Animal poisoning in Europe. Part 1: Farm livestock and poultry

Procedia Chemistry 12 ( 2014 ) 9 – 18
1876-6196 © 2014 Published by Elsevier B.V. This is an open access article under the CC BY-NC-ND license (http://creativecommons.org/licenses/by-nc-nd/3.0/).Peer-review under responsibility of the Sociedad Mexicana de Electroquimicadoi: 10.1016/j.proche.2014.12.035
Available online at www.sciencedirect.com
ScienceDirect
New Processes and Materials Based on Electrochemical Concepts at the Microscopic Level Symposium, MicroEchem 2013
Pd nanostructures with high tolerance to CO poisoning in the formic acid electrooxidation reaction
E. Ortiz-Ortegaa, R. Carrera-Cerritosb, N. Arjonac, M. Guerra-Balcázara, F. M. Cuevas-Muñizc, L. G. Arriagac, J. Ledesma-Garcíaa*
aDivisión de investigación y Posgrado, Facultad de Ingeniería, Universidad Autónoma de Querétaro, Cerro de las Campanas S/N, C.P. 76010, Querétaro, Qro., México.
bDepartamento de Ingeniería Química, División de Ciencias Naturales, Universidad de Guanajuato, Noria Alta s/n, Col. Noria Alta, C.P. 36050, Guanajuato, México.
cCentro de Investigación y Desarrollo Tecnológico en Electroquímica S.C., Parque Tecnológico Querétaro Sanfandila, C.P. 76703, Querétaro,Qro., México.
Abstract
Pd architectures such as nanobars and nanoparticles were synthetized by the polyol method using di-ethylene glycol as reaction media. The morphology, composition and electrocatalytic properties were investigated by transmission electronmicroscopy (TEM), thermo-gravimetric analysis (TGA), X-ray diffraction (XRD) and electrochemical measurements. The electrocatalytic activity of Pd nanostructures was tested in terms of formic acid electrooxidation reaction (FAOR) in acid media (0.5 M H2SO4) and compared with commercial Pd/XC-72 (Pd/C). Results from the electrochemical studies showed that Pdnanobars (PdNB/C) presented higher tolerance to the CO and CO2 poisoning effect compared with Pd nanoparticles (PdNP/C) and commercial Pd/C. Furthermore, the onset potential toward formic acid electrooxidation at high concentration (1 M) on PdNB/C exhibited a negative shift ca. 100 mV compared with commercial Pd/C. Finally, PdNB/C in the presence of 1 M FA showed a lower poisoning degree compared with commercial Pd/C and PdNP/C. © 2014 The Authors. Published by Elsevier B.V. Selection and peer-review under responsibility of the Sociedad Mexicana de Electroquimica.
Keywords:Pd nanobars; Pd nanoparticles; polyol method; formic acid electrooxidation.
* Corresponding author. Tel.: + (442) 192 12 00 ext. 65411
E-mail address: [email protected]
© 2014 Published by Elsevier B.V. This is an open access article under the CC BY-NC-ND license (http://creativecommons.org/licenses/by-nc-nd/3.0/).Peer-review under responsibility of the Sociedad Mexicana de Electroquimica

10 E. Ortiz-Ortega et al. / Procedia Chemistry 12 ( 2014 ) 9 – 18
1. Introduction
Fuel cells represent an attractive alternative for replacing fossil fuels. The main advantages of these devices included high efficiency and low pollution levels. Direct formic acid fuel cells (DFAFC) are characterized by the generation of reasonable power densities at low temperatures1; further, formic acid is a non-toxic and non-explosive liquid at room temperature. The use of liquid fuels in fuel cells shows advantages as comparison with hydrogen such as the handling and storage. These features become DFAFC an alternative for portable electronic devices applications2. However, the cost and efficiency of the DFAFC are the major challenges to overcome nowadays3. Pt and Pt-group metal surfaces are the catalysts commonly employed, but exhibit some disadvantages such as high costs and fast Pt-poisoning by CO production during formic acid oxidation reaction4. Recent investigations are focused on decreasing the Pt loading, providing acceptable performance5. In this context, numerous studies have shown that Pd catalysts accomplish higher activity for formic acid oxidation than Pt, due to its better CO tolerance during this reaction6. Pd-d-bands are closer to the cores than Pt and there is less d electron density available for bonding. This property conducts to weaker interactions with bonds, allowing unique chemistry to occur7. Pd has a similar lattice constant such as Pt. In addition, Pd is a more abundant element compared to Pt, which is reflected in the decrease of the catalyst costs8.
On the other hand, the relationship between structure and electrocatalytic activity of metallic materials has been widely reported; this behavior is attributed to the crystallographic planes present on the nanostructure9,10. For the specific case of Pd, spherical nanoparticles with 6 nm of average size show the highest electrocatalytic activity toward FAOR10. Furthermore, the electrocatalytic activity increases in accordance with preferential crystallographic plane in the following sequence: 111<110<100 plane11.We previously reported the synthesis of Pdnanocubes with high electrocatalytic activity toward formic acid, ethanol and methanol electrooxidation reactions12. However, Pdnanocubes showed excellent electrocatalytic activity only at low fuel concentration (0.1 M).
In this study Pd nanostructures were obtained by the polyol method varying the experimental conditions in order to obtain two different Pd morphologies: nanoparticles (PdNP/C) and nanobars (PdNB/C). These Pd nanostructures were supported on Vulcan carbon and physicochemical and electrochemically evaluated in terms of the FAOR. The effect on the FAOR as function of the preferential crystallographic planes and shape are discussed and compared to commercial Pd/XC-72 (Pd/C).
2. Experimental setup
2.1. Synthesis of Pd nanostructures
Pd nanoparticles (PdNP/C) were synthesized placing 5 mL of ethylene glycol as reacting media (99.9%, J.T. Baker) in a flask and heated under reflux at 373 K. Meanwhile, 0.0486 g of Na2PdCl4salt (98%, Sigma-Aldrich) was dissolved in 3 mL of deionized water and 0.0916 g of polyvinylpyrrolidone as surfactant (PVP Mw=55,000; Aldrich) in 3 mL of ethylene glycol at room temperature. Both solutions were injected simultaneously into the flask using two syringe pumps (Cole Palmer Instruments Company) at 45 mL h-1. After that, 0.037 g of Vulcan carbon XC-72 were added to the mixture and heated for 1 h. Finally, the catalyst was centrifuged and washed with plenty deionized water and dried at 333 K for 12 h. The synthesis of Pdnanobars (PdNB/C) was done following the same procedure above described for Pd nanoparticles. The differences resided in the use of di-ethylene glycol DEG (99%, Aldrich) as reducing agent and the reaction temperature (378 K) and the addition of KBr (99%, J.T. Baker) with the purpose of promoting the unidirectional growth13, 14.
2.2. Materials Characterization
All catalysts were characterized by X-Ray diffraction (XRD) employing Bruker D8 Advance through a Cu-K radiation operated at 30 kV and 30 mA in the range 20°<2 <130°. The morphology and average crystal size are observed using a Jeol JEM-100S microscope operated at 60 kV. The thermo-gravimetric analysis (TGA) was carried out in a Q500 TA Instruments in the presence of air following the variation of the percentage weight loss in the range between room temperature and 1073 K at10 K min-1of heating rate.

E. Ortiz-Ortega et al. / Procedia Chemistry 12 ( 2014 ) 9 – 18 11
2.3. Electrochemical Measurements
Electrochemical experiments consisted in cyclic voltammetry (CV) and chronoamperometry (CA) performed in a Biologic VSP Potentiostat/Galvanostat. A glassy carbon surface (3mm diameter) was employed as working electrode in standard three-electrode glass cell using Hg/Hg2SO4saturated with K2SO4and graphite rod as reference and counter electrode, respectively. Potentials are referred to the Normal Hydrogen Electrode (NHE). 1.5 μL of an ink prepared with 75 L of isopropyl alcohol and 7 L of Nafion® per milligram of catalyst was deposited onto glassy carbon electrodes and dried under a nitrogen flow. For comparison, a commercial Pd/C catalyst was used (Electrochem®, 10 wt.%). The formic acid electrooxidation was investigated using three formic acid concentrations (0.1, 0.5 and 1 M) in 0.5 M H2SO4 (J. T. Baker, 99.7%) as electrolyte. All solutions were prepared with deionized water DI (� 18 M� cm). Before each experiment, the glassy carbon electrode was cleaned by cyclic voltammetry at 50 mV s-1 in a range of potential between -0.03 to 1.45 V for 15 cycles in 0.5 M H2SO4 under N2 atmosphere.
3. Results
3.1. Materials Characterization
Figure 1 shows the X-Ray Diffraction patterns of commercial Pd/C and the Pd-based materials (PdNP/C and PdNB/C). All materials exhibited the crystallographic peaks (111), (200), (220) and (311) located at 2 = 40°, 46°, 68° and 82°, respectively, which are characteristic of Pd metallic phase (JCPDS 46-1043) with a typical fcc structure. Lattice parameters were estimated through the XRD data and showed an expansion for all the materials compared to the commercial Pd (Table 1). Usually hydrogen is absorbed into the interstitial sites of Pd-based materials expanding their lattice parameters15, 16. Changes in the lattice parameter for PdNP/C and PdNB/C could be related to the effect of size and shape in the hydrogen ad/absorption17.
Fig. 1.X-Ray diffraction patterns for commercial Pd/C, PdNP/C and PdNB/C.
Average crystallite size was estimated according the Scherrer’s equation (1) resulting in values of 4.9, 6.4 and 9.0 nm for Pd/XC-72, PdNP/C and PdNB/C, respectively18.
(1)

12 E. Ortiz-Ortega et al. / Procedia Chemistry 12 ( 2014 ) 9 – 18
Table 1. Summary of the X-Ray diffraction data.
Nanoparticle size (nm) Lattice parameter (nm) Intensity Ratio(111)/(200) % Pd Load
Pd/C 4.9 0.3902 2.82 15.9
PdNP/C 6.4 0.3914 2.77 20.1
PdNB/C 9.0 0.3917 2.71 14.4
TGA curves (Figure 2) revealed three different regions for each material. The first region is the slight decrease at temperatures below 450 K attributed to the evaporation of absorbed water on catalytic material surface. The second region at 450 to 900 K is mainly associated to the reaction between C and O2 to form CO2 which indicates the decomposition of organic complexes employed in the synthesis procedure19. The last region, at temperatures beyond 900 K showed a stable zone associated with the real Pd loading of catalytic material on carbon resulting in 15.9, 20.1 and 14.4% for Pd/C, PdNP/C and PdNB/C, respectively. The lower Pd amount founded in the PdNB/C catalyst could be associated to the presence of Br- ions that suppress the deposition of Pd atoms by protecting the surface through adsorption20.
Fig. 2.TGA curves of commercial Pd/C, PdNP/C and PdNB/C.
The morphology of Pd nanostructures was observed by TEM (Figure 3). Pd is characterized by a face-centered cubic (fcc) system, and according with the surface energy of nanocrystals, some crystallographic facets ( [111]< [100]< [110]) can be favoured during the synthesis21.According previous works13, 14, the addition of potassium bromide to the synthesis procedure favors the formation of cuboctahedral shape and the chemisorbed bromide layer facilitates a preferential growth. By inspection of Figure 3, the addition of KBr and the use of di-ethylene glycol instead ethylene glycol resulted in a 70% of nanobars (PdNB/C) with crystallographic facets [111] and [100], meanwhile the rest of the nanostructures are composed by nanocubes, nanobars, semispherical and other shapes.
300 400 500 600 700 800 900 1000 11000
20
40
60
80
100
% W
eig
ht
Temperature / K
Pd/C
PdNP
/C
PdNB
/C

E. Ortiz-Ortega et al. / Procedia Chemistry 12 ( 2014 ) 9 – 18 13
Fig. 3.Transmission micrographs for commercial Pd/C, PdNP/C and PdNB/C.
3.2. Electrochemical characterization
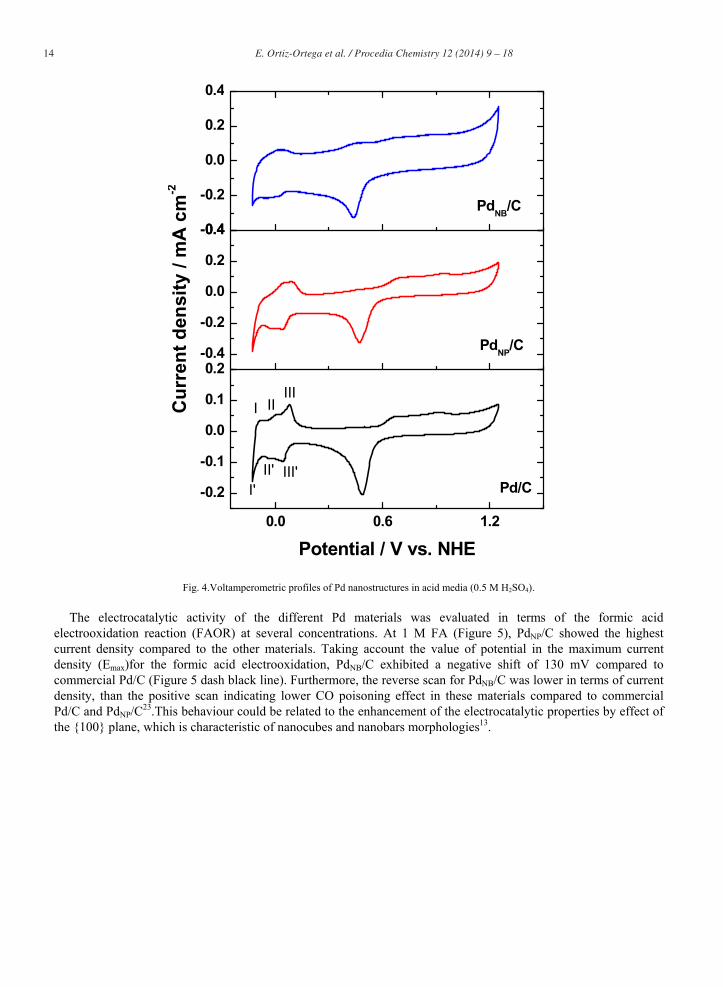
Cyclic voltammetry in acid medium (0.5 M H2SO4) was carried out to obtain the typical response of Pd-based materials (Figure 4). Three characteristic regions were observed: the hydrogen adsorption/desorption peaks (-0.15 to 0.15 V vs. NHE), the capacitive zone (0.15 to 0.4 V vs. NHE) and the peaks associated to the Pd oxides formation ad reduction (0.4 to 1.2 V vs. NHE)22. In the hydrogen adsorption/desorption region six processes were founded and labeled (Figure 4 Pd/C). Peaks III’ and II’ were linked to the hydrogen adsorption followed for the (hydrogen-) sulphate desorption, and finally for the hydrogen evolution process (Peak I´)23.The third region was used to determinate the electrochemical active surface area (ECSA) using the associated charge with the palladium peak related to the reduction of Pd oxides (424 μC cm-2)24.
14 E. Ortiz-Ortega et al. / Procedia Chemistry 12 ( 2014 ) 9 – 18
Fig. 4.Voltamperometric profiles of Pd nanostructures in acid media (0.5 M H2SO4).
The electrocatalytic activity of the different Pd materials was evaluated in terms of the formic acid electrooxidation reaction (FAOR) at several concentrations. At 1 M FA (Figure 5), PdNP/C showed the highest current density compared to the other materials. Taking account the value of potential in the maximum current density (Emax)for the formic acid electrooxidation, PdNB/C exhibited a negative shift of 130 mV compared to commercial Pd/C (Figure 5 dash black line). Furthermore, the reverse scan for PdNB/C was lower in terms of current density, than the positive scan indicating lower CO poisoning effect in these materials compared to commercial Pd/C and PdNP/C23.This behaviour could be related to the enhancement of the electrocatalytic properties by effect of the {100} plane, which is characteristic of nanocubes and nanobars morphologies13.
0.0 0.6 1.2
-0.2
-0.1
0.0
0.1
0.2-0.4
-0.2
0.0
0.2
0.4-0.4
-0.2
0.0
0.2
0.4
Cu
rre
nt
de
ns
ity
/ m
A c
m-2
Potential / V vs. NHE
PdNB
/C
PdNP
/C
Pd/C
IIII
I'II' III'
II

E. Ortiz-Ortega et al. / Procedia Chemistry 12 ( 2014 ) 9 – 18 15
Fig. 5.Comparison of cyclic voltammograms of 1 M formic acid electrooxidation on Pdnanostructures.
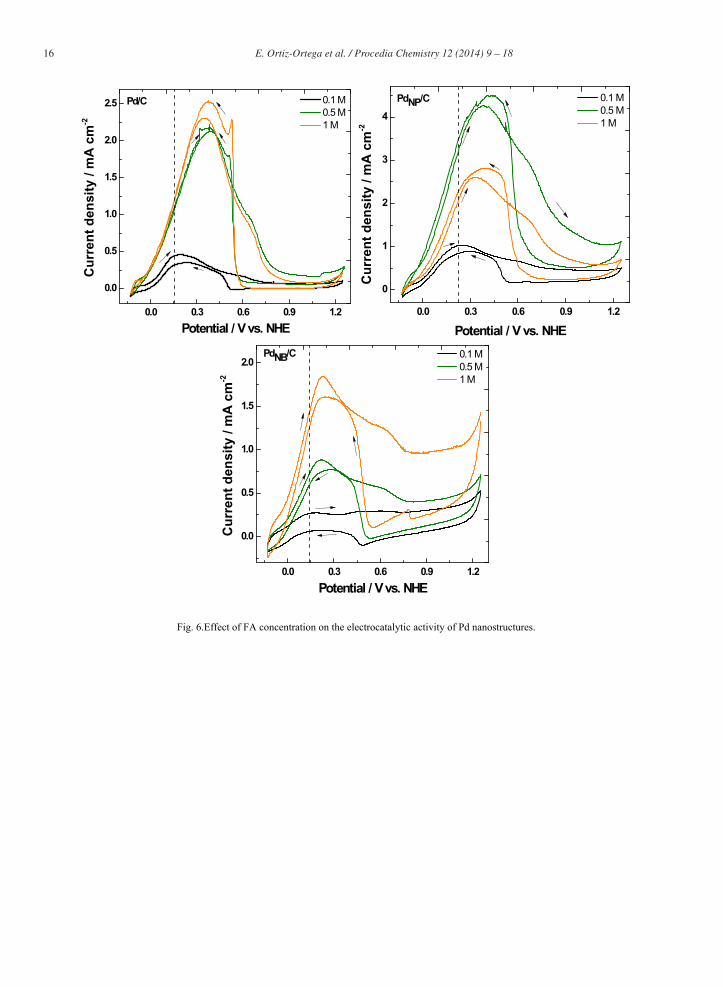
CO poisoning effect was confirmed when the concentration of formic acid was increased from 0.1 to 1 M FA (Figures 6 and 7). Maximum peak potential Emax of FA electro-oxidation on commercial Pd/C showed a positive shift of almost 200mV between minimum and maximum FA concentration and the current density was maintained constant from 0.5 to 1 M FA. In the case of PdNP/C the positive shift was around 140 mV and the decrement of the current density was almost 50 percent from 0.5 to 1 M FA, in both cases, the CO poisoning effect was evident, being higher for PdNP/C. Further, for PdNB/C the shift of potential was of around 75 mV and the current density showed a linear tendency with increasing the FA concentration. These interesting nanostructured materials offer potential possibilities of application as electrocatalysts in direct formic acid fuel cells.
-0.2 0.0 0.2 0.4 0.6 0.8 1.0 1.2
0
1
2
3
0
1
2
3
0
1
2
Pd/C
PdNP
/C
PdNB
/C
Cu
rren
t d
en
sit
y /
mA
cm
-2
Potential / V vs. NHE
16 E. Ortiz-Ortega et al. / Procedia Chemistry 12 ( 2014 ) 9 – 18
Fig. 6.Effect of FA concentration on the electrocatalytic activity of Pd nanostructures.
0.0 0.3 0.6 0.9 1.2
0.0
0.5
1.0
1.5
2.0
2.5 Pd/C
Cu
rre
nt
de
nsit
y /
mA
cm
-2
Potential / V vs. NHE
0.1 M 0.5 M 1 M
0.0 0.3 0.6 0.9 1.2
0
1
2
3
4
PdNP/C
Cu
rre
nt
de
ns
ity
/ m
A c
m-2
Potential / V vs. NHE
0.1 M 0.5 M 1 M
0.0 0.3 0.6 0.9 1.2
0.0
0.5
1.0
1.5
2.0PdNB/C
Cu
rre
nt
de
ns
ity
/ m
A c
m-2
Potential / V vs. NHE
0.1 M 0.5 M 1 M

E. Ortiz-Ortega et al. / Procedia Chemistry 12 ( 2014 ) 9 – 18 17
Fig. 7.Effect of FA concentration in the current density of Pd materials.
Chronoamperometric tests were performed at 0.3 V (Figure 8). All the catalysts exhibited the same behaviour, which is typical for diffusion-controlled systems. Two zones were identified; the first showed fast current loss due to the consumption of species in the electrical double-layer and in the second, a stability zone is exposed. The PdNP/C and the commercial Pd/C exhibited a slow decrement of the current density with tendency to reach zero current density, which is related to poor stability. Meanwhile PdNB/C presented a fast decrement until maintain a constant density current, which suggest a good stability.
Fig. 8.Chronoamperometry curves on Pd-based materials at 0.3 V vs NHE for 30 minutes in the presence of 0.5 M FA in 0.5 M H2SO4.
4. Conclusions
In summary different morphologies of Pd nanostructures were prepared by polyol method and physicochemically characterized by XRD, TGA and TEM techniques. The electrocatalytic properties of the synthesized materials were
0.0 0.2 0.4 0.6 0.8 1.00.0
0.5
1.0
1.5
2.0
2.5
3.0
3.5
4.0
4.5
Cu
rren
t d
en
sit
y /
mA
cm
-2
Concentration / M
Pd/C Pd
NP/C
PdNB
/C
0 5 10 15 20 25 30
0.0
0.2
0.4
0.6
0.8
1.0
1.2
1.4
1.6
1.8
j / m
A c
m-2
t / min
Pd/C Pd
NP/C
PdNB
/C
18 E. Ortiz-Ortega et al. / Procedia Chemistry 12 ( 2014 ) 9 – 18
evaluated for the formic acid electrooxidation. Pd nanobars (PdNB/C) exhibit good stability in acid media and more negative anodic potential associated to this reaction than that achieved with commercial Pd and PdNP/C electrocatalyst. This result could be attributed to the presence of {100} plane, which is intrinsic of nanobar shapes. Furthermore, PdNB/C materisl shows the most tolerance to poisoning for by-products of the formic acid oxidation at different FA concentrations, becoming in a promising catalyst for future use in direct formic acid fuel cells.
Acknowledgements
The authors thanks to CONACYT for the financial support through SEP-CONACYT (Grant 179921).
References
1. Yu XY, Pickup PG. Recent advances in direct formic acid fuel cells (DFAFC). J Power Sources 2008;182:124-32. 2. Wang RF, Liao SJ, Ji S. High performance Pd-based catalysts for oxidation of formic acid. J Power Sources 2008;180:205-8. 3. Wang RF, Li H, Feng HQ, Wang H, Lei ZQ. Preparation of carbon-supported core@shellPdCu@PtRu nanoparticles for methanol oxidation. J
Power Sources 2010;195:1099-102. 4. Mazumder V, Lee YM, Sun SH. Recent Development of Active Nanoparticle Catalysts for Fuel Cell Reactions. Adv Funct Mater 2010;
20:1224-31. 5. Wang XM, Xia YY. Synthesis, characterization and catalytic activity of an ultrafine Pd/C catalyst for formic acid electrooxidation,
Electrochim Acta 2009;54:7525-30. 6. Antolini E. Palladium in fuel cell catalysis. Energy Environ Sci 2009;2:915-31. 7. Vielstich W, Lamm W, Gasteiger H A. (Eds.), Handbook of Fuel Cells: Fundamentals Technology and Application, Wiley, NJ, 2003. 8. Zhang ZY, Xin L, Sun K, Li WZ. Pd–Ni electrocatalysts for efficient ethanol oxidation reaction in alkaline electrolyte. Int J Hydrogen Energy
2011; 36:12686-97. 9. Arjona N, Guerra-Balcázar M, Trejo G, Ledesma-García J, Arriaga LG. Electrochemical growth of Au architectures on glassy carbon and their
evaluation toward glucose oxidation reaction. New J Chem 2012;36:2555–61. 10. Pérez Y, Ruiz-González ML, González-Calbet JM, Concepción P, Boronat M, Corma A. Shape-dependent catalytic activity of palladium
nanoparticles embedded in SiO2 and TiO2. Catal Today 2012;180:59–67. 11. Suo Y, Hsing IM. Size-controlled synthesis and impedance-based mechanistic understanding of Pd/C nanoparticles for formic acid oxidation.
Electrochim Acta 2009;55:210-7. 12. Arjona N, Guerra-Balcázar M, Ortiz-Frade L, Osorio-Monreal G, Álvarez-Contreras L, Ledesma-García J, Arriaga LG. Electrocatalytic
activity of well-defined and homogeneous cubic-shaped Pd nanoparticles. J Mater Chem A 2013;1:15524-15529. 13. Xiong YJ, Cai HG, Wiley BJ, Wang JG, Kim MJ, Xia YN. Synthesis and Mechanistic Study of Palladium Nanobars and Nanorods. J Am
Chem Soc 2007;129:3665-75. 14. Xiong YJ, Xia YN. Shape-Controlled Synthesis of Metal Nanostructures: The Case of Palladium. Adv Mater 2007;19:3385-3391. 15. Suleiman M, Jisrawi NM, Dankert O, Reetz MT, Bähtz C, Kirchheim R, Pundt A. Phase transition and lattice expansion during hydrogen
loading of nanometer sized palladium clusters. J Alloys Compd 2003, 356-357:644-648 6. De Ninno A, Violante V, La Barbera A. Consequences of lattice expansive strain gradients on hydrogen loading in palladium. Phys Rev
1997;56:2417. 17. Suleiman M, Faupel J, Borchers C, Krebs HU, Kirchheim R, Pundt A. Hydrogen absorption behaviour in nanometer sized palladium samples
stabilized in soft and hard matrix. J Alloys Compd 2005;404-406:523-528 18. Shen SY, Zhao TS, Xu JB, Li YS. Synthesis of PdNi catalysts for the oxidation of ethanol in alkaline direct ethanol fuel cells. J Power
Sources 2010;195:1001–1006. 19. Evangelista JW, Avedisian CT, Tsang W. Thermal and catalytic decomposition of aqueous ethylene glycol mixtures by film boiling. Int J
Heat Tran 2012;55:6425-6434. 20. Xiao CW, Ding H, Shen CM, Yang TZ, Hui C, Gao HJ. Shape-controlled synthesis of palladium nanorods and their magnetic properties. J
Phys Chem 2009;113:13466–13469. 21. Mingshang J, Hongyang L, Hui Z, Zhaoxiong X, Jingyue L, Younan X. Synthesis of Pdnanocrystals enclosed by [100] facets and with sizes
<10 nm for application in CO oxidation. Nano Res 2011;4:83-91. 22. Dall’Antonia LH, Tremiliosi-Filho G, Jerkiewicz G. Influence of temperature on the growth of surface oxides on palladium electrodes. J
Electroanal Chem 2001;502:72-81. 23. Hara M, Linke U, Wandlowski T. Preparation and electrochemical characterization of palladium single crystal electrodes in 0.1 M H2SO4
and HClO4: Part I. Low-index phases. Electrochim Acta 2007;52:5733-48. 24. Grozovski V, Climent V, Herrero E, Feliu JM. Intrinsic Activity and Poisoning Rate for HCOOH Oxidation at Pt [100] and Vicinal Surfaces
Containing Monoatomic [111] Steps. Chem Phys Chem 2009;10:1922-6.
Copyright © 2022 FDOKUMEN