Electrooxidation of primary alcohols on smooth and electrodeposited platinum in acidic solution
11
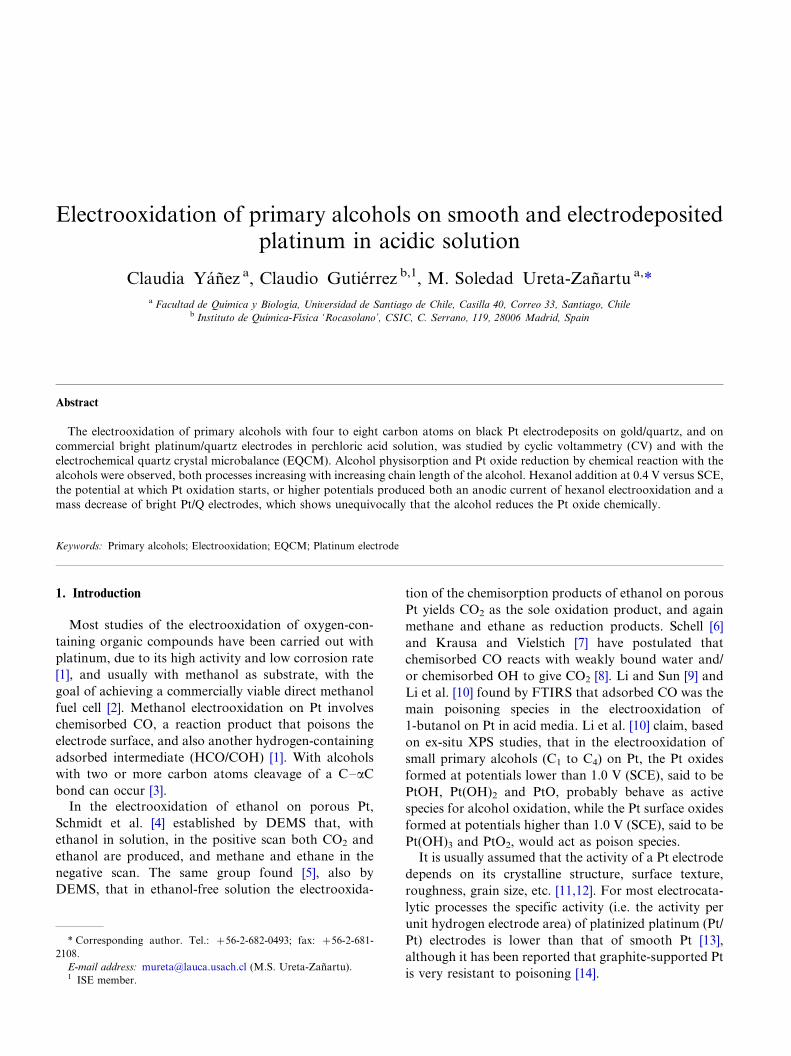
Electrooxidation of primary alcohols on smooth and electrodeposited platinum in acidic solution Claudia Ya ´n ˜ez a , Claudio Gutie ´rrez b,1 , M. Soledad Ureta-Zan ˜ artu a, * a Facultad de Quı ´mica y Biologı ´a, Universidad de Santiago de Chile, Casilla 40, Correo 33, Santiago, Chile b Instituto de Quı ´mica-Fı ´sica ‘Rocasolano’, CSIC, C. Serrano, 119, 28006 Madrid, Spain Abstract The electrooxidation of primary alcohols with four to eight carbon atoms on black Pt electrodeposits on gold/quartz, and on commercial bright platinum/quartz electrodes in perchloric acid solution, was studied by cyclic voltammetry (CV) and with the electrochemical quartz crystal microbalance (EQCM). Alcohol physisorption and Pt oxide reduction by chemical reaction with the alcohols were observed, both processes increasing with increasing chain length of the alcohol. Hexanol addition at 0.4 V versus SCE, the potential at which Pt oxidation starts, or higher potentials produced both an anodic current of hexanol electrooxidation and a mass decrease of bright Pt/Q electrodes, which shows unequivocally that the alcohol reduces the Pt oxide chemically. Keywords: Primary alcohols; Electrooxidation; EQCM; Platinum electrode 1. Introduction Most studies of the electrooxidation of oxygen-con- taining organic compounds have been carried out with platinum, due to its high activity and low corrosion rate [1], and usually with methanol as substrate, with the goal of achieving a commercially viable direct methanol fuel cell [2]. Methanol electrooxidation on Pt involves chemisorbed CO, a reaction product that poisons the electrode surface, and also another hydrogen-containing adsorbed intermediate (HCO/COH) [1]. With alcohols with two or more carbon atoms cleavage of a C /aC bond can occur [3]. In the electrooxidation of ethanol on porous Pt, Schmidt et al. [4] established by DEMS that, with ethanol in solution, in the positive scan both CO 2 and ethanol are produced, and methane and ethane in the negative scan. The same group found [5], also by DEMS, that in ethanol-free solution the electrooxida- tion of the chemisorption products of ethanol on porous Pt yields CO 2 as the sole oxidation product, and again methane and ethane as reduction products. Schell [6] and Krausa and Vielstich [7] have postulated that chemisorbed CO reacts with weakly bound water and/ or chemisorbed OH to give CO 2 [8]. Li and Sun [9] and Li et al. [10] found by FTIRS that adsorbed CO was the main poisoning species in the electrooxidation of 1-butanol on Pt in acid media. Li et al. [10] claim, based on ex-situ XPS studies, that in the electrooxidation of small primary alcohols (C 1 to C 4 ) on Pt, the Pt oxides formed at potentials lower than 1.0 V (SCE), said to be PtOH, Pt(OH) 2 and PtO, probably behave as active species for alcohol oxidation, while the Pt surface oxides formed at potentials higher than 1.0 V (SCE), said to be Pt(OH) 3 and PtO 2 , would act as poison species. It is usually assumed that the activity of a Pt electrode depends on its crystalline structure, surface texture, roughness, grain size, etc. [11,12]. For most electrocata- lytic processes the specific activity (i.e. the activity per unit hydrogen electrode area) of platinized platinum (Pt/ Pt) electrodes is lower than that of smooth Pt [13], although it has been reported that graphite-supported Pt is very resistant to poisoning [14]. * Corresponding author. Tel.: /56-2-682-0493; fax: /56-2-681- 2108. E-mail address: [email protected] (M.S. Ureta-Zan ˜ artu). 1 ISE member.
Transcript of Electrooxidation of primary alcohols on smooth and electrodeposited platinum in acidic solution
Electrooxidation of primary alcohols on smooth and electrodepositedplatinum in acidic solution
Claudia Yanez a, Claudio Gutierrez b,1, M. Soledad Ureta-Zanartu a,*a Facultad de Quımica y Biologıa, Universidad de Santiago de Chile, Casilla 40, Correo 33, Santiago, Chile
b Instituto de Quımica-Fısica ‘Rocasolano’, CSIC, C. Serrano, 119, 28006 Madrid, Spain
Abstract
The electrooxidation of primary alcohols with four to eight carbon atoms on black Pt electrodeposits on gold/quartz, and on
commercial bright platinum/quartz electrodes in perchloric acid solution, was studied by cyclic voltammetry (CV) and with the
electrochemical quartz crystal microbalance (EQCM). Alcohol physisorption and Pt oxide reduction by chemical reaction with the
alcohols were observed, both processes increasing with increasing chain length of the alcohol. Hexanol addition at 0.4 V versus SCE,
the potential at which Pt oxidation starts, or higher potentials produced both an anodic current of hexanol electrooxidation and a
mass decrease of bright Pt/Q electrodes, which shows unequivocally that the alcohol reduces the Pt oxide chemically.
Keywords: Primary alcohols; Electrooxidation; EQCM; Platinum electrode
1. Introduction
Most studies of the electrooxidation of oxygen-con-
taining organic compounds have been carried out with
platinum, due to its high activity and low corrosion rate
[1], and usually with methanol as substrate, with the
goal of achieving a commercially viable direct methanol
fuel cell [2]. Methanol electrooxidation on Pt involves
chemisorbed CO, a reaction product that poisons the
electrode surface, and also another hydrogen-containing
adsorbed intermediate (HCO/COH) [1]. With alcohols
with two or more carbon atoms cleavage of a C�/aC
bond can occur [3].
In the electrooxidation of ethanol on porous Pt,
Schmidt et al. [4] established by DEMS that, with
ethanol in solution, in the positive scan both CO2 and
ethanol are produced, and methane and ethane in the
negative scan. The same group found [5], also by
DEMS, that in ethanol-free solution the electrooxida-
tion of the chemisorption products of ethanol on porous
Pt yields CO2 as the sole oxidation product, and again
methane and ethane as reduction products. Schell [6]
and Krausa and Vielstich [7] have postulated that
chemisorbed CO reacts with weakly bound water and/
or chemisorbed OH to give CO2 [8]. Li and Sun [9] and
Li et al. [10] found by FTIRS that adsorbed CO was the
main poisoning species in the electrooxidation of
1-butanol on Pt in acid media. Li et al. [10] claim, based
on ex-situ XPS studies, that in the electrooxidation of
small primary alcohols (C1 to C4) on Pt, the Pt oxides
formed at potentials lower than 1.0 V (SCE), said to be
PtOH, Pt(OH)2 and PtO, probably behave as active
species for alcohol oxidation, while the Pt surface oxides
formed at potentials higher than 1.0 V (SCE), said to be
Pt(OH)3 and PtO2, would act as poison species.It is usually assumed that the activity of a Pt electrode
depends on its crystalline structure, surface texture,
roughness, grain size, etc. [11,12]. For most electrocata-
lytic processes the specific activity (i.e. the activity per
unit hydrogen electrode area) of platinized platinum (Pt/
Pt) electrodes is lower than that of smooth Pt [13],
although it has been reported that graphite-supported Pt
is very resistant to poisoning [14].
* Corresponding author. Tel.: �/56-2-682-0493; fax: �/56-2-681-
2108.
E-mail address: [email protected] (M.S. Ureta-Zanartu).1 ISE member.

The electrochemical quartz crystal microbalance
(EQCM) can give valuable information, not only about
mass changes of the electrode, but also about interfacial
friction, surface roughness and thin film viscoelasticity[15]. Wilde and Zhang [16] have reported that in
methanol oxidation at Pt/Au/Q electrodes the poisoning
by strongly adsorbed species is accompanied by a
decrease in mass relative to the background electrolyte,
this decrease being attributed to a displacement by the
poisoning species of water and anions. Daikhin et al.
[17] found that the specific adsorption of pyridine on
gold electrodes in water and butanol involved not only amass change of an adsorbed layer rigidly coupled to the
oscillating surface, but also a finite slippage at the
adsorbed layer j water interface.
The study of higher alcohols could shed light on the
structure of the metal j electrolyte interface in the
presence of molecules with amphiprotic character. In
this work we have studied the electrooxidation on Pt of
primary alcohols with four to eight carbon atoms todetermine the influence of chain length. Black Pt
electrodeposits on gold/quartz and bright commercial
Pt/Q electrodes were used for studying the effect of the
surface texture and roughness of Pt on alcohol electro-
oxidation.
2. Experimental
2.1. Reagents and equipment
Primary alcohols: 1-butanol, 1-pentanol, 1-hexanol,
1-heptanol and 1-octanol were of analytical grade(Aldrich) and used without further purification. All
the solutions were freshly prepared with bidistilled
water. The required alcohol concentrations were ob-
tained by injection with a syringe of the required volume
of alcohol in the 0.5 M HClO4 supporting electrolyte.
The experiments were carried out at room temperature
under a nitrogen atmosphere.
The electrochemical equipment consisted of a Wenk-ing POS73 Potentioscan controlled by a CAEM In-
strumentation electrochemical interface interfaced to a
486 PC, or an Elchema PS 205 potentiostat, both with
suitable software for fully automated control of the
experiments and data acquisition. An EQCM (EQCM-
501 from Elchema) with 10 MHz AT-cut quartz
oscillators was used. The calibration was made by
anodic stripping of Cu deposited by cyclic voltammetry(CV) at 0.1 V s�1 from 10 mM Cu(II) solution in 0.1 M
HNO3. The calibration constant was dm /df�/4.4 ng
cm�2 Hz�1. All potentials were measured against, and
are referred to, a saturated calomel electrode (SCE).
2.2. Working electrodes
Two types of Pt electrodes were used for the EQCM
measurements: (i) black Pt/Au/Q electrodes obtained byelectrodeposition at 1 mA cm�2 from 2 mM H2PtCl6(Aldrich) in 0.5 M H2SO4 on an Elchema 10 MHz AT-
cut, Au-covered quartz crystal, the mass electrodepos-
ited being controlled by EQCM; and (ii) an Elchema 10
MHz AT-cut quartz crystal with a bright Pt deposit on
both faces (Pt/Q electrode). The roughness factors (RF)
were calculated from the hydrogen desorption charge,
taking a value of 0.21 mC cm�2 for a hydrogenmonolayer. Mass changes and current densities were
referred to the geometric area.
The black Pt/Au/Q electrodeposited electrodes were
activated by 10 potential cycles in 0.5 M H2SO4 at 0.1 V
s�1. Wilde et al. [18] and Ureta-Zanartu et al. [19] have
reported that the EQCM response in the hydrogen
region of electrodeposited Pt electrodes can change with
prolonged cycling of the electrode, although the CVshows no appreciable changes. Therefore, the black Pt/
Au/Q electrodes were used only until the mass increase
due to hydrogen adsorption began to increase above its
usual value.
Two procedures of alcohol addition were used. In one
procedure the potential was held at �/0.22 V, after
which the required volume of alcohol was injected in the
cell with a syringe, the electrolyte was stirred with N2 toachieve homogenization, and the mass was allowed to
stabilize. This procedure took 240 s, after which a
positive potential scan was started. In the other proce-
dure the electrode was introduced at open circuit into
the alcohol solution previously deaerated by nitrogen
bubbling.
3. Results
3.1. Results obtained with the black Pt electrodeposits
3.1.1. Characterization of the black Pt electrodeposits
Platinum was electrodeposited on the Au/Q electrode
and the black Pt/Au/Q deposit was activated as de-
scribed in Section 2. The Pt deposits had a mass of about
28 mg cm�2, a roughness factor RF between 13.1 and29.3, a specific area between 11.7 and 26.2 m2 g�1, and a
particle diameter (evaluated according to Mikhaylova et
al. [20]) between 5.9 and 2.6 nm. Electrodes with a
higher RF would exceed the limit of applicability of the
Sauerbrey equation [21].
3.1.2. First positive scan with black Pt electrodeposits
after alcohol addition at �/0.22 V
The first positive scan at 0.02 V s�1 of a black Pt/Au/
Q electrode in 0.5 M HClO4 in 10 mM butanol (A, solid
line) and 10 mM heptanol (B, solid line) solutions, after
C. Yanez et al. / 40

addition of the alcohol at �/0.22 V, and the simulta-
neously recorded mass change (C and D, respectively)
are given in Fig. 1. The dashed lines show the back-
ground response in base electrolyte. Holding the poten-
tial at �/0.22 V for 240 s led to a slight poisoning of the
electrode, as is apparent from the current increase in the
double layer region of the CV. However, this holdingtime could not be reduced because it was the minimum
time required for mass stabilization before and after
alcohol addition.
In the first positive scan the alcohols produced no
decrease of the hydrogen desorption charge, in the same
way as with smooth Pt electrodes [1]. Two peaks of
alcohol oxidation appear (peaks I and III) and a
shoulder (peak II) at the foot of peak III. Petry et al.[22] were the first to report peak I for 0.05 M CH3OH
(admitted at 50 mV vs. RHE) in 0.05 M H2SO4 at a Pt/
Pt electrode, and attributed it to methanol dehydro-
genation. Krausa and Vielstich [7], Xia et al. [23] and
Vielstich and Xia [24] have shown by DEMS that, in the
case of methanol, peak I is due to its electrooxidative
dehydrogenation on a Pt surface that is oxide-free,
leading to chemisorbed CO. In the case of ethanol orhigher alcohols the reaction would be:
RCH2OH 0 COads�R�H�2H��2e� (1)
The chemisorbed CO produced by reaction (1) can beevaluated as uI
CO�(QH�QH� )=2QH
� ; where QH and QH�
represent the charge between �/0.23 and 0.15 V in the
presence and absence of the alcohol, respectively. This
CO coverage should coincide with the fraction of the
surface H-sites covered by CO, uHCO; determined from
the decrease of the hydrogen charge (see below), since,
as is well known, most of the CO chemisorbed on Pt in
acid media is in the linear (on-top) configuration. uICO is
low, about 0.1, for butanol�/hexanol, and still lower,
0.012, for heptanol (Table 1).
We can define an oxidation parameter, OP, as OP�(Qox�Qox
� )=QH� where Qox and Qox
� are the charges
between 0.3 V and the positive limit of the scan in the
presence and absence of the alcohol, respectively. Thus,
the OP parameter represents the extra number of
electrons transferred per surface H-site in the potential
window between 0.3 V and the positive limit of the scan
due to the presence of alcohol. The OP of heptanol is
30�/45% of the OP of the lower alcohols (Table 1). This
influence of the chain length will be discussed below.
The mass response in the absence of alcohol has been
explained by Gloaguen et al. [25], Wilde et al. [18] and
Santos et al. [26] in terms of water and anion adsorption/
desorption at low potentials, and of Pt oxide formation
at higher potentials. The differences in the mass change
in the H-desorption and double layer potential regions
among different groups can be attributed, at least in
part, to differences in electrode preparation which can
affect the rugosity, pore size, etc. [19], and have been
discussed by Wilde et al. [18], who claim that prolonged
potential cycling brings about a change of the structure
of the Pt deposits.
For the four alcohols tested no mass changes were
observed upon alcohol admission at �/0.22 V, even for
octanol, which shows unequivocally that at �/0.22 V
alcohols do not physisorb on the electrodeposited Pt.
Therefore, in Fig. 1C and D the initial masses at �/0.22
V in the absence (dotted line) and the presence (solid
line) of the alcohol have been made to coincide.The mass change in the hydrogen region is unaffected
by the alcohols (Fig. 1C and D), which shows that no
organic adsorbates are formed in this region. The
alcohols produce a slight mass decrease at the potential
of peak I, 0.04 V, due to the formation by reaction (1) of
adsorbed CO, which inhibits water and/or anion ad-
sorption at the electrode surface, as described by Wilde
and Zhang [16] for methanol. At higher potentials the
Fig. 1. First positive voltammetric scan (A and B), and simultaneously
recorded mass response (C and D), of a black Pt/Au/Q electrode at
0.02 V s�1 in 0.5 M HClO4 in the absence (dashed lines) and in the
presence (solid lines) of 10 mM n -butanol (A and C) and 10 mM n -
heptanol (B and D). The alcohols were added while the electrode was
held at �/0.22 V. RF�/13.1.
Table 1
Parameters obtained from the first positive scan at 0.02 V s�1 of a
black Pt/Au/Q electrode in 0.5 M HClO4, 10 mM alcohol, with alcohol
admission at �/0.22 V (Fig. 1)
Alcohol /uICO/ OP Dm /ng cm�2 at 0.15 V
Butanol 0.108 4.4 89
Pentanol 0.084 4.5 150
Hexanol 0.096 6.6 166
Heptanol 0.012 2.0 158
RF�/13.1.
C. Yanez et al. / 41

mass in alcohol (solid line) is lower than the mass in
supporting electrolyte, the mass decrease at 0.15 V
produced by the alcohol being 89 ng cm�2 for butanol
and 158 ng cm�2 for heptanol (see Table 1), indicatingthat the more hydrophobic heptanol displaces a greater
amount of water and anions from the interface.
For all the alcohols studied, the difference between
the mass at the positive and negative limits of the first
scan was the same in the presence and absence of the
alcohols, which, since there was no alcohol adsorption
at the initial potential of �/0.22 V, as said above, shows
that the mass at the end of the first positive scan is thesame in the presence and absence of the alcohols,
indicating that the amount of Pt oxide formed is
unaffected by the alcohols, and, furthermore, that no
organic residue is present on the surface at the positive
limit.
With these black Pt electrodes, usually, but not
always, peak I appears in the first potential scan even
if the alcohols are added at open circuit. Therefore, thepresence of this peak I must depend on the structure of
the Pt electrodeposit, which is not easy to control for
very thin films, obtained with only a few minutes of
electrolysis. The presence or absence of peak I is
perfectly correlated with the mass change in the hydro-
gen region: in the former case the mass in the presence
and in the absence of the alcohol is the same, irrespective
of the admission potential, while in the latter case themass in alcohol is lower than that in supporting
electrolyte, indicating that dissociative chemisorption
of the alcohol has occurred, blocking both the electro-
oxidative dehydrogenation of the alcohol and the
adsorption of water and anions (not shown).
3.1.3. Second CVs with black Pt electrodeposits after
alcohol admission at �/0.22 V
Fig. 2A and B shows the second CV cycles (from�/0.22 to 1.2 V) obtained after the positive scan
described in Section 3.1.2 followed by 30 s of nitrogen
bubbling at open circuit in order to restore the alcohol
concentration at the electrode surface, and the simulta-
neously recorded mass response (Fig. 2C and D). The
hydrogen region is little affected by alcohol (the decrease
of QH values is B/10%), as in the first scan after alcohol
admission at �/0.22 V (Fig. 1A and B), but peak I doesnot appear now. With butanol the shoulder II is better
defined and peak III increases as compared with the first
positive scan. In the negative scan the Pt oxide reduction
peak is smaller than in base electrolyte, and a butanol
oxidation peak appears (peak IV), which would seem to
indicate that the decrease of the Pt oxide reduction peak
is due to the simultaneous occurrence of butanol
electrooxidation. The simultaneity of the two reactionsis more evident for heptanol (Fig. 2B), for which the
peak of Pt oxide reduction nearly disappears. However,
with heptanol, peak IV barely appears, which suggests
that the decrease of the Pt oxide reduction peak is due to
a chemical reaction of the Pt oxide with the alcohol, as
will be shown below to be the case.
In Fig. 2C and D the mass curves in the absence and
the presence of the alcohol have been made to coincide
at the positive potential limit. For butanol (Fig. 2C), in
the second positive scan the mass increase in the
hydrogen desorption region is unaffected by the alcohol
up to 0.03 V, at which potential butanol produces a
small decrease of the hydrogen desorption charge (Fig.
2A) and a noticeable mass decrease, similar to that
observed with an admission potential of �/0.22 V (Fig.
1C), i.e. for butanol the presence or absence of peak I
does not affect the mass increase up to 0.03 V.
Heptanol shows a CV (Fig. 2B) similar to that of
butanol, but its mass curve (Fig. 2D) is completely
different, the difference between the masses at the
positive and negative limit of the scan being about
65% higher in the presence of heptanol than in its
absence, while in the case of butanol this difference is the
same as in base electrolyte. The coverage by all
adsorbates (mainly CO [9,10]) that are stable in the
hydrogen potential region can be evaluated as uHCO�
(QH� �QH)=QH
� ; and is given for the four alcohols in
Table 2. It increases with increasing chain length up to
hexanol, which points to an increasing physisorption
previous to the dissociative chemisorption. The decrease
of uHCO for heptanol as compared with hexanol is
perhaps due to the fact that the concentration is near
its solubility limit. uHCO is 60% higher for heptanol than
for butanol, which could be responsible, at least
Fig. 2. Second CV after alcohol admission at �/0.22 V (A and B), and
simultaneously recorded mass response (C and D), of a black Pt/Au/Q
electrode at 0.02 V s�1 in 0.5 M HClO4 in the absence (dashed lines)
and in the presence (solid lines) of 10 mM n -butanol (A and C) and 10
mM n -heptanol (B and D). RF�/13.1.
C. Yanez et al. / 42

partially, for the lower mass at the beginning of the scan
with heptanol.
With butanol the mass is the same at the beginning
and the end of the CV, i.e. a complete potential cycle
does not alter the mass. On the contrary, with heptanol
(Fig. 2D) the mass at the end of the second CV is
considerably higher than that at the beginning, i.e. there
has been an irreversible mass increase. Furthermore, the
mass difference in the double layer region between the
mass in the negative and positive scans is much larger
than with butanol, pointing to a profound modification
of the structure of the double layer.
At the beginning of the negative sweep the mass is
barely affected by the presence of heptanol down to 0.5
V (Fig. 2D), at which potential reduction of Pt oxide
starts, but the mass decrease between 0.5 and 0.15 V is
much higher in the presence of heptanol, probably
because the adsorption of the rather hydrophobic
heptanol (which at 10 mM is near its solubility limit)
decreases the adsorption of water and/or anions greatly.
An interesting parameter from the EQCM results is
the @(Dm )/@Q slope obtained from a Dm versus Q plot,
as shown in Fig. 3. For faradaic processes in which the
reaction product is desorbed or deposited on the
electrode this slope should be M /nF (mass change (in
grams) per mole of electrons transferred), where M is
the molar mass of the electrosorbed species, n the
number of electrons transferred, and F is Faraday’s
constant (see Table 3). In Fig. 3A�/C the Dm versus Q
plots for the first (solid line) and the second (dashed
line) positive scans for a Pt/Au/Q electrode in the
absence (Fig. 3A) and the presence of 10 mM butanol
(Fig. 3B) and 10 mM heptanol (Fig. 3C) are given.
Arrows labelled 1, 2 and 3 indicate the positive limits of
weak (�/0.1 V) and strong (0.1 V) hydrogen adsorption,
and of the double layer region (0.5 V), respectively. In
Fig. 3B and C only the initial region of the curves is
plotted in order to obtain a better resolution in the
hydrogen region.
In base electrolyte the mass curve in the second scan is
shifted towards smaller charges and smaller masses as
compared with the mass curve for the first scan (dashed
and solid curves, respectively, in Fig. 3A). The mass
difference, which appears in the hydrogen region and
remains practically constant at higher potentials, prob-
ably stems from the adsorption of impurities, as inferred
from the high double layer current in the first scan (Fig.
1A and B). Two slopes in the hydrogen desorption
region, corresponding to the weakly (HW) and strongly
(HS) adsorbed hydrogen, are clearly defined. In the first
scan a positive slope of nearly 8 g per mole of electrons
transferred (see Table 3) was obtained for strongly
adsorbed hydrogen, in agreement with Visscher et al.
[27]. Since the desorption of hydrogen should produce a
negative slope of 1 g per mole of electrons transferred, it
is clear that the mass increase must correspond to the
adsorption of anions and water on the H-free Pt sites.
The adsorption of anions and water continues in the
double layer (d.l.) region, and the slope in the Pt oxide
formation region (column ‘ox’ in Table 3) is 5.8 g mole
of electrons transferred, somewhat lower than those
given by Xia and Birss [28,29], probably due to the effect
of adsorbed impurities, since the slope in the second
scan, 8.4 g mole of electrons transferred, is in agreement
with these references, and with the value of 8 g mole of
electrons transferred expected for the formation of PtO
or PtO2. In the second scan the values obtained for
weakly and strongly adsorbed hydrogen are 3.18 and
18.04, respectively. These values are much higher than
the corresponding ones in the first scan, which is due to
a charge decrease much larger than the mass decrease,
both as compared with the first scan.
In the first positive scan in the presence of the
alcohols (Fig. 3B and C) the Dm /DQ curves are very
Fig. 3. Plot of mass (Dm ) vs. charge (Q ) values from EQCM data
obtained in the first positive scan after alcohol addition at �/0.22 V
(solid line) and in the second positive scan (dashed line). (A) Base
electrolyte; (B) 10 mM butanol; (C) 10 mM heptanol. The arrows
define the following potential regions: weakly adsorbed hydrogen,
region to the left of arrow 1; strongly adsorbed hydrogen, region
between arrows 1 and 2; double layer, region between arrows 2 and 3;
and Pt oxidation, region to the right of arrow 3.
Table 2
Parameters obtained from the second positive scan at 0.02 V s�1 of a
black Pt/Au/Q electrode in 0.5 M HClO4, 10 mM alcohol (Fig. 2)
Alcohol /uHCO/ OP
Butanol 0.17 5.20
Pentanol 0.37 5.62
Hexanol 0.49 5.45
Heptanol 0.27 2.64
RF�/13.1.
C. Yanez et al. / 43

similar to that in base electrolyte. There is a small mass
decrease near arrow 2, which is the region of peak I in
the CV (see Fig. 1), and therefore this mass decrease
should be due to the formation of adsorbed CO with
displacement of adsorbed ions and/or water molecules.
For this reason only the slope of the weakly adsorbed
hydrogen could be evaluated (Table 3).
In the second scan in the presence of the alcohols the
mass decrease in the hydrogen region, as compared with
the mass in the first scan, appears first with pentanol,
and increases with increasing chain length. Only for
butanol could the hydrogen slope be evaluated in the
second scan (see Fig. 3B and Table 3). While for butanol
the mass increases monotonically over the whole poten-
tial scan, for pentanol�/heptanol there is an initial region
of constant mass that extends over the whole hydrogen
region in base, and is followed by a short, nearly vertical
segment. This mass increase without significant charge
transfer clearly indicates that, once hydrogen desorption
has been completed, pentanol�/heptanol physisorption
takes place on this H-free Pt surface. Furthermore, the
second CVs in heptanol and base electrolyte shown in
Fig. 2D practically coincide over the whole double layer
region, which indicates that the physisorbed heptanol is
not electrooxidized in this potential range. On the
contrary, butanol is electrooxidized in the double layer
region, as can be seen in the CV in Fig. 2A, and,
consequently, from the horizontal distance between
arrows 2 and 3 (double layer region) in Fig. 3B.
The slopes in columns d.l. and ox in Table 3 were
obtained from the double layer region (between arrows
2 and 3) and oxide region (to the right of arrow 3),
respectively, in Fig. 3. The slopes in the ox region in
both the first and second scans are lower in the presence
of alcohols than that of Pt oxide formation in base
electrolyte, as was to be expected, since a high fraction
of the charge transferred, namely OP/(1�/OP), goes
towards alcohol electrooxidation, a process which does
not contribute to a mass increase. This slope is markedly
higher for heptanol than for the other alcohols, both in
the first and second scans, in agreement with the fact
that the OP is markedly lower for heptanol, also both in
the first and second scans.
With the higher alcohols, and especially for heptanol,
the mass at the beginning of the second scan was lower
than that in the first scan, indicating that with increasing
chain length there is an increasing physisorption of the
alcohol. We return to this point below.
3.1.4. Effect of the scan rate on the second CV with black
Pt electrodeposits with alcohol admission at open circuit
In these experiments the alcohol was added at open
circuit, a ‘stabilizing’ CV was carried out from the
negative potential limit, the electrolyte was stirred by
nitrogen bubbling for 1 min to reestablish solution
homogeneity, and a second CV was carried out and
recorded simultaneously with the mass curve. With this
procedure peak I, which with electrodeposited Pt gen-erally appears in the first scan even with alcohol
admission at open circuit, as noted above, does not
appear in the second CV, and so its interference with the
other peaks in the CV is avoided.
Fig. 4 shows the second CVs and the mass curves for
black Pt/Au/Q electrodes in 0.5 M HClO4 (Fig. 4A and
D), in 0.5 M HClO4 with 20 mM butanol (Fig. 4B and
Table 3
Mass change per mole of electrons transferred obtained as the slopes of the Dm vs. DQ plots in Fig. 3
Alcohol First scan Second scan
HW HS CO d.l. ox HW HS d.l. ox
Base 0.97 7.9 �/ Variable 5.80 3.18 18.04 �/ 8.40
Butanol 2.41 �/0.67 2.22 2.40 3.96 3.00 1.97
Pentanol 1.35 �/3.86 3.00 2.32 �/ 5.02 1.93
Hexanol 0.10 �/1.74 3.09 1.93 �/ 7.24 2.90
Heptanol 1.93 �/2.32 3.86 3.18 �/ 5.11
The alcohol concentration was 10 mM.
Fig. 4. Second CV (A, B and C) and simultaneously recorded mass
response (D, E and F) of a black Pt/Au/Q electrode at different scan
rates in 0.5 M HClO4 (A and D) and in 0.5 M HClO4 with 20 mM n -
butanol (B and E) and 20 mM n -pentanol (C and F). The alcohols
were added to the electrolyte while the electrode was at open circuit
and the scans were begun at the negative limit. RF�/29.3.
C. Yanez et al. / 44

E) and in 0.5 M HClO4 with 20 mM pentanol (Fig. 4C
and F). In base electrolyte, with increasing scan rate the
potential at which Pt oxidation starts, as reflected by the
corresponding mass increase, is practically independent
of the scan rate, but the mass decrease corresponding to
the reduction of the Pt oxide is shifted to more negative
potentials, i.e. it becomes more irreversible (Fig. 4D).
This scan rate independence of the Pt oxide formation,
and dependence of the Pt oxide reduction (both types of
behaviour obviously to be expected from the corre-
sponding CVs), is unaffected by butanol (Fig. 4E) or
pentanol (Fig. 4F). As for the hydrogen and double
layer regions, in which in 0.5 M HClO4 the mass
increases with the potential, they show almost no mass
changes in the presence of the alcohols, especially at the
higher scan rates, from which it can be inferred that
there is an alcohol physisorption that inhibits the
adsorption of water and/or anions. In the presence of
butanol or pentanol the mass change after a complete
CV (second scan) is almost zero, independently of the
scan rate.
The mass change per mole of electrons transferred,
obtained from the slopes of the linear segments of Dm
versus DQ plots, are given in Table 4. Both in the
absence and presence of alcohols the mass decreased
with increasing potential in the region of weakly
adsorbed H, and it was not possible to evaluate a slope.
In base electrolyte, the slope in the region of strongly
adsorbed H decreased monotonically with decreasing
scan rate. The slopes in the Pt oxide region are in the
range 7.6�/6.7 g per mole of electrons transferred, in fair
agreement with the theoretical value of 8 g per mole of
electrons transferred for the formation of PtO or PtO2.
In 20 mM butanol and pentanol the slopes in the Pt
oxide region are much smaller than in 0.5 M HClO4,
since, as said above, a large fraction of the charge, OP/
(1�/OP), is consumed in the electrooxidation of the
alcohols, which does not contribute to the mass increase.
These slopes in alcohol decrease with decreasing scan
rate, indicating an increasing participation of alcohol
electrooxidation, as was to be expected.
3.1.5. Effect of the hexanol concentration on the second
CV with black Pt electrodeposits with hexanol admission
at open circuit
Fig. 5 shows the second CVs and mass curves,
obtained as in Section 3.1.4, for a black Pt/Au/Q
electrode at 0.1 V s�1 in 0.5 M HClO4 (solid line) and
in the presence of 5 (dashed line) and 20 mM (dotted
line) hexanol. With increasing hexanol concentration,
the hydrogen desorption charge decreases, the anodicoxidation charge increases, and in the negative scan the
Pt oxide reduction charge decreases (Fig. 5A). Peak IV
almost does not appear at this high scan rate. With
forced coincidence of the mass at the positive potential
limit, in the positive scan the mass in 20 mM hexanol is
much lower than that in base electrolyte over the whole
potential range (Fig. 5B). Furthermore, in the negative
scan the mass decrease starts together with the scan with20 mM hexanol, while with 5 mM hexanol it starts at
lower potentials only, probably because with 20 mM
hexanol there is a larger extent of chemical reduction of
the Pt oxide by the alcohol. Similar results were
observed for bright Pt/Q electrodes (not shown).
The initial mass at the starting potential is much lower
with 20 mM hexanol than in base electrolyte, although
with 5 mM hexanol it was even higher than in base.Probably the physisorption of hexanol (in the double
layer region) increases significantly with concentration,
Table 4
Mass change per mole of electrons transferred obtained as the slopes of
Dm vs. DQ plots in Fig. 4
Scan rate/V s�1 Hs d.l. ox
Base 0.1 10.8 22.5 7.43
0.05 8.0 23.5 7.55
0.02 7.2 17.0 6.69
Butanol 0.1 2.42 3.68 1.71
0.05 2.02 3.35 1.21
0.02 1.26 2.07 0.73
Pentanol 0.1 3.87 1.75
0.05 3.15 1.27
0.02 2.10 0.78
The alcohol concentration was 20 mM.
Fig. 5. Second cyclic voltammetric (A) and simultaneously recorded
mass response (B) of a black Pt/Au/Q electrode at 0.1 V s�1 in 0.5 M
HClO4. The alcohol was added to the electrolyte while the electrode
was at open circuit and the scans were begun at the negative limit.
RF�/12.1.
C. Yanez et al. / 45

leading to a stronger inhibition of the adsorption of
water and/or ions. Furthermore, perhaps with 20 mM
hexanol there is an increase of chemisorbed CO, which
would preclude the adsorption of water and ions. This issupported by EMIRS results of Beden et al. [30], who
found that poisoning by CO of methanol oxidation on
smooth Pt electrodes is slight at low methanol concen-
trations, but very severe at higher concentrations.
3.2. Electrooxidation of hexanol at constant potential on
a bright Pt/Q electrode
In order to confirm the chemical reduction of the Pt
oxides by the alcohols, controlled potential experiments
were carried out with bright Pt/Q electrodes in 0.5 MHClO4. The results for controlled potentials of 0.3, 0.5,
0.7 and 0.9 V versus SCE are shown in Fig. 6A�/D,
respectively. The arrows show the moment at which
hexanol was added to the electrolyte up to a final
concentration of 8 mM, all the experiment being
conducted under continuous nitrogen bubbling. Curves
1 show the response in the presence of hexanol, and
curves 2, recorded in the absence of hexanol, have beenincluded for comparison purposes. It can be seen that
already at 0.4 V, the potential at which Pt oxidation
starts, hexanol addition produces an increase of anodic
current and a concomitant mass decrease. The simplest
interpretation of this mass decrease is that hexanol
reduces some Pt oxide chemically. Similar results were
observed by Wilde and Zhang [16] for methanol
oxidation at black Pt/Au/Q electrodes upon additionof methanol at different potentials, a chemical reaction
between the oxide and methanol being proposed.
3.3. Influence of the admission potential on the
electrooxidation of alcohols on smooth Pt
Due to the differences between the first and thesecond scans for the alcohol oxidation at a black Pt/
Au/Q electrode, measurements with a smooth Pt disc
were made admitting the alcohol at open circuit (Fig. 7)
and at �/0.22 V (Fig. 8). When the alcohol was admitted
at open circuit in deaerated 0.5 M HClO4 an immediate
potential decrease down to 0.05 V versus SCE was
observed, indicating that alcohol dissociative chemi-
sorption, yielding chemisorbed H, had occurred. TheCV obtained at 0.02 V s�1 in the presence of 2 mM of
alcohol (Fig. 7, solid line) shows, in comparison with
that in 0.5 M HClO4 (Fig. 7, dotted line), the well-
known decrease in the hydrogen region due to chemi-
sorbed residues produced by dissociative chemisorption
of the alcohol [1], and consequently the absence of peak
I, which is observed only with a CO-free Pt surface. Two
oxidation peaks in the positive scan (peaks II and III)and one in the negative scan (peak IV) appear. Peak III
is higher for heptanol and octanol, probably because of
an increased physisorption prior to the electrooxidation,
a decrease of the Pt oxide reduction peak also being
observed for these two alcohols. uHCO increases with
chain length, while the OP is at a minimum for hexanol
(Table 5).
If under the same experimental conditions the alco-hols are admitted at �/0.22 V, no decrease of the
hydrogen desorption charge, together with the appear-
ance of peaks I and IV, are observed for the five alcohols
(Fig. 8), independently of the chain length. The current
densities of peaks II and III depend hardly at all on
chain length, and the decrease of the Pt oxide reduction
peak with increasing chain length is far less than with
open circuit admission. The CO coverages produced inpeak I are lower than those produced by dissociative
chemisorption of the alcohols at open circuit, while the
OP values are higher (Table 6). Neither the CO coverage
nor the OP value shows a definite influence of chain
length.
4. Discussion
The electrooxidation of primary alcohols is a complex
reaction, in which different intermediates and products
may be involved in different potential regions, and,
furthermore, more than one reaction can occur simulta-
neously. Although certainly neither CV nor EQCM
techniques can provide information on the chemical
nature of intermediates and products, a detailed analysis
of the results can yield interesting insights on theprocesses involved. In this work the changes in the
resonance frequency of the quartz crystal microbalance
have been ascribed solely to mass changes, without
Fig. 6. Evolution with time of the mass change (Dm ) (A0/D) and of
the simultaneously recorded current density (j ) (E0/H) in the presence
(dashed lines (1)) and the absence (solid lines (2)) of 8 mM hexanol of a
bright Pt/Q electrode held at the following potentials: (A) 0.3; (B) 0.5;
(C) 0.7; and (D) 0.9 V vs. SCE. The moment of hexanol addition is
indicated by an arrow. The electrolyte was 0.5 M HClO4.
C. Yanez et al. / 46

considering the changes in the viscoelastic properties of
the interface which could occur, especially with the
longer-chain alcohols at concentrations near their solu-
bility limit.
4.1. Chemical reduction by alcohols of anodic oxides of
Pt
The potentiostatic experiments with bright commer-
cial Pt/Q electrodes (Fig. 6) show unequivocally that at
the same potential, 0.4 V, at which Pt oxidation starts,
the addition of hexanol brings about an increase of
anodic current, due to the electrooxidation of hexanol,
and a simultaneous mass decrease. As said above, this
mass decrease can be simply interpreted as being due to
a chemical reduction by hexanol of some Pt oxide. It isdifficult to envisage any other mechanism by which the
mass of the electrode would be decreased by hexanol
addition, since at 0.4 V or higher potentials the
adsorption of water and ions should be negligible as
compared with the mass increase due to Pt oxide
formation. As said in Section 1, according to the XPS
studies of Li et al. [10] the Pt surface oxides formed at
potentials below 1.0 V versus SCE are active catalysts
for alcohol electrooxidation, providing the required
oxygen atoms. These active Pt oxides would be present
over most of the potential excursion in the CVs
Fig. 7. Cyclic voltammograms of a smooth Pt electrode at 0.02 V s�1 in 0.5 M HClO4 without (dashed lines) and with (solid line) 2 mM of: (A) n -
butanol; (B) n -pentanol; (C) n -hexanol; (D) n -heptanol; and (E) n -octanol. The alcohols were admitted at open circuit and the scans were begun at
the negative limit. RF�/2.3.
Fig. 8. First cyclic voltammograms of a smooth Pt electrode at 0.02 V s�1 in 0.5 M HClO4 without (dashed lines) and with (solid line) 2 mM of: (A)
n -butanol; (B) n -pentanol; (C) n -hexanol; (D) n -heptanol; and (E) n -octanol. The alcohols were added to the electrolyte while the electrode was held
at �/0.2 V (SCE) and the scans were begun at this potential. RF�/2.3
Table 5
Parameters corresponding to the second positive scan at 0.02 V s�1 for
a smooth Pt electrode in 0.5 M HClO4�/2 mM alcohol
Alcohol /uHCO/ OP
Butanol 0.26 4.2
Pentanol 0.37 3.5
Hexanol 0.49 3.0
Heptanol 0.60 5.1
Octanol 0.71 5.9
Data from Fig. 7. RF�/2.3.
C. Yanez et al. / 47

presented here, since the positive potential limit was
1.2 V.
The increase of peak III and the decrease in peak IV
with the alcohol concentration is further experimental
evidence of chemical reduction of the Pt oxide. The rate
of this reaction probably depends on the surface
structure, as in the case of peak I.
4.2. Lack of activity of black electrodeposited Pt for the
dissociative chemisorption of alcohols
The behaviour towards alcohol chemisorption of
black electrodeposited Pt is completely different from
that of smooth, massive Pt (Fig. 7) [1], since even with
alcohol admission at open circuit, electrodeposited Pt
showed no activity for the dissociative chemisorption ofthe alcohol, and consequently the first CV showed peak
I, characteristic of a residue-free Pt surface (Fig. 1). This
lack of activity of electrodeposited Pt for alcohol
dissociation is also reflected in the open circuit potential,
which did not decrease significantly upon alcohol
addition, while, as is well known, the open circuit
potential of smooth Pt is readily and substantially
decreased by the dissociative adsorption of alcohols.Peak I does not appear in the second and subsequent
CVs, in the same way as it occurs with smooth Pt.
A dramatic difference between electrodeposited and
smooth Pt has been reported by Hilmi et al. [31], who
found that while electrooxidation of different 2,3-
butanediol stereoisomers on Pt produced different
current densities on smooth Pt, all the isomers yielded
about the same current density on a Pt/Pt electrode.It has been postulated recently by Pron’kin et al. [13]
that electrodeposited Pt has two types of sites, one type
being similar to the sites on smooth Pt, and another type
constituted by ‘defective’, low-coordination surface
sites, with a high oxygen binding energy. Upon electro-
oxidation these two types of sites would form two types
of Pt oxide, with low and high Pt�/O binding energies,
and therefore active and inactive, respectively, for thechemical oxidation of organic compounds.
The same model has been postulated by Mukerjee and
McBreen [32] for conventional electrocatalysts of car-
bon-supported Pt with a particle size of 2.5�/8.0 nm,
within which range there are significant differences in
the coordination degree of Pt atoms at the surface.
Particles smaller than 5 nm have many Pt sites with lowcoordination, and therefore able to form a strong Pt�/
OH bond stable at potentials more negative than 0.8 V
(RHE), inhibiting alcohol electrooxidation, which
would explain the absence of peak I in the second scans
(Fig. 2).
4.3. Dissociative chemisorption of alcohols on black
electrodeposited Pt and on smooth Pt
Besides the absence of peak I in the second scan with
black electrodeposited Pt, with the longer-chain alcohols
there occurs a high decrease in initial mass in the
hydrogen region as compared to that in base electrolyte
(Fig. 2), this mass decrease increasing with the alcohol
concentration. Since this mass decrease occurs with the
longer chain alcohols only, it should be due to physisorp-
tion of these more hydrophobic alcohols in the doublelayer region during the negative scan of the first CV.
For smooth Pt uHCO; which measures the coverage of
chemisorbed residues produced during the negative scan
of the first cycle, increases monotonically with the chain
length up to octanol (Table 5), whereas for Pt black it
increases only up to hexanol (Table 2). It is remarkable
that, with the exception of heptanol, the values are very
similar for both Pt/Au/Q and smooth Pt electrodes, and,as a matter of fact, the values are identical for pentanol
and hexanol.
Dissociative chemisorption of the alcohols is a process
which occurs at fairly high potentials, at which the Pt
surface contains oxide or hydroxide sites, and, in
principle, the reactivity of the hydroxyl group of the
alcohol should be independent of the chain length.
However, the monotonic increase of uHCO with chain
length indicates that in the previous negative sweep
there occurs, simultaneously with the dissociative che-
misorption, a physisorption of the alcohols that ob-
viously would increase with increasing chain length, i.e.
with increasing hydrophobicity, of the alcohol. This
physisorption would be the origin of the great mass
decrease at the beginning of the second positive scan
with pentanol�/octanol, and of the increase of this effectwith the alcohol concentration for the lower alcohols.
The fact that the mass decrease is absent in the first
positive sweep (Fig. 1) indicates that this physisorption
takes place only on the freshly reduced Pt sites, since the
rapidly increasing current in the double layer region
after holding the potential at �/0.22 V, both in the
absence and presence of alcohol added at that potential
(Fig. 1), indicates that the Pt surface after a potentialhold is not exceedingly clean.
It should be stressed that the mass curve of black Pt/
Au/Q electrodes in 0.5 M HClO4 changes with repetitive
Table 6
Parameters corresponding to the first positive scan at 0.02 V s�1 for a
smooth Pt electrode in 0.5 M HClO4�/2 mM alcohol with alcohol
admission at �/0.22 V
Alcohol /uICO/ OP
Butanol 0.32 7.5
Pentanol 0.10 5.9
Hexanol 0.20 5.7
Heptanol 0.06 5.7
Octanol 0.20 5.9
Data from Fig. 8. RF�/2.3.
C. Yanez et al. /48

potential cycling [18,19] as a consequence of changes in
the deposit structure, while the bright Pt/Q electrodes
show a more stable behaviour. For this reason in this
work the black Pt/Au/Q electrodes were subjected to afew potential cycles only.
5. Conclusions
The results presented here indicate the following:
a) None of the alcohols tested became adsorbed on
black Pt/Au/Q electrodes when they were admitted
at a controlled potential of �/0.22 V, since the
electrode mass was unaffected by the alcoholaddition. Probably this was due to contamination
of the electrode surface during the potential hold,
since all the reactants were p.a. grade and were used
as received.
b) With black Pt/Au/Q electrodes the initial mass at
the beginning of the second scan was lower for
pentanol�/heptanol as compared with the initial
mass in the first scan, which indicates that theselonger, more hydrophobic alcohols physisorb on
black electrodeposited Pt in the double layer region
during the negative scan of the first CV, i.e. on
freshly reduced, and thereby cleaned, Pt sites.
c) Chemical reduction of the Pt oxides by the alcohols
has been demonstrated unequivocally by controlled
potential experiments with Pt/Q electrodes in 0.5 M
HClO4. Hexanol addition at 0.4 V, the potential atwhich Pt oxidation starts, or higher potentials
produces a concomitant mass decrease, the simplest
interpretation of this decrease being that hexanol
reduces the Pt oxide chemically.
d) While primary alcohols chemisorb dissociatively on
polished Pt at open circuit, producing chemisorbed
residues that inactivate the electrooxidative dehy-
drogenation of alcohols that gives origin to peak I,they do not on black Pt electrodeposits, probably
because many of the Pt atoms in the deposit have a
low coordination, and therefore bind oxygen so
strongly that the Pt oxide cannot react chemically
with the alcohols.
e) The mass curves show, as was to be expected from
the CVs, that reduction of Pt oxide, but not its
formation, becomes increasingly irreversible withincreasing scan rate.
Acknowledgements
The authors are grateful to DICYT-USACH and
FONDECYT (grant 2970020). C.Y. thanks CONICYT-
CHILE for a doctoral fellowship.
References
[1] T.D. Jarvi, E.M. Stuve, Fundamental aspects of vacuum and
electrocatalytic reactions of methanol and formic acid on
platinum surfaces, in: J. Lipkowski, P.N. Ross (Eds.), Electro-
catalysis (Chapter 3), Wiley-VCH, New York, 1998, p. 75.
[2] S. Wasmus, A. Kuver, J. Electroanal. Chem. 461 (1999) 14.
[3] E.I. Sokolova, Electrochim. Acta 24 (1979) 147.
[4] V.M. Schmidt, R. Ianniello, E. Pastor, S. Gonzalez, J. Phys.
Chem. 100 (1996) 17901.
[5] R. Ianniello, V. Schmidt, J.L. Rodrıguez, E. Pastor, J. Electro-
anal. Chem. 471 (1999) 167.
[6] M. Schell, J. Electroanal. Chem. 457 (1998) 221.
[7] M. Krausa, W. Vielstich, J. Electroanal. Chem. 399 (1995)
7.
[8] R.S. Goncalves, J.-M. Leger, C. Lamy, Electrochim. Acta 34
(1998) 433.
[9] N.-H. Li, S.-G. Sun, J. Electroanal. Chem. 436 (1997) 65.
[10] N.-H. Li, S.-G. Sun, S.-P. Chen, J. Electroanal. Chem. 430 (1997)
57.
[11] B. Beden, F. Hahn, J.M. Leger, C. Lamy, C.L. Perdriel, N.R. de
Tacconi, R.O. Lezna, A.J. Arvıa, J. Electroanal. Chem. 301 (1991)
129.
[12] G. Foti, C. Mousty, K. Novy, Ch. Comninellis, V. Reid, J. Appl.
Electrochem. 30 (2000) 147.
[13] S.N. Pron’kin, O.A. Petrii, G.A. Tsirlina, D.J. Schiffrin, J.
Electroanal. Chem. 480 (2000) 112.
[14] N.P. Lebedeva, G.N. Kryukova, S.V. Tsybulya, A.N. Salanov,
E.R. Savinova, Electrochim. Acta 44 (1998) 1431.
[15] D.A. Buttry, Applications of the quartz crystal microbalance to
electrochemistry, in: A.J. Bard (Ed.), Electroanalytical Chemistry,
vol. 17 (Chapter 1), Marcel Dekker, Inc, New York, 1990, p. 1.
[16] C.P. Wilde, M. Zhang, Electrochim. Acta 39 (1994) 347.
[17] L. Daikhin, E. Gileadi, V. Tsionsky, M. Urbakh, G. Zilberman,
Electrochim. Acta 45 (2000) 3615.
[18] C.P. Wilde, S.V. de Cliff, K.C. Hui, D.J.L. Brett, Electrochim.
Acta 45 (2000) 3649.
[19] M.S. Ureta-Zanartu, C. Yanez, J.H. Zagal, Bol. Soc. Chil. Quim.
46 (2001) 15.
[20] A.A. Mikhaylova, O.A. Khazova, V.S. Bagotzky, J. Electroanal.
Chem. 480 (2000) 225.
[21] D.A. Buttry, The quartz crystal microbalance as in situ tool in
electrochemistry, in: H.D. Abruna (Ed.), Electrochemical Inter-
faces: Modern Techniques for In-Situ Interface Characterization
(Chapter 10), VCH-publishers, New York, 1991, p. 529.
[22] O.A. Petry, B.I. Podlovchenko, A.N. Frumkin, H. Lal, J.
Electroanal. Chem. 10 (1969) 253.
[23] X.H. Xia, T. Iwasita, F. Ge, W. Vielstich, Electrochim. Acta 41
(1996) 711.
[24] W. Vielstich, X.H. Xia, J. Phys. Chem. 99 (1995) 10421.
[25] F. Gloaguen, J.M. Leger, C. Lamy, J. Electroanal. Chem. 467
(1999) 186.
[26] M.C. Santos, D.W. Miwa, S.A.S. Machado, Electrochem. Com-
mun. 2 (2000) 692.
[27] W. Visscher, J.F.E. Gootzen, A.P. Cox, J.A.R. van Veen,
Electrochim. Acta 43 (1998) 533.
[28] S.J. Xia, V.I. Birss, Electrochim. Acta 45 (2000) 3659.
[29] S.J. Xia, V.I. Birss, Electrochim. Acta 44 (1998) 467.
[30] B. Beden, F. Hahn, S. Juanto, C. Lamy, J.M. Leger, J.
Electroanal. Chem. 225 (1987) 215.
[31] A. Hilmi, E.M. Belgsir, J.M. Leger, C. Lamy, J. Electroanal.
Chem. 382 (1995) 53.
[32] S. Mukerjee, J. McBreen, J. Electroanal. Chem. 448 (1998)
163.
C. Yanez et al. / 49