PCR MULTIPLEXED MICROSATELLITE PANELS TO EXPEDITE CANINE GENETIC DISEASE LINKAGE ANALYSIS
13
PCR MULTIPLEXED MICROSATELLITE PANELS TO EXPEDITE CANINE GENETIC DISEASE LINKAGE ANALYSIS M. L. Eggleston, * D. N. Irion, A. L. Schaffer, S. S. Hughes, J. E. Draper, K. R. Robertson, L. V. Millon, and N. C. Pedersen The Veterinary Genetics Laboratory, School of Veterinary Medicine, University of California, Davis, CA 95616, USA ABSTRACT Modern dog breeds possess large numbers of genetic diseases for which there are currently few candidate genes or diagnostic tests. Linkage of a micro- satellite marker to a disease phenotype is often the only available tool to aid in the development of screening tests for disease carriers. Detection of linkage to a specific disease phenotype requires screening of large numbers of markers across known affected and unaffected animals. To establish high throughput genome scanning this study placed 100 canine microsatellite markers, arranged by fragment size and fluorescent dye label, into 12 PCR multiplexed panels. The highest degree of multiplexing was 11 markers per panel while the lowest was five markers per panel; each panel was run in one gel lane on automated DNA sequencers. Selection of the markers was based upon chromosomal or linkage group locations, degree of polymorphism, PCR multiplex compatibility and ease of interpretation. The marker set has an average spacing of 22.25 centiMorgan (cM). Marker polymorphism was evaluated across 28 American Kennel Club (AKC) recognized breeds. The utility of buccal swab vs. blood samples was also validated in this study as all template DNA was derived from swabs obtained and submitted by participating dog breeders and owners. The PCR multiplexed microsatellite panels and sampling method described in this report will provide investigators * Corresponding author. Fax: (530) 752-3556; E-mail: [email protected] 223 DOI: 10.1081=ABIO-120016191 1049-5398 (Print); 1532-2378 (Online) Copyright # 2002 by Marcel Dekker, Inc. www.dekker.com ANIMAL BIOTECHNOLOGY Vol. 13, No. 2, pp. 223–235, 2002 ©2002 Marcel Dekker, Inc. All rights reserved. This material may not be used or reproduced in any form without the express written permission of Marcel Dekker, Inc. MARCEL DEKKER, INC. • 270 MADISON AVENUE • NEW YORK, NY 10016
-
Upload
independent -
Category
Documents
-
view
0 -
download
0
Transcript of PCR MULTIPLEXED MICROSATELLITE PANELS TO EXPEDITE CANINE GENETIC DISEASE LINKAGE ANALYSIS

PCR MULTIPLEXED MICROSATELLITE
PANELS TO EXPEDITE CANINE GENETICDISEASE LINKAGE ANALYSIS
M. L. Eggleston,* D. N. Irion, A. L. Schaffer, S. S. Hughes,
J. E. Draper, K. R. Robertson, L. V. Millon, and N. C. Pedersen
The Veterinary Genetics Laboratory, School of Veterinary Medicine,
University of California, Davis, CA 95616, USA
ABSTRACT
Modern dog breeds possess large numbers of genetic diseases for which there
are currently few candidate genes or diagnostic tests. Linkage of a micro-
satellite marker to a disease phenotype is often the only available tool to aid in
the development of screening tests for disease carriers. Detection of linkage to
a specific disease phenotype requires screening of large numbers of markers
across known affected and unaffected animals. To establish high throughput
genome scanning this study placed 100 canine microsatellite markers,
arranged by fragment size and fluorescent dye label, into 12 PCR multiplexed
panels. The highest degree of multiplexing was 11 markers per panel while the
lowest was five markers per panel; each panel was run in one gel lane on
automated DNA sequencers. Selection of the markers was based upon
chromosomal or linkage group locations, degree of polymorphism, PCR
multiplex compatibility and ease of interpretation. The marker set has an
average spacing of 22.25 centiMorgan (cM). Marker polymorphism was
evaluated across 28 American Kennel Club (AKC) recognized breeds. The
utility of buccal swab vs. blood samples was also validated in this study as all
template DNA was derived from swabs obtained and submitted by
participating dog breeders and owners. The PCR multiplexed microsatellite
panels and sampling method described in this report will provide investigators
*Corresponding author. Fax: (530) 752-3556; E-mail: [email protected]
223
DOI: 10.1081=ABIO-120016191 1049-5398 (Print); 1532-2378 (Online)
Copyright # 2002 by Marcel Dekker, Inc. www.dekker.com
ANIMAL BIOTECHNOLOGY
Vol. 13, No. 2, pp. 223–235, 2002
©2002 Marcel Dekker, Inc. All rights reserved. This material may not be used or reproduced in any form without the express written permission of Marcel Dekker, Inc.
MARCEL DEKKER, INC. • 270 MADISON AVENUE • NEW YORK, NY 10016
with a cost effective and expedient means of pursuing linkage studies of
specific canine genetic diseases.
Key Words: Canine DNA; Polymorphisms; Genome screen; Linkage;
Microsatellites
INTRODUCTION
Comparative gene mapping continues to provide clues to candidate genes
from analogous human diseases,[1–3] but any and all means of controlling canine
genetic disease must be put to use. Disease phenotypes related to either single gene
defects or polygenic disorders with a dominant gene effect lend themselves to
linkage studies with type II markers.[4–7] Integration of the canine linkage and
radiation hybrid (RH) maps provided nearly 500 mapped microsatellite markers
for potential use in disease linkage studies.[8–10] Although these markers provide
reasonable coverage of the canine genome they are not all equally effective in
genome screening applications. Inadequacies are encountered when public domain
markers are rigorously evaluated. These include published PCR primer sequences
that fail to amplify detectable product under standard PCR parameters or a lack of
polymorphism when markers are examined across a variety of breeds. The present
study addressed these concerns and extensively characterized numerous markers
for polymorphism on 28 American Kennel Club (AKC) recognized breeds. These
breeds are a random cross section of the 150 AKC breeds, currently divided by the
AKC into seven distinct groups. Four breeds from each group were selected to
provide an accurate assessment of marker polymorphism across all AKC breeds.
In addition, the AKC Canine Health Foundation has specifically targeted many of
these breeds for genetic disease research.
The use of fluorescence-labeled microsatellites sized on automated DNA
sequencers is standard for gene mapping, disease linkage analysis, forensic
investigations, and paternity testing.[11–15] The degree of automation allowed by
this methodology, combined with high-speed DNA fragment analysis and data
acquisition software, provides an efficient means for testing large sample numbers.
This high throughput process can be further enhanced by multiplex PCR, which
allows simultaneous amplification of multiple markers that are identified during
gel electrophoresis by unique fluorescent labels. Genetic analyses requiring large
number of markers are expedited by this technique, with the added advantage of
dramatically decreasing PCR reagent costs. A majority of published markers have
not been evaluated for reliable amplification in a multiplex PCR or for PCR
products that can be easily interpreted and sized by DNA fragment analysis
software. Unreliable markers increase test costs while those that are hard to
interpret, relative to allele sizing, increase analysis time, and may yield erroneous
linkage information. All markers screened for this study were assessed for
reliability of amplification and ease of interpretation; only those that performed
well in both areas were selected for inclusion in the project.
224 EGGLESTON ET AL.
©2002 Marcel Dekker, Inc. All rights reserved. This material may not be used or reproduced in any form without the express written permission of Marcel Dekker, Inc.
MARCEL DEKKER, INC. • 270 MADISON AVENUE • NEW YORK, NY 10016

MATERIALS AND METHODS
Animal Selection
Breeds were selected to provide four representative breeds from each of the
seven AKC recognized groups. The breeds screened were: Airedale Terrier, Akita,
American Eskimo Dog, Australian Shepherd, Borzoi, Belgian Tervuren, Bernese
Mountain Dog, Border Collie, Boxer, Brittany, Bulldog, Bull Terrier, Chow Chow,
Doberman Pinscher, Golden Retriever, Greyhound, Jack Russell Terrier,
Keeshond, Labrador Retriever, Miniature Bull Terrier, Norwegian Elkhound,
Papillon, Pembroke Welsh Corgi, Pomeranian, Pug, Rhodesian Ridgeback,
Weimaraner, and Yorkshire Terrier. An average of 41 unrelated animals was
tested for each breed. Individual animals were defined as unrelated if they shared
no common ancestors within the first generation.
Marker Selection and Panel Design
Markers were selected from the 1999 canine genetic linkage map[9] based on
their map location and their reported polymorphism and allele size ranges.
Additional unmapped markers were also evaluated based on known high
polymorphism values. In total, 117 markers were selected for evaluation.
Forward primers were synthesized and dye labeled with Fam, Hex or Tamra
[Applied Biosystems, Inc. (ABI), Foster City, CA]. Reverse primers were
synthesized by Operon (Alameda, CA). All primer pairs were initially tested at
final concentrations of 0.2mM and 0.4mM and at an annealing temperature of
64�C. Primer pairs that did not amplify at 64�C were tested under identical
conditions but at successively lower annealing temperatures until an optimum
temperature was determined. Primers were arranged into mini-panels of three to
six markers, based on their annealing temperature and dye label and then tested
against a minimum of 40 samples from each of 16 breeds to provide an accurate
estimate of their allele number and size range. Once parameters were determined
for each marker the final multiplex panels were assembled. Markers were grouped
by annealing temperature and then organized by dye color and size range as to not
allow any overlap of markers labeled with the same dye. As necessary, final primer
concentration adjustments were made to provide optimal product yield and the
lowest degree of non-specific artifact peaks. Completed panels were tested against
the remaining 12 breeds.
Sample Preparation and PCR Conditions
All samples used in this study were derived from buccal cell swabs taken
with nylon bristle cytology brushes (Medical Packaging Corp., Camarillo, CA)
collected by owners and submitted directly to the laboratory. DNA was extracted
PCR MULTIPLEXED MICROSATELLITE PANELS 225
©2002 Marcel Dekker, Inc. All rights reserved. This material may not be used or reproduced in any form without the express written permission of Marcel Dekker, Inc.
MARCEL DEKKER, INC. • 270 MADISON AVENUE • NEW YORK, NY 10016

by heating a single swab for 10 min at 95�C in 400 mL 50 mM NaOH and then
neutralized with 140mL 1 M Tris-HCl, pH 8.0. A 2 mL aliquot of this extraction
was then used in each PCR reaction. All markers were tested with a PCR reagent
mix of 1X PCR buffer (ABI), 2.5 mM MgCl2, 200 mM of each dNTP (Hoffmann-
La Roche Inc, Nutley, NJ), 0.7 unit AmpliTaq (ABI), and 2% DMSO. Thermal
cycler parameters differed depending on the annealing temperature used; all PCR
work was done on MJ Research PTC-100 thermal cyclers (Waltham, MA). Due to
the volume of information, all markers, primer sequences, appropriate primer
concentrations, and complete PCR protocols for the 12 panels are provided at the
Veterinary Genetics Laboratory website: http:==www.vgl.ucdavis.edu=research=canine=paper_data=index.jsp.
Gel Electrophoresis Conditions and DNA Fragment Analysis
One mL aliquots of PCR product were mixed with 2 mL Fluorescent Ladder
(CXR) 60–400 bases (Promega 400) or Internal Lane Standard 600 (Promega 600,
Promega, Madison, WI) fluorescent size standard, denatured on MJ Research PTC-
100 thermal cyclers for 3 min at 95�C, then held at 5�C or placed on ice for at least
1 min before gel loading. Two mL aliquots were then loaded onto a 6% denaturing
polyacrylamide gel and run on an ABI 377 Automated Sequencer using ABI
1000671800 short plates (12 cm). Gels were run at 1.10 kV (constant) voltage, 60.0 mA
current, 200 W power, 51�C, and 40.0 mW (constant) laser power for up to 2 hours
when using Promega 400, up to 3 hours using Promega 600. DNA fragment analysis
was performed with in-house designed STRand software[16] that replaces ABI
Genotyper and Genescan software and is available from the VGL website at:
http:==www.vgl.ucdavis.edu=STRand. This data was then transferred to an in-house
database compatible with the STRand software.
Statistical Analysis
Marker polymorphism was determined by the relative number and frequency
of alleles for a specific locus within each breed.[17,18] Allele frequencies and
observed heterozygosity (HO) were determined by direct counting; expected
heterozygosity (HE) was calculated from the allele frequencies. Polymorphism
information content (PIC)[19] and probability of exclusion (PE)[20] were
determined for all markers in each of the 28 breeds.
Linkage Analysis
Accuracy of pedigrees, quality of data, and linkage analysis were performed
with the various program options of CRIMAP-prepare, twopoint, build, and
chrompic.[21,22] A lod score of 3 was used as a minimum threshold for linkage.
226 EGGLESTON ET AL.
©2002 Marcel Dekker, Inc. All rights reserved. This material may not be used or reproduced in any form without the express written permission of Marcel Dekker, Inc.
MARCEL DEKKER, INC. • 270 MADISON AVENUE • NEW YORK, NY 10016

RESULTS
Marker Multiplex PCR Performance
Of the 117 markers originally selected for evaluation, ten would not
amplify under standard PCR parameters, three did not amplify under PCR
multiplex conditions, three were difficult to score (Table 1), and one proved
uninformative after extensive testing on multiple breeds. The remaining
100 markers were multiplexed into 12 panels, ranging from five to 11 markers
Table 1. Listing of Markers by Chromosomal Location. Also Included Are the
Number of Alleles, Average Observed Heterozygosity and Ease of Scoring
Across All 28 Breeds
Locus Chromosome #Alleles OH Ease of Scoring
C01.424 CFA01 8 0.472 4
FH2313 CFA01 11 0.694 4
FH2326 CFA01 9 0.636 4
AHT111 CFA02 11 0.649 4
AHT132 CFA02 8 0.489 5
FH2274 CFA02 8 0.598 4
C03.877 CFA03 9 0.493 4
FH2137 CFA03 10 0.650 4
FH2145 CFA03 9 0.469 4
PEZ12 CFA03 10 0.608 4
AHT103 CFA04 7 0.563 3
C04.140 CFA04 9 0.473 3
PEZ13 CFA04 11 0.660 4
C05.771 CFA05 9 0.524 5
CPH14 CFA05 10 0.593 5
FH2140 CFA05 8 0.592 4
C06.636 CFA06 10 0.450 5
CPH03 CFA06 8 0.611 5
FH2164 CFA06 9 0.652 4
C07.620 CFA07 8 0.469 5
FH2201 CFA07 11 0.641 3
PEZ22 CFA07 9 0.645 4
VIASD10 CFA07 8 0.550 4
C08.410 CFA08 10 0.582 5
C08.618 CFA08 8 0.521 5
FH2138 CFA08 14 0.672 3
PEZ11 CFA08 10 0.653 4
C09.173 CFA09 8 0.511 5
C09.250 CFA09 8 0.576 4
C10.404 CFA10 7 0.515 3
FH2293 CFA10 11 0.719 4
(continued )
PCR MULTIPLEXED MICROSATELLITE PANELS 227
©2002 Marcel Dekker, Inc. All rights reserved. This material may not be used or reproduced in any form without the express written permission of Marcel Dekker, Inc.
MARCEL DEKKER, INC. • 270 MADISON AVENUE • NEW YORK, NY 10016

Table 1. Continued
Locus Chromosome #Alleles OH Ease of Scoring
AHT136 CFA11 2 0.152 4
AHT137 CFA11 8 0.641 4
C11.750 CFA11 2 0.544 3
FH2004 CFA11 9 0.568 4
FH2054 CFA12 10 0.653 5
FH2200 CFA12 10 0.723 4
FH2202 CFA12 10 0.747 4
PEZ05 CFA12 8 0.500 4
AHT121 CFA13 11 0.616 5
C13.365 CFA13 7 0.568 5
C13.391 CFA13 9 0.491 5
C13.758 CFA13 2 0.467 5
C14.866 CFA14 9 0.596 3
PEZ10 CFA14 10 0.720 4
AHT139 CFA15 7 0.471 5
C15.608 CFA15 8 0.469 5
RVC1 CFA15 8 0.574 4
C16.147 CFA16 7 0.339 4
FH2175 CFA16 11 0.607 4
C17.402 CFA17 8 0.551 4
PEZ02 CFA17 10 0.658 4
PEZ08 CFA17 10 0.578 4
AHT130 CFA18 7 0.611 5
AHTk292 CFA18 9 0.511 5
FH2356 CFA18 10 0.473 5
Wilms-TF CFA18 10 0.607 4
CPH08 CFA19 10 0.549 4
PEZ03 CFA19 10 0.668 5
C20.253 CFA20 7 0.297 5
C20.446 CFA20 8 0.529 3
CPH16 CFA20 8 0.570 5
FH2148 CFA20 10 0.518 4
FH2161 CFA21 10 0.657 5
FH2233 CFA21 13 0.712 4
INRA21 CFA21 7 0.471 5
C22.279 CFA22 10 0.631 4
C22.763 CFA22 9 0.554 4
AHTk253 CFA23 8 0.564 4
C23.123 CFA23 8 0.502 4
FH2001 CFA23 8 0.560 5
FH2283 CFA23 9 0.629 4
FH2079 CFA24 7 0.209 4
C25.213 CFA25 8 0.542 4
FH2324 CFA25 12 0.620 4
228 EGGLESTON ET AL.
©2002 Marcel Dekker, Inc. All rights reserved. This material may not be used or reproduced in any form without the express written permission of Marcel Dekker, Inc.
MARCEL DEKKER, INC. • 270 MADISON AVENUE • NEW YORK, NY 10016

each. Nine of the panels were each amplified in one PCR reaction and run in
one gel lane. The remaining three panels each required two separate
amplifications, which were then co-loaded into one gel lane. Variation of
annealing temperature and primer concentration proved to be the most effective
means to achieve simultaneous amplification of multiple primer pairs.
Approximately 90% of the markers amplified at an annealing temperature of
60�C or above; 11 markers required temperatures below 60�C. High annealing
stringency made it possible to multiplex up to 11 loci in a single reaction
without generating excessive non-specific artifact peaks. More than 86% of the
original markers were successfully amplified and multiplexed despite fairly
stringent PCR conditions. Approximately one third of the markers were
represented by each fluorescent dye: 36 for Fam, 34 for Hex, and 30 for Tamra.
Of the markers that did not amplify, two were labeled with Fam, three with
Hex and five with Tamra. Failure to amplify was not thought to be a function
of the dye label.
Table 1. Continued
Locus Chromosome #Alleles OH Ease of Scoring
AHTk211 CFA26 9 0.478 5
FH2130 CFA26 8 0.572 3
C27.671 CFA27 7 0.458 5
FH2289 CFA27 8 0.690 4
LEI002 CFA27 11 0.548 5
PEZ18 CFA27 8 0.680 3
C28.176 CFA28 9 0.507 5
C29.002 CFA29 8 0.456 4
FH2328 CFA29 9 0.583 5
INRA02 CFA29 8 0.564 3
FH2305 CFA30 12 0.656 4
C31.646 CFA31 9 0.533 4
FH2199 CFA31 13 0.775 3
CPH02 CFA32 7 0.498 5
FH2165 CFA33 14 0.677 4
FH2361 CFA33 11 0.672 4
AHT133 CFA37 10 0.498 5
LEI004 CFA37 7 0.538 4
CXX130 Not mapped 8 0.358 4
CXX161 Not mapped 7 0.438 5
CXX263 Not mapped 9 0.559 3
FH2247 Not mapped 12 0.769 4
LEI003 Not mapped 8 0.456 4
LEI005 Not mapped 7 0.459 5
LEI007 Not mapped 8 0.521 3
PCR MULTIPLEXED MICROSATELLITE PANELS 229
©2002 Marcel Dekker, Inc. All rights reserved. This material may not be used or reproduced in any form without the express written permission of Marcel Dekker, Inc.
MARCEL DEKKER, INC. • 270 MADISON AVENUE • NEW YORK, NY 10016

The original panels were optimized using fluorescent dye labels, Fam, Hex,
and Tamra. In January 2001, Ned and Vic became commercially available. Tamra
and Hex were replaced respectively with labels Ned and Vic. The new labels
provide for less dye shedding during gel runs, particularly noted with Tamra, and
consistently allow for a lower primer concentration to be used. Subsequently, the
final panels presented on the web site were optimized using the new labels. Result
data remain unchanged.
Marker Analysis and Allele Sizing
Markers were evaluated for PCR products that could be easily interpreted and
sized by DNA fragment analysis software. Ease of allele sizing, with a score of 5
representing the optimum, was based on several factors including lack of
non-specific artifact peaks, consistency of sizing predicted by the repeat type, lack
of allelic dropout, and lack of differential peak heights. A majority of the markers,
84%, scored 4 or higher with 34 receiving a score of 5 and 51 receiving a score of
4 (Table 1). A marginal score of 3 was given to 14 markers; two received a score of
2 and may be replaced if alternative markers become available near their map
locations. Slightly more dinucleotide repeats than tetranucleotide repeats, 57 vs. 42,
and only one trinucleotide fulfilled selection criteria. Some reports[23] indicate that
dinucleotide repeats are difficult to interpret due to stutter peaks; this has proven
not to be an issue when using fluorescent dye detection. Although canine
dinucleotide repeats tend to be less polymorphic than tetranucleotides,[24] when all
criteria for inclusion in this study were considered, the two repeat types often
ranked equally. Some tetranucleotide loci received low scores because they
possessed alleles differing in size by 1, 2, and 3 bases, in addition to the usual
multiples of 4 base differences, which made accurate interpretation of allele sizes
difficult. In all, the majority of the markers successfully multiplexed were readily
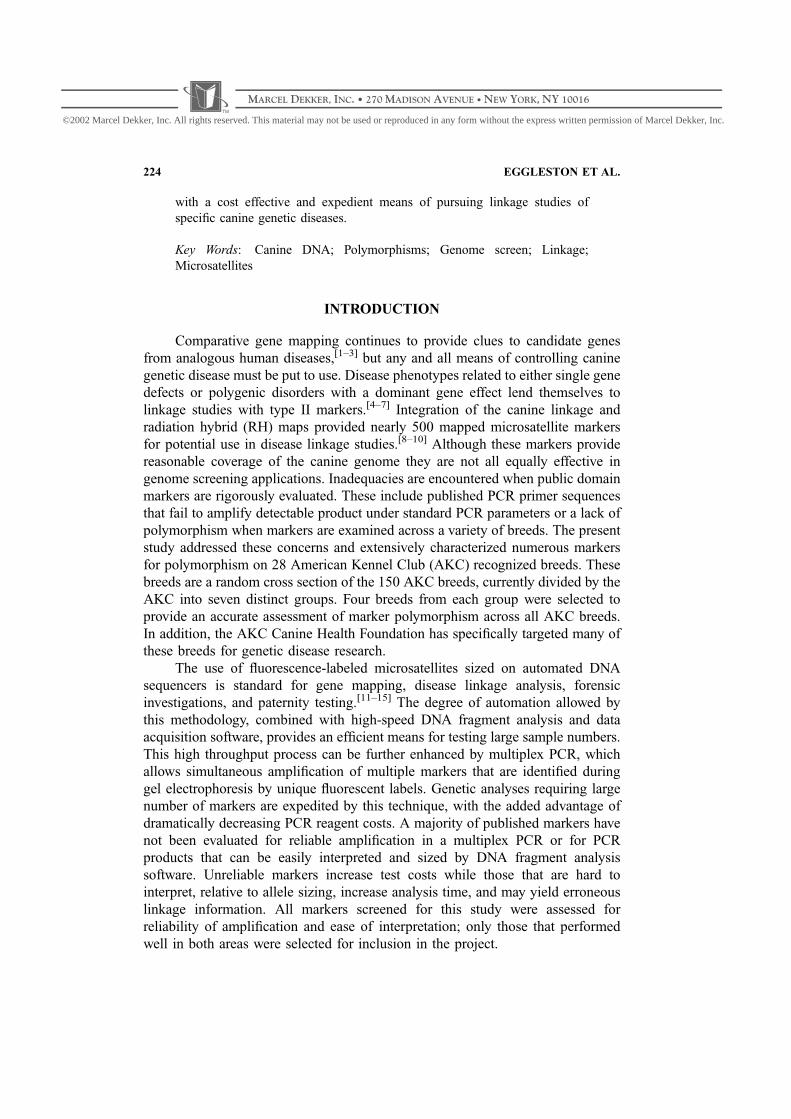
scored, providing for high throughput gel analysis. Figure 1 is an electropherogram
image of the K9-1 panel during assembly of that panel.
Marker Statistics and Resolution
It was not feasible to present the large volume of statistical data, 114,737
genotypes, generated by this study in a journal format. Therefore, the complete
statistical information for each marker on all 28 breeds can be found at the
Veterinary Genetics Laboratory web site http:==www.vgl.ucdavis.edu=research=canine=paper_data=index.jsp. Table 1, presented in the text, lists the average
number of alleles and average heterozygosity across breeds for each marker to give a
preliminary indication of the possible informative value of the markers. However,
providing an overall average PIC value for these markers across 28 breeds can be
misleading due to the high degree of genetic heterogeneity between modern dog
breeds and the resultant wide variation in marker polymorphism.[17,18] For example,
230 EGGLESTON ET AL.
©2002 Marcel Dekker, Inc. All rights reserved. This material may not be used or reproduced in any form without the express written permission of Marcel Dekker, Inc.
MARCEL DEKKER, INC. • 270 MADISON AVENUE • NEW YORK, NY 10016

Fig
ure
1.
An
imag
efr
om
the
ST
Ran
dso
ftw
are
asv
iew
edo
na
com
pu
ter
mo
nit
or.
A4
8la
ne
gel
file
fro
man
AB
I
37
7,
anel
ectr
op
her
og
ram
fro
mla
ne
21
and
the
frag
men
tsi
zes
det
ecte
dfo
rsa
mp
leD
R4
04
3ru
nw
ith
the
K9
-1
pan
elar
ed
epic
ted
inth
isim
age.
PCR MULTIPLEXED MICROSATELLITE PANELS 231
©2002 Marcel Dekker, Inc. All rights reserved. This material may not be used or reproduced in any form without the express written permission of Marcel Dekker, Inc.
MARCEL DEKKER, INC. • 270 MADISON AVENUE • NEW YORK, NY 10016

the overall average PIC for FH2238 was 0.572 yet the range across the breeds was
from 0.085–0.806. Therefore, PIC, PE, and heterozygosity values for each marker
are presented individually by breed on the web site. Listed in Table 1 and on the web
site is the chromosomal distribution of markers according to the latest integrated
canine map;[25] the present panels cover all but four chromosomes. In-house linkage
analysis shows an average distance between markers of 22.25 cM with the smallest
gap being 0.8 cM and the largest being 56.4 cM. The panels also contain seven
markers, which currently remain unmapped.
Sampling Methods
A major obstacle to the completion of this project was the large number of
samples required for accurate statistical data. The non-invasive buccal swab
sample collection technique resulted in a significantly higher rate of owner
participation than usually seen with requests for blood sample donations. Template
DNA derived from buccal cell swabs rather than blood samples proved not to be an
issue. Greater than 99% of samples submitted to the laboratory yielded more than
adequate amounts of template DNA, generally enough for 200 plus PCR reactions
per swab. In addition, consistent amplification of PCR product was obtained from
the relatively crude buccal swab preparations. The swabs were shipped by regular
post with no restrictions on temperature or transit time.
DISCUSSION
The extensive statistical data presented in this study, 100 markers across 28
AKC breeds, have provided confirmation of the expected disparity in marker
polymorphism between phenotypically diverse domestic dog breeds. A consider-
able number of the breeds tested were quite homogenous, many unrelated
individuals possessed similar DNA profiles, and most markers had unusually low
numbers of observed alleles. Lack of canine genetic diversity may eventually
necessitate selective out-crossing among breeds. Expanded profiling of all
recognized breeds and feral populations using the 100 marker panels will help
determine the extent of existing genetic variation. The substantial variations in
allele numbers and frequencies among the 28 targeted breeds dictate the need to
determine baseline polymorphism values on any breed prior to beginning linkage
analysis studies.
The 100 markers presented here represent a significant first step towards a
minimum 300-marker set, placed in PCR multiplexes, and which will provide a
10 cM low-resolution genome screen assuming a canine genome size of
2650 cM.[9] Screening hundreds of samples, from affected and unaffected animals,
for a specific disease investigation will be significantly more cost effective and
expedient through the use of PCR multiplexed panels of well-characterized
markers. The statistical data presented here, combined with the PCR multiplex
232 EGGLESTON ET AL.
©2002 Marcel Dekker, Inc. All rights reserved. This material may not be used or reproduced in any form without the express written permission of Marcel Dekker, Inc.
MARCEL DEKKER, INC. • 270 MADISON AVENUE • NEW YORK, NY 10016

parameters, will allow many investigators to quickly initiate linkage analysis for
their specific disease study.
Detection of marker linkages will aid in development of indirect diagnostic
tests to screen for carriers of genetic disorders[26] or in the determination of the
actual chromosomal location of the disease gene(s).[4,5,27,28] The availability of
diagnostic tests for inherited diseases will help breeders make informed breeding
decisions with an ultimate goal of decreasing the incidence of canine genetic
diseases.
ACKNOWLEDGMENTS
This work was supported in part by grants from the American Kennel Club Canine
Health Foundation. We would also like to thank the many dog breeders who made this
work possible by the submission of samples and pedigrees.
REFERENCES
1. Acland, G.M.; Ray, K.; Mellersh, C.S.; Gu, W.; Langston, A.A.; Rine, J.;
Ostrander, E.A.; Aguirre, G.D. Linkage Analysis and Comparative Mapping of
Canine Progressive Rod-Cone Degeneration (prcd) Establishes Potential Locus
Homology with Retinitis Pigmentosa (RP17) in Humans. Proc. Natl. Acad. Sci.
USA. 1998, 95 (6), 3048–3053.
2. Acland, G.M.; Ray, K.; Mellersh, C.S.; Langston, A.A.; Rine, J.; Ostrander, E.A.;
Aguirre, G.D. A Novel Retinal Degeneration Locus Identified by Linkage and
Comparative Mapping of Canine Early Retinal Degeneration. Genomics 1999, 59 (2),
134–142.
3. Blazej, R.G.; Mellersh, C.S.; Cork, L.C.; Ostrander, E.A. Hereditary
Canine Spinal Muscular Atrophy is Phenotypically Similar but Mole-
cularly Distinct from Human Spinal Muscular Atrophy. J. Hered. 1998, 89 (6),
531–537.
4. Bailey, E.; Reid, R.C.; Skow, L.C.; Mathiason, K.; Lear, T.L.; McGuire, T.C. Linkage
of the Gene for Equine Combined Immunodeficiency Disease to Microsatellite
Markers HTG8 and HTG4; Synteny and FISH Mapping to ECA9. Anim. Genet.
1997, 28 (4), 268–273.
5. Jonasdottir, T.J.; Mellersh, C.S.; Moe, L.; Heggebo, R.; Gamlem, H.;
Ostrander, E.A.; Lingaas, F. Genetic Mapping of a Naturally Occurring Hereditary
Renal Cancer Syndrome in Dogs. Proc. Natl. Acad. Sci. USA. 2000, 97 (8),
4132–4137.
6. Werner, P.; Mellersh, C.S.; Raducha, M.G.; DeRose, S.; Acland, G.M.; Prociuk, U.;
Wiegand, N.; Aguirre, G.D.; Henthorn, P.S.; Patterson, D.F.; Ostrander, E.A.
Anchoring of Canine Linkage Groups with Chromosome-Specific Markers.
Mamm. Genome 1999, 10 (8), 814–823.
7. Yuzbasiyan-Gurkan, V.; Blanton, S.H.; Cao, Y.; Ferguson, P.; Li, J.; Venta, P.J.;
Brewer, G.J. Linkage of a Microsatellite Marker to the Canine Copper Toxicosis
Locus in Bedlington Terriers. Am. J. Vet. Res. 1997, 58 (1), 23–27.
PCR MULTIPLEXED MICROSATELLITE PANELS 233
©2002 Marcel Dekker, Inc. All rights reserved. This material may not be used or reproduced in any form without the express written permission of Marcel Dekker, Inc.
MARCEL DEKKER, INC. • 270 MADISON AVENUE • NEW YORK, NY 10016

8. Mellersh, C.S.; Hitte, C.; Richman, M.; Vignaux, F.; Priat, C.; Jouquand, S.;
Werner, P.; Andre, C.; DeRose, S.; Patterson, D.F.; Ostrander, E.A.; Galibert, F.
An Integrated Linkage-Radiation Hybrid Map of the Canine Genome.
Mamm. Genome 2000, 11 (2), 120–130.
9. Neff, M.W.; Broman, K.W.; Mellersh, C.S.; Ray, K.; Acland, G.M.;
Aguirre, G.D.; Ziegle, J.S.; Ostrander, E.A.; Rine, J. A Second-Generation
Genetic Linkage Map of the Domestic Dog, Canis Familiaris. Genetics 1999, 151
(2), 803–820.
10. Priat, C.; Hitte, C.; Vignaux, F.; Renier, C.; Jiang, Z.; Jouquand, S.; Cheron, A.;
Andre, C.; Galibert, F. A Whole-Genome Radiation Hybrid Map of the Dog Genome.
Genomics 1998, 54 (3), 361–378.
11. Agardi, D.; Pigg, M.; Sjoholm, A.G.; Truedsson, L.; Spath, P.J.; Kuijper, E.J.;
Tijssen, C.C.; Tranebjaerg, L.; Gustavson, K.H.; Ulfendahl, P.J. Fluorescent
Detection of Microsatellite Polymorphisms: Properdin Deficiency Linked to PFC
Microsatellite. Exp. Clin. Immunogenet. 1995, 12 (2), 111–114.
12. Alonso, J.; Garcia-Miguel, P.; Abelairas, J.; Mendiola, M.; Pestana, A.
A Microsatellite Fluorescent Method for Linkage Analysis in Familial Retinoblas-
toma and Deletion Detection at the RB1 Locus in Retinoblastoma and Osteosarcoma.
Diagn. Mol. Pathol. 2001, 10 (1), 9–14.
13. Berg, K.D.; Glaser, C.L.; Thompson, R.E.; Hamilton, S.R.; Griffin, C.A.;
Eshleman, J.R. Detection of Microsatellite Instability by Fluorescence Multiplex
Polymerase Chain Reaction. J. Mol. Diagn. 2000, 2 (1), 20–28.
14. Heyen, D.W.; Beever, J.E.; Da, Y.; Evert, R.E.; Green, C.; Bates, S.R.; Ziegle, J.S.;
Lewin, H.A. Exclusion Probabilities of 22 Bovine Microsatellite Markers in
Fluorescent Multiplexes for Semiautomated Parentage Testing. Anim. Genet. 1997,
28 (1), 21–27.
15. Lindqvist, A.K.; Magnusson, P.K.; Balciuniene, J.; Wadelius, C.; Lindholm, E.;
Alarcon-Riquelme, M.E.; Gyllensten, U.B. Chromosome-Specific Panels of Tri- and
Tetranucleotide Microsatellite Markers for Multiplex Fluorescent Detection and
Automated Genotyping: Evaluation of Their Utility in Pathology and Forensics.
Genome Res. 1996, 6 (12), 1170–1176.
16. Hughes, S. STRand Nucleic Acid Analysis Software; Regents of the University of
California: Davis, 1998; http:==www.vgl.ucdavis.edu=STRand.
17. Lingaas, F.; Aarskaug, T.; Sorensen, A.; Moe, L.; Sundgren, P.E. Estimates of
Genetic Variation in Dogs Based on Microsatellite Polymorphism. In Animal
Genetics, XXVth International Conference, 1996, Tours, France.
18. Zajc, I.; Mellersh, C.S.; Sampson, J. Variability of Canine Microsatellites Within and
Between Different Dog Breeds. Mamm. Genome 1997, 8 (3), 182–185.
19. Botstein, D.; White, R.L.; Skolnick, M.; Davis, R.W. Construction of a Genetic
Linkage Map in Man Using Restriction Fragment Length Polymorphisms. Am. J.
Hum. Genet. 1980, 32 (3), 314–331.
20. Jamieson, A.; Taylor, S.C. Comparisons of Three Probability Formulae for Parentage
Exclusion. Anim. Genet. 1997, 28 (6), 397–400.
21. Green, P.; Falls, K.; Crooks, K. Documentation for CRIMAP; (Version 2.4);
Washington University, School of Medicine: St. Louis, 1990.
22. Lander, E.S.; Green, P. Construction of Multilocus Genetic Linkage Maps in
Humans. Proc. Natl. Acad. Sci. USA 1987, 84 (8), 2363–2367.
234 EGGLESTON ET AL.
©2002 Marcel Dekker, Inc. All rights reserved. This material may not be used or reproduced in any form without the express written permission of Marcel Dekker, Inc.
MARCEL DEKKER, INC. • 270 MADISON AVENUE • NEW YORK, NY 10016

23. Richman, M.; Mellersh, C.S.; Andre, C.; Galibert, F.; Ostrander, E.A. Characteriza-
tion of a Minimal Screening Set of 172 Microsatellite Markers for Genome-Wide
Screens of the Canine Genome. J. Biochem. Biophys. Methods 2001, 47 (1–2),
137–149.
24. Francisco, L.V.; Langston, A.A.; Mellersh, C.S.; Neal, C.L.; Ostrander, E.A. A Class
of Highly Polymorphic Tetranucleotide Repeats for Canine Genetic Mapping.
Mamm. Genome 1996, 7 (5), 359–362.
25. Breen, M.; Jouquand, S.; Renier, C.; Mellersh, C.S.; Hitte, C.; Holmes, N.G.;
Cheron, A.; Suter, N.; Vignaux, F.; Bristow, A.E.; Priat, C.; McCann, E.;
Andre, C.; Boundy, S.; Gitsham, P.; Thomas, R.; Bridge, W.L.; Spriggs, H.F.;
Ryder, E.J.; Curson, A.; Sampson, J.; Ostrander, E.A.; Binns, M.M.; Galibert, F.
Chromosome-Specific Single-Locus FISH Probes Allow Anchorage of an
1800-Marker Integrated Radiation-Hybrid=Linkage Map of the Domestic Dog
Genome to all Chromosomes. Genome Res. 2001, 11 (10), 1784–1795.
26. Proschowsky, H.F.; Jepsen, B.; Jensen, H.E.; Jensen, A.L.; Fredholm, M.
Microsatellite Marker C04107 as a Diagnostic Marker for Copper Toxicosis in the
Danish Population of Bedlington Terriers. Acta Vet. Scand. 2000, 41 (4), 345–350.
27. Kunieda, T.; Ide, H.; Nakagiri, M.; Yoneda, K.; Konfortov, B.; Ogawa, H.
Localization of the Locus Responsible for Chediak-Higashi Syndrome in Cattle to
Bovine Chromosome 28. Anim. Genet. 2000, 31 (2), 87–90.
28. Lingaas, F.; Aarskaug, T.; Sletten, M.; Bjerkas, I.; Grimholt, U.; Moe, L.;
Juneja, R.K.; Wilton, A.N.; Galibert, F.; Holmes, N.G.; Dolf, G. Genetic Markers
Linked to Neuronal Ceroid Lipofuscinosis in English Setter Dogs. Anim. Genet.
1998, 29 (5), 371–376.
PCR MULTIPLEXED MICROSATELLITE PANELS 235
©2002 Marcel Dekker, Inc. All rights reserved. This material may not be used or reproduced in any form without the express written permission of Marcel Dekker, Inc.
MARCEL DEKKER, INC. • 270 MADISON AVENUE • NEW YORK, NY 10016