Paul K. K. Adu-Gyamfi BSc. Agriculture (Crop Science) A ...
272
THE PHYSIOLOGICAL BASIS OF DROUGHT TOLERANCE IDENTIFIED FROM GENETIC ASSOCIATION ANALYSIS IN WHEAT (Triticum aestivum L.) By Paul K. K. Adu-Gyamfi BSc. Agriculture (Crop Science) A thesis submitted in fulfilment of the requirements for the degree of THE DOCTOR OF PHILOSOPHY Faculty of Agriculture and Environment Plant Breeding Institute, Cobbitty The University of Sydney June, 2017
-
Upload
khangminh22 -
Category
Documents
-
view
0 -
download
0
Transcript of Paul K. K. Adu-Gyamfi BSc. Agriculture (Crop Science) A ...

THE PHYSIOLOGICAL BASIS OF DROUGHT TOLERANCE IDENTIFIED FROM
GENETIC ASSOCIATION ANALYSIS IN WHEAT (Triticum aestivum L.)
By
Paul K. K. Adu-Gyamfi
BSc. Agriculture (Crop Science)
A thesis submitted in fulfilment of the requirements for the degree of
THE DOCTOR OF PHILOSOPHY
Faculty of Agriculture and Environment
Plant Breeding Institute, Cobbitty
The University of Sydney
June, 2017

i
Acknowledgements
All praise and thanks be to God the Father, His son Jesus Christ and the Holy Spirit for the gift of
life and strength throughout this study. I sincerely would like to express my profound gratitude to my
supervisor Professor Richard M. Trethowan, Director of the I. A. Watson Grains Research Centre-
Narrabri (Plant Breeding Institute- The University of Sydney) and associate supervisor Dr. Tariq M.
Chattha for their invaluable support, encouragement, guidance, suggestions and constructive criticism
which have resulted in the production of this thesis.
I will also like to extend a special thanks to the entire staff of the Plant Breeding Institute,
Narrabri for their support and assistance especially to Annette Treadea, Dr Mrs Angela Danette, Dr Phil
Davis, Mr. Graeme Rapp for their technical support in this work. My sincere thanks to Dr. Urmil K.
Bansal and Bosco Chemayeke for their assistance in providing greenhouse rooms for the development of
my top cross progenies. I would also like to thank Dr Vivi Arief from the University of Queensland for
assistance with the association analyses. I would also like to acknowledge Kate Rudd for her continuous
help throughout my studies at Plant Breeding Institute, Cobbitty. I am equally grateful to Mr. James Bell,
Operations Manager, Plant Breeding Institute, Cobbitty for his encouragement and his cooperation during
the course of my research. I am grateful to the Australian Government (Australian Development
Scholarship), The University of Sydney(Thomas Lawrance Pawlett Postgraduate Scholarship) and the
Ghana Cocoa Board for awarding the scholarship to support my studies.
I would also like to express my deep gratitude to my loving wife Eunice Adu-Gyamfi for her patience,
love, care and advice throughout this study. I wish to also extend my sincere gratitude to my son Gerald
and daughter Esther for putting smiles on my face every morning. My sincere appreciation are due my
parents, brothers, sisters and in-laws for all their prayers, support and patience during my studies.

ii
Abstract
Drought remains the single most important abiotic stress reducing wheat grain yield in the Australian
wheat belt. For this reason the development of cultivars with improved water use efficiency has become a
target of breeders. Trait based plant breeding is a strategy that allows the plant breeder to breakdown
water-use-efficiency into more heritable sub-components. This study aimed to elucidate the physiological
traits linked to genomic regions conferring higher yield under moisture stress identified in an earlier
genetic association analysis of multi-environment wheat trial data (Atta, 2013). Physiological traits were
tested to determine their possible association with grain yield in different environments under different
farming practices including plus and minus tillage and irrigation. Mixtures of genotypes were also made
based on complementary marker trait associations (MTAs) from the Atta (2013) analysis to test the
buffering effects of combined traits on yield. The genetic association analysis of Atta (2013) was also
validated by sowing the same materials in head-to-head comparisons in 2014 and 2015 and by developing
and testing new germplasm selected on the basis of significant MTAs for yield.
Five traits; days to heading, normalized difference vegetation index, leaf rolling, earliness to ground
cover and grain filling duration accounted for 87.8% of the observed variation in yield. These traits are
likely responsible in part or in combination for the observed significant marker trait associations. Water-
use-efficient genotypes were faster in ground cover, earlier to heading, developed larger photosynthetic
biomass, rolled their leaves to avoid damage while maintaining photosynthetic activity and had shorter
grain filling period. Their association with grain yield suggests that these traits could be utilized for
indirect selection of genotypes with higher yield and water-use-efficiency.
While significant year x genotype interaction for yield and water-use-efficiency were observed, tillage
practice was not a driver of this interaction. No-tillage rainfed environments produced higher mean grain
yield with better water-use-efficiency relative to conventional tillage. Mixtures of cultivars developed by
combining genotypes carrying complementary genomic regions based on the Atta (2013) genetic
association analysis produced higher yields relative to their pure components in some cases. However, the
selection of appropriate mixture components was critical in achieving higher yield under stress. When
progeny carrying accumulated markers for MTAs identified in the Atta (2013) multi-environment genetic
association study were assessed for yield no significant improvement in phenotype was noted. However,
when only those MTAs consistent between the Atta (2013) analysis and the head-to-head comparisons
conducted in 2014 and 2015 were selected an improvement in grain yield was observed with the

iii
accumulation of positive markers. In addition, several new MTAs for yield and associated traits were
identified in the head-to-head comparisons and these will need to be validated in further testing before
they are used to develop new germplasm.

iv
Certificate of originality
This thesis contains no material which has been accepted for the award of any degree or diploma in any
university and contains no material previously published except where due references are made in the text.
Paul Kwasi Krah Adu-Gyamfi

v
TABLE OF CONTENTS
Acknowledgement i
Abstract ii
Certificate of originality iv
Table of contents v
List of Figures xi
List of Tables xii
Abbreviations/Acronyms xiv
1 INTRODUCTION 1
1.1 BACKGROUND 4
2 REVIEW OF LITERATURE 5
2.1 WHEAT 5
2.1.1 ECONOMIC IMPORTANCE OF WHEAT 5
2.1.2 ORIGIN, DOMESTICATION AND EVOLUTION OF WHEAT 5
2.1.3 DISTRIBUTION OF WHEAT CULTIVATION 6
2.1.4 WHEAT MORPHOLOGY, GROWTH AND DEVELOPMENT 7
2.2 DROUGHT 8
2.2.1 DROUGHT EFFECTS ON WHEAT PRODUCTION 8
2.2.2 DROUGHT RESISTANCE/TOLERANCE MECHANISMS 9
2.2.3 DROUGHT ESCAPE 9
2.2.4 DROUGHT AVOIDANCE OR WATER-USE-EFFICIENCY 9
2.2.5 DROUGHT TOLERANCE 9
2.2.6 BREEDING FOR DROUGHT TOLERANCE 10
2.2.7 GENOMIC REGIONS FOR DROUGHT TOLERANCE 11
2.2.8 ESTIMATION OF DROUGHT TOLERANCE 12
2.2.9 PHENOLOGY AND YIELD UNDER MOISTURE STRESS 12
2.2.10 PHYSIOLOGICAL TRAITS CONFERRING YIELD UNDER MOISTURE STRESS 14
2.2.10.1 Water soluble carbohydrates and yield under water stress 14
2.2.10.2 Canopy temperature depression and yield under water stress 14
2.2.10.3 Leaf chlorophyll content and yield under water stress 15
2.2.10.4 Stay green and yield under water stress 15
2.2.10.5 Stomatal conductance and yield under water stress 16
2.2.10.6 Carbon Isotope Discrimination, Transpiration efficiency, water use efficiency and yield under water
stress. 16
2.2.10.7 Leaf relative water content and yield under water stress 18
2.2.10.8 Epicuticular wax load and yield under water stress 18
2.2.10.9 Leaf rolling/curling and yield under water stress 18

vi
2.2.10.10 Seedling emergence/vigour and yield under water stress 19
2.2.10.11 Root morphology and yield under water stress 19
2.3 WATER USE EFFICIENCY 20
2.3.1 BREEDING FOR IMPROVED WATER-USE EFFICIENCY 21
2.3.2 GENOMIC REGIONS FOR WATER USE EFFICIENCY 23
2.4 CONSERVATION AGRICULTURE (CA) 26
2.4.1 CONSERVATION AGRICULTURE AND WATER-USE EFFICIENCY 26
2.4.2 CONSERVATION AGRICULTURE IMPACTS ON WHEAT GRAIN YIELD AND QUALITY 27
2.4.3 CONSERVATION AGRICULTURE AND SOIL STRUCTURE IMPROVEMENT 27
2.4.4 CONSERVATION AGRICULTURE AND THE PREVALENCE OF PESTS, DISEASES AND WEEDS 28
2.4.5 ADOPTION OF CONSERVATION AGRICULTURE AND THE CHOICE OF CULTIVAR 28
2.5 PLANT/CULTIVAR MIXTURES 29
2.5.1 PHYSIOLOGICAL CAUSES OF CULTIVAR MIXING EFFECTS 29
2.5.1.1 Complementary effects 29
2.5.1.2 Compensation effects 30
2.5.1.3 Facilitation 30
2.5.2 CULTIVAR MIXTURES AND WATER-USE EFFICIENCY 30
2.5.3 NUMBER OF CULTIVARS (COMPONENTS) IN MIXTURES AND YIELD PERFORMANCE 31
2.5.4 PLOT SIZE AND THE PERFORMANCE OF CULTIVAR MIXTURES 31
2.5.5 DIVERSITY IN CULTIVAR MIXTURES 32
2.5.6 CULTIVAR MIXTURES AND END-PRODUCT QUALITY 32
2.5.7 CULTIVAR MIXTURES AND THE CONTROL OF DISEASES AND PESTS PREVALENCE 32
2.6 ASSOCIATION MAPPING 33
2.6.1 FACTORS AFFECTING LINKAGE DISEQUILIBRIUM 34
2.6.2 TYPES OF ASSOCIATION MAPPING METHODS 34
2.6.3 APPLICATION OF ASSOCIATION MAPPING 35
2.7 DEVELOPING A WHEAT CROP IDEOTYPE ADAPTED TO NO TILLAGE WATER LIMITED ENVIRONMENTS AT NARRABRI IN THE
NORTHERN NSW GRAINS REGION. 36
3 EFFECT OF TILLAGE PRACTICE ON WHEAT PRODUCTIVITY UNDER WELL-
WATERED AND DROUGHT CONDITIONS 38
3.1 INTRODUCTION 38
3.2 MATERIALS AND METHODS 39
3.2.1 EXPERIMENTAL SITE 39
3.2.2 EXPERIMENTAL MATERIAL 39
3.2.3 FIELD LAYOUT 41
3.2.4 FERTILIZER AND CHEMICAL APPLICATIONS 43
3.2.5 IRRIGATION TREATMENT 43
3.2.6 WEATHER CONDITIONS 43
3.2.7 SOIL MOISTURE ASSESSMENT 46
3.2.8 ESTIMATION OF WATER USE AND WATER USE EFFICIENCY 46

vii
3.2.9 CROP MEASUREMENTS 47
3.2.9.1 Canopy Ground Cover (%) 47
3.2.9.2 Chlorophyll content (SPAD units) 47
3.2.9.3 Canopy temperature depression (ᵒC) 48
3.2.9.4 Biomass at Maturity(kg ha-1) 48
3.2.9.5 Light interception (%). 48
3.2.9.6 Grain yield (kg ha-1) 48
3.2.9.7 Leaf relative water content 48
3.2.9.8 Plant height(cm) 49
3.2.9.9 Number of days to heading(days) 49
3.2.9.10 Number of days to physiological maturity(days) 49
3.2.9.11 Protein content (%) 49
3.2.9.12 Flag leaf rolling 49
3.2.9.13 Normalized difference vegetation index (NDVI) 50
3.2.9.14 Climatic conditions 50
3.2.9.15 Soil water content 50
3.2.10 STATISTICAL ANALYSES 53
3.3 RESULTS 53
3.3.1 AGRO-PHYSIOLOGICAL TRAITS 53
3.3.1.1 Early ground cover (%) 53
3.3.1.2 Late ground cover (%) 55
3.3.1.3 Rate of ground cover (%) 56
3.3.1.4 Chlorophyll content 58
3.3.1.5 Harvest index 60
3.3.1.6 Biomass (kg ha-1) 62
3.3.1.7 Leaf rolling 63
3.3.1.8 Relative water content 65
3.3.1.9 Water use efficiency (kg ha-1 mm-1) 67
3.3.1.10 Canopy temperature(ᵒC) 69
3.3.1.11 Light interception(%) 70
3.3.1.12 NDVI at early heading 72
3.3.1.13 NDVI at late heading 74
3.3.1.14 NDVI at early grain filling 75
3.3.1.15 NDVI at late grain filling 77
3.3.2 PHENOLOGICAL TRAITS 79
3.3.2.1 Number of days to heading 79
3.3.2.2 Number of days to physiological maturity 81
3.3.2.3 Grain filling duration 83
3.3.2.4 Plant height (cm) 84
3.3.3 PRODUCTION TRAITS 86
3.3.3.1 Grain Yield(kg ha-1) 86
3.3.3.2 Thousand Kernel Weight (g) 87

viii
3.3.3.3 Protein content (%) 89
3.4 DISCUSSION 92
3.4.1 AGRO--PHYSIOLOGICAL TRAITS 92
3.4.1.1 Canopy ground cover 92
3.4.1.2 Chlorophyll content 94
3.4.1.3 Flag leaf rolling 94
3.4.1.4 Canopy Temperature (ᵒC) 95
3.4.1.5 Days to heading & Maturity 95
3.4.1.6 Grain filling duration 96
3.4.1.7 Biomass 97
3.4.1.8 Harvest Index 97
3.4.2 PRODUCTION TRAITS 98
3.4.2.1 Thousand Kernel weights 98
3.4.2.2 Protein content 98
3.4.2.3 Grain yield 99
3.4.3 IMPLICATIONS FOR WHEAT BREEDING 100
4 THE EFFICACY OF USING MIXTURES TO BUFFER YIELD UNDER STRESS 102
4.1 INTRODUCTION 102
4.2 MATERIALS AND METHODS 103
4.3 STATISTICAL ANALYSIS 104
4.4 RESULTS 104
4.4.1 CANOPY TEMPERATURE (ᵒC) 104
4.4.2 CHLOROPHYLL CONTENT 106
4.4.3 HEADING TIME (DAYS FROM SOWING TO HEADING) 108
4.4.4 PHYSIOLOGICAL MATURITY (DAYS FROM SOWING TO MATURITY). 111
4.4.5 MATURITY TIME 2014 CROPPING SEASON 111
4.4.6 GRAIN FILLING DURATION (DAYS) 113
4.4.7 HARVEST INDEX 114
4.4.8 PLANT HEIGHT (CM) 116
4.4.9 LIGHT INTERCEPTION (IPAR) 118
4.4.10 NORMALIZED DIFFERENCE VEGETATION INDEX (NDVI) AT EARLY GRAIN FILLING. 120
4.4.11 NORMALIZED DIFFERENCE VEGETATION INDEX AT HEADING & ANTHESIS 122
4.4.12 NORMALIZED DIFFERENCE VEGETATION INDEX AT LATE GRAIN FILLING 124
4.4.13 PROTEIN CONTENT 126
4.4.14 RELATIVE WATER CONTENT (RWC) 128
4.4.15 THOUSAND KERNEL WEIGHT (G) 130
4.4.16 BIOMASS(KG HA-1) 132
4.4.17 GRAIN YIELD (KG HA-1) 134
4.5 DISCUSSION 136
4.6 CONCLUSIONS & IMPLICATIONS FOR BREEDING 138

ix
5 VALIDATION OF GENETIC ASSOCIATION MAPPING I 140
5.1 INTRODUCTION 140
5.2 MATERIALS AND METHODS 141
5.2.1 GERMPLASM 141
5.2.2 PHENOTYPIC DATA AND ANALYSIS 142
5.2.3 MOLECULAR DATA 142
5.3 STATISTICAL ANALYSIS 142
5.4 RESULTS 144
5.4.1 ANALYSIS OF PHENOTYPIC DATA 144
5.4.2 ANALYSIS OF MOLECULAR DATA 148
5.4.3 ASSOCIATION ANALYSIS OF GRAIN YIELD 151
5.5 DISCUSSION 155
5.5.1 ASSOCIATION ANALYSIS OF GRAIN YIELD 155
5.5.2 ASSOCIATION ANALYSIS OF THOUSAND KERNEL WEIGHT (TKW) 158
5.5.3 ASSOCIATION ANALYSIS OF HEADING TIME 158
5.5.4 ASSOCIATION ANALYSIS OF MATURITY TIME 159
5.6 CONCLUSION 160
6 VALIDATION OF ASSOCIATION GENETIC MAPPING II 171
6.1 INTRODUCTION 171
6.2 MATERIALS AND METHODS 172
6.2.1 PLANT MATERIAL 172
6.2.2 DEVELOPMENT OF MATERIALS CARRYING PYRAMIDED MARKERS 172
6.2.3 DNA EXTRACTION AND GENOTYPING OF F2 TOPCROSS PROGENY 175
6.2.4 FIELD EXPERIMENT 178
6.3 STATISTICAL ANALYSIS 178
6.4 RESULTS 178
6.4.1 PERFORMANCE OF THE 6 TOP CROSS POPULATIONS 178
6.4.2 VALIDATION OF MTAS FOR HIGHER GRAIN YIELD USING TARGETED MARKERS FROM THE EARLIER ATTA (2013) GENETIC
ASSOCIATION ANALYSIS 187
6.4.3 VALIDATION OF MTAS FOR HIGHER GRAIN YIELD USING TARGETED MARKERS FROM THE CURRENT GENETIC ASSOCIATION
ANALYSIS 188
6.5 DISCUSSION 189
6.6 CONCLUSION 190
7 GENERAL DISCUSSION 191
7.1 THE EFFECT OF TILLAGE AND MOISTURE ON GRAIN YIELD 191
7.2 THE EFFECTS OF GENETIC MIXTURES ON WATER USE EFFICIENCY 192
7.3 PHYSIOLOGICAL TRAITS LINKED TO GENOMIC REGIONS 192

x
7.4 PRODUCTION TRAITS 195
7.5 WHEAT IDEOTYPES ADAPTED TO ZERO-TILLAGE RAINFED ENVIRONMENTS IN NORTHWESTERN NSW, AUSTRALIA. 196
7.6 ASSOCIATION ANALYSIS 196
7.7 CONCLUSIONS 197
8 REFERENCES 199
9 APPENDIX I (CHAPTER 3&4) 231
10 APPENDIX II (CHAPTER 5) 232

xi
List of Figures
FIGURE 2.1 WHEAT GROWING REGIONS IN AUSTRALIA. ADAPTED FROM ABARE (2012) ............................................................... 7 FIGURE 2.2 CONCEPTUAL MODEL FOR TRAITS ASSOCIATED WITH ADAPTATION TO DROUGHT PRONE-ENVIRONMENTS ADAPTED
FROM REYNOLDS AND TUBEROSA (REYNOLDS AND TUBEROSA 2008). ................................................................................ 11 FIGURE 3.1 THE EXPERIMENTAL AREA: ZERO TILLAGE (LEFT HAND SIDE) AND CONVENTIONAL TILLAGE ENVIRONMENTS IN 2013
............................................................................................................................................................................................. 41
FIGURE 3.2 THE EXPERIMENTAL AREA: ZERO TILLAGE ENVIRONMENTS WITH STUBBLE FROM THE PREVIOUS CROP (2013). ......... 42
FIGURE 3.3 THE EXPERIMENTAL AREA: CONVENTIONAL TILLAGE ENVIRONMENT WITH LOOSENED SOIL SURFACE (2013). ........... 42
FIGURE 3.4 CROPPING SEASON RAINFALL AND TEMPERATURE IN 2013 AT NARRABRI................................................................... 44
FIGURE 3.5 CROPPING SEASON RAINFALL AND TEMPERATURE IN 2014 AT NARRABRI................................................................... 44
FIGURE 3.6 IN SEASON RELATIVE HUMIDITY AND SOLAR RADIATION IN 2013 AT NARRABRI ......................................................... 45
FIGURE 3.7 IN-SEASON RELATIVE HUMIDITY AND SOLAR RADIATION IN 2014 AT NARRABRI. ....................................................... 45
FIGURE 3.8 SOIL WATER CONTENT UNDER CONVENTIONAL TILLAGE AND ZERO TILLAGE RAINFED ENVIRONMENTS IN 2013. ....... 51
FIGURE 3.9 SOIL WATER CONTENT UNDER CONVENTIONAL TILLAGE AND ZERO TILLAGE IN IRRIGATED ENVIRONMENTS IN 2013. 51
FIGURE 3.10 SOIL WATER CONTENT UNDER CONVENTIONAL TILLAGE AND ZERO TILLAGE IRRIGATED ENVIRONMENTS IN 2014. . 52
FIGURE 3.11 SOIL WATER CONTENT UNDER CONVENTIONAL TILLAGE AND ZERO TILLAGE RAINFED ENVIRONMENTS IN 2014. ..... 52
FIGURE 5.1 LINKAGE DISEQUILIBRIUM HEAT MAP OF THE GENOME OF THE WHEAT GENOTYPES TESTED ..................................... 145 FIGURE 5.2 PATTERN ANALYSIS OF GRAIN YIELD, NUMBER OF DAYS TO HEADING (DH)/MATURITY (DM), AND THOUSAND KERNEL
WEIGHTS (TKW) OF GENOTYPES TESTED IN 2014 AND 2015 AT NARRABRI. (A) OPTIMIZED DENDROGRAMS (B) BIPLOTS OF
1ST, 2ND AND 3RD PRINCIPAL COMPONENTS. THE BLUE AND RED COLOURS INDICATE GENOTYPES THAT ARE ALLOCATED TO
THE SAME GROUP. ............................................................................................................................................................... 147 FIGURE 5.3 COMBINED PATTERN ANALYSIS OF GENOTYPES TESTED IN 2014 AND 2015 AT NARRABRI USING MARKER DATA. (A)
OPTIMIZED DENDROGRAMS (B) A PLOT OF 1ST , 2ND, AND 3RD PRINCIPAL COMPONENTS. THE BLUE AND RED COLOURS
INDICATE GENOTYPES BELONGING TO THE SAME GROUP. .................................................................................................... 150 FIGURE 5.4 POLYMORPHIC AND NON-POLYMOPHIC MARKERS/REGIONS ACROSS GENOTYPES TESTED IN 2014 AND 2015. THE BLUE
COLOUR INDICATES POLYMORPHIC REGIONS WHILST THE BROWN REPRESENTS NON-POLYMORPHIC REGIONS. ................... 153 FIGURE 5.5 MARKER TRAIT ASSOCIATIONS FOR GRAIN YIELD (YLD), THOUSAND KERNEL WEIGH T(TKW), DAYS TO HEADING
(DH), AND DAYS TO PHYSIOLOGICAL MATURITY (DPM) BASED ON DATA FROM 2014 AND 2015. NEGATIVE ASSOCIATIONS
ARE SHOWN IN RED AND POSITIVE ASSOCIATIONS ARE SHOWN IN BLUE. INCREASING COLOUR INTENSITY SHOWS THE
STRENGTH (-LOG10 PROBABILITY) OF ASSOCIATION (ARIEF 2010). .................................................................................... 154 FIGURE 5.6 MAP OF SIGNIFICANT DART MARKERS ASSOCIATED WITH GRAIN YIELD (YLD), NUMBER OF DAYS TO HEADING
(DHD), NUMBER OF DAYS TO PHYSIOLOGICAL MATURITY (DPM) AND THOUSAND KERNEL WEIGHT (TKW) IN THE CURRENT
ASSOCIATION ANALYSIS. ..................................................................................................................................................... 161 FIGURE 6.1 PRINCIPLE COMPONENT PLOT OF THE FIELD PERFORMANCE OF PROGENIES AND PARENTS ON THE BASIS OF AGRONOMIC
TRAITS (GRAIN YIELD, HEADING TIME, MATURITY TIME, THOUSAND KERNEL WEIGHT AND BIOMASS). ............................... 189
Supplementary figures-Appendix
FIGURE 1 EXPERIMENTAL FIELD LAYOUT IN 2013 CROPPING SEASON. ....................................................................................... 231
FIGURE 2 EXPERIMENTAL FIELD LAYOUT IN 2014 CROPPING SEASON. ....................................................................................... 231

xii
List of Tables
TABLE 3.1 LIST OF GERMPLASM EVALUATED IN FIELD STUDIES IN 2013 AND 2014 ....................................................................... 40
TABLE 3.2 MEANS FOR EARLY GROUND COVER (%) UNDER DIFFERENT MANAGEMENT PRACTICES IN 2013 AND 2014 ................. 54
TABLE 3.3 MEANS FOR LATE GROUND COVER (%) IN 2013 AND 2014 CROPPING YEAR. ................................................................ 56
TABLE 3.4 MEANS FOR RATE OF GROUND COVER (%) IN 2013 AND 2014. ..................................................................................... 57 TABLE 3.5 MEANS FOR CHLOROPHYLL CONTENT (SPAD UNITS) UNDER DIFFERENT MANAGEMENT PRACTICES IN 2013 AND 2014
............................................................................................................................................................................................. 59
TABLE 3.6 MEANS FOR HARVEST INDEX IN 2013 AND 2014. .......................................................................................................... 61
TABLE 3.7 MEANS FOR BIOMASS (KG/HA) UNDER DIFFERENT MANAGEMENT PRACTICES IN 2013 AND 2014 ................................. 62
TABLE 3.8 MEANS FOR LEAF ROLLING UNDER DIFFERENT MANAGEMENT PRACTICES IN 2013 AND 2014 ...................................... 64
TABLE 3.9 MEANS FOR RELATIVE WATER CONTENT (%) UNDER DIFFERENT MANAGEMENT PRACTICES IN 2013 AND 2014. .......... 66 TABLE 3.10 MEANS FOR WATER USE EFFICIENCY (KG HA
-1 MM
-1) UNDER DIFFERENT MANAGEMENT PRACTICES IN 2013 AND 2014
............................................................................................................................................................................................. 68
TABLE 3.11 MEANS FOR CANOPY TEMPERATURE (°C) UNDER DIFFERENT MANAGEMENT PRACTICES IN 2013 AND 2014 .............. 70
TABLE 3.12 MEANS FOR LIGHT INTERCEPTION (%) UNDER DIFFERENT MANAGEMENT PRACTICES IN 2013 AND 2014 ................... 71
TABLE 3.13 MEANS FOR NDVI AT EARLY HEADING IN 2013 AND 2014 ........................................................................................ 73
TABLE 3.14 MEANS FOR NDVI AT LATE HEADING UNDER DIFFERENT MANAGEMENT PRACTICES IN 2013 AND 2014 .................... 74
TABLE 3.15 MEANS FOR NDVI AT EARLY GRAIN FILLING UNDER DIFFERENT MANAGEMENT PRACTICES IN 2013 AND 2014 ........ 76
TABLE 3.16 MEANS FOR NDVI AT LATE GRAIN FILLING UNDER DIFFERENT MANAGEMENT PRACTICES IN 2013 AND 2014 ........... 78
TABLE 3.17 MEANS FOR NUMBER OF DAYS TO HEADING UNDER DIFFERENT MANAGEMENT PRACTICES IN 2013 AND 2014 .......... 80
TABLE 3.18 MEANS FOR DAYS TO PHYSIOLOGICAL MATURITY IN THE 2013 AND 2014 CROPPING SEASONS. ................................. 82
TABLE 3.19 MEANS FOR GRAIN FILLING DURATION (DAYS) IN 2013 AND 2014............................................................................. 83
TABLE 3.20. MEANS FOR PLANT HEIGHT (CM) IN 2013 AND 2014 .................................................................................................. 85
TABLE 3.21 MEANS FOR GRAIN YIELD (KG/HA) UNDER DIFFERENT MANAGEMENT PRACTICES IN 2013 AND 2014 ......................... 86
TABLE 3.22 MEANS FOR THOUSAND KERNEL WEIGHT (G) UNDER DIFFERENT MANAGEMENT PRACTICES IN 2013 AND 2014 ......... 88
TABLE 3.23 MEANS FOR PROTEIN CONTENT (%) IN 2013 AND 2014 .............................................................................................. 90 TABLE 3.24 PHENOTYPIC CORRELATION OF COMBINED MEANS OF PHYSIOLOGICAL CHARACTERISTICS POSSIBLY ASSOCIATED WITH
GRAIN YIELD AND QUALITY TRAITS IN 2013-2014. ............................................................................................................... 91 TABLE 4.1 CHARACTERISTICS OF MIXTURE COMPONENTS AND THEIR CORRESPONDING NUMBERS OF POSITIVE MARKER/TRAITS
ASSOCIATIONS FOR GRAIN YIELD IDENTIFIED IN THE EARLIER ASSOCIATION ANALYSIS (ATTA 2013) ................................. 103 TABLE 4.2 COMBINED MEANS AND ANALYSIS OF CANOPY TEMPERATURE (°C) OF LINCOLN+LANG AND SUNSTATE+STAMPEDE
MIXTURES VERSUS THEIR PURE STANDS IN 2013 AND 2014. ................................................................................................ 105 TABLE 4.3 MEANS AND ANALYSIS OF CANOPY TEMPERATURE (°C) IN MIXTURES VERSUS THEIR PURE LINE COMPONENTS IN 2014.
........................................................................................................................................................................................... 106 TABLE 4.4 COMBINED MEANS AND ANALYSIS OF CHLOROPHYLL CONTENT (SPAD UNITS) OF LINCOLN+LANG AND
SUNSTATE+STAMPEDE MIXTURES AND THEIR PURE STAND IN 2013 AND 2014. .................................................................. 107 TABLE 4.5 MEANS AND ANALYSIS OF CHLOROPHYLL CONTENT (SPAD UNITS) OF MIXTURES VERSUS THEIR PURE STANDS IN 2014.
........................................................................................................................................................................................... 108 TABLE 4.6 COMBINED MEANS AND ANALYSIS OF HEADING TIME (DAYS FROM SOWING) OF LINCOLN+LANG AND
SUNSTATE+STAMPEDE MIXTURES AND THEIR PURE STANDS IN 2013 AND 2014.................................................................. 109
TABLE 4.7 MEANS AND ANALYSIS OF HEADING TIME (DAYS FROM SOWING) OF MIXTURES VERSUS PURE STANDS IN 2014. ........ 110 TABLE 4.8 COMBINED MEANS AND ANALYSIS OF PHYSIOLOGICAL MATURITY (DAYS FROM SOWING) OF LINCOLN+LANG AND
SUNSTATE+STAMPEDE MIXTURES AND THEIR PURE STANDS IN 2013 AND 2014. ................................................................ 111
TABLE 4.9 MEANS AND ANALYSIS OF MATURITY TIME (DAYS FROM SOWING) OF MIXTURES VERSUS PURE STANDS IN 2014. ...... 112 TABLE 4.10 COMBINED MEANS AND ANALYSIS OF GRAIN FILLING DURATION (DAYS) OF LINCOLN+LANG AND
SUNSTATE+STAMPEDE MIXTURES AND THEIR PURE STANDS IN 2013 AND 2014. ................................................................ 113
TABLE 4.11 MEANS AND ANALYSIS OF GRAIN FILLING DURATION (DAYS) OF MIXTURES VERSUS PURE STANDS IN 2014. ............ 114

xiii
TABLE 4.12 COMBINED MEANS AND ANALYSIS OF HARVEST INDEX OF LINCOLN+LANG AND SUNSTATE+STAMPEDE MIXTURES
AND THEIR PURE STANDS IN 2013 AND 2014. ...................................................................................................................... 115
TABLE 4.13 MEANS AND ANALYSIS OF HARVEST INDEX OF MIXTURES VERSUS PURE STANDS IN 2014. ....................................... 116 TABLE 4.14 COMBINED MEANS AND ANALYSIS OF PLANT HEIGHT (CM) OF LINCOLN+LANG AND SUNSTATE+STAMPEDE MIXTURES
AND THEIR PURE STANDS IN 2013 AND 2014. ..................................................................................................................... 117
TABLE 4.15 MEANS AND ANALYSIS OF PLANT HEIGHT (CM) OF MIXTURES VERSUS PURE STANDS IN 2014 .................................. 118 TABLE 4.16 COMBINED MEANS AND ANALYSIS OF LIGHT INTERCEPTION (%) OF LINCOLN+LANG AND SUNSTATE+STAMPEDE
MIXTURES AND THEIR PURE STANDS IN 2013 AND 2014. ..................................................................................................... 119
TABLE 4.17 MEANS AND ANALYSIS OF LIGHT INTERCEPTION (%) OF MIXTURES VERSUS PURE STANDS IN 2014 . ........................ 120 TABLE 4.18 COMBINED MEANS AND ANALYSIS OF NDVI AT EARLY GRAIN FILLING STAGE OF LINCOLN+LANG AND
SUNSTATE+STAMPEDE MIXTURES AND THEIR PURE STANDS IN 2013 AND 2014. ................................................................ 121
TABLE 4.19 MEANS AND ANALYSIS OF NDVI AT EARLY GRAIN FILLING OF MIXTURES VERSUS PURE STANDS IN 2014 .............. 122 TABLE 4.20 COMBINED MEANS AND ANALYSIS OF NDVI AT HEADING AND ANTHESIS OF LINCOLN+LANG AND
SUNSTATE+STAMPEDE MIXTURES AND THEIR PURE STANDS IN 2013 AND 2014. ................................................................ 123
TABLE 4.21 MEANS AND ANALYSIS OF NDVI AT HEADING AND ANTHESIS OF MIXTURES VERSUS PURE STANDS IN 2014. .......... 124 TABLE 4.22 COMBINED MEANS AND ANALYSIS NDVI AT LATE GRAIN FILLING OF LINCOLN+LANG AND SUNSTATE+STAMPEDE
MIXTURES AND THEIR PURE STANDS IN 2013 AND 2014. ..................................................................................................... 125
TABLE 4.23 MEANS AND ANALYSIS OF NDVI AT LATE GRAIN FILLING OF MIXTURES VERSUS PURE STANDS IN 2014 ................. 126 TABLE 4.24 COMBINED MEANS AND ANALYSIS OF PROTEIN CONTENT (%) OF LINCOLN+LANG AND SUNSTATE+STAMPEDE
MIXTURES AND THEIR PURE STANDS IN 2013 AND 2014 ...................................................................................................... 127
TABLE 4.25 MEANS AND ANALYSIS OF PROTEIN CONTENT (%) OF MIXTURES VERSUS PURE STANDS IN 2014 .............................. 128 TABLE 4.26 COMBINED MEANS AND ANALYSIS OF RWC (%) OF LINCOLN+LANG AND SUNSTATE+STAMPEDE MIXTURES AGAINST
THEIR PURE STANDS IN 2013 AND 2014. .............................................................................................................................. 129
TABLE 4.27 MEANS AND ANALYSIS OF RWC (%) OF MIXTURES VERSUS PURE STANDS IN 2014. ................................................. 130 TABLE 4.28 COMBINED MEANS AND ANALYSIS OF THOUSAND KERNEL WEIGHTS (G) OF LINCOLN+LANG AND
SUNSTATE+STAMPEDE MIXTURES AND THEIR PURE STANDS IN 2013 AND 2014. ............................................................... 131
TABLE 4.29 MEANS AND ANALYSIS OF THOUSAND KERNEL WEIGHTS (G) OF MIXTURES VERSUS PURE STANDS IN 2014 .............. 132 TABLE 4.30 COMBINED MEANS AND ANALYSIS OF BIOMASS (KG HA
-1) OF LINCOLN+LANG AND SUNSTATE+STAMPEDE MIXTURES
AND THEIR PURE STANDS IN 2013 AND 2014. ...................................................................................................................... 133
TABLE 4.31 MEANS AND ANALYSIS OF BIOMASS (KG HA-1
) OF MIXTURES VERSUS PURE STANDS IN 2014 .................................... 134 TABLE 4.32 COMBINED MEANS AND ANALYSIS OF GRAIN YIELD (KG/HA) OF LINCOLN+LANG AND SUNSTATE+STAMPEDE
MIXTURES AND THEIR PURE STAND IN 2013 AND 2014 ........................................................................................................ 135
TABLE 4.33 MEANS AND ANALYSIS OF GRAIN YIELD (KG HA-1
) OF MIXTURES VERSUS PURE STANDS IN 2014.............................. 136 TABLE 5.1 SUMMARIES OF NUMBER OF DETECTED MARKER TRAIT ASSOCIATIONS IN THE CURRENT AND EARLIER ASSOCIATION
ANALYSIS FOR GRAIN YIELD, NUMBER OF DAYS TO HEADING, NUMBER OF DAYS TO PHYSIOLOGICAL MATURITY AND
THOUSAND KERNEL WEIGHT. .............................................................................................................................................. 158
TABLE 6.1 LIST OF GENOTYPES HYBRIDIZED TO PRODUCE TOP CROSS PROGENIES AND THEIR CORRESPONDING NUMBERS OF
POSITIVE MARKERS DETECTED IN THE EARLIER ASSOCIATION ANALYSIS CONDUCTED BY ATTA 2013. ............................... 173
TABLE 6.2 SIMILARITY MATRIX OF THE 10 PARENTS IN TABLE 6.1 BASED ON DART MARKER PROFILES. ..................................... 173
TABLE 6.3 LIST OF HYBRIDIZATIONS MADE TO GENERATE F1 AND F2 TOP CROSS POPULATIONS. ................................................. 174 TABLE 6.4 LIST OF SIGNIFICANT DART MARKERS ASSOCIATED WITH HIGHER GRAIN YIELD UNDER MOISTURE STRESS IDENTIFIED
FROM THE CHAPTER 5 HEAD-TO-HEAD ASSOCIATION ANALYSIS. ........................................................................................ 174 TABLE 6.5 LIST OF PARENTS WITH THEIR CORRESPONDING TARGET DARTSEQ MARKERS UTILIZED IN THE HYBRIDIZATION
PROGRAM. ........................................................................................................................................................................... 177 TABLE 6.6 MEANS OF THE TOP CROSS POPULATION (PBI-100 X PBI-11) X PBI-94 FOR DAYS TO HEADING(DHD), DAYS TO
PHYSIOLOGICAL MATURITY(DPM), CANOPY GROUND COVER(GC), HARVEST INDEX(HI), GRAIN FILLING DURATION(GFD),
NORMALIZED DIFFERENCE VEGETATION INDEX(NDVI), THOUSAND KERNEL WEIGHT(TKW), BIOMASS(BMAS) AND GRAIN
YIELD(YLD). ...................................................................................................................................................................... 179

xiv
TABLE 6.7 MEANS OF THE TOP CROSS POPULATION (PBI-11 X PBI-10) X PBI-1 FOR DAYS TO HEADING (DHD), DAYS TO
PHYSIOLOGICAL MATURITY(DPM), CANOPY GROUND COVER (GC), HARVEST INDEX( HI), GRAIN FILLING DURATION(GFD),
NORMALIZED DIFFERENCE VEGETATION INDEX(NDVI), THOUSAND KERNEL WEIGHT (TKW), BIOMASS(BMAS) AND GRAIN
YIELD(YLD) KG/HA. ........................................................................................................................................................... 181 TABLE 6.8 MEANS OF THE TOP CROSS POPULATION (PBI-11 X PBI-10) X PBI-45 TOGETHER WITH PARENTS AND CONTROLS FOR
HARVEST INDEX (HI), GRAIN FILLING DURATION (GFD), THOUSAND KERNEL WEIGHT (TKW), BIOMASS (BMAS) AND GRAIN
YIELD (YLD). ..................................................................................................................................................................... 182 TABLE 6.9 MEANS OF THE TOP CROSS POPULATION (PBI-100 X PBI-11) X PBI-98 TOGETHER WITH PARENTS AND CONTROLS FOR
HARVEST INDEX (HI), GRAIN FILLING DURATION (GFD), THOUSAND KERNEL WEIGHT (TKW), BIOMASS (BMAS) AND GRAIN
YIELD (YLD). ..................................................................................................................................................................... 183 TABLE 6.10 MEANS OF THE TOP CROSS POPULATION (PBI-151 X PBI-45) X PBI-273 TOGETHER WITH PARENTS AND CONTROLS
FOR HARVEST INDEX(HI), GRAIN FILLING DURATION(GFD), THOUSAND KERNEL WEIGHT(TKW), BIOMASS(BMAS) AND
GRAIN YIELD(YLD). ........................................................................................................................................................... 184 TABLE 6.11 MEANS OF THE TOP CROSS POPULATION (PBI-100 X PBI-11) X PBI-94 TOGETHER WITH PARENTS AND CONTROLS
FOR HARVEST INDEX (HI), GRAIN FILLING DURATION (GFD), THOUSAND KERNEL WEIGHT (TKW), BIOMASS (BMAS) AND
GRAIN YIELD (YLD). .......................................................................................................................................................... 186 TABLE 6.12 MEANS OF GRAIN YIELD AND OTHER TRAITS AND NUMBER OF ACCUMULATED MARKERS BASED ON THE EARLIER
ATTA (2013) ASSOCIATION ANALYSIS ................................................................................................................................ 187 TABLE 6.13 MEANS OF GRAIN YIELD AND OTHER TRAITS AND NUMBER OF ACCUMULATED MARKERS BASED ON THE ON MARKERS
CONFIRMED IN BOTH THE ATTA (2013) STUDY AND THE HEAD-TO-HEAD ANALYSIS OF CHAPTER 5 .................................... 188
Supplementary Tables-Appendix
TABLE 1 MEANS FOR NUMBER OF DAYS TO HEADING (DHD) OF 215 GENOTYPES EVALUATED HEAD-TO-HEAD IN ASSOCIATION
ANALYSIS IN 2014 AND 2015 AT NARRABRI. ...................................................................................................................... 232 TABLE 2 MEANS FOR NUMBER OF DAYS TO PHYSIOLOGICAL MATURITY (DPM) OF 215 GENOTYPES EVALUATED HEAD-TO-HEAD IN
ASSOCIATION ANALYSIS IN 2014 AND 2015 AT NARRABRI. ................................................................................................. 238 TABLE 3 YIELD MEANS OF 215 GENOTYPES EVALUATED HEAD-TO-HEAD IN ASSOCIATION ANALYSIS IN 2014 AND 2015 AT
NARRABRI. ......................................................................................................................................................................... 244 TABLE 4 MEANS FOR THOUSAND KERNEL WEIGHT (TKW) OF 215 GENOTYPES EVALUATED HEAD-TO-HEAD FOR ASSOCIATION
ANALYSIS IN 2014 AND 2015 AT NARRABRI. ....................................................................................................................... 250

xv
Abbreviations / Acronyms
ANOVA = Analysis of variance
CID = Carbon isotope discrimination (Δ)
CIMMYT = International Maize And Wheat Improvement Centre
cM = centiMorgan
CTD = Canopy temperature depression (Tair - Tcanopy)
DArT = Diversity arrays technology
DAS = Days after sowing
DSI = Drought susceptibility index
FAO = Food and Agricultural Organization of United Nations
MTA = Marker trait association
NDVI = Normalized difference vegetation index
NSW = New South Wales
QTL = Quantitative trait loci
QWRI = Queensland Wheat Research Institute, Toowoomba
TE = Transpiration efficiency (μmol mol-1)
WUE = Water use efficiency (kg ha-1mm
-1)
WUEGrain = Water use efficiency for grain yield (kg ha-1
mm-1
)

1
1 Introduction
Wheat is an important cereal globally supplying more nourishment to humans than any other food
source (Curtis et al. 2002). It is a staple food for over 35% of the world's population and its cultivation
extends over 220 million hectares world-wide making it the largest crop in terms of area under
cultivation (Rajaram 2001; Ogbonnaya et al. 2007; Ashraf 2010; Morris et al. 2015). Wheat is
Australia's prominent crop and a prime agricultural commodity with gross production valued at over
AU$ 7 billion dollars (Ogbonnaya et al. 2007; Statistics 2014).
Wheat is successfully grown within the latitudes of 30° and 60°N and 27° and 40°S (Nuttonson
1955; Ecocrop 2011) even stretching beyond these limits to within the Arctic Circle and higher
elevations close to the equator (Ecocrop 2011). Even though moisture stress limits wheat production,
studies by the International Maize and Wheat Improvement Center (CIMMYT) suggested the
feasibility of wheat production in much warmer regions (Saunders and Hettel 1994).
World-wide, wheat is grown under both irrigated and rainfed conditions, however in Australia,
wheat cultivation is primarily rainfed in variable agro-ecological zones known as the Wheat belt. The
wheat belt extends from central Queensland through New South Wales, Victoria, South Australia and to
South-Western Australia. Inadequate supply of moisture at critical growth stages characterizes the
Australian wheat belt. Projected climate change will increase production variability and research is
vital if food production is to be sustained (Ogbonnaya et al. 2007; Semenov and Halford 2009).
Subsequently, global production of wheat needs to be doubled by 2050 to meet the projected demands
from rising population, diet shifts, and increasing biofuels consumption (Ray et al. 2013b).
In many environments, wheat is low yielding compared to rice and maize (Langridge et al. 2001).
In rain-fed systems, average wheat yields are often well below 2 t/ha (Langridge et al. 2001). However,
some estimate that wheat yield could be as high as 15 t/ha under irrigated conditions (Langridge et al.
2001). This suggests that 80%–90% of the yield potential is lost because of moisture stress and other
factors including poor agronomy. The majority of wheat produced globally tends to be cultivated in
environments where water is severely limiting (Langridge 2013). In Australia, changed management,
improved agronomy, better genetics and a synergy among these elements has significantly improved
rainfed wheat yields (Richards et al. 2014). Yield improvement from breeding will therefore require

2
understanding the genetic basis of morphophysiological traits that control yield under moisture stress
(Araus et al., 2002; Salekdeh et al., 2009).
Drought is a complex trait under polygenic control with low heritability and high genotype x
environment interaction effects (Blum 2011; Khakwani et al. 2011). Although, varieties with improved
water use efficiencies have been found to be associated with earliness to flowering, faster canopy
development and increased harvest index. Currently, advances in genomics has facilitated the selection
and identification of chromosomal regions controlling key agronomic and yield traits in crops
(Tuberosa and Salvi, 2006; Collins et al., 2008; Cooper et al., 2009) and association mapping has been
proven to be efficient over traditional linkage mapping because it utilizes linkage disequilibrium (LD)
in natural populations to identify significant marker trait associations (Ochieng et al., 2007).
Genetic association analysis has also proved to be effective in identifying loci for traits with low
heritability, particularly yield and its components (Breseghello and Sorrells 2006a; Neumann et al.
2011c). These techniques have detected genomic regions of agronomically important traits in crops
such as maize (Buckler et al. 2009; Liu et al. 2011), wheat (Reif et al. 2011; Kulwal et al. 2012; Kollers
et al. 2013), barley (Wang et al. 2012; Berger et al. 2013; Zhou and Steffenson 2013) and sugar beet
(Stich et al. 2008; Würschum et al. 2011).
In wheat, progress has been slower and while genetic association analysis has identified genomic
regions linked to complex traits, there is little evidence of targeted marker pyramiding to improve trait
expression. Moreover, the physiological traits associated with chromosomal regions identified for yield
are generally unknown. Reports of identified genomic regions to date have tended to be based on
individual small to moderately sized mapping populations screened with relatively few markers
affording a relatively low resolution of marker–trait association (Xu 2002; Salvi and Tuberosa 2005).
Therefore a limited number of genomic regions reported have found their way into Marker Assisted
Selection (MAS) in plant breeding (Xu and Crouch 2008) mainly due low heritability, environmental
effects and the high associated costs (Collard and Mackill 2008). Marker Trait Associations (MTAs)
must therefore be validated in representative parental lines, breeding populations and phenotypic
extremes before they can be used for routine MAS (Xu and Crouch 2008). In most cases, markers will
lose their selective power during this validation, therefore a plausible approach to identify new markers
in the genomic regions around the target locus to find MTAs that are shared across different breeding
populations and environments is needed (Xu and Crouch 2008). Parents of any breeding population

3
must therefore be monomorphic thus affording breeders the opportunity to track the alleles donated
from each parent using MAS throughout the breeding process (Xu and Crouch 2008).
Genetic diversity deployed in cereal mixtures based on complementary genomic regions could
increase yield by buffering the effects of drought. Plant ecology theory predicts that seed mixtures of
varieties (genotype mixtures) may increase grain yield compared to the average of the component
varieties in pure stands (Kiær et al. 2009). Previous studies reported increased resistance to biotic and
abiotic stresses and stochastic events through increased genotypic diversity in plant communities
(Hughes and John 2004; Reusch et al. 2005; Hughes et al. 2008). A 30% increase in biomass was
reported in eelgrass when a mixture of six genotypes was evaluated under high temperature, suggesting
that more genotypically diverse populations maintain productivity better than monocultures under
abiotic stress (Ehlers et al. 2005; Tooker et al. 2012). Mixtures therefore induce beneficial interaction
(compensatory, complementary and facilitation) effects among component varieties (Stützel and
Aufhammer 1990; Faraji 2011).
Soil structural modification affects water loss from the soil and conservation agriculture
practices can minimize the effects of drought through, (a) less disturbance of the soil, i.e. reduced
tillage or no-tillage (b) provision of soil cover, i.e. crop residue, cover crops, relay crops or intercrops
to mitigate soil erosion and to improve soil fertility and soil functions and (c) crop rotation to control
weeds, pests and diseases (Derpsch et al. 2001). The ability of roots to grow and explore the soil for
water and nutrients is a key determinant of plant growth rates (Clark et al. 2003) and structural
modifications of the soil caused by tillage affects crop available water, nutrient uptake, stomatal
conductance, evapotranspiration, canopy development and subsequently leaf area index (Lo Cascio and
Casa 1997). Therefore, the choice of tillage system is crucial to optimizing moisture availability at
critical wheat growth stages.

4
1.1 Background
In the earlier Atta (2013) study the following findings were made:
a) The water use efficient wheat ideotype for northwestern NSW should have higher normalized
difference vegetation index (NDVI), higher transpiration rates resulting in cooler canopies,
higher biomass at anthesis and maturity, greater plant height, superior harvest index and
thousand grain weight, better grain yield, superior WUEDM-Maturity and WUEGrain.
b) The genotypes with higher gas exchange parameters were positively associated with biomass at
maturity, WUE and grain yield.
c) Significant MTAs for grain yield under moisture stress were also identified on all wheat
chromosomes whereas for other traits the MTAs were found on specific chromosomes. A
number of MTAs were also identified in genomic regions reported previously and many new
regions were identified for grain yield, stripe rust, leaf rust and crown rot. It was observed that
each trait is affected by many markers and each MTA affects multiple traits.
In this study, the genomic regions linked to yield from a previous association analysis conducted by
Atta (2013) of a commercial wheat breeding program were examined:
1. To identify physio-genetic traits possibly linked to genomic regions conferring high yield under
moisture stress.
2. To test the performance of selected wheat mixtures of complementary genomic regions against
their pure stand components in different environments that varied for tillage and irrigation
regimes.
3. To assess genotype x environment effects on the performance of these advance wheat lines on
grain yield.
4. To test the validity of the results of genetic association analysis by more intensive evaluation of
materials in head-to-head comparisons and by combining significant markers into a single
genotype.

5
2 REVIEW OF LITERATURE
2.1 Wheat
Wheat (Triticum spp.) is one of the earliest domesticated cereal crops belonging to the class
Liliopsida, tribe Triticeae (Hordeae), family Poaceae (Grasses) and sub-family Pooideae which
evolved some 20-70 million years ago (Kellogg 2001; Huang et al. 2002).
2.1.1 Economic importance of wheat
The world's food security relies heavily on the cultivation of three cereals, wheat, rice (Oryza
sativa L.) and maize (Zea mays L.) with wheat ranking first (Peng et al. 2011). It provides over 20% of
calories and protein to the world's populace (Reynolds et al. 2012), straw as a source of carbon for fuel
production using bioethanol yeasts (Murphy and Power 2008; Petrik et al. 2013), feed for livestock
(Nagarajan 2005) and a non-wood pulp for the paper making industry (Zhang et al. 2012).
2.1.2 Origin, domestication and evolution of wheat
Notwithstanding that, the center of origin of wheat has received varied opinions substantiated
by both archeo-botanical and molecular evidence. In the 19th century, bio-geographical studies
identified the Fertile Crescent, particularly in the areas that surround the fertile alluvial plains of the
Tigris and Euphrates rivers to be the centre of origin of wheat. This has been validated by
archaeological evidence from the fossilized remains of crops (Braidwood et al. 1969; Vavilov and
Dorofeev 1992; Saunders and Hettel 1994; Willcox 2005; Kuijt and Finlayson 2009). Recent studies on
the relationship between cultivated and wild wheat accessions at the molecular level suggested that
they originated from the Karacadag Mountains, validating the location of the cradle of agriculture in
the Middle-East (Manfred et al. 1997; Lev-Yadun et al. 2000; Kilian et al. 2007).
Prior to the domestication of wheat, there were extensive polyploidization and duplication of
events mainly from species of the Triticum and Aegilops genera resulting in the classification of the
genus into three main groups, diploids having 14 (n=7), tetraploids 28 (n=2x=14) and hexaploids
(n=3x=21) with 42 chromosomes. The first cultivated forms were diploid (einkorn) and tetraploid
(emmer) (genome AABB) wheat and with the later appearance of hexaploid (AABBDD) bread wheat
when farming extended to the Near East by about 7000 years BC (Feldman 2001).
Gill et al. (2006) opined that hexaploid wheat (Triticum aestivum L.genome AABBDD) was
developed from the rare hybridization between tetraploid wheat (Triticum turgidum L., AABB) and
wild wheat relatives (A. tauschii Coss., DD) that occurred fairly recently (~8000 years ago) in farmers’

6
fields in the West Caspian region of Iran. Some major events that accompanied the domestication of
wheat included loss of shattering of the spike at maturity (Nalam et al. 2006) and the appearance of
hulled forms, which is controlled by a mutation at the Q locus (Jantasuriyarat et al. 2004; Simons et al.
2006; Dubcovsky and Dvorak 2007).
2.1.3 Distribution of wheat cultivation
The cultivation of wheat (Triticum spp.) extends from its center of origin through Iran into
central Asia, China to Africa and eventually in Australia and Mexico, where it was introduced by
European colonization (Feldman 2001). Wheat is adapted to a wide range of environments from 65°N
to 45°S (Lantican et al. 2005) and its cultivation is technologically feasible in warmer areas within
temperature ranges of 3 - 32°C (Briggle 1980). It is tolerant to a range of moisture conditions from
xerophytic to littoral and it can be grown in most locations where precipitation ranges from 250 to 1750
mm (Martin 1963).
In Australia, wheat cultivation began with a small plot of 8 acres at Farm Cove (currently
Sydney Botanical Gardens) under Governor Phillip in 1788 (Simmonds 1989). Yields were very low
due to lack of adaptability and the cultivation of wheat only became viable with the eventual
development of cultivars adapted to dry conditions. Currently, wheat is grown in all states in Australia
except the Northern Territory (Fig 2.1). Bread, durum, emmer and spelt wheat are cultivated in
Australia and yields are also limited by poorer soils with low water holding capacities. Intermittent
rainfall is one of the critical factors influencing changes in yields in Australia (Simmonds 1989).
Cultivation under rain fed conditions and flowering in mid-September produces the highest yields with
the least frost damage (Cooper 1992).
Current national average yields have fallen due to changes in climatic conditions and the
movement of wheat to more marginal environments, displaced by higher value crops, and to meet
current demands from an increasing world population (Ray et al. 2013a). Contemporary strategies
emphasize the development and deployment of high yielding wheat varieties under moisture stress and
resistance to major insect pest and fungal diseases (Anwar et al. 2007) .

7
Figure 2.1 Wheat growing regions in Australia. Adapted from ABARE (2012)
2.1.4 Wheat morphology, growth and development
Physiologically, wheat growth and development can be partitioned into: germination to
emergence and double ridge to maturity (Acevedo et al. 2006). Physiological maturity refers to the
period when both the flag leaf, spikes and peduncle turn yellow (Hanft and Wych 1982) and this varies
with genotype, temperature, day length and sowing date (Acevedo et al. 2006). An important trait
conferring adaptation of wheat to cold winters is the requirement of long exposure to low temperatures
(vernalization) to accelerate flowering. This regulates initiation of the transition between the vegetative
and reproductive apices (seedling to flowering). However, the period from flowering to maturity is
regulated by day length or photoperiod response.
Depending on the response to vernalization wheat is classified into two phenological groups;
spring and winter wheat (Flood and Halloran 1986). After vernalization wheat varieties which are
sensitive to photoperiod require certain day length to induce flowering. Both processes control the
adaptation of wheat to various environments, therefore genetic manipulation of these responses could
improve adaptation and yield (Acevedo et al. 2006). Photoperiod sensitive wheat genotypes require
long days for induction of flowering while photoperiod insensitive genotypes flower independent of
daylength. Photoperiod insensitive genotypes are cultivated in equatorial regions where shorter days
delay reproductive growth for photoperiod sensitive genotypes. Anthesis occurs about three to ten days
after the ear emerges and a minimum temperature of 9.5 °C and an optimum temperature between 18

8
°C to 24°C is ideal (Macdowall 1973; Slafer and Savin 1991). However temperatures below 9°C and
beyond 31°C may be lethal (Macdowall 1973). Optimal temperature for grain development lies
between 19.3 °C and 22.1 °C with a maximum between 33.4 °C and 37.4°C (Porter and Gawith 1999).
2.2 Drought
The definition of drought reflects many disciplinary perspectives including the meteorologist
who views it as the lowest amount of annual precipitation and the agronomist who assesses yield loss
attributable to water deficit. Farmers attempt to minimize the impact of drought, particularly at
flowering, by integrating best crop management practices with drought resistant cultivars (Passioura
2007).
2.2.1 Drought effects on wheat production
Drought always results in yield decline (Saini and Westgate 2000; Mahajan and Tuteja 2005)
and wheat is one of the principal staple food crops affected by drought globally with about 32 million
ha under wheat cultivation experiencing periodic water stress in developing countries and 60 million
ha in developed countries (Rajaram 2001; Ashraf 2010; Sareen et al. 2014). An estimated higher future
demand for food by an increased populace coupled with limited water supply is expected to worsen the
effects of drought (Somerville and Briscoe 2001). Its effects are evident at all the phenological stages
of plant growth (Harris D. et al. 2002; Kaya et al. 2006). In wheat growing areas, drought negatively
impacts yield (Lott N et al. 2011; Semenov and Shewry 2011) with the reproductive stages being most
susceptible (French and Schultz 1984; Passioura 2006b). It decreases grain set (Dorion and Lalonde
1996; Saini and Westgate 2000; Ji et al. 2010), grain filling duration, grain filling rate and grain weight
(Wardlaw and Willenbrink 2000). In barley (Hordeum vulgare), drought stress reduces grain yield by
reducing the number of tillers, spikes, grains per plant and individual grain weight. Post-anthesis
drought stress is detrimental to grain yield regardless of the stress intensity (Samarah 2005). Yield
improvement in cereals therefore, requires consideration of the whole developmental process with
appropriate strategies, from grain to grain, to target the various developmental stages (Triboi and
Triboi-Blondel 2002).

9
2.2.2 Drought resistance/tolerance mechanisms
Drought tolerant plants have evolved defensive mechanisms against water loss (Chaves and
Oliveira 2004) and Mitra (2001) has opined that tolerance mechanisms could be categorized into (a)
drought escape (b) drought avoidance and (c) drought tolerance.
2.2.3 Drought escape
This mechanism operates when plants complete their life cycle before the onset of
drought/severe water stress. This could be achieved when phenological development is appropriately
harmonized with defined periods of soil moisture availability or where the growing season is shorter
and terminal drought stress predominates (Araus et al. 2002). Short-duration varieties have proven to
be effective in minimizing yield losses from terminal drought, as early maturing types escape the
period of stress (Kumar and Abbo 2001). However, a yield penalty may arise due to reduced length of
crop duration (Turner et al. 2001).
2.2.4 Drought avoidance or water-use-efficiency
This mechanism refers to the plant’s ability to maintain tissue water potential through
increasing uptake of available water and reducing transpiration (Izanloo et al. 2008; Agbicodo et al.
2009). Traits such as root biomass, length, density and depth which are helpful in extracting water from
greater depths are the major traits linked to drought avoidance (Subbarao et al. 2000; Turner et al.
2001; Kavar et al. 2008).
2.2.5 Drought tolerance
Drought tolerance mechanisms evolve when plants manage conditions of water deficiency
through the manipulation of biochemical and physiological parameters to evade the injurious effects of
drought (Jones, 2004). Blum (2005) opined that crops adapted to dry environments employ drought
avoidance mechanisms rather than drought tolerance and that osmotic adjustment is the fundamental
trait to assess the performance of crops under drought conditions. Evaluation of three Australian bread
wheat (Triticum aestivum L.) cultivars; Excalibur, Kukri, and RAC875, has confirmed osmotic
adjustment to be the main physiological attribute associated with tolerance under cyclic water stress
(Izanloo et al. 2008). Traits that contribute to improved drought tolerance include reduced leaf area
(Schuppler 1998).

10
2.2.6 Breeding for drought tolerance
Genetic gains in wheat yields in sub-optimal environments has been slower (Richards et al.
2001). This is mainly due to the complexity of drought (Khan and Iqbal 2011). Under water stress, a
myriad of genes are induced and these in part determine how the plant copes with the stress and
edaphic factors, mainly composition and structure, affect the balance of these different stresses
(Whitmore and Whalley 2009). Various biochemical mechanisms may have opposing effects under
different stresses; therefore tackling tolerance to one stress may lead to sensitivity to another. Osmo-
protectants such as the amino acid proline, have a toxic effect under heat stress and their accumulation
may not be an acceptable tolerance mechanism in field conditions when heat and drought stresses are
merged (Rizhsky et al. 2004; Salekdeh et al. 2009). Variation in rainfall patterns over a crop cycle and
traits for drought adaptation to specific environments also exist and these factors complicate selection
for drought tolerance.
In molecular breeding, little progress has been made due to the polygenic control of many
drought tolerance traits. Drought induces many changes in gene expression, therefore the identification
of potential candidate genes that express in drought stress conditions is crucial, however microarray
technology has had limited practical application (Umezawa et al. 2006). Zhang et al. (2005b) reported
on two dwarf mutants of wheat showing a remarkably low rate of transpiration with higher water use
efficiency as compared to the Chinese wheat cultivar Jingdong 6. The two mutant lines were identified
through haploid breeding and mutagenesis which appeared to be a promising drought tolerance
breeding strategy (Khan et al. 2001). Likewise, Njau et al. (2009) developed drought resistant wheat
varieties in the marginal areas of Kenya, using mutation and the double haploid techniques. Although
the success of molecular-based approaches in developing drought tolerant cultivars has not been fully
realized (Zhao et al. 2008), the technology holds promise and can ultimately help identify genomic
regions for drought tolerance that can be recombined in breeding (Tuberosa and Salvi 2006).
To increase productivity under drought through breeding, Reynolds et al. (2005) proposed a
conceptual model (Fig 2.2) elucidating how physiological traits could be targeted to improve yield
under drought stress. They include traits related to pre-anthesis growth (G1): Early ground cover
portends good crop establishment that suppresses weeds and reduces water loss from the soil surface.
Therefore the selection of genotypes that provide early ground cover, especially in the Mediterranean
regions of southern Australia where rainfall is available in the early part of the season, is essential to
avoiding peaks of pre-anthesis moisture stress. However, in the northern region where water is limiting
throughout the growing season, early ground cover may not offer an advantage. Selection based on

11
pre-anthesis biomass and partitioning of assimilates to stem reserves is also essential for higher yield
under moisture stress because water soluble carbohydrates can be later remobilized to fill grains when
the grain filling period is affected by moisture stress (Gebbing et al. 1999; Shearman et al. 2005b).
Traits related to water access (G2): Root systems that will ensure maximum soil moisture capture from
deep in the soil profile will be an added advantage under drought stress. Also stomata aperture related
traits such as stomatal conductance, leaf water content, canopy temperature etc affecting plant water
status are essential under moisture stress. Traits related to water use efficiency(G3): Although difficult
to measure, carbon isotope discrimination has been accepted as an indirect measure of water use
efficiency. Genes regulating higher harvest indices are essential as are traits related to photo protection
(G4). Traits include accumulation of sugars, mainly sucrose and raffinose which maintain membrane
integrity and increases desiccation tolerance. G4 also includes growth regulators such as ABA and
proline (Sansberro et al. 2004; Bayoumi et al. 2008; Hussain et al. 2008).
Figure 2.2 Conceptual model for traits associated with adaptation to drought prone-environments
adapted from Reynolds and Tuberosa (Reynolds and Tuberosa 2008).
2.2.7 Genomic regions for drought tolerance
Genomic regions controlling drought tolerance in wheat and barley have been identified through
yield and yield component measurements under water-limited conditions (Maccaferri et al. 2008a;

12
Mathews et al. 2008; McIntyre et al. 2010a). Regions linked to floral infertility resulting from water
deficit, root traits under controlled conditions and nitrogen deficiency have been identified in wheat
(Laperche et al. 2006; Passioura 2007). Nevertheless, despite this substantial research, only a limited
number of molecular markers associated with high-yield under moisture stress have been used in plant
breeding programs (Gupta et al. 2010b), although many markers linked to other traits such as rust
resistance, grain quality, dormancy, dwarfing and vernalization are routinely utilized. The limited
success of the physiological and molecular breeding approaches suggests a careful re-evaluation of
strategies to dissect and breed for drought tolerance is needed (Fleury et al. 2010).
2.2.8 Estimation of drought tolerance
Drought tolerance assessment entails measuring grain yield under drought (Acevedo et al. 2006)
and a number of models have been developed to assess genotypes with significant dependence on yield
potential and crop phenology. These models exhibit high genotype x environment interaction effects
(Acevedo 1991) and include (a) the yield stability index (YSI) across environments (Finlay 1963;
Eberhart and Russell 1966) and (b) the drought susceptibility index (DSI) (Fischer and Maurer 1978).
As a measure to neutralize these genotype x environment interaction effects, Bidinger (1987)
propounded (c) a drought resistance index (DRI) equal to the residual effect of yield under stress once
the effects of yield potential, phenology and experimental error is eliminated. This criterion is utilized
to select drought resistant genotypes or genotypic traits related to drought resistance that could be
manipulated as independent genetic traits (Acevedo and Ceccarelli 1989). Morphophysiological traits
that confer adaptation to drought can be categorized into their relationship to water uptake and water
loss from the crop. Traits that enhance water absorption include root growth, osmotic adjustment,
accumulated solutes and membrane stability (Emundo Acevedo et al. 1998a). Whereas those traits that
control transpiration/water loss include leaf colour (Van Oosterom and Acevedo 1992), leaf water
movements, epicuticular waxes and trichomes on leaf surfaces (Upadhyaya and Furness 1994),
stomatal regulation (Venora and Calcagno 1991), transpiration efficiency (Farquhar and Richards 1984;
Austin et al. 1990) and air to canopy temperature difference (Blum 1988b; Rees et al. 1993).
2.2.9 Phenology and yield under moisture stress
Wheat is a long day plant and its cultivation is confined to temperate and semi-temperate agro-
climates due the sensitivity of both the vegetative and productive stages to elevated temperatures
(Kumar et al. 2012). Its growth, development and adaptation is influenced by environmental factors
such as vernalization temperatures and photoperiod (González et al. 2002). Therefore an appropriate

13
flowering time is crucial to maximization of yield and adaptation to drier environments (Richards
1991). Variation in response to photoperiod is controlled by a homologous series of genes Ppd-A1,
Ppd-B1 and Ppd-D1 (Dubcovsky et al. 2006; Yang et al. 2009; Bentley et al. 2011) and the dominant
alleles Ppd-D1confer insensitivity (Worland et al. 1998). Ppd-D1 confers early flowering and maturity
thus avoiding peaks of moisture stress (Worland 1996). Ppd-D1 is also associated with fewer spikelets,
reduced plant height and reduced tillering (Worland et al. 1998). The pleotropic effects of Ppd-D1 in
wheat suggest that summer stress avoidance associated with early flowering promotes a yield
advantage of about 30% in southern Europe (Borner et al. 1993; Law et al. 1994). The effects of Ppd-
D1 are neutral in winter wheat averaged over years in the UK (Borner et al. 1993; Law et al. 1994),
although in dry years yield increases have been observed suggesting earliness confers summer drought
avoidance (Worland 1996). Photoperiodic sensitivity effects on different developmental phases is
independent from each other and varies with genotypes (Slafer and Rawson 1994), therefore Slafer et
al. (2001) suggested that manipulation of the vegetative phase and the reproductive phases could be
done separately to improve wheat yield. Recognition of these genes has facilitated the manipulation of
days to ear emergence to reduce the impact from abiotic stress during critical growth stages of
flowering and grain fill (Bennett et al 2012).
Vernalization also induces flowering competence in winter wheat crops (Flood et al. 1984;
Goncharov 2004; Trevaskis et al. 2007) and is controlled by major genes such as Vrn-A1, Vrn-B1, Vrn-
D1 and Vrn-D4 (Eagles et al. 2009; Shimada et al. 2009; Rousset et al. 2011). They function in the
establishment and maintenance of floral meristem identity at tiller apex in wheat plants (Danyluk and
Sarhan 2003; Preston and Kellogg 2008).
A third class of genes, called the earliness per se genes, fine-tune the flowering time of wheat to
regional conditions whilst the major Vrn-1 and Ppd genes govern the gross adaptation to environments
(Hoogendoorn 1985; Båga et al. 2009; Rousset et al. 2011).
Significant interaction effects between vernalization and photoperiodic genes have been
reported (González et al. 2002) and the presence of Ppd- D1b in fully vernalized winter wheat plants
reduced the time to flowering by up to 24 days (González et al. 2005; White et al. 2008; Bespalova et
al. 2010), whereas those carrying an active allele Vrn-A1 was at least 30 days earlier (González et al.
2005; Bespalova et al. 2010). Ppd-D1a in the presence of one or more active Vrn-1 allele(s) advanced
flowering time by up to 12 days (White et al. 2008; Eagles et al. 2010). Flowering time was found to
be advanced by 11.8 days when Vrn-A1, Vrn-B1 and Vrn-D1 were present simultaneously and only by

14
3.7 days when Vrn-B1 alone was present in addition to Ppd-D1a (Eagles et al. 2010). The Vrn
genotypes were observed to be marginally early flowering time in the following order Vrn-A1 Vrn-B1
Vrn-D1 < Vrn-A1 Vrn-B1, Vrn-A1 VrnD1 and Vrn-A1 < Vrn-B1 and Vrn-D1 (Iqbal et al. 2007a, b;
Eagles et al. 2009). Dubcovsky and Dvorak (2007) therefore indicated that the natural and conscious
movement of the active alleles of Vrn and Ppd genes across landraces and cultivars may have governed
the cultivation of bread wheat over wider environments. The occurrence of Vrn and Ppd alleles
singularly or in combination has imparted considerable phenological plasticity to wheat (Dubcovsky
and Dvorak 2007; Zhang et al. 2008; Eagles et al. 2009). Manipulating the genetics of flowering time
could facilitate the designing of superior wheat genotypes for the new and conventional locations,
sowing times, considering climate change (Mathews et al. 2007).
2.2.10 Physiological traits conferring yield under moisture stress
2.2.10.1 Water soluble carbohydrates and yield under water stress
Most cereal crops have the capacity to store water soluble carbohydrate in their stems and later
remobilise these to increase grain yield. In wheat, varieties that are capable of synthesizing and storing
significant amounts of water soluble carbohydrates in their stems prior to anthesis are likely to produce
higher yields under water stress conditions (Conocono 2002). This trait has been accepted as an
adaptive trait for drought tolerance (Reynolds et al. 2009) and its contribution to yield varies with
genotype, environment, and growing conditions ranging from 10 to 20% under non-stressed conditions
(Gebbing et al. 1999; Shearman et al. 2005b). Due to its high heritability, breeding for high WSC
should be feasible (Ruuska et al. 2006) although it appears to be controlled by many genes (Rebetzke
GJ et al. 2008). Genomic regions responsible for water soluble carbohydrate remobilization have been
reported (Salem et al. 2007; Snape et al. 2007; Yang et al. 2007a).
2.2.10.2 Canopy temperature depression and yield under water stress
Canopy temperature can indicate overall plant water status (Blum et al. 1982; Idso 1982) and
has been utilised to evaluate plant response to drought (Blum et al. 1989; Royo et al. 2002). Strong
negative correlations have been noted between canopy temperature and grain yield in wheat under
irrigated conditions when measured between 12:00 to 4:00pm with no effects from stage of
development (booting, heading or grain filling) or time relative to irrigation (Amani et al. 1996). Also,
strong genotypic variation for canopy temperature measurements in wheat were reported (Blum et al.
1989; Reynolds et al. 1994; Ayeneh et al. 2002) and genotypes with high canopy temperature

15
depression (cooler canopies) have corresponding yield increases (Fischer et al. 1998). Canopies with
higher water content are indicative of genotypes with higher biomass resulting from larger rates of
carbon fixation associated with greater stomatal conductance and therefore, cooler canopies (Babar et
al. 2006). Thus drought-susceptible genotypes may have warmer canopies than tolerant cultivars
(Reynolds et al. 2001). However, canopy temperature depression measurements could be misleading
when yield is highly dependent on limited amounts of soil stored water (Royo et al. 2002; Balota et al.
2007) or when affected by both biological and environmental factors mainly, vapour pressure deficits,
soil water status, wind, evapo-transpiration, cloudiness, conduction systems, plant metabolism, air
temperature, relative humidity and continuous radiation (Reynolds et al. 2001). Hence measurements
are preferably taken in high temperatures and low relative humidity to minimize both environmental
and biological effects (Amani et al. 1996). In wheat, Rebetzke et al. (2013a) has identified 16 genomic
regions regulating canopy temperature and these regions could be targeted for selection to improve
drought tolerance.
2.2.10.3 Leaf chlorophyll content and yield under water stress
Limited water supply decreases chlorophyll formation (Begum and Paul 1993), chlorophyll
content (Beltrano and Ronco 2008; Nikolaeva et al. 2010), plant growth and yield by accelerating leaf
senescence (Sionit et al. 1980; Ashraf et al. 1994). Variation in chlorophyll concentration among
genotypes is controlled mainly by genes acting additively (Hervé et al. 2001; Juenger et al. 2005). Four
additive QTLs controlling chlorophyll content in wheat were mapped (Yang et al. 2007b).
2.2.10.4 Stay green and yield under water stress
The stay green trait allows plants to retain leaves in an active photosynthetic state when
subjected to stress conditions (Rosenow et al. 1983). It contributes to a long grain-filling period and
stable yield even when the plant is stressed (Vijayalakshmi et al. 2010). Delayed leaf senescence has
been associated with higher grain yield especially under water stress during the grain filling period,
when water supply is inadequate to support potential transpiration (Borrell et al. 1999; Borrell et al.
2000a). In sorghum, hybrids that retain greenness produced 47 % more post-anthesis biomass than their
counterparts under terminal moisture deficit conditions (Borrell et al. 2000b). Moreover, in wheat, four
green-retaining lines had corresponding higher yields than their parents under drought (Spano et al.
2003). Strong positive relationships with radiation use efficiency, nutrient remobilisation (Gregersen et
al. 2008) and water use efficiency during the grain formation of wheat have been reported (Gorny et al.

16
2006). However, there are limited reports on wheat providing evidence of substantial variation for the
staygreen trait (Joshi et al. 2007; ur Rehman et al. 2009). Visual rating of staygreen is quick to perform
in the field on a plot basis using a 0–9 scale and as such, it represents an important tool for use by plant
breeders to screening large numbers of progenies (Xu et al. 2000).
2.2.10.5 Stomatal conductance and yield under water stress
Stomatal conductance and photosynthetic rate reflects the ability of the plant to take up CO2 or
lose water through transpiration. Genotypic variation for stomatal conductance and a positive
correlation with yield were found in wheat (Fischer et al. 1998; Rebetzke et al. 2003; Bijanzadeh and
Emam 2010) and increased stomatal conductance has resulted to greater radiation-use efficiency among
some Australian wheat varieties (Sadras and Lawson 2011). Rebetzke et al. (2003) has observed that
variation in stomatal conductance is repeatable and could be targeted for improving adaptation to
specific environments. A reduced transpiration rate can slow water use and increase transpiration
efficiency for wheat crops growing under limited water supply (Condon et al. 1990; Pinter et al. 1990;
Morgan and Lecain 1991). Alternatively, greater transpiration and photosynthetic rates may be
associated with increased grain yield in irrigated environments where water is plentiful (Fischer et al.
1998; Condon et al. 2007). James et al. (2002) indicated that stomatal conductance has an advantage
over measuring photosynthesis, as the former is often more sensitive to water deficit on a per unit area
basis. Strong associations between stomatal conductance and canopy temperature depression have been
reported (Pinter et al. 1990; Amani et al. 1996; Fischer et al. 1998). However, not all studies have
demonstrated correlated benefits of canopy temperature depression and grain yield in wheat (Winter et
al. 1988; Royo et al. 2002). Genomic regions controlling leaf porosity, a surrogate for stomatal
conductance were also reported (Rebetzke et al. 2013a). However, both traits are difficult to measure.
2.2.10.6 Carbon Isotope Discrimination, Transpiration efficiency, water use efficiency and yield
under water stress.
Carbon isotope discrimination determines the ratio of stable isotopes of carbon 13
C/12
C in plant
dry matter relative to the value of the 13
C/12
C ratio in the air that plants use in photosynthesis. Its
measurement provides an indirect estimate of variation in transpiration efficiency and water-use
efficiency of dry matter production (Farquhar et al. 1982; Farquhar and Richards 1984) and negative
correlations between 13
C and plant water-use efficiency have been reported in many species (Farquhar
et al. 1989; Condon A. G and E. 1997). 13
C is a highly heritable trait (Condon and Richards 1992;

17
Rebetzke et al. 2002) and therefore amenable to breeding to increase water-use efficiency through
greater transpiration efficiency (Condon et al. 2004). Carbon isotope discrimination was found to
correlate with yield in crops under water stressed conditions (Leidi et al. 1999; Cabuslay et al. 2002;
Shaheen and Hood-Nowotny 2005) and has therefore been utilised to evaluate genotypes for grain yield
and water use efficiency under field water stress conditions. In wheat, grain yield was found to be
positively correlated to carbon isotope discrimination in environments with characteristic post-anthesis
water deficit such as South Australia (Condon et al. 1987), California, USA (Ehdaie et al. 1991),
Morocco and Spain (Araus et al. 1998), southern France (Merah et al. 2001) and Greece (Tsialtas et al.
2001) although there were exceptions. The relationship between grain yield and carbon isotope
discrimination therefore varies with the environment, with the correlation being weaker and less stable
under pre-anthesis water stress (Xu et al. 2007) and under residual soil moisture conditions (Misra et
al. 2006). Therefore the association largely depends on the amount of water stored in the soil before
sowing and on the evaporative demand during the growth cycle (Monneveux et al. 2005). Genomic
regions for carbon isotope discrimination have been reported across a range of species including barley
Hordeum vulgare (Saranga et al. 1999) and rice (Orzya indica) (Xu et al. 2009). A wheat breeding
program in Australia released two high water use efficient wheat cultivars, “Drysdale" (released in
2002) and “Rees" (released in 2003), through indirect selection of carbon isotope discrimination
(Rebetzke et al. 2002; Condon et al. 2004) although these are not commonly cultivated in recent years.
Transpiration efficiency at the leaf level is the ratio of leaf CO2 exchange rate to stomatal conductance
(Gutierrez-Rodriguez et al. 2000; Xue et al. 2002). The presence of an impermeable cuticle in crop
plants might indicate drought tolerance (Clarke and Richards 1988; Jamaux et al. 1997) thus plant
varieties with low cuticluar transpiration rates can conserve higher amounts of water under water-
deficient conditions, indicating their drought tolerance. In wheat, variation in transpiration efficiency
was found to be correlated with variation in the ratio of biomass production to water transpired of
potted plants, suggesting that leaf gas exchange techniques may provide an accurate assessment of the
transpiration efficiency of the whole plant (Heitholt 1989). In several plant species, carbon isotope
discrimination is negatively correlated with transpiration efficiency (Shangguan et al. 2000; Cabuslay
et al. 2002; Xue et al. 2002). Carbon isotope discrimination may therefore permit an integrated
measure of transpiration efficiency.

18
2.2.10.7 Leaf relative water content and yield under water stress
Leaf relative water content indicates the water status of plants relative to their fully turgid state
(Moayedi et al. 2011). Genotypes that maintain high levels of leaf water under water deficit conditions
are less affected by stress and are able to maintain normal growth and yield (Beltrano et al. 2006). In
wheat, water balance among genotypes is disrupted when relative water content decreases in leaves
under water deficit conditions (Molnar et al. 2004; Dulai et al. 2006) and a positive correlation between
grain yield and leaf relative water content has been observed (Schonfeld et al. 1988; Tahara et al. 1990;
Merah 2001). The selection of leaf relative water content traits for breeding under drought stress
conditions has therefore been emphasised (Schonfeld et al. 1988). Teulat et al. (2003) identified nine
chromosomal regions linked to leaf relative water content in field grown barley.
2.2.10.8 Epicuticular wax load and yield under water stress
The epicuticular waxes covering the aerial parts of plants play an important role in the control
of water flow across the cuticle (Eigenbrode and Espelie 1995). They help leaves retain water (Jordan
et al. 1984) by minimizing cuticular transpiration (Premachandra et al. 1992b; Jefferson 1994). They
also shield plants from high radiation and UV light damage by providing the leaves with greater
reflectance (Grant et al. 1995). Its role in reducing cuticular transpiration and improving drought
resistance is evident in sorghum and wheat (Blum 1988b) and genotypes with low cuticular
transpiration rates usually have a functional advantage during water deficit due to more efficient water
use (Paje et al. 1988). QTLs for wheat leaf epicuticular wax load were reported on chromosomes 2B,
3B, 5A, 5B, 6B, 7A, and 7B.
2.2.10.9 Leaf rolling/curling and yield under water stress
Water deficit induces leaf rolling in cereal crops such as rice, maize, wheat and sorghum (Kadioglu and
Terzi 2007) and this has been noted as a stress avoidance mechanism that moderates abiotic stresses
such as light interception, irradiation, drought and high temperature (Kadioglu and Terzi 2007). In
wheat genotypes with this trait, leaves roll up to prevent photo damage (Kadioglu and Terzi 2007). The
correlation between leaf rolling and photosynthesis is not clear because leaf rolling during stress
reduces leaf surface exposure to sun light energy and transpiration leading to closure of stomata, thus
CO2 entry into cells and photosynthesis decreases (Allah 2009). Subashri et al. (2009) observed a
negative relationship between leaf rolling and chlorophyll content because leaf rolling reduced the leaf
area exposed to light, thus reducing the activity of chlorophyll and the process of photosynthesis. On

19
the other hand, leaf rolling protected the photosynthetic apparatus in Grey maranta (Ctenanthe setosa
EichL.) from photodamage (Nar et al. 2009) and the function of leaf rolling in maximising
photosynthesis with a complimentary increased grain yield by decreasing water loss from plants under
stress was reported (Richards et al. 2002; Zhang et al. 2009a). This trait, induced under abiotic stress, is
controlled by major genes in rice (Yan et al. 2008; Luo et al. 2009) and maize (Nelson et al. 2002;
Juarez et al. 2004).
2.2.10.10 Seedling emergence/vigour and yield under water stress
Emergence is the ability of a seedling to emerge its aerial parts from the soil and is considered
one of the most important traits of seedling vigour (Basra et al. 2003). High seedling vigour indicate
good growth and yield, and it is necessary for effective crop establishment, particularly under sub-
optimal growing conditions (Landjeva et al. 2010). Poor germination and uneven crop stand are the
main constraints of a good crop and survival after desiccation has been considered as a valid and
suitable technique for screening large populations (Winter et al. 1988). Landjeva et al. (2010) mapped
twenty QTL's in wheat controlling germination, seedling vigour, longevity, and early seedling growth.
2.2.10.11 Root morphology and yield under water stress
The ability to develop roots capable of exploiting soil moisture deep in the soil profile is
considered an important drought adaptive trait. In turf grass, drought resistance has been associated
with deep root penetration (Carrow 1996; Huang et al. 1997) whilst in rice, strong root growth is the
major factor governing drought tolerance (Yoshida S and S 1982; Ray et al. 1996). A larger root
system increases water and nutrient uptake from the soil (Ehdaie et al. 2003) and in rice, lines with
large deep root systems tend to have high leaf water potential and delayed leaf death during drought
(Mambani and Lal 1983; Cruz and O'Toole 1984). Root thickness, dry weight, volume and density
have high heritabilities showing positive association with drought tolerance (Qu et al. 2008) Variation
in root development among wheat genotypes in response to drought has been observed (Ehdaie et al.
2001) and this phenotypic plasticity depends on the genotype, year to year variation in growing
conditions and drought timing and intensity (Ehdaie et al. 2001; Kano et al. 2011). Variation in root
growth angle and the number of seminal roots among 27 Australian wheat genotypes have been also
observed (Manschadi et al. 2008). Satisfactory grain yield can be achieved under terminal drought
stress when soil moisture is captured by a vigorous and deep root system when deep soil moisture is
available (Kirkegaard et al. 2007; Blum 2009). Therefore, genotypes with an efficient root system are

20
crucial for improving productivity in rain fed environments (Yadav et al. 1997; Price et al. 2002b; Li et
al. 2003). Genomic regions for different root traits have been identified in rice (Champoux et al. 1995;
Price and Tomos 1997), maize (Lebreton et al. 1995) and wheat (Sharma et al. 2011; Bai et al. 2013).
2.3 Water use efficiency
Water use efficiency (WUE) determines the plant response to water stress with respect to the final
performance (Condon et al. 2004). The agronomist or breeder perceives it as the ratio of aerial biomass
yield to water utilised during the life cycle of a crop (Condon et al. 2004; Tuberosa et al. 2007), whilst
the crop physiologist recognizes it as the ratio of net photosynthesis to transpiration over a period of
seconds or minutes (Farquhar et al. 1989; Condon et al. 2002; Bousba et al. 2009). At the leaf level,
instantaneous WUE is measured as the net amount of carbon assimilated per unit of water transpired
(transpiration rate) during the same period (Farquhar et al. 1989; Condon et al. 2002; Polley 2002).
Intrinsic water use efficiency is independent of specific environmental conditions and is defined as the
ratio of the amount of carbon assimilated and stomatal conductance. Therefore water use efficiency is
defined as:
WUE = Y / ET (1)
Where Y is total harvestable biomass or marketed yield and ET is evapo-transpiration. For agronomists
and plant breeders,
WUE = TE/1+Es/T (2)
Where TE is the transpiration efficiency (aboveground dry matter/transpiration), Es is the water lost by
evaporation from the soil surface whilst T is water lost through transpiration by the crop.
Intrinsic water use efficiency could also be expressed as:
WUEins or TE = A/T= [Gc(Ca-Ci)] ∕ [Gw(Wi-Wa)] (3)
Where A is the product of stomatal conductance to CO2 (Gc) and the gradient in concentration of CO2
between the outside (Ca) and inside (Ci) of the leaf whilst T is the product of stomatal conductance and
water vapour (Gw), the gradient in concentration of water vapour from the inside (Wi) to the outside
(Wa) of the leaf.
Richards et al. (2002) indicated that crop water loss is controlled by the gradient in water
vapour concentration between the crop canopy and the atmosphere with the least being in cool, humid
regions and during the coolest months of the year. It could be inferred from equation (2) that WUE

21
could be improved either by increasing TE or minimize water lost by evaporation from soil surface (Es)
through agronomic management practices (Gregory et al. 1997; Condon et al. 2002; Richards et al.
2002; Passioura 2006a).
WUE calculated as grain yield divided by water supply may be underestimated because it
assumes that the same amount of water is transpired by each genotype, therefore, Blum (2009) has
advocated the application of effective use of water (EUW) for genetic improvements/breeding, since
the former resulted in the selection of genotypes with reduced yield and reduced drought resistance.
Thus, water use efficiency could be expressed as the following equation (Hatfield et al. 2001) :
Y = B x HI, (4)
B = mT/Eo (5)
Therefore WUE = mT/Eo x HI/ET or mT x ET/Eo x HI (6)
where Y is yield, B is the crop biomass, m is a crop constant, HI is the harvest index, T is the crop
transpiration and Eo is free water (potential) evaporation.
2.3.1 Breeding for improved water-use efficiency
Water/yield relationships are the basis of efficient water management (Siahpoosh et al. 2011)
and the need to improve food security in many regions necessitates the development of crops with
improved yield and high water-use efficiency (Hamdy et al. 2003; Parry and Reynolds 2007). Passioura
(2006a) proposed a model for grain yield under limited water environments as a partial function of
water use efficiency:
Y= WU x WUE x HI (1)
Where yield (Y) and WU is described as being a function of the amount of water used or
actually transpired by the crop, the transpiration efficiency of biomass production (WUE), i.e. how
much biomass is produced per millimetre of water transpired, and, lastly, how effectively the achieved
biomass is partitioned into the harvested product, i.e. the ratio of grain yield to standing biomass
termed the harvest index (HI).
From the above model, three key processes could be exploited in breeding for high water-use
efficiency (i) moving more of the available water through the crop rather than wasting it through
evaporation from the soil surface or drainage beyond the root zone or being left behind in the root zone
at harvest (ii) acquiring more carbon/biomass in exchange for the water transpired by the crop i.e.

22
improving crop transpiration efficiency (iii) partitioning more of the achieved biomass into the
harvested product. None of the components of this yield model are truly independent of each other
(Condon et al. 1993; Tambussi et al. 2007b) but each could be considered a target for genetic
improvement. In addition, Richards et al. (2002) recognized that a deep root system increases water
uptake from the soil and there improves performance under drought. It has therefore been suggested
that transpiration can be directly related to root system size and leaf area (Cinnirella et al. 2002; Cooper
et al. 2003) and that large root systems supply more water (Kramer 1969). Improvement of biomass
production for higher harvest index and grain yield stability under drought stress can be achieved by
maximizing soil water capture while diverting the largest part of the available soil moisture toward
stomatal transpiration during grain filling (Blum 2009). This has been confirmed by modeling where
each additional millimeter of water extracted by the root system during grain filling is estimated to
generate an extra 55 kg ha-1 of grain in Australian dry environments (Manschadi et al. 2006). Greater
root production under drought is advantageous only when plant-available water is enough to support
grain production (Ehdaie et al. 2012).
The Mediterranean climates are characterized by frequent rainfall during vegetative growth and
terminal drought during grain filling with evaporation from the soil surface accounting for as much as
50% from the growing season rainfall (Cooper et al. 1987). Thus, a reduction in soil evaporation or the
average evaporative gradient during the crop cycle could be beneficial (Richards et al. 2002).
Increasing rooting depth, distribution and ground cover of crops to reduce soil evaporation in these
regions could be accomplished through early sowing, rapid seedling establishment and good canopy
cover combined with higher specific leaf area (SLA) (Richards et al. 2002; Tambussi et al. 2007a).
Early vigorous genotypes develop deep rooting systems and exhibit greater soil water extraction
capacity (Turner and Asseng 2005), which is a remarkable trait for the effective use of water under
most drought conditions (Blum 2009).
Under temperate climates, crops rely on stored soil water, which is usually depleted at maturity
(Cooper et al. 1987; Loss and Siddique 1994), a restricted leaf area therefore reduces transpiration and
conserves soil moisture thereby contributing more water for late grain filling (Rebetzke et al. 2002).
Transpiration efficiency could be improved genetically by increasing surface reflectance
(Richards et al. 2002) and is achieved through selection for glaucousness, pubescence, and awns with
photosynthetic capacity (Richards 1986). Cuticular loss during the day can be important and significant
genotypic variation has been found in wheat (Clarke and McCaig 1982). Selection of genotypes with

23
higher photosynthetic capacity has also been noted to improve transpiration efficiency by increasing
CO2 concentration in plants (Farquhar et al. 1989).
Higher harvest index is generally linked to higher yield (Cattivelli et al. 2008). According to
Richards et al. (2002), the genetic manipulation of HI in rain fed environments is probable but not
simple because crops that experience drought have two factors, drought independent and drought
dependent traits, that determine HI. These can be genetically manipulated to maximise HI to achieve
higher grain yields (Richards 1991). The latter is largely a function of post anthesis water use mainly
during the grain filling period and other factors such as pre-anthesis period during partitioning between
structural and soluble carbohydrate (Richards et al. 2002). It has therefore been noted that large post
anthesis water use relative to total water use increases HI. Improvement in yields among cereals have
therefore been achieved by selecting for a higher drought independent HI through the reduction of plant
height and earlier flowering (Slafer and Rawson 1994; Richards et al. 2002; Zhang 2007).
Nevertheless, the upper limit for genetic increases in crop yields based on harvest index is close to
maximised (Mann 1999; Richards et al. 2002).
Although Blum (2005) opined that selection for high water use efficiency (WUE), will result in
smaller or early flowering plants without increasing yield when targeting net reduction in the total
amount of water used, other research suggests that breeding involving the selection of genotypes with
high water use efficiency is promising, since water use efficiency is one of the mechanisms by which
wheat plants may adapt to lack of water with association to high productivity under drought (Chaves
and Oliveira 2004; Condon et al. 2004; Rensink and Buell 2004; Munns 2005; Shao et al. 2006).
2.3.2 Genomic regions for water use efficiency
Recent advances in molecular markers and computer software have facilitated understanding of
quantitative trait inheritance, improved genetic improvement of yield in drier environments and
provided a basis for the identification of chromosomal regions controlling adaptive traits (Zhang 2007).
Farquhar and Richards (1984) found that carbon isotope discrimination measurements during growth
can be an excellent surrogate for direct measurement of water use efficiency, therefore identification of
chromosomal regions for carbon isotope discrimination could indicate regions conferring high water
use efficiency. Similar relationships between carbon isotope discrimination, leaf characters and other
physiological traits have been demonstrated in several plant species, including wheat, forage, knotweed
and cotton (Condon et al. 1990; Geber and Dawson 1997; Saranga et al. 1999). The first genomic
region responsible for carbon isotope discrimination was reported by Martin et al. (1989) in tomato

24
(Lycopersicon esculentum and L. pennellii). Similarly, genomic regions responsible for carbon isotope
discrimination in soybean (Specht et al. 2001), barley (Teulat et al. 2002; Diab et al. 2004), cotton
(Gossypium hirsutum G. barbadense) (Saranga et al. 2004) and rice (Takai et al. 2006; Xu et al. 2009)
have been found.
In wheat, genomic regions controlling water use efficiency through carbon isotope discrimination
in both rain fed and irrigation systems have been identified. Peleg et al. (2009a) identified 12 QTLs
under well-watered and water-limited conditions using recombinant inbred lines whilst Rebetzke et al.
(2008b) identified 9-12 QTLs using double haploid lines under rain fed and irrigated conditions. A
number of genomic regions are reported to co-locate and overlap with some morphophysiological
traits.
In barley, Teulat et al. (2002) identified eight QTLs for carbon isotope discrimination that were
co-located with QTLs for physiological traits related to plant water status and/or osmotic adjustment,
and/or for agronomic traits previously measured on the same population. One genomic region known
to be associated with thousand-grain weight (Teulat et al. 2001), located on chromosome 2H, mapped
near EBmac0684 and was linked to QTLs for carbon isotope discrimination. Four genomic regions
harboring genes responsible for carbon isotope discrimination also co-located with regions for
physiological traits related to plant water status measured under controlled conditions (Teulat et al.
2001). In rice, Diab et al. (2008b) indicated that the genomic region for carbon isotope discrimination
and transpiration were located near the same marker (gwm389) and that these regions are of interest in
terms of plant breeding as they control both important drought-adaptive traits for cereals and yield
components (Teulat et al. 2002).

25
Summary of some wheat traits and their identified QTLs together with their corresponding chromosomes.
Trait
No. of
QTLs Location Heritability Populations Experimental System
Root Morphology 31
2A, 2D, 3A, 3B, 4D, 5A, 5BS,
6A LOW Near Isogenic lines Green house, Field Experiments
Seedling Vigour/Ground Cover 20 1D, 2D, 4D, 5D, 7D, 1A, 2A MODERATE Lines carrying D genome Field experiment
Epicuticular Wax Load 10 2B, 3B, 5A, 5B, 6B, 7A, 7B MODERATE Recombinant Inbred lines Field experiment
Carbon Isotope
Discrimination/WUE 24
2B, 4A, 5A, 7B, 1BS, 2BS,
3BS, 4AS, 4BS, 5AS,
7AS,7BS LOW Double haploid Field Experiment
Chlorophyll Content 8 1A, 3B, 5A, 7A LOW Double haploid Field experiment
Canopy Temperature 16 3B HIGH Double haploid Field experiment
Water soluble carbohydrate 10 1A, 1D, 2B, 2D, 4B, 5B, 6B HIGH Double haploid Field experiment
Heading date 2
1A, 2B, 6D, 7AL, 7B, 2DS,
4AS MODERATE Recombinant Inbred lines Field experiment
Maturity date 2 1B , 3AS MODERATE Recombinant Inbred lines Field experiment
Biomass 2 4B, 4D LOW Double haploid Field experiment
Stay green 3 1AS, 3BS, 7DS HIGH Recombinant Inbred lines Field experiment
Thousand Kernel Weight 10 1A, 1D, 2B, 2D, 4B, 5B, 6B LOW Double haploid Field experiment
Grain filling duration 6 1A, 3B, 5D, 6D LOW Double haploid Field experiment

26
2.4 Conservation agriculture (CA)
Conservation agriculture utilises three modules concurrently: (1) reduced disturbance of the soil
(2) soil cover, i.e. crop residue, cover crops, relay crops and (3) crop rotation (Derpsch et al. 2001).
Major benefits include: increased soil organic matter, improved water and nutrient use efficiency,
reduced erosion of topsoil, soil surface temperatures, fuel, labor, and overall cost associated with crop
establishment and timely operations (Hobbs et al. 2008).
2.4.1 Conservation agriculture and water-use efficiency
The ability of roots to grow and explore the soil for water and nutrients influences plant growth
rates (Clark et al. 2003) and soil structural modifications resulting from tillage affects root
water/nutrient uptake, stomatal conductance, evapotranspiration, canopy development and
subsequently leaf area index (Lo Cascio and Casa 1997). It is estimated that wheat yield could be as
high as 15 t/ha (Langridge et al. 2001) suggesting that 80 – 90% of the yield potential is lost because
of moisture stress and other factors including poor agronomy. However, conservation agriculture with
its characteristic larger biopores constructed by activities of earthworms, mainly anecic and epigeic
(Lo Cascio and Venezia 1986; Peigné et al. 2009; Pelosi et al. 2009) provides good drainage of water,
improved root penetration of the soil profile and improved water use (Turner 2004).
The pores favours percolation of incident rainfall and ensures that a greater proportion of
received water is held at plant available tensions (Shaxson 2009), therefore soils have higher moisture
content with reduced evapotranspiration in the upper soil layers (Josa and Hereter 2005) and a 30–80%
greater saturated hydraulic conductivity than soils tilled with moldboard and chisel plows (Chan and
Mead 1989; Benjamin 1993). Under sub-optimal rainfall conditions, the availability of water
accounted for the differences in the performance of genotypes under no tillage and conventional tillage
(Hall and Cholick, 1989; Cox, 1991; Carr et al., 2003a), because conservation agriculture lowers soil
evaporation, increases infiltration, conductibility, reduces runoff, mainly due to the presence of crop
residues on the soil surface and soil structure modifications (Blevins et al. 1971; Unger 1990; Hatfield
et al. 2001; Karamanos et al. 2004).
In wheat, no-tillage systems support higher yields by providing greater water storage in the
soil profile, mostly in drier regions, enhancing water use-efficiency and saving energy (Su et al. 2007;
Muñoz-Romero et al. 2010). An increase in grain yield was realised when precipitation increased,
indicating that conservation of soil water was a critical factor explaining yield differences between no

27
tillage and conventional tillage (Herrera et al. 2013). Variation in yield due to increased soil moisture
and nutrient availability in CA compared to full-tillage was reported in the range of 20–120 % in dry
Mediterranean climates (Mrabet 2000; Fernández-Ugalde et al. 2009b).
Long-term CA adoption results in improved nutrient availability, biological activity, fertility
restoration and soil water balance due to organic matter build-up at the soil surface (Kassam et al.
2012) and increased nitrogen availability which improves water use efficiency (Casa 2007; Di Paolo
and Rinaldi 2008). CA also impedes rapid oxidation of soil organic matter to CO2 which is induced by
tillage (Nelson et al. 2009), reduces losses of phosphorus and nitrate in run-off/ leaching and even
reverses the emission of CO2 and other greenhouse gases (Lal 2002; Lal 2004; Soane et al. 2012).
Overall, CA positively increases the grain yield of winter wheat in drier conditions (Li et al. 2006).
2.4.2 Conservation agriculture impacts on wheat grain yield and quality
The yield potential of crops under CA in rainfed systems is often higher than conventional
tillage systems especially in dry environments where sub-optimal rainfall limits yield (Farooq et al.
2011) even though the yield advantage has not always been positive in all experiments. Crop residue
control in no-tillage is the most critical factor influencing crop yield (Li et al. 2011) and yield
performance could be comparatively higher when water stress is present (Huang et al. 2008b). Under
extreme arid conditions in northern Spain, barley yields under no tillage were sometimes twice those
of conventional tillage (Fernández-Ugalde et al. 2009a). In addition grain water content at harvest was
28 and 27% for no-tillage and 19 and 21% in conventional tillage, requiring an extra cost for grain
drying from no-tillage crops (Soane et al. 2012). Wheat yield under no tillage was 18-42% higher than
conventional tillage mainly due to water availability (Hemmat and Eskandari 2006; Huang et al.
2008a) even though some authors have reported higher yields under conventional tillage than
conservation tillage (Thompson et al., 1987; Hwu and Allan, 1992; Weisz and Bowman, 1999; Kharub
et al., 2008; Kumudini et al., 2008) with similar results observed in maize (Karlen and Sojka 1985;
Newhouse and Crosbie 1986; Graven and Carter 1991). Trethowan et al. (2012) in an earlier study
concluded that genotypes used for some of those studies were primarily developed under conventional
tillage and that accounted for their reduced adaptability to CA.
2.4.3 Conservation agriculture and soil structure improvement
Tillage modifies soil factors such as bulk density, penetrance, pore continuity, soil temperature
and root impedance (Huwe B. 2003; Hamza and Anderson 2005; Johnson et al. 2006). CA improves
soil structure through accumulation of organic matter and soil organic carbon (Stockfisch et al. 1999;

28
Horacek et al. 2001) resulting in carbon vertical stratification affecting top soil physical properties
(Josa and Hereter 2005; Moreno et al. 2006). Soil organic carbon accumulation of up to 11 t/ha after 9
years was reported under CA (Baker and Saxton 2007). CA also improves soil aggregate stability,
reduces erosion, soil surface sealing, increases infiltration, soil water content, water use efficiency and
reduces runoff (Tebrügge and Düring 1999; Hernanz et al. 2002; Hobbs et al. 2008; Farooq et al.
2011). Erosion control is achieved through the combined effects of soil cover, topsoil aggregates
stability, accumulation of organic carbon and the water infiltration rate which are associated to soil
organic matter, soil organic carbon and earthworm activity (Puget et al. 1995; Hernanz et al. 2002).
Hansen et al. (2012) obtained up to 25% reduction in soil erosion in a wheat summer fallow system.
However, Blevins and Frye (1993) cautioned that the use of no-till in fine-textured (clayey) soils may,
over time may increase impedance and density in the topmost 30 cm, thus hindering root penetration.
In addition, CA it increases soil bulk density, which results in reduction of soil nutrient and water
absorption by plant roots (Fabrizzi et al. 2005; Su et al. 2007) unless sub-soiling tillage is adopted as a
control (Borghei et al. 2008).
2.4.4 Conservation agriculture and the prevalence of pests, diseases and weeds
The adoption of conservation agriculture encourages crop infestation by necrotrophic
pathogens such as tan spot, the Septorias and crown rot caused by Fusarium. However, the use of
tolerant cultivars in combination with crop management practices such as rotation, timely sowing,
irrigation and fungicide application can afford effective control (Duveiller et al. 2007). The prevalence
of perennial weeds poses a challenge but an integrated application of pre and post emergence
herbicides in combination with crop residues, timely sowing and rotation can control their emergence
and subsequent growth, although weed resistance to herbicides in the long term is a danger (Chauhan
et al. 2006; Farooq et al. 2011; Johansen et al. 2012)
2.4.5 Adoption of conservation agriculture and the choice of cultivar
Kumudini et al. (2008) indicated that seven out of twelve wheat studies (58%) had significant
genotype by tillage interaction effects even though other authors found none in winter wheat (Dao and
Nguyen 1989; Weisz and Bowman 1999; Carr et al. 2003a, 2003b). This could be possibly linked to
the relatively small number of genotypes were evaluated (Carr et al. 2003a; Kumudini et al. 2008;
Zamir et al. 2010). Therefore, the variation in grain yield observed among genotypes in no-till systems
compared to conventional tillage suggests that better adapted genotypes could be developed (Herrera et
al. 2013). Trethowan et al. (2012) also reported significant genotype x tillage interaction effects and

29
QTLs for grain yield under no-till in a wheat mapping population of 150 entries involving two parents
Berkut and Krichauff. It is therefore essential that the correct parents be selected when breeding for
adaption to tillage management (Herrera et al. 2013). A contemporary approach necessitates the
development of genotypes under no till and the transfer of research on genotype performance under no
till systems to defined ecologies with reduced input use and subsequent evaluation of factors that
discriminate conservation agriculture from conventional practice (Herrera et al. 2013).
2.5 Plant/cultivar mixtures
Cultivar mixtures involve the cultivation of a mix of crop varieties differing in many traits
including disease resistance but have sufficient resemblance to be grown together simultaneously on
the same parcel of land, with no attempt to breed for phenotypic uniformity (Wolfe 1985b; Mundt
2002). It ensures effective utilisation of total environmental space, greater stability (homeostasis)
relative to a single genotype under environmental stress (drought) and provides the possibility of
greater overall resistance to diseases and insect pests (Clay and Allard 1969; Barrett 1981; Lammerts
van Bueren et al. 2008). Cultivar mixtures assume that genetic, physiological, structural and
phenological diversity among component varieties induce beneficial interactions thus increasing yield
and yield stability across environments (Kiær et al. 2009) .
2.5.1 Physiological causes of cultivar mixing effects
The principle assumes that a cultivar which produces less in a particular environment utilises
less of the available resources than two cultivars deployed in a mixture. This advantage of the mixture
over the pure line components is due to compensatory or mixing effects (Stützel and Aufhammer
1990). Therefore, among mixture components, three types of interaction are evident, complimentary,
compensatory and facilitatory effects, which are difficult to quantify (Faraji 2011).
2.5.1.1 Complementary effects
These effects are evident when genotypes vary in their ability to protect themselves and exploit
available resources resulting in higher yield fluctuations which is a function of complementary
resource use above and below ground (Willey 1979). Variation in growth duration due to the demand
on resources occurring at different times (Fukai and Trenbath 1993), growth habit and shading are
complementary and are responsible for the increased grain yield of mixtures (Gallandt et al. 2001).

30
2.5.1.2 Compensation effects
Effects exist among varieties differing in their competitive abilities (Willey 1979). Bowden et
al. (2001) observed that a disease tolerant variety may balance a weak, susceptible or injured variety
by producing more tillers when disease occurs early in the season, thus producing bigger heads, and/or
heavier kernels at maturity . The mechanism functions only between neighboring plants and mixing
varieties that vary in their genetic backgrounds may increase the chances of compensation effects
(Faraji 2011). Compensation effects are expressed when components vary in plant height and when the
yield of one component improves whilst the other does not improve without affecting the overall
performance of the mixture (Khalifa and Qualset 1974).
2.5.1.3 Facilitation
The facilitation mechanism is expressed as a benefit offered by a plant on the establishment or
growth of other plants (Garcia-Barrios 2003). They occur when a cultivar supports another directly by
improving the microclimate, or providing physical support such as windbreaks thus ameliorating harsh
environmental conditions. They can also indirectly provide protection from other pests and diseases
thus improving the water-holding capacity of the mixture (Callaway 1995; Garcia-Barrios 2003).
2.5.2 Cultivar mixtures and water-use efficiency
Mixed plant populations afford improved utilisation of available resources (light, CO2, H20,
nutrients) compared to pure stands (Stützel and Aufhammer 1990). Under sub-optimal conditions,
wheat mixtures conserve more soil water prior to stem elongation ensuring the availability and
efficient utilisation of resources; this translates into higher water use efficiency and yield than pure
stands (Naudin et al. 2011; Fang et al. 2014b).
In natural ecosystems, functional diversity portends higher stability (Petchey and Gaston 2002)
and could be achieved by using cultivar mixtures (Wolfe 1985b; Finckh et al. 2000). Mixtures of
several varieties of the same crop species could have higher yields than monocultures of single
varieties (Wolfe 1985a) and varieties with differing characteristics have the means to increase as well
as stabilise crop yield over environments compared to pure stands (Smithson and Lenne 1996; Finckh
et al. 2000; Kiær et al. 2009). Kiær et al. (2009) conducted an extensive review of the literature on
grain yield of cereal varietal mixtures and reported higher yield when varieties are grown in mixtures.
Tratwal A et al. (2007) observed a 1–15% yield increase in barley mixtures compared to pure stands.
In wheat, mixtures of genetically modified wheat lines outperformed monocultures (Zeller et al. 2012),
indicating that mixtures could be formulated to meet the specific production requirements (Gallandt et

31
al. 2001; Cowger and Weisz 2008). Smithson and Lenne (1996) assessed genotype x environment
interaction effects and concluded that yields from mixtures varied less across environments. Likewise,
Østergård and Jensen (2005) also concluded that yield from spring barley (Hordeum vulgare L.)
mixtures were stable across 17 environments. Mixtures improved productivity under suboptimal
conditions in oats (Frey and Maldonado 1967), wheat (Sarandon and Sarandon 1995) and maize
(Tilahun 1995).
Varietal mixtures tolerant to drought and flood do not only increase productivity, but prevent
soil erosion, desertification, increase soil organic matter and help stabilise slopes (Hajjar et al. 2008).
However, the performance of cultivar mixtures has not always been positive, some studies reported
negative mixing effects (Baker and Briggs 1984; Finckh and Mundt 1996). Therefore, favorable cereal
variety mixtures need to be tailored for various growing conditions vis-a-vis the recognition of specific
environmental and varietal characteristics (Cowger and Weisz 2008; Newton and Guy 2009).
2.5.3 Number of cultivars (components) in mixtures and yield performance
Cultivar mixtures are formulated in components of two (biblends) or three (triblends) and the
influence of component number on yield improvement is not clear (Smithson and Lenne 1996). In
studies involving small grains, yield increases were observed in plots with more than two component
mixtures (Stuke and Fehrmann 1987; Newton et al. 1997; Kiær et al. 2009). Likewise, Nitzsche and
Hesselbach (1983) also observed a yield increased in barley when the number of component of
mixtures increased from two to six. Smithson and Lenne (1996) also claimed that yield stability of
field crops increased with increasing numbers of component mixtures in about 50% of the data sets
examined.
2.5.4 Plot size and the performance of cultivar mixtures
The effects of plot size on the yield performance of mixtures was studied and the performance
of wheat cultivar mixtures in small plots (1.83×0.31) m was lower compared to larger plots (6.1×3.1)
m (Cowger and Weisz 2008). The benefits obtained from mixtures are at larger spatial scales as host-
diversity effects on disease increases over vast areas (Garrett and Mundt 1999). The effects of the
contributing mechanisms, mainly disease reduction and compensation are lesser in smaller plots than
larger ones and this observation has been supported (Zhu et al. 2000; Mille et al. 2006).

32
2.5.5 Diversity in cultivar mixtures
An essential component to the choice of cultivars to compose mixtures is the diversity of the
cultivars used in terms of agronomic traits (Faraji 2011), although the correlation between component
diversity and blend advantage is not clear (Smithson and Lenne 1996). Soybean mixtures varying in
yield, plant height or maturity have shown some positive mixing effects and component diversity
(Smithson and Lenne 1996). In contrast, others have shown no advantages in mixture (Patterson et al.
1963; Gizlice et al. 1989). Mixing advantages have been obtained among wheat cultivars differing in
height which creates a wavy canopy affording a uniform distribution of leaves, more penetration of
light due to decreased shading of adjacent plants. Therefore, increased light use efficiency,
photosynthesis and dry matter production and reduced evaporation from the soil surface due to reduced
incident amount of solar radiation reaching the soil surface helps conserve the soil moisture necessary
for the production of higher yields especially under sub-optimal conditions (Faraji 2011).
2.5.6 Cultivar mixtures and end-product quality
Wheat grain protein content influences bread, noodle, and tortilla making performance
(Qarooni et al. 1994; Lang et al. 1998; Ambalamaatil et al. 2002) and protein content is influenced by
environmental conditions (Huang and Varriano-Marston 1980; McGuire et al. 1994; Lang et al. 1998).
Improved quality equivalent to a higher quality component was obtained by blending a high and a low
bread quality wheat when grown under low soil fertility (Sarandon and Sarandon 1995). In addition,
Bean et al. (1990) obtained a synergistic improvement in bread quality by blending low protein
‘Klasic’ and low protein ‘Anza’ flours in equal portion.
2.5.7 Cultivar mixtures and the control of diseases and pests prevalence
Cultivar mixtures help control diseases and pests due to increased distances between
susceptible cultivars (Browning and Frey 1969; Chin and Wolfe 1984) thereby decreasing the chance
of inoculum produced from an infected or susceptible cultivar landing on another susceptible cultivar
(Araus et al. 2002; Faraji 2011). The presence of a resistant cultivar in a mixture presents a physical
barrier that restricts the movement of inoculum from the susceptible cultivar (Browning and Frey
1969).
In wheat and barley, increased distance between plants of the same genotype in cultivar
mixtures was the most important mechanism of control of powdery mildew (Chin and Wolfe 1984;
Manthey and Fehrmann 1993). Mixtures also foster the chance of interactions and competition
between pathogen races (Garrett and Mundt 1999) thus preventing the dominance of one pathotype

33
over another and reducing the likelihood of eroding host resistance through mutation in cultivar
mixtures (Faraji 2011).
Mixtures induce resistance when races that are non-virulent on a cultivar induce the plant
defense response mechanisms resulting in the elimination of infection when any virulent race invades
exactly the same area of the plant (Chin and Wolfe 1984). Calonnec et al. (1996) found that up to one
third of the reduction in infection by Puccinia striiformis in wheat mixtures was due to induced
resistance.
The outstanding performance of wheat yield in mixtures over pure stands over a range of
environments has been emphasised suggesting that mixtures are capable of producing repeatable,
worthwhile yield improvements over their components in monoculture as long as appropriate
combinations can be identified (Frey and Maldonado 1967; Clay and Allard 1969; Fehr and Rodriguez
1974) and that yield losses due to various biotic and abiotic factors of environment, i.e., diseases, late
sowing, drought could be compensated by such mixtures (Asghar et al. 2011).
2.6 Association mapping
Association mapping analyses statistical associations between genotypes, usually SNPs or SNP
haplotypes, determined in a collection of individuals and the traits (phenotype) of the same individuals.
It therefore verifies marker alleles occurring at significantly different frequencies in individuals
carrying a particular phenotype (trait) compared to a control (Painter et al. 2011). Association genetic
studies were used to identify the genetic causes of several diseases in humans (Pritchard and
Przeworski 2001; Slatkin 2008), and was later applied to crops such as wheat, maize, barley, rice,
sorghum, soybean, grape and forest tree species (Abdurakhmonov and Abdukarimov 2008).
Association mapping is closely related to quantitative trait loci mapping (Paterson 1998) and
this technique, based on linkage disequilibrium (LD), was introduced as an alternative approach to
mapping QTLs in bi-parental populations (Reich et al. 2001; Weiss and Clark 2002). Linkage
disequilibrium (LD) refers to a condition where a combination of alleles at loci located close together
in the genome occur more frequently than by chance because of previous population history (Painter et
al. 2011). In a sense it refers to a nonrandom association of alleles at different loci, describing the
condition with non-equal (increased or reduced) frequency of the haplotypes in a population at random
combinations at different loci (Abdurakhmonov and Abdukarimov 2008). Linkage disequilibrium is
not synonymous with linkage, although tight linkage may generate high levels of linkage
disequilibrium between alleles (Abdurakhmonov and Abdukarimov 2008).

34
Association mapping has some advantages over traditional QTL mapping because it does not
require the development mapping populations such as back cross, doubled haploids, recombinant
inbred lines, near isogenic lines and the multi environment evaluation of these populations to generate
robust phenotypic data (Hansen et al. 2001; Stella and Boettcher 2004; Gupta et al. 2005). In addition,
high resolution results are achieved from individuals from germplasm collections or natural
populations because accumulated meioses are used in the breeding history and past phenotypic data on
cultivars can be mapped without the need to establish new trials (Zhao et al. 2009). The most ideal LD
quantification measure required for association mapping is r2 (square of the correlation coefficient
between the two loci) that is also indicative of marker-trait correlations (Abdallah et al. 2003; Gupta et
al. 2005).
2.6.1 Factors affecting linkage disequilibrium
Linkage disequilibrium is influenced by both genetic and demographic factors shaping the
haplotypic LD blocks in a genome (Stich et al. 2005; Stich et al. 2006; Stich et al. 2007). Factors
increasing LD include mutation, mating system (self-pollination), genetic isolation, population
structure, relatedness (kinship), small founder population size or genetic drift, admixture, selection
(natural, artificial, and balancing), epistasis, and genomic rearrangements (Gupta et al. 2005).
However, LD is decreased by high recombination and mutation rates, recurrent mutations, out-crossing
and gene conversions (Gupta et al. 2005). Another salient factor influencing linkage disequilibrium is
“ascertainment bias” and its relationship with an assayed sample and data characteristics
(Abdurakhmonov and Abdukarimov 2008). In addition, the presence of minor alleles can cause
inaccurate estimates in datasets. These alleles tend to inflate linkage disequilibrium values (Mohlke et
al. 2001; McRae et al. 2002; Maccaferri et al. 2005).
2.6.2 Types of association mapping methods
Association mapping is accomplished by two main methods, Candidate Gene Association and
Whole Genome Scan, also known as Genome-Wide Association Study. In candidate gene association,
one investigates the possibility of correlation between DNA polymorphisms of a gene and the trait of
interest; the technique normally employs a sound understanding genetics, biochemistry or biochemical
pathways and regulatory genes. In the absence of such skills or information, a whole genome scan
technique is adopted (Rafalski 2010) and this technique entails analysing associations of most of the
segments of the genome, by genotyping densely distributed genetic marker loci covering all

35
chromosomes. It is based on the principle that ‘one (or more) of the genetic loci being considered is
either causal for the trait or in linkage disequilibrium with the causal locus’(Rafalski 2010).
2.6.3 Application of association mapping
The development and effective utilisation of association studies to unravel the genetic cause of
several diseases began with humans (Pritchard and Przeworski 2001; Slatkin 2008). In plants,
association mapping commenced with Arabidopsis, and the technique has now been applied to crops
such as maize, barley, durum wheat, spring wheat, rice, sorghum, sugarcane, sugar beet, soybean, and
grape and forest tree species (Abdurakhmonov and Abdukarimov 2008). Its application remained
impracticable in cereals for some time owing to the genotyping of large numbers of entries at the
required number of marker loci (Neumann et al. 2011b). However, high throughput systems such as
diversity array technology (DArT) (Jaccoud et al. 2001), SNP and GBS have overcome this difficulty,
thus providing rapid and cost-effective genome-wide genotyping (Wenzl et al. 2006). DArT markers
are bi-allelic dominant anonymous markers obtained by cloning random fragments of genomic
representations and analysis of sequencing these markers revealed most of them to be derived from the
genespace (Wenzl et al. 2006). In wheat, Crossa et al. (2007c) conducted the first genome wide
association mapping using DArT markers and identified several marker-trait associations on historic
data from a multi-locational field data for grain yield and disease resistance. Neumann et al. (2011b)
also identified several markertrait associations in bread wheat of which several coincided with known
major QTL identified in traditional QTL mapping, whilst the remaining were detected in regions where
no known QTL have been detected to date. Likewise, Dodig et al. (2012) also identified a number of
marker-trait associations with developmental and agronomic traits highly correlated with grain yield
under drought in wheat, even though no marker related to yield under drought stress was observed.
Recently, association mapping was used to dissect the genetic bases of seed dormancy and pre harvest
sprouting in a panel of 96 diverse winter wheat cultivars (Rehman Arif et al. 2012). Le Gouis et al.
(2012a) identified 62 markers individually associated with earliness components corresponding to 33
chromosomal regions in wheat.
The output of association mapping analysis is usually applied in genotype-based selection of
superior individuals in plant breeding, or as a step toward positional cloning (Rafalski 2010).
However, the efficacy of using these predictions in this way in applied breeding has not been
established. The independent validation of the associations in different genetic backgrounds remains
essential and is a neglected aspect of this technology (Rafalski 2010). The results of association

36
mapping could therefore be useful in marker assisted selection (MAS) and development of elite
genotypes when genotypes that carry complementary regions are hybridized to produce superior types.
2.7 Developing a wheat crop ideotype adapted to no tillage water limited environments at
Narrabri in the northern NSW grains region.
The phenotype is a product of the genotype interaction with the prevailing environment and it is
dynamic and conditional, ever changing with the environment in response to both endogenous and
exogenous signals over the development and life history of the organism, thus plants are continually
sensing their environment and modifying their growth response through signaling (Davies et al. 2005;
Brenner et al. 2006; Cobb et al. 2013). Phenotyping of physiological traits has been utilised to assess
variation and increase rates of genetic gains through (a) strategic trait-based crossing to combine
complementary traits in progeny; (b) enriching desirable alleles in intermediate generations; and (c)
exploration of genetic resources to broaden the genetic base for hybridisation (Reynolds et al. 2009).
Strategic trait-based hybridisation aims to accumulate traits that will be complementary for a
given target environment (target-traits).Therefore, under water stressed conditions, traits that improve
water uptake, water use efficiency and partitioning to yield, may work synergistically to improve
productivity in the target environment (Passioura 1977). It is assumed that a physiological trait strategy
employing crosses between parents with different but potentially complementary physiological trait
expression will realise cumulative gene action in selected progeny with the caution that a trait may
show interaction with genetic background and environment (Reynolds and Tuberosa 2008).
A conceptual model for drought tolerance in wheat was proposed by Reynolds et al. (2001b). It
included seed size and coleoptile length facilitating early crop establishment, early ground cover and
pre-anthesis biomass which decreased loss of soil moisture, stem reserves/remobilisation and spike
photosynthesis supporting grain filling during post-anthesis stress, stomatal conductance indicative of
roots capable of extracting deep soil water, osmotic adjustment which maintains cell functions at low
water potential, accumulation of abscisic acid which pre-adapts cells to stress, heat tolerance (heat
stress may be due to low leaf transpiration rates under drought), leaf traits e.g. waxiness, pubescence,
rolling, thickness reduce danger of photo-inhibition, high tiller survival and stay green traits. These are
all easily observable traits indicative of good drought tolerance.
More recently these traits are placed in four different groups (Figure 2.2) such that the
physiological effects between groups are relatively independent and when contrasting parents in trait-
groups are crossed, drought-adaptive genes are more likely to be pyramided (Reynolds et al. 2005a).

37
Under extreme drought conditions, the wheat ideotype as proposed by Reynolds et al. (2001b) could
realize full expression of the genetic potential when conservation agriculture/no tillage systems which
improves soil fertility, structure, soil water balance, soil nitrogen, reduces soil erosion, soil organic
carbon is adopted.

38
3 Effect of tillage practice on wheat productivity under well-watered and
drought conditions
3.1 Introduction
Moisture stress limits wheat productivity with the period between anthesis and maturity crucial
for grain yield as about 80% of the dry matter deposited in grains is derived from photosynthesis
during this period (Zheng et al. 2008).
Tillage is a basic factor affecting soil quality, crop performance and the sustainability of
cropping systems (Munkholm et al. 2013). Conventional tillage results in increased soil erosion, higher
energy consumption and low economic returns (De Vita et al. 2007b) whereas conservation tillage
(defined as reduced soil disturbance and maximized soil cover by residues) offers sustainable and
economically viable production with little impact on the environment (Trethowan et al. 2012). The
approach preserves soil and soil moisture when zero and minimum tillage are utilized (El Titi 2003;
Trethowan et al. 2012). Currently, many crop improvement programs globally only select materials
under conventional tillage (Liebman and Davis 2000; Cook 2006) thus masking the genotype x tillage
practice effects and the subsequent identification of genotypes amenable to conservation agriculture
(Mahmood et al. 2009). Most studies examining genotype x tillage practice interactions for yield
reported no significant interaction in a range of crops including wheat and barley etc (Ullrich and Muir
1986; Cox 1991). However, Trethowan et al. (2012) observed significant genotype x tillage practice
interactions for many traits. This study included a larger number of genetically diverse materials which
may have influenced the interaction. Trethowan et al. (2005a) suggested that genotypes developed in
conventional or full tillage systems may not be amenable to the changing cropping environment, thus
necessitating the development of specifically adapted genotypes to conservation agriculture.
Physiological traits are drivers of yield under moisture stress and some recent studies
emphasize that future wheat genetic yield gains must come from improving physiological
characteristics (Donmez et al. 2001; Shearman et al. 2005a; Foulkes et al. 2011) as evidenced through
biomass increases biomass, harvest index etc (Sayre et al. 1997; Calderini and Slafer 1999)
The aim of the research presented in this chapter was to assess the genotype x management
interaction effects on the performance of a set of released wheat varieties. These environments
included adjacent and contrasting tillage and irrigation treatments. The genotypes evaluated were
identified from association analysis as carrying different genomic regions potentially linked to grain

39
yield. The study aimed to identify key traits conferring adaptation to specific crop management
environments.
3.2 Materials and Methods
3.2.1 Experimental site
The experiments were conducted at the I.A. Watson Grains Research Centre, Narrabri, NSW
(30° 20΄S, 149° 45΄E) on a self-mulching black soil classified as Ug 5.2 (KH 1965) during the 2013
and 2014 growing seasons (May-October) under both rainfed and irrigated conditions. Narrabri has a
predominantly variable summer rainfall with an annual average rainfall of 580 mm (2001-2014); 212
mm falls in the winter cropping season and 368 mm in summer (November-April), making it ideal for
drought studies during winter. The zero-tillage treatments were established 8-years ago. The zero-
tillage treatments were maintained without tillage except a single pass of seeding equipment at sowing.
The conventional tillage treatment was maintained by regular disc ploughing and harrowing. The
treatments were established in 2007 and maintained as strips in a three year rotation of wheat, barley
and field pea. The genotypes were sown in plots of 12 m2 and later reduced to 8m
2 for harvesting.
3.2.2 Experimental material
Eighteen released wheat genotypes were evaluated in 2013 and 2014 (Table 3.1). These
represented a subset of two hundred and sixteen advanced wheat lines evaluated in an earlier multi
environment genetic association study (Atta 2013). These advanced wheat lines originated from five
commercial programs. Entries 1, 4 and 20 originated from LongReach Plant Breeders; 2, 9, 10, 11, 15
and 18 from the now defunct University of Sydney program at Narrabri; 5, 6, 7 and 19 from Australian
Grains Technologies; 3 and 13 from the now defunct Enterprise Grains Australia and 8 and 12 from
the Queensland Department of Primary Industries. Six mixtures (formulated based on complementary
genomic regions from the results of the earlier association analysis) were evaluated across
environments varying for tillage and irrigation practices. They consisted of two two-way mixtures of
Lincoln+Lang and Sunstate+Stampede evaluated in 2013 and 2014 and an additional set of two-way
mixtures (EGA Gregory+Ventura and Suntop+Spitfire) and two sets of three-way mixtures
(Sunstate+Stampede+Janz and Lincoln+Lang+Sunstate) were included in 2014.

40
Table 3.1 List of germplasm evaluated in field studies in 2013 and 2014
ENTRY VARIETY PEDIGREE
1 CRUSADER SUNBROOK/H45
2 SUNSTATE HARTOG*4//COOK*5/VPM 1
3 EGA STAMPEDE SERI-M 82/SUNPICT/GENARO81/BATAVIA/HARTOG/SUN-
290-B/JANZ/SUNVALE/QT-4646/11-IBWSN-50[000];
4 LINCOLN LEVELHEAD//BLOCKHEAD/KING'S JUBILEE
5 LIVINGSTON SUN129A/SUNVALE
6 SUNVEX CNT3/4*3765//2*CHM/3/2*SUNVAL
7 MERINDA VICAM S 71/3*SUNECA//SUN 231 A
8 LANG IFIFE//VNSS/INDIAN G
9 SUNVALE COOK*2/VPM1//3*COOK
10 VENTURA SUNVALE/ROWAN
11 ELLISON VICAM S 71/3*SUNECA//SUN 231 A
12 JANZ 3AG#3/4*CONDOR//COOK
13 CUNNINGHAM QT2826
14 EGA GREGORY PELSART/2*BATAVIA
15 SUNCO COOK*3/WW15/4SUN9E-27/3AG14
16 SUNSTATE+STAMPEDE MIXTURE 1
17 LICOLN+LANG MIXTURE 2
18 SUNLIN SUNELG*2//SUNECA*3/VPM 1
19 SUNTOP SUNCO/2*PASTOR//SUN-436-E[4172]
20 SPITFIRE DRYSDALE/KUKRI
21 SUNSTATE+STAMPEDE+JANZ SUNSTATE+ STAMPEDE+JANZ
22 LICOLN+LANG+SUNSTATE LICOLN+LANG+SUNSTATE
23 SUNTOP+SPITFIRE SUNTOP+SPITFIRE
24 EGA GREGORY+VENTURA EGA GREGORY+VENTURA
Source: Queensland 2013 wheat varieties (nvtonline.com.au).

41
3.2.3 Field layout
The experiments were laid out in a randomized complete block design with 3 replications.
Tillage regimes (zero-tillage and conventional tillage) were laid out in parallel strips established in
2007 and irrigation treatments were established at right angles to the tillage treatments (Appendix I).
This created four different managed environments which were repeated in both years. These managed
environments were classified as (i) conventional-tillage irrigated; (ii) zero-tillage irrigated; (iii)
conventional-tillage no-irrigation; (iv) zero-tillage no-irrigation (Figures 3.1, 3.2 and 3.3). Irrigation
was managed to generate differential soil moisture conditions across tillage treatments and the amount
of water applied varied depending on seasonal rainfall.
Figure 3.1 The experimental area: Zero tillage (left hand side) and conventional tillage environments
in 2013

42
Figure 3.2 The experimental area: zero tillage environments with stubble from the previous crop
(2013).
Figure 3.3 The experimental area: conventional tillage environment with loosened soil surface (2013).

43
3.2.4 Fertilizer and chemical applications
Fertilizer treatments followed recommended practices for this region of NSW. Following pre-
sowing soil nutrient analysis, 100kg/ha of urea and DAP 50kg/ha were applied at sowing in 2013 and
2014 to facilitate establishment. In season herbicides were applied as required. These were Hotshot
and MCPA LVE @ 750 ml ha-1 during tillering to control weeds such as milk thistle, wild turnip,
volunteer field pea and wild mustard. In 2014, fungicide was sprayed to control rust in the late grain
filling stage (Zadok, Z25 – Z31).
3.2.5 Irrigation Treatment
The irrigated experimental plots were watered with an overhead irrigator at the rate of 35 mm
per irrigation using ground water. Two irrigation applications were made to the high moisture
environments during 2013 and 2014. The first irrigation was applied 60 DAS (days after sowing) and
the second at 115 DAS during grain filling. In total 70mm was applied in both 2013 and 2014 on
addition to rainfall.
3.2.6 Weather conditions
Total rainfall and rainfall distribution varied across the 2013 and 2014 cropping seasons. Total
seasonal rainfall was higher in 2014 (125.2mm) than 2013 (96.6mm). The 2013 season was
characterized by an initial higher total rainfall in June that later declined producing relatively long
periods of drought. The 2014 cropping season was characterized by low initial June rainfall, that later
increased through anthesis; therefore post-anthesis moisture stress was minimal. Mean temperatures
were also relatively higher in 2013 compared to 2014 (Figures 3.4 and 3.5). In season relative
humidity was initially higher in 2013 but declined sharply in June, whereas 2014 had a higher relative
humidity until September after which it declined (Figures 3.6 and 3.7).

44
Sowing Anthesis Harvesting
Figure 3.4 Cropping season rainfall and temperature in 2013 at Narrabri
Sowing Anthesis Harvesting
Figure 3.5 Cropping season rainfall and temperature in 2014 at Narrabri

45
Figure 3.6 In season relative humidity and solar radiation in 2013 at Narrabri
.
Figure 3.7 In-season relative humidity and solar radiation in 2014 at Narrabri.

46
3.2.7 Soil moisture Assessment
Aluminium tubes of 1.5m were inserted immediately after sowing in the centre of control plots
(selected genotypes) using a hydraulic corer mounted on a tractor. Tubes were inserted in three and
two replications in 2013 and 2014, respectively. Soil moisture content (counts) was determined using a
neutron moisture meter (CPN® 503DR Hydroprobe, Boart Longyear, California, USA) with the
individual reading time set at 16 seconds. Moisture readings were taken throughout the cropping
season at 10, 20, 40, 60, 70, 80, 90, 100 and 120 cm depths in the root zone at two weekly intervals. A
calibration (Eq. 1) previously developed on the same soil type (grey vertosol) was used to convert the
neutron probe counts to volumetric water content (Personal Communication, Rafiq Islam).
θ = 0.0117 + 0.00003*Counts................................................. Eq. 1
Where θ = volumetric water content, cm3 cm
-3; Counts = neutron probe counts; 0.0117 and 0.00003
are the coefficients of the calibration equation.
3.2.8 Estimation of water use and water use efficiency
Total seasonal water utilized by each plot was estimated during the cropping season.
Evapotranspiration (ETo) was assumed equal to the moisture loss from a bare soil surface over the
period preceding the first day of measurement from sowing. The total water use was estimated using
the equation developed by Zhang and Oweis (1999) and described by Zhang et al. (2005a):
TWU = P + I + ΔW – R – D + CR…………………..Eq. 2
Where TWU = total water use during crop growth (mm), P = precipitation (recorded from a weather
station) (mm), I = irrigation (mm), ΔW = change in soil water content in the profile up to 50 cm depth
from sowing to anthesis or maturity (mm), R = runoff (mm), D = drainage from the root zone (mm)
and CR = capillary rise to the root zone (mm). Surface runoff, drainage and capillary rise on these soils
was considered negligible, thus the following equation was used as reported by Khan MK . (1999) on
the same site:
TWU = P + I + ΔW………………………………Eq. 3
Water use efficiency for grain yield was calculated following Zhang et al. (2005) and Siddique et al.
(2001):

47
WUEGrain = Y/TWU …………………………Eq. 4
Where WUE = water use efficiency kg ha-1
mm-1
; Y = grain yield kg ha-1
; DM = dry matter kg ha-1
;
TWU = total water use (mm).
3.2.9 Crop measurements
Data were recorded on crop phenology as described by Zadoks (1974.), biomass at maturity (kg
ha-1
), chlorophyll content, NDVI, canopy temperature (°C), number of days to physiological
maturity(days), number of days to heading(days), canopy ground cover (%), light interception (%),
relative water content (%), NIR (protein content) and grain yield (kg ha-1
) during the two years of
experiments. Heading days were classified as early at Zadokes score of 55 and late at a score of 59.
3.2.9.1 Canopy Ground Cover (%)
Canopy cover (%) was recorded at early (3 to 4 leaf) and mid-tillering stages of development.
The protocol utilized is outlined at http://www.pi.csiro.au/canopy_cover/ which states that:
Percentage crop canopy is estimated by taking a photo with a camera pointed perpendicularly
(90°) to the centre of the plot at a height of 1m above the crop canopy.
The image captured (data) was uploaded and processed on a computer using software
downloaded from http://www.pi.csiro.au/canopy_cover/canopycover setup.zip. The software generated
an estimate of the percentage ground cover. Canopy ground cover data collection was carried out
before the application of irrigation treatment so only the effects of zero-tillage and conventional tillage
treatments were determined. Data on percentage canopy cover was discontinued at stem elongation
when 100% cover was achieved and no bare soil was visible in any of the genotypes under study. Data
on canopy ground cover were taken at two stages (a) early ground cover (Zadok score 21) (b) late
ground cover (Zadok score 29). The rate of ground cover (c) was then calculated as difference between
early and late ground cover.
3.2.9.2 Chlorophyll content (SPAD units)
Chlorophyll content was measured twice during heading and anthesis on fully expanded flag
leaves of 10 random plants from each plot using a hand held chlorophyll meter (SPAD 502 Plus,
Konica Minolta Sensing Inc. Japan).

48
3.2.9.3 Canopy temperature depression (ᵒC)
Canopy temperatures for the various genotypes (including spikes, peduncle and leaf) were
measured at the grain filling stage using a hand held infrared gun on sunny, calm and clear days
between 11:00h and 14:00h. To avoid confounding results, measurements were taken within 60-90
minutes on plots that had achieved approximately 100% soil cover. Infrared guns were held at 0.5
meters from the edge of the plot and 1m above the canopy at an angle of approximately 30° to the
horizontal. Canopy temperature readings were taken twice on each plot in all replicates per genotype
and the mean calculated for each plot.
3.2.9.4 Biomass at Maturity(kg ha-1
)
Random 1 m2 sections of each plot were cut at maturity using a quadrat. Sections were
harvested at ground level avoiding border rows. Samples were dried in a dehydrator (Hurricane,
Forced Air heating, WESSBERG & Tulander Sydney, Australia) and the dry tissue weighed to
determine total dry weight.Harvest Index
Harvest indices were calculated by threshing the biomass cuts to obtain the grain yield. Harvest
indices were obtained as HI = grain yield (g) per square meter / biomass (g) per square meter.
3.2.9.5 Light interception (%).
Light interception was evaluated using a potable ceptometer held in the middle row of each
plot. Measurements were recorded 7 days after anthesis and three readings were taken above and
within each plot. Mean were calculated and Light interception (%) = ((A-B) - C) / (A-B) × 100.
Where: A = above-canopy PAR; B = reflected PAR; and C = below canopy PAR.
3.2.9.6 Grain yield (kg ha-1
)
At maturity the first and last meter of each plot was removed and an area of 8m2
was harvested
with a combine harvester to determined grain yield. Grains obtained from each plot were subsequently
weighed and converted to grain yield in kg/ha-1
.
3.2.9.7 Leaf relative water content
The most fully expanded flag leaves receiving sunlight were selected randomly from each plot.
The bottom and the tops were cut off including any dead tissue to avoid confounding results. Leaves
were placed immediately into pre-weighed sealed tubes and immediately placed into cooled boxes.
The fresh weight was calculated (FW). Sample tubes were weighed and 5mL of distilled water was
added to each sample and refrigerated in darkness for 24hrs. After this period leaves were blot dried

49
and weighed to determine their turgor weight (TW). Blotted leaves were placed in envelopes and dried
in a dehydrator (Hurricane, Forced Air heating) to a constant mass to obtain the dry weight (DW). Leaf
RWC was calculated as:
RWC = ((FW-DW) / (TW-DW)) x 100…………………Eq. 5
3.2.9.8 Plant height(cm)
Plant height was assessed at maturity using a 1m meter ruler. Three random readings per plot
were taken by measuring the distance from ground level to the top of the spike and the average used to
determine the height of each plot.
3.2.9.9 Number of days to heading(days)
The number of days to heading was determined as the number of days from sowing to when
approximately 50% of the tillers extruded awns out of the flag leaves. Heading days were classified as
early at Zadokes score of 55 and late at a score of 59.
3.2.9.10 Number of days to physiological maturity(days)
The number of days to physiological maturity was calculated as the number of days from
sowing to the period when the 80% of plants lost green colour in their peduncle. This was deemed
physiological maturity.
3.2.9.11 Protein content (%)
Harvested grains were cleaned and protein content was measured using an Infrared Grain
Analyzer-Foss Grain Analyzer (FOSS, InfratecTM
1241, Sweden).
3.2.9.12 Flag leaf rolling
Observations for leaf rolling were conducted in the mornings 10 am in the afternoon between
13:00 and 16:00. Observations were made on the most recent fully expanded flag leaf. The extent of
leaf rolling (%) was scored on entire plot basis on a scale of 0 - 4 where 0 = all flag leaves not rolled,
1= 75% of flag leaf lamina exposed, 2 = 50% of flag leaf lamina exposed, 3 = 25% of flag leaf lamina
exposed, 4 = 0 % of flag leaf lamina exposed-tube-like appearance.

50
3.2.9.13 Normalized difference vegetation index (NDVI)
NDVI was recorded at anthesis and grain filling using a hand held Green SeekerR (Ntech
Industries, Canada) held 20-50 cm above the crop canopy. Measurements were recorded between 11
am and 2pm on bright sunny days.
3.2.9.14 Climatic conditions
Meteorological data for the 2013 and 2014 cropping seasons were obtained from a weather
station located 4km away at Narrabri Airport AWS (Climate data online, Bureau of Meteorology).
Data included humidity, temperature, rainfall and global solar radiation data measurements. The ETo
values were collected online from the Myall vale weather station for the entire duration of the study.
Source:
Narrabri Weather Portal (http://www.weatherdata.net.au/narrabri/)
Narrabri Airport AWS (54038) (http://www.bom.gov.au/climate/data/)
Narrabri West Post Office (53030) (http://www.gov.au/climate/data/)
3.2.9.15 Soil water content
Soil water content was initially higher under zero tillage environments than conventional tillage
although not significant at sowing each year (Figures 3.8, 3.9, 3.10 and 3.11). The difference between
zero-tillage and conventional tillage was greater when moisture was limiting (3.8 and 3.90). However,
soil water differences between tillage regimes were minimized under irrigation (3.9 and 3.10).

51
Figure 3.8 Soil water content under conventional tillage and zero tillage rainfed environments in 2013.
Figure 3.9 Soil water content under conventional tillage and zero tillage in irrigated environments in
2013.

52
Figure 3.10 Soil water content under conventional tillage and zero tillage irrigated environments in
2014.
Figure 3.11 Soil water content under conventional tillage and zero tillage rainfed environments in
2014.

53
3.2.10 Statistical analyses
GenStat statistical software, version 14.1 (Payne RW 2011), was used to analyze data and to
test differences among the four contrasting management practices using the REML function. Years,
genotypes and management were considered fixed effects and range/row coordinates within years as
random effects.
The model utilized in the analysis was as follows:
(a) Fixed model: Constant + Year + Management + Genotype + Year. Management + Year.
Genotype + Management. Genotype + Year. Management. Genotype
(b) Random model: Year. Range. Row.
Management refers to the four specific irrigation/tillage practice regimes. The adjusted means
derived from the mixed model analysis were used for all subsequent comparisons. Significant
differences among genotype means were calculated using Fisher's protected least significant difference
test at P < 0.05. The strength of the simple linear relationship between pairs of variables, based on the
phenotypic data, was assessed using Pearson's correlation coefficient.
3.3 Results
3.3.1 Agro-physiological traits
3.3.1.1 Early ground cover (%)
The effect of year, genotype, year x genotype and management x genotype interaction
significantly influenced earliness to ground cover (Table 3.2). Earliness to ground cover varied across
years and was 43% higher in 2013 compared to 2014. This could possibly be attributed to the higher
initial total rainfall from May-July in 2013. In the two cropping seasons, the management x genotype
interaction effects revealed that Crusader, Lang and Lincoln produced significantly more early-ground
cover in zero tillage, whilst Ventura produced better ground cover in conventional tillage. The
remaining genotypes were stable across the two management regimes. Early ground cover was
positively correlated with yield (r = 0.35), plant height (r = 0.36) and NDVI at heading (r = 0.65) and
NDVI at grain filling (r = 0.66) and negatively correlated with RWC (r = - 0.42) (Table 3.24).

54
Table 3.2 Means for early ground cover (%) under different management practices in 2013 and 2014
Management
Year Genotype ZT CT
2013 CRUSADER 58.3 54.3
SUNSTATE 64.7 59.7
EGA STAMPEDE 55.0 57.0
LINCOLN 55.3 56.7
LIVINGSTON 63.7 58.7
SUNVEX 56.7 58.0
MERINDA 57.3 63.3
LANG 65.3 59.3
SUNVALE 60.3 60.3
VENTURA 61.3 68.3
ELLISON 52.7 52.0
JANZ 62.7 59.3
CUNNINGHAM 66.0 65.7
EGA GREGORY 58.0 59.7
SUNCO 55.3 62.0
SUNSTATE+STAMPEDE 58.0 56.3
LICOLN+LANG 58.3 62.3
SUNLIN 63.3 65.3
SUNTOP 58.0 56.7
SPITFIRE 55.3 58.0
2014 CRUSADER 22.3 16.3
SUNSTATE 19.7 16.6
EGA STAMPEDE 17.0 14.7
LINCOLN 25.7 13.3
LIVINGSTON 9.0 11.7
SUNVEX 7.0 14.7
MERINDA 20.3 17.7
LANG 22.0 17.3
SUNVALE 14.3 15.0
VENTURA 9.7 14.3
ELLISON 14.3 14.0
JANZ 19.7 16.7
CUNNINGHAM 20.7 18.3
EGA GREGORY 19.7 16.0
SUNCO 14.0 15.7
SUNSTATE+STAMPEDE 18.0 15.7
LICOLN+LANG 20.3 19.0
SUNLIN 17.7 13.7
SUNTOP 18.7 14.3

55
SPITFIRE 17.0 17.3
SUNSTATE+STAMPEDE+JANZ 20.3 15.0
LICOLN+LANG+SUNSTATE 20.3 16.0
SUNTOP+SPITFIRE 18.3 19.7
EGA GREGORY+VENTURA 14.7 15.7
Mean
36.5 35.7
Lsd (5%) M x G
4.6
Wald statistic
Y
7697.39***
M
2.63
G
82.68***
Y x M
4.7*
Y x G
70.9***
M x G
41.32**
Y x M x G 21.36
Note: *, **, *** indicates significance at P≤0.05, 0.01 and 0.001, respectively. M- Management , G - Genotype, Y-Year
3.3.1.2 Late ground cover (%)
The influence of year, genotype and year x genotype interaction effects were significant on late
ground cover (Table 3.3). Late ground cover in 2013 was 32% higher than in 2014. The year x
genotype interaction ranked Cunningham, Lang and Janz among the top 3 genotypes with significantly
higher late cover, whilst in 2014 the genotypes Crusader, Lincoln+Lang and Merinda were highest.
This interaction could partly be driven by the higher stored soil moisture prior to sowing in 2013
coupled with higher initial rainfall from May-July in 2013. Late ground cover positively correlated
with grain filling duration (r = 0.70) and yield (r = 0.64) but negatively correlated with the number of
days to heading (r = - 0.75) and number of days to physiological maturity (r = - 0.61) (Table 3.24).

56
Table 3.3 Means for late ground cover (%) in 2013 and 2014 cropping year.
Cropping Year
Genotype 2013 2014
CRUSADER 90.2 42.2
SUNSTATE 91.0 35.3
EGA STAMPEDE 89.8 31.3
LINCOLN 90.5 34.5
LIVINGSTON 90.7 26.8
SUNVEX 91.3 20.8
MERINDA 91.0 40.5
LANG 92.3 34.0
SUNVALE 91.8 30.2
VENTURA 91.0 18.7
ELLISON 87.7 32.8
JANZ 92.3 30.3
CUNNINGHAM 92.8 36.5
EGA GREGORY 92.2 24.0
SUNCO 90.8 34.2
SUNSTATE+STAMPEDE 90.5 31.7
LICOLN+LANG 91.5 41.2
SUNLIN 90.5 30.3
SUNTOP 90.7 26.5
SPITFIRE 91.0 37.5
SUNSTATE+STAMPEDE+JANZ - 36.7
LICOLN+LANG+SUNSTATE - 26.7
SUNTOP+SPITFIRE - 30.8
EGA GREGORY+VENTURA - 25.0
Mean 91.0 31.6
Lsd (5%) Genotype x Year 20.5
Wald statistic
Y 3535.5***
E 0.11
G 44.55**
Y 1.48
Yx G 37.27*
E x G 24.92
Y x E x G 22.14
Note: *, **, *** indicates significance at P≤0.05, 0.01 and 0.001, respectively. G-Genotype, Y-Year, M-Management
3.3.1.3 Rate of ground cover (%)
The rate of ground cover development was significantly influenced by year, genotype and year
x genotype interaction effects (Table 3.4). All tested genotypes had significantly higher rate of ground
cover in 2014 cropping season with the exception of Livingston, Sunvex, Ventura, EGA Gregory and
Suntop which appeared to be stable across the two cropping seasons. In 2013 the top three genotypes

57
with significantly higher rate of ground cover included Ellison, EGA Gregory and Lincoln whereas
Cunningham, Lang and Crusader were higher in 2014.
Table 3.4 Means for rate of ground cover (%) in 2013 and 2014.
Cropping Year
Genotype 2013 2014
CRUSADER 33.8 64.2
SUNSTATE 28.8 58.2
EGA STAMPEDE 33.8 56.2
LINCOLN 34.5 56.8
LIVINGSTON 29.5 48.2
SUNVEX 34.0 40.3
MERINDA 30.7 62.7
LANG 30.0 64.3
SUNVALE 31.5 59.3
VENTURA 26.2 38.7
ELLISON 35.3 58.2
JANZ 31.3 59.8
CUNNINGHAM 27.0 67.3
EGA GREGORY 33.3 45.5
SUNCO 32.2 61.0
SUNSTATE+STAMPEDE 33.3 57.7
LICOLN+LANG 31.2 64.7
SUNLIN 26.2 61.0
SUNTOP 33.3 47.3
SPITFIRE 34.3 60.3
SUNSTATE+STAMPEDE+JANZ - 62.7
LICOLN+LANG+SUNSTATE - 54.2
SUNTOP+SPITFIRE - 60.7
EGA GREGORY+VENTURA - 49.8
Mean 31.5 56.6
Lsd(p< 5%) YxG 20.1
wald statistic
Y 471.86***
E 0.42
G 54.66***
Y x E 1.19
Y x G 50.54***
E x G 20.22
Y x E x G 12.41
Note: *, **, *** indicates significance at P≤0.05, 0.01 and 0.001, respectively G-Genotype, Y-Year, M-Management

58
3.3.1.4 Chlorophyll content
The effects of year, management, genotype, genotype x management and year x genotype
interaction significantly influenced the chlorophyll content of the genotypes tested (Table 3.5).
Chlorophyll content varied across years and was 29.3% higher in 2014 compared to 2013. In rainfed
conditions, Sunstate, EGA Stampede, Lang, Ventura, Sunco Sunstate+Stampede, Suntop and Spitfire
had significantly higher chlorophyll content under conventional tillage management whilst in zero
tillage Ventura produced the highest chlorophyll content. In irrigated conditions, Crusader, Sunstate,
EGA Stampede, Janz, Cunningham, Lincoln, Lang, Suntop had significantly higher chlorophyll
contents in zero tillage management with Sunlin producing the highest chlorophyll content in
conventional tillage. Chlorophyll content correlated positively though weakly with yield (r = 0.17) and
negatively with days to heading (r = - 0.51), maturity (r = - 0.42) and grain filling duration (r = - 0.42)
(Table 3.24). These negative correlations could be due to the drought escape strategy employed by the
early heading/maturity genotypes which develops rapidly and loses their chlorophyll prior to their
measurement.

59
Table 3.5 Means for chlorophyll content (SPAD units) under different management practices in 2013
and 2014
Management
Rainfed Irrigated
Year Genotype ZT CT ZT CT
2013 CRUSADER 27.3 28.4 37.6 31.2
SUNSTATE 25.3 21.8 31.5 39.3
EGA STAMPEDE 28.8 25.5 35.8 39.6
LINCOLN 36.5 32.7 26.3 22.3
LIVINGSTON 38.3 32.8 26.4 34.7
SUNVEX 35.1 40.0 37.8 35.7
MERINDA 33.2 28.4 30.3 33.1
LANG 27.0 42.6 37.0 43.3
SUNVALE 22.8 28.3 29.1 26.6
VENTURA 26.3 33.7 33.8 44.7
ELLISON 31.7 26.9 28.6 33.8
JANZ 29.0 21.8 36.3 35.8
CUNNINGHAM 31.7 37.9 45.2 39.3
EGA GREGORY 41.8 36.7 38.7 41.8
SUNCO 23.6 32.3 29.1 33.8
SUNSTATE+STAMPEDE 21.5 27.1 29.8 39.0
LICOLN+LANG 32.6 20.4 30.3 33.5
SUNLIN 32.0 34.9 25.4 34.3
SUNTOP 27.1 28.9 39.4 35.3
SPITFIRE 26.2 23.3 34.5 33.9
2014 CRUSADER 53.9 50.6 51.8 56.1
SUNSTATE 52.6 49.5 51.9 55.7
EGA STAMPEDE 50.8 50.1 54.4 54.4
LINCOLN 54.1 52.4 52.6 55.6
LIVINGSTON 51.4 45.5 52.2 54.1
SUNVEX 53.6 49.4 53.0 53.0
MERINDA 50.8 51.5 55.0 52.8
LANG 53.9 51.7 51.6 53.2
SUNVALE 51.5 53.7 53.0 53.5
VENTURA 54.7 46.4 50.2 55.7
ELLISON 52.2 51.1 52.8 52.7
JANZ 50.9 49.9 51.3 51.3
CUNNINGHAM 54.2 52.3 52.9 55.3
EGA GREGORY 53.8 50.8 50.6 53.7
SUNCO 48.7 53.3 51.7 52.3
SUNSTATE+STAMPEDE 53.8 52.8 50.5 51.8
LICOLN+LANG 53.0 53.1 48.4 54.0
SUNLIN 53.2 53.3 50.5 57.4
SUNTOP 52.2 52.3 58.5 52.8
SPITFIRE 54.9 47.7 51.8 53.8
SUNSTATE+STAMPEDE+JANZ 51.8 49.7 53.9 50.7
LICOLN+LANG+SUNSTATE 52.9 51.3 50.6 56.0
SUNTOP+SPITFIRE 55.2 52.7 49.5 55.3

60
EGA GREGORY+VENTURA 54.2 51.5 55.9 53.1
Mean
42.4 41.5 43.5 45.5
Lsd (p< 5%) Yx E x G
7.1
Wald
statistic
Y
1183.37***
E
15.25**
G
50.79**
Y x E
74.88**
Y x G
81.85**
E x G
110.1*
Y x E x G 117.51*
Note: *, **, *** indicates significance at P≤0.05, 0.01 and 0.001, respectively Y-Year, E-Environment, G-Genotype.
3.3.1.5 Harvest index
Harvest indices were significantly influenced by year, management, genotype, year x management and
year x genotype interaction effects (Table 3.6). Genotypes with stable harvest indices in the two
cropping seasons included EGA Stampede, Lincoln, Livingston, Sunvex, Merinda, Sunvale, Ventura,
EGA Gregory, Sunlin, Spitfire, Sunstate+Stampede whilst the rest expressed significant year x
genotype interaction effects. The relatively lower harvest indices in 2014 are likely due to the higher
and more evenly distributed rainfall that resulted in higher biomass production. Harvest indices were
4.8% higher in 2013 compared to 2014. Under rainfed environments, harvest indices were 2.4% higher
in zero tillage compared to conventional tillage. This advantage reduced to 1.2% under irrigation

61
Table 3.6 Means for harvest index in 2013 and 2014.
Cropping Year
Genotype 2013 2014
CRUSADER 0.44 0.41
SUNSTATE 0.43 0.38
EGA STAMPEDE 0.44 0.44
LINCOLN 0.43 0.42
LIVINGSTON 0.41 0.42
SUNVEX 0.37 0.38
MERINDA 0.40 0.40
LANG 0.44 0.39
SUNVALE 0.41 0.38
VENTURA 0.43 0.42
ELLISON 0.39 0.44
JANZ 0.46 0.37
CUNNINGHAM 0.43 0.38
EGA GREGORY 0.39 0.36
SUNCO 0.44 0.37
SUNSTATE+STAMPEDE 0.42 0.43
LICOLN+LANG 0.44 0.39
SUNLIN 0.40 0.37
SUNTOP 0.43 0.39
SPITFIRE 0.43 0.43
SUNSTATE+STAMPEDE+JANZ - 0.41
LICOLN+LANG+SUNSTATE - 0.38
SUNTOP+SPITFIRE - 0.40
EGA GREGORY+VENTURA - 0.36
Mean 0.42 0.4
LSD(p <5%) Y x G 0.04
Wald statistic
Y 35.89***
M 14.67**
G 63.34***
Y x M 8.33*
Y x G 46.96***
M x G 59.66
Y x M x G 64.4
Note: *, **, *** indicates significance at P≤0.05, 0.01 and 0.001, respectively G-Genotype, Y-Year, M-Management

62
3.3.1.6 Biomass (kg ha-1
)
The influence of management, year and genotype on biomass was highly significant and
significant year x management and year x genotype interactions were observed (Table 3.7). Biomass
was 4.9% higher in zero tillage than conventional tillage under rainfed conditions. A similar and
stronger trend was observed in irrigated conditions, with zero tillage biomass 10.9% higher. Biomass
across years was 51% higher in 2014 compared to 2013. Genotypes with higher biomass included
Suntop, Lincoln and Lincoln+Lang in 2013 and Lang, Sunstate+Stampede+Janz and Crusader in 2014.
Biomass was positively correlated with TKW (r = 0.59) and yield (r= 0.26) (Table 3.24).
Table 3.7 Means for biomass (kg/ha) under different management practices in 2013 and 2014
Management
Rainfed
Irrigated
Year Genotype ZT CT ZT CT
2013 CRUSADER 6262 7186
7416 7291
SUNSTATE 6289 6849
7086 7070
EGA STAMPEDE 5301 7197
6962 7045
LINCOLN 6496 6341
8789 7644
LIVINGSTON 5861 7091
6767 6531
SUNVEX 4403 5935
5994 5344
MERINDA 6522 6962
7321 6840
LANG 5789 6916
6372 6507
SUNVALE 4391 6816
4969 5149
VENTURA 6520 6930
7706 7537
ELLISON 5640 6271
7155 6665
JANZ 6292 6939
6953 6358
CUNNINGHAM 5678 6812
6127 6991
EGA GREGORY 6049 7157
6858 7024
SUNCO 5186 6479
5904 6389
SUNSTATE+STAMPEDE 5572 6373
6861 6459
LICOLN+LANG 6520 7360
7585 7600
SUNLIN 6505 5981
6725 6802
SUNTOP 6311 7189
7736 8169
SPITFIRE 6486 6639
7306 6814
2014 CRUSADER 11949 9167
11662 9987
SUNSTATE 9497 8876
11501 9097
EGA STAMPEDE 9834 9453
11694 11180
LINCOLN 10031 10225
11872 8348
LIVINGSTON 10277 8108
10329 10313
SUNVEX 8619 7745
10349 8640
MERINDA 9142 9520
11919 10055

63
LANG 11000 10216
12536 10472
SUNVALE 10386 8778
10720 9742
VENTURA 9552 7971
10653 8277
ELLISON 9081 8437
10498 9679
JANZ 10971 7717
10645 10362
CUNNINGHAM 9963 7946
11768 11156
EGA GREGORY 10148 7843
11928 9474
SUNCO 11202 7504
10758 9655
SUNSTATE+STAMPEDE 10153 8459
12980 10304
LICOLN+LANG 9391 7820
12205 11757
SUNLIN 10024 7671
10911 8812
SUNTOP 9190 8478
12082 10314
SPITFIRE 10205 8710
11075 10472
SUNSTATE+STAMPEDE+JANZ 10211 9588
13907 9423
LICOLN+LANG+SUNSTATE 9204 8438
11002 11018
SUNTOP+SPITFIRE 8819 8832
11876 9705
EGA GREGORY+VENTURA 10446 7880
11875 9798
Grand Mean
8122 7745
9439 8506
Lsd (p< 5%) MxG
1155
Wald statistic
Y
1336.9***
M
219.6***
G
92.1***
Y x M
149.9***
YxG
45.9***
MxG
88.2
YxMxG 61.7
Note: *, **, *** indicates significance at P≤0.05, 0.01 and 0.001, respectively M-Management, G-Genotype, Y-Year
3.3.1.7 Leaf rolling
The extent of leaf rolling was significantly influenced by year, management, genotype, year x
management and year x genotype interaction effects (Table 3.8). The extent of leaf rolling was 8%
higher in conventional tillage compared to zero tillage under rainfed conditions, whereas in irrigated
conditions, zero tillage had 0.32 % more leaf rolling than conventional tillage. The extent of leaf
rolling was 32% higher in 2014 compared to 2013. Across the environments evaluated the extent of
leaf rolling increased in the order of conventional tillage/irrigated < zero tillage/irrigated < zero
tillage/rainfed < conventional tillage/rainfed. Genotypes which rolled their leaves exposing only 25%

64
of their lamina included Crusader, Livinsgton, Merinda and Suntop Leaf rolling was positively
associated with yield ( r = 0.499) (Table 3.24).
Table 3.8 Means for leaf rolling under different management practices in 2013 and 2014
Management
Rainfed
Irrigated
Year Genotype ZT CT ZT CT
2013 CRUSADER 4.0 4.0
4.0 4.0
SUNSTATE 0.0 0.0
0.0 0.0
EGA STAMPEDE 1.3 2.3
3.0 2.3
LINCOLN 0.3 1.0
0.0 0.3
LIVINGSTON 2.0 3.3
3.0 3.0
SUNVEX 1.3 0.7
0.0 0.0
MERINDA 4.0 4.0
4.0 4.0
LANG 0.0 0.0
0.0 0.0
SUNVALE 3.3 2.7
0.7 1.0
VENTURA 0.0 0.0
0.0 0.0
ELLISON 1.0 0.7
0.3 0.0
JANZ 2.7 3.0
1.7 0.7
CUNNINGHAM 0.3 0.0
0.0 0.0
EGA GREGORY 0.3 1.0
0.3 0.0
SUNCO 0.7 1.7
0.3 0.3
SUNSTATE+STAMPEDE 1.3 1.3
0.3 1.3
LICOLN+LANG 0.7 1.7
0.0 0.7
SUNLIN 0.0 0.0
0.0 0.0
SUNTOP 3.7 4.0
3.7 4.0
SPITFIRE 0.0 0.0
0.0 0.0
2014 CRUSADER 4.7 4.7
4.0 3.0
SUNSTATE 3.0 3.0
2.3 2.3
EGA STAMPEDE 3.0 3.3
3.0 1.7
LINCOLN 2.3 3.0
1.7 1.7
LIVINGSTON 2.3 3.7
2.3 2.7
SUNVEX 2.7 2.0
1.0 1.0
MERINDA 5.0 5.0
4.7 4.3
LANG 2.7 3.0
2.0 1.3
SUNVALE 3.3 3.0
1.3 1.0
VENTURA 3.3 3.3
2.0 1.0
ELLISON 2.0 2.7
1.0 1.0
JANZ 3.7 3.3
1.7 2.0
CUNNINGHAM 2.3 3.3
1.7 1.7
EGA GREGORY 1.7 3.3
2.0 1.7
SUNCO 3.0 3.3
1.0 1.3

65
SUNSTATE+STAMPEDE 3.0 3.3
2.3 2.3
LICOLN+LANG 2.7 2.7
2.0 1.3
SUNLIN 1.7 1.0
1.3 1.0
SUNTOP 2.0 4.0
3.0 2.0
SPITFIRE 2.7 3.7
1.7 1.3
SUNSTATE+STAMPEDE+JANZ 3.3 3.0
2.3 2.0
LICOLN+LANG+SUNSTATE 1.7 2.7
2.0 1.7
SUNTOP+SPITFIRE 2.7 3.3
2.3 2.7
EGA GREGORY+VENTURA 2.3 3.0
1.0 2.0
Grand Mean
2.1 2.5
1.6 1.5
Lsd(p< 5%) ExG
1.13
Wald statistic
Y
381.96***
M
161.43***
G
1003.04***
Y x M
31.71***
Y x G
215***
M x G
126.72***
Y x M x G 46.86
Note: *, **, *** indicates significance at P≤0.05, 0.01 and 0.001, respectively M-Management, G-Genotype, Y-Year
3.3.1.8 Relative water content
Relative water content was significantly influenced by year, genotype and management and all
observed interactions were significant (Table 3.9). RWC was 1.6% higher in zero tillage compared to
conventional tillage under rainfed conditions. However under irrigation RWC was 5.1% higher in zero
tillage. RWC was 5% higher in 2013 than 2014. Genotypes with higher relative water content (>45)
included Crusader, Sunvex, Ventura, Ellison, Sunlin, Suntop and Spitfire. RWC was positively
associated with yield (r = 0.48) (Table 3.24).

66
Table 3.9 Means for relative water content (%) under different management practices in 2013 and
2014.
Management
Rainfed
Irrigated
Year Genotype ZT CT ZT CT
2013 CRUSADER 42.48 43.98
50.56 56.94
SUNSTATE 42.01 42.69
41.69 50.00
EGA STAMPEDE 40.85 35.41
46.35 55.55
LINCOLN 46.52 29.60
43.93 60.93
LIVINGSTON 39.57 44.27
42.25 58.02
SUNVEX 46.35 42.37
58.13 53.33
MERINDA 41.36 38.26
40.38 60.19
LANG 40.11 38.83
49.58 54.04
SUNVALE 51.55 37.54
48.62 45.05
VENTURA 45.47 52.34
49.69 59.69
ELLISON 51.34 41.40
42.03 60.42
JANZ 48.84 47.86
41.98 56.96
CUNNINGHAM 42.14 31.80
47.78 56.13
EGA GREGORY 38.03 49.86
46.05 54.51
SUNCO 45.62 35.81
42.66 57.04
SUNSTATE+STAMPEDE 36.53 44.15
31.60 57.27
LICOLN+LANG 48.24 48.26
41.52 56.93
SUNLIN 40.97 45.46
41.91 55.05
SUNTOP 49.18 42.76
46.91 60.44
SPITFIRE 35.42 34.17
50.45 60.78
2014 CRUSADER 37.64 38.65
51.53 41.20
SUNSTATE 37.82 43.33
42.60 42.69
EGA STAMPEDE 34.64 34.66
44.83 42.76
LINCOLN 45.19 40.54
47.59 37.67
LIVINGSTON 41.29 38.29
51.09 39.01
SUNVEX 37.99 41.28
50.03 45.47
MERINDA 37.88 43.72
42.80 41.00
LANG 25.85 37.50
32.84 45.59
SUNVALE 36.66 34.24
53.16 41.50
VENTURA 58.33 44.20
43.47 42.58
ELLISON 57.63 42.17
46.04 43.23
JANZ 30.68 35.39
35.07 36.45
CUNNINGHAM 39.20 34.21
38.91 41.30
EGA GREGORY 43.17 40.89
40.17 46.25
SUNCO 39.29 27.65
37.75 40.72
SUNSTATE+STAMPEDE 33.35 42.45
40.96 36.49
LICOLN+LANG 37.34 30.56
34.67 43.95

67
SUNLIN 58.78 43.38
41.02 48.64
SUNTOP 40.56 42.32
43.28 45.02
SPITFIRE 45.43 49.80
49.84 50.86
SUNSTATE+STAMPEDE+JANZ 44.08 38.43
51.46 39.98
LICOLN+LANG+SUNSTATE 31.35 40.59
44.74 40.47
SUNTOP+SPITFIRE 35.35 39.97
50.36 37.36
GREGORY+VENTURA 26.18 39.14
49.54 71.04
Mean
41.55 40.23
44.72 49.33
Lsd (p<0.05) YxGxE
11.36
Wald statistic
Y
64.15***
M
129.68***
G
73.28***
Y x M
60.48***
Y x G
41.93**
M x G
174.07***
Y x M x G 82.22*
Note: *, **, *** indicates significance at P≤0.05, 0.01 and 0.001, respectively G-Genotype, Y-Year, E-Environment
3.3.1.9 Water use efficiency (kg ha-1
mm-1
)
WUE was highly influenced by year, management, genotype and significant genotype x
management interaction effects were observed (Table 3.10). WUE was 2.4% higher in 2014 than 2013.
WUE was 5.1% and 8,7% higher in zero tillage compared to conventional tillage under rainfed and
irrigated conditions, respectively. WUE increased in environments in the order conventional
tillage/rainfed < conventional tillage/irrigated < zero tillage/rainfed < zero tillage/irrigated. The
genotypes Crusader, Janz, Sunstate, Merinda and Sunstate+EGA Stampede tended to have higher
WUE in rainfed environments, whilst Crusader, Lincoln, Lincoln+Lang and Lincoln+Lang, Suntop
and EGA Stampede had higher WUE under irrigation.

68
Table 3.10 Means for water use efficiency (kg ha-1
mm-1
) under different management practices in
2013 and 2014
Management
Rainfed
Irrigated
Year Genotype ZT CT ZT CT
2013 CRUSADER 17.59 17.92
19.6 17.59
SUNSTATE 16.9 15.17
16.76 16.81
EGA STAMPEDE 15.16 16.1
18.04 17.47
LINCOLN 16.46 16.36
20.36 15.97
LIVINGSTON 15.7 16.12
17.32 15.29
SUNVEX 12.74 13.56
15.59 12.34
MERINDA 18.04 17.94
17.62 15.15
LANG 16.17 16.97
17.62 15.63
SUNVALE 12.35 14.74
11.68 12.41
VENTURA 16.01 17.63
17.32 15.57
ELLISON 14.56 13.99
17.63 13.19
JANZ 17.48 17.26
18.95 16.41
CUNNINGHAM 15.62 16.21
15.41 16.46
EGA GREGORY 15.06 14.88
15.3 15.27
SUNCO 14.53 15.98
16.75 16.8
SUNSTATE+STAMPEDE 14.68 16.86
17.94 15.51
LICOLN+LANG 15.84 16.88
18.97 17.36
SUNLIN 15.55 14.87
13.08 12.05
SUNTOP 16.46 16.86
19.09 19.43
SPITFIRE 16.64 16.41
18.18 14.99
2014 CRUSADER 20.47 17.2
26.19 18.93
SUNSTATE 16.95 13.85
20.22 18.08
EGA STAMPEDE 20.06 15.84
23.01 19.2
LINCOLN 18.49 15.08
24.14 16.61
LIVINGSTON 14.97 11.81
19.28 12.98
SUNVEX 10.71 8.08
13.32 9.2
MERINDA 17.09 15.45
21.91 17.05
LANG 17.9 13.64
20.68 17.34
SUNVALE 17.13 12.63
20.03 14.53
VENTURA 14.32 10.57
16.81 13.83
ELLISON 15.4 11.76
19.27 16.39
JANZ 18.94 14.56
22.27 15.52
CUNNINGHAM 18.6 14.58
22.58 18.23
EGA GREGORY 17.84 12.45
21.43 15.62
SUNCO 17.42 11.91
19.9 15.96
SUNSTATE+STAMPEDE 17.76 15.53
23.46 18.85
LICOLN+LANG 17.85 13.42
23.54 20.55

69
SUNLIN 13.24 11.08
18.76 14.49
SUNTOP 18.17 14.33
22.38 17.76
SPITFIRE 16.43 14.04
21.25 17.78
SUNSTATE+STAMPEDE+JANZ 19.66 16.29
24.28 18.13
LICOLN+LANG+SUNSTATE 16.93 13.56
20.95 18.13
SUNTOP+SPITFIRE 16.73 14.7
22.76 17.86
EGA GREGORY+VENTURA 15.17 12.04
19.99 16.31
Mean
16.4 14.7
19.35 16.15
Lsd (p<0.05) M x G
0.26
Wald statistic
Y
28.86***
M
535.57***
G
569.25***
Y x M
279.54***
Y x G
136.15***
M x G
79.22*
Y x M x G 64.56
Note: *, **, *** indicates significance at P≤0.05, 0.01 and 0.001, respectively G-Genotype, M-Management, Y-Year
3.3.1.10 Canopy temperature(ᵒC)
Observed canopy temperatures were significantly influenced by year, management and year x
management interaction effects (Table 3.11). Zero tillage managed environment were significantly
cooler than conventional tillage in both rainfed and irrigated conditions. Canopy temperature
correlated negatively with yield (r = - 0.35) (Table 3.24).

70
Table 3.11 Means for canopy temperature (°C) under different management practices in 2013 and
2014
Management
Rainfed
Irrigated
Year ZT CT ZT CT
2013 22.87 24.89
20.15 21.78
2014 25.95 26.26
21.21 21.33
Mean 24.41 25.57
20.68 21.55
Lsd (p < 5%) Yx M 0.82
Wald statistic
Y
24.35***
M
1368.46***
G
22.4
Y x M
67.8***
Y x G
24.34
M x G
58.92
Y x M x G 64.03
Note: *, **, *** indicates significance at P≤0.05, 0.01 and 0.001, respectively M-Management, Y-Year, G-Genotype
3.3.1.11 Light interception(%)
The amount of solar radiation intercepted varied significantly with year, management,
genotype and year x management interaction effects (Table 3.12). Light interception was 0.4% higher
under zero tillage in rainfed environments compared to conventional tillage, whilst under irrigation
interception was 1.9% higher in conventional tillage. Intercepted solar radiation was 7.4% higher in
2013 than 2014. Light interception increased in different environments in the order conventional
tillage/rainfed < zero tillage/rainfed < zero tillage/irrigated < conventional tillage/irrigated. Light
interception was 6.4% higher in zero tillage/irrigated compared to zero tillage/rainfed environments
and was 8.2% higher in conventional tillage under irrigated conditions. The genotypes Lang, Ventura
and EGA Gregory generally had higher light interception (>83%).

71
Table 3.12 Means for light interception (%) under different management practices in 2013 and 2014
Management
Rainfed
Irrigated
Year Genotype ZT CT ZT CT
2013 CRUSADER 93.79 93.10
80.37 81.88
SUNSTATE 93.12 87.12
76.06 82.67
EGA STAMPEDE 87.61 94.00
86.70 88.24
LINCOLN 91.86 91.26
81.53 83.33
LIVINGSTON 90.45 92.55
79.52 85.39
SUNVEX 93.59 94.84
90.77 82.64
MERINDA 92.24 93.86
86.48 82.39
LANG 96.06 95.73
81.85 86.03
SUNVALE 94.61 95.89
71.63 83.9
VENTURA 96.32 95.84
85.47 81.53
ELLISON 96.09 95.98
84.41 84.2
JANZ 95.20 94.30
85.44 89.08
CUNNINGHAM 95.89 96.13
77.01 83.85
EGA GREGORY 97.47 96.66
88.77 90.91
SUNCO 91.43 92.88
86.35 89.76
SUNSTATE+STAMPEDE 93.62 92.83
72.75 85.62
LICOLN+LANG 94.95 93.52
80.40 85.53
SUNLIN 93.80 96.29
79.79 84.98
SUNTOP 94.95 94.09
86.90 90.85
SPITFIRE 85.26 94.94
72.20 78.71
2014 CRUSADER 66.61 65.59
88.88 93.05
SUNSTATE 60.70 57.85
85.00 92.2
EGA STAMPEDE 63.90 60.81
90.94 94.3
LINCOLN 57.17 64.25
86.41 91.34
LIVINGSTON 63.04 53.93
87.03 90.2
SUNVEX 64.50 52.59
79.53 82.05
MERINDA 63.96 53.95
89.97 91.68
LANG 64.00 66.55
94.04 94.24
SUNVALE 64.66 64.54
94.50 95.49
VENTURA 68.67 64.72
91.27 91.84
ELLISON 66.60 55.47
90.83 92.78
JANZ 43.67 55.74
93.09 92.63
CUNNINGHAM 66.36 61.95
92.38 94.76
EGA GREGORY 69.87 59.68
93.66 93.52
SUNCO 54.25 62.21
94.49 95.01
SUNSTATE+STAMPEDE 57.44 53.86
93.00 92.3
LICOLN+LANG 59.47 62.84
91.34 94.95
SUNLIN 62.71 63.91
93.44 95.01

72
SUNTOP 63.75 63.10
88.00 86.91
SPITFIRE 57.05 58.07
89.08 92.05
SUNSTATE+STAMPEDE+JANZ 61.73 66.50
95.42 92.64
LICOLN+LANG+SUNSTATE 66.73 60.32
90.34 93.57
SUNTOP+SPITFIRE 56.04 60.32
89.60 93.92
GREGORY+VENTURA 60.73 57.71
93.82 95.53
Grand Mean
76.18 75.64
86.60 89.91
Lsd(p< 5%)YxM
11.20
Wald statistic
Y
402.53***
M
397.77***
G
41.28**
Y x M
1127.93***
Y x G
28.97
M x G
52.35
Y x M x G 46.41
Note: *, **, *** indicates significance at P≤0.05, 0.01 and 0.001, respectively M-Management, Y-Year, G-Genotype
3.3.1.12 NDVI at early heading
NDVI measurements at early anthesis were significantly influenced by year, genotype,
management, year x management and year x genotype interactions effects (Table 3.13). Whilst the
majority of the genotypes had a relatively stable NDVI at early heading, significant year x genotype
interaction effects were observed and Livingston, Sunvex, Lang, Ellison, Sunco, Sunstate+Stampede,
Lincoln+Lang, Sunlin, Suntop and Spitfire all had higher NDVI in at early heading in 2013. NDVI at
early heading was positively associated with yield (r = 0.47) (Table 3.24).

73
Table 3.13 Means for NDVI at early heading in 2013 and 2014
Cropping Year
Genotype 2013 2014
CRUSADER 0.735 0.717
SUNSTATE 0.719 0.690
EGA STAMPEDE 0.735 0.683
LINCOLN 0.734 0.696
LIVINGSTON 0.724 0.523
SUNVEX 0.747 0.540
MERINDA 0.741 0.635
LANG 0.756 0.678
SUNVALE 0.737 0.693
VENTURA 0.726 0.582
ELLISON 0.756 0.688
JANZ 0.744 0.697
CUNNINGHAM 0.761 0.707
EGA GREGORY 0.749 0.712
SUNCO 0.728 0.638
SUNSTATE+STAMPEDE 0.738 0.625
LICOLN+LANG 0.731 0.669
SUNLIN 0.747 0.677
SUNTOP 0.740 0.666
SPITFIRE 0.733 0.668
SUNSTATE+STAMPEDE+JANZ - 0.701
LICOLN+LANG+SUNSTATE - 0.679
SUNTOP+SPITFIRE - 0.716
EGA GREGORY+VENTURA - 0.658
Mean 0.739 0.664
LSD(5%) Y x G 0.06
Wald statistic
Y 144.03***
M 54.05***
G 88.41***
Y x M 17.73***
Y x G 60.2***
M x G 86.75
Y x M x G 81.95 Note: *, **, *** indicates significance at P≤0.05, 0.01 and 0.001, respectively G-Genotype, Y-Year, M-Management

74
3.3.1.13 NDVI at late heading
Later anthesis NDVI measurements were significantly influenced by year, genotype and
management and genotype x management interaction effects were observed (Table 3.14).
Measurements were 6.7% higher in 2013 compared to 2014. NDVI across the environments tested
increased in the order of zero tillage/irrigated < zero tillage/rainfed < conventional tillage/ rainfed <
conventional tillage/irrigated. Genotypes with higher (>0.75) NDVI values included Cunningham,
EGA Gregory and Sunlin.
Table 3.14 Means for NDVI at late heading under different management practices in 2013 and 2014
Management
Rainfed
Irrigated
Year Genotype ZT CT ZT CT
2013 CRUSADER 0.777 0.756
0.779 0.805
SUNSTATE 0.762 0.743
0.782 0.791
EGA STAMPEDE 0.738 0.770
0.776 0.801
LINCOLN 0.769 0.739
0.767 0.802
LIVINGSTON 0.761 0.777
0.796 0.788
SUNVEX 0.824 0.830
0.838 0.784
MERINDA 0.803 0.792
0.797 0.804
LANG 0.812 0.814
0.824 0.788
SUNVALE 0.787 0.819
0.822 0.803
VENTURA 0.769 0.766
0.777 0.780
ELLISON 0.830 0.816
0.834 0.794
JANZ 0.819 0.830
0.843 0.801
CUNNINGHAM 0.848 0.852
0.832 0.809
EGA GREGORY 0.822 0.820
0.826 0.799
SUNCO 0.774 0.802
0.829 0.780
SUNSTATE+STAMPEDE 0.760 0.743
0.773 0.791
LICOLN+LANG 0.790 0.795
0.818 0.790
SUNLIN 0.813 0.804
0.822 0.792
SUNTOP 0.808 0.780
0.805 0.760
SPITFIRE 0.791 0.766
0.826 0.772
2014 CRUSADER 0.686 0.672
0.744 0.673
SUNSTATE 0.666 0.707
0.623 0.689
EGA STAMPEDE 0.710 0.714
0.739 0.605
LINCOLN 0.696 0.710
0.793 0.706
LIVINGSTON 0.524 0.480
0.773 0.758
SUNVEX 0.546 0.527
0.715 0.637
MERINDA 0.669 0.720
0.768 0.650
LANG 0.735 0.739
0.667 0.646

75
SUNVALE 0.671 0.719
0.712 0.718
VENTURA 0.634 0.574
0.774 0.689
ELLISON 0.708 0.661
0.708 0.513
JANZ 0.722 0.697
0.757 0.545
CUNNINGHAM 0.732 0.769
0.726 0.737
EGA GREGORY 0.721 0.703
0.723 0.689
SUNCO 0.695 0.709
0.709 0.599
SUNSTATE+STAMPEDE 0.641 0.703
0.783 0.667
LICOLN+LANG 0.710 0.698
0.758 0.654
SUNLIN 0.734 0.693
0.793 0.699
SUNTOP 0.693 0.696
0.788 0.645
SPITFIRE 0.676 0.685
0.741 0.627
SUNSTATE+STAMPEDE+JANZ 0.714 0.695
0.766 0.582
LICOLN+LANG+SUNSTATE 0.709 0.717
0.748 0.665
SUNTOP+SPITFIRE 0.707 0.725
0.713 0.684
GREGORY+VENTURA 0.646 0.700
0.753 0.673
Mean
0.732 0.732
0.771 0.718
Lsd(<0.05) MxG
0.089
Wald
statistic
Y
467.06***
M
67.29***
G
59.32***
Y x M
24.92***
Y x G
52.27***
E x G
116.76***
Y x M x G 88.4*
Note: *, **, *** indicates significance at P≤0.05, 0.01 and 0.001, respectively. G-Genotype, E-Environment, Y-Year
3.3.1.14 NDVI at early grain filling
NDVI measured at initial grain filling was significantly influenced by year, genotype and management
and all the observed interactions were significant (Table 3.15). NDVI was higher in 2013 compared to
2014. NDVI increased in the order of conventional tillage/rainfed < zero tillage/rainfed < zero
tillage/irrigated < conventional tillage/irrigated. Generally, the top three outstanding genotypes with
higher NDVI were Janz, Cunningham and Lincoln+Lang. NDVI at early grain filling was positively
associated with yield (r = 0.46) (Table.3.24).

76
Table 3.15 Means for NDVI at early grain filling under different management practices in 2013 and
2014
Management
Rainfed
Irrigated
Year Genotype ZT CT ZT CT
2013 CRUSADER 0.797 0.807
0.814 0.797
SUNSTATE 0.734 0.783
0.808 0.799
EGA STAMPEDE 0.806 0.786
0.829 0.785
LINCOLN 0.787 0.832
0.778 0.821
LIVINGSTON 0.805 0.800
0.781 0.800
SUNVEX 0.799 0.784
0.806 0.782
MERINDA 0.782 0.791
0.806 0.801
LANG 0.758 0.799
0.826 0.785
SUNVALE 0.792 0.790
0.797 0.806
VENTURA 0.836 0.797
0.765 0.799
ELLISON 0.779 0.789
0.821 0.798
JANZ 0.808 0.783
0.793 0.805
CUNNINGHAM 0.814 0.782
0.812 0.810
EGA GREGORY 0.817 0.790
0.838 0.787
SUNCO 0.785 0.794
0.828 0.787
SUNSTATE+STAMPEDE 0.751 0.813
0.783 0.794
LICOLN+LANG 0.788 0.796
0.839 0.786
SUNLIN 0.787 0.780
0.811 0.784
SUNTOP 0.818 0.809
0.781 0.783
SPITFIRE 0.803 0.750
0.798 0.768
2014 CRUSADER 0.637 0.619
0.691 0.693
SUNSTATE 0.626 0.607
0.679 0.701
EGA STAMPEDE 0.658 0.653
0.702 0.590
LINCOLN 0.666 0.652
0.702 0.647
LIVINGSTON 0.530 0.512
0.724 0.705
SUNVEX 0.591 0.574
0.625 0.647
MERINDA 0.630 0.688
0.694 0.719
LANG 0.712 0.734
0.732 0.633
SUNVALE 0.685 0.736
0.620 0.686
VENTURA 0.636 0.526
0.699 0.583
ELLISON 0.622 0.618
0.672 0.621
JANZ 0.707 0.725
0.718 0.718
CUNNINGHAM 0.674 0.756
0.688 0.687
EGA GREGORY 0.657 0.645
0.687 0.692
SUNCO 0.671 0.708
0.674 0.715
SUNSTATE+STAMPEDE 0.601 0.644
0.687 0.702
LICOLN+LANG 0.683 0.692
0.712 0.689

77
SUNLIN 0.666 0.696
0.710 0.661
SUNTOP 0.646 0.666
0.687 0.677
SPITFIRE 0.588 0.606
0.713 0.685
SUNSTATE+STAMPEDE+JANZ 0.677 0.674
0.663 0.628
LICOLN+LANG+SUNSTATE 0.674 0.679
0.683 0.706
SUNTOP+SPITFIRE 0.673 0.657
0.658 0.699
EGA GREGORY+VENTURA 0.609 0.616
0.643 0.732
Mean
0.072 0.073
0.059 0.059
Lsd(p< 5%)YxExG
0.069
Wald statistic
Y
1211***
M
33.52***
G
71.52***
Y x M
10.07**
Y x G
56.86***
E x G
114.97**
Y x E x G 103.39***
Note: *, **, *** indicates significance at P≤0.05, 0.01 and 0.001, respectively. G-Genotype, Y-Year, E-Environment
3.3.1.15 NDVI at late grain filling
Late NDVI measurements were similarly influenced significantly by year, genotype and
management and all observed two-way interactions were significant (Table 3.16). NDVI was 6.4%
higher in zero tillage compared to conventional tillage under rainfed conditions. Similarly, in irrigated
environments, NDVI was 2.64% higher in zero tillage compared to conventional tillage. However,
NDVI did not vary significantly across years. Higher NDVI (>0.550) was obtained from the genotypes
Lang, Sunvale, EGA Gregory and Sunlin. NDVI at late grain filling was negatively associated with
thousand kernel weight (r = - 0.58) (Table 3.24).

78
Table 3.16 Means for NDVI at late grain filling under different management practices in 2013 and
2014
Management
Rainfed
Irrigated
Year Genotype ZT CT ZT CT
2013 CRUSADER 0.468 0.433
0.588 0.596
SUNSTATE 0.430 0.430
0.541 0.576
EGA STAMPEDE 0.401 0.489
0.532 0.585
LINCOLN 0.416 0.404
0.556 0.592
LIVINGSTON 0.366 0.386
0.505 0.553
SUNVEX 0.531 0.487
0.620 0.607
MERINDA 0.495 0.454
0.591 0.573
LANG 0.495 0.515
0.593 0.559
SUNVALE 0.457 0.481
0.581 0.577
VENTURA 0.464 0.396
0.557 0.565
ELLISON 0.503 0.483
0.630 0.597
JANZ 0.517 0.474
0.579 0.571
CUNNINGHAM 0.508 0.479
0.563 0.585
EGA GREGORY 0.571 0.539
0.621 0.592
SUNCO 0.471 0.515
0.573 0.571
SUNSTATE+STAMPEDE 0.440 0.405
0.534 0.552
LICOLN+LANG 0.465 0.455
0.590 0.575
SUNLIN 0.530 0.511
0.597 0.589
SUNTOP 0.522 0.517
0.638 0.565
SPITFIRE 0.426 0.475
0.582 0.540
2014 CRUSADER 0.524 0.436
0.644 0.583
SUNSTATE 0.365 0.398
0.673 0.672
EGA STAMPEDE 0.511 0.467
0.654 0.577
LINCOLN 0.362 0.445
0.692 0.550
LIVINGSTON 0.379 0.393
0.692 0.669
SUNVEX 0.521 0.373
0.570 0.597
MERINDA 0.393 0.422
0.630 0.581
LANG 0.576 0.517
0.685 0.538
SUNVALE 0.592 0.515
0.658 0.659
VENTURA 0.473 0.486
0.630 0.579
ELLISON 0.446 0.436
0.670 0.601
JANZ 0.472 0.431
0.531 0.507
CUNNINGHAM 0.478 0.414
0.643 0.553
EGA GREGORY 0.488 0.378
0.644 0.646
SUNCO 0.529 0.370
0.492 0.636
SUNSTATE+STAMPEDE 0.348 0.429
0.554 0.684
LICOLN+LANG 0.491 0.418
0.684 0.601

79
SUNLIN 0.550 0.377
0.657 0.621
SUNTOP 0.484 0.355
0.635 0.559
SPITFIRE 0.414 0.347
0.556 0.627
SUNSTATE+STAMPEDE+JANZ 0.471 0.429
0.633 0.551
LICOLN+LANG+SUNSTATE 0.379 0.387
0.570 0.640
SUNTOP+SPITFIRE 0.382 0.310
0.708 0.653
EGA GREGORY+VENTURA 0.462 0.352
0.627 0.622
Grand Mean
0.467 0.437
0.607 0.591
Lsd (p< 5%)ExG
Wald statistic
Y
0.32
M
682.08***
G
58.52***
Y x M
49.81***
Y x G
46.09***
M x G
115.62***
Y x M x G 71.26
Note: *, **, *** indicates significance at P≤0.05, 0.01 and 0.001, respectively. G-Genotype, E-Environment, Y-Year
3.3.2 Phenological Traits
3.3.2.1 Number of days to heading
The number of days to heading was significantly influenced by the effects of years,
management, genotype, year x genotype and management x genotype interaction (Table 3.17). The
numbers of days to heading were generally shorter by approximately 2 days in zero tillage compared to
conventional tillage under rainfed conditions and 1 day shorter under irrigation. Drought therefore
reduced the number of heading days to heading by approximately 0.7%. The number of days to
heading varied with year and was 103 days in 2013 and 108 days in 2014. In irrigated condition,
Livingston and Sunvex were significantly early to heading in conventional tillage management whilst
in rainfed condition EGA Stampede and Lincoln had significantly shorter days to heading under zero
tillage management. The number of days to heading was negatively associated with thousand kernel
weight (r = -0.74) and yield (r = -0.68) (Table 3.24).

80
Table 3.17 Means for number of days to heading under different management practices in 2013 and
2014
Management
Rainfed
Irrigated
Year Genotype ZT CT ZT CT
2013 CRUSADER 98.7 99.0
99.0 98.7
SUNSTATE 100.0 101.0
101.3 101.0
EGA STAMPEDE 99.7 103.7
100.3 98.7
LINCOLN 99.7 99.7
100.0 99.7
LIVINGSTON 96.7 96.3
100.7 98.7
SUNVEX 108.0 107.7
110.0 109.0
MERINDA 101.0 102.0
102.7 101.3
LANG 102.0 106.3
106.7 106.0
SUNVALE 106.7 106.7
108.0 108.0
VENTURA 103.0 101.3
102.3 101.3
ELLISON 106.3 109.7
109.7 109.0
JANZ 102.7 102.7
103.0 103.7
CUNNINGHAM 107.3 108.0
106.0 105.3
EGA GREGORY 108.0 107.3
109.7 108.0
SUNCO 101.7 102.7
102.7 102.0
SUNSTATE+STAMPEDE 99.7 100.3
101.3 100.7
LICOLN+LANG 99.7 101.3
102.3 100.3
SUNLIN 106.0 106.3
106.3 107.3
SUNTOP 101.0 100.7
102.3 101.0
SPITFIRE 98.3 99.7
98.7 98.3
2014 CRUSADER 98.0 103.0
99.3 97.3
SUNSTATE 101.7 104.3
108.0 111.3
EGA STAMPEDE 99.0 102.3
101.3 105.3
LINCOLN 96.3 104.0
97.0 96.3
LIVINGSTON 100.0 99.7
105.7 100.0
SUNVEX 119.0 121.3
118.0 111.0
MERINDA 102.7 102.7
106.3 101.7
LANG 113.7 112.7
115.3 113.7
SUNVALE 116.3 117.3
118.3 118.7
VENTURA 108.3 104.3
112.3 111.0
ELLISON 106.0 109.3
112.7 112.3
JANZ 108.0 109.3
112.7 112.7
CUNNINGHAM 111.0 113.0
112.0 111.7
EGA GREGORY 115.3 117.0
117.3 118.7
SUNCO 113.7 112.3
115.3 115.0
SUNSTATE+STAMPEDE 101.3 103.3
104.7 110.0
LICOLN+LANG 102.0 106.7
107.0 105.3

81
SUNLIN 112.3 116.7
117.7 115.0
SUNTOP 104.0 104.7
101.7 109.7
SPITFIRE 99.3 99.3
103.0 100.3
SUNSTATE+STAMPEDE+JANZ 100.0 105.7
107.7 107.3
LICOLN+LANG+SUNSTATE 102.0 105.7
108.3 105.3
SUNTOP+SPITFIRE 97.7 101.0
105.0 108.3
EGA GREGORY+VENTURA 114.0 114.7
116.0 113.7
Grand Mean
104.3 105.7
106.7 106.1
Lsd(p< 5%)ExG
3.4
Wald statistic
Y
391.04***
M
51.97***
G
1388.48***
Y x M
12.66**
Y x G
183.66***
M x G
98.95***
Y x M x G 71.87
Note: *, **, *** indicates significance at P≤0.05, 0.01 and 0.001, respectively. G-Genotype, E-Environment
3.3.2.2 Number of days to physiological maturity
The number of days to physiological maturity was significantly influenced by the effects of
year, management, genotype, year x management and year x genotype interaction (Table 3.18). The
top three genotypes which had significantly shorter days to maturity in 2013 included Sunlin, Sunvex
and EGA Gregory whereas in 2014, Crusader, Lincoln and Spitfire were the earliest maturing. Ellison
and Cunningham were stable across the two cropping seasons. The number of days to physiological
maturity was 3.8 days longer in 2014 and this could be attributed to the higher amount and more even
distribution of rainfall in 2014. The number of days to maturity was negatively correlated with TKW (r
= -0.67) and yield (r = -0.78) (Table 3.24).

82
Table 3.18 Means for days to physiological maturity in the 2013 and 2014 cropping seasons.
Cropping Year
Genotype 2013 2014
CRUSADER 142.4 145.6
SUNSTATE 142.9 147.8
EGA STAMPEDE 144.0 148.4
LINCOLN 143.3 146.7
LIVINGSTON 143.7 150.8
SUNVEX 151.0 157.5
MERINDA 145.4 147.5
LANG 147.2 150.8
SUNVALE 147.7 151.0
VENTURA 143.2 149.5
ELLISON 150.1 150.7
JANZ 147.0 149.8
CUNNINGHAM 147.4 148.9
EGA GREGORY 150.5 153.1
SUNCO 146.7 151.5
SUNSTATE+STAMPEDE 143.6 148.5
LICOLN+LANG 146.1 148.9
SUNLIN 150.7 155.4
SUNTOP 145.8 149.7
SPITFIRE 144.4 147.4
SUNSTATE+STAMPEDE+JANZ * 148.9
LICOLN+LANG+SUNSTATE * 147.7
SUNTOP+SPITFIRE * 148.8
EGA GREGORY+VENTURA * 153.0
Mean 146.1 149.9
LSD(5%) G x Y 1.86
Wald statistic
Y 353.07***
E 563.47***
G 672.25***
Y x E 27.57***
Yx G 60.34***
M x G 63.27
Yx Mx G 53.97
Note: *, **, *** indicates significance at P≤0.05, 0.01 and 0.001, respectively. G-Genotype, Y-Year, M-Management

83
3.3.2.3 Grain filling duration
Grain filling duration was significantly influenced by year, management, genotype and year x
genotype interaction effects (Table 3.19). The genotypes Sunstate, Sunvex, Merinda, Ventura, Ellison,
Sunstate+Stampede, Lincoln+Lang, Suntop and Spitfire had a relatively stable grain filling duration
across the two cropping seasons. Janz, Cunningham, EGA Gregory, Sunco, Sunvale and Sunlin had a
relatively longer grain filling duration in 2013 whilst EGA Stampede, Lincoln and Livingston had the
longest grain filling duration in 2014. The significantly longer grain filling duration in 2014 is again a
function of the milder and wetter season. Grain filling duration correlated positively with TKW (r =
0.61) and yield (r = 0.41) (Table 3.24).
Table 3.19 Means for grain filling duration (days) in 2013 and 2014
Cropping Year
Genotype 2013 2014
CRUSADER 43.6 46.2
SUNSTATE 42.1 41.5
EGA STAMPEDE 43.4 46.4
LINCOLN 43.6 48.3
LIVINGSTON 45.7 49.5
SUNVEX 42.3 40.2
MERINDA 43.7 44.2
LANG 41.9 36.9
SUNVALE 40.4 33.3
VENTURA 41.3 40.5
ELLISON 41.4 40.6
JANZ 44.0 39.2
CUNNINGHAM 40.8 37.0
EGA GREGORY 42.3 36.0
SUNCO 44.4 37.4
SUNSTATE+STAMPEDE 43.1 43.7
LICOLN+LANG 45.2 43.7
SUNLIN 44.2 40.0
SUNTOP 44.6 44.7
SPITFIRE 45.7 46.9
SUNSTATE+STAMPEDE+JANZ - 43.8
LICOLN+LANG+SUNSTATE - 42.3
SUNTOP+SPITFIRE - 45.8
EGA GREGORY+VENTURA - 38.4
Mean 43.2 41.9
LSD (p < 5%) G x Y 2.8
Wald statistic
Y 17.98***

84
M 140.31***
G 356.08***
Y x M 7.03
Y x G 130.32***
E x G 75.32
Y x E x G 70.54
Note: *, **, *** indicates significance at P≤0.05, 0.01 and 0.001, respectively. G-Genotype, Y-Year, M-management
3.3.2.4 Plant height (cm)
Plant height was significantly influenced by year, management, genotype and year x genotype
interaction effects (Table 3.21). All the genotypes had a relatively stable plant height across the two
cropping seasons with the exception of Sunstate, Sunvex and Ventura which were significantly taller
in 2013 and EGA Stampede and Sunvale which were taller in 2014. Plant height was generally greater
(by approximately 4cm) in irrigated compared to rain fed environments. Under zero tillage
management plants were on average 2 cm higher than under conventional tillage when irrigated (Table
3.10). This difference reduced to 1.34cm under rainfed conditions. Mean plant heights were 0.44%
shorter in 2013 compared to 2014. Plant height was positively correlated with TKW (r = 0.45) and
yield (r = 0.54) (Table 3.24).

85
Table 3.20. Means for plant height (cm) in 2013 and 2014
Cropping Year
Genotype 2013 2014
CRUSADER 86.2 88.3
SUNSTATE 94.0 90.2
EGA STAMPEDE 86.7 89.7
LINCOLN 86.4 86.5
LIVINGSTON 84.9 84.2
SUNVEX 73.5 70.9
MERINDA 86.7 86.1
LANG 85.6 87.4
SUNVALE 81.4 84.0
VENTURA 93.5 91.2
ELLISON 85.0 84.5
JANZ 82.4 81.9
CUNNINGHAM 86.6 88.2
EGA GREGORY 91.7 91.4
SUNCO 83.5 85.4
SUNSTATE+STAMPEDE 89.2 90.0
LICOLN+LANG 84.9 85.1
SUNLIN 83.6 84.0
SUNTOP 89.7 88.9
SPITFIRE 83.7 83.0
SUNSTATE+STAMPEDE+JANZ - 89.8
LICOLN+LANG+SUNSTATE - 88.7
SUNTOP+SPITFIRE - 88.8
EGA GREGORY+VENTURA - 93.1
Mean 86 86.7
LSD (p < 5%) YxG 2.3
Y 8.75**
M 229.48***
G 1138.27***
Y x M 116.87***
Y x G 41.49**
M x G 99.72
Yx Mx G 73.17
Note: *, **, *** indicates significance at P≤0.05, 0.01 and 0.001, respectively G-Genotype, Y-Year, M-Management

86
3.3.3 Production traits
3.3.3.1 Grain Yield(kg ha-1
)
Yield was significantly influenced by year, management, genotype, year x management and year x
genotype interaction effects (Table 3.22). Ventura and Livingston displayed stable yield across the two
cropping seasons whilst the remaining genotypes showed higher year x genotype interaction effects
with higher yields in 2014. These interactions could possibly be driven by the higher available
moisture from evenly distribution rainfall in 2014. A yield advantage of 5.9% and 8.6% was observed
in zero tillage relative to conventional tillage under rainfed and irrigated conditions, respectively.
Table 3.21 Means for grain yield (kg/ha) under different management practices in 2013 and 2014
Genotype Cropping Year
2013 2014
CRUSADER 3228
4018
SUNSTATE 2883
3358
EGA STAMPEDE 2968
3805
LINCOLN 3069
3603
LIVINGSTON 2860
2899
SUNVEX 2406
2009
MERINDA 3049
3487
LANG 2947
3394
SUNVALE 2272
3139
VENTURA 2953
2727
ELLISON 2634
3067
JANZ 3111
3479
CUNNINGHAM 2831
3618
EGA GREGORY 2688
3277
SUNCO 2847
3168
SUNSTATE+STAMPEDE 2885
3670
LICOLN+LANG 3068
3682
SUNLIN 2463
2824
SUNTOP 3147
3545
SPITFIRE 2937
3387
SUNSTATE+STAMPEDE+JANZ -
3820
LICOLN+LANG+SUNSTATE -
3391
SUNTOP+SPITFIRE -
3513
EGA GREGORY+VENTURA -
3096
Mean 2862.3
3332.3
Lsd(5%) G xY 244.1
Wald statistic

87
Y 321.22***
M 635.29***
G 585.54***
Y x M 333.67***
Y x G 139.64***
E x G 77.57
Yx M x G 60.09
Note: *, **, *** indicates significance at P≤0.05, 0.01 and 0.001, respectively G-Genotype, Y-Year
3.3.3.2 Thousand Kernel Weight (g)
TKW was significantly influenced by year, management, genotype and year x genotype interaction
effects (Table 3.23). Genotypes that had stable TKW across the two cropping seasons included
Crusader, EGA Stampede, Livingston, Merinda, Sunvale, Lang, Ellison, Cunningham,
Sunstate+Stampede and Sunlin whilst the rest displayed significant year x genotype interaction with
generally higher TKW in 2013 than 2014. TKW was 1.6 % higher in zero tillage compared to
conventional tillage under rainfed conditions. A similar trend was observed under irrigation and TKW
was 2.9% higher in 2013 than 2014. TKW was positively associated with yield (r = 0.52) (Table 3.24).

88
Table 3.22 Means for thousand kernel weight (g) under different management practices in 2013 and
2014
Cropping Year
Genotype 2013 2014
CRUSADER 32.3 30.2
SUNSTATE 34.6 30.9
EGA STAMPEDE 32.7 33.9
LINCOLN 35.3 33.0
LIVINGSTON 33.4 31.3
SUNVEX 27.4 29.6
MERINDA 33.1 32.8
LANG 30.6 29.3
SUNVALE 29.7 28.9
VENTURA 35.0 32.4
ELLISON 32.8 31.7
JANZ 33.4 29.0
CUNNINGHAM 32.2 30.4
EGA GREGORY 33.2 30.6
SUNCO 32.1 28.8
SUNSTATE+STAMPEDE 31.8 31.6
LICOLN+LANG 35.2 30.3
SUNLIN 29.9 28.7
SUNTOP 34.8 32.2
SPITFIRE 37.6 34.4
SUNSTATE+STAMPEDE+JANZ - 31.5
LICOLN+LANG+SUNSTATE - 30.4
SUNTOP+SPITFIRE - 33.7
EGA GREGORY+VENTURA - 27.6
Mean 32.9 31
LSD(5%)YxG 2.3
Wald statistic
Y
59.35***
M
63.03***
G
227.58***
Y x M
58.87***
Y x G
44.88***
M x G
85.62
Y x M x G 51.29
Note: *, **, *** indicates significance at P≤0.05, 0.01 and 0.001, respectively. G-Genotype, Y-Year, Management

89
3.3.3.3 Protein content (%)
Grain protein content was significantly influenced by management, year, genotype and year x
genotype interaction effects (Table 3.24). While the majority of the genotypes were stable, Sunstate,
EGA Stampede, Lincoln, Livingston, Merinda, Janz, EGA Gregory, Sunstate+Stampede, Sunlin, and
Suntop displayed significant year x genotype interaction effects. Protein was 2.5% higher in
conventional tillage compared to zero tillage practices under rainfed conditions, whilst little difference
was observed under irrigation. Protein content in 2014 was 2.6% higher than in 2013. This was
surprising given the higher yield in 2014. Nevertheless, protein content was strongly negatively
correlated with yield (r = - 0.74) (Table 3.24).

90
Table 3.23 Means for protein content (%) in 2013 and 2014
Cropping Year
Genotype 2013 2014
CRUSADER 12.95 13.26
SUNSTATE 12.86 13.92
EGA STAMPEDE 11.95 13.11
LINCOLN 12.67 13.38
LIVINGSTON 13.23 14.36
SUNVEX 14.18 14.38
MERINDA 12.31 14.25
LANG 13.20 13.58
SUNVALE 13.85 13.76
VENTURA 12.85 13.40
ELLISON 14.37 14.01
JANZ 12.63 14.13
CUNNINGHAM 13.41 13.66
EGA GREGORY 12.91 14.19
SUNCO 13.35 13.57
SUNSTATE+STAMPEDE 12.31 13.15
LICOLN+LANG 12.94 13.37
SUNLIN 13.52 14.30
SUNTOP 12.25 13.44
SPITFIRE 14.20 13.88
SUNSTATE+STAMPEDE+JANZ - 13.76
LICOLN+LANG+SUNSTATE - 13.97
SUNTOP+SPITFIRE - 14.50
EGA GREGORY+VENTURA - 14.11
Mean 13.09 13.81
LSD (p <5%) YxG 0.62
Wald statistic
Y 113.2***
M 166.5***
G 188.55***
Y x M 159.28***
Y x G 72.16***
M x G 81.32
Y x M x G 67.3
Note: *, **, *** indicates significance at P≤0.05, 0.01 and 0.001, respectively. G-Genotype, Y-Year, M-Management

91
Table 3.24 Phenotypic correlation of combined means of physiological characteristics possibly associated with grain yield and quality traits in 2013-2014.
BMAS CHL CT DH DM GC1 GF GC2 GCR HI HT IPAR LFRL ND1HA ND2GF ND2HA ND1GF PROT% RWC TKW
CHL -0.16 -
CT -0.52 -0.10 -
DH -0.53 -0.52 0.18 -
DM -0.43 -0.49 0.22 0.87 -
GC1 -0.02 0.26 -0.11 0.06 -0.17 -
GF 0.50 -0.42 -0.10 -0.88 -0.53 -0.27 -
GC2 0.44 -0.19 -0.17 -0.75 -0.61 0.50 0.70 -
GRC -0.31 -0.38 0.03 -0.25 -0.31 0.28 0.12 0.32 -
HI 0.37 -0.51 -0.08 -0.76 -0.80 -0.13 0.53 0.38 0.27 -
HT 0.56 0.08 -0.50 -0.32 -0.54 0.36 0.02 0.29 0.00 0.30 -
IPAR 0.10 0.60 -0.58 0.49 0.33 0.23 -0.52 -0.3 -0.14 -0.28 0.34 -
LFRL 0.09 -0.21 -0.18 -0.50 -0.47 -0.06 0.41 0.32 0.23 0.21 0.13 -0.07 -
ND1HA -0.32 0.23 -0.33 0.16 -0.06 0.41 -0.33 0.00 0.47 0.05 0.28 0.39 -0.07 -
ND2GF -0.33 0.59 -0.35 0.74 0.62 0.10 -0.67 -0.53 -0.06 -0.55 -0.11 0.74 -0.19 0.43 -
ND2HA -0.27 0.37 -0.26 0.36 0.20 0.65 -0.43 0.10 0.37 -0.28 0.13 0.50 -0.12 0.75 0.46 -
ND1GF -0.28 0.11 -0.24 0.19 0.02 0.66 -0.32 0.20 0.53 -0.10 0.10 0.43 0.09 0.67 0.31 0.82 -
PROT% -0.51 0.08 0.42 0.53 0.64 -0.24 -0.29 -0.44 0.00 -0.50 -0.62 -0.17 -0.42 -0.14 0.26 -0.05 -0.27 -
RWC 0.25 0.18 -0.15 0.06 0.22 -0.42 0.12 -0.20 -0.52 -0.12 -0.11 0.04 -0.13 -0.22 0.14 -0.28 -0.61 0.42 -
TKW 0.59 -0.25 -0.25 -0.74 -0.67 -0.06 0.61 0.51 0.01 0.64 0.45 -0.28 0.16 0.00 -0.58 -0.19 -0.23 -0.35 0.22 -
YIELD 0.26 0.17 -0.35 -0.68 -0.78 0.35 0.41 0.64 0.53 0.63 0.54 0.02 0.49 0.47 -0.32 0.24 0.46 -0.74 0.48 0.52
Note: BMAS: Biomass, CHL: Chlorophyll content, CT: Canopy temperature, DH: number of days to heading, DM: number of days to physiological maturity, GC1: early ground cover, GF: grain filling duration, GC2: Late ground cover, GRC: Rate of ground cover, HI: harvest index, HT: plant height, TKW: Thousand kernel weight, Yield: Grain yield, RWC: relative water content, P%: protein content,
NDIGF: NDVI at early grain filling stage, ND2HA: NDVI at late heading and Anthesis, ND2GF: NDVI at late grain filling stage, ND1HA: NDVI at early heading, LFRL:Leaf rolling, IPAR light
interception

92
3.4 Discussion
The design of the experiment in this chapter and the following chapter replicated genotypes
within four management practices (representing combinations of irrigation and tillage practices).
However, these management practices were replicated across years, not within years. This was done to
maximize the number of genotypes assessed given the finite resources available. Similar treatment
structures have been used in many other experiments (Olivares-Villegas et al. 2007; Reynolds et al.
2007; Ramya et al. 2016). Water-use-efficient wheat varieties with appropriate phenology for the
target environment are paramount to sustainable agriculture in water deficit environments. The current
study looked at a range of traits in a set of genotypes selected on the basis of contrasting markers,
identified through a previous association analysis, linked to yield in multi-environment trials. A
number of traits were identified that were linked to yield and adaptation to both moisture stress and
tillage practice. However, no tillage practice x genotype interaction for yield was observed indicating
that materials do not need to be bred under specific tillage regimes for adaptation to those regimes.
This observation agrees with previous findings for a range of crops(Ullrich and Muir 1986; Cox 2010)
and contrasts with the conclusions of Trethowan et al (Trethowan et al. 2005b; Trethowan et al. 2012)
who reported a significant genotype x tillage practice interaction. Zero-tillage was included in this
study as it is reported to conserve soil moisture ((Tebrügge and Düring 1999; Hernanz et al. 2002;
Hobbs et al. 2008; Farooq et al. 2011; Soane et al. 2012) and this was confirmed. In addition,
significant year x genotype interaction effects on yield and other traits were observed which could be
possibly driven by greater moisture availability in 2014 due to higher and more evenly distributed
rainfall. The selection of more stable genotypes would be an insurance against erratic rainfall patterns.
3.4.1 Agro--physiological traits
3.4.1.1 Canopy ground cover
Greater early season leaf area development results in faster ground cover which influences
yield by reducing soil evaporation from the soil surface in certain environments (Rebetzke et al. 2004).
In the current study, earliness to ground cover did not vary significantly among the environments
tested. The coverage was initially higher under zero tillage; however the difference between the zero
and conventional tillage quickly disappeared. This could be attributed to the initially higher (but non-
significant) stored soil moisture in the zero-tillage environments. Nevertheless, this trend makes the
trait a possible target for breeding and selection to improve adaptation to zero-tillage. Evidence
suggests that reduced seedling vigor occurs in zero-tillage systems despite the many structural and

93
biological advantages offered by conservation agriculture in Australia (Chan et al. 1987;
Simpfendorfer et al. 2002; Watt et al. 2006) and worldwide (Lekberg and Koide 2005). Therefore a
more vigorous plant should be an advantage in these systems. The higher early ground cover observed
in 2013 could be due to the higher total precipitation in June of that year and higher initial soil water
content. Excluding the occurrence of diseases and pests, reduced seedling vigour has been attributed to
slower root tip growth in harder undisturbed soil which induces a proliferation of inhibitory bacteria
which release toxins thus reducing leaf growth (Watt et al. 2003; Watt et al. 2006). Nevertheless, the
significant year x genotype interaction observed for both late ground cover and the rate of increase in
ground cover could be driven by the initially higher stored soil moisture and initially higher rainfall in
May-June of 2013. Therefore, selection of stable genotypes for these characters such as Livingston,
Sunvex, Ventura, EGA Gregory and Suntop could provide security against erratic rainfall and soil
moisture availability.
The strongly positively correlation observed between ground cover and various agronomic
traits and grain protein indicates that faster leaf area development captures enough sunlight to advance
heading time therefore avoiding later season moisture stress. These adaptations result in higher yields,
higher thousand kernel weight but potentially lower protein percentage. The ground cover trait may
therefore offer an avenue for indirect selection for improved water use efficiency.
A number of genomic regions were identified that influence seedling traits including
emergence, early vegetative vigour, nutrient uptake, nodal root number, and root hair length and
density (Liu et al. 2013a; Zhang et al. 2014a). Furthermore, these morpho-physiological traits were
found to co-locate with regions influencing grain yield in many studies (Venuprasad et al. 2002;
Gautami et al. 2012).
Li et al. (2014a) found thirty-seven genomic regions in wheat responsible for seedling
related traits, it is therefore possible that earliness to ground cover is linked to genomic regions which
confer high yield under moisture stress identified in the earlier association study of these genotypes.
Several markers identified in the earlier association analysis (Atta 2013) that were associated with
yield coincided with QTLs regions found by Li et al. (2014a). QTLs QGCw-caas-1A.1, QGCw-caas-
2A.2, TQGCw-caas-1A.2 at 6.1, 6.7 and 3.0 cM respectively, coincided with the markers wPt-6564,
wPt 8242, wPt 8455 and wPt 1945 on chromosomes 1A, 2A, 1A at similar distances. These regions
and their associated markers could be used to improve yield and related traits in marker assisted
selection.

94
3.4.1.2 Chlorophyll content
Chlorophyll content influences photosynthetic efficiency and significant correlations with grain
yield and their corresponding QTLs have been found in wheat (Cao et al. 2003; Quarrie et al. 2006;
Yang et al. 2007b; Grzesiak et al. 2009; Zhang et al. 2009b; Zhang et al. 2010b). In the current study,
chlorophyll content was significantly influenced by environment. Although chlorophyll content
weakly correlated with yield (r = 0.17), the significantly higher chlorophyll contents in zero tillage
relative to conventional tillage in rainfed environments and their corresponding yield differences
suggest that moisture stress, which was greater under conventional tillage, limits the photosynthetic
apparatus of plants and eventually leads to lower yield. The correlation of chlorophyll content with
IPAR, phenology and yield suggests that genotypes that maintained their photosynthetic apparatus
(chlorophyll content) were more efficient at capturing sunlight for photosynthesis and therefore
developed faster thus avoiding peak periods of moisture stress. Chlorophyll was not assessed in the
association analysis so co-location of significant marker trait association with previously identified
QTLs cannot be made. Nevertheless, some yield related marker trait associations are located on the
same chromosome arms as previously identified QTLs including 7A which was confirmed by Quarrie
et al. (2006). These authors indicated that flag leaf chlorophyll content and leaf width at tillering were
associated with a QTL on chromosome 7A. In addition, Graziani et al. (2014) identified QTLs for leaf
greenness on chromosome 3B at 6.9 cM, which overlapped with a QTL for TKW. The earlier
association studies coincidentally found marker wPt-7907 on chromosome 3B to be associated with
higher grain yield (Atta 2013). These results suggest that chlorophyll content could be associated with
genomic regions conferring higher yield under moistures stress.
3.4.1.3 Flag leaf rolling
Attaining an optimum level of photosynthesis under moisture stress could be augmented by
changes in leaf morphology such as rolling of the leaf blade. In the current study, leaf rolling was
highly influenced by the environments tested and was more pronounced in rainfed than irrigated
conditions which agrees with previous findings that leaf rolling is more pronounced under moisture
stress(Blum 1988a; Kadioglu et al. 2012). It was therefore expected that zero tillage under rainfed
conditions; the environment with the highest soil moisture, will have the less rolling of leaves. This
was observed in the current study. Rolling clearly increases the efficiency of water metabolism in the
flag leaves of wheat. Others have concluded that leaf rolling ability is an adaptive trait for drought
tolerance(Peleg et al. 2009b; Sarieva et al. 2010). Selection of cultivars with this character has been

95
achieved in rice, maize, sorghum and wheat (Dingkuhn et al. 1989; Premachandra et al. 1992a; Corlett
et al. 1994; Price et al. 2002a). Results suggest that genotypes with ability to roll their leaves avoided
photo damage, reduced transpiration loss under stress and therefore were more efficient in capturing
sunlight resulting in higher yield.
3.4.1.4 Canopy Temperature (ᵒC)
Canopy temperature has been reported as an integrative trait that is correlated with yield that
can be used to select superior genotypes or segregating bulks (Reynolds et al. 1997; Gutiérrez-
Rodrıguez et al. 2000). The trait is routinely used at CIMMYT in early generations to change gene
frequency in favour of lines with cooler canopies (Reynolds and Trethowan 2007; Trethowan and
Reynolds 2007). In the current study, canopy temperature was significantly influenced by the
environments tested. The higher canopy temperatures observed in the rainfed environments indicate
that the trait is affected by moisture status of the environment. Results suggested that genotypes with
cooler canopies had improved plant water status through access of water from deeper in the soil
profile. This produced taller plants with better light interception that subsequently produced higher
yields. The lack of significant differences among the genotypes tested for canopy temperature likely
reflects a lack of diversity for this trait and should not preclude targeted selection for this character in
future crop improvement. In other studies the trait was reported to have high heritability with over
60% of genetic variation in yield explained in some studies and QTLs have been detected for use in
breeding and selection (Olivares-Villegas et al. 2007; Lopes and Reynolds 2010; Pinto et al. 2010;
Mason et al. 2013). Bennett et al. (2012) identified a QTL located on chromosome 3B which had a
large effect on canopy temperature and grain yield. This coincided with marker trait associations
identified on the same chromosome for yield in the earlier association analysis (Atta 2013).
3.4.1.5 Days to heading & Maturity
The duration of wheat developmental is significantly influenced by sensitivity to vernalization,
photoperiod and earliness per se genes. Earliness per se controls flowering time independent of
environmental signals and therefore helps to fine tune the time of flowering and maturity (Kamran et
al. 2013). In the present study, genotype phenology varied significantly across the four environments
tested. While no significant differences were noted between tillage regimes, shorter days to flowering
and maturity were observed in the rainfed environments relative to the irrigated environments. A
significant year x genotype interaction effects for days to physiological maturity could be influenced

96
by the higher rainfall amount and distribution in 2014. This is simply a function of reduced moisture
and greater stress. However, some genotypes were earlier flowering and thus avoided most of the
impacts of terminal drought stress (Nagesh and Kumar 2006). Later flowering genotypes may have
had greater seed abortion under rainfed conditions, as observed earlier by Passioura (2006), however
this could not be confirmed as seed number per spike was not recorded. The strong negative
correlation between heading date and productivity traits including yield and the positive correlation
with protein percentage observed under both moisture conditions indicates that high temperature as
well as moisture stress impacted later flowering materials. Others have observed similar responses
(Kamran et al. 2013). A number of genomic regions regulating earliness per se gene effects have been
identified in wheat and other crops (Kuchel et al. 2006; Båga et al. 2009; Griffiths et al. 2012; Le
Gouis et al. 2012b). In the set of 20 genotypes assembled for this study, several carried significant
marker trait associations in regions already reported as influencing phenology. Coincidentally, MTAs
identified on chromosome 1AL at 57.96, 68.25, 117.16, 125.40, 134.61 and 135.6 cM in the earlier
association analysis (Atta 2013) coincided with the findings of Bullrich et al. (2002) who mapped a
QTL for earliness per se controlling heading time in the distal region of chromosome 1AL in wheat.
Kuchel et al. (2006) identified additional QTLs controlling time to heading on chromosomes
1A, 2A, 2B, 6D, 7A and 7B which coincided with MTAs on the same chromosomes identified in the
earlier association study (Atta 2013). Undoubtedly, higher grain yield could be achieved by avoiding
critical periods of moisture stress through early flowering under rainfed conditions.
3.4.1.6 Grain filling duration
Grain filling duration and rate influences final grain yield (Takai et al. 2005). As expected, the
current study indicated that grain filling duration was much shorter under rainfed environments which
resulted in correspondingly lower yields. The significantly longer grain filling duration observed in
zero tillage compared with conventional tillage in rainfed environments suggest that although zero
tillage impacts grain filling duration effect are driven by soil moisture levels. This has been
confirmed(Liu et al. 2013b) Tillage did not impact grain fill. Our results confirm many previous
reports that terminal drought shortens the grain-filling period and reduces yield (Aggarwal and Sinha
1984; Kobata et al. 1992; Zhang et al. 1998). Few genetic studies have been conducted on grain filling
because of its complexity and the strong influence of environment (Takai et al. 2005). The observed
significant year x genotype interaction effects are likely driven by higher rainfall in 2014 and the
selection of stable genotypes could provide insurance against moisture stress.

97
In the current study, longer grain filling duration increased important agronomic characters
including yield and harvest index. Clearly, genotypes that flower early tend to have longer grain filling
duration and ultimately higher yield, WUE and higher grain weight. However, these genotype
responses are greatly influenced by the environment. For this reason TKW, which is highly heritable
and more stable than yield (Giura and Saulescu 1996) could be targeted for the improvement of yield
and water use efficiency in wheat. Six QTL on chromosomes 1A, 3B, 5D and 6D that influence TKW
and grain filling rate have been identified in wheat across two environments (Wang et al. 2009) and
several of these chromosome locations coincide the earlier association study (Atta 2013). Larger
kernels indicate greater seedling vigor and increased yield and TKW can be targeted in breeding for
wheat adaptation to moisture stress.
3.4.1.7 Biomass
Biomass is a key driver of grain yield in rainfed environments (Shepherd et al. 1987; Royo et
al. 1999; Slafer 2003; Slafer et al. 2005). Zero-tillage biomass was greater than conventional tillage
under both moisture conditions. This difference possibly reflects differences in soil moisture content
and additional nitrogen from plant residues in the zero-tillage environments. Biomass correlated
positively with yield and productivity traits as expected but also with early ground cover. This
however implies that genotypes with good early ground cover tend to produce higher biomass and in
turn higher yield and kernel weights under stress. QTLs controlling total biomass have been reported
on chromosomes 4B and 4D (Li et al. 2014b).
3.4.1.8 Harvest Index
Harvest index defined as the ratio of reproductive yield to total plant biomass, is a measure of
the efficiency of partitioning assimilated photosynthates to harvestable product. Thus the historic
genetic improvement of yield has been achieved by increasing harvest index and reducing plant height
(Zheng et al. 2011; Xiao et al. 2012). In the current study, harvest indices were greatly influenced by
year x genotype interaction effects. EGA Stampede, Lincoln, Livingston, Sunvex, Merinda, Sunvale,
Ventura, EGA Gregory, Sunlin, Spitfire, Sunstate+Stampede appeared to be stable in the two cropping
seasons. Harvest indices were higher in 2013 compared to 2014 where rainfall was higher the
distribution more even. This resulted in higher biomass in 2014 with low harvest indices suggesting
that as a drought escape and survival strategy, assimilates were remobilized from the stems to fill the
grains in the drier year. By classifying wheat varieties into old, modern and semi-dwarf types in

98
Australia, Perry and d'Antuono (1989) reported that harvest index contributed 400 kg ha–1
and
aboveground biomass only 60 kg ha–1
to increased grain yield in Western Australia. This report is
supported by studies in higher yielding environments (Sayre et al. 1997; Shearman et al. 2005a). These
observations indicate that the overall WUE of biomass accumulation has not increased greatly through
breeding, whereas WUE for grain yield has increased sharply because of improvements in harvest
index (Richards et al. 2014). In the current study the effects of year x genotype interaction on harvest
index were significant, suggesting that the trait was driven by moisture availability, therefore selection
of stable genotypes could provide insurance against moisture stress.
3.4.2 Production traits
3.4.2.1 Thousand Kernel weights
In the current study, TKW was significantly influenced by year x genotype interaction effects
and the selection of stable genotypes could help buffer the effects of stress. TKW was highest under
zero tillage compared with the conventional tillage environment, suggesting that moisture stress
impacts grain weights. The current study supports the findings of (Gevrek and Atasoy 2012) who
reported a reduction in thousand kernel weights of 5.4% following post anthesis moisture stress. TKW
is also an integrated trait that was correlated with many other traits including yield. It is therefore a
good target for selection given its relatively high heritability.
3.4.2.2 Protein content
Grain protein content is determined by complex interactions between N, soil water, yield and
temperature. These factors generally hinder the investigation of genetic responses (De Vita et al.
2007a). The current study revealed that grain protein content is influenced by year x genotype
interaction effects and that this interaction is likely driven by differences in rainfall and rainfall
distribution between the cropping seasons. A few studies analyzed wheat grain protein content as a
function of tillage system, reporting no significant differences (Bassett et al. 1989; Cox and Shelton
1992). In contrast, De Vita et al. (2007a) reported higher grain protein content under conventional
tillage compared to zero tillage. However, in the current study, grain protein content was higher in zero
tillage environments regardless of soil moisture suggesting that grain protein content was significantly
influenced by the interaction of N from residues with soil moisture. Nevertheless, a negative

99
correlation with yield regardless of environment type affirms the frequently reported observation that
increased grain yield comes at the expense of grain protein.
3.4.2.3 Grain yield
Grain yield is the key agronomic trait targeted by wheat breeders for improvement. The current
study revealed that yields in zero-tillage were significantly higher than conventional tillage regardless
of soil moisture. These observations support the findings of others, particularly under moisture stress
(Cantero‐Martínez et al. 2007; Karrou 2013). Clearly, the absence of soil disturbance reduced moisture
loss thus improving yield. The advantage of zero-tillage under sub-optimal rainfall conditions and the
link with increased water availability has been reported earlier (Hall and Cholick, 1989; Cox, 1991;
Carr et al., 2003a). Thus zero-tillage lowers soil evaporation, increases infiltration, enhances
conductibility, reduces runoff and enhances soil structure (Blevins et al. 1971; Unger 1990; Hatfield et
al. 2001; Karamanos et al. 2004). The results presented here show the superiority of zero tillage over
conventional tillage in maintaining higher grain yield and improving WUE.
Assessing the extent to which factors like genotype and genotype x interaction influence yield
is crucial. This allows breeders and farmers to make better use of the potential of genotypes. However,
in the current study, no significant genotype x environment interaction effect on yield was observed
instead significant year x genotype interaction effects were observed It may be that the germplasm
utilized were stable across all the environments tested or simply did not carry the vital genetic
variability related to adaptation to zero-tillage under either moisture regime. The development of new
varieties specifically adapted to zero-tillage systems is crucial if these interactions are to be exploited
in future (Duvick et al. 1990; Trethowan et al. 2005b). The significant year x genotype interaction
effects could be driven by the luxuriant supply of moisture in 2014, its therefore underscores the
selection of stable genotypes against unforeseen weather conditions.
Reynolds et al. (2005) emphasized the significance of and utilization of physiological traits to
increase wheat productivity under drought through breeding. The association of physiological traits
with identified genomic regions that confer higher yield under moisture stress could provide a cheaper
and faster avenue to improve genetic gains in wheat breeding. In this study, a wide range of traits
including biomass at maturity, canopy temperature, chlorophyll content, phenology, NDVI, plant
height, leaf rolling, relative water content, WUE, harvest index, TKW and earliness to ground cover in
combination accounted for 96.5% of the phenotypic variance associated with yield. However, just 5

100
traits (days to heading, NDVI at early grain filling, leaf rolling, earliness to ground cover and grain
filling duration) accounted for 87.8% of the observed phenotypic variance in yield. These traits are
likely responsible in part or in combination for the observed significant marker trait associations in the
current study. Thus the ideal water use efficient genotypes should be: faster in providing ground cover,
early to heading to avoid post-anthesis moisture stress, develop larger photosynthetic biomass to
capture sunlight, roll their leaves to avoid damage while maintaining photosynthetic activity and have
longer grain filling periods.
Previous studies have identified QTLs on 1B, 4A and 5B associated with heading time
(Kamran et al. 2013; Zanke et al. (2014)). For instance, Kamran et al. (2013) reported 3 QTLs
(QEps.dms-1B1 and QEps.dms-1B2, QEps.dms-5B) regulating earliness per se and flowering time on
chromosomes 1B, 5B and 4A, respectively. The QTL (QEps.dms-1B1) found on chromosome 1B
mapped at 31.8cM and resided approximately in the same region as MTAs found in the earlier Atta
(2013) association analysis (markers, wPt-2597, wPt-3819, wPt-5899, wPt-8682, wPt-1684, wPt-1684
were found at distances of 29.4, 29.4, 30.9, 28.6 and 34.6 cM, respectively). The QTL (QEps.dms-5B)
on chromosome 5B directly coincided with an MTA (wPt 6135) mapped at 76.1 cM.. QTLs for NDVI
mainly, QNDVIs-caas-5B (Li et al. 2014a) located on chromosome 5B at 1.0 cM coincided with an
MTA for grain yield (wPt 1302) that is 0.2 cM distant. In addition QNDVIw-caas-2A.2 located at 4.0
cM coincided with marker wPt-8464 which was associated with yield in the earlier association
analysis. A number of QTLs have also been identified for earliness to ground cover. QTLs QGCw-
caas-1A.1, QGCw-caas-2A.2, TQGCw-caas-1A.2 at 6.1, 6.7 and 3.0 cM respectively (Li et al. 2014a)
coincided with markers identified in the earlier association analysis, notably wPt-6564, wPt 8242, wPt
8455 and wPt 1945 on chromosomes 1A, 2A, 1A at distances of 6.1, 6.7 and 3.0 cM, respectively.
Grain filling duration QTLs have also been identified in wheat. These QTLs include QGfd.nfcri-1A,
QGfd.nfcri-3B, QGfd.nfcri-5D, QGfd.nfcri-6D on chromosomes 1A, 3B, 5D, and 6D, respectively.
Leaf rolling is an adaptive trait that enables the plant to manage drought. Although little research on
QTLs for leaf rolling in wheat has been published, QTLs have been identified in rice (Price et al.
1997).
3.4.3 Implications for wheat breeding
Genetic gains in wheat yield under moisture stress have been limited (Richards et al. 2001) and
progress has been slow mainly due to the complexity of drought tolerance (Khan and Iqbal 2011). The
complexity of drought tolerance therefore demands a multifaceted and integrative genetic approach.

101
The current study showed that superior yield with improved water use efficiency can be obtained under
zero tillage in both irrigated and rainfed environments. The advantage of zero tillage over conventional
tillage for yield, WUE, TKW, canopy temperature, intercepted photosynthetic active radiation, NDVI
and harvest index under low rainfall or high evaporative demand environments was confirmed. Higher
and more stable yield can be achieved by farmers when water use efficient genotypes are deployed in
zero tillage environments regardless of soil moisture status.
Although no genotype x environment interaction effects were observed, genotypes such as
Crusader, EGA Stampede, Lincoln, Sunvex and Janz tended to be adapted to zero tillage and therefore
could carry the potential genetic variability required to develop varieties better adapted to zero tillage.
The significant year x genotype interaction effects observed revealed that the selection of stable
genotypes, mainly Ventura and Livingston, could provide buffering against moisture stress.
Current molecular approaches have identified a number of chromosomal regions controlling
yield in wheat. However, very few of these genomic regions have been used for Marker Assisted
Selection (MAS) in plant breeding. The genomic regions/Marker Trait Association must be validated
in representative parental lines, breeding populations and phenotypic extremes before they can be
targeted by breeders. However, the 5 key traits identified could be targeted to efficiently improve grain
yield of wheat under moisture stress at relatively low cost.

102
4 The efficacy of using mixtures to buffer yield under stress
4.1 Introduction
Varietal mixtures (genotype mixtures) may offer yield, disease and pest tolerance advantages
compared to their pure stands (Kiær et al. 2009). This phenomenon is based on the premise that
biodiversity has been found to increase ecological stability to sustain production (Brush 1991; Gómez
et al. 2000). Improved adaptability and buffering effects in the presence of abiotic and biotic stresses
have been reported in wheat (Sarandon and Sarandon 1995; Kaut et al. 2009; Zhou et al. 2014), maize
(Tilahun 1995), oats (Peltonensainio and Makela 1995) and barley (Tratwal A et al. 2007). Wheat
mixtures have been found to increase water-use-efficiency and produce higher yield than pure stands
(Naudin et al. 2011; Fang et al. 2014b).
Mixing effects are not always positive (Finckh and Mundt 1996; Jedel et al. 1998; Kaut et al.
2008a; Dai et al. 2012) and the selection of genotypes that show complementarity for specific traits is
crucial (Mille et al. 2006). Therefore, combining genetic modification with mixtures has the potential
to increase sustainability and productivity whilst avoiding the cost of stacking transgenes in individual
plants (Zeller et al. 2012).
Reports from most studies on varietal mixtures are limited since evaluation was conducted
mostly in a single environment or management condition. It is therefore difficult to extrapolate to other
environments. Consequently, contemporary mixtures research is geared towards designing varietal
mixtures for specific environments to maximize productivity while minimizing the impact on the
environmental (Cowger and Weisz 2008; Kaut et al. 2008b).
In order to optimise varietal mixtures for real environmental situations, it is necessary to
understand how their performance is affected by relatively different tillage/management practices. This
study evaluated the performance of a set of wheat varietal mixtures formulated on the basis of
complementary genomic regions linked to high yield under moisture stress identified from an earlier
association analysis. The objective was to determine the efficacy of mixtures in buffering yield against
moisture stress in four contrasting environments/management conditions.

103
4.2 Materials and methods
Two and six genotype mixtures were evaluated alongside their pure stands in 2013 and 2014,
respectively. Each genotype represented an equivalent proportion of the mixture. The mixtures were
formulated on the basis of complementary markers/genomic regions identified in an earlier association
analysis (Atta 2013) together with other agronomic and genetic traits (Tables 4.1). It was assumed that
since the mixture components varied for the targeted markers, that complementary and compensatory
effects could further increase yield. The experiment involved four two-way mixtures:
Sunstate+Stampede, Lincoln+Lang, EGA Gregory+Ventura and Suntop+Spitfire and two three-way
mixtures: Sunstate+Stampede+Janz and Lincoln+Lang+Sunstate. The mixtures were evaluated in four
management types as indicated in Chapter 3: (i) zero-tillage/rainfed (ii) conventional-tillage/rainfed
(iii) zero tillage/irrigated and (iv) conventional tillage/irrigated.
The trial was laid out in 4 contiguous randomized complete block designs of three replicates
each as described in the previous chapter (see Appendix I for a description of the field layout). The
following data was collected using the procedures described in Chapter 3: canopy ground cover (GC),
number of days to heading (DHD), number of days to maturity (DPM), harvest index (HI), relative
water content (RWC), grain yield (GYD), thousand kernel weight (TKW), light interception (IPAR),
canopy temperature (CT), normalized difference vegetation index (NDVI) and plant height (HIGT).
Table 4.1 Characteristics of mixture components and their corresponding numbers of positive
marker/traits associations for grain yield identified in the earlier association analysis (Atta 2013)
GENOTYPE
NO. OF POSITIVE
MARKERS BREEDING METHOD MATURITY LODGING
JANZ 27 SELECTION FROM F4 BULKS INTERMEDIATE GD
LANG 30 SELECTION FROM BULKS INTERMEDIATE GD
LINCOLN 20 DOUBLE HAPLOID LINE INTERMEDIATE GD
SPITFIRE 22 DOUBLE HAPLOID LINE EARLY MS
EGA STAMPEDE 40 RECURENT SELECTION EARLY GD
SUNSTATE 43 SINGLE PLANT SELECTION EARLY GD
SUNTOP 23 RECURRENT SELECTION EARLY GD
VENTURA 31 RECURRENT SELECTION INTERMEDIATE GD
EGA GREGORY 28 DOUBLE HAPLOID LINE EARLY GD
Key GD-Good, MS-Moderately Susceptible

104
4.3 Statistical analysis
GenStat statistical software, version 14.1 (Payne RW 2011), was used to test differences among the
four contrasting management practices using REML. The same treatment structure outlined in Chapter
3 on page 52 was used. Each varietal mixture and each pure line component were considered as
separate genotypes for the purposes of analysis. Treatments were decomposed by linear contrast
analysis to test differences between mixtures and their pure stands at a significance of 5% (Clewer and
Scarisbrick 2013). Year, management and genotype were considered fixed effects and range/row
within years as random effects as in Chapter 3.
4.4 RESULTS
4.4.1 Canopy temperature (ᵒC)
Generally, canopy temperatures were significantly influenced by management and means
ranged from 20.6°C in the conventional tillage irrigated management to 25.2°C in the conventional
tillage rainfed management. Comparatively, canopy temperatures were 1°C lower in zero tillage
compared to conventional tillage in both rainfed and irrigated conditions. No significant differences
among genotypes were observed and average canopy temperatures ranged from 22.7°C for the
Lincoln+Lang mixture to 23.50 °C for Sunstate+Stampede. No significant mixing effects on canopy
temperature were observed between mixtures and their corresponding pure stands (Table 4.2).

105
Table 4.2 Combined means and analysis of canopy temperature (°C) of Lincoln+Lang and
Sunstate+Stampede mixtures versus their pure stands in 2013 and 2014.
Management
Genotype Zero till Irrigated Zero till rainfed Conv till Irrigated Conv. till Rainfed
LANG 21.37a 24.62a 21.77a 25.05a
LINCOLN 21.87a 23.93a 20.86a 24.27a
LINCOLN+LANG 20.46a 24.41a 19.87a 26.18a
EGA STAMPEDE 21.55a 24.40a 20.30a 24.96a
SUNSTATE 21.52a 24.65a 20.63a 25.71a
SUNSTATE+
EGASTAMPEDE 21.98a 26.45a 20.50a 25.06a
Mean 21.46 24.74 20.66 25.21
SED 0.63
Wald statistic
Year 10.43***
Management 117.04***
Genotype 2.42
Year x Management 17.25***
Year x Genotype 6.93
Management x Genotype 9.4
Year x Management x Genotype 5.65
Note: *, **, *** indicates significance at P≤0.05, 0.01 and 0.001, respectively. Conv-conventional. Means followed by the
same letter in columns within each mixture/pure line contrast are not significantly different at P<0.05.
In 2014, when the number of genotypes tested was increased, the management similarly
significantly influenced canopy temperature (Table 4.3). Canopy temperatures ranged from 21.0°C in
the conventional tillage irrigated management to 26.2°C in the conventional tillage rainfed
management. Temperatures in zero tillage rainfed managements were significantly cooler by 1.5°C
than in conventional tillage rainfed conditions. In irrigated managements no significant differences
were evident and tillage practice did not impact canopy temperatures. Similarly, no significant effects
of mixtures on canopy temperatures were observed. Canopy temperatures ranged from 23.3°C in Lang
to 24.1°C in Ventura as a pure stands.

106
Table 4.3 Means and analysis of canopy temperature (°C) in mixtures versus their pure line
components in 2014.
Management
Genotype
Zero till
Irrigated
Zero till
rainfed
Conv till
Irrigated
Conv. till
Rainfed
EGA GREGORY 20.72a 25.27a 20.84b 26.58a
VENTURA 21.85a 25.55a 22.42a 26.48a
EGA GREGORY+VENTURA 20.97a 25.53a 20.91ab 25.70a
LANG 21.07a 25.71bc 20.98a 25.26ab
LINCOLN 21.47a 26.22ac 21.18a 24.90b
LINCOLN+LANG 20.66a 27.29a 20.70a 26.43a
LANG 21.07a 25.71a 20.98a 25.26bc
LINCOLN 21.47a 26.22a 21.18a 24.90bc
SUNSTATE 21.51a 27.07a 20.94a 26.26ac
LINCOLN+LANG+SUNSTATE 21.34a 26.84a 20.96a 27.02a
SUNSTATE 21.51a 27.07a 20.94a 26.26ac
EGA STAMPEDE 21.33a 26.60a 20.94a 26.78a
SUNSTATE+EGA STAMPEDE 21.12a 26.38a 20.56a 25.26bc
SPITFIRE 21.31a 25.14a 20.99a 26.66a
SUNTOP 21.34a 26.61a 21.24a 25.50a
SUNTOP+SPITFIRE 21.33a 25.53a 20.64a 26.01a
SUNSTATE 21.51a 27.07a 20.94a 26.26a
EGA STAMPEDE 21.33a 26.60ac 20.94a 26.78a
JANZ 20.62a 25.60ac 21.20a 26.27a
SUNSTATE+EGA STAMPEDE+JANZ 21.13a 24.57bc 20.97a 27.22a
Mean 21.18 25.99 21.03 26.16
SED 0.38
Wald statistic Management 1261.89***
Genotype 15.69
Management x Genotype 51.02
Note: *, **, *** indicates significance at P≤0.05, 0.01 and 0.001, respectively. Means followed by the same letter in
columns within each mixture/pure line contrast are not significantly different at P<0.05.
4.4.2 Chlorophyll content
The amount of chlorophyll observed was significantly influenced by management, genotype
and genotype x management interaction effects (Table 4.4). Chlorophyll contents ranged from 37.3 in
conventional tillage rainfed managements to 41.9 in the conventional tillage irrigated management.
Comparatively, Lang as a pure stand had a significantly higher chlorophyll content than the

107
Lincoln+Lang mixture and EGA Stampede had the highest chlorophyll content in the conventional
tillage irrigated management. The mixtures were generally intermediate to the two parents.
Table 4.4 Combined means and analysis of chlorophyll content (SPAD units) of Lincoln+Lang and
Sunstate+Stampede mixtures and their pure stand in 2013 and 2014.
Management
Genotype Zero till Irrigated Zero till rainfed Conv. till Irrigated Conv. till Rainfed
LANG 42.95a 39.02a 43.83a 45.17a
LINCOLN 38.20b 40.75a 36.07b 35.77b
LINCOLN+LANG 39.07b 40.55a 41.08a 36.60b
EGA STAMPEDE 42.70a 35.68a 44.20a 36.97a
SUNSTATE 38.47b 37.25a 42.32a 36.60a
SUNSTATE+ EGA STAMPEDE 39.37b 36.37a 43.65a 32.62b
Mean 40.13 38.27 41.86 37.29
SED 1.42
Wald statistic
Year 852.39***
Management 18.27***
Genotype 16.64**
Year x Management 40.2***
Year x Genotype 22.09***
Management x Genotype 27.93*
Year x Management x Genotype 26.99
Note: *, **, *** indicates significance at P≤0.05, 0.01 and 0.001, respectively. Means followed by the same letter in
columns within each mixture/pure line contrast are not significantly different at P<0.05.
In 2014 the chlorophyll contents were similarly significantly influenced by management.
Chlorophyll content ranged from 50.1 in the conventional tillage irrigated management to 52.8 in the
conventional tillage rainfed management (Table 4.5). There was no advantage of mixtures over pure
stands in chlorophyll content across all four managements. Conventional tillage and zero tillage
rainfed managements produced higher chlorophyll content in EGA Stampede and Ventura pure stands,
whilst EGA Stampede had higher chlorophyll in the zero tillage irrigated management. Although no
significant genotypic differences occurred, positive mixing effects on chlorophyll contents were
observed in the EGA Gregory+Ventura mixture compared to its components.

108
Table 4.5 Means and analysis of chlorophyll content (SPAD units) of mixtures versus their pure stands
in 2014.
Management
Genotype
Zero till
Irrigated
Zero till
rainfed
Conv. till
Irrigated
Conv. till
Rainfed
EGA GREGORY 50.1b 53.0a 50.6a 53.5b
VENTURA 49.9b 53.8a 46.3b 55.2a
EGA GREGORY+VENTURA 55.5a 54.0a 51.2a 52.1b
LANG 50.2ac 52.4a 48.6b 53.4a
LINCOLN 51.9a 49.9b 50.5a 54.4a
LINCOLN+LANG 49.5bc 51.3a 51.4a 54.1a
LANG 50.2a 52.4a 48.6a 53.4a
LINCOLN 51.9a 49.9bc 50.5a 54.4a
SUNSTATE 50.9a 51.7ac 49.7a 54.9a
LINCOLN+LANG+SUNSTATE 51.7a 50.1bc 50.4a 54.8a
EGA STAMPEDE 52.2a 47.2c 50.3b 52.2b
SUNSTATE 50.9a 51.7b 49.7b 54.9a
SUNSTATE+ EGA STAMPEDE 51.4a 53.0a 52.4a 49.2b
SPITFIRE 50.9b 53.3a 48.4b 53.4a
SUNTOP 55.7a 51.0b 52.2a 52.6a
SUNTOP+SPITFIRE 49.2b 53.3a 51.2a 53.7a
JANZ 51.1a 49.4c 48.9a 48.3d
EGA STAMPEDE 52.2a 47.2b 50.3a 52.2b
SUNSTATE 50.9a 51.7a 49.7a 54.9a
SUNSTATE+EGA STAMPEDE+JANZ 52.7a 47.9bc 49.9a 50.2c
Mean 51.5 51.4 50.1 52.8
SED 1.05
Wald statistic
Management 24.06***
Genotype 22.01
Management x Genotype 73.65*
Note: *, **, *** indicates significance at P≤0.05, 0.01 and 0.001, respectively. Means followed by the same letter in
columns within each mixture/pure line contrast are not significantly different at P<0.05.
4.4.3 Heading time (days from sowing to heading)
Heading time was significantly influenced by management and genotype. Heading time ranged
from 101.2 days in zero tillage rainfed to 104 days in conventional tillage irrigated managements
(Table 4.6). Among the genotypes tested, heading time ranged from 99 days in Lincoln to 109.5 days

109
in Lang. The effects of mixing were intermediate for heading time compared to the component pure
stands for both mixtures.
Table 4.6 Combined means and analysis of heading time (days from sowing) of Lincoln+Lang and
Sunstate+stampede mixtures and their pure stands in 2013 and 2014.
Management
Genotype Zero till Irrigated Zero till Rainfed Conv. till Irrigated Conv. till Rainfed
LANG 111.0b 107.8a 109.8a 109.5a
LINCOLN 98.5c 98.0c 98.0b 101.8c
LINCOLN+LANG 104.7a 100.8b 102.8c 104.0b
EGA STAMPEDE 100.81c 99.3a 102.0b 103.0a
SUNSTATE 104.7a 100.8a 106.2a 102.7a
SUNSTATE+ EGA STAMPEDE 103.0b 100.5a 105.3a 101.8b
Mean 103.8 101.2 104 103.8
SED 0.80
Wald statistic
Year 67.51***
Management 24.69***
Genotype 190.36***
Year x Management 8.44*
Year x Genotype 45.35***
Management x Genotype 22.06
Year x Management x Genotype 27.01*
Note: *, **, *** indicates significance at P≤0.05, 0.01 and 0.001, respectively. Means followed by the same letter in
columns within each mixture/pure line contrast are not significantly different at P<0.05.
In 2014, the numbers of mixtures were increased and heading time was influenced significantly
by genotype, management and genotype x management interaction (Table 4.7). Heading time was
significantly earlier in zero tillage compared to the conventional tillage (by 2 days) in rainfed
managements. No mixing effects were observed and all mixtures tended to be intermediate for heading
time.

110
Table 4.7 Means and analysis of heading time (days from sowing) of mixtures versus pure stands in
2014.
Management
Genotype
Zero till
Irrigated
Zero till
rainfed
Conv. till
Irrigated
Conv. till
Rainfed
EGA GREGORY 117.3a 115.3a 118.7a 117.0a
VENTURA 112.3b 108.3b 111.0c 104.3b
EGA GREGORY+VENTURA 116.0a 114.0a 113.7b 114.7b
LANG 115.3a 113.7a 113.7a 112.7a
LINCOLN 97.0c 96.3c 96.3c 104.0c
LINCOLN+LANG 107.0b 102.0b 105.3b 106.7b
LANG 115.3a 113.7a 113.7a 112.7a
LINCOLN 97.0c 96.3c 96.3d 104.0b
SUNSTATE 108.0b 101.7b 111.3b 104.3b
LINCOLN+LANG+SUNSTATE 108.3b 102.0b 105.3c 105.7b
EGA STAMPEDE 101.3c 99.0b 105.3b 102.3a
SUNSTATE 108.0a 101.7a 111.3a 104.3a
SUNSTATE+ EGASTAMPEDE 104.7b 101.3ab 110.0a 103.3a
JANZ 112.7a 108.0a 112.7a 109.3a
EGA STAMPEDE 101.3c 99.0c 105.3b 102.3c
SUNSTATE 108.0b 101.7b 111.3a 104.3bc
SUNSTATE+EGA STAMPEDE+JANZ 107.7b 100.0bc 107.3b 105.7b
SPITFIRE 103.0a 99.3b 100.3b 99.3b
SUNTOP 101.7b 104.0a 109.7a 104.7a
SUNTOP+SPITFIRE 105.0a 97.7b 108.3a 101.0b
Mean 107.8 104.2 108.6 106.3
SED 1.24
Wald statistic
Management 54.87***
Genotype
512.01**
*
Management x Genotype 75.75***
Note: *, **, *** indicates significance at P≤0.05, 0.01 and 0.001, respectively. Means followed by the same letter in
columns within each mixture/pure line contrast are not significantly different at P<0.05.

111
4.4.4 Physiological maturity (days from sowing to maturity).
Earliness to physiological maturity varied significantly with year, genotype and management
(Table 4.8). However, no significant genotype x management interaction was observed. Maturity time
was earlier by 4 days in 2013 compared to 2014. Among the four managements tested, heading time
was significantly earlier by 4 days in the rainfed than irrigated managements. Although significant
differences among genotypes were observed, no significant maturity time advantage was observed
between mixtures and all their pure stands. The mixtures tended to be intermediate to their pure line
components.
Table 4.8 Combined means and analysis of physiological maturity (days from sowing) of
Lincoln+Lang and Sunstate+Stampede mixtures and their pure stands in 2013 and 2014.
Management
Genotype Zero till Irrigated Zero till rainfed Conv. till Irrigated Conv. till Rainfed
LANG 153.8a 145.0a 150.8a 146.2a
LINCOLN 146.8c 142.7b 146.7b 143.8b
LINCOLN+LANG 151.2b 144.8a 149.7c 144.3b
EGA STAMPEDE 148.5a 143.7a 149.0a 143.7a
SUNSTATE 147.3b 143.0a 149.0a 142.2b
SUNSTATE+EGA STAMPEDE 148.3b 143.8a 148.3a 143.7a
Means 149.3 143.8 148.9 144.0
SED 0.54
Wald statistic
Year 161.68***
Management 276.56***
Genotype 73.12***
Year x Management 13.3**
Year x Genotype 6.46
Management x Genotype 24.68
Year x Management x Genotype 13.46
Note: *, **, *** indicates significance at P≤0.05, 0.01 and 0.001, respectively. Means followed by the same letter in
columns within each mixture/pure line contrast are not significantly different at P<0.05.
4.4.5 Maturity time 2014 cropping season
In 2014, significant genotypic and management influence on maturity time was also observed
(Table 4.9). However no significant genotype x management interaction effect was observed. Maturity

112
time was significantly earlier by 1 day in zero tillage compared with conventional tillage irrigated
managements. However, no differences were noted in rainfed managements. Although significant
differences among genotype were observed, no advantage in maturity time of mixtures over pure
stands were observed. Again, mixing generally produced an intermediate maturity compared to the
pure line component genotypes.
Table 4.9 Means and analysis of maturity time (days from sowing) of mixtures versus pure stands in
2014.
Management
Genotype
Zero till
Irrigated
Zero till
rainfed
Conv. till
Irrigated
Conv. till
Rainfed
EGA GREGORY 155.3a 151.7a 155.3a 150.0a
VENTURA 154.0b 147.3c 148.3b 148.3b
EGA GREGORY+VENTURA 156.0a 149.7b 156.0a 150.3a
LANG 157.3a 146.0a 152.7a 147.0a
LINCOLN 148.3c 143.7b 148.7c 146.0a
LINCOLN+LANG 154.0b 145.7a 150.7b 145.3a
LANG 157.3a 146.0a 152.7a 147.0a
LINCOLN 148.3c 143.7b 148.7c 146.0a
SUNSTATE 151.0b 144.7a 152.0a 143.7b
LINCOLN+LANG+SUNSTATE 149.3c 145.0a 151.0b 145.3a
EGA STAMPEDE 150.3a 145.7a 152.3a 145.3a
SUNSTATE 151.0a 144.7a 152.0a 143.7a
SUNSTATE+ EGA STAMPEDE 151.0a 146.0a 152.0a 145.0a
EGA STAMPEDE 150.3b 145.7ac 152.3a 145.3bc
SUNSTATE 151.0b 144.7c 152.0a 143.7b
JANZ 154.0a 147.3a 151.3ab 146.7ac
SUNSTATE+EGASTAMPEDE+JANZ 153.0a 145.3bc 150.0b 147.3a
SPITFIRE 150.7c 144.7b 150.3b 144.0b
SUNTOP 152.3b 147.3a 152.7a 146.3a
SUNTOP+SPITFIRE 154.0a 144.7b 152.3a 144.3b
Mean 152.7 146.3 151.7 146.3
SED 1.02
Wald statistic
Management 253.29***
Genotype 91.74***
Management x Genotype 38.84
Note: *, **, *** indicates significance at P≤0.05, 0.01 and 0.001, respectively. Means followed by the same letter in
columns within each mixture/pure line contrast are not significantly different at P<0.05.

113
4.4.6 Grain filling duration (days)
Grain filling duration was significantly affected by management and genotype in 2013 and
2014 (Table 4.10). In rainfed managements, grain filling duration was significantly shorter (by 2 days)
in zero tillage compared to conventional tillage. However, no differences we noted under irrigation.
No advantage of mixtures over pure stand components was observed.
Table 4.10 Combined means and analysis of grain filling duration (days) of Lincoln+Lang and
Sunstate+Stampede mixtures and their pure stands in 2013 and 2014.
Management
Genotype Zero till Irrigated Zero till rainfed Conv. till Irrigated Conv. till Rainfed
LANG 42.83c 37.17c 41.00c 36.67c
LINCOLN 48.33a 44.67a 48.67a 42.00a
LINCOLN+LANG 46.50b 44.00a 46.83b 40.33b
EGA STAMPEDE 47.67a 44.33a 47.00a 40.67ac
SUNSTATE 42.67c 42.17b 42.83c 39.50bc
SUNSTATE+ EGA STAMPEDE 45.33b 43.33a 43.00b 41.83a
Mean 45.6 42.6 44.9 40.2
SED 0.83
Wald statistic
Year 0.16
Management 77.54***
Genotype 81.04***
Year x Management 5.3
Year x Genotype 42.21***
Management x Genotype 14.88
Year x Management x Genotype 17.6
Note: *, **, *** indicates significance at P≤0.05, 0.01 and 0.001, respectively. Means followed by the same letter
in columns within each mixture/pure line contrast are not significantly different at P<0.05.
In 2014, only management and genotype significantly influenced grain filling duration (Table
4.11). Grain filling duration was similarly significantly shorter in rainfed compared to irrigated
conditions and longer in conventional tillage compared to zero tillage. Generally, no advantage of
mixtures over all pure stands was observed. Mixing effects for grain-filling were again intermediate.

114
Table 4.11 Means and analysis of grain filling duration (days) of mixtures versus pure stands in 2014.
Management
Genotype
Zero till
Irrigated
Zero till
rainfed
Conv. till
Irrigated
Conv. till
Rainfed
EGA GREGORY 38.0b 36.3b 36.7b 33.0b
VENTURA 41.7a 39.0a 37.3b 44.0a
EGA GREGORY+VENTURA 40.0a 35.7b 42.3a 35.7b
LANG 42.0b 32.3c 39.0c 34.3c
LINCOLN 51.3a 47.3a 52.3a 42.0a
LINCOLN+LANG 47.0b 43.7b 45.3b 38.7b
LANG 42.0b 32.3c 39.0c 34.3b
LINCOLN 51.3a 47.3a 52.3a 42.0a
SUNSTATE 43.0b 43.0b 40.7c 39.3a
LINCOLN+LANG+SUNSTATE 41.0b 43.0b 45.7b 39.7a
EGA STAMPEDE 49.0a 46.7a 47.0a 43.0a
SUNSTATE 43.0c 43.0b 40.7b 39.3bc
SUNSTATE+ EGA STAMPEDE 46.3b 44.7b 42.0b 41.7ac
EGA STAMPEDE 49.0a 46.7a 47.0a 43.0a
SUNSTATE 43.0bc 43.0b 40.7bc 39.3bc
JANZ 41.3c 39.3c 38.7c 37.3b
SUNSTATE+ EGA STAMPEDE+JANZ 45.3b 45.3b 42.7b 41.7ac
SPITFIRE 47.7b 45.3ac 50.0a 44.7a
SUNTOP 50.7a 43.3bc 43.0b 41.7bc
SUNTOP+SPITFIRE 49.0b 47.0a 44.0b 43.3ac
Mean 45.1 42.2 43.3 39.9
SED 1.47
Wald statistic
Management 43.21***
Genotype 179.59***
Management x Genotype 50.71
Note: *, **, *** indicates significance at P≤0.05, 0.01 and 0.001, respectively. Means followed by the same letter in
columns within each mixture/pure line contrast are not significantly different at P<0.05.
4.4.7 Harvest index
Harvest indices were significantly influenced by management and year. Harvest indices were
5.7% higher in 2013 than 2014 (Table 4.12). Harvest indices were also higher in zero tillage compared
to conventional tillage in rainfed managements; however in the irrigated managements differences

115
were not significantly different. No advantage of mixtures over pure stands was observed for harvest
index.
Table 4.12 Combined means and analysis of harvest index of Lincoln+Lang and Sunstate+Stampede
mixtures and their pure stands in 2013 and 2014.
Management
Genotype Zero till Irrigated Zero till rainfed Conv. till Irrigated Conv. till Rainfed
LANG 0.40a 0.45a 0.40a 0.40a
LINCOLN 0.46a 0.42a 0.41a 0.42a
LINCOLN+LANG 0.41a 0.42a 0.41a 0.40a
EGA STAMPEDE 0.42a 0.47a 0.44a 0.42a
SUNSTATE 0.40a 0.43a 0.40a 0.39a
SUNSTATE+EGASTAMPEDE 0.45a 0.42a 0.41a 0.40a
Mean 0.43 0.43 0.41 0.41
SED 0.01
Wald statistic
Year 13.88***
Management 11.55**
Genotype 11.04
Year x Management 1.78
Year x Genotype 15.4*
Management x Genotype 15.1
Year x Management x
Genotype 20.14
Note: *, **, *** indicates significance at P≤0.05, 0.01 and 0.001, respectively. Means followed by the same letter in
columns within each mixture/pure line contrast are not significantly different at P<0.05.
In 2014, harvest indices were significantly influenced by genotype when the number of
genotypes (mixtures) tested was increased (Table 4.13). However, no advantages of higher harvest
indices were observed in mixtures over their pure stands. Harvest indices were again intermediate in
mixtures compared to the component genotypes in pure stand.

116
Table 4.13 Means and analysis of harvest index of mixtures versus pure stands in 2014.
Management
Genotype
Zero till
Irrigated
Zero till
rainfed
Conv. till
Irrigated
Conv. till
Rainfed
EGA GREGORY 0.34b 0.36b 0.36b 0.38b
VENTURA 0.39a 0.41a 0.45a 0.41a
EGA GREGORY+VENTURA 0.37a 0.35b 0.35b 0.36b
LANG 0.37b 0.44a 0.35b 0.39a
LINCOLN 0.46a 0.42a 0.41a 0.40a
LINCOLN+LANG 0.39b 0.39b 0.38c 0.40a
LANG 0.37c 0.44a 0.35c 0.39a
LINCOLN 0.46a 0.42ad 0.41a 0.40a
SUNSTATE 0.36c 0.40bd 0.38b 0.40a
LINCOLN+LANG+SUNSTATE 0.40b 0.37c 0.35c 0.39a
EGA STAMPEDE 0.44b 0.45a 0.45a 0.42a
SUNSTATE 0.36c 0.40b 0.38c 0.40a
SUNSTATE+EGA STAMPEDE 0.47a 0.41b 0.42b 0.40a
EGA STAMPEDE 0.44a 0.45a 0.45a 0.42ac
SUNSTATE 0.36c 0.40b 0.38c 0.40bc
JANZ 0.38c 0.38b 0.34d 0.39bd
SUNSTATE+ EGA STAMPEDE+JANZ 0.41b 0.40b 0.40b 0.43a
SPITFIRE 0.42a 0.43a 0.43a 0.43a
SUNTOP 0.39b 0.40b 0.37b 0.39b
SUNTOP+SPITFIRE 0.41a 0.40b 0.39b 0.42a
Mean 0.40 0.40 0.39 0.40
SED 0.02
Wald statistic
Management 3.01
Genotype 72.5***
Management x Genotype 37.52
Note: *, **, *** indicates significance at P≤0.05, 0.01 and 0.001, respectively. Means followed by the same letter in
columns within each mixture/pure line contrast are not significantly different at P<0.05.
4.4.8 Plant height (cm)
Plant height was significantly influenced by genotype and management. In rainfed
managements the differences in plant height were not significant, however under irrigation plants were
on average 2cm taller in zero tillage. Lincoln+Lang mixtures were significantly shorter by 1.49cm
against pure stands whilst the Sunstate+Stampede mixture was intermediate to its components in pure
stands (Table 4.14).

117
Table 4.14 Combined means and analysis of plant height (cm) of Lincoln+Lang and
Sunstate+Stampede mixtures and their pure stands in 2013 and 2014.
Management
Genotype Zero till Irrigated Zero till rainfed Conv. till Irrigated Conv. till Rainfed
LANG 89.4a 86.3a 87.2a 83.0a
LINCOLN 88.6a 85.6ac 87.5a 84.1a
LINCOLN+LANG 89.2a 84.8bc 84.3b 81.6b
EGA STAMPEDE 89.6c 87.9b 88.8c 86.5b
SUNSTATE 95.1a 91.3a 91.5a 90.6a
SUNSTATE+ EGA STAMPEDE 91.8b 86.4c 90.0b 90.2a
Mean 90.6 87.1 88.2 86
SED 0.73
Wald statistic
Year 0.84
Management 66.21***
Genotype 125.33***
Year x Management 39.46***
Year x Genotype 24.95***
Management x Genotype 23.92
Year x Management x Genotype 23.85 Note: *, **, *** indicates significance at P≤0.05, 0.01 and 0.001, respectively. Means followed by the same letter in
columns within each mixture/pure line contrast are not significantly different at P<0.05.
In 2014, plant heights were similarly significantly influenced by genotype and management. In
rainfed and irrigated conditions plants were significantly higher under zero tillage (Table 4.15). No
significant mixing effect on plant height was observed although there was a trend to taller mixtures in
the EGA GREGORY+VENTURA combination compared it the component lines in pure stand.

118
Table 4.15 Means and analysis of plant height (cm) of mixtures versus pure stands in 2014
Management
Genotype
Zero till
Irrigated
Zero till
rainfed
Conv. till
Irrigated
Conv. till
Rainfed
EGA GREGORY 99.2a 91.2a 92.1a 83.2b
VENTURA 99.4a 89.1a 89.1b 87.0a
EGA GREGORY+VENTURA 99.4a 90.4a 94.4a 88.0a
LANG 92.6a 87.8a 89.1a 80.2b
LINCOLN 91.1a 85.1a 86.8b 83.1a
LINCOLN+LANG 91.7a 84.2b 84.4b 80.1b
LANG 92.6a 87.8b 89.1b 80.2c
LINCOLN 91.1a 85.1c 86.8c 83.1b
SUNSTATE 93.3a 90.1a 88.3bc 89.1a
LINCOLN+LANG+SUNSTATE 91.3a 87.7b 93a 82.9b
EGA STAMPEDE 93.3a 90.6a 88.6a 86.3b
SUNSTATE 93.3a 90.1a 88.3a 89.1a
SUNSTATE+EGA STAMPEDE 93.7a 89.2a 88.9a 88.2ab
EGA STAMPEDE 93.3a 90.6a 88.6b 86.3b
SUNSTATE 93.3a 90.1a 88.3b 89.1a
JANZ 86.7b 82.4b 79.4c 79.0c
SUNSTATE+EGA STAMPEDE+JANZ 93.3a 88.7a 90.6a 86.8b
SPITFIRE 85.1b 83.3b 83.2b 80.3c
SUNTOP 92.4a 89.0a 86.7a 87.3a
SUNTOP+SPITFIRE 91.7a 89.9a 88.9a 84.6b
Mean 93 87.9 88.2 84.4
SED 1.17
Wald statistic
Management 201.09***
Genotype 197.31***
Management x Genotype 61.65
Note: *, **, *** indicates significance at P≤0.05, 0.01 and 0.001, respectively. Means followed by the same letter in
columns within each mixture/pure line contrast are not significantly different at P<0.05.
4.4.9 Light interception (IPAR)
There was a significant influence of management, genotype and year on the amount of
intercepted light recorded (Table 4.16). Light interception was significantly higher in conventional
tillage than zero tillage under irrigation; however in rainfed managements the differences were not
significant. No advantage of light interception in mixtures over pure stands was observed.

119
Table 4.16 Combined means and analysis of light interception (%) of Lincoln+Lang and
Sunstate+Stampede mixtures and their pure stands in 2013 and 2014.
Management
Genotype Zero till Irrigated Zero till rainfed Conv. till Irrigated Conv. till Rainfed
LANG 87.94a 80.03a 90.14a 81.14a
LINCOLN 83.97b 74.51b 87.34b 77.76bc
LINCOLN+LANG 85.87a 77.21a 90.24a 78.18ac
EGA STAMPEDE 88.82a 75.76a 91.27a 77.40a
SUNSTATE 80.53b 76.91a 87.43b 72.48b
SUNSTATE+EGA STAMPEDE 82.87b 75.53a 88.96b 73.34b
MEAN 85.0 76.66 89.23 76.72
SED 1.88
Wald statistic
Year 109.49**
Management 99.24***
Genotype 12.34*
Year x Management 355.25***
Year x Genotype 0.41
Management x Genotype 6.4
Year x Management x Genotype 12.77
Note: *, **, *** indicates significance at P≤0.05, 0.01 and 0.001, respectively. Means followed by the same letter in
columns within each mixture/pure line contrast are not significantly different at P<0.05.
In 2014, light interception was significantly affected by management and genotype (Table
4.17). In irrigated managements, conventional tillage had significantly higher light interception than
zero tillage. However, in rainfed managements these differences were not significant. No light
interception advantage was observed in mixtures compared to their pure stands.

120
Table 4.17 Means and analysis of light interception (%) of mixtures versus pure stands in 2014 .
Management
Genotype
Zero till
Irrigated
Zero till
rainfed
Conv. till
Irrigated
Conv. till
Rainfed
EGA GREGORY 93.66a 69.87a 93.52a 59.68a
VENTURA 91.27a 68.67a 91.84a 64.72a
EGA GREGORY+VENTURA 93.82a 60.73b 95.53a 57.71b
LANG 94.04a 64.00a 94.24a 66.55a
LINCOLN 86.41b 57.17bc 91.34a 64.25a
LINCOLN+LANG 91.34a 59.47ac 94.95a 62.84a
LANG 94.04a 64.00ab 94.24a 66.55a
LINCOLN 86.41b 57.17c 91.34a 64.25ac
SUNSTATE 85.0b 60.7bc 92.20a 57.85b
LINCOLN+LANG+SUNSTATE 90.34ab 66.73a 93.57a 60.32bc
EGA STAMPEDE 90.94ab 63.90a 94.30a 60.81a
SUNSTATE 85.0b 60.70a 92.20a 57.85ac
SUNSTATE+STAMPEDE 93.0a 57.44b 92.30a 53.86bc
EGA STAMPEDE 90.94ab 63.90a 94.30a 60.81ac
SUNSTATE 85.0b 60.70a 92.20a 57.85bc
JANZ 93.09a 43.67b 92.63a 55.74bc
SUNSTATE+EGA STAMPEDE+JANZ 95.42a 61.73a 92.64a 66.5a
SPITFIRE 89.08a 57.05a 92.05ab 58.07a
SUNTOP 88.0a 63.75a 86.91b 63.10a
SUNTOP+SPITFIRE 89.6a 56.04b 93.92a 60.32a
Mean 91 60.73 92.8 60.82
SED 3.11
Wald statistic
Management 750.61***
Genotype 17.61***
Management x Genotype 31.44
Note: *, **, *** indicates significance at P≤0.05, 0.01 and 0.001, respectively. Means followed by the same letter in
columns within each mixture/pure line contrast are not significantly different at P<0.05.
4.4.10 Normalized Difference Vegetation Index (NDVI) at early grain filling.
NDVI was significantly influenced by year, management and genotype. NDVI at early grain
filling was significantly higher in 2013 than 2014 (Table 4.18). NDVI at early grain filling was
significantly higher in conventional tillage compared to zero tillage in rainfed managements. However

121
in irrigated conditions, zero tillage had higher NDVI than conventional tillage. Mixtures did not
demonstrate any advantage of NDVI over pure stands.
Table 4.18 Combined means and analysis of NDVI at early grain filling stage of Lincoln+Lang and
Sunstate+Stampede mixtures and their pure stands in 2013 and 2014.
Management
Genotype Zero till Irrigated Zero till rainfed Conv. till Irrigated Conv. till Rainfed
LANG 0.779a 0.735a 0.709a 0.766a
LINCOLN 0.740c 0.727a 0.734b 0.742bc
LINCOLN+LANG 0.775b 0.736a 0.737b 0.744bc
EGA STAMPEDE 0.765a 0.732a 0.688b 0.720a
SUNSTATE 0.744ac 0.680b 0.750a 0.695b
SUNSTATE+ EGA STAMPEDE 0.735bc 0.676b 0.748a 0.729a
Mean 0.756 0.714 0.727 0.733
SED 0.011
Wald statistic
Year 325.42***
Management 19.81***
Genotype 12.27*
Year x Management 3.55
Year x Genotype 8.52
Management x Genotype 29.68*
Year x Management x Genotype 18.71
Note: *, **, *** indicates significance at P≤0.05, 0.01 and 0.001, respectively. Means followed by the same letter in
columns within each mixture/pure line contrast are not significantly different at P<0.05.
At early grain filling stage in 2014, NDVI was significantly influenced by genotype,
management and genotype x management interaction effects (Table 4.19). NDVI was significantly
higher in zero tillage irrigated managements than under conventional tillage. However, no differences
were observed under rainfed conditions. Significant positive mixing effects were observed in EGA
Gregory+Ventura, Suntop+Stampede mixtures whilst, Lincoln+Lang+Sunstate and
Sunstate+Stampede+Janz mixtures were intermediate. Although positive mixing effects were observed
in the Sunstate+Stampede mixture, these were not significant.

122
Table 4.19 Means and analysis of NDVI at early grain filling of mixtures versus pure stands in 2014 .
Environment
Genotype
Zero till
Irrigated
Zero till
rainfed
Conv. till
Irrigated
Conv. till
Rainfed
EGA GREGORY 0.687a 0.657a 0.692b 0.645a
VENTURA 0.699a 0.636a 0.583c 0.526b
EGA GREGORY+VENTURA 0.643b 0.609b 0.732a 0.616a
LANG 0.732a 0.712a 0.633b 0.734a
LINCOLN 0.702a 0.666b 0.647b 0.652b
LINCOLN+LANG 0.712a 0.683a 0.689a 0.692b
LANG 0.732a 0.712a 0.633b 0.734a
LINCOLN 0.702ab 0.666b 0.647b 0.652c
SUNSTATE 0.679b 0.626c 0.701a 0.607d
LINCOLN+LANG+SUNSTATE 0.683b 0.674b 0.706a 0.679b
EGA STAMPEDE 0.702a 0.658a 0.590b 0.653a
SUNSTATE 0.679a 0.626ac 0.701a 0.607b
SUNSTATE+STAMPEDE 0.687a 0.601bc 0.702a 0.644ab
EGA STAMPEDE 0.702ab 0.658bc 0.590b 0.653b
SUNSTATE 0.679b 0.626b 0.701a 0.607c
JANZ 0.718a 0.707a 0.718a 0.725a
SUNSTATE+STAMPEDE+JANZ 0.663b 0.677ac 0.628b 0.674b
SPITFIRE 0.713a 0.588b 0.685a 0.606b
SUNTOP 0.687ab 0.646a 0.677a 0.666a
SUNTOP+SPITFIRE 0.658b 0.673a 0.699a 0.657a
MEANS 0.691 0.654 0.672 0.652
SED 0.019
Wald statistic
Management 20.2***
Genotype 50.28***
Management x Genotype 75.34**
Note: *, **, *** indicates significance at P≤0.05, 0.01 and 0.001, respectively. Means followed by the same letter in
columns within each mixture/pure line contrast are not significantly different at P<0.05.
4.4.11 Normalized Difference Vegetation Index at heading & anthesis
NDVI at early anthesis was similarly influenced significantly by year, genotype and genotype x
management interaction effects (Table 4.20). NDVI at early anthesis was significantly higher in zero
tillage in both irrigated and rainfed conditions. NDVI was also higher in 2013 than 2014. No NDVI
advantage was observed in mixtures over pure stands across the managements tested. However,

123
negative mixing effects were observed between Sunstate+Stampede and Lincoln+Lang mixtures
compared to their pure stands.
Table 4.20 Combined means and analysis of NDVI at heading and anthesis of Lincoln+Lang and
Sunstate+Stampede mixtures and their pure stands in 2013 and 2014.
Management
Genotype Zero till Irrigated Zero till rainfed Conv. till Irrigated Conv. till Rainfed
LANG 0.721a 0.753a 0.728a 0.665a
LINCOLN 0.750a 0.692b 0.726a 0.692a
LINCOLN+LANG 0.671b 0.732a 0.715a 0.682a
EGA STAMPEDE 0.750a 0.708a 0.720a 0.658a
SUNSTATE 0.784a 0.687b 0.685a 0.662a
SUNSTATE+EGA STAMPEDE 0.730b 0.632c 0.679a 0.687a
Mean 0.734 0.701 0.709 0.674
SED 0.022
Wald statistic
Year 325.42***
Management 19.81***
Genotype 12.27*
Year x Management 3.55
Year x Genotype 8.52
Environment x Genotype 29.68*
Year x Environment x Genotype 18.71
Note: *, **, *** indicates significance at P≤0.05, 0.01 and 0.001, respectively. Means followed by the same letter in
columns within each mixture/pure line contrast are not significantly different at P<0.05.
In 2014, the effect of management on NDVI were significant. NDVI was significantly higher in
zero tillage under both irrigated and rainfed conditions (Table 4.21). However, no advantage of NDVI
was observed in mixtures compared to pure stands.

124
Table 4.21 Means and analysis of NDVI at heading and anthesis of mixtures versus pure stands in
2014.
Management
Genotype
Zero till
Irrigated
Zero till
Rainfed
Conv. till
Irrigated
Conv. till
Rainfed
EGA GREGORY 0.718a 0.745a 0.723a 0.660a
VENTURA 0.634a 0.555a 0.627a 0.510a
EGA GREGORY+VENTURA 0.735a 0.623a 0.656a 0.620a
LANG 0.669a 0.764a 0.698a 0.581a
LINCOLN 0.742a 0.702a 0.687a 0.654a
LINCOLN+LANG 0.614a 0.726a 0.709a 0.629a
LANG 0.669a 0.764a 0.698a 0.581a
LINCOLN 0.742a 0.702a 0.687a 0.654a
SUNSTATE 0.817a 0.701a 0.631a 0.610a
LINCOLN+LANG+SUNSTATE 0.608a 0.716a 0.744a 0.646a
EGA STAMPEDE 0.757a 0.730a 0.666a 0.577a
SUNSTATE 0.817a 0.701a 0.631a 0.610a
SUNSTATE+EGASTAMPEDE 0.697a 0.566a 0.623a 0.639a
EGA STAMPEDE 0.757a 0.730a 0.666a 0.577a
SUNSTATE 0.817a 0.701a 0.631a 0.610a
JANZ 0.727a 0.770a 0.671a 0.620a
SUNSTATE+EGA STAMPEDE+JANZ 0.724a 0.758a 0.684a 0.636a
SPITFIRE 0.722a 0.659a 0.730a 0.561a
SUNTOP 0.613a 0.740a 0.684a 0.628a
SUNTOP+SPITFIRE 0.734a 0.726a 0.736a 0.669a
MEANS 0.701 0.699 0.683 0.616
SED 0.041
Wald statistic
Management 20.2***
Genotype 50.28
Management x Genotype 75.34
Note: *, **, *** indicates significance at P≤0.05, 0.01 and 0.001, respectively. Means followed by the same letter in
columns within each mixture/pure line contrast are not significantly different at P<0.05.
4.4.12 Normalized Difference Vegetation Index at late grain filling
NDVI at late grain filling was significantly influenced by year, management and genotype
(Table 4.22). Significantly higher NDVI was observed in 2014 than 2013. Measurements were also
significantly higher in zero tillage irrigated managements than conventional tillage irrigated

125
managements. However, no significant influences were observed among managements under rainfed
conditions. No significant influence of mixtures over pure stands was observed for NDVI at late grain
filling.
Table 4.22 Combined means and analysis NDVI at late grain filling of Lincoln+Lang and
Sunstate+Stampede mixtures and their pure stands in 2013 and 2014.
Management
Genotype Zero till irrigated Zero till rainfed Conv. till Irrigated Conv. till Rainfed
LANG 0.639a 0.535a 0.549b 0.516a
LINCOLN 0.624a 0.389c 0.571a 0.424b
LINCOLN+LANG 0.637a 0.478b 0.588a 0.436b
EGA STAMPEDE 0.593b 0.456a 0.581b 0.478a
SUNSTATE 0.607a 0.398b 0.624a 0.414b
SUNSTATE+EGA STAMPEDE 0.544c 0.394b 0.618a 0.417b
Mean 0.607 0.442 0.588 0.448
SED 0.017
Wald statistic
Year 9.84***
Management 232.28***
Genotype 19.34***
Year x Management 16.62***
Year x Genotype 1.08
Management x Genotype 39.58
Year x Management x Genotype 28.68
Note: *, **, *** indicates significance at P≤0.05, 0.01 and 0.001, respectively. Means followed by the same letter in
columns within each mixture/pure line contrast are not significantly different at P<0.05.
Similarly, in 2014, NDVI at late the grain filling stage was significantly affected by
management and genotype (Table 4.23). NDVI was significantly higher in zero tillage than
conventional tillage in both rainfed and irrigated conditions. Positive mixing effects were evident in
the Suntop+Spitfire, mixture whilst negative effects were observed in Sunstate+Stampede, EGA
Gregory+Ventura and Lincoln+Lang+Sunstate mixtures.

126
Table 4.23 Means and analysis of NDVI at late grain filling of mixtures versus pure stands in 2014
Management
Genotype
Zero till
Irrigated
Zero till
rainfed
Conv. till
Irrigated
Conv. till
Rainfed
EGA GREGORY 0.644a 0.488a 0.646a 0.378b
VENTURA 0.630a 0.473a 0.579b 0.486a
EGA GREGORY+VENTURA 0.627a 0.462a 0.622ab 0.352b
LANG 0.685a 0.576a 0.538bc 0.517a
LINCOLN 0.692a 0.362c 0.550ac 0.445b
LINCOLN+LANG 0.684a 0.491b 0.601a 0.418b
LANG 0.685a 0.576a 0.538b 0.517a
LINCOLN 0.692a 0.362b 0.550b 0.445b
SUNSTATE 0.673a 0.365b 0.672a 0.398c
LINCOLN+LANG+SUNSTATE 0.570b 0.379b 0.640a 0.387c
EGA STAMPEDE 0.654a 0.511a 0.577b 0.467a
SUNSTATE 0.673a 0.365b 0.672a 0.398b
SUNSTATE+EGA STAMPEDE 0.554b 0.348b 0.684a 0.429a
EGA STAMPEDE 0.654a 0.511a 0.577b 0.467a
SUNSTATE 0.673a 0.365b 0.672a 0.398b
JANZ 0.531b 0.472a 0.507c 0.431ab
SUNSTATE+EGA STAMPEDE+JANZ 0.633a 0.471a 0.551bc 0.429ab
SPITFIRE 0.556c 0.414a 0.627ac 0.347a
SUNTOP 0.635b 0.484a 0.559c 0.355a
SUNTOP+SPITFIRE 0.708a 0.382a 0.653a 0.310a
Means 0.632 0.445 0.60 0.41
SED 0.029
Wald statistic
Management 310.71***
Genotype 22.02*
Management x Genotype 84.86**
Note: *, **, *** indicates significance at P≤0.05, 0.01 and 0.001, respectively. Means followed by the same letter in
columns within each mixture/pure line contrast are not significantly different at P<0.05.
4.4.13 Protein content
Grain protein content was significantly influenced by year, management and genotype. Protein
contents were 6% higher in 2014 than 2013 (Table 4.24). Protein was also significantly higher in
conventional tillage than zero tillage in both rainfed and irrigated managements. No significantly
higher protein content of mixtures over pure stands was observed.

127
Table 4.24 Combined means and analysis of protein content (%) of Lincoln+Lang and
Sunstate+Stampede mixtures and their pure stands in 2013 and 2014
Management
Genotype Zero till Irrigated Zero till rainfed Conv. till Irrigated Conv. till Rainfed
LANG 12.67a 13.22a 13.73a 13.93a
LINCOLN 12.29a 13.01a 13.40a 13.40b
LINCOLN+LANG 12.67a 13.27a 13.18b 13.49b
EGA STAMPEDE 12.43ac 11.95a 13.16b 12.60b
SUNSTATE 12.80a 12.98a 14.26a 13.53a
SUNSTATE+EGA STAMPEDE 12.16bc 12.25b 13.71c 12.79c
Mean 12.5 12.78 13.57 13.29
SED 0.23
Wald statistic
Year 32.88***
Management 39.69***
Genotype 23.01***
Year x Management 51.65
Year x Genotype 4.84
Management x Genotype 13.93
Year x Mangement x Genotype 19.24
Note: *, **, *** indicates significance at P≤0.05, 0.01 and 0.001, respectively. Means followed by the same letter in
columns within each mixture/pure line contrast are not significantly different at P<0.05.
In 2014, protein contents were significantly influenced by genotype and management (Table
4.25). Similarly, protein contents were significantly higher in conventional tillage than zero tillage
management under both irrigated and rainfed conditions. In addition, higher grain protein content was
observed in Suntop+Spitfire than its pure stand components whilst negative mixing effects were
evident in Lincoln+Lang.

128
Table 4.25 Means and analysis of protein content (%) of mixtures versus pure stands in 2014
Management
Genotype
Zero till
Irrigated
Zero till
rainfed
Conv. till
Irrigated
Conv. till
Rainfed
EGA GREGORY 13.05a 14.19a 14.82b 14.71a
VENTURA 12.20b 13.41ab 14.06b 13.92b
EGA GREGORY+VENTURA 12.62ab 13.12b 15.83a 14.88a
LANG 12.10a 13.36a 14.04a 14.79a
LINCOLN 12.06a 13.03a 14.05a 14.36a
LINCOLN+LANG 12.43a 13.40a 13.44a 14.20a
LANG 12.10a 13.36a 14.04b 14.79ab
LINCOLN 12.06a 13.03a 14.05b 14.36b
SUNSTATE 12.73a 13.11a 15.41a 14.43b
LINCOLN+LANG+SUNSTATE 12.50a 13.47a 14.43b 15.50a
EGA STAMPEDE 12.98a 11.26b 14.61b 13.60b
SUNSTATE 12.73ab 13.11a 15.41a 14.43a
SUNSTATE+EGA STAMPEDE 12.08b 11.97b 14.92a 13.62b
EGA STAMPEDE 12.98a 11.26b 14.61b 13.60b
SUNSTATE 12.73a 13.11a 15.41a 14.43a
JANZ 12.75a 13.56a 15.55a 14.65a
SUNSTATE+EGA STAMPEDE+JANZ 12.85a 13.02ab 14.28b 14.90a
SPITFIRE 14.05a 13.64a 14.06b 13.78b
SUNTOP 13.35ab 12.52b 13.94b 13.97b
SUNTOP+SPITFIRE 13.02b 13.67a 15.02a 16.28a
Mean 12.72 13.12 14.56 14.51
SED 0.41
Wald statistic
Management 118.52***
Genotype 28.3**
Management x Genotype 46.17
Note: *, **, *** indicates significance at P≤0.05, 0.01 and 0.001, respectively. Means followed by the same letter in
columns within each mixture/pure line contrast are not significantly different at P<0.05.
4.4.14 Relative water content (RWC)
RWC among the genotypes tested was significantly influenced by year and management (Table
4.26). RWC was higher by 10% in 2013 than 2014. RWC was significantly higher in irrigated
conditions under conventional tillage compared to zero tillage. No significant effects of genotype on
RWC were observed.

129
Table 4.26 Combined means and analysis of RWC (%) of Lincoln+Lang and Sunstate+Stampede
mixtures against their pure stands in 2013 and 2014.
Management
Genotype Zero till Irrigated Zero till rainfed Conv. till Irrigated Conv. till Rainfed
LANG 41.21b 32.98b 49.82a 38.16ac
LINCOLN 45.76a 45.86a 49.30a 35.07bc
LINCOLN+LANG 38.1c 42.79a 50.44a 39.41a
EGA STAMPEDE 45.59a 37.74a 49.15a 35.03b
SUNSTATE 42.14b 39.92a 46.35a 43.01a
SUNSTATE+EGA STAMPEDE 36.28c 34.94b 46.88a 43.30a
Mean 41.51 39.04 48.66 39
SED 1.70
Wald statistic
Year 38.67***
Management 64.53***
Genotype 6.92
Year x Management 27.1***
Year x Genotype 14.43*
Management x Genotype 39.85**
Year x Management x Genotype 35.81**
Note: *, **, *** indicates significance at P≤0.05, 0.01 and 0.001, respectively. Means followed by the same letter in
columns within each mixture/pure line contrast are not significantly different at P<0.05.
The management and genotype significantly influenced RWC in 2014. RWC in conventional
tillage was significantly higher than zero tillage in rainfed managements (Table 4.27). However in
irrigated managements differences were not significant. The Sunstate+Stampede+Janz mixture had
significantly higher RWC than its pure line components whilst effects among the other mixtures were
not significant.

130
Table 4.27 Means and analysis of RWC (%) of mixtures versus pure stands in 2014.
Management
Genotype
Zero till
Irrigated
Zero till
rainfed
Conv. till
Irrigated
Conv. till
Rainfed
EGA GREGORY 40.17b 43.17b 46.25b 40.89ab
VENTURA 43.47b 58.33a 42.58b 44.20a
EGA GREGORY+VENTURA 49.54a 26.18c 71.04a 39.14b
LANG 32.84b 25.85c 45.59a 37.50a
LINCOLN 47.59a 45.19a 37.67b 40.54a
LINCOLN+LANG 34.67b 37.34b 43.95a 30.56b
LANG 32.84c 25.85d 45.59a 37.50a
LINCOLN 47.59a 45.19a 37.67c 40.54a
SUNSTATE 42.60b 37.82b 42.69ab 43.33a
LINCOLN+LANG+SUNSTATE 44.74a 31.35c 40.47bc 40.59a
EGA STAMPEDE 44.83a 34.64b 42.76a 34.66b
SUNSTATE 42.60a 37.82a 42.69a 43.33a
SUNSTATE+EGA STAMPEDE 40.96a 33.35c 36.49b 42.45a
EGA STAMPEDE 44.83b 34.64bc 42.76a 34.66b
SUNSTATE 42.6b 37.82b 42.69a 43.33a
JANZ 35.07c 30.68c 36.45b 35.39b
SUNSTATE+EGA STAMPEDE+JANZ 51.46a 44.08a 39.98ab 38.43ab
SPITFIRE 49.84a 45.43a 50.86a 49.80a
SUNTOP 43.28b 40.56a 45.02b 42.32b
SUNTOP+SPITFIRE 50.36a 35.35b 37.36c 39.97b
Mean 43.43 37.95 43.94 39.98
SED 2.56
Wald statistic
Management 16.71***
Genotype 72.14***
Management x Genotype 32.54**
Note: *, **, *** indicates significance at P≤0.05, 0.01 and 0.001, respectively. Means followed by the same letter in
columns within each mixture/pure line contrast are not significantly different at P<0.05.
4.4.15 Thousand Kernel Weight (g)
TKW was significantly influenced year, management and genotype (Table 4.28). TKW were
significantly higher by approximately 6% in 2013 than 2014. TKW was also significantly higher in
zero tillage irrigated managements than conventional tillage managements. However, no difference

131
between managements was observed under rainfed conditions. There was no significant advantage of
mixtures over their pure line components for TKW observed.
Table 4.28 Combined means and analysis of thousand kernel weights (g) of Lincoln+Lang and
Sunstate+Stampede mixtures and their pure stands in 2013 and 2014.
Management
Genotype Zero till Irrigated Zero till rainfed Conv. till Irrigated Conv. till Rainfed
LANG 31.85b 29.34b 31.19b 27.34b
LINCOLN 37.31a 33.27a 33.83a 32.08a
LINCOLN+LANG 33.53b 32.36a 33.72a 31.47a
EGA STAMPEDE 33.88a 33.31a 33.30a 32.67a
SUNSTATE 34.48a 31.85b 32.28a 32.30a
SUNSTATE+STAMPEDE 30.91b 31.22b 32.49a 32.15a
Mean 33.66 31.89 32.8 31.34
SED 0.72
Wald statistic
Year 20.28***
Management 18.01***
Genotype 40.53***
Year x Management 27.47***
Year x Genotype 24.01***
Management x Genotype 17.82
Year x Management x Genotype 12.14
Note: *, **, *** indicates significance at P≤0.05, 0.01 and 0.001, respectively. Means followed by the same letter in
columns within each mixture/pure line contrast are not significantly different at P<0.05.
In 2014, genotype and management significantly influenced TKW (Table 4.29). TKW was
significantly higher in zero tillage conditions in both irrigated and rainfed managements. Mixtures did
not significantly improve TKW over the pure line components.

132
Table 4.29 Means and analysis of thousand kernel weights (g) of mixtures versus pure stands in 2014
Management
Genotype
Zero till
Irrigated
Zero till
rainfed
Conv. till
Irrigated
Conv. till
Rainfed
VENTURA 33.80a 32.40a 31.00ac 32.40a
EGA GREGORY 32.13a 30.25ab 31.70a 28.20b
EGA GREGORY+VENTURA 30.60a 28.50b 29.20bc 22.10c
LANG 30.80b 29.80b 29.30a 27.20b
LINCOLN 34.20a 35.20a 31.40a 31.10a
LINCOLN+LANG 31.30b 31.70b 30.50a 27.80b
LANG 30.80b 29.80b 29.30ab 27.20b
LINCOLN 34.20a 35.20a 31.40a 31.10a
SUNSTATE 32.70ab 31.60b 28.80b 30.50a
LINCOLN+LANG+SUNSTATE 31.50b 30.00b 30.30ab 29.70a
EGA STAMPEDE 33.20a 36.60a 33.30a 32.40a
SUNSTATE 32.70a 31.60b 28.80b 30.50a
SUNSTATE+EGA STAMPEDE 30.10b 32.20c 33.00a 31.10a
EGA STAMPEDE 33.20a 36.6a 33.30a 32.40a
SUNSTATE 32.70a 31.6b 28.80b 30.50ab
JANZ 31.30a 29.9b 26.30c 28.30b
SUNSTATE+EGA STAMPEDE+JANZ 32.60a 31.7b 29.90b 31.60a
SUNTOP 31.00b 35.10a 29.90b 32.80b
SPITFIRE 34.40a 35.00a 33.90a 34.30a
SUNTOP+SPITFIRE 34.00a 34.00a 32.90a 33.90a
Mean 32.3 32.3 30.8 30.2
SED 1.21
Wald statistic
Management 16.71***
Genotype 72.14***
Management x Genotype 32.54
Note: *, **, *** indicates significance at P≤0.05, 0.01 and 0.001, respectively. Means followed by the same letter in
columns within each mixture/pure line contrast are not significantly different at P<0.05.
4.4.16 Biomass(kg ha-1
)
Biomass was significantly influenced by year, management, genotype, year x management and year x
genotype interaction (Table 4.30). The year effect on total biomass obtained across years could be
driven by the in the higher amount and distribution of rainfall in 2014.

133
Table 4.30 Combined means and analysis of biomass (kg ha-1
) of Lincoln+Lang and
Sunstate+Stampede mixtures and their pure stands in 2013 and 2014.
Management
Genotype Zero till Irrigated Zero till Rainfed Conv. till Irrigated Conv. till Rainfed
LANG 9405a 8459a 8554b 8564a
LINCOLN 10307a 8274a 7976b 8295a
LINCOLN+LANG 9962a 7979a 9696a 7674a
EGA STAMPEDE 9317b 7564a 9065a 8317a
SUNSTATE 9329b 7946a 8073a 7800a
SUNSTATE+STAMPEDE 9938a 7762a 8323a 7436a
Mean 9709 7997 8614 8014
SED 663.8
Wald statistic
Year 1455***
Management 167.5***
Genotype 95.1***
Year x Management 144.8***
Year x Genotype 52.5***
Management x Genotype 66.9
Year x Management x
Genotype 68.6
Note: *, **, *** indicates significance at P≤0.05, 0.01 and 0.001, respectively. Means followed by the same letter in
columns within each mixture/pure line contrast are not significantly different at P<0.05.
Biomass was up to 21% higher under irrigation in the combined data across 2013 and 14. Biomass was also
significantly higher (12%) in zero tillage than conventional tillage under irrigation. However, no differences in
management were observed under rainfed conditions. The mixtures Sunstate+Stampede under zero-till irrigated
conditions and Lincoln+Lang under conventional tillage irrigated conditions produced significantly more
biomass than their pure line components.
However, when mixtures grown in 2014 were compared similar differences in biomass were noted between
irrigated and rainfed managements (Table 4.31). The irrigated treatments produced on average 20% higher
biomass. Zero-tillage was 14% higher than conventional tillage under rainfed conditions and no difference was
observed under irrigation. The three-way mixtures Sunstate+Stampede+Janz and Lincoln+Lang+Sunstate
produced significantly higher biomass than their pure stands under irrigation in zero-tillage and conventional
tillage, respectively.

134
Table 4.31 Means and analysis of biomass (kg ha-1
) of mixtures versus pure stands in 2014
Management
Genotype
Zero till
Irrigated
Zero till
Rainfed
Conv. till
Irrigated
Conv. till
Rainfed
VENTURA 10653a 9552a 8377a 7971a
EGA GREGORY 11928a 10148a 9574a 7843a
EGA GREGORY+VENTURA 11875a 10446a 9898a 7880a
LINCOLN 11872a 10031a 8348b 10225a
LANG 12536a 11000a 10472a 10216a
LINCOLN+LANG 12205a 9391a 11757a 7820b
SUNSTATE 11501a 9497a 9097a 8876a
EGA STAMPEDE 11694a 9834a 11180a 9453a
SUNSTATE+EGA STAMPEDE 12980a 10153a 10304a 8459a
SUNSTATE 11501b 9497a 9097b 8876a
EGA STAMPEDE 11694b 9834a 11180a 9453a
JANZ 10645b 10971a 10362a 7717a
SUNSTATE+EGA STAMPEDE+JANZ 13907a 10211a 9423a 9588a
LINCOLN 11872a 10031a 8348b 10225a
LANG 12536a 11000a 9072b 10216a
SUNSTATE 11501a 9497a 9097b 8876a
LINCOLN+LANG+SUNSTATE 11002a 9204a 11018a 8438a
SPITFIRE 11075a 10205a 10472a 8710a
SUNTOP 12082a 9190a 10314a 8478a
SUNTOP+SPITFIRE 11876a 8819a 9705a 8832a
Mean 11855 9910 9859.75 8700
SED 10034
Wald statistic
Management 211.3***
Genotype 43.4**
Management x Genotype 75
Note: *, **, *** indicates significance at P≤0.05, 0.01 and 0.001, respectively. Means followed by the same letter in
columns within each mixture/pure line contrast are not significantly different at P<0.05.
4.4.17 Grain yield (kg ha-1
)
Grain yield was significantly influenced by year, management and genotype (Table 4.32).
Average yields ranged from 2845kg/ha under conventional tillage rainfed managements to 3811 kg/ha
in zero tillage irrigated managements. Yields were 317kg/ha higher under zero tillage in rainfed
managements and 649kg/ha higher in irrigated conditions. Positive mixing effects on grain yield were

135
observed in Sunstate+Stampede and Lincoln+Lang mixtures in zero tillage irrigated and conventional
tillage irrigated managements, respectively.
Table 4.32 Combined means and analysis of grain yield (kg/ha) of Lincoln+Lang and
Sunstate+Stampede mixtures and their pure stand in 2013 and 2014
Management
Genotype Zero till Irrigated Zero till rainfed Conv. till Irrigated Conv. till Rainfed
LANG 3579b 3157a 3134b 2811a
LINCOLN 4138a 3241a 3073b 2891a
LINCOLN+LANG 3962c 3147a 3579a 2810a
EGA STAMPEDE 3846a 3283a 3485a 2930a
SUNSTATE 3459b 3142ac 3221b 2658b
SUNSTATE+EGA STAMPEDE 3880a 3000bc 3261b 2970a
Mean 3811 3162 3292 2845
SED 88.19
Wald statistic
Year 146.11***
Environment 187.07***
Genotype 15.65**
Year x Environment 77.95**
Year x Genotype 8.53
Environment x Genotype 24.34
Year x Environment x Genotype 8.52
Note: *, **, *** indicates significance at P≤0.05, 0.01 and 0.001, respectively. Means followed by the same letter in
columns within each mixture/pure line contrast are not significantly different at P<0.05.
In 2014, yield was similarly influenced by management and genotype (Table 4.33). Yield
ranged from 3093 kg/ha in the conventional tillage rainfed management to 4405.9 kg/ha in zero tillage
irrigated conditions. Genotype yield ranged from 3450 kg/ha in EGA Gregory to 3979 kg/ha in the
Sunstate+Stampede mixture. Significant positive mixing effects on grain yield were observed only in
the Lincoln+Lang mixture. However, positive but non-significant mixing effects were also observed in
Sunstate+Stampede+Janz, Sunstate+Stampede and Suntop+Spitfire mixtures.

136
Table 4.33 Means and analysis of grain yield (kg ha-1
) of mixtures versus pure stands in 2014
Management
Genotype
Zero till
Irrigated
Zero till
rainfed
Conv. till
Irrigated
Conv. till
Rainfed
EGA GREGORY 4303a 3520a 3252a 2726b
VENTURA 3749b 3528a 3558a 3078a
EGA GREGORY+VENTURA 4104a 3500a 3390a 2967ab
LANG 4160b 3570a 3442b 2842a
LINCOLN 4794a 3769a 3266b 3124a
LINCOLN+LANG 4731a 3733a 4123a 2994a
LANG 4160b 3570a 3442ab 2842a
LINCOLN 4794a 3769a 3266b 3124a
SUNSTATE 4044b 3643a 3752a 3104a
LINCOLN+LANG+SUNSTATE 4226b 3374a 3613a 2938a
EGA STAMPEDE 4615a 4099a 3861a 3277ab
SUNSTATE 4044b 3643b 3752a 3104b
SUNSTATE+EGA STAMPEDE 4703a 3884ab 3885a 3442a
EGA STAMPEDE 4615ab 4099a 3861a 3277a
SUNSTATE 4044c 3643b 3752a 3104a
JANZ 4443b 3824ab 3051b 3230a
SUNSTATE+EGA STAMPEDE+JANZ 4856a 3918ab 3594a 3280a
SPITFIRE 4267a 3610b 3635a 3009a
SUNTOP 4513a 4161a 3527a 3138a
SUNTOP+SPITFIRE 4581a 3605b 3676a 3246a
Mean 4405.9 3715.9 3575 3093
SED 160.7
Wald statistic
Management 256.32***
Genotype 37.84**
Management x Genotype 33.21
Note: *, **, *** indicates significance at P≤0.05, 0.01 and 0.001, respectively. Means followed by the same letter in
columns within each mixture/pure line contrast are not significantly different at P<0.05.
4.5 Discussion
The effectiveness of varietal mixtures, relative to traditional gene pyramiding, in reducing the
impacts of abiotic stress through more efficient resource use has been reviewed (Adu-Gyamfi et al.
2015). In the current study, the performance of varietal mixtures in four contrasting managements
based on varying tillage practice and moisture level was evaluated. Significant differences in the

137
performance of mixtures in the different managements were observed and mixtures outperformed their
component lines for some traits in some managements.
In this study, mixtures were constructed based on complementary genomic regions or markers
linked to yield in rainfed multi-management trials identified in an earlier association study A major
assumption was that the marker effects estimated in the earlier study were real and not false positives.
Not all mixtures produced a positive result indicating that the components of any mixture must be
carefully selected and tested before deployment. In addition, the four managements represented in this
study may not have been the most appropriate to elicit a mixture response. Nevertheless, the
Sunstate+Stampede, Sunstate+Stampede+Janz and Suntop+Spitfire mixtures were observed to increase
yield in conventional-tillage rainfed and zero tillage irrigated managements whilst the Lincoln+Lang
mixture increased yield in the conventional tillage irrigated management (Tables 4.30 and 4.31). This
observation supports earlier findings (Marshall and Brown 1973; Fang et al. 2014a). These authors
observed increased yield in mixtures particularly under moderate drought. The performance of the
Sunstate+Stampede, Sunstate+Stampede+Janz and Suntop+Spitfire mixtures supports the notion that
mixtures buffer yield under moisture stress (Finckh et al. 2000; Kiær et al. 2012). However, while
yield advantages of mixtures have been reported, some authors also found negative mixing effects
(Treder et al. 2008; Lithourgidis et al. 2011). In the current study, the EGA Gregory+Ventura,
Suntop+Spitfire and Lincoln+Lang+Sunstate mixtures appeared to show a negative response
compared their component lines under drought stress in zero tillage supporting the notion that mixtures
can have both positive and negative responses.
In the current study, it was evident that some mixture yields could be increased by adding more
components. For example, the yield of the 3-way mixture Sunstate+Stampede+Janz increased when
tested in the 2014 cropping season under zero tillage. Others made similar observations when mixtures
of more than two components were developed (Stuke and Fehrmann 1987; Newton et al. 1997; Kiær et
al. 2009). Nitzsche and Hesselbach (1983) reported yield increases in barley when the number of
components of mixtures were increased from two to six. Smithson and Lenne (1996) also claimed that
the yield stability of field crops increased with increasing numbers of component mixtures in about
50% of the data sets they examined. While a positive yield response to mixing was observed in some
instances, it was heavily influenced by management. Thousand kernel weights were not significantly
positively influenced by mixing, rather a negative mixing effect was observed in EGA
Gregory+Ventura across all managements.

138
The increased biomass production of Lincoln+Lang+Sunstate mixtures compared to
component lines under rainfed conditions is also likely a function of increased tiller production
resulting from interplant competition among mixture components. Similarly, the positive mixing
effects on plant height obtained from EGA Gregory+Ventura could also result from competition for
light and other resources. The significant mixing effects on protein content in the Suntop+Spifire
mixture suggests more efficient utilization of soil nitrogen. The relatively significant mixing effects on
relative water content observed in the Sunstate+Stampede+Janz mixture indicates a possible
synergistic interaction of the root systems allowing deeper penetration of the soil profile to access
moisture. The higher NDVI observed in Suntop+Spitfire at late grain filling suggests that early
establishment resulted in the development of larger photosynthetic biomass; a prerequisite for light
capture for photosynthesis, and earlier ground cover thus avoiding soil moisture loss and eventually
producing higher yield.
Early heading is a plant drought avoidance strategy. However, in the current study the mixtures
were intermediate for grain filling duration, maturity and heading date compared to their pure stands.
Mixing effects therefore appeared to have little impact on the phenology of the different components
and this is not surprising as similar plant height and maturity were considerations, along with
complementary markers linked to yield, when forming the mixtures. Canopy temperature is an
integrative trait that can be used to select superior genotypes or segregating bulks and is positively
correlated with yield and root depth (Reynolds and Trethowan 2007; Trethowan and Reynolds 2007).
However, little difference was noted among mixtures and component lines for this trait in the current
study. This is somewhat surprising as differences in correlated traits such as yield and biomass were
observed. However, at Narrabri there was no correlation between canopy temperature and yield (r = -
0.02) which likely explains the lack of significance for this trait.
4.6 Conclusions & Implications for breeding
The positive mixing effects observed in Sunstate+Stampede, Sunstate+Stampede+Janz ,
Suntop+Spitfire and Lincoln+Lang mixtures in some managements suggests that intra-component
competition for resources, both above and below ground, induced a positive effect on yield. Mixtures
may offer a competitive advantage over pure line components through (i) development of larger
photosynthetic biomass (NDVI) through rapid early ground cover that increases light interception and
reduces soil moisture loss through evaporation, and (ii) higher biomass and improved plant water

139
status through deeper roots accessing water deeper in soil profiles resulting in improved relative water
content. It could be concluded from these results that mixtures offer a buffering effect against moisture
stress; however, the mixtures tested varied in their adaptability to specific managements. Thus the
performance of mixtures in a particular management may not produce a corresponding effect in a
different management. It is therefore imperative to design mixtures comprised of components that
match defined ecologies.

140
5 Validation of genetic association mapping I
5.1 Introduction
Association mapping could be an improvement over traditional linkage mapping as it is based
on the correlation of genotypes with phenotypes in germplasm collections or natural populations
(Neumann et al. 2011c). It assumes that linkage disequilibrium (LD) is maintained over many
generations between loci which are genetically linked to one another. and could be utilized to identify
markers with significant allelic frequencies (Ochieng et al. 2007).
Genetic association analysis has proved to be effective in identifying loci for traits with low
heritability, particularly yield and its components (Breseghello and Sorrells 2006a; Neumann et al.
2011c) and has been applied successfully in crops such as maize (Buckler et al. 2009; Liu et al. 2011),
wheat (Reif et al. 2011; Kulwal et al. 2012; Kollers et al. 2013), barley (Wang et al. 2012; Berger et al.
2013; Zhou and Steffenson 2013) and sugar beet (Stich et al. 2008; Würschum et al. 2011) to detect
genomic regions linked to agronomically important traits. Crossa et al. (2007a) conducted the first
genome-wide association mapping study in wheat using DArt technology (www.diversityarrays.com. ;
Shewry 2009) on historical multilocational wheat yield and disease resistance data and reported many
marker-trait associations.
Despite a growing number of published association studies, much less attention has been given
to the validation of these regions in plant breeding; either through recombination or the effectiveness
of marker trait associations in other genetic backgrounds (Price et al. 2002c; Holland 2007; Yue et al.
2008). The simplest validation of genomic regions is to test their effectiveness in other populations
(Langridge et al. 2001).
This study utilized the results of an earlier genetic association study (Atta 2013) based on
DArTs which identified significant marker trait associations for grain yield in an Australian wheat
breeding program. The study evaluated different genotypes over a range of locations and across
different years and identified both confirmed and unique genomic regions linked to yield.

141
The earlier genetic association analysis revealed:
(i) Seventeen significant marker traits associations (MTAs) with grain yield observed on
chromosome 1BS, 16 on 2BS, 5BL and 6BS, 15 on 3BL, 14 on 3BS, 4AL and 4BS, 12 on 1BL, 2BL,
6AL and 7BL and 11 on 5BS and 7DS across 27 multi-environment trial locations. However, no
significant associations with grain yield across the 27 tested locations were found on chromosomes
2DS, 3AS, 4DS, 5DS and 7BS.
(ii) The MTAs for grain yield were scattered over the whole wheat genome with the maximum
number identified on the B genome (specifically 1B, 2B, 3B and 6B), whereas only a single marker
each was found on 4D and 5D which is consistent with Crossa et al. (2007) who also reported few
significant markers on both of these chromosomes.
(iii) Several MTA blocks were identified for grain yield including 53 markers covering 61.7-86.5
cM on 2BS, 43 markers covering 2.8-40.5 cM on 1BS, 7 markers covering 0.0-10.7 cM on 2AS; 24
markers covering 95.8-114.0 cM in 2DL whilst 17 markers covering 20.3-29.8 cM were found on 3BS.
Similar observations were made on other chromosomes with the exception of 4D and 5D.
In this study, we hypothesize that the previously mapped genomic regions will be detected and
effective in the same materials when sown in head-to-head yield trials at the same location across two
years. The previous study was highly unbalanced and examined subsets of materials tested across
several years in multi-environment trials. This study aimed to validate the significant marker trait
associations identified earlier in the same environment in two different cropping seasons.
5.2 Materials and methods
5.2.1 Germplasm
The wheat genotypes evaluated were the same as those tested in the earlier multi-environment
genetic association analysis (Atta 2013). The earlier study focused on commercial breeding program
germplasm based on the premise that genomic regions associated with key traits would be of relevance
to the Narrabri based wheat breeding program. A total of 215 genotypes were evaluated for yield and
other traits in 2014 and 2015. These genotypes are listed in Appendix II. The experiments were
conducted at the IA Watson Grains Research Centre during the 2014 and 2015 cropping seasons. Each
experiment was sown following field pea (Pisium sativum) in the previous season.

142
5.2.2 Phenotypic data and analysis
The traits studied included grain yield, thousand kernel weight, days to heading and days to
physiological maturity. The trials were arranged in randomized complete block designs with 2
replications. The procedures and methods used to capture physiological data are described in Chapter
3. A standard fertilizer treatment, mainly Urea 100 kg ha-1
and DAP 50 kg ha-1
was applied at sowing
to enhance plant establishment, vigour and robustness. Experiments were harvested at maturity with a
combine harvester and grain yield was recorded and expressed as kg ha-1
. GenStat statistical software,
version 14.1 (Payne RW 2011), was used to analyze data obtained from both the 2014 and 2015
cropping seasons using REML. Year and genotype were considered fixed effects and range/row
coordinates within years as random effects.
Significant effects among genotype means were separated by the Fisher's protected least
significant difference test at P < 0.05.
5.2.3 Molecular data
This study utilized the molecular data generated from the same genotypes in the earlier genetic
association studies of Atta (2013). These were DArT (Diversity™ Arrays Technology) markers.
Details of DArT technology can be found at (www.diversityarrays.com.). In summary, DArT are
biallelic dominant markers. The markers were scored as 0, 1 and –, where “0” indicates absent, “1”
present and “–” missing data. In the earlier study 2199 markers were applied on 215 wheat genotypes.
Of these, 364 markers were not associated with any chromosome and were hence discarded from all
subsequent analyses.
5.3 Statistical analysis
The trials were arranged as randomised complete block designs with two replications in each
year. These were analysed using a linear mixed model in the REML function of Genstat (v 14.1) where
years and genotypes were considered fixed effects and rows and columns within years as random
effects. The pattern and association analyses were carried out on genotype means using R version
2.13.1 (Team 2014) and the following R package ‘gclus’ (Hurley and Hurley 2012), ‘rpart’ (Therneau
et al. 2010) 2012), ‘maptree’ (White 2009) and ‘sparcl’ (Witten and Tibshirani).
Pattern analysis, the combined use of clustering and ordination techniques, was then used to
derive separate structures for genotypes based on phenotypic and marker data. Principal coordinate
analysis based on spectral decomposition was used for ordination (Gower 1966, 1967) and the method
of (Ward 1963) was used as the clustering strategy for hierarchical clustering. Optimized dendrograms

143
(Arief et al. 2017) were generated following Gruvaeus and Wainer (1972), where adjacent entities in
the dendrograms were considered the most similar. Clustering was also used to group locations
(environment structure) based on phenotypic data.
A two way table of genotypes (as rows) x traits (as columns) was prepared and columns (traits)
standardized prior to calculating the squared Euclidean distances among the genotypes. Principal
coordinate analysis was conducted on the complementary similarity measure to standardize squared
Euclidean distance (SED) and the results were presented using biplots with symmetrical scaling
(Gabriel 1971). Hence the phenotypic data was presented as; (a) optimized dendrograms based on SED
as the dissimilarity measure and Ward’s method as the clustering strategy, (b) biplots for the 1st and
2nd principal components obtained from principal coordinate analysis using the complementary
similarity of the SED, and (c) biplots for the 1st and 3rd principal components. Different colours
indicate genotypes that are allocated to the same group.
The molecular marker data was presented as; (a) optimized dendrograms based on the
complementary dissimilarity of the Czekanowski method as the dissimilarity measure and Ward’s
method as the clustering strategy, (b) scatter plots of the 1st and 2nd principal components obtained
from principal coordinate analysis using the Czekanowski similarity and (c) scatter plots of the 1st and
3rd principal components. The different colours indicate genotypes that are allocated to the same
group.
An association analysis of DArT markers and traits was then performed. These analyses
included the complete dataset using population structure for genotypes and individual analyses within
each environmental group. However, in the interest of brevity and to maintain sufficient scale, the
association analysis of the complete data set is elaborated here. Association analysis was conducted
following Bansal et al. (2010). For each marker a t-test was conducted to check if the absence or
presence of that marker significantly affected the phenotypic performance of the genotypes. The
probability (P) of the differentiation among marker classes (i.e. absent and present) was converted into
a log score (i.e. –log10P). A log score of three was used as a threshold to declare an association
significant. The marker was considered to be positively associated with the trait if presence of the
marker contributed to better phenotypic performance and vice versa for negative associations. The
gametic phase disequilibrium was evaluated using the two most commonly used measures D’
(Lewontin 1964) and r2
(Hill and Robertson 1968). The Linkage disequilibrium (LD) parameter r2
was

144
estimated for loci on the same chromosome and plotted against genetic distance measured in
centimorgans.
The chromosome arms were determined following Crossa et al. (2007a) and the significant
markers were then assigned to the specific chromosome arms. Where the chromosome arms were not
identified in the cited literature but the distance was given in centimorgans for the reported
genes/markers the arms were assigned following Crossa et al. (2007). Chromosome maps were drawn
with MapChart 2.2 (Voorrips 2002).
5.4 Results
Gametic phase disequilibrium existed among the 1835 markers within the population and the
LD (r2) estimated for loci on the same chromosome and plotted against genetic distance revealed that
LD decreased with genetic distance between marker loci (Figure 5.1).
5.4.1 Analysis of phenotypic data
The genotypes clustered into two main groups on the basis of yield, days to heading, days to
maturity and thousand kernel weights. The first group comprised genotypes which were low yielding
with lower thousand kernel weight and longer days to maturity, whilst the other group consisted of
higher yielding lines with higher thousand kernel weight and shorter days to heading and maturity. The
first group was related to the cultivar Cook whilst the other group was comprised of non-Cook types.
Phenotypic data were summarized in dendrograms (Figure 5.2a). While the genotype groups varied
significantly on the basis of yield, thousand kernel weight (TKW), days to heading and maturity, no
main effect of year on yield was observed (Appendix chapter 5). However, the number of days to
heading and maturity were approximately 3 days longer in 2014 than 2015. The year x genotype
interaction effects were significant for yield and crosses SUNCO/2*PASTOR//SUN436E,
SUN500B/Carinya, and UN421T/SUN399C.22.3 were the top 3 outstanding genotypes in 2014 whilst
CHARA/SUN434A, RAC1192/Ventura and LPB05-1164 were the top 3 genotypes in 2015. The first
three principal components of the phenotypic data including yield, days to heading and days to
maturity explained 45.6% of the total variation (Figure 5.2b). Yield in both years was similar as was
the size of the GEI. Days to heading and maturity appeared to be unassociated with yield based on the
PC1 versus PC2 biplot. The PC1/PC3 biplot indicated that TKW assessed in 2015 was negatively
associated with days to maturity.

145
Figure 5.1 Linkage disequilibrium heat map of the genome of the wheat genotypes tested

146
a)

147
(b)
Figure 5.2 Pattern analysis of grain yield, number of days to heading (DH)/maturity (DM), and thousand kernel weights (TKW) of
genotypes tested in 2014 and 2015 at Narrabri. (a) Optimized dendrograms (b) Biplots of 1st, 2nd and 3rd principal components. The blue
and red colours indicate genotypes that are allocated to the same group.

148
5.4.2 Analysis of molecular data
Two primary groups of genotypes were observed at the molecular level. The first three
principal components of the ordination explained 29.5% of the total variation based on marker data
(Figure 5.3a). Both the pattern analysis and the ordination analysis allocated genotypes into two main
groups (Figures 5.3a and b). Group one was dominated by Cook based materials (a key progenitor of
most northern Australian prime hard wheat cultivars) such as Sunco, Sunvex Sunvale, Sun431 and
Lang whilst the second group consisted of materials with non-Cook backgrounds such as Crusader,
Merinder, Livingston and EGA Gregory (Figure 5.3b).

149
a)

150
(b)
Figure 5.3 Combined pattern analysis of genotypes tested in 2014 and 2015 at Narrabri using marker data. (a) Optimized dendrograms (b)
A plot of 1st , 2nd, and 3rd principal components. The blue and red colours indicate genotypes belonging to the same group.
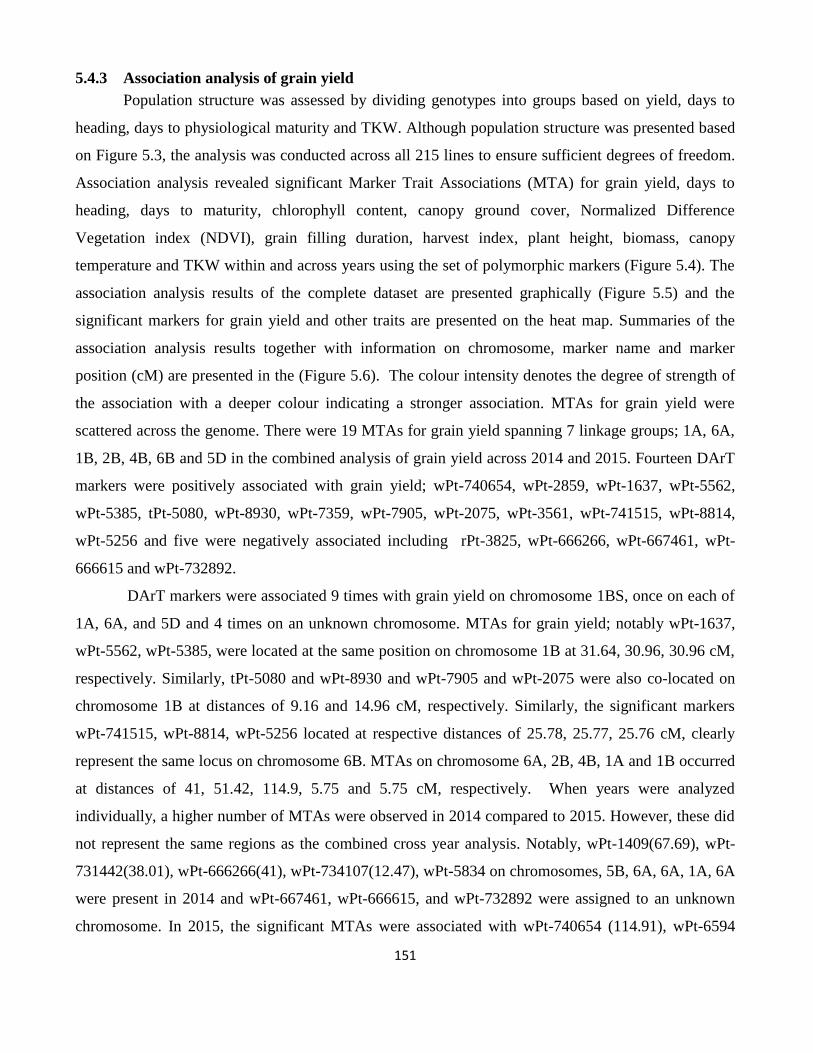
151
5.4.3 Association analysis of grain yield
Population structure was assessed by dividing genotypes into groups based on yield, days to
heading, days to physiological maturity and TKW. Although population structure was presented based
on Figure 5.3, the analysis was conducted across all 215 lines to ensure sufficient degrees of freedom.
Association analysis revealed significant Marker Trait Associations (MTA) for grain yield, days to
heading, days to maturity, chlorophyll content, canopy ground cover, Normalized Difference
Vegetation index (NDVI), grain filling duration, harvest index, plant height, biomass, canopy
temperature and TKW within and across years using the set of polymorphic markers (Figure 5.4). The
association analysis results of the complete dataset are presented graphically (Figure 5.5) and the
significant markers for grain yield and other traits are presented on the heat map. Summaries of the
association analysis results together with information on chromosome, marker name and marker
position (cM) are presented in the (Figure 5.6). The colour intensity denotes the degree of strength of
the association with a deeper colour indicating a stronger association. MTAs for grain yield were
scattered across the genome. There were 19 MTAs for grain yield spanning 7 linkage groups; 1A, 6A,
1B, 2B, 4B, 6B and 5D in the combined analysis of grain yield across 2014 and 2015. Fourteen DArT
markers were positively associated with grain yield; wPt-740654, wPt-2859, wPt-1637, wPt-5562,
wPt-5385, tPt-5080, wPt-8930, wPt-7359, wPt-7905, wPt-2075, wPt-3561, wPt-741515, wPt-8814,
wPt-5256 and five were negatively associated including rPt-3825, wPt-666266, wPt-667461, wPt-
666615 and wPt-732892.
DArT markers were associated 9 times with grain yield on chromosome 1BS, once on each of
1A, 6A, and 5D and 4 times on an unknown chromosome. MTAs for grain yield; notably wPt-1637,
wPt-5562, wPt-5385, were located at the same position on chromosome 1B at 31.64, 30.96, 30.96 cM,
respectively. Similarly, tPt-5080 and wPt-8930 and wPt-7905 and wPt-2075 were also co-located on
chromosome 1B at distances of 9.16 and 14.96 cM, respectively. Similarly, the significant markers
wPt-741515, wPt-8814, wPt-5256 located at respective distances of 25.78, 25.77, 25.76 cM, clearly
represent the same locus on chromosome 6B. MTAs on chromosome 6A, 2B, 4B, 1A and 1B occurred
at distances of 41, 51.42, 114.9, 5.75 and 5.75 cM, respectively. When years were analyzed
individually, a higher number of MTAs were observed in 2014 compared to 2015. However, these did
not represent the same regions as the combined cross year analysis. Notably, wPt-1409(67.69), wPt-
731442(38.01), wPt-666266(41), wPt-734107(12.47), wPt-5834 on chromosomes, 5B, 6A, 6A, 1A, 6A
were present in 2014 and wPt-667461, wPt-666615, and wPt-732892 were assigned to an unknown
chromosome. In 2015, the significant MTAs were associated with wPt-740654 (114.91), wPt-6594

152
(14.94) and rPt-3825 (77.5) on chromosomes 4B, 6B and 5D, respectively and wPt-669388 was
assigned to an unidentified chromosome. These results indicate a strong genotype x year interaction as
significant markers in one year are not necessarily associated in the following year. These associations
may also of course be artefactual and this will be discussed in the next section. Only two significant
MTAs for TKW were observed; wPt-0751 located on chromosome 3B and tPt-2920 on an unknown
chromosome.
Several significant MTAs were identified for days to heading and days to maturity. Two
hundred and fifty-three markers were associated with days to heading; of these 54 were positively
associated (linked to later heading) whilst the remaining were negatively associated (linked to earlier
heading). The highest number of markers found on chromosomes 3B, 5B and 7B. MTAs for days to
heading were located across the genome with 2 noted on chromosome 1A, 22 on 1B, 3 on 1D, 2 on 2A
and 2D, 8 on 2B, 3 on 3A, 44 on 3B, 13 on 3D, one on 4A and 5D, 10 on 4B, 32 on 5B, 11 on 6A, 16
on 6B, 10 on 7A, 32 on 7B and 7 on 7D. The majority of these markers assigned to chromosomes
tended to co-locate at the same region.
In contrast, 507 MTAs for days to physiological maturity were detected. One hundred and seven of
these were positive (associated with longer maturity) whilst the rest associated negatively (shorter
maturity) with a larger proportion of the markers occurring on chromosomes 1B, 6B and 7B. Ten
MTAs were found on 1A and 7D, 8 on 2A and 3A, 14 on 4B and 7A, 35 on 1B, 17 on 1D, 89 on 2B,
70 on 3B, 19 on 3D, 24 on 4A, 5 on 2D, one 4D, 33 on 5B, 3 on 5D, 13 on 6A, and 34 on 6B and 7B.
Clusters of markers were observed in MTAs for grain maturity and clusters were observed at 2.7, 51,
132, 158, 175, 176, 209 and 225.59 cM respectively. Many markers assigned to chromosomes co-
located for days to maturity.
.

153
Figure 5.4 Polymorphic and non-polymophic markers/regions across genotypes tested in 2014 and
2015. The blue colour indicates polymorphic regions whilst the brown represents non-polymorphic
regions.

154
Figure 5.5 Marker trait associations for grain yield (YLD), thousand kernel weigh t(TKW), days to
heading (DH), and days to physiological maturity (DPM) based on data from 2014 and 2015. Negative
associations are shown in red and positive associations are shown in blue. Increasing colour intensity
shows the strength (-log10 probability) of association (Arief 2010).

155
5.5 Discussion
The identification and selection of functional or linked markers assists the development of
superior drought tolerant/high yielding varieties. This study evaluated 215 wheat cultivars, previously
tested in unbalanced multi-environment trials, head-to-head in a single location over 2 years for grain
yield, to identify and confirm marker trait associations conferring high yield in rainfed environments.
In addition, traits possibly linked to yield mainly; heading time, maturity time and TKW which were
not measured in the earlier association analysis were assessed. These genotypes had never been
evaluated head-to-head and the two year trial at Narrabri attempted to confirm the earlier associations
(Atta, 2013). The relationships among the genotypes tested were generated by pattern analysis utilizing
both phenotypic and marker data which produced two primary groups giving rise to population
structure. While Arief (2010) emphasized that avoiding population structure is crucial for avoiding
spurious associations in gene discovery, the relatively small number of genotypes (215) and even
smaller sub-groups made individual analyses difficult to interpret. Hence the analysis of the full set is
presented as was the case in the earlier study by (Atta 2013). In the earlier Atta (2013) association
study, 1835 high throughput Diversity Arrays Technology (DArT) markers were polymorphic in the
germplasm evaluated. Among these, 1402 were identified on the final map, with 473, 650 and 279
markers located on genomes A, B and D, respectively. The significant markers on the various
chromosomes ranged from 1 each on 4D and 5D to 152 on 3B.
In the current study, genome wide association analysis was conducted utilizing combined
phenotypic data from the 2014 and 2015 cropping seasons and the same DArT marker data used by
(Atta 2013). The MTAs detected in this analysis (Figure 5.6) were then compared to the results of the
(Atta 2013) analysis of unbalanced multi-environment trial data (Table 5.1).
5.5.1 Association analysis of grain yield
The current study found 19 DArT markers (representing 1% of all markers) to be significantly
associated with grain yield. Of these, 68.4% were located on the B genome, 10.5% on the A genome
and 0.1% on the D genome. Nine of the 19 markers were also reported by Atta (2013) (Table 5.1).
This result was consistent with most studies using DArT or micro-satellite markers (Crossa et al.
2007a; Edae et al. 2014). Since this time SNP technology has improved the coverage of the D-genome
(Tiwari et al. 2014; Wang et al. 2015) and higher numbers of associations would now be expected.

156
Chromosomes 1A, 1B and 1D
The current study observed only a single marker wPt-2859 at a distance of 5.75cM to be
associated with grain yield on chromosome 1A. This marker was also identified in the earlier
association analysis conducted by (Atta 2013). Comparatively, the previous Atta (2013) study found
many markers associated with grain yield in addition to wPt 2859 (5.75cM) and this MTA coincided
with QTLs reported by (Carter et al. 2011) and (Fang 2011). This marker is also 4.25cM distant from a
QTL QY ld.wak-1A (between Xgdm33 and Xpsp2999) previously identified for grain yield (Carter et
al. 2011). A number of markers (wPt-2859, wPt-1637, wPt-5562, wPt-5385, tPt-5080, wPt-8930, wPt-
7359, wPt-7905, wPt-2075) were associated with grain yield on chromosome 1B in the current study
and these coincided with markers linked to grain yield reported by Atta (2013), with the exception of
wPt-7905, wPt-2075 and wPt-2859, which appeared to cluster at the same locus at a distance of 14.96
cM on chromosome 1B. A QTL within the same region on 1B for grain yield QTL Q.Gy.ui-1B.2 was
previously reported (Zhang et al. 2014b). Others reported grain yield and harvest index MTAs in the
same region on the short-arm of chromosome 1B at 21.6 cM. (Edae et al. 2014).
Chromosomes 2A, 2B and 2D
The Atta (2013) association analysis identified MTAs on 2B at multiple locations,
including those at a distance (cM) of 6.19 (tPt.1663 and wPt.8918), 14.59 (wPt.3949), 51.42
(wPt.3561), 74.64, 81.34, 89.18 (cluster of markers) and 119.17 (wPt.1454). However, in the current
study only one significant MTA located on chromosome 2B (markers wPt-3561at a distance of 51.42)
was confirmed. No MTAs were found on chromosomes 2A and 2D. The MTA on 2B that coincided
with the Atta (2013) study is new and previously unreported. However, the chromosome 4B MTA was
previously reported to be associated with grain yield.
Chromosomes 3A, 3B and 3D
The earlier study conducted by Atta (2013) found a significant marker trait association on
chromosome 3B and 3D which was confirmed by other researchers (Kuchel et al. 2007; Maccaferri et
al. 2008b; KunPu et al. 2009). However, no MTAs were found in the current study on any group 3
chromosomes.

157
Chromosome 4A, 4B and 4D
No MTAs were found on chromosomes 4A and 4D. However, a marker (wPt-740654 at 114.9
cM) found on chromosome 4B was previously reported as associated with grain yield (Marza et al.
2006; Crossa et al. 2007a; Neumann et al. 2011a).
Chromosomes 5A, 5B and 5D
In the current analysis an MTA was found on chromosome 5D (wPt-3825 at 77.5cM) that was
associated with grain yield. In the Atta (2013) analysis, a number of MTAs were identified yet none
coincided with the current study. There is no published evidence of previous MTAs in this region on
5D; therefore wPt-3825 appears to be a new MTA.
Chromosome 6A, 6B and 6D
In the current study the chromosome 6B markers wPt- wPt-741515, wPt- 8814 and wPt-
5256 at distances of 25.78, 25.78, 25.78 cM, respectively, were associated with grain yield. These
markers are located in the same location and therefore represent the same MTA. This region on 6B
was also reported in the (Atta 2013) analysis. In addition, a single MTA for grain yield reported by
Atta (2013) was confirmed on chromosome 6A with marker wPt-666266 (41cM). Sukumaran et al.
(2015a) also found a loci on chromosome 6A that was associated with grain yield and maturity. This
chromosome 6A locus, located in the same region as the current study, was associated with grain yield
under drought, heat and irrigated conditions (Edae et al. 2013; Lopes et al. 2015a). No MTAs were
found on chromosome 6D.
Chromosome 7A, 7B and 7D
The earlier Atta study identified new MTAs on chromosome 7A, 7B and 7D. However, in the
current study no significant MTAs were found on any of these group 7 chromosomes.

158
Table 5.1 Summaries of number of detected marker trait associations in the current and earlier
association analysis for grain yield, number of days to heading, number of days to physiological
maturity and thousand kernel weight.
Trait
No. of MTA's detected
in the current study
No. of MTA's detected in
the earlier Atta (2013)
association study
No. of MTA's
detected in both
studies
Grain yield 19 192 9
TKW 2 Not assessed -
No. of days to heading. 228 Not assessed -
No. of days to maturity 414 Not assessed -
5.5.2 Association analysis of thousand kernel weight (TKW)
Two MTAs for TKW were identified in the current study; one on chromosome 3B (wPt-0751)
at 129.2cM and the other (tPt-2920) on an unknown chromosome. This trait was not assessed in the
earlier association analysis conducted by (Atta 2013). However, Huang et al. (2004) identified a QTL
on chromosome 3B for TKW at a distance of 21cM and Li et al (2015) reported QTKW.caas-3B on the
same chromosome, however no coincidences were observed with the current analysis. Other reported
QTLs that influence TKW include QTKW.caas-4B and QTKW.caas-5B.1 (Li et al. 2015). However,
none of these were found in the current study. It is possible that wPt-0751 at 129.2cM on chromosome
3B is a new MTA.
5.5.3 Association analysis of heading time
Heading date (HD) is one of the pivotal traits regulating adaptation of bread wheat (Triticum
aestivum L.) to diverse climatic environments and earliness adaption has often been emphasized as an
escape strategy to avoid drought and heat stress (Debaeke 2004). The previous Atta (2013) study did
not determine MTAs for heading. In the current study, MTAs for earliness to heading were distributed
throughout the whole genome. This observation supports the findings of (Griffiths et al. 2009) who
indicated that QTLs for flowering are scattered over the whole wheat genome. However, a larger
proportion of the MTAs were found on chromosomes 1B, 3B, 5B, 7B. This observation is consistent
with earlier reports ((Zanke et al. (2014)). Blocks of markers on 7B between 200.72 - 218.05 cM and
associated with days to heading were identified. Kamran et al. (2013) reported 3 QTLs (QEps.dms-
1B1 and QEps.dms-1B2, QEps.dms-5B) regulating earliness per se and flowering time on
chromosomes 1B, 5B and 4A, respectively. In the current study, seven clusters of markers associated

159
with heading time were observed: three clusters at 56.53, 125.15, 136.87 cM on chromosome 1B and
one cluster each on 3D, 6A, 6B and 7B at 151.80, 107.78, 14.25 and 219.79 cM, respectively. The
QTL (QEps.dms-1B1) found on chromosome 1B mapped at 31.8cM and was located in the same
region as MTAs found in the current analysis linked to markers, wPt-2597, wPt-3819, wPt-5899, wPt-
8682, and wPt-1684, wPt-1684 at distances of 29.4, 29.4, 30.9, 28, 6 and 34.6 cM respectively. The
QTL QEps.dms-5B on chromosome 5B directly coincided with an MTA at wPt-6135 and mapped at
76.1 cM. Earliness per se genes have also been found on chromosomes 1A and 3A (Gawroński and
Schnurbusch 2012). Many of the identified MTAs coincided with regions already reported (Griffiths et
al. 2009). However, new and previously unreported MTAs were found on chromosome 7B at 219.9 (a
marker cluster), on chromosome 4B between 4.29 and 68.08 cM and on chromosome 6A between
86.48 and 108.986 cM.
5.5.4 Association analysis of maturity time
Several markers associated with grain maturity have been reported on chromosomes 2B, 3B,
4B, 4D and 6A (Pinto et al. 2010; Kamran et al. 2013). In the current analysis 12 major clusters of
markers associated with maturity were found on chromosomes 1A, 2B, 3B, 3D, 4B, 6B and 7D.
However, a number of markers (wPt-5906, wPt-8096, wPt-11400, wPt-3107, wPt-11278) located
between 81.17 and 83.02 cM on 3B co-located with a previously reported QTL for grain maturity
identified by the SNP marker Kukri_rep_c112440_422 (Sukumaran et al. 2015b). On chromosome 4D
the previously reported SNP marker wsnp_Ex_rep_c107564_91144523 was only 2.5cM distant from
the significant markers wPt-5809 and wPt-3058 in the current association analysis (Sukumaran et al.
2015a). In addition, on chromosome 4B the markers wPt-6209, wPt 6016 wPt,7412 and wPt 8905 at
68.88, 68.78, 77.88, 77.88cM co-located with the SNP marker BS00034371_51 reported by (Kamran
et al. 2013). On chromosome 6A wPt-1695, wPt- 4925, wPt-5550 were only 10cM distant from the
reported SNP BobWhite_c30930_192 associated with maturity (Sukumaran et al. 2015b). New
previously unreported MTAs were found on chromosome 4B between 4.29 and 68.08cM. Several
other unreported MTAs were identified including wPt-2923 and wPt-8164 at 160.155 and 166.42cM
respectively on 3D; wPt-1400 and wPt-5505 both at 85.34 cM on chromosome 5D and a cluster of
markers between 170.56 and 174.18 cM on 7D.
Higher grain yield is associated with dwarfing genes and shorter stature (Trethowan et al.
2005a), however Rht8 and Rht-2 were not detected in this study whereas the MTA found on 4BS

160
likely explains the presence of the Rht-1 gene. The significance of photoperiod insensitivity (Ppd),
vernalization (Vrn) and earliness per se (Eps) genes on grain yield have also been recognized and
MTAs reported (Crossa et al. 2007b).
5.6 Conclusion
The discovery and validation of markers linked to grain yield, thousand grain weight, number
of days to heading and number of days to maturity in hexaploid wheat is a first step to better
understanding of the genetic mechanisms regulating yield and adaptation. Association analysis based
on multi-environment trial data conducted earlier by Atta (2013) identified several MTAs across the
wheat genome for high grain yield. Some of these markers were confirmed in the current association
analysis including regions on chromosomes 1A, 1B, 2B, 4B and 6B. Others previously unreported
included the markers wPt-7905, wPt-2075, wPt-2859 and wPt-3825, however, these MTAs need to be
confirmed. Several MTAs were found for heading time scattered across the whole genome; many of
these confirm previously reported associations on chromosomes 1BS, 2BS, 2BL, 3B and, 7DL (Wang
et al. 2009; Ain et al. 2015). In general, the MTAs for grain yield that confirm the Atta (2013) study
are potentially useful for wheat breeding. However, the new MTAs identified in the current study will
likewise require confirmation before their utility can assessed.

161
wPt-2859(YLD)5.8
wPt-734027(DPM)14.8
wPt-666723(DPM)wPt-666723(DHD)
26.2
wPt-667172(DHD)35.9
wPt-8016(DPM)125.4wPt-1786(DPM)135.3wPt-664593(DPM)wPt-664703(DPM)
135.5
wPt-5160(DPM)wPt-6005(DPM)wPt-7147(DPM)
135.6
wPt-732616(DPM)136.0
1A
wPt-1782(DPM) wPt-1782(DHD)wPt-4497(DHD)
0.0
wPt-741297(DPM) wPt-8320(DPM)wPt-8320(DHD)
4.8
wPt-1560(DPM) wPt-1560(DHD)5.3wPt-744437(DPM)7.3tPt-5080(YLD) wPt-8930(YLD)9.2wPt-7359(YLD)11.2wPt-3465(DPM)14.3wPt-2230(DPM) wPt-9639(DPM)14.6wPt-2859(YLD) wPt-7905(YLD)wPt-2075(YLD)
15.0
wPt-4343(DPM) wPt-5740(DPM)17.3wPt-8240(DPM) wPt-8240(DHD)22.4wPt-8682(DPM) wPt-8682(DHD)28.7wPt-3819(DHD) wPt-2597(DHD)29.5wPt-5899(DPM) wPt-5899(DHD)30.9wPt-5562(YLD) wPt-5385(YLD)31.0wPt-1637(YLD)31.6wPt-1684(DHD)34.7wPt-6012(DPM) wPt-6012(DHD)34.8wPt-3266(DPM) wPt-3266(DHD)35.7wPt-9973(DPM) wPt-9973(DHD)38.6wPt-668027(DPM) wPt-668027(DHD)40.3wPt-8168(DPM) wPt-8168(DHD)41.1wPt-1573(DPM) wPt-1573(DHD)42.4wPt-2389(DPM) wPt-2389(DHD)43.0wPt-3451(DPM) wPt-3451(DHD)45.6wPt-2315(DPM) wPt-2315(DHD)57.2rPt-7906(DPM)65.8wPt-7160(DPM) wPt-7160(DHD)73.5wPt-1403(DPM) wPt-1403(DHD)75.7wPt-7066(DPM) wPt-7066(DHD)76.5
wPt-5034(DPM) wPt-5061(DPM)83.8
wPt-2526(DPM)88.3wPt-5281(DPM)91.5rPt-2940(DPM)93.2wPt-664593(DPM) wPt-664703(DPM)95.9
wPt-1786(DPM)111.2
1B
Figure 5.6 Map of significant DArT markers associated with grain yield (YLD), number of days to
heading (DHD), number of days to physiological maturity (DPM) and thousand kernel weight (TKW)
in the current association analysis.

162
wPt-3855(DPM) wPt-666719(DPM)wPt-667287(DPM) wPt-5915(DHD)
0.0
wPt-4497(DHD)21.4
wPt-4497(DHD)83.1wPt-8866(DHD)84.7
1D
wPt-6361(DHD)69.6
wPt-665330(DHD)70.9
2A
Figure 1 continued

163
wPt-2568(DHD) wPt-3995(DHD)0.0tPt-1663(DHD) tPt-1663(DPM)wPt-8918(DPM)
6.2
wPt-1813(DHD) wPt-1813(DPM)22.1tPt-4627(DPM)29.3wPt-5556(DPM)51.4wPt-6199(DPM)60.6wPt-4125(DPM)61.7wPt-5672(DPM) wPt-7757(DPM)wPt-1992(DPM)
63.2
wPt-1992(DHD) wPt-1127(DPM)70.1wPt-2907(DPM) wPt-5287(DPM)wPt-7747(DPM)
74.6
wPt-7747(DHD) wPt-2327(DPM)76.1wPt-9350(DPM)76.2wPt-4889(DPM)76.6wPt-2249(DPM)76.9wPt-3569(DPM) wPt-6576(DPM)wPt-741721(DPM)
79.1
wPt-1882(DPM)80.5wPt-733929(DPM) rPt-3823(DPM)80.6rPt-5747(DPM) tPt-5296(DPM)wPt-2082(DPM) wPt-2832(DPM)wPt-3906(DPM) wPt-6144(DPM)wPt-6321(DPM) wPt-731385(DPM)wPt-733161(DPM) wPt-734147(DPM)wPt-742618(DPM) wPt-744324(DPM)wPt-7512(DPM) wPt-7990(DPM)wPt-2854(DPM)
81.3
wPt-5440(DPM) wPt-2120(DPM)wPt-8077(DPM) wPt-5044(DPM)
82.1
wPt-3109(DPM)84.9tPt-5897(DPM)85.9wPt-2528(DPM) wPt-3023(DPM)wPt-8693(DPM) wPt-9812(DPM)wPt-665645(DPM)
89.2
wPt-9257(DPM)89.7wPt-5128(DPM)90.8wPt-667945(DPM)96.6wPt-7004(DPM)101.6wPt-9190(DHD) wPt-7004(DHD)wPt-666931(DPM)
101.7
wPt-7161(DPM)102.1wPt-3632(DPM)105.1wPt-4426(DPM) wPt-1454(DPM)116.7wPt-4368(DPM)119.2wPt-3561(YLD)125.4
2B
wPt-3692(DPM) wPt-666518(DPM)70.9
wPt-667584(DPM) wPt-731148(DPM)wPt-666518(DHD) wPt-3692(DHD)
114.1
2D
Figure 1 continued

164
wPt-6012(DPM) wPt-6012(DPM)0.0
wPt-6012(DHD)34.8wPt-743723(DPM)35.1
wPt-10311(DPM)50.5
wPt-9422(DPM)166.7
wPt-1036(DPM)190.2wPt-1036(DHD)190.6wPt-5476(DHD) wPt-5476(DPM)206.9wPt-6234(DPM)210.1wPt-8741(DPM)211.7
3A
Figure 1 continued

165
wPt-1162(DPM)12.0wPt-742222(DPM) wPt-3609(DPM)16.2wPt-3761(DPM) wPt-3921(DPM)wPt-666738(DPM) tPt-9267(DPM)
17.1
wPt-1081(DPM) wPt-10311(DPM)19.0wPt-2045(DPM)24.6wPt-6211(DPM) wPt-6718(DPM)wPt-734244(DPM) wPt-7668(DPM)wPt-798970(DPM) wPt-2757(DPM)wPt-800213(DPM) wPt-743847(DPM)wPt-10585(DPM) wPt-7132(DPM)
24.9
wPt-6239(DPM)25.1wPt-10130(DPM)25.4wPt-1159(DPM)26.7tPt-1366(DPM)27.6wPt-5105(DPM)29.8wPt-6945(DPM)33.8
wPt-7015(DPM) wPt-9170(DPM)47.7wPt-10196(DPM)49.0wPt-11295(DPM)52.7wPt-4608(DPM) wPt-6047(DPM)wPt-11218(DPM) wPt-3078(DPM)
53.2
wPt-9443(DPM) wPt-4364(DPM)wPt-731910(DPM) wPt-10546(DPM)wPt-6785(DPM) wPt-5769(DPM)wPt-664981(DPM) wPt-672088(DPM)wPt-732501(DPM)
56.5
wPt-2119(DPM)57.8wPt-731500(DPM) wPt-5295(DPM)58.4wPt-10349(DPM) wPt-3342(DPM)63.2
3B [1]
wPt-6856(DPM) wPt-8959(DPM)wPt-3760(DPM)
65.2
wPt-2685(DPM)67.6wPt-1834(DPM)68.6
wPt-7514(DPM)70.8
wPt-742982(DPM)79.0
wPt-3165(DPM)85.9wPt-1311(DPM) wPt-10407(DPM)86.1wPt-0751(TKW) wPt-742222(DHD)wPt-3761(DHD) wPt-666738(DHD)
87.3
wPt-6211(DHD)97.5
wPt-7668(DHD)117.6wPt-734244(DHD) wPt-6802(DHD)120.8wPt-0672(DHD)122.1wPt-0371(DHD) wPt-1159(DHD)122.9wPt-10130(DHD) wPt-6945(DHD)wPt-7015(DHD)
123.3
wPt-9170(DHD)123.6wPt-5105(DHD) wPt-6047(DHD)wPt-0695(DHD) wPt-5769(DHD)wPt-672088(DHD) wPt-664981(DHD)wPt-667746(DHD) wPt-2119(DHD)
125.2
wPt-5261(DHD) wPt-731500(DHD)wPt-0401(DHD)
126.8
wPt-5295(DHD) rPt-0996(DHD)127.0
3B [2]
wPt-8959(DHD) wPt-3342(DHD)wPt-10349(DHD) wPt-6856(DHD)
130.8
wPt-0668(DHD) wPt-3760(DHD)131.4wPt-2685(DHD)132.9wPt-7514(DHD)135.5wPt-1834(DHD) wPt-742982(DHD)wPt-7956(DHD) wPt-8352(DHD)wPt-8396(DHD) wPt-0995(DHD)
136.9
wPt-10407(DHD)139.9
3B [3]
Figure 1 continued

166
wPt-3815(DPM)11.0
wPt-7535(DHD) wPt-9389(DHD)150.1wPt-665320(DPM) wPt-665392(DPM)wPt-665570(DPM) wPt-666115(DPM)wPt-666659(DPM) wPt-671598(DPM)wPt-730421(DPM) wPt-730995(DPM)wPt-731402(DPM) wPt-732466(DPM)wPt-730421(DHD) wPt-665320(DHD)wPt-744794(DHD) wPt-666907(DHD)wPt-671603(DHD) wPt-6107(DHD)wPt-668020(DHD)
151.8
wPt-731144(DHD)153.9wPt-2923(DPM) wPt-667368(DHD)wPt-669412(DHD) wPt-666955(DHD)
160.2
wPt-8164(DPM)166.4
3D
wPt-2788(DPM)22.2
wPt-7939(DPM)50.3
wPt-730387(DPM) wPt-800147(DPM)62.1wPt-800509(DPM)62.7wPt-7924(DPM)62.9wPt-5951(DPM)64.3tPt-9400(DPM)64.6wPt-2903(DPM)68.1
wPt-3449(DPM)83.1
wPt-2951(DPM)96.9wPt-744256(DPM) wPt-8967(DPM)99.8wPt-5172(DPM)101.6wPt-3845(DPM)104.6wPt-4680(DPM)106.2wPt-7919(DPM)106.9wPt-730387(DHD)108.4
4A
Figure 1 continued

167
wPt-1931(DPM) wPt-1931(DHD)4.3
wPt-3439(DPM) wPt-6869(DPM)wPt-6869(DHD) wPt-3439(DHD)
15.5
wPt-5559(DPM) wPt-734310(DPM)wPt-5559(DHD)
16.6
wPt-4607(DPM) wPt-667593(DPM)wPt-8650(DPM) wPt-4607(DHD)wPt-8650(DHD)
22.6
wPt-7569(DPM) wPt-7569(DHD)63.2wPt-7062(DPM) wPt-9067(DPM)wPt-9067(DHD) wPt-7062(DHD)
68.1
wPt-6209(DPM) wPt-733038(DPM)68.8
wPt-740654(YLD)114.9
4B
rPt-3825(YLD)77.5
wPt-1400(DPM) wPt-5505(DPM)85.3
5D
Figure 1 continued

168
wPt-741630(DPM) wPt-9205(DPM)3.2
wPt-4681(DPM)21.0wPt-665036(DPM)21.1wPt-9113(DPM) wPt-734068(DPM)22.8wPt-667618(DPM)28.4
wPt-7063(DPM)41.0wPt-734140(DPM)41.8wPt-666494(DPM)43.2
wPt-667607(DPM) wPt-3247(DPM)wPt-4145(DPM)
86.5
wPt-666266(YLD) wPt-741630(DHD)94.9wPt-734140(DHD) wPt-8954(DHD)wPt-666494(DHD)
104.1
wPt-9976(DHD) wPt-667607(DHD)wPt-4229(DHD) wPt-9474(DHD)wPt-8124(DHD) wPt-3247(DHD)
107.8
wPt-732328(DHD)109.0
6A
tPt-2055(DPM)4.7wPt-6293(DPM)5.5wPt-5971(DPM)9.2wPt-7711(DPM)11.8wPt-4564(DPM) wPt-3526(DPM)12.8wPt-4142(DPM) wPt-665017(DPM)wPt-6667(DPM) wPt-745074(DPM)wPt-6594(DPM) wPt-4900(DPM)wPt-4930(DPM) wPt-665036(DPM)wPt-8721(DPM) wPt-729979(DPM)
14.3
wPt-2000(DPM) wPt-6160(DPM)14.9wPt-8560(DPM) wPt-2424(DPM)wPt-9231(DPM) wPt-3168(DPM)wPt-743099(DPM)
15.9
tPt-8161(DPM) wPt-5211(DPM)wPt-6208(DPM)
25.8
wPt-4164(DPM)38.5wPt-6116(DPM)50.6wPt-9952(DPM)51.9wPt-8059(DPM) wPt-4662(DPM)wPt-741515(YLD)
54.3
wPt-8814(YLD)58.1wPt-5256(YLD)61.3wPt-2095(DHD)65.7wPt-1437(DHD) wPt-8059(DHD)wPt-4164(DHD)
65.8
wPt-0406(DHD)66.0wPt-9952(DHD) wPt-6116(DHD)111.9wPt-4142(DHD) wPt-4564(DHD)113.3wPt-6594(DHD) wPt-4930(DHD)113.9wPt-745074(DHD) wPt-6667(DHD)wPt-665017(DHD)
117.2
wPt-3526(DHD)127.9wPt-0137(DHD)134.5
6B
Figure 1 continued

169
wPt-1931(DPM)4.3wPt-1179(DPM)10.8wPt-8473(DPM)13.6wPt-3992(DPM) wPt-7299(DPM)13.7
wPt-3782(DPM) wPt-2316(DPM)wPt-7947(DPM)
56.5
wPt-2501(DPM) wPt-1931(DHD)85.9wPt-8473(DHD)87.1wPt-7015(DHD)90.0
wPt-9170(DHD)125.1
wPt-5105(DHD)150.7wPt-3992(DHD)158.4wPt-0205(DHD)164.5wPt-3226(DHD)168.7
wPt-7108(DHD)179.9
wPt-1179(DHD)217.4
7A
wPt-4230(DPM) wPt-4863(DPM)15.5wPt-2737(DPM)38.8wPt-1853(DPM)67.6wPt-4025(DPM)106.8wPt-2305(DPM) wPt-4600(DPM)134.5wPt-4814(DPM)136.6wPt-4038(DPM)137.6wPt-3190(DPM)144.3wPt-5462(DPM)146.4wPt-7108(DPM) wPt-8387(DPM)149.9wPt-2592(DPM) wPt-2449(DPM)wPt-733669(DPM) tPt-3700(DPM)
200.7
wPt-2878(DPM) wPt-6320(DPM)211.0wPt-7251(DPM) wPt-6869(DPM)wPt-800156(DPM)
212.6
wPt-3439(DPM)213.1wPt-9813(DPM)214.2wPt-0318(DHD) wPt-7108(DHD)214.8wPt-0137(DHD) wPt-3439(DHD)wPt-6869(DHD) wPt-0695(DHD)
217.4
wPt-7318(DHD)217.5wPt-2305(DHD) wPt-4600(DHD)218.1wPt-4814(DHD)219.4wPt-4038(DHD)219.7wPt-3190(DHD) wPt-3004(DHD)219.8wPt-744987(DHD) wPt-0600(DHD)wPt-5462(DHD) wPt-8387(DHD)
220.0
wPt-2449(DHD) wPt-0504(DHD)wPt-0884(DHD) wPt-733669(DHD)tPt-3700(DHD)
224.0
wPt-2878(DHD)227.6wPt-6320(DHD) wPt-7251(DHD)228.5wPt-800156(DHD)234.8
7B
Figure 1 continued

170
wPt-1100(DPM) wPt-2592(DPM)wPt-3328(DPM) wPt-3923(DPM)
37.3
wPt-4315(DPM) wPt-664384(DPM)wPt-731810(DPM) wPt-7842(DPM)wPt-8343(DPM)
170.6
wPt-8422(DPM)170.8wPt-664384(DHD) wPt-1100(DHD)172.0wPt-3328(DHD)174.2
7D
Figure 1 continued

171
6 Validation of association genetic mapping II
6.1 Introduction
Wheat yield gains have reduced in recent years due to varying climatic and precipitations
patterns (Olesen et al. 2011). To facilitate the development of varieties adapted to varying climatic
conditions, positive alleles conferring high-yield under changing conditions must be identified in
current elite germplasm, as well as in new genetic pools (Lopes et al. 2015b).
Risch and Merikangas (1996) suggest that association mapping or genome-wide association
analysis (GWAS) may be a suitable complementary approach to bi-parental populations for identifying
genetic markers associated with traits of interest. An extensive study of marker-trait associations
(MTAs) in bread wheat has enabled the identification of MTAs for a large number of traits including
yield under moisture stress (Atta 2013), high molecular weight (HMW) glutenins (Ravel et al.2006),
milling quality, seed size/seed and shape (Breseghello and Sorrells 2006b), Stago-nospora nodorum
blotch resistance (Tommasini et al. 2007) and resistance against stem, leaf, and stripe rust (Crossa et
al. 2007a). However, more complex traits such as tolerance to drought and salinity have limited
application to marker assisted selection programs (Gupta et al. 2008).
A significant number of genomic regions/QTLs associated with drought response in wheat
have been reported (Kirigwi et al. 2007; Yang et al. 2007a; Rebetzke et al. 2008c; McIntyre et al.
2010b); (Rebetzke et al. 2013b); (Rebetzke et al. 2008a); (Diab et al. 2008a). However, few genomic
regions/QTLs have been targeted to improve breeding because of the following factors (i) lack of
validation in different genetic backgrounds and environments (Price et al. 2002c; Yue et al. 2008), (ii)
significant QTL x QTL interaction, (iii) significant QTL x genetic background interaction, (iv) QTL x
environment interaction, and (v) the degree of linkage between markers and associated QTL (Gupta et
al. 2010a).
Although it has been difficult to identify consistent genetic markers associated with yield under
stress environments (particularly drought) in either wheat or maize (MacCaferri et al. 2011; Dodig et
al. 2012; Lu et al. 2012), the validity and usefulness of these regions, and their applicability to wheat
breeding needs to be verified (Bentley et al. 2014). In this study, the hypothesis that hybridization of
advanced wheat lines carrying complementary genomic regions identified from an earlier genetic
association analysis (Atta 2013) and confirmed in a subsequent head-to-head cross-year comparisons
of the same lines (see Chapter 5) would accumulate positive alleles in the recombinants that

172
outperform their parents. This chapter aimed to confirm the yield expression of these selected genomic
regions/markers when pyramided in a single genotype.
6.2 Materials and Methods
6.2.1 Plant Material
The experiments were conducted at the Plant Breeding Institute, Cobbitty and the IA Watson
Grains Research Centre, Narrabri during the 2015 cropping season. The study evaluated 10 wheat
advance lines which included PBI 1, PBI 100, PBI 273, PBI 10, PBI 11, PBI 151, PBI 45, PBI 94, PBI
98 and PBI 299. These lines carried the highest numbers of positive markers based on the earlier
association analysis carried out by Atta (2013). The pedigree and description of each line is listed in
Table 6.1. The genetic similarity of these 10 parents based on the DArT genotype profiles ranged from
0.96 (for PBI-273 and PBI-151) to 0.45 (PBI-11 and PBI-45) (Table 6.2).
6.2.2 Development of materials carrying pyramided markers
Hybridization were carried out on the basis of the Atta (2013) associations in the green house
to produce F1 populations mainly: (a) PBI-100 x PBI-273 (b) PB1-11 x PBI-10 (c) PBI-100 x PBI-
11(d) PBI-11 x PBI-10, (e) PBI-11 x PBI-10 (f) PBI-151 x PB1-45 and (g) PBI-100 x PBI-11
combinations(Table 6.3). The ensuing F1 populations were then top crossed with lines PBI-299, PBI-
45, PBI-94, PBI-1 PBI-273 and PBI-98 respectively, in the green house to produce six top cross F2
populations. Each F2 top cross consisted of 30 to 100 plants which were then multiplied to produce F3
progeny for evaluation. The list of targeted DArT markers for each parent from the Atta (2013)
analysis is given in Table 6.5 However, subsequent association analysis of the same materials in head-
to-head comparisons in 2014 and 2015 confirmed Marker Trait Associations on chromosomes 1A, 1B,
2B, 4B and 6B (Table 6.4). These confirmed MTAs subsequently became the targets for validation in
the derived topcross progeny.

173
Table 6.1 List of genotypes hybridized to produce top cross progenies and their corresponding
numbers of positive markers detected in the earlier association analysis conducted by Atta 2013.
Genotype Pedigree No. of positive markers
PBI-1 Crusader 49
PBI-10 EGA Stampede 43
PBI-11 Sunstate 40
PBI-45 SUN344 E/VPMB36020 42
PBI-94 SUN434A/SUN436E.116.4 42
PBI-98 EGA Bonnie Rock/SUN436F 41
PBI-100 CHARA/B409C//SUN498E 47
PBI-151 SUN344 E/Ventura 50
PBI-273 WA-1-21005/2*SUN426B 52
PBI- 299 SUN445C/QT10776 43
Table 6.2 Similarity matrix of the 10 parents in Table 6.1 based on DArT marker profiles.
PBI-1 PBI-10 PBI-11 PBI-45 PBI-94 PBI-98 PBI-100 PBI-151 PBI-273 PBI-299
PBI-1 -
PBI-10 0.77 -
PBI-11 0.71 0.64 -
PBI-45 0.75 0.61 0.45 -
PBI-94 0.75 0.71 0.59 0.56 -
PBI-98 0.76 0.86 0.63 0.67 0.74 -
PBI-100 0.89 0.75 0.62 0.78 0.69 0.75 -
PBI-151 0.91 0.86 0.77 0.63 0.79 0.84 0.81 -
PBI-273 0.91 0.82 0.77 0.65 0.79 0.82 0.84 0.96 -
PBI-299 0.86 0.73 0.54 0.78 0.64 0.68 0.88 0.72 0.72 -

174
Table 6.3 List of hybridizations made to generate F1 and F2 top cross populations.
No.
F1 Population
F2(Top Crosses) Population
1 PBI-100 X PBI-273 (PBI-100 X PBI-273) X PBI 299
2 PB1-11 X PBI-10 (PB1-11 X PBI-10) X PBI-45
3 PBI-100 X PBI-11 (PBI-100 X PBI-11) X PBI-94
4 PBI-11 X PBI-10 (PBI-11 X PBI-10) X PBI-1
5 PBI-151 X PB1-45 (PBI-151 X PB1-45) X PBI-273
6 PBI-100 X PBI-11 (PBI-100 X PBI-11) X PB1-98
Table 6.4 List of significant DArT markers associated with higher grain yield under moisture stress
identified from the Chapter 5 head-to-head association analysis.
Marker Name Chromosome Position (cM)
wPt-2859 1A 5.75
tPt-5080 1B 9.16
wPt-8930 1B 9.16
wPt-7359 1B 11.2
wPt-2859 1B 14.96
wPt-7905 1B 14.96
wPt-2075 1B 14.96
wPt-5562 1B 30.96
wPt-5385 1B 30.96
wPt-1637 1B 31.64
wPt-3561 2B 51.42
wPt-4930 6B 15.41
wPt-740654 4B 114.9
wPt-741515 6B 25.79
wPt-1637 6B 15.41
wPt-5256 6B 25.79
wPt-6594 6B 14.94
rPt-3825 5D 77.5
wPt-666266 6A 41
.

175
6.2.3 DNA extraction and genotyping of F2 topcross progeny
DNA was extracted from each seedling top cross F2 progeny prior to multiplication utilizing a
modified CTAB method Doyle JJ (1990). This is described below:
(a) Four fresh leaves of 2cm length were collected from each two week old seedling (top cross F2)
and put in the 20 ml labelled tubes containing silica gel to dry and preserve the leaf samples for
transportation.
(b) Upon drying, leaves were transferred into 2ml tubes containing two stainless steel beads. The
material was grounded into a fine powder in a mixer mill (MM300 Retsch, Haan, Germany) for
two minutes at 20 rpm. Beads were removed and 800-900 μl of warmed CTAB buffer was
added to each tube and mixed thoroughly.
(c) Grounded samples were incubated at 65 O
C for 40 minutes with intermittent gentle swirling
(every 10 minutes). Samples are allowed to cool down at room temperature and 600 μl of
Chloroform: phenol (24:1 v:v) was added and mixed by gently inversion for about 2 minutes
until the two layers homogenized.
(d) Samples were centrifuged at 3600 rpm at room temperature for 20 minutes and the aqueous
phase transferred to a clean tube 1.5 ml and 700 μl of cold isopropanol added and gently mixed
to precipitate the nucleic acids. Tubes were kept at -20 0C for 20 minutes and then centrifuged
at 10,000 rpm for 10 minutes. The supernatant was removed and DNA was dried until
isopropanol evaporated.
(e) DNA obtained was washed with 500 μl of CTAB buffer and centrifuged at 7000 rpm for 10
minutes to remove the wash buffer.
(f) Sample tubes were kept open overnight in an upright position to allow the buffer if any to
evaporate. Then 100 μl of TE (pH-8) with RNAase (1 μl per 100 μl ofTE) was added and the
samples maintained at 37O
C in oven for 1-2 hours.
(g) The DNA quantification (NanoDrop® ND-1000 Spectrophotometer, NanoDrop Technologies
Inc., USA) was to assess DNA purity at an absorbance of 260nm and 280nm using 2 μl of
DNA sample. A ratio of 1.8 was accepted as pure.
The DNA plates were sent to the Diversity™ Arrays Technology (DArT™) Pty Ltd, ACT2600,
Australia for genotyping (www.diversityarrays.com). Target DArt markers in chromosomal regions
linked to yield from the Atta (2013) study were matched with a consensus map (unpublished) that

176
integrated 5,000 array markers with 70,000 DArTseq markers. The DArTseq marker profiles of the
parents that correspond to the MTAs in the Atta (2013) analysis are given in Table 6.4.

177
Table 6.5 List of parents with their corresponding target DArtseq markers utilized in the hybridization
program.
CloneID Chrom PBI-1 PBI-10 PBI-11 PBI-45 PBI-94 PBI-98 PBI-100 PBI-151 PBI-273 PBI-299
1123955 1B 0 0 1 0 1 1 0 1 0 0
1163780 1B 1 1 0 1 0 0 0 0 1 1 1101991 1B 1 1 1 1 1 1 1 1 1 0
1106888 2A 1 0 - 0 1 0 0 0 0 0
6020282 2B 1 1 1 1 0 0 1 1 1 0 2351065 2B 0 0 0 0 0 0 0 0 0 1
1203755 2B 0 0 0 0 1 1 0 0 0 1
1232931 2B 0 0 0 0 0 0 0 0 0 0 1234491 2B 0 0 0 0 1 1 0 0 0 0
1242436 2B 0 0 0 0 1 1 0 0 0 0
1230660 2B 0 0 0 0 1 1 0 0 0 0 2299734 2B 0 0 0 0 0 1 0 0 0 1
1716898 2B 0 0 0 0 1 0 0 0 0 0
3027838 2B 1 1 1 1 1 0 0 1 1 0 1258412 2B 0 0 0 1 0 0 0 0 0 0
1116476 2D 1 1 1 1 0 0 0 0 1 1
1127261 2D 1 1 1 1 1 1 1 1 1 1 1093304 2D 0 0 0 0 1 0 0 0 0 0
1397590 2D 0 1 1 0 0 1 - 0 - -
1151200 3B 0 0 0 0 1 0 0 0 0 0 3026577 3B 0 0 1 0 0 0 0 0 0 1
3027186 3B 1 0 1 0 0 0 1 0 0 1
1219810 3B 1 1 0 1 1 1 1 1 1 1 1013770 3B 0 0 0 0 1 0 0 0 0 0
1002107 3B 0 1 1 1 0 1 0 1 1 0
1109327 3B 0 1 1 1 0 1 0 1 1 0 1137819 3B 0 0 0 1 0 1 0 1 1 0
1092850 3B 1 1 1 0 1 0 1 0 0 1
1095941 3B 1 1 1 0 1 0 1 0 0 1 3022971 3B 1 1 1 0 1 0 1 0 0 1
1000283 3B 1 1 1 0 1 0 1 0 0 1
992140 3B 1 1 1 0 1 0 1 0 0 1 1057473 3B 1 1 1 0 1 0 1 0 0 1
984103 3B 1 1 1 0 1 0 1 0 0 1 1048368 3B 1 1 1 0 1 0 1 0 0 1
3533736 3B 0 0 0 1 0 1 0 1 1 0
3029150 3B 1 1 1 0 1 0 1 0 0 1 6027166 3D 1 1 0 0 0 1 1 0 0 1
1220326 3D 0 1 1 1 1 1 0 1 0 1
3020835 3D 0 1 1 1 1 1 0 1 0 1 1076731 3D 1 1 0 1 0 0 0 1 1 1
1075145 3D 0 0 1 1 0 1 0 1 0 1
1673946 3D 1 0 0 0 0 0 1 0 1 0 1675351 3D 1 0 0 0 0 0 1 0 1 0
2279884 4B 0 1 0 0 1 1 0 - 0 -
1150837 4D 1 1 1 1 0 1 - 1 1 0 3027580 5B 0 0 0 0 0 0 0 0 0 0
1091141 5B 0 0 0 0 0 0 0 0 0 0
1204542 5B 1 0 1 1 0 0 1 1 1 1 1052428 5B 1 0 1 1 1 0 1 1 1 1
1094527 5B 0 1 0 0 0 0 0 0 0 0
1107756 5B 1 1 1 1 0 0 1 1 1 1 1093400 6B 1 0 1 1 0 0 0 1 1 0
1121615 6B 1 1 1 1 0 0 0 1 1 0
1100767 6B 0 1 0 0 1 1 1 0 0 0 1229248 6B 1 0 1 1 0 0 0 1 1 0
1058967 6B 0 - 0 0 1 - 1 0 0 1
989612 7A 1 1 1 1 1 0 1 0 1 0 1131893 7A 0 0 0 0 1 0 0 0 0 0
Total 16 17 17 16 16 13 13 15 16 12
Key: Present = 1, Absent = 0

178
6.2.4 Field experiment
The resultant F3 seeds obtained from each topcross F2 progeny were sown at a rate of 15g/plot
in an alpha lattice design in a bird cage and partially replicated in 1 x 2m plots. The agronomic traits
assessed included days to heading, days to physiological maturity, TKW, total biomass, harvest index
and grain yield. All agronomic practices were conducted as outlined in Chapter 3 of this thesis.
6.3 Statistical analysis
Data were analysed to test differences among progenies from the various populations using a
linear mixed model and the REML function of Genstat (version 14.1). Genotypes were considered
fixed effects and ranges and rows as random effects.
Significant effects among genotype means were separated by the Fisher's protected least
significant difference test at P < 0.05. Progenies were grouped based on markers associated with grain
yield detected in the earlier Atta (2013) association analysis. Regression analysis was conducted to
group means. The materials were then re-classification based on those markers confirmed in Chapter 5
as effective in both the Atta (2013) study and the head-to-head comparison of the same materials in
2014 and 2015. The differences among genotypes based on the numbers of markers present were the
compared using REML. These target markers were wPt 4930, wPt 1637, wPt 8682 and wPt 6594.
Principal component analysis was carried out to determine the relationship among topcross progenies
on the basis of their field performance and number of target markers accumulated.
6.4 Results
6.4.1 Performance of the 6 top cross populations
The phenotypes of the 6 top cross populations; (PBI-100 X PBI-11) X PBI-94, (PBI-11 X PBI-10)
XPBI-1, (PBI-11 X PBI-10) X PBI-45, (PBI-100 X PBI-11) X PBI-98, (PBI-151 X PBI-45) X PBI-
273 and (PBI-100 X PBI-11) X PBI-94 are presented in Tables 6.6, 6.7, 6.8, 6.9, 6.10 and 6.11,
respectively. The progeny of these populations varied, sometimes significantly, from each other, their
parental lines and the commercial check cultivars.

179
Table 6.6 Means of the top cross population (PBI-100 X PBI-11) x PBI-94 for days to heading(DHD), days to physiological maturity(DPM), canopy
ground cover(GC), harvest index(HI), grain filling duration(GFD), normalized difference vegetation index(NDVI), thousand kernel weight(TKW),
biomass(BMAS) and grain yield(YLD).
Genotype DHD DPM GC (%) GFD HI NDVI TKW(g) BMAS YLD(kg/ha)
A1 89.6 137.1 41.76 47.23 0.32 0.761 33.32 1512 2408
A2 87.1 130.9 46.24 43.94 0.32 0.716 34.06 1574 2416
A3 90.1 135.6 25.88 45.49 0.30 0.750 27.28 1128 1798
A4 89.3 136.5 34.78 46.88 0.32 0.729 35.54 1492 2351
A5 91.2 136.5 34.59 44.47 0.37 0.838 29.1 1199 2213
A6 90.9 137.3 39.73 46.11 0.27 0.811 29.39 1405 1901
A7 92.1 135.7 24.07 44.32 0.38 0.816 36.62 1468 2733
A8 90.1 136.1 30.82 45.48 0.31 0.662 30.95 1376 2175
A9 92.1 136.4 39.41 44.63 0.33 0.740 33.39 1308 2164
A10 91.5 134.5 17.72 44.64 0.24 0.802 27.37 1098 1529
A11 89.4 135.8 35.72 46.07 0.27 0.794 32.16 1613 2274
A12 86.4 136.2 32.92 48.98 0.28 0.714 37.94 1893 2835
A13 90.8 137.0 38.37 46.15 0.31 0.722 32.76 1622 2547
A14 90.2 135.8 30.34 44.85 0.35 0.745 33.55 1411 2522
A15 92.4 135.8 22.76 43.22 0.29 0.768 33.53 1492 2150
A16 87.3 136.2 37.73 48.58 0.35 0.756 35.68 2023 3492
A17 89.3 136.4 28.86 47.04 0.31 0.718 30.76 1776 2721
A18 91.4 135.6 37.44 45.49 0.33 0.719 34.12 1683 2786
A19 92.5 137.5 30.13 44.52 0.31 0.769 33.65 1486 2139
A20 88.9 137.7 31.2 48.16 0.33 0.754 29.72 1439 2360
A21 88.2 135.8 36.53 47.96 0.31 0.750 36.28 1608 2497
A22 87.5 136.1 32.03 48.39 0.39 0.737 36.81 1713 3340
A23 93.8 136.6 23.82 42.29 0.27 0.744 28.48 1364 1951
A24 94.7 136.4 34.67 41.59 0.34 0.749 30.22 1556 2684
A25 93.3 136.2 26.16 43.35 0.33 0.755 27.98 1265 2032
A26 94.7 135.6 22.71 40.89 0.27 0.776 29.64 1287 1761
A27 103.0 136.6 37.94 33.33 0.26 0.700 31.94 1382 1834
A28 87.7 136.9 32.03 50.68 0.34 0.684 30.56 1547 2578
A29 90.4 135.7 29.88 45.28 0.30 0.735 33.31 1420 2102
A30 88.4 136.5 38.85 48.10 0.27 0.709 32.33 1469 1962
A31 89.7 136.2 39.08 46.62 0.43 0.795 34.09 1331 2613
A32 94.3 135.9 39.59 41.24 0.27 0.760 32.41 1217 1452
A33 87.8 134.4 25.87 46.87 0.26 0.696 29.54 1630 2180
A34 86.7 133.9 54.81 46.89 0.29 0.751 31.83 1799 2546
A35 93.7 136.5 21.24 41.89 0.30 0.759 34.34 1097 1586
A36 88.6 136.4 31.65 47.40 0.33 0.752 33.01 1398 2352

180
A37 88.3 135.8 32.71 47.23 0.30 0.661 35.74 1624 2470
A38 86.1 136.0 29.62 49.30 0.22 0.788 31.61 982 1009
A39 92.6 137.7 28.52 44.39 0.33 0.859 30.19 1545 2592
Parents
PBI-100 85.68 135.1 31.39 48.87 0.35 0.755 34.14 1564 2761
PBI-273 87.22 135.6 28.50 47.99 0.29 0.748 29.4 1524 2215
PBI-299 92.36 137.1 37.65 44.70 0.32 0.796 31.59 1426 2241
Control
SPITFIRE 91.02 136.1 43.38 44.66 0.29 0.783 29.63 1809 2658
SUNTOP 90.68 136.4 48.4 45.73 0.30 0.795 32.28 1461 2178
Mean 90.43 136.0 33.35 45.49 0.31 0.753 32.23 1477.63 2297.9
Lsd 3.62 2.7 24.62 3.82 0.92 0.076 7.82 325.2 725.8

181
Table 6.7 Means of the top cross population (PBI-11 X PBI-10) x PBI-1 for days to heading (DHD), days to physiological maturity(DPM), canopy ground
cover (GC), harvest index( HI), grain filling duration(GFD), normalized difference vegetation index(NDVI), thousand kernel weight (TKW),
biomass(BMAS) and grain yield(YLD) kg/ha.
Genotype DHD DPM GC GFD HI NDVI TKW(g) BMAS YLD(kg/ha)
B1 92.03 135.8 30.02 43.53 0.25 0.787 28.80 1264 1561
B2 91.28 135.2 26.52 43.62 0.27 0.728 30.58 1588 2254
B3 92.04 135.9 34.89 43.06 0.27 0.773 26.82 1246 1757
B4 91.6 137.5 46.16 46.11 0.25 0.700 34.68 1526 2002
B5 94.19 135.3 14.96 41.62 0.25 0.696 28.93 1116 1405
B6 90.74 135.8 30.44 44.87 0.28 0.724 30.31 1369 1917
B7 92.65 136.2 37.37 43.15 0.25 0.816 25.95 1090 1382
B8 85.12 135.7 33.54 50.45 0.25 0.806 31.33 1360 1735
B9 93.61 136.2 30.21 42.18 0.31 0.751 28.12 1385 2163
B10 90.38 135.7 21.68 44.83 0.25 0.772 27.14 1248 1636
B11 88.16 135.1 31.14 46.48 0.28 0.754 30.26 1474 2137
B12 91.88 135.9 29.95 43.95 0.26 0.773 31.80 1511 1959
B13 86.92 135.8 31.03 48.62 0.31 0.748 30.19 1298 1932
B14 93.75 136.1 35.55 41.77 0.25 0.820 29.96 1365 1756
B15 90.58 132.4 37.24 40.28 0.30 0.750 24.87 1397 2078
B16 91.38 136.1 24.22 44.51 0.27 0.722 33.89 1206 1678
B17 98.41 135.5 30.22 37.27 0.31 0.774 27.64 1335 2049
B18 92.15 135.5 33.83 43.4 0.27 0.739 32.74 1618 2186
B19 93.12 135.8 33.76 42.38 0.28 0.774 30.60 1270 1815
B20 88.12 135.1 39.42 47.32 0.28 0.738 31.11 1669 2333
PBI-1 86.55 132.3 37.87 45.4 0.34 0.710 27.67 1858 3139
PBI-10 91.07 135.7 39.46 44.32 0.30 0.736 33.92 1501 2339
PBI-11 91.06 135.1 43.95 43.89 0.25 0.806 26.91 1432 1816
SPITFIRE 91.02 136.1 43.38 44.66 0.29 0.783 29.63 1809 2658
SUNTOP 90.68 136.4 48.4 45.73 0.30 0.795 32.28 1461 2178
Mean 91.14 135.52 33.8 44.14 0.28 0.759 29.85 1415.84 1994.6
Lsd 3.62 2.7 24.62 3.82 0.92 0.076 7.82 325.2 725.8

182
Table 6.8 Means of the top cross population (PBI-11 X PBI-10) X PBI-45 together with parents and controls for harvest index (HI), grain filling duration
(GFD), thousand kernel weight (TKW), biomass (BMAS) and grain yield (YLD).
Genotype DHD DPM GC (%) GFD HI NDVI TKW(g) BMASS YLD(kg/ha)
C1 88.8 136.1 31.51 46.54 0.30 0.803 32.92 1507 2349
C2 92.7 135.9 29.74 42.77 0.27 0.771 27.83 1770 2369
C3 89.0 136.0 40.27 46.49 0.29 0.748 29.52 1546 2281
C4 90.4 135.8 38.68 45.98 0.32 0.752 37.75 1671 2812
Parents
PBI-45 95.2 136.0 36.56 40.02 0.26 0.775 28.07 1603 2112
PBI-10 91.1 135.7 39.46 44.32 0.30 0.736 33.92 1501 2339
PBI-11 91.1 135.1 43.95 43.89 0.25 0.806 26.91 1432 1816
Control
SPITFIRE 91.0 136.1 43.38 44.66 0.29 0.783 29.63 1809 2658
SUNTOP 90.7 136.4 48.40 45.73 0.30 0.795 32.28 1461 2178
Mean 91.14 135.52 33.8 44.14 0.28 0.774 30.98 1589 2324
Lsd 3.62 2.7 24.62 3.82 0.92 0.076 7.82 325.2 725.8

183
Table 6.9 Means of the top cross population (PBI-100 X PBI-11) X PBI-98 together with parents and controls for harvest index (HI), grain filling duration
(GFD), thousand kernel weight (TKW), biomass (BMAS) and grain yield (YLD).
Genotype DHD DPM GC (%) GFD HI NDVI TKW(g) BMAS YLD(kg/ha)
D1 85.8 135.4 29.80 49.4 0.31 0.787 28.18 1186 1877
D2 89.5 135.8 14.91 45.8 0.27 0.742 31.92 1055 1393
D3 84.5 134.7 30.87 50.3 0.29 0.736 32.18 1548 2229
D4 85.8 134.7 44.20 49.4 0.31 0.764 33.44 1648 2460
D5 87.3 136.1 31.08 49.1 0.24 0.810 26.06 1286 1665
D6 85.6 132.9 37.38 47.4 0.28 0.759 32.32 1348 1919
D7 87.8 133.9 20.50 47.0 0.26 0.675 27.59 1406 1872
D8 96.0 134.9 23.33 39.4 0.30 0.892 25.66 1193 1804
D9 92.6 135.3 35.53 42.9 0.24 0.814 36.19 1224 1437
D10 92.0 130.9 43.66 38.4 0.31 0.753 30.76 1101 1616
D11 86.9 136.9 34.78 49.2 0.35 0.803 31.78 1360 2363
D12 89.0 134.8 40.98 45.6 0.31 0.764 28.78 1356 2119
D13 85.9 133.6 31.87 47.3 0.22 0.734 31.44 1516 1706
D14 85.9 135.2 27.46 49.3 0.33 0.761 31.67 1294 2263
D15 88.2 136 27.77 47.0 0.29 0.756 28.4 1399 2059
D16 90.8 136.3 38.17 44.4 0.31 0.800 27.78 1389 2146
D17 87.5 134.2 44.52 46.7 0.29 0.734 35.64 1639 2378
D18 90.3 135.5 29.91 45.7 0.30 0.741 27.2 1382 2076
D19 96.2 136.4 21.34 40.2 0.23 0.707 27.36 670 620
D20 87.4 135.6 24.37 47.7 0.29 0.769 30.47 1336 1940
D21 87.2 135.6 33.10 47.9 0.29 0.769 31.72 1368 1873
D22 88.7 135.7 28.96 47.4 0.31 0.764 31.99 1367 2132
D23 87.7 134.7 26.63 46.8 0.27 0.765 31.42 1285 1657
D24 86.7 135.7 27.72 48.8 0.29 0.767 26.81 1188 1774
D25 92.5 135.8 34.35 43.1 0.26 0.807 24.94 1135 1497
D26 89.0 135.1 29.57 45.9 0.29 0.731 31.36 1470 2106
D27 92.7 135.2 25.13 42.4 0.31 0.725 30.86 1208 1952
D28 90.9 135.6 38.83 44.0 0.25 0.776 31.16 1439 2038
D29 90.5 135.5 47.46 44.8 0.29 0.776 30.1 1646 2440
Parents
PBI-100 85.7 135.1 31.39 48.9 0.3545 0.755 34.14 1564 2761
PBI-98 92.8 136.6 34.87 43.5 0.2882 0.818 31.01 1412 2032
PBI-11 91.1 135.1 43.95 43.9 0.25 0.806 26.91 1432 1816
Control
SPITFIRE 91.0 136.1 43.38 44.7 0.29 0.783 29.63 1809 2658
SUNTOP 90.7 136.4 48.40 45.7 0.30 0.795 32.28 1461 2178
Mean 91.1 135.52 33.80 44.1 0.28 0.774 30.98 1589 2324
Lsd 3.6 2.7 24.62 3.8 0.92 0.076 7.82 325.2 725.8

184
Table 6.10 Means of the top cross population (PBI-151 X PBI-45) X PBI-273 together with parents and controls for harvest index(HI), grain filling
duration(GFD), thousand kernel weight(TKW), biomass(BMAS) and grain yield(YLD).
Genotype DHD DPM GC (%) GFD HI NDVI TKW(g) BMASS YIELD(kg/ha)
E1 89.27 136.2 25.31 46.22 0.2877 0.6152 32.55 849 1088
E2 88.21 136.5 22.09 47.55 0.3029 0.7547 30.28 1351 1977
E3 91.72 135.2 31.3 43.9 0.2399 0.7297 32.76 1259 1587
E4 88.26 135.7 41.63 47.43 0.2743 0.8083 35.09 1351 1861
E5 94.59 131.9 41.95 36.13 0.0629 0.7888 24.04 1069 200
E6 90.16 136 39.65 44.76 0.1695 0.7737 20.65 1037 757
E7 91.7 137.1 29.38 45.61 0.277 0.6708 35.83 1115 1459
E8 93.03 135.6 25.88 41.76 0.262 0.7134 32.75 1205 1579
E9 91.53 135.5 17.14 43.69 0.3043 0.8046 28.01 1127 1671
E10 90.54 135.4 33.36 44.56 0.2712 0.7824 30.18 1164 1603
E11 91.1 134.4 29.49 42.93 0.2718 0.7712 32.19 1257 1585
E12 92.28 135.5 25.25 42.77 0.2408 0.7996 29.79 964 1189
E13 93.65 135.3 30 41.4 0.2524 0.7758 26.25 1075 1297
E14 90.79 136.8 27.41 45.73 0.2585 0.747 29.85 1112 1411
E15 90.54 137.6 43.41 46.83 0.1582 0.8524 27.87 1021 635
E16 91.24 135.6 30.81 43.43 0.2167 0.7447 32.91 1363 1446
E17 89.01 135.1 28.08 45.65 0.2557 0.7592 31.46 1190 1505
E18 89.13 133.6 37.78 44.64 0.2904 0.7351 26.27 1171 1546
E19 89.04 136.7 34.8 47.52 0.2643 0.7679 30.11 1234 1601
E20 93.68 136 31.49 41.92 0.2844 0.8061 32.56 1399 1948
E21 88.4 135.3 36.49 46.2 0.2868 0.7258 31.42 1381 1961
E22 88.05 136.5 20.7 48.34 0.2725 0.7485 35.47 1637 2325
E23 91.7 135.2 22.14 43.04 0.2531 0.7586 23.78 1228 1551
E24 93.69 137.2 15.18 44.33 0.2861 0.7051 32.55 1001 1387
E25 94.05 136.1 23.75 41.88 0.1324 0.7756 33.03 1568 1132
E26 89.09 135.8 19.08 46.15 0.3048 0.7331 30.74 1417 2301
E27 87.39 137.5 29.13 49.58 0.2861 0.7483 28.65 1458 2072
E28 87.02 135.5 34.68 48.28 0.2708 0.7219 32.14 1419 1880
E29 88.86 135 25.33 44.98 0.2782 0.7001 31.52 1429 1991
E30 90.57 135.8 39.19 45.32 0.2676 0.7626 31.38 1200 1604
E31 90.7 134.1 25.09 44.01 0.2475 0.7566 28.91 1249 1492
E32 93.95 135.6 17.57 42.82 0.2549 0.6486 28.1 1239 1479
E33 88.29 136.4 43.79 48.19 0.2858 0.6922 31.99 1441 2054
E34 94.31 135.2 35.75 40.75 0.347 0.7757 27.56 1356 2282
E35 91.85 136 24.35 43.76 0.277 0.7484 31.88 1414 1923
E36 89.4 135.9 33.46 46.18 0.3221 0.7442 32.11 1392 2230

185
Parents
PBI-151 89.54 135.3 37.4 45.45 0.3394 0.7729 33.09 1370 2363
PBI-273 87.22 135.6 28.5 47.99 0.2887 0.7484 29.4 1524 2215
PBI-45 95.22 136 36.56 40.02 0.2648 0.7752 28.07 1603 2112
Control
SPITFIRE 91.0 136.1 43.38 44.7 0.29 0.783 29.63 1809 2658
SUNTOP 90.7 136.4 48.40 45.7 0.30 0.795 32.28 1461 2178
Mean 90.7 135.7 30.88 44.7 0.26 0.752 30.36 1290.46 1686.23
Lsd 3.6 2.7 24.62 3.8 0.92 0.076 7.82 325.2 725.8

186
Table 6.11 Means of the top cross population (PBI-100 X PBI-11) X PBI-94 together with parents and controls for harvest index (HI), grain filling
duration (GFD), thousand kernel weight (TKW), biomass (BMAS) and grain yield (YLD).
Genotype DHD DPM GC(%) GFD HI NDVI TKW(g) BMAS YLD(kg/ha)
F1 92.8 135.3 24.1 42.6 0.31 0.797 31.69 1323 2110
F2 88.0 135.0 25.6 46.4 0.26 0.762 30.91 1315 1664
F3 92.7 136.0 33.5 43.0 0.30 0.747 34.46 1418 2045
F4 93.3 135.1 37.3 41.4 0.26 0.776 26.64 1264 1609
F5 91.9 135.5 20.9 43.6 0.26 0.784 29.81 1041 1639
F6 93.1 135.6 30.6 42.8 0.29 0.782 30.47 1363 2001
F7 91.7 135.1 29.8 44.0 0.32 0.732 32.21 1178 1843
F8 90.1 135.6 30.4 45.1 0.34 0.724 27.82 1380 2340
F9 89.4 136.1 23.7 46.0 0.27 0.750 27.6 1376 1954
F10 94.2 136.8 25.2 42.8 0.30 0.704 31.04 1201 1869
F11 94.1 136.2 33.7 41.0 0.32 0.774 29.99 1470 2442
F12 94.0 135.1 29.0 40.9 0.26 0.731 33.56 1525 1964
F13 94.4 136.0 24.3 41.1 0.29 0.719 33.95 1225 1788
F14 89.7 135.7 28.5 46.3 0.32 0.777 32.45 1422 2205
F15 92.9 135.9 33.4 42.5 0.34 0.762 31.67 1542 2780
F16 91.2 135.7 32.8 44.1 0.32 0.786 35.35 1350 2135
F17 91.9 135.4 41.4 43.6 0.24 0.710 26.49 1548 1930
F18 91.1 135.7 40.4 44.3 0.34 0.777 35.47 1311 2244
F19 90.3 136.0 26.5 44.9 0.31 0.712 36.23 1504 2462
F20 96.4 136.1 28.5 40.1 0.27 0.777 24.46 1066 1282
F21 91.2 136.6 24.3 45.9 0.32 0.765 34.43 1777 2873
F22 89.7 134.0 30.4 45.6 0.31 0.803 25.69 1253 1962
F23 91.9 135.6 32.8 43.3 0.33 0.769 36.24 1329 2210
F24 90.4 135.3 20.1 44.1 0.27 0.751 32.04 1409 1706
F25 96.1 134.0 18.4 38.6 0.24 0.694 32.52 1187 1446
Parents
PBI-100 85.7 135.1 31.4 48.9 0.35 0.755 34.14 1564 2761
PBI-11 91.1 135.1 44.0 43.9 0.25 0.806 26.91 1432 1816
PBI-94 88.3 135.2 29.4 46.8 0.26 0.733 26.98 1456 1898
Control
SPITFIRE 91.0 136.1 43.4 44.7 0.29 0.783 29.63 1809 2658
SUNTOP 90.7 136.4 48.4 45.7 0.30 0.795 32.28 1461 2178
Mean 91.6 135.6 29.0 43.8 0.29 0.757 31.10 1383.3 2060.46
Lsd 3.6 2.7 24.6 3.8 0.92 0.076 7.82 325.2 725.8

187
6.4.2 Validation of MTAs for higher grain yield using targeted markers from the earlier Atta
(2013) genetic association analysis
Progenies resulting from the hybridization of selected parental materials varied significantly in the
number of accumulated targeted markers based on the earlier association analysis of Atta (2013). The
number of accumulated markers ranged from 11-18. However, differences in mean yield based on the
number of accumulated markers were not significant (Table 6.12). Similarly, differences observed for
thousand kernel weight (TKW), harvest index and maturity were not also significantly different.
However, significant differences were observed in biomass between progeny groups. Those materials
with higher numbers of pyramided markers tended to have higher biomass.
Table 6.12 Means of grain yield and other traits and number of accumulated markers based on the
earlier Atta (2013) association analysis
MARKER#
Yield
Biomass
DHD
DPM
GC
GF
HI
NDVI
TKW
11 1715a 1263b 89.0b 135.0c 32.10d 45.71d 0.267e 0.78f 30.30g
12 1884a 1258b 91.9b 135.3c 28.92d 43.58d 0.300e 0.75f 31.30g
13 1750a 1303b 90.5b 135.5c 31.22d 44.86d 0.268e 0.76f 30.71g
14 2126a 1449a 90.1b 135.8c 33.74d 45.55d 0.289e 0.76f 31.02g
15 1869a 1329b 90.7b 135.6c 29.79d 44.78d 0.280e 0.75f 30.17g
16 2057a 1417a 90.4b 135.8c 31.84d 45.14d 0.289e 0.76f 32.04g
17 2039a 1382ab 91.2b 135.6c 31.99d 44.05d 0.290e 0.76f 30.03g
18 2002a 1444a 91.0b 135.6c 28.32d 44.23d 0.272e 0.75f 28.94g
Mean 1930 1356 90.6 135.5 30.99 44.7375 0.282 0.76 30.56
SED 49.3 20.5 0.3 0.11 0.75 0.3 0.004 0.003 0.323
Note: Means bearing different letters are significantly different ( p< 0.05). DHD, DPM, GC, GF, HI, TKW is days to
heading, days to maturity, ground cover, days of grain-filling, harvest index and thousand kernel weight, respectively.

188
6.4.3 Validation of MTAs for higher grain yield using targeted markers from the current
genetic association analysis
The progenies were then re-classified based on those markers confirmed in both the Atta (2013) multi-
environment study and the head-to-head comparisons of 2014 and 2015 at Narrabri. Grain yield was
generally positively associated with increasing accumulation of targeted markers (Table 6.13).
Progenies that accumulated 3 or more targeted markers were the highest yielding. Similarly,
significant differences were observed among progeny groups for thousand kernel weight (TKW),
heading time, biomass and grain filling duration with accumulation of markers producing higher traits
expression. No significant differences in maturity time, NDVI, canopy ground cover and harvest index
were observed.
Table 6.13 Means of grain yield and other traits and number of accumulated markers based on the on
markers confirmed in both the Atta (2013) study and the head-to-head analysis of Chapter 5
MARKER Yield Biomass DHD DPM GC GF HI NDVI TKW
0 1617c 1181a 93.23b 135.0a 27.75a 41.86b 0.267a 0.750a 29.7b
1 1908bc 1330b 89.98a 135.4a 31.37a 45.11a 0.288a 0.757a 31.68ab
2 1981b 1380b 90.62a 135.7a 31.57a 44.86a 0.284a 0.758a 30.55b
3 2235a 1473a 90.06a 135.6a 32.72a 45.48a 0.303a 0.751a 32.25a
Mean 1935 1341 90.97 135.4 30.85 44.3 0.28 0.773 31.04
SED 52.6 21.5 0.32 0.12 0.83 0.32 0.004 0.004 0.35
Note: Means bearing different letters in the same column are significantly different at p < 0.05. DHD, DPM, GC, GF, HI,
TKW is days to heading, days to maturity, ground cover, days of grain-filling, harvest index and thousand kernel weight,
respectively
The principal component analysis displayed a clear separation of some progeny from their donor
parents based on field performance for key agronomic traits (Fig 6.1). Although many showed similar
adaptation to the parents, others such as A27, A38, A16, B8, D3, D19, E5, E6, E15, F20 and F25
showed more extreme performance and were generally higher yielding than the donor parent.

189
SUNTOPF10
B17
D7
B18
PBI-98B19
PBI-45
B20
PBI-273
C1PBI-11
C2
PBI-10
C3
F25C4
F23
D1
F21
D2
F19
D3
F17
D4
F15
D5
F13
D6
F11
A2
D8
A4D9
A6
D10
A8
D11 A10
D12
A12
D13
A14
D14
A16
D15
A18
D16
A20
D17
A22
D18
A24
D19
A26
D20
A28D21
A30D22
A32
D23
A34
D24
A36
D25
A38
D26 B1
D27
B3
D28B5
D29
B7
E1
B9
E2
B11
E3
B13
E4
B15
E5
SPITFIRE
E6
PBI-299
E7PBI-100
E8
F24
E9
F20
E10
F16
E11
F12
E12A3
E13
A7
E14
A11
E15
A15
E16
A19
E17
A23
E18
A27
E19
A31
E20
A35
E21
A39
E22
B4
E23
B8
E24
B12E25
B16E26PBI-151
E27F22E28
F14E29 A5
E30
A13
E31
A21E32
A29
E33
A37
E34
B6
E35B14
E36
PBI-1F1
A1
F2
A17
F3
A33
F4
B10F5
F18 F6
A25
PBI-94
A9B2
F7F8
F9
-4
-4
0
-2
4
0
2
4
2-2
PC
2 (
26
.3%
)
PC1 (54.74%)
Figure 6.1 Principle component plot of the field performance of progenies and parents on the basis of
agronomic traits (grain yield, heading time, maturity time, thousand kernel weight and biomass).
6.5 Discussion
The polygenic nature of yield in rainfed conditions coupled with the low heritability of yield
under stress limits the development and release of improved cultivars. The era of genomics could
facilitate the process but functional validation of MTAs or genomic regions associated with key
agronomic traits is crucial for successful marker assisted selection (MAS). This is an essential step
because MTAs identified in one population or group of materials may not be applicable to all breeding
programs (Gupta et al. 2010a). Accumulation or pyramiding of favourable genomic regions/QTLs into
single plants has resulted in additive effects in many studies including wheat leaf rust (Singh et al.
2004), Fusarium head blight in wheat (Shi et al. 2008) and drought tolerance in rice (Shamsudin et al.
2016). Likewise Ribaut and Ragot (2007) recently reviewed a study to improve drought adaptation of
maize by marker assisted backcrossing (MABC) and the introgression of positive alleles for five target
regions involved in the expression of yield components under water limited conditions. The grain yield
of MABC progenies had higher yields than control hybrids under severe moisture stress conditions.

190
However in barley (Zhu et al. 1999) attempted to accumulate genomic regions conferring higher yield
but concluded that epistasis and QTL x environment interaction reduced the impact of the favorable
alleles. Similarly, when progenies were evaluated in the current study using targeted markers identified
in the Atta (2013) multi-environment study there was no significant yield advantage of those progeny
carrying accumulated markers. However, when only those markers confirmed in both the Atta (2013)
study and the subsequent head-to-head evaluation of the same materials in 2014 and 2015 were used, a
significant improvement in the yield of the progeny was observed with increased accumulation of
much smaller numbers of MTAs. Others reported that accumulation of genomic regions does not
always result in additive effects (Dalton et al. 2013). However, it is important to validate these MTAs
to remove false positives and to identify regions that consistently contribute to phenotype.
Xu and Crouch (2008), suggested that in some cases, markers will lose their selective power during
validation and that the most promising approach is to continually identify new markers associated with
the target trait across different breeding populations. For this reason the re-classification of the
progenies in the current study based on confirmed MTAs produced discernible improvements in yield
and some yield related characters.
6.6 Conclusion
The current findings suggest that association analysis can be used in wheat breeding to improve
complex traits such as yield once the repeatability of MTAs are confirmed. The impact of marker x
location interaction is significant and MTAs should continually be tested and refined and new
associations identified if this strategy is to be successfully implemented in wheat breeding. Some
genotypes mainly: A16, A22, F21, A12, C4, A18, F15, A7, A17, A24, A31, A39, A28, A13, A34,
A14, appeared to have combined favourable alleles that could be further evaluated and introgressed
into existing cultivars to develop drought tolerant varieties. However, the phenotypic evaluation was
conducted for one season only and further testing of the recombinant materials is required before firm
conclusions can be drawn.

191
7 General Discussion
A multifaceted approach that combines technologies is required to increase yield gains in
wheat. Grain yield under stress has low heritability and high genotype x environment interaction
confounds results leading to limited genetic gains. Reduced wheat yield gains over the past 30 years
have been attributed to increasingly erratic climatic conditions (Olesen et al. 2011). Therefore water
use efficiency has become the trait of interest to many breeders.
This study aimed to validate MTAs from a previous association genetics study in various ways.
In the process genotype x environment interaction effects were explored as was the efficacy of
combining MTAs in mixtures and through targeted marker pyramiding. The effectiveness of MTAs
identified through association analysis in both mixtures and marker pyramided lines was apparent after
extensive confirmation of important and repeatable MTAs.
7.1 The effect of tillage and moisture on grain yield
Winter wheat cultivation in northern NSW relies heavily on stored soil moisture. Soil surface
structural modification (or tillage), mulching and residue cover alter the water-use-efficiency of the
farming system.
While no significant genotype x tillage interaction effects for yield were observed in the current
study, some genotypes such as Crusader, Janz, EGA Stampede Lincoln performed better under zero-
tillage whilst others were clearly less well adapted including Lang, Sunvale and Ventura. The lack of
genotype x tillage practice interaction has been reported in earlier studies. However, the report of
Trethowan et al (2012) is an exception and the significant responses reported are likely germplasm and
environment specific. Nevertheless, zero-tillage significantly increased grain yield under both rainfed
and irrigated environments, with a pronounced yield advantage of 6% in rainfed conditions. Clearly,
the absence of soil disturbance and maintenance of crop residues on the surface reduced moisture loss
thus improving yield. This observation confirms previous reports that zero-tillage reduces evaporation,
increases water infiltration and reduces runoff (Hall and Cholick, 1989; Cox, 1991; Carr et al., 2003a).
These reports suggest that higher grain yield can be achieved under moisture stress when higher
yielding cultivars are deployed in zero-tillage systems. Comparatively, the year to year variation in
yields and the significant year x genotype interaction effects which could be explained by the amount

192
and distribution of in season rainfall suggests that critical periods of crop development (post-anthesis)
when moisture is limiting could significantly reduce yield.
7.2 The effects of genetic mixtures on water use efficiency
Genetic mixtures can contribute to the sustainability of grain yield under moisture stress through more
efficient utilization of resources including water, nutrients and CO2. It was assumed that mixture
components, assembled based on complementary genomic regions from the Atta (2013) study, would
confer higher grain yield as the combined traits would compensate and complement each other under
stress. However, the performance of genotypes in mixtures was heavily influenced by the genotypes
selected and the environment. A few mixtures including Sunstate+Stampede, Sunstate+Stampede+Janz
and Suntop+Spitfire outperformed their components for grain yield under rainfed conditions only, thus
supporting the notion that mixtures buffer yield under stress (Finckh et al. 2000; Kiær et al. 2012).
However, the Lincoln+Lang mixture appeared to show a negative response compared to its component
lines under drought stress indicating that mixtures can also suppress plant responses; an observation
also noted by others (Treder et al. 2008; Lithourgidis et al. 2011). There was also a significant year
effect as the 3-way mixture Sunstate+Stampede+Janz was superior to its components only when
evaluated in 2014. The current results indicate that mixtures vary in their adaptability to tillage and
irrigation systems and that mixture components must be carefully selected and tested before
deployment. The performance (mixing effects) of most mixtures was intermediate compared to their
pure stands and this could be attributed to high marker x environment interaction effects as markers
were the basis of their composition. The high level of unrepeatable MTAs observed in later analysis
(see Chapter 5) may also have played a role. It is possible that new mixtures, based only on those
MTAs that were positive and significant across the 2014 and 2015 head-to-head evaluation, will show
greater responses to mixing.
7.3 Physiological traits linked to genomic regions
Trait based plant breeding could improve genetic gains in grain yield relative to conventional
breeding strategies (Atta 2013). Significant variation for physiological traits was recorded among the
materials tested (see Chapter 3 for details). All trait means were higher in 2014 which is partly
attributed to the higher in season rainfall. The increased moisture produced greater biomass, faster
ground cover, higher NDVI and higher grain yield.

193
Earliness to ground cover significantly influences yield by reducing water loss from the soil
surface in certain environments (Rebetzke et al. 2004). The current results indicated that late ground
cover accounted for 39% of the observed genetic variance in yield and was higher under zero-tillage
systems and therefore selection for higher early ground cover could improve crop adaptation to this
farming practice. Part of this response can be explained by the positive correlation of earliness with
NDVI, biomass and water use efficiency. Several markers identified in the earlier association analysis
(Atta 2013) used to assemble the mixtures were associated with yield and these co-located with QTLs
reported by Li et al. (2014a). These QTLs, QGCw-caas-1A.1, QGCw-caas-2A.2, and TQGCw-caas-
1A.2, located at 6.1, 6.7 and 3.0 cM, respectively, coincided with wPt-6564, wPt 8242, wPt 8455 and
wPt 1945 on the same chromosomes at the same positions. It appears that earliness to ground cover
has both a physiological and molecular basis and could be targeted, through indirect selection, to
improve water use efficiency under moisture stress.
Crop phenology is one of the pivotal traits regulating adaptation of bread wheat (Triticum
aestivum L.) to diverse climatic environments and earliness has often been emphasized as an escape
strategy to avoid peak periods of drought and heat stress (Debaeke 2004). In northern NSW, post-
anthesis moisture stress is prevalent and early heading genotypes tend to escape drought and
subsequently produce higher yields. In the current study, heading and maturity positively associated
with yield. Coincidentally, yield MTAs identified on chromosome 1AL at 125.40, 134.61 and 135.6
cM in the earlier association analysis of (Atta 2013) coincided with the findings of Bullrich et al.
(2002) who mapped a QTL for earliness per se controlling heading time in the distal region of the
same chromosome in wheat. In addition, Kuchel et al. (2006) identified QTLs controlling time to
heading on chromosomes 1A, 2A, 2B, 6D, 7A and 7B which coincided with yield MTAs on the same
chromosomes identified in the earlier association study (Atta 2013). However, of the previously
reported MTAs for heading date (Bullrich et al., 2002; Kuchel et al., 2006), only locations on 6B and
7B were consistent with the current study. In the current study the only significant MTA coinciding
with a known photoperiod or vernalization locus was on 5B, which co-located with Vrn-B1. Heading
and maturity clearly have a physiological and molecular basis in these materials and can be targeted to
optimize crop development and yield in this environment.
Spectral reflectance indices assessed using NDVI measured photosynthetic biomass and
chlorophyll content and these were positively associated with yield. Quarrie et al. (2006), reported that
flag leaf chlorophyll content and leaf width at tillering were associated with a QTL on chromosome

194
7A. In addition, Graziani et al. (2014) identified QTLs for leaf greenness on chromosome 3B at 6.9
cM, which overlapped with a QTL for TKW. The earlier association study of Atta (2013) found a
marker (wPt-7907) on chromosome 3B in a similar position to the Graziani study to be associated with
higher grain yield. Chlorophyll content could therefore be associated with higher yield under moistures
stress and could be targeted for selection.
Biomass is a key driver of grain yield in rainfed environments (Shepherd et al. 1987; Royo et
al. 1999; Slafer 2003; Slafer et al. 2005). Total biomass was higher under conventional-tillage than
zero-tillage environments, even though the latter had higher moisture storage capacity. This difference
could possibly be attributed to differences in the way nitrogen is utilized in both tillage regimes. There
is some evidence to suggest that N use is less efficient in zero-tillage, largely due to less efficient
placement of fertilizer (Ken Sayre, personal communication). Biomass has both a physiological and
molecular basis with QTLs reported on chromosomes 4B and 4D (Li et al. 2014b). These
chromosomes coincide with the earlier Atta (2013) study although the map positions for yield do not
overlap with the reported biomass QTLs. In the current study harvest index was higher in zero-tillage,
reflecting the reduced total biomass in this tillage regime and equivalent or higher grain yield.
However, the MTAs for yield in the Atta (2013) study when pyramided did produce lines with
significantly greater biomass, even though the effect on yield was non-significant, suggesting that
biomass has a higher heritability.
Bennett et al. (2012), identified a QTL located on chromosome 3B which had a large effect on
canopy temperature and grain yield. This also coincided with MTAs identified on the same
chromosome for yield in the earlier association analysis of (Atta 2013). However, significant
differences among genotypes were not observed in the current study, even though canopy temperatures
were significantly lower in zero-tillage treatments.
Flag leaf rolling ability is an adaptive trait for drought tolerance and the selection of cultivars
with this character has been achieved in rice, maize, sorghum and wheat (Dingkuhn et al. 1989;
PREMACHANDRA et al. 1992c; Corlett et al. 1994; Price et al. 2002a). The current study found this
trait to be positively correlated with yield (r = 0.57) and water use efficiency (r = 0.52) under moisture
stress. The result suggests that water use efficient genotypes roll their leaves as part of the water
conservation strategy. Although no QTLs have been found controlling this trait in wheat, its strong
positive association with yield indicates a possible contribution to the observed marker trait
associations for yield. It could therefore be selected indirectly to improve grain yield and water use
efficiency.

195
The improvement of grain yield under moisture stress is a function of improved crop water use-
efficiency which has been targeted in Australia (Kirkegaard et al. 2014) and internationally (Grassini
et al. 2009; Grassini et al. 2011; Zhang et al. 2014c). In the current study, water-use-efficiency varied
across irrigation and tillage regimes with the greatest water use efficiency observed in full-tillage
rainfed environments. Water-use-efficiency correlated significantly with yield (r = 0.99), leaf rolling
(r=0.52), days to heading (r= - 0.62), days to physiological maturity (r= -0.80), plant height (r= 0.57)
and ground cover (r= 0.64) suggesting that high yielding drought tolerant genotypes were good early
ground coverers, early heading, early maturing and rolled their leaves to avoid moisture loss. These
results support the findings of (Zhang and Oweis 1999) and (Zhang et al. 2010a) who concluded that
higher yielding cultivars have the potential to improve water-use-efficiency, thereby saving water.
7.4 Production traits
Grain yield is the key agronomic trait targeted by wheat breeders for improvement. The current
study revealed that zero-tillage significantly increased grain yield under both rainfed and irrigated
environments, with a pronounced yield advantage in rainfed conditions. However, the lack of a
genotype x tillage environment interaction suggests that the germplasm utilized did not carry vital
genetic variability related to zero-tillage adaptation and the development of new varieties specifically
adapted to zero-tillage systems is crucial (Duvick et al. 1990; Trethowan et al. 2005b). To increase
wheat productivity under drought through breeding Reynolds et al. (2005) emphasized the significance
of and utilization of physiological traits. Five traits in the current study (days to heading, NDVI, leaf
rolling, earliness to ground cover and grain filling duration) accounted for 87.8% of the observed
phenotypic variance in yield. These traits are likely responsible in part or in combination for the
observed significant marker trait associations in the current study. Thus high yielding and water use
efficient genotypes were faster in providing ground cover, earlier heading to avoid post-anthesis
moisture stress, developed larger photosynthetic biomass, rolled their leaves to avoid damage while
maintaining photosynthetic activity and had shorter grain filling periods.
The current results show that some yield related MTAs from the Atta (2013) study are in fact
linked to different phenological and physiological traits. Previous studies identified QTLs on 1B
(QEps.dms-1B1 and QEps.dms-1B2) and 5B (QEps.dms-5B1) that were associated with heading time
(Kamran et al. 2013; Zanke et al. (2014)). The QTL (QEps.dms-1B1) found on chromosome 1B
mapped at 31.8cM in approximately the same region as MTAs identified in the Atta (2013) study.
Similarly, the QTL (QEps.dms-5B1) directly coincided with an MTA (wPt-6135) on the same

196
chromosome. Other QTLs for various traits including NDVI (QNDVIs-caas-5B) (Li et al. 2014a), and
earliness to ground cover (QGCw-caas-1A.1, QGCw-caas-2A.2, TQGCw-caas-1A.2) (Li et al. 2014a)
coincided with markers linked to yield in the Atta (2013) study. Thousand kernel weights also varied
significantly among genotypes but no significant genotype x tillage interaction was observed. It was
clear that thousand kernel weight correlated with grain yield and as this trait has a high heritability it
could be targeted indirectly for yield improvement.
In the current study no genotype x environment interaction effects were observed for grain
protein. However, the positive correlation with maturity, days to heading and NDVI at grain filling and
negative correlation with yield simply confirms earlier findings (Blanco et al. 2012; Noorka et al.
2013). Austin et al. (1980), suggested that N is diluted by higher carbohydrate assimilation resulting
in lower grain protein in higher yielding materials. The slightly higher protein under conventional
tillage environments compared to zero-tillage in the current study probably reflects the difficulty of
placing N accurately in zero-tillage systems. The results suggest that early heading, shorter and earlier
maturing genotypes tended to have higher protein content. Genotypes with the highest protein included
the prime hard cultivars Sunvex, Ellison, Spitfire, Sunlin and Sunvale.
7.5 Wheat ideotypes adapted to zero-tillage rainfed environments in northwestern NSW,
Australia.
The identification and selection of water-use-efficient genotypes adapted to zero-tillage rainfed
systems is the goal of breeding programs in northwestern NSW. In the current study, the cultivars
Crusader, Janz, Merinda, EGA Stampede and Lincoln were the most water-use-efficient whilst
Ventura, Sunvale, Ellison, Sunlin and Sunvex were the least. This superior performance could be
attributed to early canopy ground cover to reduce moisture loss through evaporation, faster canopy
development to capture sunlight resulting in earliness to heading to avoid peak periods of moisture
stress especially at anthesis, higher eventual biomass, higher harvest indices, cooler canopies (probably
a reflection of deeper rooting) and higher photosynthetic and stomatal conductance rates.
7.6 Association Analysis
This study confirmed that genetic association analysis was effective in developing higher
yielding progeny through selection and recombination based on MTAs with a caveat. The caveat is
that MTAs must be confirmed through additional testing as many of the earlier MTAs identified in the
Atta (2013) study were not repeatable and were either artefactual or limited by significant marker x

197
environment interactions. These results are therefore preliminary and would require further evaluation
of materials for confirmation.
When the smaller number of consistent markers that influenced grain yield found on
chromosomes 1A, 1B, 2B, 4B and 6B were targeted, the resulting progeny tended to have higher grain
yield. These consistent high value markers located on chromosome 1B between 30.96 and 31.64 cM
and on 6B at 15.41 cM. However, the head-to-head analysis of the same materials evaluated in the
multi-environment Atta (2013) study revealed several new MTAs for yield and other traits. These new
MTAs likewise must be validated before broad scale selection in breeding to ensure populations are
improved for alleles that actually contribute to phenotype.
In the current study, highest numbers of DArT markers significantly associated with grain yield were
found on the B genome with the least on D genome; an observation similar to Crossa et al. (2007b).
New MTAs for grain yield from the head-to-head study were found on chromosome 1A (wPt-3825),
1B (wPt-7905 and wPt-2075) and 5D (wPt-2859). Several previously unreported MTAs for heading
date were found on chromosomes 7B and 4B whilst new MTAs for maturity were identified on
chromosomes 3D, 4D, 5D and 7D.
7.7 Conclusions
1. The results of this study indicated that 5 key physiological traits, mainly days to heading,
NDVI, leaf rolling, earliness to ground cover and grain filling duration are likely responsible in
part or in combination for the observed significant marker trait associations in the current study
and could be targeted indirectly to develop cultivars with superior drought tolerance (Chapter
3).
2. Higher yield could be achieved under drought when water-use-efficient cultivars are deployed
in zero-tillage systems (Chapter 3).
3. Higher yield with improved water use efficiency could be achieved under moisture stress when
high yielding cultivars are carefully combined mechanically in mixtures based on significant
and repeatable MTAs and deployed in zero-tillage systems (Chapter 4).
4. Comparatively few MTAs identified in the earlier Atta (2013) analysis were confirmed in the
head-to-head association analyses in 2014 and 2015 (Chapter 5).

198
5. Recombination of targeted markers associated with grain yield into progenies resulted in
additive effects revealing superior yield (Chapter 6). Association analysis could therefore be
validly applied in developing cultivars with improved yield in rainfed conditions.

199
8 References ABARE, 2012. Wheat growing regions of Australia. National Income and Expenditure Data Series, Australia. Abdallah JM, Goffinet B, Cierco-Ayrolles C, Perez-Enciso M (2003) Linkage disequilibrium fine mapping of
quantitative trait loci: A simulation study. GENETICS SELECTION EVOLUTION 35, 513-532. Abdurakhmonov IY, Abdukarimov A (2008) Application of association mapping to understanding the genetic
diversity of plant germplasm resources. International journal of plant genomics 2008, 574927-18. Acevedo E (1991) Morphophysiological traits of adaptation of cereals to Mediterranean environments.
Monografias-Instituto Nacional de Investigaciones Agrarias Acevedo E, Ceccarelli S (1989) Role of the physiologist-breeder in a breeding program for drought resistance
conditions. Acevedo E, Silva P, Silva H (2006) Growth and Wheat Physiology, Development. Laboratory of Soil Plant Water
Relations. Faculty of Agronomy and Forestry Sciences. University of Chile, Chile 1-47. Adu-Gyamfi P, Mahmood T, Trethowan R (2015) Can wheat varietal mixtures buffer the impacts of water
deficit? Crop and Pasture Science 66, 757-769. Agbicodo EM, Fatokun CA, Muranaka S, Visser RGF, Linden van der CG (2009) Breeding drought tolerant
cowpea: constraints, accomplishments, and future prospects. Euphytica 167, 353-370. Aggarwal P, Sinha S (1984) Effect of water stress on grain growth and assimilate partitioning in two cultivars of
wheat contrasting in their yield stability in a drought-environment. Annals of botany 53, 329-340. Ain Q-u, Rasheed A, Anwar A, Mahmood T, Imtiaz M, Mahmood T, Xia X, He Z, Quraishi UM (2015) Genome-
wide association for grain yield under rainfed conditions in historical wheat cultivars from Pakistan. Frontiers in plant science 6,
Allah A (2009) Genetic studies on leaf rolling and some root traits under drought conditions in rice (Oryza sativa L.). AFRICAN JOURNAL OF BIOTECHNOLOGY 8,
Amani I, Fischer RA, Reynolds MP (1996) Canopy temperature depression association with yield of irrigated spring wheat cultivars in a hot climate. JOURNAL OF AGRONOMY AND CROP SCIENCE-ZEITSCHRIFT FUR ACKER UND PFLANZENBAU 176, 119-129.
Ambalamaatil S, Lukow OM, Hatcher DW, Dexter JE, Malcolmson LJ, Watts BM (2002) Milling and quality evaluation of Canadian hard white spring wheats. CEREAL FOODS WORLD 47, 319-327.
Anwar MR, O’Leary G, McNeil D, Hossain H, Nelson R (2007) Climate change impact on rainfed wheat in south-eastern Australia. Field Crops Research 104, 139-147.
Araus JL, Amaro T, Casadesus J, Asbati A, Nachit MM (1998) Relationships between ash content, carbon isotope discrimination and yield in durum wheat. AUSTRALIAN JOURNAL OF PLANT PHYSIOLOGY 25, 835-842.
Araus JL, Slafer GA, Reynolds MP, Royo C (2002) Plant breeding and drought in C3 cereals: what should we breed for? Annals of botany 89 Spec No, 925-940.
Arief V (2010) Methodology development to integrate phenotypic and genotypic data from a plant breeding program through association analysis with a case study using data from the CIMMYT International Spring Wheat field trials.
Arief VN, DeLacy IH, Basford KE, Dieters MJ (2017) Application of a dendrogram seriation algorithm to extract pattern from plant breeding data. Euphytica 213, 85.
Asghar S, Kashif M, Khan AS, Khaliq I, Farooq J (2011) Comparative studies on some yield contributing traits of wheat sown in binary mixtures. Frontiers of Agriculture in China 5, 141-145.
Ashraf M (2010) Inducing drought tolerance in plants: Recent advances. Biotechnology Advances 28, 169-183. Ashraf M, Azmi A, Khan A, Ala S (1994) Effect of water stress on total phenols, peroxidase activity and
chlorophyll content in wheat [Triticum aestivum L.]. Acta Physiologiae Plantarum 16, Atta bM (2013) The basis of improved water use efficiency and adaptation in hexaploid wheat. Faculty of
Agriculture and Environment U6 - ctx_ver=Z39.88-2004&ctx_enc=info%3Aofi%2Fenc%3AUTF-8&rfr_id=info:sid/summon.serialssolutions.com&rft_val_fmt=info:ofi/fmt:kev:mtx:book&rft.genre=dissertation&rft.title=The+basis+of+improved+water+use+efficiency+and+adaptation+in+hexaploid+whe

200
at&rft.DBID=LKP&rft.au=Atta%2C+babar+Manzoor&rft.date=2013-03-26&rft.pub=Faculty+of+Agriculture+and+Environment&rft.externalDBID=n%2Fa&rft.externalDocID=oai_ses_library_usyd_edu_au_2123_9930¶mdict=en-US U7 - Dissertation.
Austin R, Bingham J, Blackwell R, Evans L, Ford M, Morgan C, Taylor M (1980) Genetic improvements in winter wheat yields since 1900 and associated physiological changes. The Journal of Agricultural Science 94, 675-689.
Austin RB, Craufurd PQ, Hall MA, Acevedo E, Pinheiro BD, Ngugi ECK (1990) Carbon isotope discrimination as a means of evaluation drought resistance in barley, rice and cowpea. Bulletin de la societe botanique de France-Actualities 137, 21-30.
Ayeneh A, van Ginkel M, Reynolds MP, Ammar K (2002) Comparison of leaf, spike, peduncle and canopy temperature depression in wheat under heat stress. Field Crops Research 79, 173-184.
Babar MA, Reynolds MP, Van Ginkel M, Klatt AR, Raun WR, Stone ML (2006) Spectral reflectance to estimate genetic variation for in-season biomass, leaf chlorophyll, and canopy temperature in wheat. Crop science 46, 1046-1057.
Båga M, Fowler DB, Chibbar RN (2009) Identification of genomic regions determining the phenological development leading to floral transition in wheat (Triticum aestivum L.). Journal of experimental botany 60, 3575-3585.
Bai C, Liang Y, Hawkesford MJ (2013) Identification of QTLs associated with seedling root traits and their correlation with plant height in wheat. Journal of experimental botany 64, 1745-1753.
Baker CJ, Saxton KE (2007) 'No-tillage seeding in conservation agriculture.' (CABI: Baker R, Briggs K (1984) Comparison of grain yield of uniblends and biblends of 10 spring barley cultivars. Crop
science 24, 85-87. Balota M, Payne WA, Evett SR, Lazar MD (2007) Canopy temperature depression sampling to assess grain yield
and genotypic differentiation in winter wheat. Crop science 47, 1518-1529. Bansal U, Hayden M, Gill M, Bariana H (2010) Chromosomal location of an uncharacterised stripe rust
resistance gene in wheat. Euphytica 171, 121-127. Barrett J (1981) The evolutionary consequences of monoculture. Genetic consequences of man-made change.
Academic 209-248. Basra SMA, M. Farooq, Khaliq A (2003) Comparative study of pre-sowing seed enhancement treatments in fine
rice (Oryza sativa L.). Pak. J. Life and Soc. Sci. 1, 5-9.
Bassett L, Allan R, Rubenthaler G (1989) Genotype✕ Environment Interactions on Soft White Winter Wheat Quality. Agronomy Journal 81, 955-960.
Bayoumi TY, Eid MH, Metwali EM (2008) Application of physiological and biochemical indices as a screening technique for drought tolerance in wheat genotypes. AFRICAN JOURNAL OF BIOTECHNOLOGY 7, 2341-2352.
Bean MM, Huang DS, Miller RE (1990) Some wheat and flour properties of Klasic - A hard White Wheat. CEREAL CHEMISTRY 67, 307-309.
Begum FA, Paul NK (1993) Influence of soil-moisture on growth, water-use and yield of mustard. journal of agronomy and crop science-zeitschrift fur acker und pflanzenbau 170, 136-141.
Beltrano J, Ronco MG (2008) Improved tolerance of wheat plants (Triticum aestivum L.) to drought stress and rewatering by the arbuscular mycorrhizal fungus Glomus claroideum: effect on growth and cell membrane stability. Brazilian Journal of Plant Physiology 20, 29-37.
Beltrano J, Ronco MG, Arango MC (2006) Soil drying and rewatering applied at three grain developmental stages affect differentially growth and grain protein deposition in wheat (Triticum aestivum L.). Brazilian Journal of Plant Physiology 18, 341-350.
Benjamin JG (1993) Tillage effects on near-surface soil hydraulic properties. SOIL & TILLAGE RESEARCH 26, 277-288.

201
Bennett D, Reynolds M, Mullan D, Izanloo A, Kuchel H, Langridge P, Schnurbusch T (2012) Detection of two major grain yield QTL in bread wheat (Triticum aestivum L.) under heat, drought and high yield potential environments. Theoretical and Applied Genetics 125, 1473-1485.
Bentley AR, Scutari M, Gosman N, Faure S, Bedford F, Howell P, Cockram J, Rose GA, Barber T, Irigoyen J, Horsnell R, Pumfrey C, Winnie E, Schacht J, Beauchêne K, Praud S, Greenland A, Balding D, Mackay IJ (2014) Applying association mapping and genomic selection to the dissection of key traits in elite European wheat. Theoretical and Applied Genetics 127, 2619-2633.
Bentley AR, Turner AS, Gosman N, Leigh FJ, Maccaferri M, Dreisigacker S, Greenland A, Laurie DA (2011) Frequency of photoperiod‐insensitive Ppd‐A1a alleles in tetraploid, hexaploid and synthetic hexaploid wheat germplasm. Plant Breeding 130, 10-15.
Berger GL, Liu S, Hall MD, Brooks WS, Chao S, Muehlbauer GJ, Baik BK, Steffenson B, Griffey CA (2013) Marker-trait associations in Virginia Tech winter barley identified using genome-wide mapping. Theoretical and Applied Genetics 126, 693-710.
Bespalova LA, Koshkin VA, Potokina EK, Filobok VA, Matvienko II, Mitrofanova OP, Guenkova EA (2010) Photoperiod sensitivity and molecular marking of genes Ppd and Vrn in connection with breeding alternative-habit wheat varieties. Russian Agricultural Sciences 36, 389-392.
Bidinger FR (1987) Assessment of drought resistance in pearl millet ["Pennisetum americanum" (L.) Leeke]. II. Estimation of genotype response to stress. Australian Journal of Agricultural Research 38, 49.
Bijanzadeh E, Emam Y (2010) Effect of source-sink manipulation on yield components and photosynthetic characteristic of wheat cultivars (Triticum aestivum and T. durum L.). Journal of Applied Sciences 10, 564-569.
Blanco A, Mangini G, Giancaspro A, Giove S, Colasuonno P, Simeone R, Signorile A, De Vita P, Mastrangelo A, Cattivelli L (2012) Relationships between grain protein content and grain yield components through quantitative trait locus analyses in a recombinant inbred line population derived from two elite durum wheat cultivars. Molecular Breeding 30, 79-92.
Blevins R, Cook D, Phillips S, Phillips R (1971) Influence of no-tillage on soil moisture. Agronomy Journal 63, 593-596.
Blevins RL, Frye WW (1993) Conservation tillage - an ecological approach to soil-management. Vol. 51 pp. 33-78. (ACADEMIC PRESS INC: SAN DIEGO)
Blum A (1988a) 'Plant breeding for stress environments.' (CRC Press, Inc.: Blum A (1988b) 'Plant breeding for stress environments.' (CRC Press: Boca Raton, Fla) Blum A (2005) Drought resistance, water-use efficiency, and yield potential - are they compatible, dissonant,
or mutually exclusive? Australian Journal of Agricultural Research 56, 1159-1168. Blum A (2009) Effective use of water (EUW) and not water-use efficiency (WUE) is the target of crop yield
improvement under drought stress. Field Crops Research 112, 119-123. Blum A (2011) 'Plant breeding for water-limited environments.' (Springer: New York) Blum A, Mayer J, Gozlan G (1982) Infrared thermal sensing of plant canopies as a screening technique for
dehydration avoidance in wheat. Field Crops Research 5, 137-146. Blum A, Shpiler L, Golan G, Mayer J (1989) Yield stability and canopy temperature of wheat genotypes under
drought-stress. Field Crops Research 22, 289-296. Borghei A, Taghinejad J, Minaei S, Karimi M, Varnamkhasti M (2008) Effects of subsoiling on soil bulk density,
penetration resistance and cotton yield in northwest of Iran. International Journal of Agricultural Biology 10, 120-123.
Borner A, Worland AJ, Plaschke J, Schumann E, Law CN (1993) Pleiotropic effects of genes for reduced height (rht) and day-length insensitivity (ppd) on yield and its components for wheat grown in middle europe. Plant Breeding 111, 204-216.
Borrell A, Bidinger F, Sunitha K (1999) Stay-green trait associated with yield in recombinant inbred sorghum lines varying in rate of leaf senescence. International Sorghum and Millets Newsletter 40, 31-34.

202
Borrell AK, Hammer GL, Douglas AC (2000a) Does maintaining green leaf area in sorghum improve yield under drought? I. Leaf growth and senescence. Crop science 40, 1026-1037.
Borrell AK, Hammer GL, Henzell RG (2000b) Does maintaining green leaf area in sorghum improve yield under drought? II. Dry matter production and yield. Crop science 40, 1037-1048.
Bousba R, Ykhlef N, Djekoun A (2009) Water use efficiency and flag leaf photosynthetic in response to water deficit of durum wheat (Triticum durum Desf.). World Journal of Agricultural Sciences 5, 609-616.
Bowden RL, Shroyer JP, Roozeboom KL, Claassen M, Evans PM, Gordon B, Heer B, Janssen K, Long JH, Martin J (2001) Performance of wheat variety blends in Kansas.
Braidwood RJ, Cambel H, Watson PJ (1969) Prehistoric investigations in south-western Turkey. science 164, 1275-1276.
Brenner ED, Stahlberg R, Mancuso S, Vivanco J, Baluska F, Van Volkenburgh E (2006) Plant neurobiology: an integrated view of plant signaling. Trends in Plant Science 11, 413-419.
Breseghello F, Sorrells ME (2006a) Association analysis as a strategy for improvement of quantitative traits in plants. Crop Science 46, 1323-1330.
Breseghello F, Sorrells ME (2006b) Association Mapping of Kernel Size and Milling Quality in Wheat (Triticum aestivum L.) Cultivars. Genetics 172, 1165-1177.
Briggle LW (Ed. E Häfliger (1980) 'Origin and botany of wheat.' Basle, Switzerland) Browning JA, Frey KJ (1969) Multiline Cultivars as a Means of Disease Control. Annual Review of
Phytopathology 7, 355-382. Brush SB (1991) A farmer-based approach to conserving crop germplasm. Economic Botany 45, 153-165. Buckler ES, Holland JB, Bradbury PJ, Acharya CB, Brown PJ, Browne C, Ersoz E, Flint-Garcia S, Garcia A, Glaubitz
JC, Goodman MM, Harjes C, Guill K, Kroon DE, Larsson S, Lepak NK, Li H, Mitchell SE, Pressoir G, Peiffer JA, Rosas MO, Rocheford TR, Romay MC, Romero S, Salvo S, Villeda HS, Silva HSd, Sun Q, Tian F, Upadyayula N, Ware D, Yates H, Yu J, Zhang Z, Kresovich S, McMullen MD (2009) The Genetic Architecture of Maize Flowering Time. Science 325, 714-718.
Bullrich L, Appendino ML, Tranquilli G, Lewis S, Dubcovsky J (2002) Mapping of a thermo-sensitive earliness per se gene on Triticum monococcum chromosome 1A(m). Theoretical and Applied Genetics 105, 585-593.
Cabuslay GS, Ito O, Alejar AA (2002) Physiological evaluation of responses of rice ( Oryza sativa L.) to water deficit. Plant Science 163, 815-827.
Calderini DF, Slafer GA (1999) Has yield stability changed with genetic improvement of wheat yield? Euphytica 107, 51-59.
Callaway RM (1995) Positive Interactions among Plants. Botanical Review 61, 306-349. Calonnec A, Goyeau H, deVallaviellePope C (1996) Effects of induced resistance on infection efficiency and
sporulation of Puccinia striiformis on seedlings in varietal mixtures and on field epidemics in pure stands. European Journal of Plant Pathology 102, 733-741.
Cantero‐Martínez C, Angás P, Lampurlanés J (2007) Long‐term yield and water use efficiency under various tillage systems in Mediterranean rainfed conditions. Annals of Applied Biology 150, 293-305.
Cao W, Jia J, Jin J (2003) Identification and interaction analysis of QTL for chlorophyII content in wheat seedlings. Plant Nutrition and Fertitizer Science 10, 473-478.
Carr PM, Horsley RD, Poland WW (2003a) Tillage and seeding rate effects on wheat cultivars: I. Grain production. Crop science 43, 202-209.
Carr PM, Horsley RD, Poland WW (2003b) Tillage and seeding rate effects on wheat cultivars: II. Yield components. Crop science 43, 210-218.
Carrow RN (1996) Drought avoidance characteristics of diverse tall fescue cultivars. Crop science 36, 371-377. Carter A, Garland-Campbell K, Kidwell K (2011) Genetic Mapping of Quantitative Trait Loci Associated with
Important Agronomic Traits in the Spring Wheat (L.) Cross ‘Louise’בPenawawa’. Crop Science 51, 84-95.

203
Casa R (2007) Agronomic perspective on the increase of water use efficiency at the field scale in Mediterranean environments. Options Mediterr. Ser. A 7, 83-91.
Cattivelli L, Rizza F, Badeck F-W, Mazzucotelli E, Mastrangelo AM, Francia E, Marè C, Tondelli A, Stanca AM (2008) Drought tolerance improvement in crop plants: An integrated view from breeding to genomics. Field Crops Research 105, 1-14.
Champoux MC, Wang G, Sarkarung S, Mackill DJ, Otoole JC, Huang N, McCouch SR (1995) Locating genes associated with root morphology and drought avoidance in rice via linkage to molecular markers. Theoretical and Applied Genetics 90, 969-981.
Chan K, Mead J (1989) Water movement and macroporosity of an Australian Alfisol under different tillage and pasture conditions. Soil and Tillage Research 14, 301-310.
Chan K, Mead J, Roberts W (1987) Poor early growth of wheat under direct drilling. Crop and Pasture Science 38, 791-800.
Chauhan BS, Gill GS, Preston C (2006) Tillage system effects on weed ecology, herbicide activity and persistence: a review. Australian Journal of Experimental Agriculture 46, 1557-1570.
Chaves MM, Oliveira MM (2004) Mechanisms underlying plant resilience to water deficits: prospects for water-saving agriculture. Journal of experimental botany 55, 2365-2384.
Chin KM, Wolfe MS (1984) Selection on Erysiphe graminis in pure and mixed stands of barley. PLANT PATHOLOGY 33, 535-546.
Cinnirella S, Magnani F, Saracino A, Borghetti M (2002) Response of a mature Pinus laricio plantation to a three-year restriction of water supply: structural and functional acclimation to drought. Tree physiology 22, 21-30.
Clark LJ, Whalley WR, Barraclough PB (2003) How do roots penetrate strong soil? Plant and Soil 255, 93-104. Clarke JM, McCaig TN (1982) Excised-leaf water retention capability as an indicator of drought resistance
oftriticumgenotypeS. Canadian Journal of Plant Science 62, 571-578. Clarke JM, Richards RA (1988) The effects of glaucousness, epicuticular wax, leaf age, plant height, and growth
environment on water loss rates of excised wheat leaves. canadian journal of plant science 68, 975-982.
Clay RE, Allard RW (1969) A comparison of the performance of homogeneous and heterogeneous barley populations. Crop science 9, 407-412.
Clewer AG, Scarisbrick DH (2013) 'Practical Statistics and Experimental Design for Plant and Crop Science.' (Wiley: Hoboken)
Cobb JN, DeClerck G, Greenberg A, Clark R, McCouch S (2013) Next-generation phenotyping: requirements and strategies for enhancing our understanding of genotype–phenotype relationships and its relevance to crop improvement. Theoretical and Applied Genetics 126, 867-887.
Collard BC, Mackill DJ (2008) Marker-assisted selection: an approach for precision plant breeding in the twenty-first century. Philosophical Transactions of the Royal Society B: Biological Sciences 363, 557-572.
Condon A. G, E. HA (1997) Adaptation to diverse environments: genotypic variation in water-use efficiency within crop species. In 'Agricultural ecology.' (Ed. JL E.) pp. 79-116. (Academic Press, : San Diego, CA)
Condon AG, Farquhar GD, Richards RA (1990) Genotypic variation in carbon isotope discrimination and transpiration efficiency in wheat - leaf gas-exchange and whole plant studies. australian journal of plant physiology 17, 9-22.
Condon AG, Reynolds MP, Rebetzke GJ, Ginkel Mv, Richards RA, Farquhar GD (2007) Using Stomatal Aperture-Related Traits to Select for High Yield Potential in Bread Wheat. In 'Wheat Production in Stressed Environments.' (Eds HT Buck, JE Nisi, N Salomón.) Vol. 12 pp. 617-624. (Springer Netherlands:
Condon AG, Richards RA (1992) BROAD SENSE HERITABILITY AND GENOTYPE X ENVIRONMENT INTERACTION FOR CARBON ISOTOPE DISCRIMINATION IN FIELD-GROWN WHEAT. Australian Journal of Agricultural Research 43, 921-934.

204
Condon AG, Richards RA, Farquhar GD (1987) Carbon Isotope Discrimination is Positively Correlated with Grain Yield and Dry Matter Production in Field-Grown Wheat1. Crop Sci. 27, 996-1001.
Condon AG, Richards RA, Farquhar GD (1993) Relationships between carbon-isotope discrimination, water-use efficiency and transpiration efficiency for dryland wheat. Australian Journal of Agricultural Research 44, 1693-1711.
Condon AG, Richards RA, Rebetzke GJ, Farquhar GD (2002) Improving intrinsic water-use efficiency and crop yield. Crop science 42, 122-131.
Condon AG, Richards RA, Rebetzke GJ, Farquhar GD (2004) Breeding for high water-use efficiency. J Exp Bot 55, 2447-60.
Conocono EA (2002) Improving yield of wheat experiencing postanthesis water deficits through the use of shoot carbohydrate reserves. University of Western Australia.
Cook RJ (2006) Toward Cropping Systems That Enhance Productivity and Sustainability. Proceedings of the National Academy of Sciences of the United States of America 103, 18389-18394.
Cooper DJ, D'Amico DR, Scott ML (2003) Physiological and Morphological Response Patterns of Populus deltoides to Alluvial Groundwater Pumping. Environmental Management 31, 0215-0226.
Cooper J (1992) Effect of time sowing and cultivar on the development and grain yield of irrigated wheat in the Macquarie Valley, New South Wales. Animal Production Science 32, 345-353.
Cooper PJM, Gregory PJ, Keatinge JDH, Brown SC (1987) Effects of fertilizer, variety and location on barley production under rainfed conditions in Northern Syria 2. Soil water dynamics and crop water use. Field Crops Research 16, 67-84.
Corlett J, Jones H, Massacci A, Masojidek J (1994) Water deficit, leaf rolling and susceptibility to photoinhibition in field grown sorghum. Physiologia plantarum 92, 423-430.
Cowger C, Weisz R (2008) Winter wheat blends (mixtures) produce a yield advantage in north Carolina. Agronomy Journal 100, 169-177.
Cox D (1991) Breeding for hard red winter wheat cultivars adapted to conventional-till and no-till systems in northern latitudes. Euphytica 58, 57-63.
Cox D (2010) Performance of hard red winter wheat cultivars under conventional-till and no-till systems. Cox D, Shelton D (1992) Genotype-by-tillage interactions in hard red winter wheat quality evaluation.
Agronomy Journal 84, 627-630. Crossa J, Burgueno J, Dreisigacker S, Vargas M, Herrera-Foessel SA, Lillemo M, Singh RP, Trethowan R,
Warburton M, Franco J, Reynolds M, Crouch JH, Ortiz R (2007a) Association Analysis of Historical Bread Wheat Germplasm Using Additive Genetic Covariance of Relatives and Population Structure. Genetics 177, 1889-1913.
Crossa J, Burgueño J, Dreisigacker S, Vargas M, Herrera-Foessel SA, Lillemo M, Singh RP, Trethowan R, Warburton M, Franco J, Reynolds M, Crouch JH, Ortiz R (2007b) Association Analysis of Historical Bread Wheat Germplasm Using Additive Genetic Covariance of Relatives and Population Structure. Genetics 177, 1889-1913.
Crossa J, Franco J, Reynolds M, Crouch JH, Ortiz R, Burgueno J, Dreisigacker S, Vargas M, Herrera-Foessel SA, Lillemo M, Singh RP, Trethowan R, Warburton M (2007c) Association Analysis of Historical Bread Wheat Germplasm Using Additive Genetic Covariance of Relatives and Population Structure. Genetics 177, 1889-1913.
Cruz R, O'Toole J (1984) Dryland rice response to an irrigation gradient at flowering stage. Agronomy Journal 76, 178-183.
Curtis B, Rajaram S, Macpherson HG (2002) and Production. Dai J, Wiersma J, Holen D (2012) Performance of hard red spring wheat cultivar mixtures. Agronomy Journal
104, 17-21. Dalton E, Griffin D, Gallagher TF, Vetten N, Milbourne D (2013) The effect of pyramiding two potato cyst
nematode resistance loci to Globodera pallida Pa2/3 in potato. Molecular Breeding 31, 921-930.

205
Danyluk J, Sarhan F (2003) TaVRT-1, a Putative Transcription Factor Associated with Vegetative to Reproductive Transition in Cereals. Plant Physiology 132, 1849-1860.
Dao TH, Nguyen HT (1989) Growth-response of cultivars to conservation tillage in a continuous wheat cropping system. Agronomy Journal 81, 923-929.
Davies WJ, Kudoyarova G, Hartung W (2005) Long-distance ABA Signaling and Its Relation to Other Signaling Pathways in the Detection of Soil Drying and the Mediation of the Plant’s Response to Drought. Journal of Plant Growth Regulation 24, 285-295.
De Vita P, Di Paolo E, Fecondo G, Di Fonzo N, Pisante M (2007a) No-tillage and conventional tillage effects on durum wheat yield, grain quality and soil moisture content in southern Italy. Soil and Tillage Research 92, 69-78.
De Vita P, Di Paolo E, Fecondo G, Di Fonzo N, Pisante M (2007b) No-tillage and conventional tillage effects on durum wheat yield, grain quality and soil moisture content in southern Italy. SOIL & TILLAGE RESEARCH 92, 69-78.
Debaeke P (2004) Scenario analysis for cereal management in water-limited conditions by the means of a crop simulation model (STICS). Agronomie 24, 315-326.
Derpsch R, García-Torres L, Benites J, Martínez-Vilela A (2001) 'Conservation tillage, no-tillage and related technologies, Conservation agriculture, a worldwide challenge. First World Congress on conservation agriculture, Madrid, Spain, 1-5 October, 2001. Volume 1: keynote contributions.'. (XUL:
Di Paolo E, Rinaldi M (2008) Yield response of corn to irrigation and nitrogen fertilization in a Mediterranean environment. Field Crops Research 105, 202-210.
Diab AA, Kantety R, Ozturk N, Benscher D, Nachit M, Sorrells M (2008a) Drought-inducible genes and differentially expressed sequence tags associated with components of drought tolerance in durum wheat. Sci Res Essay 3, 009-026.
Diab AA, Kantety RV, Ozturk NZ, Benscher D, Nachit MM, Sorrells ME (2008b) Drought - inducible genes and differentially expressed sequence tags associated with components of drought tolerance in durum wheat. SCIENTIFIC RESEARCH AND ESSAYS 3, 9-26.
Diab AA, Teulat-Merah B, This D, Ozturk NZ, Benscher D, Sorrells ME (2004) Identification of drought-inducible genes and differentially expressed sequence tags in barley. Theoretical and Applied Genetics 109, 1417-1425.
Dingkuhn M, Cruz R, O'Toole J (1989) Net photosynthesis, water use efficiency, leaf water potential and leaf rolling as affected by water deficit in tropical upland rice. Crop and Pasture Science 40, 1171-1181.
Dodig D, Zoric M, Kobiljski B, Savic J, Kandic V, Quarrie S, Barnes J (2012) Genetic and association mapping study of wheat agronomic traits under contrasting water regimes. International journal of molecular sciences 13, 6167-6188.
Donmez E, Sears R, Shroyer J, Paulsen G (2001) Genetic gain in yield attributes of winter wheat in the Great Plains. Crop science 41, 1412-1419.
Dorion S, Lalonde S (1996) Induction of Male Sterility in Wheat by Meiotic-Stage Water Deficit Is Preceded by a Decline in Invertase Activity and Changes in Carbohydrate Metabolism in Anthers. Plant Physiology 111, 137-145.
Dubcovsky J, Dvorak J (2007) Genome plasticity a key factor in the success of polyploid wheat under domestication. Science (New York, N.Y.) 316, 1862-1866.
Dubcovsky J, Loukoianov A, Fu D, Valarik M, Sanchez A, Yan L (2006) Effect of Photoperiod on the Regulation of Wheat Vernalization Genes VRN1 and VRN2. Plant Molecular Biology 60, 469-480.
Dulai S, Molnár I, Prónay J, Csernak A, Tarnai R, Molnár-Láng M (2006) Effects of drought on photosynthetic parameters and heat stability of PSII in wheat and in Aegilops species originating from dry habitats. Acta Biologica Szegediensis 50, 11-17.
Duveiller E, Singh RP, Nicol JM (2007) The challenges of maintaining wheat productivity: pests, diseases, and potential epidemics. Euphytica 157, 417-430.

206
Duvick D, Janick J, Simon J (1990) 'Genetic enhancement and plant breeding, Advances in new crops. Proceedings of the first national symposium'New crops: research, development, economics', Indianapolis, Indiana, USA, 23-26 October 1988.'. (Timber Press:
Eagles HA, Cane K, Kuchel H, Hollamby GJ, Vallance N, Eastwood RF, Gororo NN, Martin PJ (2010) Photoperiod and vernalization gene effects in southern Australian wheat. Crop & Pasture Science 61, 721-730.
Eagles HA, Cane K, Vallance N (2009) The flow of alleles of important photoperiod and vernalisation genes through Australian wheat. Crop & Pasture Science 60, 646-657.
Eberhart St, Russell W (1966) Stability parameters for comparing varieties. Crop science 6, 36-40. Ecocrop (2011) Available at http://ecocrop.fao.org/ecocrop/srv/en/home Edae EA, Byrne PF, Haley SD, Lopes MS, Reynolds MP (2014) Genome-wide association mapping of yield and
yield components of spring wheat under contrasting moisture regimes. Theoretical and Applied Genetics 127, 791-807.
Edae EA, Byrne PF, Manmathan H, Haley SD, Moragues M, Lopes MS, Reynolds MP (2013) Association mapping and nucleotide sequence variation in five drought tolerance candidate genes in spring wheat. The Plant Genome 6,
Ehdaie B, Barnhart D, Waines J (2001) Inheritance of root and shoot biomass in a bread wheat cross [Triticum aestivum L.]. Journal of Genetics & Breeding 55,
Ehdaie B, Hall AE, Farquhar GD, Nguyen HT, Waines JG (1991) WATER-USE EFFICIENCY AND CARBON ISOTOPE DISCRIMINATION IN WHEAT. Crop science 31, 1282-1288.
Ehdaie B, Layne AP, Waines JG (2012) Root system plasticity to drought influences grain yield in bread wheat. Euphytica 186, 219-232.
Ehdaie B, Whitkus RW, Waines JG (2003) Root Biomass, Water-Use Efficiency, and Performance of Wheat–Rye Translocations of Chromosomes 1 and 2 in Spring Bread Wheat ‘Pavon’. Crop Sci. 43, 710-717.
Ehlers A, Hämmerli A, Worm B, Lubchenco J (2005) Ecosystem Recovery after Climatic Extremes Enhanced by Genotypic Diversity. Proceedings of the National Academy of Sciences of the United States of America 102, 2826-2831.
Eigenbrode SD, Espelie KE (1995) Effects of Plant Epicuticular Lipids on Insect Herbivores. Annual Review of Entomology 40, 171-194.
El Titi A (2003) 'Soil tillage in agroecosystems.' (CRC Press: Boca Raton, FL) Emundo Acevedo E, Opazo M, Silva P, Silva H (1998a) PERFORMANCE, PERFORMANCE COMPONENTS AND
RESISTANCE TO DROUGHT IN WHEAT (Triticum aestivum L.). Bol. Técn. Esta. Exp. Agron. 49, 1-28. Fa rizzi P, Garc a FO, Costa JL, Picone LI (2005) Soil water dynamics, physical properties and corn and wheat
responses to minimum and no-tillage systems in the southern Pampas of Argentina. SOIL & TILLAGE RESEARCH 81, 57-69.
Fang TY-lLJWY-qWH-tLC-SYW-yC (2011) Identification of QTLs for Yield-Related Traits in the Recombinant Inbred Line Population Derived from the Cross Between a Synthetic Hexaploid Wheat- Derived Variety
Chuanmai 42 and a Chinese Elite Variety Chuannong 16. 中国农业科学:英文版 10, 1665-1680.
Fang Y, Xu B, Liu L, Gu Y, Liu Q, Turner NC, Li FM (2014a) Does a mixture of old and modern winter wheat cultivars increase yield and water use efficiency in water-limited environments? Field Crops Research 156, 12-21.
Fang Y, Xu B, Liu L, Gu Y, Liu Q, Turner NC, Li FM (2014b) Does a mixture of old and modern winter wheat cultivars increase yield and water use efficiency in water-limited environments? Field Crops Research 156, 12-21.
Faraji J (2011) Wheat cultivar blends: A step forward to sustainable agriculture. AFRICAN JOURNAL OF AGRICULTURAL RESEARCH 6, 6780-6789.
Farooq M, Flower KC, Jabran K, Wahid A, Siddique KHM (2011) Crop yield and weed management in rainfed conservation agriculture. SOIL & TILLAGE RESEARCH 117, 172-183.
Farquhar GD, Ehleringer JR, Hubick KT (1989) Carbon Isotope Discrimination and Photosynthesis. Annual Review of Plant Biology 40, 503-537.

207
Farquhar GD, O'Leary MH, Berry JA (1982) On the Relationship Between Carbon Isotope Discrimination and the Intercellular Carbon Dioxide Concentration in Leaves. AUSTRALIAN JOURNAL OF PLANT PHYSIOLOGY 9, 121.
Farquhar GD, Richards RA (1984) Isotopic Composition of Plant Carbon Correlates With Water-Use Efficiency of Wheat Genotypes. AUSTRALIAN JOURNAL OF PLANT PHYSIOLOGY 11, 539.
Fehr W, Rodriguez S (1974) Effect of row spacing and genotypic frequency on the yield of soybean blends. Crop science 14, 521-525.
Feldman M (2001) Origin of cultivated wheat. In 'The world wheat book: a history of wheat breeding.' (Eds BA P., AW J.) pp. 3-56. ( Lavoisier Publishing: Paris, France)
Fernández-Ugalde O, Virto I, Bescansa P, Imaz M, Enrique A, Karlen D (2009a) No-tillage improvement of soil physical quality in calcareous, degradation-prone, semiarid soils. Soil and Tillage Research 106, 29-35.
Fernández-Ugalde O, Virto I, Bescansa P, Imaz MJ, Enrique A, Karlen DL (2009b) No-tillage improvement of soil physical quality in calcareous, degradation-prone, semiarid soils. SOIL & TILLAGE RESEARCH 106, 29-35.
Finckh MR, de Vallavieille-Pope C, Wolfe MS, Gacek ES, Goyeau H, Lannou C, Merz U, Mundt CC, Munk L, Nadziak J, Newton AC (2000) Cereal variety and species mixtures in practice, with emphasis on disease resistance. AGRONOMIE 20, 813-837.
Finckh MR, Mundt CC (1996) Temporal dynamics of plant competition in genetically diverse wheat populations in the presence and absence of stripe rust. Journal of Applied Ecology 1041-1052.
Finlay KW (1963) The Analysis of Adaptation in a Plant-breeding Programme. Australian Journal of Agricultural Research 14, 742.
Fischer RA, Maurer R (1978) Drought resistance in spring wheat cultivars. I. Grain yield responses. Australian Journal of Agricultural Research 29, 897.
Fischer RA, Rees D, Sayre KD, Lu ZM, Condon AG, Larque Saavedra A (1998) Wheat Yield Progress Associated with Higher Stomatal Conductance and Photosynthetic Rate, and Cooler Canopies. Crop science 38, 1467-1475.
Fleury D, Jefferies S, Kuchel H, Langridge P (2010) Genetic and genomic tools to improve drought tolerance in wheat. Journal of experimental botany 61, 3211-3222.
Flood RG, Halloran G (1986) Genetics and physiology of vernalization response in wheat. Advances in Agronomy 39, 87-125.
Flood RG, Halloran GM, . (1984) The nature and duration of gene action for vernalization response in wheat. Annals of botany 53, 363-368.
Foulkes MJ, Slafer GA, Davies WJ, Berry PM, Sylvester-Bradley R, Martre P, Calderini DF, Griffiths S, Reynolds MP (2011) Raising yield potential of wheat. III. Optimizing partitioning to grain while maintaining lodging resistance. Journal of experimental botany 62, 469-486.
French RJ, Schultz JE (1984) Water use efficiency of wheat in a Mediterranean-type environment. II. some limitations to efficiency. Australian Journal of Agricultural Research 35, 765.
Frey KJ, Maldonado U (1967) Relative productivity of homogeneous and heterogeneous oat cultivars in optimum and suboptimum environments. Crop science 7, 532-535.
Fukai S, Trenbath BR (1993) Processes determining intercrop productivity and yields of component crops. Field Crops Research 34, 247-271.
Gabriel KR (1971) The biplot graphic display of matrices with application to principal component analysis. Biometrika 58, 453-467.
Gallandt ER, Dofing SM, Reisenauer PE, Donaldson E (2001) Diallel analysis of cultivar mixtures in winter wheat. Crop science 41, 792-796.
Garcia-Barrios L (2003) Plant–plant interactions in tropical agriculture. Tropical agroecosystems 11-58. Garrett KA, Mundt CC (1999) Epidemiology in mixed host populations. Phytopathology 89, 984-990. Gautami B, Pandey M, Vadez V, Nigam S, Ratnakumar P, Krishnamurthy L, Radhakrishnan T, Gowda M, Narasu
M, Hoisington D (2012) Quantitative trait locus analysis and construction of consensus genetic map for

208
drought tolerance traits based on three recombinant inbred line populations in cultivated groundnut (Arachis hypogaea L.). Molecular Breeding 30, 757-772.
Gawroński P, Schnur usch T (2012) High-density mapping of the earliness per se-3Am (Eps-3A m ) locus in diploid einkorn wheat and its relation to the syntenic regions in rice and Brachypodium distachyon L. Molecular Breeding 30, 1097-1108.
Gebbing T, Schnyder H, Kuhbauch W (1999) The utilization of pre-anthesis reserves in grain filling of wheat. Assessment by steady-state (CO2)-C-13/(CO2)-C-12 labelling. PLANT CELL AND ENVIRONMENT 22, 851-858.
Geber MA, Dawson TE (1997) Genetic Variation in Stomatal and Biochemical Limitations to Photosynthesis in the Annual Plant, Polygonum arenastrum. Oecologia 109, 535-546.
Gevrek MN, Atasoy GD (2012) Effect of post anthesis drought on certain agronomical characteristics of wheat under two different nitrogen application conditions. Turkish Journal of Field Crops 17, 19-23.
Gill BS, Frie e B, Raupp WJ, Wilson DL, Cox TS, Sears RG, Brown‐Guedira GL, Fritz A (2006) Wheat Genetics Resource Center: The First 25 Years. Advances in Agronomy 89, 73-136.
Giura A, Saulescu N (1996) Chromosomal location of genes controlling grain size in a large grained selection of wheat (Triticum aestivum L.). Euphytica 89, 77-80.
Gizlice Z, Carter TE, Burton JW (1989) THE IMPACT OF MATURITY AND GENOTYPE ON BLEND PERFORMANCE IN GROUP-V AND GROUP-VII SOYBEAN CULTIVARS. Agronomy Journal 81, 559-562.
Gómez JAA, Bellon MR, Smale M (2000) A regional analysis of maize biological diversity in Southeastern Guanajuato, Mexico. Economic Botany 54, 60-72.
Goncharov NP (2004) Response to vernalization in wheat: its quantitative or qualitative nature. CEREAL RESEARCH COMMUNICATIONS 32, 323-330.
González FG, Slafer GA, Miralles DJ (2002) Vernalization and photoperiod responses in wheat pre-flowering reproductive phases. Field Crops Research 74, 183-195.
González FG, Slafer GA, Miralles DJ (2005) Pre-anthesis development and number of fertile florets in wheat as affected by photoperiod sensitivity genes Ppd-D1 and Ppd-B1. Euphytica 146, 253-269.
Gorny AG, Garczynski S, Banaszak Z, Lugowska B (2006) Genetic variation in the efficiency of nitrogen utilization and photosynthetic activity of flag leaves among the old and modern germplasm of winter wheat. JOURNAL OF APPLIED GENETICS 47, 231-237.
Gower JC (1966) Some distance properties of latent root and vector methods used in multivariate analysis. Biometrika 53, 325-338.
Gower JC (1967) Multivariate analysis and multidimensional geometry. Journal of the Royal Statistical Society. Series D (The Statistician) 17, 13-28.
Grant RH, Jenks MA, Rich PJ, Peters PJ, Ashworth EN (1995) Scattering of ultraviolet and photosynthetically active radiation by sorghum bicolor: influence of epicuticular wax. Agricultural and Forest Meteorology 75, 263-281.
Grassini P, Hall AJ, Mercau JL (2009) Benchmarking sunflower water productivity in semiarid environments. Field Crops Research 110, 251-262.
Grassini P, Yang H, Irmak S, Thorburn J, Burr C, Cassman KG (2011) High-yield irrigated maize in the Western US Corn Belt: II. Irrigation management and crop water productivity. Field Crops Research 120, 133-141.
Graven L, Carter P (1991) Seed quality effect on corn performance under conventional and no-tillage systems. JOURNAL OF PRODUCTION AGRICULTURE 4, 366-NP.
Graziani M, Maccaferri M, Royo C, Salvatorelli F, Tuberosa R (2014) QTL dissection of yield components and morpho-physiological traits in a durum wheat elite population tested in contrasting thermo-pluviometric conditions. Crop and Pasture Science 65, 80-95.
Gregersen PL, Holm PB, Krupinska K (2008) Leaf senescence and nutrient remobilisation in barley and wheat. Plant Biology 10, 37-49.

209
Gregory PJ, Simmonds LP, Warren GP, Batey T, Syers JK, Wallace JS, Sivakumar MVK (1997) Interactions between Plant Nutrients, Water and Carbon Dioxide as Factors Limiting Crop Yields [and Discussion]. Philosophical Transactions: Biological Sciences 352, 987-996.
Griffiths S, Simmonds J, Leverington M, Wang Y, Fish L, Sayers L, Alibert L, Orford S, Wingen L, Herry L, Faure S, Laurie D, Bilham L, Snape J (2009) Meta-QTL analysis of the genetic control of ear emergence in elite European winter wheat germplasm. Theoretical and Applied Genetics 119, 383-395.
Griffiths S, Simmonds J, Leverington M, Wang Y, Fish L, Sayers L, Alibert L, Orford S, Wingen L, Snape J (2012) Meta-QTL analysis of the genetic control of crop height in elite European winter wheat germplasm. Molecular Breeding 29, 159-171.
Gruvaeus G, Wainer H (1972) TWO ADDITIONS TO HIERARCHICAL CLUSTER ANALYSIS†. British Journal of Mathematical and Statistical Psychology 25, 200-206.
Grzesiak MT, Hura K, Hura T (2009) The usefulness of the chlorophyll fluorescence parameters in harvest prediction in 10 genotypes of winter triticale under optimal growth conditions. Plant Biosystems - An International Journal Dealing with all Aspects of Plant Biology 143, 496-503.
Gupta P, Balyan H, Kumar S, Kulwal P, Kumar N, Mir R, Kumar A, Mohan A, Prabhu K (2008) QTL analysis and marker assisted selection for improvement in grain protein content and pre-harvest sprouting tolerance in bread wheat.
Gupta P, Langridge P, Mir R (2010a) Marker-assisted wheat breeding: present status and future possibilities. Molecular Breeding 26, 145-161.
Gupta PK, Langridge P, Mir RR (2010b) Marker-assisted wheat breeding: present status and future possibilities. Molecular Breeding 26, 145-161.
Gupta PK, Rustgi S, Kulwal PL (2005) Linkage disequilibrium and association studies in higher plants: Present status and future prospects. Plant Molecular Biology 57, 461-485.
Gutiérrez-Rodr guez M, Reynolds M, Larque-Saavedra A (2000) Photosynthesis of wheat in a warm, irrigated environment: II. Traits associated with genetic gains in yield. Field Crops Research 66, 51-62.
Gutierrez-Rodriguez M, Reynolds MP, Larque-Saavedra A (2000) Photosynthesis of wheat in a warm, irrigated environment - II. Traits associated with genetic gains in yield. Field Crops Research 66, 51-62.
Hajjar R, Jarvis DI, Gemmill-Herren B (2008) The utility of crop genetic diversity in maintaining ecosystem services. Agriculture, Ecosystems and Environment 123, 261-270.
Hamdy A, Raga R, Scarascia‐Mugnozza E (2003) Coping with water scarcity: water saving and increasing water productivity. Irrigation and Drainage 52, 3-20.
Hamza MA, Anderson WK (2005) Soil compaction in cropping systems - A review of the nature, causes and possible solutions. SOIL & TILLAGE RESEARCH 82, 121-145.
Hanft JM, Wych R (1982) Visual indicators of physiological maturity of hard red spring wheat. Crop science 22, 584-588.
Hansen M, Kraft T, Ganestam S, SÄLl T, Nilsson N-O (2001) Linkage disequilibrium mapping of the bolting gene in sea beet using AFLP markers. Genetics Research 77, 61-66.
Hansen NC, Allen BL, Baumhardt RL, Lyon DJ (2012) Research achievements and adoption of no-till, dryland cropping in the semi-arid US Great Plains. Field Crops Research 132, 196-203.
Harris D., R.S. T, A. J (2002) On-farm seed priming to improve crop establishment and yield in dry direct-seeded rice. In 'Direct seeding: Research Strategies and Opportunities, International Research Institute.' (Ed. MM Pandey S., Wade L., Tuong T.P., Lopes K., Hardy B. (Eds.).) pp. 231-240. Manila, Philippines)
Hatfield JL, Sauer TJ, Prueger JH (2001) Managing soils to achieve greater water use efficiency: A review. Agronomy Journal 93, 271-280.
Heitholt JJ (1989) WATER-USE EFFICIENCY AND DRY-MATTER DISTRIBUTION IN NITROGEN-STRESSED AND WATER-STRESSED WINTER-WHEAT. Agronomy Journal 81, 464-469.
Hemmat A, Eskandari I (2006) Dryland winter wheat response to conservation tillage in a continuous cropping system in northwestern Iran. SOIL & TILLAGE RESEARCH 86, 99-109.

210
Hernanz JL, López R, Navarrete L, Sánchez-Girón V (2002) Long-term effects of tillage systems and rotations on soil structural stability and organic carbon stratification in semiarid central Spain. SOIL & TILLAGE RESEARCH 66, 129-141.
Herrera JM, Verhulst N, Trethowan RM, Stamp P, Govaerts B (2013) Insights into Genotype × Tillage Interaction Effects on the Grain Yield of Wheat and Maize. Crop Sci. 0, -.
Hervé D, Fabre F, Berrios EF, Leroux N, Al Chaarani G, Planchon C, Sarrafi A, Gentzbittel L (2001) QTL analysis of photosynthesis and water status traits in sunflower (Helianthus annuus L.) under greenhouse conditions. Journal of experimental botany 52, 1857-1864.
Hill W, Robertson A (1968) Linkage disequilibrium in finite populations. Theoretical and Applied Genetics 38, 226-231.
Hobbs PR, Sayre K, Gupta R (2008) The role of conservation agriculture in sustainable agriculture. Philosophical Transactions of the Royal Society of London. Series B, Biological Sciences 363, 543-555.
Holland JB (2007) Genetic architecture of complex traits in plants. Current Opinion in Plant Biology 10, 156-161.
Hoogendoorn J (1985) A reciprocal F1 monosomic analysis of the genetic control of time of ear emergence, number of leaves and number of spikelets in wheat (Triticum aestivum L.). Euphytica 34, 545-558.
Horacek J, Ledvina R, Raus A (2001) The content and quality of organic matter in cambisol in a long-term no-tillage system. ROSTLINNA VYROBA 47, 205-210.
Huang B, Duncan RR, Carrow RN (1997) Drought-resistance mechanisms of seven warm-season turfgrasses under surface soil drying .2. Root aspects. Crop science 37, 1863-1869.
Huang G, Li L, Zhang R, Unkovich M, Li G, Chan K, Bellotti W (2008a) 'Conservation tillage research on the Loess Plateau of China, Global Issues: Paddock Action: Proceedings of 14th Agronomy Conference.'
Huang G, Varriano-Marston E (1980). alpha.-Amylase activity and preharvest sprouting damage in Kansas hard white wheat. Journal of Agricultural and Food Chemistry 28, 509-512.
Huang GB, Cullis BR, Bellotti WD, Zhang RZ, Li GD, Li LL, Chan KY, Heenan DP, Chen W, Unkovich MJ, Robertson MJ (2008b) Productivity and sustainability of a spring wheat–field pea rotation in a semi-arid environment under conventional and conservation tillage systems. Field Crops Research 107, 43-55.
Huang S, Sirikhachornkit A, Su X, Faris J, Gill B, Haselkorn R, Gornicki P (2002) Genes encoding plastid acetyl-CoA carboxylase and 3-phosphoglycerate kinase of the Triticum/Aegilops complex and the evolutionary history of polyploid wheat. Proceedings of the National Academy of Sciences of the United States of America 99, 8133-8138.
Huang XQ, Kempf H, Ganal MW, Röder MS (2004) Advanced backcross QTL analysis in progenies derived from a cross between a German elite winter wheat variety and a synthetic wheat (Triticum aestivumL.). Theoretical and Applied Genetics 109, 933-943.
Hughes AR, Inouye BD, Johnson MT, Underwood N, Vellend M (2008) Ecological consequences of genetic diversity. ECOLOGY LETTERS 11, 609-623.
Hughes AR, John JS (2004) Genetic diversity enhances the resistance of a seagrass ecosystem to disturbance. Proceedings of the National Academy of Sciences of the United States of America 101, 8998-9002.
Hurley C, Hurley MC (2012) Package ‘gclus’. URL: http://CRAN. R-project. org/package= gclus [Zugriff am 15.11. 2014]
Hussain M, Malik MA, Farooq M, Ashraf MY, Cheema MA (2008) Improving Drought Tolerance by Exogenous Application of Glycinebetaine and Salicylic Acid in Sunflower. Journal of Agronomy and Crop Science 194, 193-199.
Huwe B. (2003) The role of soil tillage for soil structure. In 'Soil tillage in agroecosystems. CRC.' (Ed. ET A.) pp. 27-49. (Boca Raton: Florida)
Idso SB (1982) Non-water-stressed baselines: A key to measuring and interpreting plant water stress. Agricultural Meteorology 27, 59-70.

211
Izanloo A, Condon AG, Langridge P, Tester M, Schnurbusch T (2008) Different mechanisms of adaptation to cyclic water stress in two South Australian bread wheat cultivars. Journal of experimental botany 59, 3327-3346.
Jaccoud D, Peng K, Feinstein D, Kilian A (2001) Diversity arrays: a solid state technology for sequence information independent genotyping. Nucleic acids research 29, E25-25.
Jamaux I, Steinmetz A, Belhassen E (1997) Looking for Molecular and Physiological Markers of Osmotic Adjustment in Sunflower. New Phytologist 137, 117-127.
James RA, Rivelli AR, Munns R, von Caemmerer S (2002) Factors affecting CO2 assimilation, leaf injury and growth in salt-stressed durum wheat. Functional Plant Biology 29, 1393-1403.
Jantasuriyarat C, Vales MI, Watson CJW, Riera-Lizarazu O (2004) Identification and mapping of genetic loci affecting the free-threshing habit and spike compactness in wheat ( Triticum aestivum L.). Theoretical and Applied Genetics 108, 261-273.
Jedel PE, Helm JH, Burnett PA (1998) Yield, quality and stress tolerance of barley mixtures in central Alberta. Canadian Journal of Plant Science 78, 429-436.
Jefferson PG (1994) Genetic-variation for epicuticular wax production in altai wildrye populations that differ in glaucousness. Crop science 34, 367-371.
Ji XM, Shiran B, Wan JL, Lewis DC, Jenkins CLD, Condon AG, Richards RA, Dolferus R (2010) Importance of pre-anthesis anther sink strength for maintenance of grain number during reproductive stage water stress in wheat. PLANT CELL AND ENVIRONMENT 33, 926-942.
Johansen C, Haque ME, Bell RW, Thierfelder C, Esdaile RJ (2012) Conservation agriculture for small holder rainfed farming: Opportunities and constraints of new mechanized seeding systems. Field Crops Research 132, 18-32.
Johnson JMF, Allmaras RR, Reicosky DC (2006) Estimating source carbon from crop residues, roots and rhizodeposits using the national grain-yield database. Agronomy Journal 98, 622-636.
Jordan WR, Shouse PJ, Blum A, Miller FR, Monk RL (1984) Environmental physiology of sorghum. II. Epicuticular wax load and cuticular transpiration. Crop Science 24, 1168-1173.
Josa R, Hereter A (2005) Effects of tillage systems in dryland farming on near-surface water content during the late winter period. SOIL & TILLAGE RESEARCH 82, 173-183.
Joshi A, Kumari M, Singh V, Reddy C, Kumar S, Rane J, Chand R (2007) Stay green trait: variation, inheritance and its association with spot blotch resistance in spring wheat (Triticum aestivum L.). Euphytica 153, 59-71.
Juarez MT, Twigg RW, Timmermans MCP (2004) Specification of adaxial cell fate during maize leaf development. Development (Cambridge, England) 131, 4533.
Juenger TE, McKay JK, Hausmann N, Keurentjes JJB, Sen S, Stowe KA, Dawson TE, Simms EL, Richards JH (2005) Identification and characterization of QTL underlying whole‐plant physiology in Ara idopsis thaliana: δ13C, stomatal conductance and transpiration efficiency. Plant, Cell & Environment 28, 697-708.
Kadioglu A, Terzi R (2007) A Dehydration Avoidance Mechanism: Leaf Rolling. Botanical Review 73, 290-302. Kadioglu A, Terzi R, Saruhan N, Saglam A (2012) Current advances in the investigation of leaf rolling caused by
biotic and abiotic stress factors. Plant Science 182, 42-48. Kamran A, Iqbal M, Navabi A, Randhawa H, Pozniak C, Spaner D (2013) Earliness per se QTLs and their
interaction with the photoperiod insensitive allele Ppd-D1a in the Cutler × AC Barrie spring wheat population. Theoretical and Applied Genetics 126, 1965-1976.
Kano M, Inukai Y, Kitano H, Yamauchi A (2011) Root plasticity as the key root trait for adaptation to various intensities of drought stress in rice. Plant and Soil 342, 117-128.
Karamanos AJ, Bilalis D, Sidiras N (2004) Effects of Reduced Tillage and Fertilization Practices on Soil Characteristics, Plant Water Status, Growth and Yield of Upland Cotton. Journal of Agronomy and Crop Science 190, 262-276.
Karlen D, Sojka R (1985) Hybrid and irrigation effects on conservation tillage corn in the Coastal Plain. Agronomy Journal 77, 561-567.

212
Karrou M (2013) Combined effect of tillage system, supplemental irrigation and genotype on bread wheat yield and water use in the dry Mediterranean region. AFRICAN JOURNAL OF AGRICULTURAL RESEARCH 8, 5398-5404.
Kassam A, Friedrich T, Derpsch R, Lahmar R, Mrabet R, Basch G, Gonzalez-Sanchez EJ, Serraj R (2012) Conservation agriculture in the dry Mediterranean climate. Field Crops Research 132, 7-17.
Kaut AHEE, Mason HE, Navabi A, O'Donovan JT, Spaner D (2008a) Performance and stability of performance of spring wheat variety mixtures in organic and conventional management systems in western Canada. The Journal of Agricultural Science 147, 141.
Kaut AHEE, Mason HE, Navabi A, O'Donovan JT, Spaner D (2009) Performance and stability of performance of spring wheat variety mixtures in organic and conventional management systems in western Canada. The Journal of Agricultural Science 147, 141-153.
Kaut E, Mason E, Navabi A, O'Donovan T, Spaner D (2008b) Organic and conventional management of mixtures of wheat and spring cereals. AGRONOMY FOR SUSTAINABLE DEVELOPMENT 28, 363-371.
avar T, Maras M, idrič M, Šuštar-Vozlič J, Meglič V (2008) Identification of genes involved in the response of leaves of Phaseolus vulgaris to drought stress. Molecular Breeding 21, 159-172.
Kaya MD, Okçu G, Atak M, Ç k l Y, olsar c Ö (2006) Seed treatments to overcome salt and drought stress during germination in sunflower ( Helianthus annuus L.). European Journal of Agronomy 24, 291-295.
Kellogg EA (2001) Evolutionary history of the grasses. Plant Physiology 125, 1198-1205. KH N (1965) A factural key for the recognition of Australian soils. CSIRO Division of Soils Divisional Report No.
2/65. Khakwani AA, Dennett MD, Munir M (2011) Drought tolerance screening of wheat varieties by inducing water
stress conditions. Songklanakarin Journal of Science and Technology 33, 135-142. Khalifa M, Qualset C (1974) Intergenotypic competition between tall and dwarf wheats. I. In mechanical
mixtures. Crop science 14, 795-799. Khan AJ, Hassan S, Tariq M, Khan T (2001) Haploidy breeding and mutagenesis for drought tolerance in wheat.
Euphytica 120, 409-414. Khan MA, Iqbal M (2011) Breeding for drought tolerance in wheat ( Triticum aestivum L.): constraints and
future prospects. Frontiers of Agriculture in China 5, 31-34. Khan MK . (1999) Agronomy of field pea production in northwest New South Wales. The University of Sydney. Kiær LP, Skovgaard IM, Østergård H (2009) Grain yield increase in cereal variety mixtures: A meta-analysis of
field trials. Field Crops Research 114, 361-373. Kiær LP, Skovgaard IM, Østergård H (2012) Effects of inter-varietal diversity, biotic stresses and environmental
productivity on grain yield of spring barley variety mixtures. Euphytica 185, 123-138. Kilian B, Ozkan H, Walther A, Kohl J, Dagan T, Salamini F, Martin W, Institutionen för g, Göteborgs u,
Department of Earth S, Faculty of S, University of G, Naturvetenskapliga f (2007) Molecular diversity at 18 loci in 321 wild and 92 domesticate lines reveal no reduction of nucleotide diversity during Triticum monococcum (Einkorn) domestication: implications for the origin of agriculture. Molecular biology and evolution 24, 2657-2668.
Kirigwi F, Van Ginkel M, Brown-Guedira G, Gill B, Paulsen G, Fritz A (2007) Markers associated with a QTL for grain yield in wheat under drought. Molecular Breeding 20, 401-413.
Kirkegaard JA, Hunt JR, McBeath TM, Lilley JM, Moore A, Verburg K, Robertson M, Oliver Y, Ward PR, Milroy S, Whitbread AM (2014) Improving water productivity in the Australian Grains industry-a nationally coordinated approach. Crop & Pasture Science 65, 583-601.
Kirkegaard JA, Lilley JM, Howe GN, Graham JM (2007) Impact of subsoil water use on wheat yield. Australian Journal of Agricultural Research 58, 303-315.
Kobata T, Palta JA, Turner NC (1992) Rate of development of postanthesis water deficits and grain filling of spring wheat. Crop science 32, 1238-1242.

213
Kollers S, Rodemann B, Ling J, Korzun V, Ebmeyer E, Argillier O, Hinze M, Plieske J, Kulosa D, Ganal MW, Röder MS (2013) Whole Genome Association Mapping of Fusarium Head Blight Resistance in European Winter Wheat (Triticum aestivum L.). PLoS ONE 8, e57500.
Kramer PJ (1969) 'Plant & soil water relationships: a modern synthesis.' (McGraw-Hill: New York U6 - ctx_ver=Z39.88-2004&ctx_enc=info%3Aofi%2Fenc%3AUTF-8&rfr_id=info:sid/summon.serialssolutions.com&rft_val_fmt=info:ofi/fmt:kev:mtx:book&rft.genre=book&rft.title=Plant+%26+soil+water+relationships&rft.au=Kramer%2C+Paul+J&rft.series=McGraw-Hill+series+in+organismic+biology&rft.date=1969-01-01&rft.pub=McGraw-Hill&rft.externalDBID=n%2Fa&rft.externalDocID=b23145043¶mdict=en-US U7 - Book U8 - FETCH-usyd_catalog_b231450431)
Kuchel H, Hollamby G, Langridge P, Williams K, Jefferies SP (2006) Identification of genetic loci associated with ear-emergence in bread wheat. Theoretical and Applied Genetics 113, 1103-1112.
Kuchel H, Williams KJ, Langridge P, Eagles HA, Jefferies SP (2007) Genetic dissection of grain yield in bread wheat: I. QTL analysis. Theor Appl Genet 115,
Kuijt I, Finlayson B (2009) Evidence for food storage and predomestication granaries 11,000 years ago in the Jordan Valley. Proceedings of the National Academy of Sciences of the United States of America 106, 10966-10970.
Kulwal P, Ishikawa G, Benscher D, Feng Z, Yu L-X, Jadhav A, Mehetre S, Sorrells ME (2012) Association mapping for pre-harvest sprouting resistance in white winter wheat. Theoretical and Applied Genetics 125, 793-805.
Kumar J, Abbo S (2001) Genetics of flowering time in chickpea and its bearing on productivity in semiarid environments. Vol. 72 pp. 107-138. (ACADEMIC PRESS INC: SAN DIEGO)
Kumar S, Sharma V, Chaudhary S, Tyagi A, Mishra P, Priyadarshini A, Singh A (2012) Genetics of flowering time in bread wheat Triticum aestivum: complementary interaction between vernalization-insensitive and photoperiod-insensitive mutations imparts very early flowering habit to spring wheat. Journal of genetics 91, 33-47.
Kumudini S, Grabau L, Van Sanford D, Omielan J (2008) Analysis of yield-formation processes under no-till and conventional tillage for soft red winter wheat in the south-central region. Agronomy Journal 100, 1026-1032.
KunPu Z, XianBin X, JiChun T (2009) QTL mapping for grain yield and spike related traits in common wheat. Acta Agronomica Sinica 35, 270-278.
Lal R (2002) Carbon sequestration in dryland ecosystems of West Asia and North Africa. Land Degradation and Development 13, 45-59.
Lal R (2004) Carbon sequestration in dryland ecosystems. Environmental Management 33, 528-544. Lammerts van Bueren ET, Miedaner T, Desclaux D, Wolfe MS, Loschenberger F, Kovacs GM, Hoad S, Ostergard
H, Baresel JP, Golinger I (2008) Developments in breeding cereals for organic agriculture. Euphytica 163, 323-346.
Landjeva S, Lohwasser U, Börner A (2010) Genetic mapping within the wheat D genome reveals QTL for germination, seed vigour and longevity, and early seedling growth. Euphytica 171, 129-143.
Lang C, Lanning S, Carlson G, Kushnak G, Bruckner P, Talbert L (1998) Relationship between baking and noodle quality in hard white spring wheat. Crop science 38, 823-827.
Langridge P (2013) Wheat genomics and the ambitious targets for future wheat production. Genome / National Research Council Canada = Génome / Conseil national de recherches Canada 56, 545-547.
Langridge P, Lagudah ES, Holton TA, Appels R, Sharp PJ, Chalmers KJ (2001) Trends in genetic and genome analyses in wheat: A review. Australian Journal of Agricultural Research 52, 1043-1077.
Lantican MA, Dubin HJ, Morris ML (2005) ' Impacts of International Wheat Breeding Research in the Developing World, 1988-2002.' ( International Maize and Wheat Improvement Center: Mexico, D.F.)

214
Laperche A, Devienne-Barret F, Maury O, Le Gouis J, Ney B (2006) A simplified conceptual model of carbon/nitrogen functioning for QTL analysis of winter wheat adaptation to nitrogen deficiency. TAG. Theoretical and applied genetics. Theoretische und angewandte Genetik 113, 1131-1146.
Law CN, Worland AJ, Borner A, Petrovic S (1994) 'The utilisation of photoperiodic response genes in breeding winter wheat varieties adapted to specific European ecoclimatic conditions, 8th Int Wheat Genet Symp.' Beijing,.
Le Gouis J, Allard V, Rousset M, Bordes J, Ravel C, Heumez E, Faure S, Praud S, Galic N, Remoué C, Balfourier F (2012a) Genome-wide association analysis to identify chromosomal regions determining components of earliness in wheat. Theoretical and Applied Genetics 124, 597-611.
Le Gouis J, Bordes J, Ravel C, Heumez E, Faure S, Praud S, Galic N, Remoué C, Balfourier F, Allard V, Rousset M (2012b) Genome-wide association analysis to identify chromosomal regions determining components of earliness in wheat. Theoretical and Applied Genetics 124, 597-611.
Lebreton C, Lazicjancic V, Steed A, Pekic S, Quarrie SA (1995) IDENTIFICATION OF QTL FOR DROUGHT RESPONSES IN MAIZE AND THEIR USE IN TESTING CAUSAL RELATIONSHIPS BETWEEN TRAITS. Journal of experimental botany 46, 853-865.
Leidi EO, López M, Gorham J, Gutiérrez JC (1999) Variation in carbon isotope discrimination and other traits related to drought tolerance in upland cotton cultivars under dryland conditions. Field Crops Research 61, 109-123.
Lekberg Y, Koide RT (2005) Is Plant Performance Limited by Abundance of Arbuscular Mycorrhizal Fungi? A Meta-Analysis of Studies Published between 1988 and 2003. New Phytologist 168, 189-204.
Lev-Yadun S, Gopher A, Abbo S (2000) The Cradle of Agriculture. science 288, 1602-1603. Lewontin R (1964) The interaction of selection and linkage. I. General considerations; heterotic models.
Genetics 49, 49-67. Li L-l, Huang G-b, Zhang R-z, Bill B, Guangdi L, Kwong YC (2011) Benefits of Conservation Agriculture on Soil and
Water Conservation and Its Progress in China. Agricultural Sciences in China 10, 850-859. Li X-M, Chen X-M, Xiao Y-G, Xia X-C, Wang D-S, He Z-H, Wang H-J (2014a) Identification of QTLs for seedling
vigor in winter wheat. Euphytica 198, 199-209. Li X, Xia X, Xiao Y, He Z, Wang D, Trethowan R, Wang H, Chen X (2015) QTL mapping for plant height and yield
components in common wheat under water-limited and full irrigation environments. Crop and Pasture Science 66, 660-670.
Li Y, Wu J, Huang M, Yao Y, Zhang C, Cai D, Jin K (2006) Effects of different tillage systems on photosynthesis characteristics of flag leaf and water use efficiency in winter wheat. Trans. CSAE 22, 44-48.
Li ZK, Jiang XL, Peng T, Shi CL, Han SX, Tian B, Zhu ZL, Tian JC (2014b) Mapping quantitative trait loci with additive effects and additive x additive epistatic interactions for biomass yield, grain yield, and straw yield using a doubled haploid population of wheat (Triticum aestivum L.). GENETICS AND MOLECULAR RESEARCH 13, 1412-1424.
Li ZK, Shashidhar HE, Zhuang JY, Zheng KL, Singh VP, Sidhu JS, Srivantaneeyakul S, Khush GS, Yu SB, Lafitte HR, Huang N, Courtois B, Hittalmani S, Vijayakumar CHM, Liu GF, Wang GC (2003) QTL x environment interactions in rice. I. heading date and plant height. TAG. Theoretical and applied genetics. Theoretische und angewandte Genetik 108, 141-153.
Lie man, Davis (2000) Integration of soil, crop and weed management in low‐external‐input farming systems. Weed Research 40, 27-47.
Lithourgidis A, Vlachostergios D, Dordas C, Damalas C (2011) Dry matter yield, nitrogen content, and competition in pea–cereal intercropping systems. European Journal of Agronomy 34, 287-294.
Liu W, Gowda M, Steinhoff J, Maurer HP, Würschum T, Longin CFH, Cossic F, Reif JC (2011) Association mapping in an elite maize breeding population. Theoretical and Applied Genetics 123, 847-858.
Liu X, Li R, Chang X, Jing R (2013a) Mapping QTLs for seedling root traits in a doubled haploid wheat population under different water regimes. Euphytica 189, 51-66.

215
Liu Y, Sui Y, Gu D, Wen X, Chen Y, Li C, Liao Y (2013b) Effects of conservation tillage on grain filling and hormonal changes in wheat under simulated rainfall conditions. Field Crops Research 144, 43-51.
Lo Cascio, Casa (1997) 'Soil tillage effects on soy ean canopy resistance, ‘Agroecological and ecological aspects of soil tillage.' Proceedings of XIVth I.S.T.R.O. Conference. (Fragmenta Agron:
Lo Cascio B, Venezia G (1986) Clay soil habitableness as affected by reduced tillage in a Mediterranean environment. Italian, with English abstract.). Riv. Agron 20, 166-171.
Lopes M, Dreisigacker S, Peña R, Sukumaran S, Reynolds M (2015a) Genetic characterization of the Wheat Association Mapping Initiative (WAMI) panel for dissection of complex traits in spring wheat. Theoretical and Applied Genetics 128, 453-464.
Lopes MS, Dreisigacker S, Peña RJ, Sukumaran S, Reynolds MP (2015b) Genetic characterization of the wheat association mapping initiative (WAMI) panel for dissection of complex traits in spring wheat. Theoretical and Applied Genetics 128, 453-464.
Lopes MS, Reynolds MP (2010) Partitioning of assimilates to deeper roots is associated with cooler canopies and increased yield under drought in wheat. Functional Plant Biology 37, 147-156.
Loss SP, Siddique KHM (1994) Morphological and physiological traits associated with wheat yield increases in mediterranean environments. Vol. 52 pp. 229-276. (ACADEMIC PRESS INC: SAN DIEGO)
Lott N, Ross T, Smith A, Houston T, S (2011) '‘Billion dollar US weather disasters, 1980-2010.' Available at http://www.ncdc.noaa.gov/oa/reports/billionz.htm [Accessed 11 June ].
Lu Y, Xu J, Yuan Z, Hao Z, Xie C, Li X, Shah T, Lan H, Zhang S, Rong T, Xu Y (2012) Comparative LD mapping using single SNPs and haplotypes identifies QTL for plant height and biomass as secondary traits of drought tolerance in maize. Molecular Breeding 30, 407-418.
Luo Y-Z, Zhao F-M, Sang X-C, Ling Y-H, Yang Z-L, He G-H (2009) Genetic Analysis and Gene Mapping of a Novel Rolled-Leaf Mutant rl12(t) in Rice. Acta Agronomica Sinica 35, 1967-1972.
Maccaferri M, El-Ahmed A, Maalouf F, Machlab H, Martos V, Moragues M, Motawaj J, Nachit M, Nserallah N, Ouabbou H, Royo C, Sanguineti MC, Slama A, Tuberosa R, Corneti S, Ortega JLA, Salem MB, Bort J, DeAmbrogio E, del Moral LFG, Demontis A (2008a) Quantitative Trait Loci for Grain Yield and Adaptation of Durum Wheat (Triticum durum Desf.) Across a Wide Range of Water Availability. Genetics 178, 489-511.
Maccaferri M, Sanguineti MC, Corneti S, Ortega JLA, Salem MB, Bort J, DeAmbrogio E, del Moral LFG, Demontis A, El-Ahmed A (2008b) Quantitative trait loci for grain yield and adaptation of durum wheat (Triticum durum Desf.) across a wide range of water availability. Genetics 178, 489-511.
MacCaferri M, Sanguineti MC, Demontis A, El-Ahmed A, Garcia Del Moral L, Maalouf F, Nachit M, Nserallah N, Ouabbou H, Rhouma S, Royo C, Villegas D, Tuberosa R (2011) Association mapping in durum wheat grown across a broad range of water regimes. Journal of experimental botany 62, 409-438.
Maccaferri M, Sanguineti MC, Noli E, Tuberosa R (2005) Population structure and long-range linkage disequilibrium in a durum wheat elite collection. Molecular Breeding 15, 271-290.
Macdowall F (1973) Growth kinetics of Marquis wheat. V. Morphogenic dependence. Canadian Journal of Botany 51, 1259-1265.
Mahajan S, Tuteja N (2005) Cold, salinity and drought stresses: an overview. Archives of biochemistry and biophysics 444, 139-158.
Mahmood T, Ahmad A, Ali Z, Trethowan R (2009) 'Genotype× tillage interactions in broad acre crops and their implications for cultivar improvement, 14th Australasian Plant Breeding & 11th SABRAO Conference.'
Mambani B, Lal R (1983) Response of upland rice varieties to drought stress. Plant and Soil 73, 73-94. Manfred H, Ralf S-P, Dieter K, Renato C, Monica A, Basilio B, Francesco S (1997) Site of Einkorn Wheat
Domestication Identified by DNA Fingerprinting. science 278, 1312-1314. Mann CC (1999) Genetic Engineers Aim to Soup up Crop Photosynthesis. science 283, 314-316. Manschadi AM, Christopher J, Devoil P, Hammer GL (2006) The role of root architectural traits in adaptation of
wheat to water-limited environments. Functional Plant Biology 33, 823-837.

216
Manschadi AM, Hammer GL, Christopher JT, deVoil P (2008) Genotypic variation in seedling root architectural traits and implications for drought adaptation in wheat ( Triticum aestivum L.). Plant and Soil 303, 115-129.
Manthey R, Fehrmann H (1993) Effect of cultivar mixtures in wheat on fungal diseases, yield and profitability. Crop Protection 12, 63-68.
Marshall D, Brown A (1973) Stability of performance of mixtures and multilines. Euphytica 22, 405-412. Martin B, Nienhuis J, King G, Schaefer A (1989) Restriction fragment length polymorphisms associated with
water use efficiency in tomato. science 243, 1725-1728. Martin La (1963) 'Cereal crops.' (MacMillan Publishing: New York, USA) Marza F, Bai G-H, Carver B, Zhou W-C (2006) Quantitative trait loci for yield and related traits in the wheat
population Ning7840× Clark. Theoretical and Applied Genetics 112, 688-698. Mason RE, Hays DB, Mondal S, Ibrahim AMH, Basnet BR (2013) QTL for yield, yield components and canopy
temperature depression in wheat under late sown field conditions. Euphytica 194, 243-259. Mathews KL, Cooper M, Chapman SC, Trethowan R, Pfeiffer W, van Ginkel M, Crossa J, Payne T, DeLacy I, Fox
PN (2007) Global adaptation patterns of Australian and CIMMYT spring bread wheat. Theoretical and Applied Genetics 115, 819-835.
Mathews KL, Malosetti M, Chapman S, McIntyre L, Reynolds M, Shorter R, van Eeuwijk F (2008) Multi-environment QTL mixed models for drought stress adaptation in wheat. Theoretical and Applied Genetics 117, 1077-1091.
McGuire C, Taylor G, Rust C, Kisha T (1994) End-use quality of Montana 7811, hard white winter wheat. Montana agresearch 11,
McIntyre CL, Mathews KL, Rattey A, Chapman SC, Drenth J, Ghaderi M, Reynolds M, Shorter R (2010a) Molecular detection of genomic regions associated with grain yield and yield-related components in an elite bread wheat cross evaluated under irrigated and rainfed conditions. TAG. Theoretical and applied genetics. Theoretische und angewandte Genetik 120, 527-541.
McIntyre CL, Mathews KL, Rattey A, Chapman SC, Drenth J, Ghaderi M, Reynolds M, Shorter R (2010b) Molecular detection of genomic regions associated with grain yield and yield-related components in an elite bread wheat cross evaluated under irrigated and rainfed conditions. Theoretical and Applied Genetics 120, 527-541.
McRae AF, McEwan JC, Dodds KG, Wilson T, Crawford AM, Slate J (2002) Linkage Disequilibrium in Domestic Sheep. Genetics 160, 1113-1122.
Merah O (2001) Potential importance of water status traits for durum wheat improvement under Mediterranean conditions. The Journal of Agricultural Science 137, 139-145.
Merah O, Deléens E, Souyris I, Nachit M, Monneveux P (2001) Stability of Carbon Isotope Discrimination and Grain Yield in Durum Wheat. Crop Sci. 41, 677-681.
Mille B, Fraj MB, Monod H, de Vallavieille-Pope C (2006) Assessing Four-Way Mixtures of Winter Wheat Cultivars from the Performances of their Two-Way and Individual Components. European Journal of Plant Pathology 114, 163-173.
Misra SC, Randive R, Rao VS, Sheshshayee MS, Serraj R, Monneveux P (2006) Relationship between Carbon Isotope Discrimination, Ash Content and Grain Yield in Wheat in the Peninsular Zone of India. Journal of Agronomy and Crop Science 192, 352-362.
Mitra J (2001) Genetics and genetic improvement of drought resistance in crop plants. CURRENT SCIENCE 80, 758-763.
Moayedi AA, Nasrulhaq-Boyce A, Tavakoli H (2011) Application of physiological and biochemical indices for screening and assessment of drought tolerance in durum wheat genotypes. AUSTRALIAN JOURNAL OF CROP SCIENCE 5, 1014-1018.
Mohlke KL, Tuomilehto J, Collins FS, Boehnke M, Lange EM, Valle TT, Ghosh S, Magnuson VL, Silander K, Watanabe RM, Chines PS, Bergman RN (2001) Linkage disequilibrium between microsatellite markers extends beyond 1 cM on chromosome 20 in Finns. Genome research 11, 1221-1226.

217
Molnar I, Gaspar L, Sarvari E, Dulai A, Hoffmann B, Molnar-Lang M, Galiba G (2004) Physiological and morphological responses to water stress in Aegilops biuncialis and Triticum aestivum genotypes with differing tolerance to drought. Functional Plant Biology 31, 1149-1159.
Monneveux P, Reynolds MP, Trethowan R, González-Santoyo H, Peña RJ, Zapata F (2005) Relationship between grain yield and carbon isotope discrimination in bread wheat under four water regimes. European Journal of Agronomy 22, 231-242.
Moreno F, Murillo JM, Pelegrin F, Giron IF (2006) Long-term impact of conservation tillage on stratification ratio of soil organic carbon and loss of total and active CaCO3. SOIL & TILLAGE RESEARCH 85, 86-93.
Morgan JA, Lecain DR (1991) Leaf gas-exchange and related leaf traits among 15 winter-wheat genotypes. Crop science 31, 443-448.
Morris CF, Casper J, Kiszonas AM, Fuerst EP, Murray J, Simeone MC, Lafiandra D (2015) Soft Kernel Durum Wheat—A New Bakery Ingredient? CEREAL FOODS WORLD 60, 76-83.
Mrabet R (2000) Differential response of wheat to tillage management systems in a semiarid area of Morocco. Field Crops Research 66, 165-174.
Mundt CC (2002) Use of multiline cultivars and cultivar mixtures for disease management. Annual Review of Phytopathology 40, 381-410.
Munkholm LJ, Heck RJ, Deen B (2013) Long-term rotation and tillage effects on soil structure and crop yield. Soil and Tillage Research 127, 85-91.
Munns R (2005) Genes and salt tolerance: bringing them together. New Phytologist 167, 645-663. Muñoz-Romero V, Benítez-Vega J, López-Bellido RJ, Fontán JM, López-Bellido L (2010) Effect of tillage system
on the root growth of spring wheat. Plant and Soil 326, 97-107. Murphy JD, Power NM (2008) How can we improve the energy balance of ethanol production from wheat?
Fuel 87, 1799-1806. Nagarajan S (2005) Can India produce enough wheat even by 2020. Curr Sci 89, 1467-1471. Nagesh B, Kumar A (2006) The physiological and genetic bases of water-use efficiency in winter wheat.
University of Nottingham. Nalam VJ, Vales MI, Watson CJW, Kianian SF, Riera-Lizarazu O (2006) Map-based analysis of genes affecting the
brittle rachis character in tetraploid wheat ( Triticum turgidum L.). Theoretical and Applied Genetics 112, 373-381.
Nar H, Saglam A, Terzi R, Várkonyi Z, Kadioglu A (2009) Leaf rolling and photosystem II efficiency in Ctenanthe setosa exposed to drought stress. Photosynthetica 47, 429-436.
Naudin C, Corre-Hellou G, Pineau S, Crozat Y, Jeuffroy MH (2011) The effect of various dynamics of N availability on winter pea-wheat intercrops: Crop growth, N partitioning and symbiotic N-2 fixation (vol 119, pg 2, 2010). Field Crops Research 120, 201-202.
Nelson JM, Lane B, Freeling M (2002) Expression of a mutant maize gene in the ventral leaf epidermis is sufficient to signal a switch of the leaf's dorsoventral axis. Development (Cambridge, England) 129, 4581-4589.
Nelson RG, Hellwinckel CM, Brandt CC, West TO, De La Torre Ugarte DG, Marland G (2009) Energy use and carbon dioxide emissions from cropland production in the United States, 1990–2004. Journal of Environmental Quality 38, 418-425.
Neumann , o iljski B, Denčić S, Varshney R, Börner A (2011a) Genome-wide association mapping: a case study in bread wheat (Triticum aestivum L.). Molecular Breeding 27, 37-58.
Neumann , o iljski B, Denčić S, Varshney R , Börner A (2011 ) Genome-wide association mapping: a case study in bread wheat ( Triticum aestivum L.). Molecular Breeding 27, 37-58.
Neumann , o iljski B, Denčić S, Varshney R , Börner A (2011c) Genome-wide association mapping: a case study in bread wheat (Triticum aestivum L.). Molecular Breeding 27, 37-58.
Newhouse K, Crosbie T (1986) Interactions of maize hybrids with tillage systems. Agronomy Journal 78, 951-954.

218
Newton AC, Ellis RP, Hackett CA, Guy DC (1997) The effect of component number on Rhynchosporium secalis infection and yield in mixtures of winter barley cultivars. PLANT PATHOLOGY 46, 930-938.
Newton AC, Guy DC (2009) The effects of uneven, patchy cultivar mixtures on disease control and yield in winter barley. Field Crops Research 110, 225-228.
Nikolaeva MK, Maevskaya SN, Shugaev AG, Bukhov NG (2010) Effect of drought on chlorophyll content and antioxidant enzyme activities in leaves of three wheat cultivars varying in productivity. Russian Journal of Plant Physiology 57, 87-95.
Nitzsche W, Hesselbach J (1983) Sortenmischungen statt Viellinien-Sorten 1. Sommergerste. Z. Pflanzenzuecht 90, 68-74.
Njau P, Kimurto PK, Kinyua M, Okwaro H, Ogolla J (2009) Wheat productivity improvement in the drought prone areas of Kenya.
Noorka IR, Batool A, AlSultan S, Tabasum S, Ali A (2013) Water stress tolerance, its relationship to stem reserve mobilization and potence ratio in spring wheat. American Journal of Plant Sciences 4, 231.
Nuttonson MY (1955) Wheat-climate relationships and the use of phenology in ascertaining the thermal and photo-thermal requirements of wheat. Based on data of North America and of some thermally analogous areas of North America in the Soviet Union and in Finland. American institute of crop Ecology
Ochieng JW, Muigai AW, Ude GN (2007) Localizing genes using linkage disequilibrium in plants: integrating lessons from the medical genetics. African Journal of Biotechnology 6,
Ogbonnaya FC, Ye G, Trethowan R, Dreccer F, Lush D, Shepperd J, van Ginkel M (2007) Yield of synthetic backcross-derived lines in rainfed environments of Australia. Euphytica 157, 321-336.
Olesen JE, Trnka M, Kersebaum KC, Skjelvåg AO, Seguin B, Peltonen-Sainio P, Rossi F, Kozyra J, Micale F (2011) Impacts and adaptation of European crop production systems to climate change. European Journal of Agronomy 34, 96-112.
Olivares-Villegas JJ, Reynolds MP, McDonald GK (2007) Drought-adaptive attributes in the Seri/Babax hexaploid wheat population. Functional Plant Biology 34, 189-203.
Østergård H, Jensen J (2005) Increased yield and yield stability in variety mixtures of spring barley. DARCOFenews
Painter JN, Nyholt DR, Montgomery GW (2011) Association mapping. Methods in molecular biology (Clifton, N.J.) U6 - ctx_ver=Z39.88-2004&ctx_enc=info%3Aofi%2Fenc%3AUTF-8&rfr_id=info:sid/summon.serialssolutions.com&rft_val_fmt=info:ofi/fmt:kev:mtx:journal&rft.genre=article&rft.atitle=Association+mapping&rft.jtitle=Methods+in+molecular+biology+%28Clifton%2C+N.J.%29&rft.au=Painter%2C+Jodie+N&rft.au=Nyholt%2C+Dale+R&rft.au=Montgomery%2C+Grant+W&rft.date=2011&rft.eissn=1940-6029&rft.volume=760&rft.spage=35&rft_id=info:pmid/21779989&rft.externalDocID=21779989¶mdict=en-US U7 - Journal Article U8 - FETCH-pubmed_primary_217799891 760, 35.
Paje M, Ludlow M, Lawn R (1988) Variation among soybean (Glycine max (L.) Merr.) accessions in epidermal conductance of leaves. Crop and Pasture Science 39, 363-373.
Parry MAJ, Reynolds MP (2007) Improving resource use efficiency. Annals of Applied Biology 151, 133-135. Passioura J (1977) Grain yield, harvest index, and water use of wheat. J. Aust. Inst. Agric. Sci. 43, 117-120. Passioura J (2006a) Increasing crop productivity when water is scarce—from breeding to field management.
Agricultural Water Management 80, 176-196. Passioura J (2007) The drought environment: physical, biological and agricultural perspectives. Journal of
experimental botany 58, 113-117. Passioura JB (2006b) The perils of pot experiments. Functional Plant Biology 33, 1075-1079. Paterson AH (1998) 'Molecular dissection of complex traits.' (CRC Press: Boca Raton, Fla) Patterson FL, Schafer JF, Caldwell RM, Compton LE (1963) Comparative standing ability and yield of variety
blends of oats. Crop science 3, 558-560.

219
Payne RW MD, Harding SA, Baird DB, Soutar DM (2011) 'An Introduction to GenStat for Windows (14th Edition).' (VSN International: Hemel Hempstead, UK.)
Peigné J, Gautronneau Y, Aveline A, Giteau JL, Cluzeau D (2009) Earthworm populations under different tillage systems in organic farming. SOIL & TILLAGE RESEARCH 104, 207-214.
Peleg Z, Fahima T, Krugman T, Abbo S, Yakir D, Korol AB, Saranga Y (2009a) Genomic dissection of drought resistance in durum wheat x wild emmer wheat recombinant inbreed line population. Plant, Cell & Environment 32, 758-779.
Peleg Z, Fahima T, Krugman T, Abbo S, Yakir D, Korol AB, Saranga Y (2009b) Genomic dissection of drought resistance in durum wheat× wild emmer wheat recombinant inbreed line population. Plant, Cell & Environment 32, 758-779.
Pelosi C, Bertrand M, Roger-Estrade J (2009) Earthworm community in conventional, organic and direct seeding with living mulch cropping systems. AGRONOMY FOR SUSTAINABLE DEVELOPMENT 29, 287-295.
Peltonensainio P, Makela P (1995) Comparison of physiological methods to assess drought tolerance in oats. acta agriculturae scandinavica section b-soil and plant science 45, 32-38.
Peng JH, Sun D, Nevo E (2011) Domestication evolution, genetics and genomics in wheat. Molecular Breeding 28, 281-301.
Perry M, d'Antuono M (1989) Yield improvement and associated characteristics of some Australian spring wheat cultivars introduced between 1860 and 1982. Crop and Pasture Science 40, 457-472.
Petchey OL, Gaston KJ (2002) Functional diversity (FD), species richness and community composition. ECOLOGY LETTERS 5, 402-411.
Petrik S, Kádár Z, Márová I (2013) Utilization of hydrothermally pretreated wheat straw for production of bioethanol and carotene-enriched biomass. Bioresource technology 133, 370-377.
Pinter PJ, Zipoli G, Reginato RJ, Jackson RD, Idso SB, Hohman JP (1990) Canopy temperature as an indicator of differential water use and yield performance among wheat cultivars. Agricultural Water Management 18, 35-48.
Pinto RS, Reynolds MP, Mathews KL, McIntyre CL, Olivares-Villegas J-J, Chapman SC (2010) Heat and drought adaptive QTL in a wheat population designed to minimize confounding agronomic effects. Theoretical and Applied Genetics 121, 1001-1021.
Polley HW (2002) Implications of atmospheric and climatic change for crop yield and water use efficiency. Crop science 42, 131-140.
Porter JR, Gawith M (1999) Temperatures and the growth and development of wheat: a review. European Journal of Agronomy 10, 23-36.
Premachandra GS, Saneoka H, Fujita K, Ogata S (1992a) Leaf water relations, osmotic adjustment, cell-membrane stability, epicuticular wax load and growth as affected by increasing water deficits in sorghum. Journal of experimental botany 43, 1569-1576.
Premachandra GS, Saneoka H, Fujita K, Ogata S (1992b) Leaf water relations, osmotic adjustments, cell-membrane stability, epicuticular wax load and growth as affected by increasing water deficit in Sorghum. Journal of experimental botany 43, 1569-1576.
PREMACHANDRA GS, SANEOKA H, FUJITA K, OGATA S (1992c) Osmotic adjustment and stomatal response to water deficits in maize. Journal of experimental botany 43, 1451-1456.
Preston JC, Kellogg EA (2008) Discrete Developmental Roles for Temperate Cereal Grass VERNALIZATION1/FRUITFULL-like Genes in Flowering Competency and the Transition to Flowering. Plant Physiology 146, 265-276.
Price A, Young E, Tomos A (1997) Quantitative trait loci associated with stomatal conductance, leaf rolling and heading date mapped in upland rice (Oryza sativa). New Phytologist 137, 83-91.
Price AH, Cairns JE, Horton P, Jones HG, Griffiths H (2002a) Linking drought‐resistance mechanisms to drought avoidance in upland rice using a QTL approach: progress and new opportunities to integrate stomatal and mesophyll responses. Journal of experimental botany 53, 989-1004.

220
Price AH, Steele KA, Moore BJ, Jones RGW (2002b) Upland rice grown in soil-filled chambers and exposed to contrasting water-deficit regimes: II. Mapping quantitative trait loci for root morphology and distribution. Field Crops Research 76, 25-43.
Price AH, Tomos AD (1997) Genetic dissection of root growth in rice (Oryza sativa L.). II: mapping quantitative trait loci using molecular markers: II: mapping quantitative trait loci using molecular markers. TAG Theoretical and Applied Genetics 95, 143-152.
Price AH, Townend J, Jones MP, Audebert A, Courtois B (2002c) Mapping QTLs associated with drought avoidance in upland rice grown in the Philippines and West Africa. Plant Molecular Biology 48, 683-695.
Pritchard JK, Przeworski M (2001) Linkage Disequilibrium in Humans: Models and Data. The American Journal of Human Genetics 69, 1-14.
Puget P, Chenu C, Balesdent J (1995) Total and young organic-matter distributions in aggregates of silty cultivated soils. european journal of soil science 46, 449-459.
Qarooni J, Bequette R, Deyoe C (1994) The performance of US hard white wheats: Effect of milling extraction on flour, pan bread, tortilla and pita (Arabic) bread quality. LWT-Food Science and Technology 27, 270-277.
Qu Y, Mu P, Zhang H, Chen CY, Gao Y, Tian Y, Wen F, Li Z (2008) Mapping QTLs of root morphological traits at different growth stages in rice. Genetica 133, 187-200.
Quarrie SP, Quarrie SA, Radosevic R, Rancic D, Kaminska A, Barnes JD, Leverington M, Ceoloni C, Dodig D (2006) Dissecting a wheat QTL for yield present in a range of environments: from the QTL to candidate genes. Journal of experimental botany 57, 2627-2637.
Rafalski JA (2010) Association genetics in crop improvement. Current opinion in plant biology 13, 174-180. Rajaram S (2001) Prospects and promise of wheat breeding in the 21st century. In 'Wheat in a Global
Environment.' pp. 37-52. (Springer: Ray DK, Mueller ND, West PC, Foley JA (2013a) Yield trends are insufficient to double global crop production
by 2050. PloS one 8, e66428. Ray DK, Mueller ND, West PC, Foley JA (2013b) Yield Trends Are Insufficient to Double Global Crop Production
by 2050. PLoS ONE 8, Ray JD, Yu L, McCouch SR, Champoux MC, Wang G, Nguyen HT (1996) Mapping quantitative trait loci
associated with root penetration ability in rice (Oryza sativa L). Theoretical and Applied Genetics 92, 627-636.
Rebetzke G, Condon A, Farquhar G, Appels R, Richards R (2008a) Quantitative trait loci for carbon isotope discrimination are repeatable across environments and wheat mapping populations. Theoretical and Applied Genetics 118, 123-137.
Rebetzke GJ, van Herwaarden AF, Jenkins C, Weiss M, Lewis D, Ruuska S, Tabe L, Fettell NA, . RR, (2008) Quantitative trait loci for watersoluble carbohydrates and associations with agronomic traits in wheat. Australian Journal of Agricultural Research 59 891-905.
Rebetzke GJ, Botwright TL, Moore CS, Richards RA, Condon AG (2004) Genotypic variation in specific leaf area for genetic improvement of early vigour in wheat. Field Crops Research 88, 179-189.
Rebetzke GJ, Condon AG, Farquhar GD, Appels R, Richards RA (2008b) Quantitative trait loci for carbon isotope discrimination are repeatable across environments and wheat mapping populations. Theoretical and Applied Genetics 118, 123-137.
Rebetzke GJ, Condon AG, Richards RA, Farquhar GD (2002) Selection for reduced carbon isotope discrimination increases aerial biomass and grain yield of rainfed bread wheat. Crop science 42, 739-745.
Rebetzke GJ, Condon AG, Richards RA, Farquhar GD (2003) Gene action for leaf conductance in three wheat crosses. Australian Journal of Agricultural Research 54, 381-387.
Rebetzke GJ, Rattey AR, Farquhar GD, Richards RA, Condon AG (2013a) Genomic regions for canopy temperature and their genetic association with stomatal conductance and grain yield in wheat. Functional Plant Biology 40, 14-33.

221
Rebetzke GJ, Rattey AR, Farquhar GD, Richards RA, Condon ATG (2013b) Genomic regions for canopy temperature and their genetic association with stomatal conductance and grain yield in wheat. Functional Plant Biology 40, 14-33.
Rebetzke GJ, Van Herwaarden AF, Jenkins C, Weiss M, Lewis D, Ruuska S, Tabe L, Fettell NA, Richards RA (2008c) Quantitative trait loci for water-soluble carbohydrates and associations with agronomic traits in wheat. Australian Journal of Agricultural Research 59, 891-905.
Rees D, Sayre K, Acevedo E, Nava Sanchez T, Lu Z, Zeiger E, Limon A (1993) 'Canopy temperatures of wheat: Relationship with yield and potential as a technique for early generation selection.' (CIMMYT:
Rehman Arif MA, Neumann K, Nagel M, Kobiljski B, Lohwasser U, Börner A (2012) An association mapping analysis of dormancy and pre-harvest sprouting in wheat. Euphytica 188, 409-417.
Reich DE, Ward R, Lander ES, Cargill M, Bolk S, Ireland J, Sabeti PC, Richter DJ, Lavery T, Kouyoumjian R, Farhadian SF (2001) Linkage disequilibrium in the human genome. Nature 411, 199-204.
Reif JC, Gowda M, Maurer HP, Longin CFH, Korzun V, Ebmeyer E, Bothe R, Pietsch C, Würschum T (2011) Association mapping for quality traits in soft winter wheat. Theoretical and Applied Genetics 122, 961-970.
Rensink WA, Buell CR (2004) Arabidopsis to Rice. Applying Knowledge from a Weed to Enhance Our Understanding of a Crop Species1. Plant Physiology 135, 622-629.
Reusch TB, Ehlers A, Hämmerli A, Worm B (2005) Ecosystem recovery after climatic extremes enhanced by genotypic diversity. Proceedings of the National Academy of Sciences of the United States of America 102, 2826-2831.
Reynolds M, Foulkes J, Furbank R, Griffiths S, King J, Murchie E, Parry M, Slafer G (2012) Achieving yield gains in wheat. Plant, Cell & Environment 35, 1799-1823.
Reynolds M, Manes Y, Izanloo A, Langridge P (2009) Phenotyping approaches for physiological breeding and gene discovery in wheat. Annals of Applied Biology 155, 309-309.
Reynolds M, Nagarajan S, Razzaque M, Ageeb O (1997) 'Using canopy temperature depression to select for yield potential of wheat in heat-stressed environments.' (CIMMYT:
Reynolds M, Trethowan R (2007) Physiological interventions in breeding for adaptation to abiotic stress. Frontis 21, 127-144.
Reynolds M, Tuberosa R (2008) Translational research impacting on crop productivity in drought-prone environments. Current Opinion in Plant Biology 11, 171-179.
Reynolds MP, Balota M, Delgado MIB, Amani I, Fischer RA (1994) PHYSIOLOGICAL AND MORPHOLOGICAL TRAITS ASSOCIATED WITH SPRING WHEAT YIELD UNDER HOT, IRRIGATED CONDITIONS. AUSTRALIAN JOURNAL OF PLANT PHYSIOLOGY 21, 717-730.
Reynolds MP, Calderini DF, Condon AG, Rajaram S (2001) Physiological basis of yield gains in wheat associated with the LR19 translocation from Agropyron elongatum. Euphytica 119, 137-141.
Reynolds MP, Mujeeb-Kazi A, Sawkins M (2005) Prospects for utilising plant-adaptive mechanisms to improve wheat and other crops in drought- and salinity-prone environments. Annals of Applied Biology 146, 239-239.
Ribaut J-M, Ragot M (2007) Marker-assisted selection to improve drought adaptation in maize: the backcross approach, perspectives, limitations, and alternatives. Journal of experimental botany 58, 351-360.
Richards RA (1986) 'Glaucousness in wheat, its effect on yield and related characteristics in dryland environments, and its control by minor genes.' 2000. Available at http://usyd.summon.serialssolutions.com/link/0/eLvHCXMwY2BQMLBMTQXWEolmpkmWxmmpFsAoNk1KTjUGgsTElERLlGFspNLcTYiBKTVPlEHJzTXE2UMXVjTGJyaBev3JJcXxwNoHVEWbGIox8CaCVoDnlYB3iqWIM7CmAaMrVRxUhIoDjRNn4IiwdPaJ9A-CcoVgXL1i8HYmvcIScWCJDY5tXUM9AwAm2S4M
Richards RA (1991) Crop improvement for temperate Australia: Future opportunities. Field Crops Research 26, 141-169.
Richards RA, A.G. C, G.J. R (2001) Traits to Improve Yield in Dry Environments. In 'Application of Physiology in Wheat Breeding.' (Ed. JIO-M M.P. Reynolds, and A. McNab (eds.).) (CIMMYT: Mexico, D.F)

222
Richards RA, Hunt JR, Kirkegaard JA, Passioura JB (2014) Yield improvement and adaptation of wheat to water-limited environments in Australia-a case study. CROP & PASTURE SCIENCE 65, 676-689.
Richards RA, Rebetzke GJ, Condon AG, van Herwaarden AF (2002) Breeding opportunities for increasing the efficiency of water use and crop yield in temperate cereals. Crop science 42, 111-121.
Risch N, Merikangas K (1996) The Future of Genetic Studies of Complex Human Diseases. Science 273, 1516-1517.
Rizhsky L, Liang H, Shuman J, Shulaev V, Davletova S, Mittler R (2004) When defense pathways collide. The response of Arabidopsis to a combination of drought and heat stress. Plant Physiology 134, 1683-1696.
Rosenow D, Quisenberry J, Wendt C, Clark L (1983) Drought tolerant sorghum and cotton germplasm. Agricultural Water Management 7, 207-222.
Rousset M, Le Gouis J, Santoni S, Goldringer I, Bonnin I, Remoué C, Falque M, Rhoné B, Veyrieras J-B, Madur D, Murigneux A, Balfourier F (2011) Deciphering the genetics of flowering time by an association study on candidate genes in bread wheat ( Triticum aestivum L.). Theoretical and Applied Genetics 123, 907-926.
Royo C, Villegas D, del Moral LFG, Elhani S, Aparicio N, Rharrabti Y, Araus JL (2002) Comparative performance of carbon isotope discrimination and canopy temperature depression as predictors of genotype differences in durum wheat yield in Spain. Australian Journal of Agricultural Research 53, 561-569.
Royo C, Voltas J, Romagosa I (1999) Remobilization of pre-anthesis assimilates to the grain for grain only and dual-purpose (forage and grain) triticale. agronomy Journal 91, 312-316.
Ruuska SA, Rebetzke GJ, van Herwaarden AF, Richards RA, Fettell NA, Tabe L, Jenkins CLD (2006) Genotypic variation in water-soluble carbohydrate accumulation in wheat. Functional Plant Biology 33, 799-809.
Sadras VO, Lawson C (2011) Genetic gain in yield and associated changes in phenotype, trait plasticity and competitive ability of South Australian wheat varieties released between 1958 and 2007. Crop & Pasture Science 62, 533-549.
Saini HS, Westgate ME (2000) Reproductive development in grain crops during drought. Vol. 68 pp. 59-96. (Elsevier: San Diego)
Salekdeh GH, Reynolds M, Bennett J, Boyer J (2009) Conceptual framework for drought phenotyping during molecular breeding. Trends in plant science 14, 488-496.
Salem KFM, Roder MS, Borner A (2007) Identification and mapping quantitative trait loci for stem reserve mobilisation in wheat (Triticum aestivum L.). CEREAL RESEARCH COMMUNICATIONS 35, 1367-1374.
Salvi S, Tuberosa R (2005) To clone or not to clone plant QTLs: present and future challenges. Trends in plant science 10, 297-304.
Samarah NH (2005) Effects of drought stress on growth and yield of barley. AGRONOMY FOR SUSTAINABLE DEVELOPMENT 25, 145-149.
Sansberro PA, Mroginski LA, Bottini RE (2004) Foliar sprays with ABA promote growth of Ilex paraguariensis by alleviating diurnal water stress. Plant Growth Regulation 42, 105-111.
Sarandon SJ, Sarandon R (1995) Mixture of Cultivars: Pilot Field Trial of an Ecological Alternative to Improve Production or Quality of Wheat (Triticum aestivum). Journal of Applied Ecology 32, 288-294.
Saranga Y, Flash I, Paterson AH, Yakir D (1999) Carbon isotope ratio in cotton varies with growth stage and plant organ. Plant Science 142, 47-56.
Saranga Y, Jiang CX, Wright RJ, Yakir D, Paterson AH (2004) Genetic dissection of cotton physiological responses to arid conditions and their inter‐relationships with productivity. Plant, Cell & Environment 27, 263-277.
Sareen S, Tyagi BS, Sarial AK, Tiwari V, Sharma I (2014) Trait analysis, diversity, and genotype x environment interaction in some wheat landraces evaluated under drought and heat stress conditions. Chilean journal of agricultural research 74, 135-142.
Sarieva G, Kenzhebaeva S, Lichtenthaler H (2010) Adaptation potential of photosynthesis in wheat cultivars with a capability of leaf rolling under high temperature conditions. Russian Journal of Plant Physiology 57, 28-36.

223
Saunders DA, Hettel GP (1994) 'Wheat in Heat-stressed Environments: Irrigated, Dry Areas, and Rice-wheat Farming Systems: Proceedings of the International Conferences: Wheat in Hot, Dry, Irrigated Environments, Wad Medani, Sudan, 1-4 February 1993, Wheat in Warm Area, Rice-wheat Farming Systems, Dinajpur, Bangladesh, 13-15 Feburary [sic] 1993.' (CIMMYT:
Sayre K, Rajaram S, Fischer R (1997) Yield potential progress in short bread wheats in northwest Mexico. Crop science 37, 36-42.
Schonfeld MA, Johnson RC, Carver BF, Mornhinweg DW (1988) Water Relations in Winter Wheat as Drought Resistance Indicators. Crop Sci. 28, 526-531.
Schuppler U (1998) Effect of Water Stress on Cell Division and Cdc2-Like Cell Cycle Kinase Activity in Wheat Leaves. PLANT PHYSIOLOGY U6 - ctx_ver=Z39.88-2004&ctx_enc=info%3Aofi%2Fenc%3AUTF-8&rfr_id=info:sid/summon.serialssolutions.com&rft_val_fmt=info:ofi/fmt:kev:mtx:journal&rft.genre=article&rft.atitle=Effect+of+Water+Stress+on+Cell+Division+and+Cdc2-Like+Cell+Cycle+Kinase+Activity+in+Wheat+Leaves&rft.jtitle=PLANT+PHYSIOLOGY&rft.au=Schuppler%2C+U&rft.date=1998-06-01&rft.eissn=1532-2548&rft.volume=117&rft.issue=2&rft.spage=667&rft.epage=678&rft_id=info:doi/10.1104%2Fpp.117.2.667&rft.externalDBID=n%2Fa&rft.externalDocID=10_1104_pp_117_2_667¶mdict=en-US U7 - Journal Article U8 - FETCH-LOGICAL-c1000-1ed73d7cb670e25da1c377ba54d83a62a572d446d86d15c10a5b4478835007b91 117, 667-678.
Semenov MA, Halford NG (2009) Identifying target traits and molecular mechanisms for wheat breeding under a changing climate. Journal of experimental botany 60, 2791-2804.
Semenov MA, Shewry PR (2011) Modelling predicts that heat stress, not drought, will increase vulnerability of wheat in Europe. Scientific reports 1, 66.
Shaheen R, Hood-Nowotny RC (2005) Effect of drought and salinity on carbon isotope discrimination in wheat cultivars. Plant Science 168, 901-909.
Shamsudin NAA, Swamy BPM, Ratnam W, Sta Cruz MT, Raman A, Kumar A (2016) Marker assisted pyramiding of drought yield QTLs into a popular Malaysian rice cultivar, MR219. BMC genetics 17, 30.
Shangguan ZP, Shao MA, Dyckmans J (2000) Nitrogen nutrition and water stress effects on leaf photosynthetic gas exchange and water use efficiency in winter wheat. Environmental and Experimental Botany 44, 141-149.
Shao H, Liang Z, Shao M (2006) Progress and trend in the study of anti-drought physiology and biochemistry and molecular biology of wheat. Acta Prataculturae Sin 15, 12-25.
Sharma S, Xu S, Ehdaie B, Hoops A, Close TJ, Lukaszewski AJ, Waines JG (2011) Dissection of QTL effects for root traits using a chromosome arm-specific mapping population in bread wheat. Theoretical and Applied Genetics 122, 759-769.
Shaxson TF (2009) Re-thinking the conservation of carbon, water and soil: a different perspective. In 'Sustainable Agriculture.' pp. 61-74. (Springer:
Shearman V, Sylvester-Bradley R, Scott R, Foulkes M (2005a) Physiological processes associated with wheat yield progress in the UK. Crop science 45, 175-185.
Shearman VJ, Sylvester-Bradley R, Scott RK, Foulkes MJ (2005b) Physiological processes associated with wheat yield progress in the UK. Crop science 45, 175-185.
Shepherd K, Cooper P, Allan A, Drennan D, Keatinge J (1987) Growth, water use and yield of barley in Mediterranean-type environments. The Journal of Agricultural Science 108, 365-378.
Shewry PR, 2009. Wheat. OXFORD UNIV PRESS, OXFORD. 60: 1537-1553. Shi JR, Xu DH, Yang HY, Lu QX, Ban T (2008) DNA marker analysis for pyramided of Fusarium head blight (FHB)
resistance QTLs from different germplasm. Genetica 133, 77-84. Shimada S, Handa H, Murai K, Ogawa T, Kitagawa S, Suzuki T, Ikari C, Shitsukawa N, Abe T, Kawahigashi H,
Kikuchi R (2009) A genetic network of flowering-time genes in wheat leaves, in which an APETALA1/FRUITFULL-like gene, VRN1, is upstream of FLOWERING LOCUS T. The Plant journal : for cell and molecular biology 58, 668-681.

224
Siahpoosh MR, Dehghanian E, Kamgar A (2011) Drought Tolerance Evaluation of Bread Wheat Genotypes Using Water Use Efficiency, Evapotranspiration Efficiency, and Drought Susceptibility Index. Crop science 51, 1198-1204.
Simmonds DH (1989) 'Wheat and wheat quality in Australia.' (CSIRO PUBLISHING: Simons KJ, Fellers JP, Trick HN, Zhang Z, Tai Y-S, Gill BS, Faris JD (2006) Molecular Characterization of the Major
Wheat Domestication Gene Q. Genetics 172, 547-555. Simpfendorfer S, Kirkegaard J, Heenan D, Wong P (2002) Reduced early growth of direct drilled wheat in
southern New South Wales-role of root inhibitory pseudomonads. Crop and Pasture Science 53, 323-331.
Singh R, Datta D, Priyamvada, Singh S, Tiwari R (2004) Marker-assisted selection for leaf rust resistance genes Lr19 and Lr24 in wheat (Triticum aestivum L.). Journal of Applied Genetics 45, 399-403.
Sionit N, Hellmers H, Strain BR (1980) Growth and Yield of Wheat under CO2 Enrichment and Water Stress1. Crop Sci. 20, 687-690.
Slafer GA (2003) Genetic basis of yield as viewed from a crop physiologist's perspective. Annals of Applied Biology 142, 117-128.
Slafer GA, Abeledo LG, Miralles DJ, Gonzalez FG, Whitechurch EM (2001) Photoperiod sensitivity during stem elongation as an avenue to raise potential yield in wheat. Euphytica 119, 191-197.
Slafer GA, Araus JL, Royo C, García del Moral LF (2005) Promising eco-physiological traits for genetic improvement of cereal yields in Mediterranean environments. Annals of Applied Biology 146, 61-70.
Slafer GA, Rawson HM (1994) SENSITIVITY OF WHEAT PHASIC DEVELOPMENT TO MAJOR ENVIRONMENTAL-FACTORS - A REEXAMINATION OF SOME ASSUMPTIONS MADE BY PHYSIOLOGISTS AND MODELERS. AUSTRALIAN JOURNAL OF PLANT PHYSIOLOGY 21, 393-426.
Slafer GA, Savin R (1991) Developmental Base Temperature in Different Phenological Phases of Wheat (Triticum aestivum). Journal of experimental botany 42, 1077-1082.
Slatkin M (2008) Linkage disequilibrium--understanding the evolutionary past and mapping the medical future. Nature reviews. Genetics 9, 477-485.
Smithson JB, Lenne JM (1996) Varietal mixtures: A viable strategy for sustainable productivity in subsistence agriculture. Annals of Applied Biology 128, 127-158.
Snape JW, Foulkes MJ, Simmonds J, Leverington M, Fish LJ, Wang Y, Ciavarrella M (2007) Dissecting gene x environmental effects on wheat yields via QTL and physiological analysis. Euphytica 154, 401-408.
Soane BD, Ball BC, Arvidsson J, Basch G, Moreno F, Roger-Estrade J (2012) No-till in northern, western and south-western Europe: a review of problems and opportunities for crop production and the environment. Soil and Tillage Research 118, 66-87.
Somerville C, Briscoe J (2001) Genetic engineering and water. Science (New York, N.Y.) 292, 2217-2217. Spano G, Di Fonzo N, Perrotta C, Platani C, Ronga G, Lawlor D, Napier J, Shewry P (2003) Physiological
characterization of ‘stay green’mutants in durum wheat. Journal of experimental botany 54, 1415-1420.
Specht JE, Chase K, Macrander M, Graef GL, Chung J, Markwell JP, Germann M, Orf JH, Lark KG (2001) Soybean response to water: A QTL analysis of drought tolerance. Crop science 41, 493-509.
Statistics ABo, 2014. Media Release: Australian Bureau of Statistics. MediaNet Press Release Wire U6 - ctx_ver=Z39.88-2004&ctx_enc=info%3Aofi%2Fenc%3AUTF-8&rfr_id=info:sid/summon.serialssolutions.com&rft_val_fmt=info:ofi/fmt:kev:mtx:journal&rft.genre=article&rft.atitle=Media+Release%3A+Australian+Bureau+of+Statistics&rft.jtitle=MediaNet+Press+Release+Wire&rft.date=2014-03-05&rft.pub=Australian+Associated+Press+Pty+Limited&rft.externalDocID=3235832971¶mdict=en-US U7 - Newspaper Article U8 - FETCH-proquest_dll_32358329713. Australian Associated Press Pty Limited, Sydney.
Stella A, Boettcher PJ (2004) Optimal Designs for Linkage Disequilibrium Mapping and Candidate Gene Association Tests in Livestock Populations. Genetics 166, 341-350.

225
Stich B, Maurer HP, Melchinger AE, Frisch M, Heckenberger M, van der Voort JR, Peleman J, Sørensen AP, Reif JC (2006) Comparison of Linkage Disequilibrium in Elite European Maize Inbred Lines using AFLP and SSR Markers. Molecular Breeding 17, 217-226.
Stich B, Melchinger AE, Frisch M, Maurer HP, Heckenberger M, Reif JC (2005) Linkage disequilibrium in European elite maize germplasm investigated with SSRs. TAG. Theoretical and applied genetics. Theoretische und angewandte Genetik 111, 723-730.
Stich B, Melchinger AE, Heckenberger M, Möhring J, Schechert A, Piepho H-P (2008) Association mapping in multiple segregating populations of sugar beet (Beta vulgaris L.). Theoretical and Applied Genetics 117, 1167-1179.
Stich B, Melchinger AE, Piepho H-P, Hamrit S, Schipprack W, Maurer HP, Reif JC (2007) Potential causes of linkage disequilibrium in a European maize breeding program investigated with computer simulations. Theoretical and Applied Genetics 115, 529-536.
Stockfisch N, Forstreuter T, Ehlers W (1999) Ploughing effects on soil organic matter after twenty years of conservation tillage in Lower Saxony, Germany. SOIL & TILLAGE RESEARCH 52, 91-101.
Stuke F, Fehrmann H (1987) Sortenmischungen im Weizenanbau. Nachrchtenbl. Dtsch. Pflanzenschutzdienst 39, 53-57.
Stützel H, Aufhammer W (1990) The physiological causes of mixing effects in cultivar mixtures: A general hypothesis. Agricultural Systems 32, 41-53.
Su Z, Gabriels D, Zhang J, Wu W, Cai D, Lv J, Jiang G, Huang J, Gao J, Hartmann R (2007) Effects of conservation tillage practices on winter wheat water-use efficiency and crop yield on the Loess Plateau, China. Agricultural Water Management 87, 307-314.
Subashri M, Robin S, Vinod KK, Rajeswari S, Mohanasundaram K, Raveendran TS (2009) Trait identification and QTL validation for reproductive stage drought resistance in rice using selective genotyping of near flowering RILs. Euphytica 166, 291-305.
Subbarao GV, Nam NH, Chauhan YS, Johansen C (2000) Osmotic adjustment, water relations and carbohydrate remobilization in pigeonpea under water deficits. Journal of plant physiology 157, 651-659.
Sukumaran S, Dreisigacker S, Lopes M, Chavez P, Reynolds MP (2015a) Genome-wide association study for grain yield and related traits in an elite spring wheat population grown in temperate irrigated environments. Theoretical and Applied Genetics 128, 353-363.
Sukumaran S, Reynolds MP, Lopes MS, Crossa J (2015b) Genome-Wide Association Mapping for Adaptation to Agronomic Plant Density: A Component of High Yield Potential in Wheat. TRIGO (Wheat) Yield Potential 5.
Tahara M, Carver BF, Johnson RC, Smith EL (1990) Relationship between relative water-content during reproductive development and winter-wheat grain-yield. Euphytica 49, 255-262.
Takai T, Fukuta Y, Shiraiwa T, Horie T (2005) Time-related mapping of quantitative trait loci controlling grain-filling in rice (Oryza sativa L.). Journal of experimental botany 56, 2107-2118.
Takai T, Fukuta Y, Sugimoto A, Shiraiwa T, Horie T (2006) Mapping of QTLs controlling carbon isotope discrimination in the photosynthetic system using recombinant inbred lines derived from a cross between two different rice (Oryza sativa L.) cultivars. PLANT PRODUCTION SCIENCE 9, 271-280.
Tambussi, Bort, Araus (2007a) Water use efficiency in C3 cereals under Mediterranean conditions: a review of physiological aspects. Annals of Applied Biology 150, 307-307.
Tambussi EA, Bort J, Araus JL (2007b) Water use efficiency in C3cereals under Mediterranean conditions: a review of physiological aspects. Annals of Applied Biology 150, 307-321.
Team RC, 2014. R: A language and environment for statistical computing. R Foundation for Statistical Computing, Vienna, Austria. 2013. ISBN 3-900051-07-0,
Tebrügge F, Düring RA (1999) Reducing tillage intensity — a review of results from a long-term study in Germany. SOIL & TILLAGE RESEARCH 53, 15-28.

226
Teulat B, Borries C, This D (2001) New QTLs identified for plant water status, water-soluble carbohydrate and osmotic adjustment in a barley population grown in a growth-chamber under two water regimes. TAG Theoretical and Applied Genetics 103, 161-170.
Teulat B, Merah O, Sirault X, Borries C, Waugh R, This D (2002) QTLs for grain carbon isotope discrimination in field-grown barley. Theoretical and Applied Genetics 106, 118-126.
Teulat B, Zoumarou-Wallis N, Rotter B, Ben Salem M, Bahri H, This D (2003) QTL for relative water content in field-grown barley and their stability across Mediterranean environments. TAG. Theoretical and applied genetics. Theoretische und angewandte Genetik 108, 181-188.
Therneau TM, Atkinson B, Ripley B (2010) rpart: Recursive Partitioning. R package version 3.1-46. Computer software program retrieved from http://CRAN. R-project. org/package= rpart
Tilahun A (1995) Yield Gain and Risk Minimization in Maize ( Zea Mays) through Cultivar Mixtures in Semi-arid Zones of the Rift Valley in Ethiopia. Experimental Agriculture 31, 161-168.
Tiwari VK, Wang S, Sehgal S, Vrána J, Frie e B, u aláková M, Chhuneja P, Doležel J, Akhunov E, alia B (2014) SNP Discovery for mapping alien introgressions in wheat. BMC genomics 15, 273.
Tommasini L, Schnurbusch T, Fossati D, Mascher F, Keller B (2007) Association mapping of Stagonospora nodorum blotch resistance in modern European winter wheat varieties. Theoretical and Applied Genetics 115, 697-708.
Tooker JF, Frank SD, Steffan‐Dewenter I (2012) Genotypically diverse cultivar mixtures for insect pest management and increased crop yields. Journal of Applied Ecology 49, 974-985.
Tratwal A, Law J, Philpott H, Horwell A, J G (2007) The possibilities of reduction of winter barley chemical protection by growing variety mixtures. Journal of Plant Protection Research 47, 87-99.
Treder K, Wanic M, Nowicki J (2008) Competition between spring wheat and spring barley under conditions of diversified fertilisation. Part I. Influence on selected morphological characteristics of plants. Acta Agrophysica 11, 767-780.
Trethowan R, Reynolds M (2007) Drought resistance: genetic approaches for improving productivity under stress. In 'wheat production in stressed environments.' pp. 289-299. (Springer:
Trethowan R, Reynolds M, Sayre , ORTIZ‐MONASTERIO I (2005a) Adapting wheat cultivars to resource conserving farming practices and human nutritional needs. Annals of Applied Biology 146, 405-413.
Trethowan RM, Mahmood T, Ali Z, Oldach K, Garcia AG (2012) Breeding wheat cultivars better adapted to conservation agriculture. Field Crops Research 132, 76-83.
Trethowan RM, Reynolds M, Sayre K, Ortiz-Monasterio I (2005b) Adapting wheat cultivars to resource conserving farming practices and human nutritional needs. Annals of Applied Biology 146, 405-405.
Trevaskis B, Hemming MN, Dennis ES, Peacock WJ (2007) The molecular basis of vernalization-induced flowering in cereals. Trends in Plant Science 12, 352-357.
Triboi E, Triboi-Blondel A-M (2002) Productivity and grain or seed composition: a new approach to an old problem—invited paper. European Journal of Agronomy 16, 163-186.
Tsialtas JT, Tokatlidis I, Tamoutsidis E, Xinias I (2001) Grain carbon isotope discrimination and ash content of cv. Nestos bread wheat plants selected for high and low yield in absence of competition. CEREAL RESEARCH COMMUNICATIONS 29, 391-396.
Tuberosa, Giuliani, Parry, Araus (2007) Improving water use efficiency in Mediterranean agriculture: what limits the adoption of new technologies? Annals of Applied Biology 150, 157-157.
Tuberosa R, Salvi S (2006) Genomics-based approaches to improve drought tolerance of crops. Trends in plant science 11, 405-412.
Turner NC (2004) Agronomic options for improving rainfall-use efficiency of crops in dryland farming systems. Journal of experimental botany 55, 2413-2425.
Turner NC, Asseng S (2005) Productivity, sustainability, and rainfall-use efficiency in Australian rainfed Mediterranean agricultural systems. Australian Journal of Agricultural Research 56, 1123-1136.

227
Turner NC, Wright GC, Siddique KHH (2001) Adaptation of grain legumes (pulses) to water-limited environments. Vol. 71 pp. 193-231. (ELSEVIER ACADEMIC PRESS INC: SAN DIEGO)
Ullrich S, Muir C (1986) Genotypic response of spring barley to alternative tillage systems. CEREAL RESEARCH COMMUNICATION 161-168.
Umezawa T, Fujita M, Fujita Y, Yamaguchi-Shinozaki K, Shinozaki K (2006) Engineering drought tolerance in plants: discovering and tailoring genes to unlock the future. Current opinion in biotechnology 17, 113-122.
Unger PW (1990) Conservation Tillage Systems. In 'Advances in Soil Science.' (Eds RP Singh, JF Parr, BA Stewart.) Vol. 13 pp. 27-68. (Springer New York:
Upadhyaya MK, Furness NH (1994) Influence of light intensity and water stress on leaf surface characteristics of Cynoglossum officinale, Centaurea spp., and Tragopogon spp. Canadian Journal of Botany 72, 1379-1386.
ur Rehman A, Habib I, Ahmad N, Hussain M, Khan MA, Farooq J, Ali MA (2009) Screening wheat germplasm for heat tolerance at terminal growth stage. PLANT OMICS 2, 9-19.
Van Oosterom E, Acevedo E (1992) Adaptation of barley (Hordeum vulgare L.) to harsh Mediterranean environments. Euphytica 62, 15-27.
Vavilov NI, Dorofeev VF (1992) 'Origin and geography of cultivated plants.' (Cambridge University Press: Cambridge [England])
Venora G, Calcagno F (1991) Study of stomatal parameters for selection of drought resistant varieties in triticum-durum desf. Euphytica 57, 275-283.
Venuprasad R, Shashidhar HE, Hittalmani S, Hemamalini GS (2002) Tagging quantitative trait loci associated with grain yield and root morphological traits in rice (Oryza sativa L.) under contrasting moisture regimes. Euphytica 128, 293-300.
Vijayalakshmi K, Fritz AK, Paulsen GM, Bai G, Pandravada S, Gill BS (2010) Modeling and mapping QTL for senescence-related traits in winter wheat under high temperature. Molecular Breeding 26, 163-175.
Voorrips R (2002) MapChart: software for the graphical presentation of linkage maps and QTLs. Journal of heredity 93, 77-78.
Wang M, Jiang N, Jia T, Leach L, Cockram J, Waugh R, Ramsay L, Thomas B, Luo Z (2012) Genome-wide association mapping of agronomic and morphologic traits in highly structured populations of barley cultivars. Theoretical and Applied Genetics 124, 233-246.
Wang RX, Hai L, Zhang XY, You GX, Yan CS, Xiao SH (2009) QTL mapping for grain filling rate and yield-related traits in RILs of the Chinese winter wheat population Heshangmai x Yu8679. Theoretical and Applied Genetics 118, 313-325.
Wang Y, Drader T, Tiwari VK, Dong L, Kumar A, Huo N, Ghavami F, Iqbal MJ, Lazo GR, Leonard J (2015) Development of a D genome specific marker resource for diploid and hexaploid wheat. BMC genomics 16, 1.
Ward JH (1963) Hierarchical Grouping to Optimize an Objective Function. Journal of the American statistical association 58, 236-244.
Wardlaw IF, Willenbrink J (2000) Mobilization of fructan reserves and changes in enzyme activities in wheat stems correlate with water stress during kernel filling. New Phytologist 148, 413-422.
Watt M, Kirkegaard JA, Passioura JB (2006) Rhizosphere biology and crop productivity—a review. Australian Journal of Soil Research 44, 299-317.
Watt M, McCully ME, Kirkegaard JA (2003) Soil strength and rate of root elongation alter the accumulation of Pseudomonas spp. and other bacteria in the rhizosphere of wheat. Functional Plant Biology 30, 483-491.
Weiss KM, Clark AG (2002) Linkage disequilibrium and the mapping of complex human traits. Trends in Genetics 18, 19-24.
Weisz R, Bowman DT (1999) Influence of tillage system on soft red winter wheat cultivar selection. JOURNAL OF PRODUCTION AGRICULTURE 12, 415-418.

228
Wenzl P, Caig V, Ovesná J, Cakir M, Poulsen D, Wang J, Raman R, Smith KP, Muehlbauer GJ, Chalmers KJ, Kleinhofs A, Li H, Huttner E, Kilian A, Carling J, Zhou M, Raman H, Paul E, Hearnden P, Maier C, Xia L (2006) A high-density consensus map of barley linking DArT markers to SSR, RFLP and STS loci and agricultural traits. BMC genomics 7, 206-206.
White D, 2009. maptree: Mapping, pruning, and graphing tree models. R package version 1.4-5. White JW, Herndl M, Hunt LA, Payne TS, Hoogenboom G (2008) Simulation-based analysis of effects of Vrn and
Ppd loci on flowering in wheat. Crop science 48, 678-687. Whitmore AP, Whalley WR, 2009. Physical effects of soil drying on roots and crop growth. OXFORD UNIV
PRESS, England. 60: 2845-2857. Willcox G (2005) The distribution, natural habitats and availability of wild cereals in relation to their
domestication in the Near East: multiple events, multiple centres. Vegetation History and Archaeobotany 14, 534-541.
Willey RW (1979) 'Intercropping: Its Importance and Research Needs. Part 1, Competition and Yield Advantages.' (Commonwealth Agricultural Bureaux:
Winter SR, Musick JT, Porter KB (1988) Evaluation of Screening Techniques for Breeding Drought-Resistanct Winter Wheat. Crop Sci. 28, 512-516.
Witten DM, Tibshirani R sparcl: Perform sparse hierarchical clustering and sparse k-means clustering. 2011. R package version 2,
Wolfe M (1985a) The current status and prospects of multiline cultivars and variety mixtures for disease resistance. Annual Review of Phytopathology 23, 251-273.
Wolfe MS (1985b) The Current Status and Prospects of Multiline Cultivars and Variety Mixtures for Disease Resistance. Annual Review of Phytopathology 23, 251-273.
Worland AJ (1996) The influence of flowering time genes on environmental adaptability in European wheats. Euphytica 89, 49-57.
Worland AJ, Börner A, Korzun V, Li WM, Petrovíc S, Sayers EJ (1998) The influence of photoperiod genes on the adaptability of European winter wheats. Euphytica 100, 385-394.
Würschum T, Maurer HP, Kraft T, Janssen G, Nilsson C, Reif JC (2011) Genome-wide association mapping of agronomic traits in sugar beet. Theoretical and Applied Genetics 123, 1121-1131.
www.diversityarrays.com., : Diversity arrays technology.;. http://www.triticarte.com.au. Xiao YG, Qian ZG, Wu K, Liu JJ, Xia XC, Ji WQ, He ZH (2012) Genetic gains in grain yield and physiological traits
of winter wheat in Shandong province, China, from 1969 to 2006. Crop Science 52, 44-56. Xu W, Rosenow DT, Nguyen HT (2000) Stay green trait in grain sorghum: relationship between visual rating and
leaf chlorophyll concentration. Plant Breeding 119, 365-367. Xu X, Yuan H, Li S, Trethowan R, Monneveux P (2007) Relationship between Carbon Isotope Discrimination and
Grain Yield in Spring Wheat Cultivated under Different Water Regimes. JOURNAL OF INTEGRATIVE PLANT BIOLOGY 49, 1497-1507.
Xu Y (2002) 9 Global View of QTL: Rice as a Model. Quantitative genetics, genomics, and plant breeding 109. Xu Y, Crouch JH (2008) Marker-assisted selection in plant breeding: from publications to practice. Crop Science
48, 391-407. Xu Y, This D, Pausch RC, Vonhof WM, Coburn JR, Comstock JP, McCouch SR (2009) Leaf-level water use
efficiency determined by carbon isotope discrimination in rice seedlings: genetic variation associated with population structure and QTL mapping. Theoretical and Applied Genetics 118, 1065-1081.
Xue Q, Soundararajan M, Weiss A, Arkebauer TJ, Stephen Baenziger P (2002) Genotypic variation of gas exchange parameters and carbon isotope discrimination in winter wheat. Journal of plant physiology 159, 891-898.
Yadav R, Courtois B, Huang N, McLaren G (1997) Mapping genes controlling root morphology and root distribution in a doubled-haploid population of rice. Theoretical and Applied Genetics 94, 619-632.

229
Yan S, Yan C-J, Zeng X-H, Yang Y-C, Fang Y-W, Tian C-Y, Sun Y-W, Cheng Z-K, Gu M-H (2008) ROLLED LEAF 9, encoding a GARP protein, regulates the leaf abaxial cell fate in rice. Plant Molecular Biology 68, 239-250.
Yang D-L, Jing R-L, Chang X-P, Li W (2007a) Identification of Quantitative Trait loci and Environmental Interactions for Accumulation and Remobilization of Water-Soluble Carbohydrates in Wheat (Triticum aestivum L.) Stems. Genetics 176, 571-584.
Yang DL, Jing RL, Chang XP, Li W (2007b) Quantitative trait loci mapping for chlorophyll fluorescence and associated traits in wheat (Triticum aestivum). JOURNAL OF INTEGRATIVE PLANT BIOLOGY 49, 646-654.
Yang FP, Zhang XK, Xia XC, Laurie DA, Yang WX, He ZH (2009) Distribution of the photoperiod insensitive Ppd-D1a allele in Chinese wheat cultivars. Euphytica 165, 445-452.
Yoshida S, S H (1982) The rice root system: its development and function: its development and function. . In 'Drought resistance in crops with the emphasis on rice ' pp. 83-96. ( IRRI, : Manila )
Yue B, Xue W, Luo L, Xing Y (2008) Identification of quantitative trait loci for four morphologic traits under water stress in rice (Oryza sativa L.). Journal of Genetics and Genomics 35, 569-575.
Zadoks JC, T.T. Chang and C.F. Konzak (1974.) A decimal code for the growth stages of cereals. Weed Research 14, 415-421.
Zanke C, Ling J, Plieske J, Kollers S, Ebmeyer E, Korzun V, Argillier O, Stiewe G, Hinze M, Beier S, Ganal MW, Röder MS (2014) Genetic architecture of main effect QTL for heading date in European winter wheat. Frontiers in plant science 5, 217.
Zeller SL, Kalinina O, Flynn DFB, Schmid B (2012) Mixtures of genetically modified wheat lines outperform monocultures. Ecological Applications 22, 1817-1826.
Zhang G-H, Xu Q, Zhu X-D, Qian Q, Xue H-W (2009a) SHALLOT-LIKE1 Is a KANADI Transcription Factor That Modulates Rice Leaf Rolling by Regulating Leaf Abaxial Cell Development. The Plant Cell 21, 719-735.
Zhang H, Cui F, Wang H (2014a) Detection of quantitative trait loci (QTLs) for seedling traits and drought tolerance in wheat using three related recombinant inbred line (RIL) populations. Euphytica 196, 313-330.
Zhang H, Li J, Hu H, He Z, Ni Y (2012) Improvement of bleached wheat straw pulp properties by using aspen high-yield pulp. Bioresource technology 120, 40-44.
Zhang H, Oweis T (1999) Water–yield relations and optimal irrigation scheduling of wheat in the Mediterranean region. Agricultural Water Management 38, 195-211.
Zhang J, Chen J, Chu C, Zhao W, Wheeler J, Souza EJ, Zemetra RS (2014b) Genetic Dissection of QTL Associated with Grain Yield in Diverse Environments. Agronomy 4, 556-578.
Zhang J, Sui X, Li B, Su B, Li J, Zhou D (1998) An improved water-use efficiency for winter wheat grown under reduced irrigation. Field Crops Research 59, 91-98.
Zhang K, Fang Z, Liang Y, Tian J (2009b) Genetic dissection of chlorophyll content at different growth stages in common wheat. Journal of genetics 88, 183-189.
Zhang Q (2007) Strategies for Developing Green Super Rice. Proceedings of the National Academy of Sciences of the United States of America 104, 16402-16409.
Zhang SL, Sadras V, Chen XP, Zhang FS (2014c) Water use efficiency of dryland maize in the Loess Plateau of China in response to crop management. Field Crops Research 163, 55-63.
Zhang X, Chen S, Liu M, Pei D, Sun H (2005a) Improved water use efficiency associated with cultivars and agronomic management in the North China Plain. Agronomy Journal 97, 783-790.
Zhang X, Chen S, Sun H, Wang Y, Shao L (2010a) Water use efficiency and associated traits in winter wheat cultivars in the North China Plain. Agricultural Water Management 97, 1117-1125.
Zhang XH, Chen XQ, Wu ZY, Zhang XD, Huang CL, Cao MQ (2005b) A dwarf wheat mutant is associated with increased drought resistance and altered responses to gravity. AFRICAN JOURNAL OF BIOTECHNOLOGY 4, 1054-1057.

230
Zhang XK, Xiao YG, Zhang Y, Xia XC, Dubcovsky J, He ZH (2008) Allelic variation at the vernalization genes Vrn-A1, Vrn-B1, Vrn-D1, and Vrn-B3 in Chinese wheat cultivars and their association with growth habit. Crop science 48, 458-470.
Zhang ZB, Xu P, Jia JZ, Zhou RH (2010b) Quantitative trait loci for leaf chlorophyll fluorescence traits in wheat. AUSTRALIAN JOURNAL OF CROP SCIENCE 4, 571-579.
Zhao C-X, Guo L-Y, Jaleel CA, Shao H-B, Yang H-B (2008) Prospectives for applying molecular and genetic methodology to improve wheat cultivars in drought environments. Comptes rendus - Biologies 331, 579-586.
Zhao W, Park E-J, Chung J-W, Park Y-J, Chung I-M, Ahn J-K, Kim G-H (2009) Association analysis of the amino acid contents in rice. JOURNAL OF INTEGRATIVE PLANT BIOLOGY 51, 1126-1137.
Zheng C-Y, Yu Z-W, Ma X-H, WANG X-Z, BAI H-L (2008) Water consumption characteristic and dry matter accumulation and distribution in high-yielding wheat. Acta Agronomica Sinica 8, 023.
Zheng TC, Zhang XK, Yin GH, Wang LN, Han YL, Chen L, Huang F, Tang JW, Xia XC, He ZH (2011) Genetic gains in grain yield, net photosynthesis and stomatal conductance achieved in Henan Province of China between 1981 and 2008. Field Crops Research 122, 225-233.
Zhou H, Steffenson B (2013) Genome-wide association mapping reveals genetic architecture of durable spot blotch resistance in US barley breeding germplasm. Molecular Breeding 32, 139-154.
Zhou KQ, Wang GD, Li YH, Liu XB, Herbert SJ, Hashemi M (2014) Assessing variety mixture of continuous spring wheat (Triticum aestivum L.) on grain yield and flour quality in Northeast China. INTERNATIONAL JOURNAL OF PLANT PRODUCTION 8, 91-105.
Zhu H, Briceno G, Dovel R, Hayes P, Liu B, Liu C, Ullrich S (1999) Molecular breeding for grain yield in barley: an evaluation of QTL effects in a spring barley cross. Theoretical and Applied Genetics 98, 772-779.
Zhu Y, Mew TW, Teng PS, Wang Z, Mundt CC, Chen H, Fan J, Wang Y, Li Y, Chen J, Yang S, Hu L, Leung H (2000) Genetic diversity and disease control in rice. Nature 406, 718-722.

231
9 Appendix I (chapter 3&4)
Zero till Irrigated
Conventional till Irrigated
3 16 1 12 8 17 4 11 2 15 7 19
3 16 1 12 8 17 4 11 2 15 7 19
5 6 20 14 7 10 14 2 4 20 10 11
5 6 20 14 7 10 14 2 4 20 10 11
13 2 15 8 16 12 19 15 12 13 17 1
13 2 15 8 16 12 19 15 12 13 17 1
4 10 19 7 9 1 18 6 18 8 3 5
4 10 19 7 9 1 18 6 18 8 3 5
9 18 17 11 20 13 5 3 16 6 14 9
9 18 17 11 20 13 5 3 16 6 14 9
Rep 1 Rep 2 Rep 3
Rep 1 Rep 2 Rep 3
16 2 11 14 1 7 9 18 19 4 17 9
5 2 18 4 12 17 14 3 1 18 10 4
9 20 19 10 6 16 13 12 18 10 3 5
15 17 7 12 2 18 6 5 2 6 9 19
6 8 7 12 10 14 11 19 13 14 6 12
11 19 1 13 7 20 13 4 7 20 17 16
3 15 1 13 20 15 4 17 2 15 20 11
8 14 9 16 1 16 11 19 3 14 12 8
5 17 4 18 5 8 2 3 7 8 16 1
20 6 3 10 15 8 9 10 15 11 13 5
Zero till Rainfed
Conventional till Rainfed
Figure.1 Experimental Field layout in 2013 cropping season.
Conventional till rainfed
Zero till Rainfed
22 17 16 15 5 14 9 21 12 24 6 23
Rep3
2 16 9 22 5 11 21 8 17 7 14 20
4 3 11 19 10 7 20 18 2 8 1 13 3 19 4 10 18 24 6 23 12 15 1 13
2 23 24 19 16 22 11 1 10 8 18 9
Rep2
21 18 9 5 20 7 2 1 15 23 13 8
20 21 14 5 6 13 3 12 4 17 7 15 4 10 3 19 11 16 17 24 14 22 6 12
4 18 14 7 19 11 13 21 20 6 24 8
Rep1
1 7 6 23 5 3 20 17 11 22 13 15
22 23 2 12 5 3 17 9 15 10 16 1 8 10 16 12 21 4 18 24 19 14 9 2
2 1 21 22 15 9 11 3 10 24 8 13
Rep3
22 15 24 12 9 23 11 2 18 14 7 3
16 4 6 18 23 14 20 5 7 12 19 17 13 19 16 10 5 17 21 1 4 8 6 20
24 2 19 16 3 22 10 9 21 8 14 20
Rep2
22 7 10 15 8 2 3 21 19 13 17 24
18 13 17 6 11 23 1 5 15 4 12 7 6 20 9 5 14 23 18 16 1 4 12 11
5 24 2 11 9 16 13 6 4 12 19 1
Rep1
16 15 8 21 5 10 3 11 9 4 2 19
23 15 20 8 17 18 7 14 10 21 3 22 7 20 12 18 17 1 13 6 24 22 14 23
Conventional till Irrigated
Zero till Irrigated
Figure 2 Experimental Field layout in 2014 cropping season.

232
10 Appendix II (Chapter 5)
Table 1 Means for number of days to heading (DHD) of 215 genotypes evaluated head-to-head in
association analysis in 2014 and 2015 at Narrabri.
Genotype No. Pedigree Cropping year means (days to heading)
2014 2015
1 CRUSADER 110.5
105.0
2 SUNSTATE 115.0
113.0
3 EGA STAMPEDE 113.0
107.5
4 LINCOLN 110.5
108.0
5 LIVINGSTON 110.0
104.5
6 SUNVEX 122.0
119.5
7 MERINDA 107.5
110.5
8 LANG 118.0
115.0
9 SUNVALE 121.0
116.0
10 VENTURA 114.0
112.0
11 ELLISON 117.0
115.5
12 JANZ 116.0
116.0
13 CUNNINGHAM 117.5
114.0
14 EGA GREGORY 121.0
118.0
15 SUNCO 116.5
116.5
16 SUNLIN 120.5
118.5
17 SUNTOP 113.5
113.0
18 SPITFIRE 109.0
117.5
19 EGA GREGORY 118.0
113.0
20 GILES/Carinya 120.5
106.5
21 DM5637*B8/H45//SUN498D 106.5
108.0
22 Wentworth/SUN434A 114.5
110.0
23 Ellison/Ventura 116.5
112.5
24 LPB05-1157 112.0
102.0
25 DM5637*B8/H45//SUN485A 109.0
107.0
26 GILES/Carinya 120.0
119.0
27 Carinya/Sunpict 117.5
115.0
28 SUN325K/SUN434A 109.0
110.5
29 Carinya/Sunpict 114.5
113.0
30 DM5637*B8/H45//SUN498D 116.5
104.5
31 DM5637*B8/H45//SUN498D 98.0
116.0
32 CROC_1/AE.SQUARROSA (224)/ 104.5
103.5
33 DM5637*B8/H45//SUN485A 110.5
106.0
34 LPB05-2148 116.0
115.5
35 Sunco/SUN431A 118.0
113.0

233
Genotype No. Pedigree Cropping year means (days to heading)
2014 2015
36 CUNNINGHAM 2007 117.5
117.0
37 Sunco*2/Kukri 116.0
113.5
38 CPI133814/SUN421H//SUN421E 118.0
115.0
39 SUN325K/SUN434A 115.5
94.5
40 Crusader 114.5
111.5
41 SUNCO/2*PASTOR//SUN436E 109.0
103.5
42 RAC892/98ZHB03//RAC892 113.0
115.5
43 DM5637*B8/H45//SUN498D 101.0
120.0
44 Ellison/Ventura 99.5
101.0
45 GILES/Carinya 119.0
116.0
46 GILES/Carinya 119.5
118.5
47 SUNSTATE/CHARA 117.0
116.5
48 SUN500B/Carinya 116.0
115.5
49 SUN445C/QT10776 116.0
114.5
50
CROC_1/AE.SQUARROSA
(224)//2*OPATA 110.0
106.5
51 SUNSTATE/VO1225//SUN429E 116.0
115.0
52 Lincoln 114.0
115.0
53 SUN344 E/VPMB36020 113.5
112.0
54 Sunco/SUN431A 116.5
114.5
55 Carinya/Sunpict 117.0
111.5
56 GILES 2002 118.5
117.0
57 Ega Bonnie Rock 121.5
118.5
58 Carinya/Sunpict 116.0
111.5
59 Yr15Yr24 2*399C.1 113.0
112.5
60 Lang/SUN431B 117.5
114.0
61 SUN431A/SUN492A 111.0
109.5
62 SUN421T/QT10401 117.5
119.5
63 QT6581/4/PASTOR//SITE/MO/3/CHEN/ 102.5
100.5
64 SUN434A/LANG 107.5
105.5
65 Carinya/Sunpict 116.0
117.0
66 DM5637*B8/H45//SUN485A 119.0
115.5
67 GILES/Carinya 119.0
117.0
68 SUNVALE/VPMB36020 110.0
107.0
69 Carinya/Cascade 115.0
113.0
70 Ellison/Ventura 110.5
108.0
71 Sunco/SUN431A 111.5
111.0
72 Ruby 115.0
109.0
73 Lang/SUN431B 119.0
115.5
74 ZWC06 19 116.5
108.0
75 SUNCO/2*PASTOR 117.5
114.0

234
Genotype No. Pedigree Cropping year means (days to heading)
2014 2015
76 Sunco/SUN431A 117.0
114.0
77 SUN498F/SUN485A 112.0
112.5
78 SUN431A 118.0
116.5
79 Sunco/SUN431A 116.0
115.0
80 Sunvale*2/VO1225 119.5
118.0
81 Chara 118.5
115.5
82 QT10580/SUN431A.34.1 120.5
118.0
83 Chara/4*Sun376G 121.0
118.0
84 LANG/SUN366A 110.5
93.0
85 IRAQ43 116.5
103.0
86 SOKOLL 109.0
109.5
87 SUN344 E/VPMB36020 115.0
115.0
88 Sunvale*2/VO1225 120.0
118.5
89 SUN429E/Ruby 114.0
111.5
90 URES/JUN//KAUZE/3/2*SUNVALE 118.0
116.0
91 CHARA/SUN434A 119.0
112.0
92 SUN421T/SUN399C.22.3 115.0
110.0
93 CHARA/SUN434A 118.0
118.5
94 Ellison/Ventura 117.0
100.0
95 Sunvale/Janz 120.0
119.5
96 LANG/SUN366A 113.0
111.5
97 SUN431A/Lang.25.2 116.0
112.5
98 BAXTER/SUN421N 118.0
117.5
99 SYN 1.57.2 111.0
109.0
100 RAC1192/Ventura 117.0
114.0
101 Carinya/Sunpict 117.0
115.0
102 Carinya/Sunpict 120.0
119.5
103 SUN429E/Ruby 116.5
114.5
104 Sunco/SUN431A 115.0
113.0
105 SYN 1.57.3 114.0
114.0
106 Janz 115.0
111.0
107 Lang/Ellison 117.5
115.5
108 SUN434A/Lang.67.2 111.0
106.0
109 SUN325K/SUN434A 109.0
116.0
110 QT10580/SUN431A.4.3 119.0
115.0
111 SUN429E/Ruby 114.0
113.0
112 QT10580 (Wentworth) 116.0
118.0
113 Carinya 117.0
116.0

235
Genotype No. Pedigree Cropping year means (days to heading)
2014 2015
114 SUN429E/Ruby 116.0
115.5
115 SUN498F/SUN485A 109.0
107.0
116 SUN421T/QT10401 115.0
113.0
117 SUN429E/Ruby 115.0
112.0
118 Sunvale*2/VO1225 121.0
115.0
119 ELLISON/Sunbri 119.0
114.5
120 RAC1192/Ventura 100.0
115.5
121 SUN325K/SUN434A*2 116.0
104.0
122 Sunvale*2/VO1225 121.0
119.5
123 SUN434A/SUN436E 118.0
113.0
124 SUN434A/SUN436E.116.4 109.0
108.5
125 98ZHB03/2*Lang 121.0
115.5
126 GILES/Carinya 117.0
115.5
127 SUNVALE//OPATA*2/WULP 113.0
115.5
128 Sunstate/Ellison 117.0
111.5
129 SUN429E/Ruby 115.0
107.0
130 SUN421T/QT10401 117.0
107.5
131 Carinya/Sunpict 115.0
112.5
132 SUN431A/SUN492A 109.0
107.0
133 Yr15,24,2*399C.102 112.0
109.5
134 D67.2/P66.270//AE.SQUARROSA (320)/3 111.0
131.0
135 KUKRI/SUNSTATE 111.0
100.5
136 SUNVALE/VPMB36020 115.0
110.5
137 SUNVALE//OPATA*2/WULP 115.0
113.0
138 DM5637*B8/H45//SUN485A 111.0
111.0
139 SUNVALE//OPATA*2/WULP 115.0
107.5
140 30Ibwsn008 123.0
113.5
141 SUN434A/SUN436E.46.4 118.0
111.0
142 WA-1-21005/2*SUN426B 117.0
110.0
143 Lang/3*Sun376J.1.2.1 115.0
106.5
144 Sunstate/QT8733 117.0
116.5
145 syn6.47.4 117.0
110.0
146 Carinya/Sunpict 121.0
115.0
147 SUN431A/Lang.21.1 117.0
113.0
148 Sunco*2/Kukri 114.0
113.0
149 SUN372D.1.3 115.0
114.5
150 SUN429E/Ruby 117.0
116.0
151 SUN421T/QT10401 115.0
109.5

236
Genotype No. Pedigree Cropping year means (days to heading)
2014 2015
152 Cascade 109.0
113.0
153 SUN431A/Lang.21.2 117.0
115.5
154 SUN434A 117.0
114.0
155 SYN 3.74.2 98.0
100.0
156 LPB05-1164 109.0
109.5
157 Wentworth/SUN434A 112.0
110.0
158 15HRWSN112 115.0
114.5
159 SUN429E/Ruby 117.0
114.0
160 KUKRI/SUNSTATE 111.0
109.5
161 Sunco/SUN431A 118.0
114.0
162 SUNCO/2*PASTOR//SUN436E 111.0
106.5
163 SUN431A/SUN492A 115.0
109.0
164 Yr15,24,2*399C.85 111.0
110.0
165 Sunvale*2/VO1225 119.0
119.5
166 GILES/Carinya 115.0
111.5
167 B409C/SUN420A//SUN498E 100.0
102.0
168 SUN434A/LANG 100.0
118.0
169 Carinya/Sunpict 115.0
115.5
170 SUN429E/Ruby 116.0
109.0
171 WA-1-21005/2*SUN426B 109.0
105.0
172 SUN434A/SUN436E.188.3 114.0
113.5
173 RAC 892 116.0
115.0
174 Sunco/SUN431A 119.0
117.5
175 4zwf04.1.3 112.0
105.5
176 SUN434A/Lang.40.1 111.0
107.0
177 4zwf04.1.4 111.0
106.0
178 RAC1192/Ventura 107.0
102.5
179 QT10580/SUN431A.34.3 121.0
118.5
180 KUKRI/SUNSTATE 112.0
108.5
181 SUN434A/SUN436E 112.0
112.0
182 SUN429E/Ruby 115.0
114.0
183 DM5637*B8/H45//SUN485A 121.0
118.0
184 SUN431A/SUN492A 109.0
113.0
185 SUNVALE//SERIISO-6/SUNVALE 117.0
110.5
186 98ZHB16/SUN399H//SUN399C 121.0
119.0
187 Yr15,24,2*399C.76 115.0
107.5
188 MILAN/KAUZ/5/CNDO/R143//ENTE/MEXI 112.0
101.0
189 QT8733 115.0
109.5

237
Genotype No. Pedigree Cropping year means (days to heading)
2014 2015
190 QT10580/SUN431A.10.3 117.0
114.0
191 Sunco*2/Kukri 119.0
115.0
192 WA-5-21-020/Lang*2 121.0
115.5
193 AMSEL/2*HTG/3/Sunstate 115.0
113.0
194 URES/KAUZ//2*Janz/3/SUN421E 121.0
118.5
195 Giles 121.0
118.0
196 URES/KAUZ//2*Janz/3/SUN421E 112.0
108.0
197 Sunco*2/Kukri 118.0
117.5
198 SUN434B/Sunco 112.0
104.5
199 SUN434A/CHARA 117.0
119.0
200 Sunco/SUN431A 119.0
113.0
201 SUNVALE//SERIISO-6/SUNVALE 117.0
113.0
202 SUNCO/2*PASTOR//SUN436E 110.0
103.5
203 EGA Bonnie Rock/SUN436F 99.0
100.5
204 DM5637*B8/H45//SUN498D 101.0
106.5
205 SUN434A/SUN436E.142.1 112.0
110.0
206 SUN436F 116.0
113.5
207 RAC1192/Ventura 115.0
109.5
208 Isr614.23/2*Sunvale 121.0
119.5
209 SUN434A/Lang.67.1 114.0
109.5
210 Sunco/SUN431A 112.0
93.0
211 CHARA/SUN434A 118.0
112.5
212 Yr15,24,2*399C.103 117.0
110.5
213 KUKRI/SUNLIN 118.0
114.5
214 SUN498E/Sunco 117.0
114.0
215 CHARA/SUN434A 117.0
121.5
Mean
114.6
112.1
SED
5.22
Wald Statistic
Year
45.2
Genotype
563.05***
Year x Genotype 168.2
Note: ns indicates non-significance and *** significance at P<0.001

238
Table 2 Means for number of days to physiological maturity (DPM) of 215 genotypes evaluated head-
to-head in association analysis in 2014 and 2015 at Narrabri.
Genotype No. Genotype Cropping year means (days to maturity)
2014 2015
1 CRUSADER 152.0
157.5
2 SUNSTATE 158.0
156.5
3 EGA STAMPEDE 156.5
154.0
4 LINCOLN 153.0
152.0
5 LIVINGSTON 159.0
155.5
6 SUNVEX 162.0
155.0
7 MERINDA 148.0
153.0
8 LANG 158.5
158.5
9 SUNVALE 161.5
154.0
10 VENTURA 157.5
155.0
11 ELLISON 157.5
155.0
12 JANZ 159.0
155.5
13 CUNNINGHAM 160.0
155.5
14 EGA GREGORY 160.5
154.0
15 SUNCO 159.0
153.0
16 SUNLIN 161.5
153.5
17 SUNTOP 159.0
154.0
18 SPITFIRE 155.0
159.0
19 EGA GREGORY 159.0
156.0
20 GILES/Carinya 162.0
154.5
21 DM5637*B8/H45//SUN498D 155.5
156.0
22 Wentworth/SUN434A 158.0
154.0
23 Ellison/Ventura 157.0
153.0
24 LPB05-1157 156.0
156.0
25 DM5637*B8/H45//SUN485A 156.5
154.5
26 GILES/Carinya 162.5
153.5
27 Carinya/Sunpict 156.5
155.0
28 SUN325K/SUN434A 157.5
155.5
29 Carinya/Sunpict 159.0
156.0
30 DM5637*B8/H45//SUN498D 155.0
155.0
31 DM5637*B8/H45//SUN498D 147.5
156.0
32 CROC_1/AE.SQUARROSA (224)/ 147.5
156.0
33 DM5637*B8/H45//SUN485A 157.0
156.5
34 LPB05-2148 157.0
155.5

239
Genotype No. Genotype Cropping year means (days to maturity)
2014 2015
35 Sunco/SUN431A 159.0
154.0
36 CUNNINGHAM 2007 158.0
156.5
37 Sunco*2/Kukri 159.0
155.5
38 CPI133814/SUN421H//SUN421E 160.0
156.0
39 SUN325K/SUN434A 156.0
156.0
40 Crusader 154.0
153.5
41 SUNCO/2*PASTOR//SUN436E 154.5
154.5
42 RAC892/98ZHB03//RAC892 157.5
146.0
43 DM5637*B8/H45//SUN498D 152.0
157.5
44 Ellison/Ventura 153.0
155.0
45 GILES/Carinya 156.5
157.0
46 GILES/Carinya 153.5
153.0
47 SUNSTATE/CHARA 159.5
154.5
48 SUN500B/Carinya 160.0
153.5
49 SUN445C/QT10776 157.0
154.5
50 CR_1/AE.SQUARROSA (224)//2*OPATA 149.5
153.5
51 SUNSTATE/VO1225//SUN429E 158.5
156.0
52 Lincoln 156.5
154.0
53 SUN344 E/VPMB36020 159.0
153.0
54 Sunco/SUN431A 160.0
156.0
55 Carinya/Sunpict 159.0
152.0
56 GILES 2002 158.5
155.0
57 Ega Bonnie Rock 159.5
156.0
58 Carinya/Sunpict 156.5
153.5
59 Yr15Yr24 2*399C.1 153.0
156.0
60 Lang/SUN431B 160.5
154.5
61 SUN431A/SUN492A 158.0
152.0
62 SUN421T/QT10401 160.0
159.0
63 QT6581/4/PASTOR//SITE/MO/3/CHEN/ 148.5
153.0
64 SUN434A/LANG 155.0
153.0
65 Carinya/Sunpict 160.0
153.5
66 DM5637*B8/H45//SUN485A 159.0
155.0
67 GILES/Carinya 162.0
155.0
68 SUNVALE/VPMB36020 156.0
153.5
69 Carinya/Cascade 161.0
155.0
70 Ellison/Ventura 157.0
154.0

240
Genotype No. Genotype Cropping year means (days to maturity)
2014 2015
71 Sunco/SUN431A 160.5
152.0
72 Ruby 158.5
153.0
73 Lang/SUN431B 156.0
157.0
74 ZWC06 19 158.0
155.5
75 SUNCO/2*PASTOR 156.5
152.5
76 Sunco/SUN431A 159.0
157.5
77 SUN498F/SUN485A 158.5
153.0
78 SUN431A 158.5
156.0
79 Sunco/SUN431A 159.0
155.0
80 Sunvale*2/VO1225 160.0
153.0
81 Chara 159.0
155.0
82 QT10580/SUN431A.34.1 160.5
153.0
83 Chara/4*Sun376G 157.5
154.0
84 LANG/SUN366A 155.5
155.5
85 IRAQ43 153.5
155.5
86 SOKOLL 154.0
157.0
87 SUN344 E/VPMB36020 156.5
154.0
88 Sunvale*2/VO1225 157.0
157.5
89 SUN429E/Ruby 155.0
155.5
90 URES/JUN//KAUZE/3/2*SUNVALE 160.0
154.0
91 CHARA/SUN434A 163.0
155.0
92 SUN421T/SUN399C.22.3 159.0
158.5
93 CHARA/SUN434A 159.0
155.5
94 Ellison/Ventura 154.5
154.0
95 Sunvale/Janz 160.0
155.5
96 LANG/SUN366A 162.0
153.5
97 SUN431A/Lang.25.2 159.0
157.0
98 BAXTER/SUN421N 159.0
154.5
99 SYN 1.57.2 157.0
156.5
100 RAC1192/Ventura 160.5
153.5
101 Carinya/Sunpict 159.0
154.0
102 Carinya/Sunpict 161.5
154.0
103 SUN429E/Ruby 157.0
152.0
104 Sunco/SUN431A 159.0
152.5
105 SYN 1.57.3 157.0
157.0
106 Janz 159.0
155.5
107 Lang/Ellison 158.5
154.0
108 SUN434A/Lang.67.2 155.0
155.0

241
Genotype No. Genotype Cropping year means (days to maturity)
2014 2015
109 SUN325K/SUN434A 151.0
155.5
110 QT10580/SUN431A.4.3 160.0
155.0
111 SUN429E/Ruby 157.0
150.5
112 QT10580 (Wentworth) 152.5
154.0
113 Carinya 162.0
153.0
114 SUN429E/Ruby 156.5
155.5
115 SUN498F/SUN485A 153.5
158.0
116 SUN421T/QT10401 160.0
154.0
117 SUN429E/Ruby 158.5
153.5
118 Sunvale*2/VO1225 162.0
153.0
119 ELLISON/Sunbri 156.0
153.0
120 RAC1192/Ventura 148.5
157.0
121 SUN325K/SUN434A*2 155.0
155.0
122 Sunvale*2/VO1225 160.0
153.0
123 SUN434A/SUN436E 163.0
156.0
124 SUN434A/SUN436E.116.4 155.0
156.0
125 98ZHB03/2*Lang 161.0
156.5
126 GILES/Carinya 160.0
154.5
127 SUNVALE//OPATA*2/WULP 157.0
155.5
128 Sunstate/Ellison 155.0
153.5
129 SUN429E/Ruby 155.0
153.0
130 SUN421T/QT10401 158.0
154.5
131 Carinya/Sunpict 158.0
153.0
132 SUN431A/SUN492A 155.0
153.5
133 Yr15,24,2*399C.102 157.0
157.5
134 D67.2/P66.270//AE.SQUARROSA (320)/3 152.0
155.0
135 KUKRI/SUNSTATE 154.0
155.0
136 SUNVALE/VPMB36020 157.0
153.0
137 SUNVALE//OPATA*2/WULP 157.0
155.0
138 DM5637*B8/H45//SUN485A 151.0
153.0
139 SUNVALE//OPATA*2/WULP 157.0
153.0
140 30Ibwsn008 159.0
152.5
141 SUN434A/SUN436E.46.4 158.0
157.0
142 WA-1-21005/2*SUN426B 155.0
153.0
143 Lang/3*Sun376J.1.2.1 155.0
154.0
144 Sunstate/QT8733 162.0
155.5
145 syn6.47.4 158.0
157.5
146 Carinya/Sunpict 163.0
156.0
147 SUN431A/Lang.21.1 160.0
154.5

242
Genotype No. Genotype Cropping year means (days to maturity)
2014 2015
148 Sunco*2/Kukri 159.0
154.5
149 SUN372D.1.3 158.0
153.0
150 SUN429E/Ruby 160.0
154.5
151 SUN421T/QT10401 161.0
156.5
152 Cascade 158.0
155.5
153 SUN431A/Lang.21.2 158.0
156.0
154 SUN434A 159.0
154.5
155 SYN 3.74.2 152.0
153.0
156 LPB05-1164 155.0
155.0
157 Wentworth/SUN434A 158.0
155.0
158 15HRWSN112 155.0
157.0
159 SUN429E/Ruby 160.0
153.5
160 KUKRI/SUNSTATE 157.0
154.0
161 Sunco/SUN431A 160.0
154.0
162 SUNCO/2*PASTOR//SUN436E 155.0
156.5
163 SUN431A/SUN492A 155.0
155.0
164 Yr15,24,2*399C.85 152.0
153.0
165 Sunvale*2/VO1225 159.0
154.0
166 GILES/Carinya 157.0
156.5
167 B409C/SUN420A//SUN498E 158.0
154.5
168 SUN434A/LANG 152.0
155.0
169 Carinya/Sunpict 158.0
155.0
170 SUN429E/Ruby 158.0
149.0
171 WA-1-21005/2*SUN426B 157.0
154.0
172 SUN434A/SUN436E.188.3 157.0
155.0
173 RAC 892 157.0
155.5
174 Sunco/SUN431A 154.0
156.0
175 4zwf04.1.3 147.0
154.0
176 SUN434A/Lang.40.1 153.0
156.0
177 4zwf04.1.4 147.0
156.0
178 RAC1192/Ventura 155.0
153.0
179 QT10580/SUN431A.34.3 158.0
155.0
180 KUKRI/SUNSTATE 157.0
152.0
181 SUN434A/SUN436E 155.0
154.0
182 SUN429E/Ruby 158.0
157.5
183 DM5637*B8/H45//SUN485A 153.0
154.5
184 SUN431A/SUN492A 154.0
155.0

243
Genotype No. Genotype Cropping year means (days to maturity)
2014 2015
185 SUNVALE//SERIISO-6/SUNVALE 158.0
156.0
186 98ZHB16/SUN399H//SUN399C 161.0
154.0
187 Yr15,24,2*399C.76 155.0
155.0
188 MILAN/KAUZ/5/CNDO/R143//ENTE/MEXI 146.0
157.0
189 QT8733 155.0
156.5
190 QT10580/SUN431A.10.3 160.0
153.5
191 Sunco*2/Kukri 160.0
154.5
192 WA-5-21-020/Lang*2 161.0
157.5
193 AMSEL/2*HTG/3/Sunstate 153.0
156.0
194 URES/KAUZ//2*Janz/3/SUN421E 163.0
154.0
195 Giles 162.0
155.0
196 URES/KAUZ//2*Janz/3/SUN421E 150.0
155.0
197 Sunco*2/Kukri 158.0
153.5
198 SUN434B/Sunco 158.0
153.5
199 SUN434A/CHARA 158.0
153.0
200 Sunco/SUN431A 162.0
154.5
201 SUNVALE//SERIISO-6/SUNVALE 159.0
155.5
202 SUNCO/2*PASTOR//SUN436E 155.0
156.0
203 EGA Bonnie Rock/SUN436F 155.0
154.5
204 DM5637*B8/H45//SUN498D 160.0
156.0
205 SUN434A/SUN436E.142.1 157.0
152.5
206 SUN436F 155.0
154.0
207 RAC1192/Ventura 159.0
156.0
208 Isr614.23/2*Sunvale 154.0
155.5
209 SUN434A/Lang.67.1 157.0
153.0
210 Sunco/SUN431A 158.0
155.5
211 CHARA/SUN434A 161.0
154.0
212 Yr15,24,2*399C.103 158.0
153.0
213 KUKRI/SUNLIN 159.0
156.5
214 SUN498E/Sunco 158.0
153.0
215 CHARA/SUN434A 160.0
155.5
Mean
157.2
154.7
SED
2.73
Wald statistics
Year
158.44***
Genotype
277.82***
Year x Genotype 352.71**
Note: ns indicates non-signficance and *** significance at P<0.001

244
Table 3 Yield means of 215 genotypes evaluated head-to-head in association analysis in 2014 and
2015 at Narrabri.
Genotype No. Genotype/Crosses Cropping year mean yield (kg ha-1
)
2014 2015
1 CRUSADER 4444
4531
2 SUNSTATE 4478
4091
3 EGA STAMPEDE 4356
4069
4 LINCOLN 4484
4409
5 LIVINGSTON 4700
4547
6 SUNVEX 4316
4122
7 MERINDA 4569
4647
8 LANG 3725
4150
9 SUNVALE 3925
3866
10 VENTURA 4597
4931
11 ELLISON 4306
3703
12 JANZ 4966
4472
13 CUNNINGHAM 4537
4453
14 EGA GREGORY 4412
4147
15 SUNCO 3528
4141
16 SUNLIN 4181
3644
17 SUNTOP 5028
4909
18 SPITFIRE 4747
3409
19 EGA GREGORY 4200
4956
20 GILES/Carinya 4787
4078
21 DM5637*B8/H45//SUN498D 4184
4544
22 Wentworth/SUN434A 4197
4622
23 Ellison/Ventura 4522
4687
24 LPB05-1157 4744
4059
25 DM5637*B8/H45//SUN485A 4466
4353
26 GILES/Carinya 4972
4425
27 Carinya/Sunpict 4147
4291
28 SUN325K/SUN434A 3956
4431
29 Carinya/Sunpict 5131
4537
30 DM5637*B8/H45//SUN498D 4109
4272
31 DM5637*B8/H45//SUN498D 4181
4337
32 CROC_1/AE.SQUARROSA (224)/ 4050
4375
33 DM5637*B8/H45//SUN485A 4675
4494
34 LPB05-2148 4653
4041

245
Genotype No. Genotype/Crosses Cropping year mean yield (kg ha-1
)
2014 2015
35 Sunco/SUN431A 4434
4556
36 CUNNINGHAM 2007 3416
4172
37 Sunco*2/Kukri 4697
3684
38 CPI133814/SUN421H//SUN421E 4547
4687
39 SUN325K/SUN434A 2937
3722
40 Crusader 4547
4737
41 SUNCO/2*PASTOR//SUN436E 5034
5199
42 RAC892/98ZHB03//RAC892 4919
4078
43 DM5637*B8/H45//SUN498D 3912
4300
44 Ellison/Ventura 4403
4984
45 GILES/Carinya 4637
4569
46 GILES/Carinya 4512
4591
47 SUNSTATE/CHARA 4712
4794
48 SUN500B/Carinya 5291
5187
49 SUN445C/QT10776 4444
4531
50
CROC_1/AE.SQUARROSA
(224)//2*OPATA 3778
4103
51 SUNSTATE/VO1225//SUN429E 4778
4778
52 Lincoln 4347
4487
53 SUN344 E/VPMB36020 4666
4391
54 Sunco/SUN431A 4722
4672
55 Carinya/Sunpict 4728
4319
56 GILES 2002 4947
3897
57 Ega Bonnie Rock 4125
4519
58 Carinya/Sunpict 4341
3947
59 Yr15Yr24 2*399C.1 4266
4944
60 Lang/SUN431B 4878
4559
61 SUN431A/SUN492A 4884
4431
62 SUN421T/QT10401 4537
4222
63 QT6581/4/PASTOR//SITE/MO/3/CHEN/ 4253
4387
64 SUN434A/LANG 5209
4791
65 Carinya/Sunpict 4659
4306
66 DM5637*B8/H45//SUN485A 4244
4278
67 GILES/Carinya 4894
5125
68 SUNVALE/VPMB36020 4259
4066
69 Carinya/Cascade 4550
3662
70 Ellison/Ventura 4362
4419
71 Sunco/SUN431A 4637
4766

246
Genotype No. Genotype/Crosses Cropping year mean yield (kg ha-1
)
2014 2015
72 Ruby 4466
4762
73 Lang/SUN431B 3256
3856
74 ZWC06 19 3737
4781
75 SUNCO/2*PASTOR 3466
4797
76 Sunco/SUN431A 3609
4444
77 SUN498F/SUN485A 4859
4550
78 SUN431A 4616
4106
79 Sunco/SUN431A 3756
3812
80 Sunvale*2/VO1225 4256
4456
81 Chara 4656
4575
82 QT10580/SUN431A.34.1 4434
4166
83 Chara/4*Sun376G 4506
4275
84 LANG/SUN366A 4369
4028
85 IRAQ43 2409
3509
86 SOKOLL 3719
4678
87 SUN344 E/VPMB36020 4603
4716
88 Sunvale*2/VO1225 4481
4197
89 SUN429E/Ruby 4672
4234
90 URES/JUN//KAUZE/3/2*SUNVALE 4316
4650
91 CHARA/SUN434A 4631
3875
92 SUN421T/SUN399C.22.3 5222
4544
93 CHARA/SUN434A 4087
4212
94 Ellison/Ventura 4553
4719
95 Sunvale/Janz 3228
4444
96 LANG/SUN366A 4100
3887
97 SUN431A/Lang.25.2 4103
3919
98 BAXTER/SUN421N 4575
4122
99 SYN 1.57.2 4356
4091
100 RAC1192/Ventura 4472
4912
101 Carinya/Sunpict 3422
4215
102 Carinya/Sunpict 4631
3997
103 SUN429E/Ruby 4978
4900
104 Sunco/SUN431A 4781
4487
105 SYN 1.57.3 4750
4525
106 Janz 4944
4184
107 Lang/Ellison 4153
4109
108 SUN434A/Lang.67.2 4631
3731
109 SUN325K/SUN434A 3431
4412

247
Genotype No. Genotype/Crosses Cropping year mean yield (kg ha-1
)
2014 2015
110 QT10580/SUN431A.4.3 4369
4375
111 SUN429E/Ruby 4622
4716
112 QT10580 (Wentworth) 4744
4481
113 Carinya 5119
4266
114 SUN429E/Ruby 4256
4706
115 SUN498F/SUN485A 4447
3334
116 SUN421T/QT10401 4825
4387
117 SUN429E/Ruby 4253
4384
118 Sunvale*2/VO1225 4925
4025
119 ELLISON/Sunbri 4116
4316
120 RAC1192/Ventura 4078
4653
121 SUN325K/SUN434A*2 4200
4369
122 Sunvale*2/VO1225 4825
4597
123 SUN434A/SUN436E 5075
3987
124 SUN434A/SUN436E.116.4 5081
3966
125 98ZHB03/2*Lang 4206
4169
126 GILES/Carinya 4925
3887
127 SUNVALE//OPATA*2/WULP 2112
3691
128 Sunstate/Ellison 4012
3772
129 SUN429E/Ruby 4581
4697
130 SUN421T/QT10401 4637
4653
131 Carinya/Sunpict 3881
4366
132 SUN431A/SUN492A 4906
4456
133 Yr15,24,2*399C.102 3462
4728
134 D67.2/P66.270//AE.SQUARROSA (320)/3 3875
4137
135 KUKRI/SUNSTATE 3744
4066
136 SUNVALE/VPMB36020 4956
4503
137 SUNVALE//OPATA*2/WULP 3319
4237
138 DM5637*B8/H45//SUN485A 4256
4566
139 SUNVALE//OPATA*2/WULP 2819
4222
140 30Ibwsn008 3612
4112
141 SUN434A/SUN436E.46.4 4800
4631
142 WA-1-21005/2*SUN426B 4119
4147
143 Lang/3*Sun376J.1.2.1 4669
4412
144 Sunstate/QT8733 4644
4375
145 syn6.47.4 2787
4619
146 Carinya/Sunpict 4662
4537

248
Genotype No. Genotype/Crosses Cropping year mean yield (kg ha-1
)
2014 2015
147 SUN431A/Lang.21.1 4150
4475
148 Sunco*2/Kukri 4450
3756
149 SUN372D.1.3 4562
4681
150 SUN429E/Ruby 4087
3650
151 SUN421T/QT10401 5081
4316
152 Cascade 4312
3800
153 SUN431A/Lang.21.2 4512
4994
154 SUN434A 4075
3706
155 SYN 3.74.2 1800
3622
156 LPB05-1164 3887
5256
157 Wentworth/SUN434A 3969
4556
158 15HRWSN112 4469
4575
159 SUN429E/Ruby 4512
4800
160 KUKRI/SUNSTATE 4600
4834
161 Sunco/SUN431A 4494
4809
162 SUNCO/2*PASTOR//SUN436E 5050
5144
163 SUN431A/SUN492A 4475
3722
164 Yr15,24,2*399C.85 4744
4650
165 Sunvale*2/VO1225 4300
4578
166 GILES/Carinya 4969
4425
167 B409C/SUN420A//SUN498E 4094
3819
168 SUN434A/LANG 4594
4078
169 Carinya/Sunpict 4669
4284
170 SUN429E/Ruby 4437
4000
171 WA-1-21005/2*SUN426B 4300
3981
172 SUN434A/SUN436E.188.3 4981
4794
173 RAC 892 4594
3875
174 Sunco/SUN431A 3956
4262
175 4zwf04.1.3 4856
4750
176 SUN434A/Lang.40.1 3337
4891
177 4zwf04.1.4 4656
4566
178 RAC1192/Ventura 5106
5269
179 QT10580/SUN431A.34.3 4681
4141
180 KUKRI/SUNSTATE 4900
4728
181 SUN434A/SUN436E 5087
4681
182 SUN429E/Ruby 4750
4731
183 DM5637*B8/H45//SUN485A 4412
3912

249
Genotype No. Genotype/Crosses Cropping year mean yield (kg ha-1
)
2014 2015
184 SUN431A/SUN492A 4737
4247
185 SUNVALE//SERIISO-6/SUNVALE 4244
4997
186 98ZHB16/SUN399H//SUN399C 3456
3869
187 Yr15,24,2*399C.76 4481
4159
188 MILAN/KAUZ/5/CNDO/R143//ENTE/MEXI 4031
4322
189 QT8733 4281
4116
190 QT10580/SUN431A.10.3 4506
4769
191 Sunco*2/Kukri 3675
4131
192 WA-5-21-020/Lang*2 3744
4356
193 AMSEL/2*HTG/3/Sunstate 3944
4387
194 URES/KAUZ//2*Janz/3/SUN421E 4925
3847
195 Giles 4625
4359
196 URES/KAUZ//2*Janz/3/SUN421E 4531
4250
197 Sunco*2/Kukri 4331
3775
198 SUN434B/Sunco 4794
4262
199 SUN434A/CHARA 2306
2812
200 Sunco/SUN431A 4919
4204
201 SUNVALE//SERIISO-6/SUNVALE 4781
4237
202 SUNCO/2*PASTOR//SUN436E 5137
4687
203 EGA Bonnie Rock/SUN436F 4619
4169
204 DM5637*B8/H45//SUN498D 4731
4600
205 SUN434A/SUN436E.142.1 4506
4103
206 SUN436F 4612
4662
207 RAC1192/Ventura 4812
4359
208 Isr614.23/2*Sunvale 3850
3444
209 SUN434A/Lang.67.1 4612
3994
210 Sunco/SUN431A 4125
4462
211 CHARA/SUN434A 4331
4931
212 Yr15,24,2*399C.103 4462
4597
213 KUKRI/SUNLIN 4106
4362
214 SUN498E/Sunco 4131
4100
215 CHARA/SUN434A 4037
5412
Mean
4352.94
4349.38
SED
369.8
Wald Statistic
Year
0.42ns
Genotype
767.03***
Year x Genotype
398.04*
Note: ns indicates non-significance and *** significance at P<0.001

250
Table 4 Means for thousand kernel weight (TKW) of 215 genotypes evaluated head-to-head for
association analysis in 2014 and 2015 at Narrabri.
Genotype No. Genotype Cropping year mean TKW (g)
2014 2015
1 CRUSADER 33.55
36.70
2 SUNSTATE 32.35
35.17
3 EGA STAMPEDE 38.90
39.67
4 LINCOLN 37.55
31.47
5 LIVINGSTON 36.10
38.02
6 SUNVEX 35.75
37.10
7 MERINDA 35.85
35.72
8 LANG 33.15
36.10
9 SUNVALE 34.50
33.70
10 VENTURA 37.10
37.42
11 ELLISON 34.80
29.45
12 JANZ 35.00
31.15
13 CUNNINGHAM 36.85
37.05
14 EGA GREGORY 36.55
36.65
15 SUNCO 35.45
36.75
16 SUNLIN 34.95
35.25
17 SUNTOP 36.95
35.42
18 SPITFIRE 35.15
32.75
19 EGA GREGORY 43.25
34.90
20 GILES/Carinya 34.15
35.00
21 DM5637*B8/H45//SUN498D 32.65
38.35
22 Wentworth/SUN434A 35.85
34.40
23 Ellison/Ventura 30.85
34.20
24 LPB05-1157 37.15
33.35
25 DM5637*B8/H45//SUN485A 36.50
34.02
26 GILES/Carinya 38.20
35.70
27 Carinya/Sunpict 32.15
32.30
28 SUN325K/SUN434A 35.05
36.37
29 Carinya/Sunpict 38.25
36.37
30 DM5637*B8/H45//SUN498D 41.15
41.12
31 DM5637*B8/H45//SUN498D 37.95
36.60
32 CROC_1/AE.SQUARROSA (224)/ 35.20
37.10
33 DM5637*B8/H45//SUN485A 43.35
33.07

251
Genotype No. Genotype Cropping year mean TKW (g)
2014 2015
34 LPB05-2148 37.35
32.15
35 Sunco/SUN431A 37.35
34.82
36 CUNNINGHAM 2007 29.55
34.12
37 Sunco*2/Kukri 33.75
37.00
38 CPI133814/SUN421H//SUN421E 37.10
34.10
39 SUN325K/SUN434A 34.00
38.42
40 Crusader 33.20
32.85
41 SUNCO/2*PASTOR//SUN436E 35.60
34.90
42 RAC892/98ZHB03//RAC892 33.55
37.48
43 DM5637*B8/H45//SUN498D 39.30
35.62
44 Ellison/Ventura 36.45
36.72
45 GILES/Carinya 38.90
31.60
46 GILES/Carinya 40.50
31.08
47 SUNSTATE/CHARA 32.45
35.67
48 SUN500B/Carinya 36.85
35.95
49 SUN445C/QT10776 28.95
32.35
50
CROC_1/AE.SQUARROSA
(224)//2*OPATA 34.70
34.10
51 SUNSTATE/VO1225//SUN429E 37.65
36.05
52 Lincoln 39.50
29.77
53 SUN344 E/VPMB36020 34.90
35.77
54 Sunco/SUN431A 35.95
37.55
55 Carinya/Sunpict 33.70
36.95
56 GILES 2002 33.45
37.25
57 Ega Bonnie Rock 38.20
38.08
58 Carinya/Sunpict 34.95
35.23
59 Yr15Yr24 2*399C.1 35.75
33.80
60 Lang/SUN431B 36.40
33.52
61 SUN431A/SUN492A 36.20
31.40
62 SUN421T/QT10401 35.55
33.85
63 QT6581/4/PASTOR//SITE/MO/3/CHEN/ 35.70
33.15
64 SUN434A/LANG 40.20
31.60
65 Carinya/Sunpict 40.45
31.95
66 DM5637*B8/H45//SUN485A 34.15
32.32
67 GILES/Carinya 34.55
37.85
68 SUNVALE/VPMB36020 36.50
36.40
69 Carinya/Cascade 34.70
42.92
70 Ellison/Ventura 34.65
39.10
71 Sunco/SUN431A 36.95
38.97
72 Ruby 35.40
36.40
73 Lang/SUN431B 35.85
32.52

252
Genotype No. Genotype Cropping year mean TKW (g)
2014 2015
74 ZWC06 19 33.20
39.10
75 SUNCO/2*PASTOR 41.95
35.22
76 Sunco/SUN431A 38.25
35.40
77 SUN498F/SUN485A 32.70
28.55
78 SUN431A 37.00
32.97
79 Sunco/SUN431A 31.10
35.20
80 Sunvale*2/VO1225 32.20
33.17
81 Chara 34.50
33.60
82 QT10580/SUN431A.34.1 33.05
38.25
83 Chara/4*Sun376G 32.45
37.23
84 LANG/SUN366A 35.80
33.42
85 IRAQ43 38.20
38.62
86 SOKOLL 43.55
31.02
87 SUN344 E/VPMB36020 38.40
30.47
88 Sunvale*2/VO1225 34.30
34.92
89 SUN429E/Ruby 37.40
30.05
90 URES/JUN//KAUZE/3/2*SUNVALE 32.85
37.62
91 CHARA/SUN434A 37.65
33.87
92 SUN421T/SUN399C.22.3 37.70
30.87
93 CHARA/SUN434A 37.45
29.40
94 Ellison/Ventura 35.75
38.30
95 Sunvale/Janz 39.30
31.20
96 LANG/SUN366A 36.65
39.05
97 SUN431A/Lang.25.2 31.70
37.13
98 BAXTER/SUN421N 32.90
34.60
99 SYN 1.57.2 34.45
33.22
100 RAC1192/Ventura 35.85
34.90
101 Carinya/Sunpict 37.55
35.95
102 Carinya/Sunpict 35.00
37.90
103 SUN429E/Ruby 34.80
35.45
104 Sunco/SUN431A 36.10
29.87
105 SYN 1.57.3 33.90
32.45
106 Janz 35.90
28.70
107 Lang/Ellison 34.15
34.00
108 SUN434A/Lang.67.2 35.40
41.58
109 SUN325K/SUN434A 35.50
39.58
110 QT10580/SUN431A.4.3 39.10
38.27
111 SUN429E/Ruby 35.55
35.95
112 QT10580 (Wentworth) 36.15
34.95
113 Carinya 36.20
35.83

253
Genotype No. Genotype Cropping year mean TKW (g)
2014 2015
114 SUN429E/Ruby 31.30
37.92
115 SUN498F/SUN485A 33.25
36.35
116 SUN421T/QT10401 35.20
32.85
117 SUN429E/Ruby 34.15
31.83
118 Sunvale*2/VO1225 35.20
34.40
119 ELLISON/Sunbri 32.55
34.55
120 RAC1192/Ventura 38.35
29.85
121 SUN325K/SUN434A*2 44.70
33.20
122 Sunvale*2/VO1225 38.90
38.78
123 SUN434A/SUN436E 30.40
37.55
124 SUN434A/SUN436E.116.4 35.00
38.05
125 98ZHB03/2*Lang 33.30
39.17
126 GILES/Carinya 38.00
37.55
127 SUNVALE//OPATA*2/WULP 35.20
37.02
128 Sunstate/Ellison 36.70
34.67
129 SUN429E/Ruby 36.60
29.72
130 SUN421T/QT10401 37.80
35.82
131 Carinya/Sunpict 37.70
35.05
132 SUN431A/SUN492A 41.50
31.82
133 Yr15,24,2*399C.102 36.70
30.25
134 D67.2/P66.270//AE.SQUARROSA (320)/3 41.50
32.27
135 KUKRI/SUNSTATE 39.00
34.45
136 SUNVALE/VPMB36020 33.00
33.33
137 SUNVALE//OPATA*2/WULP 32.70
33.62
138 DM5637*B8/H45//SUN485A 36.20
35.30
139 SUNVALE//OPATA*2/WULP 33.10
34.15
140 30Ibwsn008 32.50
34.67
141 SUN434A/SUN436E.46.4 34.00
32.88
142 WA-1-21005/2*SUN426B 31.70
35.67
143 Lang/3*Sun376J.1.2.1 38.90
33.82
144 Sunstate/QT8733 33.70
35.88
145 syn6.47.4 35.60
32.35
146 Carinya/Sunpict 33.00
27.82
147 SUN431A/Lang.21.1 35.20
32.23
148 Sunco*2/Kukri 35.20
30.77
149 SUN372D.1.3 30.30
32.83
150 SUN429E/Ruby 30.80
35.58
151 SUN421T/QT10401 34.20
37.02
152 Cascade 33.00
32.25
153 SUN431A/Lang.21.2 33.60
33.57

254
Genotype No. Genotype Cropping year mean TKW (g)
2014 2015
154 SUN434A 46.50
34.35
155 SYN 3.74.2 38.90
30.12
156 LPB05-1164 39.10
30.40
157 Wentworth/SUN434A 43.60
37.37
158 15HRWSN112 40.80
34.62
159 SUN429E/Ruby 30.50
31.37
160 KUKRI/SUNSTATE 37.80
33.65
161 Sunco/SUN431A 31.20
32.80
162 SUNCO/2*PASTOR//SUN436E 40.00
33.73
163 SUN431A/SUN492A 36.60
34.97
164 Yr15,24,2*399C.85 33.00
36.00
165 Sunvale*2/VO1225 36.40
32.73
166 GILES/Carinya 36.60
34.22
167 B409C/SUN420A//SUN498E 40.60
34.62
168 SUN434A/LANG 37.70
33.80
169 Carinya/Sunpict 36.40
31.85
170 SUN429E/Ruby 35.10
37.60
171 WA-1-21005/2*SUN426B 38.30
32.48
172 SUN434A/SUN436E.188.3 34.10
32.70
173 RAC 892 33.00
33.37
174 Sunco/SUN431A 33.30
33.50
175 4zwf04.1.3 30.90
33.52
176 SUN434A/Lang.40.1 40.80
32.55
177 4zwf04.1.4 31.70
32.60
178 RAC1192/Ventura 35.50
36.38
179 QT10580/SUN431A.34.3 33.50
34.50
180 KUKRI/SUNSTATE 33.40
32.98
181 SUN434A/SUN436E 29.20
36.33
182 SUN429E/Ruby 34.90
34.53
183 DM5637*B8/H45//SUN485A 35.30
32.35
184 SUN431A/SUN492A 31.50
30.73
185 SUNVALE//SERIISO-6/SUNVALE 34.20
30.63
186 98ZHB16/SUN399H//SUN399C 36.00
32.27
187 Yr15,24,2*399C.76 39.50
28.77
188 MILAN/KAUZ/5/CNDO/R143//ENTE/MEXI 38.30
35.07
189 QT8733 35.80
34.80
190 QT10580/SUN431A.10.3 34.00
41.50
191 Sunco*2/Kukri 27.80
32.60
192 WA-5-21-020/Lang*2 31.40
34.30
193 AMSEL/2*HTG/3/Sunstate 37.20
34.70

255
Genotype No. Genotype Cropping year mean TKW (g)
2014 2015
194 URES/KAUZ//2*Janz/3/SUN421E 31.50
37.05
195 Giles 34.20
34.22
196 URES/KAUZ//2*Janz/3/SUN421E 33.70
33.97
197 Sunco*2/Kukri 35.70
31.17
198 SUN434B/Sunco 39.00
32.20
199 SUN434A/CHARA 35.10
33.67
200 Sunco/SUN431A 35.20
30.40
201 SUNVALE//SERIISO-6/SUNVALE 36.00
32.02
202 SUNCO/2*PASTOR//SUN436E 42.10
30.02
203 EGA Bonnie Rock/SUN436F 40.70
35.00
204 DM5637*B8/H45//SUN498D 40.40
34.70
205 SUN434A/SUN436E.142.1 32.60
33.40
206 SUN436F 39.10
30.32
207 RAC1192/Ventura 36.70
31.83
208 Isr614.23/2*Sunvale 34.10
32.10
209 SUN434A/Lang.67.1 33.40
30.43
210 Sunco/SUN431A 36.40
34.92
211 CHARA/SUN434A 33.40
34.70
212 Yr15,24,2*399C.103 41.30
34.00
213 KUKRI/SUNLIN 36.30
33.20
214 SUN498E/Sunco 36.20
31.07
215 CHARA/SUN434A 32.10
33.85
Mean
35.77
34.4
SED
3.19
Wald Statistic
Year
34.06**
Genotype
265.69**
Year x Genotype 322.21**
Note: ns indicates non-significance and *** significance at P<0.001

256