Patterns of water and heat flux across a biome gradient from tropical forest to savanna in Brazil
9
Patterns of Water and Heat Flux Across a Biome Gradient From Tropical Forest to Savanna in Brazil (Article begins on next page) Citation da Rocha, Humberto R., Antonio O. Manzi, Osvaldo M. Cabral, Scott D. Miller, Michael L. Goulden, Scott R. Saleska, Natalia R. Coupe, et al. 2009. Patterns of water and heat flux across a biome gradient from tropical forest to savanna in Brazil. Journal of Geophysical Research 114(G00B12): 1-8 Published Version doi:10.1029/2007JG000640 Accessed May 21, 2011 7:38:13 AM EDT Citable Link http://nrs.harvard.edu/urn-3:HUL.InstRepos:3138565 Terms of Use This article was downloaded from Harvard University's DASH repository, and is made available under the terms and conditions applicable to Other Posted Material, as set forth at http://nrs.harvard.edu/urn-3:HUL.InstRepos:dash.current.terms-of- use#LAA
-
Upload
independent -
Category
Documents
-
view
2 -
download
0
Transcript of Patterns of water and heat flux across a biome gradient from tropical forest to savanna in Brazil

Patterns of Water and Heat Flux Across a Biome Gradient FromTropical Forest to Savanna in Brazil
(Article begins on next page)
Citation da Rocha, Humberto R., Antonio O. Manzi, Osvaldo M. Cabral,Scott D. Miller, Michael L. Goulden, Scott R. Saleska, Natalia R.Coupe, et al. 2009. Patterns of water and heat flux across a biomegradient from tropical forest to savanna in Brazil. Journal ofGeophysical Research 114(G00B12): 1-8
Published Version doi:10.1029/2007JG000640
Accessed May 21, 2011 7:38:13 AM EDT
Citable Link http://nrs.harvard.edu/urn-3:HUL.InstRepos:3138565
Terms of Use This article was downloaded from Harvard University's DASHrepository, and is made available under the terms and conditionsapplicable to Other Posted Material, as set forth athttp://nrs.harvard.edu/urn-3:HUL.InstRepos:dash.current.terms-of-use#LAA
Patterns of water and heat flux across a biome gradient from tropical
forest to savanna in Brazil
Humberto R. da Rocha,1 Antonio O. Manzi,2 Osvaldo M. Cabral,3 Scott D. Miller,4
Michael L. Goulden,5 Scott R. Saleska,6 Natalia R.-Coupe,6 Steven C. Wofsy,7
Laura S. Borma,1 P. Artaxo,1 George Vourlitis,8 Jose S. Nogueira,9 Fernando L. Cardoso,10
Antonio D. Nobre,2 Bart Kruijt,11 Helber C. Freitas,1 Celso von Randow,2
Renata G. Aguiar,10 and Jair F. Maia2
Received 30 October 2007; revised 29 September 2008; accepted 11 November 2008; published 17 January 2009.
[1] We investigated the seasonal patterns of water vapor and sensible heat flux along atropical biome gradient from forest to savanna. We analyzed data from a network of fluxtowers in Brazil that were operated within the Large-Scale Biosphere-AtmosphereExperiment in Amazonia (LBA). These tower sites included tropical humid andsemideciduous forest, transitional forest, floodplain (with physiognomies of cerrado), andcerrado sensu stricto. The mean annual sensible heat flux at all sites ranged from 20 to38 Wm�2, and was generally reduced in the wet season and increased in the late dryseason, coincident with seasonal variations of net radiation and soil moisture. The siteswere easily divisible into two functional groups based on the seasonality of evaporation:tropical forest and savanna. At sites with an annual precipitation above 1900 mm and a dryseason length less than 4 months (Manaus, Santarem and Rondonia), evaporation ratesincreased in the dry season, coincident with increased radiation. Evaporation rates were ashigh as 4.0 mm d�1 in these evergreen or semidecidous forests. In contrast, ecosystemswith precipitation less than 1700 mm and a longer dry season (Mato Grosso, Tocantinsand Sao Paulo) showed clear evidence of reduced evaporation in the dry season.Evaporation rates were as low as 2.5 mm d�1 in the transitional forests and 1 mm d�1 inthe cerrado. The controls on evapotranspiration seasonality changed along the biomegradient, with evaporative demand (especially net radiation) playing a more important rolein the wetter forests, and soil moisture playing a more important role in the drier savannahsites.
Citation: da Rocha, H. R., et al. (2009), Patterns of water and heat flux across a biome gradient from tropical forest to savanna in
Brazil, J. Geophys. Res., 114, G00B12, doi:10.1029/2007JG000640.
1. Introduction
[2] The partitioning of surface energy between evapo-transpiration and sensible heat flux in the tropics is impor-tant for both the functioning of natural ecosystems and thedevelopment of regional climatic patterns. The combinationof sensible and latent heat flux controls humidity andthermal stability of the planetary boundary layer, triggersconvective rainfall, and ultimately helps to control regionalprecipitation, soil moisture and climate. Terrestrial ecosys-
tems provide ecosystem services, such as catchment dis-charge, that are a function of evapotranspiration and thatcan be altered by land use or climate change. Approxi-mately half of the precipitation falling in Amazoniaevaporates, of which less than half is recycled as precip-itation in the basin [Dirmeyer and Brubaker, 2007; Costaand Foley, 1999]. Previous estimates of the mean annualevapotranspiration in Amazonia based on model simula-tions range from 2.7 to 5.2 mm d�1, with an average of
JOURNAL OF GEOPHYSICAL RESEARCH, VOL. 114, G00B12, doi:10.1029/2007JG000640, 2009ClickHere
for
FullArticle
1Departamento de Ciencias Atmosfericas, IAG, Universidade de SaoPaulo, Sao Paulo, Brazil.
2Instituto Nacional de Pesquisas da Amazonia, Manaus, Brazil.3Embrapa Meio Ambiente, Jaguariuna, Brazil.4Atmospheric Sciences Research Center, State University of New York
at Albany, Albany, New York, USA.5Department of Earth System Science, University of California, Irvine,
California, USA.
Copyright 2009 by the American Geophysical Union.0148-0227/09/2007JG000640$09.00
G00B12
6Department of Ecology and Evolutionary Biology, University ofArizona, Tucson, Arizona, USA.
7Department of Earth and Planetary Sciences, Harvard University,Cambridge, Massachusetts, USA.
8Biological Sciences Department, California State University, SanMarcos, California, USA.
9Department of Physics, Universidade Federal de Mato Grosso, Cuiaba,Brazil.
10Universidade Federal de Rondonia, Porto Velho, Brazil.11Wageningen University and Research, Wageningen, Netherlands.
1 of 8
3.9 mm d�1, while estimates based on field observationsinclude 3.5 mm d�1 [Shuttleworth, 1988; da Rocha et al.,2004], 3.7 mm d�1 [von Randow et al., 2004] and 3.1 mmd�1
[Hutyra et al., 2007]. The potential impact of forest topasture conversion on temperature and precipitation patternsin Amazonia as a result of changes in the surface energybudget [Gash et al., 1996], as well as the potential for forestcollapse due to global warming-induced drought [Betts etal., 2004; Friedlingstein et al., 2006], remain very poorlyunderstood.
[3] The Large-Scale Biosphere-Atmosphere Experimentin Amazonia (LBA) was motivated in part by the need forimproved observations of evapotranspiration and sensibleheat flux in the tropics. Scientists within LBA operatededdy covariance towers at several sites, including ones intropical humid and semideciduous forest, transitional forest,floodplain, and cerrado sensu stricto. We analyzed data fromthese towers to better understand the seasonal patterns ofwater vapor and sensible heat flux across Amazonia. Weorganized our analysis along a large-scale biome and water
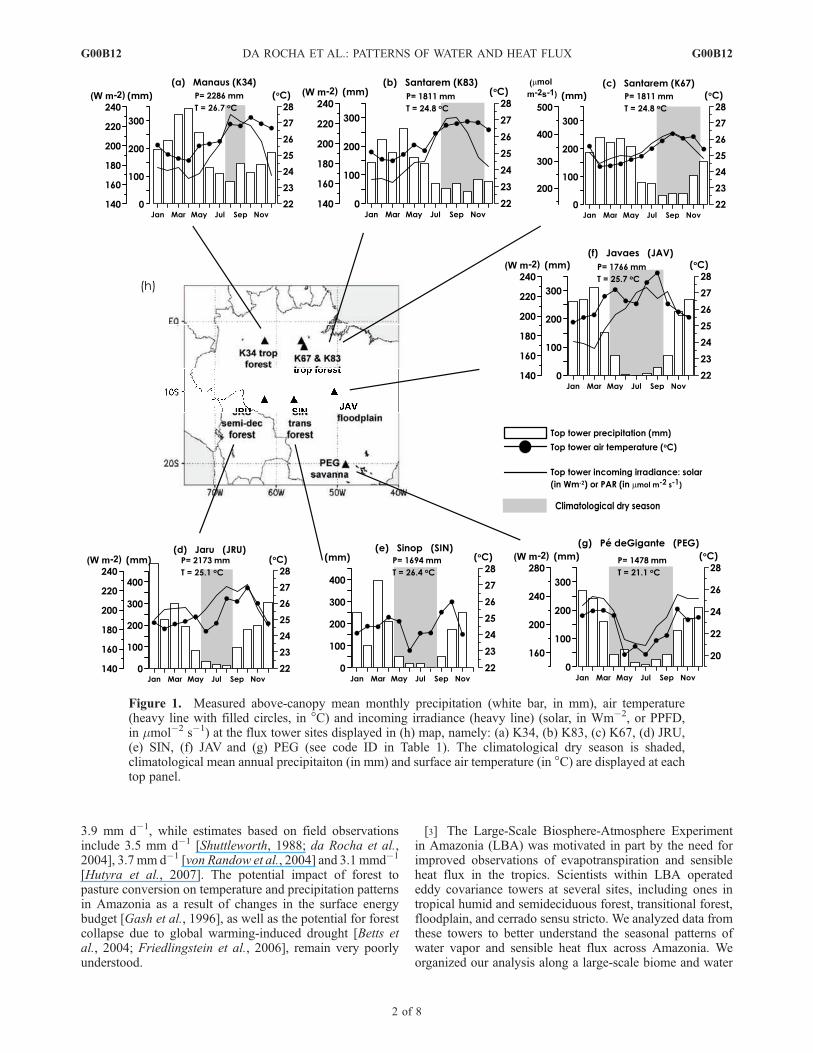
Figure 1. Measured above-canopy mean monthly precipitation (white bar, in mm), air temperature(heavy line with filled circles, in �C) and incoming irradiance (heavy line) (solar, in Wm�2, or PPFD,in mmol�2 s�1) at the flux tower sites displayed in (h) map, namely: (a) K34, (b) K83, (c) K67, (d) JRU,(e) SIN, (f) JAV and (g) PEG (see code ID in Table 1). The climatological dry season is shaded,climatological mean annual precipitaiton (in mm) and surface air temperature (in �C) are displayed at eachtop panel.
G00B12 DA ROCHA ET AL.: PATTERNS OF WATER AND HEAT FLUX
2 of 8
G00B12
balance gradient, from comparatively wet sites, which weredominated by evergreen forest, to a dry site, which wasdominated by cerrado sensu stricto.
2. Methods
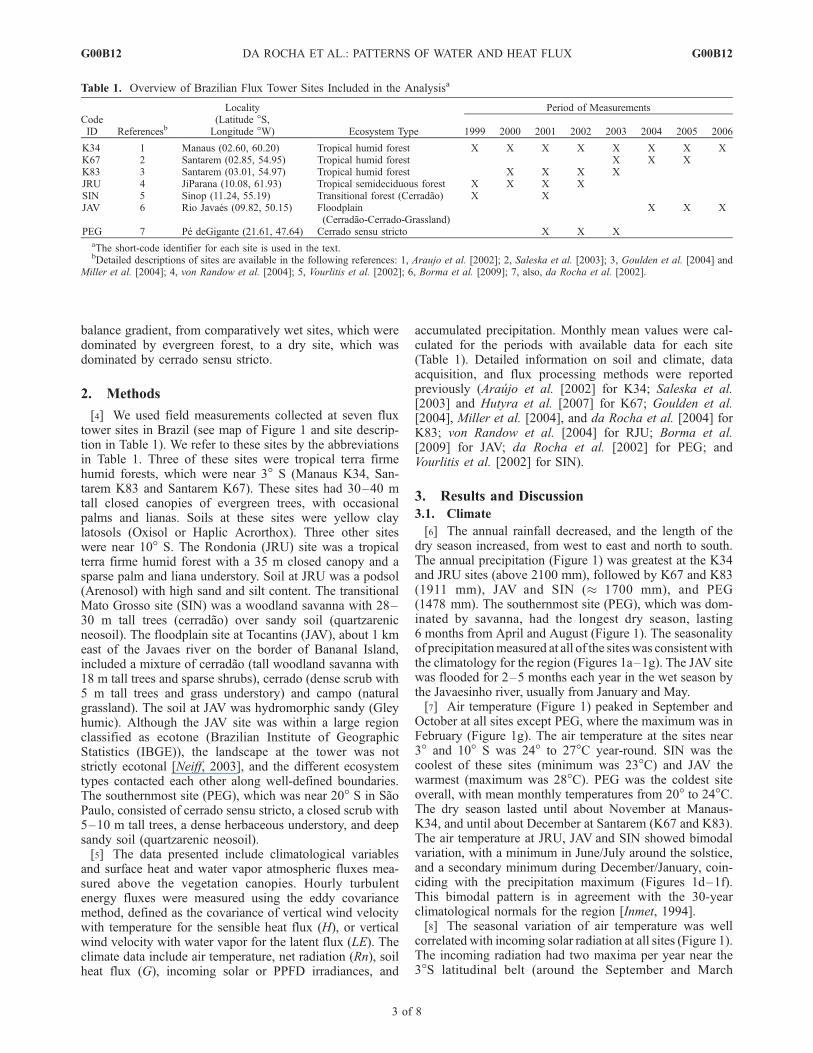
[4] We used field measurements collected at seven fluxtower sites in Brazil (see map of Figure 1 and site descrip-tion in Table 1). We refer to these sites by the abbreviationsin Table 1. Three of these sites were tropical terra firmehumid forests, which were near 3� S (Manaus K34, San-tarem K83 and Santarem K67). These sites had 30–40 mtall closed canopies of evergreen trees, with occasionalpalms and lianas. Soils at these sites were yellow claylatosols (Oxisol or Haplic Acrorthox). Three other siteswere near 10� S. The Rondonia (JRU) site was a tropicalterra firme humid forest with a 35 m closed canopy and asparse palm and liana understory. Soil at JRU was a podsol(Arenosol) with high sand and silt content. The transitionalMato Grosso site (SIN) was a woodland savanna with 28–30 m tall trees (cerradao) over sandy soil (quartzarenicneosoil). The floodplain site at Tocantins (JAV), about 1 kmeast of the Javaes river on the border of Bananal Island,included a mixture of cerradao (tall woodland savanna with18 m tall trees and sparse shrubs), cerrado (dense scrub with5 m tall trees and grass understory) and campo (naturalgrassland). The soil at JAV was hydromorphic sandy (Gleyhumic). Although the JAV site was within a large regionclassified as ecotone (Brazilian Institute of GeographicStatistics (IBGE)), the landscape at the tower was notstrictly ecotonal [Neiff, 2003], and the different ecosystemtypes contacted each other along well-defined boundaries.The southernmost site (PEG), which was near 20� S in SaoPaulo, consisted of cerrado sensu stricto, a closed scrub with5–10 m tall trees, a dense herbaceous understory, and deepsandy soil (quartzarenic neosoil).[5] The data presented include climatological variables
and surface heat and water vapor atmospheric fluxes mea-sured above the vegetation canopies. Hourly turbulentenergy fluxes were measured using the eddy covariancemethod, defined as the covariance of vertical wind velocitywith temperature for the sensible heat flux (H), or verticalwind velocity with water vapor for the latent flux (LE). Theclimate data include air temperature, net radiation (Rn), soilheat flux (G), incoming solar or PPFD irradiances, and
accumulated precipitation. Monthly mean values were cal-culated for the periods with available data for each site(Table 1). Detailed information on soil and climate, dataacquisition, and flux processing methods were reportedpreviously (Araujo et al. [2002] for K34; Saleska et al.[2003] and Hutyra et al. [2007] for K67; Goulden et al.[2004], Miller et al. [2004], and da Rocha et al. [2004] forK83; von Randow et al. [2004] for RJU; Borma et al.[2009] for JAV; da Rocha et al. [2002] for PEG; andVourlitis et al. [2002] for SIN).
3. Results and Discussion
3.1. Climate
[6] The annual rainfall decreased, and the length of thedry season increased, from west to east and north to south.The annual precipitation (Figure 1) was greatest at the K34and JRU sites (above 2100 mm), followed by K67 and K83(1911 mm), JAV and SIN (� 1700 mm), and PEG(1478 mm). The southernmost site (PEG), which was dom-inated by savanna, had the longest dry season, lasting6 months from April and August (Figure 1). The seasonalityof precipitationmeasured at all of the siteswas consistent withthe climatology for the region (Figures 1a–1g). The JAV sitewas flooded for 2–5 months each year in the wet season bythe Javaesinho river, usually from January and May.[7] Air temperature (Figure 1) peaked in September and
October at all sites except PEG, where the maximum was inFebruary (Figure 1g). The air temperature at the sites near3� and 10� S was 24� to 27�C year-round. SIN was thecoolest of these sites (minimum was 23�C) and JAV thewarmest (maximum was 28�C). PEG was the coldest siteoverall, with mean monthly temperatures from 20� to 24�C.The dry season lasted until about November at Manaus-K34, and until about December at Santarem (K67 and K83).The air temperature at JRU, JAV and SIN showed bimodalvariation, with a minimum in June/July around the solstice,and a secondary minimum during December/January, coin-ciding with the precipitation maximum (Figures 1d–1f).This bimodal pattern is in agreement with the 30-yearclimatological normals for the region [Inmet, 1994].[8] The seasonal variation of air temperature was well
correlated with incoming solar radiation at all sites (Figure 1).The incoming radiation had two maxima per year near the3�S latitudinal belt (around the September and March
Table 1. Overview of Brazilian Flux Tower Sites Included in the Analysisa
CodeID Referencesb
Locality(Latitude �S,Longitude �W) Ecosystem Type
Period of Measurements
1999 2000 2001 2002 2003 2004 2005 2006
K34 1 Manaus (02.60, 60.20) Tropical humid forest X X X X X X X XK67 2 Santarem (02.85, 54.95) Tropical humid forest X X XK83 3 Santarem (03.01, 54.97) Tropical humid forest X X X XJRU 4 JiParana (10.08, 61.93) Tropical semideciduous forest X X X XSIN 5 Sinop (11.24, 55.19) Transitional forest (Cerradao) X XJAV 6 Rio Javaes (09.82, 50.15) Floodplain
(Cerradao-Cerrado-Grassland)X X X
PEG 7 Pe deGigante (21.61, 47.64) Cerrado sensu stricto X X XaThe short-code identifier for each site is used in the text.bDetailed descriptions of sites are available in the following references: 1, Araujo et al. [2002]; 2, Saleska et al. [2003]; 3, Goulden et al. [2004] and
Miller et al. [2004]; 4, von Randow et al. [2004]; 5, Vourlitis et al. [2002]; 6, Borma et al. [2009]; 7, also, da Rocha et al. [2002].
G00B12 DA ROCHA ET AL.: PATTERNS OF WATER AND HEAT FLUX
3 of 8
G00B12
equinoxes), and a single minimum near the 10� S belt(around the June solstice). A decline in temperatures atK34, K67 and K83 during January to May appears to resultfrom increasing cloud cover during the wet season.Increases in temperature at all sites but PEG during thedry season are a result of increasing incoming radiation,reduced cloud cover, and the large scale subsidence. Thelargest annual amplitude of temperature and incoming solarradiation was observed at 20�S, and was a result of bothmore extreme changes in solar elevation angle and theoccasional intrusion of strong cold fronts during the winter.[9] The seasonality of the measured precipitation was
consistent with the climatology for the region. A strongdrought during 2004/2005 over western and southern Ama-zonia [Saleska et al., 2007] may have influenced the sites
JRU and SIN. However, the data sets were collected prior to2003 and therefore were likely not influenced.
3.2. Seasonal Patterns of Evaporation, Sensible Heat,and Net Radiation
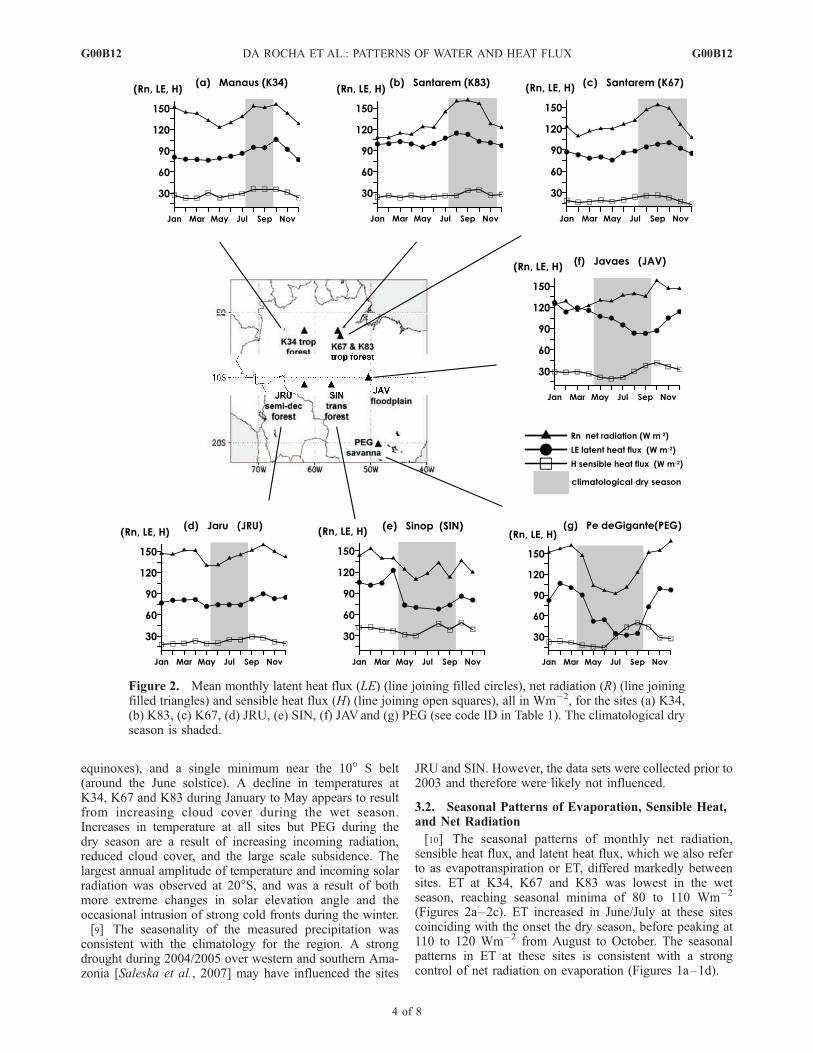
[10] The seasonal patterns of monthly net radiation,sensible heat flux, and latent heat flux, which we also referto as evapotranspiration or ET, differed markedly betweensites. ET at K34, K67 and K83 was lowest in the wetseason, reaching seasonal minima of 80 to 110 Wm�2
(Figures 2a–2c). ET increased in June/July at these sitescoinciding with the onset the dry season, before peaking at110 to 120 Wm�2 from August to October. The seasonalpatterns in ET at these sites is consistent with a strongcontrol of net radiation on evaporation (Figures 1a–1d).
Figure 2. Mean monthly latent heat flux (LE) (line joining filled circles), net radiation (R) (line joiningfilled triangles) and sensible heat flux (H) (line joining open squares), all in Wm�2, for the sites (a) K34,(b) K83, (c) K67, (d) JRU, (e) SIN, (f) JAV and (g) PEG (see code ID in Table 1). The climatological dryseason is shaded.
G00B12 DA ROCHA ET AL.: PATTERNS OF WATER AND HEAT FLUX
4 of 8
G00B12
[11] The ET at JRU peaked early in the wet season(Figure 2d). The low ET at JRU in comparison to the othersites during the early to middle dry season may haveresulted from colder temperatures and less net radiation,coinciding with the June solstice (see Figure 1d). However,the ET at JRU did not increase in August coincident withdecreased cloud cover and increased radiation, implyingthat radiation alone doesn’t control ET at JRU. A possibleexplanation is semideciduous species at JRU started tosenesce in August, which reduced green leaf area indexand transpiration.[12] In contrast, the ET at SIN, JAV and PEG followed a
seasonal pattern that was nearly opposite to that observed atK34, K67 and K83. The mean ET rates at SIN, JAV andPEG decreased progressively with the development of thedry season (Figures 2e–2g). Peak monthly ET was between110 to 120 Wm�2 at these sites, and minimal ET was�70 Wm�2 at SIN and JAV and �30 Wm�2 at PEG(Figures 2e–2g).[13] The seasonal patterns of ET at SIN and PEG were
positively correlated with net radiation (Figures 2e and 2g),a pattern that is similar to that observed for the tropicalhumid forest sites (K34, K67 and K83) and semideciduousforest (JRU) and that illustrates the control that availableenergy exerts on ET. A contrasting pattern was observed atJAV, where net radiation increased progressively from Maythrough August (the dry season), while ET decreased(Figure 1f). The evaporation from standing water beneaththe canopy may have likely dominated the energyexchanges during the wet season at JAV, and must havedeclined markedly as JAV dried in the dry season [Borma etal., 2009]. The ecosystem at this point functioned similar toa savanna, resulting in a large decrease in ET from May toSeptember, despite increasing radiation.[14] Net radiation, ET and sensible heat flux for the dry
and wet seasons are summarized in Table 2. All three ofthese energy fluxes increased during the dry season at theevergreen forest sites (K34, K67 and K83). Net radiation atthese sites was 143–153 Wm�2 in the dry season and 117–137 Wm�2 in the wet season. ET was 96–114 Wm�2 in thedry season (equivalent to 3.3–3.9 mm d�1) and 81–103 Wm�2 (equivalent to 2.8–3.6 mm d�1) in the wet
season. In contrast, ET was lower in the dry season at SIN,JAVand PEG (39–94 Wm�2; i.e., 1.3–3.3 mm d�1) than inthe wet season (88–111 Wm�2; i.e., 2.8–3.8 mm d�1)(Table 2). Likewise, net radiation was generally lower in thedry season at these sites (except for JAV, which showed avery modest increase), as was sensible heat flux (exceptfor PEG). The highest seasonal change of ETwas observed atPEG, which increased from 39 Wm�2 in the dry season(1.3 mm d�1) to 88 Wm�2 in the wet season (3.0 mm d�1).[15] The sensible heat flux at all sites was reduced during
the wet season, with a gradual increase during the dry season,and a maximum during the mid to late dry season (Figure 2).This pattern is consistent with the temporal variation of netradiation, and the plentiful soil moisture in the wet season andmoisture deficit in the dry season. Soil moisture decreasessubstantially during the dry season in savanna [Oliveira et al.,2005], at the floodplain site [Borma et al., 2009], and intropical humid forest [Bruno et al., 2006], although thedecrease does not appear to limit transpiration at forest sites.The seasonal differences of sensible heat fluxes were mostlypositive, varying from 19 to 44%, or 20–38 Wm�2, for allsites except SIN and JAV (Table 2). SIN and JAV showednegative differences, partly because the sensible heat fluxremained high even in the early wet season (Figures 2fand 2e). Moreover, at JAV the heat flux was low duringearly to middle dry season, consistent with the relativelywet soil after the flooding.[16] At all sites, the mean monthly sensible heat flux was
lower than the latent heat fluxes (i.e., the Bowen ratio was <1), except for the PEG site during the middle to late dryseason, when it was >1.
3.3. Normalized Surface Fluxes
[17] The mean net radiation varied considerably betweensites during the wet season (from about January throughMay, 110–150 Wm�2, Figure 3a). At all sites except PEG,the mean monthly net radiation increased from � 120 inMay to 150 Wm�2 in October, coinciding with the dryseason. The similarity in the temporal evolution of netradiation among sites as the dry season progressed wasremarkable, considering the variation of incoming solarradiation with latitude, and the potential importance of otherfactors, such as cloudiness, smoke, surface albedo, andlong-wave energy exchange. The annual amplitude ofincoming solar radiation was much more pronounced atPEG, with a substantial decrease in net radiation during thesouthern hemisphere winter.[18] The absolute values of latent and sensible heat fluxes
must be interpreted with caution, as the estimates ofturbulent fluxes have potential site-specific uncertaintiesrelated to energy balance closure. We calculated the ratio(H + LE)/(Rn – G), to investigate the energy closure at eachsite, using monthly averages for all sites, excluding G at theK67 site (Table 2). We disregarded energy stored in biomassand canopy air below the measurement height, the chemicalenergy associated with net CO2 exchange, and energyadvected horizontally, which are arguably small whenaveraged over 24h (for example, the energy stored intropical forest biomass varied between 0 and 2 Wm�2 [daRocha et al., 2004]). The energy balance closure was lowest(0.70) at PEG and JRU, and higher (0.85–1.05) at theremaining sites. The energy balance closure was consistent
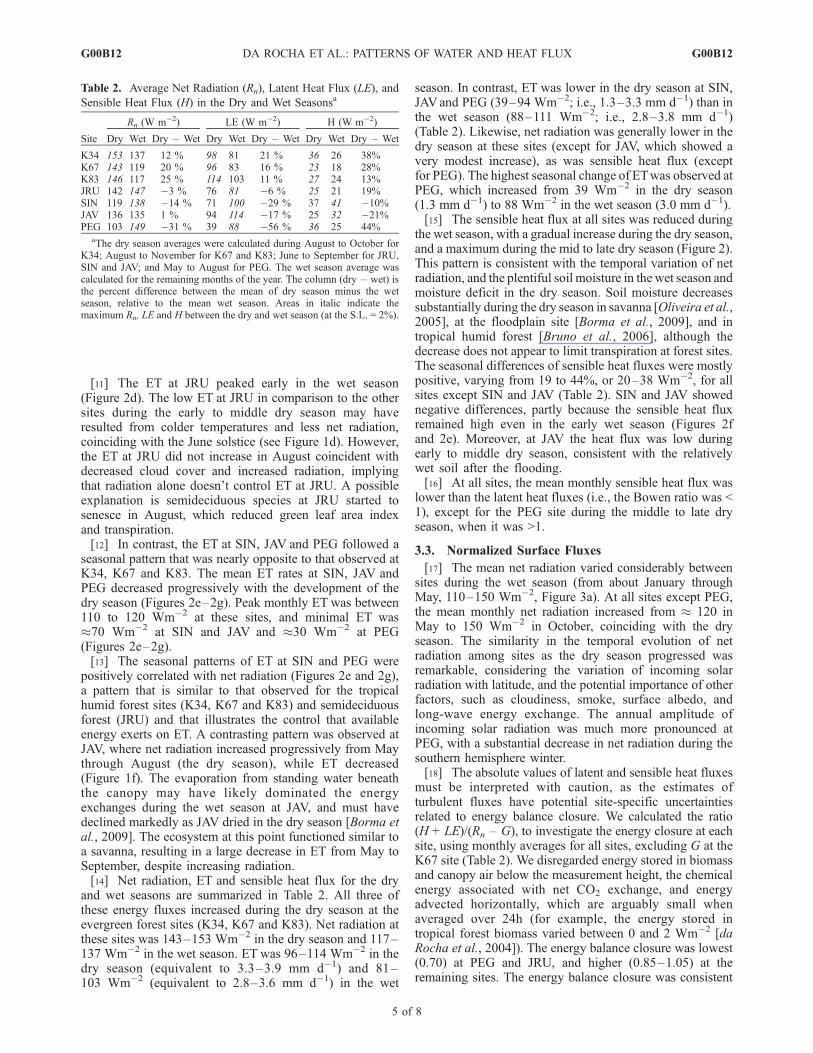
Table 2. Average Net Radiation (Rn), Latent Heat Flux (LE), and
Sensible Heat Flux (H) in the Dry and Wet Seasonsa
Site
Rn (W m�2) LE (W m�2) H (W m�2)
Dry Wet Dry � Wet Dry Wet Dry � Wet Dry Wet Dry � Wet
K34 153 137 12 % 98 81 21 % 36 26 38%K67 143 119 20 % 96 83 16 % 23 18 28%K83 146 117 25 % 114 103 11 % 27 24 13%JRU 142 147 �3 % 76 81 �6 % 25 21 19%SIN 119 138 �14 % 71 100 �29 % 37 41 �10%JAV 136 135 1 % 94 114 �17 % 25 32 �21%PEG 103 149 �31 % 39 88 �56 % 36 25 44%
aThe dry season averages were calculated during August to October forK34; August to November for K67 and K83; June to September for JRU,SIN and JAV; and May to August for PEG. The wet season average wascalculated for the remaining months of the year. The column (dry � wet) isthe percent difference between the mean of dry season minus the wetseason, relative to the mean wet season. Areas in italic indicate themaximum Rn, LE and H between the dry and wet season (at the S.L. = 2%).
G00B12 DA ROCHA ET AL.: PATTERNS OF WATER AND HEAT FLUX
5 of 8
G00B12
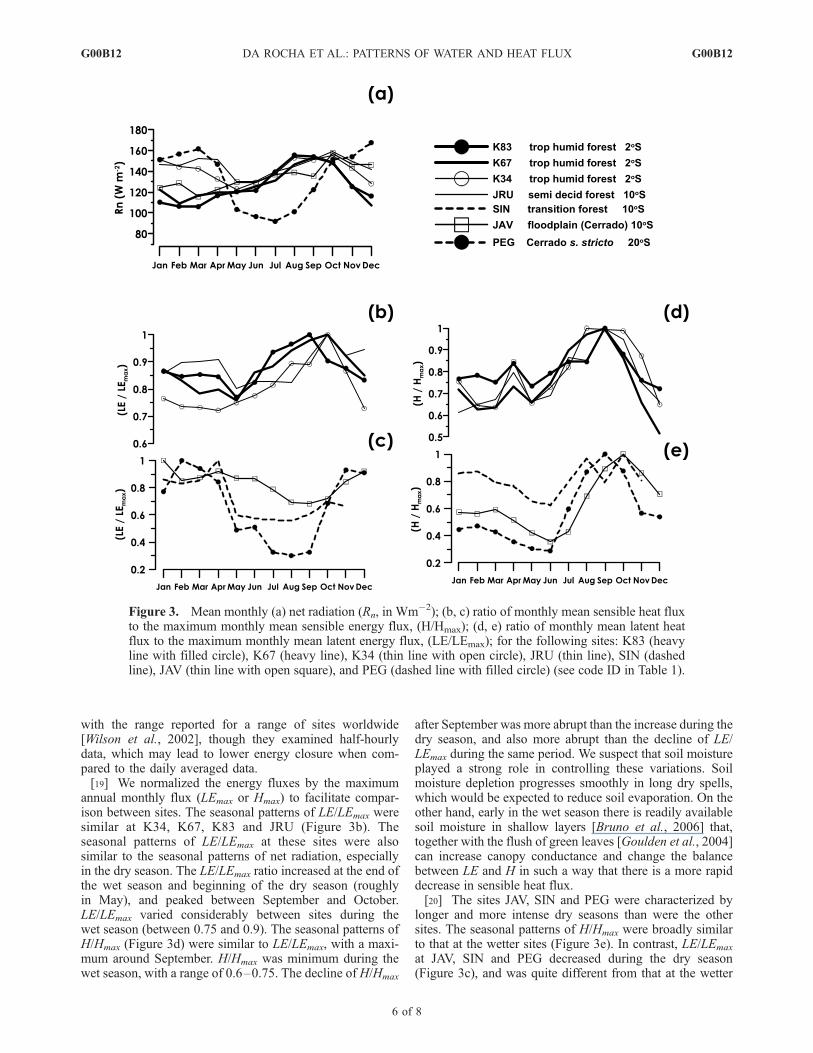
with the range reported for a range of sites worldwide[Wilson et al., 2002], though they examined half-hourlydata, which may lead to lower energy closure when com-pared to the daily averaged data.[19] We normalized the energy fluxes by the maximum
annual monthly flux (LEmax or Hmax) to facilitate compar-ison between sites. The seasonal patterns of LE/LEmax weresimilar at K34, K67, K83 and JRU (Figure 3b). Theseasonal patterns of LE/LEmax at these sites were alsosimilar to the seasonal patterns of net radiation, especiallyin the dry season. The LE/LEmax ratio increased at the end ofthe wet season and beginning of the dry season (roughlyin May), and peaked between September and October.LE/LEmax varied considerably between sites during thewet season (between 0.75 and 0.9). The seasonal patterns ofH/Hmax (Figure 3d) were similar to LE/LEmax, with a maxi-mum around September. H/Hmax was minimum during thewet season, with a range of 0.6–0.75. The decline of H/Hmax
after September was more abrupt than the increase during thedry season, and also more abrupt than the decline of LE/LEmax during the same period. We suspect that soil moistureplayed a strong role in controlling these variations. Soilmoisture depletion progresses smoothly in long dry spells,which would be expected to reduce soil evaporation. On theother hand, early in the wet season there is readily availablesoil moisture in shallow layers [Bruno et al., 2006] that,together with the flush of green leaves [Goulden et al., 2004]can increase canopy conductance and change the balancebetween LE and H in such a way that there is a more rapiddecrease in sensible heat flux.[20] The sites JAV, SIN and PEG were characterized by
longer and more intense dry seasons than were the othersites. The seasonal patterns of H/Hmax were broadly similarto that at the wetter sites (Figure 3e). In contrast, LE/LEmax
at JAV, SIN and PEG decreased during the dry season(Figure 3c), and was quite different from that at the wetter
Figure 3. Mean monthly (a) net radiation (Rn, in Wm�2); (b, c) ratio of monthly mean sensible heat fluxto the maximum monthly mean sensible energy flux, (H/Hmax); (d, e) ratio of monthly mean latent heatflux to the maximum monthly mean latent energy flux, (LE/LEmax); for the following sites: K83 (heavyline with filled circle), K67 (heavy line), K34 (thin line with open circle), JRU (thin line), SIN (dashedline), JAV (thin line with open square), and PEG (dashed line with filled circle) (see code ID in Table 1).
G00B12 DA ROCHA ET AL.: PATTERNS OF WATER AND HEAT FLUX
6 of 8
G00B12
sites. The maximum LE/LEmax at JAV, SIN, and PEGoccurred during the middle or late wet season (Decemberto March), and the minimum LE/LEmax occurred aroundSeptember, which is at the end of the dry season. Theseasonal amplitude at JAV was similar to, but less extremethan that at SIN and PEG. The floodplain at JAV apparentlyretains enough water from the wet season to allow greaterevaporation through the early dry season than at the othertwo sites [Borma et al., 2009].
4. Conclusions
[21] The seven tower sites were easily divisible into twofunctional groups based on the seasonality of evaporation:tropical forest and savanna. Dry season length varied from2 months in central Amazonia to 6 months in the south andeast. The vegetation type at each site was closely associatedwith the dry season length along the gradient. Other factorswere also almost certainly important in controlling vegeta-tion distribution, such as mean annual temperature, annualprecipitation, and geomorphology (especially at JAV, whichis on a river floodplain).[22] The two functional groups were different in their
seasonality of water and energy fluxes. The more southernand eastern sites (SIN, JAV and PEG) were drier andshowed an ET decrease during the dry season, reachingminimum values of 2.5 mm d�1 in the transitional forest andfloodplain, and 1 mm d�1 in the cerrado sensu stricto. Thisdecrease was likely due to soil moisture limitation. Thispattern is typical of the Brazillian cerrado ecosystem, withits marked seasonality of leaf area index and green biomassresulting from leaf senescence and grass dormancy duringthe dry season. This created a situation where the seasonalpatterns of ET at SIN, JAVand PEG were controlled mainlyby the effect of soil moisture availability.[23] The more northern and western sites (K34, K67, K83
and JRU) were wetter, with dry season length of less than 4or 5 months. The annual precipitation at these sites was atleast 1900 mm, and the mean annual above-canopy tem-perature was above 25�C. The mean monthly evaporation atthe wetter sites increased during the dry season to as muchas 4 mm d�1, and was relatively consistent during the wetseason. ET, net radiation and vapor density deficit werepositively correlated at these sites, and atmospheric con-ditions appear to exert the dominant control on ET. All ofthese sites were dominated by well-established forest, withtrees that were presumably deeply rooted [cf. Bruno et al.,2006]. The combination of evergreen or semidecidous leafphenology, extensive root systems, and the ability to extractsoil moisture from deep in the soil column, apparently allowthese sites to maintain high rates of ET throughout the dryseason. This created a situation where the seasonal patternsof ET at K34, K67, K83 and JRU were controlled mainly byatmospheric evaporative demand.
[24] Acknowledgments. We thank the LBA scientific committee, theBrazilian Ministry of Science and Technology, the Brazillian fundingagencies Fapesp, CNPq and Finep, the NASA/LBA-Eco coordination andstaff, and all who contributed with constructive work during the last decade,including C. Nobre, J. Shuttleworth, D. Fitzjarrald, M. Keller, M. A. S.Dias, P. S. Dias, A. Araujo, O. Moraes, O. Acevedo, R. Sakai, L. Sa,J. Lloyd, J. Gash, L. Hutyra, M. Costa, F. Zanchi, A. Miranda, J. Grace,Y. Malhi, G. Fisch, R. Alvala, R. Avissar, E. Collichio, F. Lobo, J. Tota,
R. Bruno, R. Tannus, L. Oliveira, R. Juarez, D. Kurzatkowski, andD. Rezende. The first author acknowledges Fapesp (02/09289–9) andCNPq (Instituto do Milenio, Ed. Universal-01, Ed. CT-Hidro 03).
ReferencesAraujo, A. C., et al. (2002), Comparative measurements of carbon dioxidefluxes from two nearby towers in a central Amazonian rainforest: TheManaus LBA site, J. Geophys. Res., 107(D20), 8090, doi:10.1029/2001JD000676.
Betts, R., et al. (2004), The role of ecosystem-atmosphere interactions insimulated Amazonian precipitation decrease and forest dieback underglobal climate warming, Theor. Appl. Climatol., 78(1–3), 157–175.
Borma, L. S., et al. (2009), Atmospheric and hydrological controls of theevapotranspiration over a floodplain forest in the Bananal Island region,Amazonia, J. Geophys. Res., doi:10.1029/2007JG000641, in press.
Bruno, R. D., H. R. da Rocha, H. Freitas, M. Goulden, and S. Miller (2006),Soil moisture dynamics in an eastern Amazonian tropical forest, Hydrol.Process., 20, 2477–2489.
Costa, M., and J. Foley (1999), Trends in the hydrologic cycle of theAmazon basin, J. Geophys. Res., 104, 14,189–14,198.
da Rocha, H. R., H. C. Freitas, R. Rosolem, R. I. N. Juarez, R. N. Tannus,M. V. Ligo, O. M. R. Cabral, and M. A. F. Silva Dias (2002), Mea-surements of CO2 exchange over a woodland savanna (cerrado sensustricto) in southeast Brasil, Biota Neotropica, 2(1). (Available at http://www.scielo.br/scielo.php/script_sci_serial/lng_pt/pid_1676-0603/nrm_iso)
da Rocha, H. R., M. Goulden, S. Miller, M. Menton, L. Pinto, H. Freitas,and A. S. Figueira (2004), Seasonality of water and heat fluxes over atropical forest in eastern Amazonia, Ecol. Appl., 14(4), 22–32.
Dirmeyer, P., and K. Brubaker (2007), Characterization of the global hydro-logic cycle from a back-trajectory analysis of atmospheric water vapor,J. Hydrometeorol., 8(1), 20–37.
Friedlingstein, P., et al. (2006), Climate-carbon cycle feedback analys: Re-sults from the CMIP-M4 model intercomparison, J. Clim., 19(14), 3337–3353.
Gash, J. C. H., C. A. Nobre, J. M. Roberts, and R. Victoria (1996), Ama-zonian Deforestation and Climate, pp. 1–14, John Wiley, Chichester,UK.
Goulden, M., S. Miller, H. Rocha, M. Menton, and H. Freitas (2004),Physiological controls on tropical forest CO2 exchange, Ecol. Appl.,14(4), 42–55.
Hutyra, L., J. Munger, S. Saleska, E. Gottlieb, B. Daube, A. Dunn,D. Amaral, P. Camargo, and S. Wofsy (2007), Seasonal controls on theexchange of carbon and water in an Amazonian rain forest, J. Geophys.Res., 112, G03008, doi:10.1029/2006JG000365.
Inmet (1994), Normais climatologicas de superfıcie 1931–1990, Inst. Nac.de Meteorol., Brasılia, DF, Brasil.
Miller, S. D., M. L. Goulden, H. R. da Rocha, M. C. Menton, and H. C.Freitas (2004), Biometric and micrometeorological measurements of tro-pical forest carbon balance, Ecol. Appl., 14(4), suppl. S, 114–126.
Neiff, J. J. (2003), Planıcies de inundacao sao ecotonos?, in Ecotonos nasInterfaces dos Ecossistemas Aquaticos, edited by R. Henry, cap. 2, pp. 32–47, RIMA Editora, Sao Carlos, Brazil.
Oliveira, R., et al. (2005), Deep root function in soil water dynamics incerrado savannas of central Brazil, Funct. Ecol., 19, 574–581.
Saleska, S. R., et al. (2003), Carbon in Amazon forests: Unexpected sea-sonal fluxes and disturbance-induced losses, Science, 302, 1554–1557.
Saleska, S. R., K. Didan, A. R. Huete, and H. R. da Rocha (2007), Amazonforests green-up during 2005 drought, Science, 318, 612, doi:10.1126/science.1146663.
Shuttleworth, W. J. (1988), Evaporation from Amazonian rain forest, Proc.R. Soc. London, Ser. B, 233, 321–346.
von Randow, C., et al. (2004), Comparative measurements and seasonalvariations in energy and carbon exchange over forest and pasture insouthwest Amazonia, Theor. Appl. Climatol., doi:10.1007/s00704-004-0041-z.
Vourlitis, G., et al. (2002), Seasonal variations in the evapotranspiration of atransitional tropical forest of Mato Grosso, Brasil, Water Resour. Res.,38(6), 1094, doi:10.1029/2000WR000122.
Wilson, K., et al. (2002), Energy balance closure at FLUXNET sites, Agric.For. Meteorol., 113(1–4), 223–243.
�����������������������R. G. Aguiar and F. L. Cardoso, Universidade Federal de Rondonia,
Porto Velho, RO 78900-000, Brazil.P. Artaxo, L. S. Borma, H. R. da Rocha, and H. C. Freitas, Departamento
de Ciencias Atmosfericas, IAG, Universidade de Sao Paulo, Rua do Matao,1226 Cidade Universitaria, Sao Paulo, SP 05508-090, Brazil. ([email protected])O. M. Cabral, Embrapa Meio Ambiente, Jaguariuna, SP 13.820-00,
Brazil.
G00B12 DA ROCHA ET AL.: PATTERNS OF WATER AND HEAT FLUX
7 of 8
G00B12
M. L. Goulden, Department of Earth System Science, University ofCalifornia, Irvine, CA 92697, USA.B. Kruijt, Wageningen University and Research, NL-6700 AA
Wageningen, Netherlands.J. F. Maia, A. O. Manzi, A. D. Nobre, and C. von Randow, Instituto
Nacional de Pesquisas da Amazonia, Manaus, AM 69060-001, Brazil.S. D. Miller, Atmospheric Sciences Research Center, State University of
New York at Albany, Albany, NY 12203, USA.
J. S. Nogueira, Department of Physics, Universidade Federal de MatoGrosso, Cuiaba, MT 78005505, Brazil.N. R.-Coupe and S. R. Saleska, Department of Ecology and Evolutionary
Biology, University of Arizona, Tucson, AZ 85721, USA.G. Vourlitis, Biological Sciences Department, California State University,
San Marcos, CA 92096, USA.S. C. Wofsy, Department of Earth and Planetary Sciences, Harvard
University, Cambridge, MA 02138, USA.
G00B12 DA ROCHA ET AL.: PATTERNS OF WATER AND HEAT FLUX
8 of 8
G00B12