
Patterns of Pass-through of Commodity Price Shocks to Retail Prices
26
eScholarship provides open access, scholarly publishing services to the University of California and delivers a dynamic research platform to scholars worldwide. Department of Agricultural and Resource Economics, UCB UC Berkeley Title: Patterns of Pass-through of Commodity Price Shocks to Retail Prices Author: Berck, Peter , University of California, Berkeley and Giannini Foundation Leibtag, Ephraim S. , Economic Research Service - United States Deprartment of Agriculture Villas-Boas, Sofia B. , University of California, Berkeley and Giannini Foundation Solis, Alex , University of California, Berkeley Publication Date: 06-16-2009 Series: CUDARE Working Papers Permalink: http://escholarship.org/uc/item/546195ms Keywords: commodity prices, retail prices, statistical analysis Local Identifier: CUDARE Working Paper No. 1082 Abstract: Commodity prices have been rising at unprecedented rates over the last two years. The primary objective of this paper is to assess if and how firms pass through upstream cost increases to final good prices. First, we investigate what happens to the shelf prices (the regular prices) of goods that contain significant amounts of a commodity whose price has changed. The objective is to document patterns of price rigidity depending on the share of the commodity in the final good that is sold to consumers. For example, given an abnormal commodity price change in wheat, what happens to the shelf regular price of bread, wheat cereals, and other goods that contain wheat? Commodity pass-through patterns for ready to eat cereal (smallest share of commodity in final product) and fresh chicken (largest share of commodity in final good) are investigated. Second, we also assess what happens to the net prices consumers pay (that is the regular price net of discounts offered). One possible way to pass through a cost increase is to reduce the frequency of promotional discounts, or offer smaller discounts to consumers. Upstream commodity input prices used in our investigation are wheat and corn futures prices, to account for upstream inputs, and flour and chicken feed producer price sub indices for downstream cost shocks. We combine several datasets for this empirical analysis: commodity prices, commodity price indices, and scanner data on prices for a variety of goods, over a four year time period and across several stores in California, belonging to a large retail chain. We construct quantity weighted price indices within two product categories sold in the supermarket, where prices are weighted
-
Upload
independent -
Category
Documents
-
view
0 -
download
0
Transcript of Patterns of Pass-through of Commodity Price Shocks to Retail Prices

eScholarship provides open access, scholarly publishingservices to the University of California and delivers a dynamicresearch platform to scholars worldwide.
Department of Agricultural and ResourceEconomics, UCB
UC Berkeley
Title:Patterns of Pass-through of Commodity Price Shocks to Retail Prices
Author:Berck, Peter, University of California, Berkeley and Giannini FoundationLeibtag, Ephraim S., Economic Research Service - United States Deprartment of AgricultureVillas-Boas, Sofia B., University of California, Berkeley and Giannini FoundationSolis, Alex, University of California, Berkeley
Publication Date:06-16-2009
Series:CUDARE Working Papers
Permalink:http://escholarship.org/uc/item/546195ms
Keywords:commodity prices, retail prices, statistical analysis
Local Identifier:CUDARE Working Paper No. 1082
Abstract:Commodity prices have been rising at unprecedented rates over the last two years. The primaryobjective of this paper is to assess if and how firms pass through upstream cost increases to finalgood prices. First, we investigate what happens to the shelf prices (the regular prices) of goodsthat contain significant amounts of a commodity whose price has changed. The objective is todocument patterns of price rigidity depending on the share of the commodity in the final good thatis sold to consumers. For example, given an abnormal commodity price change in wheat, whathappens to the shelf regular price of bread, wheat cereals, and other goods that contain wheat?Commodity pass-through patterns for ready to eat cereal (smallest share of commodity in finalproduct) and fresh chicken (largest share of commodity in final good) are investigated. Second,we also assess what happens to the net prices consumers pay (that is the regular price net ofdiscounts offered). One possible way to pass through a cost increase is to reduce the frequency ofpromotional discounts, or offer smaller discounts to consumers. Upstream commodity input pricesused in our investigation are wheat and corn futures prices, to account for upstream inputs, andflour and chicken feed producer price sub indices for downstream cost shocks.
We combine several datasets for this empirical analysis: commodity prices, commodity priceindices, and scanner data on prices for a variety of goods, over a four year time period and acrossseveral stores in California, belonging to a large retail chain. We construct quantity weightedprice indices within two product categories sold in the supermarket, where prices are weighted

eScholarship provides open access, scholarly publishingservices to the University of California and delivers a dynamicresearch platform to scholars worldwide.
by pre-determined quantity weights to obtain shelf price indices and net price indices. For eachof the commodities, regressions will be run using store-level product (UPC) weekly data. Thereduced form regressions consist of projecting the shelf price index, as well as the net priceindex, on commodity prices, other explanatory variables and on region and time dummies. Thepoint estimates measure the effect of residual changes in commodity prices, net of seasonaland regional effects, on the prices consumers face when making purchase decisions. We alsoconstruct a variable that measures the frequency of price discounts and relate that variable to thesame explanatory variables. We estimate pass through behavior using the above three differentmeasures of retail price activity controlling for cost proxies, store-level fixed-effects and regionaltime trends using panel data estimation techniques. Results suggest that an important part ofretail price variation comes from promotional activities, and the usual shelf price index wouldunderestimate the true pass through coefficient. To deal with omitted variables and price stickinesswe included a lagged dependent variable, using the Arellano-Bond dynamic panel estimator.For Chicken the results show that using standard information on regular shelf price leads to anunderestimation of the true pass-through coefficient. For Cereal, using standard shelf prices leadsto an overestimation of the pass-through coefficient reflecting the importance of storability facedby consumers and retailers, and industry characteristics in the sale dynamics. Not only do our costpass-through estimates account for sales we also provide dynamic multipliers for grain commodityprice increases to supermarket shelf prices. The estimated dynamic elasticities are not as smallas one might expect from a naive model. The elasticity of cereal price with respect to flour is over1 and the elasticity of chicken price with respect to chicken feed was 30 percent. These estimateswould imply a very large price increase in cereal and chicken over the last several years. Thereare fewer sales when commodity prices go up. From this we would conclude that net prices shouldbe used for pass-through analysis.
Copyright Information:All rights reserved unless otherwise indicated. Contact the author or original publisher for anynecessary permissions. eScholarship is not the copyright owner for deposited works. Learn moreat http://www.escholarship.org/help_copyright.html#reuse

Department of Agricultural &Resource Economics, UCB
CUDARE Working Papers(University of California, Berkeley)
Year Paper
Patterns of Pass-through of Commodity
Price Shocks to Retail Prices
Peter Berck ∗ Ephraim S. Leibtag †
Sofia B. Villas-Boas ‡ Alex Solis ∗∗
∗University of California Berkeley†Economic Research Service - United States Deprartment of Agriculture‡University of California, Berkeley
∗∗University of California, Berkeley
This paper is posted at the eScholarship Repository, University of California.
http://repositories.cdlib.org/are ucb/1082
Copyright c©2009 by the authors.

Patterns of Pass-through of Commodity
Price Shocks to Retail Prices
Abstract
Commodity prices have been rising at unprecedented rates over the last twoyears. The primary objective of this paper is to assess if and how firms passthrough upstream cost increases to final good prices. First, we investigate whathappens to the shelf prices (the regular prices) of goods that contain significantamounts of a commodity whose price has changed. The objective is to documentpatterns of price rigidity depending on the share of the commodity in the finalgood that is sold to consumers. For example, given an abnormal commodityprice change in wheat, what happens to the shelf regular price of bread, wheatcereals, and other goods that contain wheat? Commodity pass-through patternsfor ready to eat cereal (smallest share of commodity in final product) and freshchicken (largest share of commodity in final good) are investigated. Second, wealso assess what happens to the net prices consumers pay (that is the regularprice net of discounts offered). One possible way to pass through a cost increaseis to reduce the frequency of promotional discounts, or offer smaller discountsto consumers. Upstream commodity input prices used in our investigation arewheat and corn futures prices, to account for upstream inputs, and flour andchicken feed producer price sub indices for downstream cost shocks.
We combine several datasets for this empirical analysis: commodity prices, com-modity price indices, and scanner data on prices for a variety of goods, over afour year time period and across several stores in California, belonging to a largeretail chain. We construct quantity weighted price indices within two productcategories sold in the supermarket, where prices are weighted by pre-determinedquantity weights to obtain shelf price indices and net price indices. For each ofthe commodities, regressions will be run using store-level product (UPC) weeklydata. The reduced form regressions consist of projecting the shelf price index,as well as the net price index, on commodity prices, other explanatory variablesand on region and time dummies. The point estimates measure the effect of

residual changes in commodity prices, net of seasonal and regional effects, onthe prices consumers face when making purchase decisions. We also constructa variable that measures the frequency of price discounts and relate that vari-able to the same explanatory variables. We estimate pass through behaviorusing the above three different measures of retail price activity controlling forcost proxies, store-level fixed-effects and regional time trends using panel dataestimation techniques. Results suggest that an important part of retail pricevariation comes from promotional activities, and the usual shelf price indexwould underestimate the true pass through coefficient. To deal with omittedvariables and price stickiness we included a lagged dependent variable, usingthe Arellano-Bond dynamic panel estimator. For Chicken the results show thatusing standard information on regular shelf price leads to an underestimation ofthe true pass-through coefficient. For Cereal, using standard shelf prices leadsto an overestimation of the pass-through coefficient reflecting the importance ofstorability faced by consumers and retailers, and industry characteristics in thesale dynamics. Not only do our cost pass-through estimates account for sales wealso provide dynamic multipliers for grain commodity price increases to super-market shelf prices. The estimated dynamic elasticities are not as small as onemight expect from a naive model. The elasticity of cereal price with respect toflour is over 1 and the elasticity of chicken price with respect to chicken feed was30 percent. These estimates would imply a very large price increase in cerealand chicken over the last several years. There are fewer sales when commodityprices go up. From this we would conclude that net prices should be used forpass-through analysis.

Patterns of Pass-through of Commodity Price Shocks to Retail Prices
Peter Berck, Ephraim Leibtag, Alex Solis, and Sofia Villas-Boas1
The prices of corn and wheat started in the year 2000 at $1.92 and $2.17 per bushel,
respectively. Eight years later, corn stood at $7.38 and wheat at $11.95 per bushel. In
May of 2009, corn dropped to $3.96 and wheat to $4.77 per bushel. Gasoline prices
followed the same pattern during the same period. For example, the average Los Angeles
price was $0.71 per gallon in 2000, increased to $3.82 per gallon in the beginning of
2009, and dropped back down to $1.60 per gallon in May 2009. Other commodities
followed similar patterns. Fuel, wheat, and corn are all important elements for the
manufacture and delivery of foodstuffs. The effect of these high prices on food prices
depends on the pass-through of these raw commodity prices to the prices of foods
purchased and consumed by consumers. Since grain and fuel are only a fraction of the
1 Peter Berck, Alex Solis, and Sofia Villas-Boas are Professor, Graduate Student, and
Associate Professor in the Department of Agricultural and Resource Economics at
University of California, Berkeley. Ephraim Leibtag is Economist at the Economic
Research Service, USDA. The project has benefitted from financial support from
Cooperative Agreement 58-4000-8-0083 from the USDA and from the Giannini
Foundation of Agricultural Economics.
This article was presented in an invited paper session at the 2009 AAEA annual meeting
in Milwaukee, WI. The articles in these sessions are not subjected to the journal’s
standard refereeing process.

2
value of the consumed food products, the change in prices is expected to be significantly
less than the change in these commodity prices.
In this article we examine the pass-through of corn, wheat, and gasoline prices to
the supermarket prices of cereals and chicken. We estimate these pass-through rates and
compare our estimates to a rough estimate of the level of pass-through that can be derived
from the cost share of the commodity in the final product. We also examine how the
estimate of pass-through varies with price measurement. Because sales are a pervasive
way of reducing prices, we expect analyses that use shelf prices to differ systematically
from those that use transaction prices. We will show this in two ways: through a
comparison of pass-through estimates from shelf and transaction prices and through an
analysis of the frequency of sales as a function of commodity prices.
Farm to shelf markups have always concerned farmers who typically receive a
very small share of the shelf price. Gardner (1975) set out a six equation model to
explain the relation of prices at these levels. Heien (1980) introduced dynamics to the
markup model and using retail and wholesale prices for 22 food items estimated the pass-
through equations. He found no asymmetric effect—price increases and decreases have
the same effect. More recently, researchers have been able to use consumer level data
derived from supermarkets or from home scanners to investigate price variation and pass-
through (Nakamura 2008; Rojas, Andino, and Purcell 2008). These data differ from
earlier data in that they include promotions. Hosken and Reiffen (2004) show that retail
promotions account for 20 to 50 percent of the annual variation in prices, so capturing
these sales is an important part of the data. Pesendorfer (2002) analyzes the frequencies

3
of sales as method of price discrimination; Berck et al. (2008) find little empirical
evidence supporting most theories of sales; and finally, Hendel and Nevo (2006a, 2006b)
and Gicheva, Hastings, and Villas-Boas (2008) study the effect of sales on consumer
behavior and demand substitution. Two recent papers use the transaction price data to
examine pass-through. Kim and Cotterill (2008) set out two structural models, collusion
and Nash-Bertrand, and estimate the pass-through of milk prices to cheese prices. They
also estimate a nonstructural model and find that the empirical pass-through lies between
the collusion and Nash-Betrand models. Leibtag et al. (2007) examine the pass-through
for coffee. Their estimation shows a penny for penny pass-through in the long run and
significantly less than that within a calendar quarter. Coffee and cheese are both good
goods to study pass-through because of the relatively high percentage of value occupied
by the raw commodity in the final product. Coffee is also subject to dramatic price
swings that greatly increase the accuracy of estimation.
In this article we begin an investigation of the pass-through to transaction food
prices of the changes in the prices of major food commodities at both farm and wholesale
level. We have selected two commodities that are derived from grains, fresh chicken,
and ready-to-eat cereals (cereals hereafter). Both storability and commodity content are
related to pass-through. Storability allows retailers to segment the market between those
who buy only for current consumption and those that will buy and store (Pesendorfer
2002; Hendel and Nevo 2006a, 2006b). Of these two products chicken presents a more
competitive market, has the higher grain content, and is less storable. Cereal, on the
other hand, is a highly concentrated industry, with differentiated products, high price-cost

4
margins, and large promotion to sale ratios, presenting cooperative competition (Nevo
2001) that increases the likelihood of idiosyncratic behavior.
Data
The data are on prices at three levels along the vertical distribution chain: downstream
retail (chicken and cereal), intermediate processing (feed and flour), and upstream
commodities (corn and wheat).
The retail price data set comes from scanner data on two product categories from
184 retail grocery stores in California. The data were collected weekly and cover the
years 2003-2005. We have weekly product level (UPC-level) data for all items within the
two product categories analyzed (fresh chicken and ready-to-eat family cereal). The
original scanner data include the total: unit quantity sold of each UPC, gross revenue,
revenue net of sale discounts, and weight of the UPC sold for the chicken products
(weights consists of pounds of meat, and price is measured in dollars per pound). Mean
price for a box of cereal in our sample is $4.22, and the mean price net of promotional
discounts is $3.78 with a standard deviation of $1.07. The average promotion is 51.7
cents which represent a 12.2 percent discount from the regular price. The large average
promotional discount is driven by frequent buy-one, get-one-free sale. Approximately 32
percent of the UPC observations in our data set are on promotion every week. These sales
make the gross price, which is the shelf price, different from the net price, which is the
actual transaction price and includes the sales. For the chicken category the main product
differentiation is by cut of meat: boneless-skinless, breast, leg, thigh, drumsticks, etc.
There are not many brand varieties, and organic or free-range varieties were not prevalent

5
at this retail chain during this time period. Price is measured in dollars per pound, and
quantity sold is measured in pounds. For fresh chicken 32 percent of the observations in
the data set are on promotion. The average gross price per pound across products is $3.37
with a standard deviation of $1.76, and the average net price per pound is $3.10 with a
standard deviation of $1.75. The average markdown is 27 percent of price with a standard
deviation of 15 percent. Hence, the average markdown as a percentage of price is lower
for chicken than for cereal.
The data on cereal and chicken include many UPC codes for each commodity.
The prices of these different UPC code items are aggregated using fixed quantity weights
into a price index. In this manner we constructed an index for net price (NPI) and gross
price (GPI) for chicken and cereal for each store and week. Also, we created an index of
the frequency of sales. The percent of each month that each UPC was on sale is its sale
frequency. Again, we used a fixed quantity weight index of the UPCs to construct our
frequency index by month and store.
There is considerable variation in price from store to store, despite the fact that all
these stores belong to the same chain. Also, chain management has stated that the stores
take independent price decisions. The common trend estimated as the first principal
component accounted for 69 percent of the variability, still leaving 31 percent of the
variability from other and presumably less common sources. This result is very similar to
the average correlation among the 184 series for the NPI, which is equal to 67.4 percent.
Data on corn price are the futures prices from Chicago Board of Trade (CBOT),
while data on feed are monthly data from the producer price indices (PPI).

Either corn or wheat or both are present in nearly all the cereals in our sample.
Corn may be present in many forms, including as grain and as sweetener. The corn
content of a box of cereal was about 4 cents if the cereal was solely corn-based. This is
almost 1 percent of the value of the product. Flour would be a higher percentage of value.
The flour price is the PPI, while the wheat price is the CBOT futures price.
During the time of this study, there was a strike in some of the stores, and this is
accounted for by a strike dummy. The tendency to have sales at holidays was accounted
for by a holiday dummy. Transport costs were proxied with the gasoline price.
Additionally, there were store and seasonal fixed effects and regional time trends. Table
1 gives the definition of each variable, its source, and its maximum and minimum value.
Empirical Strategy
To estimate the pass-through on cereal and chicken, we regress our three measures of
retail price activity (NPI, GPI, and frequency index separately) on the input price in
question while controlling for store-level fixed-effects, month dummies, holiday
dummies, and regional time trends. The reduced form specification is given by:
(1) 1log( ) log( ) log( )jrt j t jrt jt r t t jrty y Strk t Holi Inputγ μ α ψ δ θ β ε−= + + + + + + + ,
where log( )jrty represents the three dependent variables in logs in store j in time period t
and in region r: (i). The index of “regular” shelf-prices or GPI, (ii) an index of prices “net
of promotional discounts” or NPI, and (iii) the mean time frequency index. The
intermediate, or commodity prices, are the inputs, and log is used. Each
regression included store level fixed effects
( )tInput
jγ and seasonal fixed effect tμ . To control for
6

regional effects, there were regional trends rtδ ( 1r = if store j is in South California and
0 if North California). Dummies for the Thanksgiving, Christmas, New Year’s Day, and
the Fourth of July tHoli are included for the week in which that day is held. Finally,
jtStrk corresponds to dummies for the periods and stores under strike in southern
California.
The fixed effects take into account all the variation in the store and store
customers that are invariant in time such as location, squared feet of store, number of
employees, etc. The seasonal fixed effect takes into account the changes that are
common for all stores in a given month; the regional trends capture the differences in the
regional prices tendencies common for stores in a given region.
The parameterβ measures the contemporaneous effect on retail price activity of
the changes in commodity prices, controlling for seasonal, event, and regional effects.
To account for possible slow adjustment of price we add a lagged dependent
variable. Now, the parameter of interest is the long run elasticity or dynamic multipliers
given by:
(2) ˆ
( ; )ˆ1t t
inputy inputP P
βζ .
α=
−
The standard errors of the dynamic multipliers are calculated using the Delta method.
Before running the pass-through regressions, the system was checked for
stationarity with the test of Levin, Lin, and Chu (2002). The null hypothesis of unit roots
was rejected. Since this system is a panel with a lagged dependent variable and fixed
effects, the ordinary difference in difference estimator would not be consistent.
7

8
Therefore, we estimated pass-through using the Generalized Method of Moments (GMM)
and the Arellano-Bond (1991) estimator. We used four lags of the exogenous variable
and the exogenous variables as instruments.
Results: GPI and NPI
Table 2 shows the coefficients, and table 3 shows the dynamic multipliers. The first set
of columns in table 2 are the cereal results, the second set the chicken results. Within the
sets the results for GPI are presented before those for NPI and with those categories first
regressions on commodities and then on intermediate goods. The reported standard
errors are GMM robust standard errors. All of the coefficients were significantly
different from zero.
If the technology at all levels of processing was Leontief and the market
organization was strictly competitive, then pass-through would be dollar for dollar. Let r
be the input requirement, approximately 1 for grain in cereal and 2.6 for grain in chicken,
then the elasticity of NPI with respect to commodity price should be r P/NPI, where P is
commodity price. Vukina (2009) provides data showing that feed costs were 15.13 cents
per lb, inclusive of corn costs of 10.2 cents per lb of chicken on December 30, 2005. For
chicken this estimate of pass-through elasticity would be under 3 percent for corn and 4
percent for feed. The estimated pass-through for chicken using NPI is 17 percent for corn
and 30 percent for feed. The sign on other potential cost shares is negative: gasoline is
reported but the same results obtain with labor. Labor was not included because the
available series do not match our chain very well.
The Leontief-competitive pass-through for cereal also would be less than 3

9
percent. However, the estimated results for pass-through rates to NPI are quite different
from either the Leontief-competitive model or from those for chicken. The pass-through
elasticity for corn is negative and for wheat it is positive for cereal. Added together
(since both corn and wheat trend together), they come to 15 percent, well above the naïve
level. For flour the elasticity is above 1, yet flour is not even the majority cost share of
cereal on the shelf. Gasoline again has the wrong sign.
Comparing the NPI and GPI estimates, for cereal the GPI estimates of pass-
through are bigger and statistically significantly so. For chicken it is the NPI estimates
that are greater, also statistically significantly so. Therefore, it is important to use NPI, as
the existence of sales does change the estimates of pass-through.
Results: Frequencies
We ran the same set of regressions with the frequency of sales as the dependent variable,
and results for coefficients and dynamic multiplier are presented in tables 4 and 5. In this
case we expect that increases in input prices cause decreases in the percentage of time on
sale. For chicken we found that the mean frequency does not show statistically
significant changes when corn price changes, whereas the long run elasticity for feed is
significant and above 1. Additionally, the frequency of sales decreases when the gas price
goes up.
For cereal we found that wheat has an unexpected positive coefficient, and corn
has a coefficient of -2.13. Together they add -1.11, indicating a great response of the
frequency of sales when commodity prices change. On the other hand the long-run flour
elasticity has the wrong sign.

10
Conclusion
The aims of this article are to re-estimate the cost pass-through accounting for sales and
to provide dynamic multipliers for grain commodity price increases to supermarket shelf
prices. First, the estimated dynamic elasticities are not as small as one might expect from
a naïve model. The elasticity of cereal price with respect to flour is over 1, and the
elasticity of chicken price with respect to chicken feed was 30 percent. These estimates
would imply a very large price increase in cereal and chicken over the last several years.
Second, the elasticity estimates are definitely different when one includes sales but not
always in the expected manner. There are fewer sales when commodity prices go up.
From this we would conclude that net prices should be used for pass-through analysis.
One explanation for the large elasticities is imperfect competition and particularly
the chicken-chicken feed elasticity is in the range of what Kim and Cotterill (2008)
found. Another explanation is that a longer time series is needed for this estimation, and
with a longer time series we would also be able to produce sensible estimates of the pass-
through on labor and gasoline.
To deal with omitted variables and price stickiness, we included a lagged dependent
variable, using the Arellano-Bond (1991) dynamic panel estimator. For chicken the
results show that using standard information on regular shelf price leads to an
underestimation of the true pass-through coefficient. For cereal using standard shelf
prices leads to an overestimation of the pass-through coefficient reflecting the importance
of storability faced by consumers and retailers and industry characteristics in the sale
dynamics.

11
References
Arellano, M., and S. Bond. 1991. “Some Tests of Specification for Panel Data: Monte
Carlo Evidence and an Application to Employment Equations.” The Review of
Economic Studies 58:277-297.
Berck, P., J. Brown, J. Perloff, and S.B. Villas-Boas. 2008. “Sales: Tests of Theories on
Causality and Timing.” International Journal of Industrial Organization 26:1257-
1273.
Gardner, B. 1975. “The Farm-Retail Price Spread in a Competitive Food Industry.”
American Journal of Agricultural Economics 57:399-409.
Gicheva, D., J. Hastings, and S.B. Villas-Boas. 2008. “Revisiting the Income Effect:
Gasoline Prices and Grocery Purchases.” Working paper, University of California
Berkeley.
Heien, D. 1980 “Markup Pricing in a Dynamic Model of the Food Industry.” American
Journal of Agricultural Economics 62:10-18.
Hendel, I., and A. Nevo. 2006a. “Measuring the Implications of Sales and Consumer
Inventory Behavior.” Econometrica 74:1637–1673
---. 2006b. “Sales and Consumer Inventories.” RAND Journal of Economics 37:543–561
Hosken, D., and D. Reiffen. 2004. “Patterns of Retail Price Variation.” The RAND
Journal of Economics 35:128-146
Kim, D., and R.W. Cotterill. 2008. “Cost Pass-Through in Differentiated Product: The
Case of US Processed Cheese.” The Journal of Industrial Economics 55:32-48
Leibtag, E., A. Nakamura, E. Nakamura, and D. Zerom. 2007. “Cost Pass-Through in the

12
U.S. Coffee Industry.” Washington DC: U.S. Department of Agriculture, ERS 38,
month?.
Levin, A., C. Lin, and C. Chu. 2002. “Unit Root Tests in Panel Data: Asymptotic and
Finite Sample Properties.” Journal of Econometrics 108:1-24.
Nakamura, E. 2008. “Pass-through in Retail and Wholesale.” American Economic Review
98 (2): 430–437.
Nevo, A. 2001. “Measuring Market Power in the Ready-to-eat Cereal Industry.”
Econometrica 69:307-342.
Pesendorfer, M. 2002. “Retail Sales: A Study of Pricing Behavior in Supermarkets.” The
Journal of Business 75:33-66.
Rojas, A., A. Andino, and W.D. Purcell. 2008. “Retailers' Response to Wholesale Price
Changes: New Evidence from Scanner-Based Quantity-Weighted Beef Prices.”
Agribusiness 24:1–15.
Vukina, T. 2009? Poultry Market Data. Accessed: May 9, 2009. Available at:
http://www4.ncsu.edu/unity/lockers/users/v/vukina/extension/poultryMarketData.
htm.

13
Table 1. Data Sources
Name Description Source Frequency Min Max
Flour (index
number) Milled flour
PPI sub-series
311211311211 M 112.20 119.90
Feed (index
number) Chicken Feed
PPI sub-series
93111912 M 74.40 103.50
Wheat ($/bu) Cash CBOT W 2.54 4.22
Corn ($/bu) Cash CBOT W 1.80 3.30
NPI-Cereal
($/box)
Net price ready
to eat cereal
184 store scanner
data W 1.24 4.03
GPI-Cereal
($/box)
Gross price ready
to eat cereal
184 store scanner
data W 1.40 4.29
NPI-
Chicken($/lb)
Net price fresh
chicken
184 store scanner
data W .12 4.00
GPI-Chicken
( $/lb)
Gross price fresh
chicken
184 store scanner
data W .13 4.14
Note: All data is for 2003 to 2005. The PPI is the producer price index of the Bureau of
Labor Statistics. CBOT is the Chicago Board of Trade.

Table 2. Arellano-Bond Regressions for log(GPI) and log(NPI) for Cereal and Chicken
(1) (2) (3) (4) (5) (6) (7) (8)
Cereal Chicken
GPI NPI GPI NPI
Ln(y(t-1)) 0.728 0.684 0.298 0.288 0.374 0.368 0.117 0.108
(0.014)*** (0.014)*** (0.007)*** (0.007)*** (0.019)*** (0.019)*** (0.012)*** (0.012)***
Ln(Flour/PPI) 0.526 0.821
(0.020)*** (0.034)***
Ln(ChicFeed/PPI) 0.131 0.27
(0.011)*** (0.020)***
Ln(Wheat/PPI) 0.099 0.163
(0.005)*** (0.005)***
14

Ln(Corn/PPI) -0.037 -0.049 0.082 0.152
(0.003)*** (0.005)*** (0.010)*** (0.016)***
Ln(Gas/PPI) 0.057 0.048 -0.047 -0.057 -0.131 -0.142 -0.202 -0.222
(0.005)*** (0.005)*** (0.007)*** (0.006)*** (0.012)*** (0.012)*** (0.018)*** (0.018)***
Constant -0.838 -0.878 -3.01 -2.829 -3.152 -3.119 -4.753 -4.652
(0.049)*** (0.048)*** (0.053)*** (0.044)*** (0.101)*** (0.099)*** (0.108)*** (0.102)***
Observations 28152 28152 28152 28152 28149 28149 28149 28149
Store FE 184 184 184 184 184 184 184 184
Dependent variables are log(GPI) and log(NPI) for ?
Robust standard errors in parentheses
* significant at 10 percent; ** significant at 5 percent; *** significant
at 1 percent
15

All regressions include regional trends and month, holidays, strike and regional dummies
16

Table 3. Dynamic Multipliers for GPI and NPI.
(1) (2) (3) (4) (5) (6) (7) (8)
Cereal Chicken
GPI NPI GPI NPI
Ln(Flour/PPI) 1.665 1.153
(0.040)*** (0.044)***
Ln(ChicFeed/PPI) 0.207 0.303
(0.018)*** (0.022)***
Ln(Wheat/PPI) 0.364 0.232
(0.008)*** (0.006)***
Ln(Corn/PPI) -0.135 -0.070 0.131 0.172
17
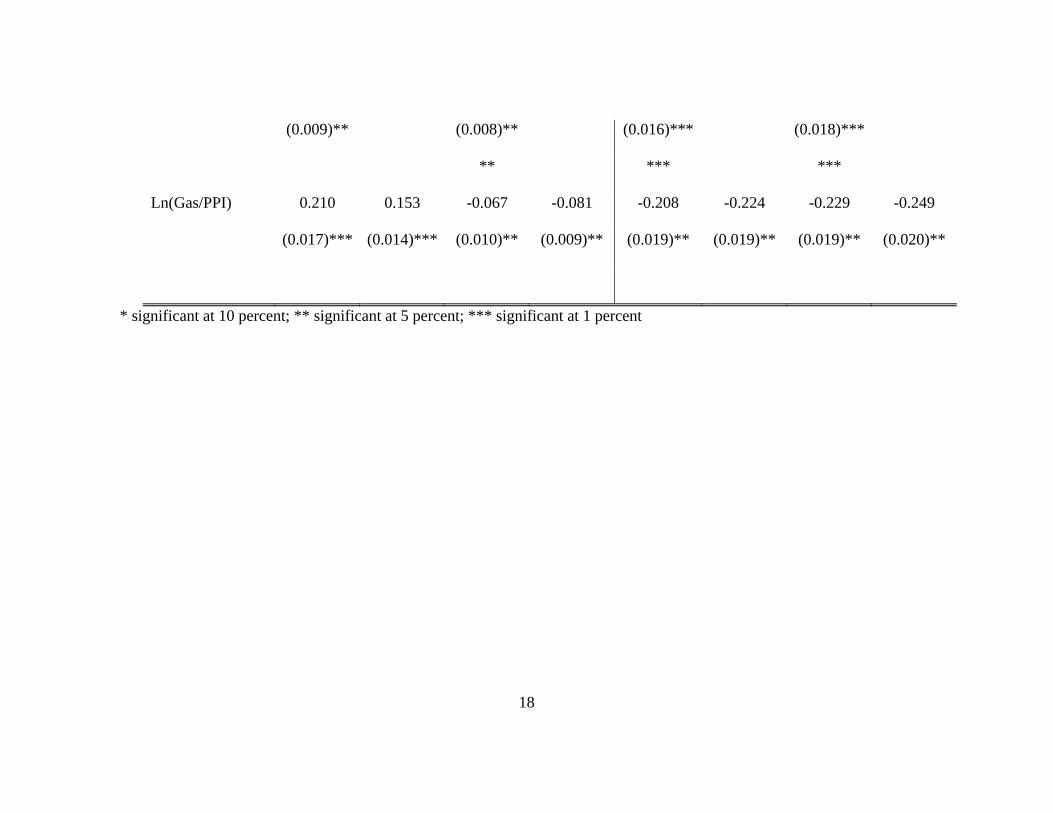
(0.009)** (0.008)** (0.016)*** (0.018)***
** *** ***
Ln(Gas/PPI) 0.210 0.153 -0.067 -0.081 -0.208 -0.224 -0.229 -0.249
(0.017)*** (0.014)*** (0.010)** (0.009)** (0.019)** (0.019)** (0.019)** (0.020)**
* significant at 10 percent; ** significant at 5 percent; *** significant at 1 percent
18

19
Table 4. Arellano-Bond Regressions for Cereal and Chicken Sale Frequency Index
(1) (2) (3) (4)
Cereal Chicken
Ln(y(t-1) 0.103 0.039 -0.195 -0.183
(0.020)*** (0.018)** (0.024)*** (0.023)***
Ln(Flour/PPI) 1.183
(0.100)***
Ln(ChicFeed/PPI) -1.528
(0.215)***
Ln(Wheat/PPI) 0.917
(0.031)***
Ln(Corn/PPI) -1.913 -0.241
(0.044)*** (-0.163)
Ln(Gas/PPI) -0.276 0.286 -0.446 -0.409
(0.020)*** (0.016)*** (0.101)*** (0.065)***
Observations 2775 2775 2775 2775

20
Store FE 184 184 184 184
Dependent variable: log(frequency)
Robust standard errors in parentheses
* significant at 10 percent; ** significant at 5 percent; *** significant at 1 percent
All regressions include regional trends and month, holidays, and strike and
regional dummies

21
Table 5. Dynamic Multipliers for the Frequency Index.
(1) (2) (3) (4)
Ln(Flour/PPI) 1.231
(0.094)***
Ln(ChicFeed/PPI) -1.292
(0.180)***
Ln(Wheat/PPI) 1.023
(0.044)***
Ln(Corn/PPI) -2.133 -0.202
(0.076)** (0.135)
Ln(Gas/PPI) -0.308 0.297 -0.373 -0.346
(0.027)** (0.013)*** (0.081)** (0.053)**
** significant at 5 percent; *** significant at 1 percent