Patterns of Genetic Diversity in Remaining Giant Panda Populations
12
Contributed Papers 1596 Conservation Biology, Pages 1596–1607 Volume 15, No. 6, December 2001 Patterns of Genetic Diversity in Remaining Giant Panda Populations ZHI LU,*† WARREN E. JOHNSON,* MARILYN MENOTTI-RAYMOND,* NAOYA YUHKI,* JANICE S. MARTENSON,* SUSAN MAINKA,‡ HUANG SHI-QIANG,§ ZHENG ZHIHE,** GUANGHAN LI,** WENSHI PAN,† XIARONG MAO,† AND STEPHEN J. O’BRIEN*†† *Laboratory of Genomic Diversity, National Cancer Institute, Frederick, MD 21702-1201, U.S.A. †Wildlife Research Center, Peking University, Beijing 100671, China ‡Species Survival Commission, Rue Mauverney 28 CH-1196, Gland, Switzerland §137 Xizhimenwai Street, Beijing Zoo, Beijing, 100044 **Chengdu Research Base of Giant Panda Breeding, Fu Tou Shan, Northern Suburb, Sichuan, China Abstract: The giant panda (Ailuropoda melanoleuca) is among the more familiar symbols of species conser- vation. The protection of giant panda populations has been aided recently by the establishment of more and better-managed reserves in existing panda habitat located in six mountain ranges in western China. These re- maining populations are becoming increasingly isolated from one another, however, leading to the concern that historic patterns of gene flow will be disrupted and that reduced population sizes will lead to diminished genetic variability. We analyzed four categories of molecular genetic markers (mtDNA restriction-fragment- length polymorphisms [RFLP], mtDNA control region sequences, nuclear multilocus DNA fingerprints, and mi- crosatellite size variation) in giant pandas from three mountain populations (Qionglai, Minshan, and Qin- ling) to assess current levels of genetic diversity and to detect evidence of historic population subdivisions. The three populations had moderate levels of genetic diversity compared with similarly studied carnivores for all four gene measures, with a slight but consistent reduction in variability apparent in the smaller Qinling population. That population also showed significant differentiation consistent with its isolation since historic times. From a strictly genetic perspective, the giant panda species and the three populations look promising insofar as they have retained a large amount of genetic diversity in each population, although evidence of re- cent population reduction—likely from habitat loss—is apparent. Ecological management to increase habi- tat, population expansion, and gene flow would seem an effective strategy to stabilize the decline of this en- dangered species. Patrones de Diversidad Genética en Poblaciones Remanentes de Panda Gigante Resumen: El panda gigante (Ailuropoda melanoleuca) es uno de los símbolos más familiares de la conser- vación de especies. La protección de poblaciones de panda gigante ha sido asistida recientemente con el es- tablecimiento de más reservas mejor administradas en los hábitats existentes en seis cadenas montañosas en el occidente de China. Sin embargo, estas poblaciones restantes se están aislando cada vez más, con ello crece la preocupación de que el flujo histórico de genes se alterará y que los reducidos tamaños poblacionales con- ducirán a una variabilidad genética disminuida. Analizamos cuatro categorías de marcadores genéticos mo- leculares ( polimorfismos de restricción de longitud de fragmentos (PRLF) de mtDNA, secuencias de control de regiones de mtDNA, huellas de DNA nuclear multilocus y variación del tamaño de microsatélites) en pan- das gigantes de poblaciones en tres cadenas montañosas (Qionglai, Minshan y Qinling) para evaluar los niveles de diversidad genética y para detectar la evidencia de subdivisiones de poblaciones históricas. Las tres poblaciones tuvieron niveles moderados de diversidad genética comparada con la de carnívoros estudiados similarmente para las cuatro medidas genéticas, con una ligera pero consistente reducción de variabilidad ††Address correspondence to S. J. O’Brien, email [email protected] Paper submitted March 9, 2000; revised manuscript accepted January 31, 2001.
-
Upload
independent -
Category
Documents
-
view
0 -
download
0
Transcript of Patterns of Genetic Diversity in Remaining Giant Panda Populations

Contributed Papers
1596
Conservation Biology, Pages 1596–1607Volume 15, No. 6, December 2001
Patterns of Genetic Diversity in RemainingGiant Panda Populations
ZHI LU,*† WARREN E. JOHNSON,* MARILYN MENOTTI-RAYMOND,*NAOYA YUHKI,* JANICE S. MARTENSON,* SUSAN MAINKA,‡ HUANG SHI-QIANG,§ ZHENG ZHIHE,** GUANGHAN LI,** WENSHI PAN,† XIARONG MAO,† AND STEPHEN J. O’BRIEN*††
*Laboratory of Genomic Diversity, National Cancer Institute, Frederick, MD 21702-1201, U.S.A.†Wildlife Research Center, Peking University, Beijing 100671, China‡Species Survival Commission, Rue Mauverney 28 CH-1196, Gland, Switzerland§137 Xizhimenwai Street, Beijing Zoo, Beijing, 100044**Chengdu Research Base of Giant Panda Breeding, Fu Tou Shan, Northern Suburb, Sichuan, China
Abstract:
The giant panda (
Ailuropoda melanoleuca
) is among the more familiar symbols of species conser-vation. The protection of giant panda populations has been aided recently by the establishment of more andbetter-managed reserves in existing panda habitat located in six mountain ranges in western China. These re-maining populations are becoming increasingly isolated from one another, however, leading to the concernthat historic patterns of gene flow will be disrupted and that reduced population sizes will lead to diminishedgenetic variability. We analyzed four categories of molecular genetic markers (mtDNA restriction-fragment-length polymorphisms [RFLP], mtDNA control region sequences, nuclear multilocus DNA fingerprints, and mi-crosatellite size variation) in giant pandas from three mountain populations (Qionglai, Minshan, and Qin-ling) to assess current levels of genetic diversity and to detect evidence of historic population subdivisions.The three populations had moderate levels of genetic diversity compared with similarly studied carnivores forall four gene measures, with a slight but consistent reduction in variability apparent in the smaller Qinlingpopulation. That population also showed significant differentiation consistent with its isolation since historictimes. From a strictly genetic perspective, the giant panda species and the three populations look promisinginsofar as they have retained a large amount of genetic diversity in each population, although evidence of re-cent population reduction—likely from habitat loss—is apparent. Ecological management to increase habi-tat, population expansion, and gene flow would seem an effective strategy to stabilize the decline of this en-dangered species.
Patrones de Diversidad Genética en Poblaciones Remanentes de Panda Gigante
Resumen:
El panda gigante (
Ailuropoda melanoleuca
) es uno de los símbolos más familiares de la conser-vación de especies. La protección de poblaciones de panda gigante ha sido asistida recientemente con el es-tablecimiento de más reservas mejor administradas en los hábitats existentes en seis cadenas montañosas enel occidente de China. Sin embargo, estas poblaciones restantes se están aislando cada vez más, con ello crecela preocupación de que el flujo histórico de genes se alterará y que los reducidos tamaños poblacionales con-ducirán a una variabilidad genética disminuida. Analizamos cuatro categorías de marcadores genéticos mo-leculares ( polimorfismos de restricción de longitud de fragmentos (PRLF) de mtDNA, secuencias de controlde regiones de mtDNA, huellas de DNA nuclear multilocus y variación del tamaño de microsatélites) en pan-das gigantes de poblaciones en tres cadenas montañosas (Qionglai, Minshan y Qinling) para evaluar losniveles de diversidad genética y para detectar la evidencia de subdivisiones de poblaciones históricas. Las trespoblaciones tuvieron niveles moderados de diversidad genética comparada con la de carnívoros estudiadossimilarmente para las cuatro medidas genéticas, con una ligera pero consistente reducción de variabilidad
††
Address correspondence to S. J. O’Brien, email [email protected] submitted March 9, 2000; revised manuscript accepted January 31, 2001.

Conservation BiologyVolume 15, No. 6, December 2001
Lu et al. Giant Panda Molecular Genetic Patterns
1597
Introduction
Giant pandas (
Ailuropoda melanoleuca
) are indigenousto the People’s Republic of China, where they are foundin regions of alpine forest on the edge of the Tibetan pla-teau. Populations originally extended throughout mostof southern and eastern China, northern Myanmar, andnorthern Vietnam, but habitat loss from deforestation dur-ing the eighteenth century rapidly reduced their numbersand distribution. Currently, giant pandas are restricted tosix forest fragments in the rugged mountain ranges of theeastern edge of the Tibetan plateau in the western Chi-nese provinces of Gansu, Shaanxi, and Sichuan (Fig. 1)(Schaller et al. 1985; MacKinnon et al. 1989; O’Brien et al.1994). Within these areas they survive only where there isbamboo, and thus are generally restricted to 1200–3400 min elevation in what is termed the southwestern Chinatemperate-forest ecoregion. Two surveys conducted in themiddle 1970s and 1980s suggested that at least 1100 giantpandas existed in the wild at the time (Schaller et al. 1985;Johnson et al. 1988; MacKinnon et al. 1989). One impor-tant conservation measure the Chinese government hastaken, with support from international communities, is toexpand the protected-area system. The number of giantpanda reserves has been increased from 13 in the late1980s to 33 in the late 1990s. Currently, over 60% of thegiant panda’s habitat and populations are under protec-tion (MacKinnon et al. 1989).
In spite of their status as a Chinese national treasureand international symbol of the conservation movement,relatively little is known about remaining panda popula-tions. Long-term fieldwork started in 1980 in the Wolongand Tangjiahe Reserves in Sichuan Province (Schaller et al.1985, 1989; Schaller 1986, 1993) and then in the QinlingMountains in Shaanxi Province in the mid-1980s (Panet al. 1988; Lu 1991, 1993; Lu et al. 1994; Pan 1995; Zhu1996; Zhu 1999; Pan & Lu 2001) provide important in-sights into the life history, population dynamics, socialbehavior, and habitat requirements of pandas. This re-search depicted populations that were increasingly threat-ened by timber harvest, poaching, and other humanpressures, resulting in gradual but deliberate habitat re-duction and isolation. Giant panda ranges have beenhalved in the last 25 years, and the majority of survivingwild populations, estimated at about 25, have fewer than
20 individuals ( Johnson et al. 1988; Schaller 1993; Mac-Kinnon et al. 1989). Such small populations are in acutedanger of extinction due to chance demographic factors(10–20% of these populations have disappeared sincethe 1970s) as well as inbreeding and its well-known con-sequences (O’Brien & Knight 1987; O’Brien 1994
a
,1994
b
; Frankham 1995; Saccheri et al. 1998; Soulé &Mills 1998). A preliminary report (Su et al. 1993) sug-gests that giant pandas may have reduced allozyme varia-tion relative to certain bear populations.
We employed four distinct molecular genetic tech-niques, two that assay genetic variation in the mitochon-drial genome and two that measure variation in thenuclear genome, to characterize the extent and differen-tiation of genetic diversity among individuals from threeisolated giant panda populations (Fig. 1). Qinling, thesmallest area (1135 km
2
) had an estimated 109–240 pan-das in 1980s (Pan et al. 1988), Minshan (6127 km
2
) had581 animals, and Qionglai (3355 km
2
) had 233 animals(MacKinnon et al. 1989).
The results of our analyses are relevant to the develop-ment of objective management plans for both captiveand wild panda populations (MacKinnon et al. 1989; Luet al., 2000). Because of the visibility and symbolic valueof pandas in China and abroad, their management hasbeen the subject of great interest and notoriety (Schalleret al. 1985; O’Brien & Knight, 1987; Schaller 1993; O’Brienet al. 1994) and will benefit greatly from a thorough analy-sis of the genetic structure of remaining populations.
Methods
Samples
Samples were collected from wild animals and from un-related wild-born, captive animals of known geographicorigin (Table 1; Fig. 1). Most samples came from individ-uals from three main populations from three mountainranges, Qinling (
n
�
14 ), Minshan (
n
�
7), and Qiong-lai (
n
�
15). Two additional samples collected from theXiangling and Liangshan Mountains were consideredpart of the Qionglai population for analyses. The Qinlinganimals derive from a study group from two adjacent val-leys that may be related genetically (Lu 1991). GenomicDNA was extracted from frozen leukocytes, primary fi-
aparente en la población más pequeña de Qinling. Esa población también mostró diferenciación significa-tiva consistente con su aislamiento desde tiempos históricos. Desde una perspectiva estrictamente genética, laespecie de panda gigante y las tres poblaciones parecen seguras hasta ahora ya que han retenido una grandiversidad genética en cada población, aunque la evidencia de la reducción poblacional reciente, por pér-dida de hábitat, es notable. Así, el manejo ecológico para incrementar el hábitat, la expansión de la po-blación y el flujo de genes parecería una estrategia efectiva para estabilizar la declinación de esta especie en
peligro de extinción.

1598
Giant Panda Molecular Genetic Patterns Lu et al.
Conservation BiologyVolume 15, No. 6, December 2001
broblast cultures from skin biopsies (Sambrook et al.1989), hair samples (Higuchi et al. 1988), or sperm(Camper et al. 1984).
Mitochondrial DNA variation
Mitochondrial DNA variation was assayed with two tech-niques. First, we measured mtDNA restriction-fragment-length-polymorphism (RFLP) variation in 19 animals fromthe three populations (Qionglai, Minshan, Qinling). Ge-nomic DNA (1
�
g) from each animal was digested sepa-rately with 28 restriction enzymes (monomorphic restric-tion enzymes: ACCI, APAI, AVAI, AVAII, BAMHI, BCLI,BSTEI, BSTUI, MLUI, DRAI, ECORI, ECORV, HINDIII,KPNI, NCOI, NDEI, PSTI, SMAI, SSTI, SSTII, STUI, XBAI,XHOI; Polymorphic restriction enzymes: CLAI, PVUII,HPAI, STYI, HINCII ), separated by electrophoresis in 1%agarose gels, and transferred to nylon filters (UV Dur-alon; Stratagene) by Southern blotting. The DNA frag-ments on the membrane were hybridized with a [
32
P]dCTP–labeled molecular clone of feline mtDNA (Lopez etal. 1994). The mtDNA variation was described by estimat-
ing
pi
,
d
xy
, and
d
a
with the computer program MAXLINK(Nei & Tajima 1983). Nucleotide diversity,
pi
, measuresthe probability that two randomly selected sequencesfrom two individuals within a population will have differ-ent nucleotides at a given position (Nei & Li 1979; Nei1987). The average nucleotide diversity between popula-tions,
d
xy
, is the probability that two randomly selectedsequences from two populations will not share the samesites (Nei & Li 1979). The net nucleotide diversity be-tween two populations,
d
a
, discounts the intrapopulationvariation and was calculated as:
d
a
�
d
xy
�
(
p
x
�
p
y
)/2.We also measured mtDNA variation by sequencing a
268-bp fragment of the control region with 36 pandasfrom three populations. Nucleotide sequences were ob-tained by polymerase chain reaction (PCR) amplificationthrough control region universal primers (Kocher et al.1989). Thirty cycles of PCR were performed in a pro-grammable heat block (ABI-Perkin-Elmer 9700 Ther-mal Cycler). Each cycle had 1-minute denaturation at92
�
C, 1-minute annealing at 48
�
C, and 1-minute exten-sion at 72
�
C. Reactions (100
�
L) were prepared with10 ng genomic DNA in 10 mM Tris-HCl of pH 8.3, 1.5 mM
Figure 1. The geographic relation-ship among giant panda popula-tions sampled for this study. The frequency distribution of mito-chrondrial DNA restriction-frag-ment-length polymorphisms (RFLP) and control-region (CR) haplotypes, defined in Tables 3 and 4 respectively, are specified by letters in pie charts.

Conservation BiologyVolume 15, No. 6, December 2001
Lu et al. Giant Panda Molecular Genetic Patterns
1599
Tabl
e 1.
The
Ame
refe
renc
e nu
mbe
r, s
ex, n
ame,
stu
dboo
k nu
mbe
r, g
eogr
aphi
c or
igin
, sou
rce
of a
nim
al a
t tim
e of
sam
ple
colle
ctio
n, a
nd s
umm
ary
of m
tDNA
res
tric
tion-
frag
men
t-le
ngth
-po
lym
orph
ism
var
iatio
n (R
FLP)
and
con
trol
-reg
ion
(CR)
hap
loty
pe, D
NA fi
nger
prin
t, an
d nu
mbe
r of
mic
rosa
telli
tes
geno
type
d fo
r th
e gi
ant p
anda
s an
alyz
ed in
this
stu
dy.
a
Popu
lati
on
b
Am
e n
o.
Sex
Na
me
Stu
d n
o.
Ori
gin
al lo
cati
on
(mt. r
an
ge)
b
Sou
rce
mtD
NA
h
aplo
types
Mic
rosa
tellit
e
RFL
PC
RD
NA
–FP
no. l
oci
Cap
tive
Min
shan
Min
5F
Min
g M
ing
214
Pin
gwu
(m
in)
Lon
do
n Z
oo
A17
Min
12F
Nan
Nan
271
Nan
pin
g (m
in)
Wo
lon
gC
B18
Min
48F
Tan
g T
ang
309
Tan
gjia
he
(min
)W
olo
ng
A18
Min
49M
Zh
en Z
hen
306
Nan
pin
g (m
in)
Wo
lon
gA
18M
in50
FK
ang
Kan
g35
2P
ingw
u (
min
)W
olo
ng
I18
Min
74M
Lin
Nan
298
Bai
shu
ijian
g (m
in)
Ch
engd
u Z
oo
A18
Min
78F
Nan
Nan
180
Nan
pin
g (m
in)
Ch
on
gqin
g Z
oo
O18
Qio
ngl
aiQ
io1
FLi
ng
Lin
g11
2B
aox
ing
(qio
)N
atio
nal
Zo
olo
gica
l Par
k, U
.S.A
.A
LX
16Q
io2
MH
sin
g H
sin
g12
1B
aox
ing
(qio
)N
atio
nal
Zo
olo
gica
l Par
k, U
.S.A
.B
JX
16Q
io4
MC
hia
Ch
ia14
1B
aox
ing
(qio
)M
exic
o Z
oo
CE
X18
Qio
11M
Shan
Sh
an22
1Sa
njin
ag (
qio
)W
olo
ng
CB
X18
Qio
13M
Le L
e30
5B
aox
ing
(qio
)W
olo
ng
BJ
X18
Qio
14F
Ch
ing
Ch
ing
222
Bao
xin
g (q
io)
Wo
lon
gC
BX
18Q
io15
?Q
ion
glai
Mex
ico
Zo
oD
Xia
18M
Pe
Pe
167
Yu
exi (
xia
)M
exic
o Z
oo
AN
16Q
io41
FC
hu
n C
hu
n38
0W
olo
ng
(qio
)W
olo
ng
CQ
io42
MZ
hen
g H
e37
6W
ench
uan
(q
io)
Wo
lon
gA
16Q
io43
MSh
i Sh
i38
1W
ench
uan
(q
io)
Wo
lon
gJ
18Q
io44
MX
in X
ing
329
Bao
xin
g (q
io)
Wo
lon
gJ
18Q
io45
MP
an P
an30
8B
aox
ing
(qio
)W
olo
ng
J18
Xia
53F
Jia
Si36
5Eb
ian
(lia
)W
olo
ng
N18
Qio
75M
Ch
uan
Ch
uan
202
Bao
xin
g (q
io)
Ch
on
gqin
g Z
oo
J18
Qio
81M
Xia
op
ingp
ing
342
Lush
an (
qio
)C
hen
gdu
Zo
oA
18Q
io92
MB
ao B
ao15
0B
aox
ing
(qio
)B
eijin
g Z
oo
7W
ild li
vin
gQ
inlin
gQ
in22
M12
90H
uay
ang
(qin
)Q
ingl
ing
EM
X18
Qin
24F
Jiao
Jia
oH
uay
ang
(qin
)Q
ingl
ing
EF
18Q
in25
MD
abai
Hu
ayan
g (q
in)
Qin
glin
gE
HX
18Q
in26
FR
uix
ue
Hu
ayan
g (q
in)
Qin
glin
gE
MX
18Q
in27
FM
o M
oH
uay
ang
(qin
)Q
ingl
ing
CI
X18
Qin
28M
Pro
fess
or
Hu
ayan
g (q
in)
Qin
glin
gC
IX
18Q
in29
MO
ldm
an-s
hu
iH
uay
ang
(qin
)Q
ingl
ing
EG
X18
Qin
30M
94H
uay
ang
(qin
)Q
ingl
ing
EH
X18
Qin
31M
Dah
uo
Hu
ayan
g (q
in)
Qin
glin
gE
KX
18Q
in32
MX
iao
hu
oH
uay
ang
(qin
)Q
ingl
ing
QX
18Q
in33
MX
inx
ing
Hu
ayan
g (q
in)
Qin
glin
gN
X18
Qin
34F
Nu
xia
Hu
ayan
g (q
in)
Qin
glin
gC
IX
18Q
in36
FFa
ng
Fan
gFo
pin
g (q
in)
Qin
glin
gP
X18
Qin
39M
Das
hu
nH
uay
ang
(qin
)Q
ingl
ing
D18
a
All a
nim
als
exc
ept
qio
15
wer
e w
ild-b
orn
. Qin
lin
g a
nim
als
wer
e fr
ee r
an
gin
g; t
he
rest
wer
e ca
pti
ve i
ndiv
idu
als
fro
m z
oos
or
Wolo
ng
Bre
edin
g C
ente
r.
b
Abbre
via
tion
s: m
in, M
insh
an
; qio
, Qio
ngl
ai; q
in, Q
inli
ng;
xia
, Xia
ngl
ing;
lia
, Lia
ngs
ha
n.

1600
Giant Panda Molecular Genetic Patterns Lu et al.
Conservation BiologyVolume 15, No. 6, December 2001
MgCl
2
, 200
�
M dNTP, 2.5 units
Thermus aquaticus
DNApolymerase. Reaction products were resuspended in 2 mLof dH
2
O and concentrated with Centricon 100 microcon-centrators. Products were sequenced in both forward andreverse directions with a Dye Terminator Prism sequenc-ing kit and an ABI 373A automated DNA sequencer (Ap-plied Biosystems, Inc.), and consensus sequences of for-ward and reverse sequences were determined. Alignmentsof the sequences were obtained by the algorithm of Needle-man and Wunsch (1970) with the PILEUP program of theGenetics Computer Group computer package version 8 andwere visually confirmed. Sequences were deposited in Gen-Bank (accession numbers AF 363507–363524).
Phylogenetic trees were constructed from the sequencedata through three methods as implemented in the PAUP*computer program (Swofford 1999). The minimum-evolu-tion tree was estimated by the neighbor-joining (NJ) algo-rithm (Saitou & Nei 1987) through a distance matrix ofKimura’s two-parameter distances (Kimura 1980) and ageneral heuristic search with tree-bisection-reconnec-tion branch swapping. The maximum parsimony (MP)tree was estimated with a general heuristic search throughsimple-sequence addition of sequences and tree-bisection-reconnection branch swapping. The maximum-likelihood(ML) tree was generated according to the HKY or F84model with a starting tree from the ME analysis, empiricallyderived nucleotide frequencies, and default values for tran-sition/transversion ratios and the shape parameter of thegamma distribution of among-site rate heterogeneity (Neiet al. 1996). Successive ML trees incorporating new esti-mates of these parameters were obtained iteratively untilan optimal tree was derived consistently. Bootstrap resa-mpling (100 iterations) was done with the minimumevolution and maximum parsimony analyses to test thereliability of the data to derive consistent topologies.Minimum Spanning Networks (Excoffier & Smouse 1994)were constructed with Arlequin version 2.000 (Schneideret al. 2000) to depict phylogenetic, geographic, and poten-tial ancestor-descendant relationships among sequences.
Nuclear Genetic Variation
Multilocus DNA fingerprinting was used on a subset of gi-ant pandas to describe diversity in the nuclear genome.The DNA (6
�
g) of 6 giant pandas from Qionglai and 12from Qinling was digested with HINFI and HAEIII, sepa-rated by electrophoresis in 1% agarose gels, transferred tonylon filters, and hybridized to the [
32
P] dCTP–labeled fe-line-specific minisatellite probes FCZ8 and FCZ9 (Gilbertet al. 1990, 1991). Average number of bands, number ofmonomorphic loci, heterozygosity (H
e
), average percent-age difference (APD), and mean average percent differ-ence (MAPD) were estimated as by Stephens et al. (1992).
Eighteen microsatellite loci were identified from asmall insert library of giant panda genomic DNA, whichwe screened with radiolabeled oligonucleotide probes
using wash conditions for hybridization filters and se-quencing of recombinant clones as described by Diet-rich et al. (1992) and Menotti-Raymond et al. (1997).Primer pairs were designed in unique sequence flankingthe microsatellite for a
T
m
of 60
�
C through the programPRIMER (version 0.5; Lincoln, Daly, Lander, and White-head Institute for Biomedical Research, Cambridge, Mas-sachusetts) (Table 2). The PCR amplifications of individ-ual microsatellite loci were performed in 10-
�
L reactionvolumes containing 1
�
Perkin Elmer PCR buffer (10 mMTris-hydrochloric acid of pH 8.3, 50 mM potassium chlo-ride), 2 mM MgCl
2
, 250
�
M each of the four deoxyribo-nucleoside 5
�
-triphosphates (dATP, dCTP, dGTP, dTTP)(Pharmacia), 0.4 unit AmpliTaq or AmpliTaq Gold DNApolymerase (Perkin-Elmer Cetus), 4.0 picomoles each offorward and reverse primer (Life Technologies and PEApplied Biosystems, Inc.), bovine serum albumin at 0.16mg/mL final concentration (Sigma A-3294) and 50 ng ofDNA. The AmpliTaq Gold DNA polymerase was used inthe amplification of Ame-
�
21, Ame-
�
24, Ame-
�
27, andAme-
�
28A. One member of each primer pair was labeledwith a fluorescent dye, phosphoramidite. Of 18 microsat-ellite loci utilized in the study (Table 2), one had a com-pound repeat motif (Ame-
�
22), three had a complex re-peat motif (Ame-
�
26, Ame-
�
28B, and Ame-
�
70), and allwere CA dinucleotide repeats except Ame-
�
70, which hada GATA tetranucleotide repeat. The Ame-
�
28A and 28Bwere isolated together and are separated by several hun-dred bp.
The PCR amplification was performed in a Perkin ElmerModel 9600 Thermocycler for 1 cycle of 3 minutes at93
�
C; 10 cycles at 94
�
C for 15 seconds, 55
�
C for 1 sec-ond, 72
�
C for 30 seconds; 20 cycles at 89
�
C for 15 sec-onds, 55
�
C for 15 seconds, 72
�
C for 30 seconds; and 1cycle of 72
�
C for 10 minutes. The PCR products werediluted 1:10 with sterile deionized water, and 2
�
L of di-luted product were mixed with 4
�
L of a gel-loadingbuffer/standard mixture composed of 6:1:1 ratio of for-mamide (Sigma), ABI PRISM GeneScan-350 Tamra inter-nal lane standard, and ABI GeneScan loading buffer, re-spectively. Samples were denatured 3 minutes at 94
�
Cand placed on ice. Two microliters of sample were loadedper lane and electrophoresed in 6% denaturing polyacry-lamide gels in an ABI Model 373A Automated DNA Se-quencer Apparatus for 3.5 hours at 2500 V, 40mA, and25W. Allele sizes were estimated with ABI GeneScan (ver-sion 1.2.2–1) and Genotyper (version 1.1) software pack-ages, and the Local Southern method (Elder & Southern1987) was used to generate a best-fit curve from the sizestandards electrophoresed in each lane.
For each of the three main populations and each mic-rosatellite locus, the homogeneity of allele distribution,occurrence of private or unique alleles, and estimatedobserved and expected heterozygosity were determinedwith the computer program MICROSAT ( Minch et al.1997). Departure from Hardy-Weinberg expectations

Conservation BiologyVolume 15, No. 6, December 2001
Lu et al. Giant Panda Molecular Genetic Patterns
1601
and estimates of population subdivision (
F
ST
) and num-ber of migrants per generation (
Nm
) were determinedwith the program ARLEQUIN, version 2.0 (Schneider etal. 2000). Phylogenetic trees were constructed accordingto the NJ algorithm as implemented in PHYLIP (Version3.5; Felsenstein 1993), with 100 bootstrap iterationsfrom the microsatellite data from distance matrices es-timated through kinship coefficients (Bowcock et al.1994) and the proportion of shared alleles (Bowcock
et al. 1994), as implemented in the computer programMICROSAT (Minch et al. 1997).
Results
Two measures of mtDNA variation were examined insamplings of three panda populations: mtDNA-RFLP andDNA sequence variation of 268 bp from the mtDNA
Table 3. Patterns of mtDNA restriction-fragment-length-site polymorphisms (RFLP) in three giant panda populations.*
RFLP Ame CLAI PVUII HPAI STYI HINCII HINCII HINCII HINCII Populations (n)
A
� � � � � � � �
Minshan (1), Qionglai (2)B
� � � � � � � �
Qionglai (2)C
� � � � � � � �
Qionglai (3), Qinling (3)D
� � � � � � � �
Qionglai (1)E
� � � � � � � �
Qinling (7)
*
Plus sign denotes presence and minus sign denotes absence of restriction site.
Table 2. Molecular characterization, primer sequences for PCR amplification, and expected product size of panda microsatellite loci.
Name Repeat motif
a
Primer sequence
b
Product sizes Heterozygosity
Ame-�5 (CA)15†
CCCCGAGTTGCTGAGTTTTATTTCTTCCTGCTCACACAAGG
131–157 0.42
Ame-�10 (CA)16†
ACCGTGCTCTTAATCCCCTTCCCATGCTTATGAGAAACAGG
138–160 0.61
Ame-�11 (CA)12 † TATGCCACCTGCCCAGACGATGGAAAGAGTAGAGCCAAGG
228–236 0.44
Ame-�13 (CA)18†
GGAAGCATTAAGGAAAACATGCAATGATGACCATTTCAAACGC
142–171 0.51
Ame-�14 (CA)17†
CCACCCAGGCACATCTATCTTTTACTGTGGTGGAAGTTAGGG
139–147 0.54
Ame-�15 (CA)13 † AAGCAGTTGTTTTTGCTTAGTGTGTCAAAGTATTTGCCTCACA
122–130 0.09
Ame-�16 (CA)20 † CCCACTGCGGAAACAATAATATCTCATTCTTTTTTGTGGCTG
132–143 0.38
Ame-�19 (CA)18 † CAGGCAGCACAGCTATACCACCACCTGATACCTATGCACAT
154–162 0.33
Ame-�21 (CA)18 † TATGAAAAGAGCCCAAATGTCATAGCTCCATCCACGTTGTTG
156–174 0.66
Ame-�22 (CA)11*†
AGGAAACATGTTGCCTTTTCAAGAGGGCAAATAGGAGGGAA
127–129 0.27
Ame-�23 (CA)18 † TGAGCCAAAAGTAAAAGGCTGTTTGTGGACCTGTTATTCCTTG
138–152 0.56
Ame-�24 (CA)15†
ATGCATGACATTTTGGGTAGCTGAAGACCCTAGATGAAGGCA
248–258 0.35
Ame-�25 (CA)22†
CATAATTCCCTGGCAATGCTTAGCCCGCATTGAAAAATG
219–237 0.49
Ame-�26 (CA)CMPLX**†
TTTTCAGGCCTCCGAAAACATTCCCAATAAAGCAAATCAGA
114–120 0.46
Ame-�27 (CA)12 † TTGAAGAAGAAGGAACATTCCCTTTTGCAACTATGTCCCTCAGG
132–150 0.29
Ame-�28A** (CA)12†
CGATTAGTCGTCAGCACTCTGAAGGGTAACTGCAGGTGGG
118–132 0.32
Ame-�28B** (CA)CMPLX**†
CCAGCATCTGGTCTGAGTGACCACCTGCAGTTACCCTTGT
169–183 0.36
Ame-�70 (GATA)CMPLX**†
TGATGCCGTAAAAACTGCAATTTAACTCTTCTGTAGTATTCC
182–284 0.66
aCompound nucleotide repeat motifs are marked with one asterisk and complex motifs with two asterisks.bLabeled primers are marked with a dagger.

1602 Giant Panda Molecular Genetic Patterns Lu et al.
Conservation BiologyVolume 15, No. 6, December 2001
control region. The RFLP analysis with 28 enzymes re-vealed five polymorphic restriction enzymes (CLAI,PVUII, HPAI, STYI, and HINCII ) specifying eight vari-able sites distributed into five haplotypes (Table 3; Fig.1). Haplotype E was restricted to Qinling; A, B, and Dwere restricted to Qionglai; and C was found in eachpopulation analysis. Qionglai had the largest number ofhaplotypes at four, compared with two in Qinling. Over-all, the estimate of nucleotide diversity () for the com-bined panda populations was 0.22. The phylogenetic re-lationship was star-like (not shown), and the differencesbetween different haplotypes ranged from three to fivemutational steps (Table 3).
Aligned sequences from the control region of 36pandas (14 from Qinling, 7 from Minshan, and 15 fromQionglai) revealed 17 distinct haplotypes (A–Q) that dif-fered from each other by 1–9 bp (0.4–3.3%) (Table 4).There were 16 variable sites with two insertion/dele-tions sites. We analyzed the sequences using three phy-logenetic approaches (minimum evolution/neighbor join-ing, maximum parsimony, and maximum likelihood) anda minimum-spanning network (Fig. 2). The phylogeneticsignal was not strong, however, and there was no strik-ing correspondence of control-region haplotype withgeographic origin. The absence of phylogenetic cluster-ing of both mtDNA–RFLP and control region sequenceprobably reflects the occurrence of gene flow betweenthe populations until rather recently, because no geo-graphic differentiation is apparent.
Nuclear minisatellite loci revealed a moderate level ofvariation in a small sampling of giant pandas from theQionglai (He � 35.8%; n � 6) and Qinling (He � 34.5; n �12) populations (Table 5), which is much higher, for ex-
ample, than comparable estimates based on the sameprobes from the genetically uniform Gir forest lion (He �2.9%; Gilbert et al. 1991), Florida panther (He � 10.5%;Roelke et al. 1993), or island fox (He � 0.4%; Gilbert etal. 1990). Giant pandas more closely resemble DNA fin-gerprint heterozygosities observed in outbred lions (He �49.1%) or African cheetah (Acinonyx jubatus) popula-tions (He � 43.4%) that have reconstituted DNA–fin-gerprint variations over a 10,000-year interval since theirlast extreme population bottleneck (Stephens et al.1992; Menotti-Raymond & O’Brien 1993). There was asuggestion of higher diversity in Qionglai (He � 30.1–41.4%, MAPD � 38.3%) than in Qinling (He � 26.3–46.5%, MAPD � 31.5%), paralleling the slight reductionin mtDNA haplotype counts between the two popula-tions (Table 5).
To extend the phylogenetic and quantitative popula-tion-diversity assessment, we developed and character-ized 18 microsatellite loci specific to the giant panda inthe three populations (Table 2). Each population dis-played moderate to high microsatellite variation com-pared with other species. Average heterozygosity rangedfrom 49% to 58% in the three populations, with a total of106 alleles observed across the 18 loci (Table 5). Therewere multiple population-specific signature alleles ineach population, which lead to a mean of 1.7–4.0 signa-ture alleles retained in the composite microsatellite ge-notype of any individual (Table 5). Qinling and Qionglaihad nearly twice as many signature alleles as Minshan ineach population. The allele-size expansion, termed mic-rosatellite variance (a measure of the breadth of allele-size range for a polymorphic microsatellite locus), wasappreciable in each population (Table 5) (Goldstein &
Table 4. Patterns of mtDNA control-region (CR) haplotypes in three giant panda populations.
Variable nucleotide site
mtDNA–CR haplotype14
31
34
54
66
111
133
135
152
161
176
228
238
244
245
254 Population (n)
A A T A C C C A C — — C C G T C A Minshan (4), Qionglai(2)B A T T C C C A C — — C C G T C A Minshan (1), Qionglai(2)C A T A C C C A C — — C C C T C A Qionglai(1)D A T A C T C A C — — C T G T C A Qinling (1)E A T C T C C A C — — C C G T C T Qionglai(1)F A T A C T C G C — — C C G C C A Qinling (1)G A T T C T C G C — C C C G T C A Qinling (1)H A T A C T C G C — C C C G T C A Qinling (2)I A T A C C C A C — C C C G T C A Minshan (1), Qinling (3)J A T A C T T A C — C C C G T C A Qionglai(6)K A T A C T C A C — C C C G T C A Qinling (1)L C T A C T C A C — C C C G T C A Qionglai(1)M A T A C T C G G — C G C G T C A Qinling (2)N A T A C T C A C C C C C G T C A Qionglai(2), Qinling (1)O A T A C C C A C C C C C G T C A Minshan (1)P A T A C T T A C C C C C G T C A Qinling (1)Q A C T C T C A C C C C C G C G A Qinling (1)
Conservation BiologyVolume 15, No. 6, December 2001
Lu et al. Giant Panda Molecular Genetic Patterns 1603
Figure 2. Phylogenetic relationships among mtDNA control-region-sequence haplotypes. (a) Minimum evolution tree constructed by means of a Kimura 2-parameter distance matrix and the neighbor-joining algorithm; one of the six best trees found in a heuristic search. Nodes with bootstrap percentages above 40%
are listed. Nodes supported by maximum likelihood analyses are labeled with an asterisk. (b) Minimum-spanning network with length of connecting lines pro-portional to the number of steps between haplotypes, and with haplotypes ( filled circles) indicating the indi-viduals and population bearing each haplotype. Indi-viduals are coded by their affiliation with one of five populations; Min, Minshan; Qin, Qinling; Qio, Qiong- lai; Xia, Xiangling; Lia, Liangshan.
Pollock 1997). This observation is consistent with thesupposition of panmixia in recent times for each popula-tion and for pandas as a whole. All microsatellite lociconformed to Hardy-Wienberg equilibrium.
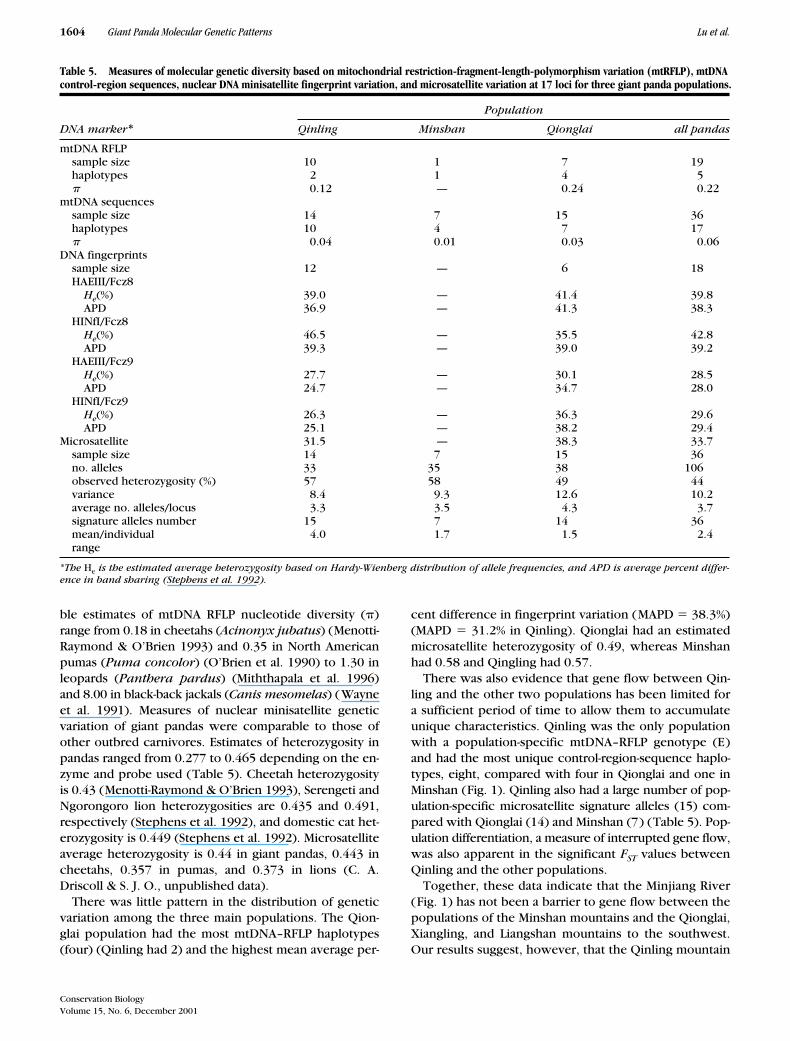
The relationships among individual giant pandas wereexamined in a phylogenetic analysis of composite micro-satellite genotypes of 36 individuals (selected from eachpopulation and excluding known relatives). Minimumevolution topologies were estimated by the neighbor-join-ing algorithm based on two genetic-distance measures,percent allele sharing (Dps) and mean kinship (Dkf),which were previously determined applicable to closelyrelated populations (Goldstein et al. 1995; C. A. Driscoll& S. J. O., unpublished data). These phylogenetic treesrecapitulated geographic origins with only a few excep-tions (Fig. 3), although the statistical bootstrap supportfor the major nodes was low (20% between Qinling indi-viduals and the others). The Qinling individuals clusteredtogether without exceptions. The Qionglai and Minshanpopulations were intermingled and the individual speci-mens from Lingshan and Xiangling were clustered withthe Qionglai individuals.
The apparent population differentiation indicated by thephylogeographic microsatellite analysis (Fig. 3) was alsoapparent in the FST estimates, which indicated signifi-cant differentiation between Qinling and Qionglai (FST �0.18; p 0.05) and between Qinling and Minshan (FST �0.18; p 0.05), but not between Minshan and Qionglai(FST � 0.07; p � 0.05). These measures imply that Qin-ling has experienced moderate geographic isolation, asrevealed by the microsatellites but not by the mtDNA re-sult. Gene flow has occurred until recently among thetwo southern populations (Fig. 1), however, becausethere was no robust geographic substructure betweenthem by any measure (Figs. 1–3).
Discussion
Results of the analyses of genetic variation in pandas basedon four different kinds of molecular genetic markersprovided insights into the recent evolutionary history ofremaining populations. The mtDNA RFLP variation in gi-ant pandas ( � 0.22) was moderate to low comparedwith other outbred carnivores. For example, compara-
1604 Giant Panda Molecular Genetic Patterns Lu et al.
Conservation BiologyVolume 15, No. 6, December 2001
ble estimates of mtDNA RFLP nucleotide diversity ()range from 0.18 in cheetahs (Acinonyx jubatus) (Menotti-Raymond & O’Brien 1993) and 0.35 in North Americanpumas (Puma concolor) (O’Brien et al. 1990) to 1.30 inleopards (Panthera pardus) (Miththapala et al. 1996)and 8.00 in black-back jackals (Canis mesomelas) (Wayneet al. 1991). Measures of nuclear minisatellite geneticvariation of giant pandas were comparable to those ofother outbred carnivores. Estimates of heterozygosity inpandas ranged from 0.277 to 0.465 depending on the en-zyme and probe used (Table 5). Cheetah heterozygosityis 0.43 (Menotti-Raymond & O’Brien 1993), Serengeti andNgorongoro lion heterozygosities are 0.435 and 0.491,respectively (Stephens et al. 1992), and domestic cat het-erozygosity is 0.449 (Stephens et al. 1992). Microsatelliteaverage heterozygosity is 0.44 in giant pandas, 0.443 incheetahs, 0.357 in pumas, and 0.373 in lions (C. A.Driscoll & S. J. O., unpublished data).
There was little pattern in the distribution of geneticvariation among the three main populations. The Qion-glai population had the most mtDNA–RFLP haplotypes(four) (Qinling had 2) and the highest mean average per-
cent difference in fingerprint variation (MAPD � 38.3%)(MAPD � 31.2% in Qinling). Qionglai had an estimatedmicrosatellite heterozygosity of 0.49, whereas Minshanhad 0.58 and Qingling had 0.57.
There was also evidence that gene flow between Qin-ling and the other two populations has been limited fora sufficient period of time to allow them to accumulateunique characteristics. Qinling was the only populationwith a population-specific mtDNA–RFLP genotype (E)and had the most unique control-region-sequence haplo-types, eight, compared with four in Qionglai and one inMinshan (Fig. 1). Qinling also had a large number of pop-ulation-specific microsatellite signature alleles (15) com-pared with Qionglai (14) and Minshan (7) (Table 5). Pop-ulation differentiation, a measure of interrupted gene flow,was also apparent in the significant FST values betweenQinling and the other populations.
Together, these data indicate that the Minjiang River(Fig. 1) has not been a barrier to gene flow between thepopulations of the Minshan mountains and the Qionglai,Xiangling, and Liangshan mountains to the southwest.Our results suggest, however, that the Qinling mountain
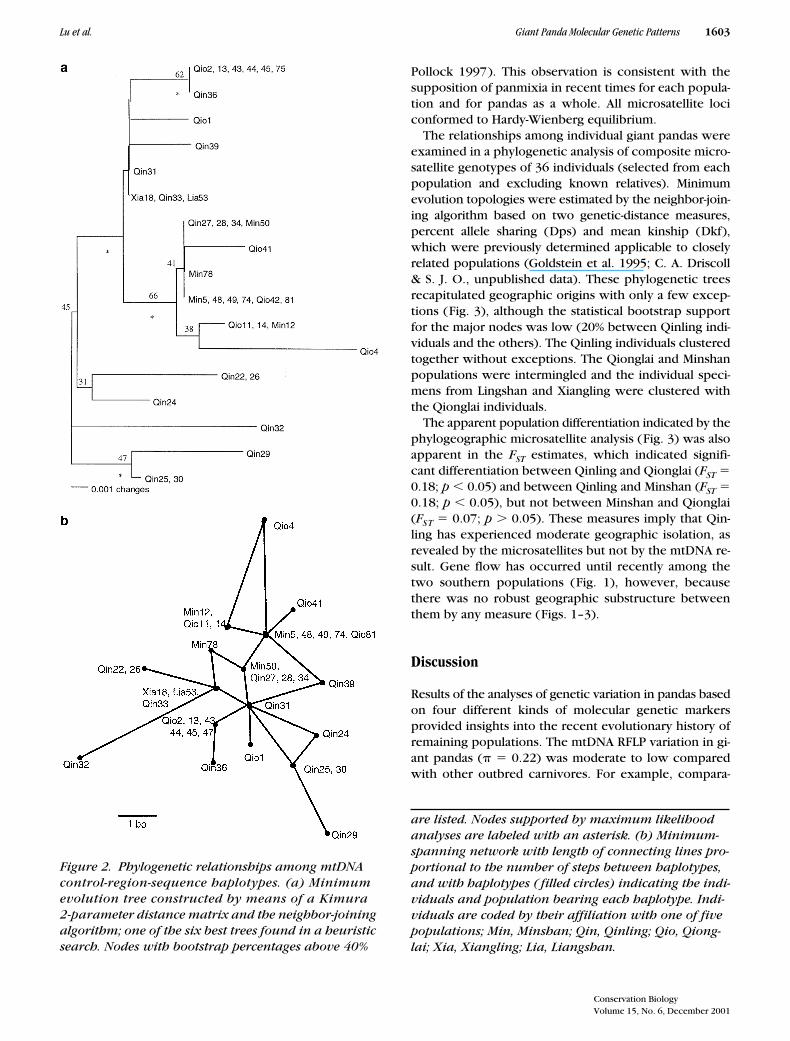
Table 5. Measures of molecular genetic diversity based on mitochondrial restriction-fragment-length-polymorphism variation (mtRFLP), mtDNA control-region sequences, nuclear DNA minisatellite fingerprint variation, and microsatellite variation at 17 loci for three giant panda populations.
DNA marker*
Population
Qinling Minshan Qionglai all pandas
mtDNA RFLPsample size 10 1 7 19haplotypes 2 1 4 5 0.12 — 0.24 0.22
mtDNA sequencessample size 14 7 15 36haplotypes 10 4 7 17 0.04 0.01 0.03 0.06
DNA fingerprintssample size 12 — 6 18HAEIII/Fcz8
He(%) 39.0 — 41.4 39.8APD 36.9 — 41.3 38.3
HINfI/Fcz8He(%) 46.5 — 35.5 42.8APD 39.3 — 39.0 39.2
HAEIII/Fcz9He(%) 27.7 — 30.1 28.5APD 24.7 — 34.7 28.0
HINfI/Fcz9He(%) 26.3 — 36.3 29.6APD 25.1 — 38.2 29.4
Microsatellite 31.5 — 38.3 33.7sample size 14 7 15 36no. alleles 33 35 38 106observed heterozygosity (%) 57 58 49 44variance 8.4 9.3 12.6 10.2average no. alleles/locus 3.3 3.5 4.3 3.7signature alleles number 15 7 14 36mean/individual 4.0 1.7 1.5 2.4 range
*The He is the estimated average heterozygosity based on Hardy-Wienberg distribution of allele frequencies, and APD is average percent differ-ence in band sharing (Stephens et al. 1992).

Conservation BiologyVolume 15, No. 6, December 2001
Lu et al. Giant Panda Molecular Genetic Patterns 1605
population became isolated from the other populationsin the recent past. This reduction in gene flow did notoccur long enough ago for significant differences to be-come apparent in the mitochondrial markers given his-toric population sizes. The large number of mtDNA–CRhaplotypes in Qinling (Fig. 1) implies that it descendsfrom a large, expanding historic population that withtime became isolated and reduced in number and in rela-tive genomic diversity. Such a pattern may signal the be-ginning of a reversible but damaging trend that can pre-cede genetic and demographic reductions in isolatedpopulations of threatened species.
Management Implications
Our results consistently suggest that the studied pandapopulations were probably connected until recently, whengene flow between Qinling and the populations of theMinshan and Qionglai mountains was reduced. The date
is difficult to estimate precisely, but by comparison tocoalescent calculation in other carnivores (Menotti-Ray-mond & O’Brien 1993; Culver et al. 2000; C. A. Driscoll& S. J. O., unpublished data) it is on the order of a fewthousand years. Levels of molecular genetic variation ingiant pandas are comparable to those of other carnivoresand only slightly reduced in Qinling relative to Minshanand Qionglai, probably reflecting a relatively recent de-cline in effective population size. Although we find uniquemtDNA and microsatellite genotypes in each of the threepopulations, together the results from these four geneticmarkers suggest that there is no imperative to manage re-maining panda populations as separate units. As muchas is practical, gene flow should be encouraged betweenisolated populations on both sides of the Minjiang River,either through the maintenance or reestablishment ofnatural corridors or, in demographically critical popula-tions, through intervention.
Contact between pandas in the Qinling mountains andmore-southern populations has probably been curtailedeffectively. The effect of maintaining current manage-ment practices will be to reinforce more recently deriveddifferences between Qinling and other panda popula-tions and not differences in more-historic population pat-terns. A more important concern, however, may be themaintenance of a long-term viable population in Qinling,given current and projected effective population sizes. Adetailed analysis is needed to determine the effect thedemographic structure of this population may have ongenetic variation.
The genetic data raise some provocative questionsabout the recent history of the populations. The giantpanda’s habitat is traversed by several large river systems(Fig. 1; Yangtze, Minjiang, Jialingjiang, and Daduhe), whichhistorically may have posed barriers to migration. Butthe genetic similarity between the populations impliesthat gene flow has occurred between the populationsuntil recently, when the valley became settled by Chi-nese peoples. Together these observations suggest thathuman activities have posed a more effective migrationbarrier over the past few thousand years than have theancient river systems.
Ultimately, these molecular genetic results may offersome comfort to managers of the giant panda. From agenetic perspective, there appear to be no major reduc-tions in the genomic diversity of giant panda popula-tions, although the large number of remaining mtDNAhaplotypes in Qinling suggest that this population haslikely experienced modest genetic losses from an ances-tral, much larger, and genetically diverse population.Nonetheless, long-term field observations of the Qinlingpopulation reveal that panda reproduction is not notice-ably diminished but is comparable to similarly studiedAmerican black bear (Ursus americanus) populations(Lu 1991; Zhu 1999; Lu et al. 2000). So far, evidence ofinbreeding in Qinling has not been apparent, suggesting
Figure 3. Phylogenetic relationships among 36 giant pandas constructed from 18 microsatellite loci. Un-rooted neighbor-joining tree based on mean kinship, Dkf genetic distances with a p-ps transformation. Indi-viduals are coded by their affiliation with one of five populations; MIN, Minshan; QIN, Qinling; QIO, Qiong- lai; XIA, Xiangling; LIA, Liangshan. Individuals from Xiangling and Liangshan are combined with Qionglai in other analyses.

1606 Giant Panda Molecular Genetic Patterns Lu et al.
Conservation BiologyVolume 15, No. 6, December 2001
that conservation imperatives should focus on expand-ing habitat and protecting existing populations fromthreatened demographic losses due to timber harvestand poaching. Unfortunately, habitat loss and small-pop-ulation isolation are common across the giant panda’srange (MacKinnon et al. 1989; O’Brien et al. 1994), andthese acute population reductions need to be identifiedand reversed.
The molecular genetic data we describe have allowedan interpretation of the consequences of depletion of gi-ant panda habitat and populations in historic times. Thesame molecular genetic markers may also be applied toparentage assessment of captive and free-ranging popu-lations and to ecological genetic population monitoringbased on fecal and hair samples. Each of these applica-tions has the potential to aid managers in designing con-servation strategies for this species.
Acknowledgments
We appreciate the assistance of Q. Dagong and M. Xiao-rong at Peking University; the staffs of the Beijing Zoo,the Chengdu Zoo, and the Wolong Nature Reserve; andZ. Qingquo and all the individuals listed in Table 1 whoaided in the collection of biological samples. The con-tent of this publication does not necessarily reflect theviews or policies of the Department of Health and Hu-man Services, and the mention of trade names, commer-cial products, or organizations does not imply endorse-ment by the U.S. government.
All tissue samples were collected in full compliancewith specific U.S. Fish and Wildlife permits (Conventionon International Trade in Endangered Species of WildFauna and Flora [CITES]; Endangered and ThreatenedSpecies) issued to the National Cancer Institute of theNational Institutes of Health (principal officer S. J.O’Brien) by the U. S. Fish and Wildlife Service of the De-partment of the Interior.
Literature Cited
Bowcock, A. M., A. Ruiz-Linares, J. Tomfohrde, E. Minch, J. R. Kidd,and L. L. Cavalli-Sforza. 1994. High resolution human evolutionarytrees with polymorphic microsatellites. Nature 368:455–457.
Camper, S. A., D. N. Luck, Y. Yvonne, R. P. Woychich, T. G. Goodwin,R. H. Lyons Jr., and F. M. Rottmann. 1984. Characterization of thebovine prolactin gene. DNA 3:237–249.
Culver, M., W. E. Johnson, J. Pecon Slattery, M. Menotti-Raymond, M.Roelke-Parker, and S. J. O’Brien. 2000. Genetic evidence for aSouth American origin of modern pumas (Puma concolor): a phy-logeographic study using mitochondrial DNA and microsatellites.Journal of Heredity 91:186–197.
Dietrich W., H. Katz, S. Lincoln, H. S. Shin, J. Fiedman, N. C. Dra-copoli, and E. S. Lander. 1992. A genetic map of the mouse suitablefor typing intraspecific crosses. Genetics 131:423–447.
Elder, J. K., and E. M. Southern. 1987. Computer-aided analysis of one-dimensional restriction fragment gels. Pages 165–172 in M. J.
Bishop and C. J. Rawlings, editors. Nucleic acid and protein se-quence analysis: a practical approach. IRL Press, Oxford, UnitedKingdom.
Excoffier, L., and P. Smouse. 1994. Using allele frequencies and geo-graphic divisions to reconstruct gene geneologies within a species:molecular variance parsimony. Genetics 136:343–359.
Felsenstein, J. 1993. Phylogeny inference package (PHYLIP). Version3.5. University of Washington, Seattle.
Frankham, R. 1995. Conservation genetics. Annual Review of Genetics29:305–328.
Gilbert, D. A., N. Lehman, S. J. O’Brien, and R. K. Wayne. 1990. Ge-netic fingerprinting reflects population differentiation in the Cali-fornia Channel Island fox. Nature 344:764–767.
Gilbert, D. A., C. Packer, A. E. Pusey, J. C. Stephens, and S. J. O’Brien.1991. Analytical DNA fingerprinting in lions: parentage, genetic di-versity, and kinship. Journal of Heredity 82:378–386.
Goldstein, D. B., and D. D. Pollock. 1997. Launching microsatellites: areview of mutation processes and methods of phylogenetic inter-ference. Journal of Heredity 88: 335–342.
Goldstein, D. B., A. Ruiz-Linares, L. L. Cavalli-Sforza, and M. Feldman.1995. Genetic absolute dating based on microsatellites and the ori-gin of modern humans. Proceedings of the National Academy ofScience of the United States of America 92:6720–6727.
Higuchi, R., C. H. von Beroldingen, G. F. Sensabaugh, and H. A. Erlich.1988. DNA typing from single hairs. Nature 332:543–546.
Johnson, K., G. Schaller, and H. Jinchu. 1988. Responses of giant pan-das to a bamboo die-off. National Geographic Research 4:161–177.
Kimura, M. 1980. A simple method for estimating evolutionary rate ofbase substitutions through comparative studies of nucleotide se-quences. Journal of Molecular Evolution 16:111–120.
Kocher, T. D., W. K. Thomas, A. Meyer, S. V. Edwards, S. Paabo, F. X.Villablanca, and A. C. Wilson. 1989. Dynamics of mitochondrialDNA evolution in animals: amplification and sequencing with con-served primers. Proceedings of National Academy of Sciences ofthe United States of America 86:6196–6200.
Lopez, J. V., N. Yuhki, R. Masuda, W. S. Modi, and S. J. O’Brien. 1994.Numt, a recent transfer and tandem amplification of mitochondrialDNA to the nuclear genome of the domestic cat. Journal of Molecu-lar Evolution 39:174–190.
Lu, Z. 1991. The movement pattern, population dynamics and socialbehaviour of the Giant Panda in Qinling. Ph.D. thesis. Peking Uni-versity, Beijing. (In Chinese.)
Lu, Z. 1993. Newborn panda in the wild. National Geographic 183:60–65.Lu, Z., W. Pan, and J. Harkness. 1994. Mother-cub relationship in the
giant panda in Qinling Mountains: comments on rescuing aban-doned cubs. Zoo Biology 187:157–158.
Lu, Z., X. Zhu, D. J. Wang, H. Wang, and W. Pan. 2000. What has thepanda taught us? Pages 325–334 in A. Entwistle, editor. Prioritiesfor conservation of mammalian diversity. Cambridge UniversityPress, Cambridge, United Kingdom.
MacKinnon, J., F. Bi, and M. Qiu. 1989. The national conservation man-agement plan for the giant panda and its habitat. World Wildlife Fundand the Ministry of Forestry, Beijing, People’s Republic of China.
Menotti-Raymond, M., and S. J. O’Brien. 1993. Dating the geneticbottleneck of the African cheetah. Proceedings of the NationalAcademy of Science of the United States of America 90:3172–3176.
Menotti-Raymond, M., V. A. David, J. C. Stephens, L. A. Lyons, and S. J.O’Brien. 1997. Genetic individualization of domestic cats using fe-line STR loci for forensic applications. Journal of Forensic Science42:1039–1051.
Minch, E., A. Ruiz-Linares, D. B. Goldstein, M. W. Feldmen, and L. L.Cavalli-Sforza. 1997. MICROSAT. Version 1.5d. Stanford University,Stanford, California. (Available from http://lotka.stanford.edu/mi-crosat.html.)
Miththapala, S., J. Seidensticker, and S. J. O’Brien. 1996. Phylogeo-graphic subspecies recognition in leopards (Panthera pardus):molecular genetic variation. Conservation Biology 10:1115–1132.
Conservation BiologyVolume 15, No. 6, December 2001
Lu et al. Giant Panda Molecular Genetic Patterns 1607
Nei, M. 1987. Molecular evolutionary genetics. Columbia UniversityPress, New York.
Nei, M., and W. H. Li. 1979. Mathematical model for studying geneticvariation in the terms of restriction endonucleases. Proceedings ofNational Academy of Sciences of the United States of America 76:5269–5273.
Nei, M., and F. Tajima. 1983. Maximum likelihood estimation of thenumber of nucleotide substitutions from restriction sites data. Ge-netics 105:207–217.
Nei, M., J. C. Stephens, and N. Saitou. 1996. Methods for computingthe standard errors of branching points in an evolutionary tree andtheir application to molecular data from humans and apes. Molecu-lar Biology and Evolution 2:66–85.
O’Brien, S. J., and J. A. Knight. 1987. The future of the giant panda. Na-ture 325:758–759.
O’Brien, S. J. 1994a. A role for molecular genetics in biological conser-vation. Proceedings of the National Academy of Science of theUnited States of America 91:5748–5755.
O’Brien, S. J. 1994b. Genetic and phylogenetic analyses of endangeredspecies. Annual Review of Genetics 28:467–489.
O’Brien, S. J., M. E. Roelke, N. Yuhki, K. W. Richards, W. E. Johnson,W. L. Franklin, A. E. Anderson, O. L. Bass Jr., R. C. Belden, and J. S.Martenson. 1990. Genetic introgression within the Florida pantherFelis concolor coryi. National. Geographic Research 6:485–494.
O’Brien, S. J., W. Pan, and Z. Lu. 1994. Pandas, people and policy. Na-ture 369:179–180.
Pan, W. 1995. New hope for China’s pandas. National Geographic187:100–115.
Pan, W., and Z. Lhu. 2001. A chance of lasting survival. Peking Univer-sity Press, Beijing.
Pan, W., Z. Gao, Z. Lu, et al. 1988. The giant panda’s natural refuge inQinling. Peking University Press, Peking.
Roelke, M. E., J. S. Martenson, and S. J. O’Brien. 1993. The conse-quences of demographic reduction and genetic depletion in theendangered Florida panther. Current Biology 3:340–350.
Saccheri, I., M. Kuussaari, M. Kankare, P. Vikman, W. Fortellus, and I.Hanski. 1998. Inbreeding and extinction in a butterfly metapopula-tion. Nature 392:491–494.
Saitou, N., and M. Nei. 1987. The neighbor-joining method: a newmethod for reconstructing phylogenetic trees. Molecular Biologyand Evolution 4:406–426.
Sambrook, J., E. F. Fritsch, and T. Maniatis. 1989. Molecular cloning: alab manual. 2nd edition. Cold Spring Harbor Laboratory Publica-tions, Cold Spring Harbor, New York.
Schaller, G. 1986. Secrets of the wild panda. National Geographic 169:284–309.
Schaller, G. 1993. The last panda. University of Chicago Press, Chicago.Schaller, G., H. Jinchu, W. Pan, and Z. Jing. 1985. The giant panda of
Wolong. University of Chicago Press, Chicago.Schaller, G., Q. Teng, K. Johnson, X. Wang, H. Shen, and J. Hu. 1989.
The feeding ecology of giant panda and Asiatic black bear in theTangjiahe Reserve, China. Pages 212–241 in J. Gittleman, editor.Carnivore behavior, ecology, evolution. Cornell University Press,Ithaca, New York.
Schneider, S., D. Roessli, and L. Excoffier. 2000. ARLEQUIN. Version2.000. University of Geneva, Switzerland.
Soulé, M. E, and L. S. Mills. 1998. No need to isolate genetics. Science282:1658–1659.
Stephens, J. C., D. A. Gilbert, N. Yuhki, and S. J. O’Brien. 1992. Estima-tion of heterozygosity for single-probe, multilocus DNA finger-prints. Molecular Biology and Evolution 9:729–743.
Su, B., L. Shi, G. He, A. Zhang, Y. Song, and L. Fei. 1993. Genetic diver-sity in the giant panda: evidence from protein electrophoresis.Pages 292–296 in Z. Anju and H. Guangxin, editors. Minutes of aninternational symposium on the protection of the giant panda.Chengdu Research Base for Giant Panda Breeding, Chengdu, China.
Swofford, D. L. 1999. PAUP phylogenetic analysis using parsimony andother methods. Computer program. Sinauer Associates, Sunder-land, Massachusetts.
Wayne, R. K., B. Van Valkenburgh, and S. J. O’Brien. 1991. Moleculardistance and divergence time in carnivores and primates. Molecu-lar Biology and Evolution 8:297–319.
Zhu, X. 1996. Vocalization analysis of the giant panda cubs. M.S. the-sis. Peking University, Beijing.
Zhu, X. 1999. Social behavior and reproductive strategy of the giantpanda in Qinling. Ph.D. thesis. Peking University, Beijing.