The impact of giant panda foraging on bamboo dynamics in an isolated environment
12
The impact of giant panda foraging on bamboo dynamics in an isolated environment Vanessa Hull • Ashton Shortridge • Bin Liu • Scott Bearer • Xiaoping Zhou • Jinyan Huang • Shiqiang Zhou • Hemin Zhang • Zhiyun Ouyang • Jianguo Liu Received: 10 January 2010 / Accepted: 4 June 2010 / Published online: 29 June 2010 Ó Springer Science+Business Media B.V. 2010 Abstract Wildlife species are threatened by massive habitat destruction worldwide. Habitat fragmentation and isolation spatially constrain animals and in turn cause non-sustainable rates of animal foraging on plant populations. However, little empirical research has been done in large controlled settings to investigate foraging impacts. We conducted an experiment to characterize the impact of panda foraging on the sustainability of its food resource, bamboo, in an enclosed area of natural habitat (approximately 19 ha). We monitored bamboo density, age, and percent cover throughout the enclosure across a 3-year period. We documented marked declines in bamboo density and percent cover as a result of panda foraging, particularly in younger bamboo age classes. We constructed simultaneous autoregressive models to explain bam- boo loss to panda foraging and subsequent bamboo recovery as a function of habitat conditions. Areas with high initial bamboo cover not only were prone to high rates of bamboo percent cover loss but also experi- enced high rates of subsequent bamboo recovery, as bamboo cover loss opened up the understory for new growth. Variograms of ordinary least squares model residuals revealed that the range of spatial autocorre- lation in bamboo loss increased over time as available bamboo forage declined. The results have implications for understanding the impact of animal foraging on vegetation and also highlight the importance of preventing further habitat fragmentation and isolation. Keywords Habitat fragmentation and isolation Giant panda Bamboo Foraging Wildlife Vegetation Introduction Over the course of the last century, threats to biodiversity have been increasing worldwide due to human impacts on ecosystems (Liu et al. 2003b; Pimm et al. 1995). In the animal kingdom alone, nearly 18% of mammals, 11% of birds, and 5% of fish V. Hull (&) J. Liu Center for Systems Integration and Sustainability (CSIS), Department of Fisheries and Wildlife, Michigan State University, 1405 S. Harrison Road, Suite 115 Manly Miles Bldg., East Lansing, MI 48823-5243, USA e-mail: [email protected] A. Shortridge Department of Geography, Michigan State University, East Lansing, MI 48824-1115, USA B. Liu X. Zhou J. Huang S. Zhou H. Zhang China Conservation and Research Center for the Giant Panda (CCRCGP), Wolong Nature Reserve, Sichuan 623006, China S. Bearer The Nature Conservancy, Williamsport, PA 17701, USA Z. Ouyang State Key Laboratory of Urban and Regional Ecology, Research Center for Eco-environmental Sciences, Chinese Academy of Sciences, Beijing 100085, China 123 Plant Ecol (2011) 212:43–54 DOI 10.1007/s11258-010-9800-3
-
Upload
michiganstate -
Category
Documents
-
view
1 -
download
0
Transcript of The impact of giant panda foraging on bamboo dynamics in an isolated environment
The impact of giant panda foraging on bamboo dynamicsin an isolated environment
Vanessa Hull • Ashton Shortridge • Bin Liu • Scott Bearer •
Xiaoping Zhou • Jinyan Huang • Shiqiang Zhou • Hemin Zhang •
Zhiyun Ouyang • Jianguo Liu
Received: 10 January 2010 / Accepted: 4 June 2010 / Published online: 29 June 2010
� Springer Science+Business Media B.V. 2010
Abstract Wildlife species are threatened by massive
habitat destruction worldwide. Habitat fragmentation
and isolation spatially constrain animals and in turn
cause non-sustainable rates of animal foraging on plant
populations. However, little empirical research has
been done in large controlled settings to investigate
foraging impacts. We conducted an experiment to
characterize the impact of panda foraging on the
sustainability of its food resource, bamboo, in an
enclosed area of natural habitat (approximately 19 ha).
We monitored bamboo density, age, and percent cover
throughout the enclosure across a 3-year period. We
documented marked declines in bamboo density and
percent cover as a result of panda foraging, particularly
in younger bamboo age classes. We constructed
simultaneous autoregressive models to explain bam-
boo loss to panda foraging and subsequent bamboo
recovery as a function of habitat conditions. Areas with
high initial bamboo cover not only were prone to high
rates of bamboo percent cover loss but also experi-
enced high rates of subsequent bamboo recovery, as
bamboo cover loss opened up the understory for new
growth. Variograms of ordinary least squares model
residuals revealed that the range of spatial autocorre-
lation in bamboo loss increased over time as available
bamboo forage declined. The results have implications
for understanding the impact of animal foraging on
vegetation and also highlight the importance of
preventing further habitat fragmentation and isolation.
Keywords Habitat fragmentation and isolation �Giant panda � Bamboo � Foraging �Wildlife � Vegetation
Introduction
Over the course of the last century, threats to
biodiversity have been increasing worldwide due to
human impacts on ecosystems (Liu et al. 2003b;
Pimm et al. 1995). In the animal kingdom alone,
nearly 18% of mammals, 11% of birds, and 5% of fish
V. Hull (&) � J. Liu
Center for Systems Integration and Sustainability (CSIS),
Department of Fisheries and Wildlife, Michigan State
University, 1405 S. Harrison Road, Suite 115 Manly
Miles Bldg., East Lansing, MI 48823-5243, USA
e-mail: [email protected]
A. Shortridge
Department of Geography, Michigan State University,
East Lansing, MI 48824-1115, USA
B. Liu � X. Zhou � J. Huang � S. Zhou � H. Zhang
China Conservation and Research Center for the Giant
Panda (CCRCGP), Wolong Nature Reserve, Sichuan
623006, China
S. Bearer
The Nature Conservancy, Williamsport, PA 17701, USA
Z. Ouyang
State Key Laboratory of Urban and Regional Ecology,
Research Center for Eco-environmental Sciences, Chinese
Academy of Sciences, Beijing 100085, China
123
Plant Ecol (2011) 212:43–54
DOI 10.1007/s11258-010-9800-3
are threatened with extinction (Pimm et al. 1995). One
of the main threats to the survival of animal species is
habitat destruction (e.g., loss, fragmentation, and
isolation), which causes animals to experience food
shortages and congregate in remnant islands of high-
quality resources (Morrison et al. 2006). Spatially
constrained resource use by large herbivores in areas
too small to support them may threaten sustainability
of plant populations (Augustine and McNaughton
1998) and in turn, the animal populations that rely on
them (Cote et al. 2004).
Large herbivores impact plant communities in
various ways (Rooney and Waller 2003). Animal
foraging can alter the abundance and diversity of plant
species (Martin et al. 2010), change canopy structure
(Ammer 1996), impact plant succession (Cote et al.
2004), and affect plant regeneration (Rooney and
Waller 2003). However, questions remain about the
magnitude and spatial pattern of responses of plant
populations to such effects, as there are rarely
opportunities to conduct experiments to isolate con-
centrated foraging impacts, particularly with endan-
gered species.
The endangered giant panda (Ailuropoda melanol-
euca) is an herbivore that has experienced severe
habitat isolation and fragmentation. The 1,600 wild
pandas that remain (State Forestry Administration
2006) inhabit an area of just over 21,000 km2 in
southwestern China (Hu and Wei 2004), fragmented
into over 20 isolated areas (Loucks et al. 2001).
Expansion of human population, households, and
associated human activities, such as farming, road
construction, and timber harvesting are among the
primary causes (Liu et al. 2003a, 1999).
A critical factor for giant panda survival in the face
of these threats is their bamboo food resource. Pandas
are known for having enormous food requirements.
Because of their carnivore-adapted digestive systems,
pandas digest less than 20% of what they consume and
eat up to 38 kg of bamboo daily (Schaller et al. 1985).
As a result, pandas are particular about the species,
age, and part of the bamboo plants they consume
based on seasonal variation in nutritive qualities
(Schaller et al. 1985).
Wild pandas inhabiting large, contiguous patches
of habitat only use 10% of their 4–6 km2 home
range in any given month, which may relieve
foraging pressure on the bamboo population in any
one area (Schaller et al. 1985). However, foraging
impacts in low elevation, increasingly fragmented
areas of habitat, where there may be higher foraging
pressure, have not been studied. In addition, since
wild pandas are elusive and difficult to track,
researchers have been unable to follow individual
pandas for extended periods in order to isolate
foraging impacts.
A novel opportunity arose to study panda–bamboo
interactions in a controlled setting after an enclosure
was constructed in an area of panda habitat in
Wolong Nature Reserve, China. The 19-ha enclosure
housed a once-captive panda prior to its reintroduc-
tion to the wild. Because the panda is an endangered
species undergoing experimental ex situ management
in this study, we were not afforded the luxury of
animal replicates. Nevertheless, we were compelled
to conduct this study because it has important
implications for management planning, considering
that it could demonstrate how bamboo might respond
if pandas are forced to concentrate in fragmented
patches of habitat.
When exploring bamboo dynamics, it is important
to identify factors that make an area susceptible to
bamboo loss via panda foraging. Areas with high
bamboo densities (Liu et al. 2005; Reid and Hu 1991)
and high bamboo biomass (Yu et al. 2003) are
preferred foraging areas. The relationship between
trees, bamboo, and panda use is complex and context-
dependent (Reid and Hu 1991; Taylor et al. 2004).
Trees not only compete with bamboo for resources
(Taylor et al. 2004), but also encourage bamboo
growth (Taylor and Qin 1997). Nonetheless, pandas
prefer foraging in areas with adequate tree cover
(Schaller et al. 1985), in addition to areas with gentler
slopes that are closer to water (Reid and Hu 1991;
Zhang et al. 2006).
However, there has been little appreciation in the
literature for spatial patterns of panda foraging and
what they mean for bamboo loss and recovery. One
useful characteristic for understanding patterns of
panda–bamboo interactions is spatial autocorrelation.
Habitat use patterns are often positively spatially
autocorrelated, since animals concentrate in localized
areas more similar to one another than areas farther
apart (Lichstein et al. 2002). This pattern can arise
from animals responding to an underlying clustered
habitat structure (Meisel and Turner 1998), as a result
of social organization patterns (Stamps 1998; Valcu
and Kempenaers 2010), or in this case, due to a
44 Plant Ecol (2011) 212:43–54
123
constraint on the animal’s movement (Abrahams
1986). Within the context of multivariate analysis,
spatial autocorrelation is defined as a lack of inde-
pendence of errors in model data due to a relationship
between errors and the distance between sites
(Legendre et al. 2002).
The goal of our study was to characterize the impact
of giant panda foraging on bamboo in a controlled
setting over a multi-year period. We examined bam-
boo loss due to panda foraging during the 18 months of
panda occupancy in the enclosure and bamboo recov-
ery during the subsequent two bamboo growing
seasons. We characterized the following attributes of
both bamboo loss and recovery: (a) magnitude, (b)
underlying habitat characteristics, and (c) spatial
pattern. We characterized the last two attributes using
spatial simultaneous autoregressive (SAR) models that
examined bamboo loss and recovery as a function of
habitat variables believed to be predictors of panda
use. These models accounted for spatial autocorrela-
tion, which was characterized using variograms
depicting the variability of bamboo loss and recovery
across space. The results will contribute to under-
standing the relationship between pandas and bamboo
with potential implications for conservation of
increasingly isolated habitat in the face of the panda’s
large food demands.
Methods
Data collection
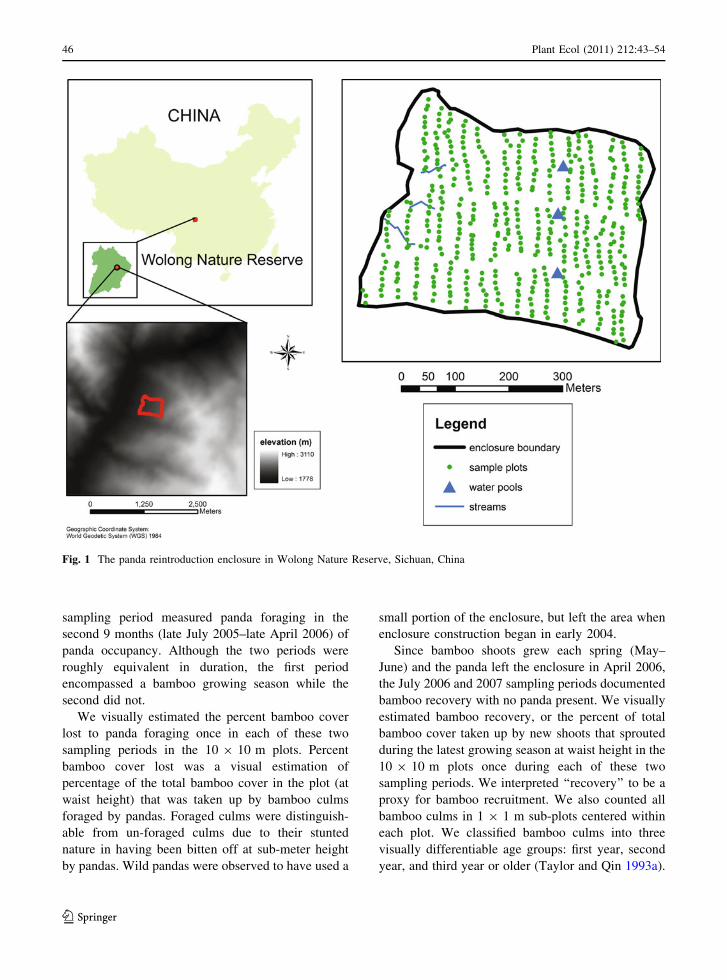
The enclosure (19.019 ha) was located in Wolong
Nature Reserve, Wenchuan County, Sichuan, China
(31�0403000N, 103�1304100E), where there is a mean
annual precipitation of 888.0 mm and a mean annual
temperature of 8.9�C (Fu et al. 2004). There were
three constructed water pools in the enclosure (2-m
wide) and three perennial streams (40–90-m long).
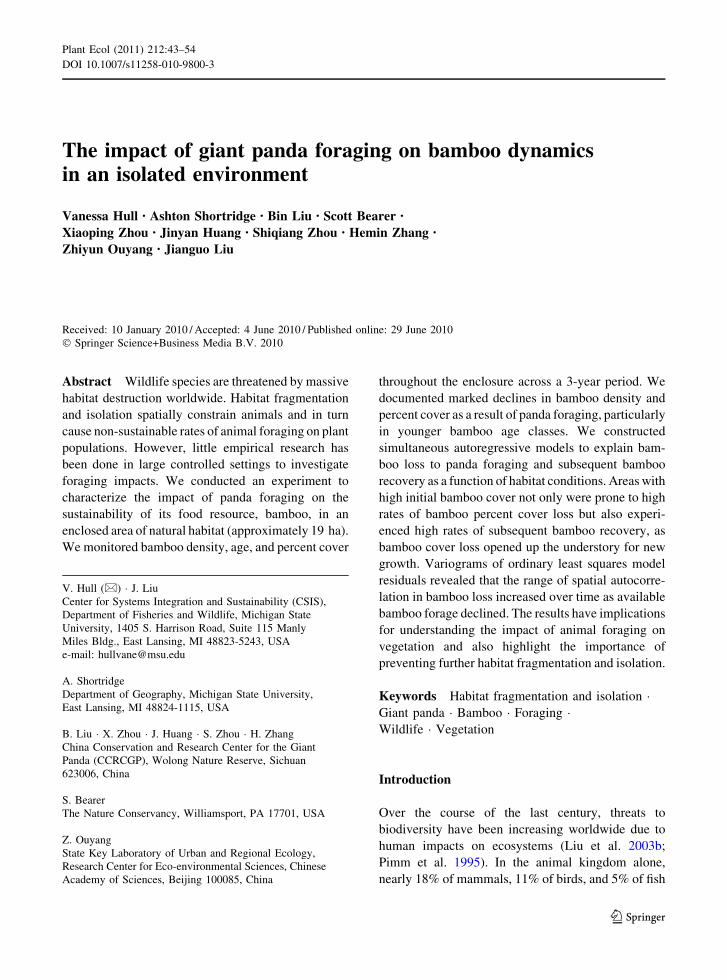
The enclosure was situated at 2,150–2,300-m eleva-
tion on a west-facing slope (20�–30�) in a mixed
coniferous and deciduous broad-leafed forest
(Fig. 1). Dominant deciduous species included the
Chinese walnut (Juglans cathayensis), huaxi wingnut
(Pterocarya insignis), and mono maple (Acer mono),
while the coniferous tree community was comprised
mainly of hemlock (Tsuga sp.) and spruce (Picea sp.,
Zhou et al. 2004).
The forest understory consisted mainly of umbrella
bamboo (Fargesia robusta), which covers 40% of the
understory at altitudes of 2,000–2,600 m throughout
the reserve (Taylor and Qin 1993b). This species
produces shoots via pachymorph rhizomes each May,
which grow to a full height of 2.5–3 m by mid-June
(Taylor and Qin 1993b). Shoots produce leaved first-
order branches in the first growing season and leaved
second-order branches in subsequent growing seasons
(Taylor and Qin 1993b). The only other bamboo
species present was Yushania brevipaniculata, which
we excluded from the analysis because it covered less
than 1% of the enclosure.
The enclosure was mapped using a Pathfinder� Pro
XRS GPS unit (Trimble Navigation Ltd., Sunnyvale,
CA, USA) equipped with OmniSTAR differential GPS
(OmniSTAR USA Inc., Houston, TX, USA). All
sampling took place during a roughly 2-week period
each July in 2005, 2006, and 2007. We established
transects (n = 19) running south to north every 30 m
throughout the enclosure. We set up contiguous
10 9 10 m sampling plots along each transect
(n = 537). We placed a marker at each center point,
where we measured slope and aspect. Diameter at
breast height (DBH) was measured for all trees with
DBH [ 5 cm. Woody vegetation was classified into
the shrub (\5 m), midstory (5–14 m), or overstory
(C15 m) height class. We counted the plants in each
layer in each plot. Percent canopy cover was visually
estimated for bamboo, shrubs, and midstory and
overstory trees. Distance (m) to the nearest water
source was computed for each plot using the Nearest
Features extension (Jenness 2004) for ArcView GIS
(Environmental Systems Research Institute 2001).
The 2-year-old male panda, Xiang Xiang (studbook
#531), weighed 62.2 kg at the start and 68.2 kg at the
end of the study. The panda was previously housed in
captivity at the CCRCGP, and subsisted on a diet of
bamboo, bamboo cakes, milk, and fruits and vegeta-
bles. The panda was moved to a small reintroduction
enclosure (2.7 ha) in the summer of 2003 and stayed
for a little over a year. During the course of this study,
the panda only received supplemental feeding during
procedures such as weighing (about once per month).
The panda was placed in the current study’s
enclosure in late September 2004 and stayed until late
April 2006. The 2005 July sampling period thus
measured panda foraging in the first 9 months (late
September 2004–late June 2005) and the 2006 July
Plant Ecol (2011) 212:43–54 45
123
sampling period measured panda foraging in the
second 9 months (late July 2005–late April 2006) of
panda occupancy. Although the two periods were
roughly equivalent in duration, the first period
encompassed a bamboo growing season while the
second did not.
We visually estimated the percent bamboo cover
lost to panda foraging once in each of these two
sampling periods in the 10 9 10 m plots. Percent
bamboo cover lost was a visual estimation of
percentage of the total bamboo cover in the plot (at
waist height) that was taken up by bamboo culms
foraged by pandas. Foraged culms were distinguish-
able from un-foraged culms due to their stunted
nature in having been bitten off at sub-meter height
by pandas. Wild pandas were observed to have used a
small portion of the enclosure, but left the area when
enclosure construction began in early 2004.
Since bamboo shoots grew each spring (May–
June) and the panda left the enclosure in April 2006,
the July 2006 and 2007 sampling periods documented
bamboo recovery with no panda present. We visually
estimated bamboo recovery, or the percent of total
bamboo cover taken up by new shoots that sprouted
during the latest growing season at waist height in the
10 9 10 m plots once during each of these two
sampling periods. We interpreted ‘‘recovery’’ to be a
proxy for bamboo recruitment. We also counted all
bamboo culms in 1 9 1 m sub-plots centered within
each plot. We classified bamboo culms into three
visually differentiable age groups: first year, second
year, and third year or older (Taylor and Qin 1993a).
Fig. 1 The panda reintroduction enclosure in Wolong Nature Reserve, Sichuan, China
46 Plant Ecol (2011) 212:43–54
123
We also recorded which ones were broken culms
consistent with panda foraging.
The only other animals that feed extensively on
umbrella bamboo are insects, which consume pri-
marily first-year culms (Taylor and Qin 1987).
Insects foraged a percentage of first-year bamboo
that was comparable to other areas of wild habitat
(2005, 9.54%; 2006, 15.71%; Taylor and Qin 1987).
Foraging by pandas was distinguishable from insects
because insect foraging caused rotting inside the
culm. Only one plot had evidence of browsing by
another herbivore (likely prior to enclosure construc-
tion). Ungulates such as sambar, serow, and tufted
deer occasionally forage on umbrella bamboo, but are
not main sources of herbivory (Schaller et al. 1985).
Data analysis
Multiple regression models were constructed to
analyze the relationship between (a) percent bamboo
cover loss due to panda foraging (in 2005 and 2006)
and (b) percent bamboo cover gained via recovery (in
2006 and 2007) and all other habitat variables
measured in the 10 9 10 m plots. Since percent
bamboo cover loss and recovery were dependent on
the presence of bamboo, all plots with no bamboo
cover (n = 71) were removed prior to analysis.
Because characteristics related to the same forest
class were correlated (e.g., midstory deciduous tree
cover, density, and DBH), we only included the
characteristic of the three that had the strongest
correlation to the response variable in the model.
Interaction terms were also included. Stepwise
regression was used to remove non-significant terms
from each model. Diagnostic plots including Cook’s
D, residual histogram, and a plot of fitted versus
actual values were consulted to ensure that the
assumptions of unbiased, normal, and homoscedastic
errors were met. The response variables were log10-
transformed to meet assumptions.
The presence of spatial autocorrelation in the
residuals required the development of SAR models.
They incorporated an additive spatial component in
the form of a non-zero covariance structure (Lich-
stein et al. 2002) and should produce superior
coefficient estimates when observations are not
independent. Two SAR models, one for panda
foraging and the other for bamboo regeneration,
were defined according to the equation:
y ¼ Aþ qWðY � AÞ þ e;where A¼ ðslopeÞb1 þ ðaspectÞb2 þ ðoverstoryÞb3
þ ðmidstoryÞb4 þ ðshrubsÞb5 þ ðbambooÞb6
þ ðdistance to waterÞb7 þ ðinteraction termÞb8:
where
A ¼ ðslopeÞb1 þ ðaspectÞb2
þ ðoverstoryÞb3 þ ðmidstoryÞb4 þ ðshrubsÞb5
þ ðbambooÞb6 þ ðdistance to waterÞb7
þ ðinteraction termÞb8:
The response variable y represented either the
percent bamboo cover lost or the percent bamboo
cover recovered, W was a spatial neighbor matrix and
q was an interaction parameter specifying the degree
of autocorrelation between neighboring points (Bai-
ley and Gatrell 1995). q corresponded to the inter-
point distance over which neighborhood values were
spatially autocorrelated (Lichstein et al. 2002). We
determined this distance by visual interpretation of
semi-variograms (subsequently called variograms in
this paper). Variograms plot semi-variances—aver-
age squared differences of values for all point pairs
separated by a particular distance—against distance.
Autocorrelation was evident when the semi-variance
increased as the distance between points increased.
The distance at which the semi-variance leveled off
marked the maximum spatial extent of spatial auto-
correlation (Lichstein et al. 2002).
In order to better understand the spatial pattern of
bamboo loss and recovery from panda foraging, we
constructed variograms for each linear model on the
residuals of an ordinary least squares (OLS) model
that had the same predictor variables as the SAR
model. Since the OLS models did not account for
spatial autocorrelation, the residuals isolated this
component (Lichstein et al. 2002). Cressie and
Hawkin’s robust estimator (Cressie and Hawkins
1980) was used to transform the variograms to
remove the influence of outliers. Directional residual
variograms of varying azimuths (0�, 45�, 90�, 135�)
showed no evidence of anisotropy. We used a
weighting scheme of 1/lag distance, whereby the
impact of neighbors on the target location decreased
linearly with distance. We employed likelihood ratio
tests to assess the significance of model covariates
and plots of actual versus SAR model-predicted
response variables to evaluate model fit. All analyses
Plant Ecol (2011) 212:43–54 47
123
were performed using the R software package
(R Development Core Team 2005).
Results
Magnitude of bamboo loss and recovery
Panda foraging had a considerable impact on bamboo
in the enclosure, particularly with respect to the
younger bamboo age classes. Approximately half of
the available first-year culms in the 1 9 1 m sub-plots
were foraged by the panda by the first sampling period
in July of 2005, compared to 20% of the second-year
culms and less than 10% of the third-year and older
culms (Table 1). Because the panda left the enclosure
prior to the majority of the growing season in 2006,
few first-year culms were lost to panda foraging
during the second period, although over 60% of the
remaining, un-foraged second-year culms were con-
sumed. Bamboo recruitment also varied across the
sampling periods. We recorded a total of 262 first-year
culms recruited in 2005 (including those foraged). In
the two growing seasons after the panda left the
enclosure, recruitment increased to 331 (2006) and
then decreased to 152 (2007).
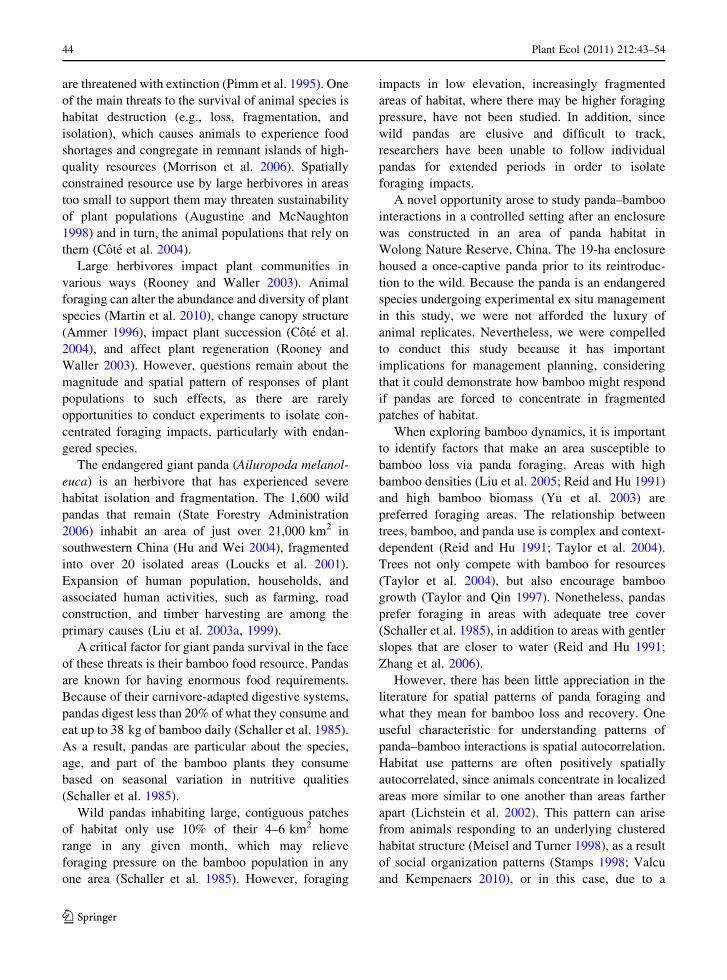
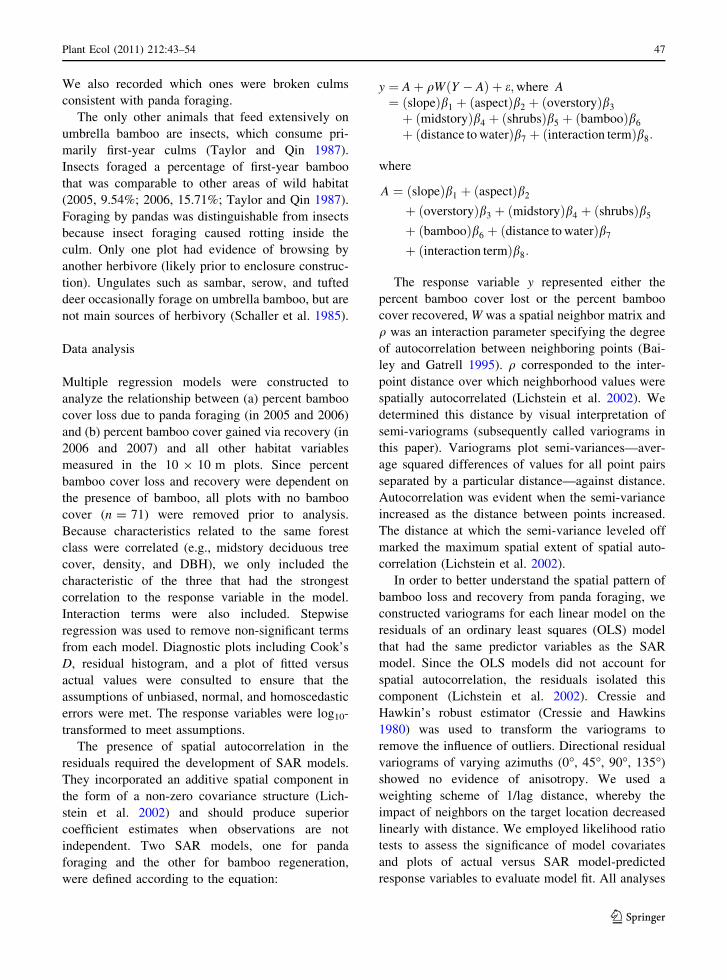
The 10 9 10 m plot data also revealed an impact
of panda foraging on bamboo. In 2005, the majority
of plots (68%) experienced bamboo cover loss at or
below 5% (Fig. 2a). However, there were an addi-
tional 127 plots (29%) that had up to 20% bamboo
cover loss, and 10 plots between 20 and 70% bamboo
cover loss. Although the average percent bamboo
foraged was similar from the first and second periods
of the panda’s occupancy (2005: mean = 6.38,
SD = 7.54; 2006: mean = 4.47, SD = 4.53), forag-
ing intensity was more evenly distributed in 2006
than 2005. A higher percentage of plots had less than
5% bamboo cover loss (73%), and all but one of the
remaining plots had under 20% bamboo cover loss.
Bamboo recovery was high in 2006 (mean =
23.45%, SD = 14.82), while 28% of plots containing
bamboo gained over 30% of new bamboo cover and
another 45% of plots gained between 10 and 30% of
new bamboo cover (Fig. 2b). In comparison, bamboo
recovery in 2007 was lower (mean = 4.82,
SD = 4.44), while 95% of plots had between 10
and 30% new bamboo cover and the remainder were
all below 10%.
Habitat characteristics explaining bamboo loss
and recovery
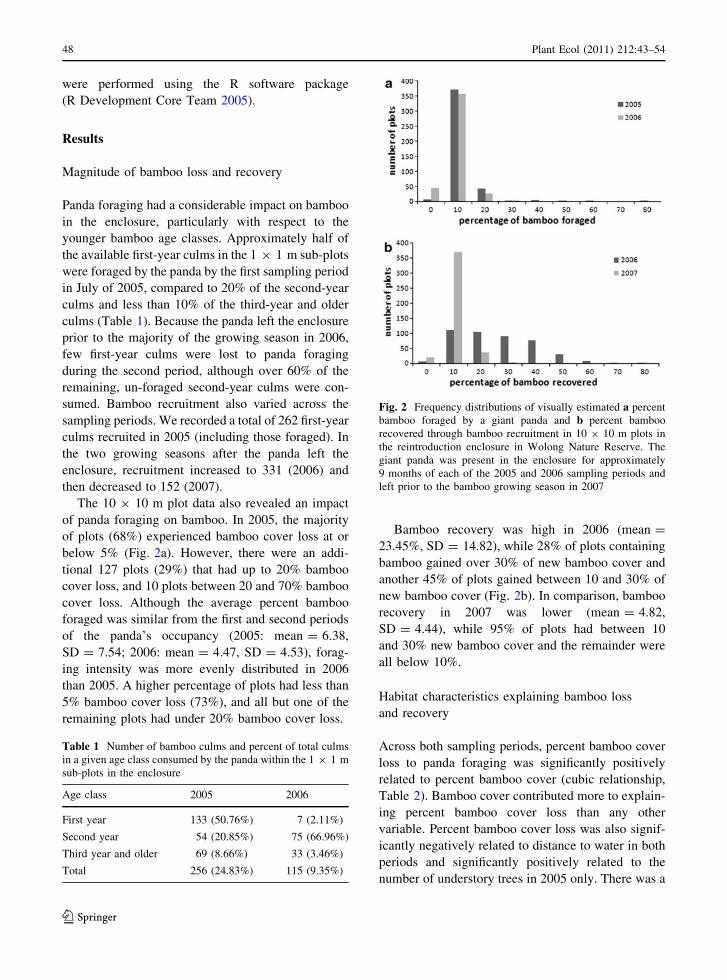
Across both sampling periods, percent bamboo cover
loss to panda foraging was significantly positively
related to percent bamboo cover (cubic relationship,
Table 2). Bamboo cover contributed more to explain-
ing percent bamboo cover loss than any other
variable. Percent bamboo cover loss was also signif-
icantly negatively related to distance to water in both
periods and significantly positively related to the
number of understory trees in 2005 only. There was a
Table 1 Number of bamboo culms and percent of total culms
in a given age class consumed by the panda within the 1 9 1 m
sub-plots in the enclosure
Age class 2005 2006
First year 133 (50.76%) 7 (2.11%)
Second year 54 (20.85%) 75 (66.96%)
Third year and older 69 (8.66%) 33 (3.46%)
Total 256 (24.83%) 115 (9.35%)
Fig. 2 Frequency distributions of visually estimated a percent
bamboo foraged by a giant panda and b percent bamboo
recovered through bamboo recruitment in 10 9 10 m plots in
the reintroduction enclosure in Wolong Nature Reserve. The
giant panda was present in the enclosure for approximately
9 months of each of the 2005 and 2006 sampling periods and
left prior to the bamboo growing season in 2007
48 Plant Ecol (2011) 212:43–54
123
significant interaction in 2005 between bamboo cover
and distance to water in explaining bamboo loss,
which was highest when bamboo cover was high and
distance to water was great.
In both recovery periods, bamboo recovery was
most strongly predicted by the percent bamboo cover
present prior to the growing season and the relation-
ship was negative quadratic. There was also a
significant positive relationship between percent
bamboo lost to foraging and bamboo recovery (loss
in 2006 was associated with recovery in 2006, loss in
2005 was associated with recovery in 2007). Bamboo
recovery was significantly negatively related to forest
characteristics in 2006, including shrub density,
understory coniferous cover, and number of overstory
deciduous trees. The effects of shrubs and understory
trees interacted, where bamboo recovery was highest
when shrub density was high and understory
coniferous cover was low. However, the effects of
forest characteristics were reversed in the following
year (2007), as areas with more understory deciduous
trees experienced more recovery. In this year, bam-
boo recovery was also significantly positively related
to distance to water. For both bamboo loss and
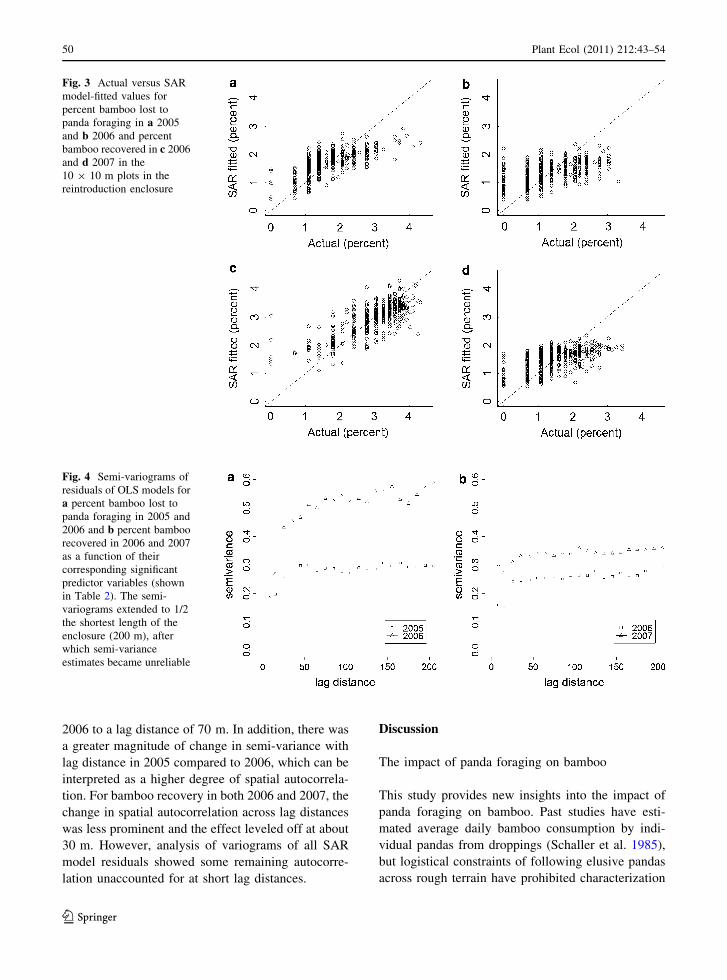
recovery, SAR model fit was low (Fig. 3). Models
tended to overestimate low values and underestimate
high values of bamboo loss and recovery.
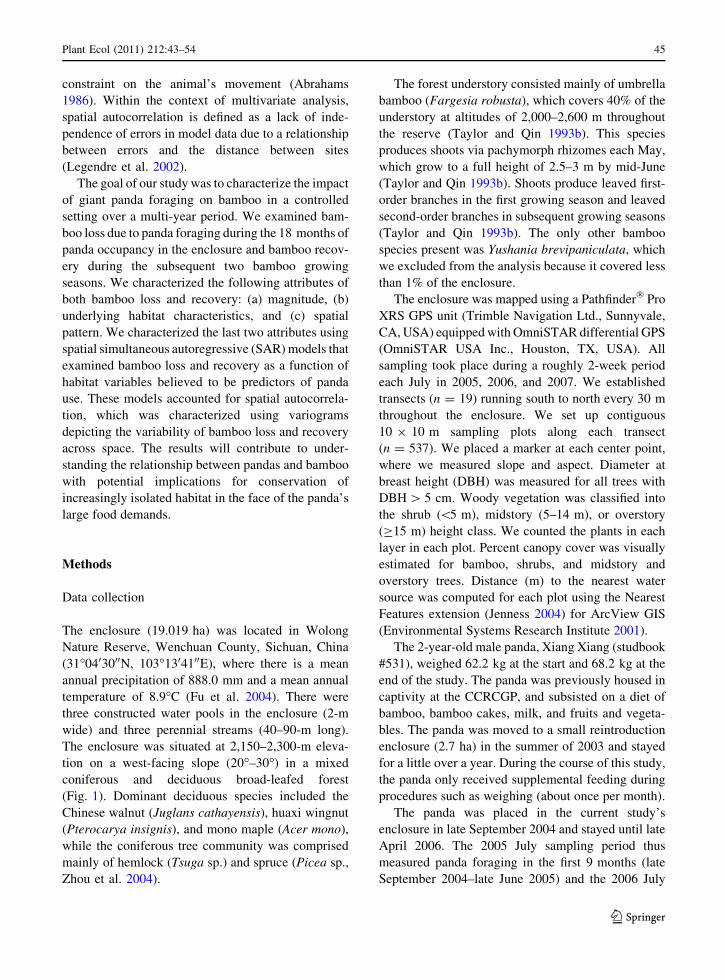
Spatial pattern of bamboo loss and recovery
Spatial autocorrelation had a significant effect on all
models, as the spatial parameter q was significant
(p \ 0.005). There was significant spatial autocorre-
lation in bamboo loss in 2005 up to a lag distance of
40 m (Fig. 4). The radius over which spatial auto-
correlation occurred for bamboo loss increased in
Table 2 Predictors of percent bamboo lost to panda foraging in (a) 2005 and (b) 2006 and percent bamboo recovered in (c) 2006 and
(d) 2007 within 10 9 10 m plots in the reintroduction enclosure according to a simultaneous autoregressive (SAR) model
Variable b SE p Likelihood ratio
(a)
Bamboo cover2 (%) -0.15 0.03 \0.001 17.57
Bamboo cover3 (%) 0.11 0.02 \0.001 41.34
Distance to water (m) -0.23 0.06 \0.001 14.58
Bamboo cover (%) 9 distance to water (m)a 0.1 0.03 \0.001 11.71
Number of understory deciduous trees 0.05 0.03 0.04 4.10
(b)
Bamboo cover3 (%) 0.14 0.02 \0.001 15.64
Distance to water (m) -0.22 0.07 0.002 3.95
(c)
Bamboo cover (%) 0.39 0.03 \0.001 122.41
Bamboo cover2 (%) -0.17 0.03 \0.001 24.85
Bamboo cover lost to foraging in 2006 (%) 0.22 0.03 \0.001 53.77
Understory coniferous cover (%) -0.1 0.03 \0.001 12.27
Number of overstory deciduous trees -0.09 0.03 \0.001 11.9
Shrub density 9 understory coniferous coverb 0.08 0.03 0.003 8.61
Shrub density -0.07 0.03 0.011 6.35
(d)
Bamboo cover (%) 0.27 0.03 \0.001 63.45
Bamboo cover2 (%) -0.16 0.03 \0.001 25.55
Bamboo cover lost to foraging in 2005 (%) 0.1 0.03 \0.001 11.14
Number of understory deciduous trees 0.06 0.03 0.04 4.04
Distance to water (m) 0.07 0.04 0.09 2.91
a Both bamboo cover and distance to water contributed positivelyb Shrub density contributed positively and understory coniferous cover contributed negatively
Plant Ecol (2011) 212:43–54 49
123
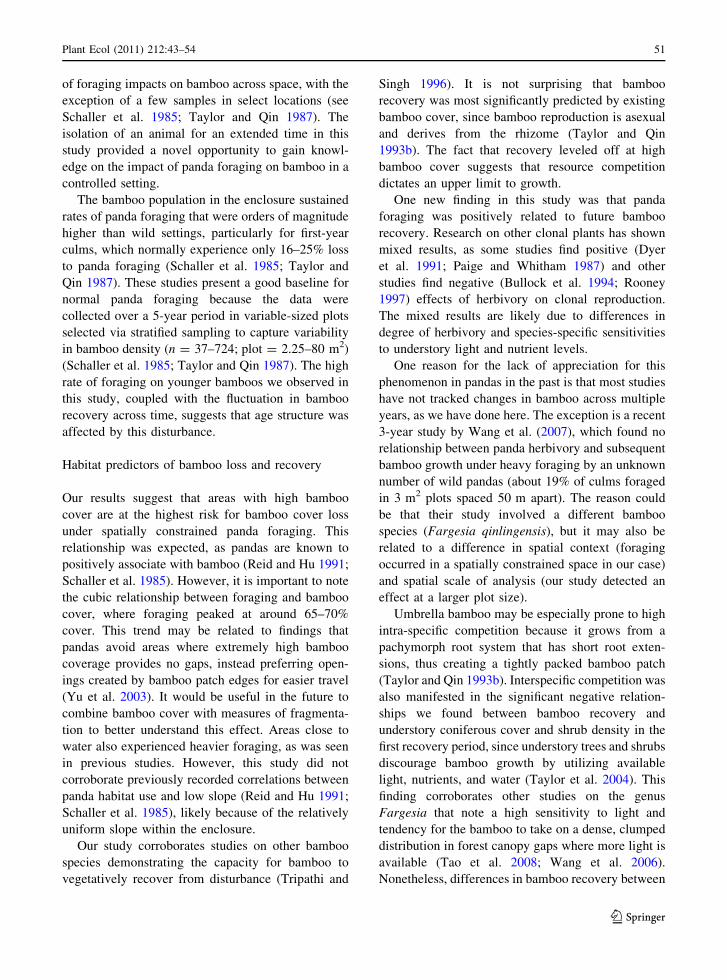
2006 to a lag distance of 70 m. In addition, there was
a greater magnitude of change in semi-variance with
lag distance in 2005 compared to 2006, which can be
interpreted as a higher degree of spatial autocorrela-
tion. For bamboo recovery in both 2006 and 2007, the
change in spatial autocorrelation across lag distances
was less prominent and the effect leveled off at about
30 m. However, analysis of variograms of all SAR
model residuals showed some remaining autocorre-
lation unaccounted for at short lag distances.
Discussion
The impact of panda foraging on bamboo
This study provides new insights into the impact of
panda foraging on bamboo. Past studies have esti-
mated average daily bamboo consumption by indi-
vidual pandas from droppings (Schaller et al. 1985),
but logistical constraints of following elusive pandas
across rough terrain have prohibited characterization
Fig. 3 Actual versus SAR
model-fitted values for
percent bamboo lost to
panda foraging in a 2005
and b 2006 and percent
bamboo recovered in c 2006
and d 2007 in the
10 9 10 m plots in the
reintroduction enclosure
Fig. 4 Semi-variograms of
residuals of OLS models for
a percent bamboo lost to
panda foraging in 2005 and
2006 and b percent bamboo
recovered in 2006 and 2007
as a function of their
corresponding significant
predictor variables (shown
in Table 2). The semi-
variograms extended to 1/2
the shortest length of the
enclosure (200 m), after
which semi-variance
estimates became unreliable
50 Plant Ecol (2011) 212:43–54
123
of foraging impacts on bamboo across space, with the
exception of a few samples in select locations (see
Schaller et al. 1985; Taylor and Qin 1987). The
isolation of an animal for an extended time in this
study provided a novel opportunity to gain knowl-
edge on the impact of panda foraging on bamboo in a
controlled setting.
The bamboo population in the enclosure sustained
rates of panda foraging that were orders of magnitude
higher than wild settings, particularly for first-year
culms, which normally experience only 16–25% loss
to panda foraging (Schaller et al. 1985; Taylor and
Qin 1987). These studies present a good baseline for
normal panda foraging because the data were
collected over a 5-year period in variable-sized plots
selected via stratified sampling to capture variability
in bamboo density (n = 37–724; plot = 2.25–80 m2)
(Schaller et al. 1985; Taylor and Qin 1987). The high
rate of foraging on younger bamboos we observed in
this study, coupled with the fluctuation in bamboo
recovery across time, suggests that age structure was
affected by this disturbance.
Habitat predictors of bamboo loss and recovery
Our results suggest that areas with high bamboo
cover are at the highest risk for bamboo cover loss
under spatially constrained panda foraging. This
relationship was expected, as pandas are known to
positively associate with bamboo (Reid and Hu 1991;
Schaller et al. 1985). However, it is important to note
the cubic relationship between foraging and bamboo
cover, where foraging peaked at around 65–70%
cover. This trend may be related to findings that
pandas avoid areas where extremely high bamboo
coverage provides no gaps, instead preferring open-
ings created by bamboo patch edges for easier travel
(Yu et al. 2003). It would be useful in the future to
combine bamboo cover with measures of fragmenta-
tion to better understand this effect. Areas close to
water also experienced heavier foraging, as was seen
in previous studies. However, this study did not
corroborate previously recorded correlations between
panda habitat use and low slope (Reid and Hu 1991;
Schaller et al. 1985), likely because of the relatively
uniform slope within the enclosure.
Our study corroborates studies on other bamboo
species demonstrating the capacity for bamboo to
vegetatively recover from disturbance (Tripathi and
Singh 1996). It is not surprising that bamboo
recovery was most significantly predicted by existing
bamboo cover, since bamboo reproduction is asexual
and derives from the rhizome (Taylor and Qin
1993b). The fact that recovery leveled off at high
bamboo cover suggests that resource competition
dictates an upper limit to growth.
One new finding in this study was that panda
foraging was positively related to future bamboo
recovery. Research on other clonal plants has shown
mixed results, as some studies find positive (Dyer
et al. 1991; Paige and Whitham 1987) and other
studies find negative (Bullock et al. 1994; Rooney
1997) effects of herbivory on clonal reproduction.
The mixed results are likely due to differences in
degree of herbivory and species-specific sensitivities
to understory light and nutrient levels.
One reason for the lack of appreciation for this
phenomenon in pandas in the past is that most studies
have not tracked changes in bamboo across multiple
years, as we have done here. The exception is a recent
3-year study by Wang et al. (2007), which found no
relationship between panda herbivory and subsequent
bamboo growth under heavy foraging by an unknown
number of wild pandas (about 19% of culms foraged
in 3 m2 plots spaced 50 m apart). The reason could
be that their study involved a different bamboo
species (Fargesia qinlingensis), but it may also be
related to a difference in spatial context (foraging
occurred in a spatially constrained space in our case)
and spatial scale of analysis (our study detected an
effect at a larger plot size).
Umbrella bamboo may be especially prone to high
intra-specific competition because it grows from a
pachymorph root system that has short root exten-
sions, thus creating a tightly packed bamboo patch
(Taylor and Qin 1993b). Interspecific competition was
also manifested in the significant negative relation-
ships we found between bamboo recovery and
understory coniferous cover and shrub density in the
first recovery period, since understory trees and shrubs
discourage bamboo growth by utilizing available
light, nutrients, and water (Taylor et al. 2004). This
finding corroborates other studies on the genus
Fargesia that note a high sensitivity to light and
tendency for the bamboo to take on a dense, clumped
distribution in forest canopy gaps where more light is
available (Tao et al. 2008; Wang et al. 2006).
Nonetheless, differences in bamboo recovery between
Plant Ecol (2011) 212:43–54 51
123
the first and second periods in our study suggest its
dynamic nature and highlight the need for long-term
studies.
One reason our models did not explain a larger
percentage of variability could be due to the inherent
uncertainty in estimating bamboo cover. The models
could be improved by incorporating data on bamboo
age classes within the 10 9 10 m plots, since pandas
prefer young shoots (Schaller et al. 1985; Taylor and
Qin 1987). In addition, we may have measured data
at inappropriate scales, since little is known about the
spatial scale at which each of the predicted habitat
characteristics is important for pandas. Further stud-
ies should be conducted on varied spatial scales.
Spatial patterns of bamboo loss and recovery
The spatial analysis in this study was informative
because it provided a means to quantify the clumped
distribution of bamboo loss and recovery. While the
significant positive spatial autocorrelation in bamboo
loss to foraging was typical of an animal foraging
effect (Meisel and Turner 1998), the variation we
observed across the 2 years of foraging was espe-
cially meaningful. The increase in range of spatial
autocorrelation of panda foraging from the first to the
second year (Fig. 1) suggests that the panda foraged
across a larger spatial scale as resources became
limited. This pattern could reflect the decline in
bamboo availability, particularly at previously heav-
ily foraged sites. Thus, the panda may have been
forced to use what could have been lower quality
sites over a broader surrounding area.
This hypothesis is supported by the marked
decrease in the panda’s consumption in the second
period (Table 1). Certainly, the two periods are not
equivalent because only the first included a bamboo
growing season. However, one would expect more
culms to be consumed in the second period, given
that older culms contain only about one-fifth of the
protein of the first-year culms during their growing
season (Schaller et al. 1985). Not only did the panda
forage on fewer bamboo culms in the second period,
but it was forced to feed on the less suitable older
bamboos, since it depleted the preferred first-year
culms during the growing season.
The range of spatial autocorrelation of bamboo
recovery across the two recovery periods was probably
similar because recovery was spatially constrained by
the bamboo rhizome structure, making spatial cluster-
ing consistent and limited to short lag distances. It was
nonetheless interesting to measure this component
relative to bamboo loss, a phenomenon dictated by an
animal roaming across a greater spatial range with
temporal variability in behavior.
Implications for conservation
The panda’s impact on the enclosed bamboo popula-
tion offers a glimpse into the damage a single panda
could do to a bamboo population in a constrained
setting. At the same time, the marked recovery of the
bamboo population after one growing season without
a panda present highlights the value of forest
connectivity in this system. Forest connectivity allows
a panda to freely move from one place to another as it
consumes large amounts of bamboo each day, thereby
diluting its foraging impact across a broader area and
allowing periods for bamboo recovery.
Nonetheless, it is important to recognize the
limitations in this study which stem from the actions
of a single, non-wild panda living in an enclosure.
The results thus cannot be directly extrapolated to
wild conditions. However, the study presented an
interesting opportunity for an experiment about the
response of a bamboo population subjected to
constrained panda foraging for a sustained period,
which is certainly a theoretical future scenario for
bamboo–wild panda interaction without further man-
agement intervention, given past rates of habitat
destruction (Liu et al. 1999, 2001).
This study has implications for foraging impacts of
other animal species on vegetation, particularly those
with increasingly isolated habitats. The insights we
gathered across multiple years suggest that there are
temporal dynamics in vegetation responses to con-
strained foraging that make persistent monitoring nec-
essary. As human impacts threaten natural resources
worldwide, studies like this, including replications in
fragmented habitats, are needed to empirically exam-
ine responses of animals to isolated resources.
Acknowledgments We thank the administration at Wolong
Nature Reserve, China for their support. We are indebted to our
field workers, including L. Cheng, S. Fan, M. Li, W. Liu,
O. Moy, S. Song, Y. Tan, W. Yang, and Y. Zhang. We thank the
National Science Foundation, the Natural Science Foundation
of China, Michigan State University’s University Distinguished
Fellowship Program, the Taylor International Engagement
52 Plant Ecol (2011) 212:43–54
123
Fellowship Program, and the Rocky Mountain Goat Foundation
for providing funding for this project.
References
Abrahams MV (1986) Patch choice under perceptual con-
straints: a cause for departure from an ideal free distri-
bution. Behav Ecol Sociobiol 19:409–415
Ammer C (1996) Impact of ungulates on structure and
dynamics of natural regeneration of mixed mountain
forests in the Bavarian Alps. For Ecol Manag 88:43–53
Augustine DJ, McNaughton SJ (1998) Ungulate effects on the
functional species composition of plant communities:
herbivore selectivity and plant tolerance. J Wildl Manag
62:1165–1183
Bailey TC, Gatrell AC (1995) Interactive spatial data analysis.
Prentice-Hall, Harlow
Bullock JM, Hill BC, Silvertown J (1994) Tiller dynamics
of two grasses—responses to grazing, density and weather.
J Ecol 82:331–340
Cote SD, Rooney TP, Tremblay J-P, Dussault C, Waller DM
(2004) Ecological impacts of deer overabundance. Ann
Rev Ecol Evol Syst 35:113–147
Cressie N, Hawkins DM (1980) Robust estimation of the
variogram. I. Math Geol 12:115–125
Dyer MI, Turner CL, Seastedt TR (1991) Mowing and fertil-
ization effect on productivity and spectral reflectance in
Bromus Inermis plots. Ecol Appl 1:443–452
Environmental Systems Research Institute (2001) Getting to
know ArcGIS desktop: basics of ArcView, ArcEditor, and
ArcInfo. ESRI, Redlands, CA
Fu B, Wang K, Lu Y, Liu S, Ma K, Chen L, Liu G (2004)
Entangling the complexity of protected area management:
the case of Wolong Biosphere Reserve, southwestern
China. Environ Manag 33:788–798
Hu J, Wei F (2004) Comparative ecology of giant pandas in the
five mountain ranges of their distribution in China. In:
Lindburg D, Baragona K (eds) Giant pandas: biology and
conservation. University of California Press, Berkeley,
CA, pp 137–148
Jenness J (2004) Nearest features (nearfeat.avx) extension for
ArcView 3.x, v. 3.8a. Jenness Enterprises. http://www.jen
nessent.com/arcview/nearest_features.htm. Accessed 10
Jan 2005
Legendre P, Dale MRT, Fortin M-J, Gurevitch J, Hohn M,
Myers D (2002) The consequences of spatial structure for
the design and analysis of ecological field surveys. Eco-
graphy 25:601–615
Lichstein JW, Simons TR, Shriner SA, Franzreb KE (2002)
Spatial autocorrelation and autoregressive models in
ecology. Ecol Monogr 72:445–463
Liu JG, Ouyang Z, Taylor WW, Groop R, Tan KC, Zhang HM
(1999) A framework for evaluating the effects of human
factors on wildlife habitat: the case of giant pandas.
Conserv Biol 13:1360–1370
Liu J, Linderman M, Ouyang Z, An L, Yang J, Zhang H (2001)
Ecological degradation in protected areas: the case of
Wolong Nature Reserve for giant pandas. Science 292:98–101
Liu J, Daily GC, Ehrlich PR, Luck GW (2003a) Effects of
household dynamics on resource consumption and biodi-
versity. Nature 421:530–533
Liu J, Ouyang Z, Pimm S, Raven P, Wang X, Miao H, Han N
(2003b) Protecting China’s biodiversity. Science
300:1240–1241
Liu X, Toxopeus AG, Skidmore AK, Shao X (2005) Giant
panda habitat selection in Foping Nature Reserve, China.
J Wildl Manag 69:1623–1632
Loucks CJ, Lu Z, Dinerstein E, Wang D, Olson DM, Zhu C,
Wang D (2001) Giant pandas in a changing landscape.
Science 294:1465
Martin J-L, Stockton S, Allombert S, Gaston A (2010) Top-
down and bottom-up consequences of unchecked ungulate
browsing on plant and animal diversity in temperate for-
ests: lessons from a deer introduction. Biol Invasions
12:353–371
Meisel J, Turner MG (1998) Scale detection in real and arti-
ficial landscapes using semivariance analysis. Landsc
Ecol 13:347–362
Morrison ML, Marcot BG, Mannan RW (2006) Wildlife–
habitat relationships: concepts and applications. Island
Press, Washington, DC
Paige KN, Whitham TG (1987) Overcompensation in response
to mammalian herbivory: the advantage of being eaten.
Am Nat 129:407
Pimm SL, Russell GJ, Gittleman JL, Brooks TM (1995) The
future of biodiversity. Science 269:347–350
R Development Core Team (2005) R: a language and envi-
ronment for statistical computing. R Foundation for Sta-
tistical Computing, Vienna
Reid DG, Hu J (1991) Giant panda selection between Bashaniafangiana bamboo habitats in Wolong Reserve, Sichuan,
China. J Appl Ecol 28:228–243
Rooney TP (1997) Escaping herbivory: refuge effects on the
morphology and shoot demography of the clonal forest
herb Maianthemum canadense. J Torrey Bot Soc
124:280–285
Rooney TP, Waller DM (2003) Direct and indirect effects of
white-tailed deer in forest ecosystems. For Ecol Manag
181:165–176
Schaller GB, Hu J, Pan W, Zhu J (1985) The giant pandas of
Wolong. University of Chicago Press, Chicago, IL
Stamps JA (1998) Conspecific attraction and aggregation in
territorial species. Am Nat 131:329–347
State Forestry Administration (2006) The 3rd national survey
report on giant panda in China. Science Publisher, Beijing
Tao J, Song L, Wang Y, Zhang W (2008) Response of clonal
plasticity of Fargesia nitida to different canopy conditions
of subalpine coniferous forest. Front Biol China 3:463–
469
Taylor AH, Qin Z (1987) Culm dynamics and dry matter
production of bamboos in the Wolong and Tangjiahe giant
panda reserves, Sichuan, China. J Appl Ecol 24:419–433
Taylor AH, Qin ZS (1993a) Aging bamboo culms to assess
bamboo population-dynamics in panda habitat. Environ
Conserv 20:76–79
Taylor AH, Qin ZS (1993b) Structure and dynamics of bam-
boos in the Wolong Natural Reserve, China. Am J Bot
80:375–384
Plant Ecol (2011) 212:43–54 53
123
Taylor AH, Qin Z (1997) The dynamics of temperate bamboo
forests and panda conservation in China. In: Chapman GP
(ed) The bamboos. The Linnean Society of London,
London, pp 189–203
Taylor AH, Huang J, Zhou S (2004) Canopy tree development
and undergrowth bamboo dynamics in old-growth Abies-
Betula forests in southwestern China: a 12-year study. For
Ecol Manag 200:347–360
Tripathi S, Singh K (1996) Culm recruitment, dry matter
dynamics and carbon flux in recently harvested and
mature bamboo savannas in the Indian dry tropics. Ecol
Res 11:149–164
Valcu M, Kempenaers B (2010) Is spatial autocorrelation an
intrinsic property of territory size? Oecologia 162:609–615
Wang W, Franklin SB, Ren Y, Ouellette JR (2006) Growth of
bamboo Fargesia qinlingensis and regeneration of trees in
a mixed hardwood-conifer forest in the Qinling Moun-
tains, China. For Ecol Manag 234:107–115
Wang W, Franklin SB, Ouellette JR (2007) Clonal regeneration
of an arrow bamboo, Fargesia qinlingensis, following
giant panda herbivory. Plant Ecol 192:97–106
Yu G, Jiang Z, Zhao Z, Wang B, Wang Y (2003) Feeding
habitat of giant pandas (Ailuropoda melanoleuca): why do
they prefer bamboo patch edges? J Zool 261:307–312
Zhang Z, Wei F, Li M, Hu J (2006) Winter microhabitat sep-
aration between giant and red pandas in Bashania faberibamboo forest in Fengtongzhai Nature Reserve. J Wildl
Manag 70:231–235
Zhou S, Huang J, Wang P, Zhang H (2004) A study on the
feature of bamboo growth and biomass structure in giant
panda’s field training area. J Bamboo Res 23:21–25
54 Plant Ecol (2011) 212:43–54
123