Computational Modeling of Variable-Droop Leading Edge in Forward Flight
Upload
khangminh22Category
view
2download
0
Technical Design Report for:
PANDAForward Time of Flight detector (FToF wall)
(AntiProton Annihilations at Darmstadt)
Strong Interaction Studies with Antiprotons
PANDA Collaboration
January 19, 2018

ii PANDA - Strong interaction studies with antiprotons
Cover: General view of the forward time-of-flight (FToF) scintillation wall positioned at 7.5 meterdownstream of the target in the Forward Spectrometer of the PANDA experiment. This documentdescribes in details the design and performance of the FToF wall detector.

FAIR/Pbar/Technical Design Report - FToF iii
The PANDA Collaboration
2017-04-01 03:15:01
Aligarth Muslim University, Physics Department, Aligarth, IndiaB. Singh
Universitat Basel, Basel, SwitzerlandW. Erni, B. Krusche, M. Steinacher, N. Walford
Institute of High Energy Physics, Chinese Academy of Sciences, Beijing, ChinaB. Liu, H. Liu, Z. Liu, X. Shen, C. Wang, J. Zhao
Ruhr-Universitat Bochum, Institut fur Experimentalphysik I, Bochum, GermanyM. Albrecht, T. Erlen, F. Feldbauer, M. Fink, M. Fritsch, J. Haase, F.H. Heinsius, T. Held,
T. Holtmann, I. Keshk, H. Koch, B. Kopf, M. Kuhlmann, M. Kummel, S. Leiber, M. Mikirtychyants,P. Musiol, A. Mustafa, M. Pelizaus, A. Pitka, J. Pychy, M. Richter, C. Schnier, T. Schroder, C. Sowa,
M. Steinke, T. Triffterer, U. Wiedner
Rheinische Friedrich-Wilhelms-Universitat Bonn, Bonn, GermanyM. Ball, R. Beck, C. Hammann, B. Ketzer, M. Kube, P. Mahlberg, M. Rossbach, C. Schmidt,
R. Schmitz, U. Thoma, M. Urban, D. Walther, C. Wendel, A. Wilson
Universita di Brescia, Brescia, ItalyA. Bianconi
Institutul National de C&D pentru Fizica si Inginerie Nucleara ”Horia Hulubei”, Bukarest-Magurele,Romania
M. Bragadireanu, D. Pantea
P.D. Patel Institute of Applied Science, Department of Physical Sciences, Changa, IndiaB. Patel
University of Technology, Institute of Applied Informatics, Cracow, PolandW. Czyzycki, M. Domagala, G. Filo, J. Jaworowski, M. Krawczyk, E. Lisowski, F. Lisowski,
M. Micha lek, P. Poznanski, J. P lazek
IFJ, Institute of Nuclear Physics PAN, Cracow, PolandK. Korcyl, A. Kozela, P. Kulessa, P. Lebiedowicz, K. Pysz, W. Schafer, A. Szczurek
AGH, University of Science and Technology, Cracow, PolandT. Fiutowski, M. Idzik, B. Mindur, K. Swientek
Instytut Fizyki, Uniwersytet Jagiellonski, Cracow, PolandJ. Biernat, B. Kamys, S. Kistryn, G. Korcyl, W. Krzemien, A. Magiera, P. Moskal, A. Pyszniak,
Z. Rudy, P. Salabura, J. Smyrski, P. Strzempek, A. Wronska
FAIR, Facility for Antiproton and Ion Research in Europe, Darmstadt, GermanyI. Augustin, R. Bohm, I. Lehmann, D. Nicmorus Marinescu, L. Schmitt, V. Varentsov
GSI Helmholtzzentrum fur Schwerionenforschung GmbH, Darmstadt, GermanyM. Al-Turany, A. Belias, H. Deppe, N. Divani Veis, R. Dzhygadlo, H. Flemming, A. Gerhardt,
K. Gotzen, A. Gromliuk, L. Gruber, R. Karabowicz, R. Kliemt, M. Krebs, U. Kurilla, D. Lehmann,S. Lochner, J. Luhning, U. Lynen, F. Nerling, H. Orth, M. Patsyuk, K. Peters, T. Saito, G. Schepers, C.
J. Schmidt, C. Schwarz, J. Schwiening, A. Taschner, M. Traxler, C. Ugur, B. Voss, P. Wieczorek,A. Wilms, M. Zuhlsdorf
Veksler-Baldin Laboratory of High Energies (VBLHE), Joint Institute for Nuclear Research, Dubna,Russia
V. Abazov, G. Alexeev, V. A. Arefiev, V. Astakhov, M. Yu. Barabanov, B. V. Batyunya, Y. Davydov,V. Kh. Dodokhov, A. Efremov, A. Fechtchenko, A. G. Fedunov, A. Galoyan, S. Grigoryan, E.

iv PANDA - Strong interaction studies with antiprotons
K. Koshurnikov, Y. Yu. Lobanov, V. I. Lobanov, A. F. Makarov, L. V. Malinina, V. Malyshev, A.G. Olshevskiy, E. Perevalova, A. A. Piskun, T. Pocheptsov, G. Pontecorvo, V. Rodionov, Y. Rogov,R. Salmin, A. Samartsev, M. G. Sapozhnikov, G. Shabratova, N. B. Skachkov, A. N. Skachkova, E.
A. Strokovsky, M. Suleimanov, R. Teshev, V. Tokmenin, V. Uzhinsky, A. Vodopianov, S.A. Zaporozhets, N. I. Zhuravlev, A. Zinchenko
University of Edinburgh, Edinburgh, United KingdomD. Branford, D. Glazier, D. Watts
Friedrich Alexander Universitat Erlangen-Nurnberg, Erlangen, GermanyM. Bohm, A. Britting, W. Eyrich, A. Lehmann, M. Pfaffinger, F. Uhlig
Northwestern University, Evanston, U.S.A.S. Dobbs, K. Seth, A. Tomaradze, T. Xiao
Universita di Ferrara and INFN Sezione di Ferrara, Ferrara, ItalyD. Bettoni, V. Carassiti, A. Cotta Ramusino, P. Dalpiaz, A. Drago, E. Fioravanti, I. Garzia, M. Savrie
Frankfurt Institute for Advanced Studies, Frankfurt, GermanyV. Akishina, S. Gorbunov, I. Kisel, G. Kozlov, M. Pugach, M. Zyzak
INFN Laboratori Nazionali di Frascati, Frascati, ItalyP. Gianotti, C. Guaraldo, V. Lucherini
INFN Sezione di Genova, Genova, ItalyA. Bersani, G. Bracco, M. Macri, R. F. Parodi
Justus Liebig-Universitat Gießen II. Physikalisches Institut, Gießen, GermanyK. Biguenko, K.T. Brinkmann, V. Di Pietro, S. Diehl, V. Dormenev, M. Duren, E. Etzelmuller,
M. Galuska, E. Gutz, C. Hahn, A. Hayrapetyan, M. Kesselkaul, K. Kreutzfeldt, W. Kuhn, T. Kuske, J.S. Lange, Y. Liang, V. Metag, M. Moritz, M. Nanova, R. Novotny, T. Quagli, S. Reiter, A. Riccardi,J. Rieke, C. Rosenbaum, M. Schmidt, R. Schnell, H. Stenzel, U. Thoring, M. N. Wagner, T. Wasem,
B. Wohlfahrt, H.G. Zaunick
IRFU, CEA, Universite Paris-Saclay, Gif-sur-Yvette Cedex, FranceE. Tomasi-Gustafsson
University of Glasgow, Glasgow, United KingdomD. Ireland, G. Rosner, B. Seitz
Birla Institute of Technology and Science, Pilani, K K Birla Goa Campus, Goa, IndiaP.N. Deepak, A. Kulkarni
KVI-Center for Advanced Radiation Technology (CART), University of Groningen, Groningen,Netherlands
A. Apostolou, M. Babai, M. Kavatsyuk, P. J. Lemmens, M. Lindemulder, H. Loehner, J. Messchendorp,P. Schakel, H. Smit, M. Tiemens, J. C. van der Weele, R. Veenstra, S. Vejdani, S. Vejdani
Gauhati University, Physics Department, Guwahati, IndiaK. Dutta, K. Kalita
Indian Institute of Technology Indore, School of Science, Indore, IndiaA. Kumar, A. Roy
Fachhochschule Sudwestfalen, Iserlohn, GermanyH. Sohlbach
Forschungszentrum Julich, Institut fur Kernphysik, Julich, GermanyM. Bai, L. Bianchi, M. Buscher, L. Cao, A. Cebulla, R. Dosdall, A. Erven, V. Fracassi, A. Gillitzer,F. Goldenbaum, D. Grunwald, A. Herten, Q. Hu, L. Jokhovets, G. Kemmerling, H. Kleines, A. Lai,
A. Lehrach, R. Nellen, H. Ohm, S. Orfanitski, D. Prasuhn, E. Prencipe, J. Putz, J. Ritman,E. Rosenthal, S. Schadmand, T. Sefzick, V. Serdyuk, G. Sterzenbach, T. Stockmanns, P. Wintz,
P. Wustner, H. Xu
Chinese Academy of Science, Institute of Modern Physics, Lanzhou, ChinaS. Li, Z. Li, Z. Sun, H. Xu

FAIR/Pbar/Technical Design Report - FToF v
INFN Laboratori Nazionali di Legnaro, Legnaro, ItalyV. Rigato
Lunds Universitet, Department of Physics, Lund, SwedenL. Isaksson
Johannes Gutenberg-Universitat, Institut fur Kernphysik, Mainz, GermanyP. Achenbach, A. Aycock, O. Corell, A. Denig, M. Distler, M. Hoek, A. Karavdina, W. Lauth, Z. Liu,
H. Merkel, U. Muller, J. Pochodzalla, S. Sanchez, S. Schlimme, C. Sfienti, M. Thiel
Helmholtz-Institut Mainz, Mainz, GermanyH. Ahmadi, S. Ahmed , S. Bleser, L. Capozza, M. Cardinali, A. Dbeyssi, M. Deiseroth, A. Ehret,
B. Frohlich, D. Kang, D. Khaneft, R. Klasen, H. H. Leithoff, D. Lin, F. Maas, S. Maldaner,M. Martınez, M. Michel, M. C. Mora Espı, C. Morales Morales, C. Motzko, O. Noll, S. Pfluger,
D. Rodrıguez Pineiro, A. Sanchez-Lorente, M. Steinen, R. Valente, M. Zambrana, I. Zimmermann
Research Institute for Nuclear Problems, Belarus State University, Minsk, BelarusA. Fedorov, M. Korjik, O. Missevitch
Moscow Power Engineering Institute, Moscow, RussiaA. Balashoff, A. Boukharov, O. Malyshev, I. Marishev
Institute for Theoretical and Experimental Physics, Moscow, RussiaP. Balanutsa, V. Balanutsa, V. Chernetsky, A. Demekhin, A. Dolgolenko, P. Fedorets, A. Gerasimov,
V. Goryachev
Nuclear Physics Division, Bhabha Atomic Research Centre, Mumbai, IndiaV. Chandratre, V. Datar, D. Dutta, V. Jha, H. Kumawat, A.K. Mohanty, A. Parmar, A. K. Rai,
B. Roy, G. Sonika
Westfalische Wilhelms-Universitat Munster, Munster, GermanyC. Fritzsch, S. Grieser, A.K. Hergemoller, B. Hetz, N. Husken, A. Khoukaz, J. P. Wessels
Suranaree University of Technology, Nakhon Ratchasima, ThailandK. Khosonthongkee, C. Kobdaj, A. Limphirat, P. Srisawad, Y. Yan
Budker Institute of Nuclear Physics, Novosibirsk, RussiaE. Antokhin, A. Yu. Barnyakov, M. Barnyakov, K. Beloborodov, V. E. Blinov, V. S. Bobrovnikov, I.
A. Kuyanov, K. Martin, A. P. Onuchin, S. Pivovarov, E. Pyata, S. Serednyakov, A. Sokolov,Y. Tikhonov
Novosibirsk State University, Novosibirsk, RussiaA. E. Blinov, S. Kononov, E. A. Kravchenko
Institut de Physique Nucleaire, CNRS-IN2P3, Univ. Paris-Sud, Universite Paris-Saclay, 91406, Orsaycedex, France
E. Atomssa, R. Kunne, D. Marchand, B. Ramstein, J. van de Wiele, Y. Wang
Dipartimento di Fisica, Universita di Pavia, INFN Sezione di Pavia, Pavia, ItalyG. Boca, S. Costanza, P. Genova, P. Montagna, A. Rotondi
Charles University, Faculty of Mathematics and Physics, Prague, Czech RepublicM. Bodlak, M. Finger, M. Finger, A. Nikolovova, M. Pesek, M. Peskova, M. Pfeffer, I. Prochazka,
M. Slunecka
Czech Technical University, Faculty of Nuclear Sciences and Physical Engineering, Prague, CzechRepublic
P. Gallus, V. Jary, J. Novy, M. Tomasek, M. Virius, V. Vrba
Institute for High Energy Physics, Protvino, RussiaV. Abramov, N. Belikov, S. Bukreeva, A. Davidenko, A. Derevschikov, Y. Goncharenko, V. Grishin,
V. Kachanov, V. Kormilitsin, A. Levin, Y. Melnik, N. Minaev, V. Mochalov, D. Morozov, L. Nogach,S. Poslavskiy, A. Ryazantsev, S. Ryzhikov, P. Semenov, I. Shein, A. Uzunian, A. Vasiliev, A. Yakutin
Sikaha-Bhavana, Visva-Bharati, WB, Santiniketan, IndiaU. Roy

vi PANDA - Strong interaction studies with antiprotons
University of Sidney, School of Physics, Sidney, AustraliaB. Yabsley
National Research Centre ”Kurchatov Institute” B. P. Konstantinov Petersburg Nuclear PhysicsInstitute, Gatchina, St. Petersburg, Russia
S. Belostotski, G. Gavrilov, A. Izotov, S. Manaenkov, O. Miklukho, D. Veretennikov, A. Zhdanov
Stockholms Universitet, Stockholm, SwedenK. Makonyi, M. Preston, P.E. Tegner, D. Wolbing
Kungliga Tekniska Hogskolan, Stockholm, SwedenT. Back, B. Cederwall
Veer Narmad South Gujarat University, Department of Physics, Surat, IndiaS. Godre
Politecnico di Torino and INFN Sezione di Torino, Torino, ItalyF. Balestra, F. Iazzi, R. Introzzi, A. Lavagno, J. Olave
Universita di Torino and INFN Sezione di Torino, Torino, ItalyA. Amoroso, M. P. Bussa, L. Busso, M. Destefanis, L. Fava, L. Ferrero, M. Greco, J. Hu, L. Lavezzi,
M. Maggiora, G. Maniscalco, S. Marcello, S. Sosio, S. Spataro
INFN Sezione di Torino, Torino, ItalyD. Calvo, S. Coli, P. De Remigis, A. Filippi, G. Giraudo, S. Lusso, G. Mazza, M. Mignone, A. Rivetti,
R. Wheadon
Universita di Trieste and INFN Sezione di Trieste, Trieste, ItalyR. Birsa, F. Bradamante, A. Bressan, A. Martin
Uppsala Universitet, Institutionen for fysik och astronomi, Uppsala, SwedenH. Calen, W. Ikegami Andersson, T. Johansson, A. Kupsc, P. Marciniewski, M. Papenbrock,
J. Pettersson, K. Schonning, M. Wolke
The Svedberg Laboratory, Uppsala, SwedenB. Galnander
Instituto de Fısica Corpuscular, Universidad de Valencia-CSIC, Valencia, SpainJ. Diaz
Sardar Patel University, Physics Department, Vallabh Vidynagar, IndiaV. Pothodi Chackara
National Centre for Nuclear Research, Warsaw, PolandA. Chlopik, G. Kesik, D. Melnychuk, B. Slowinski, A. Trzcinski, M. Wojciechowski, S. Wronka,
B. Zwieglinski
Osterreichische Akademie der Wissenschaften, Stefan Meyer Institut fur Subatomare Physik, Wien,Austria
P. Buhler, J. Marton, D. Steinschaden, K. Suzuki, E. Widmann, S. Zimmermann, J. Zmeskal

FAIR/Pbar/Technical Design Report - FToF vii
Editors: Stanislav Belostotski Email: [email protected]
Anton Izotov Email: [email protected]
Oleg Miklukho Email: [email protected]
Yury Naryshkin Email: [email protected]
Denis Veretennikov Email: [email protected]
Andrei Zhdanov Email: [email protected]
Technical Coordinator: Lars Schmitt Email: [email protected]: Anastasios Belias Email: [email protected]
Spokesperson: Klaus Peters Email: [email protected]: Tord Johansson Email: [email protected]

viii PANDA - Strong interaction studies with antiprotons

FAIR/Pbar/Technical Design Report - FToF ix
Preface
This document is a Technical Design Re-port (TDR) which presents the status of thePANDA Forward Time-of-Flight (FToF) walldesign. The FToF wall is a system of largescintillation counters which intends to detect,per event basis the timestamps of particlesemitted within the acceptance of the PANDAForward spectrometer. The overall timingresolution of the system is better than 100ps. The FToF wall is assumed to be used forParicle Indentification (PID) of forward go-ing hadrons with momenta below 4 GeV bytime-of-flight criterion.

x PANDA - Strong interaction studies with antiprotons
The use of registered names, trademarks, etc. in this publicationdoes not imply, even in the absence of specific statement, thatsuch names are exempt from the relevant laws and regulationsand therefore free for general use.

xi
Contents
Preface ix
1 Executive summary 1
1.1 The scientific program of thePANDA experiment . . . . . . . . . 1
1.2 The PANDA spectrometer andTime-of-Flight detectors . . . . . . 1
1.3 The Forward ToF wall functions . . 3
1.4 Technical requirements for theFToF wall . . . . . . . . . . . . . . 3
1.5 The Forward ToF wall design . . . 3
1.6 Prototyping . . . . . . . . . . . . . 4
1.7 Monte Carlo simulation . . . . . . . 4
1.8 Design validation . . . . . . . . . . 5
References . . . . . . . . . . . . . . . . . . 5
2 The PANDA experiment 7
2.1 High Energy Storage Ring (HESR) . 7
2.2 The targets . . . . . . . . . . . . . 7
2.3 The Detector . . . . . . . . . . . . . 8
2.4 Target Spectrometer . . . . . . . . 8
2.5 Forward Spectrometer . . . . . . . 10
2.6 Particle identification system . . . . 10
2.7 Data Acquisition . . . . . . . . . . 10
2.8 Infrastructure . . . . . . . . . . . . 11
References . . . . . . . . . . . . . . . . . . 11
3 Technical design considerations ofthe FToF wall 13
3.1 General requirements . . . . . . . . 13
3.2 Plastic scintillators . . . . . . . . . 13
3.3 Energy depositions and dynamicrange . . . . . . . . . . . . . . . . . 14
3.4 Selection of photodetectors . . . . . 16
3.4.1 Photomultiplier Tubes . . . . . 16
3.4.2 Silicon Photomultipliers . . . . . 17
3.5 Readout electronics . . . . . . . . . 17
3.6 Mechanics, cabling, integration . . . 20
3.7 Safety regulation . . . . . . . . . . 20
3.8 Summary . . . . . . . . . . . . . . . 20
References . . . . . . . . . . . . . . . . . . 22
4 Physics case of FToF, MC study 25
4.1 Forward spectrometer time-of-flightPID . . . . . . . . . . . . . . . . . . 25
4.2 Count rate and background estima-tions . . . . . . . . . . . . . . . . . 27
4.3 Λ hyperon detection with FToF wall 32
4.4 Interplay between FToF wall andSciTil detectors . . . . . . . . . . . 33
4.5 Time-dependent Monte Carlo simu-lation . . . . . . . . . . . . . . . . . 36
4.6 Optimization of the scintillatorthickness and light guide configura-tion . . . . . . . . . . . . . . . . . . 36
4.7 PID and time resolution variants . 37
References . . . . . . . . . . . . . . . . . . 37
5 Experimental study of prototypes 39
5.1 Study of photodetectors using test-station . . . . . . . . . . . . . . . . 39
5.1.1 Test-station. General remarks. . 39
5.1.2 Investigation of PMTs . . . . . 39
5.1.3 Measurement of SiPM charac-teristics . . . . . . . . . . . . . . 40
5.2 Study of prototypes using protonbeam . . . . . . . . . . . . . . . . . 43
5.2.1 Introduction . . . . . . . . . . . 43
5.2.2 Test of scintillation counter pro-totypes at the PNPI synchrocy-clotron . . . . . . . . . . . . . . 43
5.2.3 Readout electronics . . . . . . . 45
5.2.4 Data analysis . . . . . . . . . . 46
5.2.5 Tests with 730 MeV protons . . 48
5.2.6 Tests with 920 MeV protons . . 48
5.2.7 Measurements with 2000 MeVproton test beam of COSY ac-celerator . . . . . . . . . . . . . 49
5.2.8 Comments on the necessity ofhit position measurements andtime resolution . . . . . . . . . . 51

xii PANDA - Strong interaction studies with antiprotons
5.3 Summary of experimental study ofprototypes . . . . . . . . . . . . . . 52
5.4 Outlook for further experimentalstudies . . . . . . . . . . . . . . . . 54
References . . . . . . . . . . . . . . . . . . 55
6 Calibration and monitoring 57
References . . . . . . . . . . . . . . . . . . 58
7 Project management 59
7.1 Responsibility . . . . . . . . . . . . 59
7.2 Work packages . . . . . . . . . . . . 59
7.3 Timelines and milestones . . . . . . 59
8 Conclusion 63
Acknowledgments 64

1
1 Executive summary
1.1 The scientific program ofthe PANDA experiment
The PANDA (AntiProton ANihilation at DArm-stadt) experiment [1] is one of the key projectsat the future Facility for Antiproton and Ion Re-search (FAIR), which is currently under construc-tion at GSI, Darmstadt. The FAIR acceleratorswill deliver primary proton and ion beams, as wellas secondary beams of p or radioactive ions of highintensity and high quality.
The PANDA experiment will perform precise stud-ies of pp annihilations and reactions of p withnucleons of heavier nuclear targets. It will ben-efit from p beams with unprecedented intensityand quality provided by the High Energy StorageRing (HESR) in the momentum range from 1.5 to15 GeV/c. In a high momentum resolution mode(HR) of HESR the relative momentum spread ofthe beam is reduced to 5×10⁻⁵ with 1010 circulat-ing p at the peak luminosity of 2× 1031cm−2s−1.In a high luminosity mode (HL) the peak luminos-ity reaches 2 × 1032 cm−2s−1 at the same targetdensity. The relative momentum spread in thisregime is expected to be about 10−4. The HRand HL modes are established to meet the chal-lenging requirements of the PANDA experimentalprogram.
The PANDA experiment exploits an extraordinaryphysics potential of the projected high qualityp beams. The main experimental topics of thehadron physics program [2][3][4] are briefly item-ized in the following.
Charmonium Spectroscopy. Precise measure-ments of all states below and above the opencharm threshold is of great importance for QCD.All charmonium states can be formed directlyin pp annihilation in the invariant mass range2.25 < M(pp) < 5.46 GeV. At full luminosity,PANDA will be able to collect several thousandcc states per day. By means of beam momentumscans, it will be possible to measure masses withaccuracies of the order of 100 keV and widths to10%, or better.
Search for Gluonic Excitations. One of the mainchallenges of hadron physics is a search for gluonicexcitations: i.e., hadrons consisting of pure glueand hybrids, which consist of a qq pair and excitedglue. Due to additional gluon degrees of freedom,
these objects may have exotic quantum numbersJ/ψ, which make their experimental identificationeasier. Specifically, further exploration of recentlydiscovered X, Y , and Z (cc like) states is as-sumed, as well as searches for multi-quark (quarkmolecule) states.
Electromagnetic Processes. It has been shownthat a study of proton form factors is feasible inthe time-like region by measuring the pp→ e+e−
exclusive channel up to S = 14 GeV2. The statis-tical precision of these measurements is expectedto surpass essentially that of the existing to dateworld data. In order to access the “unphysicalregion” S < (2Mp)
2 the inelastic pp → e+e−π0
channel is also planned to be studied.
Study of Hadrons in Nuclear Matter. So far, ex-periments have been focused on the light quarksector. The high-intensity p beam of up to 15GeV/c will allow one an extension of this pro-gram to the charm sector both for hadrons withhidden and open charm.
Hyperon Physics. The p beam at FAIR allowsto efficiently produce hypernuclei with more thanone strange hadron, making PANDA competitivewith the planned dedicated experiments. An-other aspect of the hyperon (and charm) physicsis the measurement of the cross sections and po-larization parameters in exclusive reactions likepp → ΛΛ, pp → ΞΞ, pp → ΩΩ, pp → ΛcΛc. Thestudy of production of multi-strange and charmbaryons is of particular interest.
There are also many other important and chal-lenging topics, like, e.g., CP violation in the hy-peron sector, which are still under investigationand not presented in the experimental programdiscussed above.
1.2 The PANDA spectrometerand Time-of-Flightdetectors
The PANDA experiment is designed to achieve4π solid angle coverage, high resolution for track-ing, good particle identification, high precisioncalorimetry, high rate capabilities, with a versa-tile readout and event selection. A detailed de-scription of the PANDA detector can be found in

2 PANDA - Strong interaction studies with antiprotons
Ref.[5]. The p beam interacts with a cluster or pel-let hydrogen target, or with a deuterium or heavynucleus target. The detector is composed of twomagnetic spectrometers: the Target Spectrometer(TS), based on a superconducting solenoid mag-net and the Forward Spectrometer (FS) based ona dipole magnet. The TS is designed to provide a4π solid angle coverage around interaction point,while the FS is used to cover small polar angles inthe forward region.
The PANDA spectrometers comprise a variety ofsub-detectors dedicated to measure tracks of pro-duced particles, their energy deposit, Cerenkovlight and timing. The most important character-istics are listed below:
• Possibility of mass scan with resolution of 100keV
• Event rate capability of 2× 10⁷ s−1
• Practically 4π acceptance with high detectionefficiency
• Momentum resolution of 0.01
• Event start time reconstruction at picosecondlevel
• Good enough secondary vertex resolution(e.g. for D-meson decay reconstruction)
• Excellent particle identification (γ, e, µ, π,K, p)
• Wide range of photon detection (1 MeV - 10Gev)
In this report, timing measurements are of par-ticular interest. Timing information is foreseen inseveral PANDA sub-detectors (e.g. barrel DIRCor Forward RICH). The high time resolution atthe picosecond level will be provided for thePANDA experiment with two dedicated time-of-flight detectors: the Barrel ToF in the TS andthe Forward ToF wall in the FS.
In addition, the dipole ToF detector was proposedfor detection of low momentum particles stronglydeflected to the left and to the right by the mag-netic field within the dipole. The dipole ToFwould consist of two sets of scintillation counters(left and right sub-detector) to detect particles ofthe opposite charges. It was conceived to equipeach sub-detector with 10 scintillation countersplaced in the rear part of the dipole magnet. Theheight of scintillation slabs and their width was
preliminary designed to be 100 and 10 cm, re-spectively, thus that each sub-detector formed awall with sensitive area of 100 by 100 cm2.
Given a high level of the magnetic field in thedipole, magnetic-field-protected photo-detectorsmust be utilized for the dipole TOF readout. Ac-cording to tests in PNPI the PMT187, productionof the “Electron” firm in St. Petersburg, couldstand (keeping its high timing resolution proper-ties) against magnetic field up to 0.5 T . The latteris essentially less then the level of magnetic fieldin the rear part of the dipole. In general, usingPMTs looks unrealistic in this case.
Another option is to use SiPM’s (AvalancheMicro-Pixel Photo Diodes). Thus investigation oftiming characteristics of KETEK PM6660 withsensitive to irradiated photons active area of 36mm2 showed a very promising result: time reso-lution (σ) of 66 ps has been measured. Practicalapplication of SiPMs will however require addi-tional R&D like thorough study of their radiationhardness, design of appropriate readout, coolingproblem, etc. Also, the dipole TOF technical de-sign must comply with design of the PANDA For-ward Tracking system (FT). The latter has notyet been totally finalized.
The dipole TOF configuration was not optimizedas it ought to be a subject to a Monte Carlo studybased on specific physics cases. Previously doneMonte Carlo simulations showed that the countrate of the secondary hadrons detected with thedipole TOF detector at maximum luminosity isin general very low. Additional MC simulationswhich would include several benchmark reactionsaccording to the PANDA experimental programare needed to demonstrate importance and neces-sity of the dipole TOF detector. Proceeding fromthe above considerations the dipole ToF is not in-cluded in this TDR which is dedicated to the ToFwall only. However, given strong physics motiva-tions for the dipole TOF are demonstrated it willbe presented in a separate document later.
The PNPI group from the National Re-search Center ”Kurchatov Institute”,B.P.KONSTANTINOV PETERSBURG NU-CLEAR PHYSICS INSTITUTE is responsiblefor the design and construction of the ForwardTime-of-Flight (FToF) wall which is presentedin the report. The PNPI group is the only oneworking on this project.
The FToF wall detector is essential both for thestartup period when the Modular Start Version(MSV) of the PANDA experiment will be realized

FAIR/Pbar/Technical Design Report - FToF 3
and for the data taking period with PANDA in itsfull configuration.
1.3 The Forward ToF wallfunctions
Particle identification of low momentum hadrons.One important function of the FToF wall is tomeasure the time of flight of forward particlesemitted within the FS acceptance under labora-tory angles below 5 and 10 in the vertical andhorizontal directions, respectively. The wall isassumed to be positioned at 7.5 m downstreamof the PANDA target. Being positioned down-stream of the FS dipole, it must have a largesensitive area: 560 cm (width) × 140 cm (height).Together with the information on the particlemomentum and its track length as providedby the dipole spectrometer equipped with theforward tracking system (FT), the FToF wallshould identify the hadrons (π, K and p andtheir antiparticles) by the time-of-flight criterion.A reliable p/K and K/π separation is possible atthe momenta below 4.3 and 3 GeV, respectively,provided that the time resolution of the FToFdetector is better than 100 ps. Note that this lowmomentum range is typically below the FRICHthresholds where there is no guarantee for thehadron detection with a high efficiency.
No dedicated start counter in the interaction pointarea is foreseen for the PANDA detector. Thetime-of-flight information is assumed to be ob-tained by using the time correlations between theresponses of two or more scintillation counters ofthe FToF wall. Additionally, the combined infor-mation of the FToF wall and Barrel ToF can beused. The time of flight is extracted offline, partlyin the combination with other criteria, similar tothe HADES experiment at GSI [6].
Determination of the event start T0. As it hasbeen mentioned above, there is no dedicatedstart counter in the PANDA spectrometer de-sign. On the other hand, the determination of theantiproton-target interaction time stamp (eventstart) T0 is one of the crucial point for data anal-ysis. The time stamp of a particle detected witha FToF wall counter, may be used for the roughdetermination of the T0. For a relativistic par-ticle, time-of-flight from the Interaction Point tothe FToF wall position is about 25 + ∆ ns where∆ is not a large additional time-variation due tothe sort of a particle, its scattering angle and mo-mentum analyzed with the help of the FS. Thus
for the momenta larger than 1 GeV ∆ is typicallyless than 20 ns. The T0 can be determined muchmore precisely if a FToF wall particle hit is inde-pendently identified, e.g., with FRICH or Forward(Shashlyk) Calorimeter, or Forward Muon rangesystem, and the particle track is reconstructedwith the FT system. A procedure of the T0 de-termination is also worked out independently bythe BToF group which makes T0 extraction veryreliable and precise in the PANDA detector, inparticular, when the two detectors are involved.
Providing information on energy deposition. Theenergy deposition of the particles detected withthe FToF wall is estimated to vary from 5 to50 MeV (Sec. 3.3). Once using the time-over-threshold (TOT) method for the amplitude cor-rection in timing measurements, this informationis automatically available and can be extracted.
1.4 Technical requirementsfor the FToF wall
The main technical conditions are listed below:
• The time resolution must be better than 100ps
• The FToF wall is positioned at 7.5 m down-stream of the target
• The sensitive area of the scintillation wall is5.6 m (width) × 1.4 m (height)
• The scintillation wall should withstand a highcounting rate corresponding to the maximalluminosity of the PANDA experiment
• The dynamic range of the detector shouldcover all possible variations of energy deposi-tion in the scintillators
1.5 The Forward ToF walldesign
The technical requirements can be satisfied usingcommercially available components. The detectoris modularized to be built of scintillation countersassembled of plastic scintillation slabs with goodtiming characteristics (e.g. Bicron 408) and thefast PMT readout. The counters are placed at7.5 m downstream of the target, forming the wallwith a sensitive area according to the technicalrequirements.

4 PANDA - Strong interaction studies with antiprotons
The wall consists of 66 scintillation counters: 20counters in the central part and 46 counters in theside parts (23 counters on each side). The heightof all the plastic scintillator slabs is 140 cm, andtheir thickness is 2.5 cm, while the width of theslabs is 5 cm and 10 cm for the central and sideparts, respectively. Each scintillator is coupledon both ends by fast PMTs. The HamamatsuPMTs R4998 (1”) and R2083 (2”), for the slabsof 5 and 10 cm width will be used, respectively.There are many firms around the world producingphotomultiplier tubes. There are also some firmsin Russia (e.g. “Electron” in St.Petersburg). Ac-cording to our opinion, the Hamamatsu PMTs canbe characterized as the most reliable with a well-guaranteed specification. The R4998 and R2083Hamamatsu tubes have been tested by us duringa long period in the process of prototyping to-gether with some other PMTs. The performanceof the Hamamtsu PMT was found to be the best.The light guides made of Plexiglas are of the trun-cated cone (fish tail) configuration with differentdimensions for the PMT of 1” or 2” diameter. Inthe center of the wall a rectangular hole (size:20 cm × 20 cm) is left open through which thebeam pipe passes. It is placed off-center becauseof the deflection of the circulating beam by thePANDA dipole. The readout electronics is basedon FPGA systems with four TRB-3 platforms and18 PADIWA3 front-end interface [7, 8, 9] modules.The supporting frame of the FToF detector is po-sitioned on a rail. An option to roll out the systemto the service position is foreseen.
1.6 Prototyping
All the photodetectors used for prototyping werepreliminary tested at the PNPI test station us-ing electrons from β-decay of the radioactive 90Srsource. After the correction for the time walk,the time resolution of about 40-50 ps has been ob-tained for the Hamamatsu R4998 and 2083 PMTs.
The tests with large scintillators have been per-formed using the proton beams of the PNPI syn-chrocyclotron and the COSY accelerator in Julich.The final tests have been made in PNPI withthe help of the MAP magnetic spectrometer se-lecting the 920 MeV secondary protons elasticallyscattered off a hydrogen target. The scintillationcounter prototypes were placed in the focal planeof the spectrometer. The momentum resolutionwas about 1%. The hit position on the slab wasdetermined with 1 mm precision. The dependen-cies of the time resolution on the hit position, en-
Table 1.1: Samples of scintillation counters testedusing 920 MeV protons at PNPI
Slab di-mensions,
cm
Photomultipliertube
Timeresolution(weightedmean), ps
140×10×2.5Hamamatsu
R208365
140× 5× 2.5Hamamatsu
R499860
ergy deposition (scintillator thickness), scintilla-tion slab width and count rate load were investi-gated. The raw time resolution (σ) varied from140 to 230 ps. After applying the amplitude andhit position corrections the resolution better than100 ps was obtained ( the weighted mean of bothPMTs: 1/σ2 = 1/σ2
PMT1 +1/σ2PMT2). It must be
noted that the variations of the time resolutionσ along the plastic scintillator were found to besmall. The selected prototypes scintillation coun-ters are given in Table 1.1.
1.7 Monte Carlo simulation
A number of Monte Carlo (MC) studies have beenperformed in order to validate the detector design.It has been shown that at the maximal luminosity(2× 1032 cm2s−1) the overall counting rate in thecentral part of the FToF wall will not exceed 2MHz, which determines the detector granularity.The latter is also a compromise on the detectorcost. The background from the secondary e+e−
pairs is negligible at the lepton momenta above 2GeV. It stays below 105 s−1 at the smaller mo-menta.
At a 10 GeV p beam, the multiple hit probabilityin the FToF wall is almost 50% and the proba-bility of FToF×BToF coincidences is about 40%.These numbers are essential for the efficiency ofthe time-of-flight analysis.
It has been shown that the intensive Λ peak isautonomously reconstructed with the FToF wallwhich can be used for the detector tuning andcalibration.
FAIR/Pbar/Technical Design Report - FToF 5
1.8 Design validation
The design is validated by Monte Carlo simula-tions. The timing resolution of the large scintil-lation counter has been experimentally measuredand the resolution (σ) below 100 ps has beenobtained. The results of the experimental ‘’on-beam” tests meet the requirements of the PANDAexperiment.
References
[1] M. Kotulla et al. Strong interaction stud-ies with antiprotons. Letter of intent forPANDA (Antiproton Annihilations at Darm-stadt). 2004.
[2] Nora Brambilla and Ulf-G. Mei?ner. Studiesof Hadron Structure and Interactions with thePANDA Experiment at FAIR. 2015.
[3] B. Singh. Study of doubly strange sys-tems using stored antiprotons. Nucl. Phys.,A954:323–340, 2016.
[4] M. F. M. Lutz et al. Physics Performance Re-port for PANDA: Strong Interaction Studieswith Antiprotons. 2009.
[5] M. Kotulla et al. Technical Progress Reportfor PANDA: Strong Interaction Studies withAntiprotons. 2005.
[6] G. Agakishiev et al. The High-Acceptance Di-electron Spectrometer HADES. Eur. Phys. J.,A41:243–277, 2009.
[7] A. Neiser et al. TRB3: a 264 channel highprecision TDC platform and its applications.JINST, 8:C12043, 2013.
[8] I. Frohlich et al. TRB for HADES and FAIRexperiments at GSI. In Astroparticle, parti-cle and space physics, detectors and medicalphysics applications. Proceedings, 10th Con-ference, ICATPP 2007, Como, Italy, October8-12, 2007, pages 973–977, 2008.
[9] F. Gonnella, V. Kozhuharov, and M. Raggi.Time over threshold in the presence of noise.Nucl. Instrum. Meth., A791:16–21, 2015.

6 PANDA - Strong interaction studies with antiprotons

7
2 The PANDA experiment
Figure 2.1: Schematic view of the FAIR layout in-corporating the current GSI installations and futureinstallations: the SIS100 synchrotron the storage andcooler ring complex including CR (RESR) and HESR
2.1 High Energy StorageRing (HESR)
A schematic view of the future FAIR layout withthe HESR [1] and HESR lattice with the PANDAsetup are shown in Fig. 2.1 and Fig. 2.2. TheHESR is designed to store 1011 antiprotons. Forthe startup (MSV) period, FAIR will provide 1010
stored p. With a high density internal target (tar-get thickness ∼ 1015 atoms/cm2), the peak lumi-nosity will be ∼ 1031 cm−2s−1. For a design valueof 1011 stored p with the beam momenta from 1.5GeV/c to 15 GeV/c the luminosity will be higherby one order of magnitude. In this case the an-ticipated number of interactions with the targetis estimated to be about 107 s−1.
Two complementary operating modes of HESR areplanned which are named a high luminosity anda high resolution mode, respectively. The highluminosity mode with ∆p/p = 10−4, stochasticcooling and the target thickness of 4× 1015 cm−2
will provide an average luminosity of up to L =1.6× 1032 cm−2s−1.
In the high resolution mode, a lower beam mo-mentum spread ∆p/p = 5×10⁻⁵ will be achievedwith electron cooling for momenta up to p = 8.9GeV/c. This operation will be mainly used in theconjunction with a cluster jet target which willnot impose a time structure onto the event rate.The cycle-averaged luminosity is expected to be
L = 1.6× 1031 cm−2s−1.
As an example, the luminosity profile for severalcycles is shown in Fig. 2.3. In the beam prepa-ration target-off regime, the precooled p are in-jected to HESR and accelerated/decelerated de-pending on the request by the experimental pro-gram’s beam energy. The luminosity drop downoccurs mostly due to the multiple scattering offthe internal target atoms. A transverse and lon-gitudinal cooling will be used to compensate anincrease of betatron oscillations (which result intransverse beam blow up) and to achieve a lowmomentum spread, respectively. While stochasticcooling will be applicable over the whole momen-tum range, an electron cooling is foreseen in therange from 1.5 GeV/c to 8.9 GeV/c with a possi-ble upgrade to 15 GeV/c.
2.2 The targets
The installation of various targets is foreseen inthe PANDA detector. In order to reach the designluminosity of 2×1032 cm−2s−1 at 1011 stored p inthe HESR the hydrogen target thickness must be4× 1015 atoms per cm2. Both, a Cluster-Jet Tar-get (CJT) and a Pellet Target (PT) are being pre-pared. The CJT is foreseen for the startup period.The CJT provides hydrogen clusters smaller than10 mm. The hydrogen density can be adjustedalongwith the reducing the number of circulatingp which allows one to take data at a constant lu-minosity. The latter is an important practical ad-vantage of this technique.
The PT produces a stream of frozen hydrogenmicro-spheres (pellets) traversing the beam per-pendicularly. A pellet size of 25 µm at a pellet rateof 25 kHz and a fall speed of 80 m/s imply thatthe necessary target thickness will be reached.
One technical challenge lies in keeping the wholetarget line under high vacuum over the distanceof 2.1 m between the injection nozzle and the in-teraction point, plus the same distance until thetarget particles are dumped in an efficient catcher.
The CJT is homogeneous in space and timewhereas a pellet target with an average inter-pellet spacing of 3 mm exhibits large density vari-ations on the 10-100 µs timescale.

8 PANDA - Strong interaction studies with antiprotons
Figure 2.2: Layout of HESR. The beam injected from the left into the lower straight section. The total latticecircumference is 575 m. The circulating beam deflection of the spectrometer dipole magnet of the PANDA detectoris compensated
Figure 2.3: Time dependent macroscopic luminos-ity profile for several operation cycles with constanttarget density (blue curve). Red curve shows cycle-averaged luminosity
An extension of the targets to heavier gases suchas deuterium, nitrogen, or argon is possible.
2.3 The Detector
Fig. 2.4 shows the detector viewed with par-tial cut-outs. As a fixed target experiment, thePANDA detecctor consists of two parts: the Tar-get Spectrometer (TS) and the Forward Spec-trometer (FS). The p beam is scattered off acluster-jet or pellet target. Exclusive measure-ments of pp reactions requires simultaneous mea-surements of hadrons, leptons and photons with
the high multiplicities (up to 10 - 12 particles perevent).
The physics requirements for the detectors are:
• Practically 4π acceptance with high detectionefficiency
• Event rate capability of 2× 10⁷ s−1
• Momentum resolution not worse then 0.01
• High precision track reconstruction system
• Good event start time reconstruction
• Reliable particle identification (γ, e, µ, π, K,p)
• Wide range of photon detection (1 MeV - 10Gev)
2.4 Target Spectrometer
The TS, which is almost hermetically sealed toavoid solid angle gaps and with a compact innervolume, consists of a solenoid magnet with a fieldof 2 T and a set of detectors for the energy deter-mination of neutral and charged particles as wellas for the tracking and PID for charged tracks

FAIR/Pbar/Technical Design Report - FToF 9
Figure 2.4: Side view of with the Target Spectrometer (TS) on the left side, and the Forward Spectrometer (FS)starting with the dipole magnet center on the right. The p beam enters from the left
housed within the superconducting solenoid mag-net.
The silicon Micro-Vertex Detector (MVD) sur-rounds closely the beam pipe in the target area,providing secondary vertex sensitivity for parti-cles with the decay lengths of the order of 100 µm.The main tracker is a straw tube tracker (STT).
There will be several Gas Electron Multiplier(GEM) tracking stations in the forward direction.The tracking detectors MVD and STT also pro-vide information on the specific energy loss intheir data stream.
Two Internally Reflected Cherenkov light (DIRC)detectors are to be located within the TS. Com-pared to other types of Ring Imaging Cherenkov(RICH) counters the possibility of using thin ra-diators and placing the readout elements outsidethe acceptance favors the use of DIRC designs asCherenkov imaging detectors for PID. The BarrelDIRC covers the polar angles θ from 22 to 140
inside the TS. The Disc DIRC covers the polar an-gles θ from 10 to 22 in the horizontal plane and5 to 22 in the vertical plane. For the analysis ofthe DIRC data the tracking information is needed,as the Cherenkov angle is measured between theCherenkov photon direction and the momentumvector of the radiating particle.
The Scintillation Tile (SciTil) Hodoscope, orBarel Time-of-Flight (BToF), serves as precise (<100 ps) timing detector cylindrically surrounding
the target. It consists of small scintillator tilesread out by Silicon Photo-Multipliers (SiPMs)and is attached to the support frame outside theBarrel DIRC providing reasonable π/K separa-tion below 1 GeV/c. This sub-detector is provid-ing timing information on the picosecond level.The interplay between BToF detector and theFToF wall (which is the topic of this report) isconsidered in details in this document.
The lead tungstate (PWO) crystals of the elec-tromagnetic calorimeter (EMC) are read out withAvalanche Photo Diodes (APD) or vacuum pen-todes. Both, the light output and the APD per-formance improve with lower temperature. Thus,the plan is to operate the EMC detectors at T =−25 C. The EMC is composed of the backwardend-cap, the barrel part and the forward end-cap,all housed within the solenoid magnet return yoke.
Besides the detection of photons, the EMC is alsothe most powerful detector for the identificationof electrons.
The return yoke for the solenoid magnet in the TSis laminated to accommodate layers of drift tubesfor muon detection. They form a range stack,with the inner muon layer being able to detectlow energy muons and the cumulated iron layerthickness in front of the outer layers providingenough hadronic material to stop the high energypions. A similar lamination and instrumentationof the iron is foreseen in the downstream door ofthe yoke augmented by the addition of the muon

10 PANDA - Strong interaction studies with antiprotons
filter located in between the TS and the FS.
2.5 Forward Spectrometer
The FS angular acceptance has an ellipsoidal formwith a maximum angular acceptance of ±10 hor-izontally and ±5 vertically w.r.t. the beam di-rection.
The tracking section of the FS is incorporated be-fore, after and within the large gap of a dipolemagnet providing bending power of 2 T·m with aB-field perpendicular to the forward tracks. Theother parts are placed further downstream outsidethe dipole magnet.
An aerogel RICH detector will be located rightbehind the dipole magnet followed by the ForwardTime-of-Flight wall (FToF) which also covers thedetection of slow particles below the Cherenkovlight threshold.
The FToF wall will be described in detail in thefollowing sections as the report is dedicated to thisdetector.
In addition to the FToF wall, the dipole ToF de-tector was originally conceived. A high level ofthe magnetic field is a challenge in designing thisdetector which suggests the use of SiPMs for read-out, not tested up to now with large plastic scin-tillators. Future challenges are the difficult ac-cess, the necessity of electronics cooling and themechanical interference with the forward track-ing system. However, the physical motivation forthis system is not evident. Monte Carlo simula-tions show that the count rate of the hadron hitswithin the dipole ToF detector is very low evenat maximum luminosity. Once the physics caseof this detector is clearly demonstrated it will bedesigned and presented in a separate document.
the secondary electron/positron energy is mea-sured by the Shashlyk type electromagneticcalorimeter consisting of 1404 modules of 55× 55mm2 cell size covering 2.97× 1.43 m2.
Forward emitted muons are detected with theMuon Range System.
The determination of the luminosity is providedby the detector based on four layers of monolithicactive pixel sensors close to the beam pipe detect-ing scattered p under small angles.
2.6 Particle identificationsystem
The charged particle identification (PID) willcombine the information from the time-of-flightwith event start timestamp information, tracking,dE/dx and energy deposition, and calorimetry in-formation with the output from the Cherenkov de-tectors. A combined analysis of the TS and FS us-ing kinematic constraints is extremely important.Thus, the information on time-of-flight and T0 cri-teria can be applied by analyzing BToF×FToFcoincidences probability of about 50%.
2.7 Data Acquisition
The data flow and processing is spatially sepa-rated into the Front End Electronics (FEE) partlocated on the actual detector subsystems and theData Acquisition (DAQ), located off-detector inthe counting room.
The FEE comprises the analog electronics, digi-tization, low level preprocessing and optical datatransmission to the DAQ system.
While each sub-detector implements the detectorspecific FEE systems, the DAQ features a com-mon architecture and hardware for the completedetector.
Operating the PANDA detector at the interactionrates of 2 × 10⁷, typical event sizes of 4 - 20 kBlead to mean data rates of ∼ 200 GB/s.
The PANDA DAQ design does not use fixed hard-ware based triggers but features a continuouslysampling system where the various subsystems aresynchronized with a precision time stamp distri-bution system.
The event selection is based on the real-time fea-ture extraction, filtering and high level correla-tions.
The main elements of the PANDA DAQ are thedata concentrators, the compute nodes and highspeed interconnecting networks. The data con-centrators aggregate data via point-to-point linksfrom the FEE and the compute nodes provide fea-ture extraction, event building and physics drivenevent selection.
A data rate reduction of about 1000 is envisagedin order to write the event data of interest to per-manent storage.
The peak rates above the mean data rate of ∼ 200

FAIR/Pbar/Technical Design Report - FToF 11
GB/s and increased pile-up may occur due to pbeam time structure, target thickness fluctuations(in case of the pellet target) and luminosity vari-ations during the HESR operation cycle.
Therefore, FPGA based compute nodes serve asthe basic building blocks for the PANDA DAQ sys-tem exploiting a parallel and pipelined processingto implement the various real-time tasks, whilethe multiple high speed interconnects provide aflexible scalability to meet the rate demands.
2.8 Infrastructure
The detector is located below the ground in anexperimental hall, encased in a smaller tunnel-like concrete structure, partially fixed, partiallymade of removable blocks. Most subsystems con-nect their FEE components via cables and tubes(placed in movable cable ducts) to the installa-tions in the counting house, where three levels areforeseen to accommodate cooling, gas supplies,power supplies, electronics, DAQ and work space.
References
[1] B. Lorentz, A. Lehrach, R. Maier, D. Pra-suhn, H. Stockhorst, and R. Tolle. HESRLinear Lattice Design. Conf. Proc.,C0806233:MOPC112, 2008.

12 PANDA - Strong interaction studies with antiprotons

13
3 Technical design considerations of theFToF wall
3.1 General requirements
There is a big variety of photodetectors used inhigh energy physics experiments for time-of-flightmeasurements. Some recent reports dedicated tofast and ultra-fast photodetectors developed formodern physics applications can be found in [1,2, 3, 4, 5, 6, 7, 8, 9, 10, 11, 12].
The time-of-flight detector under consideration(FToF wall) is subject to the following technicalrequirements:
• The time resolution must be better than 100ps;
• The FToF wall is positioned at 7.5 m down-stream of the target (interaction point);
• The sensitive area of the scintillation wall is5.6 m width × 1.4 m height;
• The thickness of plastic scintillators shouldnot exceed 2.5 cm in order not to deterio-rate the performance of the forward electro-magnetic calorimeter located downstream ofthe FToF wall;
• The scintillation wall should withstand a highcounting rate corresponding to maximal lu-minosity of the PANDA experiment;
• The dynamic range of the detector shouldcover all possible variations of energy deposi-tion in the scintillators;
• The FToF wall must work at nonzero fringefield of the PANDA dipole magnet (up to 80G by absolute value);
• The opening in the wall for the vacuum beampipe must be foreseen.
These requirements can be met easily by a systemof commercial scintillators and photodetectors. Itseems reasonable that the system will be consist-ing of individual scintillation counters. The heightof a scintillation slab is to be taken equal to a ver-tical dimension of the required sensitive area, i.e.,140 cm. The granularity is subject to an admittedcounting rate load. According to the MC simula-tions results (Sec. 4), the charge particle count
rate of an individual scintillation counter basedon the slab, with width 5 cm in the central partof the wall and 10 cm in both side parts, will notexceed 0.6 MHz. The suggested configuration ofthe scintillation wall in xy-plane (perpendicular tothe spectrometer axis z) is shown in Fig. 3.1. Thethickness of all slabs in the wall is 2.5 cm (seeSec. 5). The energy loss of relativistic hadronspassing through the slab is about 5 MeV, withthe number of produced photons per MeV being104. Also shown in Fig. 3.1 the opening whichserves to pass the beam vacuum pipe through thewall. It is asymmetrically located as the FS dipoledeflects the p beam from the spectrometer axis inthe horizontal pane by 2.2, which results in thedeviation of 11.1 cm at the wall position. In orderto provide this opening (vacuum pipe diameter atFToF position is 180 mm), four slabs in the cen-tral part must be cut.
For a large plastic scintillator a precise measure-ment of particle hit position is crucial for timingresolution: 1 mm uncertainty in hit position alongthe slab, i.e. along y-axis in Fig. 3.1, correspondsto 5.9 ps in time (see discussion related to the lin-ear fitting in Fig. 5.26, Sec. 5.2). It is plannedthat the information on the hit position will beprovided by the Forward Tracking System. Anexpected uncertainty in y in this case will be onthe level of 2-3 mm. Another option is the ”mean-timer variant” as described in Sec. 5.2. In thiscase the hit position uncertainty is ruled out. Inpractice, both variants might be combined. This,however, is not the case for the four central slabswhich must be cut in order the beam pipe couldpass through. The hit positions information ob-tained with the FTS can only be used for thosecounters.
3.2 Plastic scintillators
A set of parameters of plastic scintillators whichare typically in use for the particle detection isgiven in Table 3.1. The best timing parameters(rise time and decay time) displayed in the Ta-ble 3.1 belongs to BC-404. On the other hand, thelight attenuation length of BC-404 is significantlysmaller than that of BC-408. The latter param-

14 PANDA - Strong interaction studies with antiprotons
560 cm230 cm 100 cm 230 cm
14
0 c
m
20 cm
Y
x
Figure 3.1: Configuration of the FToF wall assembled of scintillation slabs: central part (dark blue) consists of20 scintillation counters, the side parts (light blue) consist of 23 counters each. The width of the slabs is 5 cm(10 cm) in the central (side) part. The opening for the beam vacuum pipe at x = 11.1 cm is indicated
eter is very important for a large acceptance sys-tem like the FToF wall under consideration. Sincethe BC-408 time properties are very close to thebest ones listed in Table 3.1, we select this plasticscintillator as the basic material for the FToF wallscintillation counters.
The maximum of BC-408 emission spectrumshown in Fig. 3.2 is 425 nm (blue light) whichcorresponds well to the maximum of PDE (pho-ton detection efficiency) of most fast photodetec-tors (photomultiplier tubes or silicon photomulti-plier).
3.3 Energy depositions anddynamic range
Most of the particles to be detected with the FToFwall are relativistic hadrons, muons and electrons.The smaller the particle momentum, the largerthe stopping power and energy loss. Protonswith the energy of 50 MeV are stopped in theplastic scintillator of 2.5 cm thickness (Fig. 3.3).This range of 2.5 cm for other (lighter) particlescorresponds to smaller energies, e.g., this energyis 5 MeV for electrons. Therefore, for low en-ergy particles, the energy deposition of 50 MeVis a maximum implying that the particle tracksare practically perpendicular to the wall surface.The minimum energy loss in the scintillator inthe momentum range to explore corresponds toMIP (minimum ionizing particle), i.e. 1.9 MeVg−1cm2. Respectively, the minimum energy depo-sition is 4.83 MeV (for BC-408 with density 1.032g/cm3). Consequently, the expected range of vari-ation of light pulses related to the energy depo-sition spread (maximum over minimum) is given
3 6 0 3 8 0 4 0 0 4 2 0 4 4 0 4 6 0 4 8 0 5 0 0 5 2 0 5 4 00
1 0
2 0
3 0
4 0
5 0
6 0
7 0
8 0
9 0
1 0 0Re
lative
Ligh
t Outp
ut, %
W a v e l e n g t h , n m
B C 4 0 8
Figure 3.2: Emission spectrum of BC-408
by a factor of 10.
Another source of light pulse variations comesfrom the attenuation of the light propagatingalong the slab. For the BC-408 narrow slab of 140cm length this factor is e
140210 = 1.95. A light prop-
agation through the BC-408 under ideal wrappingcondition (no photon escapes the plastic volume)has been simulated using the GEANT4 package.The time dependence of light pulses produced by500 MeV protons traversing a 10× 140× 2.5 cm3

FAIR/Pbar/Technical Design Report - FToF 15
Table 3.1: Properties of plastic scintillators produced by BICRON [13]
Properties BC-400 BC-404 BC-408 BC-412 BC-416
Light output,% anthracene
65 68 64 60 38
Rise time,ns
0.9 0.7 0.9 1.0 -
Decay time,ns
2.4 1.8 2.1 3.3 4.0
Pulse width FWHM,ns
2.7 2.2 2.5 4.2 5.3
Light atten. length,cm
160 140 210 210 210
Wavelength of max.emission, nm
428 408 425 434 434
No. of H-atoms percm3 (×1022)
5.23 5.21 5.23 5.23 5.25
No. of C-atoms percm3 (×1022)
4.74 4.74 4.74 4.74 4.73
No. of e− per cm3
(×1022)3.37 3.37 3.37 3.37 3.37
Principaluses/applications
Generalpurpose
Fastcounting
Largearea ToF
Largearea
Largearea
0 . 0 1 0 . 1 1 1 0 1 0 01 E - 3
0 . 0 1
0 . 1
1
1 0
1 0 0
Rang
e, mm
E n e r g y , M e V
E l e c t r o n s P r o t o n s D e u t r o n s A l p h a
Figure 3.3: Ranges of charged particles in plasticscintillator
slab perpendicular to its surface (i.e. passing
time, ns0 5 10 15 20 25 30
ph
ot
N
0
500
1000
1500
2000
2500
3000
3500
4000
4500 x = -60 cm
x = -40 cm
x = -20 cm
x = 0 cm
x = 20 cm
x = 40 cm
x = 60 cm
Figure 3.4: Light pulse shapes detected at one endof the plastic scintillator for various hit positions x
along 2.5 cm slab thickness) are shown in Fig. 3.4.Here x indicate the hit position along the scin-tillator, x = 0 being in the middle of the slab.The light pulse is assumed to be detected by aphotodetector fastened to the light guide whichis glued to one end of the plastic scintillator atx = −70 cm. Concerning timing measurements,the front part of the light pulse is important andone may conclude that the additional variation ofthe pulse amplitude from one end of the plasticscintillator to the other is given by a factor of 3.

16 PANDA - Strong interaction studies with antiprotons
QDC, ch100 150 200 250 300 350 400 450
a.u.
0
0.002
0.004
0.006
0.008
0.01
0.012
0.014
0.016
0.018
0.02
0.022
0.024
x = -60
x = -40
x = -20
x = 0
x = 20
x = 40
x = 60
Figure 3.5: Amplitude distributions of the lightpulses in QDC channels for various positions of the920 MeV proton hits (Sec. 5). The light was read-out with the PMT R4998 coupled at one end with the140× 5× 2.5 cm3 BC-408 slab
This result was confirmed experimentally wherethe integrated light pulses produced in a 140 ×5 × 2.5 cm3 scintillator exposed with 920 MeVprotons has been measured with QDC (Sec. 5).The result is presented in Fig. 3.5.
In conclusion, considering both, the energy depo-sition spread (a factor of 10) and the light attenu-ation effect (a factor of 3) in the plastic scintillatorthe dynamic range of the detected light pulses isgiven by a factor (max/min) of 30.
3.4 Selection ofphotodetectors
3.4.1 Photomultiplier Tubes
The PhotoMultiplier Tubes (PMTs) are widelyused and very well studied photodetectors. Mostof the information on PMTs considered below ispresented in the Hamamatsu handbook [14]. Thetime response parameters of a PMT are mainlydetermined by the dynode structure and a numberof stages. The best candidates are linear-focusedPMTs with the rise time in the range of 0.7 to3 ns. The ultra-fast microchannel plate (MCP)PMTs with rise time 0.1-0.3 ns are too expensive,as well as mesh-type PMTs. The latter can oper-ate in a magnetic field up to 0.6 T [15] which is notrequired in our case. In Table 3.2, the character-istics of conventional linear-focused and fine-meshPMTs are compared. The time response is mainlydetermined by the electron transition time (ETT).For the time resolution, the most important char-
acteristics are the rise time and transition timespread (TTS). The TTS is defined as the timinguncertainty of the anode signal arrival for a singleelectron hitting the photocathode.
It is important to remember that all the time char-acteristics (τ) are improved by an increase of theapplied voltage V . Since the kinetic energy ofelectrons accelerated in a PMT is proportional tothe applied voltage for their relative change onemay use an approximate formula: δτ
τ ' −12δVV .
As it has been mentioned above the main featureof the mesh PMTs is that their high performanceis guaranteed in a rather strong magnetic fieldwhile the time resolution is about the same as thatfor linear focusing PMTs. The price, however, istypically 3 to 4 times higher. The conventionalPMTs are sensitive even to a moderate magneticfield and thus must be propelly protected.
The dipole induced magnetic field at the FToFwall position does not exceed 80 G by an absolutevalue [16]. In the horizontal plane (y = 0), it ismaximal at the spectrometer axis (x = y = 0,z = 7.5 m) and drops to 30 G at x = 3 m. TheBy component at x = y = 0 drops down to 22G at the wall position (z = 7.5 m) as shown inTable 3.3.
The behavior of the conventional and fine-meshPMTs in a moderate (below 0.5 T) magnetic fieldwas investigated in [15]. The magnetic field affectsthe gain of a PMT depressing the output anodesignal. This results in an increase of the time walkwhen using a standard readout electronic schemewith leading edge discriminators and thus worsensthe timing resolution. The effect of a magneticfield on the PMT response depends on many fac-tors like PMT position with respect to the mag-netic field vector, its dimensions, number and typeof stages, etc. A common solution is to use a com-posite shielding consisting of a thin µ-metal enve-lope as the inner shield and an outer iron cylin-der.The µ-metal shielding is arranged such thatto protrude over the PMT surface by about thetube diameter. As has been shown in [17] the con-ventional PMT R4998 operates satisfactorily forlongitudinal magnetic field (along the PMT axis)up to Bz ' 60 G and transverse field B⊥ ' 150G using only a 1 mm thick µ-metal shield. Witha composite shielding the transverse field had noeffect up to 600 G. Various variants of compositeshielding are considered in details in [15].
As the Bz component of the stray field at theFToF wall position stays well below the admittedvalue stated above and the transverse component

FAIR/Pbar/Technical Design Report - FToF 17
Table 3.2: Characteristics of conventional linear-focused and fine-mesh PMTs
R4998 R9800 R2083 R5505 R7761 R5924
PMT type linear-focused linear-focused linear-focused fine-mesh fine-mesh fine-mesh
Tube diame-ter
1” 1” 2” 1” 1.5” 2”
No. stages 10 8 8 15 19 19
Q.E. at peak 0.2 0.25 0.2 0.23 0.23 0.22
Gain (×106) 5.7 1.0 2.5 0.5 10. 10.
e− transittime, ns
10 11 16 5.6 7.5 9.5
Rise Time, ns 0.7 1.0 0.7 1.5 2.1 2.5
TTS, ns 0.16 0.27 0.37 0.35 0.35 0.44
HVmax, V 2500 1500 3500 2300 2300 2300
Table 3.3: Change of By component along spectrom-eter z axis
z, m 6.9 7.0 7.1 7.2 7.3 7.4 7.5
By, G 101 76 58 45 35 28 22
B⊥ does not exceed 100 G, a simple shielding witha 1 mm µ-metal shielding (see above) is sufficient.The PMT with the µ-metal shield is to be placedin a iron cylinder of a few mm thickness. As faras cost consideration is an issue, the sort of ironand housing thickness must be chosen accordingto the experimentally obtained information on thedipole stray field at the FToF wall position.
It must be noted that while the fine-mesh PMTscan operate in a rather high longitudinal mag-netic field (Bz ' 0.6 T), however, they are verysensitive to the transverse component, i.e., it isrequired that the axis of a PMT must be alignedalong the field direction.
3.4.2 Silicon Photomultipliers
A big advantage of the silicon photomultipliers(SiPMs) is their insensitivity to the magnetic field.No sensitivity to the magnetic field as high as 4T has been experimentally observed as reportedin [18]. An example of time characteristics fora single electron case is shown in Fig. 3.6. Thequantum efficiency of SiPMs is typically around80%, while for the PMT it is not higher than some40%. There are some other merits of the SiPMslike compactness, low operation voltage, relativelylow cost, etc. On the other hand the radiation
hardness and aging effects are still subject to ex-perimenting. The studies at the PNPI test stationof several samples of KETEK 6660 SiPM showedgood time characteristics, just a little worse thanthose for the fast PMTs (Sec. 5). SiPMs are usedin high energy physics experiments with the scin-tillators of moderate sizes [19]. In the case of largescintillation walls, the conventional PMTs are tra-ditionally used. The reason is mostly due to therelatively small active area of the SiPMs. Whilethe active area of a KETEK 6660 SiPM is 0.6cm ×0.6 cm = 0.36 cm2 the active area coveredwith a 1” (2”) PMT is larger, by a factor of 50(200). This fact cannot be compensated by thehigher quantum efficiency of the SiPMs. The useof many SiPMs might appear as a possible designchoice but it would complicate the electronic read-out scheme and the calibrations. Yet the advan-tages of SiPMs certainly motivate further techni-cal developments aimed at SiPM applications alsofor a large scintillator readout.
3.5 Readout electronics
As described in Sec. 5, the experimental studyof prototypes of the FToF scintillation counterhas been performed with the help of fast elec-tronics modules available in the PNPI. In thePANDA experiment, it is planned to use a com-pact FPGA based platform, such as TRB-3 withPADIWA FEE interfaces developed in GSI. TheTRB platform is a multi-purpose Trigger andReadout Board with an on-board DAQ function-ality developed for the HADES experiment up-grade [20, 21, 22]. This compact multi-functional

18 PANDA - Strong interaction studies with antiprotons
0 1 0 0 2 0 0 3 0 0 4 0 0
0
2 0
4 0
6 0
8 0
1 0 0
1 2 0
1 4 0
Ampli
tude,
a.u.
T i m e , n s
P M 3 3 5 0 M e a s u r e d D a t a
F i t o f F a s t T r a n s i e n t : t F = 4 . 7 n s S l o w C o m p o n e n t : t S = 1 0 7 n s
Figure 3.6: Single photoelectron pulse shape forKETEK PM 3350 SiPM
FPGA based readout board is assumed to bewidely used in PANDA and CBM experiments atFAIR.
The TRB-3 and two examples of the PADIWAmodules are shown in Fig. 3.7 and Fig. 3.8, re-spectively. The TRB-3 readout board contains264 individual high timing resolution (8 ps) TDCchannels for LVDS signals. Table 3.4 lists basicfeatures of the TRB3 platform.
The PADIWA module - a 16 channel discrimina-tor - produces LVDS signals both by the front andtrailing edge of a PMT analog signal provided theheight of the PMT pulse exceeds a fixed PADIWAthreshold. The LVDS signals are sent to a TRBwhich provides a Time-Over-Threshold informa-tion.
The time resolution of the PADIWA and TRB-3based electronics was measured using a fast gener-ator. Fig. 3.9 shows the time difference histogrammeasured with signals 50 mV/10 ps from the gen-erator. The time resolution of 30 ps is practicallyinsensitive to an increase of the pulse amplitude(by a factor of 2). The resolution gets somewhatworse (35 ps) if the pulse amplitude was reducedby 50%.
The FPGA temperature of the tested TRB-3 wascontrolled. It was first cooled to 21 C with thehelp of fans, and then ventilation was stopped.After 40 min without ventilation the FPGA tem-perature increased to 29.5 C without any notice-able effect on the time resolution.
Electronics tests are based on the Time-over-threshold (TOT) method which has recently be-come very popular [23][24]. The PADIWA LVDSsignals define the signal time-stamp-start and its
Figure 3.7: TRB-3. Functionality is described intext
Figure 3.8: PADIWA3 (left) and PADIWA-AMPS2(right). Functionality is described in text
- 4 . 0 - 3 . 9 - 3 . 8 - 3 . 7 - 3 . 60
5
1 0
1 5
2 0
2 5
Coun
ts, x1
03
C h 3 1 - C h 2 7 , n s
Figure 3.9: TDC time resolution of σ ∼ 30 ps hasbeen measured
width τ . As the pulse amplitude (or integratedcharge over threshold) is proportional to τ , onemay use it for the amplitude correction for thetime walk. One should remember, however, thatthis method has a limited dynamic range and lin-earity. Thus, the method must be very well ad-justed to the particular experiment reqirements.
Measurements of the TRB-3 platform with pho-todetectors were carried out in the PNPI. Themeasurements were performed at the PNPI teststation with two KETEK SiPMs coupled face to

FAIR/Pbar/Technical Design Report - FToF 19
Table 3.4: Some basic features of the TRB3 platform
Item Value
Supply Voltage 48 V (40-50V), galvanically isolated on board
Power Supply Current 0.5A minimum without additional electronic boards
GbE-connectivity max. 95 MBytes/s transfer per link
GbE-slow-control up to 400 registers/transfer, speed depends on GbE latency
ConnectivityMax. 8 SFPs, each 2GBit/s on board. With hub add-on: max. 32SFP 4 AddONs on top (208 pin), 1 AddOn on bottom
Max Readout Trigger Rate about 300 KHz (depending on configuration and network size)
Max Hit Rate 50 MHz (burst of 63 hits)
TDC Channels 260 (Single edge detection)
Time Precision < 20 ps
Minimum pulse width < 500 ps
Figure 3.10: Time resolution curve obtained at thePNPI test station with two KETEK SiPMs after TOTcorrections: σ = 112 ps. Raw result (without correc-tion) was twice worse (220 ps).
face to a small 6 × 6 × 9 mm3 plastic scintilla-tor. The plastic scintillator was irradiated witha collimated radioactive 90Sr source (as describedin detail in Sec. 5). The resulting time resolutionspectrum is shown in Fig. 3.10.
Very recently, tests of the PADIWA3+TRB-3readout electronics has been repeated at the PNPItest station in configuration presented in Fig. 5.1(Sec. 5.1.2) where PMT0 and PMT1 were bothHamamatsu R4998. The contribution from elec-tronics to the timing resolution was again con-trolled using a fast generator. It was found tobe σ = 20 ps. In this measurement the radioac-tive source was not collimated which increased thetime walk due to uncertainty in track position inthe scintillator to some 28 ps. Raw timing resolu-
Figure 3.11: Time difference between PMT0 andPMT1 corrected by TOT.
tion of σ = 130 ps was obtained. After amplitudecorrection using TOT method it was reduced to92 ps (Fig. 3.11). The latter, being corrected forelectronics contribution and time walk in the scin-tillator, corresponds to 50 ps per one PMT whichmeets the requirement of PANDA experiment.
Connectivity. One FToF wall hit correspondsto a 265 bit word containing all the service anddata information. The overall count rate of tar-get related particles is expected not to exceed 2-3MHz. For the central part of the wall, the countrate of individual counters is less than 1 MHz be-cause of the granularity which is twice higher thanthat in the side parts. The average hit multiplic-ity is about 1.5. The total FToF wall data flowis estimated to be about 150 MB/s, which wouldbe less than 40 MBytes/s per one TRB-3 if four

20 PANDA - Strong interaction studies with antiprotons
TRB-3s are in use.
3.6 Mechanics, cabling,integration
Fig. 3.12 and Fig. 3.13 show schematically thefront and side views of the FToF wall with a sup-porting frame. The bearing beams of the frameare made of duralumin HX4080E-8 profile. Thewall consists of two halves positioned on a railfrom the left and from the right side of the beampipe. Vertical stability of the system is providedwith a rail suspended on the ceiling. In order tomove the system into the service position a re-movable extension to the rails is foreseen.
Fig. 3.14 shows an assembly of two scintillationcounters (lower part of the FToF wall) at the bor-der between the central and side parts of the de-tector. The light guides made of Plexiglas areglued to the scintillators with BC-600 optical ce-ment. The BC-408 is the originally planned ma-terial of the scintillation slab. In order to com-promise the cost and quality it might be replacedwith EJ200, or similar, as presented in Sec. 7.The wrapping is aluminized mylar and black PVCcovering. The optical contact between the light-guide and photocathode is provided with siliconeelastomers. The active dividers are situated be-tween the connectors and the PMT (not shown inFig. 3.14). The housings are cylinders with wallsof 2 mm thickness made of a magnetic steel (e.g.steel-10). For protection against low level dipolestray field (transverse component) two layers ofµ-metal shield fully covering both the PMT anda part of the light -guides are applied.
The weight of the FToF detector together withthe supporting frame, the wheels and the rail isestimated to be 800 kg, with the plastic scintilla-tors and PMTs with housing being about a halfof this value.
The number of readout channels (number of PMToutput signals) is 132. In the case of PADIWA3,one needs 9 PADIWA modules. For reliable oper-ation at the picosecond level the cables for PMTanalog and LVDS pulses must be short: the ana-log signal (LVDS) cable should not exceed 50(200) cm. Proceeding from dimensions of theFToF wall detector, four TRB-3 modules are to beused to collect LVDS signals from the PADIWA3frontend interfaces. As an example, 10 TRB-3 modules with PADIWA frontends at Juelichtest beam were used providing 2400 channels at
10MHz count rate [25]. The PADIWA and TRB-3modules are assumed to fasten to the frame overand below the sensitive area of the detector.
HV and LV power supply. It is assumed to pro-vide HV power supply for the PMTs using two HVpatch panels at the left and right side of the sup-porting frame. It is planned to use the HV powersupply source similar to that worked out by thePNPI Electronic department for the NUSTAR-R3B experiment at FAIR (1000 PMT channels)[26]. The maximal HV of 3500V is needed (forR2083 PMT). It is implied that both R2083 andR4998 PMT will be equipped with active dividers[27]. The scheme of an active divider which hasalready been tested with the R4998 PMT is pre-sented in Fig. 3.15. Note that the maximumcounting rate about 1 MHz is expected for theFToF central part with these PMTs.
The LV power supply: one module for four TRB-3 (+48V, 4× 0.5A) and four units for PADIWA-2(+5V, 18 × 0.3A) will also be positioned at theframe.
3.7 Safety regulation
The design details and construction of the FToFwall detector will be performed according to thesafety requirements of FAIR and the Europeanand German safety regulations. In the FToF wallcase, a potential source of danger is a high volt-age power supply (HV). The maximum possiblehigh voltage value (negative) is 3500V. In orderto ensure the protection of all personnel againsthazardous voltage supplies, HV-lines, patch pan-els and connectors the several well seen overallmarkings will be made. All the HV and LV powersupply sources will be properly grounded. Twodifferent regimes, subjects to the safety rules, areforeseen for HV on and off variants and the panelwith the corresponding announcements - ”HighVoltage On” or ”High Voltage off” - will be func-tioning. All cabling and connections will be usedaccording to up-to-date standards.
3.8 Summary
The main task of the FToF wall is to detect onevent basis the timestamps of particles hits in oneor more scintillation blocks. Time resolution mustbe better than 100 ps.The PANDA experiment op-erates in a triggerless mode and a dedicated startcounter is not foreseen. Thus, the PID analysis

FAIR/Pbar/Technical Design Report - FToF 21
Figure 3.12: Schematic view of the FToF wall with the supporting frame placed on a rail.
Figure 3.13: Side view of the FToF wall (cross sec-tion).
per event should mostly be done offline by ana-lyzing the whole set of the information obtainedby all other PANDA sub-detectors. In particular,an interplay with other timing detectors, like theSciTil, is important. In simple cases, however, likeelastic p scattering or Λ→ pπ+ decay, only mea-surements of charge particle momenta are neededfor the unambiguous identification. The lattermust be widely used for an event start determi-nation and detector calibration.
Figure 3.14: The assembly of two PMTs in the bor-der between central and side parts of the FToF wall.Mu-metal covers PMT beyond front face (see text).
To summarize, it is proposed to build the FToFwall made of BC-408 plastic scintillator (or equiv-alent EJ200, see comment to Sec. 7.5) forming theactive area of the wall as shown in Fig. 3.1. Eachscintillation counter consists of a scintillation slaband two fast PMTs situated at the each end ofthe slab. In the central part of the wall the slabswith dimensions 5 cm (width) × 140 cm (height)× 2.5 cm (thickness) are viewed through the lightguides with 1” PMTs. The number of countersin the central part is 20. The side parts with theslabs of 10 cm width are equipped with the 2”

22 PANDA - Strong interaction studies with antiprotons
R14 10MR7 2M
C4
R8 3.3M
Q8
D10D3
R9 3.3M
Q9
D11
R10 3.3M
R1 1k
D4
Q10
R11 3.3M
D12D5
Q11
R12 3.3M
Q2
R19 8.2M
C1
C2
D6
R13 5.1MR2 4.3M
Q4 Q12
R20 51R3 9.1M
Q3
D7
C5
R15 51
D1
R17 51
R4 6.8M
Q5Q1
D8
C3
R5 3.9M
R16 51
Q6
R6 3.9M
D9
R18 10MQ7
D2
K
-HV
Dny10Dy9Dy8Dy7 (Acc)Dy6Dy5Dy4Dy3Dy2Dy1 P
Out
G
18 124 133 142 151 16 517
Figure 3.15: Scheme of active divider tested withHamamatsu R4998 PMT
PMTs with appropriate light guides. The num-ber of counters in each side part is 23. All PMTsare vertically positioned such that all their axesare parallel to the y-axis of the PANDA detec-tor. The calculated value of the By component ofthe magnet dipole stray field does not exceed 20 -30 G while the transverse component is less than100 G. This allows one to arrange magnetic fieldshielding with the help of a 1 mm thick µ-metal(inner shield). The cylindrical iron housing of 2mm thickness serves as outer shielding.
A time resolution at the level of 200 - 250 ps canbe obtained online. A better time resolution (of 60- 80 ps) would be reached in the offline analysis byapplying amplitude and hit position corrections toraw time distributions. In the test and prototyp-ing period, conventional readout electronics con-sisting of leading edge-discriminators LEDs, time-digital-converters TDCs and amplitude (charge)-digital converters ADC (QDC) have been used.The electronics resolution is usually dominated bythe TDC resolution which must not be worse than25 ps. In the PANDA experiment it is plannedto implement the readout electronics TRB3, theFPGA-based TDC modules developed in GSI [28].
References
[1] Jean-Francois Genat, Gary Varner, FukunTang, and Henry J. Frisch. Signal Processingfor Pico-second Resolution Timing Measure-ments. Nucl. Instrum. Meth., A607:387–393,2009.
[2] Luc Bonnet, Junhui Liao, and Krzysztof Pi-otrzkowski. Study on GASToF A 10 ps reso-lution timing detector. Nucl. Instrum. Meth.,A762:77–84, 2014.
[3] I. Deppner et al. The CBM Time-of-Flight wall - a conceptual design. JINST,
9(10):C10014, 2014.
[4] Arno Knapitsch, Etiennette Auffray, Chris-tian W. Fabjan, Jean-Louis Leclercq, XavierLetartre, Radoslaw Mazurczyk, and PaulLecoq. Effects of Photonic Crystals on theLight Output of Heavy Inorganic Scintilla-tors. IEEE Trans. Nucl. Sci., 60(3):2322–2329, 2013.
[5] R. X. Yang et al. MRPC detector for the BE-SIII E-ToF upgrade. JINST, 9(09):C09032,2014.
[6] Robert J. Abrams, Charles M. Ankenbrandt,Gene Flanagan, Steven Kahn, M. Notani,and Henry J. Frisch. Applications of FastTime-of-Flight System. Phys. Procedia,37:650–658, 2012.
[7] N. Harnew. TORCH: A Large-Area Detectorfor Precision Time-of-Flight Measurementsat LHCb. Phys. Procedia, 37:626–633, 2012.
[8] Y. Arita. Verification of Focusing System forTime-of-Propagation Counter. Phys. Proce-dia, 37:621–625, 2012.
[9] T. Kajimoto et al. Measurements and param-eterization of neutron energy spectra fromtargets bombarded with 120 GeV protons.Nucl. Instrum. Meth., B337:68–77, 2014.
[10] P. Moskal et al. Test of a single module of theJ-PET scanner based on plastic scintillators.Nucl. Instrum. Meth., A764:317–321, 2014.
[11] R. Jeffrey Wilkes. Time synchronization im-provements in the T2K long-baseline neu-trino experiment. PoS, Neutel2013:083, 2013.
[12] M. Bonesini, R. Bertoni, A. de Bari, andM. Rossella. Construction of a Fast Diode-Laser based Calibration System for Time-of-Flight Systems. PoS, EPS-HEP2013:004,2013.
[13] Bicron specifications “bc-400/bc-404/bc-408/bc-412/bc-412”. http:
//www.phys.ufl.edu/courses/phy4803L/
group_I/muon/bicron_bc400-416.pdf.
[14] Hamamatsu Photonics K.K. Photomultipliertubes: Basics and applications, edition 3a,2007.
[15] M. Bonesini, R. Bertoni, A. de Bari, andRossella. M. Behaviour in Magnetic Fieldsof Fast Conventional and Fine-Mesh Photo-multipliers. Nucl. Instrum. Meth., A693:130–137, 2012.

FAIR/Pbar/Technical Design Report - FToF 23
[16] PANDA collaboration. Technical progress re-port for panda, 2014.
[17] R. Bertoni et al. The design and commis-sioning of the MICE upstream time-of-flightsystem. Nucl. Instrum. Meth., A615:14–26,2010.
[18] E. Garutti, M. Groll, A. Karakash, and S. Re-iche. Magnetic field dependence studies forsilicon photomultiplier. 2004.
[19] Paolo W. Cattaneo, Matteo De Gerone,Flavio Gatti, Miki Nishimura, WataruOotani, Massimo Rossella, and YusukeUchiyama. Development of High PrecisionTiming Counter Based on Plastic Scintilla-tor with SiPM Readout. IEEE Trans. Nucl.Sci., 61(5):2657–2666, 2014.
[20] I. Frohlich et al. TRB for HADES and FAIRexperiments at GSI. In Astroparticle, parti-cle and space physics, detectors and medicalphysics applications. Proceedings, 10th Con-ference, ICATPP 2007, Como, Italy, October8-12, 2007, pages 973–977, 2008.
[21] A. Gil, D. Belver, P. Cabanelas, E. Castro,J. Diaz, J. A. Garzon, D. Gonzalez-Diaz,W. Koenig, and M. Traxler. Front-end elec-tronics of the HADES RPC wall: Full sec-tor test. In Proceedings, 2008 IEEE Nu-clear Science Symposium, Medical ImagingConference and 16th International Workshopon Room-Temperature Semiconductor X-Rayand Gamma-Ray Detectors (NSS/MIC 2008/ RTSD 2008), pages 1561–1563, 2008.
[22] C. Ugur, S. Linev, J. Michel, T. Schweitzer,and M. Traxler. A novel approach for pulsewidth measurements with a high precision(8 ps RMS) TDC in an FPGA. JINST,11(01):C01046, 2016.
[23] T. Orita, K. Shimazoe, and H. Takahashi.The dynamic time-over-threshold method formulti-channel APD based gamma-ray de-tectors. Nuclear Instruments and Meth-ods in Physics Research Section A: Acceler-ators, Spectrometers, Detectors and Associ-ated Equipment, 775:154 – 161, 2015.
[24] I. Kipnis et al. A time-over-threshold ma-chine: The readout integrated circuit for theBaBar silicon vertex tracker. IEEE Trans.Nucl. Sci., 44:289–297, 1997.
[25] A Neiser, J Adamczewski-Musch, M Hoek,W Koenig, G Korcyl, S Linev, L Maier,
J Michel, M Palka, M Penschuck, M Traxler,C Ugur, and A Zink. Trb3: a 264 chan-nel high precision tdc platform and itsapplications. Journal of Instrumentation,8(12):C12043, 2013.
[26] Hvds3200, the distributed high volt-age system for neuland spectrometer.http://hepd.pnpi.spb.ru/hepd/events/
abstract/2015/20151103_HVDS3200.pdf.
[27] V. A. Kalinnikov. Low powered transistordivider for PMT. 2005.
[28] Michael Traxler, Wolfgang Koenig, JanMichel, Marek Palka, and Cahit Ugur. Fpga-based tdcs: Trb3 and applications, 2013.

24 PANDA - Strong interaction studies with antiprotons

25
4 Physics case of FToF, MC study
4.1 Forward spectrometertime-of-flight PID
The Forward Spectrometer (FS) is dedicated todetect particles emitted under the laboratory an-gles below 5 and 10 in the vertical and horizon-tal directions, respectively. Although these anglesdo not seem to be large, a substantial fraction ofthe particles produced at the target by the beamoccurs within this FS acceptance. Generally, thehadrons related to the target proton (or targetnucleus) fragmentation are predominantly emit-ted within the TS while those fragmenting fromthe beam antiproton are strongly peaked forwardin the laboratory frame and thus detected in theFS. All elastically scattered p, as well as mostof the produced anti-baryons, are moving forwardat very small laboratory angles. This is also truefor the anti-hyperon decay product. Thus, as thePandaROOT MC shows, decay products of a in-clusive Λ production (p+p→ Λ+X, Λ→ p+π+)are detected with the FToF wall with a highgeometrical efficiency of about 20%. Note thatfor a hyperon produced in pp collision the lab-oratory polar angle is always kinematically lim-ited. Take as an example the binary productionp + p → Λc + Λc at pbeam = 15 GeV, the θlimLabbeing equal to 5.58. Most of Λc hyperons areexpected to be produced at the angles below θlimLabbecause of the reaction dynamics which implies asmall transverse momentum of the produced hy-perons. The strange Λ from the Λc → Λ + π− isthen detected with a high probability with the FSthus resulting in low background contamination.
Hadron identification is realized in the FS withthe help of the FToF wall and forward RICH de-tectors. While the forward RICH provides effec-tive hadron separation for the momenta above 2GeV for pions and above 4 GeV for protons (herespeed of light c = 1), [1] the FToF detector couldprovide hadron ID at particle momenta below 4GeV.
The time-of-flights between the target (Interac-tion Point, IP) and the scintillation wall posi-tioned at 7.5 m downstream of the IP for pions,kaons, protons and charged leptons are shown inFig. 4.1. The values of ToF ranges from 53.1 nsfor proton momentum of 0.5 GeV to 25 ns for rel-ativistic particles.
Besides the forward low momentum hadrons PID,an important function of the FToF wall is thatit provides information on the event time stampin a scintillation block. For a relativistic parti-cle (for a hadron with momenta larger than 3-4GeV) this information helps to reconstruct theevent start time in the IP with a precision of afew ns (Fig. 4.1). Provided the particle is identi-fied either as a hadron or a charged lepton (muonor electron), this precision could be improved tosome 100 ps which is the planned time resolutionof the FToF detector.
The FToF capabilities for hadron identificationof the FS were simulated with the help of ”ToyMonter Carlo” assuming that
1. the FToF wall detector is located at 7.5 mdownstream of the PANDA spectrometer tar-get;
2. hadrons are uniformly distributed in the se-leced momentum range from 0 to 5 GeV;
3. all hadron momentum distributions are nor-malized identically;
4. the momentum resolution of the FS spec-trometer is ∆p/p = 0.01 (Gaussian distribu-tion function));
5. the calculation is performed for ToF resolu-tion σToF (Gaussian distribution function)for 50, 100, 150 and 200 ps.
The particle mass is reconstructed using the fol-lowing equation (c=1):
m = p
√t2
t2c− 1 (4.1)
Here p is the particle momentum, tc = L/c, L isthe length of the particle track starting from theIP (start point), or from a decay vertex, to the hitposition in a FToF counter, c is the speed of light,t is the measured time of flight, i.e., t/tc = 1/v,where v is the particle velocity. The fractional un-certainty of the calculated mass can be estimatedas
δm
m=
√(δp
p
)2
+ γ4(σToF
t
)2(4.2)

26 PANDA - Strong interaction studies with antiprotons
0 1 2 3 4 52 0
2 5
3 0
3 5
4 0
4 5
5 0
ToF,
ns
P , G e V
e µ π K p
Figure 4.1: Time-of-flight of hadrons, muons andelectrons between the target (IP) and the FToF walldetector positioned at 7.5 m downstream of the targetversus particle momentum
where γ = 1/√
1− v2. Due to the relativisticγ factor, the time-of-flight resolution of 50 (or100) ps gives the main contribution to the masssmearing for the particles with momenta p ≥ 1GeV, while the momentum resolution of 1% hasa much smaller effect. However, at p < 1 GeVthe momentum uncertainty becomes more impor-tant. The uncertainty in tc, which comes from thetrack reconstruction in the magnetic field of theTS solenoid and the FS dipole, must also be takeninto account. Here we assume that the contribu-tion of this uncertainty is much smaller than thatof σToF in Eq.(4.2). Note that size of this contri-bution is still under question. It needs a MC studywith FS tracking included. An uncertainty of FStrack reconstruction at the level of δL/L ≈ 0.001translates to δσToF of about 25 ps for relativisticparticles.
Results of the calculation for the hadron mass re-construction (Eq.(4.1)) using a simplified modelabove (Toy MC) is presented in Fig. 4.2. Basedon this approach, separation power functionsshowing capability to distinguish between varioushadrons can be built, as displayed in Fig. 4.3.
Separation power for hadrons hi, hk, i, k = π,K, phave been calculated as |ti−tk|/(σi+σk)/2, whereti and tk is time-of-flight of hadrons hi and hk,respectively, σi and σk has been found by fit toprobability density functions in Fig. 4.2 at givenhadron momenta.
In a more realistic manner, hadron reconstructedmass distributions have been obtained in theframe of PANDAROOT MonteCarlo with track-ing through the dipole magnet reproduced with
GEANT4, Fig. 4.4.
As it can be seen, the time-of-flight informationobtained with the help of the FToF wall pro-vides a reliable π and kaon identification up tothe secondary particle momentum of 2.5 GeV atσToF = 100 ps (up to 3.5 GeV for simulations withσToF = 50 ps) and proton (antiproton) identifica-tion up to 4 GeV for σToF = 100 ps (up to 5.3GeV for σToF = 50 ps). Note that at momentasmaller than 0.5 GeV the proton time-of-flight in-creases very sharply with a momentum decreasewhich results in worsening the mass reconstruc-tion at very small momenta.
Construction of a dedicated start counter in theinteraction point area is technically not feasibleand not foreseen for the PANDA detector. Thetime-of-flight information is assumed to be ob-tained using the time correlations per interac-tion in the PANDA detector by the responses be-tween two or more scintillation counters of theFToF wall and/or Barrel ToF detectors. The timeof flight is extracted offline in combination withother criteria similar to the HADES experimentat GSI. The efficiency of such a procedure will de-pend on the multiplicity of particles produced inthe reaction under investigation, the event topol-ogy and the background situation. As PANDA-ROOT Monte Carlo (MC) shows the efficiency ishigh for many benchmark reactions. A positivefeature of this approach is that the overall timeresolution in this case is improved with an increaseof n, where n ≥ 2 is the number of counters witha hit.
To conclude, hadrons with the momentum rangeof 2 − 4 GeV will be identified by combiningthe information from the FToF and the forwardRICH detectors. Over the whole momentumrange, the FToF wall is used to establish the eventstart timestamp which is very important for thePANDA trigger-less data taking procedure.
It must be noted that a good timing resolution-per event is obtained in the offline analysis makinguse of the timing and amplitude information foreach photomultiplier and the hit position informa-tion in the scintillation slab. The precision of thehit position measurement in vertical (y) directionalong the slab must be at the level of 1 mm, whichcorresponds roughly to 5 ps timing uncertainty. Atracking system satisfying this requirement in theFS is mandatory needed for obtaining the timingresolution of the order of 50− 100 ps.

FAIR/Pbar/Technical Design Report - FToF 27
0 1 2 3 4 50 . 0 0
0 . 2 5
0 . 5 0
0 . 7 5
1 . 0 0
1 . 2 5Ma
ss, G
eV
M o m e n t u m , G e V / c
s T o F = 5 0 p s
p -
K -
p -
0 1 2 3 4 50 . 0 0
0 . 2 5
0 . 5 0
0 . 7 5
1 . 0 0
1 . 2 5s T o F = 1 0 0 p s
Mass
, GeV
M o m e n t u m , G e V / c
p -
K -
p -
0 1 2 3 4 50 . 0 0
0 . 2 5
0 . 5 0
0 . 7 5
1 . 0 0
1 . 2 5s T o F = 1 5 0 p s
Mass
, GeV
M o m e n t u m , G e V / c
p -
K -
p -
0 1 2 3 4 50 . 0 0
0 . 2 5
0 . 5 0
0 . 7 5
1 . 0 0
1 . 2 5s T o F = 2 0 0 p s
Mass
, GeV
M o m e n t u m , G e V / c
p -
K -
p -
Figure 4.2: Hadron mass reconstruction using Toy Monte Carlo (probability density functions). Highly populatedareas correspond approximately ±2.5σ deviation in reconstructed mass smearing
4.2 Count rate andbackground estimations
Some preliminary MC studies were done usingPYTHIA6. However, the applicability of thePYTHIA package at the relatively low energy isquestionable. Therefore, the performance of theFToF detectors was mostly investigated in theframework of the PANDAROOT MC with theDual Parton Model (DPM) generator [2] appliedfor hadron production on the hydrogen target andthe antiproton beam momentum in the range from2 to 15 GeV.
The DPM generator produces a number of finalstates. The typical ones produced at 10 GeVantiproton beam are: pp → pp, pp → ppπ0,pp → nnπ0, pp → npπ0π−, pp → ppπ+π−, pp →pnπ+π0, pp → ppπ+π−π0, pp → npπ+π−π−π0,pp → ppπ+π+π−π−π0, pp → ΛnKLπ
+π−π0, ...and many other states.
As one can see, the counting rate of both targetand forward spectrometers is expected to be dom-inated by the hadrons. The integrated yield of re-actions with meson production is approximatelyequal to that for elastic antiproton proton scat-tering. The latter is strongly peaked forward. Itis important to note that the relative frequency

28 PANDA - Strong interaction studies with antiprotons
0 1 2 3 4 5 6 7 805
1 01 52 02 53 0
Sepa
ration
powe
r
M o m e n t u m , G e V / c
p / K , s T o F = 5 0 p s p / p , s T o F = 5 0 p s K / p , s T o F = 5 0 p s
0 1 2 3 4 5 6 7 805
1 01 52 02 53 0
Sepa
ration
powe
r
M o m e n t u m , G e V / c
p / K , s T o F = 1 0 0 p s p / p , s T o F = 1 0 0 p s K / p , s T o F = 1 0 0 p s
0 1 2 3 4 5 6 7 805
1 01 52 02 53 0
Sepa
ration
powe
r
M o m e n t u m , G e V / c
p / K , s T o F = 1 5 0 p s p / p , s T o F = 1 5 0 p s K / p , s T o F = 1 5 0 p s
0 1 2 3 4 5 6 7 805
1 01 52 02 53 0
Sepa
ration
powe
r
M o m e n t u m , G e V / c
p / K , s T o F = 2 0 0 p s p / p , s T o F = 2 0 0 p s K / p , s T o F = 2 0 0 p s
Figure 4.3: Separation power for various variants of time resolution.
σtot=100psp-
k-
π-
P (GeV/c)
M (
GeV
)
0
0.25
0.5
0.75
1
0 1 2 3 4 5
σtot=50psp-
k-
π-
P (GeV/c)
M (
GeV
)
0
0.25
0.5
0.75
1
0 1 2 3 4 5
Figure 4.4: Hadron masses reconstructed using the time-of-flight information with the ToF resolution of σ = 100ps (left panel) and σ = 50 ps (right panel). Highly populated areas correspond approximately ±2.5σ deviation inreconstructed mass smearing

FAIR/Pbar/Technical Design Report - FToF 29
Table 4.1: Integrated rates of hadrons within theacceptance of the FS at the HESR cycle-averaged lu-minosity L = 1032 cm−2s−1
pbeam,GeV
2 5 15
π rate,1/s
3.9× 10⁵ 6× 10⁵ 9.6× 10⁵
K rate,1/s
2× 10³ 7.8× 10³ 4.7× 10⁴
Protonrate, 1/s
1.2× 10⁴ 3.8× 10⁴ 3.2× 10⁴
p rate,1/s
1.1× 10⁶ 9.5× 10⁵ 8.2× 10⁵
Figure 4.5: FToF wall rates versus X axis perpendic-ular to the beam line at 15 GeV p beam (PYTHIA6).The rates are normalized to 107 interactions in thetarget. The black curve is the total rate of all chargedparticles emitted from the target, the purple curveis the rate of p both from elastic pp scattering andinelastic reactions, the green curve shows p from elas-tic scattering only, the red curve is all charged par-ticles produced in the beam vacuum pipe, and theblue curve corresponds to e+e−-pairs produced in thebeam vacuum pipe by γ-photons emitted from the tar-get as products of the π0 → 2γ decay. The rates arecalculated in bins equal to 10 cm (the slab widths inthe side parts of the wall), both for the central andside parts
of π0 production is high which may result in asubstantial e+e− background: e+e−-pairs are pre-sumably produced in the spectrometer materials(e.g., in the walls of the beam vacuum pipe) bythe γ-quanta from π0 decaying in the target.
The geometry of the FToF wall detector im-plemented in the MC-geometry file is shown in
Figure 4.6: Schematic views of Forward ToF wall asimplemented in PANDAROOT
Fig. 4.6. In the MC calculations, simple ‘’box ap-proximations” were used for the FToF wall scin-tillation counters, i.e., the counter is assumed tobe fired provided that the particle track occurswithin its sensitive volume.
The integrated rates of hadrons emitted withinthe FS acceptance are presented in Table 4.1(PYTHIA6). The main contribution to the totalrate in the p beam momentum range under studyis related to a sharp forward peak of pp elasticscattering. As a source of background, this peakcan be essentially suppressed by kinematical cri-teria. Other hadron count rates are found to besubstantially lower.
The rates of individual slabs in the FToF wallrelated to various processes versus x, the axisperpendicular to the beam line in the horizontalplane, are shown in Fig. 4.5. These estimationshad been performed using PYTHIA6. The ratesare calculated in bins equal to the slab widths inthe side parts of the wall, i.e., 10 cm for both, thecentral and side parts. Remember that the cen-tral part slab width is half wide (5 cm) and, there-fore, their count rates, shown in Fig. 4.5, must bereduced by a factor of 2. One can conclude thateven in the central part of the FToF wall the totalrates are below the limit admitted by the technicalcharacteristics of the fast scintillation counters.
The procedure of MC simulation in the PANDA-ROOT framework was as follows. The generatedevents were propagated through the PANDA de-tector model implemented in the PANDAROOTpackage based on the GEANT4 simulation tool.Both, the solenoid and dipole magnetic fields wereincluded. The Barrel ToF (SciTil) was describedin the geometry file in a simplified form as a

30 PANDA - Strong interaction studies with antiprotons
Table 4.2: Count rates of PANDA time-of-flight detectors using PANDAROOT. The numbers obtained for80000 generated events have been scaled to 107 interactions in the target of PANDA spectrometer (scale factor= 125). Here efficiency is fraction of generated hadrons (with scale factor 125) detected with the detector, N iscorresponding count rate
Generated by DPM Detected by BToF Detected by DToF Detected by FToF
80K events effN,
×106s−1eff
N,×106s−1
effN,
×106s−1
π− 90693 0.36 4.08 0.01 0.14 0.23 2.59
π+ 90725 0.44 5.03 0.002 0.03 0.18 2.07
K− 3022 0.09 0.03 0.001 0.0004 0.26 0.1
K+ 3082 0.25 0.09 0.003 0.001 0.12 0.04
p 42095 0.007 0.04 0.0002 0.001 0.62 3.24
p 42003 0.61 3.19 0.002 0.012 0.07 0.35
cylindrical surface sensitive to charged particlehits with 100% detection efficiency which mim-icked the sensitive layers of the real SciTil detec-tors. The FToF wall was implemented as dis-cussed above. Since the electron/positron back-ground seems to be important for the FToF wall,the materials of the beam vacuum pipe and for-ward EM calorimeter, as these can serve as sec-ondary targets for e+e−-pair production, it hasalso been included.
The results of these calculations are shown in Ta-ble 4.2 where the hadron rates are specified foreach time-of-flight detector. The count rates ob-tained in PANDAROOT are slightly larger thanthose for PYTHIA6. The average overall rate perscintillation slab of 10 cm width (side parts of thedetector) is about 1.5 × 10⁵ s−1. In the centralpart the rate per slab (5 cm width) is 6.3 × 10⁵
s−1 well below the admitted limit of a few MHz.
As mentioned above, the background rate relatedto γ-conversion to e+e−-pairs must be taken intoaccount. The e+e−-pairs are produced on the‘’secondary targets”, i.e., on PANDA detector el-ements such as the beam pipe, FSTT or RICHmaterials, magnet coils, etc. The forward EMcalorimeter located very close downstream of theFToF wall can also load the FToF wall slabs withe+ or e− scattered backwardly.
The results of computations of the hadron countrates versus x, the position on the x axis, incomparison with that of electron (positron) back-ground are presented in Fig. 4.7. The rate his-tograms are calculated in 5 cm bins. The num-bers presented in Fig. 4.7 correspond to luminos-
ity 2×1032 cm−2s−1 (107 interactions). The blackhistogram shows the contribution from all hadrons(62%), the magenta area shows elastic scattering,the blue histogram demonstrates the total contri-bution from e+ or e− (29%), the red histogramand dashed blue correspond to contribution ofe+e−-pairs produced in the beam vacuum pipeand e+ or e− scattered backwardly from the EMcalorimeter, respectively.
It is important to notice that the momentum dis-tributions related to pair productions are stronglypeaked at small momenta and typically end upbelow 2 GeV as demonstrated in Fig. 4.8 and inFig. 4.9. In this energy range the maximum en-ergy deposit of electrons in the plastic scintilla-tor of 2.5 cm thickness is 10.4 MeV (which corre-sponds to full absorption in plastic). For hadronsthe maximum energy deposit corresponds to pro-tons with energy 50 MeV. A typical energy de-posit for relativistic hadrons is close to MIP, i.e.,about 5 MeV. This defines the necessary dynamicrange of the PMT pulse amplitude to be measuredby the FToF electronics.
Two-dimensional plots show hit distributions inthe xy-plane of the FToF wall together with theirprojections on the x and y axes are shown inFig. 4.10. A small opening in the two-dimensionalplots indicates the hole for the beam vacuum pipe.
A double-hit probability in a single bar can be es-timated proceeding from the maximum ≈ 1 MHzcount rate per a bar in the central part of thewall. Assuming a flat in time luminosity distribu-tion and taking 20 ns as a dead time (necessaryfor the Time Over Threshold measurements [3],

FAIR/Pbar/Technical Design Report - FToF 31
Figure 4.7: FToF wall rates versus x axis perpendicular to the beam line at 5 GeV (left panel), 10 GeV (centralpanel) and 12.5 GeV (right panel) calculated in the frame of PANDAROOT. Black histogram represents allcharged hadrons, magenta area shows elastic p scattering, blue histogram corresponds all e+e−, red histogramshows contribution of e+e−-pairs produced in the beam vacuum pipe, blue dashed histogram is contribution ofe+ or e− resulted from backward scattering in the forward EM calorimeter. The rates are calculated in bins equalto 10 cm (the slab widths in the side parts of the wall), both for the central and side parts
Figure 4.8: Momentum distribution of particles detected with forward ToF wall for p beam energy 5 GeV, 10GeV and 12.5 GeV. Color codes are the same as in Fig. 4.7
Figure 4.9: Momentum distribution of e−(e+) detected with forward ToF wall for p beam energy 5 GeV, 10GeV and 12.5 GeV in larger scale

32 PANDA - Strong interaction studies with antiprotons
Table 4.3: Generated and detected with FToF Λand Λ events in inclusive Λ, Λ hyperon production at0.72× 106 pp interactions in the target
GeneratedDetected
with FToFwall
Detectionefficiency
Λ 19874 3840 0.193
Λ 19518 100 0.005
[4] pulse duration) one obtains 2%. The probabil-ity to hit two adjacent bars can be estimated forhadrons (no secondary showers) proceeding fromFS angular acceptance and bar thickness (2.5 cm)and its width ( 5 or 10 cm). One obtains lessthan 5% and 2% for the bar width of 5 and 10cm, respectively. These events are not lost for theanalysis as the track information and an energydeposition criterion can be applied.
4.3 Λ hyperon detectionwith FToF wall
According to the qualitative arguments given inSec. 4.1 the forward spectrometer is expected todetect decaying anti-hyperons with a high effi-ciency. As it is seen from Table 4.3, the efficiencyto detect both p and π+ from Λ decay in inclusivehyperon production (p+p→ Λ+X, Λ→ p+π+) isabout 20%. The detection efficiency of Λ-hyperonis essentially lower. A relatively high Λ countrate (more than 3 kHz) at the maximal projectedPANDA experiment luminosity (2×1032 cm−2s−1
or 107 pp interaction in the target) provides a pos-sibility for tuning and calibration of the detectorjointly with other FS detectors (FSTT, RICH, for-ward EMC).
The MC simulations were performed with theDPM generator at 10 GeV antiproton beam andall possible final states have been taken into ac-count (see Sec. 4.2). The generated momentumand angular distributions in the laboratory framefor Λ and Λ-hyperons are presented in Fig. 4.11.As one can see these distributions are very dif-ferent for Λ and Λ confirming the considerationsabout the target and beam hadronization kine-matics. Thus Λ momenta are peaked around 1GeV while the Λ momentum increases reachingthe maximum at 7.5 GeV just a little smaller thanthe beam momentum. The Λ angular distributionis flat practically up to an angular limit of 50.
Contrary to that, Λ polar angles show a strongangular dependence staying below 2.5 and beingstrongly peaked at very small angles. The Λ decaykinematics is such that the decay p is also mov-ing forward with the momentum close to that ofthe parent Λ and both p and π+ having an angu-lar limit with respect to the parent momentum.Due to these kinematical features and productionmechanism dynamics the probability to detect thetwo hadrons (p and π+) from Λ is expected to behigh, as confirmed by the simulations. Also, theabove considerations help to understand why thedetection efficiency for Λ is so much smaller thanthat for Λ.
In the simulations, all particles produced withDPM were propagated through the PANDA de-tector model incorporated into the PANDAROOTusing the GEANT4 program. Since the forwardtrack reconstruction program had not been yet de-veloped, the information on particle momentum,track length, as well as Λ(Λ) decay vertex positionwere taken to be as those obtained with GEANT4.Time-of-flight and time stamp of particle arrivalat a slab of the FToF detector were calculatedand the time-of-flight was smeared using a Gaus-sian with σ = 100 ps.
All combinations of hadron pairs with oppositecharges which were produced in a generated eventand produced hits in the FToF detector (crossedthe sensitive area of the FToF) were selected.In order to isolate Λ(Λ) peak the invariant massof two hadrons with opposite charges containingtheir 4-momenta must be built. The FS trackingsystem gives a 3-momentum of the hadron. Miss-ing is the hadron mass. If the observed hadronscome from Λ(Λ) decay, the negative (positive)hadron should have the proton mass while thepositive (negative) hadron must be a pion. Asmost of the detected pairs are π+π−-pairs, thiscondition, i.e., only assumption on the detectedhadron mass (criterion A), strongly suppresses thepion background and Λ peak is clearly seen inFig. 4.12 (left panel). Contrary to that, a similarcriterion (A) applied for Λ selection does not re-sult in a peak Fig. 4.12 (right panel). This showsthat criterion A is not sufficient in the case ofmuch less intensive Λ production within FS ac-ceptance.
In order to suppress better the background con-tribution the timing criterion was applied (crite-rion B). The time-of-flight is calculated for bothhadrons in a selected pair using the criteria A hy-pothesis for hadrons masses, their momenta andtrack lengths. In the case of the wrongly as-

FAIR/Pbar/Technical Design Report - FToF 33
Figure 4.10: Hits distributions in the FToF xy-plane (top) and their x, y-projections (bottom) for p, p, π+, π−,K+ and K−
signed mass, e.g. the pion is assumed to have aproton mass, the calculated time-of-flight will bewrong and the timing condition will not be ful-filled. In the real experiment this is equivalentto the PID using the time-of-flight criterion. Thetiming criterion was quantified by the condition|th1 − th2| < 100 ps where th1 and th2 are timestamps of the hadron 1 and 2 in the decay vertex,respectively. Here we remind that the time reso-lution in the time-of-flight calculations was takento be σ = 100 ps. As one can see in Fig. 4.13 (leftpanel) the criterion B resulted in a very strongsuppression of the combinatorial background andsome decrease of real Λ events (due to nonzeroσ). For Λ event selection, the effect of the timingrequirement is shown in Fig. 4.13 (right panel).The Λ peak is seen. The number of events in thepeak is estimated with the background interpo-lated with a straight line.
In Fig. 4.14 the Λ decay length distribution isshown. The further strong background suppres-sion can be made by a cut on the decay length, orvertex separation z2 − z1. The above example onreconstruction of a weak signal from Λ decay maybe instructive in the case of even weaker signals
Table 4.4: Probability of coincidences between FToFwall and ScTil detectors
pbeam2.5
GeV5.0
GeV10.0GeV
12.5GeV
ε 23.6% 31.5% 45.4% 48.3%
of decaying particle like, e.g., Λc → Λ + π−, Λ→p + π+. The secondary vertex position is recon-structed with the help of PANDA tracking detec-tors like the MVD with a high precision. The ef-fect on background suppression due to the vertexseparation is expected to be very helpful.
4.4 Interplay between FToFwall and SciTil detectors
There is no dedicated start counter in the PANDAdetector. In order to use the time-of-flight crite-rion for the pattern recognition, the timing con-dition for the time stamps of the particle comingfrom the IP, or from the decay vertex, must be ap-

34 PANDA - Strong interaction studies with antiprotons
0 2 4 6 8 1 00
4 0 0
8 0 0
1 2 0 0
1 6 0 0
p , G e V
p p X+ → Λ +
0 1 0 2 0 3 0 4 0 5 0 6 00
2 0 0
4 0 0
6 0 0 p p X+ → Λ +
q , d e g
0 2 4 6 8 1 00
1 0 0
2 0 0
3 0 0
4 0 0
5 0 0 p p X+ → Λ +
p , G e V0 1 0 2 0 3 0 4 0 5 0 6 0
0
4 0 0
8 0 0
1 2 0 0
1 6 0 0 p p X+ → Λ +
q , d e g
Figure 4.11: Momentum and angular distributions for Λ (upper panels) and Λ (lower panels) hyperons
Figure 4.12: Invariant mass distribution for Λ (left panel) and for Λ (right panel) with selection criteria A.The solid line in Λ case shows result of fit performed with a Gaussian and second order polynomial. Fittingparameters are mΛ (mΛ,PDG = 1.11683 GeV), σΛ (Gaussian peak dispersion), NΛ (number of Λ events) and Nbgr
(background contribution under the peak), η = NΛ/ (NΛ +Nbgr)

FAIR/Pbar/Technical Design Report - FToF 35
Figure 4.13: Invariant mass distribution for Λ (left panel) and for Λ (right panel) with selection criteria A andB
Figure 4.14: Λ decay vertex distribution. Here z1
and z2 are production vertex (target) position anddecay vertex position along the spectrometer axis, re-spectively
plied. For that, at least two hits must be detectedby either ToF detector. The hit multiplicity dis-tribution per event calculated for the PANDAtime-of-flight detectors SciTil (BToF), FToF walland, tentatively, for Dipole ToF are presented inFig. 4.15.
The probability to detect more than one hit (dou-
ble hit probability) may be defined as ε =∑
i>1Ni∑i>0Ni
,
where i is a hit multiplicity. These numbers at10 GeV p beam are 48% and 38% for SciTil andFToF wall detectors, respectively. For the dipole
Figure 4.15: Hits multiplicity distributions for Sci-Til (barrel ToF), dipole ToF (DToF) and FToF wall(forward ToF) at 10 GeV p beam
ToF the counting rate is by an order of magnitudeless and the double hit probability is less than 5%.As it is seen from Fig. 4.16 the double hit prob-ability increases with the beam momentum. Inthe lower panels of Fig. 4.16 the hit multiplicitydistributions are shown with a green color for thecase when either SciTil or FToF wall (at least)would detect more than one hit. The correspond-ing probabilities ε are 61% and 80% for the beammomentum 5 GeV and 12.5 GeV, respectively.

36 PANDA - Strong interaction studies with antiprotons
Figure 4.16: Hits multiplicity distributions for SciTil (barrel ToF) and FToF wall (forward ToF) at 5 GeV and12,5 GeV p beam. The lower panels shows hits distributions for the case case when either SciTil or FToF wall(at least) would detect more than one hit
Another option for the application of the time-of-flight criterion is the coincidence between thetwo ToF detectors. The coincidence probabilitiesgiven in Table 4.4 increase with the beam momen-tum.
To conclude, the MC simulation confirms thatthe FToF wall is an important component of thePANDA experiment. It is used for hadron PID atthe particle momenta below 4 GeV. With the helpof FToF wall information the event start time canbe obtained. The timing criterion for event re-construction can be applied in many cases witha high efficiency. The count rate per a scintilla-tion counter in the wall at the maximal luminos-ity stays below 1 MHz. The forward emitted Λbaryons can be used for calibrations and tuningof the detector.
4.5 Time-dependent MonteCarlo simulation
A study of the FToF wall detector performanceusing PANDAROOT is still in progress. The goalis to analyze particle hits detected with the FToFwall in a chronological sequence in order to findout how hits produced in consecutive events canbe separated. The calculations with 5 GeV and 15GeV beam for the high luminosity mode (2× 10⁷
interactions/s) have been performed. It has beenpreliminary shown that at 5 GeV there is practi-cally no event overlap. However, this fraction isincreasing with the beam momentum. The pileupeffect is estimated to be small for the FToF wall.More detailed studies with information from otherdetectors included in the analysis will be done inthe near future.
4.6 Optimization of thescintillator thickness andlight guide configuration
For a fast PMT the time resolution is mostlydetermined by the PMT TTS (time transitionspread) and number of the photons in the lead-ing edge (front part) of the photon bunch arrivingat the PMT photocathode. A Monte Carlo studyof the light propagation in the plastic scintillatorand the light guide has been performed in order todetermine the number of photons in the leadingedge of the photon pulse depending on the scin-tillator thickness. in the simulations, the 1 GeVproton track passed the slab through its center.The result is shown in Fig. 4.17.
As one can see, the optimal slab thickness isaround 2.5 cm. Further enlarging the slab thick-

FAIR/Pbar/Technical Design Report - FToF 37
0 5 1 0 1 5 2 0 2 5 3 0 3 5 4 0 4 50
1 0 0 0
2 0 0 0
3 0 0 0
4 0 0 0
5 0 0 0
6 0 0 0
S c i n t i l l a t o r t h i c k n e s s , m m
N p h o t
Figure 4.17: Number of photons in the leadingedge of the photon pulse depending on the scintillatorthickness
nesses does not increase the number of photons inthe front part of the signal. In a similar way anoptimal length of the light guide is found to be12.5 cm which close to that assumed to use forthe large slabs in this project.
4.7 PID and time resolutionvariants
The best time resolution (< 100 ps) will bereached only off-line with all corrections done. Itis important to know how sensitive the PID tothe quality of time measurements, e.g., for pre-liminary analysis, one may use raw time measure-ments with much worse time resolution than thefinal one with all corrections made. The resultsof calculation of hadron mass reconstruction de-pending on time resolution is shown in Fig. 4.2.
References
[1] M. Kotulla et al. Technical Progress Reportfor PANDA: Strong Interaction Studies withAntiprotons. 2005.
[2] A. Capella, U. Sukhatme, C-I Tan, andJ. Tran Thanh Van. Dual parton model. Phys.Rept., 236:225–329, 1994.
[3] T. Orita, K. Shimazoe, and H. Takahashi.The dynamic time-over-threshold method formulti-channel APD based gamma-ray de-tectors. Nuclear Instruments and Meth-
ods in Physics Research Section A: Accelera-tors, Spectrometers, Detectors and AssociatedEquipment, 775:154 – 161, 2015.
[4] I. Kipnis et al. A time-over-threshold machine:The readout integrated circuit for the BaBarsilicon vertex tracker. IEEE Trans. Nucl. Sci.,44:289–297, 1997.

38 PANDA - Strong interaction studies with antiprotons

39
5 Experimental study of prototypes
5.1 Study of photodetectorsusing test-station
5.1.1 Test-station. Generalremarks.
The test-station is designed and built to exam-ine the performance of commercially fabricatedphoto-detectors: photomultiplier tubes PMTsand silicon photomultipliers SiPMs (multi-pixelphoton counters MPPC made up of multipleavalanche photodiodes). These studies are fo-cused on the measurements of time characteristicsand the optimization of their timing resolution.The measurements with the test-station help toselect candidates for further prototyping with thehelp of proton beams. It is also planned that theapproach worked out using the test-station is tobe applied for tests and the preliminary calibra-tion of the FToF wall modules in the process oftheir mass production.
5.1.2 Investigation of PMTs
The test-stand layout for PMT investigations isshown in Fig. 5.1.
A cubic plastic scintillator with dimensions 1 ×1 × 1 cm3 made of BC-408 is viewed with twoPMTs: PMT 0 and PMT 1, their photocathodeface plates being attached to the scintillator atthe opposite sides. An optical contact is providedwith optical grease BC-630. The whole system isplaced in a closed metal-tube box. The scintil-lator is irradiated by the electrons with energiesup to 2.28 MeV from the 90Sr β decay. The elec-trons pass through the window of 100 µm thickblack-paper sheet. The 90Sr radioactive source isplaced in a lead container. Emitted electrons arecollimated as shown in Fig. 5.1. The distance Lvaries from 20 mm for 1” PMTs to 30 mm for 2”PMTs.
The SCDA (continuous-slowing-down approxima-tion) range for a 2 MeV electron is 0.938 g/cm2
with the radiation yield less than 0.6% [1] so thatpractically all emitted within the collimator ac-ceptance electrons are stopped in the plastic scin-tillator.The maximum energy deposit is about 2MeV. According to the BC-408 specification, thiscorresponds to the irradiation of 2× 10⁴ photons.
PMT_1PMT_0
D = 4.5 mm
50 mm
90Sr
BC408 plastic stintillator
20 mm (1" PMT)
30 mm (2" PMT)
Figure 5.1: Layout of test-stand
PMT_0 PMT_1
90Sr
LED PMC
TDC CDC
N1N0
N1
N0
N0
N1
to CDC
to CDC
to TDC
to TDC
Stop N0
Stop N1
Start TDC
Start TDC
Gate CDC
Gate CDC
Figure 5.2: General layout of the test station elec-tronics. N0 and N1 are signals of PMT 0 andPMT 1, CDC is charge-to-digital converter (LeCroyADC 2249A, 250 fK/ch.), TDC is time-to-digital con-verter (16 Ch. CAEN V775 N, 35 ps/ch), LED is lead-ing edge discriminator (8 Ch LeCroy 623B), PMC isprogrammable coincidence matrix (PNPI electronics155/08)
The time resolution of a PMT under investigationis deduced from the t1 − t0 spectrum measuredwith a simultaneous control of the PMT signalamplitudes. Here t1 and t0 are the time stamps ofthe PMT 1 and PMT 0 signals, respectively. Thereadout electronics scheme is shown in Fig. 5.2.
The signals N0 and N1 of PMT 0 and PMT 1 aredivided into two halves with the help of passivesplitters. One half of each signal comes to the

40 PANDA - Strong interaction studies with antiprotons
CDC to be used for the offline amplitude correc-tion. Another half, after shaping with the help ofthe LED, goes to the PMC which produces a fast“Start TDC” pulse and “Gate CDC” signal. TheLED threshold is set to 50 mV while the pulse am-plitude varies typically in the range from 0.5 to 2V. The time difference t1−t0 is measured betweenthe time stamps given by “Start TDC” and “StopN1” pulses. Time difference spectrum between“Start TDC” and “Stop N0” is used for the es-timation of timing uncertainty due to electronics,e.g. due to resolution of the TDCs. The param-eters of photomultipliers under investigation arelisted in Table 5.1.
The signal and noise dependencies on HV valuesfor the investigated Hamamatsu PMTs are pre-sented in Fig. 5.3.
The following pairs of PMTs were investigated us-ing the test station (Table 5.2).
When studying the PMTs pairs of the same typethe HV was tuned such that the CDC distribu-tions of the PMT 0 and PMT 1 were practicallyidentical. In the analysis of obtained results, thetime resolutions of the two PMTs were assumedto be equal in the corresponding data sample.
The typical raw spectra obtained for theR2083/R2083 pair are shown in Fig. 5.4. Theamplitude spectra of the PMTs are practicallyidentical. The “raw” time resolution measuredwith the TDC 1 is RMSTDC 1 = 8.03 ch × 35ps/ch = 281 ps.
The time resolution of the pair is improved toRMSTDC 1 = 2.74 × 35 ps = 96 ps after cut-ting off low energy deposits (low CDC ampli-tudes) as shown in Fig. 5.5. The TDC 0 spectrum,used to control the timing resolution in a “selfstart/stop” variant, is also somewhat improvedgiving RMSTDC 0 = 0.9 ch (31.5 ps) thus showingthat the contribution to the time resolution fromelectronics is mostly defined by the resolution ofthe used TDC.
Note that the CDC spectra after cutting off thelow amplitudes are still having some residual am-plitude spread which affects the time resolution.Further improvement of the time resolution canbe achieved with the help of (offline) amplitudecorrections as discussed in [2, 3, 4] where severalvariants of the amplitude correction are consid-ered. The time walk of a PMT signal after LEDcorrelates strongly with its amplitude. This corre-lation is shown in Fig. 5.6 where TDC 1 is plottedversus 1/
√Qi − 1/
√Qk. Here Q0 and Q1 is the
charge collected by CDC 0 and 1, respectively.
The amplitude correction has been made by a fitto the data as described in details in Sec. 5.2.4.After this correction, it has been finally obtainedσTDC 1 = 72.6 ps (Fig. 5.7).
The experimentally obtained time resolution ofthe R2083/R2083 pair can be decomposed as fol-lows:
σ2TDC1
= 2σ2R2083 + σ2
el + σ2S (5.1)
where σ2R2083 characterizes the “net” time resolu-
tion of the PMT under study, σ2el is the contri-
bution from electronics, and σ2S represents tim-
ing uncertainty due to the track position spreadof the emitted electron in the plastic scintillator.Proceeding from above, the electronics contribu-tion is
√σ2el = 31.5 ps. A conservative estimation
of the track position uncertainty gives√σ2S = 3
mm × 5.27 ps/mm = 15.81 ps. Here we neglecta small difference in the scintillator position forthe measurements with 1 inch and 2 inch PMTs.With these estimations one obtains σ2
R2083 = 45ps. In order to obtain the resolution for R9779the equation
σ2R9779 = σ2
TDC 1∗ − σ2TDC 1 (5.2)
can be used, where σ2TDC 1∗ corresponds to the
measurements for the R2083/R9779 pair. Ina similar way the pairs of XP2020/XP2020,R4998/R4998 and R4998/R9800 have been ana-lyzed. The results are summarized in Table 5.3.
5.1.3 Measurement of SiPMcharacteristics
The studies of SiPM characteristics have beenorganized using the test-station described inSec. 5.1.2. with minor mechanics and electronicsmodifications. As schematically shown in Fig. 5.8,two sets of MPPC modules have been studied:Hamamatsu S10931-50p, with an effective photo-sensitive area 3×3 mm2 (variant A), and KETEK6660, with an active sensor area 6× 6 mm2 (vari-ant B). The dimensions of plastic scintillators usedin the A and B variants are specified in Fig. 5.8.The scintillators were irradiated with the sameradioactive source 90Sr as in Sec. 5.1.2. The max-imum energy deposit of the emitted electrons isless than in the PMT case. It is estimated to be0.75 MeV and 1.37 MeV for variants A and B,respectively.
The SiPM signals are typically at the level of 50- 80 mV being essentially less than those from

FAIR/Pbar/Technical Design Report - FToF 41
Table 5.1: Parameters of photomultipliers under investigation
PMTPhotocathode
diameter,(mm)
Anode pulserise time,
(ns)
e− transitiontime,
(ns)
Transitiontime spread,
(ps)
Gain,×106
Typicalvoltage,
(V)
R4998 25 (1”) 0.7 10 160 5.7 2250
R9800 25 (1”) 1.0 11 270 1.1 1300
R2083 51 (2”) 0.7 16 370 2.5 3000
R9779 51 (2”) 1.8 20 250 0.5 1500
XP2020 51 (2”) 1.6 28 - 30 2000
0 . 6 0 . 7 0 . 8 0 . 9 1 . 0 1 . 1 1 . 2 1 . 3 1 . 4 1 . 5
0 . 0
0 . 5
1 . 0
1 . 5
2 . 0
2 . 5 s i g n a l n o i s e
Signa
l, V
H V , k V
R 9 8 0 0
1 . 4 1 . 5 1 . 6 1 . 7 1 . 8 1 . 9 2 . 0 2 . 1 2 . 2 2 . 3 2 . 4
0 . 0
0 . 5
1 . 0
1 . 5
2 . 0
R 4 9 9 8 s i g n a l n o i s e
Signa
l, V
H V , k V1 . 0 1 . 1 1 . 2 1 . 3 1 . 4 1 . 5 1 . 6 1 . 7 1 . 8
0 . 0
0 . 5
1 . 0
R 9 7 7 9 s i g n a l n o i s e
Signa
l, V
H V , k V2 . 2 2 . 4 2 . 6 2 . 8 3 . 0 3 . 2 3 . 4 3 . 6
0 . 00 . 51 . 01 . 52 . 02 . 53 . 03 . 54 . 0
R 2 0 8 3 s i g n a l n o i s e
Signa
l, V
H V , k V
Figure 5.3: Signal and noise versus applied HV for investigated PMTs
Table 5.2: Pairs of PMT selected for investigations
1” PMTs
PMT 0 PMT 1Applied
HV0 (kV)Applied
HV1 (kV)
R4998 R4998 2.0 1.9
R4998 R9800 2.0 1.35
2” PMTs
PMT 0 PMT 1Applied
HV0 (kV)Applied
HV1 (kV)
R2083 R2083 2.7 2.7
R2083 R9779 2.7 1.6
XP2020 XP2020 2.35 2.25
XP2020 XP2020 2.5 2.36
PMTs. A fast preamplifier (4AMP 165.37, PNPImade electronics with 3 ns rise time and ad-justable voltage gain from 4 to 8) has been usedfor the amplification of the SiPM signals. It mustbe noted that introducing a fast preamplifier inthe electronics scheme does not practically worsen
Figure 5.4: CDC (QDC) and TDC spectra measuredfor pair of identical PMTs R2083/R2083.
overall the electronics time resolution.
The measurement results have been analyzed inthe same way as in Sec. 5.1.2.
For variant A, it has been obtained σTDC 1 = 550and 195 ps before and after cutting off low signalamplitudes. A correlation TDC/CDC similar tothat shown in Fig. 5.6 has been also observed forSiPMs. After the amplitude correction the timeresolution has been improved to σTDC 1(corr) =

42 PANDA - Strong interaction studies with antiprotons
Figure 5.5: Same as in Fig. 5.4 after cuts on CDCspectra.
Figure 5.6: Correlation between TDC 1 and valueof 1/
√Qi − 1/
√Qk
Figure 5.7: Final TDC-1 spectrum after amplitudecorrection.
Table 5.3: Time resolutions obtained at test station
PMT 1σTDC 1
(ps)σPMT
(ps)
R4998(4998/4998)
72.0 44.4
R9800(4998/9800)
86.0 64.6
R2083(2083/2083)
72.6 44.9
R9779(2083/9779)
64.0 56.5
XP2020(2020/2020)
82.0 52.3
S10931-50p3x3 mm2
S10931-50p3x3 mm2
KETEK6x6 mm2
KETEK6x6 mm2
90Sr
Variant A
90Sr
Variant B
3x3x40 mm3
6x6x15 mm3
Figure 5.8: Two variants of measurements of SiPMcharacteristics
150 ps. Using Eq.5.1 with the same values of σ2el
and σ2s as in Sec. 5.1.2. one obtains σS10931=103
ps.
More promising results have been obtained forKETEK 6660 (Table 5.4). The best resolution of66 ps is just a little worse than those for PMTs.One should remember that the amount of irradi-ated photons here is less than in the PMT tests.
The “raw” signal of KETEK 6660 SiPM has along tail of about 150 ps. This limits the maximalcount rate to 50 KHz in a practical utilization ofthese MPPC array. Besides, it complicates CDCmeasurements. The latter difficulty can be solvedusing of a RC differentiating circuit at the output.The pulses of two KETEK 6660 SiPMs passedthrough the differentiator with RC = 1 kΩ× 500pF are shown in Fig. 5.9.
In practical applications of SiPMs, an importantissue is their radiation hardness. We have per-formed a very preliminary study of the SiPM ra-diation hardness exposing a not powered S10931-50p SiPM (3 × 3 mm2) sample to a 1 GeV ex-tracted proton beam of the PNPI synchrocy-clotron. The beam intensity during the testswas 2.1 × 108 cm−2s−1. The sample was irradi-ated in ten successive periods about 10 minuteseach. The integrated number of protons whichpassed through the active area of the sample was0.45 × 1011. The characteristics of the investi-gated SiPM sample were measured at the test-stand before and after the irradiation run. Theresults shown in Table 5.5 demonstrate that thenot powered sample could not tolerate the irra-diation dose mentioned above. Further detailedstudies are needed in order to investigate to whichintegrated radiation dose a SiPM module is oper-ational.

FAIR/Pbar/Technical Design Report - FToF 43
Table 5.4: Main parameters and time resolution of KETEK 6660
Supplyvoltage
(V)
Signalamplitude
(mV)
Noiseamplitude
(mV)
Currentwithout
90Sr (µA)
Currentwith 90Sr
(µA)
σTDC 1
(ps)σTDC 1/
√2
(ps)σKETEK
(ps)
26.35 20÷30 ∼0.3 7.5 9 120 84.8 81.1
26.85 70÷90 ∼0.5 11 13 100 70.7 66.1
Table 5.5: Signal amplitude, noise count rate and dark current of the S10931 SiPM sample before and afterexposition to the 1 GeV proton beam
Supplyvoltage
(V)
Signalamplitude
beforeirradiation
(mV)
Noise beforeirradiation
(kHz)
Darkcurrentbefore
irradiation(µA)
Signalamplitude
afterirradiation
(mV)
Noise afterirradiation
(kHz)
Darkcurrent
afterirradiation
(µA)
72.06 40 1.55 0.15 4 2.8 81
72.53 80 4.2 0.3 6 99 113
Figure 5.9: Pulses of two KETEK 6660 SiPMspassed through the differentiator
5.2 Study of prototypesusing proton beam
5.2.1 Introduction
The configuration of the plastic scintillators forthe FToF wall and selection of the correspondingphoto detectors were discussed above. All PMTsselected for thr tests using proton beams hadbeen preliminary investigated using the test sta-
tion Sec. 5.1. Based on this information, severalscintillation counters were assembled (Table 5.6).The plastic scintillators were made of BICRON408 (BC408). The light guides were made ofPlexiglas. Optical contacts were provided withan optical grease BC630. The light guide witha truncated cone (fish tail) configuration for thePMT of 1” or 2” diameter is shown in Fig. 5.10.Small scintillation counters with plastic scintilla-tors 2 × 2 × 2 cm3 or 1 × 1 × 1 cm3 were alsoused in the test experiments. The small scintil-lation counter was coupled with a single, either,Hamamatsu R4998 or Electron 187 PMT.
A series of measurements were performed at the1 GeV PNPI synchrocyclotron during the periodfrom year 2008 to 2014. Preliminary results ofthese studies can be found in [1]. In the year 2012,there was a run of test measurements at the 2GeV proton beam at the Jessica area of the COSYaccelerator in Julich.
5.2.2 Test of scintillation counterprototypes at the PNPIsynchrocyclotron
The measurements were performed with the helpof one arm of the experimental facility used ina series of experiments on polarization in quasi-elastic (p, 2p) scattering [5][6][7]. A 1 GeV ex-tracted proton beam of the PNPI (Gatchina) syn-chrocyclotron was focused onto a polyethylene

44 PANDA - Strong interaction studies with antiprotons
Table 5.6: Prototypes of scintillation counters testedat proton beams
Scintillatordimensions, cm
Photomultipliers
1.5× 5× 140Hamamatsu R4998
(both ends)
1.5× 10× 140Hamamatsu R2083
(both ends)
2.5× 2.5× 140Hamamatsu R4998
(both ends)
2.5× 5× 140Hamamatsu R4998
(both ends)
2.5× 10× 140Hamamatsu R2083
(both ends)
2.5× 2.5× 140Electron 187 (both
ends)
2.5× 5× 140Electron 187 and
Hamamatsu R4998
2.5× 5× 140Electron 187 (both
ends)
2.5× 10× 100Electron 187 (both
ends)
2.5× 10× 100Electron 187 and
Hamamatsu R4998
target of the MAP spectrometer (Fig. 5.11). Theprotons scattered elastically from hydrogen in thetarget were selected by the spectrometer at a cer-tain scattering angle θp. The spectrometer wasmounted on a movable platform which allows oneto vary the angle θp and thus to set a appropriatescattered proton energy Ep. The measurementswere performed at two sets of the proton energiesand angles: Ep=730 MeV at θp = 26.0 and Ep= 920 MeV at θp = 13.5.
The momentum uncertainty of the scattered pro-tons was defined by the energy spread of the ex-tracted beam [8], the spectrometer angular ac-ceptance θp and the momentum resolution ofthe spectrometer, the latter (∆p/p) being about0.005.
A conservative estimation of the overall uncer-tainty of the scattered proton momentum was ±5MeV/c. The target dimensions seen by the spec-trometer were ±11 mm in a horizontal plane and±7.5 mm in a vertical direction. The spectrometerhorizontal and vertical angular acceptances wererestricted to ±0.007 and ±0.016, respectively, bythe collimator C. The protons scattered from thetarget were focused by two quadrupole lenses Q1
18
0
55
12
5
25100
D46 D46
50
11
0
65
25
D2045
Figure 5.10: The light guides for the plastic scin-tillators of 2.5 cm thickness, 5 cm width (left) andfor the plastic scintillators of 2.5 cm thickness, 10 cmwidth (right)
M1 – M3
C
T
Q1Q2D
X
Y
Z
S0
PC1 – PC3
PC4
S2
S1
S4
S3
Proton
beam
Spectrometer MAP
Figure 5.11: The experimental setup to study scin-tillation counter prototype characteristics at the PNPIproton beam. M1-M3 is scintillation telescope to mon-itor beam intensity, T is polyethylene target, C is col-limator restricting horizontal and vertical spectrome-ter acceptance, Q1, Q2 are focusing quadrupoles, D isdipole magnet. Vacuum system of the spectrometer isshown with thin red lines. PC1, PC2 and PC3, PC4are multiwire proportional chambers to measure x, ycoordinates of a track, S0 is start scintillation counterproducing common trigger. S1, S2 are small scintilla-tion counters (2×2×2 cm3). S3 and S4 are PMTs atboth ends of the slab of the scintillation counter S34.
and Q2, and partly by the dipole, onto the fo-cal plane located in between the multiwire pro-portional chamber PC2 and PC3. The scatteredprotons (as well as the beam) were mostly trans-ported in vacuum. The proportional chambersPC1, PC2 and PC3, PC4 with 1 mm and 2 mmwire spacing, respectively, were used to measurethe x, y coordinates of a track at the location ofthe scintillation counter S34 (S3,S4) under inves-tigation.
A long slab of the tested scintillation counter S34was placed horizontally behind the PC4 (see pho-

FAIR/Pbar/Technical Design Report - FToF 45
Figure 5.12: The scintillation counter prototype S34mounted on the movable platform behind the mul-tiwire proportional chamber PC4. A proportionalchamber seen upstream of the PC4 with wires rotatedby 45. The PC4 was not used in these measurements.
tograph in Fig. 5.12) at 126 cm downstream ofthe spectrometer’s focal plane. The counter wasmounted on a movable platform equipped with re-motely controlled electric motors. Measurementswere carried out at 14 positions of the slab movingalong the x axis starting from the end of the slabviewed with the S3 PMT. As shown in Fig. 5.11the right-handed coordinate system is used withz directed along the spectrometer axis, the x-axisperpendicular to the z-axis in the horizontal planeand y axis perpendicular to the horizontal plane.The slab position along the x axis was fixed bythe value of x measured from the center of theslab. For a slab of 140 cm length x ranges from-70 to 70 cm. The positions of the small scintil-lation counters S1 and S2 were fixed. The coun-ters were aligned along the z-axis and centeredat x = y = 0. The S1(S2) PMT collected pho-tons moving antiparallel (parallel) to the x-axisin direction (opposite) to S3 PMT. In most of themeasurements, the slab was set at y = 0. The yposition of the slab could be changed under man-ual control. It was also possible to turn the S34counter around the x-axis in order to vary the ef-fective energy deposition in the scintillator.
The start counter S0 was made large enough notto restrict the spectrometer acceptance. A partof the data were taken “inclusively” based on S0triggers only. In this case, the peak of elastic pp-scattering projected on the slab formed a spot of35 mm × 60 mm. The inclusive count rate of theS34 counter was mostly determined by the protonhits within this spot.
- 3 0 - 2 0 - 1 0 0 1 0 2 0 3 00
1 0
2 0
3 0
4 0
5 0
6 0
7 0
Coun
ts, x1
03
x , m m- 3 0 - 2 0 - 1 0 0 1 0 2 0 3 0
0
1 0
2 0
3 0
4 0
5 0
6 0
7 0
Coun
ts, x1
03
y , m m
Figure 5.13: x distribution (left) and y distribution(right) at the slab measured under the condition ofS0S1S2 coincidences
Most of the data were collected under the con-dition of the S0S1S2 coincidences. Owing tothis condition the proton hit area was restrictedto a smaller spot defined by the geometry andthe mutual positions of the S1 and S2 scintilla-tors. The corresponding distributions are shownin Fig. 5.13.
The hit position on the slab was specified withinthis spot due to the tracking information obtainedwith the help of PCs. The overall uncertainty ofthe hit position on the slab in the x-coordinate isestimated as σx ≈ 1.8 mm. Taking into accountthe refractive index (1.58 for the plastic scintilla-tor BC408), this corresponds to a timing uncer-tainty of σt ≈ 9.5 ps.
5.2.3 Readout electronics
Implementation of the readout electronicssketched in Fig. 5.14 was similar to that de-scribed in Sec. 5.1. Both, the timing andamplitude information from each scintillationcounter as well as the tracking system informationon the hit position was needed for the precisedetermination of timing intervals in the offlineanalysis. An analog signal from each PMT (S1,S2, S3, S4) was split into two halves with the helpof a passive splitter. One signal after the splittercame to a QDC module (LeCroy ADC 2249A, 250fC/ch) for offline amplitude correction. Anothersignal came to a Leading Edge DiscriminatorLED ( LeCroy 623B) which produced a fastpulse at the “STOP” input of the TDC (CAENV775N, 35 ps per channel). The pulses “START”TDC and “GATE” QDC were activated by thesignal from the S0 PMT passing through theCFD (Constant Fraction Discriminator) under

46 PANDA - Strong interaction studies with antiprotons
Figure 5.14: Scheme of readout electronics, expla-nations are given in text
the condition of coincidences among S0S1S2.The coincidences were realized with the helpof the programming coincidence matrix PMC(production of PNPI). The LED threshold wasadjusted to 50 mV while a typical amplitude ofthe analog signal at the LED input was 0.5 - 2.5V and the pulse rise time was about 2 ns.
As far as the analog PMT signal was always wellwithin the “GATE” pulse, the measured inte-grated charge was proportional to the pulse am-plitude. Thus, a correction can be made to com-pensate on event basis for the timing uncertaintyof the discriminator (LED) (time walk) becauseof the pulse amplitude variations.
As shown in the Fig. 5.14, a part of the electron-ics is situated in the experimental hall (a frontendpart) while the other in the Control Room. Theyare labelled with “Experimental Hall” and “Con-trol Room”, respectively. The connecting cableswere of 50 m length.
In addition to the information from the TDC andQDC, an event contained the tracking informa-tion from the PCs together with Slow Controldata, like slab positions, inclusive count rates ofthe scintillation counters, proton beam character-istics, etc.. The local data acquisition (DAQ) sys-tem was capable to accumulate events at the rateof 10kHz.
5.2.4 Data analysis
A typical example of the integrated charge Q dis-tribution of the S3 and S4 PMTs (raw QCD dis-tributions) is presented in Fig. 5.15.
The data have been obtained at tests of the slab
Figure 5.15: Integrated charge Q distributions ofS4 PMT (left) and S3 PMT (right), measured at 920MeV for the slab 2.5× 5× 140 cm3 positioned at x =−60 cm
with dimensions 2.5×5×140 cm3 using 920 MeVprotons with the scintillation slab coupled to twoR4998 PMTs. The slab was positioned at x =−60 cm.
The observed distributions are intermediate onesbetween Landau and Gaussian type distributions.One may try to interpret this shape as a fluctu-ation of the proton energy loss in the slab. Forrelativistic protons a standard deviation σ of theGaussian distribution can be estimated as [9]:
σ
∆E=
√0.153me
ZAρt
Ep
Mp
∆E= 0.097 (5.3)
Here ∆E is the energy deposition in the slab, me
and Mp are the electron and proton mass, Ep isthe proton energy, ρ and t are the scintillator den-sity and thickness, Z/A for BC408 is 0.542. TheLandau equation gives a close value: σ/∆E ∼ 0.1.Experimentally, σmeas = 0.126 and 0.132 havebeen obtained for QDC3 and QDC4, respectively.It is important that the Q fluctuations are quitemoderate and thus may be corrected for offline.
In order to simulate the time-of-flight measure-ments experimentally, the time interval tik = tk−ti distributions obtained with the help of TDCswere analyzed. Here ti(tk) is a time stamp forthe detected particle to pass through the plasticscintillator of the counter Si(Sk), i(k) = 1, 2, 3, 4(k > i). In the measurements of timing resolu-tions one of the small counters was conditionallyassumed to be a “start” while S3 or S4 was a“stop”. An example of the raw TDC distributionsis shown in Fig. 5.16. In addition to the measuredtime-of-flight, a raw distribution contains two de-pendencies: dependence on pulse amplitude (timewalk due to frontend electronics threshold) andvariation of the delay of photon pulse arrival atthe PMT photocathode related to spread of hitpositions of the detected particle along the scintil-lator. The two dependencies are kept under con-
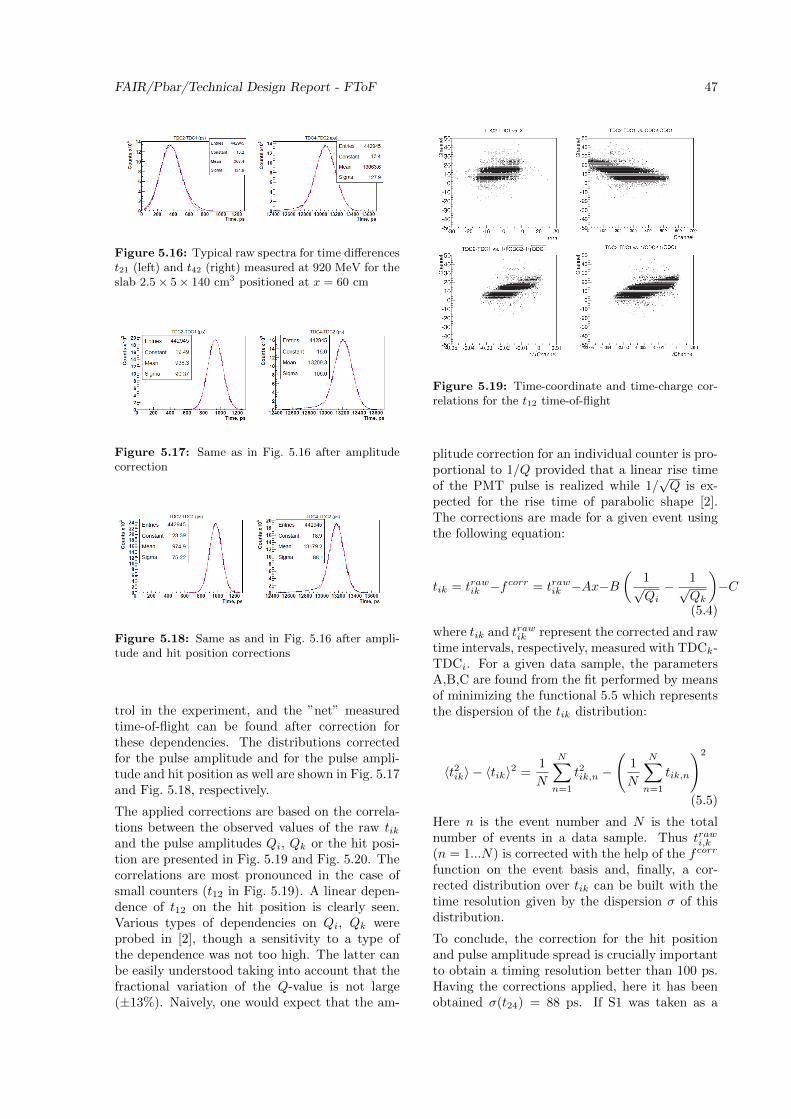
FAIR/Pbar/Technical Design Report - FToF 47
Figure 5.16: Typical raw spectra for time differencest21 (left) and t42 (right) measured at 920 MeV for theslab 2.5× 5× 140 cm3 positioned at x = 60 cm
Figure 5.17: Same as in Fig. 5.16 after amplitudecorrection
Figure 5.18: Same as and in Fig. 5.16 after ampli-tude and hit position corrections
trol in the experiment, and the ”net” measuredtime-of-flight can be found after correction forthese dependencies. The distributions correctedfor the pulse amplitude and for the pulse ampli-tude and hit position as well are shown in Fig. 5.17and Fig. 5.18, respectively.
The applied corrections are based on the correla-tions between the observed values of the raw tikand the pulse amplitudes Qi, Qk or the hit posi-tion are presented in Fig. 5.19 and Fig. 5.20. Thecorrelations are most pronounced in the case ofsmall counters (t12 in Fig. 5.19). A linear depen-dence of t12 on the hit position is clearly seen.Various types of dependencies on Qi, Qk wereprobed in [2], though a sensitivity to a type ofthe dependence was not too high. The latter canbe easily understood taking into account that thefractional variation of the Q-value is not large(±13%). Naively, one would expect that the am-
Figure 5.19: Time-coordinate and time-charge cor-relations for the t12 time-of-flight
plitude correction for an individual counter is pro-portional to 1/Q provided that a linear rise timeof the PMT pulse is realized while 1/
√Q is ex-
pected for the rise time of parabolic shape [2].The corrections are made for a given event usingthe following equation:
tik = trawik −f corr = trawik −Ax−B(
1√Qi− 1√
Qk
)−C
(5.4)
where tik and trawik represent the corrected and rawtime intervals, respectively, measured with TDCk-TDCi. For a given data sample, the parametersA,B,C are found from the fit performed by meansof minimizing the functional 5.5 which representsthe dispersion of the tik distribution:
〈t2ik〉 − 〈tik〉2 =1
N
N∑n=1
t2ik,n −
(1
N
N∑n=1
tik,n
)2
(5.5)
Here n is the event number and N is the totalnumber of events in a data sample. Thus trawi,k
(n = 1...N) is corrected with the help of the f corr
function on the event basis and, finally, a cor-rected distribution over tik can be built with thetime resolution given by the dispersion σ of thisdistribution.
To conclude, the correction for the hit positionand pulse amplitude spread is crucially importantto obtain a timing resolution better than 100 ps.Having the corrections applied, here it has beenobtained σ(t24) = 88 ps. If S1 was taken as a

48 PANDA - Strong interaction studies with antiprotons
Figure 5.20: Time-coordinate and time-charge cor-relations for the t24 time-of-flight
start counter the result was just somewhat worse:σ(t14) = 94 ps. The timing resolution of the S3at the opposite end of the slab was much worse(170 ps) because of much less number of photonsreached the PMT3 photocathode. However, theoverall timing resolution of the S34 scintillationcounter σ34 is always better than 100 ps as it isgiven by the weighted mean of the measurementsmade with both S3 and S4 PMTs, i.e. 1/σ2
34 =1/σ2
3 + 1/σ24 .
5.2.5 Tests with 730 MeV protons
This was the first test run at the proton beam. Ascintillation counter to be tested was assembledon a 1.5× 5× 140 cm3 slab viewed with a R4998PMT (S3) from one side only. The time-of-lightresolution of t12 (between S1 and S2 counters) wasmeasured at first. It was found to be σ = 70 psafter offline corrections. An important part of theprogram was to study the dependence of the tim-ing resolution on the energy deposition in the slab.In order to perform this study a possibility was re-alized of turning the slab around the x-axis andthus varying the effective thickness of the scintil-lator in the range from 1.5 to 5 cm. The result ofthe measurements is demonstrated in Fig. 5.21.
The timing resolution for hits in the middle ofthe slab is improving with the increase of theenergy deposition as expected. The scintillatorthickness, however, should be optimized proceed-ing from several, other than the best timing reso-lution, considerations. A serious limitation of the
- 8 0 - 6 0 - 4 0 - 2 0 0 2 0 4 0 6 0 8 04 06 08 0
1 0 01 2 01 4 01 6 01 8 02 0 02 2 02 4 0
Time r
esolu
tion,
ps
x , c m
T h i c k n e s s 1 . 5 c m
- 8 0 - 6 0 - 4 0 - 2 0 0 2 0 4 0 6 0 8 04 06 08 0
1 0 01 2 01 4 01 6 01 8 02 0 02 2 02 4 0 T h i c k n e s s 2 . 5 c m
Time r
esolu
tion,
ps
x , c m
- 8 0 - 6 0 - 4 0 - 2 0 0 2 0 4 0 6 0 8 04 06 08 0
1 0 01 2 01 4 01 6 01 8 02 0 02 2 02 4 0 T h i c k n e s s 4 . 0 c m
Time r
esolu
tion,
ps
x , c m- 8 0 - 6 0 - 4 0 - 2 0 0 2 0 4 0 6 0 8 0
4 06 08 0
1 0 01 2 01 4 01 6 01 8 02 0 02 2 02 4 0 T h i c k n e s s 5 . 0 c m
Time r
esolu
tion,
ps
x , c m
Figure 5.21: Timing resolution versus effectivethickness of the plastic scintillator: 1.5 cm (left upperpanel), 2.5 cm (right upper panel), 4 cm (left lowerpanel) and 5 cm (right lower panel)
scintillator thickness is the admitted extent of theToF wall along the PANDA spectrometer axis andthe fact that it will be situated in front of the FScalorimeter. A thickness of more than 2.5 cm willbe hardly possible because of the limitations dis-cussed above.
As seen from Fig. 5.21, the timing resolution isgetting better with increasing x (proton hit posi-tion approaching the PMT S3). Such a behavioris well approximated with a linear dependence. At2.5 cm thickness, the timing resolution is 125 ps inthe middle of slab. The weighted mean then (pro-vided the slab is viewed from both ends) would bebetter than 90 ps which meets the requirementsof the PANDA experiment. Furthermore, this istrue for any hit positions on the slab.
A further consideration here is that the energy lossof the 730 Mev protons is by a factor of 1.2 largerthan that for minimum ionizing particles (MIP).One would expect then a somewhat worse resolu-tion for the increasing proton momenta up to thatcorresponding to the MIP particles. However, dueto a gradual perfection of the experimental tech-niques, no worsening of the timing resolution wasobserved at tests in the latest series of the mea-surements made with 920 MeV protons (see nextsection) and at a higher proton momentum at atest beam in Julich.
5.2.6 Tests with 920 MeV protons
A wide program of tests has been performed inrecent years in a series of runs using 920 MeVprotons. All the types of large scintillation coun-

FAIR/Pbar/Technical Design Report - FToF 49
ters listed in Table 5.6 were tested and some ofthem tested several times. In the latest run inMay 2014, a scan on the inclusive count rate ofa slab was made in order to define the maximumcount rate at which the scintillation counter pro-totype could still operate.
In addition to the slabs of 140 cm length, the100 cm slabs preliminary foreseen for the instal-lation in the dipole magnet were investigated us-ing PMT187. According to Electron firm specifi-cation these mesh dynode PMTs can operate inmagnetic fields up to 0.5 T.
The main results on the timing resolution mea-sured at 920 MeV are presented in Fig. 5.22. Thebest timing resolution of 43 ps (σ) given by theweighted means was obtained for the slab withcross section 2.5× 2.5 cm2. A value of 60 ps wasobtained for 2.5 × 5 cm2 and slightly worse thanthat for the slab with cross section 2.5× 10 cm2.In all the cases the requirement “better than 100ps” was satisfied.
Most of measurements were made at y = 0 po-sition. In principle, the number of photons col-lected at the PMT photocathode and time reso-lution might also depend on the y-position of thehit. However, no effect of the y-position of theslab on the timing resolution was experimentallyseen.
Of particular interest was the timing resolution ofthe PMT 187. In a ”well focused photons case”which had been realized for the 2.5 × 2.5 × 140cm3 slab they showed a good resolution of about80 ps (Fig. 5.23). For a wider slab (2.5× 10× 100cm3) the resolution deteriorated to 120 ps.
According to Monte Carlo simulations the inte-grated rate of the central slab in the ToF wallis expected to be the highest one, being relatedmostly to elastic pp scattering (Sec. 4.2). Atthe maximum luminosity corresponding to about107 interactions in the target the central countersshould stand against an inclusive count rate of2× 106.
In the PNPI test experiments the inclusive countrate of the S34 counter was monitored (withscalers not shown in Fig. 5.14). As most of thetiming resolution measurements were performedat a moderate count rate of about 10 kHz, a scanon the beam intensity was made while monitor-ing the inclusive S34 rate. The 2.5× 5× 140 cm3
slab assumed as a prototype for the central partof the ToF wall was tested. The results are givenin Table 5.7. Here the rates have been corrected(multiplied) by a factor of 2.5 due to not a ho-
- 8 0 - 6 0 - 4 0 - 2 0 0 2 0 4 0 6 0 8 00
2 04 06 08 0
1 0 01 2 01 4 01 6 0 1 4 0 x 2 . 5 x 2 . 5 c m 3
Time r
esolu
tion,
ps
x , c m- 8 0 - 6 0 - 4 0 - 2 0 0 2 0 4 0 6 0 8 0
02 04 06 08 0
1 0 01 2 01 4 01 6 0 1 4 0 x 2 . 5 x 2 . 5 c m 3
Time r
esolu
tion,
ps
x , c m
- 8 0 - 6 0 - 4 0 - 2 0 0 2 0 4 0 6 0 8 00
2 04 06 08 0
1 0 01 2 01 4 01 6 0 1 4 0 x 5 x 2 . 5 c m 3
Time r
esolu
tion,
ps
x , c m- 8 0 - 6 0 - 4 0 - 2 0 0 2 0 4 0 6 0 8 0
02 04 06 08 0
1 0 01 2 01 4 01 6 0 1 4 0 x 5 x 2 . 5 c m 3
Time r
esolu
tion,
ps
x , c m
- 8 0 - 6 0 - 4 0 - 2 0 0 2 0 4 0 6 0 8 00
2 04 06 08 0
1 0 01 2 01 4 01 6 0 1 4 0 x 1 0 x 2 . 5 c m 3
Time r
esolu
tion,
psx , c m
- 8 0 - 6 0 - 4 0 - 2 0 0 2 0 4 0 6 0 8 00
2 04 06 08 0
1 0 01 2 01 4 01 6 0 1 4 0 x 1 0 x 2 . 5 c m 3
Time r
esolu
tion,
ps
x , c m
Figure 5.22: Timing resolution for various scintilla-tion counter prototypes with S3 (red line) and S4 (blueline) PMT versus slab position (left panels) and corre-sponding weighted means (right panels). From top tobottom, the slabs investigated are: 2.5×2.5×140 cm3
with PMT R4998, 2.5×5×140 cm3 with PMT R4998and 2.5×10×140 cm3 with PMT R2083, respectively
- 8 0 - 6 0 - 4 0 - 2 0 0 2 0 4 0 6 0 8 04 06 08 0
1 0 01 2 01 4 01 6 01 8 02 0 02 2 02 4 0 1 4 0 x 2 . 5 x 2 . 5 c m 3
Time r
esolu
tion,
ps
x , c m- 8 0 - 6 0 - 4 0 - 2 0 0 2 0 4 0 6 0 8 0
4 06 08 0
1 0 01 2 01 4 01 6 01 8 02 0 02 2 02 4 0 1 4 0 x 2 . 5 x 2 . 5 c m 3
Time r
esolu
tion,
ps
x , c m
Figure 5.23: Timing resolution for scintillationcounters with PMT Electron 187, S3 (blue line) andS4 (red line), versus slab position (left panel) and cor-responding weighted means (right panel)
mogeneous time-macro-structure of the extractedproton beam (correction for duty factor). No de-terioration of the timing resolution was observedfor increasing the integrated rate of scattered pro-tons up to 2× 10⁶ s−1.
5.2.7 Measurements with 2000MeV proton test beam ofCOSY accelerator
In December 2012 a scintillation counter proto-type built of the scintillation slab 1.5 × 5 × 140

50 PANDA - Strong interaction studies with antiprotons
Table 5.7: Timing resolution at high inclusive ratesof the S3S4 counter
Inclusive countrate, kHz
600 1100 1700 2000
σ (weightedmean), ps
67 76 75 76
cm3 equipped with two PMTs R4998 was testedin the Jessica area at the COSY proton ring inJulich.
The measurements at COSY were aimed at thefollowing tasks:
1. To repeat measurements at another pro-ton energy which would approximately cor-respond to the minimum energy depositionin the slab;
2. To measure the timing resolution of slabswith 2.5 cm thickness and 1.5cm thickness;
3. There was an opportunity to carry out themeasurements with TRB 2 (Trigger andReadout Board, version 2) readout. This sys-tem was formerly developed for the HADESexperiment [10] and now it is in an upgradephase for PANDA.
The measurements were performed using a 2 GeVproton beam at the relatively low beam intensityof 104 s−1 . The beam spot on the slab was about30 mm diameter.
The measurement principle was basically the sameas in PNPI. Two small counters S1, S2 switched incoincidence determined (roughly) the hit positionarea on the slab. In these measurements, the S1,S2 scintillators with dimensions of 1 × 1 × 1 cm3
were used. These small scintillators were viewedwith the PMTs 187. Since no tracking systemwas used the contribution on the timing resolutionfrom the hit position uncertainty was larger thanin the PNPI tests being estimated as σ ≈ 25 ps.
The scintillation slab with PMTs situated at theCOSY test beam is shown in Fig. 5.24. An optionwas foreseen to move the slab perpendicular tothe beam (along the x-direction in terms of thecoordinate system defined above).
The TRB-2 version was used for the readout. Thewidth of the TDC channel was reduced to 24 ps inorder to minimize contribution to the timing res-olution from the readout electronics. In the 24 psper channel mode, the TRB-2 board had 32 input
Figure 5.24: View of the test measurement setup atJessica area at COSY
Figure 5.25: The TRB-2 based readout electronicsscheme used at COSY test beam
channels with 4 of them connected to the outputanalog signals of PMTs S1,S2,S3,S4 (Fig. 5.25).The scheme provided coincidences of at least 2 of4 signals from these counters. The TRB-2 pro-duced the output n × 40 mV signal with n thenumber of counters in coincidence. The 4FC dis-criminator (production of PNPI) with threshold50 mV activated the TRB-2 to store the eventinformation under the condition n > 1.
Having stored 100 MB (250 MB for TRB-3) theaccumulated data were transferred to a computer.
The timing resolution of the small counters viewedwith PMTs 187 was found to be at the level ofσ = 70 ps. The uncertainty in the hit positionwas somewhat larger than that in the PNPI mea-surements. The timing resolution of the S3 andS4 PMT ranges from 120 to 170 ps depending onthe slab position with respect to the beam (slab x-position). Despite the different experimental con-ditions this result was not far from that measuredin PNPI with a similar slab.

FAIR/Pbar/Technical Design Report - FToF 51
5.2.8 Comments on the necessityof hit position measurementsand time resolution
As discussed above the required time resolutionbetter than 100 ps is obtained provided the hitposition on the slab is measured with a precisionof σ = 2 mm. In the PANDA Forward Spectrom-eter, the information on the track (hit) positionis assumed to be obtained with the help of theForward Tracking system (FT). By a coarse esti-mation made without taking into account multi-ple scattering, an expected space resolution (σ) inthe vertical direction (along the scintillation slab)is about 5 mm which would worsen the obtainednumbers of time resolution by 3 ÷ 5%. The mul-tiple scattering of 1 GeV protons enlarges σ to 11mm which translates into a timing uncertainty of58 ps (!). This deterioration of the space and timeresolution is mostly due to material budget of theForward RICH detector located upstream of theFToF wall.
In principle, one may use the combination of TDCdata based only on the time-of-flight without theinformation onthe hit position but containing onlythe amplitude walk uncertainties of the counters2, 3 and 4-”mean-time variant”. In a simplifiedform, one can write:
T3 = T2 + t+ τ3
T4 = T2 + t+ τ4,
where τ3 (τ4) is the time of propagation of pho-ton bunch through the plastic scintillator from theparticle hit position to the counter 3(4) photo-cathode, t is the time-of-flight of the particle be-tween the start counter 2 (T2) and the scintillationslab. It is obvious that τ3 + τ4 = τ is constant de-pending on the length of the scintillator and prop-erties of scintillator material. Combining the sumT3 +T4 one can write 2t = (T3−T2)+(T4−T2) =T3 + T4 − 2T2. Here all not essential for the timeresolution delays which assumed to be constant,e.g., τ , are omitted. We select here start counter2 with the resolution estimated to be 49 ps (whichis somewhat better than that of the start counter1).
The time resolution provided by the sum T3 + T4is
σ34 =1
2
√σ23 + σ2
4 + 4σ22 . (5.6)
Here σ3, σ4 represent the time resolutions of thecounters 3 and 4. As one can see, the time startuncertainty (σ2) dominates the time resolution inthe mean-time variant Eq. 5.6.
Symmetrically, one may build a combination notcomprising either time-of-flight t or start counterbut containing information on the hit position:∆τ = τ3 − τ4 = T3 − T4. Thus, the hit posi-tion in the center of slab would correspond ∆τ =0. The dispersion of T3 − T4 represents the nettime uncertainty related to the counters 3 and 4:σ34− = 1
2
√σ23 + σ2
4 . Remind that the weightedmean σwm (see above) is given by 1
σ2wm
= 1σ23
+ 1σ24.
An example of the discussed above combinationsmeasured recently at the 920 MeV protons withthe slab 2.5 × 5 × 140 cm3 readout with R4998PMTs at each end presented in Table 5.8.
Assume that the hit is in the middle of the slaband σ3 = σ4 = σ. In this case σwm = σ34− =σ/√
2. As seen from Table 5.8 the net mean timeresolution is somewhat worse: 73.5 versus 64 ps.
The σwm,start column in Table 5.8 shows the realtime resolution which can be achieved in time-of-flight measurements provided that the start signalhas a dispersion at the level of 50 ps. As PANDAhas no dedicated start counter it is subject to MCstudies to estimate a real time resolution for eachreaction under investigation. For example, if astart comes from the BToF detector one wouldexpect σ2 ≈ 100 ps and σwm,start ≈ 100 ps. Itmust be understood that the effective offline timeresolution will depend on many factors like re-action kinematics, particle multiplicity, particlemomenta etc. It is important to note, that FStracking system must provide necessary hit posi-tion resolution as the time resolution in mean timevariant (σ34) is substantially worse.
The combination ∆τ can be used to determineroughly the hit position internally without the FTinformation. The dependence of ∆τ on x is fittedvery well with a linear function (Fig. 5.26). Us-ing the slope parameter obtained in the fit onemay determine the time needed for the propaga-tion of a photon bunch from one end of the scin-tillator to the other: τsci = 59.12 ps/cm ×140 cm= 8276.8 ps. The average photon bunch velocityis vb = 1/59.12 = 0.169 mm/ps which is close tothe speed of light in BC408 (0.1899 mm/ps).
Using the T4−T3 difference one can determine thehit position with a precision of σx = σ43vb, whereσ43 ∼ 85.5 ps, σx ∼ 14.5 mm. This can only beused for a coarse estimation of the hit position ona scintillation slab.

52 PANDA - Strong interaction studies with antiprotons
Table 5.8: Time resolutions using the hit position correction in the time stamp measurements with the counter3 and 4 and in the mean-time variant of the analysis. Here σ34− and σ34 are dispersions of correspondingdistribution (T4 − T3)/2 and (T4 + T3 + 2T2)/2, respectively, σ3 and σ4 are dispersions of the individual counters3 and 4 measured with the hit defined and with the contribution from the start counter subtracted, the weightedmean σwm is defined in text, σ3,start, σ4,start, σwm,start are dispersions with contribution from the start counter2 included, σ2 = 49 ps
x (T4 − T3)/2 (T4 + T3 + 2T2)/2 σ34− σ3 σ4 σwm σ3,start σ4,start σwm,start σ34
(cm) (ps) (ps) (ps) (ps) (ps) (ps) (ps) (ps) (ps) (ps)
60 1503.5 11580 90 61 158 57 78.2 165 70.7 133
40 2770.5 11510 74 80 111 65 93.8 121.3 74.2 123
20 3904 11630 90.5 96 109 72 107.8 119.5 80.0 133.4
0 5025 11580 73.5 84 99 64 97.2 110.5 73 122.5
-20 6255 11630 81.5 111 75 62 121.3 89.6 72 127.5
-40 6890 11560 84 125 68 59 134.2 83.8 71 129
-60 8655 11600 85.5 147 57 53 155 75.1 67 130
Figure 5.26: (T4 − T3)/2 versus x with linear fit
5.3 Summary ofexperimental study ofprototypes
Here we summarize the results of the prototypetests using the test station and proton beams. Atthe test station, an attempt has been undertakento measure the “net” time resolution of a pho-todetector selected for the FToF. Several typesof PMTs have been tested with a high enoughamount of photons (∼ 104) irradiated the PMTphotocathodes.
After the amplitude corrections and subtraction ofthe contributions from electronics (σel) and elec-tron track position (σs) uncertainties it has beenobtained that for all the investigated PMTs the
time resolution (σ) ranges from 45 to 65 ps. Thebest time resolution was observed for two types ofHamamtsu PMTs: R4998 1” and R2083 2”. Theyhad been selected for prototyping using protonbeams with plastic scintillators of 140 cm lengthand various widths and thicknesses. In additionthe PMT 187 (Electron firm) has also been probedat the proton beams without a pre-test at the teststation.
The energy of the proton beams used for the pro-totyping was in the energy range from 740 to 2000MeV. The corresponding stopping power in plas-tic scintillators ranged from 2.5 to 2.1 MeV g−1
cm2, respectively. The latter number are close tothose for a MIP particle. In distinction from thetests with a small plastic scintillator at the teststation, the number of photons at the PMT pho-tocathode of a large counter varies strongly de-pending on the track position in the scintillationslab. For a MIP particle, the number of photonsat photocathode may reach 2.5× 10⁴ if the parti-cle track crosses the scintillator close to the PMTand decreases significantly if the track crosses atfar end of the slab (Sec. 3.3, Fig. 3.4). The timeresolution varies respectively being worse than 100ps in the last case. However, the overall resolutiondefined by the weighted mean of both (indepen-dent) measurements at opposite sides of the slabwas always better than 80 ps.
The time resolution of a particular PMT wascalculated on the event basis using raw TDCand QDC information together with the protontrack position information in the slab measuredwith the help of multi-wire proportional cham-

FAIR/Pbar/Technical Design Report - FToF 53
bers. The correction for the pulse amplitude andhit position was made and a contribution from thesmall start counter S1 (or S2) to the time resolu-tion was subtracted.
The main outcomes of PMT studies are itemisedbelow:
1. The time resolution of 60 - 65 ps was obtainedfor the scintilation counters recommended forprototypes for the FToF wall.
2. The time resolution of 50 ps was obtained forthe slabs of 2.5 cm width. A practical ap-plication of such slabs however would resultin increase of the number of channels whichmay confront the detector cost limitation.
3. The time resolution of 80 ps was obtained forthe scintillation counter based on the slab of2.5 cm width viewed with the Electron PMT187. These mesh PMTs can operate in mag-netic fields up to 0.5 T without a deteriora-tion of the time resolution.
4. Samples with slabs of 1.5 cm thickness origi-nally projected for the FToF wall showed es-sentially worse time resolution than those of2.5 cm thickness.
5. A precise measurement of the hit position iscrucial to get the timing resolution on thelevel of 60 ps. It has been demonstrated thatwithout independent information on the hitposition the best timing resolution which canbe achieved is twice worse.
The prototype samples of interest investigated atproton beams are listed in Table 5.9.
The vertical dimension of the scintillation slabs inTable 5.9 was dictated by the requirements of theFS vertical acceptance. The scintillator thicknessof 2.5 cm was optimized in a dedicated experiment(Fig. 5.21). The selected granularity (slab width)was defined proceeding from PANDAROOT MCstudy fulfilling the condition that counting rateper a scintillation slab should stay below 1-2 MHz(Sec. 4). The count rate drops down in the hori-zontal direction left and right from the FS spec-trometer axis. The last counters left and right inthe side parts of the wall counts about 1/70 of thecount in the central part. This limitation comesfrom an admitted width of the FToF wall and ef-fective acceptance of the FT system to detect lowmomentum particles strongly deflected by the FSdipole magnet.
It should be noted that the time resolutions pre-sented in Table 5.9 are obtained with a negligi-ble contribution from the track hit position un-certainty (∼ 1 mm) and with time uncertainty ofthe start counter subtracted. In other words, theyare ”net” time resolutions.
The selection of the Hamamatsu R2083 andR4998 PMTs was mostly based on the test sta-tion measurement results. The selected samplesdemonstrate excellent performance. One shouldkeep in mind, however, a possible progress inthePMT technology now and in the future.
Having in mind the future Dipole TOF detector,various applications of the photodetectors whichcould stand against a strong magnetic field hasbeen investigated.
The ”Electron” PMT 187 is hardly applicablefor the dipole ToF subdetector as the level ofthe magnetic field inside the dipole is essentiallyhigher than 0.5 T. An alternative choice mightbe a SiPM matrix. The timing characteristicsof SiPMs were tentatively investigated using thePNPI test station. A satisfactory result was ob-tained for KETEK PM6660 samples. A raw tim-ing resoluton of σ = 71 ps (per a SiPM sample)was directly measured, and after the correctionsit was obtained σPM6660 = 66 ps.
A big advantage of SiPMs is that they can operatein high magnetic fields. The KETEK 6660 has anactive area of 6 × 6 mm2 , geometrical efficiencyof 40% and gain 107. It looks like that, presently,the SiPM matrices are the only option to buildthe dipole ToF detector. However, more R&D isneeded. Thus we could not find an informationabout aging of these detectors. A thorough studyof the SiPM radiation hardness is of particularimportantance.
A very tentative test of the radiation hardness ofSiPMs has been made in PNPI using not poweredS0931-50p SiPM (3 × 3 mm2) sample exposed to1 GeV proton beam. It was found that the radi-ation dose equivalent to 0.45× 10¹¹ protons hav-ing passed through the active area of the sampleis crucial for its operation capabilities. More de-tailed information on the radiation hardness of theSiPMs is needed together with a radiation dosemap inside the PANDA dipole magnet.
To conclude,
• BC408 plastic scintillator is selected for theFToF wall. Measured in beam tests light at-tenuation along the slab made of BC408 cor-responds to specification;

54 PANDA - Strong interaction studies with antiprotons
Table 5.9: Prototype samples with experimentally obtained timing resolution calculated as weighted mean forlarge scintillators
Scintillation slabdimensions (cm)
PMTTiming
resolutionσ (ps)
Comment
140× 10× 2.5Hamamatsu R2083
(both ends)63
Recommended for a prototypefor the FToF wall
140× 5× 2.5Hamamatsu R4998
(both ends)60
Recommended for a prototypefor the FToF wall
140× 2.5× 2.5Hamamatsu R4998
(both ends)43
Variant of prototype withsmaller stintillator width
140× 5× 1.5Hamamatsu R4998
(both ends)≈ 88
Projected originally for theFToF wall
140× 2.5× 2.5Electron 187 (both
ends)78
Magnetic field protected,tentatively projected for the
dipole ToF
1× 1× 1Electron 187,
Hamamatsu R499849
“net” timing resolution of onePMT
• Two types of fast Hamamatsu PMTs are se-lected for the FToF wall as they have demon-strated the best performance both at the teststation and on beam tests;
• The scintillator thickness has been experi-mentally optimized. It is selected for theFToF to be of 2.5 cm. The beam tests showedthat smaller thickness resulted in worse timeresolution (Table 5.8);
• The measured average velocity of photonbunch propagation along the the BC408 scin-tillator is 0.169 mm/ps. In order to minimizea corresponding time uncertainty the particlehit position must be measured with a preci-sion of a few mm. Then one may guaranteethe time resolution better 100 ps;
• Without the hit position measurement, theFToF wall can provide time resolution on thelevel of 120-130 ps (mean time variant).
5.4 Outlook for furtherexperimental studies
It is planned to continue the high time resolutioninvestigations of the prototype using a fast UVlaser and (if necessary) the 1 GeV proton beamof the PNPI accelerator. The Picosecond PulsedDiode laser PDL-800, available at the PNPI sinceJune 2017, provides excellent conditions for mea-surements with a good simulation of the light
pulse produced by a real particle. It also allowsto control the pulse amplitude and length (downto 50 ps), to change the laser frequency from asingle shot to 40 MHz, to vary pulse power, etc.A room with the necessary infrastructure is avail-able. A mechanical mount to work with the largescintillation blocks is in process of fabrication.
A first test has already been done with the PDL-800 irradiating a small scintillator coupled witha PMT Hamamatsu R4998. A time resolution ofabout 40 ps has been obtained.
A number of tasks are planned to perform usingthe system based on the PDL-800:
• Optimization of PMT parameters togetherwith optimization of the active divider
• Detailed studies with the proposed sizes ofthe scintillation slabs. Comparison of the Bi-cron408 and EJ200 characteristics
• Measurements of the attenuation lengths ofthe large scintillators
• Experimental study of the light guides withlarge scintillators (comparison to MonteCarlo analysis, section 4.6)
• Measurements with readout electronicsboards in the final configuration
• Final adjustment to the PANDA experimentrequirements

FAIR/Pbar/Technical Design Report - FToF 55
References
[1] S.L. Belostotski et al. Test of scintillationcounter for the PANDA time-of-flight detec-tor at 730 MeV proton beam. Preprint-PNPI,2010.
[2] N. Rabin. Status and possibilities of the time-of-flight measurement technique using longscintillation counters with a small cross sec-tion. Instrum. Exp. Tech., 50:579–638, 2007.
[3] W. Braunschweig, E. Konigs, W. Sturm, andW. Wallraff. A Large Area Time-Of-FlightSystem with a Resolution of 0.5 ns fwhm.Nucl. Instrum. Meth., 134:261–266, 1976.
[4] T. Tanimori, T. Kageyama, K. Naka-mura, M. Yoshioka, J. Haba, H. Kawai,M. Kobayashi, T. S. Nakamura, andN. Sasao. A TEST OF 150-CM X 20-CM WIDE TIME-OF-FLIGHT SCINTIL-LATION COUNTERS. Nucl. Instrum.Meth., 216:57–65, 1983.
[5] O. V. Miklukho et al. Polarization in quasi-elastic (p, 2p) reaction on 7 Li nucleus incomplete kinematics at 1 GeV. Nucl. Phys.,A683:145–156, 2001.
[6] V. A. Andreev et al. Polarizations for protonknockout reactions from s(1/2) orbits at 1-GeV. Phys. Rev., C69:024604, 2004.
[7] O. V. Miklukho et al. Polarization effectsin the quasi - elastic (p, 2p) reaction withthe nuclear S-shell protons at 1 GeV. Phys.Atom. Nucl., 76:871–880, 2013.
[8] S.L. Belostotskii, G.D. Alkhazov, G.M.Amalskii, A.A. Verobev, and Yu.V. Dot-senko. Use of Extracted SynchrocyclotronBeam to Investigate Scattering of 1-GeV Pro-tons by Nuclei. JETP Lett., 17/2:101.
[9] S.M.Seltzer and M.J.Berger. Energy lossstraggling of protons and mesons. Studies inPenetration of Charged Particles in Matter,Nuclear Science Series, 39, 1964.
[10] I. Frohlich et al. TRB for HADES and FAIRexperiments at GSI. In Astroparticle, parti-cle and space physics, detectors and medicalphysics applications. Proceedings, 10th Con-ference, ICATPP 2007, Como, Italy, October8-12, 2007, pages 973–977, 2008.

56 PANDA - Strong interaction studies with antiprotons

57
6 Calibration and monitoring
The FToF counter is dedicated to measure thetime stamp t corresponding to a particle passingthrough the sensitive area of the FToF wall. Notethat the crossing time through the scintillator (of2.5 cm thickness) is not zero. For relativistic par-ticles the ∆t to cross the scintillator is 75 ps. Wedetermine the time stamp position by crossing theupstream surface of the scintillator. The time tis counted from some reference signal (PMT1 orPMT2) as conditionally shown in Fig. 6.1. Thescintillation bar is read out from both ends withPMT3 and PMT4.
Figure 6.1: Calibration scheme of a large scintilla-tion slab
One can write in a simplified way
T3 = t+ τ3 + δ3 + d3
T4 = t+ τ4 + δ4 + d4
Here T3 (T4) is the time difference measured withTDC3 (TDC4) between a STOP signal from thePMT3 (PMT4) and the START signal from a ref-erence counter (e.g. PMT1), τ3 (τ4) is the effec-tive time of the light pulse to reach the PMT3(PMT4) photocathode, τ3 (τ4) contains the fluc-tuating part of T3 (T4) related to fluctuations
of the number of photoelectrons, fluctuations oftransition time in PMT(s), readout electronicsresolution, etc., d3 (d4) includes all latencies in agiven channel (cables, PMT transition time, elec-tronics) which may slowly vary due to temper-ature change and other external environmentalconditions. The value of τ3+τ4 = τ has been mea-sured using T3 − T4 difference for the prototypesample slab of 140× 5× 2.5 cm3 made of BC408:it has been found τ = 8277 ps and light pulse ve-locity v = 0.169 mm/ps (Sec. 5.2). These valuesare to be specified for each individual counter.
Here we first consider ”on beam” calibrations us-ing particles produced off the PANDA spectrome-ter target. In principle, the value of τ3(τ4) can bedetermined provided the hit position is indepen-dently measured. This information could comefrom the FS tracking system. An expected con-tribution to the time resolution from the hit posi-tion uncertainty is however not small in this case(10 to 50 ps). In order to exclude this uncertaintyone may build the sum
T3+T4 = 2t+τ+δ3++δ4+d3+d4 = 2t+τ+δ+d
where τ = τ3+τ4, d = d3+d4 (meantime variant).
Assume that a bunch of events with known ti,where i is event number, is used for the calibra-tion (determination of all latencies). Unknownlatencies can be then found as
δ + d = T3 + T4 − 2t− τ
Where δ, T3, T4 and t are averaged over the datasample. Note that individual values of d3+δ3, d4+δ4 can be determined using additional equation
T3 − T4 =2x
Lτ + (d3 + δ3)− (d4 + δ4)
Here x is hit position (counted from the center ofslab), L is slab length.
It must be noted that the average value of δ3(δ4) isnot zero. In the TOT (time over threshold) vari-ant of readout electronics, the average value of thetime walk depends on the pulse amplitude. Thelatter is proportional to the energy deposit in thescintillator which, according to our expectations,varies from 5 to 50 MeV (Sec. 3.3). Therefore the

58 PANDA - Strong interaction studies with antiprotons
δ3(δ4) calibration must be performed at severalpoints within this dynamic range and at variouselectronic thresholds.
Calibration using elastically scattered p. Theelastically scattered p (protons in the case ofHESR proton test beam) can be easily selectedwith the help of the dipole magnet. The momen-tum spread in the selected data sample for eachscattering angle is on the level of 1% and time-of-flight per event (ti) is well defined. The en-ergy deposit in the plastic scintillator is about 5MeV (MIP). However, these protons are availablefor calibration at a high enough rate mostly forthe central part of the detector (see Fig. 4.16 inSec. 4).
Calibration using inclusively produced hadrons.The protons and pions unclusively produced aremuch less peaked at small angles (Fig. 4.10) andcan be used for calibration of the side parts ofthe FToF wall together with FRICH informtion(provided that the particle momentum is higherthan RICH threshold).
Calibration using Λ decay Λ→ p+ π+. The Λpeak is well seen after very modest selection crite-ria (Sec. 4.3), the event rate can reach a few kHz.The p from Λ decay are again strongly peaked atsmall angles while pions cover much wider angularrange. It is important that the decay vertex wouldbe reconstructed and both p and pion momentaare well reconstructed.
Laser calibration. Modern picosecond lasers pro-vide excellent opportunities for calibrations ofmultichannel time-of-flight systems. A possibil-ity to vary light pulse amplitude would help toscan the dynamic range. A high repletion rateallows to study the saturation effects in PMTs.There are many commercially available suitablelasers. As an example, characteristics of Pil040laser (405 nm) are listed below
PiLas
Center wavelenght 375 nm - 2 µm
Pulse duration 20 ps - 1 ns variable
Pulse peake power 25 - 1000 mW
Pulse repetition rate single shop - 120 MHz
Output free space or fiber output
PER > 23 dB
Timing Jitter < 3 ps rms
Warm-up time < 5 minutes
Size laser head 95× 31× 147 mm3
Size control unit 235× 88× 326 mm3
Power consuption < 15 W
Weight laser head 0.45 kg
Weight controller 2.5 kg
A laser calibration system built of commerciallyavalable optical components is described in detailin [1]. Here we plan to build a similar system.The laser calibration may operate in beam pausesduring data taking period and thus be used fora continuous monitoring of the ToF detector pa-rameters. The laser light pulse passing through asplitter is delivered to the middle of a scintillationslab with the help of a 3 m optical fiber. The split-ter serves to callibrate a multichannel system ofthe scintillation counters. All the optical compo-nents necessary for the calibration as well as thelaser itself are included in the FToF cost matrix.
The cost estimation is included in the cost matrixof the FToF wall.
References
[1] R. Bertoni, M. Bonesini, A. de Bari, andM. Rossella. A laser diode based systemfor calibration of fast time-of-flight detectors.JINST, 11(05):P05024, 2016.

59
7 Project management
7.1 Responsibility
The FToF detector is designed, prototyped andtested in PNPI. The PNPI group is fully andthe only one responsible for realization of thisproject. The project will be realized with the helpof the PNPI Electronic department and Techni-cal - Manufacturing department. The project isstrongly supported by the PNPI administration.
The PNPI group involved in PANDA experimentconsists of six physicists, PhD student, expert onFEE electronics and one technician. The PNPIsuggested financial and infrastructure help in or-ganization of the test station with a picosecondUV laser and space for mass production.
7.2 Work packages
As has been presented above, the FToF wall isto be assembled of standard modules those con-sisting of commercially procured elements (largescintillation slabs and PMTs). The supportingstructure is to be designed and fabricated inPNPI. The readout electronics will be based onPADIWA interface and TRB-3 modules being cur-rently worked out in GSI. Expertise of the GSIelectronic group is (will be) very helpful.
The project is planned to organize (in work pack-ages -WPs) as follows in Table 7.1.
7.3 Timelines and milestones
Timelines are presented in Table 7.2. It is plannedthat the FToF wall detector will be built in thePNPI. All the commercially available componentswill be delivered to the PNPI, assembled andtested there. The system is modulized: one blockconsists of a scintillation slab, two fast PMTs andan optical connector in the middle of the slab. Thetests of an individual module will be organizedwith the help of the fast UV-laser (Laser headLDH-P-C-3758, Laser driver PicoQuant PDL 800-B):
• Wavelengths between 375 nm and 1550 nm
• Pulse widths as short as 70 ps (FWHM),
• Time stamp at 3 ps precision,
• Peak power up to 1 W,
• Repetition rate from single shot to 80 MHz.
The laser is available since recently in the PNPI.
As far as the UV laser is planned to be in com-mon use (e.g. for R3B tests) the FToF calibrationsystem is based on a dedicated laser PiLas as de-scribed above.
The readout electronics will be the PADIWA andTRB-3 (FPGA platform) according to the proto-typing presented in the TDR. All the mechanicalcomponents will be fabricated in the PNPI.

60 PANDA - Strong interaction studies with antiprotons
Table 7.1: Work packages and responsibilities
WP WP content Involved groups, organizations
WP1 HV system together with PMT dividers PNPI Electronics Division
WP2 Laser calibration system PNPI Electronics Division
WP3 FPGA based frontend electronics GSI, Darmstadt, PNPI
WP4 PMTs and plastic scintillators Hamamatsu, Bicron, other relevantfirms
WP5 Mechanical components: supporting frame, patchpanels, PMT housings
PNPI Design division, PNPI Workshop
WP6 PANDAROOT MC studies: benchmark reactions intime-dependent MC-simulations. FToF wall time res-olution and PID
Table 7.2: Timelines and milestonesTDR presented to PANDA collaboration 12.2016
Organization of working place for assembling and tests of scintillation counter mod-ules in PNPI
01.2017 - 12.2018
Approval of TDR by FAIR [M3] 06.2018
Prepare funding request 06.2018 - 03.2018
Funding established 03.2019
Tendering 03.2019 - 12.2019
Prepare contract 04.2019 - 11.2019
Contract is signed [M4] 12.2019
Tender completed 12.2019
Prepare manufacturing concept and documentation for tests and mass production 01.2019 - 12.2019
Procurement of necessary equipment for tests and calibrations (components notyet available)
06.2019 - 12.2019
Procurement materials for mass production (scintillators, PMTs, etc) 06.2019 - 12.2019
Preparation of drawings for mechanical items. Fabrication of mechanical items. 06.2018 - 12.2019
Mass production. Assembly, tests and calibration of scintillation modules 01.2020 - 06.2021
Preassembly of the FToF wall 06.2021 - 12.2021
Shipment to GSI 01.2022 - 06.2022
Integration in PANDA detector [M11] 06.2022 - 06.2023
Pre-tests, on beam tests [M12] 06.2023 - 12.2023

8 Conclusion
We presented here the design, experimental testsand Monte Carlo simulation studies of the FTOFwall sub-detector dedicated to measure the eventstart T0 and time-of-flight of hadrons in the For-ward Spectrometer of the PANDA experiment.The FTOF wall is situated at 7.5 m downstreamthe interaction point. It covers practically allacceptance of the Forward Spectrometer. Ac-cording to design considerations, the wall can bebuilt using commercially available plastic scintil-lators, photomultipliers tubes and other opticalcomponents. The FEE electronics is based onthe FPGA platform (TRB-3 and PADIWA) de-veloped in GSI.
The experimental tests performed with 920 MeVprotons have demonstrated that the proposedscintillation wall meets all the requirements ofthe PANDA experiment. The experimentally mea-sured (offline) time resolution was obtained to beσ ≈ 70 ps. The time lines for detector construc-tion complies with general PANDA planning.
61

PANDA - Strong interaction studies with antiprotons
Acknowledgments
We acknowledge financial support from theRussian funding agency ”State Corporationfor Atomic Energy Rosatom”, the adminis-tration of the High Energy Physics Divisionof the B. P. Konstantinov Petersburg NuclearPhysics Institute of National research CenterKurchatov Institute, the ForschungszentrumJulich GmbH.We are grateful to Dr. M. Traxler for hishelp in tuning and development of the TRB-3 platform for the FToF detector. We aregrateful to the accelerator crews of the PNPIand Julich IKP for their help in organizationof on-beam tests. In particular, we are grate-ful to Prof. J. Ritman for his help in provid-ing our experimental studies with necessarymaterials and for very useful discussions. Weare grateful to Dr. H. Orth for his valuableadvises on TDR drafting. Especially, we aregrateful to Dr. Anastasios Belias for his veryuseful help in drafting this document.
62
Copyright © 2022 FDOKUMEN