Exploring Bamboo Leaf Nutrient Value in the USNPGS ...
8
Citation: Wang ML, Irish B, Tonnis BD, Pinnow D, Davis J, Hotchkiss MW, et al. Exploring Bamboo Leaf Nutrient Value in the USNPGS Germplasm Collection. Austin Food Sci. 2017; 2(1): 1030. Austin Food Sci - Volume 2 Issue 1 - 2017 Submit your Manuscript | www.austinpublishinggroup.com Wang et al. © All rights are reserved Austin Food Sciences Open Access Abstract Bamboo shoots and leaves are nutritious, providing food for human and animal consumption. However their nutrient value depends on a number of factors including the bamboo species (e.g. taxon), harvesting season and growing location. Leaf crude protein content, amino acid composition and mineral element concentration were quantified from leaf samples collected from 222 accessions representing two bamboo types (temperate/tropical), two growing seasons (dry/wet) and three locations (PGRCU-Byron, GA; TARS- Mayaguez, PR; and Govardhan Gardens-Mayaguez, PR). Significant variability in leaf nutrient value was identified among accessions, types, growing locations and harvesting seasons. On average, bamboo leaf tissue contained 12.92% protein with relatively high percentages of leucine (Leu, 8.97%) and proline (Pro, 7.98%) and low percentages of tryptophan (Trp, 1.69%) and histidine (His, 2.01%). Bamboo leaves also contained relatively high concentrations of the macro-mineral elements potassium (K, 12.17mg/g) and calcium (Ca, 5.37mg/g), high concentrations of the micro-mineral elements manganese (Mn, 388.76 μg/g) and iron (Fe, 123.19 μg/g), and low concentrations of boron (B, 7.8 μg/g) and zinc (Zn, 28.56 μg/g). PI 647932 and TARS 182857 contained the highest and lowest protein content (21.69% and 5.78%), respectively. Temperate bamboos contained a significantly higher percentage of protein (13.02%) than tropical bamboos (12.71%). Leaf samples harvested from the dry season contained a significantly higher percentage of protein (13.12%) than leaf samples harvested from the wet season (12.70%). The leaf samples harvested from Govardhan Garden location contained a higher percentage of protein (13.40%) than from Byron (12.65%) and TARS (12.89%) locations. The leaf samples harvested from Govardhan Garden contained a significantly higher iron concentration (151.22 μg/g) than from the other two locations (118.19 μg/g, 111.52 μg/g), whereas the leaf samples collected from Byron contained a significantly higher zinc concentration (36.03 μg/g) than what was observed from the other two locations (27.83 μg/g, 22.11 μg/g). There was no significant difference in iron and zinc concentrations between leaf samples collected from dry or wet seasons. Tropical bamboo leaves contained a higher iron concentration (131.74 μg/g) than temperate bamboo leaves (118.95 μg/g), whereas temperate bamboo leaves contained a significantly higher zinc concentration (29.82 μg/g) than tropical bamboo leaves (26.01 μg/g). The information on the bamboo leaf nutrient value related to bamboo accessions, types, growing location and harvesting season will be very useful for bamboo growers, processors and consumers. Keywords: Bamboo leaf nutrition; Amino acid; Microelement; Protein; Genetic resources Popular vegetables, especially in Asian countries. Bamboo leaves, stems and shoots are a staple food for giant pandas. Research has shown that as shoots age, all nutrient values (except dietary fiber) decrease [4-6]. Bamboo leaves are used as a food source for goats, sheep, yaks and cattle. However, there is a lack of information available on the nutrient value of leaves harvested at different seasons and specific locations. e genetic diversity of the USDA-ARS National Plant Germplasm System’s (NPGS) bamboo germplasm accessions maintained in Byron, GA was previously characterized using SSR markers [7], but there was no nutritional information available for these accessions or for those maintained at the Tropical Agricultural Research Station. Introduction Bamboos are fast-growing species in the grass family (Poaceae), mainly growing in temperate and tropical regions of the world. Bamboos have multiple utilizations (including building materials, medicinal ingredients, nutritious vegetables and animal feed stocks) depending on bamboo species, bamboo types, plant parts and growing regions of a country. Bamboo shoots and leaves are very nutritious and have been used for human consumption and animal feed for many years. ere are a number of studies published on nutrient value of bamboo shoots [1,2], but very few on bamboo leaves [3]. Newly emerging bamboo shoots are rich in protein, amino acids, vitamins, minerals and other phytochemicals and are consumed as Research Article Exploring Bamboo Leaf Nutrient Value in the USNPGS Germplasm Collection Wang ML 1 *, Irish B 3 *, Tonnis BD 1 , Pinnow D 1 , Davis J 2 , Hotchkiss MW 4 and Harrison ML 1 1 United States Department of Agriculture, Agricultural Research Service, PGRCU, USA 2 Department of Experimental Statistics, University of Georgia, USA 3 United States Department of Agriculture, Agricultural Research Service, TARS, USA 4 United States Department of Agriculture, Agricultural Research Service, SFTNRL, USA *Corresponding author: Wang ML, United States Department of Agriculture, Agricultural Research Service, PGRCU, USA and Irish B, Department of Agriculture, Agriculture Research Service, TARS, USA Received: March 26, 2017; Accepted: April 12, 2017; Published: April 19, 2017
-
Upload
khangminh22 -
Category
Documents
-
view
3 -
download
0
Transcript of Exploring Bamboo Leaf Nutrient Value in the USNPGS ...

Citation: Wang ML, Irish B, Tonnis BD, Pinnow D, Davis J, Hotchkiss MW, et al. Exploring Bamboo Leaf Nutrient Value in the USNPGS Germplasm Collection. Austin Food Sci. 2017; 2(1): 1030.
Austin Food Sci - Volume 2 Issue 1 - 2017Submit your Manuscript | www.austinpublishinggroup.com Wang et al. © All rights are reserved
Austin Food SciencesOpen Access
Abstract
Bamboo shoots and leaves are nutritious, providing food for human and animal consumption. However their nutrient value depends on a number of factors including the bamboo species (e.g. taxon), harvesting season and growing location. Leaf crude protein content, amino acid composition and mineral element concentration were quantified from leaf samples collected from 222 accessions representing two bamboo types (temperate/tropical), two growing seasons (dry/wet) and three locations (PGRCU-Byron, GA; TARS-Mayaguez, PR; and Govardhan Gardens-Mayaguez, PR). Significant variability in leaf nutrient value was identified among accessions, types, growing locations and harvesting seasons. On average, bamboo leaf tissue contained 12.92% protein with relatively high percentages of leucine (Leu, 8.97%) and proline (Pro, 7.98%) and low percentages of tryptophan (Trp, 1.69%) and histidine (His, 2.01%). Bamboo leaves also contained relatively high concentrations of the macro-mineral elements potassium (K, 12.17mg/g) and calcium (Ca, 5.37mg/g), high concentrations of the micro-mineral elements manganese (Mn, 388.76 μg/g) and iron (Fe, 123.19 μg/g), and low concentrations of boron (B, 7.8 μg/g) and zinc (Zn, 28.56 μg/g). PI 647932 and TARS 182857 contained the highest and lowest protein content (21.69% and 5.78%), respectively. Temperate bamboos contained a significantly higher percentage of protein (13.02%) than tropical bamboos (12.71%). Leaf samples harvested from the dry season contained a significantly higher percentage of protein (13.12%) than leaf samples harvested from the wet season (12.70%). The leaf samples harvested from Govardhan Garden location contained a higher percentage of protein (13.40%) than from Byron (12.65%) and TARS (12.89%) locations. The leaf samples harvested from Govardhan Garden contained a significantly higher iron concentration (151.22 μg/g) than from the other two locations (118.19 μg/g, 111.52 μg/g), whereas the leaf samples collected from Byron contained a significantly higher zinc concentration (36.03 μg/g) than what was observed from the other two locations (27.83 μg/g, 22.11 μg/g). There was no significant difference in iron and zinc concentrations between leaf samples collected from dry or wet seasons. Tropical bamboo leaves contained a higher iron concentration (131.74 μg/g) than temperate bamboo leaves (118.95 μg/g), whereas temperate bamboo leaves contained a significantly higher zinc concentration (29.82 μg/g) than tropical bamboo leaves (26.01 μg/g). The information on the bamboo leaf nutrient value related to bamboo accessions, types, growing location and harvesting season will be very useful for bamboo growers, processors and consumers.
Keywords: Bamboo leaf nutrition; Amino acid; Microelement; Protein; Genetic resources
Popular vegetables, especially in Asian countries. Bamboo leaves, stems and shoots are a staple food for giant pandas. Research has shown that as shoots age, all nutrient values (except dietary fiber) decrease [4-6].
Bamboo leaves are used as a food source for goats, sheep, yaks and cattle. However, there is a lack of information available on the nutrient value of leaves harvested at different seasons and specific locations. The genetic diversity of the USDA-ARS National Plant Germplasm System’s (NPGS) bamboo germplasm accessions maintained in Byron, GA was previously characterized using SSR markers [7], but there was no nutritional information available for these accessions or for those maintained at the Tropical Agricultural Research Station.
IntroductionBamboos are fast-growing species in the grass family (Poaceae),
mainly growing in temperate and tropical regions of the world. Bamboos have multiple utilizations (including building materials, medicinal ingredients, nutritious vegetables and animal feed stocks) depending on bamboo species, bamboo types, plant parts and growing regions of a country. Bamboo shoots and leaves are very nutritious and have been used for human consumption and animal feed for many years. There are a number of studies published on nutrient value of bamboo shoots [1,2], but very few on bamboo leaves [3]. Newly emerging bamboo shoots are rich in protein, amino acids, vitamins, minerals and other phytochemicals and are consumed as
Research Article
Exploring Bamboo Leaf Nutrient Value in the USNPGS Germplasm CollectionWang ML1*, Irish B3*, Tonnis BD1, Pinnow D1, Davis J2, Hotchkiss MW4 and Harrison ML1
1United States Department of Agriculture, Agricultural Research Service, PGRCU, USA 2Department of Experimental Statistics, University of Georgia, USA 3United States Department of Agriculture, Agricultural Research Service, TARS, USA 4United States Department of Agriculture, Agricultural Research Service, SFTNRL, USA
*Corresponding author: Wang ML, United States Department of Agriculture, Agricultural Research Service, PGRCU, USA and Irish B, Department of Agriculture, Agriculture Research Service, TARS, USA
Received: March 26, 2017; Accepted: April 12, 2017; Published: April 19, 2017

Austin Food Sci 2(1): id1030 (2017) - Page - 02
Wang ML Austin Publishing Group
Submit your Manuscript | www.austinpublishinggroup.com
The lack of nutritional information on bamboo germplasm greatly hinders its utilization as a food or feed crop. To address this issue, leaf samples from more than 200 bamboo accessions collected from three locations and two harvesting seasons were used for chemical analysis (including leaf crude protein content, amino acid composition and mineral element concentrations). Therefore, the objectives of this study were to (i) determine the variability in crude protein content, amino acid composition and mineral element concentrations of bamboo leaves among accessions at different growing locations and harvesting seasons by chemical analysis; (ii) determine the correlation coefficients among investigated leaf nutritional traits; (iii) identify unique bamboo accessions with desirable nutritional traits including high protein content, balanced amino acid composition and high concentrations of essential mineral elements.
Materials and MethodsLeaf sample collection
Bamboo leaves were collected from the USDA-ARS bamboo germplasm collection plants in Byron, GA which are established on fine loamy sand, kaolintic, thermic, typic Kandiudult soil. In contrast, the leaves collected from bamboo plants at the USDA-ARS Tropical Agriculture Research Station (TARS) and from a private collection held at Govardhan Gardens in PR were grown on hydric consumo clay soils. Leaf samples were collected twice, six months apart from each other, corresponding to mid-winter and mid-summer in the northern hemisphere. Each time for each accession, three bags of leaves were collected from different culms as replicates. The collection times for Puerto Rico were January (as dry season) and July (as wet season). For Georgia, the collection times were November (dry season) and July (wet season). This sampling strategy allowed the comparison for many of the same accessions across the locations and for a direct comparison between accessions at two time intervals during the year. In total, leaf samples from 222 accessions were collected and detailed information can be obtained from the USDA-ARS website (http:// www/ars-grin.gov).
Leaf samples were collected in the same way for all three locations with approximately 50 g of fresh leaf tissue per bag from field-grown plants. Samples were placed into paper bags and their contents were weighed immediately following collection. Paper bags with leaf samples were then placed at 70°C in an air Lindberg/Blue M circulation oven (Thermo Scientific, Waltham, MA) to dry. Dry samples were ground in a MF-10 IKA grinding mill (IKA Works Inc., Wilmington, NC) using a 0.5 mm mesh at 3,500 rpm.
Protein contentProtein content was determined by the micro-Kjeldahl method
[8]. Total nitrogen was determined using a modification of the micro-Kjeldahl method. The procedure was carried out in three stages: digestion, distillation and titration. Prior to implementation, leaf samples were placed in a drying oven with air circulation for 24 hours to eliminate any moisture absorbed during storage. Protein percentage was determined by multiplying nitrogen percentage by the 6.25 conversion factor.
Amino acid compositionFor amino acid analysis, leaves were collected, dried and ground
to powder with liquid nitrogen. The powder was then dried slowly at
45°C under reduced pressure to remove any remaining moisture and then kept in a desiccators until processed. Amino acids were analyzed by two separate methods. The first method used was a protein acid hydrolysis technique which yielded 17 amino acids. Hydrolysis with acid destroys three amino acids (tryptophan, cysteine and methionine) and as a consequence these three amino acids could not be directly measured. In addition, asparagine and glutamine were completely hydrolyzed to aspartic acid and glutamic acid, respectively (i.e. amount of aspartic acid = aspartic acid + asparagine; amount of glutamic acid = glutamic acid + glutamine). The second method (base hydrolysis) yielded tryptophan which was measured separately. In total, 18 amino acids were quantified.
Acid hydrolysis: For each sample, 120-130 mg ground tissues were measured into a 5ml reaction vial and 4ml of 6N HCl were added to each along with 4μl of phenol (0.1% final concentration). Nitrogen was blown over the top and vials were immediately sealed with Teflon-lined caps. Vials were incubated in 110°C heating block for 20 hours. Samples were then cooled and a 1ml aliquot was neutralized and diluted to 25ml with 4.2N NaOH and water, respectively. Diluents were filtered and an aliquot derivatized using AccQ-FluorTM reagent (Waters Corp., Milford, MA) according to the directions in the manual (WAT052874, Rev. 1). Amino acids were separated and quantified using an 1100 HPLC System (Agilent Technologies) with a 1260 fluorescent detector. The column used was a Waters AccQ-Tag (C18, 4 μM, 3.9x150mm). The mobile phase consisted of pf Eluent A, a phosphate buffer solution purchased from Waters and diluted according to directions and Eluent B, acetonitrile mixed with water (60:40 v/v). The column temperature was 37°C and the flow rate was 1.0ml/min at the following gradient: 0% B to start, then increased to 2% at 0.5 min, to 7% at 15 min, to 10% at 19 min, to 33% at 32 min and held for 33 min. B was then increased to 100% at 34 min and held for 37 min after which B returned to 0% at 38 min. The column was equilibrated at 0% B for 10 min between injections. Sample injection volume was 5μl and derivatized amino acids were monitored by Fluorescence Detector with the excitation set to 250 nm and emission set to 395 nm. All samples were spiked with α-aminobutyric acid as an internal standard. A standard mix containing 100 pmol/μl each of 15 amino acids was diluted accordingly and derivatized to generate a 9-point calibration curve from 1.25 to 30 pmol/μl. Amino acid totals were converted to mg/g by multiplying the molecular mass of each and the dilution factor, then dividing by the sample mass: mg/g = (molar concentration x molecular mass x dilution factor) / sample mass. The results were expressed as percentage and all samples were prepared and measured twice.
Base hydrolysis: For tryptophan analysis, 150-170 mg ground tissues were measured into a 5ml reaction vial and 3ml of 4.2N NaOH were added to each. Nitrogen was blown over the top and vials were immediately sealed tightly with Teflon-lined caps. Vials were incubated in a 110°C heating block for 18 hours. Samples were then cooled, transferred to a 25ml volumetric flask, neutralized with 6N HCl, mixed with 5ml ethanol and then diluted to volume with 200 mM phosphate buffer. An aliquot was filtered for injection. Tryptophan was separated and quantified on an 1100 HPLC System (Agilent Technologies, Santa Clara, CA) with a diode-array detector (DAD) using an Eclipse-XDB, 3.0 x 250 mm, 5 μm, C18 column (Agilent Technologies). The mobile phase consisted of HPLC-grade

Austin Food Sci 2(1): id1030 (2017) - Page - 03
Wang ML Austin Publishing Group
Submit your Manuscript | www.austinpublishinggroup.com
acetonitrile (B) and 20mM phosphate buffer, pH 3.3 (A). The column temperature was 30°C and the flow rate was 0.5ml/min at the following gradient: 5% B to start, increased to 25% at 10 min, then increased to 75% at 11 min and held for 19 min after which B returned to 5% at 20 min. The column was equilibrated at 5% B for 13 min between injections. Sample injection volume was 5μl and tryptophan was monitored by UV absorption at 280 nm. A pure tryptophan standard (Sigma, Aldrich, St. Louis, MO) was diluted and used to generate a 7-point calibration curve from 1 to 50 μg/ml. The same formula as above was used to calculate the tryptophan percentage. All samples were prepared and measured twice.
Mineral element concentrationLeaf samples were analyzed for P, K, Ca, Mg, Fe, Mn, Zn, B, Al, Na,
S and Cu concentrations using recommended digestion procedures [9]. Prior to the elemental analysis, leaf samples were processed
using the same methodology for protein analysis. Leaf samples were heated at 70°C in an oven for 24 hours and placed in desiccators. Three replicates of 1g tissue from each sample were weighed in porcelain crucibles and incinerated at 500°C for 4 hours and allowed to cool overnight. The incinerated samples were digested with 20ml of 33% HCl until 10ml of solution remained in the crucible. After digestion, each sample was filtered through Whatman filter paper (No. 541) into a 100ml volumetric flask using hot distilled water. After cooling down, the sample was adjusted to 100ml by adding water and then employed for nutrient analysis using 7300 DV-OES Spectrometer (Perkin Elmer, Waltham, MA). The emission signal of samples was obtained by developing calibration curves. Standard reference material (peach leaves, Standard Reference Material 1547, National Institute of Standard and Technology, Gaithersburg, MD) with certified concentrations of elements indicated a recovery within the range of certified values. The results for triplicate samples were averaged and standard deviation for each element was calculated.
Statistical analysisSignificant correlations among different leaf chemical traits were
Figure 1: Mean value of amino acid composition, macro-mineral element concentration, and micro-mineral element concentration in bamboo leaves. 1a: mean value of amino acid in bamboo leaves. 1b: mean value of macro-mineral element in bamboo leaves. 1c: mean value of micro-mineral element in bamboo leaves.
Variable Mean Std Dev Minimum Maximum
Protein (%) 12.917 2.238 5.776 21.689
Asp (%) 11.666 2.405 5.321 20.292
Ser (%) 4.872 0.995 2.390 8.549
Glu (%) 11.338 2.582 5.464 21.445
Gly (%) 6.006 1.216 2.519 10.262
His (%) 2.012 0.490 0.590 3.633
Arg (%) 5.784 1.282 2.186 10.698
Thr (%) 4.926 1.006 2.221 8.559
Ala (%) 6.965 1.407 3.504 11.781
Pro (%) 7.979 1.730 0.850 13.278
Tyr (%) 3.382 0.864 1.075 5.683
Val (%) 6.167 1.308 2.865 11.208
Lys (%) 5.353 1.206 2.130 9.272
Ile (%) 4.513 0.988 1.836 7.739
Leu (%) 8.974 1.918 3.826 15.626
Phe (%) 5.854 1.326 2.240 9.784
Trp (%) 1.686 0.412 0.626 2.643
P (mg/g) 1.510 0.522 0 4.800
K (mg/g) 12.17 31.669 0.18 114.000
Ca (mg/g) 5.370 3.617 0.80 50.000
Mg (mg/g) 1.760 0.861 0.100 7.400
Fe (µg/g) 123.19 122.693 21.000 2182.000
Mn (µg/g) 388.76 406.022 3.000 3124.000
Zn (µg/g) 28.56 21.935 0.800 180.000
B (µg/g) 7.799 5.284 0.100 95.000
Al (µg/g) 91.214 137.601 13.000 2940.000
S (µg/g) 1497.000 612.585 13.400 6294.000
Na (µg/g) 113.383 69.879 0.120 891.000
Table 1: Variability of protein content, amino acid composition, and mineral concentration in bamboo leaves.

Austin Food Sci 2(1): id1030 (2017) - Page - 04
Wang ML Austin Publishing Group
Submit your Manuscript | www.austinpublishinggroup.com
determined using Pearson’s correlation coefficient. An analysis of variance was performed on the data and means were separated using Turkey’s multiple comparison procedure (SAS 2008, Online Doc 9.2; SAS Institute Inc., Cary, NC).
Results and DiscussionThe results from the investigated nutrition traits of bamboo
leaves are summarized in (Table 1) and shown in (Figure 1). On average, bamboo leaves contained 12.92% protein and had relatively high percentages of the amino acids leucine (Leu 8.97%) and proline (Pro, 7.98%) and low percentages of tryptophan (Trp, 1.69%) and histidine (His, 2.01%) (Figure 1a). The samples also had relatively high concentrations of the macro-mineral elements potassium (K, 12.17 mg/g) and calcium (Ca, 5.37 mg/g) (Figure 1b), as well as high concentrations of the micro-mineral elements manganese and iron (Mn, 388.76 μg/g and Fe, 123.19 μg/g) and low concentrations of boron and zinc (B, 7.8 μg/g and Zn, 28.56 μg/g) (Figure 1c). Although aspartate (Asp) and glutamate (Glu) have the highest values (Figure 1a), they were not the highest percentages of amino acids in bamboo leaves because Asp and Glu each represent total amounts of two amino acids (asparagine and aspartate; glutamine and glutamate), respectively. Eight out of nine essential amino acids (except methionine) were quantified in our study and six out of the eight amino acid values were near or exceeded 5% (except His and Trp). This indicates that bamboo protein contains a balanced amino acid composition. Bamboo leaves contain very high concentrations of potassium and calcium. Consuming vegetable products with high concentration of calcium can help to not only build strong bones but also prevent heart diseases and blood vessel blockage [10]. For two important micro-minerals (Fe and Zn), bamboo leaves are a good source of iron but not zinc (Figure 1c).
Nutritional differences (bamboo accessions)There was significant variability in bamboo leaf protein content,
amino acid composition and mineral element concentrations among the bamboo accessions tested. For example, leaves from PI 647932 (Bambusa multiplex) contained the highest protein content (21.67%), whereas leaves from TARS 18285 (Bambusa lako) contained the lowest protein content (5.78%). PI 647932 and other accessions may be good candidates for future research on the use of leaves as potential protein sources in animal nutrition. This could be either through research on direct consumption of leaves or possibly extracting protein from leaves and providing it as a supplement. For eight quantified essential amino acids (leucine, valine, phenylalanine, lysine, threonine, isoleucine, histidine and tryptophan), leaves from PI 38921 (Pleioblastus simoni) contained the highest percentages (Leu, 15.63%; Val, 11.21%; Phe, 9.78%; Lys, 9.27%; Thr, 8.56%; Ile, 7.74%; His, 3.63%; and Trp, 2.64%). This accession also contained 12.84% protein (similar to the overall bamboo average of 12.92%). In terms of essential amino acids, this accession may be a good source for improving leaf amino acid composition and for possible animal and/or for human consumption. In contrast, leaves from PI 49505 (Phyllostachys nigra) contained the lowest percentages of eight quantified essential amino acids (Leu, 3.83%; Val, 2.87%; Phe, 2.34%; Lys, 2.13%; Thr, 2.22%; Ile, 1.84%; His, 0.59%; and Trp, 0.82%). This accession also contained 11.09% protein, lower than the average (12.92%). Iron and zinc are two important minerals for
both animal health and human. Leaves from TrG53 (Dendrocalamus calostachyus, no accession number assigned) contained the highest iron concentration (2182.0 μg/g), whereas leaves from PI 76496 (Bambusa oldhamii) contained the lowest iron concentration (21.0 μg/g), 100 times lower than TrG 53. However, TrG 53 contained 8.11% protein, much lower than the average (12.92%). This material could be used for improvement of iron concentration but not protein content. Both TrG 53 and PI 76496 are tropical bamboos, but the former was collected from Govardhan Gardens, PR and the latter from TARS site, PR. The soil type, soil pH and agro-environmental conditions at these two collection sites may partially explain the variability in iron concentration between these two accessions. This is because plant mineral concentrations are highly dependent on minerals available in the soil [6]. Leaves from PI 116768 (Phyllostachys meyeri) contained the highest zinc concentration (180μg/g), whereas leaves from PI 67398 (Phyllostachys rubromarginata) contained the lowest
Trait Temperate Tropical MSD
Protein (%) 13.018 a 12.714 b 0.1759
Asp (%) 11.727 a 11.645 a 0.2556
Ser (%) 5.020 a 4.736 b 0.1172
Glu (%) 11.968 a 10.751 b 0.2642
Gly (%) 5.920 b 6.105 a 0.1338
His (%) 1.894 b 2.138 a 0.0471
Arg (%) 5.820 a 5.765 a 0.1398
Thr (%) 4.844 b 5.018 a 0.1051
Ala (%) 7.104 a 6.847 b 0.1666
Pro (%) 7.793 b 8.183 a 0.2284
Tyr (%) 3.143 b 3.632 a 0.0889
Val (%) 6.374 a 5.978 b 0.1408
Lys (%) 5.326 a 5.409 a 0.1152
Ile (%) 4.359 b 4.679 a 0.1048
Leu (%) 8.675 b 9.293 a 0.1946
Phe (%) 5.566 b 6.155 a 0.1400
Trp (%) 1.485 b 1.891 a 0.0345
P (mg/g) 1.610 a 1.302 b 0.038
K (mg/g) 11.384 a 11.182 a 0.580
Ca (mg/g) 5.915 a 4.271 b 0.330
Mg (mg/g) 1.691 a 1.891 b 0.067
Fe (µg/g) 118.946 b 131.743 a 6.519
Mn (µg/g) 435.080 a 295.286 b 27.811
Zn (µg/g) 29.823 a 26.005 b 2.1077
B (µg/g) 9.090 a 5.097 b 0.4163
Al (µg/g) 74.865 b 124.210 a 3.6176
S (µg/g) 1493.88 a 1502.84 a 48.642
Na (µg/g) 102.152 b 136.047 a 5.1363
Cu (µg/g) 14.045 a 4.609 b 0.8329
Table 2: Comparison of protein content, amino acid composition, and mineral concentration in bamboo leaves between climate zones.
Means with different letters across the column are significantly different at alpha = 0.05. MSD: Minimum Significant Difference.
Austin Food Sci 2(1): id1030 (2017) - Page - 05
Wang ML Austin Publishing Group
Submit your Manuscript | www.austinpublishinggroup.com
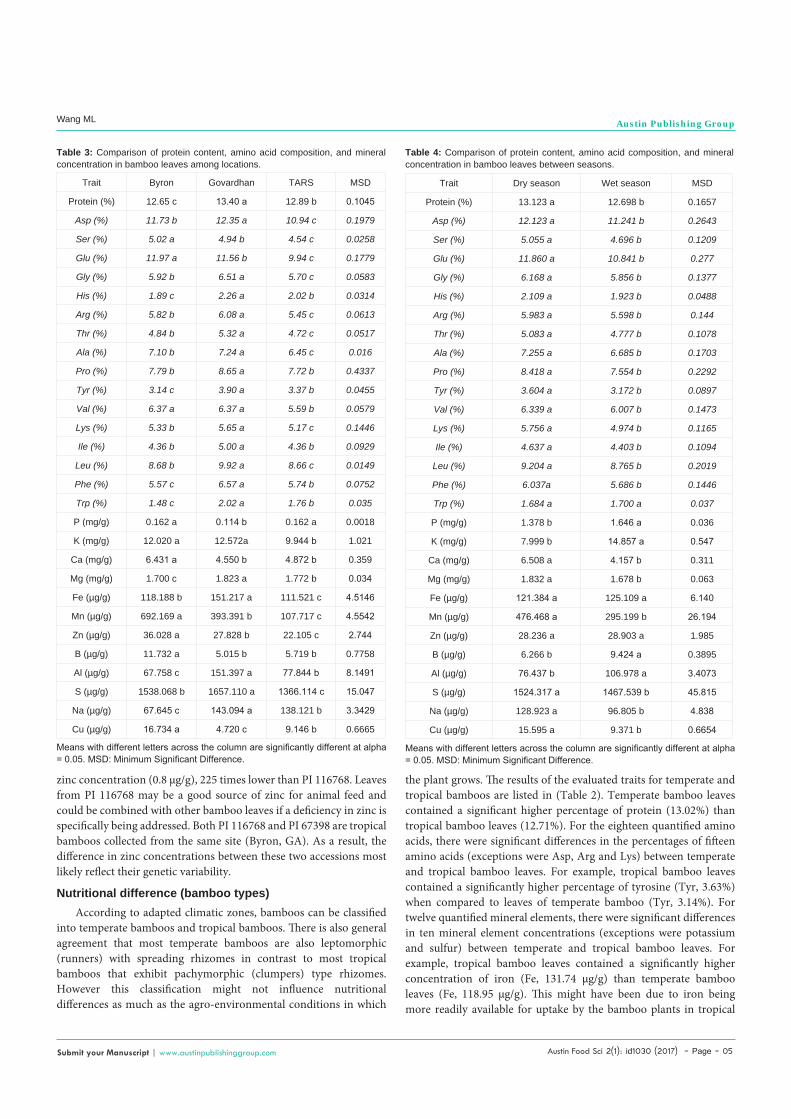
zinc concentration (0.8 μg/g), 225 times lower than PI 116768. Leaves from PI 116768 may be a good source of zinc for animal feed and could be combined with other bamboo leaves if a deficiency in zinc is specifically being addressed. Both PI 116768 and PI 67398 are tropical bamboos collected from the same site (Byron, GA). As a result, the difference in zinc concentrations between these two accessions most likely reflect their genetic variability.
Nutritional difference (bamboo types)According to adapted climatic zones, bamboos can be classified
into temperate bamboos and tropical bamboos. There is also general agreement that most temperate bamboos are also leptomorphic (runners) with spreading rhizomes in contrast to most tropical bamboos that exhibit pachymorphic (clumpers) type rhizomes. However this classification might not influence nutritional differences as much as the agro-environmental conditions in which
the plant grows. The results of the evaluated traits for temperate and tropical bamboos are listed in (Table 2). Temperate bamboo leaves contained a significant higher percentage of protein (13.02%) than tropical bamboo leaves (12.71%). For the eighteen quantified amino acids, there were significant differences in the percentages of fifteen amino acids (exceptions were Asp, Arg and Lys) between temperate and tropical bamboo leaves. For example, tropical bamboo leaves contained a significantly higher percentage of tyrosine (Tyr, 3.63%) when compared to leaves of temperate bamboo (Tyr, 3.14%). For twelve quantified mineral elements, there were significant differences in ten mineral element concentrations (exceptions were potassium and sulfur) between temperate and tropical bamboo leaves. For example, tropical bamboo leaves contained a significantly higher concentration of iron (Fe, 131.74 μg/g) than temperate bamboo leaves (Fe, 118.95 μg/g). This might have been due to iron being more readily available for uptake by the bamboo plants in tropical
Trait Byron Govardhan TARS MSD
Protein (%) 12.65 c 13.40 a 12.89 b 0.1045
Asp (%) 11.73 b 12.35 a 10.94 c 0.1979
Ser (%) 5.02 a 4.94 b 4.54 c 0.0258
Glu (%) 11.97 a 11.56 b 9.94 c 0.1779
Gly (%) 5.92 b 6.51 a 5.70 c 0.0583
His (%) 1.89 c 2.26 a 2.02 b 0.0314
Arg (%) 5.82 b 6.08 a 5.45 c 0.0613
Thr (%) 4.84 b 5.32 a 4.72 c 0.0517
Ala (%) 7.10 b 7.24 a 6.45 c 0.016
Pro (%) 7.79 b 8.65 a 7.72 b 0.4337
Tyr (%) 3.14 c 3.90 a 3.37 b 0.0455
Val (%) 6.37 a 6.37 a 5.59 b 0.0579
Lys (%) 5.33 b 5.65 a 5.17 c 0.1446
Ile (%) 4.36 b 5.00 a 4.36 b 0.0929
Leu (%) 8.68 b 9.92 a 8.66 c 0.0149
Phe (%) 5.57 c 6.57 a 5.74 b 0.0752
Trp (%) 1.48 c 2.02 a 1.76 b 0.035
P (mg/g) 0.162 a 0.114 b 0.162 a 0.0018
K (mg/g) 12.020 a 12.572a 9.944 b 1.021
Ca (mg/g) 6.431 a 4.550 b 4.872 b 0.359
Mg (mg/g) 1.700 c 1.823 a 1.772 b 0.034
Fe (µg/g) 118.188 b 151.217 a 111.521 c 4.5146
Mn (µg/g) 692.169 a 393.391 b 107.717 c 4.5542
Zn (µg/g) 36.028 a 27.828 b 22.105 c 2.744
B (µg/g) 11.732 a 5.015 b 5.719 b 0.7758
Al (µg/g) 67.758 c 151.397 a 77.844 b 8.1491
S (µg/g) 1538.068 b 1657.110 a 1366.114 c 15.047
Na (µg/g) 67.645 c 143.094 a 138.121 b 3.3429
Cu (µg/g) 16.734 a 4.720 c 9.146 b 0.6665
Table 3: Comparison of protein content, amino acid composition, and mineral concentration in bamboo leaves among locations.
Means with different letters across the column are significantly different at alpha = 0.05. MSD: Minimum Significant Difference.
Trait Dry season Wet season MSD
Protein (%) 13.123 a 12.698 b 0.1657
Asp (%) 12.123 a 11.241 b 0.2643
Ser (%) 5.055 a 4.696 b 0.1209
Glu (%) 11.860 a 10.841 b 0.277
Gly (%) 6.168 a 5.856 b 0.1377
His (%) 2.109 a 1.923 b 0.0488
Arg (%) 5.983 a 5.598 b 0.144
Thr (%) 5.083 a 4.777 b 0.1078
Ala (%) 7.255 a 6.685 b 0.1703
Pro (%) 8.418 a 7.554 b 0.2292
Tyr (%) 3.604 a 3.172 b 0.0897
Val (%) 6.339 a 6.007 b 0.1473
Lys (%) 5.756 a 4.974 b 0.1165
Ile (%) 4.637 a 4.403 b 0.1094
Leu (%) 9.204 a 8.765 b 0.2019
Phe (%) 6.037a 5.686 b 0.1446
Trp (%) 1.684 a 1.700 a 0.037
P (mg/g) 1.378 b 1.646 a 0.036
K (mg/g) 7.999 b 14.857 a 0.547
Ca (mg/g) 6.508 a 4.157 b 0.311
Mg (mg/g) 1.832 a 1.678 b 0.063
Fe (µg/g) 121.384 a 125.109 a 6.140
Mn (µg/g) 476.468 a 295.199 b 26.194
Zn (µg/g) 28.236 a 28.903 a 1.985
B (µg/g) 6.266 b 9.424 a 0.3895
Al (µg/g) 76.437 b 106.978 a 3.4073
S (µg/g) 1524.317 a 1467.539 b 45.815
Na (µg/g) 128.923 a 96.805 b 4.838
Cu (µg/g) 15.595 a 9.371 b 0.6654
Table 4: Comparison of protein content, amino acid composition, and mineral concentration in bamboo leaves between seasons.
Means with different letters across the column are significantly different at alpha = 0.05. MSD: Minimum Significant Difference.

Austin Food Sci 2(1): id1030 (2017) - Page - 06
Wang ML Austin Publishing Group
Submit your Manuscript | www.austinpublishinggroup.com
soils which are generally highly weathered with lower pH values. In contrast, the temperate bamboo leaves contained significantly higher concentrations of zinc and manganese (Zn, 29.82 μg/g; Mn, 435.08 μg/g) than tropical bamboo leaves (Zn, 26.01 μg/g; Mn, 295.29 μg/g), respectively.
Nutritional differences (growing locations)The results of the evaluated nutrition traits from leaf samples
collected at the three locations (Byron, GA; Mayaguez, PR [Govardhan]; and Mayaguez, PR [TARS]) are listed in (Table 3). Bamboo leaves collected from Govardhan contained a significantly higher percentage of protein (13.40%) than from the other two locations (12.65% and 12.89%). For eighteen quantified amino acids, the percentages of sixteen amino acids (exceptions were serine and glutamate) from leaves collected at Govardhan were significantly higher than those found in the leaves collected from the other two locations. For example, the percentage of phenylalanine from leaves collected at Govardhan (6.57%) was higher than at Byron and TARS (5.57% and 5.74%), respectively. There were significant differences in the concentrations of all twelve quantified mineral elements for bamboo leaves collected among three locations. For example, the bamboo leaves collected at Govardhan contained a significantly higher concentration of iron (Fe, 151.22 μg/g) than leaves collected from the other two locations (111.52 μg/ and 118.19 μg/g). This is in contrast to leaves collected from Byron which contained significantly higher concentrations of manganese, zinc and boron (Mn, 692.17 μg/g; Zn, 36.03 μg/g; B, 11.73 μg/g) when compared to leaves collected at the other two locations (Mn, 393.39 μg/g and 107.72 μg/g; Zn, 27.83 μg/g and 22.11 μg/g; B, 5.02 μg/g and 5.72 μg/g). The significant differences in mineral concentrations across three locations most likely have a lot to do with the soil types, soil pH and agro-environmental conditions at the specific location in addition to any underlying genetic components.
Nutritional differences (harvesting seasons)Table 4 presents data results for nutrient traits from two different
harvesting seasons (dry/winter and wet/summer). The protein percentage was significantly higher from the leaves harvested in the
K Ca Mg Fe Mn Zn B Al S Na Cu
P 0.0135 0.6226
0.0497 0.0699
0.1291 <.0001
0.0675 0.0138
0.0349 0.2029
0.2465 <.0001
0.2990 <.0001
-0.0521 0.0576
0.1287 <.0001
-0.1700 <.0001
0.0944 0.0025
K -0.0642 0.0191
-0.0318 0.2472
0.0085 0.7571
-0.0308 0.2618
0.0042 0.8775
0.0361 0.1910
0.0323 0.2392
-0.0012 0.9656
0.0090 0.7424
0.0255 0.4164
Ca 0.2927 <.0001
0.2940 <.0001
0.5366 <.0001
0.3196 <.0001
0.2877 <.0001
0.0010 0.9707
0.3032 <.0001
0.0275 0.3170
0.2344 <.0001
Mg 0.0305 0.2671
0.1173 <.0001
0.1827 <.0001
0.1345 <.0001
-0.0680 0.0132
0.2323 <.0001
0.2248 <.0001
0.0887 0.0046
Fe 0.1818 <.0001
0.1553 <.0001
0.2449 <.0001
0.8668 <.0001
0.1416 <.0001
0.0019 0.9436
0.0366 0.2433
Mn 0.3966 <.0001
0.3688 <.0001
-0.0230 0.4024
0.2203 <.0001
-0.3153 <.0001
0.2976 <.0001
Zn 0.3244 <.0001
-0.0458 0.0950
0.2232 <.0001
-0.1427 <.0001
0.1804 <.0001
B -0.0190 0.4912
0.1529 <.0001
-0.2772 <.0001
0.2366 <.0001
Al -0.0239 0.3840
-0.0737 0.0072
-0.0788 0.0118
S 0.0241 0.3788
0.1520 <.0001
Na -0.0968 0.0020
Table 5: Pearson correlation coefficients and probability values for minerals in bamboo accessions.
dry season (13.12%) than in the wet season (12.7%). For investigated amino acid traits, 17 out of 18 amino acids (exception was tryptophan) had significantly higher percentages from leaves harvested during the dry season than those collected during the wet season. For example, the leucine percentage was significantly higher from leaves harvested in the dry season (9.20%) when compared to leaves harvested in the wet season (8.77%). There were significant differences in ten out of twelve mineral element (exceptions were Fe and Zn) concentrations between leaves harvested in the dry and wet seasons. The copper concentration from leaves harvested in dry season (15.6 μg/g) was significantly higher than leaves harvested in the wet season (9.37 μg/g), whereas the boron concentration from leaves harvested in wet season (9.42 μg/g) was significantly higher than the leaves harvested in dry season (6.27 μg/g). There was no significant difference in the concentrations of Fe (121.38 μg/g and 125.11 μg/g) and Zn (28.24 μg/g and 28.90 μg/g) between the leaves harvested at dry and wet seasons, respectively. Generally, most of the protein, amino acid and elemental nutrient concentration were higher during the dry season. This would make sense as water uptake by the plant during the rainy or wet season, when moisture in the soil is readily available, would dilute nutrient concentrations in the leaves during that time period.
Nutrition trait correlationsCorrelation coefficients and probability values for mineral
concentrations among bamboo accessions are listed in (Table 5). Calcium had highly significant correlations with manganese, zinc and sulfur (r = 0.54, p< 0.0001; r = 0.32, p< 0.0001; and r = 0.30, p< 0.0001), respectively. Iron had a highly significant correlation with aluminum (r= 0.87, p< 0.0001). Manganese had highly significant correlations with zinc and boron (r = 0.40, p< 0.0001 and r = 0.37, p< 0.0001), respectively. Zinc had a highly significant correlation with boron (r = 0.32, p< 0.0001). Manganese, zinc and boron have a very interrelated relationship at the soil pH value range of 5.0-7.0 (http://www.roughbros.com/blog/ph-nutrient-availability). This relationship may partially explain their significant correlations.
Correlation coefficients and probability values for protein content and their amino acids with mineral element concentrations among

Austin Food Sci 2(1): id1030 (2017) - Page - 07
Wang ML Austin Publishing Group
Submit your Manuscript | www.austinpublishinggroup.com
bamboo accessions are listed in table 6. Potassium had a highly significant positive correlation with tyrosine (r = 0.33, p< 0.0001), but a highly significant negative correlation with lysine (r = -0.39, p< 0.0001). Manganese had a highly significant positive correlation with glutamate (r = 0.36, p< 0.0001). Boron had highly significant negative correlations with histidine, tyrosine and tryptophan (r = -0.36, p< 0.0001; r = -0.39, p< 0.0001; r = -0.36, p< 0.0001), respectively.
ConclusionSignificant variability in leaf protein content, amino acid
composition and mineral element concentration (all dietary nutritional components) was observed in our study. Our results indicate that the bamboo leaf nutrition values were directly affected by three main independent factors including the bamboo genotypes (taxa, accessions and types), growing locations (Byron, TARS and Govardhan) and harvesting seasons (dry and wet). The manner in which these three factors interacted with each other and the growing environment would also have played a significant role in our observations. Highly significant correlations among different traits were observed. The information presented here would be valuable for farmers to determine the harvesting and grazing time for animal feeding. Humans also consume bamboo shoots as vegetables. If associations between bamboo leaf and shoot nutrition values can be established (not determined in the current study), specific taxa and growing conditions can be targeted and optimized for edible bamboo shoots to maximize their values for human consumption. Bamboo leaves also contain sugars, dietary fibers, tannins and other antioxidant compounds which can contribute to human health. For future research, these useful compounds in bamboo leaves should be
P K Ca Mg Fe Mn Zn B Al S Na Cu
Prot 0.0775 0.0047
0.0061 0.8245
-0.0149 0.5870
0.2070 <.0001
-0.1273 <.0001
-0.0286 0.2968
0.0040 0.8829
-0.0590 0.0327
-0.1738 <.0001
0.1499 <.0001
0.0114 0.6785
0.1142 0.0003
Asp -0.2094 0.0009
-0.2856 <.0001
0.1182 0.0630
-0.0099 0.8769
0.0465 0.4704
0.2450 <.0001
-0.0702 0.2717
-0.1671 0.0089
-0.0438 0.4926
0.1337 0.0353
-0.1620 0.0106
0.0668 0.3675
Ser -0.1847 0.0035
-0.2450 <.0001
0.1578 0.0128
-0.0133 0.8355
0.0185 0.7725
0.2903 <.0001
-0.0159 0.8036
-0.0636 0.3223
-0.0955 0.1337
0.1367 0.0314
-0.2314 0.0002
0.1214 0.1008
Glu -0.1577 0.0129
-0.2256 0.0003
0.1739 0.0060
-0.0485 0.4469
0.0232 0.7160
0.3568 <.0001
-0.0198 0.7568
-0.0326 0.6120
0.0964 0.1301
0.1772 0.0051
-0.2940 <.0001
0.1454 0.0489
Gly -0.2098 0.0009
-0.2242 0.0004
0.0849 0.1827
0.0260 0.6833
0.0564 0.3762
0.1618 0.0107
-0.0832 0.1926
-0.1833 0.0041
-0.0041 0.9486
0.1016 0.1106
-0.0863 0.1757
0.0468 0.5284
His -0.2197 0.0005
-0.3113 <.0001
0.0483 0.4486
0.0531 0.4054
0.0608 0.3405
0.0757 0.2351
-0.1000 0.1169
-0.3573 <.0001
0.0040 0.9496
0.1121 0.0782
0.0020 0.9756
-0.0657 0.3753
Arg -0.1984 0.0017
-0.2508 <.0001
0.1197 0.0597
-0.0003 0.9963
0.0304 0.6341
0.1966 0.0019
-0.0737 0.2486
-0.1497 0.0193
-0.0506 0.4272
0.0941 0.1394
-0.1684 0.0079
0.0679 0.3601
Thr -0.2065 0.0011
-0.2361 0.0002
-0.0851 0.1823
-0.0009 0.9886
0.0383 0.5491
0.1611 0.0112
-0.0881 0.1682
-0.2180 0.0006
-0.0265 0.6789
0.1191 0.0616
-0.0908 0.1547
0.0467 0.5303
Ala -0.2054 0.0012
-0.2508 <.0001
0.1541 0.0153
-0.0392 0.5399
0.0576 0.3673
0.2736 <.0001
-0.0656 0.3052
-0.1115 0.0827
-0.0509 0.4259
0.1116 0.0801
-0.2100 0.0009
0.1029 0.1658
Pro -0.2152 0.0006
-0.2914 <.0001
0.0991 0.1195
0.0048 0.9403
0.0644 0.3127
0.1160 0.0088
-0.0556 0.3840
-0.2326 0.0002
-0.0439 0.4914
0.1078 0.0903
-0.0687 0.2809
0.0157 0.8328
Tyr -0.2506 <.0001
0.3317 <.0001
0.0525 0.4105
0.0488 0.4445
0.0487 0.4454
0.0939 0.1443
-0.1141 0.0735
-0.3907 <.0001
0.0054 0.9321
0.1210 0.0570
0.0309 0.6288
-0.0603 0.4165
Val -0.1695 0.0075
-0.2000 0.0016
0.1632 0.0100
-0.0193 0.7621
0.0536 0.4010
0.2895 <.0001
-0.0579 0.3650
-0.0357 0.5793
-0.0259 0.4068
0.1140 0.0731
-0.2405 0.0001
0.1122 0.1293
Lys -0.2109 0.0008
-0.3887 <.0001
0.1619 0.0107
-0.0020 0.9745
0.0104 0.8708
0.2304 0.0003
-0.0582 0.3626
-0.2925 <.0001
-0.0945 0.1378
0.1238 0.0515
-0.1413 0.0261
0.0095 0.8983
Ile -0.2241 0.0004
-0.2343 0.0002
-0.0652 0.3066
0.0287 0.6532
0.0760 0.2329
-0.1081 0.0893
-0.1142 0.0731
-0.2328 0.0002
0.0257 0.6868
0.0854 0.1800
-0.0355 0.5778
-0.0340 0.6466
Leu -0.2190 0.0005
-0.2267 0.0003
0.0607 0.3414
0.0314 0.6232
0.0591 0.3539
0.1111 0.0809
-0.0963 0.1313
-0.2353 0.0002
0.0122 0.8485
0.0987 0.1209
-0.0379 0.5524
0.0001 0.9987
Phe -0.2271 0.0003
-0.2536 <.0001
0.0503 0.4307
0.0449 0.4814
0.0763 0.2312
0.0872 0.1708
-0.1109 0.0818
-0.2764 <.0001
0.0343 0.5906
0.0776 0.2233
0.0048 0.9403
-0.0250 0.7359
Trp -0.2211 0.0005
-0.1447 0.0226
-0.0781 0.2205
0.0981 0.1234
0.0745 0.2427
-0.1160 0.0682
-0.1202 0.0592
-0.3622 <.0001
0.0953 0.1345
0.0740 0.2457
0.1891 0.0028
-0.1981 0.0070
Table 6: Pearson correlation coefficients and probability values for protein content and their amino acid composition with mineral elements among bamboo accessions.
quantified and evaluated. Furthermore, the purpose of this study was focused on leaf nutrient value. Some of the bamboos with low leaf nutrient values may not be suitable for vegetable or animal feeding use, but may be useful for timber and/or building materials. Data collected for bamboo germplasm accessions for the USDA-ARS sites (i.e. PGRCU and TARS) sampled during these evaluations can be accessed and downloaded through the NPGS GRIN-Global database.
AcknowledgmentThe authors would like to thank MARS, Inc. for its partial financial
support of this project, Ms. Zilma Poueymirou and Mr. Delvis Perez for their assistance on crude protein and mineral element analysis and Mr. Sadhu Govardhan for providing access to bamboo leaf samples from his collection.
References1. Choudhury D, Sahu JK, Sharma GD. Value addition to bamboo shoots: a
review. J Food Sci Technol. 2012; 49: 407-414.
2. Singhal P, Bal LM, Satya S, Sudhakar P, Naik SN. Bamboo shoots: a novel source of nutrition and medicine. Crit Rev Food Sci Nutr. 2013; 53: 517-534.
3. Halvorson JJ, Cassida KA, Turner KE, Belesky DP. Nutritive value of bamboo as browse for livestock. Renewable Agric Food Systems. 2010; 26: 161-170.
4. Nirmala C, David E, Sharma ML. Changes in nutrient components during aging of emerging juvenile bamboo shoots. Int J Food Sci Nutr. 2007; 58: 612-618.
5. Wang S, Pu X, Ding Y, Wang X. Aboveground biomass and bamboo shoot nutrients of high altitude bamboos (Fargesia yunnanensis Hsueh et Yi) from different sites in Yunnan province, China. J Tropical Agri. 2009; 47: 48-53.
6. Christian AL, Knott KK, Vance CK, Falcone JF, Bauer LL, Fahey Jr GA, et al. Nutrient and mineral composition during shoot growth in seven species of

Austin Food Sci 2(1): id1030 (2017) - Page - 08
Wang ML Austin Publishing Group
Submit your Manuscript | www.austinpublishinggroup.com
Phyllostachys and Pseudosasa bamboo consumed by giant panda. Animal Physiol Animal Nutr. 2015; 99: 1172-1183.
7. Barkley NA, Newman ML, Wang ML, Hotchkiss MW, Pederson GA. Assessment of the genetic diversity and phylogenetic relationships of a temperate bamboo collection by using transferred EST-SSR markers. Genome. 2005; 48: 731-737.
8. Persson JA, Wennerholm M. Handbook for Kjeldahl digestion: a recent review of the classical method with improvements developed by FOSS. DK-3400 Hilleroed. Denmark. 2008.
9. Perkin-Elmer. Analytical methods for atomic absorption spectroscopy. The Perkin-Elmer Corporation, Norwalk. Connecticut. 1994.
10. Tsaltas TT. Dietetic management of uremic patients I. Extraction of potassium from foods for uremic patients. Am J Clin Nutr T. 1969; 22: 490-493.
Citation: Wang ML, Irish B, Tonnis BD, Pinnow D, Davis J, Hotchkiss MW, et al. Exploring Bamboo Leaf Nutrient Value in the USNPGS Germplasm Collection. Austin Food Sci. 2017; 2(1): 1030.
Austin Food Sci - Volume 2 Issue 1 - 2017Submit your Manuscript | www.austinpublishinggroup.com Wang et al. © All rights are reserved