Red Panda Field Survey and Protocol for Community Based ...
40
-
Upload
khangminh22 -
Category
Documents
-
view
1 -
download
0
Transcript of Red Panda Field Survey and Protocol for Community Based ...

Red Panda Field Surveyand Protocol for Community Based Monitoring
Government of NepalMinistry of Forests and Soil Conservation
Singha Durbar, Kathmandu, 2016


3
Red Panda Field Survey and Protocol for Community Based Monitoring
Government of NepalMinistry of Forests and Soil Conservation
Singha Durbar, Kathmandu, 2016
Publisher:
Ministry of Forests and Soil Conservation, Singha Durbar, Kathmandu, Nepal
Citation:
Ministry of Forests and Soil Conservation 2015.Red Panda Field Survey and Protocol for Community Based MonitoringMinistry of Forests and Soil Conservation, Singha Durbar, Kathmandu, Nepal
Cover photo credits:
A Red Panda feeding on bamboo in the wild © Axel Gebauer
© Ministry of Forests and Soil Conservation

5III

6

V
List of Acronyms and Abbreviations
A Area
ASi Availability of Signs
ASh Availability of Shelter
BZCFUGs Buffer Zone Community Forest User Groups
CF Community Forest
CFUGs Community Forest User Groups
CITES Convention on International Trade in Endangered Species of Flora and Fauna
DNPWC Department of National Parks and Wildlife Conservation
dbh Diameter at Breast Height
GPS Global Positioning System
ha Hectare
IUCN International Union for Conservation of Nature
IVI Importance Value Index
NRs Nepali Rupees
TA Travel and Accessibility
V Visibility
VDC Village Development Committee
W Weather
WGS World Geodetic System

2
VII
Table of ContentsAcknowledgement .............................................................................................................................................. III
List of Acronyms and Abbreviations ....................................................................................................................v
Section I: General Information on Red Panda ....................................................................................................1
1. Introduction to the Species ............................................................................................................................................................. 1
2. Physical Characteristics ................................................................................................................................................................... 1
3. Habitat, Ecology, and Behavior ...................................................................................................................................................... 1
4. Distribution and Population Status ................................................................................................................................................. 2
5. Conservation Challenges and Threats ............................................................................................................................................ 4
6. Conservation Policy ......................................................................................................................................................................... 4
Section II: Field Survey Techniques and Community-Based Monitoring Protocol ............................................5
1. Rationale of Protocol .................................................................................................................................................................... 5
Part 1: Field Techniques for .......................................................................................................................................................... 5
Presence or Absence Surveys and Abundance Estimation ............................................................................................... 5
Presence or Absence Survey Techniques ........................................................................................................................... 5
Collect and Compile the Data ............................................................................................................................................10
Data Management and Analysis .......................................................................................................................................11
Estimating Red Panda Populations ....................................................................................................................................12
Part 2: Community-Based Red Panda Monitoring (Citizen Science) .........................................................................................13
Monitoring Objective ..........................................................................................................................................................13
Monitoring site selection and transect establishment .....................................................................................................13
Monitoring Season and Frequency ....................................................................................................................................13
What to Monitor? ................................................................................................................................................................14
Selection of Forest Guardians ............................................................................................................................................15
Training for Forest Guardians .............................................................................................................................................15
Permission from Government ...........................................................................................................................................15
Equipment ...........................................................................................................................................................................15
Monitoring Techniques .......................................................................................................................................................15
Data Management and Analysis .......................................................................................................................................15
References ..........................................................................................................................................................17

List of Figures
Figure 1: Potential red panda range area with the easternmost and westernmost confirmed locations ............................................. 2
Figure 2: Red Panda presence confirmed districts of Nepal ..................................................................................................................... 3
Figure 3: Schematic diagram of transect walk .......................................................................................................................................... 6
Figure 4: Circular plot sampling design ...................................................................................................................................................... 6
List of Tables
Table 1: Potential habitat and population estimation of red panda in Nepal ......................................................................................... 3
Table 2: List of equipment and gear .......................................................................................................................................................... 8
Table 3: Factors to consider when selecting the time for the survey ...................................................................................................... 9
Table 4: Schedule recommended for monitoring .....................................................................................................................................14
List of Annexes
Annex 1: Data sheets .................................................................................................................................................................................19
Annex 2: Individual identification through photographs .........................................................................................................................26
VIII

1
1. Introduction to the Species
The scientific classification of red panda is:
Kingdom: Animalia
Phylum: Chordata
Class: Mammalia
Order: Carnivora
Family: Ailuridae
Scientific Name: Ailurus fulgens (F.G. Cuvier, 1825)
Sub-species: A. f. fulgens & A. f. styani
Groves (2011) recommended that these two sub-species should
be considered two separate species.
The animal’s common names in English are red panda, lesser
panda, shinning cat, firefox, and fox bear. The name panda is
derived from the Nepali word nigalya ponya: nigalya is thought
to come from nigalo meaning bamboo, but the source of ponya is
less certain, although it may come from ponja meaning the ball
of the foot or claws - making the complete meaning ‘bamboo
foot’ (Glatston, 2012). Different common names used in different
places include:
Burma: Kyaung-wun
Sikkim: Workar
Bhutan: AchhuDongkar (Dzongkha
China: Chu-chieh-liang, Xia xongmao
Nepal: Habrey (Nepali); Punde Kundo (Eastern
Nepal); Hoptanga (Bhutia dialect); Sankam
(Lepcha dialect); Waa (Gurung dialect in
Manang); Nyakarau in Kaski; Pamsayang
in Gorkha; Lita Shayal, Meta Shyal, and
Charrah in Lamjung; Sagaicha in Kham
Magar dialect; Nautoto in Karnali region;
Thanwor in Chantyal dialect; and Wa´h in
Limbu (Wikipedia, 2016 & HCF, 2016)
2. Physical Characteristics
Body length: 50 to 64 cm
Tail length: 28 to 59 cm
Weight: Male- 3.7 to 6.2 kg and Female - 4.2 to
6 kg
Color: Reddish-brown fur on the upper parts and
blackish on the lower part looks exactly
the same color as of moss and lichen
found on the trees where they live. This
camouflages them from predators.
Long bushy tail helps red pandas to balance while climbing
down the trees. The tail’s 12 to 18 alternating rings also provide
excellent camouflage. Individual red panda can be identified
by their tail rings and facial markings (Shrestha et al., 2015).
However, red panda has no sexual dimorphism in color or size
(Roberts & Gittleman, 1984).
3. Habitat, Ecology, and Behavior
Individual red pandas spend most of their time alone, except
during the mating season and when the mother is with her cubs.
Red panda spends most of their time for aging, and sleeping on
tree branches or in tree hollows during the day. Their activity
increases in the late afternoon and early evening hours (Yonzon
and Hunter, 1991).
Forest habitat: Red panda is a small crepuscular, arboreal
mammal living in temperate forests with abundant bamboo in
the under-storey. Red panda prefers to live in forests close to
water sources (within 100-200m) and with moderate tree canopy
(>30%) and bamboo cover (>37%) where an average bamboo
height should be more than 2.9m (Yonzon et al., 1991; Pradhan
et al., 2001; Williams 2006; Dorji et al., 2012). They also prefer
gentle to steep slopes with fallen logs, tree stumps, and snags
(Zhang et al., 2008; Dorji et al., 2012).
Red panda also shows a preference for north, north-west and
south-west aspect slopes (Yonzon and Hunter 1991, Pradhan et
al. 2001, Dorjiet al. 2012). However, in eastern Nepal, they show
a preference for south, southeast, and west slopes (Bista et al.,
in prep). Their elevational distribution ranges from 2200-4800m
(Roberts & Gittleman, 1984).
Food sources and droppings: The diet of red panda consists
primarily of bamboo leaves and shoots, which are more than 83%
of its total food types. Since bamboo is very low in calories, red
pandas spend 56% of their overall time budget eating (Yonzon
& Hunter, 1991). As a bamboo eater, the red panda has a very
low metabolic rate (Wei et al., 2000), which reduces its energy
requirements (McNab, 1988). Red pandas use elevated objects,
such as shrub branches, fallen logs, or tree stumps to reach
bamboo leaves (Wei et al., 2000).
Other food includes the leaves and berries of plants such as
Sorbus spp., Acer spp., Quercus semicarpifolia, Berberis spp.,
Actinidiastrigosa, Rhododendron campanulata, Rosa sericera,
Abies spectabilis, Juniperus spp., Rubus spp, Schlleriflora spp.
etc (Yonzon & Hunter, 1991, Pradhan et al., 2001; Sharma, 2008;
Panthiet al., 2012; Thapa & Basnet, 2015, Panthi et al.2015). Red
pandas also feed on birds, eggs, and insects. On occasion, zoos
feed chicken to red pandas to supplement their diet (pers. Comm.
Sarah Jones, 2015).
Section I: General Information on Red Panda

2
The droppings of red panda are spindle-shaped, soft, moist and
light green. The color depends on their diet. Red panda usually
leaves a cluster of 1-15 pellets at a feeding site in a single
defecation (pers. Observation, D. Bista, 2012), and will use the
same site for defecation — latrine sites — where more than 100
pellets can accumulate (Yonzon, 1989).
Reproduction and rearing young: Red panda breed in the
late winter months, from January to March, so the cubs are born
during the monsoon, from June to August (Northrop & Czekala,
2011). Red panda normally locate their nests in a hollow tree or
a rock crevice. A female gives birth to one to four blind and deaf
cubs each weighing 110 to 130 gm. Cubs begin to open their
eyes at 18 days. They achieve full adult fur coloring and start to
venture out of the nest when they are 3 months old (Robert &
Gittleman, 1984). Red panda young leave their mother to become
independent at about 8 months of age, when the mother begins
a new breeding season (Schaller, 1993). The young become
sexually mature at 18 to 20 months of age and first give birth at
24 to 26 months.
4. Distribution and Population Status
Distribution: The current distribution of red panda extends
into areas of five countries: China, Myanmar, Nepal, India, and
Bhutan (Glatston et al., 2015). The easternmost location is in
Minshan Mountain and Upper Min Valley of Sichuan Province,
South-Central China (104° E) and the western most record is
from Kalikot district, western Nepal (81° E) (Choudhury, 2001;
Dangol, 2014). The nominate form, A. f. fulgens, is found
primarily in Nepal, India, Bhutan, Tibet and the northwestern
Yunnan Province of China.The sub-species A. f. styani is found in
Sichuan and northeastern Yunnan of eastern China and Myanmar
(Wei et al., 1999; Wei & Hu, 1993). The Nujiang River seems to
be a biogeographic barrier separating the two subspecies (Wei
et al., 2000).
Potential habitat: The estimated potential red panda habitat
available in its entire distribution range varies greatly between
the different studies. Choudhury (2001) estimated the potential
habitat of about 142,400 km2, while Mahato (2010) suggested
that the potential habitat available across the range is about
425,700 km2. A recent study based on a predictive random forest
model estimated the total potential red panda habitat available
in the range countries to be 32,600 km2 with most of the habitat
(53.4%) in Nepal (Kandel et al., 2014).
Figure 1: Potential red panda range area with the easternmost and westernmost confirmed locations

3
Jnawali et al. (2012) estimated that the total potential red panda
habitat available in Nepal is 2,652 km2 distributed across 36
districts. However, red panda habitation has been confirmed in
only 25 districts so far (Figure 2). Two other studies suggest that
the total potential habitat is far higher than this estimation; i.e.,
20,400 km2 (Mahato, 2010) & 17,400 km2 (Kandel et al., 2014).
Figure 2: Red Panda presence confirmed districts of Nepal
Population: The total range-wide red panda population is
estimated to be less than 10,000 mature individuals (Glatston et
al., 2015). In Nepal, the population may range from 237 to 1,061
individuals within 11 different sub-populations shown in Table 1
(Jnawali et al., 2012). These estimates are based on Population
and Habitat Viability Analyses, but need further assessment using
techniques that are more reliable.
Table 1: Potential habitat and population estimation of red panda in Nepal
S.N. Sub Populations Area (Km2) Populations
Confirmed Possible Confirmed Possible
1 Annapurna-Manaslu 4.18 84.23 2 34
2 Darchula - - - -
3 Dhorpatan 89.05 434.92 36 174
4 Gauri Shankar 45.17 114.15 18 46
5 Kanchenjunga 111.91 160.76 45 64
6 Khaptad 3.57 211.22 1 84
7 Langtang 47.83 125.7 19 50
8 Rara 55.63 1,099.16 22 440
9 Sagarmatha 73.71 150.96 29 60
10 Sankhuwasabha East 101.88 119.01 41 41
11 Sankhuwasabha West 59.46 152.02 24 48
Total 592.39 2,652.13 237 1,061

4
5. Conservation Challenges and Threats
Across its range, the major threats to red panda conservation are
the loss, degradation, and fragmentation of its habitat. Poaching
of red panda, especially to trade its hide, is also increasing
(Glatston, et al., 2015). As well, inbreeding depression is
threatening red panda populations (Wei et al. 1999).
Human threats to red panda habitat: The dependency of
local people on forest resources for firewood, fodder, timber, and
other non-timber forest products is a major cause of habitat loss
and degradation and an immediate cause of concern for managing
red panda populations in Nepal (Panthi et al. 2012). Livestock
herding practices of local people are further deteriorating the
quality of the habitat.
The main food of red panda, bamboo, is being over-exploited,
leading to a scarcity of food for red panda. Local people use
bamboo for fodder, fencing, thatching, and harvest the tender
shoots for vegetables. A natural food short age occurs when
bamboo flowers at the end of its life cycle leading to a mass
die-off of bamboo forest sin large areas. This may lead to the
local extirpation of red panda if there are no other staple foods
available in the habitat, or if the red pandas are unable to move
to other areas with suitable food.
Further challenges to red panda conservation include forest fires
and slash-and-burn cultivation, especially in eastern Nepal where
slash-and-burn is practiced for the cultivation of Chiraito (Swertia
chiraita). Development activities may hinder the movement of
red panda, especially when rural roads are constructed through
red panda habitat, which fragments the habitat.
Poaching: Another emerging challenge for red panda conservation
is poaching and illegal trade as seen in the growing numbers of
cases of confiscation of red panda hides. During the 8-year period
from 2008 to 2015, 56 cases of trafficking red panda hides were
reported in Nepal. This trade-induced threat is also reported
in other red panda range countries (Glatston et al., 2015). It is
believed that the threat is fueled by the demand in some parts
of eastern China for hides to make hats worn during wedding
ceremonies by newly married couples, which they believe brings
good luck for a happy conjugal life.
Natural threats: The natural predators of red panda include
martens, wild cats, leopards, dholes and eagles. There are reports
that domestic and feral dogs prey upon red pandas, and are a
significant threat to red panda conservation (Williams, 2004; Bista
and Paudel, 2014).
Other reports of red panda mortality are due to parasitic infections
and canine distemper. Infections of Trematodes and Nematodes
may cause respiratory and digestive problems reported to be
fatal for red panda (Lama et al., 2015). The livestock and herder’s
dogs that share red panda habitat are the potential source of
infection (Glatston et al., 2015, Deem et al., 2000).
6. Conservation Policy
The International Union for Conservation of Nature (IUCN) Red List
of Threatened Species designates red panda as an endangered
species (Glatston et al., 2015), and as an Appendix I species
under the Convention on International Trade in Endangered
Species (CITES) of Wild Fauna and Flora (https://cites.org/). The
Status of Nepal’s Mammals: The National Red List Series has also
listed this species under endangered C2a (i) category (Jnawali et
al., 2011). The National Park and Wildlife Conservation Act, 1973
of Nepal protects this species, prohibiting its killing or capture
dead or alive. There is a provision to impose a fine of NRs 40,000-
75,000 and/or a jail term of 1-10 years on any person who kills
or tries to kill a red panda. Other countries in the red panda range
also legally protect this species (Glatston et al., 2015).
Various documents for conservation in Nepal emphasize the
protection of threatened species, like the red panda. The National
Conservation Strategy (1988) clearly highlights the need to
preserve rare or endangered species and their habitats. The Nepal
Environmental Policy and Action Plan (1993) emphasizes the need
to protect and conserve endemic and endangered species and
their habitats, and to conduct inventories of biological resources.
The Nepal Biodiversity Strategy (2002) urges extensive research
and maintenance of endangered indicator species, including red
panda and their habitat. The National Biodiversity Strategy and
Action Plan (2014) emphasizes the framework for managing
biodiversity at the local level.
5
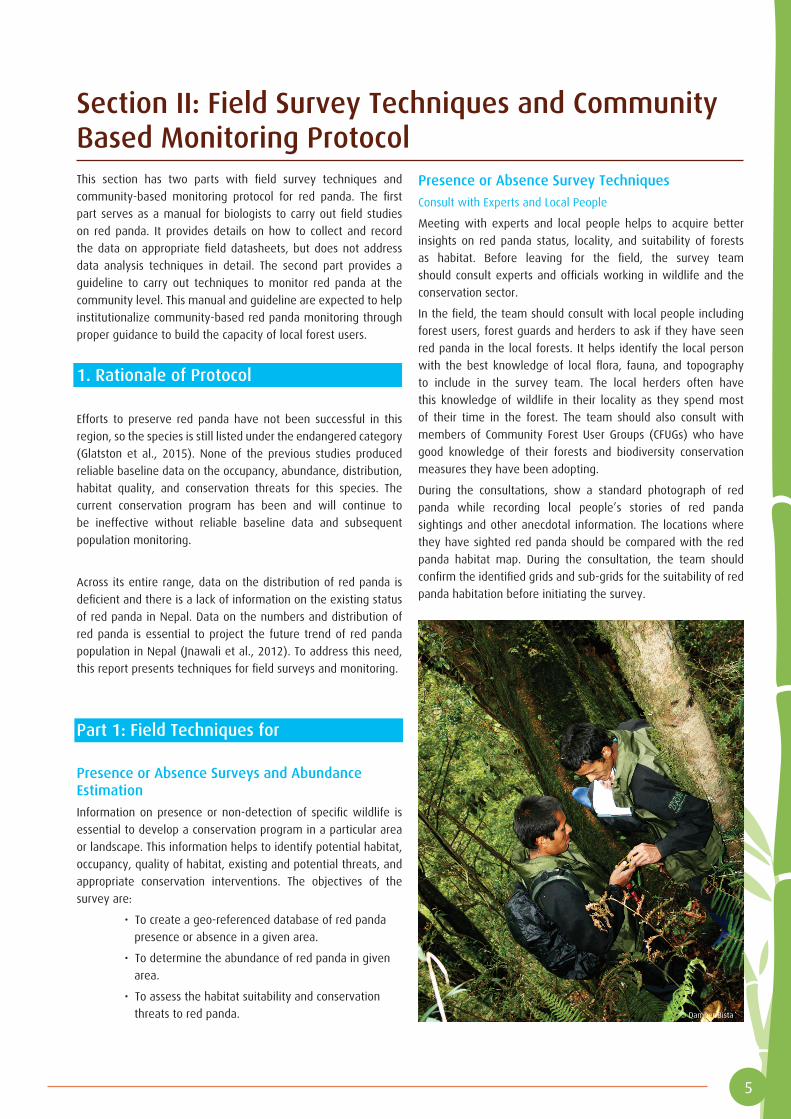
This section has two parts with field survey techniques and
community-based monitoring protocol for red panda. The first
part serves as a manual for biologists to carry out field studies
on red panda. It provides details on how to collect and record
the data on appropriate field datasheets, but does not address
data analysis techniques in detail. The second part provides a
guideline to carry out techniques to monitor red panda at the
community level. This manual and guideline are expected to help
institutionalize community-based red panda monitoring through
proper guidance to build the capacity of local forest users.
1. Rationale of Protocol
Efforts to preserve red panda have not been successful in this
region, so the species is still listed under the endangered category
(Glatston et al., 2015). None of the previous studies produced
reliable baseline data on the occupancy, abundance, distribution,
habitat quality, and conservation threats for this species. The
current conservation program has been and will continue to
be ineffective without reliable baseline data and subsequent
population monitoring.
Across its entire range, data on the distribution of red panda is
deficient and there is a lack of information on the existing status
of red panda in Nepal. Data on the numbers and distribution of
red panda is essential to project the future trend of red panda
population in Nepal (Jnawali et al., 2012). To address this need,
this report presents techniques for field surveys and monitoring.
Part 1: Field Techniques for
Presence or Absence Surveys and Abundance Estimation
Information on presence or non-detection of specific wildlife is
essential to develop a conservation program in a particular area
or landscape. This information helps to identify potential habitat,
occupancy, quality of habitat, existing and potential threats, and
appropriate conservation interventions. The objectives of the
survey are:
• To create a geo-referenced database of red panda
presence or absence in a given area.
• To determine the abundance of red panda in given
area.
• To assess the habitat suitability and conservation
threats to red panda.
Presence or Absence Survey Techniques
Consult with Experts and Local People
Meeting with experts and local people helps to acquire better
insights on red panda status, locality, and suitability of forests
as habitat. Before leaving for the field, the survey team
should consult experts and officials working in wildlife and the
conservation sector.
In the field, the team should consult with local people including
forest users, forest guards and herders to ask if they have seen
red panda in the local forests. It helps identify the local person
with the best knowledge of local flora, fauna, and topography
to include in the survey team. The local herders often have
this knowledge of wildlife in their locality as they spend most
of their time in the forest. The team should also consult with
members of Community Forest User Groups (CFUGs) who have
good knowledge of their forests and biodiversity conservation
measures they have been adopting.
During the consultations, show a standard photograph of red
panda while recording local people’s stories of red panda
sightings and other anecdotal information. The locations where
they have sighted red panda should be compared with the red
panda habitat map. During the consultation, the team should
confirm the identified grids and sub-grids for the suitability of red
panda habitation before initiating the survey.
Section II: Field Survey Techniques and Community Based Monitoring Protocol
© Damber Bista

6
Identify Potential Red Panda Habitat
Ideally, the team should use a map of land use land cover of the
survey area to identify potential red panda habitat based on the
following three parameters:
• Elevation range between 2,000m to 4,400m.
• Forest Types: fir forest, rhododendron forest, birch and
alpine scrub, oak forest, broad-leaf deciduous forest,
broad-leaf conifer forest and coniferous forest with
bamboo in the under-storey, should be identified
as potential red panda habitat (Yonzon et al., 1991;
Pradhan et al., 2001; Williams, 2004).
• River networks and existing locations of red panda
sightings help identify potential habitat.
• Other potential habitats that are far from former
sighting
In case a land use map is not available, use a topographic map or
Google Earth image.
Select the Survey Area Grids and Sub-grids
Overlay the potential habitat on the map with 9.6 km2 grids,
which is the red panda’s maximum size of home range in
Langtang National Park. Further, divide each grid of 9.6 km2
into 6 sub-grids, each with an area of 1.6 km2 to ease the data
collection. Randomly select at least 50% of the total grids for
the survey using the Geospatial Modeling Environment built into
ArcGIS version 10.2.
Within each particular grid, select three sub-grids randomly to
conduct the survey looking for signs of the presence of red panda.
Ensure that these three sub-grids cover the entire potential habitat,
including elevation range and water availability, in the particular
grid. Switch to another sub-grid if there is no representation, or if
a sub-grid is inappropriate.
The team should traverse all the available transects following
contours at intervals of 100m in the selected sub-grids, and note
the Global Positioning System (GPS) coordinates of the start and
end of each transect.
Each transect should be from 500m to 1,000m long. Each transect
will be sub-divided into 500m sub-segments for systematic
sampling to assess the habitat suitability (Figure 3).
Figure 3: Schematic diagram of transect walk
Sample Circular Plots to Determine Vegetation in Habitat
To collect data on the suitability of the habitat for red panda, use
a circular sampling plot to study the vegetation. Establish these
plots in two different ways. Establish circular sampling plots at
the start point of each transect and successive plots at intervals
of 500m. Establish a similar plot at each location where there is a
direct sighting of a red panda or sign. The concentric circular plots
will have a larger, 10m radius plot (Area =314.28m2) for trees,
and two other sub-plots of 3m radius for shrubs and bamboo
(A=28.28m2) and 1m radius for herbs (A=3.14m2) (Bista et al.,
in prep). See Figure 4. The team should record information on
disturbance factors seen within each plot.
Figure 4: Circular plot sampling design
Look for Signs of Red Panda on the Transects
The team should scan the trees and other vegetation for direct
sightings of red panda. The chance of spotting red panda during
the survey is low, so, the surveys depend upon observations of
the other indirect signs of red panda described below.
Droppings
Droppings are the most reliable evidence to document the
presence of red panda. The fresh droppings of red panda are
spindle-shaped, soft, moist, and green in color. The color of fresh
droppings will change from dark green to pale green and whitish
with aging. The remnants of leaves and other food can be seen
easily if the dropping is broken up.
According to Yonzon (1989), the size of spindle-shaped pellets
helps to distinguish whether the dropping is of an adult or cub/
sub-adult as follows:

7
Red pandas use tree branches, fallen logs, rocks, and the ground
as latrine sites, which can be hidden from view. Latrine sites with
piles of droppings of different ages could be found in resting sites,
whereas a few pellets (1 to 16) of droppings may be defecated
during other activities. However, usually, red panda repeatedly
defecate in the same site, which could have more than 100
pellets (Yonzon, 1989). See Photo 1.
Photo 1: Red Panda droppings of different age
Footprints
The red panda rarely leave footprints because they are arboreal
animals, spending most of their time in trees and little time on
the ground. However, on some occasions foot imprints may be
seen, especially on a snow, or in mud close to a water source.
See Photo 2
Photo 2: Red Panda footprint on snow: front
foot (left) & back foot (right)Photo 3: Bamboo leaves nipped by red panda
Dimension Adult Sub-adult/cub
Length (mm) 41.6 ± 6 34.7 ± 7.1
Diameter (mm) 19.2 ± 2.3 14.9 ± 2.6
© Damber Bista
© Damber Bista
© Amy Heffernan

8
Required Equipment and Gear
Table 2: List of equipment and gear
Equipment and gears Purpose
GPS Tracking transects, and recording GPS coordinates and elevation
Compass Aspect
Clinometer Measurement of tree height and slope angle of location
Binocular Observations in the forest
Camera Photograph of direct sighting and signs, other wildlife, threats and harmful human activities
Measuring Tape (30m) Quadrat establishment
Masking Tape Demarcating the boundary of quadrats
dbh Tape Measurement of dbh of tree
Spherical Densitometer Measurement of canopy cover
Vernier Calipers Measurement of length and diameter of droppings
Topographic and Other Maps Tracking transects and identifying potential red panda habitat
Laminated Picture of Red Panda Show to local people during consultation
Field Note Book Recording information
Pen/Pencil/Eraser Recording information
Camping Gear Camping while away from settlements
Warm Clothes To keep warm because the red panda habitat is cold
Rain Suits To keep dry in rain
Trekking Boots Protection of legs from mud, prickly bushes, and other pests like leeches, or snakes, etc.
Food/Snacks and Cooking Set Snacks needed while working in the forest; food and cooking set necessary if staying away
from settlement
Back-up Materials Example: batteries, write in the rain paper, lead pens
First Aid Kit For treating common body ailments and injuries
Foraging Marks
Red panda forage on the soft leaves of bamboo on upper
bamboo stalks that are about 2m above ground and inaccessible
to domestic livestock and other wild ungulates. Bamboo leaves
nipped at this height can be a sign of red panda foraging. See
Photo 3. These foraging indicators may be seen either at the base
of the leaf or at the junction of leaf and branch. Similarly, foraging
signs may be seen on the leaves of other vegetation like Bhaalu
Chinde (Schefflera impressa).
Scratch Marks
Red pandas use their claws and sometimes teeth to leave scratch
marks on tree trunks and branches. The marks of red panda are
usually about 1.5m above ground, but other animals may also
leave such markings on tree trunks. Occasionally, the red panda’s
hair is found with the scratch marks. These marks on the bark of
trees are very small scratches with no particular shape.
Body Parts
In some cases, the survey teams may find a carcass and
remaining body parts (e.g., hide, skeletal remains) in the forest
or in the homes of local people. When home owners keep body
parts in houses, it is important to ask them about the source and
place of origin of these parts, since the body parts could be from
elsewhere through trade or exchange.
When and Which Season to Conduct the Survey
The survey can be done in most months of the year, except during
the monsoon when the dense growth of vegetation in the under-
storey creates problems to walk and observe in the forest. Signs,
especially droppings, may be washed away which reduces the
chances of recording the presence of red panda. However, some
surveys need to be conducted during the monsoon season if the
research question is for example, information on seasonal diets.
There are several factors affecting the success of survey including
weather, travel and accessibility, visibility inside the forest,
availability of signs (droppings/foot prints etc.), and availability
of shelter for survey crew. The major factors to consider while
scheduling the survey are shown in Table 3.

9
Table 3: Factors to consider when selecting the time for the survey
Season Sign Detectability Factors Sum
Weather (W) Travel (TA) Visibility (V) Availability of
Signs (ASi)
Availability of
Shelter (ASh)
Summer 3*** 2 3 3 2 13
Monsoon 1* 1 1 1 2 6
Post-monsoon 2** 2 2 2 2 10
Winter 2 2 2 3 1 10
Winter: December-February; Summer: March-May; Monsoon: June-August & Post Monsoon: September-November
Factors Affecting Survey Abbreviation Suitability Ranking
Weather W * 1 = Poor
Travel and Accessibility TA ** 2 = Acceptable
Visibility Inside the Forest V *** 3 = Best
Availability of Signs (Droppings/Footprints etc.) ASi
Availability of Shelter for Survey Crew ASh
Before going in the field, set the GPS to metric units and degrees
as ‘decimal’ in Map Datum WGS84. Then load the GPS coordinates
of the four corners of each selected sub-grid in the GPS.
Once in the field, after reaching the nearest sub-grid, use the GPS
to conduct the survey along each contour at an interval of 100m.
A transect’s elevation may vary slightly ( 10m) on difficult or
inaccessible terrain.
Observe all the potential trees and substrates for direct sightings
of red panda or indirect signs while walking along the transects.
Try to see upto 25m distance on the both sides of a transect for
indirect signs.
There is no limitation of distance for direct sighting. Use binoculars
to confirm the observation, which reduces the chance of missing
any direct sightings or indirect signs. Record the information
related to the red panda observed during the survey on the data
sheet (Data sheet 1).
Details of the process to follow during the transect survey are as
follows:
• Use the ‘GoTo’ function of GPS to reach the nearest point
of the selected sub-grid and begin the survey from that
point. Lay out a sampling plot and record vegetation
information on Data sheet 2.
• Walk the transect line along the particular elevation
within the sub-grid using the GPS. Keep scanning the
trees and surroundings for direct sightings and indirect
signs. Use binoculars to increase the chance of seeing a
red panda or sign.
• Photograph direct sightings and other signs to show the
shape and size. Be sure to label and save the photograph,
and transfer it correctly. Use a scale beside the sign in
photographs and write down the details, such as GPS
coordinates and date on a piece of paper that you place
next to the sign when taking the photograph.
• Measure the distance covered along each transect using
the GPS. The person carrying the GPS has to be careful
to keep the GPS along the transect. If that person walks
off the transect, leave the GPS on the ground so as
not to increase the recorded length of the transect.
Leave the GPS on the ground (or other substrate) while
establishing sampling plots and taking notes.
• Establish the next sampling plot at an interval of
500m (systematic sampling) to record information on
vegetation and habitat.
• Take the GPS coordinates and other related information
at the end of each transect.
• After reaching at the end of the transect, follow the
next selected transect along the next contour, 100 m up
or down in elevation.
• Note the information for all observations recorded during
the transect walk, and survey and record information on
vegetation types in sampling plots and micro-habitats
at the locations of direct sightings or signs. Record the
GPS position.
• Repeat the process until all the transects are completed.
Opportunistic Surveys Where Locals Report Sightings
When locations where local people report having seen red panda
in the past are outside the selected sampling sub-grids, the
survey team should visit the location and sample the sub-grid
using the same methods and protocols as for a complete sub-
grid. Record all information provided by the local people, and
complete the process described in the section above, “How to
do a transect walk?” This opportunistic sampling is necessary in
case the systematic sampling fails to record any direct sighting
or signs.
How to do a Transect Walk

10
Collect and Compile the Data
It is important to record the details of all field level information,
including GPS locations of direct sighting/indirect signs, elevation,
aspect, slope, substratum, height from ground surface, vegetation
types, bamboo culm number, and distances to nearest settlement
and water sources.
The information recorded on vegetation should include the
species, diameter at breast height (dbh), height, canopy cover of
trees, and the composition of herbs, shrubs, and bamboo species,
with their number, height, and cover.
Collect and record information on human disturbances including
the number of cut stumps, number of livestock seen and their
droppings, livestock shelters, cattle paths, signs of forest fire,
distance to nearest settlement, number of tourists, presence of
electric transmission lines, roads, and other construction activity,
and other visible human activities. This information matters in the
preparation of conservation strategies.
Recording the Data
The annexes at the end of this report have data sheets for
recording the information noted while doing the survey. Complete
these datasheets while conducting the survey in the field.
• Datasheet 1: Red Panda Presence/Absence Survey
• Datasheet 2: Habitat Suitability and Threat Survey
• Datasheet 3: Red Panda Sign Monitoring
• Datasheet 4: Vegetation and Threat Monitoring
• Datasheet 5: Monitoring Data Analysis (Red Panda
status)
• Datasheet 6: Monitoring Data Analysis (Habitat
suitability)
• Datasheet 7: Disturbance and Threat Monitoring
Sign Data in Presence or Absence Survey
• For each transect, complete a separate Datasheet 1.
Complete the information section at the top of Datasheet
1 with the name of district, Village Development
Committee (VDC), Protected Area, Community Forest
(CF), and number of Grid, Sub-Grid, transect, and the
transect length covered. Also record the time and GPS
coordinates of the start and end of each transect. These
coordinates should be in decimal degrees.
• Use one row to record the direct sighting or indirect sign
observed in one location. All signs observed within a
10m distance along the transect are considered as a
group or cluster of signs. Record the data in a separate
row if the signs are 10m or more apart along the
transect.
• Note the number of red pandas seen. Record the number
of dropping piles and other signs. At red panda latrine
sites, count and note the number of pellets in each pile.
Measure the length and diameter of one representative
pellet from each pile. If you find footprints, measure the
length and width of the footprints. Take photographs.
Include a scale and a piece of paper with the GPS
coordinates and date in the photograph.
• Note GPS coordinates, elevation, and substrate for
observed signs or direct sighting of red panda on the
datasheet. Document the name of the tree species if
a red panda is seen on a tree. Estimate and note the
distance to nearest water source, livestock shelter,
road and settlement. The team can verify, confirm, and
correct this information later using maps, Google Earth,
and interviews with local people.
• Note any unique features, proximity to human
disturbances, special behavior observed during a direct
sighting, or other significant observations in the remarks
section. Examples include the age of the animal (adult,
sub-adult, cub), behavior, etc. Note if a mother and cubs
are seen, as it is evidence of breeding.
Data for Habitat Suitability
• For each sampling plot, complete a separate Datasheet
2. Fill in the section on top of Datasheet 2 with the
name of district, VDC, Protected Area, Community
Forests and number of Grid, Sub-Grid, transect number,
and sampling plot types (whether a sign/non-sign plot).
• Record the GPS Coordinates and elevation of the
location.
• Record the distance to the nearest water sources,
livestock shelter, human settlement, and any other
physical infrastructure (e.g., roads, electric transmission
lines, water supply line, etc.).
• Record the number of logs, snag trees, lopped trees,
tree stumps, and dropping piles of livestock and wildlife
within the plot. Take photographs. Include a scale and a
piece of paper with the GPS coordinates and date in the
photograph.
• Record the name of trees along with their height and
dbh. Use a dbh tape to measure the dbh of each tree
at 1.37m above the ground. Likewise, measure the
canopy coverage of trees. One row should be used for
one species of tree, and the value of height and dbh for
each individual tree of that species could be separated
by semicolon (;) or slash (/). Measure the angle of the
slope with a Clinometer.
• Record the information on shrubs, bamboo, and herbs.
Count the numbers of each of these vegetation features
and record their height. Estimate the understory
dominance of each of these vegetation types.

11
Data for Threats and Disturbance
• Use one datasheet (Datasheet 2) for recording information
on threats and disturbances at each sampling plot.
• Fill in the section at the top of the datasheet with the
name of district, VDC, Protected Area, Community Forests
and number of Grid, Sub-Grid and transect number.
• Note the presence of the given variables separately
under the remarks column, and estimate the scale for
each of them. Use ocular estimation to scale the values
for each variable as follows: 0 if the given disturbance or
threat is absent; 1 if the given threat extends upto 25%
of the plot; 3 if 26-50% of the threat extends up to 50%
of the plot, etc.
• Consider threats within a distance of less than 200m for
the variables rural road or trekking trail and settlement.
Data Management and Analysis
Data collected during the fieldwork has to be processed in a
spreadsheet and analyzed to obtain the information according to
the research design. The team should enter the data immediately
after completing the fieldwork. Check the possibility of errors by
using a double entry or by having a second person review the
data.
The following software could be useful in data management and
analysis.
• MS-Excel (Data management)
• R (Statistical Analysis)
• ArcGIS (Mapping and Analysis)
• PRESENCE (Occupancy Modelling)
• MaxEnt (Spatial Distribution and Habitat Suitability
Analysis)
Analysis of Presence or Absence
The presence of red panda in the surveyed area is confirmed
by direct sighting and the observation of droppings, carcasses/
body parts. However, be aware that predators might have carried
a carcass from a nearby area. So, this sort of cases should be
treated carefully during analysis.
An absence of evidence does not confirm the absence of red
panda; it could be just that the team did not detect the evidence
during the survey. Factors including the availability of water
sources, abundant bamboo in the understory, and a good canopy
of trees may indicate the possible presence of red panda. It is
helpful to consult with local people when reaching conclusions
about the presence or absence of red panda.
The following parameters have to be considered during the
analysis:
• Local names, and cultural-religious significance (if any)
• Age structure based upon the size of pellets
• Distribution map of red panda (based on the GPS coordinates
of direct sighting/indirect sign)
Estimation of Abundance
Abundance refers to the relative population of a species in a
particular area at a specific time. Since red pandas are very elusive
animals, it is hard to estimate their population size through direct
sightings. Therefore, a standard method to suggest their relative
abundance is to calculate the estimated rate of encountering
their signs (number of signs/per km). Besides, the genotyping
of these samples could also be performed to estimate accurate
abundance.
Relative abundance helps compare the population status in
two or more communities. It also helps to assess the change
in population size and population structure in locales and time.
Similarly, abundance estimations help to assess the impact of
a particular threat, such as forest fire or bamboo flowering and
die-off events. Abundance estimations can also help to assess
the effectiveness of a conservation program and help the wildlife
conservationist to decide when and where to focus management
interventions.
Systematic sampling is essential for estimating relative
abundance. The key factor during the survey is the length of
transect covered, which must be properly noted for each transect.
Survey teams use the data collected during presence or absence
surveys to estimate the encounter rate of red panda by dividing
the total numbers of sign by the total length of the transects in
kilometers.
While analyzing abundance data the following two factors are
considered:
• Encounter rate (signs/km)
• Distribution across different elevation and forest types
Assessment of Habitat Suitability
The term “habitat suitability” describes the complex environmental
factors that affect the ability of organisms to establish and maintain
a population. Data recorded in the field is useful in analyzing
whether or not the habitat in a particular location can support a red
panda population. This analysis can also utilize satellite imageries
of that site to determine the size of the study area. In suitable
habitat there should be stands of other, similar forest patches
that connect via potential corridors to facilitate movement of the
red panda. It is important to consider the following parameters
when analyzing habitat suitability:
• Preferences in aspect, slope, and proximity to water
sources
• Use of substrate, preferred tree species, and height
above the ground
• Vegetation composition, canopy cover, Importance
Value Index (IVI) of different species, bamboo cover,
bamboo density (culm/m2), and bamboo height
12
Research shows that the following habitat conditions are important
for red panda (Yonzon et al., 1991; Pradhan et al., 2001; Williams
2006 & Dorji et al., 2011):
• Canopy cover of trees should be more than 32%
• Bamboo cover should be more than 37%
• Average bamboo height should be more than 2.5m
• Average dbh of trees should be more than 30cm
• Presence of other staple diet species; e.g., Sorbus spp.,
Schefflera spp., Rubus berries, etc.
• Presence of nearby water sources
Assessment of Threats and Disturbances
Use consultations with local people and existing field observations
to identify the potential threats to red panda. Information
recorded on Datasheet 2 helps in analyzing the extent of threats
and disturbances. Consider the following factors while assessing
and analyzing threats:
• Deforestation status based on the density of tree stumps
[in Hectare (ha)]
• Livestock herding impacts based on the density of livestock
droppings piles (in ha) and cattle trails, and density of
lopped trees (in ha)
• Impact of wildlife poaching, forest fire, development
activities, human traffic, landslides, etc.
• Proximity to settlements and rural roads or trekking
trails
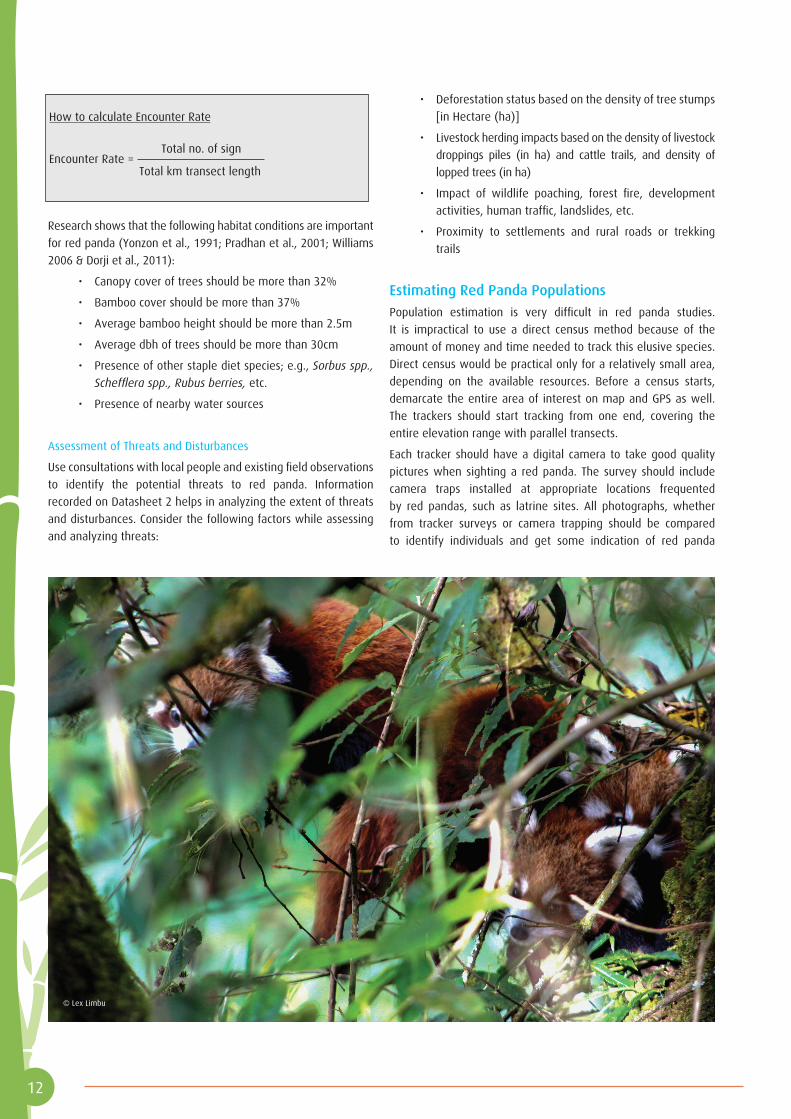
Estimating Red Panda Populations
Population estimation is very difficult in red panda studies.
It is impractical to use a direct census method because of the
amount of money and time needed to track this elusive species.
Direct census would be practical only for a relatively small area,
depending on the available resources. Before a census starts,
demarcate the entire area of interest on map and GPS as well.
The trackers should start tracking from one end, covering the
entire elevation range with parallel transects.
Each tracker should have a digital camera to take good quality
pictures when sighting a red panda. The survey should include
camera traps installed at appropriate locations frequented
by red pandas, such as latrine sites. All photographs, whether
from tracker surveys or camera trapping should be compared
to identify individuals and get some indication of red panda
© Lex Limbu
How to calculate Encounter Rate
Encounter Rate = Total no. of sign
Total km transect length

13
movement patterns in the area (Annex 2, Shrestha et al., 2015).
Non-invasive genetic techniques, such as collecting faecal
samples and hair, can provide estimates of red pandas in larger
areas. Genotyping may also further validate the findings obtained
through camera trapping if both of these different methods could
be integrated systematically.
Part 2: Community-Based Red Panda Monitoring (Citizen Science)
Engaging local people is crucial for the success of a conservation
program. Local people have the best knowledge of their forests
and wildlife so involving communities from the outset, by having
them physically collect information, builds ownership of the
species and their forests (Williams et al., 2011). Ensure the active
participation of these local conservation stewards throughout
the implementation of every conservation program to elicit the
feeling of engagement and contribution towards conservation of
their forest resources. Community-based monitoring programs
help local forest users to build the perception that a forest can be
of longer-term benefit if used sustainably, and to appreciate the
inherent aesthetic value of natural ecosystems and the wildlife
species. However, it is important to give communities insights
into science-based conservation practices.
This Citizen Science protocol aims to build the capacity of local
stewards to use structured, science-based techniques to assess
the status of red panda populations, including abundance, habitat
quality, and conservation threats. Empowering local forest users
with science-based monitoring techniques not only educates
them on issues of red panda conservation, it motivates them to
sustain the initiative. This outcome was seen in eastern Nepal,
where through the community-based monitoring program, cattle
herders changed from being the main threat to red pandas and
their habitat, to being ardent supporters of saving red pandas and
their habitat (Williams et al., 2011).
A wildlife monitoring program demands huge resources in terms
of time, money, and effort. Therefore, it should be designed
carefully so that the program answers the relevant questions
effectively, while being cost-effective and sustainable. Having
the protocol helps maintain uniformity in activities to monitor red
panda including site selection, and the collection, management,
and analysis of data. Uniformity in the monitoring program
allows its effectiveness in different locations to be compared and
evaluated.
Monitoring Objective
To monitor the status and trends of red panda population abundance,
habitat quality, and conservation threats over time using community
information (citizen science).
Monitoring Site Selection and Transect Establishment
• Identify potential habitat and conduct surveys to confirm
the presence/absence of red panda (methodology
described in Part 1) by involving local people.
• Demarcate the confirmed red panda habitat on topographic
maps and randomly select the potential sites for long term
monitoring.
• Consult with the target community CFUGs and Buffer
Zone Community Forest User Groups (BZCFUGs). Ask each
group to select at least two different blocks demarcated
with some natural or artificial features (e.g., streams,
gorge, cliff, buildings, roads, transmission lines, etc.) for
monitoring.
• Mark 1km long elevational transects along each contour
line within each selected grid at intervals of 100 m. Mark
each transect at the start point, end point, and at every
100m interval. Ensure that notations used for marking
are uniform; e.g., the notations used to mark a transect
at an elevation of 2,600m will be:
- Start point (T1-2, 600m-0)
- At every 100m distance (T1-100m, T1-
200m……T1-900m)
- End point (T1-2,600m-1km)
• Use aluminum tags to mark transects on trees.
• Locate one circular plot for vegetation sampling at
the mid-point (T-500m) of each transect by nailing a
wooden peg to mark the plot site.
Monitoring Season and Frequency
Conduct monitoring four times a year, once in every season
(Table 4). Schedule specific dates to conduct the monitoring at
the same time in all sites.

14
Table 4: Schedule recommended for monitoring
Season Months (Recommended for monitoring) Description
Winter January This is the mating season of red panda when there are higher
chances of seeing them in pairs.
The monitors should take precautions so that the mating couples
are undisturbed while observing them.
Summer April This is when poachers are active. Monitoring in this season helps
in recording evidence of poaching and in dismantling the traps/
snares set for wildlife, including red panda.
Monsoon July This is the breeding season of red panda with good chances
of identifying nesting sites as mothers spend most of her time
around the nest. These observations help conserve nesting sites/
trees.
Post Monsoon October The cubs come out of their nest, so their droppings can be seen
during this season. This will help determine the population struc-
ture and productivity.
What to Monitor?
Monitoring should assess the following:
• Status of red panda sightings, abundance, and population
structure
• Red panda habitat quality
• Disturbances and threats
Therefore, the monitoring should focus on the following
observation types:
• Direct sightings of red panda
• Indirect signs (droppings, foraging marks, footprints, and
scratch marks)
• Direct sighting and indirect evidence of the presence of
other wildlife
• Size of fecal pellets and footprints to distinguish age
groups (cubs or adults)
• Vegetation (trees, shrubs, herbs, and bamboo)
• Disturbance and threats (evidence of poaching, forest fire,
livestock, dogs, tree stumps, lopped trees, etc.)
© Sonam Tashi Lama

15
Selection of Forest Guardians
Based on the resources available for a monitoring program,
engage at least two local people from a CFUG or BZCFUG as forest
guardians. Ask the respective community group to nominate
people who are familiar with the local topography, flora/fauna,
and literate enough to be capable of completing data sheets and
handling equipment (e.g., GPS, Vernier Calipers, etc.). Give priority
to livestock herders and ex-poachers meeting these criteria.
Training for Forest Guardians
Train all the monitors before deploying them in the field for
monitoring. The training organized for them must at least include
the following:
• General introduction of red panda status, ecology,
conservation threats, and conservation importance
• Legal provisions concerning conservation of red panda
and other associated wildlife
• Monitoring techniques, including handling equipment and
recording data
Based on the quality of data they provide, provide the guardians
with frequent feedback for the further improvement of their skills.
Permission from Government
Obtain permission from the relevant government agencies,
including Department of National Parks and Wildlife Conservation
(DNPWC) and Department of Forest (DOF) and their field offices.
Likewise, collaborate with the relevant Buffer Zone User Groups
(BZUGs) and CFUGs to initiate the monitoring.
Equipment
The equipment required for each guardian or team includes a GPS,
camera (ideally waterproof), binoculars, measuring tape, dBH
tape, vernier caliper, first aid kit, notebooks, pens and batteries.
Monitoring Techniques
• Make a checklist of all the necessary equipment and field
gear, and ensure that all necessary gear is taken to the
field.
• Start the monitoring from one end of each transect. Scan
all the trees and substrates for indirect signs (upto 25m
on both sides of the transect) and direct sightings within
the range of sight while walking along each transect.
• Look for any sign left in the past three months on the
substrate where signs or sightings were recorded during
previous monitoring. Take notes of the observations in
notebooks. Records of the number of pellets and their
location or substrate will be helpful during successive
monitoring. Ensure that the GPS is working properly
(accuracy should be about 3m) before taking the notes
of GPS coordinates and elevation. Ensure that the GPS is
set to metric units and records degrees as ‘decimal’ in
WGS84.
• Record the observations made during the monitoring on
Datasheet 3, and record notes in the notebook.
• Establish a sampling plot at the permanently marked
locations along each transect. Record the information
on habitat suitability on Datasheet 4, according to the
description provided in the previous section on sampling
plots. Take care not to damage the vegetation inside the
plots when sampling.
• Repeat the process for other transects.
Data Management and Analysis
Compile and present the data collected during monitoring in
summary sheets for further analysis as follows:
Status of Red Panda Sighting and Abundance and Population
Structure
• Use Datasheet 5 to compile data recorded on Datasheet
3 for each transect. Use a separate Datasheet 5 for each
grid.
• Use the number of direct sightings, indirect signs, substrates
and trees observed with signs,and the average elevation
and distance to water sources calculated in each datasheet
for the respective transects in Datasheet 5.
• Use information on preferred tree species to local forest
users to provide insights for focusing conservation
interventions.
• Note that increases (or decreases) in the numbers of
direct sightings and the abundance (including that of cubs
and adults) over time indicates growing (or declining)
populations.
Habitat Suitability
• Use Datasheet 6 to compile information recorded on
Datasheet 4 from different sampling plots of a particular
grid.
• Add the values of each variable at the bottom of the
datasheet, and use the mid-value for the range of
vegetation cover, including trees, shrubs, herbs, and
bamboo.
• Note that increases (or decreases) in the value of
vegetation cover in successive monitoring, and in the
height and density of bamboo indicate improving (or
declining) quality of habitat.
• Note that increases in the density of wildlife dropping
piles over time indicate that the habitat suitability for
associated wildlife is improving.

16
Disturbances and Threats
• Use Datasheet 7 to compile information recorded on
different transects of a particular grid.
• Replace the percentage values with the impact scale
range. For example, replace 0 with 0; 0-25% with 1; 26-
50% with 2; 51-75% with 3, and 76-100% with 4, which
is the most serious impact.
• Add the values of each variable under the column (Total
Value).
• Note that the total impact value of specific threat or
disturbance provides crucial information for local forest
users to determine if a further intervention is necessary
or not. Different variables have impacts on the survival of
red panda. Therefore, specific values show the acceptance
level of each impact. A total value upto ‘1’ indicates the
level of acceptance for forest fire, rural road or trekking
trail, cattle trail, landslide, settlement, bamboo die-off,
solid waste, and livestock. The value should be ‘0’ for
other variables including presence of dogs, poaching signs,
lopped trees, and tree stumps. Any variables exceeding
these limits indicate a need for further interventions to
address them.
Record Keeping and Reporting
The survey team should properly keep all the datasheets used
during monitoring and data analysis for future records. Each CFUG
or BZCFUG should submit copies of the Datasheets 5, 6, and 7
to relevant government authorities immediately after conducting
the monitoring. Keeping these records is crucial in evaluating and
monitoring the efficacy of monitoring team.

17
Bista D., S.T. Lama, Shrestha, S & Paudel R. (under preparation),
Status of red panda in Panchthar-Ilam-Taplejung Corridor,
eastern Nepal
Bista, D., & Paudel, R. (2014). An Overview of the Status and
Conservation Initiatives of Red Panda Ailurus fulgens (Cuvier,
1825) in Nepal. The Initiation, 5, 171-181.
Choudhury, A. (2001). An overview of the status and
conservation of the red panda Ailurus fulgens in India, with
reference to its global status. Oryx, 35(3), 250-259.
Dangol, B. 2014. Habitat and distribution of Red Panda: a
case study from Ranchuli VDC, Kalikot District, Nepal.
(Unpublished thesis for Master Degree in Environmental
Science). Central Department of Environmental Science,
Tribhuvan University, Kathmandu, Nepal.
Deem, S. L., Spelman, L. H., Yates, R. A., &Montali, R. J. (2000).
Canine distemper in terrestrial carnivores: a review. Journal
of Zoo and Wildlife medicine, 31(4), 441-451.
Dorjee, D., Chakraborty, R., & Dutta, P. K. (2014). A note on
the high elevation distribution record of Red Panda Ailurus
fulgens (Mammalia: Carnivora: Ailuridae) in Tawang District,
Arunachal Pradesh, India. Journal of Threatened Taxa, 6(9),
6290-6292.
Dorji, S., Rajaratnam, R., &Vernes, K. (2012). The Vulnerable red
panda Ailurus fulgens in Bhutan: distribution, conservation
status and management recommendations. Oryx, 46(04),
536-543.
Dorji, S., Vernes, K., & Rajaratnam, R. (2011). Habitat correlates
of the red panda in the temperate forests of Bhutan. PloS
one, 6(10), e26483.
Glatston, A. R. (2011). Red panda: biology and conservation of
the first panda.
Glatston, A., Wei, F., Than Zaw& Sherpa, A. 2015. Ailurus
fulgens. The IUCN Red List of Threatened Species 2015:
e.T714A45195924. http://dx.doi.org/10.2305/IUCN.
UK.2015-4.RLTS.T714A45195924.en.
GoN. 1973. National Park and Wildlife Conservation Act, 1973.
Government of Nepal.
GoN/MFSC. 1988. National Conservation Strategy, Government
of Nepal/Ministry of Forest and Soil Conservation, GEF and
UNDP.
GoN/MFSC. 2002. Nepal Biodiversity Strategy. Kathmandu:
Government of Nepal/ Ministry of Forest and Soil
Conservation)
Groves, C. (2011). The taxonomy and phylogeny of Ailurus
fulgens. Red panda Biology and Conservation of the First
Panda (A, 101-124.
HCF (2016). Assessment of Red Panda Occupancy, Abundance,
Distribution, and Threats in Chitwan-Annapurna Landscape,
Report submitted to WWF-Nepal (Unpublished).
https://en.wikipedia.org/wiki/Red_panda
Jnawali, S. R., Baral, H. S., Lee, S., Acharya, K. P., Upadhyay,
G. P., Pandey, M., ... & Khatiwada, A. (2011). The Status of
Nepal Mammals: The National Red List Series, Department of
National Parks and Wildlife Conservation Kathmandu, Nepal.
Preface by Simon M. Stuart Chair IUCN Species Survival
Commission.
Jnawali, S., Leus K., Molur, S., Glatston, A., Walker, S. (Editors)
2012. Red Panda (Ailurus fulgens). Population and Habitat
Viability Assessment (PHVA) and Species Conservation
Strategy (SCS) Workshop Report. National Trust for Nature
Conservation, Kathmandu, Nepal, Conservation Breeding
Specialist Group and Zoo Outreach Organization, Coimbatore,
India.
Kandel, K., Huettmann, F., Suwal, M. K., Regmi, G. R., Nijman,
V., Nekaris, K. A. I., ... & Subedi, T. R. (2015). Rapid multi-
nation distribution assessment of a charismatic conservation
species using open access ensemble model GIS predictions:
Red panda (Ailurus fulgens) in the Hindu-Kush Himalaya
region. Biological Conservation, 181, 150-161.
Lama, S. T., Lama, R. P., Regmi, G. R., & Ghimire, T. R. (2015).
Prevalence of intestinal parasitic infections in free-ranging
Red Panda Ailurus fulgens Cuvier, 1825 (Mammalia:
Carnivora: Ailuridae) in Nepal. Journal of Threatened Taxa,
7(8), 7460-7464.
Mahato, N. K. (2012). Distribution of the red panda Ailurus
fulgens (Cuvier, 1825) in Nepal based on a predictive model.
McNab, B. K. (1988). Energy conservation in a tree-kangaroo
(Dendrolagus matschiei) and the red panda (Ailurus
fulgens). Physiological Zoology, 280-292.
Northrop, L.E. and Czekala, N. 2011. Reproduction of the Red
Panda. In: A.R. Glatston (ed.), Red Panda, biology, and
conservation of the first panda, pp. 125–146. Academic
Press, London, UK.
Panthi, S., Aryal, A., Raubenheimer, D., Lord, J., & Adhikari,
B. (2012). Summer Diet and Distribution of the Red
Panda(Ailurus fulgensfulgens) in Dhorpatan Hunting
Reserve, Nepal. Zoological Studies, 51(5), 701-709.
Panthi,S.,Coogan.S.C P., AryalA., RaubenheimerD. 2015. Diet
and nutrient balance of red panda in Nepal. Science of
Nature102:54 DOI 10.1007/s00114-015-1307-2
Pradhan, S., Saha, G. K., & Khan, J. A. (2001). Ecology of the
red panda Ailurus fulgens in the Singhalila National Park,
Darjeeling, India. Biological Conservation, 98(1), 11-18.
Roberts, M. S., &Gittleman, J. L. (1984). Ailurus fulgens.
Mammalian Species Archive, 222, 1-8.
Roberts, M. S., & Kessler, D. S. (1979). Reproduction in red
pandas, Ailurus fulgens (Carnivora: Ailuropodidae). Journal of
Zoology, 188(2), 235-249.
References

18
Schaller, G. B. (1994).The last panda. University of Chicago Press.
Sharma, H. P. (2008). Distribution and conservation status of Red
Panda (Ailurus fulgens) in Rara National Park, Nepal. Final
report to People’s Trust for Endangered Species, London, UK.
Shrestha, S., Shah, K. B., Bista, D., & Baral, H. S. (2015).
Photographic Identification of Individual Red Panda (Ailurus
fulgens Cuvier, 1825). Applied Ecology and Environmental
Sciences, 3(1), 11-15.
Subedi, T. and Thapa, A. 2011. Habitat status and distribution of
Red Panda (Ailurus fulgens) in Dhorpatan Hunting Reserve,
Nepal. Proceedings of Second Seminar on Small Mammals
Issues: 17–24.
Thapa, A., & Basnet, K. (2015). Seasonal diet of wild panda
(Ailurus fulgens) in Langtang National Park, Nepal Himalaya.
International Journal of Conservation Science, 6(2).
Wei, F. W., & Hu, J. C. (1993). Status and conservation of red
pandas in Sichuan. Changes of Mammal Resources under
Human Activities. China Science and Technology Publishing
House, Beijing, 56-60.
Wei, F., Feng, Z., Wang, Z., & Hu, J. (1999). Current distribution,
status and conservation of wild red pandas Ailurus fulgens in
China. Biological Conservation, 89(3), 285-291.
Wei, F., Feng, Z., Wang, Z., & Hu, J. (2000). Habitat use and
separation between the giant panda and the red panda.
Journal of Mammology, 81(2), 448-455.
William, B. H. 2004. The status of Red Panda in Jamuna and
Mabu village of Eastern Nepal. (Unpublished thesis M.Sc. The
faculty of the Department of Environmental Studies). San
Jose State University.
Williams, B.H. 2003. Red Panda in Eastern Nepal: how do they
fit into the biological conservation of the Eastern Himalaya?
Conservation Biology in Asia 16: 236–250.
Williams, et al., 2011. Project Punde Kundo: Community-based
monitoring of a red panda population in Eastern Nepal, Red
Panda Biology and Conservation of The First Panda (Ed.) A.R.
Glatston, pp. 393-408, Elsevier Inc.
Yonzon, P. B. (1989). Ecology and conservation of the red panda
in the Nepal-Himalayas (Doctoral dissertation, University of
Maine).
Yonzon, P. B., & Hunter, M. L. (1991). Conservation of the red
panda Ailurus fulgens. Biological conservation, 57(1), 1-11.
Zhang, S.L., Ran, J.H., Tang, M.K., Du, B.B., Yang, Q.S. and Liu, S.C.
2008. Landscape pattern analysis of Red Panda habitat in
Liangshan Mountains. ActaEcologicaSinica28: 4787–4795.

19
Section III: Annexes
Annex 1: Data sheets
Data Sheet 1: Red Panda Presence/Absence Survey
District:
_____________________________
VDC:
___________________
Protected Area:
_________________________
Community Forest:
________________________
Grid No.: _____________________ Sub Grid No.: ________ Transect No.: _______________ Transect Length (m): _______
GPS Coordinates Start N _________________ End N ________________________________
E _________________ E ________________________________
S.N. Types of Sign Num-
ber of
Pellets
in
Drop-
ping
Piles
Dropping/Foot
Print (mm)
Geo-
graphic
Location
Ele-
va-
tion
(m)
Substrate
(Ground/
Rock/
Tree/
Log)
Tree
Spe-
cies
Distance to nearest (m) Re-
marks
Direct
Sighting/
Number
Indirect
(Drop-
ping
Piles/
Feeding
sign/
Foot
Print/
Scratch
Mark/
Body
Parts)/
Number
Length Diam-
eter/
Width
N E Settle-
ment
Live-
stock
shed
Water
sourc-
es
Surveyors: -Team Leader:
___________________________________________________
Assistants:
1. ________________________________________________
2. ________________________________________________Date:

20
Data Sheet 2: Habitat Suitability and Threat Survey
District:_______________VDC:
_______________
Protected Area:
_______________
Community Forest:
__________________
Grid No.:___ Sub-Grid No.: ___Transect No.:
___
QuadratType:-
Sign/Non-Sign
GPS Coordinates:
N__________E__________
Elevation
(m):.____
Distance to (m) Water Sources: _______ Goth: _______ Other Physical Infrastructures: _______
Num-
ber ofLogs: ___
Tree Stumps:
___
Looped
trees: ___
Snag
trees:
___
Livestock dropping:
___
Wildlife drop-
ping: ___Poaching Sign: ___
S.N. Tree Species Height (m) dBH Canopy Cover
S.N. Other Vegetations Height (m) Number Cover
Shrubs
Bamboo
Herbs
0% / 0-25% / 26-50% / 51-75% / 76-100%
Threat/Disturbance Factors Impact Scale* Remarks
Absence Low Medium High Extremely High
Forest Fire
Rural Road/Trekking trail
Cattle trail
Landslide
Settlement
Solid waste
Bamboo Die off
*Impact Scale: Absence = 0; Low = 0-25%; Medium = 26-50%; High = 51-75%; Extremely High = 76-100%
Surveyors:
Team Leader: ___________________________________
Assistants:
1. ___________________________________
2. ___________________________________Date:

21
Data Sheet 3: Red Panda Sign Monitoring
District: _______________ VDC: _______________ Community Forest:
_______________________________________________
Grid No.: ______ Transect No.: ______
S.N. Types of Sign Number of
Pellets in
Dropping
Piles
Dropping/Foot
Print (mm)
Geographic
Location
Eleva-
tion
(m)
Substrate
(Ground/
Rock/Tree/
Log)
Tree
Species
Direct
Sighting/
Number
Indirect
(Dropping
Piles/
Feeding
sign/Foot
Print/
Scratch
Mark/
Body
Parts)/
Number
Length Diam-
eter/
Width
N E Remarks
Other Wildlife
S.N. Name of
Wildlife
Types of Sign Number Geographic
Location
Eleva-
tion
(m)
Remarks
Direct
Sighting
Indirect Signs (Drop-
ping/ Feeding sign/
Foot Print/Scratch
Mark/Body Parts)/
Calls)
N E
Name of Monitors:
1. ___________________________________ 2. _______________________________________________
Date:

22
Data Sheet 4: Vegetation and Threat Monitoring
District:_______________ VDC: ____________ Community Forest: _______________
Grid No.:___ Transect No.: ___ GPS Coordinates:
N__________E__________
Elevation (m):.____
Distance to (m) Water Sources:
_______
Goth:
_______
Other Physical Infrastructures: _______
Number of Logs: ___ Tree Stumps: ___ Looped trees:
___
Snag Trees: ___
Wildlife Dropping: ___ Livestock
dropping:
___
Poaching Sign:
___
S.N. Tree Species Height (m) dBH Canopy Cover
0% / 0-25% / 26-50% / 51-75% / 76-100%
S.N. Other Vegetations Height (m) Number Cover
Shrubs
0% / 0-25% / 26-50% / 51-75% / 76-100%
Bamboo
0% / 0-25% / 26-50% / 51-75% / 76-100%
Herbs
<0% / 0-25% / 26-50% / 51-75% / 76-100%
Threat/Disturbance Factors Impact Scale* Remarks
Absence Low Medium High Extremely High
Forest Fire
Rural Road/Trekking trail
Cattle trail
Landslide
Settlement
Solid waste
Bamboo Die off
*Impact Scale: Absence = 0; Low = 0-25%; Medium = 26-50%; High = 51-75%; Extremely High = 76-100%
Name of Forest Guardians: - 1. ____________________________ 2.____________________________
Date:

23
Data Sheet 5: Monitoring Data Analysis (Red Panda status)
District:_______________ VDC: _______________ Community Forest: ________________________________________
Grid No.: ____ Total Transect Length: _________km
Transect
Number
(C1)
Number of No. of dropping piles Number of signs on substrates Name of Tree
Species with
highest sign
(Specify the
number of
signs) (C11)
Direct
Sight-
ing
(C2)
Indirect
Signs (C3)
L=<35mm &
D=<17mm (C4)
L=>35mm &
D=>17mm (C5)
Ground
(C6)
Rock
(C7)
Tree
(C8)
Log
(C9)
1
2
3
4
5
6
Total
Abundance: Total Indirect Signs (C3)/Total Transect length
Abundance of dropping piles of Cub: Total no. of dropping piles (C4)/Total Transect length
Abundance of dropping piles of Adult: Total no. of dropping piles (C5)/Total Transect Length
Preferred substrate: Substrate with Highest Total number of four types (C6, C7, C8 and C9)
Preferred Tree species: Name of tree with the highest sign
Other Wildlife
Grid No. ____________
S.N. Name of Wildlife Number of Remarks
Direct Sighting Indirect Signs
Total

24
Data Sheet 6: Monitoring Data Analysis (Habitat suitability)
District: __________________ VDC: __________________ CF: ________________________________________
Grid No.: __________
Quadrat Number
(C1)
Number of Wildlife
Dropping Piles (C2)
Cover Bamboo
Trees (C3) Shrubs (C4) Herbs (C5) Height (C6) Number (C7) Cover (C8)
1
2
3
4
5
Total
Density of wildlife droppings (no/ha) = Total of C3/314.28*no. of quadrats) X 10000
Cover of Trees = Total of C3/No. of quadrats
Cover of Shrubs = Total of C4/No. of quadrats
Cover of Herbs = Total of C5/No. of quadrats
Bamboo
Average Height (m) = Total of C6/Total of C7
Density (culm/m2) = Total of C7/28.26*No. of quadrats
Cover = Total of C8/No. of quadrats
Datasheet 7: Disturbance and Threat Monitoring
District: _______________ VDC: _______________ CF: ____________________________
Grid No.: ______
Threat/Disturbance Factors Impact Value Total Value
Q1
Q2
Q3
Q4
Q5
Forest Fire
Rural Road/Trekking trail
Cattle trail
Landslide
Settlement
Solid waste
Bamboo Die off
Number
Poaching Sign
Logs
Tree Stump
Looped Tree
Livestock dropping

25
*Replace Impact Scale with following values
0 with 0
0-25% with 1
26-50% with 2
51-75% with 3
76-100% with 4
Poaching Sign (no/ha): ( (Total number of poaching sign/(314.28*no. of quadrats)) X 10000
Logs (no/ha): ((Total number of logs/(314.28*no. of quadrats)) X 10000
Tree Stump (no/ha): ((Total number of tree stumps/(314.28*no. of quadrats)) X 10000
Looped Tree (no/ha): ((Total number of looped trees/(314.28*no. of quadrats)) X 10000
Livestock dropping (no/ha): ((Total number of livestock drooping piles/(314.28*no. of quadrats)) X 10000
Key for analysis
Threat/Disturbance Factors Acceptance Level Description
Forest Fire 1
Total value beyond this limit demands for
further intervention
Rural Road/Trekking trail 1
Cattle trail 1
Landslide 1
Settlement 1
Solid waste 1
Bamboo Die off 1
Logs 1
Tree Stump 0
Looped Tree 0
Livestock dropping 0
Poaching Sign 0

26
Annex 2: Individual identification through photographs
Facial features and its descriptions
Features Photographic representation
1. Muzzle tip (Area between eyes and nose)
2. Nose bridge (Area just above nose)
3. Crown (Area just above eyes)
4. Tear drop (Area running down the eyes)
Nose Bridge
− It may be Pointed downwards
− It may be Pointed upwards
− It may be elongated
− It may be blur
− It may be indistinguishable
− It may be shapeless
Tear drop:
− It may be Thin
− It may be Broad
− It may be Curved
− It may be Straight
− It may be indistinguishable
− It may be shapeless
Muzzle tip:
− Triangular,
− Square
− Trapezoid
− Any other shape
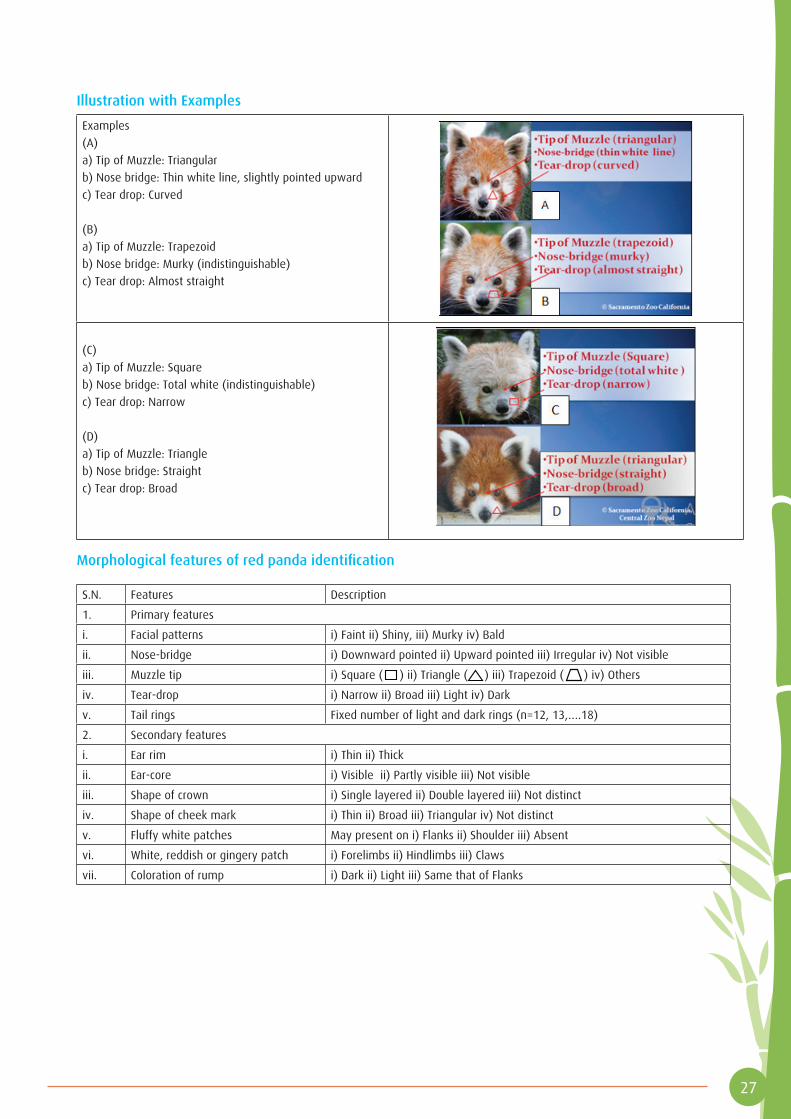
27
Illustration with Examples
Examples
(A)
a) Tip of Muzzle: Triangular
b) Nose bridge: Thin white line, slightly pointed upward
c) Tear drop: Curved
(B)
a) Tip of Muzzle: Trapezoid
b) Nose bridge: Murky (indistinguishable)
c) Tear drop: Almost straight
(C)
a) Tip of Muzzle: Square
b) Nose bridge: Total white (indistinguishable)
c) Tear drop: Narrow
(D)
a) Tip of Muzzle: Triangle
b) Nose bridge: Straight
c) Tear drop: Broad
Morphological features of red panda identification
S.N. Features Description
1. Primary features
i. Facial patterns i) Faint ii) Shiny, iii) Murky iv) Bald
ii. Nose-bridge i) Downward pointed ii) Upward pointed iii) Irregular iv) Not visible
iii. Muzzle tip i) Square ( ) ii) Triangle ( ) iii) Trapezoid ( ) iv) Others
iv. Tear-drop i) Narrow ii) Broad iii) Light iv) Dark
v. Tail rings Fixed number of light and dark rings (n=12, 13,….18)
2. Secondary features
i. Ear rim i) Thin ii) Thick
ii. Ear-core i) Visible ii) Partly visible iii) Not visible
iii. Shape of crown i) Single layered ii) Double layered iii) Not distinct
iv. Shape of cheek mark i) Thin ii) Broad iii) Triangular iv) Not distinct
v. Fluffy white patches May present on i) Flanks ii) Shoulder iii) Absent
vi. White, reddish or gingery patch i) Forelimbs ii) Hindlimbs iii) Claws
vii. Coloration of rump i) Dark ii) Light iii) Same that of Flanks

28
Facial patterns of red panda
Pattern Features Pictorial representation
Faint Thin cheek mark with single layered crown
Shiny Cheek mark is broader and shiny
Murky Cheek mark is triangular and other marks clearly invisible
Bald White pelage coloration starting above the forehead, goes upto the muzzle,
extends beyond the nose-bridge to the side of the face and tear-drops, and
cheek marks indistinct
To identify an individual at least three key features are required different from those of previously identified red pandas.
Primary and secondary feature that should be examined:
1) Primary features
- Facial pattern
- Nose-bridge
- Muzzle tip
- Tear-drop
- Tail rings
2) Secondary features
- Ear rim
- Ear core
- Shape of crown
- Shape of cheek mark
- Fluffy white patches
- Whitish, reddish or gingery patches on limbs and claws
- Different coloration of rump
In addition to these primary and secondary morphological features there could be some other features which may be useful in
identification of individual red panda: e.g., broken tail, incomplete external ear pattern, scars etc.

29

30
Government of NepalMinistry of Forests and Soil Conservation
Singha Durbar, Kathmandu, NepalTel: +977-1- 4211567, 4211936
Fax: +977-1-4223868Website: www.mfsc.gov.np