
Patient Record Management System Report
115
PATIENTS RECORDS MANAGEMENT SYSTEM A CASE STUDY OF EMMANUEL MEDICAL CENTRE By OCHAN KALUNGI JIMMY FEB/2011/BIT/B8182/DAY Supervisor Ms. Namara Asiimwe Department of CIT A Research Report Submitted in Partial Fulfillment of the Requirements for the Award of Bachelor Degree in Information Technology of Nkumba University May, 2014. 1
Transcript of Patient Record Management System Report

PATIENTS RECORDS MANAGEMENT
SYSTEM
A CASE STUDY OF EMMANUEL MEDICAL
CENTRE
By
OCHAN KALUNGI JIMMY
FEB/2011/BIT/B8182/DAY
Supervisor
Ms. Namara Asiimwe
Department of CIT
A Research Report Submitted in Partial Fulfillment of the
Requirements for the Award of Bachelor Degree in
Information Technology of Nkumba University
May, 2014.1

DeclarationI do hereby declare that this report is my original work and has
never been submitted for any award of a degree in any institution
of higher learning.
NAME INDEX NO REG-NOOCHAN KALUNGI JIMMY FEB/2011/BIT/
B8182/DAYI060
i

ApprovalI certify that this project is the original work of the above
named student and has been done under my supervision. The work
has never been submitted for any award of a degree in any
institution of higher learning.
ii

Signed:………………………………… Date:……………………………….
Supervisor
Ms. Namara Asiimwe
iii

DedicationI dedicate this report to my parents, guardians and my supervisor
and all those who have supported me in my research and findings.
May the Almighty God bless you.
iv

AcknowledgmentI am grateful to several people for the support and guidance they
accorded me.
Special thanks go to Ms. Namara Asiimwe my supervisor for
enabling me to realize the importance of time management and for
her continued guidance throughout the course of the project.
To the mentors, thank you for the advice and support.
I was lucky enough to work with a group of enthusiastic and
communicative people: to my colleagues and the lecturers, thank
you for being cooperative and helpful.
I would like to thank my parents for the encouragement, love and
financial support they gave me. Most importantly, we thank the
Almighty God for keeping me strong and healthy and enabling me to
complete our course.
v

Contents
Declaration
iiApproval
iiDedication
iiiAcknowledgment
iiiTable of contents vList of Tables v
vi

List of Figures
viList of Appendices
viiiList of Abbreviations
ixAbstract xCHAPTER 1 1Introduction 11.0 Introduction 11.1 Background 11.2 Problem Statement 11.3 Objectives 21.3.1 Main Objective 21.3.2 Specific Objectives 21.4 Scope 21.5 The importance of the problem 21.6 Beneficiaries 3
CHAPTER 2 4
vii
Literature Review 42.0 Introduction 42.1 Description of the current system 42.2 Patients Records Management System 52.2.1 The need for a Patients Records Management System 52.2.2 Features of a Patients Records Management System 62.3 Related systems (existing systems) 72.3.1 Patient Management Software 72.3.2 Chronic Patient’s Management. 72.4 Types of Record Management System 82.4.1 Conclusion 9CHAPTER 3 9Methodology 93.1 Study Analysis 93.2 Literature review.........................................103.3 Requirements gathering
113.3.1 System study
113.3.2 Interviews
113.3.3 Questionnaires
113.4 System Design
viii

123.5 Software Implementation
123.5.1 Server
123.6 Testing and Validation of the interfaces
13CHAPTER 4
14System Analysis and Design
144.1 Introduction
144.2 System Study
144.3 Table of findings
144.4 Weaknesses of the current system
194.5 Proposed Improvements
19
ix

4.6 Functionalities of the proposed Patients Records Management system........................................................204.7.1 User Requirements
204.7.2 Functional Requirements
214.7.3 Non-functional Requirements
214.7.4 System Requirements
214.8 Design Modeling
224.8.1 Context diagram for Patients Records Management System
244.8.2 DFDs for Patient’s Records Management System
254.8.3 Level 1 DFD
264.8.3 Data dictionary describing Level 1 DFD on figure 2
274.9 Data Modeling
x

274.9.1 Logical Data Modeling
284.9.2 Modeling relationships between entities
294.9.3 Entity Relationship Diagram for Patients Records Management System
314.9.4 Physical Database Design................................324.9.5 Pseudo Codes for Patients Records Management System
35CHAPTER 5
38Presentation of Results
385.1 Number of patients attended to by a doctor
385.2 What Management owes a Doctor
39References
40
xi

Appendices
41CHAPTER 6
506.1 FINDINGS.................................................506.2 CONCLUSIONS..............................................746.3 RECCOMMENDATIONS.........................................756.4 FUTURE WORK..............................................75
List of Tables
TABLE 1: SHOWING TYPES OF RECORDS MANAGEMENT SYSTEM.....................8
TABLE 2: TABLE SHOWING QUESTIONNAIRES FOR DOCTORS.....................16
TABLE 3: TABLE SHOWING QUESTIONNAIRES FOR MANAGEMENT...................17
TABLE 4: TABLE SHOWING QUESTIONNAIRES FOR PATIENTS....................18
TABLE 5: A DESCRIPTION OF HARDWARE REQUIREMENT.......................21
TABLE 6: A DESCRIPTION OF SOFTWARE REQUIREMENTS.......................21
TABLE 7: A DATA DICTIONARY FOR DATA FLOWS...........................24
TABLE 8: A DATA DICTIONARY FOR DATA STORES...........................25
TABLE 9: A DESCRIPTION OF ENTITIES AND THEIR ATTRIBUTES................26
TABLE 10: A DESCRIPTION OF ENTITY DOCTORS...........................29
TABLE 11: A DESCRIPTION OF ENTITY MANAGEMENT_STAFF....................29
TABLE 12: A DESCRIPTION OF ENTITY PATIENTSRECORDS.....................30
TABLE 13: A DESCRIPTION OF ENTITY PRESCRIPTION.......................30
TABLE 14: A DESCRIPTION OF ENTITY SYSTEMS_ADMINISTRATOR................31
Table 15: Table showing time frame............................37
xii

List of FiguresFIGURE 4.1: CONTEXT DIAGRAM FOR PATIENTS RECORDS MANAGEMENT SYSTEM......23
FIGURE 4.2: LEVEL 1 DATA FLOW DIAGRAM FOR THE PATIENT’S RECORDS MANAGEMENT
SYSTEM......................................................24
FIGURE 4.3: ENTITY RELATIONAL DIAGRAM FOR PATIENTS RECORDS MANAGEMENT
SYSTEM......................................................28
FIGURE 4.4 : PIE CHART 1: SHOWING THE AGE OF DOCTORS OR NURSES.........45
FIGURE 4.6 : PIE CHART 3: SHOWING THE LEVEL OF EDUCATION OF DOCTORS OR
NURSES.......................................................46
FIGURE 4.7 : PIE CHART 4: SHOWING THE SYSTEM DOCTORS USE FOR PRESCRIPTION.
...........................................................47
FIGURE 4.8 : PIE CHART 5: SHOWING THE CHECKING OF PRESCRIPTION.........48
FIGURE 4.9 : PIE CHART 6: SHOWING THE CURRENT SYSTEM’S PATIENTS RECORD
KEEPING .....................................................48
xiii

FIGURE 4.10 : PIE CHART 7: SHOWING THE TRACKING OF THE PATIENTS RECORDS .49
FIGURE 4.11 : PIE CHART 8 : SHOWING THE CURRENT SYSTEM’S MEANS OF
COMMUNICATION ................................................50
FIGURE 4.12 : PIE CHART 9 : SHOWING THE CURRENT SYSTEM’S SAVING OF PATIENTS
INFORMATION...................................................50
FIGURE 4.13 : PIE CHART 10: SHOWING THE CURRENT SYSTEM’S RETRIEVAL OF
PATIENTS INFORMATION ..........................................51
FIGURE 4.14 : PIE CHART 11 : SHOWING THE CURRENT SYSTEM’S CONTRIBUTION TO
RESEARCH AND ACADEMIA .........................................52
FIGURE 4.15 : PIE CHART 12 : SHOWING THE CURRENT SYSTEM’S ACCESSIBILITY OF
PATIENTS INFORMATION ..........................................53
FIGURE 4.16 : PIE CHART 13 : SHOWING THE CURRENT SYSTEM’S SHARING OF
PATIENTS INFORMATION ..........................................53
FIGURE 4.17 : PIE CHART 14 : SHOWING THE RATE OF SERVICE DELIVERY OF
DOCTORS OR NURSES.............................................54
FIGURE 4.18 : PIE CHART 15 : SHOWING CURRENT SYSTEM’S GENERATION OF REPORTS
...........................................................54
FIGURE 4.19 : PIE CHART 16: SHOWING THE CURRENT SYSTEM ON HAVING MULTIPLE
FILES OF PATIENTS.............................................55
FIGURE 4.20 : PIE CHART 17 : SHOWING THE ABILITY OF THE CURRENT SYSTEM
EXPERIENCING DISASTERS..........................................56
FIGURE 4.21: PIE CHART 18 : SHOWING THE CREATION OF NEW SYSTEM TO REDUCE ON
ADMINSTRATIVE COSTS............................................56
FIGURE 4.22 : PIE CHART 19 : SHOWING THE DESIRE OF DOCTORS OR NURSES TO
HAVE AN AUTOMATED PATIENTS RECORDS MANAGEMENT SYSTEM.................57
xiv

FIGURE 4.23 : PIE CHART 20 : SHOWING THE AGE OF THE ADMINSTRATORS IN
MANAGEMENT...................................................58
FIGURE 4.24 : PIE CHART 21: SHOWING THE GENDER OF THE ADMINSTRATORS IN THE
MANAGEMENT ..................................................58
FIGURE 4.25 : PIE CHART 22 : SHOWING THE CONTRIBUTION OF THE CURRENT SYSTEM
TO RESEARCH AND ACADEMIA........................................59
FIGURE 4.26 : PIE CHART 23 : SHOWING THE CURRENT SYSTEM’S MEANS OF
COMMUNICATION AMONG THE MANAGEMENT................................60
FIGURE 4.27 : PIE CHART 24 : SHOWING THE CURRENT SYSTEM’S SHARING OF
INFORMATION AMONG MANAGEMENT.....................................60
FIGURE 4.28 : PIE CHART 25 : SHOWING THE CURRENT SYSTEM’S ABILITY TO
GENERATE REPORTS..............................................61
FIGURE 4.29 : PIE CHART 26 : SHOWING WHETHER THE CURRENT SYSTEM CAN
EXPERIENCE DISASTERS...........................................61
FIGURE 4.30 : PIE CHART 27 : SHOWING THE CREATION OF NEW SYSTEM TO REDUCE
ON ADMINSTRATIVE COSTS.........................................62
FIGURE 4.31 : PIE CHART 28 : SHOWING THE CURRENT SYSTEM ABILITY TO HELP IN
PLANNING ....................................................63
FIGURE 4.32 : PIE CHART 29 : SHOWING THE AGE OF THE PATIENTS.........64
FIGURE 4.33 : PIE CHART 30: SHOWING THE GENDER OF THE PATIENTS.........64
Figure 4.34 : Pie chart 31 : showing the system doctors use for
presription ...............................................65
xv

List of Appendices
APPENDIX I: BUDGET ESTIMATES......................................36
APPENDIX II: TIME FRAME..........................................37
xvi

List of Abbreviations
DB- Database
DBMS- Database Management System
DFD- Data Flow Diagrams
ERD- Entity Relational Diagram
HTTP- Hypertext Mark-up Language
MySQL- My Structured Query Languages
PHP- Hypertext Pre-Processor
xvii

AbstractWith the highly improving technology today, the Patients Record
Management System was a vital system to cope up with rapid
growing technology. It’s considered as the only means of moving
from manual system of recording patient’s information to another
new system where the whole process is automated. Considering
management of patient’s information manually a lot of challenges
were met. Issues like fire outbreaks, misplacements of patient’s
information, time wasting in search for this files, the whole
process of accessing the files. Eliminating this delays and
improving accessibility of the patients information were most
important considering the fact that the system aimed at reducing
time spent on searching for patient’s files. This system could be
accessed by the authorized users say the medical personnel of a
given health unit.
xviii

To come up with this system, user and system requirements were
elicited and analyzed to determine functional and non-functional
requirements of the proposed system. This design was thus
implemented and tested to come up with a functional system. This
system enables quality of service in terms of medical attention
given by enabling doctors and management to be able to view the
rate of common diseases and their percentages.
Management is also able to know the number of patients a
doctor has attended to within a particular specified period of
time. This makes it easier for management to view and know how
much a doctor is supposed to be paid at the end of the month.
xix

CHAPTER
ONE
Introduction
Patients Records Management System is a fully-fledged system
which is aimed at enabling Emmanuel Medical Centre to keep track
of all the patients’ records and be accessed with ease. This
helped to improve ways in which services were rendered to
patients by increasing efficiency. Emmanuel Medical Center has
three clinics (general clinic, dental clinic and eye clinic) and
services offered include Reproductive Health, Pharmacy, Emergency
Services, X-Ray and Ultra Sound Services, Physiotherapy Services,
Laboratory Services, Ward Services. The developed system enhanced
quality and efficiency delivery of the above services due to the
ease at which the records were accessed.
1.0 Background
Emmanuel Medical Centre is one of the largest public Medical
Centre in Entebbe which provides medical services to people in
Entebbe, staff of and private patients.
The number of patients to be served has dramatically increased
leading to a slow delivery of services. There is a possibility of
the patients being given wrong drugs prescriptions due to fatigue
caused by a lot of writing by doctors and nurses trying to reduce
the queues.
1

1.1 Problem Statement
The problem Emmanuel Medical Centre facing is using the manual
process to provide health services, use of cards, files to track
records of continuing patients and set up records for new
patients in the hospital. This process has many inconsistencies
and inconveniences like patients losing their health cards or
their files being misplaced. Therefore an automated system helps
to keep track of patient’s records and medical bills making it
easy to determine the state of new and continuing patients. This
system enhances quality of service in terms of medical attention
given by enabling doctors and management to be able to view the
rate of common diseases and their percentages. Management is also
able to know the number of patients a doctor has attended to
within a particular specified period of time. This makes it
easier for management to view and know how much a doctor is
supposed to be paid at the end of the month.
1.2 Objectives of the study
1.3.1 Main Objective of the study
To design a Patients Records Management System that enables
Emmanuel Medical Centre keep track of their patient’s records,
doctors and management to be able to view the rate of common
diseases and their percentages, management to know the number of
patients a doctor has attended to within a particular specified
period of time thus making it easier for management to view and
2

know how much a doctor is supposed to be paid at the end of the
month.
1.3.2 Specific Objectives
A. To design a user friendly system that will capture, store
and retrieve the stores records.
B. To design a database and its application that will generate
reports concerning the evolution of the store.
C. To develop a secured store system which can access storage
with a huge amount of data.
3

1.4 Scope
The study focuses on designing a Patients Records Management
System that was used by Emmanuel Medical Centre in keeping track
of their patient’s records.
1.4.1 Context diagram for Patients Records Management System
This figure shows how the major entities in the system that is
medical personnel, management and system administrator’s
interaction with the main system.
Figure 4.1: Context diagram for Patients Records Management System
4

1.4 The significance of the study
Many patients end up spending a lot of time when being diagnosed
because the original diagnosis and treatment notes cannot be
retrieved, so with the development of the proposed system this
problem is solved since the system is able to manage the
patient’s details.
Another serious issue is over prescription, where patients are
continued on a prescription that is not effective and yet this
can have access to the patient records. So with the development
of this system, the patient’s details will be followed by the
doctor to prescribe better or effective prescriptions.
1.5 Beneficiaries
The developed system is beneficial to medical officers and
researchers in patient record management systems.
Patients (Students)
The system will ease on the burden of carrying the medical cards
which can easily be misplaced by the patients or students
Doctors and Nurses
The system will help Doctors and Nurses to give proper
prescriptions to the patients considering the previous
prescriptions given to them and avoids the making of mistakes
made due to lack of documents to show the previous prescriptions
given.
5

Management
Help in record keeping for overall operations to improve on the
service delivery.
CHAPTER 2
STUDY
LITERATURE
2.0 Introduction
This chapter covers how the current process was carried out and
findings that is reviewed from different sources such as eBooks,
online journals, newspapers, magazines and the internet. It shows
brief on what other studies worked on and how their system works.
The chapter presents various systems used by hospitals to
automate the process. Various literatures from various studies on
the types of hospital management systems they operated their
advantages, how they manage and how effective it brings the
organization in use. Literature review published information in a
particular subject area, and sometimes information in a
particular subject within a certain period of time.
2.1 Description of the current system
Accessing patient’s files and records at Emmanuel Medical Centre
is manually in all the departments, making it very labor
6

intensive and ineffective. This process involves very large
amounts of data, thus consuming a lot of time. The cause of data
retrieval, loss of information results since the nurse or the
person involve in data search dealt with very many files for
different years. This was actually cumbersome and extremely
hectic. This trend was good to be dealt out with for better
services to the patients in hospitals. This process had so many
inconsistencies and inconveniences like patients losing their
health cards or their files being misplaced. Therefore an
automated system helps to keep track of patient’s records and
medical bills making it easy to determine the state of new and
continuing patients.
The following are some of the reasons why the manual
files storage should not be used in the hospital.
The current process of attending to patients has a number of
problems including the following:
7

1. High possibility of losing patients previous records and files
due to misplacement, disasters occurrences like fit breaks.
2. It is time wasting e.g. in terms of capturing, analyzing and
verifying details about patients, scheduling and making of their
appointments.
3. It faced a possibility of many human error caused by doctors
in their prescription due to fatigue.
4. It is expensive due to high administrative costs incurred in
terms of high stationary costs, printing patient’s cards, data
entry and capture, data analysis and cleaning for storage
purposes.
Emmanuel Medical Centre was able to efficiently store and keeps
track of their patient’s records; the system provides an easy
mechanism for doctors and nurses to retrieve the prescription
they had earlier written so as to avoid making wrong
prescriptions. The management was able to budget and improve the
service delivery of the hospital. The project produces a Patients
Records Management System that enabled Emmanuel Medical Centre
keeps track of their patient’s records.
2.2 Patients Records Management System
This is an automated system that keeps track of all patients’
details and enables easy access, retrieval and storage of the
patient’s information. The management was able to budget and
improve the service delivery of the hospital.
8

2.2.1 The need for a Patients Records Management System
A need according to Encarta Dictionaries is defined as a pressing
requirement of something essential in order to have success or
achieve a goal, Encarta Dictionaries, 2008. The proposed Patients
Records Management System was dramatically and by a large extent
helped Emmanuel Medical Centre improve on the quality of services
offered to its patients. The hospital is able to efficiently
store and keep track of their patient’s record that is the system
provided an easy mechanism for doctors and nurses to retrieve the
prescription they had earlier written so as to avoid making wrong
prescriptions and the management to easily budget for hospital.
The project produced a Patients Records Management System that
enabled Emmanuel Medical Centre keeps track of their patient’s
records.
2.2.2 Features of a Patients Records Management System
According to Entreon, Warken aan warrken, 2009 “A system that has
various intuitive features will make it more convenient to the
users in an organizations”.
These features include:
Easy usability
Usability is the degree to which a given product or system
assists the person using it to accomplish a task.
Reliability
A measure of consistency or stability.
Programming logic
9

Programming logic consists of one server program, scripts that
are used to validate data, perform calculations or navigate the
patients through the Patient’s Information Management system.
According to Introduction to Programming logic (2009).
Database
A database is a shared collection of logically related data and
a description of this data designed to meet the needs of an
organization. Connolly & Begg (2004). The database could be a
set of flat files and/or database tables. The structure of the
database was designed to facilitate data access and/or updates by
both the medical personnel and the server.
Secure user-login and management interface
The system is to ensure security and integrity of information
captured by enhancing restricted login and rights to respective
entity given according to regulations and policies of Emmanuel
Medical Centre
2.3 Related systems (existing systems)
2.3.1 Patient Management Software
Patient Management Software (PMS) is software that is regulated
as a medical device. It is software that is used to acquire
medical information from a medical device to be used in the
treatment or diagnosis of a patient. It was also used as software
that is an adjunct to a medical device and directly contributed
to the treatment of the patient by performing analysis, or
providing treatment or diagnosis functionality that replaced the
10

decision and judgment of a physician. This is being used in
Canada.
The system was implemented to run on a desktop setting or from a
server where multiple accesses can be done. The system utilizes
QR codes to confirm payments and also record patient diagnosis
results that made using this system highly sophisticated tool for
storing and retrieving patient’s details. According to De Toledo
P, et al (2000). A telemedicine system to support a new model for
care of chronically ill patients.
The implementation of a Patients Records Management System came
up with a system that will enable Emmanuel Medical Centre and
other hospitals keep track of their patient’s records, doctors
and management to be able to view the rate of common diseases and
their percentages, management to know the number of patients a
doctor has attended to within a particular specified period of
time thus making it easier for management to view and know how
much a doctor is supposed to be paid at the end of the month.
2.3.2 Chronic Patient’s Management.
The system was developed to support the Chronic Disease
Management Model consists of two main elements:
1. A virtual and ubiquitous cooperative working space, a
continuum of care space, to coordinate at any time and place all
professionals of the multidisciplinary care team (primary care
personnel, specialists based at different hospitals. All of them
procuring common targets centered on the patient, with predefined
11
and consensual care plans and making use of tools to optimize all
available resources and tasks efficiency
2. A multi-access system to allow the patient or the professional
to access any service available adapted to his/her better
convenience and needs, including telemonitoring services if
required by the patient. According to Pauwels RA, Buist AS, et al
(2003)
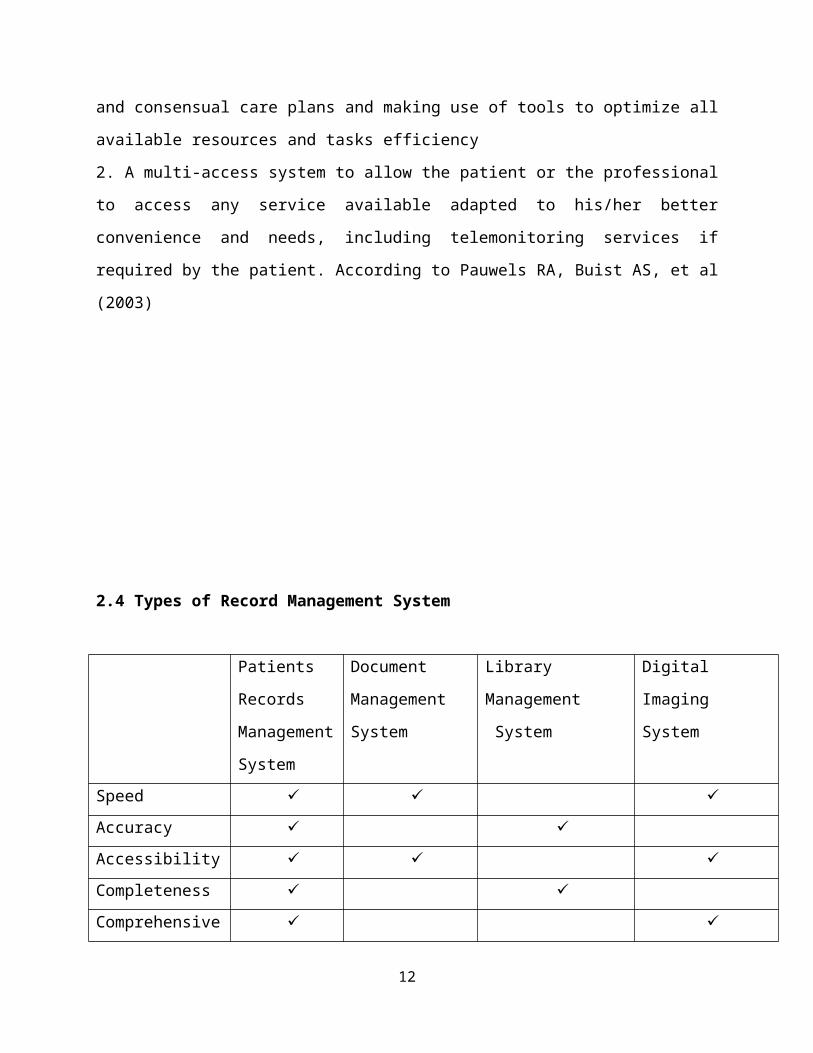
2.4 Types of Record Management System
Patients
Records
Management
System
Document
Management
System
Library
Management
System
Digital
Imaging
System
Speed
Accuracy
Accessibility
Completeness
Comprehensive
12

nessCompliance
Effectiveness
Security
Authenticity
Table 1: showing types of records management system used in
different organizations
A number of record management systems above were reviewed
according to various system requirements and Patients Records
Management System was adopted.
.
CHAPTER
THREE
Research Methodology
3.1 Introduction
Chapter three majorly focuses on the various basic methodologies
for the research project the study analysis that is carried out,
the key elements of the system design methods to be used. The
13

main goal is to implement a research project that would be used
by Emmanuel Medical Centre.
3.2 Requirements gathering
3.1.1 System studyObjective (a) of obtaining the requirements for designing a Patients
Records Management System, a system study and analysis for
Emmanuel Medical Centre are carried out.
3.2.1 Interviews
An interview is a conversation between two or more people (the
interviewer and the interviewee) in a context where the questions
are asked by the interviewer to obtain information from the
interviewee. The free dictionary, 2007 Interviews was conducted
with the help of a number of groups using the current
technologies for example Emmanuel Medical Centre and staff.
Interviews are used because:
They help to document personalities of prospective users of
Emmanuel Medical Centre Management and staff that are both
technical and operational.
They assist to expand our understanding of the hospital
operations thus the researcher is in a better position to
collect requirements.
3.1.1 Questionnaires
A Questionnaire is a form containing a set of questions addressed to a statistically significant number of subjects as a way of gathering information for a survey.The free dictionary, (2007).
14

Questions were used to capture raw data from individuals whowere patients, nurses, doctors, management, students and anyother relevant group that provided the information.
Questionnaires are used to capture raw data from individuals
in the shortest time possible. They contained direct
questions designed to strategically attain data on
particular fields.
The questionnaire method of data collection has the
following advantages:
Questionnaires are familiar to most people since nearly
everyone has some experience in completing questionnaires.
Questionnaires reduce bias since there is a uniform question
presentation. The researchers’ opinions is not influenced
the respondent to answer questions in a certain manner thus
offers great anonymity.
Questionnaires are easy to analyze using SPSS and Excel thus
coming up with a comprehensive report of the findings.
3.4 System Design
Objective (b) of systems analysis and design of the proposed Patients
Records Management System was achieved by designing a database
using conceptual, logical and physical database a design.
These were developed using tools such as Microsoft Visio. Project
management tools such as Microsoft project professional are used
15

to present the time schedules for the system development
procedures, task dissemination and ordering
3.5 Software Implementation
Objective (c) of software implementation of the proposed Patients
Records Management System was achieved by use of a client-server
model architecture which involves having a main server that
provided information to other workstations/computers, which are
known as the clients that accessed it through the internet. The
server runs a server-side program that is accessed by client
programs through the internet.
3.5.1 Server
Essentially the server is a computer with server software
installed and running, connected to a network .The server is
networked to connect it with other machines by connecting it to
the clients. The system included a server side application. The
following applications were used to implement the server side
application.
(i) PHP
16

The researcher used visual studio due to the advantages that fall
under the programming languages. Visual studio languages enhance
the need to expand a program where features of the objects in the
program can be added independently without reorganizing the
system.
(ii) Databases
The system has a database on which the rest of the application is
based. The researcher used VB for the Patients Record management
database application.
(iii) Client interface
The user-facing element in a Client Server application provides
the means to interact with it. The interface takes the form of a
web application, connecting and interfacing with the database.
The client interface's role overall is to sending a request to
the server, which responds in return. The researcher developed
the interface using VB on windows operating system platform.
3.6 Testing and Validation of the interfaces
Objective (d) of testing and validation of the proposed Patients
Records Management System is achieved by unit and integration
testing of the developed system. The researcher fed in test data
in the required fields in system and upon execution checked if
the system realized the expected output. This helped the
researcher to know whether the functionality of the system had
been achieved and check for errors. The validation is done
through an experiment in an actual computer where the system is
17

deployed in a few computers and actual users are able to interact
with the system and provided feedback.
Appendices
Appendix I: Budget Estimates
Item quantity rate
Amount
Stationery
Sub-total
200.000/=
Sub-total
200.000/=
This budget includes a feasibility study, mapping out the field
as well as organizing and carrying out interviews.
Secretarial Services
Word processing (typing) and printing
50.000/=
Photocopying 20.000/=
Data analysis 200.000/=
Binding books 3 10.000@ 30.000/=
Sub- total 300.000/=
Grand total 500.000/=
18

Appendix II: Time Frame
Activities Month1. Writing and submission of
research proposal
2. Collection of data
3. Data analysis
4. Writing research report
February
2012
March
2012
March 2012
April
2012
19

5. Submitting research report May 2012
CHAPTER 4
System Analysis and Design
4.1 IntroductionThis chapter focuses on system analysis, determining of
requirements that is; user, functional and non-functional
requirements and system design among others.
4.2 System StudyDuring the system study the researcher used various mechanisms to
come up with the findings and fully understood end user
20

requirements. They were identified by using questionnaires,
interviewing and observing end users. During the system study, it
was discovered that here was a high occurrence of prescription
mistakes to patients due to lack of reference mechanisms that are
supposed to help the doctors. Requirements were categorized into
three mainly user requirements, functional requirements and non-
functional requirements.
4.3 Table of findings
QUESTIONAIRE FOR DOCTORS/ NURSES
The table shows analyzed data of the questionnaires from doctors.
QUESTION ANSWER SCORE
Age 25 and below 325-35 335-45 045 and above 0
50%
50%
0%
0%
Gender
Male 4Female 2
67%
33%
Level of
educationCertificate 2
21

Diploma 1Degree 3Masters 0Phd 0
33%
17%
50%
0%
System doctors
use for
prescription
manual system 6Automated system 0
100%
0%
Checking
prescription Yes 3No 3
50%
50%
System keep all
patients
records
Yes 4No 2
67%
33%
Track the
patients
records
very fast 0Fast 0Fair 0Slow 5very slow 1
0%
0%
0%
83%
17%
Means of
communicationYes 5No 1
83%
17%
Save patients
informationManually 6Automated system 0
100%
22

0%
Retrieve
patients
information
very fast 0Fast 0fairly fast 0Slow 5very slow 1
0%
0%
0%
83%
17%
Contribute to
researchYes 4No 2
67%
33%
Access patients
informationvery fast 0Fast 0fairly fast 4Slow 1very slow 1
0%
0%
67%
16%
17%
Share patients
information very fast 0Fast 0fairly fast 0Slow 4very slow 2
0%
0%
0%
67%
33%
Rate your Excellent 0 0%
23

service
deliveryGood 0Fair 4Poor 2
0%
67%
33%
Quickly
generate
reports
Yes 1no 5
17%
83%
Patients to
have multiple
files
Yes 2No 4
33%
67%
Experience
disasters Yes 4No 2
67%
33%
Reduce on
administrative
costs
Yes 5no 1
83%
17%
Patients
records
management
system
Yes 5No 1
83%
17%
Table 2: Table showing questionnaires for doctors
QUESTIONAIRE FOR MANAGEMENT
24

The table shows analyzed data of the questionnaires from hospital
management.
QUESTION ANSWER SCOREAge 25 and below 0
25-35 035-45 245 and above 4
0%
0%
33%
67%Gender Male 2
Female 433%
67%Contribution of
the current
system
Yes 4No 2
67%
33%
Means of
communicationYes 4No 2
67%
33%Sharing of
information among
management
very fast 0Fast 0Fairly fast 0Slow 4very slow 2
0%
0%
0%
67%
33%Generate reports Yes 4
No 267%
33%Experience
disastersYes 4No 2
67%
33%Reduce on
administrative
costs
Yes 4No 2
67%
33%
Current system Yes 2 33%
25

help you plan
efficiently No 4 67%
Table 3: Table showing questionnaires for management
QUESTIONAIRE FOR PATIENTS
The table shows analyzed data of the questionnaires from various
patients.
QUESTION ANSWER SCORE
Age 25 and below 425-35 235-45 045 and above 0
67%
33%
0%
0%
Gender Male 3Female 3
50%
50%
System doctors
use for
prescription
manual system 6Automated system 0
100%
0%
Table 4: Table showing questionnaires for patients
26

4.4 Weaknesses of the current system It was realized that the current system does not allow
doctors to view previous prescriptions pertaining made
pertaining the disease thus prone to making mistakes due to
fatigue.
The current system does not enable doctors to record and
store patient’s information in an organized way for easy
retrieval.
It was noted that prescriptions are given to patients who in
the long run goes away with them thus a challenge in
retaining similar information for future reference.
Retrieval of needed information by doctors or management was
not enhanced in the current system.
There was no information sharing and dissemination by
medical staff in the current system that will enhance easy
identification of new symptoms and prescriptions
4.5 Proposed Improvements
Doctors and management be able to view the rate of common
diseases and their percentages.
Management to be able to know the number of patients a
doctor has attended to within a particular specified period
of time thus making it easier for management to view and
27

know how much a doctor is supposed to be paid at the end of
the month.
4.6 Functionalities of the proposed Patients Records Management
system
The system enables doctors to record and store patient’s
information in an organized way for easy retrieval.
The system stores patients’ information that is recorded for
future reference.
The system enables doctors or nurses to give prescriptions
to patients and store all the prescriptions given.
The system enables doctors or nurses to check and view
previous prescriptions to avoid mistakes.
The system enhances retrieval of needed information by
doctors or management.
The system enables information sharing and dissemination by
medical staff for easy identification of new symptoms and
prescriptions.
4.7.1 User RequirementsUsers are the people who will interact with the system in one way
or the other. Potential
Users of the system are the medical personnel, system
administrators, administrators and organizations that many need
to do further data processing with the system data. The different
user requirements are described below:
28

a) Medical personnel
The system should enable doctors to record and store
patient’s information in an organized way for easy
retrieval.
View the prescriptions that were previously given to the
patient’s before prescribing for them new drugs
Medical personnel will also be able to know the number of
patients that have been entered or registered by the system
and their full information concerning their previous
diagnosis.
b) System Administrators
Ensure proper functionality of the system by ensuring a high
uptime is maintained for easy operation ability.
c) Management
The system enhances management to generate end process
reports easily.
4.7.2 Functional Requirements The system should be able to respond to searches by the
medical personnel or even other users of the system.
The System should be able to summarize the reports to the
administrators about what is happening on daily basis or
after every minute.
29

Administrative Interface should allow for proper
interpretation of data through the use of graphs and
reports.
4.7.3 Non-functional Requirements System must ensure right format is followed while
interacting with the system and only valid date should be
sent to the system.
The system should use more informative error messages to
help the user understand what to do next.
For the administrative interface, only administrators can
add or remove other administrators but there should be at
least one administrator of the system.
The system should allow future expansion and modification.
.
4.7.4 System RequirementsThis section describes the hardware and software requirements of
the system.
Table 5: A description of Hardware Requirement
Hardware Minimum Specifications
30

Server - Random Access Memory(RAM): 512 MB or
higher
- Processor Speed: 1.3 GHz and above
- Hard Disk Space: 10GB
- 1 year uptimeSystem Unit - Processor: Pentium III and above
- Memory: 512 MB of RAM or higher
- Hard Drive space-10 GBMonitor display -1024 × 768 High color-16 bit Recommended
Table 6: A description of Software requirements
Software SpecificationsOperating System - Windows 7, Windows 2000,
Windows NT, Windows XP and
Windows Server 2005 Enterprise
EditionDatabase MySQL
Server Apache
4.8 Design ModelingRepresentation of the system was done by use of a Data Flow
Diagram. This describes the design that includes: the structure,
31

behavior, and interaction of the different components in the
system, the context diagram and the architecture of the system. KEYSYMBOLS
Symbo
l
Description
External
entity
It is outside the context of the system
and can be any class of people,
organization or another system.
Its function is to supply or receive
data. It is the originator or receiver
of information outside the scope of the
system portrayed in the data flowing.
Data flow It shows the movement of data and is a
pipeline carrying data through the
system. These show the movement of data
between processes, external entities,
and data stores in a DFD
32

Process This portrays the transformation of
input data flows to output data flows in
DFDs. Incoming data flows are processed
or transformed into outgoing data flows.
Data store A temporary /time delayed repository
that processes can add data to/or
retrieve data from.
Data Report Shows reports generated after an action
performed
4.8.1 Context diagram for Patients Records Management System This figure shows how the major entities in the system that is
medical personnel, management and system administrators’
interaction with the main system.
33

Figure 4.1: Context diagram for Patients Records Management System
4.8.2 DFDs for Patient’s Records Management System
DFDs were used to establish system functions. It was broken down
from the context diagram onward into a Level 0 and 1 DFDs through
a technique called Leveling. Leveling is the decomposition from a
Context Diagram to a much detailed representation in this case,
levels 0 and 1.
34
External entities: Medical personnel, management, System
administrators.
Process: Patients Records Management System
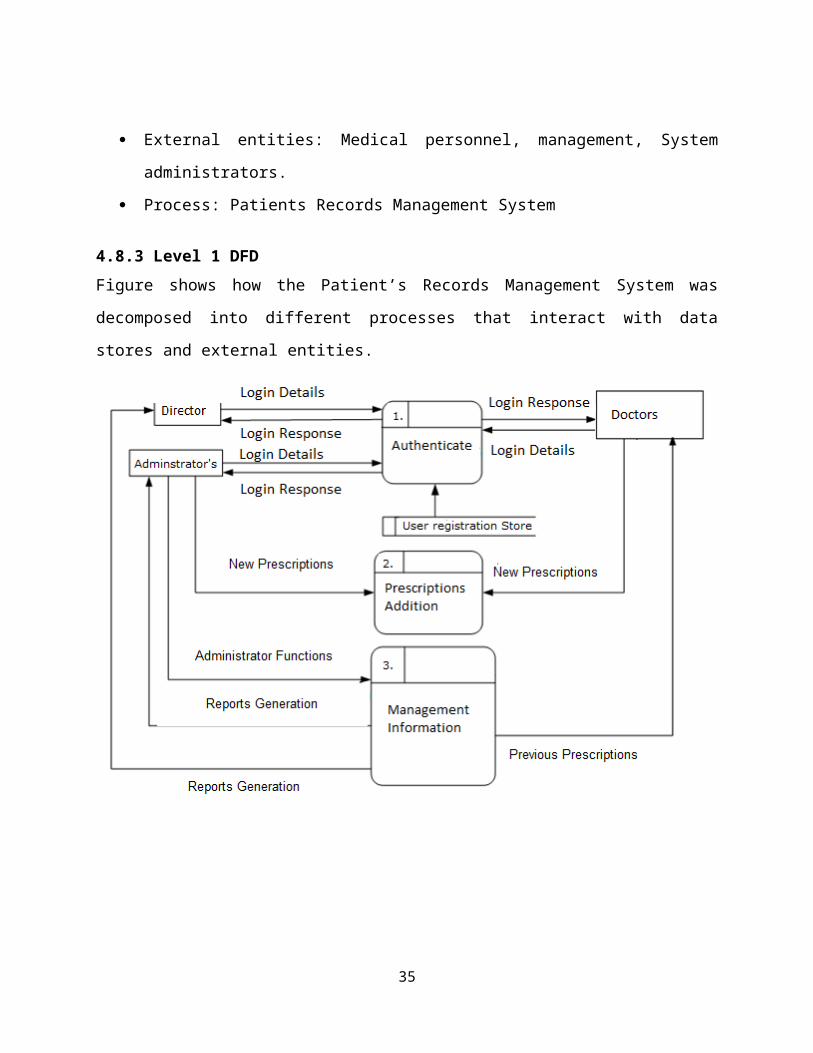
4.8.3 Level 1 DFDFigure shows how the Patient’s Records Management System was
decomposed into different processes that interact with data
stores and external entities.
35

Figure 4.2: Level 1 Data Flow Diagram for the Patient’s Records
Management System
4.8.3 Data dictionary describing Level 1 DFD on figure 2
Table 7: A data dictionary for data flows
Data flow name DescriptionPatient’s information Refers to the information users send to
the system to either register with the
system or ask for the services from the
system.Registration of
patients
Patients are registered by the medical
personnel in the systemLogin details The user of the system enters the
required login details by the systemViews reports The medical personnel, management and
system administrators are able to view
reports as requestedAdd, view , delete,
update
When the system administrator wants to
make changes as required Generates Report When management or any other user of the
system is need of some information
concerning the patients, a report is
generated.Prescription of drugs Refers to prescribing of drugs to the
patients
36

Table 8: A data dictionary for data stores
Data store name DescriptionPatient’ s registration
store
Stores the registered details or
information about the patientsUser registration store Stores user registration information.
E.g. medical personnel and the system
administratorsPatient’s Prescription Store the prescriptions of the patients.
4.9 Data ModelingData modeling is the analysis of data objects that are used in a
business or other context and identification of the relationships
among these data objects.
4.9.1 Logical Data ModelingEntity name Description Attributes
1 systems_adminis
trator
After login he can change password
or username. Add/remove users.
Add services like
Add/update patients
View reports
Patients information
Other users information
AdminId
Usertype
Password
Username
2 prescription Prescriptions given to customers
including the previous ones
PrescriptionId
PrescriptionGive
37

n
AdditionalInform
ation
DateOfPrescripti
on
AmountPaid
PatientsId
3 patientsrecords Shows all the patients
information
PatientsId
PhysicalAddress
LastName
Age
Gender
Contact
FirstName
4 management_staf
f
Stores the information of the
management staff as well as their
customers.
StaffId
FirstName
LastName
38

Gender
Usertype
Department
Designation
5 doctors Shows and stores the doctors
details
DoctorsId
FirstName
LastName
Gender
DoctorsQualifica
tions
PrescriptionGive
n
PatientsId
Department
Table 9: A description of entities and their
attributes
4.9.2 Modeling relationships between entities
has reports
39
Systemadministrator
Managementstaff

1:*
1:*
A system administrator can report to one or many management
staffs while a one management staff can view one or many reports
from the system administrator. Hence the cardinality of this
relationship is a 1: M
Treats
1:* 1:*
A patient is treated by one or many doctors while a doctor can
treat one or many patients cardinality of this relationship is a
1: M
Employs
1:*
1:*
A system administrator is employed by one or many management
staffs and management staff can employ one or many system. Hence
the cardinality of this relationship is a 1: M
40
Patient Doctor
Managementstaff
Systemadministrator

Employs
1:*
1:*
Management staff can employ one or many doctors while one doctor
can be employed by one or many management staffs. Hence the
cardinality of this relationship is a 1: M
Prescribe
s
1:1
1:*
One doctor prescribes drugs for one or many patients while one
patient can be prescribed drugs by one and only one doctor. Hence
the cardinality of this relationship is a 1: M.
4.9.3 Entity Relationship Diagram for Patients Records ManagementSystemThe diagram below describes in detail the entities involved and
the relationships between these entities
41
Managementstaff Doctors
Doctors Patient

Figure 4.3: Entity Relational Diagram for Patients Records
Management System
4.9.4 Physical Database Design
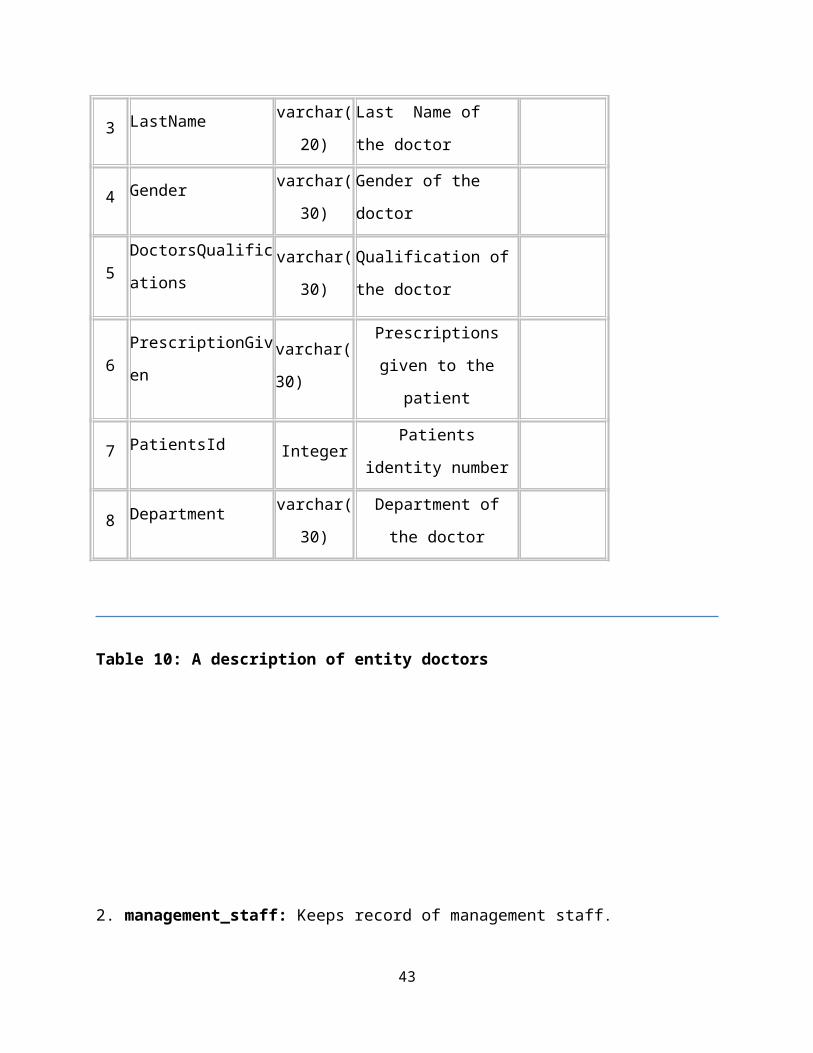
1. Doctors: Keeps record of doctors.
S.n
oField name
Data
typeDescription
Constrai
nts
1 DoctorsId IntegerDoctor’s
identity number
Primary
key
2 FirstName varchar(
20)
First Name of
the doctor
42
3 LastName varchar(
20)
Last Name of
the doctor
4 Gender varchar(
30)
Gender of the
doctor
5DoctorsQualific
ationsvarchar(
30)
Qualification of
the doctor
6PrescriptionGiv
envarchar(
30)
Prescriptions
given to the
patient
7 PatientsId IntegerPatients
identity number
8 Department varchar(
30)
Department of
the doctor
Table 10: A description of entity doctors
2. management_staff: Keeps record of management staff.
43

S.n
oField name
Data
typeDescription
Constrai
nts
1 StaffId IntegerStaff identity
number
Primary
key
2 FirstName Integer Staff’s first name
2 LastName varchar(
20)Staff’s last name
3 Gender varchar(
20)
Gender of
management staff
4 Usertype Real Type of the user
5 Department Date Department neme
6 Designation time(7) Designation name
Table 11: A description of entity management_staff
3. Patientsrecords: keeps records of patients.
S.n
oField name
Data
typeDescription
Constrai
nts
1 PatientsId IntegerPatients identity
number
Primary
key
44

2PhysicalAdd
ressVarchar(
30)
Physical address of
the patient
3 LastName Varchar(
30)
Last name of the
patient
4Age Varchar(
20) Age of the patient
5Gender Varchar(
20)
Gender of the
patient
6 Contact Varchar(
30)
Contact information
of the patient
7FirstName Varchar(
30)
First name of the
patient
Table 12: A description of entity Patientsrecords
4. prescription: prescriptiondetails.
S.n
oField name
Data
typeDescription
Constrai
nts
1 PrescriptionId IntegerPrescriptions identity
number
Primary
key
2PrescriptionGiv
envarchar(
20)
Prescriptions given to the
patient
3AdditionalInfor
mationvarchar(
20)
More information about the
patient
45

4
DateOfPrescript
ion DateDate a patient is
prescribed drugs
5 AmountPaid varchar(
20)
The amount of money paid by
the patient
6PatientsId varchar(
20)Patients identity number
Foreign
key
Table 13: A description of entity prescription.
systems_administrator Details.
S.n
o
Field
name
Data
typeDescription
Constrai
nts
1 AdminId IntegerStaff identity
number
Primary
key
2 Usertype varchar(
20)Administator
user type
2 Password varchar(
20)Administartor
password
3 Username varchar(
20)Administartor
username
46

Table 14: A description of entity systems_administrator
4.9.5 Pseudo Codes for Patients Records Management SystemPseudo code for authentication login.
If (user type=Admin && $Username = $_POST ['Username'] &&
$Password = $_POST ['Password'];)
{
URL = "Admin_page.php";
}
Else if (user type=Management && $Username = $_POST ['Username']
&& $Password = $_POST ['Password'] ;)
{
URL = "Management_page.php";
}
Else if (user_type=Doctor && $Username = $_POST ['Username']
&& $Password = $_POST ['Password'] ;)
{
URL = "Doctors_page.php";
}
Pseudo code for management functions.
47

If (user_type=Management ;)
{
Search, view prescriptions, doctors information and
patients information;
View number of patients a doctor has
attended to;
View how much management owes a doctor at
the end of the month;
View rate of common diseases &
percentages;
}
Pseudo code for administrator functions.
If (user_type=Admin ;)
{
Add, edit, view, search, prescriptions, doctors
information and patients;
Add, edit, and view new users;
Calculate how much management owes a
doctor at the end of the month;
48

View rate of common diseases &
percentages;
}
Pseudo code for doctor’s functions.
If (user type=Doctor ;)
{
Enter patient’s information;
View patient’s information;
Make new prescription;
Search prescription;
View prescriptions;
}
49

CHAPTER 5
Presentation of Results
5.1 Number of patients attended to by a doctorThis information displays the number of patients a doctor has
attended to on a given particular day. This information is used
to calculate the amount of money a doctor is supposed to receive
at the end of the month.
50

5.2 What Management owes a Doctor
This information displays the amount management owes a doctor at
the end of a month depending on the number of patients attended
to.
How the calculation is done;
The maximum patients a doctor can attend to in a normal working
day are forty (40).
A doctor is entitled to a certain amount per each patient
attended to. Any extra patient on top of 40 is taken as overtime.
Total pay = 40 patients * pay per patient + overtime (All extra
patients * pay per patient * 1.5)
Using example demonstrated:
Basic pay: 40 * 200,000 = Ugx 8,000,000/=
Overtime: 10 * 200,000 * 1.5 = Ugx 3,000,000/=
Total pay= 8,000,000 + 3,000,000 = Ugx 11,000,000/=
51

AppendicesAppendix I: Budget Estimates
Item quantity rate
Amount
Stationery
Sub-total
200.000/=
Sub-total
200.000/=
This budget includes a feasibility study, mapping out the field
as well as organizing and carrying out interviews.
52

Secretarial Services
Word processing (typing) and printing
50.000/=
Photocopying 20.000/=
Data analysis 200.000/=
Binding books 3 10.000@ 30.000/=
Sub- total 300.000/=
Grand total 500.000/=
Appendix II: Time Frame
Activities Month
6. Writing and submission of
research proposal
February
2014
53

7. Collection of data
8. Data analysis
9. Writing research report
10. Submitting research report
March
2014
March 2014
April
2014
May 2014
54

Appendix III:Screen shots
Administrator’s Login Panel
55

Login fail page
56
Doctors’Login panel
57

Homepage
Doctor’s view
58

59

Management Staff Login Panel
60

Front Desk panel
61

Enter new patients form
62

CHAPTER 6
6.0 IntroductionThis chapter consists of results and findings of the system model
developed, the recommendations and conclusion of the research
carried out by our group.
6.1 FINDINGSDuring system testing and validation, we asked users a number of
questions to find out whether the current system meets their
requirements. The analyzed questions which were given to doctors
or nurses , management and patients include the following :
QUESTIONAIRE FOR DOCTORS/ NURSES
AGE25 and below 325-35 335-45 045 and above 0
63

Figure 4.4 : Pie chart 1: showing the Age of doctors or nurses.
50% of the doctor or nurses are of age of 25 and below , 50% of the
doctors or nurses are of age 50% .
GenderMale 4Female 2
64

Figure 4.5 : Pie chart 2 : showing the gender of the doctors or
nurses.
67% of the doctors or nurses are male and 33% of the doctors or nurses
are female
Level of educationCertificate 2Diploma 1Degree 3Masters 0Phd 0
65
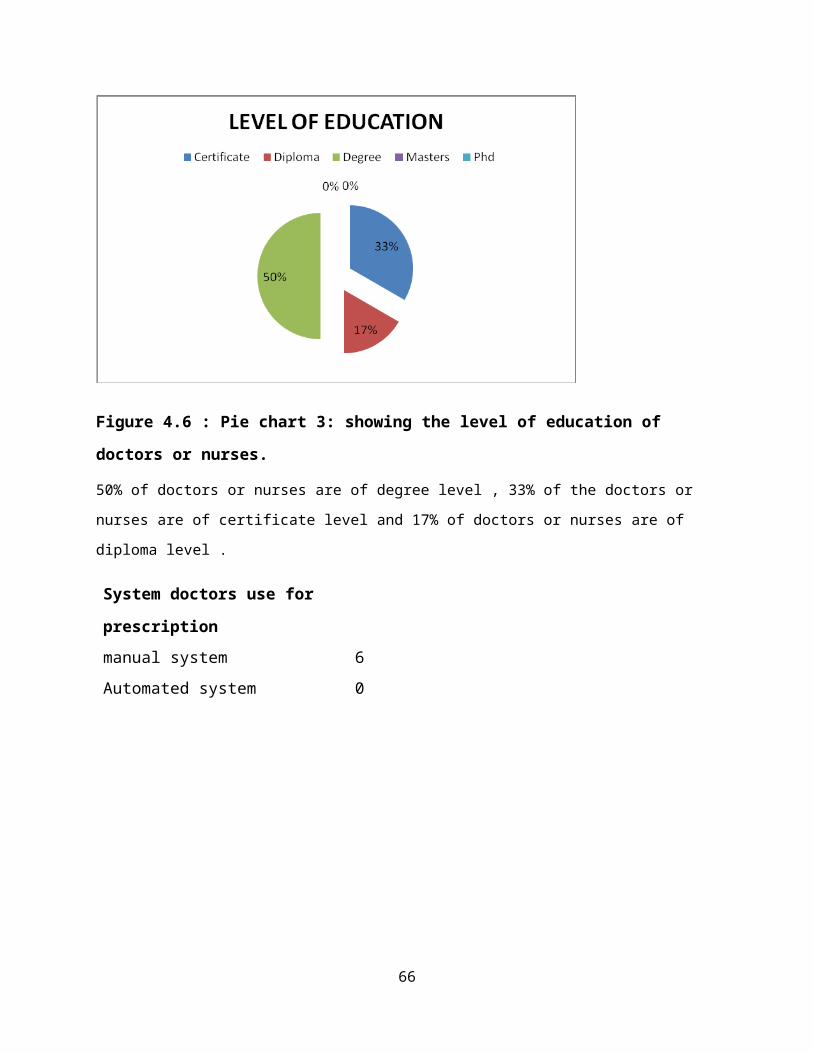
Figure 4.6 : Pie chart 3: showing the level of education of
doctors or nurses.
50% of doctors or nurses are of degree level , 33% of the doctors or
nurses are of certificate level and 17% of doctors or nurses are of
diploma level .
System doctors use for
prescriptionmanual system 6Automated system 0
66

Figure 4.7 : Pie chart 4: showing the system doctors use for
prescription.
All doctors use the manual system for prescription with the 100%
Checking
PrescriptionYes 3No 3
67

Figure 4.8 : Pie chart 5: showing the checking of prescription.
50% of the doctors or nurses say current system can check for
prescription and 50% of the doctors or nurses say current system
cannot check for prescription.
system keep all
patients recordsYes 4No 2
68

Figure 4.9 : Pie chart 6: showing the current system’s patients
record keeping .
67% of the doctors or nurses say the current system can keep all
patients records and 33% of the doctors or nurses say the current
system cannot keep all patients records
track the patients
recordsvery fast 0fast 0fair 0slow 5very slow 1
69

Figure 4.10 : Pie chart 7: showing the tracking of the patients
records .
83% of the doctors or nurses say the current system is slow in
tracking the patients records and 17% of the doctors or nurses say the
current system is very slow in tracking the patients records
means of
communicationYes 5No 1
70

Figure 4.11 : Pie chart 8 : showing the current system’s means of
communication .
83% of the doctors or nurses say there is a means of
communication and 17% of the doctors or nurses say there is no
means of communication
save patients informationManually 6Automated system 0
71

Figure 4.12 : Pie chart 9 : showing the current
system’s saving of patients information.
All of the doctors or nurses say the current
system can save patients information manually
retrieve patients
informationvery fast 0Fast 0fairly fast 0Slow 5very slow 1
72

Figure 4.13 : Pie chart 10: showing the current
system’s retrieval of patients information .
83% of the doctors or nurses say the current
system retrieves patients information slowly and
17% of the doctors or nurses say the current
system retrieves patients information very slowly
contribute to
researchYes 4No 2
73

Figure 4.14 : Pie chart 11 : showing the current
system’s contribution to research and academia .
67% of the doctors or nurses say the current
system contributes to research and 33% of the
doctors or nurses say the current system does not
contribute to research
Access patients
informationvery fast 0Fast 0fairly fast 4Slow 1very slow 1
74

Figure 4.15 : ie chart 12 : showing the current
system’s accessibility of patients information .
67% of the doctors or nurses say the current
system can access patients information fairly fast
, 17% of the doctors or nurses say the current
system can access patients information slowly and
16% of the doctors or nurses say the current
system can access patients information very slowly
share patients
informationvery fast 0Fast 0fairly fast 0Slow 4very slow 2
75

Figure 4.16 : Pie chart 13 : showing the current
system’s sharing of patients information .
67% of the doctors or nurses say the current system
can share patients information slowly and 33% of the
doctors or nurses say the current system can share
patients information very slowly
rate your service
deliveryExcellent 0Good 0Fair 4Poor 2
76

Figure 4.17 : Pie chart 14 : showing the rate of
service delivery of doctors or nurses.
67% of the doctors or nurses say rate of service
delivery is fair and 33% of the doctors or nurses
say rate of service delivery is poor
quickly generate
reportsYes 1no 5
77

Figure 4.18 : Pie chart 15 : showing current
system’s generation of reports .
83% of the doctors or nurses say the current
system does not quickly generate reports and 17%
of the doctors or nurses say the current system
quickly generates reports
patients to have
multiple filesYes 2No 4
78

Figure 4.19 : Pie chart 16: showing the current
system on having multiple files of patients.
67% of the doctors or nurses say the current
system does not have multiple files about patients
and 33% of the doctors or nurses say the current
system does have multiple files about patients
experience
disastersYes 4No 2
79

Figure 4.20 : Pie chart 17 : showing the ability
of the current system experiencing disasters.
67% of the doctors or nurses say the current
system does not experience disasters and 33% of
the doctors or nurses say the current system can
experience disasters
reduce on
adminstrative costsYes 5no 1
80

Figure 4.21: Pie chart 18 : showing the creation
of new system to reduce on adminstrative costs.
83% of the doctors or nurses say the current
system needs to reduce on administrative costs and
33% of the doctors or nurses say the current
system can not reduce on administrative costs
patients records
mgt systemYes 5No 1
81

Figure 4.22 : Pie chart 19 : showing the desire of
doctors or nurses to have an automated patients
records management system.
83% of the doctors or nurses say there is need to
create an automated patients records management
system and 17% of the doctors or nurses say there
is no need to create an automated patients records
management system
QUESTIONAIRE FOR MANAGEMENT
AGE25 and below 025-35 035-45 245 and above 4
82

Figure 4.23 : Pie chart 20 : showing the age of the adminstrators
in management.
67% are of age between 45 and above, 33% are of age between 35-45 and
0% for those of age 25-35 and 25 and below.
GenderMale 2Female 4
83

Figure 4.24 : Pie chart 21: showing the gender of the
adminstrators in the management .
33% of the management are males and 67% of the management are females.
Contribution of the
current systemYes 4No 2
84

Figure 4.25 : Pie chart 22 : showing the contribution of the
current system to research and academia.
67% of the management say that the current system contributes to
research and academia and 33% of the management say that the current
system does not contribute to research and academia.
means of communicationYes 4No 2
85

Figure 4.26 : Pie chart 23 : showing the current system’s means
of communication among the management.
67% of the management say that the current system enables
communication between doctors and management while 33% of the
management say the current system does not enable the communication.
very fast 0Fast 0Fairly fast 0Slow 4very slow 2
86

Figure 4.27 : Pie chart 24 : showing the current system’s sharing
of information among management.
67% of the management say the sharing of information amongst them is
slow and 33% of the management say the sharing of information amongst
them is very slow .
Generate reportsYes 4No 2
87

Figure 4.28 : Pie chart 25 : showing the current system’s ability
to generate reports.
67% of the management say the current system can generate reports
about patients and 33% of the management say the current system cannot
generate reports.
experience disastersYes 4No 2
88

Figure 4.29 : Pie chart 26 : showing whether the
current system can experience disasters.
67% of the management say the current system can
experience disasters and 33% of the management say the
current system cannot experience disasters.
reduce on administrative
costsYes 4No 2
89

Figure 4.30 : Pie chart 27 : showing the creation
of new system to reduce on adminstrative costs.
67% of the management say the current system can
reduce on administrative costs and 33% of the
management say the current system doesnot reduce
on administrative costs.
current system help you
plan efficientlyYes 2No 4
90

Figure 4.31 : Pie chart 28 : showing the current
system ability to help in planning .
67% of the management say that the current system
helps in planning efficiently and 33% of the
management say that the current system does not
help in planning.
QUESTIONAIRE FOR PATIENTS
AGE25 and below 425-35 235-45 045 and above 0
91

Figure 4.32 : Pie chart 29 : showing the age of the patients.
67% of the patients are of age 25 and below , 33% of the patients are
of age between 25-35 and 0% for both 35-45 and 45 and above.
GenderMale 3Female 3
92

Figure 4.33 : Pie chart 30: showing the gender of the patients.
There is 50% for both the males and females.
System doctors use for
prescriptionmanual system 6Automated system 0
93

Figure 4.34 : Pie chart 31 : showing the system doctors use for
presription .
The manual system is used by doctors for prescription that is it
has 100%.
6.2 CONCLUSIONS
This project is of great importance to management of any hospital
as a means of keeping track of activities, budgeting for the
hospital and determining the quality of services given to their
patients. Due to time limitations however, the scope of the
project was limited to Makerere University Hospital. But with
expected success of the project, it is expected to spread to the
rest of the regions in Uganda.
6.3 RECCOMMENDATIONS
Data collected from this system can be used for a number of
statistical purposes and help in the inspection of the quality of
service provided by other hospitals. This data can also be useful
to the hospital management through getting some form of
feedback about their work from the system’s perspective.
6.4 FUTURE WORKFurther research is required in order to come up with a more advanced
system that can check the health of the patient without help from any
medical personnel , prescribe medicine for him or her and advice him
94

or her on the diet he or she should have in order to have an immune
and well protected health. This will lead to the reduction of getting
preventable diseases like malaria, bacteria infections, six killer
diseases.
95