Pathways to Conflict - VU Research Portal
330
VU Research Portal Pathways to Peace - Pathways to Conflict Bretthauer, J.M. 2014 document version Publisher's PDF, also known as Version of record Link to publication in VU Research Portal citation for published version (APA) Bretthauer, J. M. (2014). Pathways to Peace - Pathways to Conflict: A Qualitative Comparative Analysis of Social, Economic and Political Conditions in Situations of Resource Scarcity. VU University Amsterdam. General rights Copyright and moral rights for the publications made accessible in the public portal are retained by the authors and/or other copyright owners and it is a condition of accessing publications that users recognise and abide by the legal requirements associated with these rights. • Users may download and print one copy of any publication from the public portal for the purpose of private study or research. • You may not further distribute the material or use it for any profit-making activity or commercial gain • You may freely distribute the URL identifying the publication in the public portal ? Take down policy If you believe that this document breaches copyright please contact us providing details, and we will remove access to the work immediately and investigate your claim. E-mail address: [email protected] Download date: 10. Jul. 2022
-
Upload
khangminh22 -
Category
Documents
-
view
1 -
download
0
Transcript of Pathways to Conflict - VU Research Portal
VU Research Portal
Pathways to Peace - Pathways to Conflict
Bretthauer, J.M.
2014
document versionPublisher's PDF, also known as Version of record
Link to publication in VU Research Portal
citation for published version (APA)Bretthauer, J. M. (2014). Pathways to Peace - Pathways to Conflict: A Qualitative Comparative Analysis ofSocial, Economic and Political Conditions in Situations of Resource Scarcity. VU University Amsterdam.
General rightsCopyright and moral rights for the publications made accessible in the public portal are retained by the authors and/or other copyright ownersand it is a condition of accessing publications that users recognise and abide by the legal requirements associated with these rights.
• Users may download and print one copy of any publication from the public portal for the purpose of private study or research. • You may not further distribute the material or use it for any profit-making activity or commercial gain • You may freely distribute the URL identifying the publication in the public portal ?
Take down policyIf you believe that this document breaches copyright please contact us providing details, and we will remove access to the work immediatelyand investigate your claim.
E-mail address:[email protected]
Download date: 10. Jul. 2022
PATHWAYS TO PEACE – PATHWAYS TO CONFLICT
A QUALITATIVE COMPARATIVE ANALYSIS OF SOCIAL, ECONOMIC AND
POLITICAL CONDITIONS IN SITUATIONS OF RESOURCE SCARCITY
Reading committee
prof. dr. H. Buhaug
prof. dr. A. J. Dietz
prof. dr. C. Q. Schneider
dr. M. Spierenburg
prof. Dr. C. Van Kersbergen
Judith M. Bretthauer, 2014
ISBN 978-94-6203-626-0
All rights reserved. Save exceptions stated by law no part of this publication may be
reproduced, stored in retrieval system of any nature, or transmitted in any form by any
means, electronic, mechanical, photocopying, recording or otherwise, included a complete or
partial transcription, without the prior written consent of the proprietor.
Cover design and photography by Judith M. Bretthauer
Printed by CPI – Wöhrmann Printservices B.V.
VRIJE UNIVERSITEIT
PATHWAYS TO PEACE – PATHWAYS TO CONFLICT
A QUALITATIVE COMPARATIVE ANALYSIS OF SOCIAL, ECONOMIC AND POLITICAL CONDITIONS IN SITUATIONS OF
RESOURCE SCARCITY
ACADEMISCH PROEFSCHRIFT
ter verkrijging van de graad Doctor aan
de Vrije Universiteit Amsterdam,
op gezag van de rector magnificus
prof.dr. F.A. van der Duyn Schouten,
in het openbaar te verdedigen
ten overstaan van de promotiecommissie
van de Faculteit der Sociale Wetenschappen
op donderdag 4 september 2014 om 11.45 uur
in de aula van de universiteit,
De Boelelaan 1105
door
Judith Magdalena Bretthauer
geboren te Regensburg, Duitsland

promotoren: prof.dr. H.W. Overbeek
prof.dr. F.H.B. Biermann
prof.dr. B. Vis
A c k n o w l e d g e m e n t s v
ACKNOWLEDGEMENTS
After four years of working on a PhD, there are many, many people who have earned my
gratitude:
My supervisors: Kees van Kersbergen for believing in the project in its early stages, Henk
Overbeek for being the only one of my supervisors to see the project through from beginning
to end, for reading all the drafts and for supporting me in finding my own way to do research,
Frank Biermann for his helpful comments and encouragement and Barbara Vis for her hands-
on advice on anything from methods to sentence structure.
Leonie Heres for all the encouragement and commiseration and over many, many cups of
coffee. How I miss them! Julie Birkholz for her friendship and her advice on living in
Amsterdam. Julie, Rad and Caius for making our neighbourhood a friendlier place and Amanda
, Jon and Aletta for the BBQs in their backyard. We really miss having you around!
My colleagues at VU Department for Political Science and Public Administration for all their
encouragement, practical help (from “how to fix the printer” to “how to run the analysis”),
willingness to read drafts and helpful comments.
The PhDs of the Political Science Department for sharing their experiences of doing a PhD and
for all the fun PhD dinners. Special thanks to Falk and Michal for many interesting (and
distracting) conversations; my roommates, Gijs, Jerome and Ma Yuan, for making the solitary
process of writing more bearable; Nana for all her advice and for sharing her experiences on
combining a PhD and motherhood; Annemarie for encouraging me to speak Dutch and
Trineke for helping out with the Dutch summary of this dissertation.
The PhDs of the VU Faculty of Social Sciences and the PhDs at the NIG courses for many
enjoyable discussions inside and outside of classrooms.
The colleagues at the UvA/VU RISC group for their detailed and helpful comments on my
papers and all the colleagues I met over the years at various conferences asking insightful
questions or making helpful suggestions.
My parents who have believed in my ability to write this thesis with a conviction I never had
and my sisters and my brother who sometimes had their own way of showing their belief in
my abilities (“I have to hand in my sociology term paper tomorrow! Can you fix it?”).
Gunnar for reading my work, having so many intelligent things to say about it and saying them
in such a kind way, enduring my emotional reactions to his feedback and then agreeing to
read yet another chapter. Also for his love, friendship and unwavering enthusiasm for political
discussions.
My thesis baby Amrei, who was born 1.5 years into the process, for reminding me every day
that some things are more important than research.
CONTENT
Acknowledgements ................................................................................................................ v
Tables in the Main Text ......................................................................................................... ix
Tables in the Appendix ........................................................................................................... x
Figures.................................................................................................................................. xiii
Chapter 1: Introduction .................................................................................................... 1
Climate Wars in the Public Debate ......................................................................................... 1
Climate and its Influences on Human Development from a Historic Perspective ................. 3
Climate Change in the Anthropocene .................................................................................... 4
Resource Scarcity as Result of Climate Change ...................................................................... 5
The Academic Puzzle and its Solutions in a Nutshell ............................................................. 6
The Role of the Level of Development ................................................................................... 8
Structure of the Dissertation .................................................................................................. 9
Chapter 2: Climate Change, Resource Scarcity and Armed Conflict: Theoretical Links and
Empirical Evidence.......................................................................................................... 11
Introduction .......................................................................................................................... 11
Security and the Environment .............................................................................................. 11
Climate Change and Armed Conflict .................................................................................... 12
Resource Scarcity and Armed Conflict ................................................................................. 16
Empirical Evidence on the Links Between Resource Scarcity and Violent Conflict .............. 28
Economic, Political and Social Conditions in Resource-Scarce Countries ............................ 34
Conclusion ............................................................................................................................ 41
Chapter 3: Research Design ............................................................................................ 42
Introduction .......................................................................................................................... 42
Configurational Comparative Methods ................................................................................ 42
Selection of Conditions ......................................................................................................... 52
Selection of Cases ................................................................................................................. 57
Conclusion ............................................................................................................................ 76
Chapter 4: Economic Explanations: Development, Dependence and Diversification ......... 77
Introduction .......................................................................................................................... 77
C o n t e n t v i i
Economic Conditions in Linking Resource Scarcity and Armed Conflict .............................. 77
Operationalisation and Calibration of Conditions ................................................................ 84
Analysis ................................................................................................................................. 89
Discussion ........................................................................................................................... 107
Conclusion .......................................................................................................................... 109
Chapter 5: Political Explanations: Dimensions of State Capacity .................................... 111
Introduction ........................................................................................................................ 111
Dimensions of State Weakness .......................................................................................... 111
Operationalisation and Calibration of Conditions .............................................................. 118
Analysis ............................................................................................................................... 122
Discussion ........................................................................................................................... 130
Conclusion .......................................................................................................................... 135
Chapter 6: Social Explanations: Inequality and Adaptive Skills ....................................... 136
Introduction ........................................................................................................................ 136
Inequality in Society ........................................................................................................... 136
Adaptive Skills ..................................................................................................................... 141
Operationalisation and Calibration of Conditions .............................................................. 144
Analysis ............................................................................................................................... 149
Discussion ........................................................................................................................... 161
Conclusion .......................................................................................................................... 164
Chapter 7: Bringing Economic, Political and Social Explanations Together ..................... 165
Introduction ........................................................................................................................ 165
Pathways to Conflict ........................................................................................................... 166
Pathways to Peace .............................................................................................................. 169
The Role of Development ................................................................................................... 173
Development as a Historical Process .................................................................................. 180
Authoritarianism and Resource Abundance ...................................................................... 182
Conclusion .......................................................................................................................... 187
Chapter 8: Conclusion ................................................................................................... 188
Pathways to Peace and Conflict ......................................................................................... 188
Contributions to the Literature .......................................................................................... 191
Conclusion .......................................................................................................................... 196
Bibliography ................................................................................................................. 198
Appendix A: Supplementary Materials for Chapter 2 ..................................................... 238
Overview of Quantitative Studies Linking Resource Scarcity and Violent Conflict ............ 238
Appendix B: Supplementary Materials for Chapter 3 ..................................................... 243
Overview of Qualitative Case Studies and Political, Social and Economic Conditions Included
in Case Studies .................................................................................................................... 243
Overview of Freshwater Indicators .................................................................................... 259
Overview of Conflict Datasets ............................................................................................ 260
Appendix C: Supplementary Materials for Chapter 4 ..................................................... 266
Assumptions for Intermediate Solutions ............................................................................ 266
Raw and Calibrated Data .................................................................................................... 266
Categorisations of Developed and Developing Countries According to Different
International organisations ................................................................................................ 271
Supplementary Materials for Analysis ............................................................................... 272
Appendix D: Supplementary Materials for Chapter 5 .................................................... 282
Assumptions for Intermediate Solutions ............................................................................ 282
Raw and Calibrated Data .................................................................................................... 282
Supplementary Materials for Analysis ............................................................................... 287
Appendix E: Supplementary Materials for Chapter 6 ..................................................... 294
Assumptions for Intermediate Solutions ............................................................................ 294
Raw and Calibrated Data .................................................................................................... 294
Supplementary Materials for Analysis ............................................................................... 301
Appendix F: Supplementary Material for Chapter 7 ....................................................... 307
Supplementary Materials for Analysis ............................................................................... 307
Appendix G: Nederlandse Samenvatting/Dutch Summary: ............................................ 312
C o n t e n t i x
TABLES IN THE MAIN TEXT
Table 3.1. Example of a Truth Table ........................................................................................ 49
Table 3.2. Conditions Included in Empirical Chapters ............................................................. 56
Table 3.3. Case Selection and Excluded Cases ......................................................................... 73
Table 3.4: Resource Scarce Cases with and without Conflicts ................................................ 75
Table 4.1. Intermediate Solution for Conflict Outcome Including Conditions AGR, POV, EXP,
OIL ................................................................................................................................. 92
Table 4.2. Overview of Complex and Parsimonious Solutions Including Conditions EXP, OIL
and Development Conditions ECOD, AGR and POV ..................................................... 94
Table 4.3. Intermediate Solution for Conflict Outcome Including Conditions AGR, EXP, OIL,
DIV ................................................................................................................................ 98
Table 4.4. Complex and Intermediate Solution for a Peace Outcome Including Conditions
ECOD, OIL, EXP and DIV .............................................................................................. 101
Table 4.5. Complex and Intermediate Solution for Peace Outcome Including Conditions AGR,
POV, OIL and EXP ........................................................................................................ 102
Table 4.6. Complex and Intermediate Solution Including Conditions ECOD, AGR, OIL, EXP . 104
Table 4.7. Complex, Intermediate and Parsimonious Solution Including Conditions AGR, DIV,
EXP and Oil .................................................................................................................. 106
Table 4.8. Comparing Conditions for Conflict and Peace Outcomes ..................................... 107
Table 5.1. Complex, Intermediate and Parsimonious Solution for Conflict Outcome Including
Conditions LACC, ROL, AUT, STAB .............................................................................. 123
Table 5.2. Overview of Complex and Parsimonious Solutions Including the Conditions LACC,
ROL, AUT ..................................................................................................................... 126
Table 5.3. Complex and Intermediate Solution for Conflict Outcome Including Conditions
LACC, AUT, ROL, COR .................................................................................................. 127
Table 5.4. Intermediate Solution for Peace Outcome Including LACC, ROL, AUT, COR ........ 128
Table 5.5. Complex and Intermediate Solution for Peace Outcome Including Conditions
LACC, ROL, STAB, COR ................................................................................................ 129
Table 5.6. Comparing Conditions for Conflict and Peace Outcomes ..................................... 131
Table 6.1. Overview of Complex and Most Parsimonious Solutions for Conflict Outcome with
High Consistency and Coverage Rates........................................................................ 153
Table 6.2. Intermediate and Parsimonious Solution for Peace Outcome Including Conditions
EDU, INEQ, TECH, UNEVEN ......................................................................................... 156
Table 6.3. Overview of Complex and Parsimonious Solutions for Peace Outcome Including
Conditions EDU, TECH and UNEVEN ........................................................................... 161
Table 6.4. Comparing Conditions for Conflict and Peace Outcomes ..................................... 161
Table 7.1. Overview of Prevalent Solutions in Chapters 4 to 6 ............................................. 167
Table 7.2. Intermediate Solution for Conflict Outcome Including Conditions UNEVEN, EDU,
AUT, ROL, EXP, OIL, AGR ............................................................................................. 169
Table 7.3. Overview of Prevalent solutions in Chapters 4 to 6 ............................................. 170
Table 7.4. Intermediate Solution for Peace Outcome Including Conditions AGR, POV, OIL,
EXP, ROL, COR, EDU, TECH, UNEVEN .......................................................................... 171
TABLES IN THE APPENDIX
Table A.1. Overview of Quantitative Studies Linking Resource Scarcity and Violent Conflict
.................................................................................................................................... 238
Table B.1. Conditions Included in Case Studies ..................................................................... 244
Table B.2. Overview of Armed Conflict Datasets: Philippines and Burundi .......................... 262
Table B.3. Calibrated Outcome Scores for Conflict and Peace Cases .................................... 265
Table C.1. Assumptions for Intermediate Solutions .............................................................. 266
Table C.2. Raw and Calibrated Data for All Economic Conditions ......................................... 266
Table C.3. Raw and Calibrated Data for all Economic Conditions Continued ....................... 268
Table C.4. Developed and Developing Countries According to Different Categorisations ... 271
Table C.5 Necessary Conditions for a Conflict Outcome ....................................................... 272
Table C.6. Truth Table for Conflict Outcome Including Conditions AGR, POV, EXP, OIL ....... 272
Table C.7. Complex Solution for Conflict Outcome Including Conditions AGR, POV, EXP, OIL
.................................................................................................................................... 273
Table C.8. Parsimonious Solution for a Conflict Outcome Including Conditions AGR, POV, EXP
and OIL ........................................................................................................................ 273
Table C.9. Truth Table for Conflict Outcome Including Conditions AGR, EXP, NR ................ 274
Table C.10. Complex, Intermediate and Parsimonious Solution for Conflict Outcome
Including Conditions AGR, EXP, NR ............................................................................ 274
Table C.11. Overview of Complex and Parsimonious Solutions for a Conflict Outcome
Including Conditions EXP, NR, ECOD, AGR and POV .................................................. 275
Table C.12. Truth Table for Conflict Outcome Including Conditions AGR, EXP, OIL, DIV ...... 275
Table C.13. Complex Solution For Conflict Outcome Including Conditions AGR, EXP, OIL and
DIV .............................................................................................................................. 276
Table C.14. Necessary Conditions for a Peace Outcome ....................................................... 276
Table C.15. Truth Table for Peace Outcome Including Conditions ECOD, OIL, EXP, DIV ....... 277
Table C.16. Parsimonious Solution for Peace Outcome Including Conditions ECOD, OIL, EXP
and DIV ....................................................................................................................... 277
Table C.17. Truth Table for Peace Outcome Including Conditions AGR, POV, OIL, EXP ........ 278
Table C.18. Parsimonious Solution for Peace Outcome Including Conditions AGR, POV, OIL,
EXP .............................................................................................................................. 278
Table C.19. Truth Table for Peace Outcome Including Conditions ECOD, AGR, OIL, EXP...... 279
Table C.20. Parsimonious Solution for Peace Outcome Including Conditions ECOD, AGR, OIL
And EXP ....................................................................................................................... 279
Table C.21. Truth Table for Peace Outcome Including Conditions AGR, DIV, EXP, OIL ......... 280
Table C.22. Complex and Intermediate Solution for Peace Outcome Including Conditions
AGR, DIV, EXP and NR ................................................................................................. 280
C o n t e n t x i
Table C.23. Parsimonious Solution for Peace Outcome Including Conditions AGR, DIV, EXP
and NR ........................................................................................................................ 281
Table D.1. Assumptions in Intermediate Solutions ............................................................... 282
Table D.2. Raw and Calibrated Data for State-Based Conditions .......................................... 282
Table D.3. Raw and Calibrated Data for State-Based Conditions Continued ........................ 284
Table D.4. Necessary Conditions for a Conflict Outcome ...................................................... 287
Table D.5.Truth Table for a Conflict Outcome Including Conditions LACC, ROL, AUT, STAB 287
Table D.6. Overview of Complex and Parsimonious Solution for Conflict Outcome Including
Conditions ROL, AUT, COR .......................................................................................... 288
Table D.7. Truth Table for a Conflict Outcome Including Conditions LACC, ROL, AUT, COR . 288
Table D.8. Parsimonious Solution for Conflict Outcome Including Conditions LACC, ROL, AUT,
COR ............................................................................................................................. 289
Table D.9. Necessary Conditions for a Peace Outcome ......................................................... 289
Table D.10. Truth Table for a Peace Outcome Including Conditions LACC, ROL, AUT, COR . 290
Table D.11. Complex Solution for Peace Outcome Including Conditions LACC, ROL, AUT, COR
.................................................................................................................................... 290
Table D.12. Parsimonious Solution for Peace Outcome Including Conditions LACC, ROL, AUT,
COR ............................................................................................................................. 291
Table D.13. Overview of Complex and Parsimonious Solutions for a Peace Outcome
Including Conditions COR, ROL ................................................................................... 292
Table D.14. Truth Table for a Peace Outcome Including Conditions LACC, ROL, STAB, COR 293
Table D.15. Parsimonious Solution for Conflict Outcome Including Conditions LACC, ROL,
COR, STAB ................................................................................................................... 293
Table E.1. Assumptions for Intermediate Solutions .............................................................. 294
Table E.2. Raw and Calibrated Data for Conditions on Inequality and Adaptive skills ......... 294
Table E.3. Raw and Calibrated Data for Conditions on Inequality and Adaptive skills
Continued ................................................................................................................... 297
Table E.4. Raw and Calibrated Data for Conditions on Inequality and Adaptive skills
Continued ................................................................................................................... 298
Table E.5. Necessary Conditions for a Conflict Outcome ...................................................... 301
Table E.6. Overview of Complex and Most Parsimonious Solutions Including Three
Conditions for a Conflict Outcome ............................................................................. 302
Table E.7. Necessary Conditions for a Peace Outcome ......................................................... 305
Table E.8. Truth Table for a Peace Outcome Including Conditions EDU, INEQ, TECH, UNEVEN
.................................................................................................................................... 305
Table E.9. Complex Solution for Peace Outcome Including Conditions EDU, INEQ, TECH,
UNEVEN ...................................................................................................................... 306
Table E.10. Overview of Complex and Parsimonious Solutions for Peace Outcome with
Condition ACCAGR Replacing TECH and EDU ............................................................. 306
Table F.1. Truth Table for a Conflict Outcome Including Conditions AGR, AUT, ROL, EXP, OIL,
UNEVEN ...................................................................................................................... 307

Table F.2. Complex Solution for Conflict Outcome Including Conditions AGR, EDU, AUT, ROL,
EXP, OIL, UNEVEN ....................................................................................................... 308
Table F.3. Parsimonious Solution for Conflict Outcome Including Conditions AGR, EDU, AUT,
ROL, EXP, OIL, UNEVEN ............................................................................................... 309
Table F.4. Truth Table for Peace Outcome Including Conditions AGR, POV, OIL, EXP, ROL,
COR, EDU, TECH .......................................................................................................... 309
Table F.5. Complex Solution for Conflict Outcome Including Conditions AGR, POV, OIL, EXP,
ROL, COR, EDU, TECH, UNEVEN .................................................................................. 310
Table F.6. Parsimonious Solution for Conflict Outcome Including Conditions AGR, POV, OIL,
EXP, ROL, COR, EDU, TECH, UNEVEN .......................................................................... 311
C o n t e n t x i i i
FIGURES
Figure 3.1. Increase in QCA Applications by Type ................................................................... 45
Figure 3.2. Necessary and Sufficient Conditions ..................................................................... 48
Figure 3.3. Physical and Socio-Economic Scarcity Including Real Cases .................................. 63
Figure 4.1: Direct and Indirect Effects of Trade Openness on Internal Armed Conflict .......... 80
Figure 4.2. Low Levels of Economic Development as Necessary Condition for Conflict ......... 90
Figure 4.3. High Levels of Oil and Low Levels of Exports as Sufficient Condition for Conflict . 96
Figure 4.4. Low Levels of Agricultural Dependence as Necessary Condition for Peace ........ 100
Figure 5.2. High Levels of Authoritarian Regimes and Low Levels of Rule of Law as Sufficient
Condition for Conflict ................................................................................................. 125
Figure 5.3. High Levels of Rule of Law and Low Levels of Corruption as Sufficient Conditions
for Peace ..................................................................................................................... 130
Figure 6.1. High Levels of Uneven Economic Development as Necessary Condition for
Conflict ........................................................................................................................ 150
Figure 6.2. Low Levels of Tertiary Education as Necessary Condition for Conflict................ 152
Figure 6.3. Low Levels of Tertiary Education and High Levels of Uneven Economic
Development as Sufficient Condition for Conflict ...................................................... 154
Figure 6.4. High Levels of Tertiary Education or High Levels of Technology Combined with
Low Levels of Uneven Development as Sufficient Condition for Peace..................... 157
Figure 7.1. Incidence of Civil War by Country Income per Capita, 1960–2006 ..................... 178

I n t r o d u c t i o n 1
Chapter 1: INTRODUCTION
Does climate change cause conflicts? The public debate around “climate wars” suggests a
causal link between changes in climate and conflict. Examples from history show that climate
and the natural environment had an impact on many aspects of human development such as
types of food and settlements. This raises the question of how current, accelerated climate
change and resulting environmental changes will influence human societies. Due to the many
influences of climate change, this question covers a variety of aspects, such as the impact of
extreme weather effects (e.g. floods or typhoons), of rising sea levels or of changes in
temperature and precipitation. I focus on one link between climate change and conflict:
scarcity of livelihood resources such as arable land and water. While there are strong
theoretical arguments linking resource scarcity and conflict, the empirical evidence on this
link is mixed with some case studies supporting the link but most quantitative studies finding
no or only weak correlations. I assume that that whether conflicts break out in resource-
scarce countries depends on the specific combinations of social, political and economic
conditions in these countries. To establish under which conditions armed conflict occurs in
countries experiencing resource scarcity, I systematically compare 30 cases1. Many of the
aspects included in the analysis (such as the quality of political institutions, the level of
education and access to technology) are dependent on and constitutive of the level of
development. This makes the role development plays for peace and conflict in resource-
scarce countries a central theme in this dissertation.
CLIMATE WARS IN THE PUBLIC DEBATE
In 2007, the Norwegian Nobel Committee awarded the Nobel Peace Prize to Al Gore and the
Intergovernmental Panel on Climate Change (IPCC) for their work in the area of climate
change, reasoning that “global warming not only has negative consequences for ‘human
security’, but can also fuel violence and conflict within and between states” (Mjøs, 2007). This
is reflected in the public debate as well where the notion of “climate wars” has sparked a
number of books2 (Henson, 2011; J. R. Lee, 2010; Lynas, 2008; Parenti, 2012; Paskal, 2010),
films (Armstrong, 2009; Bednar, 2009; Bennett, 2007; N. Brown, 2006; Nash, 2010; Taylor,
2006) and articles (Baldauf, 2006; Bittner, 2007; Borger, 2007; Drach, 2010; Faris, 2007;
Friedmann, 2009; Groenewald, 2007; Harvey, 2011; Mail & Guardian, 2007; Perras, 2010;
Revkin, 2007; Colin Sullivan, 2009; The Economist, 2010b; Wild, 2013). Many of these books,
documentaries and articles carry sensationalist titles in order to attract attention to the issue.
Book titles such as “Climate Wars – The Fight for Survival as the World Overheats” (Dyer,
2011), “Climate Wars: What People Will Be Killed for in the 21st Century” (Welzer, 2012) also
1 Algeria, Armenia, Bahrain, Bhutan, Burundi, Cape Verde, Chile, Djibouti, Egypt, Haiti, Jamaica, Japan, Jordan, Kenya, Kuwait, Kyrgyzstan, Lesotho, Mongolia, Nepal, Netherlands, Pakistan, Qatar, Rwanda, Singapore, South Korea, Switzerland, Turkmenistan, United Arab Emirates, Uzbekistan and Yemen 2 The term climate wars can also refer to the debate between those who argue that climate change is taking place and those that are skeptic of the reality of climate change (e.g. M. E. Mann, 2013; I. Stewart, 2008a, 2008b, 2008c).
2 I n t r o d u c t i o n
show the extent to which the notions of climate change and war and fighting have been
connected in the public debate.
This notion of conflict as a consequence of climate change has also been adopted by
governments, international organisations, military organisations and international non-
governmental organisations (CDC, IISD, & Saferworld, 2009; Christian Aid, 2006; D. Smith &
Vivekananda, 2007). The basic argument is as follows: climate change leads to human
insecurity as it reduces the resources people need to sustain their livelihoods, such as
freshwater, arable land, forests and fish. This scarcity of livelihood resources results in
increased competition over resources, which in turn leads to violent conflict and war. This
debate on climate change and conflict is therefore linked to an older debate focusing on the
environment and conflict. In the 1990s, a lot of focus was put on the impact of the natural
environment and changes to the natural environment on conflict. Similarly to today’s debate
on climate change and conflict, this debate also included academic and non-academic circles,
spanning from alarmist predictions of global conflicts to those who saw little if any impact of
the environment on conflict.
In an alarmist article titled “The Coming Anarchy”, Robert Kaplan (1994) drew a direct link
between environmental scarcity and violence, calling the environment “the national security
issue of the early twenty-first century”. While criticised by academics as “culturally
insensitive, one-dimensional, analytically impoverished, and unduly alarmist” (Matthew,
2002, p. 111), it created a lot of debate in policy circles and the Clinton administration sent
copies to all US embassies (Matthew, 2002, p. 111). The 1997 National Security Strategy (The
White House, 1997) also explicitly mentions the issues of “resource depletion, rapid
population growth, environmental degradation and refugee migration” as a potential security
threat and argues that “natural resource scarcities often trigger and exacerbate conflict.” The
increasing awareness of climate change has drawn the attention of other governments to the
links between environmental change and armed conflict as well. The German government,
for instance, commissioned a report stating that climate change will most likely put an
enormous strain on many societies, which might lead to conflict and violence (WBGU, 2007).
International organisations have also acknowledged this link: The European Union (High
Representative and the European Commission, 2008, p. 3) stated that “climate change will
fuel existing conflicts over depleting resources, especially where access to those resources is
politicised.” The United Nations (UN) has also included this issue on its agenda (UNEP, 2007).
In 2003, then-Secretary-General Kofi Annan (UN, 2003, p. 12) wrote that
the implications of the scarcity of certain natural resources, of the mismanagement or depletion of natural
resources and of the unequal access to natural resources as potential causes of conflicts need to be more
systematically addressed by the United Nations system.
Current UN Secretary-General Ban Ki Moon (2007) drew a direct link between climate change
and armed conflict when he wrote that the conflict in Darfur arose “at least in part from
climate change”.
I n t r o d u c t i o n 3
Military organisations have also adopted this focus on the impact of climate change on
security. Schwartz and Randall (2003) predict dire consequences in a Pentagon Report on
Climate Change and US Security, including the world falling back to Hobbesian state, where
“humanity would revert to its norm of constant battles for diminishing resources” (P.
Schwartz & Randall, 2003, p. 16). They (P. Schwartz & Randall, 2003, p. 17) expect, for
instance, increased migration from Europe to the US by 2015 and the need for the
Department of Defense to manage the border and the inflow of refugees from Europe and
the Caribbean by 2020. In a report for the CNA corporation (2007, p. 3) eleven retired US
generals and admirals conclude that climate change “presents significant national security
challenges for the United States”. The North Atlantic Treaty Organization (NATO) has also
focused on the relationship between environmental change and security (Lietzmann & Vest,
1999) and has hosted a number of high-profile workshops on the issue (Dalby, 2002, p. 97).
CLIMATE AND ITS INFLUENCES ON HUMAN DEVELOPMENT FROM A HISTORIC PERSPECTIVE
While this debate seems to suggest a strong link between climate change and conflict, the
impact of climate and the question of how the natural environment and human development
are connected is actually difficult to answer in the short term. There is evidence that climate
conditions have favoured or disfavoured specific developments such as the move from
migrating to settled communities in the long term, however. While political scientists tend to
focus on the short term of a few decades at the most and on factors other than the
environment to account for changes in society, environmental historians tell a story of human
development stretching for tens of thousands of years with a great role for the environment
and the climate. The extent to which climate determines human development has been the
subject of much dispute. While climate determinists see climate as a key factor for the rise
and fall of many civilizations, this is doubted by climate sceptics, who point to the difficulties
in establishing climate events and linking them to historical events and the need to include
other aspects that mediate the climate-human interaction, such as social relations and power
dynamics (Carey, 2012).
Changes in climate during the Holocene have been linked to historical events such as the
development and collapse of several high civilizations, human movement on a massive scale
and wide-spread famine (J. M. Diamond, 2005). The Holocene, which begins around 12000 BC
is characterised by high stability of climate and warmth, which led Fagan (2004, p. 25) to argue
that “civilization arose during a remarkably long summer”. The example of one settlement in
the Levant illustrates how the warming around 13 000 BC led to a shift from mobile hunter-
gatherer societies to permanent settlements (Fagan, 2004, p. 80). The warming and the
related higher rainfall led to an increase of acorn and pistachio trees. While acorn trees have
very high yields and are very nutritious, they need to be processed for human consumption,
which is a labour-intensive and time-consuming process. The processing and need to store
foods anchored humans to one place, leading to permanent settlements. Having lived in close
proximity to each other and on the same land for generations, humans were not able to shift
4 I n t r o d u c t i o n
back to the mobile lifestyle of earlier times, even when the warming and the rains came to an
end (Fagan, 2004, p. 88). For one thing, the settlements had grown in numbers far beyond
the numbers that could be sustained in mobile bands. Secondly, the now connected spiritual
connection to the land made it difficult to leave it. When the nuts and fruits from previous
diets were no longer available from around 11 000 BC as the climate became drier and drier,
humans in the area shifted to the planting of seeds instead, leading to the development of
the first domesticated seeds such as rye and einkorn, which appear around 10 000 BC. This
example shows how a warmer and wetter climate led humans to settle in one place
permanently and how the shift to drier climate favoured the development of agriculture.
This and many more examples (Behringer, 2007; J. M. Diamond, 2005; Fagan, 2004) show that
changes in climate and consequently the natural environment have had an impact on human
life and the make-up of human societies. This raises the question of what the impact of
climate change on today’s humans is. The main difference between climate change in the
Holocene and climate change today is its speed. While climate change in Holocene progressed
slowly, the speed of climate change has accelerated in the Anthropogenic (or man-made) age.
This acceleration has added a sense of urgency to the question of how climate change affects
human societies and sparked a lot of research on the impact of climate (change) on human
societies and conflict.
CLIMATE CHANGE IN THE ANTHROPOCENE
Earth has entered a new era, the anthropocene or man-made age. While the past 10 000
years of the Holocene have been a period of unusual climate stability, which saw the
development of human civilizations, the onset of the anthropocene is threatening the
foundations of human life on Earth. Human activities since the Industrial Revolution are
pushing the boundaries of the stable state of the Holocene, which allowed for human
development. During the Holocene, environmental change occurred naturally and the earth’s
regulatory capacity kept temperatures, freshwater availability and biogeochemical flows
within a narrow range (Rockström et al., 2009, p. 472). Human activities, such as the use of
fossil fuels and industrialised agriculture have damaged the systems necessary to keep the
earth in this Holocene state. This is why the new era has been named the anthropocene, or
man-made age. Crutzen (2002) introduced this concept, which has been defined as “a new
geologic epoch in which humankind has emerged as a significant – and potentially intelligent
– force capable of reshaping the face of the planet” (Clark, Crutzen, & Schellnhuber, 2004, p.
1).
Various interdependent subsystems of the planet are affected by human change and threaten
the earth’s balance. Rockström et al. (2009, p. 472) have defined nine highly interdependent
subsystems and boundaries for each. These boundaries are based on the carrying capacity of
Earth and define the “safe operating space for humanity” (Rockström et al., 2009, p. 472) and
crossing them could mean a shift of important subsystems into new states. Pushing the
earth’s environmental system beyond these planetary boundaries could have catastrophic
I n t r o d u c t i o n 5
consequences for large parts of the world. Of these nine subsystems - climate change,
biodiversity loss, interference with the nitrogen and phosphorus cycles, stratospheric ozone
depletion, ocean acidification, global freshwater use, change in land use, chemical pollution
and atmospheric aerosol loading – three (climate change, biodiversity loss and nitrogen
cycles) have already transgressed the boundaries of their stable Holocene state. Humanity
has therefore pushed Earth beyond a tipping point into the anthropocene. The effects of
anthropogenic climate change can already be seen in the retreat of mountain glaciers, the
loss of mass from the Greenland and West Antarctic ice sheets, the retreat of the summer ice
in the Arctic Ocean and the rising sea levels. The Intergovernmental Panel on Climate Change
(IPCC) finds that the climate system has warmed since the 1950s, including the warming of
the atmosphere and the oceans, the diminishing of snow and ice, rising sea levels and
increased concentration of greenhouse gases (Stocker & Qin, 2013, p. 2).
RESOURCE SCARCITY AS RESULT OF CLIMATE CHANGE
It is difficult to establish the impact of these changes on human societies. Climate change has
different effects in different areas including extreme weather events, rising sea levels and
changes in temperatures and precipitation levels. In this dissertation, I focus on one aspects
that are cause for concern: The impact of climate change on the resources needed to produce
food, notably arable land and freshwater.
The Intergovernmental Panel on Climate Change (IPCC, 2007, p. 50) projects climate change
to have drastic impacts on the natural resources and consequently, food production.
Processes such as soil degradation, desertification and the increasing salt content in the soil
reduce the land available for agriculture. Changes in the climate lead to reduced rainfall in
many areas. While the situation will worsen in some areas, food production in other areas is
projected to benefit from changes in the climate.
The situation is particularly dire in Africa where the IPCC projects that between 75 and 250
million people will be exposed to increased water stress by 2020. Arid and semi-arid land is
also expected to increase by 5 to 8% by 2080. Climate change and variability could thus reduce
yields from rain-fed agriculture by up to 50% by 2020, which would lead to food insecurity
and malnutrition. In Latin America, temperature increases are projected to lead to tropical
forests turning into savannah in eastern Amazonia and semi-arid vegetation being replaced
by arid vegetation. Agricultural production of most crops and livestock is projected to decline.
The fall in agricultural production will likely lead to food insecurity and a higher number of
people at risk for hunger. Water availability is also projected to be affected due to changes in
precipitation patterns and the disappearance of glaciers. In much of Asia, freshwater
availability is projected to decrease, in particular in large river basins. Water insecurity will
intensify in parts of Australia and New Zealand and production of agriculture is projected to
decrease due to drought and wildfires. In southern Europe, climate change is expected to lead
to increasing temperatures and droughts, negatively affecting agricultural production. In
North America, there will likely be warming in the western mountains, which will lead to more
6 I n t r o d u c t i o n
winter flooding and reduced summer flows, leading to increased water stress. Water
resources will also be negatively affected on many small islands in the Caribbean and the
Pacific. There are some benefits of climate change projected as well. For instance, in North
America, climate change is expected to increase yields by 5 to 20%.
Climate change will likely lead to a reduction of the resources needed to sustain human
livelihoods, in particular arable land and freshwater. What are the consequences of reduced
levels of resources for social interaction? In particular, what happens when the level of land
and water available per person drops below the threshold needed to sustain the livelihood of
that person? While the popular notion is that reduction of resources due to climate change
will lead to “climate wars”, academic research on resource scarcity and armed conflict
presents an interesting puzzle, which is the focus of this dissertation.
THE ACADEMIC PUZZLE AND ITS SOLUTIONS IN A NUTSHELL
Academic research into the links between resource scarcity and armed conflict presents a
more complex picture than the popular notion of “climate wars”. While there are convincing
theories laying out ties between resource scarcity and conflict, the empirical evidence is
mixed. There are case studies of resource-scarce countries that link a lack of resources to
conflict as resource scarcity leads to situations of threatened livelihoods, which leads to
grievances and higher incentives to fight. However, there are also case studies that point to
other factors besides resource scarcity as causal factors for conflict (e.g. Benjaminsen, Alinon,
Buhaug, & Buseth, 2012; Benjaminsen, 2008; Turner, 2004). Quantitative studies of various
aspects connected to resource scarcity such as population density, soil degradation or forest
cover have – with few exceptions – not found correlations between resource scarcity and
armed conflict (e.g. Esty et al., 1998; Theisen, 2008; Urdal, 2005). The field is thus
characterized by strong theoretic arguments, which certainly appeal to intuitive
understanding, and contradictory empirical results.
THE RESEARCH QUESTION
The starting point for this dissertation is this contradiction and the assumption that these
contradictory results are due to different social, economic and political conditions in different
countries. I assume that conflicts occur under specific conditions. This explains contradictory
findings in case studies, since whether conflicts occur depends on the social, economic and
political conditions specific to each case. It explains the non-findings of quantitative studies
as well, since there can be no strong correlation between resource scarcity and conflict if this
link depends on other conditions. The aim of this dissertation is to give an answer to the
question: “Under which sets of political, social and economic conditions does armed conflict
occur in countries with low levels of freshwater or arable land or both?“
THE RESEARCH METHOD
In order to answer this question, I compare the social, economic and political conditions in
resource-scarce countries, employing fuzzy-set qualitative comparative analyses (fsQCA)
I n t r o d u c t i o n 7
(Ragin, 2000, 2008b). Qualitative comparative analysis (QCA) allows for the comparison of
different configurations of conditions and establishes necessary and sufficient conditions for
certain outcomes. It also allows for the conjunctural logic such as conflicts over resources only
occurring under a specific combination of conditions, which makes it well-suited to answer
my research question. I compare 30 countries with low levels of arable land or freshwater or
both. Of these cases, 14 experienced conflicts between 1990 and 2010 and 16 did not. While
many notions of conflict and violence have been linked to resource scarcity, such as political
violence, ethnic strife, civil war and international war, I focus on the types of conflict most
common in the literature on resource scarcity and conflict: internal armed conflict and non-
state conflict. I use a threshold of 25 battle deaths to differentiate conflict and non-conflict
cases. I analyse 22 conditions, which I selected based on an adaptive capacities framework
and a review of case studies of resource scarcity and evaluated against the larger conflict
literature. These conditions are analysed in two steps. In step one, I focus on various
explanations for conflict (economic explanations, political explanations, social explanations),
using these explanations as a theoretical guidance for the analyses. In a second step, the most
prevalent results from these analyses are brought together for an integrated analysis. This
analysis finds three key pathways to conflict – 1) being a least developed country, 2) being a
patrimonial country and 3) being oil rich but not well integrated into the global economy –
and two pathways to peace – 1) low dependence on agriculture with even development
between groups and 2) being a non-agrarian country that is highly integrated into the global
economy with high adaptive skills.
CONTRIBUTIONS TO THE LITERATURE
This study contributes to the literature on resource scarcity and armed conflict by introducing
fsQCA as an approach that explicitly allows for the analysis of contextual conditions, which
have not been analysed systematically before. To enable the analyses, I introduce an adaptive
capacities framework3, which is based on the determinants of adaptive capacities such as
economic resources, political institutions, equity and adaptive skills (e.g. the level of
technology or education). This allows for a structured analysis of the many potential
conditions in the case study literature and the introduction of adaptive skills as conditions
that have been overlooked so far. In the resulting qualitative comparative analysis of the
conditions included in the framework, I show empirically that clear sets of conditions exist
under which conflicts occur in resource-scarce countries and sets of conditions under which
they do not. The resulting pathways for a peace outcome highlight the role of adaptive skills
such as education, technology or access to research and knowledge, which have not received
much attention in previous case studies of resource scarcity and conflict. Theoretical
arguments in the conflict literature have rarely included adaptive skills, but my results show
3 The concept of adaptive capacities and adaptive skills are related. I use adaptive capacities in a broader sense, capturing aspects such as economic resources, political resources and equity while I use adaptive skills to refer to a more narrow range of skills in a society such as the level of education or the access to technology and science.
8 I n t r o d u c t i o n
that higher adaptive skills prevent conflicts in resource-scarce countries under certain
circumstances.
In addition, the empirical pathways give some insight into the role of resource scarcity in
conflict and speak to more general issues in the peace and conflict literature. Among these
issues are arguments linking low levels of development to conflict as poor people have lower
opportunity costs when joining rebel armies and poor states have less capacities to suppress
or accommodate conflicts. In situations of resource scarcity this is exacerbated as it is more
difficult for people to sustain their livelihoods through subsistence agriculture, heightening
the incentives to join rebel armies. A second issue in the general conflict literature focuses on
neopatrimonial systems where the state’s resources are used by patrons to keep the loyalty
of their clients. This is linked to conflict where it leads to grievances between different groups
in the state if only some of them have access to the state’s resources. My empirical results
support this link and show that being a neopatrimonial state is sufficient for a conflict
outcome. Finally, rentier states are linked to peace as authoritarian states with high revenues
from natural resources such as oil are able to buy off their constituents to keep them from
rebelling and to devote many resources to maintaining an effective security apparatus. This
is also supported by my empirical results, which show that oil-rich states are peaceful if they
are integrated into the global economy, which results in large amounts of oil revenues that
can be distributed among different groups in society.
While I focus not on whether resource scarcity contributes to conflict but under which
conditions, my results still speak to question of whether resource scarcity contributes to
conflict as well. Some of the resulting pathways clearly tie into the question whether resource
scarcity contributes to conflict: For instance, the pathway focusing on least-developed
countries shows that a high level of subsistence agriculture and few opportunities for other
income are sufficient for conflict. This supports arguments of resource scarcity theorists that
conflict erupts in situations of enormous pressure on resources. The pathway is in accordance
with many of the case studies supporting resource scarcity theories, which are frequently
characterized by high dependence on agriculture. Similarly, the inclusion of adaptive skills in
sufficient pathways to peace suggests that higher adaptive skills – such as relevant
technologies and high education levels – can help societies in overcoming resource scarcities,
which suggests a role in explaining conflict for resource scarcity.
THE ROLE OF THE LEVEL OF DEVELOPMENT
When comparing countries with resource scarcity and exploring which of these countries
remain peaceful and which experience conflict, the role of development is often highlighted
(Buhaug, Gleditsch, & Theisen, 2008, pp. 23 – 25). Developed countries, such as the
Netherlands, Switzerland, Chile, Japan or South Korea seem to fare better and are less
conflict-prone, while least-developed countries such as Rwanda, Burundi, Haiti, Djibouti,
Nepal or Yemen are much more conflict-prone. Pointing out that it is matter of development
seems an easy answer to the question posed in this dissertation. However, development is a
I n t r o d u c t i o n 9
multi-facetted concept. Stating that peace and conflict in resource-scarce countries are
mainly a matter of development poses the question which aspects of development play a role
in differentiating peaceful from conflict-prone countries. As a result, many of the conditions
included in this dissertation correspond to the various dimensions of development. For
instance, aspects such as the percentage of people depending on subsistence agriculture, the
quality of political institutions, the level of education and the access to science and technology
are not independent of the level development; rather they represent different dimensions of
development.
Development has been defined as “a multifaceted process of structural transformations, not
only economic, that becomes manifest in the growth of income, productivity, consumption,
investment, education, life expectancy, and employment – all that makes for a better life.”
(Przeworski, Alvarez, Cheibub, & Limongi, 2000, p. 1). While it is quite intuitive that a country
with a large industrial and service sector, low inequality, good education and health systems,
effective political institutions, a liberal democratic system, access to financial capital and so
on does not have a high risk for conflict (Hegre, forthcoming), this gives little insight into the
question which of these factors matter most. It also fails to explain peaceful cases that do not
have any or only some of these facets. In addition, when everything that “makes for a better
life” is included in the definition of development, then yes, development is strongly linked to
peace as peace surely makes for better lives than war and people whose lives are improving
have few incentives to fight. However, this result is not very satisfying and leads to the
question how the different facets of development are linked to peace and conflict.
The issue of development is present throughout the dissertation in its various facets. The
different chapters in this dissertation focus on different explanations linking the level of
development and conflict, such as poverty, inequality, opportunities for looting, state
capacities or education. The role of development for peace and conflict is more explicitly
explored in chapter 7, which also explores the limits of the concept within the framework of
this dissertation, which focuses on development as a status quo rather than as a historical
process.
STRUCTURE OF THE DISSERTATION
The next chapter reviews the literature on climate change, resource scarcity and conflict and
the empirical evidence available. It presents the theoretical arguments made by resource
scarcity theorists and the research question. It also discusses the inclusion of social, political
and economic conditions in previous studies and introduced an adaptive capacities
framework to study the multitude of potential conditions. The third chapter explains the
choices made in the research design. I introduce qualitative comparative analysis as the main
research method and explain how and why it can answer the research question. I explain the
selection of conditions for the analysis in the following chapters as well as the case selection
and the definition and operationalisation of resource scarcity on which it is based. The third
chapter also explains the definition of conflict employed and the dataset used to differentiate
1 0 I n t r o d u c t i o n
conflict and peace cases. The following four chapters constitute the empirical heart of the
dissertation. Each of them focuses on a specific explanation for conflict (economic, political
or social) and reviews the theoretical arguments and empirical evidence from quantitative
studies and from case studies in resource scarce countries. This review leads to hypotheses
which are then tested. I explain the operationalization of the hypotheses including issues of
defining, measuring, data collection and calibrating of the conditions included. Each chapter
then includes separate analyses of the conflict and the peace outcome and a discussion of
these results. More specifically, chapter 4 focuses on economic explanations, in particular on
the issues of development, economic dependence and diversification. Chapter 5 focuses on
state-based explanation, in particular different dimensions of state capacity. Chapter 6
focuses on societal factors, in particular inequality and adaptive skills. Chapter 7 brings the
results from these previous chapters together and finds the key pathways to conflict, being a
least developed country, being a patrimonial country and being oil rich but not well integrated
into the global economy for the conflict outcome and having low dependence on agriculture
and even development between groups or having low dependence on agriculture in
combination with high integration into the global economy and high adaptive skills for a peace
outcome. Chapter 7 also explores further some of the strands running through the previous
empirical chapters since they combine economic, political and social conditions. In particular,
it focuses on how the level of development affects peace and conflict, arguing that the level
of development matters for the very rich - that remain peaceful - and the very poor - that
experience conflicts – but much less for the intermediate countries. It also focuses on oil and
authoritarian regimes, finding more support for the peaceful influence of oil as proposed in
rentier state theory than for a conflict potential as argued in resource abundance theories.
Chapter 8, finally, summarises the findings of the research, the contributions to the literature,
points to the limitations of the answers given and potential avenues for future research.
C l i m a t e C h a n g e , R e s o u r c e S c a r c i t y a n d A r m e d C o n f l i c t 1 1
Chapter 2: CLIMATE CHANGE, RESOURCE SCARCITY AND ARMED CONFLICT:
THEORETICAL LINKS AND EMPIRICAL EVIDENCE
INTRODUCTION
Does climate change lead to conflict? As I have shown in the introduction, the public debate
carried by journalists, international organisations and governments supports the notion of
“climate wars”. In this chapter, I will turn to the academic research on links between climate
change, the natural environment and armed conflict. I first place the debate on climate
change and conflict in the larger debate on environmental security that has developed in the
aftermath of the Cold War. Research on climate change and conflict has evolved in recent
years but lacks conclusive findings. I review the theoretical arguments and empirical evidence
linking climate change and conflict. This research attempts to link two complex phenomena
(climate change and conflict), which leads to many potential links but makes establishing
conclusive results difficult. My focus is on one of these links, focusing on reduced levels of
freshwater and arable land due to climate change. This is linked to an older debate on
resource scarcity and conflict, but is of renewed relevance as climate change will reduce the
freshwater and arable land in many regions. In the literature on resource scarcity and conflict
natural resources, such as freshwater, soil and forests play an important role in linking
changes in the natural environment to social consequences like armed conflict. Resource
scarcity theories (Bächler, 1998a; Homer-Dixon, 1999; Kahl, 2008) argue that a lack of
resources is linked to armed conflict through various mechanisms but this link is doubted by
scholars who argue that this argument amounts to environmental determinism (Barnett,
2000; Peluso & Watts, 2001a) and that it ignores the many ways humans can adapt to changes
in their natural environment (Lomborg, 2001). The empirical evidence for a relationship
between resource scarcity and armed conflict is weak. In particular, the impact of social,
political and economic conditions in resource-scarce countries is not included systematically.
An analysis of the combinations under which social, economic and political conditions under
which conflict breaks out in resource-scarce countries can explain the contradictory evidence
in empirical studies and deepen our understanding of conflict in resource-scarce countries.
This analysis leads to the formulation of the research question guiding the research in this
dissertation. In order to facilitate such an in-depth analysis of the social, economic and
political conditions in resource-scarce cases, I introduce an adaptive capacities framework to
the debate, which helps to structure the large number of potential conditions mediating the
relationship between resource scarcity and armed conflict.
SECURITY AND THE ENVIRONMENT
With the end of the Cold War, renewed attention by policymakers and academics (e.g. Stern,
1996; Westing, 1986) alike was given to the issue of security. This resulted in a broadening of
the security concept to include new aspects like environmental change. This broader
definition of security has been accepted by many scholars (including Brock, 1991; Gleick,
1 2 C l i m a t e C h a n g e , R e s o u r c e S c a r c i t y a n d A r m e d C o n f l i c t
1993; Lodgaard & Hjort af Ornäs, 1992; Mathews, 1989; Myers, 1989; Renner, 1989) as well
as many policymakers (Boutros-Ghali, 1992) and organisations. The concept of human
security emerged and shifted the focus from the security of states to the security of
individuals. For instance, Sooros’s (1997a, p. 236) definition of security includes “the
assurance people have that they will continue to enjoy those things that are most important
to their survival and well-being.” This broadening of the security term brought about an
inclusion of the environmental factors, as the security of individuals is more often dependent
on environmental factors than on the security of nations. For instance, the 1994 Human
Development Report (UNDP, 1994, p. 23) includes environmental factors in the discussion of
human security since changes in the natural environment such as desertification or droughts
frequently lead to hurtful disruptions of daily life:
Human security can be said to have two main aspects. It means, first, safety from such chronic threats as hunger,
disease and repression. And second, it means protection from sudden and hurtful disruptions in the patterns of
daily life.
This merging of security studies with aspects of environmental studies led to research
analysing the impact of environmental change on violent conflict4. In this way, the argument
that resource depletion and scarcity increase the risk of violent conflict is a direct result of the
merging of two prominent debates in international relations: the debate on environment and
the debate on security (Gleditsch, 1998). This has sparked criticisms of securitizing the
environment and climate change (Barnett, 2000; Detraz, 2011).
CLIMATE CHANGE AND ARMED CONFLICT
The spotlight on the social consequences of climate change has sparked a number of studies
focusing on links between climate and armed conflict. So far, however, there is little
agreement on the theoretical linkages between climate change and conflict. One reason for
this is that climate change is a complex phenomenon with effects on many different aspects
of the natural environment. Therefore, studies focus on various aspects of climate change
and their links to conflict, in particular variability in rainfall; variability in temperature; an
increase in extreme weather events; rising sea levels and environmental change and resource
scarcity. Most of the theoretical explanations focus on economic loss, arguing that economic
loss contributes to conflict. While empirical studies exist for all the proposed linkages, they
do not provide any conclusive results on the impact of climate change on conflict, though a
recent metastudy finds converging results (Hsiang, Burke, & Miguel, 2013). One reason for
4 The question of how resource scarcity is linked to conflict falls within the field of environmental security. However, this field covers many more aspects. Environmental security as a field focuses on the question how traditional notions of security should take environmental issues into account. Examples include social conflicts on environmental entitlements, the burdens of pollution, the sharing of uncertain environmental risks, and the loss of access to natural resources and environmental services and a number of different approaches (Clover, 2007, p. 5). Three areas have received particular attention (D. M. Schwartz & Singh, 1999, p. 6).: the redefinition of traditional notions of security, the relationship between traditional security institutions and environmental concerns and the relationship between environment and conflict, which is the area of research that this dissertation contributes to.
C l i m a t e C h a n g e , R e s o u r c e S c a r c i t y a n d A r m e d C o n f l i c t 1 3
the different results is that different studies take into account very different types of conflict
and violence, ranging from full-out civil wars to armed and communal conflict and political
riots. Overall, there are no conclusive results on the links between climate change and
conflict.
RAINFALL VARIABILITY
Arguments linking variability in rainfall to conflict mostly focus on agricultural decline and
economic loss as intervening variables, which is linked to conflict through various
mechanisms. Both, much less or much more rain than usual can lead to agricultural decline
and to economic loss, in particular in areas with a high dependence on rain-fed agriculture.
Economic loss can contribute to increasing inequality as decreasing state revenues lead to
diminishing public service, resulting in an increased wealth gap between privileged elites and
those excluded from power. The resulting grievances provide motivation for conflict (Buhaug
et al., 2008, p. 45). Economic loss might also lower the opportunity costs for individuals to
join rebellions (Collier, 2000; Grossman, 1991). Rainfall variability might also lead to changes
in forest cover, which has been linked to conflict. Cattle raids and thus violence might take
place more frequently in wet years as more vegetation provides better cover and there are
more cattle, which makes gives raids a higher chance of success (Meier, Bond, & Bond, 2007;
Witsenburg & Adano, 2009).
There is empirical evidence supporting a whole range of contradictory notions, including that
more rain contributes to more conflict, that less rain contributes to more conflict, that both,
more and less rain contribute to conflict and that there is no effect of rain on conflict at all.
Arguments linking wetter years and more abundant vegetation to more conflict are supported
by Theisen (2012), who finds in a case study of communal conflict in Kenya that years with
below average rainfall tend to have a peaceful effect on the following year. Reanalyzing his
data with a different statistical model, Hsiang et al. (2013, p. 1) find different results in
opposition to the original study. Other studies find a link between lower rainfall and more
conflict (Fjelde & von Uexkull, 2012; Hendrix & Glaser, 2007; Miguel, Satyanath, & Sergenti,
2004). However, the robustness of the results by Miguel, Satyanath and Sergenti (2004) has
been questioned (Jensen & Gleditsch, 2009) and in a re-evaluation of their argument Ciccone
(2011) finds that conflict is less rather than more likely after more rainfall. Similarly,
O’Loughlin et al. (2012) find that conflict is reduced in wetter periods. Some studies find both
these effects: Hendrix and Salehyan (2012) find that both, particularly dry and particularly
wet years, see higher rates of social conflict in Africa, with wet years being more violent.
Raleigh and Kniveton (2012) also find that both, wet and dry years, see higher rates of violence
in Africa, arguing that particularly dry conditions will see more rebel conflict while particularly
dry conditions will see more communal conflict. Finally, there is evidence that finds no
significant effects of rainfall on conflict (Brückner & Ciccone, 2010; Buhaug, 2010a; Burke,
Miguel, Satyanath, Dykema, & Lobell, 2009; Theisen, Holtermann, & Buhaug, 2011) This is
supported by a case study of the Niger inland delta region in Mali, which also finds no effect
of rain on conflict (Benjaminsen et al., 2012). No general conclusion for links between rainfall
1 4 C l i m a t e C h a n g e , R e s o u r c e S c a r c i t y a n d A r m e d C o n f l i c t
and conflict can be drawn and the results from case studies are highly dependent on specific
conditions such as vegetation cover that is dependent on small changes in precipitation
patterns or specific cultural practices such as cattle raids.
TEMPERATURE VARIABILITY
Variability in temperature has also been linked to conflict. There are arguments that hot
temperatures increase aggression, which leads to increased violence (Anderson, 2001). This
applies to number of issues such as assault (Anderson, Bushman, & Groom, 1997; Cohn &
Rotton, 1997; Rotton & Cohn, 2004) and domestic violence (Auliciems & DiBartolo, 1995) as
well as retaliation in baseball (Larrick, Timmerman, Carton, & Abrevaya, 2011) and the
blowing of horns by car drivers (Kenrick & MacFarlane, 1986), all of which increase in warmer
temperatures. However, cooler periods have also been linked to an increase in conflict in
long-term studies as they were linked to economic loss and food insecurity (Tol & Wagner,
2010; Zhang, Brecke, Lee, He, & Zhang, 2007). There are also arguments that tropical climates
hampers economic development and leads to poverty for instance as a result of tropical
diseases (Gallup, Sachs, & Mellinger, 1999). However, Acemoglu et al. (2000) and Easterly and
Levine (1997) argue that institutions have a greater impact on economic growth than climate
and that the supposed effects of tropical climate disappear when institutional quality is taken
into account.
Focusing on links between temperature and conflict, Loughlin et al. (2012) find for East Africa
that much warmer than normal temperatures raise the risk of violence. In a sample of Sub-
Saharan Africa, Burke et al. (2009) find that an increase in temperature increases civil war,
arguing that higher temperatures lead to decreasing agricultural yields. For the period
between 1981 and 2002, they found a 4.5% increase in civil war for a 1°C increase in
temperature in the same year, which corresponds to 49% relative increase in civil war.
However, the approach has been criticised by Buhaug (2010a) as the results are not robust to
small changes to the conflict data, the sample years or the estimation technique. Buhaug
(2010a) himself finds that climate variability does not explain armed conflict. In a study of
Kenya, Theisen (2012) finds that both warmer and colder years experienced more conflict but
also points out that these results are not robust. Finally, Bergholt and Lujala find no effect of
temperature on conflict. Similarly, Koubi et al. (2012) find no effect of climate variability,
taking into account both temperature and precipitation. Overall, there is no conclusive
evidence on links between changes in temperature and conflict.
EXTREME CLIMATE EVENTS
Extreme climate events, such as droughts or floods, have been linked to conflict through
either economic loss or through erosion of government authority. There are various types of
extreme climate events and these have been linked to different types of conflict. Generally,
however, empirical studies on these links lack conclusive results. For all types of disaster,
Drury and Olsen (1998) find a direct and positive link between disaster severity and political
unrest. This is supported by Nel and Righarts (2008) that find that natural disasters increase
C l i m a t e C h a n g e , R e s o u r c e S c a r c i t y a n d A r m e d C o n f l i c t 1 5
the risk of violent conflict in the short and medium term, in particular in countries with low
and middle incomes and in countries with intermediate to high levels of inequality, mixed
political regimes and low levels of economic growth. Similarly, Besley and Perrson find that
disasters increase the risk for conflict. In contrast to those findings, Slettebak (2012) finds that
countries affected by any type of climate-related natural disasters have a lower risk of civil
war. Reasons for this might be a unifying effect in aftermath of disaster or that governments
can increase their popularity through effective action in the aftermath. While not an effect of
climate change, earthquakes and their impact on conflict are included here because they are
a similar in their extreme and sudden occurrence and devastating results. For earthquakes,
Brancati (2007) finds that earthquakes increase the likelihood of conflict, in particular where
earthquakes are of a higher magnitude, where more densely populated areas are affected,
where countries have low levels of economic development and in countries that had
experienced conflict previously. For droughts, Theisen et al. (2011) find no effect on conflict
in Africa. Looking at hydro-meteorological disasters, such as typhoons or floods, Bergholt and
Lujala (2012) find no impact on armed conflict, while Hsiang et al. (2011) argue that the
probability of new conflicts doubles during El Niño years. Similarly to other effects of climate
change, no conclusive results of extreme weather events on conflict can be found. This is most
probably due to great differences between different types of extreme climate events such as
droughts, typhoons or floods and because it is hard to draw general conclusions from the
small number of such events that occur.
SEA-LEVEL RISE
Climate change is predicted to raise sea levels by 0.9 to 1.3m within the 21st century (Grinsted,
Moore, & Jevrejeva, 2010). This will have negative effects for the livelihoods of people living
on small islands in the Indian Ocean, the Caribbean and the Pacific and for a large number of
people in coastal areas, in particular in South Asia and West Africa. Sea-level rise is projected
to lead to migration and to economic loss (Scheffran & Battaglini, 2011, p. 531), which is linked
to conflict. Migration might lead to conflict where newcomers and old inhabitants are in
competition over the same resource, in particular where these conflicts arise along existing
fault lines, such as one ethnic group migrating to an area predominantly inhabited by another
or pastoralists and farmers coming into competition over the same land (Reuveny, 2007).
There is a clear difference between the impacts of catastrophic events (floods, droughts,
typhoons), which are likely to lead to a large exodus and longer processes due to climate
change (rising sea levels, desertification), which are likely to lead to a slow trickle of migration
over a longer time (Gleditsch, Nordas, & Salehyan, 2007, p. 4). While a large inflow of refugees
can contribute to conflict (Salehyan & Gleditsch, 2006), this is not necessarily so. Considering
some of the natural disasters that brought about large streams of refugees, (e.g. the 2011
Tsunami in Japan, the 2006 Tsunami in the Pacific, Hurricane Katrina in 2005, the 2010
earthquake in Haiti), these events did not lead to concerted violence of host communities
against the refugees. There are also cases where host communities expect better economic
1 6 C l i m a t e C h a n g e , R e s o u r c e S c a r c i t y a n d A r m e d C o n f l i c t
opportunities as a result of the placing of a refugee camp in the surrounding area (A. Martin,
2005, p. 337).
Other aspects of climate change might also lead to migration. For instance where changes in
the climate make agriculture more difficult, this might increase rural-urban migration. In a
study of the determinants of rural-urban migration, Barrios et al. (2006) found that 1% decline
in rainfall induces urbanization to rise by 0.45%. However, as reasons for people to migrate
from one area to another are manifold, the research on climate-induced migration does not
yet yield conclusive results on the impact of climate change on migration and of the impact
of migration on conflict. While some argue that there will be up to 200 million climate
refugees by 2050 (Myers, 2002), this remains speculative and there are no conclusive results
on the impact of sea-level rise and migration on conflict.
Empirical studies linking climate and conflict reach divergent results, which is echoed by most
reviews of the literature (Gleditsch, 2012; Scheffran & Battaglini, 2011; Theisen, Gleditsch, &
Buhaug, 2013). However a recent metastudy (Hsiang et al., 2013, p. 1) of 60 quantitative
studies finds a “remarkable convergence of results” for both interpersonal and intergroup
violence. They find that large deviations from mild temperatures and normal rainfall increase
the risk for conflict substantially: For every standard deviation warming in temperature or
more rainfall, the frequency of interpersonal violence increases by 4% and intergroup conflict
increases by 14%. Hsiang et al. (2013, p. 2) argue that by employing a standardized statistical
model they can minimize statistical bias and solve a number of problems present in other
studies. In addition, studies in this metastudy are weighted according to statistical precision.
Together the weighting of results and the standardization of the statistical model used
account for the convergence of results, which stands in opposition to the divergence in
original findings of the studies. A promising avenue for exploring and resolving many of the
contradictory results of the impact of climate change and conflict is the recent work using
geographical disaggregation (Buhaug, Gates, & Lujala, 2009; Buhaug, 2010b; Cederman &
Gleditsch, 2009) and the increasing availability of geo-referenced data (Hallberg, 2012;
Tollefsen, Strand, & Buhaug, 2012). Focusing on smaller geographic units might lead to a
convergence of empirical evidence.
RESOURCE SCARCITY AND ARMED CONFLICT
The link between climate change and conflict that is the main focus of this dissertation
concentrates on changes to the natural environment and resource scarcity. This is linked to
an older debate focusing on links between resource scarcity and violent conflict. Resource
scarcity arguments usually focus on livelihood resources, i.e. resources that humans need to
sustain their livelihoods, such as freshwater, arable land, forests and fish5, thus placing an
5 In addition to the resource scarcity theories discussed here, other perspectives on the role of resources in armed conflict are possible as well. Researchers focusing on resources that can easily be looted to finance conflicts (Collier, Hoeffler, & Rohner, 2009; Collier & Hoeffler, 2004; Fearon, 2005; Humphreys, 2005; Le Billon,
C l i m a t e C h a n g e , R e s o u r c e S c a r c i t y a n d A r m e d C o n f l i c t 1 7
emphasis on human security. Whereas most studies on resource scarcity focus on internal
conflict, there are some examples of studies focusing on international conflict as well. While
I focus on internal (or intrastate) conflict, I will give a short overview of arguments and
evidence on resource scarcity and international conflict first. This shows that there are few
serious cases of international conflicts over resources and that cooperation rather than
conflict over resources is the more common outcome.
INTERNATIONAL CONFLICT OVER SCARCE RESOURCES
Examples of studies on resource scarcity and international conflict include studies on the so-
called “water wars”, as well as on conflicts over fish and land. While some studies find a
moderate impact of water scarcity on conflict, most authors argue that the notion of water
wars is overstated. Furlong et al. (2006), for instance, find that there is an increased (but
overall still low) risk of conflict if two countries share a river basin and at least one of them
experiences water scarcity. Contradicting this, Gleditsch et al. (2006) argue that water scarcity
increases the risk of violent conflict only in cases where countries do not share a river basin.
Toset et al. (2000) argue that the risk for violent conflict is higher when countries share a river,
but point out that this could be due to the fluidity of river boundaries. Hensel et al. (2006)
find that scarcity in one of the states increases the likelihood of militarisation over the issue,
but that specific institutions decrease the risk of violent conflict. Similarly, Tir and Stinnett
(2012) show that water scarcity increases the risk of military conflicts over transboundary
river resources but that the institutional arrangements of transboundary river treaties can
offset this, making international agreements an important tool in preventing conflict breaking
out over water scarcities induced by climate change. Giordano et al. (2005) also point to the
importance of institutions for avoiding conflict. They argue that conflicts are more likely in
situations where resource sovereignty is ill-defined, existing institutions are destroyed or the
environment changes so rapidly that existing institutions are unable to adapt in time. Many
authors argue that the idea of “water wars” is overstated (Barnett, 2000; Beaumont, 1997;
Deudney, 1990; Lonergan, 2001). Very few conflicts over water actually resulted in military
action and the only recorded outright war over water took place more than 4500 years ago
2001; Lujala, n.d.; Ross, 2006) such as oil, gold or diamonds often argue that an abundance of resources increases the risk of civil war as it provides financing for rebel armies, increases the value of the state as target or provides incentives for separatist movements. Much of this literature uses statistical analysis and econometric modeling, but some case studies are available as well (Ross, 2004). These arguments will be explored further in chapter 4 on economic explanations for conflict. Another strand of literature focuses on the strategic role of resources, in particular on energy resources such as oil and gas and their transport through shipping or pipelines. In contrast to researchers focusing on scarcity or abundance of natural resources, who tend to be interested in the role of resources in internal conflict, researchers focusing on the strategic role of resources are mostly concerned with the security of states, so their focus is on conflicts between rather than within states. Generally, the literature on strategic resources and pipelines as reasons for conflicts focuses mostly on descriptive case studies and journalistic accounts. Particular attention is paid to three regions: the Caspian Sea region, the Persian Gulf and the South China Sea. Yet, the literature lacks analytical rigour and a theoretical framework. However, some more rigorous research from a realist perspective exists as well (Klare, 2001). I am not exploring these arguments further since they focus on different types of resources (strategic rather than livelihood) and different types of conflict (interstate rather than intrastate).
1 8 C l i m a t e C h a n g e , R e s o u r c e S c a r c i t y a n d A r m e d C o n f l i c t
between the two Mesopotamian city states of Lagash and Umma (Wolf, Kramer, Carius, &
Dabelko, 2005, p. 84). On the other hand, there are many more instances were shared water
led to cooperation, not conflict. Since 1945 more than 150 international water agreements
have been signed, dealing with issues like water quantity, quality of water, economic
development and hydroelectric power. 60% of the world’s freshwater supplies come from
rivers shared between two or more nations, but only 37 disputes involving violence occurred
in the last 50 years. In fact, two thirds of all international water-related incidents in that time
were of cooperative nature (Wolf et al., 2005, p. 84). International water agreements also
tend to be rather enduring. The Indus Water Treaty, a water-sharing agreement between
India and Pakistan over water resources in the Indus water basin, which was signed in 1960,
for instance, survived three wars between the signatories (Wolf et al., 2005, p. 85). Water
cooperation between Israel and Jordan dates back to the 1950s, even though the countries
were officially at war. Through those interactions, trust was built, leading to the 1994 peace
agreement between the two countries (Wolf et al., 2005, p. 86). Similarly, the Oslo Peace
Talks between Israel and Palestine were preceded by talks about the Jordan River basin,
enabling the two parties to establish ties, making peace negotiations a lot easier (Libiszewski,
1997). The Permanent Okavango Basin River Water Commission, established by Angola,
Namibia and Botswana amidst mounting tensions over the use of the water resources has
also helped to foster cooperation between the riparian states (Barnett, 2000, p. 277).
Fish is sometimes seen as a scarce resource that can inspire conflicts, even among Western
democracies. However, while there is some talk about “cod wars” and “turbot wars” (Soroos,
1997b), they are clearly misnomers. These conflicts rarely escalate to the point where humans
die, and never at the large scale the term “war” implies (Gleditsch, 2001, p. 261).
Furthermore, most instances of violence occurred between fishing vessels in foreign waters
and representatives of that state, for instance the navy or the coast guard, but never of
representatives of two states, which would be required to consider these instances an inter-
state war.
Other studies discuss the relationship between land scarcity and interstate conflict. A study
by Tir and Diehl (1998) for instance found that population growth pressures had a positive
but moderate impact on interstate conflict while population density did not. This finding is
supported by Stalley (2003) who also found that soil erosion is significantly and positively
related to violent conflict. In general, however, livelihood resources, such as water, land or
fish have mostly been discussed in relation to conflict within states rather than between
states and there are very few examples of interstate conflicts that erupted over scarce
resources.
INTERNAL CONFLICT OVER SCARCE RESOURCES
The main focus of research linking a scarcity of resources and violent conflict is on internal
conflict. This is the main literature that this dissertation builds on and contributes to. For this
reason, this literature is reviewed in some detail here. There are various ways to group this
C l i m a t e C h a n g e , R e s o u r c e S c a r c i t y a n d A r m e d C o n f l i c t 1 9
literature: Environmental conflict has been discussed in subsequent “generations”
(Rønnfeldt, 1997) where the first generation focused on integrating the environment in
security research, the second generation aimed at identifying the causal pathways from
environmental change to conflict and the third generation was mostly concerned with
improved methodology and the role of resource cooperation. Resource scarcity and conflict
has also been discussed with regard to methodology and research design (Gleditsch, 2001),
according to normative underpinnings and epistemology (Barnett, 2001) and in various
schools of thought (Theisen, 2008). I show that previous empirical studies fail to take social,
economic and political conditions into account, which explains the contradiction between
strong theoretical arguments, strong evidence in some case studies but weak or no links in
quantitative studies. To do so, I start by reviewing the roots of resource scarcity, the main
contributors and their theoretical arguments linking resource scarcity and conflict and key
criticisms of these arguments from the political ecology perspective and neo-classical and
cornucopian perspectives. I then turn to the empirical evidence from case studies and
quantitative studies and methodological criticisms of these studies. Finally, I analyse the
insufficient inclusion of social, economic and political conditions in these studies and
introduce an adaptive capacities framework to facilitate the analysis of these conditions.
Roots of Resource Scarcity Theories
Resource scarcity theory builds on relative deprivation theory as well as Malthusian thought.
Relative deprivation (Gurr, 1970) focuses on the discrepancy between actors’ perceived
entitlements of goods or conditions and the goods or conditions they can actually achieve, in
particular in reference to other members in society. The gap between perceived and actual
entitlements leads to frustration and aggression. This argument is taken up by resource
scarcity theories, such as Kahl (2008, p. 36) who argues that
DES [demographic and environmental stress] can increase the level of grievances within societies. The primary
sources of such grievances are absolute and relative deprivation brought on by population and environmental
pressures on the poor. Absolute deprivation occurs when there is a discrepancy between what people get and
what they need. Relative deprivation occurs when there is a discrepancy between what people get and what they
feel they are entitled to.
Resource scarcity theorists are sometimes referred to as neo-Malthusian as their theories are
based on Malthus' (1789) insight that population grows exponentially while the food supply
can only grow linearly, meaning that the food supply will always grow slower and therefore
limit population growth. Modern versions of Malthus’ argument were put forward by Paul
Ehrlich (1968) in his bestseller “The Population Bomb” and the Club of Rome (Meadows,
1972), both of which argue that population growth will soon outstrip the available resources
on earth. Other alarmist literature on the subject includes Hardin (1968), Myers (1993),
Renner (1997) and Ehrlich and Ehrlich (1990). Myers (1987, p. 16) puts the key argument like
this:
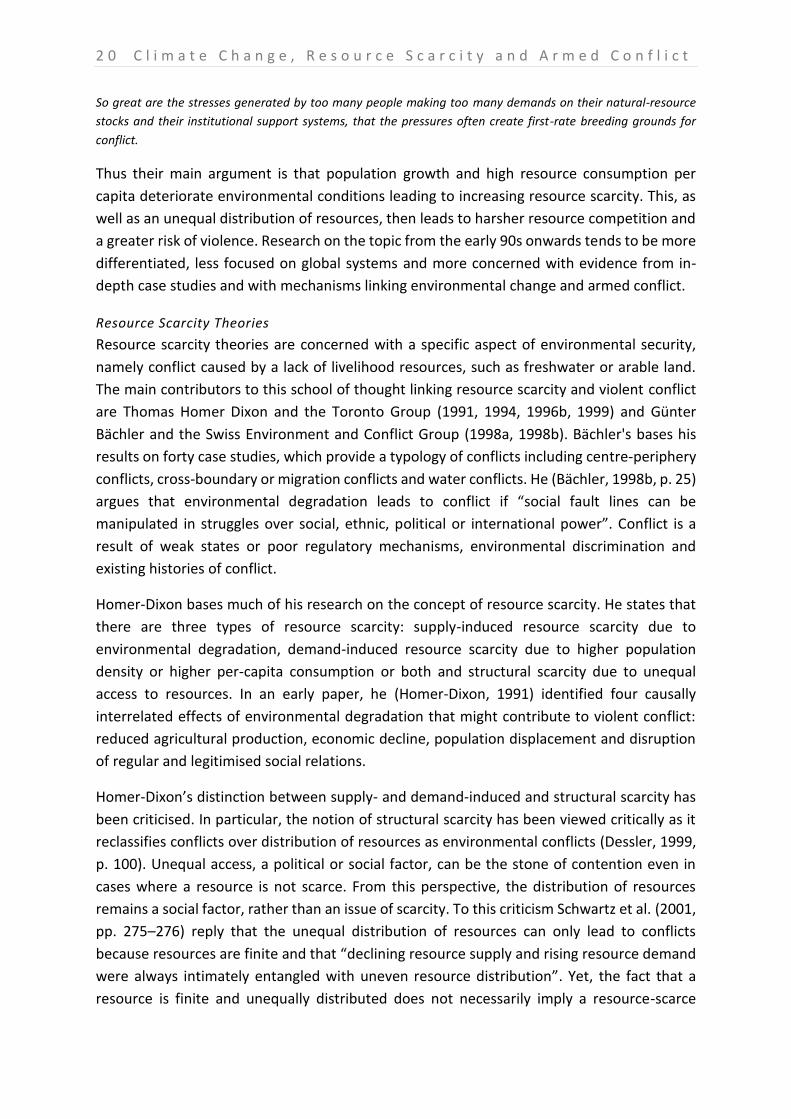
2 0 C l i m a t e C h a n g e , R e s o u r c e S c a r c i t y a n d A r m e d C o n f l i c t
So great are the stresses generated by too many people making too many demands on their natural-resource
stocks and their institutional support systems, that the pressures often create first-rate breeding grounds for
conflict.
Thus their main argument is that population growth and high resource consumption per
capita deteriorate environmental conditions leading to increasing resource scarcity. This, as
well as an unequal distribution of resources, then leads to harsher resource competition and
a greater risk of violence. Research on the topic from the early 90s onwards tends to be more
differentiated, less focused on global systems and more concerned with evidence from in-
depth case studies and with mechanisms linking environmental change and armed conflict.
Resource Scarcity Theories
Resource scarcity theories are concerned with a specific aspect of environmental security,
namely conflict caused by a lack of livelihood resources, such as freshwater or arable land.
The main contributors to this school of thought linking resource scarcity and violent conflict
are Thomas Homer Dixon and the Toronto Group (1991, 1994, 1996b, 1999) and Günter
Bächler and the Swiss Environment and Conflict Group (1998a, 1998b). Bächler's bases his
results on forty case studies, which provide a typology of conflicts including centre-periphery
conflicts, cross-boundary or migration conflicts and water conflicts. He (Bächler, 1998b, p. 25)
argues that environmental degradation leads to conflict if “social fault lines can be
manipulated in struggles over social, ethnic, political or international power”. Conflict is a
result of weak states or poor regulatory mechanisms, environmental discrimination and
existing histories of conflict.
Homer-Dixon bases much of his research on the concept of resource scarcity. He states that
there are three types of resource scarcity: supply-induced resource scarcity due to
environmental degradation, demand-induced resource scarcity due to higher population
density or higher per-capita consumption or both and structural scarcity due to unequal
access to resources. In an early paper, he (Homer-Dixon, 1991) identified four causally
interrelated effects of environmental degradation that might contribute to violent conflict:
reduced agricultural production, economic decline, population displacement and disruption
of regular and legitimised social relations.
Homer-Dixon’s distinction between supply- and demand-induced and structural scarcity has
been criticised. In particular, the notion of structural scarcity has been viewed critically as it
reclassifies conflicts over distribution of resources as environmental conflicts (Dessler, 1999,
p. 100). Unequal access, a political or social factor, can be the stone of contention even in
cases where a resource is not scarce. From this perspective, the distribution of resources
remains a social factor, rather than an issue of scarcity. To this criticism Schwartz et al. (2001,
pp. 275–276) reply that the unequal distribution of resources can only lead to conflicts
because resources are finite and that “declining resource supply and rising resource demand
were always intimately entangled with uneven resource distribution”. Yet, the fact that a
resource is finite and unequally distributed does not necessarily imply a resource-scarce
C l i m a t e C h a n g e , R e s o u r c e S c a r c i t y a n d A r m e d C o n f l i c t 2 1
situation. This argument is reflected in my case selection, which focuses on situation where
the available resources cannot support the livelihoods of the people living in the area, using
absolute levels of resources available rather than the perceptions of resource scarcity.
The Washington-based Worldwatch Institute is a third research group to follow a neo-
Malthusian logic, in particular in its early papers on the issue. For instance, Renner (1999, pp.
39–40) writes:
The depletion of freshwater resources, excessive exploitation of fisheries, degradation of arable land, and
deforestation, among other problems, not only affect human health and well-being and imperil the habitability
of some regions, but they are also increasingly understood to play an important role in generating or
exacerbating some conflicts.
Researchers at the Peace Research Institute Oslo (PRIO) have also conducted a lot of research
on links between climate change, the natural environment and conflict, much of it focusing
empirical studies to explore these links. In addition, a number of other authors (e.g. Kahl,
2008) have argued that resource scarcity can lead to conflict. Much research has focused on
the linkages between resource scarcity and armed conflict. There exist various mechanisms
of how resource scarcity leads to armed conflict in the literature. I summarise these into the
following three: inter-group dynamics, migratory pressures and state manipulation.
Explanations focusing on inter-group conflict argue that competition over scarce resources
exacerbates existing cleavages in societies. If resource conflicts are framed in terms of ethnic,
social, religious or political groups, this can result in a hardening of group identities and inter-
group conflict (A. Martin, Blowers, & Boersema, 2006). In situations where the state is absent,
this can lead to a process similar to a security dilemma, termed state failure hypothesis by
Kahl (2008, pp. 44–50). If one group tries to increase their access to a resource, which is
perceived as threat by other groups, they will in turn try to increase their security. Even
though both groups are aiming at security not conflict, this situation can spiral into violent
conflict:
DES [demographic and environmental stress] increases incentives for violence by contributing to deprivation and
intergroup competition over scarce resources. This ratchets up the level of societal grievances and resource
competition, thus increasing incentives for antistate and intergroup conflict. DES increases the opportunities for
violence by undermining economic productivity, reducing state revenue, and increasing societal demands. This
can weaken the capacity, cohesion, and legitimacy of states and thereby increases the “political space” for
collective violence. (Kahl, 1998, p. 84)
A similar argument is put forward by Goldstone (1993) who argues that the impact of
increasing demographic stress on economic, political and social institutions can lead to a
breakdown of relations between popular groups, elites and the state leading to rebellion and
revolution. However, he views the environment as having a role in a conflict only if societal
relations are shaped by it, e.g. if the breakdown between elites and popular groups leads to
elites trying to take land from other groups. Generally, however, Goldstone (2002, p. 4) argues
2 2 C l i m a t e C h a n g e , R e s o u r c e S c a r c i t y a n d A r m e d C o n f l i c t
that “environmental degradation is not a major or pervasive cause of international wars,
ethnic wars or revolutionary conflicts.”
A second mechanism focuses on migratory pressures, termed ecological marginalization by
Homer-Dixon (1999, p. 74). Scarcity provides incentives for people to migrate to other areas,
where this might result in tensions between those already living in the area and newcomers.
In addition, the influx of newcomers can lead to increased pressures in the new area, which
might prompt further migration.
The third mechanism consists of the manipulation of the state by groups in power, termed
resource capture by Homer-Dixon (1999, p. 74) and state exploitation hypothesis by Kahl
(2008, pp. 50–51): In a situation of scarce resources elites might be tempted to use their
power to secure their access to scarce or potentially scarce resources. By manipulating state
policies in their favour, they can limit access to resources to themselves and their supporters.
This may contribute to social unrest or even spark conflict. It also weakens the institutions of
the state and state capacities. This is explained by Kahl (1998, p. 88):
The resource and economic competition engendered by mounting population and environmental pressures can
easily create zero-sum distributional conflicts between social groups and absolute and relative deprivation
stemming from DES [demographic and environmental stress] can expand the breadth and depth of intergroup
animosities. In such a volatile social climate, state elites have ample opportunities to spark violent conflicts by
playing on the fears, hatreds, and desires of contending groups. Elites may indirectly incite violence by
capitalizing on propaganda advantages, such as the control over means of communication, to exaggerate the
threats posed by certain groups or the potential gains to be had if one groups attacks another.
Weakened states, however, are less likely to provide mechanisms for peaceful solutions to
conflicts, therefore making violent conflict more likely.
It is important to note that most writings on resource scarcity do not envision a direct link
between resource scarcity and violent conflict. Homer-Dixon (1996a, p. 53) states that:
Scarcities indirectly contribute to conflict by producing various forms of economic and institutional dislocation; it
is only rarely that people fight directly over resources.
Other perspectives on the environment-conflict nexus have viewed the various links between
resource scarcity and conflict that resource scarcity theories envision critically. Political
ecologists focus on the specific contexts and histories in each case, while cornucopian and
neo-classical perspectives emphasise human inventiveness and the adaptive capacities of
societies and markets.
CRITICISM FROM POLITICAL ECOLOGY
Political ecologists are influenced by dependency theory and therefore focus on the global
political and economic processes and issues of discrimination and distribution. They deny any
direct link between natural resources and violent conflict (Fairhead, 2001; Hartmann, 2001;
Hildyard, 1999; Peluso & Watts, 2001a). Many political ecologists argue from a more
interpretivist epistemological standpoint leading to a different perspective on the importance
C l i m a t e C h a n g e , R e s o u r c e S c a r c i t y a n d A r m e d C o n f l i c t 2 3
of context like social processes and histories and to criticisms of environmental determinism.
Other points raised by political ecologists are the issues of reverse causality and the Western-
centric approach by resource scarcity theorists.
Resource Scarcity as Result of Social Processes
A key criticism raised by political ecologists is the definition of resource scarcity. While most
studies from the resource scarcity perspective opt for a positivist stance, operationalising
resource scarcity in terms of available resource per person, political ecologists criticise this
framing of the environment (Peluso & Watts, 2001b). For instance, Hagmann (2005, p. 14)
criticises the link between population growth and scarcity arguing that the relationship is
more complex than a simple causality. A similar argument is made by Le Billon (2001) who
argues that scarcity and abundance themselves are often processes of social and economic
developments across space. Similarly, Lipschutz (1997, p. 35) argues that by definition scarcity
represents a product of social processes rather than nature. He warns against the
“environmental determinism” in much of the environmental conflict literature as it
“naturalizes” the process where one actor takes control over others. Taking environmental
factors as causal variable negates the impact of the actors in society and may let political
leaders of the hook. Barnett (2000, p. 276) points out that violent conflict over scarce
resources shows a failure of political dialogue rather than a necessary outcome. Framing
these conflicts in terms of environmental determinism only “denies responsibility for peaceful
action, and justifies violence in lieu of meaningful dialogue.” Looking at the conflict in Darfur,
de Waal (2007) argues that
Depleted natural resources and livelihood transformations cannot on their own account for conflict, let alone
armed conflict. The most important culprit for violence in Darfur is government, which not only failed to utilize
local and central institutions to address the problems of environmental stress in Darfur, but actually worsened
the situation through its militarized, crisis management interventions whenever political disputes have arisen.
A society’s perception of “their” resources is shaped by societal processes such as socially
defined property rights or symbolic meanings, shaping the interactions between the social
and ecological sphere. Political leaders can manipulate these processes hoping to gain. From
this Hagmann (2005, p. 17) deduces that resource scarcity cannot explain conflict when the
more complex interactions between humans and nature are not fully understood. Most
resource scarcity theorists assume that the natural environment has the capacity to
determine social interactions in resource-scarce countries, while there might be an
interdependent relationship between the ecosystem and human social interaction.
Therefore, resource scarcity “is first and foremost a property of a relationship between
groups and their ecosystem” (Hagmann, 2005, p. 16). Similarly, Benjaminsen (2008) has
argued that degradation is a highly subjective concept. Whether an area is considered
degraded or not can depend on what the person making the assessment considers the
“natural” use of the land.
2 4 C l i m a t e C h a n g e , R e s o u r c e S c a r c i t y a n d A r m e d C o n f l i c t
Missing Link Between Conflict and Violence
Political ecologists also criticise the assumption that conflict will lead to violence arguing that
history emphasises conflicts over cooperation, but resource scarcity theorists fail to explain
the exact links between conflict and violence. In addition, case selection might bias results
since resource scarcity theorists tend to use cases where conflicts occurred rather than those
that remained peaceful. In particular, resource scarcity theorists do not show clear links
between environmental change and conflict as many of the key concept used in causal
pathways are underspecified and do not take into account the larger political economy under
which these forces operate (Peluso & Watts, 2001b, p. 20). Using historical examples to argue
that there is a human tendency to go to war over resources is misleading as history tends to
emphasise times of war over times of peace, while “the overarching message of history is that
humans as individuals and as species continually adapt and survive, and are therefore able to
adapt to environmental pressures” (Barnett, 2000, p. 285). In addition, the case selection of
resource scarcity theorists emphasises conflict but neglects to discuss cases where scarcity
led to cooperation (Rønnfeldt, 1997, p. 477). Deudney (1990) argues that there are many
reasons for actors in resource-scarce societies to engage in cooperation rather than conflict,
such as the cost of conflict and technological alternatives for scarce resources. Environmental
degradation might also spark cooperative action to halt the degradation rather than conflict.
For instance, Dokken (1997) shows in study of regional integration in West Africa how
cooperation can break the links between environmental change and conflict. She argues that
the threat of an environmental conflict was a main cause for actors to engage in cooperative
efforts. Hagmann (2005, p. 19) also criticises the neglect of the social dynamics producing and
shaping collective mobilisation. While many theories include a number of variables in order
to explain why there is conflict over scarce resources, he finds these explanations lacking to
explain why humans go to war over these issues. Finally, resource-scarcity theorists
exclusively focus on physical violence and ignore non-physical acts of violence (Peluso &
Watts, 2001b, p. 23)
Ahistorical Nature of Resource Scarcity Theories and Environmental Determinism
Political Ecologists often criticise the ahistorical nature of resource scarcity theories focusing
solely on the level of resources in a country but failing to take the historical processes into
account (Barnett, 2000, p. 284; Matthew, 2002, p. 114; Smil, 1997, p. 108). In particular, some
authors (Barnett, 2000, p. 284; Matthew, 2002, p. 113) cite the often violent colonial
experiences (among other factors) in many developing countries and their impact on factors
like ingenuity and population growth as key factors overlooked by resource scarcity theorists.
Matthew (2002, p. 114) argues
that environmental change, resource scarcity, and resource abundance have been linked to insecurity and
violence through social processes of greed and grievance for a very long time; that contemporary conflicts build
on and are shaped by histories that might have to be understood in order for the conflict to be resolved; and that
societies of all types have usually proven resilient and innovative in the face of environmental change.
C l i m a t e C h a n g e , R e s o u r c e S c a r c i t y a n d A r m e d C o n f l i c t 2 5
From a political ecologist’s view resource scarcity theories seem like “environmental
determinism” (Smil, 1997, p. 109) due to the neglect of long-term historical perspectives and
the complex relationship between civilizations and their environment. Barnett (2000, p. 285)
argues that this environmental determinism stems, at least in part, from the intersection of
biology and political science with biologists, e.g. Gleick (1989, 1990, 1991) and Myers (1993)
commenting on political science and political scientists like Homer-Dixon using biology as
their starting point, leaving little room for a more interpretivist perspective.
Reverse Causalities and the Impact of Other Factors
Political ecologists also maintain that environmental degradation and conflict are both caused
by other factors such as bad governance and corruption (Peluso & Watts, 2001a). The
proposed causal link between scarcity and violent conflict is therefore viewed critically. This
argument sheds light on a difficulty with resource scarcity theories: Reverse causalities and
feedback loops. While resource scarcity leads to conflict, conflict also leads to resource
scarcity through habitat destruction and loss of wildlife, over-exploitation of natural
resources, pollution and the breakdown of environmental policies and programmes
(Matthew, Halle, & Switzer, 2002, pp. 366–369). The Environmental Vulnerability Index (UNEP
& SOPAC, 2004), for instance, includes conflicts within the country over the past 50 years as
an indicator for environmental vulnerability, arguing that “conflicts can result in habitat
disturbance and degradation, pollution and a complete breakdown in environmental
management.” McMichael (1993, p. 22) argues that this could lead to a vicious circle where
“environmental destruction and resource scarcity promote war which, when it breaks out,
further increases environmental destruction and resource depletion”. The issue of reverse
causalities and feedback loops is also raised by scholars from a econometric background, who
argue that the dynamic nature of the link between resource scarcity and armed conflict can
be more accurately represented in an econometric model (Maxwell & Reuveny, 2000, p. 314).
While many resource scarcity theorists (Homer-Dixon, 1999) acknowledge the possibility of
feedback loops and reverse causality, there is little systematic study or empirical evidence of
the issue. Schwartz et al. (2001, p. 278) retain that the scarcity of resource is at least in part
“a function of the particular physical characteristics of the society’s surrounding
environment”. In addition, they argue, once environmental scarcity becomes irreversibly, it is
by definition an exogenous factor as even very sensible policies cannot bring back things like
washed-away topsoil.
Euro-Centric Perspective
Barnett (2000, p. 274) also points out that much of the environment security literature
focuses on case studies in developing countries. He questions the underlying assumption that
people in developing countries are somehow more likely to resort to violence, arguing that
“there is continued scripting of people from the South as barbaric, strongly implying that
those in the North are more civilised”. He, however, gives some unrelated reasons why the
North might be resilient to environmental conflict. There are three safeguards against
violence over scarce resource in industrialised societies: Many industrialised economies
2 6 C l i m a t e C h a n g e , R e s o u r c e S c a r c i t y a n d A r m e d C o n f l i c t
transfer environmental degradation abroad. The level of wealth in the industrialised world
allows for institutions providing stability and resilience to environmental change. The trade in
industrialised countries helps to solve issues of resource scarcity. Similarly, Gleick (1990, p.
518) argues that “developing countries have far fewer technical and economic resources at
their disposal” and therefore have less capacities to adapt to environmental change. Gleditsch
(2001, pp. 261–262) points out that most developed countries are actually relatively resource
friendly as richer countries can afford more advanced technology and pay a higher premium
for a clean environment.
Summary of the Arguments of Political Ecologists
All these arguments lead many political ecologists to argue for a more encompassing
environmental security literature. Matthew (2002, p. 120) focuses on three “dimensions”:
The historical context of environment-human relations and the way history shaped the
institutions and identities that still determine how the resource scarcity is viewed today; the
specific conditions under which environmental pressures lead to violent conflict and the
capacity of societies to adjust to changing circumstances.
Many of the more recent writings from the resource scarcity theorists have taken the
arguments of political ecologists on board. Kahl (2008, p. 11), for instance, argues that many
resource scarcity theorists exaggerate the importance of environmental factors while
neglecting intervening processes. There have been many efforts in empirical studies to
describe the exact causal linkages, sometimes finding that the environment plays at most a
limited role (e.g. Benjaminsen, 2008). Empirical studies are generally aware of the problems
regarding reverse causalities and there have been efforts to include the social, political and
economic conditions (see below). I follow the political ecologists’ arguments about the
importance of context conditions but in contrast to political ecologists, I search for patterns
across cases that allow me to draw general conclusions.
NEO-CLASSICAL AND CORNUCOPIAN CRITICISMS
Cornucopian and neo-classical scholars offer a different perspective on the issue as they
believe that resource scarcity can be overcome by a number of mechanisms. Neo-classical
critique of resource scarcity theories focuses on the abilities of markets and international
trade to reduce resource scarcities. Simon (1981) puts forward the basic argument that
market mechanisms can help to overcome scarcity through prices and substitution.
Therefore, even societies dependent on a particular resource today, can overcome this
dependence by substitution or international trade. Lomborg (2001, p. 148) argues that
scarcity of water can be overcome by pricing it adequately as this will increase water efficiency
and place water-intensive productions in water-rich countries through international trade.
Cornucopians are named for the “horn of plenty” in Greek mythology which reflects the
Cornucopian belief that human inventiveness and technological advances can overcome
resource scarcities. They argue that resource scarcity theories ignore human inventiveness
and technological advances which can help to overcome resource scarcity, for instance
C l i m a t e C h a n g e , R e s o u r c e S c a r c i t y a n d A r m e d C o n f l i c t 2 7
through the increase in agricultural production. This is the key argument put forward by
Boserup (1965): She argues that population pressures often lead to more effective
agricultural techniques, and that in particular, the shift from fallowing (and the use of slash
and burn farming) to annual cultivation often took place in times of increasing population
density, necessitating agricultural intensification. Another example is the “green revolution”
following the introduction of high-yield crops, such as the dwarf wheat developed by Norman
Borlaug in the 1950s and 60s. Ehrlich (1968, p. xi) insisted that “the battle to feed all of
humanity is over. In the 1970s and 1980s hundreds of millions of people will starve to death
in spite of any crash programs embarked upon now” and made the prediction that India would
not be able to feed itself due to population growth. He was proved wrong when India was
self-sufficient by 1974 with wheat harvests increasing from 11 million tons in 1965 to 60
million tons annually in the 1990s (Easterbrook, 1995) due to the introduction of dwarf wheat.
This trend can be seen on a global level as well: Lomborg (2001, pp. 127–129) points out that
the world’s agricultural production has doubled since 1961 and tripled in developing
countries, resulting in a 14% drop in the number of people suffering from hunger and
coinciding with falling prices for agricultural produce.
In addition, prominent cornucopians like Lomborg (2001) have argued that resources are
nowhere near as scarce as some neo-Malthusian authors like to make out, in particular when
viewed on a global scale. Neo-classical and cornucopian arguments rely on the market to put
mechanisms in place to overcome regional scarcities. As a resource becomes scarce, prices
will rise. Rising prices will provide incentives to come up with technologies to either substitute
the resource or find ways to use the resource more efficiently. Rising prices will also lead to
more international trade. There are, however, circumstances where the cornucopian
arguments do not hold. Local scarcities of livelihood resources such as freshwater or firewood
in developing countries can be difficult to alleviate through price mechanisms or substitution
(Barnett, 2000, p. 273).
Resource scarcity theorists (D. M. Schwartz et al., 2001, p. 276) point out that while
Adaptive processes certainly operate in many cases […] societies often fail to adjust adequately to scarcity, with
poverty, migrations, and institutional failure as result. Just because humans are remarkably adaptive in some
cases does not mean that they are always adaptive.
I include cornucopian arguments by including adaptive skills such as the level of technology
or education.
The obvious question at this point is which societies adapt and which do not and why? Why
can people adapt in some situations but not in others? Neither resource scarcity theorists nor
Cornucopians provide convincing answers to this question. The aim of this dissertation is to
find an answer to the question what differentiates resource-scarce societies that remain
peaceful from those that do not.
2 8 C l i m a t e C h a n g e , R e s o u r c e S c a r c i t y a n d A r m e d C o n f l i c t
EMPIRICAL EVIDENCE ON THE LINKS BETWEEN RESOURCE SCARCITY AND VIOLENT CONFLICT
Even though there is a considerable body of empirical research on the links between resource
scarcity and armed conflict, there are no conclusive results. While the strongest support for
links between resource scarcity and armed conflict comes from detailed case studies, most
quantitative studies find no or only very weak links between resource scarcity and armed
conflict. I argue that these contradictory results can be explained by taking the social,
economic and political conditions in different countries into account. While there is an early
study on population pressure as a factor in the outbreak of war (Bremer, Singer, &
Luterbacher, 1973), most empirical studies were conducted in the early nineties or later.
CASE STUDIES
Much of the early research has been based on illustrative case studies including, for instance,
Rwanda (Percival & Homer-Dixon, 1996, p. 276), the Philippines (Kahl, 2008), Gaza (Kahl,
2008), Chiapas in Mexico (Howard & Homer-Dixon, 1996), South Africa (Howard & Homer-
Dixon, 1996), Bangladesh (Swain, 1996), Pakistan (Matthew, 2001), Bougainville in Papua New
Guinea (Boege, 1999) and the Senegal River (Homer-Dixon, 1994). Most of these case studies
use process-tracing as their key methodology, aiming to map important variables and causal
pathways from resource scarcity to violent conflict. Most case studies focus on a number of
intervening mechanisms and variables to explain how resource scarcity and armed conflict
are linked6.
While some case studies such as Kahl’s (1998) discussion of Kenya provide convincing
evidence for the linkages between resource scarcity and violent conflict, other cases such as
Rwanda are more controversial and some case studies such as Percival and Homer-Dixon’s
(1998) treatment of the South African case are unconvincing.
In a case study of Kenya, Kahl (1998) focuses on the intervening variables of groupness and
institutional inclusivity to explain how scarcity of arable land due to fast-growing population,
significant environmental degradation and uneven distribution of good agricultural land led
to inter-ethnic strife. Institutional inclusivity, defined as the degree to which key social groups
are institutionally empowered to participate in, and influence decision making by state elites,
allows disadvantaged groups to place limits on the exploitation of more privileged groups and
therefore reduces the likelihood of violent conflict. In the Kenyan case, the exclusive and
authoritarian rule during most of the post-colonial period led to highly centralized and quasi-
authoritarian rule with a system of ethnic patronage, which facilitated ethnic violence. A high
degree of social segmentation or groupness facilitates the formation of conflict groups, which
increases the prospects for state exploitation. Members of the Kalenjin and Maasai ethnic
groups could be enticed by their leaders to terrorize their long-time neighbours because of
their desperate hunger for land and their fears that pluralism would result in their groups
losing political power:
6 For an overview of a selection of case studies see Table B.1 in the appendix.
C l i m a t e C h a n g e , R e s o u r c e S c a r c i t y a n d A r m e d C o n f l i c t 2 9
The nature of group identification and the degree of intergroup competition in violence-affected areas help
explain why individual Kalenjins, Maasais, and others were able to overcome the free-riding dilemmas normally
associated with violent collective action. Rural residents tended to define their interests collectively in terms of
the broader interests of their ethnic group. They also received a host of benefits from group membership, not the
least of which being privileged political and economic resources from the Kenyan state. This made it easier for
Kalenjin and Masaai elites to rally their brethren to violence on the basis that minority rights and their
communities’ privileged access to wealth and power would be placed in jeopardy if they failed to drive Kikuyus,
Luhyas, Luos, Kisiis off “their” land. Violent collective action was further facilitated by the ability of state elites to
provide private benefits, in the form of access to cheap and desirable land, to those who directly took part in the
violence. (Kahl, 1998, p. 115)
Kahl (1998, p. 116) also argued that the fact that class identities in urban Kenya tended to cut
across ethnic lines (and therefore led to a much lower groupness in cities) helped to prevent
the spread of violence from rural to urban areas.
In the case study of Rwanda, very different conclusions have been drawn on whether
resource scarcity contributed to genocide. An ethnographic study by André and Platteau
(1998, p. 38) came to the conclusion that the strained situation due to resource scarcity
greatly contributed to the spreading of violence in the countryside during the 1994 genocide.
Their study is an in-depth study of a predominantly Hutu community in Rwanda, where
detailed information was collected in 1988, 1993 and following the genocide. They show that
between 1988 and 1993 land scarcity increased due to land degradation and population
growth. For instance, the percentage of young men between 20 and 25 years of age living at
home (as land is needed to marry) increased from 71% to 100%. They also note a sharp
reduction in pre-capita landholdings, increasing inequality in landholdings and a very high
number of land-related conflicts. Following the genocide, the authors found that many of the
victims belonged to larger households or households that were involved in land-related
conflicts while perpetrators came from poor, though not very poor households. They argue
that land scarcity and a lack of other employment opportunities were causal factors in the
genocide. This is echoed by Des Forges (1999, pp. 13 – 14) who argues that access to land was
a incentive for popular participation in the killings:
Authorities offered tangible incentives to participants. They delivered food, drink, and other intoxicants, parts of
military uniforms and small payments in cash to hungry, jobless young men. They encouraged cultivators to
pillage farm animals, crops, and such building materials as doors, windows and roofs. Even more important in
this land-hungry society, they promised cultivators the fields left vacant by Tutsi victims.
The role of land scarcity for violence in Rwanda is also emphasised by Verpoorten (2012)
arguing that conflict severity was higher in areas that had high population density and little
opportunities for young men to acquire land.
However, other authors, such as Percival and Homer-Dixon (1996, p. 270) argue that
“environmental scarcity had at most a limited, aggravating role in the recent conflict” and
that other factors played a bigger role, an argument echoed by Uvin who points to other
factors than environmental scarcity as the crucial factors in the case of Rwanda:
3 0 C l i m a t e C h a n g e , R e s o u r c e S c a r c i t y a n d A r m e d C o n f l i c t
Rwanda’s genocide was the extreme outcome of the failure of the development model that was based on ethnic,
regional and social exclusion; that increased deprivation, humiliation and vulnerability of the poor; that allowed
state instigated racism and discrimination to continue unabated; that was top-down and authoritarian; and that
left the masses uninformed, uneducated and unable to resist orders and slogans. It was also the failure of
development cooperation based on ethnic amnesia, technocracy and political blindness.” (Uvin, 1996, p. 34)
The case study of communal violence in South Africa in the early nineties is an example of a
less convincing case study linking resource scarcity and armed conflict. Percival and Homer-
Dixon (1998) attribute this violence to resource scarcity. However, their analysis suffers from
a number of drawbacks, such as a very broad definition of “urban resource scarcity”, which
includes features such as access to piped water and electricity and household income. This
makes “urban resource scarcity” indistinguishable from general poverty, which is strongly
linked to conflict. In addition, the case study oversimplifies ethnic relations in South Africa by
inaccurately portraying the African National Congress as an ethnic party, representing the
interests of the Xhosa ethnic group. The case study does not include the role of the Apartheid
security forces in instigating inter-ethnic violence, nor does it discuss the role of the power
vacuum in the run-up to the first free elections in 1994. While resource scarcity might have
well played a role in the violence in the early nineties, the links drawn by Percival and Homer-
Dixon are very indirect. In general, this case study suffers from the attempt to fit a pre-
established theoretical mechanisms onto a case in which other factors clearly provide better
explanations.
Some case studies have also been heavily criticised by country experts. In the case of the
Chiapas, where Howard and Homer-Dixon (1996) argue that resource scarcity contributed to
conflict in a situation where a large part of the population was highly dependent on
agriculture for their livelihoods, Bobrow-Strain (2001) argues that there was less resource
scarcity in the Chiapas than in other Mexican provinces, which were also dependent on
agriculture but did not experience conflicts. Matthew (2002, p. 116) adds that by placing the
1994 Chiapas conflict into a longer time-frame, it may well be considered part of a larger, on-
going struggle.
Methodological Criticism of Case Studies
There are a number of methodological issues that have been raised regarding many case
studies such as selection bias and the inclusion of a large number of variables.
Case Selection
The tendency of resource scarcity theorists to focus on cases that experienced resource
scarcity as well as violent conflict is widely criticised. (Gleditsch, 1998, p. 6; M. A. Levy, 1995,
p. 45; Rønnfeldt, 1997, p. 477). As Gleditsch (1998, p. 6) points out:
When one only examines cases of conflict, one is likely to find confirmation of whatever one is looking for, unless
there are very clearly specified criteria for the threshold level of the independent variable which is supposed to
lead to violence. No society is completely free of environmental degradation, nor is any society completely free
of ethnic fragmentation, or religious differences or economic inequalities, or problems of governance. In
C l i m a t e C h a n g e , R e s o u r c e S c a r c i t y a n d A r m e d C o n f l i c t 3 1
examining a set of armed conflicts, one may variously conclude that they are all environmental conflicts, ethnic
conflicts, clashes of civilisations, or products of bad governments.
Homer-Dixon (1999, p. 170) responds that the selecting of cases on the basis of both the
independent and the dependent variable can be justified by the highly complex matter of the
issue and the need to develop causal mechanism in the early stages of theory formation. The
implication here seems to be that environmental conflicts are somehow more interactive and
complex than any other social phenomena. This, of course, seems doubtful (Gleditsch, 2001,
p. 264).
In addition, Schwartz, Deligiannis and Homer-Dixon (2001, p. 281) argue that much of the
Toronto group’s research is not focused on causal effect, but on causal mechanisms. While
single case studies might not be the best method to analyse causal effects, there is a lot of
value in tracing processes and intervening variables in order to describe a social phenomenon
(D. M. Schwartz et al., 2001, p. 282). Similarly, Schwartz, Deligiannis and Homer-Dixon (2001,
p. 285) defend their choice of cases by pointing out that they are interested in the
mechanisms linking resource scarcity and violent conflict and that process tracing can be used
to learn more about these mechanisms, which would not be a feasible option if cases without
conflict resource scarcity were to be included. They claim that “the patterns of ecological
marginalization and resource capture, which were discovered by the Toronto Group using
process tracing, are not obvious and would undoubtedly have remained hidden from
statistical analysis”. This defence, however, weakens their key argument. If a strong link
between resource scarcity and violent conflict exists, one would expect that this link and its
patterns can be established using a variety of methods.
Too Many and Untestable Variables
Many case studies are also criticised for the inclusion of many imprecise and hard-to-measure
variables which make it difficult to falsify the thesis (Hagmann, 2005, p. 11; M. A. Levy, 1995,
p. 45) and because some variables appear as both, causes and measures of environmental
problems. Rønnfeldt (1997, p. 478) criticises the tendency to propose “overly complex models
which only offer very general conclusions”. The multitude of variables and linkages proposed
and the overall complexity of many of the proposed models make testing many resource
scarcity theories very difficult (Dessler, 1994, p. 96; Gleditsch, 2001, p. 262; Hagmann, 2005,
p. 13; Hauge & Ellingsen, 1998, p. 8; M. A. Levy, 1996, p. 59; Rønnfeldt, 1997, p. 478). Including
seven or eight independent variables in the explanation of a single case not only renders the
theory virtually untestable (Gleditsch, 1998, p. 390), but also limits its explanatory power. In
their study of the Chiapas in Mexico, Howard and Homer-Dixon (1996) include seven
independent variables and nine intervening variables, including some very broad concepts
such as “historically rooted socio-economic context”. This complicates the testing of the
theory on a more general level, in particular testing the significance and validity of the
proposed relationship by using quantitative methods (Rønnfeldt, 1997, p. 478). This leaves
Levy (1995, p. 196) to conclude that “we are left with claims that sometimes environmental
scarcity produces violent conflicts but not knowing what conditions matter most.”
3 2 C l i m a t e C h a n g e , R e s o u r c e S c a r c i t y a n d A r m e d C o n f l i c t
QUANTITATIVE STUDIES
While some of these case studies provide strong examples of the causal links envisioned by
resource scarcity theorists, empirical evidence from large-n studies to back up these findings
is weak 7 . Quantitative studies focus on various independent variables such as land
degradation, freshwater scarcity, population density, deforestation and population growth.
The strongest support for resource scarcity theories was found in an early study by Hauge and
Ellingsen (1998) who established strong relationships between land degradation, freshwater
scarcity, population density, deforestation and conflict. However, these results could neither
be replicated using the original nor an updated dataset (Theisen, 2008). Raleigh and Urdal
(2007) also found a significant relationship between low freshwater availability, land
degradation, population growth and conflict in some of the models they tested. On the other
hand, the State Failure Taskforce (Esty et al., 1998), found no direct link between indicators
of environmental scarcity and state failure. In a study of developing and developed countries,
Urdal (2005) could not link demographic pressure to the risk of conflict in either developed
or developing countries. This result is corroborated by other studies finding no relation
between population growth and violent conflict (Buhaug & Rød, 2006; Collier & Hoeffler,
1998, 2004; Hauge & Ellingsen, 1998). Yet, there are some studies showing a positive
relationship between population growth and violent conflict (de Soysa, 2002a, 2002b; Raleigh
& Urdal, 2007). For instance, Brückner (2010) estimates that a 5% increase in population size
raises the risk of conflict by about 6%.
Other authors have focused on specific regions, in particular on Sub-Saharan Africa. A study
on rainfall in Sub-Saharan Africa (Hendrix & Glaser, 2007) concluded that a decrease in rainfall
increases the risk of violence in the following years, while soil degradation has no impact and
more water per capita increases the risk of conflict. In a study of non-state conflicts in Sub-
Saharan Africa, Theisen and Brandsegg (2007) found no robust effect of population density or
precipitation patterns on non-state conflicts in Sub-Saharan Africa.
There are a number of studies discussing the impact of resource scarcity in particular settings.
A study of pastoral conflicts in the Horn of Africa (Meier et al., 2007), for instance, argued that
scarcity does not increase the risk of conflict, but has an impact on its severity. Bocchi et al.
(2006, p. 195) found that decreasing access to water and pastures in Kenya sometimes leads
to violent clashes, but to cooperation at other times. In a comparative study of 27 Indian
states, Urdal (2008) found that scarcity of productive land increases the risk of violence when
the rural population is growing at a high rate and the agricultural yield is low.
Most of the quantitative works in the field do not provide evidence for the theses of resource
scarcity theorists. Some studies strongly contradict the findings from many of the earlier case
7 For an overview of the various quantitative studies, see Table A.1 in the appendix.
C l i m a t e C h a n g e , R e s o u r c e S c a r c i t y a n d A r m e d C o n f l i c t 3 3
studies and the generally inconclusive results point to a more complex relationship between
scarcity and conflict than most resource scarcity theorists envision.
Methodological Criticisms of Quantitative Studies
Quantitative studies have also been criticised on methodological grounds. The level of
analysis, the failure to take indirect and conditional effects into account, the focus on certain
types of conflict and the onset of war as well as data limitations are methodological issues in
some of the quantitative studies.
Level of Analysis
The focus on a national level as level of analysis is often criticised (Buhaug et al., 2008; Buhaug
& Lujala, 2005; Buhaug, 2010b; O’Lear & Diehl, 2007). Especially in the case of resources and
their link to conflicts, focusing on national averages can obfuscate the relationship. For
instance, diamonds found in Siberia probably have little to do with conflict in Chechnya, yet
in an analysis on national level, it might seem so (Buhaug & Lujala, 2005). Similarly, state
capacity might also vary strongly across the country (Buhaug et al., 2008, p. 33). While some
(Urdal, 2008) make some excellent points in favour smaller units of analysis, others
(Rønnfeldt, 1997, p. 477) argue in favour of larger units of analysis: as environmental change
is a transnational problem, the analysis of its impacts should be as well. There is an increasing
tendency to use smaller levels of analysis and geo-referenced data of conflicts and resources
(Raleigh & Urdal, 2007) and a number of studies using geo-referenced data have been
published in recent years focusing on conflict zones (Braithwaite, 2005; Buhaug & Gates,
2002), conflict events (O’Loughlin & Witmer, 2011; Raleigh, Linke, Hegre, & Karlsen, 2010),
locations of conflict onset (Buhaug, 2010b) and geographic location of ethnic groups
(Cederman, Buhaug, & Rød, 2009; Weidmann, 2009). There are also increased efforts of data
collection (Cederman & Gleditsch, 2009; Tollefsen et al., 2012).
Types of Conflict
Most quantitative studies are concerned with the most severe forms of violence: civil and
intrastate war, but resource scarcity might in fact contribute more to local, small-scale, inter-
ethnic conflicts and communal violence than to actual war (Buhaug et al., 2008, p. 34). There
are, however, some studies that focus on non-state conflict and communal violence (Bocchi
et al., 2006; Meier et al., 2007; Theisen & Brandsegg, 2007; Theisen, 2006; Urdal, 2008).
Focus on the Onset of War
Most quantitative studies focus on the onset of war, viewing resource scarcity as a cause for
war. More than half of today’s conflicts, however, originated in the 1980s and earlier and
therefore, the impact of resource scarcity on the severity, diffusion and the prospects for
resolution of conflicts might be analytically more valuable, but have rarely been the focus of
quantitative or qualitative studies (Buhaug et al., 2008, p. 34). There are exceptions, of course,
such as Meier et al. (2007) who argue that scarcity had no impact on the risk of conflict in the
Horn of Africa, but increased the severity of conflict.
3 4 C l i m a t e C h a n g e , R e s o u r c e S c a r c i t y a n d A r m e d C o n f l i c t
Data Limitations
Many large-n studies have suffered from a lack of availability of environmental data (Buhaug
et al., 2008, p. 35). For instance, the UNEP’s GLASOD (Global Assessment of Soil Degradation)
measure of soil degradation has been criticised for overestimating the extent of soil
degradation in Africa as a result of a lack of cross-expert comparability (Theisen & Brandsegg,
2007). Field data on Burkina Faso, for instance, shows small changes in soil fertility for the
period of 1969-1996 (Niemeijer & Mazzucato, 2002) while the GLASOD data reports a high
level of soil degradation. In addition, environmental data is inherently dynamic, so the
temporal dimension is crucial to measure changes in resource availability. Yet, many large-n
studies rely on static data alone.
ECONOMIC, POLITICAL AND SOCIAL CONDITIONS IN RESOURCE-SCARCE COUNTRIES
While there is agreement that context conditions play an important role in links between
resource scarcity and conflict, there is less agreement on the question which and how
conditions interact. For instance, Homer Dixon (1999, p. 16) points out that “numerous
contextual factors have combined with environmental and demographic stress to produce
these [violent] outcomes. Environmental scarcity is never a sole or sufficient cause of large
migrations, poverty, or violence; it always joins with other economic, political, and social
factors to produce its effects”. Similarly, Lee (1997, p. 365) points out that “environmental
stress results in violent conflict only when interacting with other political, ethnic, economic,
and social causes”.
While the impact of political, economic and social factors on violent conflict in general has
been well-documented (Dixon, 2009; Hegre & Sambanis, 2006), there is little systematic
research on the interaction of social and economic processes with environmental factors. As
Barnett and Adger (2007, p. 641) point out: “The risks of climate change to social systems is
as much about the characteristics of those systems as it is about changes in the environmental
system.” Most authors acknowledge the importance of these factors, but fail to analyse their
impact in detail. Homer-Dixon (1999, pp. 178 – 179) produces a long list of relevant factors
including cultural conception of economic justice, the level of social ingenuity, degree and
type of social cleavage, strength of norms of trust, reciprocity and responsibility, the
autonomy of the state, the quantity and vulnerability of environmental resources, the balance
of political power, the nature of the state, patterns of social interaction, the structure of
economic relations among social groups, organisational coherence and resources of
challenger groups and elites, and the character of markets. Bächler (1998b, p. 32) adds the
institutional capacities for peaceful conflict-resolution, readiness and/or capacity of
authorities and leaders to organize and mobilize collective actors, the (mis)perception of
alternatives to resorting to violence, the preferences and opportunities of actors and actor
limitations. Barnett and Adger (2007, p. 641) include poverty, the degree of support
communities receive from the state, access to economic opportunities and the effectiveness
of decision-making processes. Carius and Imbusch (1999, p. 20) mention “cultural
C l i m a t e C h a n g e , R e s o u r c e S c a r c i t y a n d A r m e d C o n f l i c t 3 5
circumstances and traditions, ethno-political factors, civil society mechanisms of peaceful
conflict resolution, the stability of the interior policy system and, finally, societal, institutional,
economic and technological capabilities”. A six-country study by Ejigu (2009, p. 888) argues
that “a transition from competition for scarce resources to environmentally induced conflicts
occurs under unique sets of conditions”. These are: population growth and pressure on
resources, restricted mobility of labour or large-scale influx of population, socio-economic
and ethnic heterogeneity related to inequality, distribution of finite resources or wealth
created from these resources, low technological innovations to mitigate loss of productivity
of resource, weak institutional arrangement to economize and allocate scarce resources,
environmental goods and services to competing claimants and failed state, democracy and
public policy. A comparative study of Sudan and Bangladesh also includes a wide range of
social, political, economic and ethnic factors but fails to specify, which of these factors play a
causal role (S.-W. Lee, 1997). Clearly, this mere listing of factors that might play a role in
certain cases does provide little new insight. Rather, there is need for a more systematic
analysis.
Most of the large-n studies on resource scarcity theories have not considered the impact of
intervening factors (Buhaug et al., 2008, p. 33). While more recent studies (Raleigh & Urdal,
2007) have started to take these factors into account, this has mostly happened in simple
interaction terms. Buhaug, Gleditsch and Theisen (2008, p. 33) point out that this is
insufficient as intermediate effects may well be characterised by threshold effects or only
apply under certain conditions. Other studies include conditions, but focus on only one or
very few conditions. For instance, Raleigh (2010) argues that political and economic
marginalization is a critical factor, that can be amplified by environmental issues. A study by
Gizelis and Wooden (2010) focuses on political institutions and finds that democratic
institutions are better able to mitigate conflicts over resources.
The insufficient discussion of the question under which political, social and economic
conditions violence breaks out in resource-scarce countries is a weak point in the literature
linking climate change, resource scarcity and armed conflict. The proposed mechanism linking
resource scarcity and conflict take place in very specific social, economic and political settings
but resource scarcity theorists frequently fail to specify which conditions are of importance.
Case studies frequently include a large number of conditions relevant to specific cases but do
not analyse whether there are general patterns favouring conflict in resource-scarce
countries. Finally, quantitative studies mostly do not include social, economic or political
conditions. Where they do, they are limited to relatively few conditions and simple interaction
terms.
To address this gap in the literature, this dissertation aims to answer the following research
question:
Under which sets of political, social and economic conditions does armed conflict occur in
countries with low levels of freshwater or arable land or both?
3 6 C l i m a t e C h a n g e , R e s o u r c e S c a r c i t y a n d A r m e d C o n f l i c t
While answering this question does not directly contribute to the larger question whether
resource scarcity causes conflict, it improves our understanding of when conflicts erupt in
resource-scarce countries and when countries remain peaceful. In order to do systematically
analyse the large number of potential conditions, I introduce an adaptive capacity framework
to the literature. The results of the analysis contribute to the literature on resource scarcity
and conflict by explaining previously contradictory results. The use of the adaptive capacities
framework also highlights the importance of adaptive skills, such as tertiary education, access
to science and research and technology. These aspects have not received much attention in
the wider conflict literature but I show that these skills can play a role in preventing conflict
and therefore warrant a closer look.
As the review of conditions included in case studies shows, there is a long list of conditions
that might matter in explaining peace and conflict. My aim is to find out which of them are
necessary or sufficient for peace and conflict. To do so, I compare the conditions 30 resource-
scarce countries using a fuzzy-set qualitative comparative analysis (see chapter 3 for details
on the method and case selection). Of course, in each of these cases, there is a multitude of
potential conditions. To structure the large number of potential conditions and focus on those
that are the most likely to mediate the relationship between resource scarcity and armed
conflict, I introduce an adaptive capacities framework.
ADAPTIVE CAPACITIES FRAMEWORK
The term adaptation stems from the natural sciences, in particular evolutionary biology,
where it refers to the response of an organism (e.g. the development of genetic or
behavioural characteristics) to its environment in order to survive and reproduce. When
referring to human-environment systems adaptation refers to “adjustments in a system’s
behavior and characteristics that enhance its ability to cope with external stress” (Brooks,
2003, p. 8). In the research on the social consequences of climate change a number of
definitions are available, mostly referring to adjustments in a system, such as a community,
group or a country, enabling this system to better manage or cope with a change in
conditions, stress, hazard, risk or opportunity (Smit & Wandel, 2006, p. 282). Adaptive
capacity then refers to “the ability of the system to prepare for stresses and changes in
advance or adjust and respond to the effects caused by the stress” (Engle, 2011, p. 647).
Adaptation can take various forms and happen on various levels. One common criterion is the
intent of adaptation, which can be autonomous, which is typical in unmanaged systems or
planned (i.e. managed by private or public actors). Actors can be individuals, local
communities, institutions, governments and international governments. Adaptation can
occur at different times, i.e. before (anticipatory), during (concurrent) or after (reactive) a
stimulus. Adaptation can occur at different levels and in different forms (structural, legal,
institutional, financial, technological) (Smit et al., 2001, p. 884). There are a number of other
terms that aim to catch the ability of a system to adapt to external influences, such as
vulnerability, resilience, exposure, sensitivity, coping ability, management capacity, stability,
C l i m a t e C h a n g e , R e s o u r c e S c a r c i t y a n d A r m e d C o n f l i c t 3 7
robustness, flexibility (see Smit et al., 2001 for an overview differentiation of various terms),
which are closely related and overlapping. The focus in this study is on adaptive capacity,
which is one component of vulnerability (Adger & Vincent, 2005). Vulnerability or the
“susceptibility to harm” (Engle, 2011, p. 649) also includes, for instance, biophysical and social
factors. The International Panel on Climate Change (Smit et al., 2001) employs the concepts
of exposure, sensitivity and adaptive capacities to illustrate this. Physical factors are included
in the component of exposure, showing to what extent the system is physically in harm’s way.
Sensitivity focuses on how much this exposure affects a system. Finally, adaptive capacity
focuses on the social factors that allow a system to effectively prepare for or react to a
stressor.
Which factors determine the adaptive capacities of systems has received a lot of attention in
the research on social consequences of climate change. Adaptive capacity and its
determinants cover a wide spectrum of subjects including “economic, social, institutional, and
technological conditions that facilitate or constrain the development and deployment of
adaptive measures” (Smit et al., 2001, p. 882). These conditions “influence (promote, inhibit,
stimulate, dampen, or exaggerate) the occurrence and nature of adaptations and thereby
circumscribe the vulnerability of systems and their residual impacts” (Smit et al., 2001, p.
893). The spectrum of theoretically relevant factors is very broad and there is no consensus
beyond broad categories (Smit & Wandel, 2006, p. 288) and they can relate to various levels
(individual, local, national, global) and to different aspects of society (legal, technological,
individual behaviour, etc.). There is consensus about the great impact of societal factors in
the impact of external shocks, which explain, for instance that rainfall and temperature
fluctuations had more severe effects on human welfare in medieval and early modern
western Europe than they do today as society is less vulnerable today (Smit et al., 2001, p.
895).
In the following, I will follow a framework by the International Panel on Climate Change8 as
the most common framework, which summarises the determinants of adaptive capacities
into six broad categories: economic resources, technology, information and skills,
8 Other approaches include those by Yohe and Moss (1999), which include the range of available technological options for adaptation, the availability of resources and their distribution across the population, the structure of critical institutions and the derivative allocation of decision-making authority, the stock of human capital, including education and personal security, the stock of social capital including the definition of property rights, the system’s access to risk spreading processes, the ability of decision-makers to manage information, the processes by which these decision-makers determine which information is credible, and the credibility of the decision-makers, themselves, and public perception of attribution, while Adger and Vincent (2005, p. 402) argue that “adaptation comes through markets, civil society and government action and complex interactions between them”. Tan et al. (2012) focus on six criteria of adaptive capacity: adaptability; information and knowledge; institutional and governance; human capital; economic resources and technology and infrastructure. In an integrated framework of interactions between climate and society, Scheffran(2011) including climate change as a stressor for natural resources, natural resources and their impact on human needs and the human response sometimes leading to societal instability. Brooks, Adger and Kelly (2005) emphasise the importance of governance, civil and political rights, and literacy as indicators of adaptive capacity. In addition, associations, networks and capital have been seen as key components of adaptive capacity (Adger, 2003).
3 8 C l i m a t e C h a n g e , R e s o u r c e S c a r c i t y a n d A r m e d C o n f l i c t
infrastructure, institutions, equity (Smit et al., 2001). I opt to use this framework because the
determinants of adaptive capacities are closely linked to the conditions that I am interested
in. Both the determinants of adaptive capacities and the conditions in resource-scarce
countries mediate the relationship between humans and their natural environment. Adapting
to climate change in order to prevent various negative consequences for humans and
adapting to resource scarcity to avoid conflict are similar in nature. As a result there is close
match between the broader categories introduced in the adaptive capacities framework and
the conditions mentioned in case studies of resource scarcity. I will follow these categories
and specify them more specifically for the issue of conflict in resource-scarce countries by
analysing the conditions included in case studies using these categories (see chapter 3 for
details on selection of conditions).
Economic Resources
Economic resources are recognized as playing a key role in determining a country’s ability to
adapt to climate change and it is generally accepted that richer countries have higher
capacities to adapt to climate change and that poverty increases the vulnerability to climate
change (Smit et al., 2001, p. 895). Economic resources are also a key explanatory factor in
many case studies of conflict over resource scarcity, which frequently focus on situations
where livelihoods are threatened due to for instance, high dependence on agriculture
combined with declining agricultural productivity, export dependence and falling world
market prices. This is one of the mechanisms discussed by Buhaug, Gleditsch and Theisen
(Buhaug et al., 2008, p. 23), which gives various explanations why situations of economic
insecurity and poverty can lead to violence. Case studies that find that economic insecurity
contributed to conflict include inland delta of Niger river in Mali (Benjaminsen et al., 2012),
Bangladesh (Swain, 1996) and Fiji, Solomon Islands and Vanuatu (Ware, 2005). This study
includes conditions focusing on economic development, agricultural population, poverty,
dependence on exports, natural resources and oil, and economic diversification. I discuss the
theoretical economic explanations and the links between resource scarcity and conflict in
chapter 4.
Institutions
Well-functioning social institutions are a key factor in the ability to adapt and mal-functioning
institutions are frequently argued to prevent effective adaption (Smit et al., 2001, p. 896). The
conditions in case studies, many of which focus on different aspects of state capacities, reflect
the importance of functioning institutions. State capacities are often argued to be a key factor
in linking resource scarcity to conflict. For instance, Homer-Dixon (1999, p. 87) argues that “it
is institutional factors that largely determine whether or not countries […] respond effectively
to rising scarcities of land and water”. In addition to more general dimensions of state
capacities, such as administrative capacities and capacities for tax collection, a particular
focus in case studies is on the issues of land access and tenure systems and on judicial
institutions. Land rights are a factor in many case studies, among them the inland delta of
Niger river in Mali (Benjaminsen et al., 2012), Kenya (Boone, 2011), Rwanda (André &
C l i m a t e C h a n g e , R e s o u r c e S c a r c i t y a n d A r m e d C o n f l i c t 3 9
Platteau, 1998) and Ethiopia (Flintan & Tamrat, 2002). The lack of conflict resolution
mechanisms is another factor frequently mentioned in case studies. However, this is rarely
seen as a key factor. An exception to this is the study of Bonga refugee camp (A. Martin, 2005),
where the lack of common political space and opportunities to solve conflict are seen as key
contributing factor to conflict. Finally, two related factors that are frequently mentioned are
neopatrimonialism and autocratic leadership. Patronage systems and neopatrimonialism are
seen as factors in the cases of Darfur (Suliman, 2008), Burundi (Oketch & Polzer, 2002),
Ethiopia (Flintan & Tamrat, 2002), Kenya (Boone, 2011), Somalia (Farah, Hussein, & Lind,
2002), Rwanda (André & Platteau, 1998) and the Solomon Islands and Vanuatu (Ware, 2005).
Autocratic leadership are seen as a factor in cases such as Burundi (Oketch & Polzer, 2002),
Indonesia (Barber, 1998), Gaza (K. Kelly & Homer-Dixon, 1995), the Philippines (Kahl, 2008)
and Kenya (Kahl, 1998). Factors that focus on state-based explanations are covered in chapter
5, which includes various dimensions of state weakness.
Equity
The access to and distribution of resources within and between states has been explored by
those focusing on adaptive capacities as well as those focusing on conflict. The entitlement of
groups and individuals to access resources strongly affects the vulnerability to climate change
as it limits the capacities to adapt (Adger & Kelly, 1999). Similarly, inequality in its various
dimensions has been linked to conflict outbreak in the wider conflict literature. Linked to the
notion of equity is also the notion of ethnic, religious or linguistic heterogeneity, which has
been the focus of conflict research as well. Almost all case studies presented in Table 3.2
mention aspects related to inequality and heterogeneity. Another aspect that is frequently
mentioned are different traditions of resource use. This most commonly refers to farmer-
herder conflicts with different groups laying claims on the same land for different purposes.
Since this is very specific to certain areas, it is not included as a condition. Land, in particular,
is used for different purposes (forests, agriculture, housing, industry and commerce,
infrastructure, etc.) in all countries in my sample, so different land uses does not reflect the
specific situation of different groups and their different ways of earning their livelihoods and
claiming the same resources to do so. Therefore, I do not include this aspect in the analysis.
However, the analysis focusing on inequality in chapter 6 does include the aspect of uneven
economic development between groups, which comes close to the issue of different
traditions of land use. Chapter 6 focuses on different dimensions of inequality.
Adaptive Skills
I use the term adaptive skills to refer to a number of mitigating factors that are lumped
together here. As mitigating factors, they are less in the focus of researchers studying cases
of conflict. One reason for this is that these factors are mitigating in their nature and it is
therefore their presence that might prevent conflicts rather than their absence that leads to
conflicts. As it is very hard to show that a conflict could have been prevented if technology or
information had been available, these factors are hardly included in case studies. While
technology is hardly mentioned at all, low levels of education are included as a factor in only
4 0 C l i m a t e C h a n g e , R e s o u r c e S c a r c i t y a n d A r m e d C o n f l i c t
two case studies: Ethiopia (Flintan & Tamrat, 2002) and Vanuatu (Ware, 2005). However, in
this study I compare cases with a conflict outcome to cases without a conflict outcome. This
gives me the opportunity to include conditions focusing on mitigation as well. Therefore, I
focus on those aspects mentioned by researchers focusing on adaptive capacities, such as
access to technology, access to science (in general and more specifically to research on
agriculture), to the level of highly qualified personnel and the effects of brain drain. These
aspects are the focus of chapter 6.
Infrastructure
Focusing on climate change Smit et al. (2001, p. 896) argue that the right infrastructure in
place is important to adapt to the consequences of climate change. While the same can be
said about adapting to resource scarcity, I argue that acquiring adequate infrastructure is
linked to the aspects discussed previously, in particular economic resources and adaptive
skills. Smit et al. (2001, p. 896) are mainly focusing the mitigating impact of natural disasters
occurring due to climate change, such as El Niño and typhoons, which are not the focus of this
study. None of the case studies mention infrastructure in particular. Therefore, the category
of infrastructure is not included in the analysis as it refers mainly to climate events.
Of course, the conditions included here are not clear-cut. Very few of the case studies present
one such factor as the single causal factor and there are many overlapping explanations.
Instead, many of these factors act in conjuncture with each other. For instance, a case study
of the Tuareg rebellion in northern Mali (Benjaminsen, 2008) includes aspects of identities
(such as different traditions of land use and marginalization of pastoralists) as well as aspect
of corruption (rent-seeking behaviour by forest officials and embezzlement of aid) and finally
the migration of Tuareg to neighbouring countries and urban areas. In addition, many of these
aspects take on very different forms in different case studies. Economic deprivation, for
instance, can mean loss of the fishing industry in a study of Bangladesh (Swain, 1996),
agricultural decline in a study of South Africa (Percival & Homer-Dixon, 1998), agricultural
encroachment on key productive resources for pastoralism (Benjaminsen et al., 2012) or
decreasing plot sizes in a study of Burundi (Oketch & Polzer, 2002). However, they all share
one aspect in common – the threat to human security. I decided to follow the categorization
provided by the International Panel on Climate Change of determinants of adaptive capacities
(Smit et al., 2001) as a guide to organize the conditions included in this analysis as there were
too many relevant conditions to include all of them in one analysis. While other ways are
possible, this provided clear lines for three separate analyses focusing on economic
explanations (chapter 4), political explanations (chapter 5) and social explanation (inequality
and adaptive skills) (chapter 6). While many other relevant and interesting conditions that
could have been included exist, the process described above provides a thorough exploration
of the relevant conditions, which is based on both theory and empirical data.
C l i m a t e C h a n g e , R e s o u r c e S c a r c i t y a n d A r m e d C o n f l i c t 4 1
CONCLUSION
The end of the Cold War led to a broadening of the security concept and the inclusion of new
factors, such as a focus on human security and the inclusion of environmental factors. The
recent focus on climate change has renewed the interest into research on the social
consequences of environmental change in general and on the impact of dwindling natural
resources on armed conflict in particular. Yet, even with two decades of research into the
effect of resource scarcity on armed conflict, there is no consensus on this topic. While there
are a number of well-developed theoretical mechanisms, which are supported by empirical
case studies, empirical evidence from quantitatively oriented studies does not support the
link between resource scarcity and armed conflict. This contradiction raises the question why
some resource-scarce countries experience armed conflict while others do not. More
research on the impact of other social, political and economic factors on the links between
resource scarcity and armed conflict is needed.
4 2 R e s e a r c h D e s i g n
Chapter 3: RESEARCH DESIGN
INTRODUCTION
In the question of how the natural environment and in particular resource scarcity are linked
to armed conflict, different researchers give different empirical accounts. While there are
many qualitative, in-depth case studies using process tracing that find strong links between
resource scarcity and armed conflict, quantitative studies using statistical methods do not
support this finding. This contradiction is the puzzle I am exploring in this thesis. I argue that
the reason for this contradiction is the different economic, social and political conditions in
different countries that act in conjunction with the lack of natural resources. While most
quantitative studies ignore these conditions by design, the small-n design of most qualitative
studies fail to compare these conditions across cases. In the following, I will show how these
different approaches to dealing with the inclusion of conditions are based on a different logics
of causation – conjunctural logic in case studies and additive logic in quantitative studies –
and argue that qualitative comparative analysis (QCA) is the best method to bridge this divide
as it allows for the use of conjunctural causation as well across-case comparison. I will also
explain my approach to selecting conditions, which uses an adaptive capacities framework to
structure the conditions found in case studies. I then evaluate these conditions against the
conditions found in the larger conflict-studies literature. In addition, I will discuss my selection
of cases, which I base on an understanding of resource scarcity taking absolute levels of
freshwater and equivalent potential arable land into account. Of the 30 resulting cases, 14
experienced conflicts according to the operationalisation of conflict employed, which is based
on a threshold of 25 battle-related deaths.
CONFIGURATIONAL COMPARATIVE METHODS
My aim in this dissertation is to explore under which sets of political, social and economic
conditions does armed conflict occur in countries with low levels of freshwater or arable land
or both. To this end, I use qualitative comparative analysis as research method in three
empirical chapters (focusing on economic, political and social factors) and a final chapter
bringing the findings from these three chapters together. Since four chapters use the same
method, I choose to introduce this method here to avoid repetitive explanations in the
empirical chapters.
Configurational comparative methods are based on a causal logic arguing that context
matters. Configurational refers to combinations of factors or conditions in case one that are
compared to the combination of conditions in case two. A condition might play a different
role if combined with conditions A and B than if combined with conditions C and D. This is in
contrast to the additive logic employed in statistical research.
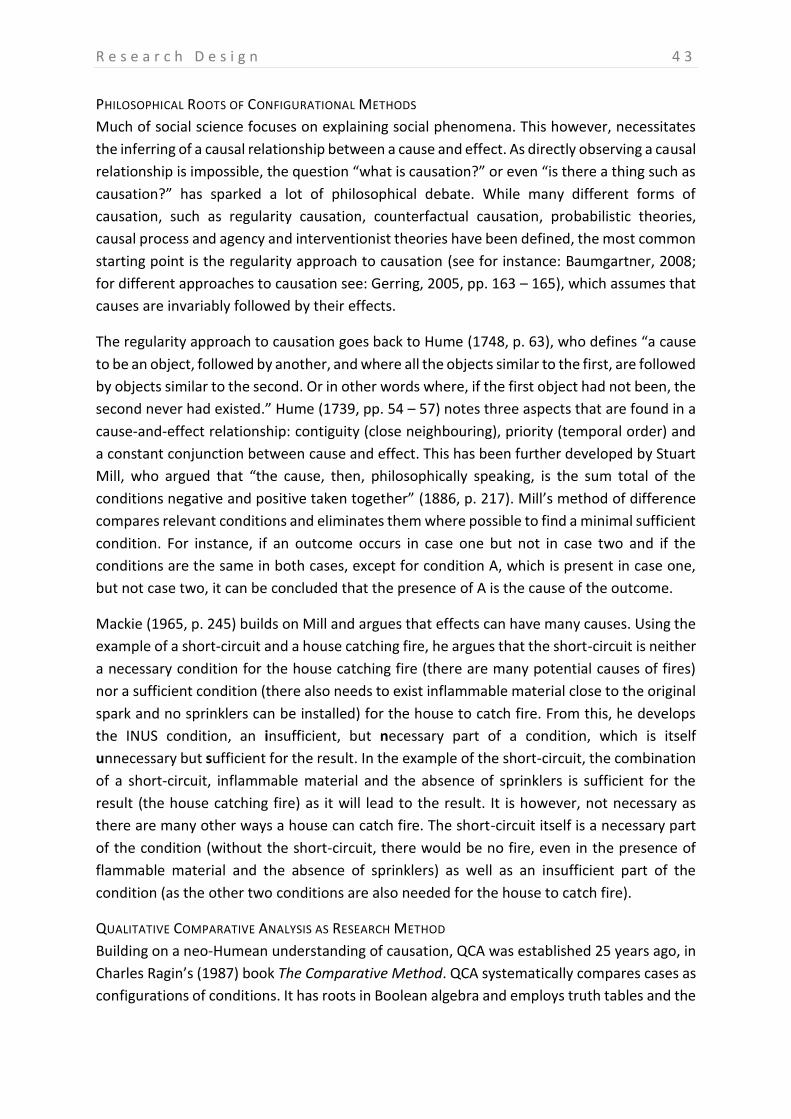
R e s e a r c h D e s i g n 4 3
PHILOSOPHICAL ROOTS OF CONFIGURATIONAL METHODS
Much of social science focuses on explaining social phenomena. This however, necessitates
the inferring of a causal relationship between a cause and effect. As directly observing a causal
relationship is impossible, the question “what is causation?” or even “is there a thing such as
causation?” has sparked a lot of philosophical debate. While many different forms of
causation, such as regularity causation, counterfactual causation, probabilistic theories,
causal process and agency and interventionist theories have been defined, the most common
starting point is the regularity approach to causation (see for instance: Baumgartner, 2008;
for different approaches to causation see: Gerring, 2005, pp. 163 – 165), which assumes that
causes are invariably followed by their effects.
The regularity approach to causation goes back to Hume (1748, p. 63), who defines “a cause
to be an object, followed by another, and where all the objects similar to the first, are followed
by objects similar to the second. Or in other words where, if the first object had not been, the
second never had existed.” Hume (1739, pp. 54 – 57) notes three aspects that are found in a
cause-and-effect relationship: contiguity (close neighbouring), priority (temporal order) and
a constant conjunction between cause and effect. This has been further developed by Stuart
Mill, who argued that “the cause, then, philosophically speaking, is the sum total of the
conditions negative and positive taken together” (1886, p. 217). Mill’s method of difference
compares relevant conditions and eliminates them where possible to find a minimal sufficient
condition. For instance, if an outcome occurs in case one but not in case two and if the
conditions are the same in both cases, except for condition A, which is present in case one,
but not case two, it can be concluded that the presence of A is the cause of the outcome.
Mackie (1965, p. 245) builds on Mill and argues that effects can have many causes. Using the
example of a short-circuit and a house catching fire, he argues that the short-circuit is neither
a necessary condition for the house catching fire (there are many potential causes of fires)
nor a sufficient condition (there also needs to exist inflammable material close to the original
spark and no sprinklers can be installed) for the house to catch fire. From this, he develops
the INUS condition, an insufficient, but necessary part of a condition, which is itself
unnecessary but sufficient for the result. In the example of the short-circuit, the combination
of a short-circuit, inflammable material and the absence of sprinklers is sufficient for the
result (the house catching fire) as it will lead to the result. It is however, not necessary as
there are many other ways a house can catch fire. The short-circuit itself is a necessary part
of the condition (without the short-circuit, there would be no fire, even in the presence of
flammable material and the absence of sprinklers) as well as an insufficient part of the
condition (as the other two conditions are also needed for the house to catch fire).
QUALITATIVE COMPARATIVE ANALYSIS AS RESEARCH METHOD
Building on a neo-Humean understanding of causation, QCA was established 25 years ago, in
Charles Ragin’s (1987) book The Comparative Method. QCA systematically compares cases as
configurations of conditions. It has roots in Boolean algebra and employs truth tables and the
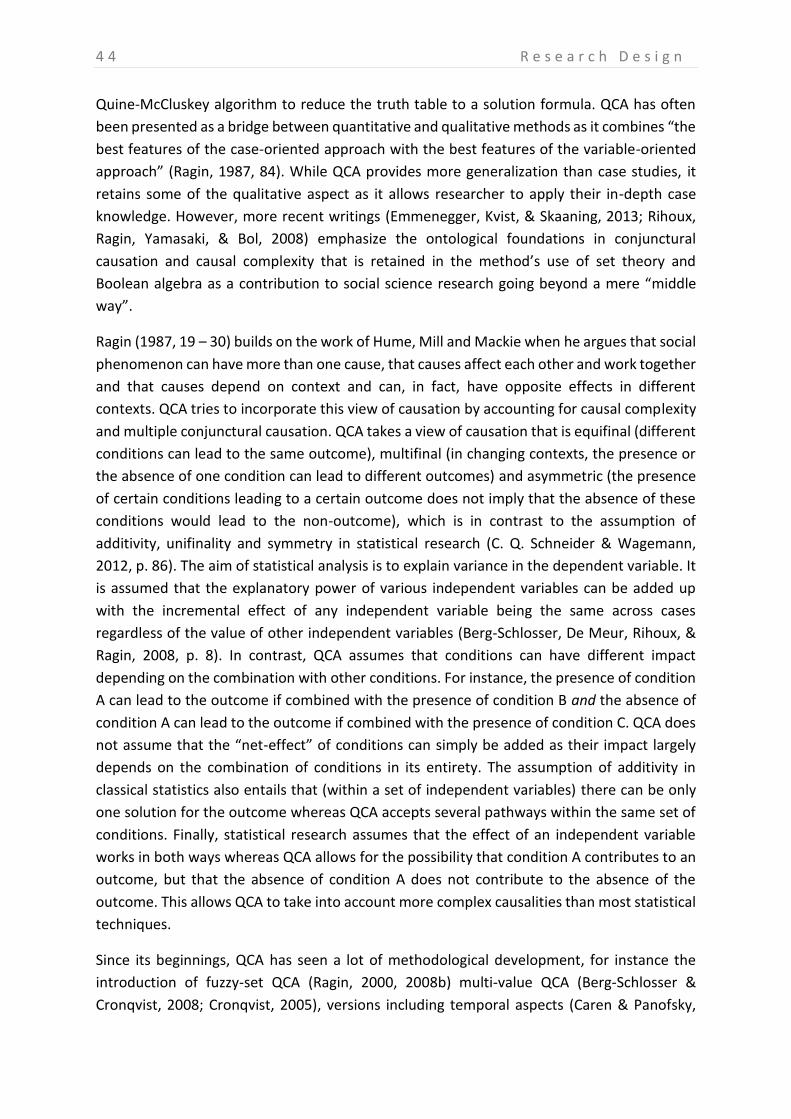
4 4 R e s e a r c h D e s i g n
Quine-McCluskey algorithm to reduce the truth table to a solution formula. QCA has often
been presented as a bridge between quantitative and qualitative methods as it combines “the
best features of the case-oriented approach with the best features of the variable-oriented
approach” (Ragin, 1987, 84). While QCA provides more generalization than case studies, it
retains some of the qualitative aspect as it allows researcher to apply their in-depth case
knowledge. However, more recent writings (Emmenegger, Kvist, & Skaaning, 2013; Rihoux,
Ragin, Yamasaki, & Bol, 2008) emphasize the ontological foundations in conjunctural
causation and causal complexity that is retained in the method’s use of set theory and
Boolean algebra as a contribution to social science research going beyond a mere “middle
way”.
Ragin (1987, 19 – 30) builds on the work of Hume, Mill and Mackie when he argues that social
phenomenon can have more than one cause, that causes affect each other and work together
and that causes depend on context and can, in fact, have opposite effects in different
contexts. QCA tries to incorporate this view of causation by accounting for causal complexity
and multiple conjunctural causation. QCA takes a view of causation that is equifinal (different
conditions can lead to the same outcome), multifinal (in changing contexts, the presence or
the absence of one condition can lead to different outcomes) and asymmetric (the presence
of certain conditions leading to a certain outcome does not imply that the absence of these
conditions would lead to the non-outcome), which is in contrast to the assumption of
additivity, unifinality and symmetry in statistical research (C. Q. Schneider & Wagemann,
2012, p. 86). The aim of statistical analysis is to explain variance in the dependent variable. It
is assumed that the explanatory power of various independent variables can be added up
with the incremental effect of any independent variable being the same across cases
regardless of the value of other independent variables (Berg-Schlosser, De Meur, Rihoux, &
Ragin, 2008, p. 8). In contrast, QCA assumes that conditions can have different impact
depending on the combination with other conditions. For instance, the presence of condition
A can lead to the outcome if combined with the presence of condition B and the absence of
condition A can lead to the outcome if combined with the presence of condition C. QCA does
not assume that the “net-effect” of conditions can simply be added as their impact largely
depends on the combination of conditions in its entirety. The assumption of additivity in
classical statistics also entails that (within a set of independent variables) there can be only
one solution for the outcome whereas QCA accepts several pathways within the same set of
conditions. Finally, statistical research assumes that the effect of an independent variable
works in both ways whereas QCA allows for the possibility that condition A contributes to an
outcome, but that the absence of condition A does not contribute to the absence of the
outcome. This allows QCA to take into account more complex causalities than most statistical
techniques.
Since its beginnings, QCA has seen a lot of methodological development, for instance the
introduction of fuzzy-set QCA (Ragin, 2000, 2008b) multi-value QCA (Berg-Schlosser &
Cronqvist, 2008; Cronqvist, 2005), versions including temporal aspects (Caren & Panofsky,
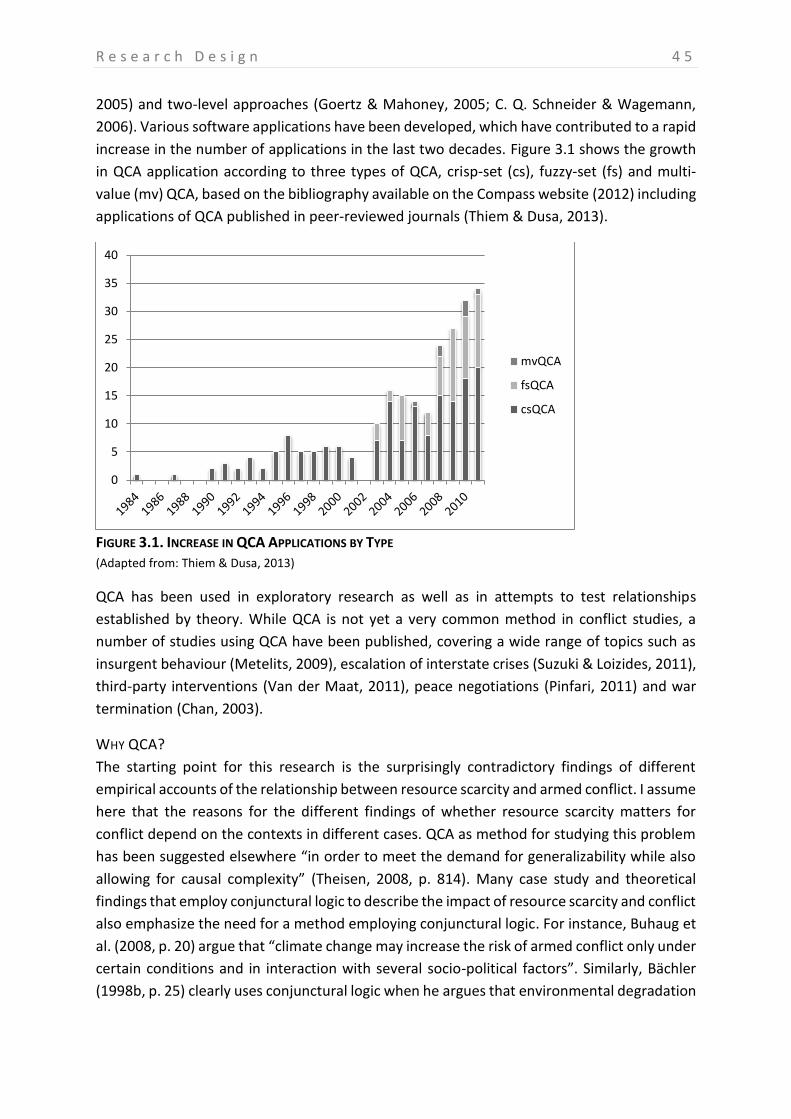
R e s e a r c h D e s i g n 4 5
2005) and two-level approaches (Goertz & Mahoney, 2005; C. Q. Schneider & Wagemann,
2006). Various software applications have been developed, which have contributed to a rapid
increase in the number of applications in the last two decades. Figure 3.1 shows the growth
in QCA application according to three types of QCA, crisp-set (cs), fuzzy-set (fs) and multi-
value (mv) QCA, based on the bibliography available on the Compass website (2012) including
applications of QCA published in peer-reviewed journals (Thiem & Dusa, 2013).
FIGURE 3.1. INCREASE IN QCA APPLICATIONS BY TYPE (Adapted from: Thiem & Dusa, 2013)
QCA has been used in exploratory research as well as in attempts to test relationships
established by theory. While QCA is not yet a very common method in conflict studies, a
number of studies using QCA have been published, covering a wide range of topics such as
insurgent behaviour (Metelits, 2009), escalation of interstate crises (Suzuki & Loizides, 2011),
third-party interventions (Van der Maat, 2011), peace negotiations (Pinfari, 2011) and war
termination (Chan, 2003).
WHY QCA?
The starting point for this research is the surprisingly contradictory findings of different
empirical accounts of the relationship between resource scarcity and armed conflict. I assume
here that the reasons for the different findings of whether resource scarcity matters for
conflict depend on the contexts in different cases. QCA as method for studying this problem
has been suggested elsewhere “in order to meet the demand for generalizability while also
allowing for causal complexity” (Theisen, 2008, p. 814). Many case study and theoretical
findings that employ conjunctural logic to describe the impact of resource scarcity and conflict
also emphasize the need for a method employing conjunctural logic. For instance, Buhaug et
al. (2008, p. 20) argue that “climate change may increase the risk of armed conflict only under
certain conditions and in interaction with several socio-political factors”. Similarly, Bächler
(1998b, p. 25) clearly uses conjunctural logic when he argues that environmental degradation
0
5
10
15
20
25
30
35
40
mvQCA
fsQCA
csQCA
4 6 R e s e a r c h D e s i g n
leads to conflict if “social fault lines can be manipulated in struggles over social, ethnic,
political or international power”, in fact arguing that environmental degradation leads to
conflict only in combination with other conditions. Blattman and Miguel (2010, p. 27) also
point out that if the relationship of risk factors like inequality and ethnic fragmentation to
conflict “is conditional on particular institutional or historical contexts, then we should not be
surprised that their statistical association with conflict is weak.” As it is based on conjunctural
logic and focuses on the pathways and combinations of conditions that lead to an outcome,
QCA is particularly beneficial to the analysis of context conditions. Employing QCA can thus
help to overcome the failure of quantitative studies to consider indirect and conditional
effects.
HOW QCA WORKS
Early variants of QCA focus on the presence and absence of conditions (crisp-set QCA) while
later variants allow for more continuous scoring of conditions. This study uses fsQCA rather
than crisp-set QCA as this allows for more nuance, both when it comes to the calibration of
conditions and the calibration of the outcome. Fuzzy-set (fs) QCA is a variant of QCA that
scores conditions not in terms of presence or absence of a condition but scores them between
zero and one. This reflects the social reality, where few conditions are dichotomous. Rather,
most conditions present a spectrum from for instance the most democratic countries to the
most undemocratic. FsQCA uses set theory to differentiate between countries that are fully
in a set, (e.g. Turkmenistan in the set of authoritarian countries), more in than out of a set
(e.g. Kyrgyzstan), more out than in a set (e.g. Armenia) or fully out of a set (e.g. Netherlands).
Determining whether a country is fully in, more in than out, more out than in or fully out of a
set of countries is of great importance and needs to be done very carefully as this plays a large
role in determining the outcome. Therefore the scoring of conditions (or calibration) should
be based on substantive and theoretical knowledge (Ragin, 2008b, p. 86) using external
criteria rather than rather than sample-specific standards such as averages or standard
deviations. A lot of focus is put on making the process of calibration as transparent as possible
(C. Q. Schneider & Wagemann, 2012, p. 32). In some cases, it is possible to use external criteria
for defining the set membership of cases, in particular where qualitative threshold exists. For
instance, for the condition access to agricultural research in chapter 6, I use qualitative
assessments by the International Fund for Agricultural Development, which includes
assessments such as “the agricultural research and extension system is weak and does not
address the needs of poor farmers” (IFAD, 2003, p. 8), which I use as threshold for fully out of
the set of countries with access to agricultural research. However, many social science data
lacks these kind of obvious thresholds, so knowledge of specific cases is another way to set
anchors (C. Q. Schneider & Wagemann, 2012, pp. 32 – 41). In practice, data gaps are
frequently employed to set threshold since they suggest a qualitatively different categories
of countries. In addition to being based on theory, the calibration of data needs to provide
variation across the spectrum of cases, as a condition where all cases are more in than out of
the set (or vice versa) is meaningless. For instance, if all countries in a sample are either more
R e s e a r c h D e s i g n 4 7
in than out or fully in the set of rich countries, then being a rich country will be a necessary
condition for both, the outcome and non-outcome. Subsequently, thresholds can be set quite
differently depending on the set of cases. For instance, in my global sample, Chile is more in
than out of the set of countries with high levels of development (fuzzy-set score of 0.68).
However, in a set of OECD countries, Chile might be fully in the set of countries with a low per
capita income and in a set of Latin American countries, it might be fully in the set of countries
with a high per capita income. For this reason, clearly defining the target set is of great
importance (Ragin, 2008a, pp. 93 – 94), which is in line with the requirement of a close
relationship between theory and empirical cases (Ragin, 2008b, p. 84).
There are two ways to calibrate fuzzy-set conditions, the direct and the indirect method
(Ragin, 2008b, pp. 89–97). In the direct method, the researcher specifies three thresholds:
1) The crossover point from fully in the set to more in than out of the set
(corresponding to a fuzzy-set score of 1);
2) The crossover point from more in to more out of the set (fuzzy-set score of 0.5)
and
3) The crossover point from more out than in the set to fully out of the set (fuzzy-set
score of 0).
Using these thresholds the raw data is then calibrated applying software. Scores are assigned
to cases for a condition based on the raw data and the thresholds defined by the researcher.
With the indirect method, the cases are grouped qualitatively according to their membership
in the target set and then assigned scores to reflect this grouping. In this study, all conditions
are calibrated directly using the calibrate function in the fsQCA software (Davey & Ragin,
2009). The score assigned to a case for a condition is the membership score of this case in the
condition. Membership scores can be negated: If a country has a membership score of 0.7 in
the set of democratic countries, its membership score for the set of non-democratic countries
is 1 - 0.7 or 0.3. Membership scores can also be combined, either in an AND or in an OR
relation: A country with a 0.7 score in the set of democratic countries and a 0.9 membership
score in the set of developed countries has a 0.7 score for being democratic AND developed
and a 0.9 score for being democratic OR developed. Formally, the logical AND is the
intersection of two (or more) sets, calculated as the minimum of the membership scores.
Logical OR is the union of two (or more) sets, calculated by using the maximum of the
membership scores.
As outlined above, QCA focuses on (combinations of) conditions. It differentiates between
necessary and sufficient conditions. With a necessary condition, whenever the outcome is
present, the condition is as well. If poverty is a necessary condition for conflict, all countries
experiencing conflict are poor, but not all poor countries experience conflict. With a sufficient
condition, whenever the condition is present, so is the outcome. If poverty is a sufficient
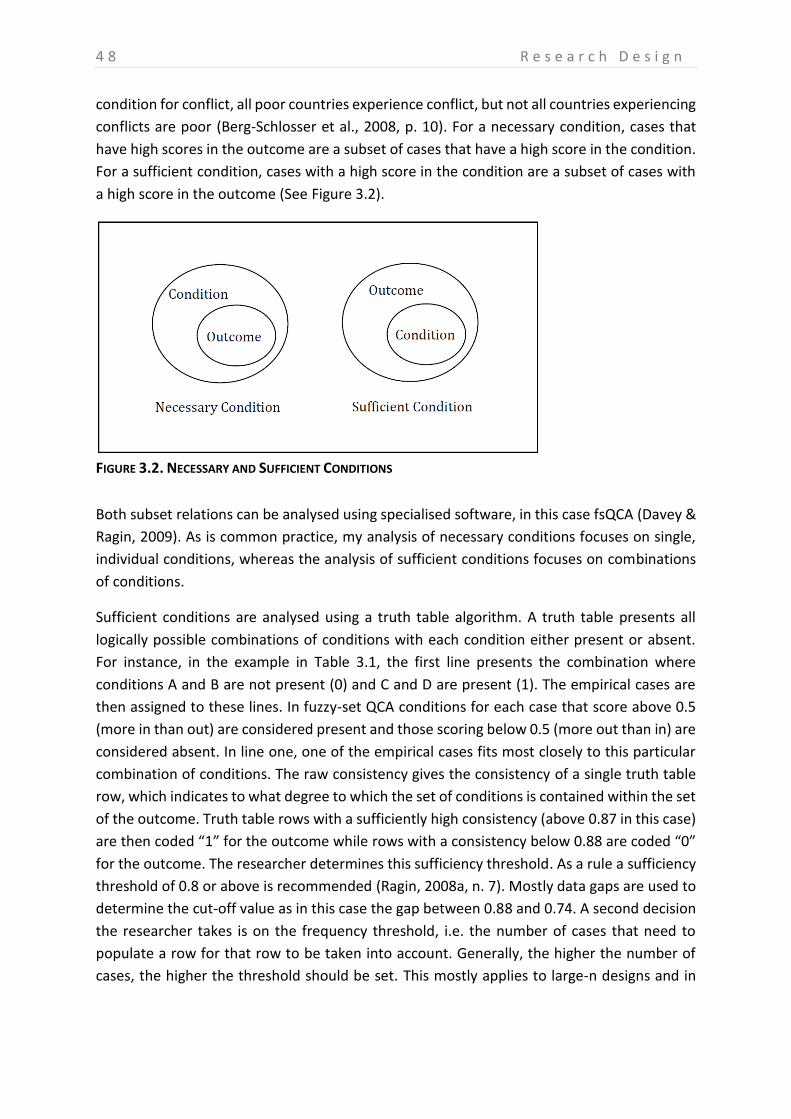
4 8 R e s e a r c h D e s i g n
condition for conflict, all poor countries experience conflict, but not all countries experiencing
conflicts are poor (Berg-Schlosser et al., 2008, p. 10). For a necessary condition, cases that
have high scores in the outcome are a subset of cases that have a high score in the condition.
For a sufficient condition, cases with a high score in the condition are a subset of cases with
a high score in the outcome (See Figure 3.2).
FIGURE 3.2. NECESSARY AND SUFFICIENT CONDITIONS
Both subset relations can be analysed using specialised software, in this case fsQCA (Davey &
Ragin, 2009). As is common practice, my analysis of necessary conditions focuses on single,
individual conditions, whereas the analysis of sufficient conditions focuses on combinations
of conditions.
Sufficient conditions are analysed using a truth table algorithm. A truth table presents all
logically possible combinations of conditions with each condition either present or absent.
For instance, in the example in Table 3.1, the first line presents the combination where
conditions A and B are not present (0) and C and D are present (1). The empirical cases are
then assigned to these lines. In fuzzy-set QCA conditions for each case that score above 0.5
(more in than out) are considered present and those scoring below 0.5 (more out than in) are
considered absent. In line one, one of the empirical cases fits most closely to this particular
combination of conditions. The raw consistency gives the consistency of a single truth table
row, which indicates to what degree to which the set of conditions is contained within the set
of the outcome. Truth table rows with a sufficiently high consistency (above 0.87 in this case)
are then coded “1” for the outcome while rows with a consistency below 0.88 are coded “0”
for the outcome. The researcher determines this sufficiency threshold. As a rule a sufficiency
threshold of 0.8 or above is recommended (Ragin, 2008a, n. 7). Mostly data gaps are used to
determine the cut-off value as in this case the gap between 0.88 and 0.74. A second decision
the researcher takes is on the frequency threshold, i.e. the number of cases that need to
populate a row for that row to be taken into account. Generally, the higher the number of
cases, the higher the threshold should be set. This mostly applies to large-n designs and in
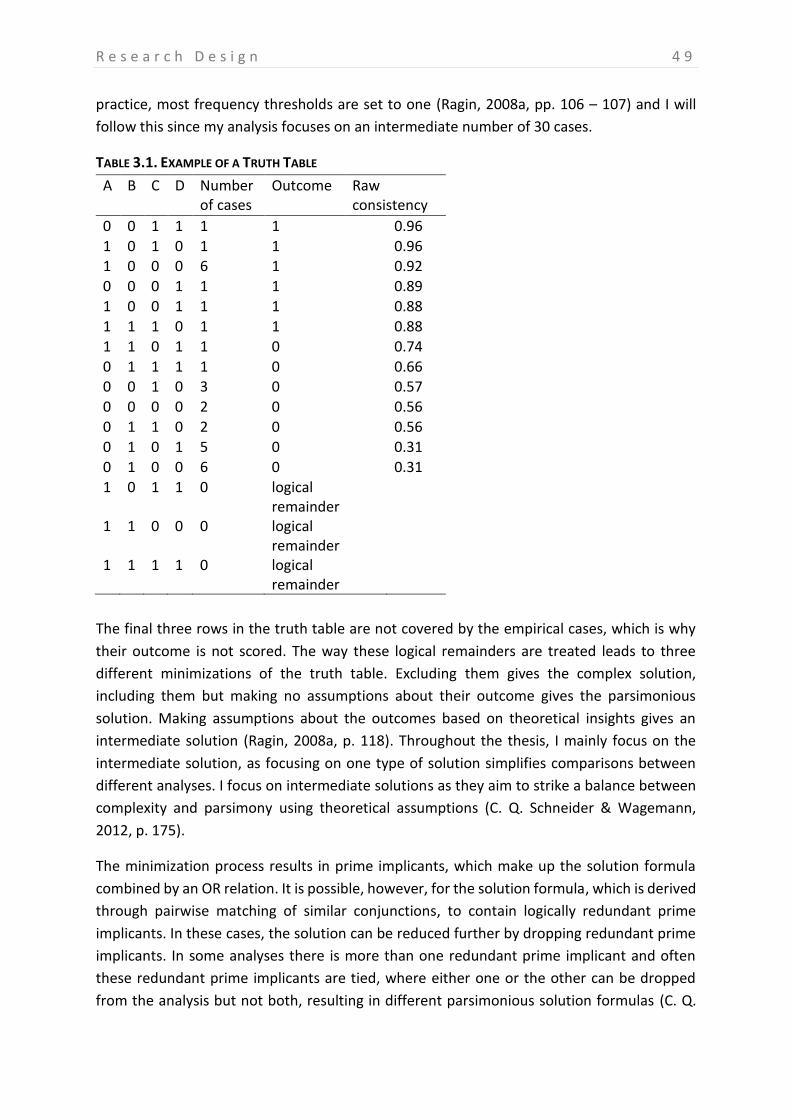
R e s e a r c h D e s i g n 4 9
practice, most frequency thresholds are set to one (Ragin, 2008a, pp. 106 – 107) and I will
follow this since my analysis focuses on an intermediate number of 30 cases.
TABLE 3.1. EXAMPLE OF A TRUTH TABLE
A B C D Number of cases
Outcome Raw consistency
0 0 1 1 1 1 0.96
1 0 1 0 1 1 0.96 1 0 0 0 6 1 0.92
0 0 0 1 1 1 0.89
1 0 0 1 1 1 0.88
1 1 1 0 1 1 0.88
1 1 0 1 1 0 0.74
0 1 1 1 1 0 0.66 0 0 1 0 3 0 0.57
0 0 0 0 2 0 0.56
0 1 1 0 2 0 0.56
0 1 0 1 5 0 0.31
0 1 0 0 6 0 0.31
1 0 1 1 0 logical remainder
1 1 0 0 0 logical remainder
1 1 1 1 0 logical remainder
The final three rows in the truth table are not covered by the empirical cases, which is why
their outcome is not scored. The way these logical remainders are treated leads to three
different minimizations of the truth table. Excluding them gives the complex solution,
including them but making no assumptions about their outcome gives the parsimonious
solution. Making assumptions about the outcomes based on theoretical insights gives an
intermediate solution (Ragin, 2008a, p. 118). Throughout the thesis, I mainly focus on the
intermediate solution, as focusing on one type of solution simplifies comparisons between
different analyses. I focus on intermediate solutions as they aim to strike a balance between
complexity and parsimony using theoretical assumptions (C. Q. Schneider & Wagemann,
2012, p. 175).
The minimization process results in prime implicants, which make up the solution formula
combined by an OR relation. It is possible, however, for the solution formula, which is derived
through pairwise matching of similar conjunctions, to contain logically redundant prime
implicants. In these cases, the solution can be reduced further by dropping redundant prime
implicants. In some analyses there is more than one redundant prime implicant and often
these redundant prime implicants are tied, where either one or the other can be dropped
from the analysis but not both, resulting in different parsimonious solution formulas (C. Q.
5 0 R e s e a r c h D e s i g n
Schneider & Wagemann, 2012, pp. 108 – 111). In these cases, I indicate the prime implicant
that I keep in the analysis.
Throughout the thesis QCA results are notated by employing upper case for the presence (or
high levels) of a condition while lower case denotes the absence (or low levels) of a condition.
Conditions can be combined with a logical AND, which is denoted by “*” or a logical OR, which
s denoted by “+”. A sufficient solution is denoted by “->” while a necessary solution is denoted
by “<-“. Thus, the solution [A * b * C + A *d -> OUTCOME] has two sufficient pathways [A * b
* C] or [A * d] that are combined with a logical OR. It reads as high levels of condition A
combined with low levels of condition B and high levels of C or high levels of A combined with
low levels of D are sufficient for the outcome. It can also be written like this [A (b * C + d) ->
OUTCOME] since high levels of A are part of both pathways.
The solutions resulting from minimizing the truth table are assessed using consistency and
coverage measures. Consistency for a sufficient condition evaluates the degree to which a
sub-set relation has been approximated, while coverage assesses the empirical importance
of a consistent subset (Ragin, 2008, 44 – 70). For fully consistent sufficiency, all cases must
have a membership in the combination of conditions that is equal to or smaller than the
membership in the outcome. To assess whether this requirement is met, the minimum
membership scores across the combination of conditions (x) and the outcome (y) is added up
and then divided by the sum of the membership values in the combination of conditions.
Where all cases have a smaller membership in the combination of conditions than in the
outcome, this formula is equal to one (C. Q. Schneider & Wagemann, 2012, p. 126). In formal
terms, the consistency for a sufficient condition is∑ min(𝑥𝑖,𝑦𝑖)𝐼𝑖=1
∑ 𝑥𝑖𝐼𝑖=1
. Coverage of a sufficient
condition expresses the relation in size between the combination of conditions and the
outcome (C. Q. Schneider & Wagemann, 2012, pp. 129 – 131). For full coverage, the score of
cases in the combination of conditions needs to be equal to or smaller than the membership
score in the outcome. In formal terms, the coverage for a sufficient condition is∑ min(𝑥𝑖,𝑦𝑖)𝐼𝑖=1
∑ 𝑦𝑖𝐼𝑖=1
.
For the individual pathways of a solution, the raw and unique coverage are given. Raw
coverage gives the coverage rate for all cases covered by the pathway while unique coverage
gives the coverage rate for those cases that are covered by this pathway only.
For necessary conditions, the notions of consistency and coverage can be applied as well (C.
Q. Schneider & Wagemann, 2012, pp. 139 – 147). In a necessary condition, all cases have
higher membership scores in the condition than in the outcome. Therefore, the degree to
which each case’s membership in the condition is equal to or greater than their membership
in the outcome gives the consistency. Therefore, the consistency of a necessary condition is
equal to the coverage of a sufficient condition. For the coverage, it is assessed how much
smaller the size of the outcome is than the size of the condition. The closer the fit, the higher
the coverage. This helps to eliminate trivial necessary conditions (e.g. needing oxygen for
voting left wing – while all left wing voters need oxygen, the coverage ratio shows that the
R e s e a r c h D e s i g n 5 1
size of the condition is very much larger than the size of the outcome.) The formula for the
coverage of a necessary condition is equal to the formula of consistency for a sufficient
condition.
QCA results are summarised in tables, which give information on the outcome that is analysed
(peace or conflict), the sufficiency and frequency thresholds, the conditions included in the
analysis, the individual pathways including their consistency and raw and unique coverage,
and the full solution formula including sufficiency and coverage.
SEQUENCING AND REVERSE CAUSALITY
A problem – common in many methods – that QCA cannot solve is how to show causality.
Observing causality in social science is difficult and the subset relations QCA is based upon do
not infer causality per se. While necessary and sufficient conditions are often discussed in the
terms of causal pathways, the causal inference is based on theory rather than the subset
relationship, which only gives information of the patterns in which conditions and outcomes
occur. For instance, the street being wet is a necessary condition of rain as a wet street is
always present when it rains. (It is not sufficient, as there are reasons for wet streets besides
rain). However, nobody would argue that the wet street is the cause of the rain. This is also
true in less obvious cases, such as conflict and development. If development is a necessary
condition for conflict, does low development cause conflict? Or does conflict cause low levels
of development? This example shows the importance of having sound theoretical reasons for
the choice of conditions and outcomes as well as the importance of sequence and timing.
As a method, QCA does not explicitly integrate a temporal dimension and in fact, it has been
argued that QCA is “a static comparison that is not fully compensated by the use of temporally
contingent determinants” (Boswell & Brown, 1999). However, scholars have developed
various strategies to integrate time into QCA. Rihoux (2012) presents a number of previous
approaches to include timing into QCA: Aiming at including time into QCA proper, Caren and
Panofsky (2005) developed temporal QCA (T)QCA, which includes sequence contributions as
a case attribute (temporal operator). However, this increases the number of logically possible
configurations dramatically. Other authors have combined various other methods with QCA
to include the temporal aspect. Methods used for this include process tracing (see for
instance: Emmenegger, 2011; Maggetti, 2007; Sager & Andereggen, 2012; C. Q. Schneider &
Wagemann, 2006), event structure analysis (e.g. Stevenson & Greenberg, 2000), sequential
game theory (C. Brown & Boswell, 1995) and time-series analysis (Hino, 2009).
Timing and feedback loops are an important issue for my analysis as conflicts themselves can
lead to environmental degradation via a number of mechanisms such as habitat destruction
and loss of wildlife, over-exploitation of natural resources, pollution and the breakdown of
environmental policies and programmes (Matthew et al., 2002, pp. 366–369). In addition,
conflicts have a huge impact on many of the social, economic and political conditions I am
interested in. For instance, armed conflict and civil war have a strong negative impact on
economic development as well as on political institutions. Armed conflicts can generate a
5 2 R e s e a r c h D e s i g n
“conflict trap” (Collier & Sambanis, 2002, p. 5), where societies that have experienced
conflicts are more likely to experience another one shortly afterwards. Research on civil war
recurrence argues that there are various reasons for this such as that grievances that lead to
the first war were not resolved; that existing cleavages were exacerbated through violence
and that the first conflict ended in unstable peace agreements (Walter, 2004, p. 372). There
are various strategies to deal with this in this project
a) In case selection: by excluding cases that have experienced a conflict in the 10 years before the first conflict in the time of interest. This would, however, limit the sample and therefore increase the problem of limited diversity.
b) By including a condition to capture conflicts in the 10 years before the first conflict.
This would allow me to analyse the interplay in a post-conflict society with many
other variables. It is quite reasonable for instance, to theorise that where previous
conflicts are combined with slow economic recovery, this might increase the risk of
conflict. The drawback here is that adding a condition also increases the number of
combinations and therefore leads to many logical remainders. From what we know
about the impact of previous conflicts it is also likely that this will end up the only
sufficient condition in a parsimonious conditions – while this would once again
emphasize the high risk of post-conflict societies to slip back into armed conflict, it
would add little in substance.
c) A third option would be to use process tracing to assess the causal processes taking
place. However, with an intermediate n of more than 30 cases this is not feasible.
In this study, I choose to exclude cases with previous conflicts (see page 57 for details on case
selection) as this allows me to control best for feedback loops. I am not including any temporal
measures to determine the order in which conditions occurred. As I am mainly including
general rather than actor-dependent conditions, most conditions remain stable over time. It
would be difficult to establish, for instance, whether Kenya was first a country where
livelihoods largely depended on agriculture or a society with multiple ethnic identities. In
addition, it is hard to imagine that the order of these developments would matter for the
conflicts between 1990 and 2010. To avoid feedback loops, such as conflict leading to poverty,
data for conditions are taken from the year(s) prior to the conflict.
SELECTION OF CONDITIONS
The twin goals of doing justice to the complexity of social reality and providing results that
can be generalized across cases make the selection of conditions a vital step for this analysis.
There are two opposing aims that need to be satisfied: While I aim to portray the complex
interrelationships between the environment and the many social, political and economic
conditions at play as accurately as possible (which calls for the inclusion of many if not all
conditions), I also aim at to draw more general conclusions across cases (which suggests
limiting the number of conditions included. In addition, QCA as a method limits the number
R e s e a r c h D e s i g n 5 3
of conditions that can be included to reach robust results. Therefore, selecting the conditions
to be included in this study is an important step. I will first review various approaches to
selecting conditions in QCA and the present my approach, which is based on the adaptive
capacities framework presented in chapter 2.
HOW TO SELECT CONDITIONS IN QCA
Within QCA, the careful selection of conditions is seen as a best practice due to the inherent
limit to the number of conditions. The number of possible combinations of conditions
increases exponentially with each new condition added. For k conditions, there are 2k
combinations of conditions. In the case of many logically possible combinations, the empirical
cases cover only a small proportion of this “logical space”. This is a problem that is not unique
to QCA, but is common in any empirical analysis including a more than a few variables (De
Meur, Rihoux, & Yamasaki, 2008, p. 158). In fact, this problem of “limited diversity is
ubiquitous in comparative research and it has strong impacts on the inferences drawn” (C. Q.
Schneider & Wagemann, 2006, p. 752). Limited diversity leads to a situation where “the
observed data are far less rich than the potential property space delineated by the conditions”
(Berg-Schlosser & De Meur, 2008, p. 27). The danger is that this will lead to individualization,
where no or only one case represents each combination of conditions, which amounts to a
description of cases and has no explanatory power. Therefore, the number of conditions that
can reasonably be included in any analysis is limited. Berg-Schlosser and De Meur (2008, p.
28) suggest no more than four to seven conditions for an intermediate number of cases. For
crisp-set analysis, Marx (2010) finds the ratio of conditions to cases should not exceed 1/3.
For 30 cases, this means that no more than 10 conditions should be included.
Owing to this limitation, a number of approaches to selecting conditions have been
suggested. Ragin (1987, pp. 120 – 121) argues that the selection of conditions should be based
on the “relevant theories, the relevant research literature, and, most important of all, the
relevant cases.” Analysing a number of csQCA studies, Amenta and Poulsen (1994) find five
approaches to choosing conditions: the comprehensive approach includes all potentially
interesting conditions; the perspective approach tests two or three theories based on
previous knowledge; the significance approach selects conditions based on statistical
significance; the second-look approach focuses on previously overlooked conditions and
finally (and preferred by Amenta and Poulsen) the conjunctural approach includes conditions
that are selected on the basis of “theories that are conjunctural or combinatorial in
construction”. To these five approaches, Yamasaki and Rihoux (2008, p. 125) add the
inductive approach, where conditions are based on case knowledge rather than theory. In
addition, the two-step approach pioneered by Schneider and Wagemann (2006) takes the
opposite approach by making it possible to include additional conditions.
CONDITIONS INCLUDED IN THIS STUDY
This study uses the theoretical framework of adaptive capacity (see chapter 2) as first step to
select conditions. The adaptive capacities framework describes six categories of factors that
5 4 R e s e a r c h D e s i g n
determine a society’s capacity to adapt to climate change and avoid negative consequences.
These categories are: economic resources, institutions, technology, information and skills,
infrastructure and equity. I have summarised technology, information and skills into a single
category called “adaptive skills”. I am not including the category infrastructure since this
mainly applies to the adaption to extreme weather events (building of dams, shelters, etc.),
which does not apply to my research.
I use the six broader categories in the adaptive capacities framework to structure the
conditions that I found in an in-depth review of more than 20 case studies of conflict in
resource-scarce cases. I included case studies that fulfilled the following criteria:
published in top 10 journals according to five-year impact factor in 2011 in International Relations and Political Science 9
published between 1990 and 2010
found with the search {“resource scarcity” AND “conflict”} or {“environmental scarcity” AND “conflict”} or {“environmental conflict”}
focus on arable land or water or both
focus on internal conflict
included at least one detailed case study
This yielded 10 case studies published in top journals. I added 12 additional case studies from
published volumes or other journals to provide a more comprehensive picture. The
explanations for violence in these cases cover quite a wide range – from cases focusing on
specific political institutions such as land rights and land allocation (Boone, 2011) to cases that
see migration and identity politics as main causal factors (Swain, 1996)10. I then used the
adaptive capacities framework to structure the conditions included in case studies using
mainly qualitative clustering techniques.
In addition to the conditions included from case studies, I include adaptive skills, such as
access to science, technology and knowledge. These aspects are not frequently discussed in
case studies of conflict in resource scarce cases. However, they play an important role in the
discussion of adaptive capacities. I argue that the limited role adaptive skills play in the
discussion of conflicts in resource-scarce countries and in the conflict literature at large is due
to a focus on cases with conflict outcome. Since these conditions are more likely to prevent
9 American Journal of Political Science, American Political Science Review, Annual Review of Political Science, Comparative Political Studies, European Journal of International Relations, Foreign Affairs, International Organization, International Political Sociology, International Security, International Studies Quarterly, Journal of Conflict Resolution, Journal of Peace Research, Journal of Politics, Marine Policy, Political Analysis, Political Geography, Political Psychology, Public Opinion Quarterly, Security Dialogue, World Politics 10 For an overview of the case studies and the conditions included, see Table B.1 in the appendix.
R e s e a r c h D e s i g n 5 5
conflicts, they are hard to find when focusing mostly on causal explanations for conflict. It is
also difficult to argue that a conflict would have broken out in a certain case, had it not been
for adaptive skills. However, this analysis and, in particular, the separate analyses of the
conflict and peace outcome demanded by the method allow me to include adaptive skills as
an individual condition.
In a third step, I evaluated the conditions found so far against the theoretical arguments and
findings in the wider conflict literature. As a result of this evaluation I included high
dependence on the export of natural resources and high dependence on the export of oil as
conditions. While the role of mineral resources is not a condition in most case studies of
resource-scarce countries, theories of resource abundance and rentier states play an
important role in the conflict literature at large (see chapters 4 and 5 for detailed discussion
of these arguments).
This selection procedure leads to 22 conditions (see Table 3.2), which are analysed in three
separate analyses as a first step, separated into three chapters focusing on economic, political
and social explanations (chapters 4 to 6). These explanations are brought together in an
integrated analysis (chapter 7).
This approach to selecting conditions combines prior theoretical knowledge with case study
knowledge, which is in line with the ontological basis of QCA, emphasizing case study
knowledge and conjunctural causation. In addition, I keep the number of conditions at a
feasible number.
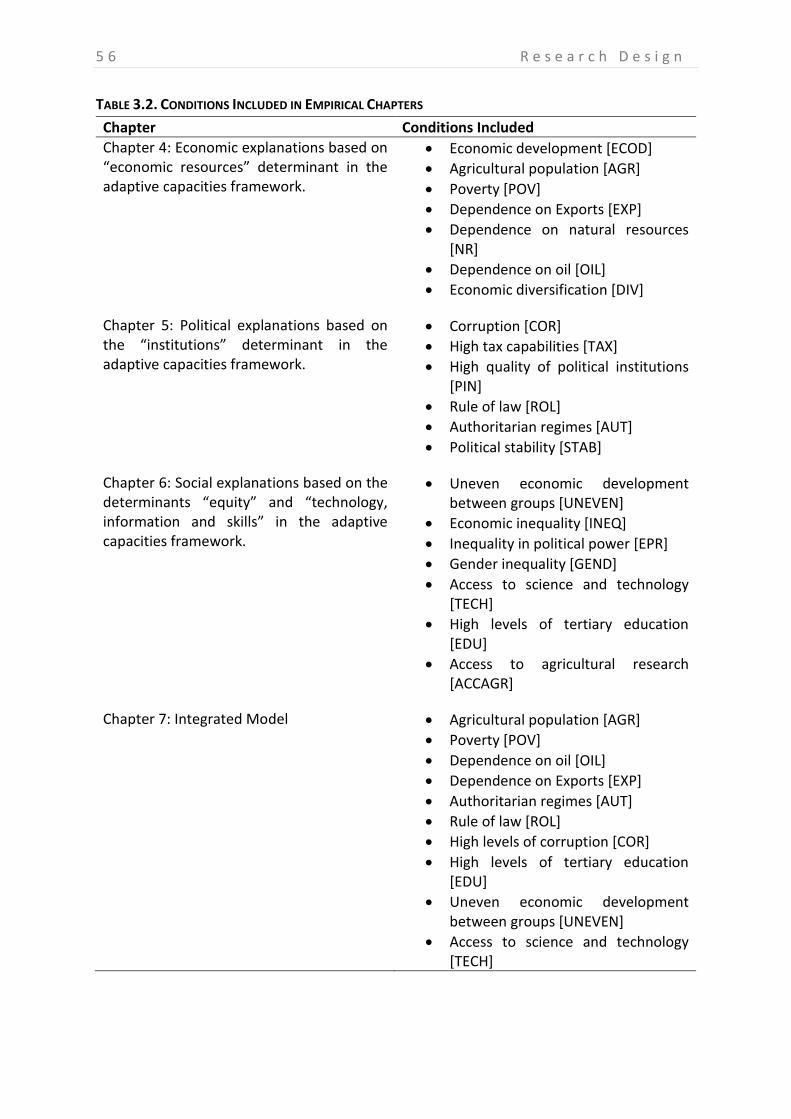
5 6 R e s e a r c h D e s i g n
TABLE 3.2. CONDITIONS INCLUDED IN EMPIRICAL CHAPTERS
Chapter Conditions Included
Chapter 4: Economic explanations based on “economic resources” determinant in the adaptive capacities framework.
Economic development [ECOD]
Agricultural population [AGR]
Poverty [POV]
Dependence on Exports [EXP]
Dependence on natural resources [NR]
Dependence on oil [OIL]
Economic diversification [DIV]
Chapter 5: Political explanations based on the “institutions” determinant in the adaptive capacities framework.
Corruption [COR]
High tax capabilities [TAX]
High quality of political institutions [PIN]
Rule of law [ROL]
Authoritarian regimes [AUT]
Political stability [STAB]
Chapter 6: Social explanations based on the determinants “equity” and “technology, information and skills” in the adaptive capacities framework.
Uneven economic development between groups [UNEVEN]
Economic inequality [INEQ]
Inequality in political power [EPR]
Gender inequality [GEND]
Access to science and technology [TECH]
High levels of tertiary education [EDU]
Access to agricultural research [ACCAGR]
Chapter 7: Integrated Model Agricultural population [AGR]
Poverty [POV]
Dependence on oil [OIL]
Dependence on Exports [EXP]
Authoritarian regimes [AUT]
Rule of law [ROL]
High levels of corruption [COR]
High levels of tertiary education [EDU]
Uneven economic development between groups [UNEVEN]
Access to science and technology [TECH]
R e s e a r c h D e s i g n 5 7
I choose to split up the conditions into three chapters focusing on economic, political and
social conditions for two main reasons. Firstly, this allows me to look into different strands of
theory explaining armed conflict and civil war in more depth. Exploring the various
explanations in depth would be very difficult without this separation. Secondly, in an effort
to include all the relevant conditions, placing them into a single analysis is not feasible. By
splitting them up, I am able to include all conditions that my review of the case literature and
the larger armed conflict literature yielded. The main drawback of separating the conditions
into different chapters is that connection between conditions in different chapters gets lost
as social, political and economic conditions act in conjecture. These conjectures between
social, economic and political conditions are explored in the integrated chapter.
SELECTION OF CASES
The previous section has focused on selecting conditions of relevance in resource-scarce
countries. To analyse these conditions, I need to define my sample of resource-scarce
countries. In operationalising resource scarcity, I focus on absolute (rather than perceived)
levels and on natural (rather than socio-economic) scarcity. Focusing on two resources,
freshwater and arable land, this leads me to select cases based on the 1000 m3 per year
freshwater threshold set forth by Falkenmark et al. (1989) and the FAO index according to
land resource potential and constraints (FAO, 2000). To establish, which of the resulting cases
experienced conflicts, I focus on low-scale conflict with a relatively low battle death threshold.
After presenting various definitions and datasets to measure conflict, I explain my choice of
the Uppsala Conflict Data Program’s definition and datasets. This generates a final list of 30
countries, 14 of which experienced conflicts and 16 of which did not.
NATURAL RESOURCE SCARCITY
While it is a key term within resource scarcity theories, no commonly accepted definition or
measure of natural resource scarcity exists. As I have shown in chapter 2, various measures
such as population density (Theisen, 2008; Buhaug & Rød, 2006; Hegre & Sambanis, 2006; de
Soysa, 2002b; Hauge & Ellingsen, 1998) or the degree of soil erosion (Hendrix & Glaser, 2007;
Raleigh & Urdal, 2007; Theisen & Brandsegg, 2007; Esty et al., 1998; Hauge & Ellingsen, 1998)
have been used to determine whether an area is resource scarce, but no standard
operationalisation has been established. In this section, I will compare different approaches
and explain the epistemological choices made in this study, leading to a positivist and absolute
approach towards defining resource scarcity and to states as the level of analysis.
Approaches to resource scarcity can be differentiated into a) positivist and constructivist
approaches and b) absolute and relative approaches. The positivist approach focuses on the
actual level of resource scarcity as can be measured in the natural world, whereas the
constructivist approach is concerned with the perceived level of scarcity. The absolute level
of scarcity focuses on the natural level of resources without taking into account socio-
economic factors that might influence the experienced level of scarcity, which are included in
the relative approach to resource scarcity. This concerns for instance resources that are not
5 8 R e s e a r c h D e s i g n
accessible due to infrastructure restraints (i.e. not enough wells), resource-intensive lifestyle
choices that need a much higher resource level to be sustainable or adaptation skills that
make societies function well even on a relatively low resource level. Most operationalisations
of resource scarcity in quantitative studies fall squarely into the positivist and absolute camp.
Resource scarcity theorists often include both absolute and relative conceptions of resource
scarcity but are less clear on the division between positivist and constructivist approaches.
For instance, Homer-Dixon’s (1999, pp. 47 – 72) conception of resource scarcity includes
natural as well as social factors in the conception resource scarcity, but is rather silent on the
issue of perceptions versus positivist measures. More attention to perceptions of resources
as a result of social processes is demanded by political ecologists (see e.g. Benjaminsen, 2008;
Hagmann, 2005, p. 17), who argue that making any assumptions about the impact of resource
scarcity is impossible if the relationship between human beings and nature is not taken into
account.
For the purposes of this study, I will follow a positivist and absolute conception of resource
scarcity focusing on freshwater and arable land. I define a country to be resource scarce if the
available arable land or freshwater are not sufficient to support the population living in the
area. I will focus on absolute measures of freshwater and arable land without considering
lifestyle or adaptation skills. It is an option to consider other resources needed to sustain
livelihoods such as fish or timber as well but I limit myself to water and land as the most
relevant resources for sustaining human livelihoods. Other livelihood resources are ill suited
for a qualitative comparative analysis, as there is a relatively small number of cases from the
start. For instance, a lack of fish might not constitute scarcity in areas where fish does not
traditionally play an important role in sustaining livelihoods. This would limit the potential
number of cases and as a result make it difficult to compare countries. Even though the
perceived level of scarcity plays an important role in the study of conflict as inciting issues and
propaganda are key components in the explanation of armed conflict, I will use absolute
values rather than perceived scarcity for my analysis. While resources have been used to
convince nations to go to war, this is different from conflict that breaks out over the use of
resources. For instance, the idea that it should strive for “Lebensraum” in Central and Eastern
Europe was part of Germany’s decision to declare war on the Soviet Union, yet this was not
based on an actual inability of Germany to feed itself but on propaganda and delusion. My
study, however, focuses on situations where it becomes physically difficult to feed all people.
Thus, I concentrate on factual rather than perceived scarcity. I focus on absolute rather than
relative levels of resource scarcity as focusing on relative levels by definition includes social,
economic and political conditions, such as for instance the level of development (e.g. for
water infrastructure) or wealth (e.g. being able to raise cattle rather than eat maize). As the
aim of this project is to analyse under which conditions conflict occurs in resource-scarce
countries, including social, economic or political conditions into to case selection criteria
would bias the analysis.
R e s e a r c h D e s i g n 5 9
A second problematic issue is the level of analysis. The availability of both, freshwater and
arable land, differ widely throughout countries. While certain areas might be resource scarce,
this could be offset by other areas that are rich in resources. This is a frequent criticism of
many studies of links between resources and conflict and has led to the increasing
introduction of geo-referenced data in this area (Buhaug et al., 2009; Buhaug, 2010b;
Cederman & Gleditsch, 2009). While this is a helpful development, in particular for large-n
studies of different environmental effects and links to conflict, it is less so in the case for this
study. While both environmental data and conflict data are available in geo-referenced form,
collecting social science data on a sub-national level is only beginning. In this study, I am
particularly interested in a wide range of social, political and economic conditions. Explaining
the contradictory results of quantitative studies necessitates a comparison of these
conditions across cases. Including a sub-national level to this analysis would either make the
data collection completely unfeasible or limit the analysis to very basic data that is easily
accessible. For these reasons, I focus on the national level for this study, while realising the
promise of geo-referenced data for the field of environmental security studies.
My definition contains the two key livelihood resources freshwater and potential arable land.
Both freshwater and land scarcity are difficult to define and measure and echo some of the
problematic issues with defining resource scarcity in general.
SCARCITY OF FRESHWATER
Defining Freshwater Scarcity
As with resource scarcity in general, defining scarcity of freshwater is a complex task.
Generally, a person is considered water insecure if they cannot satisfy their water needs for
drinking, washing and their livelihoods (Rijsberman, 2006, p. 6). An area is water scarce if a
large number of people are water insecure for a significant period. As with resource scarcity
in general, a number of issues, such as the lack of freshwater due to social and economic
factors, the dynamic nature of water and the impact of different lifestyles have to be
considered. In this study, the focus is on absolute levels of freshwater availability averaged
out over several years.
A key question centres on whether the focus should be on physical scarcity of water alone or
whether situations where water is in principle available, but not accessible due to socio-
economic problems should also be considered (i.e. the difference between absolute and
relative resource scarcity). This has also been referred to as “first-order scarcity” of natural
resources and “second-order scarcity” which refers to a social lack of resources and therefore
failure to adapt to scarce resources (Ohlsson & Turton, 1999). Water poverty is another term
used for situations “without adequate and efficient water supplies” (Caroline Sullivan, 2002,
p. 1195) due to either physical scarcity or socio-economic reasons. A similar issue is the impact
of lifestyle. Some countries have a much higher demand in water, in part due to irrigation
agriculture. Societies accustomed to this lifestyle might experience scarcity at a much higher
level of physical water availability than societies that have adapted to a situation of water
6 0 R e s e a r c h D e s i g n
scarcity. Similar to socio-economic scarcity, lifestyle rests on the social, economic and political
conditions I am analysing. Adaptation, in particular, might be a successful strategy to avoid
conflicts. As explained above, I will focus on absolute or physical scarcity as my analysis
focuses on the social, economic and political conditions and including socio-economic scarcity
or lifestyle factors – which rests on the conditions I am interested in – would bias my case
selection.
Another problematic issue is the dynamic nature of water availability due to cycles of rain,
runoff and evaporation and spatial and temporal variation. National averages in large
countries like India or China can hide regional water scarcities11 while annual averages even
out seasonal water shortages. I average out freshwater data over several years, thereby
avoiding long-term cyclical variation. While I might miss cases that suffer from resource
scarcity for parts of the year while experiencing heavy rainfall in the other half, countries
suffering from extreme climate events such as cycles of drought and flooding might better be
analysed separately as they experience unique dynamics.
Measuring Freshwater Scarcity
Various indicators for measuring freshwater levels exist (for an overview see: Gleick, Chalecki,
& Wong, 2002, pp. 90 – 92; Rijsberman, 2006). As pointed out above, my focus is on absolute
and positivist measures of freshwater. The various available freshwater indicators illustrate
the consequences of this choice. I will present two freshwater indicators in detail – the
Falkenmark indicator, which focuses on absolute measures of freshwater and the Water
Poverty Index, which includes socio-economic factors. I defend my choice of the Falkenmark
indicator and show the consequence of this choice by discussing the cases that are included
and excluded by the definitions of the two indicators.
Studying and measuring water resources includes a number of interlocked issues such as
water availability, water quality, water use efficiency, water productivity, water access and
allocation, water management problems (e.g. overpumping of aquifers or nitrate pollution
through irrigation agriculture) and the need to find a balance between sustaining aquatic
ecosystems and water for domestic, agricultural and industrial use. While some authors
concentrate on singular aspects, other adopt a more systematic approach (Molle & Mollinga,
2003, pp. 529 – 536). Generally there is a trade-off between the complexity of the issue and
the available data as pointed out by Rijsberman (2006, p. 15).
Additional problems regarding the measuring of water scarcity include (Gleick, 2000, pp. 40–
42):
Serious gaps in regional-scale hydrological data
11 For a case study on regional differences see Amarasinghe (1999).
R e s e a r c h D e s i g n 6 1
Data on certain types of water-use (domestic, commercial, industrial and agricultural)
are rarely collected systematically and groundwater withdrawals are rarely measured.
Some countries or regions restrict access to water data
Some water uses or needs (ecological, recreational, hydropower production,
navigation) are not quantified or unquantifiable.
The key question for my study is to what degree to include socio-economic scarcity. Using an
indicator such as the Falkenmark Index that is based on absolute levels represents a focus in
physical scarcity while the Water Poverty Index represents a focus on socio-economic
scarcity12
The Falkenmark Indicator or Water Stress Index is the most-widely used measure. It is based
on assessing the gap between the water needed to satisfy an individual’s needs and the water
available to that person. Falkenmark et al. (1998) establish a threshold of 1700 m3 of
renewable water resources per capita per year, based on water needs in the household, the
agricultural and energy sectors as well as the needs of the environment. A country with less
than 1700 m3 of renewable water resources per capita per year is considered water stressed,
with less than 1000 m3 water scarce and if countries have less than 500 m3, they experience
absolute scarcity. In its basic form, the Falkenmark Water Stress Index has been modified by
Ohlsson (1998, 1999) to include the UNDP’s Human Development Index as a measure for
adaptive capacity.
While the Falkenmark indicator is very straightforward and easy to understand, it hides
smaller scarcities on local and temporal dimensions and does not include precipitation that
goes directly into ecosystems. It is also not suited to analyse socio-economic conditions such
as the ability of societies to adapt to water scarcity, for instance through infrastructure. The
variations in water-use patterns across countries due to for instance lifestyle or climate are
not reflected (Gleick et al., 2002; Ohlsson, 1999; Raskin, Gleick, Kirshen, Pontius, & Strzepek,
1997). The Falkenmark indicator most closely reflects my operationalisation of water scarcity,
which focuses on positivist and absolute levels. In addition, data for this index are readily
available, which is why I am basing my case selection on this indicator.
The Water Poverty Index (Caroline Sullivan, 2002) assesses water scarcity on a disaggregated
level, aiming to combine measures of water availability and access with measures of people’s
capacity to access water (Lawrence, Meigh, & Sullivan, 2002). Their approach focuses on the
household and community level and measures five dimensions: access to water; water
quantity, quality and variability; water uses for domestic, food and productive purposes;
capacity for water management and environmental aspects. Their main goal is to link the
12 The two indices presented here represent the two most extreme choices focusing on physical and socio-economic scarcity. For a review of other freshwater indicators that are in between those two indicators in terms of complexity and focus see an overview on page 262 in the appendix.
6 2 R e s e a r c h D e s i g n
“physical estimates of water availability with socioeconomic variables that reflect poverty”
(Caroline Sullivan, 2002, p. 1195). As water can be imported or attained by desalination, the
difference in water access is the key to water poverty (Caroline Sullivan, 2002, p. 1201). The
Water Poverty Index uses georeferenced data, aiming to link socio-economic and natural
conditions in certain areas. Inclusive and holistic, the Water Poverty Index is complex and as
a result suffers from very limited availability of data. Accordingly, it has only been calculated
for the year 2002.
There are thus three options for case selection:
a) Relative scarcity
Include cases where water is scarce due to either physical or socio-economic
reasons, i.e. the cases covered by the Water Poverty Index. In Figure 3.3, this would
be the cases on the left-hand side of the graph. This includes cases where enough
water is available, but does not reach the people due to socio-economic reasons but
exclude cases where societies are well adapted to scarce water resources. This
exclusion poses a problem as adaptation is a key strategy to mitigate conflict over
resources and needs to be included as a condition in my analysis.
b) Absolute scarcity
Include only cases where water is scarce due to physical reasons, i.e. the cases
covered by the Falkenmark Indicator. In Figure 3.3, these are the cases in the bottom
half of the graph. This is choice for this study as it compares cases with similar
physical conditions but different socio-economic conditions.
c) Absolute or relative scarcity
Cases where water is scarce due to either physical or socioeconomic reasons or both,
i.e. the union of the Water Poverty Index and the Falkenmark Indicator. This would
include all cases with physical scarcity, even those that are fairly well adapted, as well
as those with scarcity due to socio-economic reasons. In Figure 3.3, these are all
cases, except for those in the upper-right quadrant.
Figure 3.3 applies the differentiation between socio-economic and physical scarcity above to
real cases. The x-axis shows socio-economic scarcity with higher numbers representing less
scarcity. The y-axis shows physical scarcity with larger numbers corresponding to less scarcity.
There are 11 cases that are considered water scarce by both, the Water Poverty Index and
the Falkenmark Indicator, which can be found in the bottom-left quadrant of the graph,
including Yemen (YEM), Jordan (JOR), Djibouti (DJI), Cape Verde (CPV) and Algeria (DZA).
There are also 15 cases, such as Chad (TCD), Côte d’Ivoire (CIV), Mauritania (MRT), Senegal
(SEN) and Benin (BEN) that suffer from socio-economic scarcity but not from physical scarcity
with a Falkenmark indicator clearly above 1700 m3 per capita per year, which can be found in
the upper-left quadrant. Twenty countries suffer from physical but not socio-economic
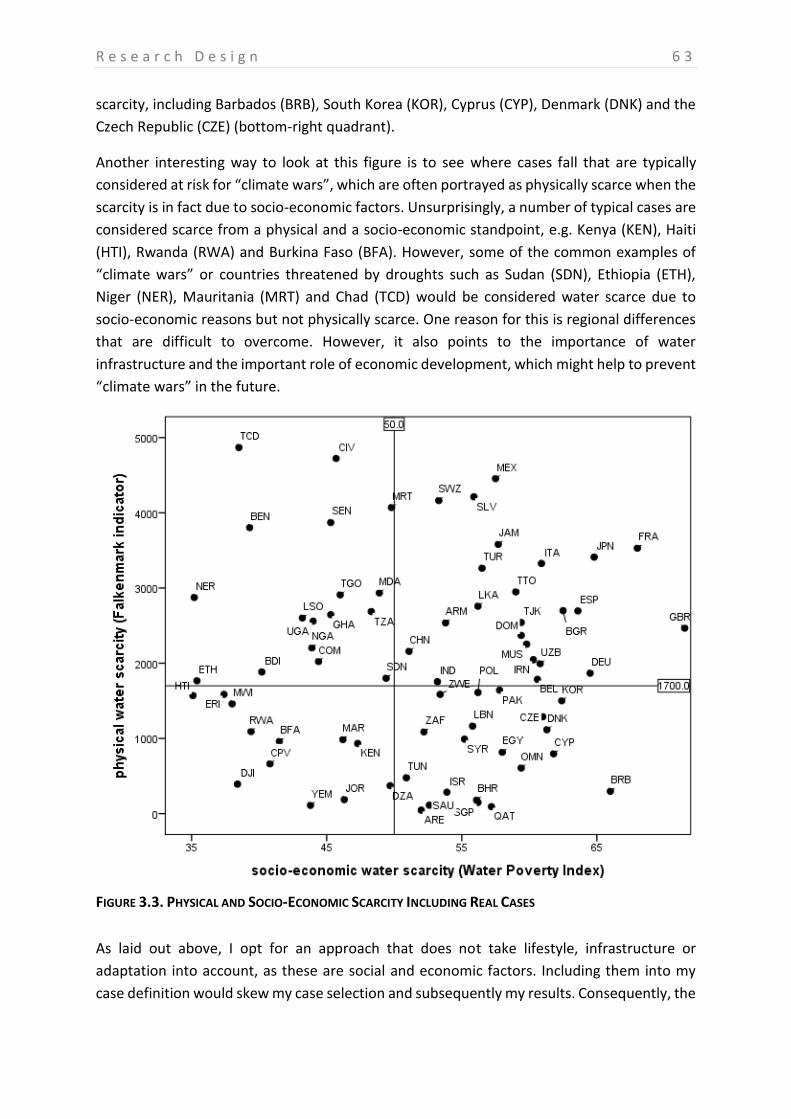
R e s e a r c h D e s i g n 6 3
scarcity, including Barbados (BRB), South Korea (KOR), Cyprus (CYP), Denmark (DNK) and the
Czech Republic (CZE) (bottom-right quadrant).
Another interesting way to look at this figure is to see where cases fall that are typically
considered at risk for “climate wars”, which are often portrayed as physically scarce when the
scarcity is in fact due to socio-economic factors. Unsurprisingly, a number of typical cases are
considered scarce from a physical and a socio-economic standpoint, e.g. Kenya (KEN), Haiti
(HTI), Rwanda (RWA) and Burkina Faso (BFA). However, some of the common examples of
“climate wars” or countries threatened by droughts such as Sudan (SDN), Ethiopia (ETH),
Niger (NER), Mauritania (MRT) and Chad (TCD) would be considered water scarce due to
socio-economic reasons but not physically scarce. One reason for this is regional differences
that are difficult to overcome. However, it also points to the importance of water
infrastructure and the important role of economic development, which might help to prevent
“climate wars” in the future.
FIGURE 3.3. PHYSICAL AND SOCIO-ECONOMIC SCARCITY INCLUDING REAL CASES
As laid out above, I opt for an approach that does not take lifestyle, infrastructure or
adaptation into account, as these are social and economic factors. Including them into my
case definition would skew my case selection and subsequently my results. Consequently, the
6 4 R e s e a r c h D e s i g n
Falkenmark indicator is the most appropriate measure for the purpose of my study. I will take
cases with less than 1000 m3 of annual renewable water resource per capita into account.
I will use data of the United Nations’ Food and Agricultural Organisation (Food and
Agricultural Organization of the United Nations, 2011a). FAO’s Aquastat programme mainly
uses data available from countries and covers a wide range of water indicators. Other recent
assessments13 of the world’s water resources include Shiklomanov (2000) and a study by the
World Resources Institute (UNDP, UNEP, World Bank, & WRI, 2000). The main reason for
choosing FAO data are the continuous updates (most recently in 2008) and the large
coverage14. I will use data in actual15 renewable16 water in cubic metres per year, according
to FAO terminology (2003, pp. xi – xii).
I am using the dataset on total renewable water resources per capita (actual) provided by
Aquastat for this analysis, averaging it out over the period from 1988 to 2012. Using the
Falkenmark indicator of 1000 m3 annual renewable freshwater per capita (i.e. the threshold
for water scarcity) yields 26 resource-scarce countries. Comparing these results to two other
water indicators, the Water Poverty Index and the withdrawals as percentage of the internal
renewable water resources shows that either indicator covers most of the cases yielded by
the Falkenmark indicator. Comparing the cases in the Falkenmark indicator to the 26 most
resource-scarce cases using the other two indicators shows that more than three quarters of
13 For a comparison of various assessments of the world’s freshwater resources see FAO (2003, p. 28). 14 Data is missing for many microstates, dependent territories and Serbia. I am excluding microstates and dependent territories for other reasons (see Table 3.3). Data from the World Resources Institute shows freshwater resources for Serbia and Montenegro at above 19,000 m3 per year, making it clearly not water scarce. 15 A distinction is drawn between actual and natural water, where natural water is a measure of water balance without human influence and actual water takes human influence mainly through agreements and treaties into account. I will consider actual rather than natural resources, as I do not include international water treaties as a condition in my analysis. Therefore, a bias in the case selection is unlikely and the actual water resources provide a better picture of water scarcity. In addition, most international water treaties have existed for a long time and are therefore unlikely to be renegotiated in the near future. However, this decision does not have a large impact on case selection as actual and natural water differ for only a few countries in practice. Of a 198 countries covered in the Aquastat database, actual and natural water resources differ for only 17 countries. Tajikistan experiences the greatest difference in relative terms: While its natural total renewable freshwater resources are estimated at 99.73 * 109m3 per year, its actual resources are 15.98 * 109 or only 16% of its natural resources. The difference is due to water-sharing agreements between the five Central Asian Republics, where Tajikistan reserves water for (mostly) Uzbekistan (FAO, 1997b). Similarly, in Syria, actual water accounts for around 30% of natural water (again due to agreements with Turkey and Lebanon and the fact that the Tigris only flows over a short distance at the border of Syria (FAO, 2011). 16 Renewable water resources represent the long-term average annual flow of rivers and groundwater. Not included are non-renewable sources, such as deep aquifers with negligible rate of recharge. Of the renewable water, the internal renewable water resources refer to those renewable waters that are generated from endogenous precipitation while external renewable water resources do not stem from within the country, but include inflows from upstream countries (rivers and groundwater) and part of the water of border lakes or rivers. For my analysis, I use total renewable water resources, thus, both internal and external resources are part of my analysis, but non-renewable water is not. I am also considering freshwater only, thereby excluding many non-conventional water sources such as desalination of brackish or seawater and reuse of urban and industrial wastewaters as there is a lack of available data.
R e s e a r c h D e s i g n 6 5
the Falkenmark cases are covered by either or both of the other indicators. This inspires
confidence in the case selection.
SCARCITY OF ARABLE LAND
Is land scarce? Answering this question presents a complex problem. Different land uses, such
as for agriculture, for housing and infrastructure and for ecosystem needs as well as other
uses such as growing bio fuels for regenerative energies have to be balanced against each
other. For this study, the focus is on agricultural land use because the premise of resource
scarcity theories is that conflicts can erupt where there is insufficient land to sustain the
livelihoods of the people living in the area. I will discuss the role of land in food production,
the various factors that determine how much food grows on a given piece of land and which
make defining land scarcity a complex task and finally discuss existing indices on land scarcity.
Feeding the World: The Role of Land in Food Production
While land is “the most fundamental factor influencing the food production capacity of a
country or region” (FAO, 2000, p. 37), producing enough food is more complex than simply
having access to the necessary land. Whether and how food security can be achieved for a
growing population has been a matter of much debate, going back to the Malthusian
argument, first raised in 1789. Based on this logic, a maximum sustainable carrying capacity
of the earth has been established at two billion people (Pimentel et al., 1999, p. 32). However,
most empirical evidence does not support this: For instance, per capita food availability has
increased by 24% since 1961 (Bruinsma, 2003, p. 30), but the population growth rate was
much slower.
The main problem lies not in the amount of food that can be theoretically produced but in
the sharing of and access to food. While approximately 2800 kilocalories – 600 more than
necessary – are available per person, about a billion people are undernourished and about
80% of undernourished children live in countries with food surpluses (Chappell & LaValle,
2009, p. 6). Badgley et al. (2007, p. 94) even argue that providing the current and future
human population with food supply from organic agriculture would be possible and it might
even be a possibility to reduce agricultural area. The problem of hunger is more often linked
to issues such poverty, political or structural problems than to the lack of food availability
(Chappell & LaValle, 2009, p. 7, fn. 8), which is the key to Sen’s (1999, p. 16) famous statement
that “no famine has ever taken place in the history of the world in a functioning democracy”.
For this study, I measure resource scarcity in terms of potential arable land per person.
Considering the arguments above, this raises the question whether defining resource scarcity
in terms of actual available land is a helpful approach considering that other factors like the
access to and sharing of food seems much more important in determining whether food
security can be achieved. The main subject of my research is how countries handle resource
scarcity in their social, economic and political realms. To do this, I must define resource
scarcity as depending on the actual natural resources, not on social circumstances. The first
6 6 R e s e a r c h D e s i g n
step to this is measuring the potential for agricultural land in various countries. However, the
need to balance agricultural land with eco-system needs complicates this.
While there is a lot land that could be used to grow crops, but is not used agriculturally now,
a lot of this land is home to other valuable eco-systems. Forests cover large areas and while
these areas could potentially be used for agriculture, this would not lead to a sustainable food
production. Therefore striking a balance between eco-system needs and potential for
agricultural use is important in determining the amount of land available for agriculture.
Around 90% of the 1.8 billion ha land with crop potential that are not currently in agricultural
use are in Latin America and Sub-Saharan Africa, mostly in the following seven countries:
Brazil, the Democratic Republic of the Congo, Sudan, Angola, Argentina, Colombia and Bolivia
(Bruinsma, 2003, p. 130), which are home to large areas of tropical rain forest. Other studies
(G. Fischer, Shah, van Velthuizen, & Nachtergaele, 2006) estimate a higher extent of potential
agricultural land that is not currently used for crop production and suitable for at least one
crop (3.3 billion ha) but agree that 23% of this land is covered by forest ecosystems. In
addition to balancing agricultural use with the needs of eco-systems, other factors also play
a role in determining how much food can be grown on a certain area.
When is Land Scarce: Factors that Determine how much Food Can Grow
While land is the most important factor in food production, other factors, like soil
characteristics and quality, terrain characteristics, climate regimes, technology or crop type
also play a role. As Bruinsma (2003, p. 136) points out “what we call land today is a composite
of land in its natural form and capital investments embodied in it such as irrigation
infrastructure, levelling, fencing and soil amendments.” These factors also make assessing
when countries suffer from land scarcity more difficult. The impact of these decisions is
obvious in the following assessments: Assuming high levels of input17 and management and
only taking suitable and very suitable land into account an estimated 2 billion ha worldwide
are suitable for cereal cultivation and 1.145 billion ha for roots and tubers. Changing the level
of input to intermediate18 about 1.59 billion ha are suitable for cereals and 0.795 for roots
and tubers (G. Fischer et al., 2006).
Technology is another factor that determines agricultural outputs. For instance, FAO
(Bruinsma, 2003, p. 127) estimates that at high input levels (i.e. commercial farm operations)
over 1.1 billion ha worldwide are suitable for wheat production at an average yield level of
6.3 tonnes/ha. However, at low input levels (i.e. subsistence farming) more land (1.5 billion
ha) would be available as some areas such as steep slopes are not suitable for commercial
17 Defined by Fischer et al. (2006) as follows: “Production is based on improved high-yielding varieties and is mechanized with low-labor intensity. It uses optimum application of nutrients; chemical pest, disease, and weed control; and full conservation measures. The farming system is mainly market oriented.” 18 Defined by Fischer et al. (2006) as follows: “Production is based on improved varieties and on manual labor and/or animal traction and some mechanization. It uses some fertilizer application and chemical pest, disease, and weed control, and employs adequate fallow periods and some conservation measures. The farming system is partly market oriented.”
R e s e a r c h D e s i g n 6 7
farming. The yield level, on the other hand would be much lower at 2.3 tonnes/ha. Similarly,
the growth in agricultural produce also depends on other factors. Increased (multiple)
cropping and yield increase are two ways to increase the crop yield. Between 1961 and 1999
15% of growth in crop production resulted from arable land expansion, 7% from increases in
cropping intensity, but 78% came from yield increases (Bruinsma, 2003, p. 126), which shows
the relative importance of technology to land expansion. The increased use of technology in
agriculture has led to sinking real prices for agricultural products in the last decades. Higher
yields are also reflected in a 40% decline of cultivated land per person, from 0.43 ha in
1961/63 to 0.26 ha in 1997/99 (Bruinsma, 2003, p. 135). Likewise, the amount of land needed
to produce a certain amount of grain has fallen by 56% in the same period (Bruinsma, 2003,
p. 136). While, looking at the world as a whole, producing an additional unit of food has been
getting cheaper compared to non-agricultural products, this is only true under certain
conditions. In particular working markets and functioning infrastructure are needed.
However, there are great differences in the source of growth, largely determined by socio-
economic conditions. In developing countries increases in output are obtained mainly
through land expansion (Bruinsma, 2003, p. 133).
The potential for agriculture also depends a lot on the crop types considered. For instance,
more than 50% of the land area in the Democratic Republic of the Congo is suitable for
growing cassava but less than 3% is suitable for growing wheat (Bruinsma, 2003, p. 131).
Establishing the suitability for various crops can solve this issue (Bruinsma, 2003, p. 129). FAO
makes an evaluation of the suitability of land for growing 30 different crops. However, this
solution can be tricky: for instance large tracts of Northern Africa are suitable for the
cultivation of only olive trees. This land is deemed suitable, yet growing only olives is not
providing for the livelihoods of the people living in the area. Should this area then be
considered potential arable land?
The many factors involved in determining how many people can be fed from the produce in
a certain area, make determining when land is too scarce to produce enough food difficult.
Yet, some measures have been developed and will be discussed in the following.
Measuring Scarcity of Arable Land
As with scarcity of freshwater, devising a single indicator for scarcity of arable land is difficult:
Many quantitative studies use proxies in studies of resource scarcity such as population
density (Buhaug & Rød, 2006; de Soysa, 2002b; Hauge & Ellingsen, 1998; Hegre & Sambanis,
2006; Theisen, 2008). This, however, is misleading as areas exist that are not densely
populated, but might still be resource scarce, such as deserts for instance. Another proxy that
has been used is soil degradation (Esty et al., 1998; Hauge & Ellingsen, 1998; Hendrix & Glaser,
2007; Raleigh & Urdal, 2007; Theisen & Brandsegg, 2007). The drawback here is that some
countries might suffer from degradation, but might not be affected by resource scarcity due
to low population density. Some other approaches have been developed. Compared to data
6 8 R e s e a r c h D e s i g n
on water scarcity, there are fewer indicators available, mostly due to the complicated nature
of the subject.
Smil (1993) has established the threshold of 0.07 ha arable land needed to sustain a person’s
livelihood. Great differences in soil quality across countries make this problematic, as 0.07 ha
in one country might be suited to feed one person, while 0.07 ha in another area might not.
Nevertheless, this indicator has been employed in analysis (e.g. Cincotta, Engelman, &
Anastasion, 2003, pp. 56 – 69) and provides the foundation for a Land Scarcity Index
(Engelman & Leroy, 1995). However, this index suffers from a number of methodological
issues. Its measure of arable land, for instance, only includes land under temporary crops, but
does not take into account land under permanent crops, meadows and pastures and other
potential arable land. In particular, the failure to include land under permanent crops – which
is used for agriculture - seems random.
Another approach is to use potential grain production per person. This indicator is available
from the United Nations’ Environmental Programme Geo Data Portal in geospatial form and
combines the potential production in an area with the population living in the area. While this
approach is promising, I focus on national averages rather than geo-spatial data in this study
as the focus is on social, economic and political conditions, which are usually determined on
a national level rather than within pre-determined grid cells.
Another possible way is to define a land-scarce country as a country with more than 60% of
their suitable land already in use (Bruinsma, 2003, pp. 126–127). This approach offers a similar
problem as the water availability to water use ratio did for measuring freshwater scarcity. As
it combines the supply of land with the demand, the resulting number can be due to both.
For instance, a country with a very high standard of living might use a large percentage of
their land even though there might be a lot of land per person relative to other countries.
Other countries might be very well adapted to resource scarcity even though there is very
little potential arable land per person. Therefore, this indicator is not suited to determine land
scarcity as I operationalize it.
Another option would be to use the FAO index according to land resource potential and
constraints (2000), which takes several factors affecting resource scarcity into account.
Among these is the equivalent potential arable area in percentage of the total area of a
country, where the measure of equivalent potential arable area is created to adjust the
potential agricultural area on basis of suitability for rainfed agriculture. In addition, the area
covered by drylands or deserts is factored in as well as steeplands, the severity of soil
degradation, the land currently under cultivation per capita, the land balance (the difference
between the potential and actual agricultural area) and the population increase.
One problem with using the FAO datasets is that this is limited to rainfed agriculture and
excludes land that is suitable for irrigation. It is estimated that about 30% of the world’s
surface (about 4.2 billion ha) is suitable for rainfed agriculture (Bruinsma, 2003, p. 128). About
R e s e a r c h D e s i g n 6 9
20% of all cultivated land is estimated to be under irrigation – a number that might well be
higher if unreported private investments could be taken into account. As land productivity is
two to four times higher under irrigated agriculture this amounts to 40% of all agricultural
products and more for cereals. While some studies assess that about 40% of all agricultural
production is produced through irrigation and about 20% of all cultivated land is equipped for
irrigation (Faurés et al., 2007, p. 358). As with arable land in general, data on irrigation
potential is notoriously difficult to estimate and methods differ across countries (FAO, 1997a).
While this shows the relevance of irrigation agriculture – which is expected to increase – I am
not including areas suitable for irrigation in my selection criteria. The main reason for this is
that irrigation represents investment in technology, which speaks to the economic conditions
rather than the natural ones.
Comparing the 44 most affected countries from this index with the 44 scarcest due to the
data on equivalent potential arable land shows a large correspondence. This is unsurprising
as equivalent potential arable land is one of the elements of the index.
Generally, data on land resources suffers from problems with data availability. In particular,
for developing countries data is often estimated rather than based on surveys or censuses.
Problematic issues also include over-estimation of potential arable land through loss in non-
cultivable areas (hills rocks, minor water bodies), under-estimation of land used for
agriculture for instance through illegal farming in protected areas. In addition, there is little
reliable data on land used for housing and other property development, in particular in
countries where sprawling housing and illegal settling are the norm (Young, 1999).
For this study, I combine Smil’s threshold of 0.07 ha per person with data on equivalent
potential arable land from the FAO index. This, however, also includes land for non-
agricultural uses, in particular human settlement and forest cover. Defining less than 0.1 of
equivalent potential arable land per person as scarce yields a list of 44 countries. I apply 0.1
ha per capita as cut-off point as it is closest to Smil’s indicator of 0.07 ha per capita. As the
FAO index has only been computed for the year 2000, I will use data from a single year. As I
focus on the period from 1990 to 2010, the year 2000 is the halfway mark, the most
reasonable point in time to measure scarcity of resources.
DEFINING AND MEASURING CONFLICT
Just as resource scarcity, the concept of armed conflict is a complex phenomenon – hard to
define and difficult to measure. Various definitions and datasets of conflict exist. I will the
discuss the decisions necessary to define and measure armed conflicts, in particular with
regard to the type of conflict, the threshold for violence and the time period. I will then
compare various datasets on armed conflict and argue that a relatively low battle threshold
of 25 battle deaths is the best choice for this study as environmental conflict has often been
linked to low-scale conflict. For this reason, I employ the Uppsala Conflict Data Program’s
(UCDP) definition of conflict and their Armed Conflict Database.
7 0 R e s e a r c h D e s i g n
Different Types of Conflict
Armed conflict is distinguished from other types of political violence such as terrorism,
genocide or organized crime as “an extreme type of military violence between at least two
politically organized groups” (Chojnacki & Reisch, 2008, p. 234). Armed conflict can be further
differentiated into four distinct types according to protagonists and territory (Chojnacki &
Reisch, 2008, p. 234):
Inter-state (or international) conflicts: between at least two independent states
Extra-state (or extra-systemic) conflicts: between a state and one or more non-state
groups outside its territory. Examples are most colonial and imperial wars but include
other instances like the conflict in the occupied Palestinian territories
Intra-state (or internal) conflicts: between a government and one or more non-state
groups within the territory of a state. This category can be divided further into intra-
state wars with and without foreign involvement. Civil wars are a sub-set of intra-state
conflicts, mostly including a higher threshold of battle deaths (typically 1000).
Sub-state (or non-state) wars: between non-state actors within or across borders
The lines between different types of armed conflict and between armed conflict and other
types of political violence such as communal riots, state massacres and coups d’état are often
blurry and many cases are ambiguous (Cramer, 2006, pp. 70 – 74). For instance, many rebel
armies are indistinguishable from organized crime. Similarly, it is not clear what level of
organization is sufficient to be considered a “politically organized group”. Governments might
have ceased to function as in Somalia in 1991 or governments might be involved in fights by
supporting sides (i.e. inter-communal clashes in Kenya’s Rift Valley in the early 1990s). The
line between one-sided state-sponsored violence and civil war also is often blurry (Sambanis,
2004c, p. 816).
Most theories on resource scarcity and conflict focus on intra-state conflict as the links
between resource scarcity and conflict such as migratory pressures, inter-group dynamics and
state manipulation take place within states. However, sub-state conflicts might also play an
important role as these dynamics might also take place between smaller groups without
government involvement (see for instance: Theisen & Brandsegg, 2007). Extra-state conflict
such as the conflict in Gaza (K. Kelly & Homer-Dixon, 1995) have also been analysed in the
light of resource scarcity. Therefore, I focus my analyses on those three types. While there
are some studies on international wars that have also focused on resource scarcity, mainly
rivers and fish (see p. 17 for an overview), the dynamics in international conflicts differ
strongly from the dynamics within states and I am therefore excluding international conflicts.
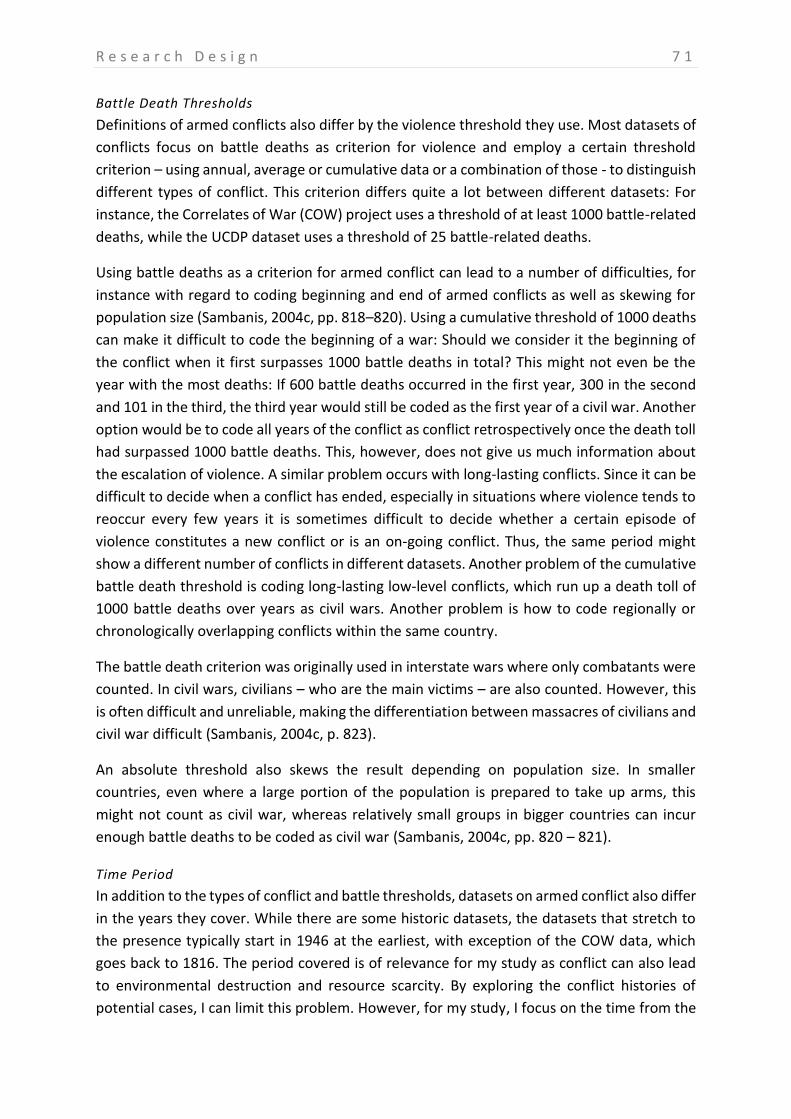
R e s e a r c h D e s i g n 7 1
Battle Death Thresholds
Definitions of armed conflicts also differ by the violence threshold they use. Most datasets of
conflicts focus on battle deaths as criterion for violence and employ a certain threshold
criterion – using annual, average or cumulative data or a combination of those - to distinguish
different types of conflict. This criterion differs quite a lot between different datasets: For
instance, the Correlates of War (COW) project uses a threshold of at least 1000 battle-related
deaths, while the UCDP dataset uses a threshold of 25 battle-related deaths.
Using battle deaths as a criterion for armed conflict can lead to a number of difficulties, for
instance with regard to coding beginning and end of armed conflicts as well as skewing for
population size (Sambanis, 2004c, pp. 818–820). Using a cumulative threshold of 1000 deaths
can make it difficult to code the beginning of a war: Should we consider it the beginning of
the conflict when it first surpasses 1000 battle deaths in total? This might not even be the
year with the most deaths: If 600 battle deaths occurred in the first year, 300 in the second
and 101 in the third, the third year would still be coded as the first year of a civil war. Another
option would be to code all years of the conflict as conflict retrospectively once the death toll
had surpassed 1000 battle deaths. This, however, does not give us much information about
the escalation of violence. A similar problem occurs with long-lasting conflicts. Since it can be
difficult to decide when a conflict has ended, especially in situations where violence tends to
reoccur every few years it is sometimes difficult to decide whether a certain episode of
violence constitutes a new conflict or is an on-going conflict. Thus, the same period might
show a different number of conflicts in different datasets. Another problem of the cumulative
battle death threshold is coding long-lasting low-level conflicts, which run up a death toll of
1000 battle deaths over years as civil wars. Another problem is how to code regionally or
chronologically overlapping conflicts within the same country.
The battle death criterion was originally used in interstate wars where only combatants were
counted. In civil wars, civilians – who are the main victims – are also counted. However, this
is often difficult and unreliable, making the differentiation between massacres of civilians and
civil war difficult (Sambanis, 2004c, p. 823).
An absolute threshold also skews the result depending on population size. In smaller
countries, even where a large portion of the population is prepared to take up arms, this
might not count as civil war, whereas relatively small groups in bigger countries can incur
enough battle deaths to be coded as civil war (Sambanis, 2004c, pp. 820 – 821).
Time Period
In addition to the types of conflict and battle thresholds, datasets on armed conflict also differ
in the years they cover. While there are some historic datasets, the datasets that stretch to
the presence typically start in 1946 at the earliest, with exception of the COW data, which
goes back to 1816. The period covered is of relevance for my study as conflict can also lead
to environmental destruction and resource scarcity. By exploring the conflict histories of
potential cases, I can limit this problem. However, for my study, I focus on the time from the
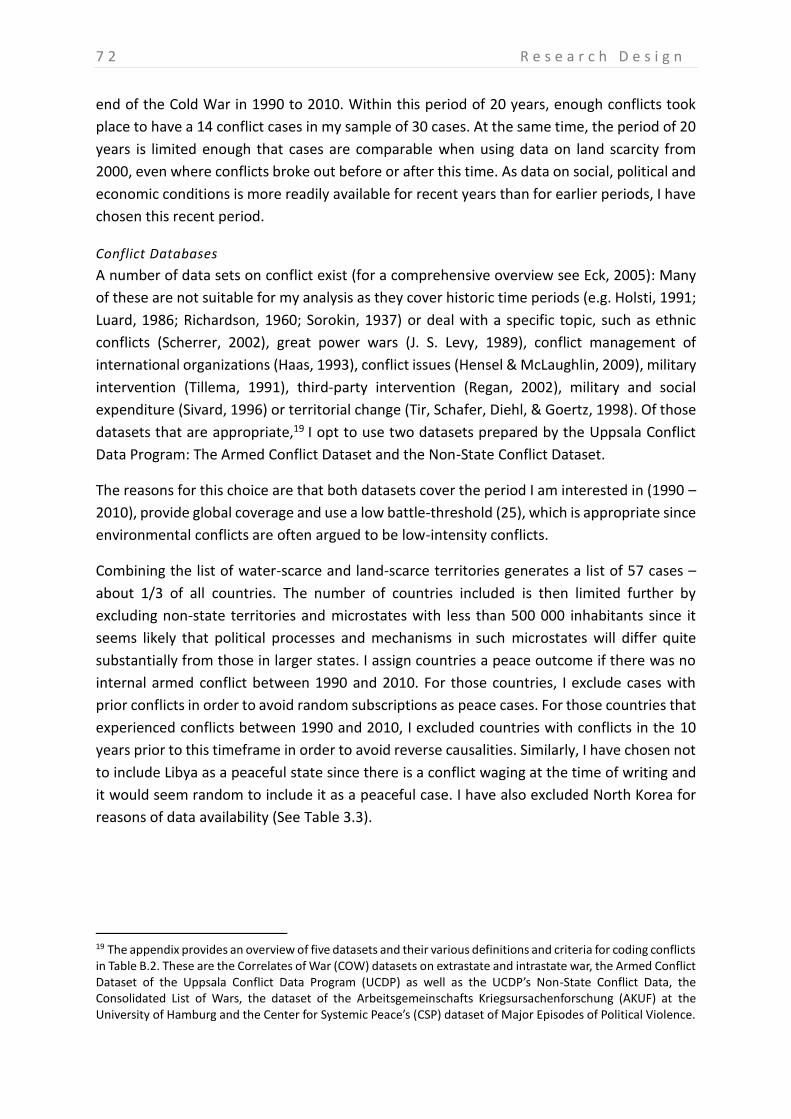
7 2 R e s e a r c h D e s i g n
end of the Cold War in 1990 to 2010. Within this period of 20 years, enough conflicts took
place to have a 14 conflict cases in my sample of 30 cases. At the same time, the period of 20
years is limited enough that cases are comparable when using data on land scarcity from
2000, even where conflicts broke out before or after this time. As data on social, political and
economic conditions is more readily available for recent years than for earlier periods, I have
chosen this recent period.
Conflict Databases
A number of data sets on conflict exist (for a comprehensive overview see Eck, 2005): Many
of these are not suitable for my analysis as they cover historic time periods (e.g. Holsti, 1991;
Luard, 1986; Richardson, 1960; Sorokin, 1937) or deal with a specific topic, such as ethnic
conflicts (Scherrer, 2002), great power wars (J. S. Levy, 1989), conflict management of
international organizations (Haas, 1993), conflict issues (Hensel & McLaughlin, 2009), military
intervention (Tillema, 1991), third-party intervention (Regan, 2002), military and social
expenditure (Sivard, 1996) or territorial change (Tir, Schafer, Diehl, & Goertz, 1998). Of those
datasets that are appropriate,19 I opt to use two datasets prepared by the Uppsala Conflict
Data Program: The Armed Conflict Dataset and the Non-State Conflict Dataset.
The reasons for this choice are that both datasets cover the period I am interested in (1990 –
2010), provide global coverage and use a low battle-threshold (25), which is appropriate since
environmental conflicts are often argued to be low-intensity conflicts.
Combining the list of water-scarce and land-scarce territories generates a list of 57 cases –
about 1/3 of all countries. The number of countries included is then limited further by
excluding non-state territories and microstates with less than 500 000 inhabitants since it
seems likely that political processes and mechanisms in such microstates will differ quite
substantially from those in larger states. I assign countries a peace outcome if there was no
internal armed conflict between 1990 and 2010. For those countries, I exclude cases with
prior conflicts in order to avoid random subscriptions as peace cases. For those countries that
experienced conflicts between 1990 and 2010, I excluded countries with conflicts in the 10
years prior to this timeframe in order to avoid reverse causalities. Similarly, I have chosen not
to include Libya as a peaceful state since there is a conflict waging at the time of writing and
it would seem random to include it as a peaceful case. I have also excluded North Korea for
reasons of data availability (See Table 3.3).
19 The appendix provides an overview of five datasets and their various definitions and criteria for coding conflicts in Table B.2. These are the Correlates of War (COW) datasets on extrastate and intrastate war, the Armed Conflict Dataset of the Uppsala Conflict Data Program (UCDP) as well as the UCDP’s Non-State Conflict Data, the Consolidated List of Wars, the dataset of the Arbeitsgemeinschafts Kriegsursachenforschung (AKUF) at the University of Hamburg and the Center for Systemic Peace’s (CSP) dataset of Major Episodes of Political Violence.
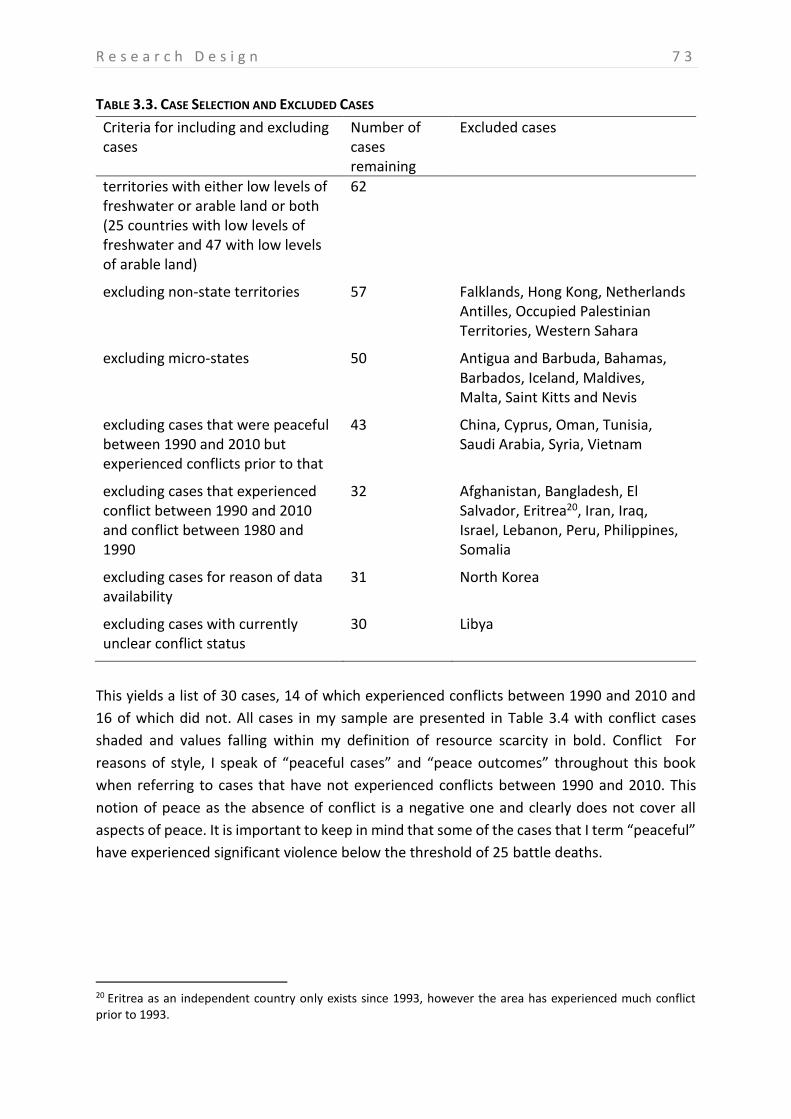
R e s e a r c h D e s i g n 7 3
TABLE 3.3. CASE SELECTION AND EXCLUDED CASES
Criteria for including and excluding cases
Number of cases remaining
Excluded cases
territories with either low levels of freshwater or arable land or both (25 countries with low levels of freshwater and 47 with low levels of arable land)
62
excluding non-state territories 57 Falklands, Hong Kong, Netherlands Antilles, Occupied Palestinian Territories, Western Sahara
excluding micro-states 50 Antigua and Barbuda, Bahamas, Barbados, Iceland, Maldives, Malta, Saint Kitts and Nevis
excluding cases that were peaceful between 1990 and 2010 but experienced conflicts prior to that
43 China, Cyprus, Oman, Tunisia, Saudi Arabia, Syria, Vietnam
excluding cases that experienced conflict between 1990 and 2010 and conflict between 1980 and 1990
32 Afghanistan, Bangladesh, El Salvador, Eritrea20, Iran, Iraq, Israel, Lebanon, Peru, Philippines, Somalia
excluding cases for reason of data availability
31 North Korea
excluding cases with currently unclear conflict status
30 Libya
This yields a list of 30 cases, 14 of which experienced conflicts between 1990 and 2010 and
16 of which did not. All cases in my sample are presented in Table 3.4 with conflict cases
shaded and values falling within my definition of resource scarcity in bold. Conflict For
reasons of style, I speak of “peaceful cases” and “peace outcomes” throughout this book
when referring to cases that have not experienced conflicts between 1990 and 2010. This
notion of peace as the absence of conflict is a negative one and clearly does not cover all
aspects of peace. It is important to keep in mind that some of the cases that I term “peaceful”
have experienced significant violence below the threshold of 25 battle deaths.
20 Eritrea as an independent country only exists since 1993, however the area has experienced much conflict prior to 1993.
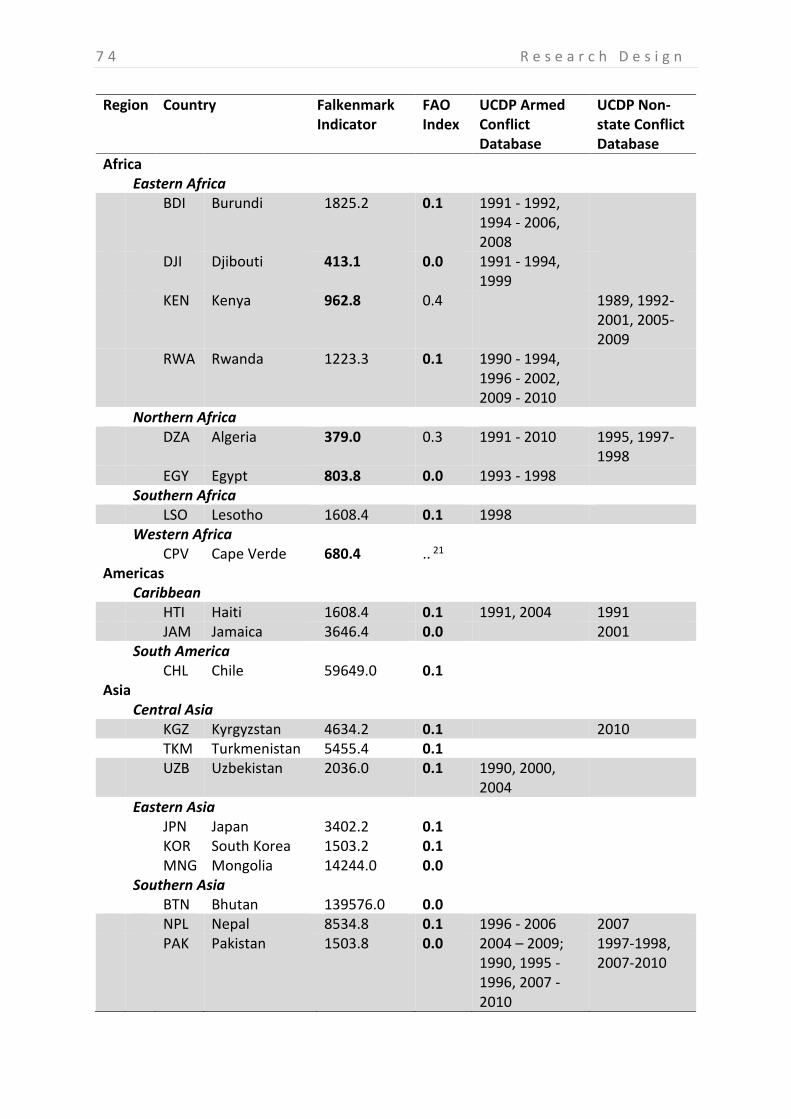
7 4 R e s e a r c h D e s i g n
Region Country Falkenmark Indicator
FAO Index
UCDP Armed Conflict Database
UCDP Non-state Conflict Database
Africa Eastern Africa BDI Burundi 1825.2 0.1 1991 - 1992,
1994 - 2006, 2008
DJI Djibouti 413.1 0.0 1991 - 1994, 1999
KEN Kenya 962.8 0.4 1989, 1992-2001, 2005-2009
RWA Rwanda 1223.3 0.1 1990 - 1994, 1996 - 2002, 2009 - 2010
Northern Africa DZA Algeria 379.0 0.3 1991 - 2010 1995, 1997-
1998 EGY Egypt 803.8 0.0 1993 - 1998 Southern Africa LSO Lesotho 1608.4 0.1 1998 Western Africa CPV Cape Verde 680.4 .. 21 Americas Caribbean HTI Haiti 1608.4 0.1 1991, 2004 1991 JAM Jamaica 3646.4 0.0 2001 South America CHL Chile 59649.0 0.1 Asia Central Asia KGZ Kyrgyzstan 4634.2 0.1 2010 TKM Turkmenistan 5455.4 0.1 UZB Uzbekistan 2036.0 0.1 1990, 2000,
2004
Eastern Asia JPN Japan 3402.2 0.1 KOR South Korea 1503.2 0.1 MNG Mongolia 14244.0 0.0 Southern Asia BTN Bhutan 139576.0 0.0 NPL Nepal 8534.8 0.1 1996 - 2006 2007 PAK Pakistan 1503.8 0.0 2004 – 2009;
1990, 1995 - 1996, 2007 - 2010
1997-1998, 2007-2010
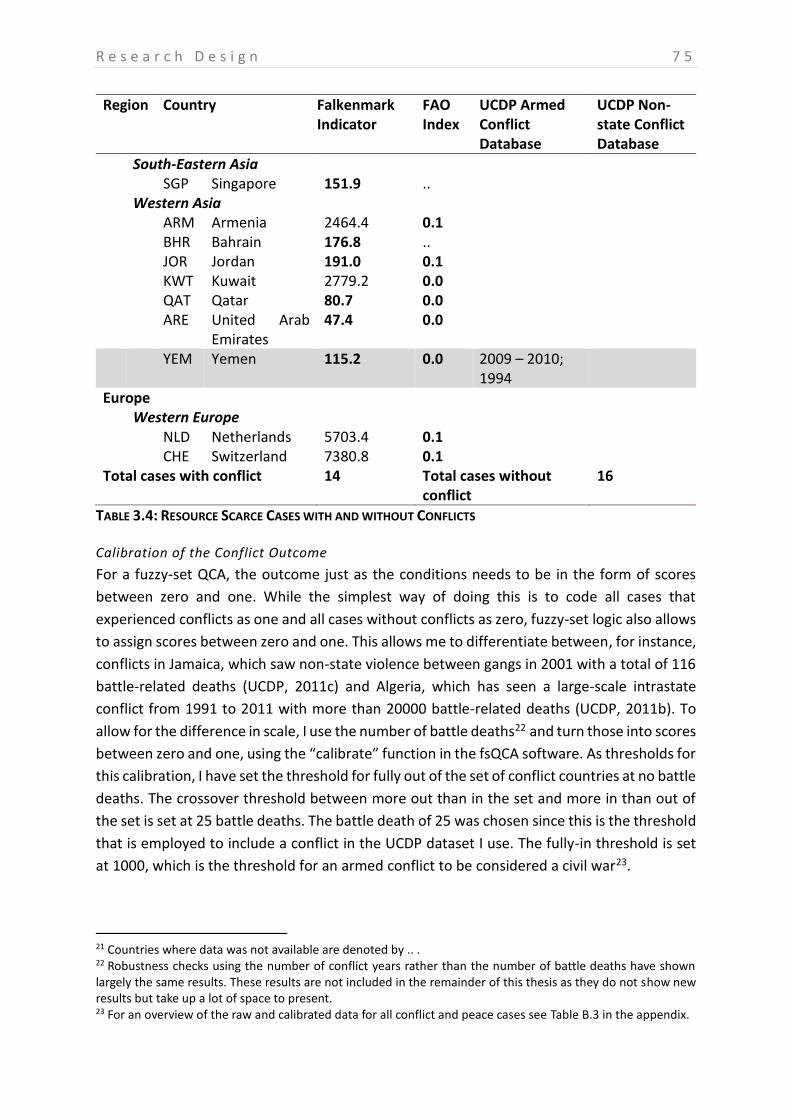
R e s e a r c h D e s i g n 7 5
Region Country Falkenmark Indicator
FAO Index
UCDP Armed Conflict Database
UCDP Non-state Conflict Database
South-Eastern Asia SGP Singapore 151.9 .. Western Asia ARM Armenia 2464.4 0.1 BHR Bahrain 176.8 .. JOR Jordan 191.0 0.1 KWT Kuwait 2779.2 0.0 QAT Qatar 80.7 0.0 ARE United Arab
Emirates 47.4 0.0
YEM Yemen 115.2 0.0 2009 – 2010; 1994
Europe Western Europe NLD Netherlands 5703.4 0.1 CHE Switzerland 7380.8 0.1 Total cases with conflict 14 Total cases without
conflict 16
TABLE 3.4: RESOURCE SCARCE CASES WITH AND WITHOUT CONFLICTS
Calibration of the Conflict Outcome
For a fuzzy-set QCA, the outcome just as the conditions needs to be in the form of scores
between zero and one. While the simplest way of doing this is to code all cases that
experienced conflicts as one and all cases without conflicts as zero, fuzzy-set logic also allows
to assign scores between zero and one. This allows me to differentiate between, for instance,
conflicts in Jamaica, which saw non-state violence between gangs in 2001 with a total of 116
battle-related deaths (UCDP, 2011c) and Algeria, which has seen a large-scale intrastate
conflict from 1991 to 2011 with more than 20000 battle-related deaths (UCDP, 2011b). To
allow for the difference in scale, I use the number of battle deaths22 and turn those into scores
between zero and one, using the “calibrate” function in the fsQCA software. As thresholds for
this calibration, I have set the threshold for fully out of the set of conflict countries at no battle
deaths. The crossover threshold between more out than in the set and more in than out of
the set is set at 25 battle deaths. The battle death of 25 was chosen since this is the threshold
that is employed to include a conflict in the UCDP dataset I use. The fully-in threshold is set
at 1000, which is the threshold for an armed conflict to be considered a civil war23.
21 Countries where data was not available are denoted by .. . 22 Robustness checks using the number of conflict years rather than the number of battle deaths have shown largely the same results. These results are not included in the remainder of this thesis as they do not show new results but take up a lot of space to present. 23 For an overview of the raw and calibrated data for all conflict and peace cases see Table B.3 in the appendix.
7 6 R e s e a r c h D e s i g n
CONCLUSION
This chapter sets out the research design of the remainder of this thesis. Starting with the
research question “Under which sets of political, social and economic conditions does armed
conflict occur in countries with low levels of freshwater or arable land or both?”, it has argued
why using a fuzzy-set qualitative comparative analysis is best-suited to answer this question.
The conditions included in this analysis are based on a review of a number of case studies in
resource-scarce countries as well as the larger conflict literature. Finally, I selected the cases
to be included in this analysis based on absolute levels of freshwater and arable land, which
yielded a final list of 30 resource-scarce countries, 14 of which had a conflict outcome.
D e v e l o p m e n t , D e p e n d e n c e a n d D i v e r s i f i c a t i o n 7 7
Chapter 4: ECONOMIC EXPLANATIONS: DEVELOPMENT, DEPENDENCE AND
DIVERSIFICATION
INTRODUCTION
The lack of arable land or freshwater has a great impact on a country’s economy. This chapter
focuses on economic conditions mediating the relation between natural resources and
conflict. A review of case studies and the relevant quantitative studies yields three main
theoretical arguments that have been closely linked to peace and conflict. The first argument
focuses on economic development, in particular poverty and dependence on agriculture, the
second focuses on export dependencies and the third on the impact of economic
diversification. I analyse the impact of these conditions in a fuzzy-set qualitative comparative
analysis of 30 countries with low levels of freshwater or arable land or both (for details on
research method and case selection see chapter 3). The analyses here will include seven
conditions: dependence on agriculture, poverty and economic development (development
conditions), export dependence, dependence on natural resources and dependence on oil
(dependence conditions) and economic diversification (diversification condition). I argue that
there a two main sets of conditions that are sufficient for conflict: Firstly, high dependence
on agriculture in combination with low levels of oil is sufficient for conflict. This pathway
describes least developed countries with high levels of subsistence agriculture and few other
opportunities for revenues. Secondly, high levels of oil combined with low levels of exports
are sufficient for conflict. This pathway describes countries, which have some oil but where
revenues from that oil are too low for oil to have stabilizing function. I also find two sufficient
combination of conditions for peace. Firstly, countries are peaceful where they are not highly
dependent on agriculture but have high levels of exports. This pathway describes
industrialised countries that are well-integrated into the global economy. Secondly, countries
with low levels of poverty, agricultural dependence and low levels of oil are also peaceful.
This pathway describes mostly industrialised Western countries. Generally, the results show
that while least developed countries experience conflict, highly developed countries do not.
The results are less straight forward for the impact of trade and oil, although they seem to
support arguments that both trade and high levels of resource revenues are sufficient for
peace.
ECONOMIC CONDITIONS IN LINKING RESOURCE SCARCITY AND ARMED CONFLICT
As I have shown in the literature review, case studies of conflict in resource-scarce countries
rarely argue that resource scarcity leads to conflict directly. Rather, case studies focus on a
large number of social, political and economic conditions that play an important role in
mediating this relationship. Conditions in this study were drawn from a number of case
studies and evaluated against a the findings of the larger conflict literature. This yielded three
main theoretical arguments, focusing on economic development, economic dependence and
economic diversification. Other economic arguments exist but I choose to concentrate on
7 8 D e v e l o p m e n t , D e p e n d e n c e a n d D i v e r s i f i c a t i o n
these three because they are common to many of the case studies or play an important role
in the quantitative conflict literature. One aspect that is also often included in both case
studies and the larger literature is economic inequality. I include economic inequality in
chapter 6, which focuses on different aspects of inequality. Development as per capita income
is much discussed in the larger conflict literature and poverty and subsistence agriculture play
an important role in case studies. Dependence on trade is a factor thoroughly discussed in the
larger conflict literature and is often mentioned more indirectly in case studies as well, for
instance in discussion of economic decline or economic shocks that contributed to conflict.
Dependence on natural resources is another issue that has been discussed in the larger
conflict literature. Finally, economic diversification is discussed in both, the larger conflict
literature and in case studies. In the following, I shortly review explanations focusing on
development, dependence and diversification, first focusing on the theoretical argument in
the larger conflict literature and empirical evidence in quantitative studies and then on the
role of these arguments in case studies of resource-scarce countries.
ECONOMIC DEVELOPMENT
As I have pointed out in the introduction, development is a multi-facetted term that cannot
be reduced to per-capita measures. However, while other measures such as the Human
Development Index focus on issues like health, life expectancy and education, income is still
the most common way to measure development. As many of the facets of development are
covered by various conditions in this and the following two chapters, I will focus on arguments
related to income here.
High-income nations are less likely to experience civil war. This is one of the most widely
accepted relationships in the quantitative conflict literature (Buhaug, 2006; Elbadawi &
Sambanis, 2002; Fearon & Laitin, 2003; Sambanis, 2001). There are a number of theoretical
explanations for this, focusing on different levels of analysis (Buhaug et al., 2008, pp. 24 – 25).
On the individual level it has been argued that the opportunity costs for people to join a
rebellion play an important role – where people have low incomes, they do not have much to
lose by joining in (Collier & Hoeffler, 2004; Grossman, 1991). On a group level, inequality
within and between groups can act as an incentive for conflict. Relative deprivation or the
discrepancy between perceived entitlements and the goods and conditions groups in society
can actually achieve leads to frustration and violence (J. C. Davies, 1962; Gurr, 1970). Finally,
on a state level, the focus is on state capacities, where low GDP per capita is seen as a proxy
for the state’s capacities to control its territory (Fearon & Laitin, 2003). The argument is that
poor states lack capabilities to control insurgencies, infrastructure and effective local
governance. In addition, political legitimacy and trust can easily be weakened through a lack
of economic opportunities for the population. This relationship between income, growth and
prosperity and less risk of conflict is one of the most robust in the civil war literature (for a
comprehensive overview see: Dixon, 2009, pp. 714 –716).
D e v e l o p m e n t , D e p e n d e n c e a n d D i v e r s i f i c a t i o n 7 9
In the case study literature in resource-scarce countries, the focus is less on overall economic
development and more on the economic situation of households, in particular a perceived
threat to livelihoods (Deligiannis, 2012). This focus on the individual household level is more
closely linked to the explanation focusing on opportunity costs rather than state capacity. For
instance, Homer-Dixon (1999, pp. 81 – 93) argues that a decline in agricultural productivity,
in particular in absence of working state institutions, can lead marginal groups in a situation,
leaving them “little choice but to rebel or starve” (Homer-Dixon, 1999, p. 153). Group-level
explanations focusing on relative deprivation are also employed (e.g. Kahl, 2008, p. 36). Most
case studies include a discussion of high levels of dependence on subsistence agriculture or
high poverty levels such as the Philippines (D. M. Schwartz & Singh, 1999), Peru (D. M.
Schwartz & Singh, 1999), Chiapas in Mexico (Howard & Homer-Dixon, 1996), Somalia (Farah
et al., 2002) and Burundi (Oketch & Polzer, 2002). For instance, Oketch and Polzer (2002, p.
90) argue that the combination of environmental pressure and lack of economic alternatives
to subsistence agriculture ultimately leads to violence. As agriculture is often linked to high
levels of poverty, it has been argued that poverty provides the link between dependence on
agriculture and conflict (de Soysa & Gleditsch, 1999). In a comparative study of the impact of
resource scarcity on violent conflict in Uganda, Rwanda, Ethiopia and Burundi, Ejigu (2009, p.
889) argues that the close link between the environment and poverty has an impact on the
relationship between resource scarcity and conflict. As the natural resource base (e.g. forest
cover, grazing land, arable agricultural land, water resources) is shrinking, there are few
routes to escape poverty, increasing the risk for conflict to break out over resources.
However, the extent to which poverty is a factor has been debated (A. Martin, 2005, p. 331).
There are many examples of cooperative self-organisation to manage scarce resources from
developing countries (e.g. Ostrom, 1990) and there is some evidence that dependence on
natural resources, which is prevalent in poorer societies, is a positive factor for cooperative,
collective action (Chambers, Saxena, & Shah, 1990).
In operationalizing these arguments, I will include three development conditions: firstly,
economic development in general, which best captures the arguments made in quantitative
studies, secondly dependence on agriculture and thirdly, poverty. The latter two capture the
focus on individual household situations and livelihoods in case studies. This choice of
conditions is based on the arguments and conditions included in case studies focusing on
resource scarcity and armed conflict. The hypothesis based on theories and empirical studies
available so far are the following:
H1: Countries with low levels of economic development experience conflicts. Thus, economic
development is a sufficient condition for conflict.
H2: Countries with a combination of high levels of dependence on agriculture and high levels
of poverty experience conflicts. Thus, the combination of high levels of dependence on
agriculture and high levels of poverty is sufficient for conflict.
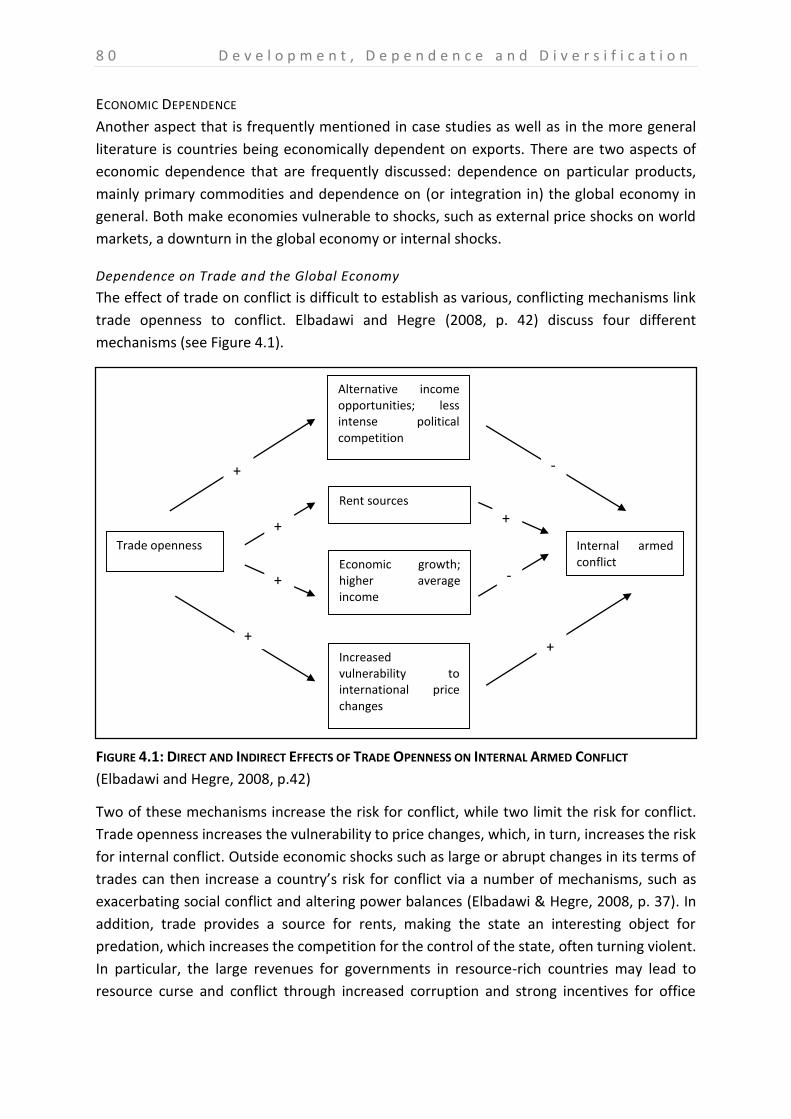
8 0 D e v e l o p m e n t , D e p e n d e n c e a n d D i v e r s i f i c a t i o n
ECONOMIC DEPENDENCE
Another aspect that is frequently mentioned in case studies as well as in the more general
literature is countries being economically dependent on exports. There are two aspects of
economic dependence that are frequently discussed: dependence on particular products,
mainly primary commodities and dependence on (or integration in) the global economy in
general. Both make economies vulnerable to shocks, such as external price shocks on world
markets, a downturn in the global economy or internal shocks.
Dependence on Trade and the Global Economy
The effect of trade on conflict is difficult to establish as various, conflicting mechanisms link
trade openness to conflict. Elbadawi and Hegre (2008, p. 42) discuss four different
mechanisms (see Figure 4.1).
Two of these mechanisms increase the risk for conflict, while two limit the risk for conflict.
Trade openness increases the vulnerability to price changes, which, in turn, increases the risk
for internal conflict. Outside economic shocks such as large or abrupt changes in its terms of
trades can then increase a country’s risk for conflict via a number of mechanisms, such as
exacerbating social conflict and altering power balances (Elbadawi & Hegre, 2008, p. 37). In
addition, trade provides a source for rents, making the state an interesting object for
predation, which increases the competition for the control of the state, often turning violent.
In particular, the large revenues for governments in resource-rich countries may lead to
resource curse and conflict through increased corruption and strong incentives for office
Alternative income opportunities; less intense political competition
Trade openness
+
Internal armed conflict
Increased vulnerability to international price changes
Economic growth; higher average income
Rent sources
-
+
+
+ +
-
+
FIGURE 4.1: DIRECT AND INDIRECT EFFECTS OF TRADE OPENNESS ON INTERNAL ARMED CONFLICT
(Elbadawi and Hegre, 2008, p.42)
D e v e l o p m e n t , D e p e n d e n c e a n d D i v e r s i f i c a t i o n 8 1
holders to keep in office, even through the use of force (Elbadawi & Hegre, 2008, p. 39).
However, the impact of economic shocks on conflict risk is complex and also depends on the
structure of the economy itself. For instance, increasing import prices lower real wages, which
can contribute to conflict risk but at the same time higher export prices also increase the risk
of conflict as they increase government revenue, thus making the state a more interesting
target (Besley & Persson, 2008). However, empirical evidence on the links between trade
shocks and conflict is not very robust as it is highly sensitive to the exact definition and
specification of conflict (Bazzi & Blattman, 2011).
There are also arguments that link openness to trade to a reduction of conflict. While it has
long been argued that trade between countries reduces the risk of conflict between those
countries, there is less research on the impact of trade on intrastate conflict. However, as civil
war reduces international trade (Bayer & Rupert, 2004), it has been argued that in countries
where there is a large trade-dependent sector, there are more incentives for peaceful
behavior (Elbadawi & Hegre, 2008, p. 39). In addition, the increased income and
opportunities in the private sector reduce competition for political offices and the related
access to resources of the state, therefore stabilizing the political institutions (Hegre,
Gissinger, & Gleditsch, 2003). This is linked to the argument that revenue from resources can
be used to buy off political support (Ross, 2001). In addition, openness has been connected
to a reduction in corruption (Wei, 2000). Countries that are highly dependent on trade and
interaction with other states have a reputation as reliable partners to lose, which limits the
incentives for conflict (Hegre, forthcoming). Being integrated into the global economy also
allows more opportunities to diversify and therefore leads to increased resilience (Adger &
Vincent, 2005, p. 406).
Trade openness is also indirectly linked to conflict through economic growth. Neo-classical
economic theory argues that countries that trade maximize their welfare through
comparative advantages. Therefore, opening up borders to increased trade should lead to
economic growth (Frankel & Romer, 1999). Negative economic growth has been linked to
increased risk for conflict as it decreases the opportunity costs for people to join rebellions
(Collier & Hoeffler, 2004) and because it limits the state’s capacities to control its territory
(Fearon & Laitin, 2003).
Trade is mostly discussed indirectly in case studies, such as in the Philippines (Kahl, 2008, p.
98) where a decline in agricultural exports contributed to an economic crisis, which provided
the backdrop for rebellion. In the case of Burundi (Oketch & Polzer, 2002), the exploitation
and control of coffee production played an important role in fuelling the conflict. Finally, in
the case of Darfur (Suliman, 2008, p. 2), the declining terms of trade due to volatile world
markets contributed to the conflict as it increased pressures on pastoralists and farmers to
produce more to keep their income or migrate to other areas, leading to conflict with previous
inhabitants.
8 2 D e v e l o p m e n t , D e p e n d e n c e a n d D i v e r s i f i c a t i o n
While many case studies focus on exports of specific commodities, such as coffee, I am only
including exports in general since specific commodities are very case specific. For the same
reason, I am not including the aspect of tourism, which is also rather specific to some
countries such as Egypt. Foreign direct investment might also play a role but is rarely
mentioned in case studies. In addition, the level of foreign direct investment is very closely
linked to factors such as the business environment characterized by corruption and the rule
of law, which are factors included in the chapter on state-based explanations.
In operationalizing these arguments, I include trade openness in terms of exports as
percentage of total GDP as a condition. As both, a positive and negative impact of trade
openness are supported by theoretical arguments two hypotheses are possible24:
H3: Countries with high levels of trade openness experience conflicts. High levels of trade
openness are a sufficient condition for conflict.
H4: Countries with high levels of trade openness remain peaceful. High levels of trade
openness are a sufficient condition for peace.
Dependence on Natural Resources
Richness in primary commodities, mainly non-renewable resources, has been an important
focus of the civil war literature since the late nineties, focusing on the impact of resource
revenues on the economic and political sphere of a country. The key argument of Collier and
Hoeffler (2004) argues that an abundance of resources makes conflict in a country more likely.
Direct and indirect explanations for the link between abundant resources and conflict have
been put forward. Direct links focus on the impact of resources on rebels (e.g. Collier &
Hoeffler, 2004) and indirect links focus on the impact on the economy and the state (e.g.
Fearon, 2005). Direct explanations include financing for rebel armies through resources as
valuable target whereas indirect explanations include the weakening of the state due to large
natural resource deposits.
Control over natural resources provides financing for rebels. This has been argued for instance
in the cases of conflict diamonds in Sierra Leone (Smillie, Gberie, and Hazleton 2000), the
Democratic Republic of Congo (United Nations Panel of Experts 2001) and Angola (Le Billon
2001a). Similarly, oil can provide financing to rebels through tapping of pipelines and theft of
oil or kidnapping and ransoming of oil workers. This argument is based on the feasibility
hypothesis, stating that "where a rebellion is feasible it will occur" (Collier, Hoeffler, and
Rohner 2009, 2). Looting and selling natural resources can provide income to rebel groups,
enabling them to start civil wars where otherwise there would have been none. In addition,
a large stock of natural resources might provide motivation for rebellions, often referred to
as the "greed hypothesis" (Englebert and Ron 2004; Fearon 2005). In this line of argument,
natural resources are providing a motive, not an opportunity for civil war. Ross (2006, 280)
24 For the intermediate solution, I assume that either the presence or the absence of trade openness can lead to conflict. See Table C.1 in the appendix.
D e v e l o p m e n t , D e p e n d e n c e a n d D i v e r s i f i c a t i o n 8 3
points to two variants of the argument: Natural resource wealth might make the state a more
interesting target for a national rebellion with the aim to take over the state or it might fuel
secessions in the areas with large resource wealth.
States with large resource revenues might not need to tax their citizens, resulting in a less
accountable and weak government, increasing grievances (Collier, Hoeffler, and Rohner 2009,
8), an argument first suggested by Middle East scholars (Mahdavy 1970; Beblawi 1987; Crystal
1995), that has since been expanded to other regions as well. This argument can point
towards grievances, such as people rebelling against a corrupt state or inequality but also
towards the feasibility argument. Where states exercise full control over their territories,
starting a rebellion is militarily not feasible, but weak states have less authority over their
citizens, making a rebellion more feasible. The weak-state argument has been restricted to
oil-producing states (Fearon and Laitin 2003) but also been applied to states producing
diamonds (Snyder and Bhavnani 2005).
Other possible explanations for the link between resource abundance and conflict include:
natural resources increasing inequalities in society, resulting in grievances and conflicts;
forced migrations as a result of resource extraction and the dense-network mechanism,
arguing that countries rich in natural resources have less dense trade networks and that dense
trade networks prevent conflict (Humphreys 2005, 511-513). Trade shocks might also lead to
conflicts in countries dependent on commodities exports as they are particularly vulnerable
to changes in the world prices (Reinhart and Wickham 1994; Humphreys 2005).
Dependence on mineral resources is a factor rarely discussed in case studies of countries with
limited arable land or water or by resource scarcity theorists. However, dependence on
natural resources is included as a condition in this analysis as it plays such a large role in the
general study of civil war. As there is some evidence that the type of resources matters as
well, and that in particular oil contributes to conflict (Ross 2006; Fearon and Laitin 2003;
Humphreys 2005; De Soysa and Neumayer 2007; Lujala 2010; Buhaug, Gates, and Lujala 2009;
Lujala, Ketil Rod, and Thieme 2007), I include oil as a second condition. Oil dependence is a
sub-category on dependence on natural resources. There is also a lot of focus on the impact
of conflict diamonds but as none of the countries in my sample produce large quantities of
diamonds, diamonds are not included as an individual condition.
H5: Countries with high levels of natural resources/oil experience conflicts. Natural resources
and oil are sufficient conditions for conflict.
ECONOMIC DIVERSIFICATION
The argument that economic diversification plays an important role is closely linked to
arguments on trade. The key argument why high integration into the world economy might
contribute to conflict is that it makes economies highly vulnerable to world market prices. As
a result, the economic situation worsens, which can lead to social conflict, or improves, which
increases incentives for predation (Elbadawi & Hegre 2004). The greater the export
8 4 D e v e l o p m e n t , D e p e n d e n c e a n d D i v e r s i f i c a t i o n
concentration on one or a few products, the higher the vulnerability to price shifts, which is
why a lack of economic diversification might have negative impact on conflict. In addition,
there is some evidence that economies dependent on land-based assets (such as most
primary commodities) have a higher risk of conflict as the incentives to hold on to and grab
hold of the state are higher (Hegre, forthcoming). Where they control assets in the form of
land or other resources that cannot be moved out of the country, economic elites have more
reason to fear a power takeover that might result in the redistribution of wealth (e.g. through
higher taxes or land reforms) than in an economic system where much of their wealth can be
moved and is therefore safe from attempts of redistribution (Boix, 2003).
In addition, economic diversification plays a role in providing employment opportunities. The
lack of economic opportunities outside agriculture, in particular for the youth is mentioned in
several case studies (e.g. André & Platteau, 1998; Benjaminsen et al., 2012; Bigagaza, Abong,
& Mukarubuga, 2002; Percival & Homer-Dixon, 1998). For instance, in the case of the Pacific
islands, Ware (2005, p. 451) argues that they are vulnerable to armed conflict where
“population growth has outstripped economic growth and thus employment opportunities”.
In the case of Burundi, Oketch and Polzer (2002, p. 90) argue that ”the scarcity of land alone
would not lead to violence of neighbour against neighbour in Burundi were it not for the
exclusion of the majority from all political and alternative economic opportunity”.
H6: Countries with low levels of economic diversification experience conflict when this is
combined with high levels of exports or when combined with high levels of poverty or
agricultural dependence. Low economic diversification, high levels of exports, high levels of
poverty and high levels of agricultural dependence are INUS conditions25.
OPERATIONALISATION AND CALIBRATION OF CONDITIONS
The theoretical arguments reviewed above are operationalized in seven conditions: The
development conditions economic development, dependence on agriculture and poverty, the
dependence conditions dependence on exports, dependence natural resources and
dependence on oil and economic diversification. The operationalisation, measurement and
calibration of these conditions is an important step in a qualitative comparative analysis and
is therefore explained in some detail. In an effort to avoid reverse causalities, such as conflict
leading to poverty or dependence on natural resources, data for cases that experienced
conflict are taken from the year(s) prior to the conflict. If these were not available, the closest
available data were used and for cases where no data was available, data were estimated
25 INUS conditions are insufficient but necessary part of a condition, which is itself unnecessary but sufficient for the result.
In this case high levels of agricultural dependence are only part of a combination of conditions (therefore insufficient) but necessary for the combination of agricultural dependence and low levels of economic diversity. The combination of agricultural dependence and low levels of economic diversity is sufficient but not necessary since two other combinations (low levels of economic diversity and high levels of export and low levels of economic diversity and high levels of poverty) are also sufficient. For more information on INUS conditions see p. 44.
D e v e l o p m e n t , D e p e n d e n c e a n d D i v e r s i f i c a t i o n 8 5
using other sources26. For peaceful cases, the data was averaged out over the 21-year period.
Using the average minimised the risk of using data from unusual years such as export data
from recession years. Most conditions, however, are very stable and data from single years
and the average over the time period does not differ much. The raw data was calibrated into
scores between zero and one using the “calibrate” function in the fsQCA software. This
functions applies thresholds specified by the researcher to turn raw data into calibrated data.
The thresholds I use are outlined below.
Three related conditions are included under the heading of development: economic
development, agricultural population and poverty27. Dependence on subsistence agriculture
and high poverty levels are frequently mentioned in case studies and economic development
is included as a broader concept.
ECONOMIC DEVELOPMENT (ECOD)
After reviewing the way three key international organization working in the area of economic
development, the United Nations, the International Monetary Fund (IMF) and the World Bank
define and measure economic development, the World Bank’s use of the Gross National
Income (GNI) per capita is deemed best-suited for this study as it is the most straight forward
operationalisation, is not based on mainly political judgments and does not include aspects
covered by other conditions.
While terms such as economic development and developing country are frequently
employed, there is a surprising lack of clear definitions and agreements what constitutes a
developing or a developed country. Different ways of operationalizing economic
development lead to very different results, in particular in the cases of high-income countries
that receive much of their income from exports of primary resources such as the oil-rich
countries in the Middle East and Northern Africa. For instance, the International Monetary
Fund (IMF) classifies 25 out of 30 countries in my sample as developing while the Human
Development Index has only 19 countries classified as having low or medium levels of
development. The United Nations categorize 23 countries as least developed or developing
countries and the World Bank categorizes 18 countries as having a low or lower-middle
income. Differences in the categorization are particularly big (i.e. not in adjacent categories)
for 11 countries, among them a number of resource-rich countries (e.g. Bahrain, Kuwait,
Qatar, Turkmenistan and the United Arab Emirates) but also countries such as Chile, which is
seen as a developing country by the IMF and the United Nations categories but also as a
upper-middle income according to the World Bank and has a very high Human Development
26 An overview of all raw and calibrated data as well as the year data is taken from and details on any other sources used to estimate data points is provided in Table C.2 and Table C.3 in the appendix. 27 A fourth condition, unemployment that is also frequently mentioned is not included as reliable data for cross-country comparison is not available due to differences in operationalisation and measurement (see for instance: Rama, 1998, pp. 60 – 61).
8 6 D e v e l o p m e n t , D e p e n d e n c e a n d D i v e r s i f i c a t i o n
Index. Similarly, Singapore is classified as developing by the United Nations while it is seen as
having high levels of development by all other institutions28.
Within the United Nations system, there is no agreed-upon definition of terms such as
“developing countries” (UNSD, 2011) with various different and overlapping categories, such
as least developed countries (LDC), developing countries, newly industrialized countries, etc.
In practice, some countries such as Japan, Canada, the US, Australia, New Zealand and
Western Europe are characterized as developed while countries in eastern Europe and CIS
countries are defined as “transition countries” (UNSD, 2011). Countries are defined as least-
developed on the basis of three indicators: low income, human resource weakness and
economic vulnerability (UN-OHRLLS, 2002). As these categories are not very clear cut and
overlapping as well as taking political arguments (such as being a former member of the Soviet
bloc) into account, they are not well suited for this study. The United Nation’s Human
Development Index provides a ranking of countries according to development, based on three
indicators: life expectancy; knowledge and education; and standard of living in terms of per
capita income 29 (Human Development Index, 2010, pp. 215 – 227). This definition and
categorization is not very well-suited for the purpose of this study as it includes a great
number of indicators, some of which are indicators in their own right, for instance education
is an important indicator for a society’s ability to adapt to environmental change. The IMF
(2011) classifies countries as either advanced or developing and emerging economies based
on three criteria: per capita income level, export diversification and degree of integration into
the global financial system. As dependence on exports and the dependence on specific
exports such as oil and agricultural products are conditions in this analysis, including them in
the definition of the economic development could bias the analysis. The World Bank (2012f),
finally, classifies countries according to the Gross National Income (GNI) into four groups: low
income, lower middle income, upper middle income and high income. This indicator has the
advantage of not taking other conditions or political arguments into account. In addition, per
capita income has often been used as a proxy for economic development in conflict studies
(e.g. Collier & Hoeffler, 1998, 2004; de Soysa, 2002a, 2002b; Ellingsen, 2000; Fearon & Laitin,
2003; Hauge & Ellingsen, 1998; Hegre, Ellingsen, Gates, & Gleditsch, 2001).
I use the World Bank’s data on GNI per capita in constant USD 2000 (World Bank, 2012e). I
set the thresholds in accordance with the World Bank’s definition of low income, lower middle
income, upper middle income and high income countries. Since I am using data based on year
2000 US dollars, I am using the thresholds set in 2000 (World Bank, 2012a). Therefore,
countries are fully in the set of developed countries with a per capita GNI above 9265, which
is the World Bank’s threshold for a high-income coutry and fully out with an income below
USD 755, which is the World Bank’s threshold for a low-income country. The crossover
28 See Table C.4 in the appendix for an overview of cases and their categorization according to different institutions. 29 This describes the HDI’s methodology up until 2011. For the current methodology see Human Development Report 2011 (UNDP, 2011) pp. 167 – 174.
D e v e l o p m e n t , D e p e n d e n c e a n d D i v e r s i f i c a t i o n 8 7
threshold is set at USD 2995, which is the World Bank’s threshold between a lower-middle
income and a upper-middle income.
AGRICULTURAL POPULATION (AGR)
To measure dependence on agriculture I use data on the agricultural population as a
percentage of the total population, defined as all persons depending for their livelihood on
agriculture, hunting, fishing and forestry and their non-working dependents, provided by the
FAO (2009). I am focusing on people depending on agriculture for their livelihoods rather than
other measures such as the percentage of agriculture in the GDP or exports as it more directly
represents the theoretical argument of threatened livelihoods. FAO estimates are based on
the close relationship between the ratio of economically active population in agriculture to
total economically active population and the ratio of agricultural population to total
population. (FAO, 2012). To establish thresholds, I follow Alexandratos (1999) who defines a
high dependence on agriculture as 50 to 80% of the population depending on agriculture as
the main source of living. I use 50% as the threshold for countries to be more in than out of
the set of countries with high levels of dependence on agriculture and 80% as the threshold
for countries to be fully in the set. As a threshold for fully out of the set, I use less than 5% of
the population depending on agriculture. This captures the city states of Bahrain and
Singapore as well as two states that are ill-suited for agriculture (Kuwait and Qatar) and two
states where agriculture plays a very limited role in employment (Netherlands and Japan).
POVERTY (POV)
I focus on absolute rather than relative levels of poverty since theoretical arguments focus on
people living below a threshold needed to sustain their livelihoods. Using relative levels of
poverty does not give much information of the number of people affected since in many of
the richer countries in my dataset, even people living in relative poverty of, for instance, less
than 60% of the average income are not living below that threshold. Therefore, I
operationalize poverty in absolute terms, using the World Bank’s poverty headcount ratio at
$1.25 a day. Basing thresholds on outside definitions is difficult in this case as it is in the nature
of poverty indicators and threshold to be targeted towards policy goals, such as the
Millennium Development Goal of halving the number of people living on less than $1.25 a
day. Therefore the thresholds in this study are based on natural gaps occurring in the data.
Eight countries in the sample have no people living on less than $1.25 a day, so this is taken
as the first threshold. The crossover point is set at 10% between Algeria (7.6%) and Armenia
(11.3%). Finally countries are considered fully in the sample of countries with high poverty
rates if the rate is more than 30%, dividing Mongolia (22.7%) and Uzbekistan (31.8%).
DEPENDENCE ON EXPORTS (EXP)
To measure if a country is dependent on exports, the percentage of exports of total GDP is
used. This measure has frequently been employed as a measure of integration into the global
economy (Eberle, Martin, & Schneider, 2003; Krause & Suzuki, 2005b). I use data from the
World Bank (2012d) on exports of goods and services as percentage of GDP. The threshold
8 8 D e v e l o p m e n t , D e p e n d e n c e a n d D i v e r s i f i c a t i o n
setting focuses on data gaps at less than 15% (fully out), 30% (crossover threshold) and 70%
(more in than out). This puts five countries in the “fully out” category (Burundi, Rwanda, Haiti,
Japan, Yemen and Pakistan) and two countries in the “fully in” category (Bahrain with 87%
and Singapore with 194%). The crossover threshold is set between Lesotho (30%) which is
more out than in and Chile (34%) which is more in than out.
DEPENDENCE ON NATURAL RESOURCES (NR)
Measuring the dependence on natural resources has received a lot of attention (see for
instance: Lujala, Gleditsch, & Gilmore, 2005; Ross, 2006) with operationalisations focusing on
either exports or on physical endowments (Davis, 2009, p. 10). In this study I use data on
natural resource rents as percentage of the GDP (World Bank, 2012g), which includes oil rents,
natural gas rents, coal rents (hard and soft), mineral rents, and forest rents. Collier and
Hoeffler (2004) find that the risk for civil wars is highest were primary commodity exports
make up for around 33% of the GDP. For this reason countries are calibrated as being fully in
the set of countries with high dependence on natural resources if resource rents are above
33% of GDP. A number of countries have no or very low levels of resource rents, which are
captured by setting the threshold for fully out of the set to less than 1%. Finally, the crossover
threshold is set at 10% utilizing a small data gap and aiming for a spread of cases across the
spectrum.
DEPENDENCE ON OIL (OIL)
Similar as with natural resources in general, there are various ways to measure dependence
on oil (Lujala, Rød, & Thieme, 2007, pp. 241 – 242): The most commonly used data come from
the World Bank General statistics (Collier & Hoeffler, 2004; de Soysa, 2002b; Fearon & Laitin,
2003; Fearon, 2005). Another dataset was compiled by Humphreys (2005) and a third dataset
is the World Bank’s Adjusted Net Savings dataset. I follow the first way and measure export
dependence on oil in terms of the percentage of fuel exports of total merchandise exports
(World Bank, 2012b). This includes mineral fuels, such as coal, petroleum, gas and electric
current. The approach focusing on fuel exports in percentages of total exports differs from
the approach used for natural resources in general, where I use natural resource rents. This
enables me to replace oil with dependence on natural resources and get a sense of the
robustness of the condition. Following Fearon and Laitin (2003), the crossover point between
countries being more in than out of the set of countries depending on oil exports is set at 30%
of exports being oil. The threshold for being fully in the set of oil-dependent countries is set
at 70%, while the threshold for fully out is set at less than one percent, which captures a
number of countries that have no or very little oil exports.
ECONOMIC DIVERSIFICATION (DIV)
The challenge in measuring economic diversification lies in the need for accurate information
on the type and amount or value of agricultural products, manufactures and services. In
particular in developing countries this type of information is difficult to come by and often
inaccurate. A common way to avoid this problem is to focus on the make-up of exports as
D e v e l o p m e n t , D e p e n d e n c e a n d D i v e r s i f i c a t i o n 8 9
more extensive documentation is available, assuming that exports will give an accurate
reflection of the types of products produced in certain countries. Following this, I use data on
export concentration from the World Bank (2009). The Herfindahl index is defined as squared
shares of exports of each industry in total exports per country and gives a value between zero
and one with a value of one standing for one single product that is being exported. While the
index theoretically uses the fuzzy-set spectrum from zero to one, in my sample the highest
value is 0.66 (in Yemen) and only six countries have values higher than 0.5. Most countries
have lower scores and the lowest score is 0.01 in the Netherlands. However, there is sufficient
diversity between cases since values close to one, i.e. a country exporting only one product,
are unusual. In fact, in 2006, Yemen has the fifth-highest score of 192 countries. To use the
full spectrum available in fsQCA, I have calibrated countries with a value above 0.6 as being
fully out of the set of cases with high levels of diversification and countries with levels below
0.05 as being fully in the set of countries with high levels of diversification. The crossover
threshold was set 0.2. The main reasoning for this calibration was to use data gaps where
they occurred and to distribute the cases across the spectrum. An additional effect of this
calibration is that it focuses on diversification rather than concentration, i.e. high numbers
now mean high levels of diversification rather than concentration.
ANALYSIS
In the following, the conditions for a conflict and a peaceful outcome are considered
separately. The reason for this is the assumption of asymmetric causality in QCA, which means
that if A is a cause for the outcome it is not taken as a given that the absence of A will lead to
the absence of the outcome. Both analyses first consider necessary and then sufficient
conditions.
CONFLICT OUTCOME: ANALYSIS OF NECESSITY
Analysing the necessary conditions for a conflict outcome yields one necessary condition:
economic development with a consistency30 of 0.9431. This means that all (or almost all)
countries with a conflict outcome experience low levels of economic development. In my
hypothesis, I expected economic development to be a sufficient condition for conflict, i.e. all
countries with low levels of economic development to experience conflict. Economic
development as a necessary condition for conflict supports the close relationship between
development levels and conflict found in quantitative studies but also shows that it is not a
direct cause for conflict since countries with low levels of development and peace outcomes
exist as well.
The graph in Figure 4.2 shows low levels of economic development as necessary condition.
The x-axis shows the membership in the condition “low levels of economic development”.
30 Consistency scores give the degree to which empirical evidence supports the existence of a set-theoretic relationship (Rihoux & Ragin, 2008, p. 183). Coverage scores assess the relation in size between the condition set and the outcome set (C. Q. Schneider & Wagemann, 2012, p. 325). 31 For consistency and coverage scores of all conditions see Table C.5 in the appendix.
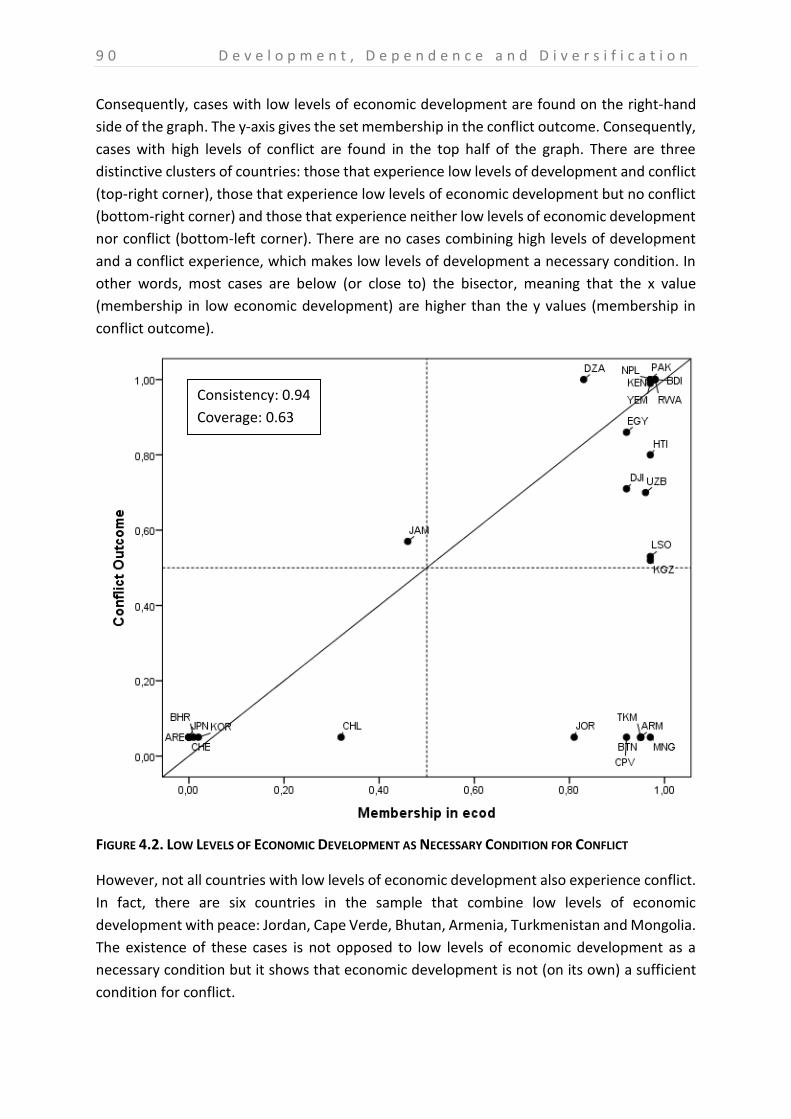
9 0 D e v e l o p m e n t , D e p e n d e n c e a n d D i v e r s i f i c a t i o n
Consequently, cases with low levels of economic development are found on the right-hand
side of the graph. The y-axis gives the set membership in the conflict outcome. Consequently,
cases with high levels of conflict are found in the top half of the graph. There are three
distinctive clusters of countries: those that experience low levels of development and conflict
(top-right corner), those that experience low levels of economic development but no conflict
(bottom-right corner) and those that experience neither low levels of economic development
nor conflict (bottom-left corner). There are no cases combining high levels of development
and a conflict experience, which makes low levels of development a necessary condition. In
other words, most cases are below (or close to) the bisector, meaning that the x value
(membership in low economic development) are higher than the y values (membership in
conflict outcome).
FIGURE 4.2. LOW LEVELS OF ECONOMIC DEVELOPMENT AS NECESSARY CONDITION FOR CONFLICT
However, not all countries with low levels of economic development also experience conflict.
In fact, there are six countries in the sample that combine low levels of economic
development with peace: Jordan, Cape Verde, Bhutan, Armenia, Turkmenistan and Mongolia.
The existence of these cases is not opposed to low levels of economic development as a
necessary condition but it shows that economic development is not (on its own) a sufficient
condition for conflict.
Consistency: 0.94
Coverage: 0.63
D e v e l o p m e n t , D e p e n d e n c e a n d D i v e r s i f i c a t i o n 9 1
Jamaica is true logically contradictory case (C. Q. Schneider & Wagemann, 2012, p. 127) as it
has a conflict outcome but high levels of development. The membership in the conflict
outcome (0.6) is above 0.5 but the membership in the absence of economic development is
below 0.5 (0.46). While the existence of true logically contradictory cases can be a reason to
argue that a condition is not necessary, in this case the fact that the set membership for both
outcome and condition is close to the 0.5 threshold and that there are no other contradictory
cases suggest that low levels of economic development is a necessary condition.
These results support the well-accepted relationship between economic development and
conflict. However, it also raises new questions. For instance, if economic development is a
necessary but not a sufficient condition, what differentiates countries with low economic
development and a conflict outcome from those without a conflict outcome? Are there
specific aspects of economic development that play a role in resource-scarce societies and
their proneness to conflict, such as economic diversification, dependence on agriculture,
dependence on fuel exports etc.? This is explored further in the analysis of sufficient
conditions.
CONFLICT OUTCOME: ANALYSIS OF SUFFICIENCY
There are seven conditions laid out above, falling into three categories. In analysing them, I
will not include all conditions at the same time. While this is theoretically possible, it would
generate 128 combinations of conditions, leading to a large number of logical remainders.
Therefore, I run separate analyses, first focusing on development, then on dependence and
finally on diversification. Most analyses include four or five conditions. Throughout the
chapter, I will present the intermediate solutions in the text, while the parsimonious and
complex solution are presented in the appendix. Intermediate solutions are based on
theoretic assumptions for the combinations of conditions that are not covered by actual
cases. I base these theoretic assumptions on the theoretic arguments and hypotheses
discussed above32.
Throughout the chapter, two pathways to conflict emerge. The first one focuses on very poor
or least developed countries (such as Burundi, Rwanda, Haiti and Nepal). This pathway
combines two conditions: 1) a high percentage of the population depending on agriculture,
which represents high levels of subsistence agriculture, and more generally, a struggle to
sustain livelihoods and 2) The absence of oil dependence, which shows a lack of other
revenues, contributing to the very low level of development. This pathway is sometimes
joined by other conditions such as high poverty levels or low levels of economic
diversification, depending on the conditions included in the analysis. The second pathway
combines low levels of export dependence and high levels of oil exports. It thus describes
countries that are not well integrated into the global economy but have a high percentage of
oil exports.
32 For an overview of the theoretic assumptions, see Table C.1 in the appendix.
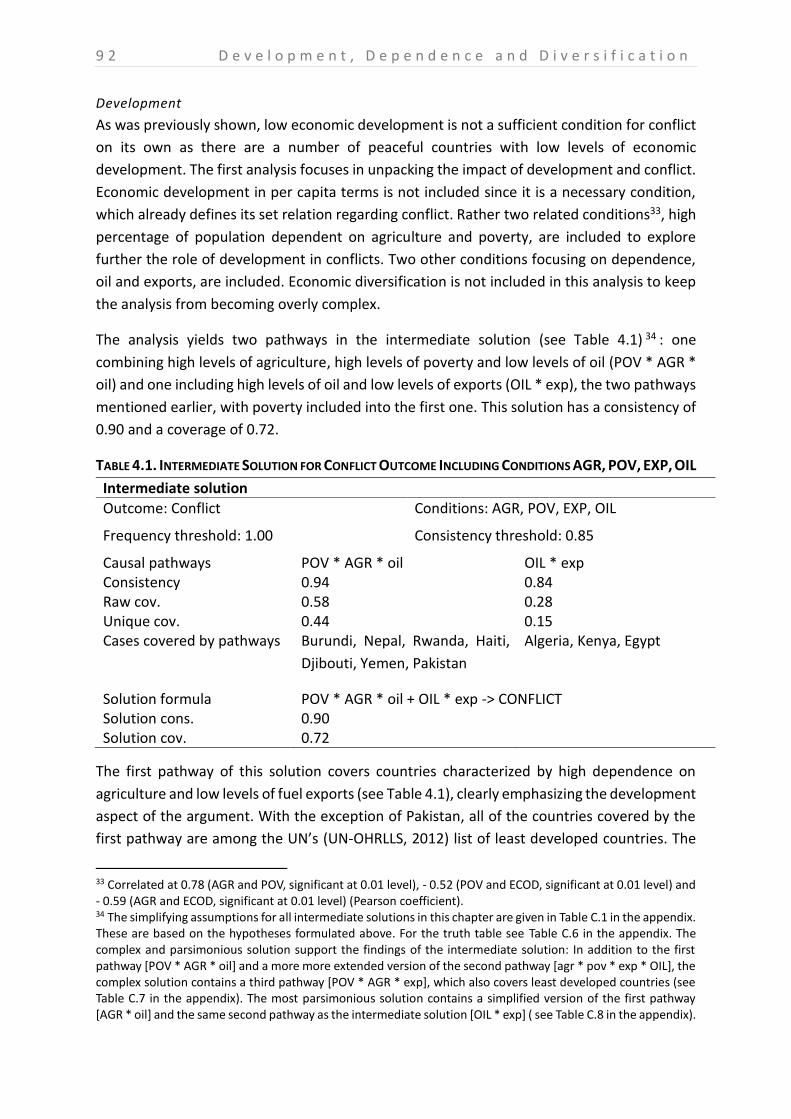
9 2 D e v e l o p m e n t , D e p e n d e n c e a n d D i v e r s i f i c a t i o n
Development
As was previously shown, low economic development is not a sufficient condition for conflict
on its own as there are a number of peaceful countries with low levels of economic
development. The first analysis focuses in unpacking the impact of development and conflict.
Economic development in per capita terms is not included since it is a necessary condition,
which already defines its set relation regarding conflict. Rather two related conditions33, high
percentage of population dependent on agriculture and poverty, are included to explore
further the role of development in conflicts. Two other conditions focusing on dependence,
oil and exports, are included. Economic diversification is not included in this analysis to keep
the analysis from becoming overly complex.
The analysis yields two pathways in the intermediate solution (see Table 4.1) 34 : one
combining high levels of agriculture, high levels of poverty and low levels of oil (POV * AGR *
oil) and one including high levels of oil and low levels of exports (OIL * exp), the two pathways
mentioned earlier, with poverty included into the first one. This solution has a consistency of
0.90 and a coverage of 0.72.
TABLE 4.1. INTERMEDIATE SOLUTION FOR CONFLICT OUTCOME INCLUDING CONDITIONS AGR, POV, EXP, OIL
Intermediate solution
Outcome: Conflict Conditions: AGR, POV, EXP, OIL
Frequency threshold: 1.00 Consistency threshold: 0.85
Causal pathways POV * AGR * oil OIL * exp Consistency 0.94 0.84 Raw cov. 0.58 0.28 Unique cov. 0.44 0.15 Cases covered by pathways Burundi, Nepal, Rwanda, Haiti,
Djibouti, Yemen, Pakistan
Algeria, Kenya, Egypt
Solution formula POV * AGR * oil + OIL * exp -> CONFLICT Solution cons. 0.90 Solution cov. 0.72
The first pathway of this solution covers countries characterized by high dependence on
agriculture and low levels of fuel exports (see Table 4.1), clearly emphasizing the development
aspect of the argument. With the exception of Pakistan, all of the countries covered by the
first pathway are among the UN’s (UN-OHRLLS, 2012) list of least developed countries. The
33 Correlated at 0.78 (AGR and POV, significant at 0.01 level), - 0.52 (POV and ECOD, significant at 0.01 level) and - 0.59 (AGR and ECOD, significant at 0.01 level) (Pearson coefficient). 34 The simplifying assumptions for all intermediate solutions in this chapter are given in Table C.1 in the appendix. These are based on the hypotheses formulated above. For the truth table see Table C.6 in the appendix. The complex and parsimonious solution support the findings of the intermediate solution: In addition to the first pathway [POV * AGR * oil] and a more more extended version of the second pathway [agr * pov * exp * OIL], the complex solution contains a third pathway [POV * AGR * exp], which also covers least developed countries (see Table C.7 in the appendix). The most parsimonious solution contains a simplified version of the first pathway [AGR * oil] and the same second pathway as the intermediate solution [OIL * exp] ( see Table C.8 in the appendix).
D e v e l o p m e n t , D e p e n d e n c e a n d D i v e r s i f i c a t i o n 9 3
economies of these countries are characterised by a large agrarian sector and “a vicious circle
of low productivity and low investment”(UN-OHRLLS, 2012). Development failure also erodes
the state’s revenue base and encourages corruption (Sharma, 2006, p. 1238). It should be
noted however, that being a least developed country on its own is not a sufficient condition.
For instance Bhutan is on the list of least developed countries, yet has not experienced
conflict. Lesotho, on the other hand, is a least developed country and has experienced
conflicts, but is not covered by the pathways shown here.
For instance, in the case of Nepal, it has been argued that “development failure […] has
provided fertile grounds for the civil war” (Sharma, 2006, p. 1237). Development efforts in
recent decades have mainly been geared towards industries in urban areas but have failed to
reach the land-based poor and agricultural output has declined between 1960 and 1992/3
(Sharma, 2006, pp. 1237 – 1241). Agriculture is of high relevance to the Nepalese economy
with 87% of the population living in rural areas. In particular, in the mountainous and hilly
areas, which are ill-suited to commercial agriculture and lack effective transport
infrastructure, the population relies heavily on subsistence agriculture (Sharma, 2006, p.
1239). Development policies that focused on small segments of the urban population
contributed to increasing poverty and inequality, which led to anger and frustration, in
particular among the youth in remote areas. This made it easy for Maoists to find recruits and
grievances slowly developed into a full civil war. Empirical results also support a strong link
between poverty and intensity of civil war in Nepal. In a geographically disaggregated analysis
of Nepal, Do and Iyer (2010) show that a 10 percentage point increase in poverty is associated
with 25 to 27 additional conflict-related deaths and that poorer districts tended to be drawn
into the conflict at an earlier stage.
To check the robustness of the solution to the inclusion of different conditions, Table 4.2
represents an overview of the various combinations of conditions. To do this, I take the
conditions included in the solution above (high dependence on [OIL] and high levels of exports
[EXP]) and add all three development conditions (poverty [POV] and high dependence on
agriculture [AGR], which were already included in the analysis above and economic
development [ECOD], which was not). Running the analysis including different combinations
of these five conditions shows that two pathways ([AGR * oil] and [OIL * exp], denoted in
bold) appear whenever agriculture is included, whether by itself (solution 2), in combination
with poverty (6), economic development (5) or both (7). In addition, these two pathways are
also the pathways of the parsimonious solution for the analysis above and are contained
within the intermediate analysis presented above. In this intermediate solution high levels of
poverty are added to the second pathway. This shows that the two main pathways remain
the same regardless of other conditions included.
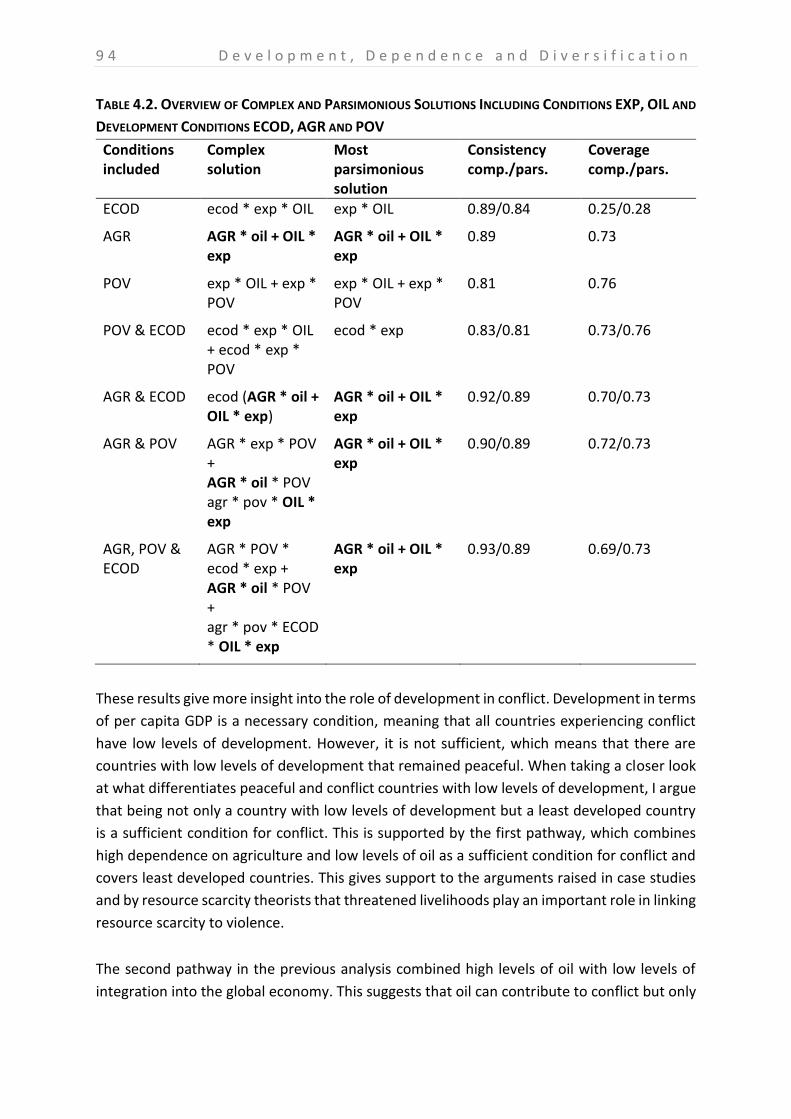
9 4 D e v e l o p m e n t , D e p e n d e n c e a n d D i v e r s i f i c a t i o n
TABLE 4.2. OVERVIEW OF COMPLEX AND PARSIMONIOUS SOLUTIONS INCLUDING CONDITIONS EXP, OIL AND
DEVELOPMENT CONDITIONS ECOD, AGR AND POV
Conditions included
Complex solution
Most parsimonious solution
Consistency comp./pars.
Coverage comp./pars.
ECOD ecod * exp * OIL exp * OIL 0.89/0.84 0.25/0.28
AGR AGR * oil + OIL * exp
AGR * oil + OIL * exp
0.89 0.73
POV exp * OIL + exp * POV
exp * OIL + exp * POV
0.81 0.76
POV & ECOD ecod * exp * OIL + ecod * exp * POV
ecod * exp 0.83/0.81 0.73/0.76
AGR & ECOD ecod (AGR * oil + OIL * exp)
AGR * oil + OIL * exp
0.92/0.89 0.70/0.73
AGR & POV AGR * exp * POV + AGR * oil * POV agr * pov * OIL * exp
AGR * oil + OIL * exp
0.90/0.89 0.72/0.73
AGR, POV & ECOD
AGR * POV * ecod * exp + AGR * oil * POV + agr * pov * ECOD * OIL * exp
AGR * oil + OIL * exp
0.93/0.89 0.69/0.73
These results give more insight into the role of development in conflict. Development in terms
of per capita GDP is a necessary condition, meaning that all countries experiencing conflict
have low levels of development. However, it is not sufficient, which means that there are
countries with low levels of development that remained peaceful. When taking a closer look
at what differentiates peaceful and conflict countries with low levels of development, I argue
that being not only a country with low levels of development but a least developed country
is a sufficient condition for conflict. This is supported by the first pathway, which combines
high dependence on agriculture and low levels of oil as a sufficient condition for conflict and
covers least developed countries. This gives support to the arguments raised in case studies
and by resource scarcity theorists that threatened livelihoods play an important role in linking
resource scarcity to violence.
The second pathway in the previous analysis combined high levels of oil with low levels of
integration into the global economy. This suggests that oil can contribute to conflict but only
D e v e l o p m e n t , D e p e n d e n c e a n d D i v e r s i f i c a t i o n 9 5
in countries that are not well integrated into the global economy. This argument will be
explored further in the following analysis.
Dependence
While oil and natural gas have often been seen as an important explanation for civil war and
oil-rich countries have been hypothesized to have a higher risk for conflict, analysis of
resource-scarce countries shows a more complex role for oil than simply contributing to
conflict. In fact, it is countries with low levels of oil exports but high levels of agricultural
population that experience conflicts. Where countries with high levels of exports of oil
experience conflicts, the high level of fuels in total exports combines with low export levels in
general. This is true for three countries: Algeria, Kenya and Egypt (see Table 4.1). The coverage
of this pathway is rather low (0.28) as only three countries are covered. While Algeria and
Egypt are important oil producing countries, ranking 16th and 28th in the world according to
oil production (CIA World Factbook, 2012a) and 14th and 58th according to exports (CIA World
Factbook, 2012c), Kenya is not a major oil producer (92nd in terms of oil exports). These results
are in line with and to an extent explain the unclear results of the impact of primary
commodity exports on conflicts in quantitative studies. That oil does not necessarily
contribute to conflict can also be seen in Figure 4.3.
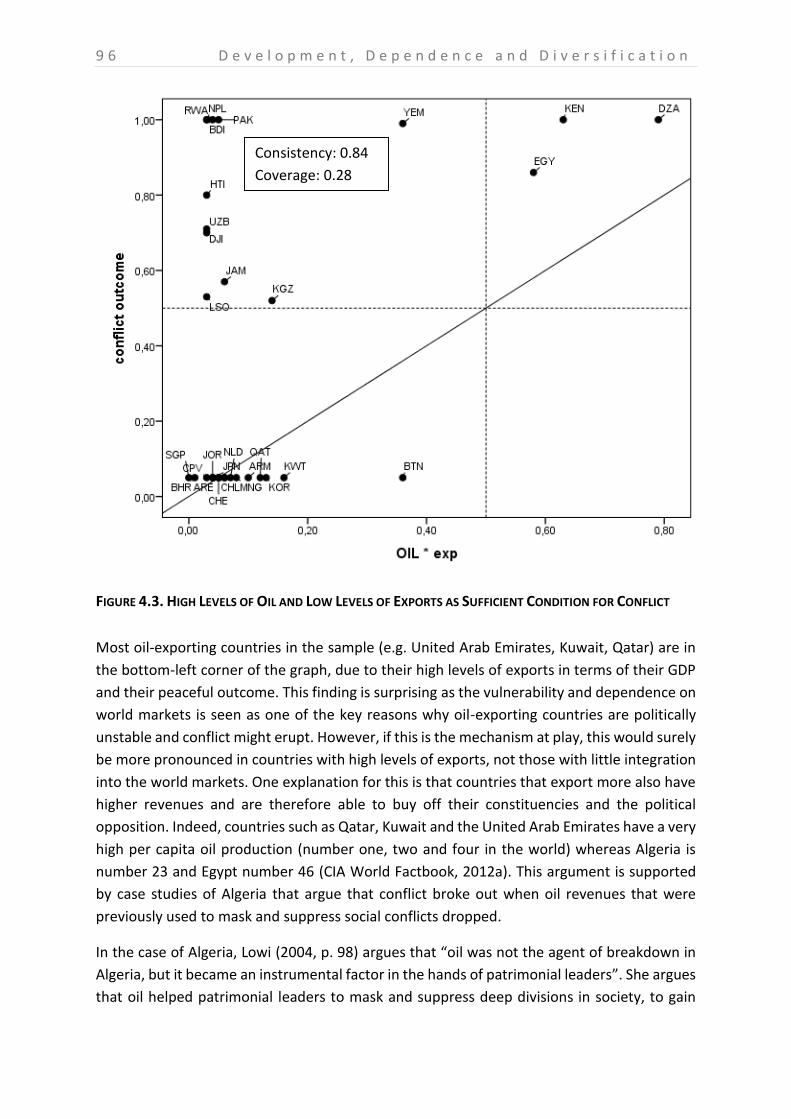
9 6 D e v e l o p m e n t , D e p e n d e n c e a n d D i v e r s i f i c a t i o n
FIGURE 4.3. HIGH LEVELS OF OIL AND LOW LEVELS OF EXPORTS AS SUFFICIENT CONDITION FOR CONFLICT
Most oil-exporting countries in the sample (e.g. United Arab Emirates, Kuwait, Qatar) are in
the bottom-left corner of the graph, due to their high levels of exports in terms of their GDP
and their peaceful outcome. This finding is surprising as the vulnerability and dependence on
world markets is seen as one of the key reasons why oil-exporting countries are politically
unstable and conflict might erupt. However, if this is the mechanism at play, this would surely
be more pronounced in countries with high levels of exports, not those with little integration
into the world markets. One explanation for this is that countries that export more also have
higher revenues and are therefore able to buy off their constituencies and the political
opposition. Indeed, countries such as Qatar, Kuwait and the United Arab Emirates have a very
high per capita oil production (number one, two and four in the world) whereas Algeria is
number 23 and Egypt number 46 (CIA World Factbook, 2012a). This argument is supported
by case studies of Algeria that argue that conflict broke out when oil revenues that were
previously used to mask and suppress social conflicts dropped.
In the case of Algeria, Lowi (2004, p. 98) argues that “oil was not the agent of breakdown in
Algeria, but it became an instrumental factor in the hands of patrimonial leaders”. She argues
that oil helped patrimonial leaders to mask and suppress deep divisions in society, to gain
Consistency: 0.84
Coverage: 0.28
D e v e l o p m e n t , D e p e n d e n c e a n d D i v e r s i f i c a t i o n 9 7
legitimacy through redistribution and to establish a system of corruption where oil rents
helped to maintain “le système”. In the 1970s, Algeria was considered a model revolutionary
post-colonial state with high growth levels, political stability, high investments in
infrastructure and education (Lowi, 2004, p. 83). However, Algerian leaders failed to address
the deep divisions within society (urban – rural; Arab – Berber; francophone – arabophone –
berberophone; europeanised – traditional) and the issue of the Algerian nation. Oil rents were
used to mask these conflicts by massive schemes of redistribution, which helped to gain
legitimacy for the government. Following a fall of oil prices in the 1980s, Algeria experienced
increasing unemployment and inequality. In addition, oil revenues increasingly benefitted
only those with close links to the bureaucracy (Sandbakken, 2006, p. 141). These grievances
led to anti-government riots, an army crackdown and the formulation of a new, more
inclusive, constitution and the announcement of the first multi-party elections. When an
electoral win of the Islamic Salvation Front (FIS) seemed certain, the military intervened,
banned the Islamic Salvation Front and forced the president to resign. Shortly after, the civil
war broke out (Lowi, 2004, p. 84). Oil rents were important in paying for their social project,
which allowed leaders to ignore the question of nation-building, in particular of how to deal
with the deep divisions in society. With the fall in oil prices, paying for social peace was no
longer possible. Therefore oil “put the brake on civil unrest only temporarily” (Lowi, 2004, p.
98) but as oil revenues declined, this no longer worked and old divisions sprung up again and
let to civil war.
Broadening the analysis to include natural resources rents rather than fuel exports as
percentage of total exports leads to similar pathways as the solution presented in Table 4.1)35.
Looking at the role of exports and integration in the world economy, the solution displayed
above shows that low levels of integration into the world economy are sufficient for conflict
in combination with either high levels of dependence on oil (Algeria, Kenya, Egypt) or high
levels of agricultural population (Burundi, Rwanda, Haiti, Nepal, Kenya, Yemen and Pakistan).
This supports theoretical arguments linking trade to a decrease in conflict via alternative
income opportunities in the private sector (and therefore less political competition) and
through growth and rising incomes, limiting grievances (and therefore motives for rebellion)
and allowing those in power to buy off their constituencies and political opponents. Oil
dependence is only sufficient for conflict in countries that are not well integrated into the
global economy.
The question of dependence on natural resources is linked to the question of economic
diversification since a common argument is that economies based on natural resource
35 See Table C.10 in the appendix for the complex, intermediate and parsimonious solution. They present the same pathways as the formula presented in Table 4.1 except for poverty, which is not part of the first pathway. As can be seen from Table C.11 in the appendix, the various solutions discussed earlier in this chapter remain very similar if oil is replaced by natural resources rents.
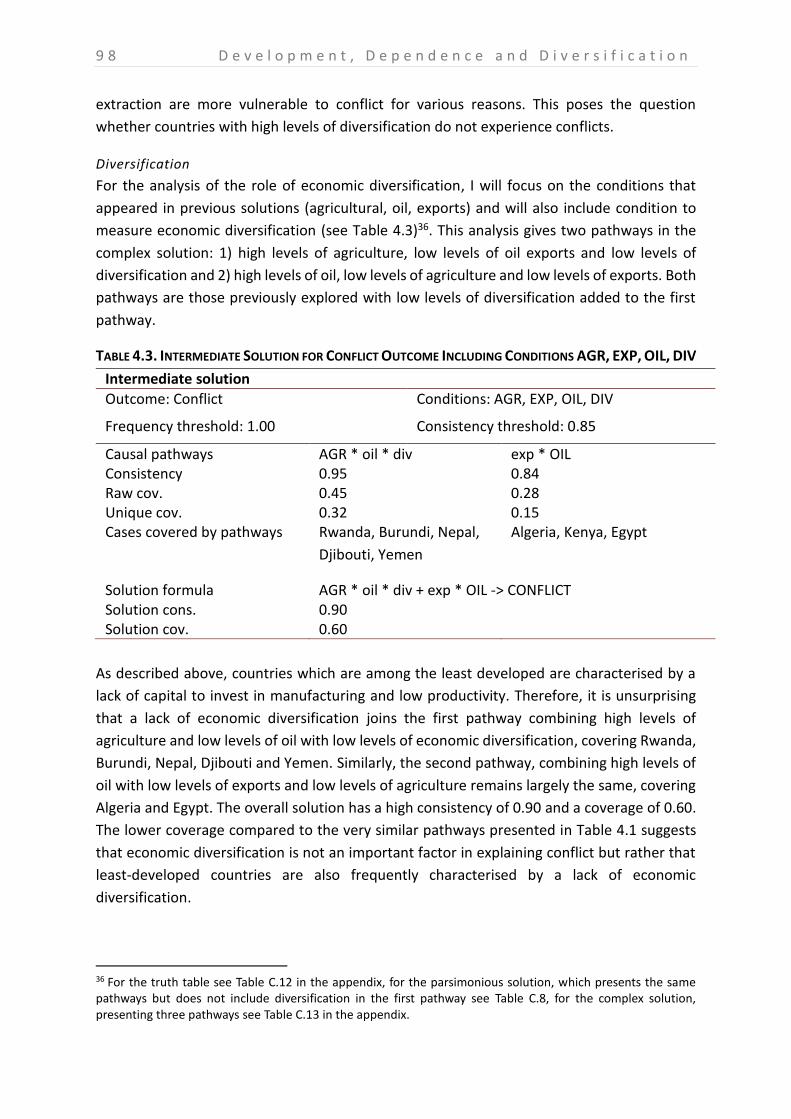
9 8 D e v e l o p m e n t , D e p e n d e n c e a n d D i v e r s i f i c a t i o n
extraction are more vulnerable to conflict for various reasons. This poses the question
whether countries with high levels of diversification do not experience conflicts.
Diversification
For the analysis of the role of economic diversification, I will focus on the conditions that
appeared in previous solutions (agricultural, oil, exports) and will also include condition to
measure economic diversification (see Table 4.3)36. This analysis gives two pathways in the
complex solution: 1) high levels of agriculture, low levels of oil exports and low levels of
diversification and 2) high levels of oil, low levels of agriculture and low levels of exports. Both
pathways are those previously explored with low levels of diversification added to the first
pathway.
TABLE 4.3. INTERMEDIATE SOLUTION FOR CONFLICT OUTCOME INCLUDING CONDITIONS AGR, EXP, OIL, DIV
Intermediate solution
Outcome: Conflict Conditions: AGR, EXP, OIL, DIV
Frequency threshold: 1.00 Consistency threshold: 0.85
Causal pathways AGR * oil * div exp * OIL Consistency 0.95 0.84 Raw cov. 0.45 0.28 Unique cov. 0.32 0.15 Cases covered by pathways Rwanda, Burundi, Nepal,
Djibouti, Yemen
Algeria, Kenya, Egypt
Solution formula AGR * oil * div + exp * OIL -> CONFLICT Solution cons. 0.90 Solution cov. 0.60
As described above, countries which are among the least developed are characterised by a
lack of capital to invest in manufacturing and low productivity. Therefore, it is unsurprising
that a lack of economic diversification joins the first pathway combining high levels of
agriculture and low levels of oil with low levels of economic diversification, covering Rwanda,
Burundi, Nepal, Djibouti and Yemen. Similarly, the second pathway, combining high levels of
oil with low levels of exports and low levels of agriculture remains largely the same, covering
Algeria and Egypt. The overall solution has a high consistency of 0.90 and a coverage of 0.60.
The lower coverage compared to the very similar pathways presented in Table 4.1 suggests
that economic diversification is not an important factor in explaining conflict but rather that
least-developed countries are also frequently characterised by a lack of economic
diversification.
36 For the truth table see Table C.12 in the appendix, for the parsimonious solution, which presents the same pathways but does not include diversification in the first pathway see Table C.8, for the complex solution, presenting three pathways see Table C.13 in the appendix.
D e v e l o p m e n t , D e p e n d e n c e a n d D i v e r s i f i c a t i o n 9 9
The analysis of the conflict outcome shows that low levels of economic development are
necessary for conflict and that, in particular, being a least developed country is sufficient for
conflict. This supports the arguments in the literature pointing to low economic development
as a cause for conflict. High levels of oil as a part of a sufficient condition for conflict supports
resource abundance arguments, arguing that high levels of oil can cause conflicts via various
mechanisms. However, as low levels of oil are sufficient for conflict of combined with high
dependence on agriculture as well, this points to a more complex role for oil than is often
assumed. There is no empirical evidence for high levels of exports as sufficient condition for
conflict as expected in some of the literature.
PEACE OUTCOME: ANALYSIS OF NECESSITY
Focusing on the peace outcome, there is one necessary condition37: Low levels of agricultural
population, meaning that all countries where few people are dependent on agriculture for
their direct livelihoods have no armed conflict. This condition has a consistency of 0.91 and a
coverage of 0.8. Figure 4.4 shows a high percentage of the population depending on
agriculture as a necessary condition. The x-axis shows the membership in low levels of
agricultural dependence [agr], so countries on the right have low levels of agricultural
dependence. The y-axis shows the membership in a peace outcome, so countries on the top
are peaceful. The countries in the cluster in the top-right corner are thus those with low levels
of agricultural dependence and a peace outcome that support this set relation.
37 For an overview of all consistency and coverage scores see Table C.14 in the appendix.
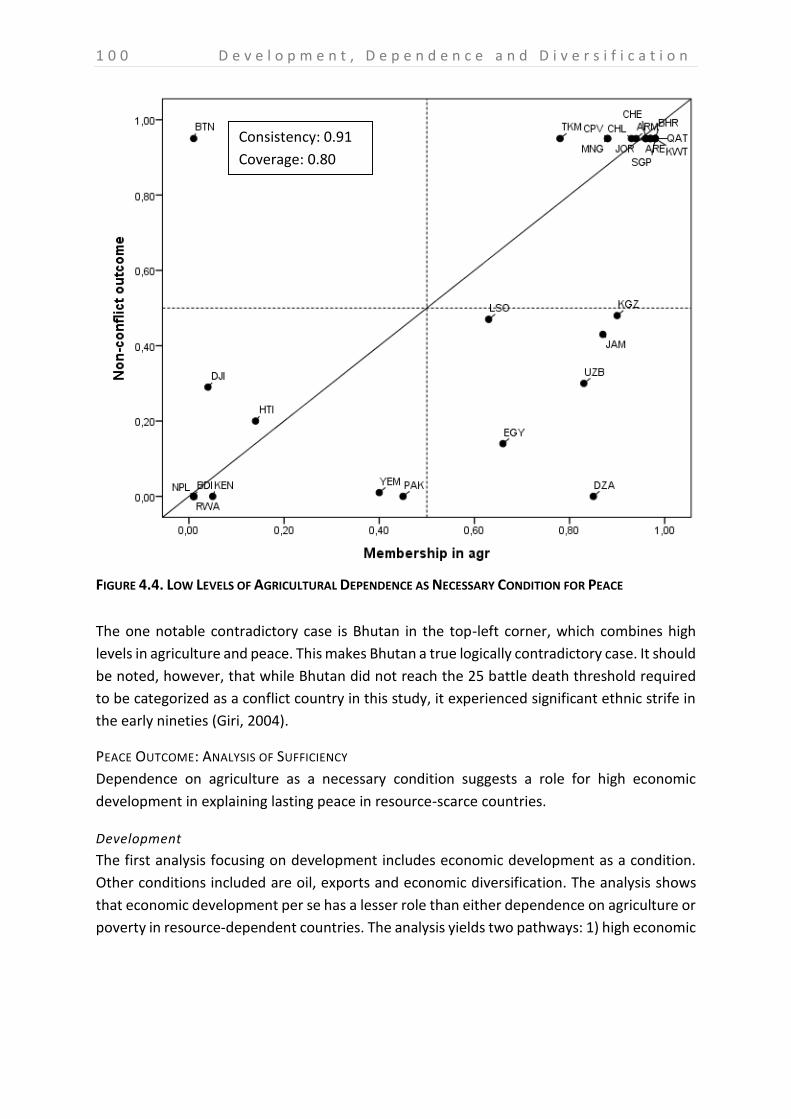
1 0 0 D e v e l o p m e n t , D e p e n d e n c e a n d D i v e r s i f i c a t i o n
FIGURE 4.4. LOW LEVELS OF AGRICULTURAL DEPENDENCE AS NECESSARY CONDITION FOR PEACE
The one notable contradictory case is Bhutan in the top-left corner, which combines high
levels in agriculture and peace. This makes Bhutan a true logically contradictory case. It should
be noted, however, that while Bhutan did not reach the 25 battle death threshold required
to be categorized as a conflict country in this study, it experienced significant ethnic strife in
the early nineties (Giri, 2004).
PEACE OUTCOME: ANALYSIS OF SUFFICIENCY
Dependence on agriculture as a necessary condition suggests a role for high economic
development in explaining lasting peace in resource-scarce countries.
Development
The first analysis focusing on development includes economic development as a condition.
Other conditions included are oil, exports and economic diversification. The analysis shows
that economic development per se has a lesser role than either dependence on agriculture or
poverty in resource-dependent countries. The analysis yields two pathways: 1) high economic
Consistency: 0.91
Coverage: 0.80
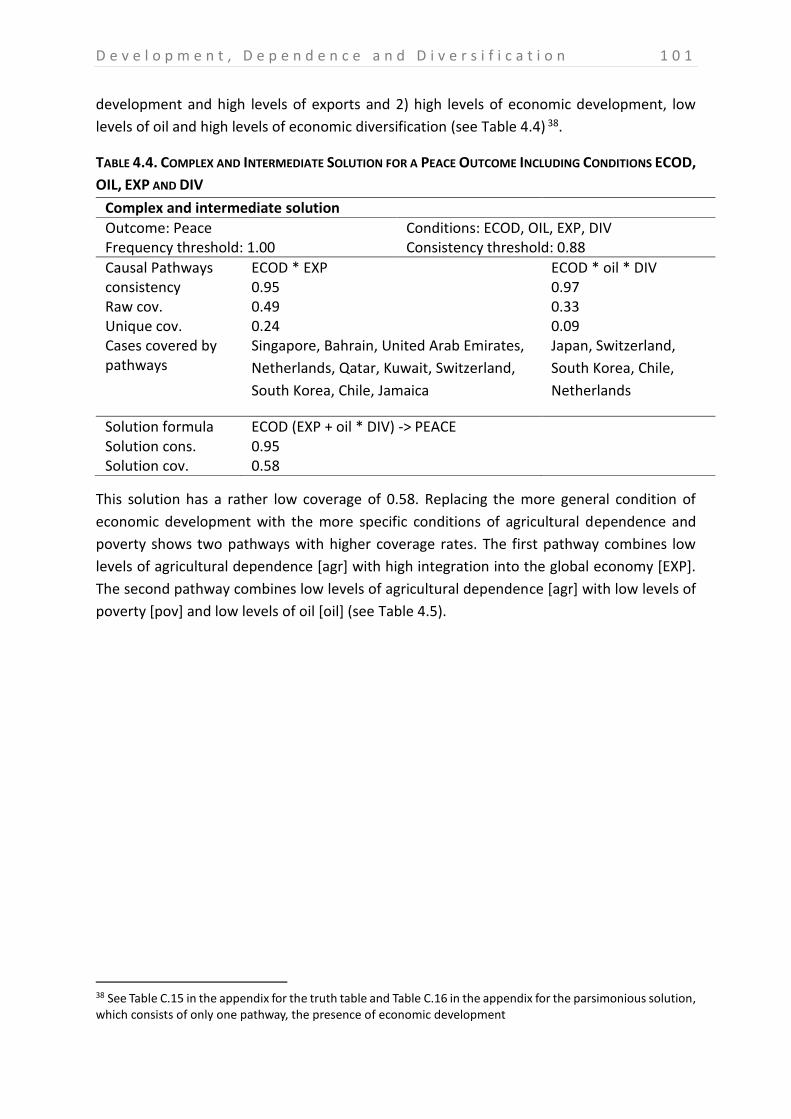
D e v e l o p m e n t , D e p e n d e n c e a n d D i v e r s i f i c a t i o n 1 0 1
development and high levels of exports and 2) high levels of economic development, low
levels of oil and high levels of economic diversification (see Table 4.4) 38.
TABLE 4.4. COMPLEX AND INTERMEDIATE SOLUTION FOR A PEACE OUTCOME INCLUDING CONDITIONS ECOD,
OIL, EXP AND DIV
Complex and intermediate solution
Outcome: Peace Conditions: ECOD, OIL, EXP, DIV Frequency threshold: 1.00 Consistency threshold: 0.88
Causal Pathways ECOD * EXP ECOD * oil * DIV consistency 0.95 0.97 Raw cov. 0.49 0.33 Unique cov. 0.24 0.09 Cases covered by pathways
Singapore, Bahrain, United Arab Emirates,
Netherlands, Qatar, Kuwait, Switzerland,
South Korea, Chile, Jamaica
Japan, Switzerland,
South Korea, Chile,
Netherlands
Solution formula ECOD (EXP + oil * DIV) -> PEACE Solution cons. 0.95 Solution cov. 0.58
This solution has a rather low coverage of 0.58. Replacing the more general condition of
economic development with the more specific conditions of agricultural dependence and
poverty shows two pathways with higher coverage rates. The first pathway combines low
levels of agricultural dependence [agr] with high integration into the global economy [EXP].
The second pathway combines low levels of agricultural dependence [agr] with low levels of
poverty [pov] and low levels of oil [oil] (see Table 4.5).
38 See Table C.15 in the appendix for the truth table and Table C.16 in the appendix for the parsimonious solution, which consists of only one pathway, the presence of economic development
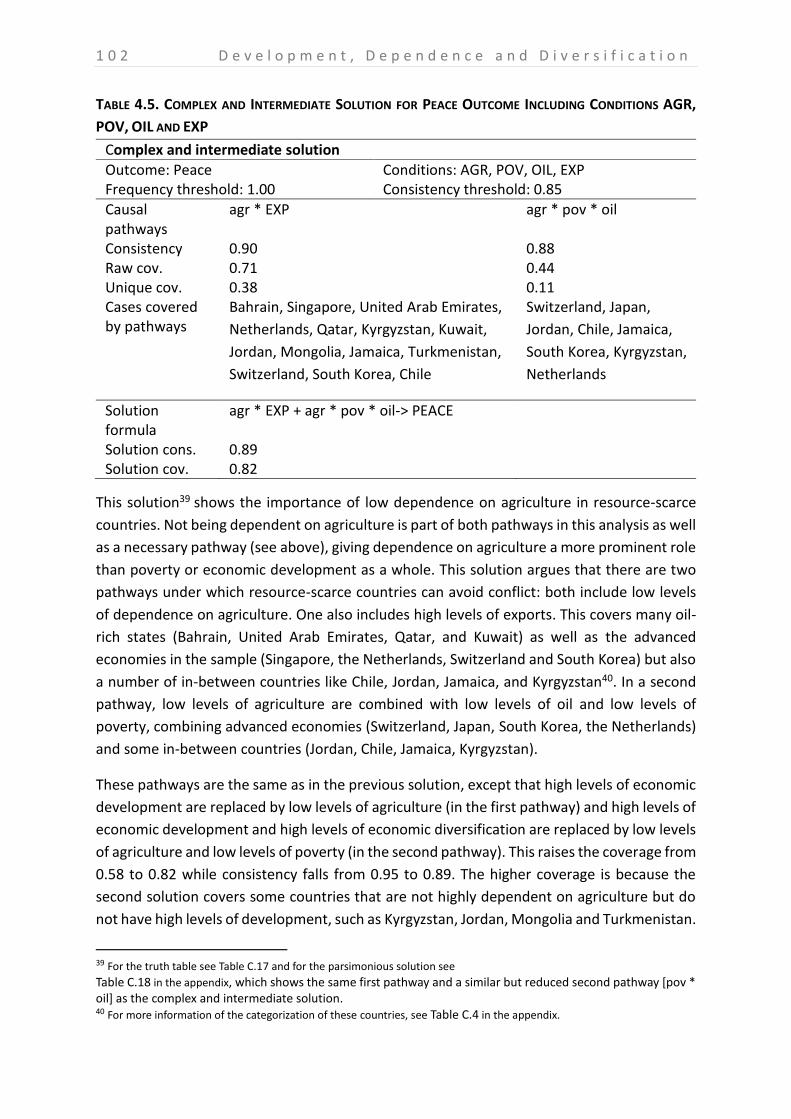
1 0 2 D e v e l o p m e n t , D e p e n d e n c e a n d D i v e r s i f i c a t i o n
TABLE 4.5. COMPLEX AND INTERMEDIATE SOLUTION FOR PEACE OUTCOME INCLUDING CONDITIONS AGR,
POV, OIL AND EXP
Complex and intermediate solution
Outcome: Peace Conditions: AGR, POV, OIL, EXP Frequency threshold: 1.00 Consistency threshold: 0.85
Causal pathways
agr * EXP agr * pov * oil
Consistency 0.90 0.88 Raw cov. 0.71 0.44 Unique cov. 0.38 0.11 Cases covered by pathways
Bahrain, Singapore, United Arab Emirates,
Netherlands, Qatar, Kyrgyzstan, Kuwait,
Jordan, Mongolia, Jamaica, Turkmenistan,
Switzerland, South Korea, Chile
Switzerland, Japan,
Jordan, Chile, Jamaica,
South Korea, Kyrgyzstan,
Netherlands
Solution formula
agr * EXP + agr * pov * oil-> PEACE
Solution cons. 0.89 Solution cov. 0.82
This solution39 shows the importance of low dependence on agriculture in resource-scarce
countries. Not being dependent on agriculture is part of both pathways in this analysis as well
as a necessary pathway (see above), giving dependence on agriculture a more prominent role
than poverty or economic development as a whole. This solution argues that there are two
pathways under which resource-scarce countries can avoid conflict: both include low levels
of dependence on agriculture. One also includes high levels of exports. This covers many oil-
rich states (Bahrain, United Arab Emirates, Qatar, and Kuwait) as well as the advanced
economies in the sample (Singapore, the Netherlands, Switzerland and South Korea) but also
a number of in-between countries like Chile, Jordan, Jamaica, and Kyrgyzstan40. In a second
pathway, low levels of agriculture are combined with low levels of oil and low levels of
poverty, combining advanced economies (Switzerland, Japan, South Korea, the Netherlands)
and some in-between countries (Jordan, Chile, Jamaica, Kyrgyzstan).
These pathways are the same as in the previous solution, except that high levels of economic
development are replaced by low levels of agriculture (in the first pathway) and high levels of
economic development and high levels of economic diversification are replaced by low levels
of agriculture and low levels of poverty (in the second pathway). This raises the coverage from
0.58 to 0.82 while consistency falls from 0.95 to 0.89. The higher coverage is because the
second solution covers some countries that are not highly dependent on agriculture but do
not have high levels of development, such as Kyrgyzstan, Jordan, Mongolia and Turkmenistan.
39 For the truth table see Table C.17 and for the parsimonious solution see Table C.18 in the appendix, which shows the same first pathway and a similar but reduced second pathway [pov * oil] as the complex and intermediate solution. 40 For more information of the categorization of these countries, see Table C.4 in the appendix.
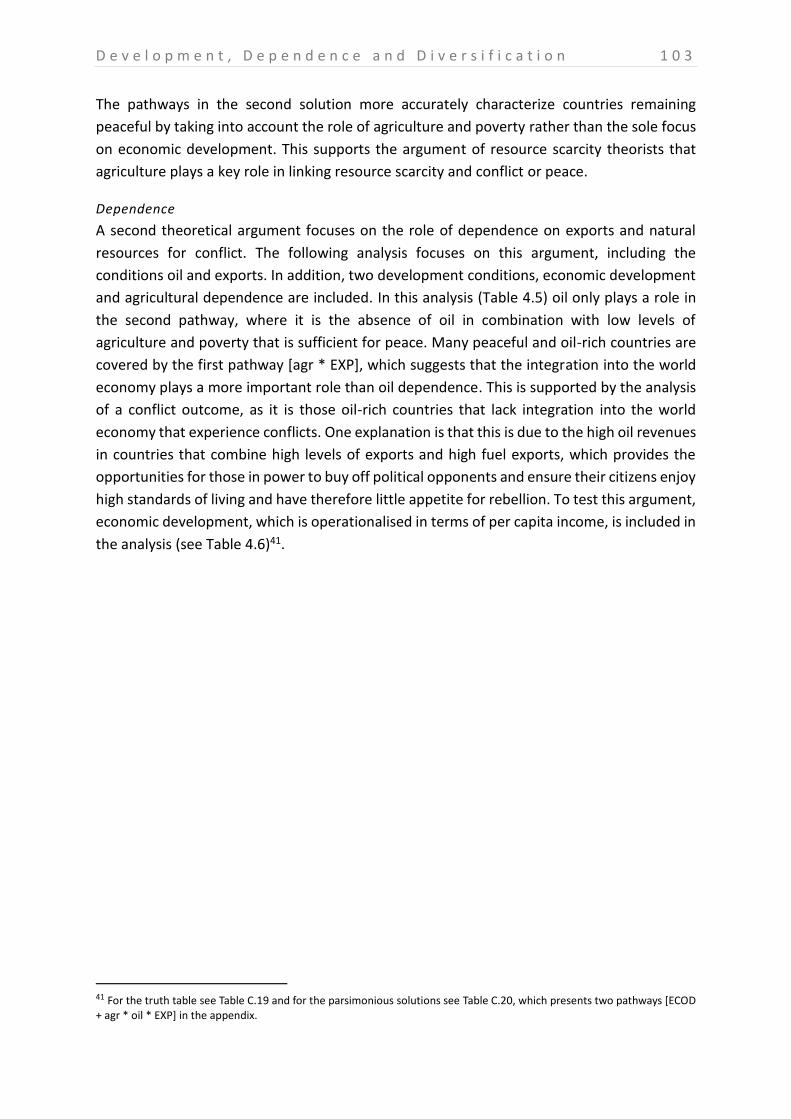
D e v e l o p m e n t , D e p e n d e n c e a n d D i v e r s i f i c a t i o n 1 0 3
The pathways in the second solution more accurately characterize countries remaining
peaceful by taking into account the role of agriculture and poverty rather than the sole focus
on economic development. This supports the argument of resource scarcity theorists that
agriculture plays a key role in linking resource scarcity and conflict or peace.
Dependence
A second theoretical argument focuses on the role of dependence on exports and natural
resources for conflict. The following analysis focuses on this argument, including the
conditions oil and exports. In addition, two development conditions, economic development
and agricultural dependence are included. In this analysis (Table 4.5) oil only plays a role in
the second pathway, where it is the absence of oil in combination with low levels of
agriculture and poverty that is sufficient for peace. Many peaceful and oil-rich countries are
covered by the first pathway [agr * EXP], which suggests that the integration into the world
economy plays a more important role than oil dependence. This is supported by the analysis
of a conflict outcome, as it is those oil-rich countries that lack integration into the world
economy that experience conflicts. One explanation is that this is due to the high oil revenues
in countries that combine high levels of exports and high fuel exports, which provides the
opportunities for those in power to buy off political opponents and ensure their citizens enjoy
high standards of living and have therefore little appetite for rebellion. To test this argument,
economic development, which is operationalised in terms of per capita income, is included in
the analysis (see Table 4.6)41.
41 For the truth table see Table C.19 and for the parsimonious solutions see Table C.20, which presents two pathways [ECOD + agr * oil * EXP] in the appendix.
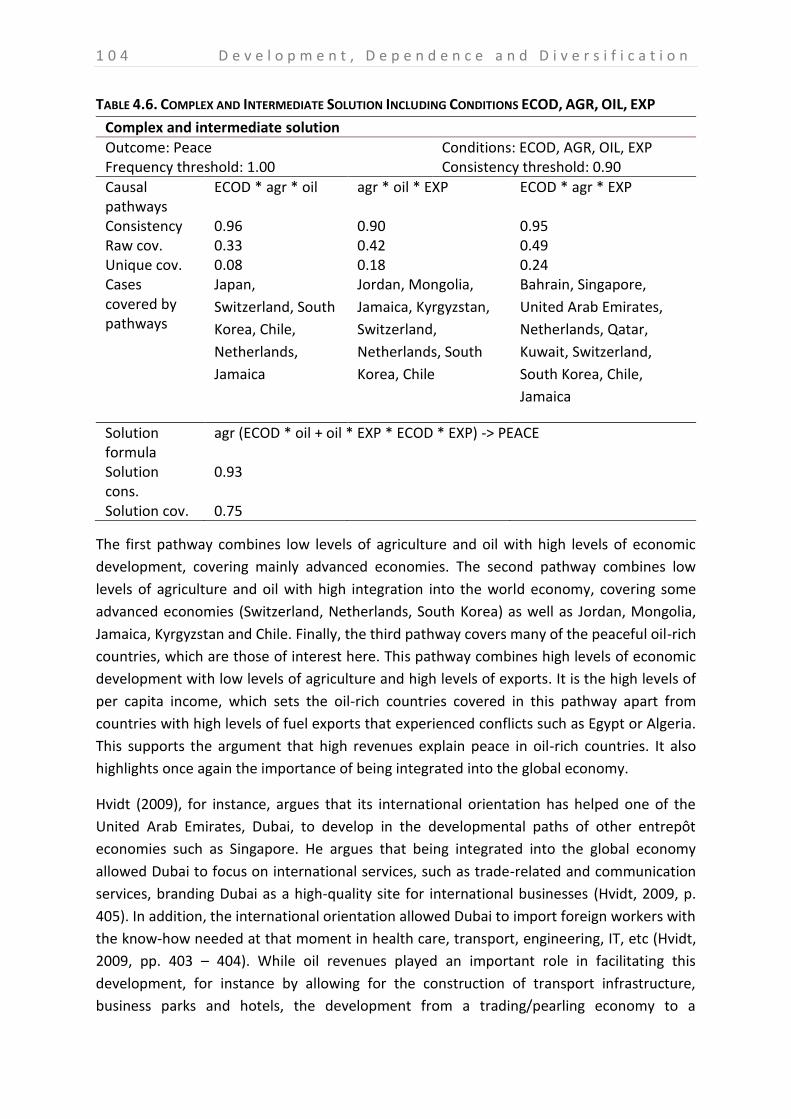
1 0 4 D e v e l o p m e n t , D e p e n d e n c e a n d D i v e r s i f i c a t i o n
TABLE 4.6. COMPLEX AND INTERMEDIATE SOLUTION INCLUDING CONDITIONS ECOD, AGR, OIL, EXP
Complex and intermediate solution
Outcome: Peace Conditions: ECOD, AGR, OIL, EXP Frequency threshold: 1.00 Consistency threshold: 0.90
Causal pathways
ECOD * agr * oil agr * oil * EXP ECOD * agr * EXP
Consistency 0.96 0.90 0.95 Raw cov. 0.33 0.42 0.49 Unique cov. 0.08 0.18 0.24 Cases covered by pathways
Japan,
Switzerland, South
Korea, Chile,
Netherlands,
Jamaica
Jordan, Mongolia,
Jamaica, Kyrgyzstan,
Switzerland,
Netherlands, South
Korea, Chile
Bahrain, Singapore,
United Arab Emirates,
Netherlands, Qatar,
Kuwait, Switzerland,
South Korea, Chile,
Jamaica
Solution formula
agr (ECOD * oil + oil * EXP * ECOD * EXP) -> PEACE
Solution cons.
0.93
Solution cov. 0.75
The first pathway combines low levels of agriculture and oil with high levels of economic
development, covering mainly advanced economies. The second pathway combines low
levels of agriculture and oil with high integration into the world economy, covering some
advanced economies (Switzerland, Netherlands, South Korea) as well as Jordan, Mongolia,
Jamaica, Kyrgyzstan and Chile. Finally, the third pathway covers many of the peaceful oil-rich
countries, which are those of interest here. This pathway combines high levels of economic
development with low levels of agriculture and high levels of exports. It is the high levels of
per capita income, which sets the oil-rich countries covered in this pathway apart from
countries with high levels of fuel exports that experienced conflicts such as Egypt or Algeria.
This supports the argument that high revenues explain peace in oil-rich countries. It also
highlights once again the importance of being integrated into the global economy.
Hvidt (2009), for instance, argues that its international orientation has helped one of the
United Arab Emirates, Dubai, to develop in the developmental paths of other entrepôt
economies such as Singapore. He argues that being integrated into the global economy
allowed Dubai to focus on international services, such as trade-related and communication
services, branding Dubai as a high-quality site for international businesses (Hvidt, 2009, p.
405). In addition, the international orientation allowed Dubai to import foreign workers with
the know-how needed at that moment in health care, transport, engineering, IT, etc (Hvidt,
2009, pp. 403 – 404). While oil revenues played an important role in facilitating this
development, for instance by allowing for the construction of transport infrastructure,
business parks and hotels, the development from a trading/pearling economy to a
D e v e l o p m e n t , D e p e n d e n c e a n d D i v e r s i f i c a t i o n 1 0 5
knowledge/service economy has benefitted greatly from the consistent focus on the global
economy. In this respect, its development is similar to Singapore, which is also a small city
state with a strong focus on the global economy. The development in both states is often
considered atypical as there is neither a strong agricultural orientation at the starting point
nor is there a shift to industries. Rather these “entrepôt” economies focus on a role as
intermediaries in the export of primary commodities produced in the region and the regional
and world markets (Haggard, 1990, p. 26). The developmental success of Dubai, spurred on
by oil revenues, has greatly contributed to internal political stability as it allowed the
government to provide low-cost, high-quality services and subsidies in many areas, such as
education, health, transport and accommodation. However, an entrepôt model of
development does not necessarily lead to political stability. Djibouti, for instance, which is
also a rather small state with strategic position that makes it a natural intermediary for
primary products exported by Ethiopia, has neither developed in the same way, nor has it
remained peaceful. This shows that high dependence on the global economy can contribute
to a high level of development, which then contributes to peace but that this is not necessarily
the case.
Diversification
A high level of economic diversification is expected to contribute to peace as it lowers
vulnerability to world market prices of very few products and in providing employment
opportunities that reduce dependence on agriculture. Looking at the analysis in Table 4.742
shows that there are two types of co.untries with a peace outcome in this sample, one
characterized by high levels of economic diversification and the other characterized by low
levels of diversification.
42 For the truth table, see Table C.21 in the appendix.
1 0 6 D e v e l o p m e n t , D e p e n d e n c e a n d D i v e r s i f i c a t i o n
TABLE 4.7. COMPLEX, INTERMEDIATE AND PARSIMONIOUS SOLUTION INCLUDING CONDITIONS AGR, DIV,
EXP AND OIL
Complex, intermediate and parsimonious solution
Outcome: Peace Conditions: AGR, DIV, EXP, OIL
Frequency threshold: 1.00 Consistency threshold: 0.89
Causal pathways agr * EXP * div agr * oil * DIV Consistency 0.91 0.93 Raw cov. 0.54 0.38 Unique cov. 0.39 0.23 Cases covered by pathways
Qatar, United Arab Emirates,
Kuwait, Turkmenistan,
Bahrain, Jamaica
Japan, Switzerland, Jordan, South
Korea, Chile, Kyrgyzstan, Armenia,
Cape Verde, Netherlands, Mongolia,
Lesotho
Solution formula agr (EXP * div + oil * DIV) -> PEACE Solution cons. 0.91 Solution cov. 0.78
The first pathway includes countries with low levels of agricultural dependence, high levels of
exports and low levels of economic diversification. In some cases the explanation for the low
level of economic diversification lies in the role of these cases as major exporters of natural
resources (e.g. Qatar, United Arab Emirates, Kuwait, Turkmenistan). However, this is not the
case for all countries covered by the solution and, in fact, when natural resources are included
instead of oil, the first pathway reads [agr * EXP], including neither a high level of natural
resources nor low levels of economic diversification43. This suggests that the low level of
economic diversification is less relevant than the combination of having few people depend
on agriculture for their livelihoods and being strongly integrated into the global economy.
The second pathway includes high levels of economic diversification combined with low levels
of oil and low levels of dependence on agriculture, describing a number of highly developed
countries (Japan, Switzerland and the Netherlands) but also some developing and transition
economies (Jordan, Chile, Kyrgyzstan, Armenia, Cape Verde, Mongolia and Lesotho). In fact,
this pathway combines low levels of economic dependence (on either oil or agriculture) and
high levels of diversification. This supports the earlier finding that economic dependence
plays an important role in explaining causes for conflict. It also shows that economic
diversification is more than a by-product of economic development as some of the countries
that have achieved high levels of economic diversification have not achieved high economic
development.
However, there are two countries covered by the second pathway (Kyrgyzstan and Lesotho)
that have experienced conflicts. Economic diversification is far from being a sufficient
condition on its own with many countries combining a high level of economic diversification
43 See Table C.22 and Table C.23 in the appendix.
D e v e l o p m e n t , D e p e n d e n c e a n d D i v e r s i f i c a t i o n 1 0 7
and a conflict outcome and many countries that combine low levels of economic
diversification and peace. In sum, the explanatory power of economic diversification seems
limited, in particular when compared to the role of economic dependence.
The analysis of the peace outcome shows two pathways that are sufficient for peace, which
both cover highly developed countries. The first pathway emphasises countries that are highly
integrated into the global economy while the second one covers only those highly developed
countries with low levels of oil. Both pathways support the strong relationship between
development and conflict in the literature. The first pathway including high levels of exports
also supports a link between trade and peace rather than trade and conflict.
DISCUSSION
The analyses in this chapter have supported the role economic dependence plays in
explaining conflict and peace in resource-scarce countries. There are three aspects of
economic dependence that stood out in both, the analysis of the peace and the conflict
outcome: dependence on agriculture, dependence on oil and dependence on the global
economy. Table 4.8 presents the most prevalent solutions of the analyses in this chapter. The
pathways presented for the conflict outcome are those that were shown to be particularly
robust to the inclusion of different conditions in Table 4.2 and that were included in all other
analyses. Similarly, the two prevalent pathways for the peace outcome are those that
repeatedly result from the analyses, even with the inclusion of different conditions. As can be
seen from, high dependence on agriculture contributes to a conflict outcome and low
dependence on agriculture contributes to peace. Oil presents a more complex picture as both
high and low levels of fuel contribute to conflict in different conditions and low levels of fuel
exports also contribute to peace. High dependence on exports (or high integration into the
world economy) contributes to peace and low levels contribute to conflict when combined
with high levels of oil.
TABLE 4.8. COMPARING CONDITIONS FOR CONFLICT AND PEACE OUTCOMES
Conflict Outcome Peace Outcome
Prevalent solution [AGR * oil] + [OIL * exp] [agr * EXP] + [agr * pov *oil]
Comparing the results of the analysis of conflict and peace outcomes shows an important role
for level of agriculture in both outcomes, suggesting that the level of people depending on
agriculture for their livelihoods is a strong indicator for the likelihood a resource-scarce
country will experience armed conflict. In contrast, the picture on economic development in
general is less clear cut, and while it is a necessary condition for armed conflict, it plays a
lesser role as a sufficient condition. This raises the question why so much focus of conflict
research has been devoted to how much income is generated in countries and much less to
how it is generated and, in particular, the role of subsistence agriculture.
While lack of economic development has often been discussed as a root cause for conflict,
the importance of the dependence on agriculture and how this affects resource-scarce
1 0 8 D e v e l o p m e n t , D e p e n d e n c e a n d D i v e r s i f i c a t i o n
countries in particular has been analysed far less. While agricultural dependence is mentioned
as an important factor in a number of qualitative studies (Farah et al., 2002; Oketch & Polzer,
2002; D. M. Schwartz & Singh, 1999; Howard & Homer-Dixon, 1996), it plays a lesser role in
quantitative studies. A study by Gleditsch and de Soysa (1999) find a strong link between
agricultural dependence and conflict, arguing that poverty and the resulting lack of
development is the missing link between dependence on agriculture and conflict. The results
of this study call this argument into question as it has been shown that solutions including
agriculture are more robust and have higher consistency scores than those not including
agriculture but poverty or economic development or both. Putting a focus on the role of
subsistence agriculture for conflict in environmentally vulnerable areas might help to give a
clearer picture.
As this study focuses on countries with low levels of freshwater or arable land or both, where
agriculture can be expected to take on a different role than in countries with an abundance
of these resources, this raises the question whether the argument that agriculture plays a
more important role than poverty or development will hold outside resource-scarce countries
as well. So far, there is little research on this question. Some studies assume agriculture to be
the link between environmental change or scarcity and conflict (e.g. Buhaug et al., 2008) but
this is not often tested empirically. Zhang et al. (2007, p. 19217) explicitly hypothesise
agricultural production as cooler periods are linked to a fall in agricultural production, which
then instigated conflicts. Hendrix and Glaser (2007) argue that the negative effects of inter-
annual variability in rainfall on conflict in Africa may be mitigated if agriculturalists were less
dependent on rain-fed agriculture. In contrast to those findings, de Soysa (2002a) found that
having a higher percentage of arable land in a country decreased the risk of conflict. Urdal
(2005) finds mixed results: while scarcity of potential cropland may have a pacifying effect,
the combination of land scarcity and high rates of population growth increases the likelihood
of internal conflict. However, both findings are not very robust.
The results also show the impact of being integrated into the global economy. While there
are theoretical arguments linking trade openness to both and increase and a decrease in
conflict, my results support the arguments that being highly integrated into the global
economy is part of a sufficient solution for peace, not conflict. This in line with liberal
arguments (based on modernization theory), which provide two theoretical explanations for
this. Firstly, as conflict disrupts trade, countries with high levels of exports have high
incentives to solve conflicts peacefully. Secondly, trade leads to economic growth and
development, which is strongly linked to a decrease in the risk of conflict and strong
democratic institutions, which in turn are also linked to a decrease in the risk of conflict
(Krause & Suzuki, 2005a). This is supported by a number of studies that find that trade
openness is linked to a reduction in conflict (Barbieri & Reuveny, 2005; de Soysa, 2002b;
Krause & Suzuki, 2005a). However, Magee and Massoud (2011, p. 60) question this argument
as they argue that “the negative correlation between openness and conflict arises primarily
because internal conflict causes a decline in openness rather than because higher levels of
D e v e l o p m e n t , D e p e n d e n c e a n d D i v e r s i f i c a t i o n 1 0 9
openness reduce conflict”. Civil wars deflate trade by up to an third (Bayer & Rupert, 2004)
and trade levels remain low even decades after the conflict (P. Martin, Mayer, & Thoenig,
2008). However, in this study, data on export levels are taken from the year prior to the
conflict start in order to avoid this kind of reverse causality. Therefore, my results support an
effect of trade on conflict and not vice versa. It is possible, though, that trade levels drop even
in years prior to the conflict in anticipation to the conflict.
Regarding the impact of natural resources on conflict, it has been shown that the impact of
fuel exports is conditional on the level of exports, with a symmetric logic. Where countries
combine high fuel exports with low general levels of exports, they experience conflict. Where
they combine high levels of fuel exports with high overall export levels, they do not. One
explanation for this is the role of fuel revenues in the local political economy. In addition,
where low levels of fuel exports are combined with low dependence on agriculture and
poverty, they contribute to peace. This is in line with the mixed empirical evidence in the
wider conflict-studies literature. Whereas Collier and Hoeffler (2004) argue that there is a
quadratic relationship between natural resources and civil war, Fearon (2005) argues that the
relationship is log-linear instead. Collier and Hoeffler (2004) explain the inverted U-shape as
the argument that governments with very high levels of resource revenues can buy off their
opponents, contributing to a stable political environment. They argue that the risk of
dependence upon primary commodity exports is at its highest when exports constitute
around 25% of GDP. Yet, not all studies support this resource curse hypothesis:
Brunnschweiler and Bulte (2009, 670) differentiate between resource wealth and resource
dependence and find that – contrary to the key argument of resource curse theories –
resource wealth lowers the risk of conflict as it brings new income. The results of this analysis
show that fuel exports do not necessarily contribute to conflict in resource-scarce countries.
It is only where countries are not integrated into world markets that high percentages of fuel
exports are sufficient for conflict, which supports the argument that the income of fuel
exports contribute to peace over a variety of mechanisms as the income is higher, which raises
the opportunity cost for rebellion, improves the provision of public goods and increases the
effectiveness of those in power to quash rebellions (Azam & Mesnard, 2003; B. Smith, 2004).
This supported by the finding that countries remain peaceful when they are integrated into
the world economy and not dependent on agriculture.
CONCLUSION
This chapter has taken as a starting point economic conditions that mediate the relationship
between a lack of freshwater and arable land and conflict. Conditions that have been
mentioned in case studies of resource conflicts and conditions from the larger conflict
literature were summarised under three explanations for conflict concentrating on
development, dependence and diversification. In separate analyses of conflict and peace
outcomes, I showed that it is the least developed countries that experienced conflict while
the highly developed countries remained peaceful. Integration into the global economy is
1 1 0 D e v e l o p m e n t , D e p e n d e n c e a n d D i v e r s i f i c a t i o n
sufficient for peace when combined with low levels of agricultural dependence and oil is
sufficient for conflict only when combined with low integration into the global economy.
D i m e n s i o n s o f S t a t e C a p a c i t y 1 1 1
Chapter 5: POLITICAL EXPLANATIONS: DIMENSIONS OF STATE CAPACITY
INTRODUCTION
Economic explanations of conflict frequently focus on the opportunities to rebel (e.g. Collier
& Hoeffler, 2004), which was reflected in the argument on economic conditions in chapter 4.
The flipside of the ability to rebel is the ability of the state to prevent or repress conflict or
rebellion. The state can either accommodate grievances by, for instance, institutionalising
economic redistribution, conferring autonomy rights to separatist groups and allowing the
representation of dissenting groups in the political system or the state can repress attempts
at rebellion by force. Both avenues require the state to have capacities, either institutional or
military (Hendrix, 2010, p. 273).
This chapter focuses on various dimensions of state capacities that are frequently mentioned
in case studies of resource-scarce countries or the larger conflict literature. I review
arguments focusing on administrative capacity and capacity for tax collection, secure land
access, the quality of judicial institutions, neopatrimonial states and regime types and build
hypotheses based on these theoretic arguments. I test these hypotheses using a fuzzy-set
qualitative comparative analyses (fsQCA) of 30 cases with low levels of freshwater or arable
land (see chapter 3 for details on research method and case selection). This analysis finds
support for arguments that neopatrimonialism is sufficient for conflict and that the
combination of low corruption levels and high levels of the rule of law is sufficient for peace.
DIMENSIONS OF STATE WEAKNESS
State weakness is a key term in many accounts of resource scarcity theorists and in the conflict
literature at large. However, there are few agreed-upon definitions of weak states. Weak
states are hard to distinguish from other related terms such as failed states or low state
capacities. As case studies including arguments concerning weak states focus on very
different aspects of weak states (e.g. insufficient security of land access, insufficient judicial
institutions, corrupt institutions), concentrating on state capacities rather than weaknesses
allows me to differentiate between these different dimensions of state capacities. A weak
state is then defined as a state with low capacities. State capacities can focus on very different
aspects, such as military capacity, bureaucratic and administrative capacities and political
institutional coherence and quality (for a review see: Hendrix, 2010).
Explanations of conflict often centre on state weakness, in particular in case studies of
resource-scarce cases. Explanations with state weakness as an intermediate factor focus on
situations where the state “does not have the resources to create legitimacy by providing
security and other services. In its attempt to find strength, it adopts predatory and
kleptocratic practices or plays upon and exacerbates tensions between the myriads of
communities that make up the state” (Holsti, 1996, p. 117). In resource-scarce cases,
increasing problems due to mounting environmental scarcity lead to higher demands on the
1 1 2 D i m e n s i o n s o f S t a t e C a p a c i t y
state, for instance for development projects to mitigate the social effects of degradation and
resource loss and the social demands resulting from rural-to-urban migration, such as
housing, employment, transport and energy (Homer-Dixon, 1994, 25). In addition, declining
productivity due to environmental issues leads to decreasing revenues of the state, further
placing limits on state capacities. This widening gap between demands placed on and
revenues available to the state breeds discontent (Homer-Dixon, 1994, p. 25). Limits on the
revenue of the state also affect the pay of the military and thereby the state’s coercive power.
This lack of coercive power can result in a concentration of power in warlords competing for
authority in the state (Kahl, 2002, 261).
Some authors have criticized this strong focus on capacities of the state and argued that more
attention needs to be paid to the structure of society and in particular state-society relations.
The demarcation between the state and society is often not as clear-cut as many social
theories argue as the state’s organisations are social forces among many in the struggle for
domination in society (Migdal, 2001, p. 128). Migdal (2001, p. 100) for instances argues that
too much focus is placed on the top position in states but that the
struggles for domination take place in multiple arenas in which the parts of the state are
related not only to one another but each is a single social force in a field of interacting, at
times conflicting, social forces. The individual parts of the state may respond as much (or
more) to the social field in which they operate – the other social forces in the arena – as they
do to the rest of the state organization.
Conflicts occur in the junctures between state and society and in a multitude of arenas. The
various struggles and conflicts serve to shape the state-society relations. In cases where
neither the state nor any other social force has achieved domination, conflict between
different groups and interests occur, sometimes violently (Migdal, 2001, 129). Percival and
Homer-Dixon (1998, 281) argue that the type of state-society relations is particularly relevant
in situations of resource scarcity where dwindling resources increase the pressure on all social
forces and thus the likelihood for violence. The type of state-society relation that is most
prominent in the case study is neopatrimonialism, where no differentiation between public
and private spheres exists and patron relations are used to organize society. Access to
resources is of particular importance in neopatrimonial states, where resources are often a
power base for the elite. These arguments are more fully explored later in this chapter.
In the following, I focus on those aspects that are particularly prominent in the case study
literature. Case studies focusing on the role of the state circle around the concepts of weak
states, yet describe different dimensions of the concept of a weak state. From the case study
literature and evaluated against the wider conflict literature, the dimensions included in this
analysis are bureaucratic and administrative capacity, capacity to collect taxes,
neopatrimonialism, judicial institutions and land access. I am not including military capacities.
Defining state capacity in terms of military capacity goes back to the Weberian definition of
the state that “claims the monopoly of the legitimate use of physical force within a given
D i m e n s i o n s o f S t a t e C a p a c i t y 1 1 3
territory” (Gerth & Mills, 1991, p. 78). Common operationalisations include military personnel
per capita (e.g. Buhaug, 2010b; de Rouen & Sobek, 2004; Mason, Weingarten, & Fett, 1999)
and military spending per capita (e.g. Henderson & Singer, 2000). While the conflict literature
frequently employs this dimension of state capacity, it is rather endogenous to the outcome
I am interested in, since countries experiencing conflicts have greater incentives to spend
money on their military capacities and build up their armies. I will review theoretic arguments,
quantitative evidence and the evidence given in case studies in resource-scarce countries. The
hypotheses I formulate also build the foundation for the theoretical assumptions for
intermediate solutions44.
ADMINISTRATIVE CAPACITY AND CAPACITY FOR TAX COLLECTION
A common focus is on bureaucratic or administrative aspects of the state, also going back to
Weber and his argument that the legitimacy of the state can be vested in a legal-rational
bureaucracy. This bureaucracy must then have the capacity to collect and analyse information
and be protected from special interest influences in recruitment (Hendrix, 2010, p. 275). This
is linked to Mann’s notion of infrastructural power, defined as the “capacity of the state to
actually penetrate civil society, and to implement logistically political decisions throughout
the realm” (M. Mann, 1986, p. 113). The bureaucratic capacity of the state includes a coercive
dimension in monitoring and controlling its population as well as the capacity for service
delivery. The controlling capacity of the state needs an effective bureaucracy to collect,
analyse and disseminate information. Providing services (e.g. education or health services) to
citizens also requires an effective bureaucracy and high levels of service delivery lowers the
risk of war (Thyne, 2006).
Closely linked to this is the operationalisation of bureaucratic capacity in terms of its revenue-
generating capacities. Going back to Weber’s (Gerth & Mills, 1991, p. 78) definition of the
state as a “human community that (successfully) claims the monopoly of the legitimate use
of force within a given territory”, the argument is that generating funds is necessary for an
effective state. This is based on the argument that it is the need of funds to wage large-scale
wars that led to the development of political institutions capable of extracting funds from the
population (Tilly, 1992). The ability of the state to collect taxes, in particular, has been seen
as the best measure of the state’s reach (Herbst, 2000, p. 113) as a “state’s means of raising
and deploying financial resources tell us more than could any other single factor about its
existing (and immediately potential) capacities to create or strengthen state organizations, to
employ personnel, to co-opt political support, to subsidize economic enterprises, and to fund
social programs” (Skocpol, 1985, p. 17). In this analysis, I include conditions capturing the tax
capabilities of the state (TAX) and the quality of the political institutions (PIN).
H 1: Countries with high capabilities to tax remain peaceful. Thus, high capabilities to tax are
a sufficient condition for peace.
44 For an overview of these theoretic assumptions, see Table D.1 in the appendix.
1 1 4 D i m e n s i o n s o f S t a t e C a p a c i t y
H 2: Countries with high-quality political institutions remain peaceful. High-quality political
institutions are a sufficient condition for peace.
LAND ACCESS
Issues of land access and land tenure are frequently seen as a source of tension, making land
tenure systems and judicial institutions that uphold these regimes an essential element in
preventing violence (Maxwell & Reuveny, 2000; Zimmermann, 2011, p. 119). Failed or weak
states lack adequate judicial institutions that can mitigate conflicts arising over scarce
resources. This is particularly relevant in situations where the groups are organized around
social cleavages and perceive or experience a government deficit as this situation can easily
be exploited (Ejigu, 891). Undermining traditional institutions for managing conflicts (e.g. the
intervention of elders of religious leaders) can also contribute to conflict (Ejigu, 892). Different
aspects of land are highlighted: Homer-Dixon (1999, p. 116) argues that a lack of clear
property rights can lead to overexploitation of open-access resources and thus increase
scarcity (and the risk for conflict). Kahl (2008, p. 38) focuses on the inequality of land access,
arguing that this combined with resource scarcity can lead to grievances over absolute or
relative deprivation and, as a result, conflict. In Kenya, for instance, land distribution was
highly unequal prior to the 1990–1995 ethnic clashes as large farms owned about 70% of the
land but represented only 0.14% of the number of small farm landowners, which led to great
land scarcity for small farm owners. In addition, as a result of policies reaching back to colonial
times, land tenure was often insecure and contested between different ethnic groups. In
particular, the Kalenjin elite (the ethnic group of president Daniel ArapMoi) employed land
grievances to instigate violence and forcefully remove other ethnic groups, who had settled
during late colonial times and early independence in Rift Valley areas, which the Kalenjin
considered their land (Kahl, 2008, pp. 130 – 131, 140 – 148). Insufficient land rights and
difficulties in aligning traditional and modern land rights are also frequently mentioned in
case studies (e.g. Adano, Dietz, Witsenburg, & Zaal, 2012; Benjaminsen et al., 2012; Butt,
2012). For instance, in the inland delta of Niger river in Mali, titled land rights often clash with
traditional pastoral land tenure, which has much weaker legal standing, leading to conflicts
about livestock corridors being blocked by agricultural expansion and encroachment on burgu
pastures for rice cultivation (Benjaminsen et al., 2012, pp. 102 – 103). This clash between
traditional and codified property rights regimes is common to many newly independent
countries (Ostrom, 2000, p. 336). These arguments lead to the inclusion of land access (LACC)
as a condition and the following hypothesis:
H 3: Countries with low levels of secure land access experience conflict. Thus, low levels of
access to land are a sufficient condition for conflict.
JUDICIAL INSTITUTIONS
Judicial institutions and the rule of law have also been considered an important dimension of
state strength. This originates with the argument that the enforcement of private property
protection leads to economic growth as it provides incentives to invest (North, 1981). For
D i m e n s i o n s o f S t a t e C a p a c i t y 1 1 5
instance, the rise of the British empire has been explained by the protection of private
property, which led to wealth and, ultimately, increased funds for the monarch (North &
Weingast, 1989). For effective protection of private property rights, state capacity is needed
as a set of rules determining the rights needs to be enforced, including cadastral knowledge
and institutions that mediate conflicts. However, whether private property regimes are
always more efficient and, more generally, whether private and common property regimes
can be strictly separated has been heavily debated (Ostrom, 2000).
However, the theoretical arguments focusing on the importance of strong judicial systems go
beyond the issue of property protection as an effective judiciary is the “central prerequisite
for dealing with conflicts in an institutionalised manner” (Debiel, 2002, p. 10). Therefore, an
effective judicial system and the rule of law in general are often missing in crisis states. This
is closely linked to the concept of human security as the judiciary as third power is tasked with
keeping the individual safe within the state, thereby providing human security (Heintze, 2002,
p. 58). The empirical conflict studies literature has overwhelmingly focused on more general
aspects of the political system, so there is little conclusive research on the impact of judicial
institutions on the risk for conflict (Salehyan, 2008, p. 321). However, the concept has been
employed frequently by the economic growth literature to show a positive impact of the rule
of law on economic growth and development (Haggard, MacIntyre, & Tiede, 2008) and
therefore to a lower conflict risk as development and growth are negatively linked to conflict.
In resource-scarce cases, however, the impact of effective judicial institutions is much greater
as a lot of conflict potential (such as conflicts over land or access to water) falls within the
jurisdiction of judicial institutions and could be resolved in courts. Therefore, the importance
of modern and effective judicial institutions has been emphasized in case studies. For
instance, in a case of pastoral conflict in Kenya’s drylands Adano et al. (2012, p. 76) argue that
“the present [peaceful] status quo could not have been reached without a modern judicial
institution”. Following these arguments, I include the condition rule of law (ROL) and the
following hypothesis:
H 4: Countries with high levels of rule of law remain peaceful, thus high levels of rule of law
are a sufficient condition for peace.
NEOPATRIMONIAL STATES
The notion of patrimonialism goes back to Max Weber’s three types of domination (legal,
traditional and charismatic). Under traditional authority, “obedience is owed not to enacted
rules but to the person who occupies a position of authority by tradition or who has been
chosen for it by the traditional master” (Weber, 1978, p. 227). In patrimonial systems, as one
form of traditional authority, power relations are personal between the ruler and the ruled
and there is no separation between the public and private domain. Patronage refers to
patron-client relations, where favours or goods are distributed to certain client groups that
have a (for instance ethnic) relationship with the patron.
1 1 6 D i m e n s i o n s o f S t a t e C a p a c i t y
Neopatrimonialism refers to hybrid systems that combine patrimonial and legal-rational
bureaucratic systems. It most often refers to African states, where it is rooted in colonial
legacies. During colonial times, the legal-rational system was centred in the colonial capital,
where it mostly applied to Europeans, whereas indirect rule via traditional authority applied
to many colonial states. After independence, this often resulted in a bureaucratic system that
is invaded by informal relationships. While private and public domain are formally separate,
this is often not observed as legal and patrimonial logics co-exist (Erdmann & Engel, 2007, pp.
105 – 106).
As a concept, (neo)patrimonialism has been criticized as “elusive” (Erdmann & Engel, 2007),
“catch-all” (Theobald, 1982, p. 555) and “contested” (deGrassi, 2008). Patrimonialism and
neopatrimonialism are applied to a variety of different cases and for a variety of purposes,
resulting in conceptual stretching (Pitcher, Moran, & Johnston, 2009). In a review of the
literature, Pitcher, et al. (2009, p. 131) find four different applications of the concept to mean
a) a set of social relations, mediated by personal loyalty and governed by bonds of
dependence and subordination;
b) the rent-seeking behaviour and personalist patterns of authority in selected country
settings;
c) an economic logic characterised by the blurring of public service and private gain and
d) a characteristic regime type associated with most African countries.
Both, the wide array of cases that are characterized as neopatrimonial and the different
applications of the term make it difficult to pinpoint the exact meaning of the term.
Nevertheless, the term is frequently employed in the case study literature on conflicts over
resource scarcity, which is why it is included here. Following the arguments in case studies
(see below) I focus on situations which combine authoritarianism, corruption and a lack of
legal order and call countries that exhibit all these characteristics neopatrimonial.
In case studies of resource scarcity, the focus is often on the access and distribution of
resource and how access and distribution are negotiated. In corrupt systems, issues
concerning mainly disadvantaged groups are unlikely to be addressed, leading to grievances.
Neopatrimonialism is linked to conflict in state-centred mechanism, termed resource capture
by Homer-Dixon (1999, p. 74) and state exploitation by Kahl (2008, pp. 50 – 51), focusing on
the role of those in power. In a situation of scarce resources, elites are tempted to use their
power to secure their access to scarce or potentially scarce resources. By manipulating state
policies in their favour, they can limit access to resources to themselves and their supporters,
in particular those belonging to their own ethnic group. This weakens the institutions of the
state and state capacities and may contribute to social unrest or even spark conflict. Thus,
weak political institutions are combined with systems of patronage and ethnic exclusion in an
effort to exploit the state. Many case studies of conflicts in resource-scarce societies mention
D i m e n s i o n s o f S t a t e C a p a c i t y 1 1 7
corruption or patronage: Kenya (Kahl, 1998), Philippines (Kahl, 2008), Rwanda (André &
Platteau, 1998), Sudan (Suliman, 2008), Indonesia (Barber, 1998), Ethiopia (Flintan & Tamrat,
2002) and Burundi (Farah et al., 2002). Oketch and Polzer (2002, pp. 110 – 111) point to three
ways in which political corruption and the resulting predatory state were linked to violence in
Burundi: firstly, the political-military Tutsi elite that controlled the state used violence to gain
and maintain control over the state and its resources. Secondly, economic crises put elites
under pressure by weakening their position, which prompted violence. Thirdly, the resulting
pressure for economic and political reforms led elites to defend their influence by resorting
to violence.
Corruption is linked to both conflict and stability. There are three key processes linking
corruption to conflict: by increasing grievances, by increasing the availability of rents and by
undermining the institutionalised public affairs (Le Billon, 417 – 420). Grievances can be in the
economic realm, such as the negative impact of corruption on economic growth and on funds
available for public services. Corruption also serves to undermine the legitimacy of the leading
group. Where the leading group controls state funds, corruption increases the prize for
capturing the state, therefore incentivizing rebellion. Finally, corruption undermines
institutionalised public affairs, for instance, through the rigging of elections or the selling off
of political positions. Violence is a way to assert these interests in a meaningful way, in
particular in the absence of other conflict-resolution mechanisms. It has also been argued
that corruption acts to stabilise political economies and therefore pre-empts conflict as it acts
as an ordering force, for instance by buying off political opponents (Le Billon, 420). If all
relevant groups receive a share of the rent, there is little incentive for armed conflict, which
may end with the rebel groups losing their share. The specific characteristics of corruption in
the political economy determine whether corruption contributes to or prevents conflict.
Neopatrimonialism and corruption are closely linked to the arguments linking resource
dependence and conflict in the previous chapter, since it is often the rents of natural resource
extraction that are distributed in patrimonial systems. I will explore this in more detail in
chapter 7.
Three aspects of the neopatrimonial state that are included in this analysis: The first is the
authoritarian ruler, the second is the disregard for the rules and regulation of the legal-
rational bureaucracy and the final is corrupt practices in the distribution of the state’s
resources. I capture the first in a measure of authoritarianism (AUT), the second in the rule of
law (ROL) and the last in a measure of corruption (COR). The resulting hypothesis is:
H 5: Countries that experience a combination of authoritarianism and either lack of rule of law
or high corruption levels or both experience conflicts, thus authoritarianism, lack of rule of
law, and high corruption are INUS conditions45.
45 These conditions are insufficient, yet necessary parts of a solution that is not necessary but sufficient. See page 44 for more on INUS conditions.
1 1 8 D i m e n s i o n s o f S t a t e C a p a c i t y
REGIME TYPE
Regarding the influence of regime type on conflict, there are two main arguments. The first
one argues that democracies are inherently more peaceful than other regime types. The
second one argues that the mix of democratic and non-democratic elements in so-called
anocracies leads to political instability (Hendrix, 2010, p. 276). The liberal school of thought
put forward the argument that democracy is linked to internal peace, going back to Kant’s
arguments of the democratic peace. While Kant’s arguments originally refer to peace
between states, they have been applied to internal peace as well. For instance, Gurr (2000)
argues that democracies are better equipped to deal with heterogeneous societies, reducing
the risk for ethnic conflict. Empirically, the link between democracy and a lower risk of civil
war is judged to be rather weak (Collier & Hoeffler, 2004; Fearon & Laitin, 2003). There is,
however, support for a U-shaped relationship between regime type and civil war (Fearon &
Laitin, 2003; Hegre et al., 2001). The explanation for this is that in consolidated democracies
and established authoritarian regimes the likelihood of civil war breaking out is relatively low,
but in regimes in transition, civil war is more likely (Buhaug et al., 2008; Hegre & Sambanis,
2006).
In the case study literature on resource scarcity, authoritarian leadership has been credited
with contributing to the outbreak of armed conflict. For instance, Kelly and Homer Dixon
(1995) argue that Arafat’s authoritarian style has eroded the legitimacy of the Palestinian
Authority in the eyes of many people living in Gaza thus contributing to increasing grievances
against the Palestinian Authority and violence. Authoritarian rule has also been argued to be
a contributing factor in Indonesia (Barber, 1998), the Philippines (Kahl, 2008) and Kenya (Kahl,
1998). A study focusing on water resources found that democratic state institutions reduce
the likelihood of intrastate conflict. However, water scarcity makes establishing democratic
institutions more difficult, which means that countries experiencing water scarcity might be
caught in a trap of scarcity – autocracy – conflict (Gizelis & Wooden, 2010).
I am including a measure of authoritarianism (AUT) and of political stability (STAB) in this
analysis. This leads to two hypotheses. The first is based on the peaceful effect of democracy
and the second on arguments about curvilinear relationships between regime type and
conflict.
H 6: Countries with low levels of authoritarianism remain peaceful, thus a low level of
authoritarianism is a sufficient condition for peace.
H 7: Countries with high levels of political stability (either very democratic or very
authoritarian) remain peaceful, thus high levels of political stability are a sufficient condition
for peace.
OPERATIONALISATION AND CALIBRATION OF CONDITIONS
Following the theoretic arguments and hypotheses laid out above, the analysis includes seven
conditions: corruption (COR), capabilities to tax (TAX), high quality of political institutions
D i m e n s i o n s o f S t a t e C a p a c i t y 1 1 9
(PIN), rule of law (ROL), secure land access (LACC), authoritarian rule (AUT) and political
stability (STAB), Conditions are based on existing indicators and calibrated using the
“calibrate” function in the fsQCA software, which converts raw data into a score between
zero and one by applying the qualitative thresholds set out below. Data for conflict cases are
taken from the year prior to the conflict outbreak in order to avoid reverse causalities. For
peaceful cases, the average over the period was used to reduce the impact of short-term
events such as economic shocks or elections. Where data from the previous year is not
available, I use the closest available data46.
Corruption (COR)
I employ the World Bank’s Control of Corruption indicator, which captures “perceptions of
the extent to which public power is exercised for private gain” (World Bank, 2012c).
Unfortunately, data are only available from 1996 onwards, which means there is a danger of
reverse causality effects in some of the countries (post-conflict countries being more corrupt).
The nature of corruption makes measuring it or estimating it on a country-by-country basis a
very difficult task. I use the World Bank’s indicator as it provides sufficient coverage of the
countries in my sample and the definition focusing on corruption in public institutions are
more closely linked to the theoretical arguments focusing on neopatrimonialism than some
other indicators. Countries are scored between -2.5 and 2.5 with higher values representing
less corruption. I keep the crossover point of 0 as it is established in the dataset and then
calibrate countries as fully within the set of countries experiencing corruption if the
corruption index is -1.0 or lower and as fully out of the set of corrupt countries if it is 1.0 or
higher. This is supported by case knowledge as it puts five countries fully out of the set of
corrupt countries (Switzerland, Netherlands, Singapore, Chile and Japan) and seven fully in
the set of corrupt countries (Kenya, Uzbekistan, Haiti, Kyrgyzstan, Pakistan, Turkmenistan and
Burundi).
Tax Capabilities (TAX)
Bureaucratic or administrative capacity operationalises the strength of state by the abilities
of its bureaucracy. Bureaucratic quality is either measured directly using surveys and expert
assessments (e.g. de Rouen & Sobek, 2004; Fearon, 2005) or by focusing on revenue-
generating capacities. Various operationalisations of this perspective of state strength have
been employed, including the government’s share of total GDP, total state revenue as a
percentage of total GDP, total tax revenue as percentage of GDP and the actual level of tax
extraction compared to a predicted level of extraction (Thies, 2010). I employ the percentage
of total taxes as a percentage of the GDP. This is based on the argument that stronger states
are able to extract more money from their citizens. There are a number of criticisms of this
measure, such as that the same level of taxes can be based on different capabilities by the
state, in particular in resource-rich economies, where states do not need to collect much tax
46 Table D.2 and Table D.3 present all raw and calibrated data as well as the years the data was taken from. Where no data were available, the these data were estimated using other sources. Details of these sources are given in the footnotes of the tables.
1 2 0 D i m e n s i o n s o f S t a t e C a p a c i t y
revenue. This is clearly a factor in this sample of countries where the top three spots of
countries with low tax capacities are occupied by the United Arab Emirates, Kuwait and
Bahrain. On the other hand, the measure has the benefit of being based on the clear theoretic
argument that states need to generate revenues to pursue any goals and has been shown to
capture the significant factors of state capacity better than most other measures (Hendrix,
2010). Data come from the World Bank’s World Governance indicators (2013a) and
calibration is based on gaps in the data. Countries are calibrated as fully in the set of countries
with high levels of tax collection with a tax percentage of GDP of 30% or more. This separates
Jamaica (25%) from Algeria (39%). Countries are calibrated as being fully out of the set with a
tax collection capacity of 5% or less separating Bahrain (4%) and Bhutan (8%). Finally, the
crossover threshold is set at 12 percent, separating Japan (10%) and Pakistan (13%).
High Quality of Political Institutions (PIN)
To measure the quality of political institutions, I am using the civil liberties index of Freedom
House Index, which includes a measurement of the rule of law to measure the quality of
political institutions. While the Freedom House Index has met a lot of criticism (Giannone,
2010; Munck & Verkuilen, 2002), such as its Western and more particularly, neo-liberal, bias,
there are, unfortunately, very few indicators that span the entire time frame and a global
sample. Freedom House categorizes countries as “free” where their score is between 1 and
2.5, as partly free between 3 and 5 and as not free between 5.5 and 7. I follow the
categorizations since they are based on qualitative assessments and use 5.5 as threshold for
fully in the condition of high quality of political institution and 2.5 as threshold for fully out.
For the crossover threshold, I avoid using the 4 as this would leave seven cases coded as
neither in nor out, which should be avoided (C. Q. Schneider & Wagemann, 2012, p. 101).
Instead, the crossover point is set at 4.1 based on case knowledge.
Rule of Law (ROL)
Rule of Law is based on the rule of law indicator of the World Bank’s World Governance
Indicators, capturing the “perceptions of the extent to which agents have confidence in and
abide by the rules of society, and in particular the quality of contract enforcement, property
rights, the police, and the courts, as well as the likelihood of crime and violence” (World Bank,
2013b). This definition shows a drawback of this indicator, which largely focuses on neo-
liberal aspects such as contract enforcement and property rights. However, as the rule of law,
and in particular property rights, are frequently mentioned in case studies, this indicator is
included here. Unfortunately, the period covered by the dataset is limited to 1996 and later,
which means there is a danger of reverse causalities. The dataset scores countries from -2.5
to 2.5. The crossover threshold is set at zero as this spreads the countries across the spectrum,
splitting them between Mongolia (- 0.14) and Egypt (0.11). Countries are calibrated as being
fully in the set of countries with high levels of rule of law with a score of one or above.
Countries are calibrated as fully out of the set with a score of minus one or below, which is in
line with case study knowledge. This leaves 16 countries more out than in the set of countries
with high levels of the rule of law with seven fully out of the set (Rwanda, Haiti, Kyrgyzstan,
D i m e n s i o n s o f S t a t e C a p a c i t y 1 2 1
Turkmenistan, Algeria, Yemen and Kenya) and 14 countries more in than out of the set of
countries with high levels of the rule of law with five fully in the set (Chile, Japan, Singapore,
Netherlands, Switzerland).
Secure Land Access (LACC)
The measure for land access is based on the IFAD (International Fund for Agricultural
Development) access to land indicator and data collected for their performance-based
allocation system (IFAD, 2005, pp. 6 – 12, 2006, pp. 2 – 14, 2007, pp. 7 – 11, 2010, pp. 7 – 17).
The indicator assesses “the existence of an institutional, legal and market framework for
secure land tenure” (IFAD, 2003, p. 6). The period covered by this indicator is limited to 2004
to 2010, which presents a danger for reverse causalities. However, as few detailed
information on land access, in particular for vulnerable groups, is available and as the issue of
land access is of great importance for theoretical linkages between resource scarcity and
armed conflict, this is included. The indicator ranges from one to six, with the majority of
countries scoring between three and five. In accordance with the definition of a score of three
as access being often insecure and vulnerable groups being excluded frequently, this is taken
as threshold for fully out of the set of countries with secure and equal land access. On the
other end, of the spectrum, a score of five includes land access mechanisms for rural poor
households, including vulnerable groups (e.g. women, indigenous groups) as well as secure,
equal and enforceable land rights and working land markets. This is taken as threshold for
fully in the set of land access. The crossover threshold is set of four, where there is some
access to land and land markets are working to some degree.
Authoritarian Regimes (AUT)
The measurement for authoritarian regimes is based on the Polity IV dataset (Marshall,
Jaggers, & Gurr, 2011), which codes countries from -10 (fully autocratic) to 10 (fully
democratic). I follow the coding rules of the dataset as it differentiates between democracies,
anocracies and autocracies and this reflects the theoretical arguments on regime type
reviewed above. Therefore, I have set the threshold for fully in the set of authoritarian
regimes at -6, the crossover threshold at 0 and the threshold to fully out of the set of
authoritarian regimes at 6.
Political Stability (STAB)
The measure of regime stability is based on the argument that full democracies as well as fully
authoritarian regimes are stable over time, while the countries in between (anocracies) are
not. Therefore political stability is based on the same dataset as authoritarian regimes.
Countries are now scored from 10 (fully authoritarian regimes and full democracies) to 0
(completely anocratic). In accordance with the coding rules of the data set, the crossover
threshold is set at 6, the threshold to be fully stable is set at 8 and the fully out threshold at
4, which is based on case knowledge.
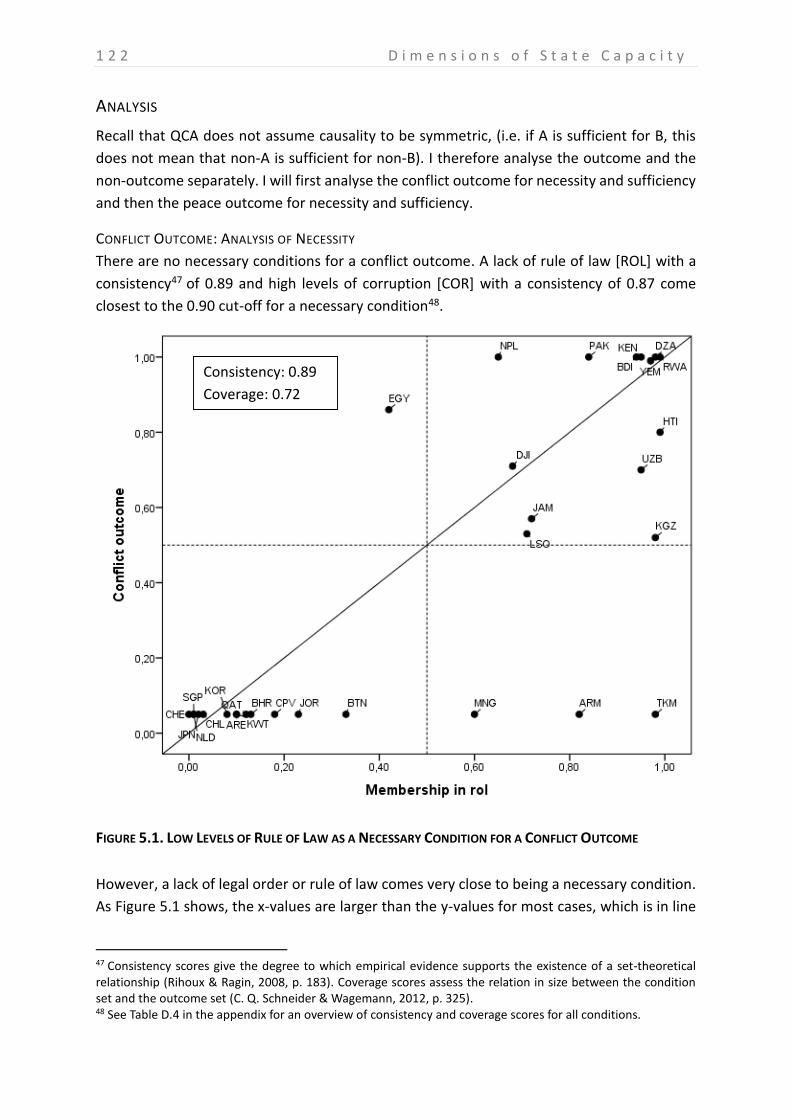
1 2 2 D i m e n s i o n s o f S t a t e C a p a c i t y
ANALYSIS
Recall that QCA does not assume causality to be symmetric, (i.e. if A is sufficient for B, this
does not mean that non-A is sufficient for non-B). I therefore analyse the outcome and the
non-outcome separately. I will first analyse the conflict outcome for necessity and sufficiency
and then the peace outcome for necessity and sufficiency.
CONFLICT OUTCOME: ANALYSIS OF NECESSITY
There are no necessary conditions for a conflict outcome. A lack of rule of law [ROL] with a
consistency47 of 0.89 and high levels of corruption [COR] with a consistency of 0.87 come
closest to the 0.90 cut-off for a necessary condition48.
FIGURE 5.1. LOW LEVELS OF RULE OF LAW AS A NECESSARY CONDITION FOR A CONFLICT OUTCOME
However, a lack of legal order or rule of law comes very close to being a necessary condition.
As Figure 5.1 shows, the x-values are larger than the y-values for most cases, which is in line
47 Consistency scores give the degree to which empirical evidence supports the existence of a set-theoretical relationship (Rihoux & Ragin, 2008, p. 183). Coverage scores assess the relation in size between the condition set and the outcome set (C. Q. Schneider & Wagemann, 2012, p. 325). 48 See Table D.4 in the appendix for an overview of consistency and coverage scores for all conditions.
Consistency: 0.89
Coverage: 0.72
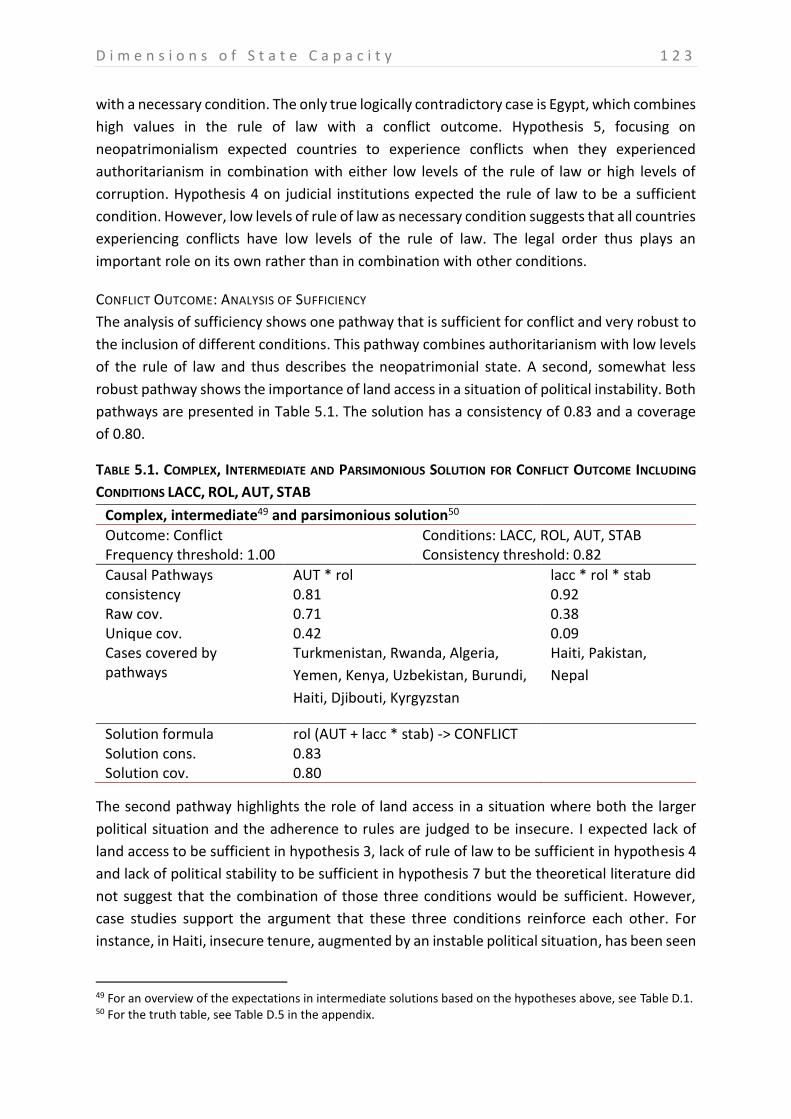
D i m e n s i o n s o f S t a t e C a p a c i t y 1 2 3
with a necessary condition. The only true logically contradictory case is Egypt, which combines
high values in the rule of law with a conflict outcome. Hypothesis 5, focusing on
neopatrimonialism expected countries to experience conflicts when they experienced
authoritarianism in combination with either low levels of the rule of law or high levels of
corruption. Hypothesis 4 on judicial institutions expected the rule of law to be a sufficient
condition. However, low levels of rule of law as necessary condition suggests that all countries
experiencing conflicts have low levels of the rule of law. The legal order thus plays an
important role on its own rather than in combination with other conditions.
CONFLICT OUTCOME: ANALYSIS OF SUFFICIENCY
The analysis of sufficiency shows one pathway that is sufficient for conflict and very robust to
the inclusion of different conditions. This pathway combines authoritarianism with low levels
of the rule of law and thus describes the neopatrimonial state. A second, somewhat less
robust pathway shows the importance of land access in a situation of political instability. Both
pathways are presented in Table 5.1. The solution has a consistency of 0.83 and a coverage
of 0.80.
TABLE 5.1. COMPLEX, INTERMEDIATE AND PARSIMONIOUS SOLUTION FOR CONFLICT OUTCOME INCLUDING
CONDITIONS LACC, ROL, AUT, STAB
Complex, intermediate49 and parsimonious solution50
Outcome: Conflict Conditions: LACC, ROL, AUT, STAB Frequency threshold: 1.00 Consistency threshold: 0.82
Causal Pathways AUT * rol lacc * rol * stab consistency 0.81 0.92 Raw cov. 0.71 0.38 Unique cov. 0.42 0.09 Cases covered by pathways
Turkmenistan, Rwanda, Algeria,
Yemen, Kenya, Uzbekistan, Burundi,
Haiti, Djibouti, Kyrgyzstan
Haiti, Pakistan,
Nepal
Solution formula rol (AUT + lacc * stab) -> CONFLICT Solution cons. 0.83 Solution cov. 0.80
The second pathway highlights the role of land access in a situation where both the larger
political situation and the adherence to rules are judged to be insecure. I expected lack of
land access to be sufficient in hypothesis 3, lack of rule of law to be sufficient in hypothesis 4
and lack of political stability to be sufficient in hypothesis 7 but the theoretical literature did
not suggest that the combination of those three conditions would be sufficient. However,
case studies support the argument that these three conditions reinforce each other. For
instance, in Haiti, insecure tenure, augmented by an instable political situation, has been seen
49 For an overview of the expectations in intermediate solutions based on the hypotheses above, see Table D.1. 50 For the truth table, see Table D.5 in the appendix.
1 2 4 D i m e n s i o n s o f S t a t e C a p a c i t y
as a factor contributing to conflict. While land distribution was relatively equal following
independence, population growth, severe environmental degradation and insufficient land
tenure system has led to problems in land access (Dolisca, 2005, pp. 21 – 25). The unstable
political situation has contributed to this: ”These processes might have been prevented had
a stable central government invested in agriculture, industrial development, and
reforestation. Instead, since independence Haiti has endured a ceaseless struggle for power
between black and Mulatto classes, and the ruling regimes have been solely interested in
expropriating any surplus wealth the economy generated” (Homer-Dixon, 1994, p. 34).
Haitian peasants have been excluded from the national political system historically, and
service delivery in rural areas is bad. In addition, the judicial system is weak and most peasants
have no opportunities to appeal to courts. Smucker et al. (2002, p. 11) report that there are
no courts in the 565 rural sectional jurisdictions and few courts are authorized to decide in
land disputes. This shows how a weak judicial system, an instable political system, insecure
land access due to environmental degradation, population growth and insufficient tenure and
economic insecurity combine to form a highly vulnerable situation, which increases the risk
for conflict (Smucker et al., 2002). Economic insecurity links this argument back to the
influence on dependence on agriculture that was discussed in the previous chapter.
The first pathway combines authoritarian rule and low levels of the rule of law, which is in
support of arguments focusing on neopatrimonialism, combining an authoritarian ruler and a
disregard for the rules of the legal-rational bureaucracy as expected in hypothesis 5. Figure
5.2 shows the first pathway as a sufficient combination of conditions. The x-axis shows the
membership in the sufficient pathway [AUT * rol], so the cases on the right-hand side are
those that combine authoritarian rule and low levels of the rule of law. The y-axis shows the
membership in the conflict outcome, so cases in the top half are those with a conflict
outcome. For a sufficient condition, the membership score in the condition should be lower
than the membership score in the outcome, i.e. cases should lie above the bisector. In this
case, this is mostly the case. Most countries are above or relatively close to the bisector. The
one exception to this is Turkmenistan, which combines a very high membership in the
condition but has not experienced a conflict. This makes Turkmenistan a true logically
contradictory case. Two likely explanations for this – differences in soft and hard
neopatrimonialism and the role of natural resource revenues – are discussed below.
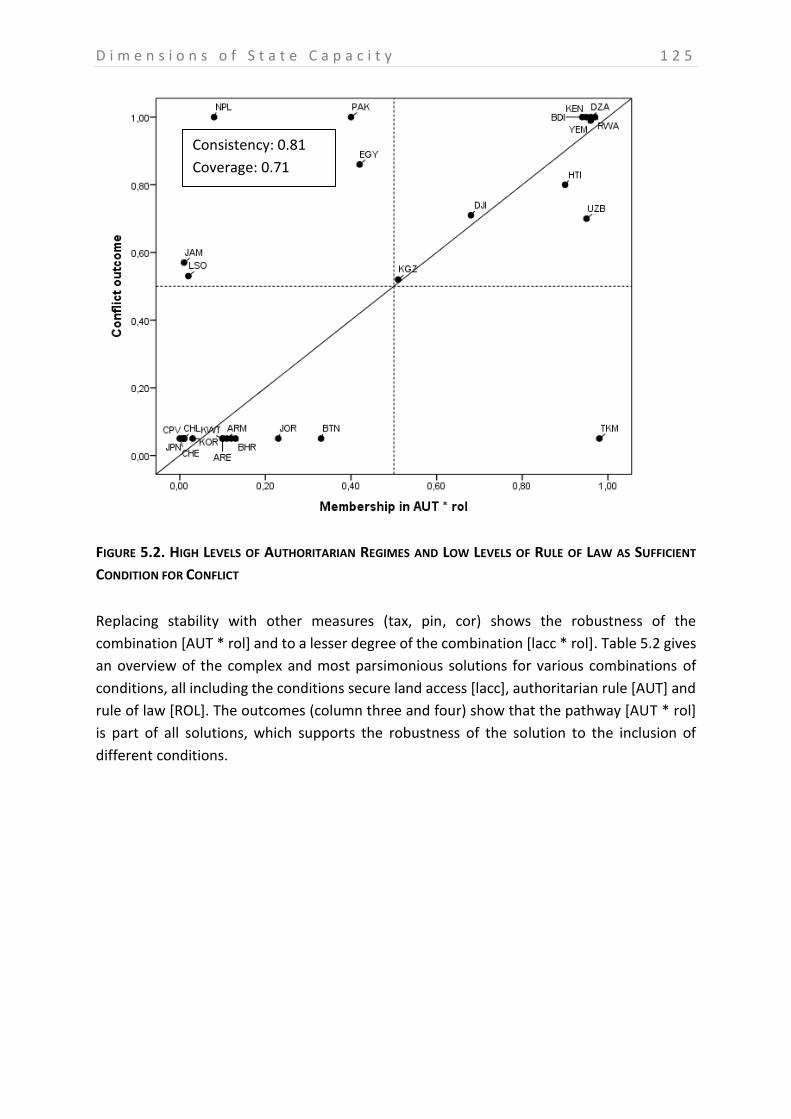
D i m e n s i o n s o f S t a t e C a p a c i t y 1 2 5
FIGURE 5.2. HIGH LEVELS OF AUTHORITARIAN REGIMES AND LOW LEVELS OF RULE OF LAW AS SUFFICIENT
CONDITION FOR CONFLICT
Replacing stability with other measures (tax, pin, cor) shows the robustness of the
combination [AUT * rol] and to a lesser degree of the combination [lacc * rol]. Table 5.2 gives
an overview of the complex and most parsimonious solutions for various combinations of
conditions, all including the conditions secure land access [lacc], authoritarian rule [AUT] and
rule of law [ROL]. The outcomes (column three and four) show that the pathway [AUT * rol]
is part of all solutions, which supports the robustness of the solution to the inclusion of
different conditions.
Consistency: 0.81
Coverage: 0.71
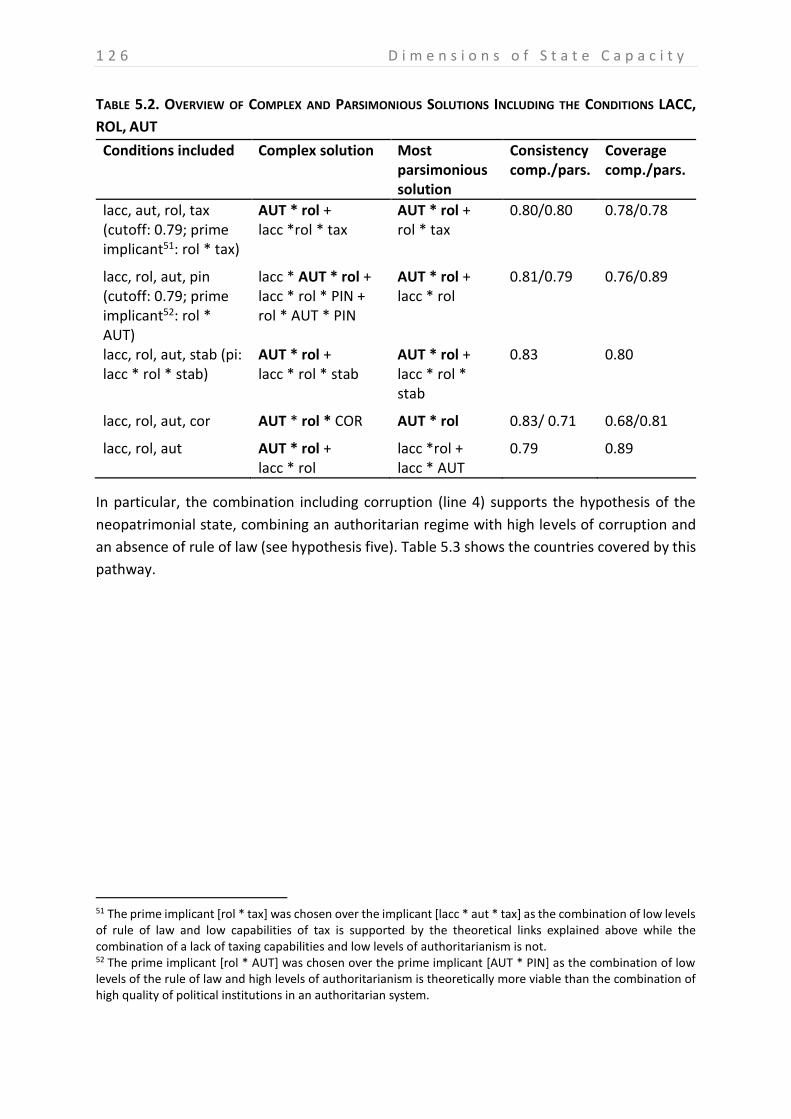
1 2 6 D i m e n s i o n s o f S t a t e C a p a c i t y
TABLE 5.2. OVERVIEW OF COMPLEX AND PARSIMONIOUS SOLUTIONS INCLUDING THE CONDITIONS LACC,
ROL, AUT
Conditions included Complex solution Most parsimonious solution
Consistency comp./pars.
Coverage comp./pars.
lacc, aut, rol, tax (cutoff: 0.79; prime implicant51: rol * tax)
AUT * rol + lacc *rol * tax
AUT * rol + rol * tax
0.80/0.80 0.78/0.78
lacc, rol, aut, pin (cutoff: 0.79; prime implicant52: rol * AUT)
lacc * AUT * rol + lacc * rol * PIN + rol * AUT * PIN
AUT * rol + lacc * rol
0.81/0.79 0.76/0.89
lacc, rol, aut, stab (pi: lacc * rol * stab)
AUT * rol + lacc * rol * stab
AUT * rol + lacc * rol * stab
0.83 0.80
lacc, rol, aut, cor AUT * rol * COR AUT * rol 0.83/ 0.71 0.68/0.81
lacc, rol, aut AUT * rol + lacc * rol
lacc *rol + lacc * AUT
0.79 0.89
In particular, the combination including corruption (line 4) supports the hypothesis of the
neopatrimonial state, combining an authoritarian regime with high levels of corruption and
an absence of rule of law (see hypothesis five). Table 5.3 shows the countries covered by this
pathway.
51 The prime implicant [rol * tax] was chosen over the implicant [lacc * aut * tax] as the combination of low levels of rule of law and low capabilities of tax is supported by the theoretical links explained above while the combination of a lack of taxing capabilities and low levels of authoritarianism is not. 52 The prime implicant [rol * AUT] was chosen over the prime implicant [AUT * PIN] as the combination of low levels of the rule of law and high levels of authoritarianism is theoretically more viable than the combination of high quality of political institutions in an authoritarian system.
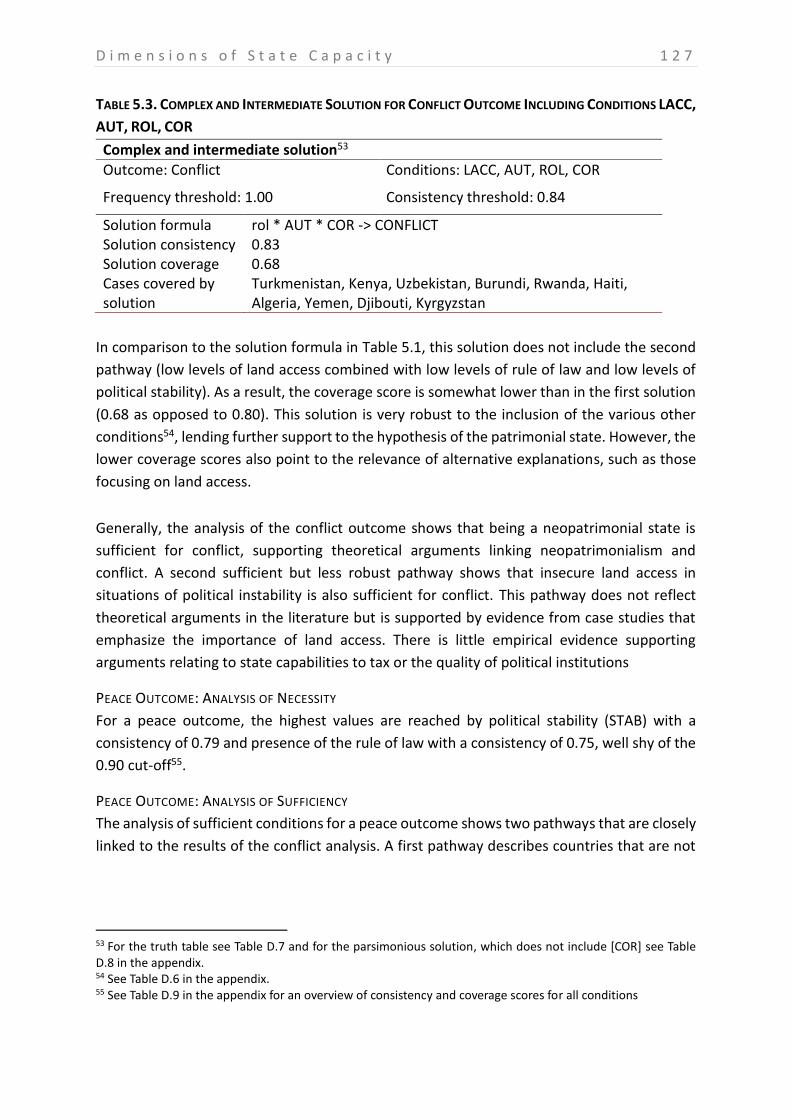
D i m e n s i o n s o f S t a t e C a p a c i t y 1 2 7
TABLE 5.3. COMPLEX AND INTERMEDIATE SOLUTION FOR CONFLICT OUTCOME INCLUDING CONDITIONS LACC,
AUT, ROL, COR
Complex and intermediate solution53
Outcome: Conflict Conditions: LACC, AUT, ROL, COR
Frequency threshold: 1.00 Consistency threshold: 0.84
Solution formula rol * AUT * COR -> CONFLICT Solution consistency 0.83 Solution coverage 0.68 Cases covered by solution
Turkmenistan, Kenya, Uzbekistan, Burundi, Rwanda, Haiti, Algeria, Yemen, Djibouti, Kyrgyzstan
In comparison to the solution formula in Table 5.1, this solution does not include the second
pathway (low levels of land access combined with low levels of rule of law and low levels of
political stability). As a result, the coverage score is somewhat lower than in the first solution
(0.68 as opposed to 0.80). This solution is very robust to the inclusion of the various other
conditions54, lending further support to the hypothesis of the patrimonial state. However, the
lower coverage scores also point to the relevance of alternative explanations, such as those
focusing on land access.
Generally, the analysis of the conflict outcome shows that being a neopatrimonial state is
sufficient for conflict, supporting theoretical arguments linking neopatrimonialism and
conflict. A second sufficient but less robust pathway shows that insecure land access in
situations of political instability is also sufficient for conflict. This pathway does not reflect
theoretical arguments in the literature but is supported by evidence from case studies that
emphasize the importance of land access. There is little empirical evidence supporting
arguments relating to state capabilities to tax or the quality of political institutions
PEACE OUTCOME: ANALYSIS OF NECESSITY
For a peace outcome, the highest values are reached by political stability (STAB) with a
consistency of 0.79 and presence of the rule of law with a consistency of 0.75, well shy of the
0.90 cut-off55.
PEACE OUTCOME: ANALYSIS OF SUFFICIENCY
The analysis of sufficient conditions for a peace outcome shows two pathways that are closely
linked to the results of the conflict analysis. A first pathway describes countries that are not
53 For the truth table see Table D.7 and for the parsimonious solution, which does not include [COR] see Table D.8 in the appendix. 54 See Table D.6 in the appendix. 55 See Table D.9 in the appendix for an overview of consistency and coverage scores for all conditions
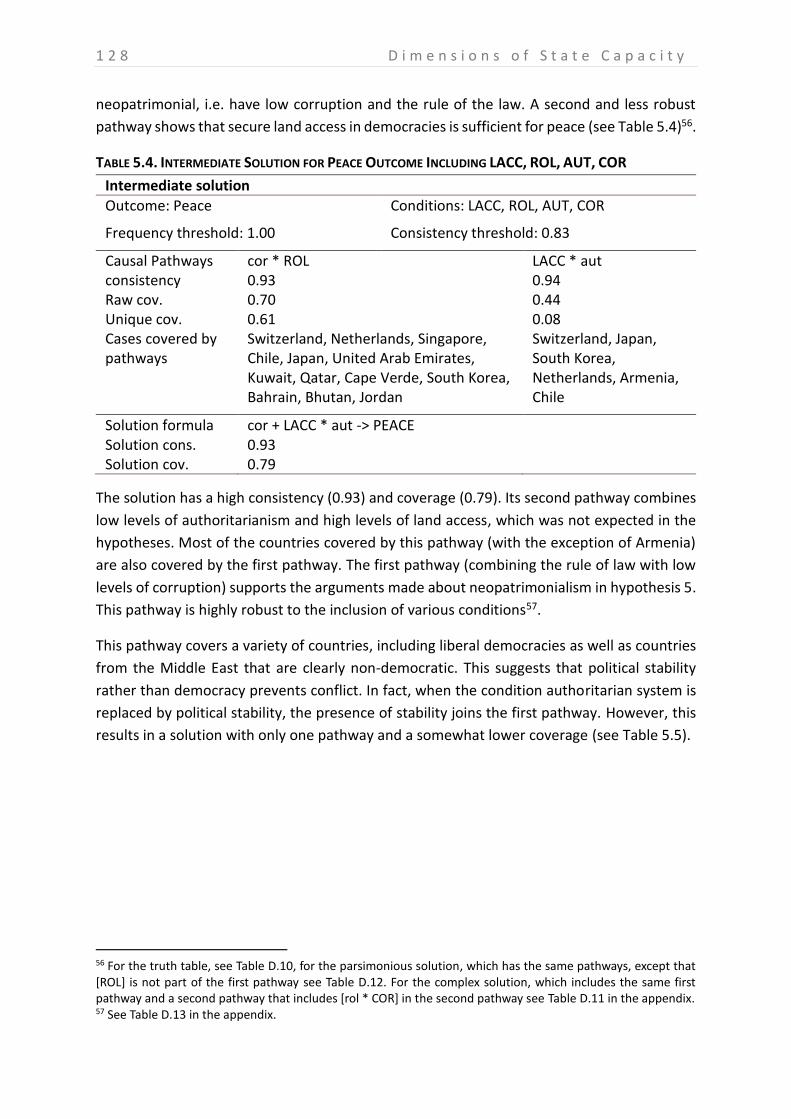
1 2 8 D i m e n s i o n s o f S t a t e C a p a c i t y
neopatrimonial, i.e. have low corruption and the rule of the law. A second and less robust
pathway shows that secure land access in democracies is sufficient for peace (see Table 5.4)56.
TABLE 5.4. INTERMEDIATE SOLUTION FOR PEACE OUTCOME INCLUDING LACC, ROL, AUT, COR
Intermediate solution
Outcome: Peace Conditions: LACC, ROL, AUT, COR
Frequency threshold: 1.00 Consistency threshold: 0.83
Causal Pathways cor * ROL LACC * aut consistency 0.93 0.94 Raw cov. 0.70 0.44 Unique cov. 0.61 0.08 Cases covered by pathways
Switzerland, Netherlands, Singapore, Chile, Japan, United Arab Emirates, Kuwait, Qatar, Cape Verde, South Korea, Bahrain, Bhutan, Jordan
Switzerland, Japan, South Korea, Netherlands, Armenia, Chile
Solution formula cor + LACC * aut -> PEACE Solution cons. 0.93 Solution cov. 0.79
The solution has a high consistency (0.93) and coverage (0.79). Its second pathway combines
low levels of authoritarianism and high levels of land access, which was not expected in the
hypotheses. Most of the countries covered by this pathway (with the exception of Armenia)
are also covered by the first pathway. The first pathway (combining the rule of law with low
levels of corruption) supports the arguments made about neopatrimonialism in hypothesis 5.
This pathway is highly robust to the inclusion of various conditions57.
This pathway covers a variety of countries, including liberal democracies as well as countries
from the Middle East that are clearly non-democratic. This suggests that political stability
rather than democracy prevents conflict. In fact, when the condition authoritarian system is
replaced by political stability, the presence of stability joins the first pathway. However, this
results in a solution with only one pathway and a somewhat lower coverage (see Table 5.5).
56 For the truth table, see Table D.10, for the parsimonious solution, which has the same pathways, except that [ROL] is not part of the first pathway see Table D.12. For the complex solution, which includes the same first pathway and a second pathway that includes [rol * COR] in the second pathway see Table D.11 in the appendix. 57 See Table D.13 in the appendix.
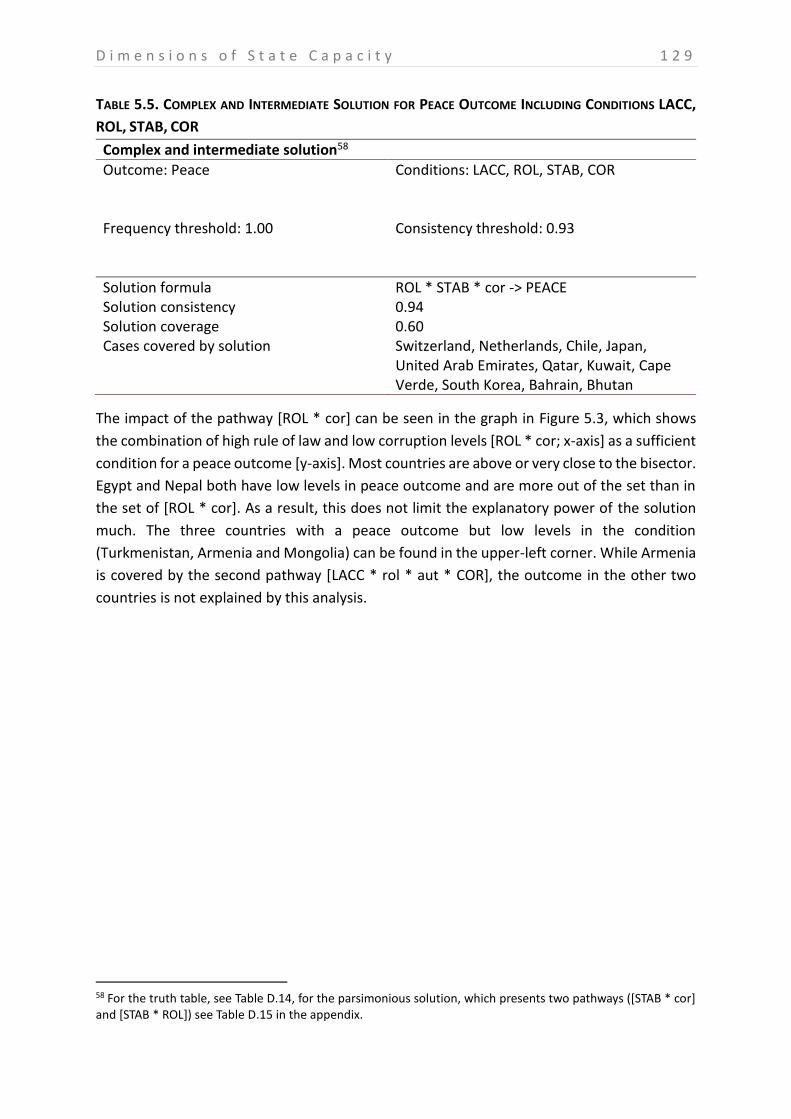
D i m e n s i o n s o f S t a t e C a p a c i t y 1 2 9
TABLE 5.5. COMPLEX AND INTERMEDIATE SOLUTION FOR PEACE OUTCOME INCLUDING CONDITIONS LACC,
ROL, STAB, COR
Complex and intermediate solution58
Outcome: Peace Conditions: LACC, ROL, STAB, COR
Frequency threshold: 1.00 Consistency threshold: 0.93
Solution formula ROL * STAB * cor -> PEACE Solution consistency 0.94 Solution coverage 0.60 Cases covered by solution Switzerland, Netherlands, Chile, Japan,
United Arab Emirates, Qatar, Kuwait, Cape Verde, South Korea, Bahrain, Bhutan
The impact of the pathway [ROL * cor] can be seen in the graph in Figure 5.3, which shows
the combination of high rule of law and low corruption levels [ROL * cor; x-axis] as a sufficient
condition for a peace outcome [y-axis]. Most countries are above or very close to the bisector.
Egypt and Nepal both have low levels in peace outcome and are more out of the set than in
the set of [ROL * cor]. As a result, this does not limit the explanatory power of the solution
much. The three countries with a peace outcome but low levels in the condition
(Turkmenistan, Armenia and Mongolia) can be found in the upper-left corner. While Armenia
is covered by the second pathway [LACC * rol * aut * COR], the outcome in the other two
countries is not explained by this analysis.
58 For the truth table, see Table D.14, for the parsimonious solution, which presents two pathways ([STAB * cor] and [STAB * ROL]) see Table D.15 in the appendix.
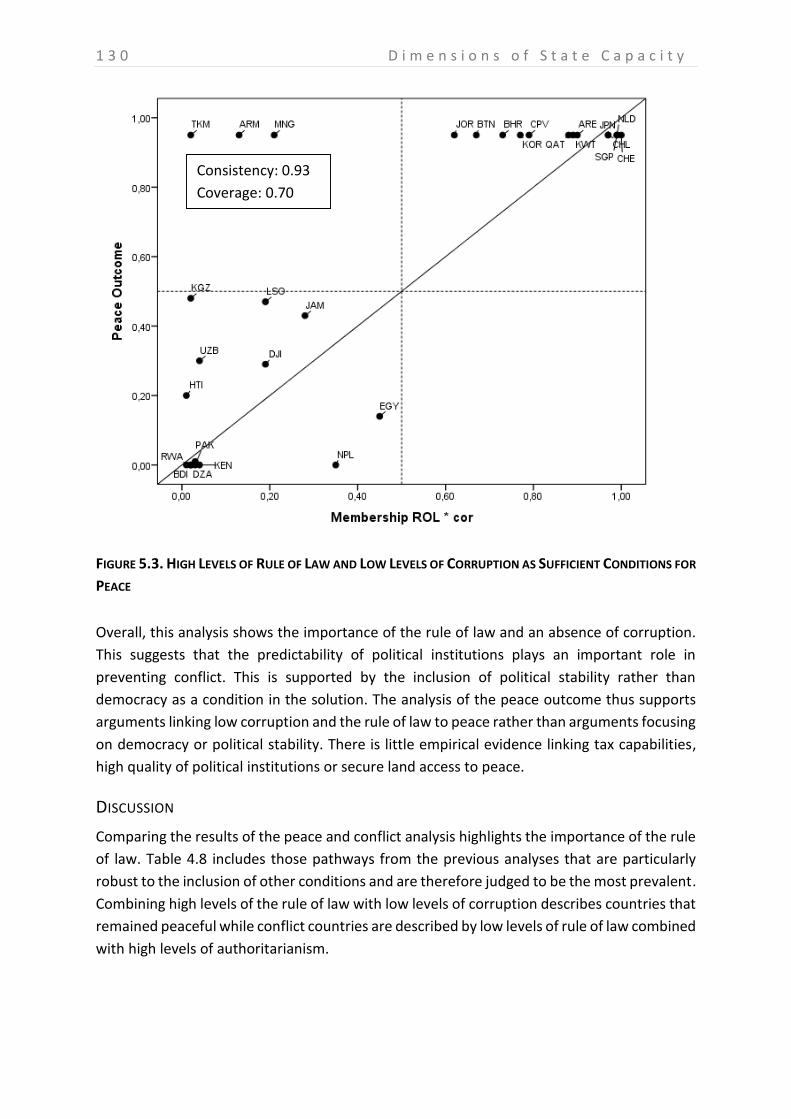
1 3 0 D i m e n s i o n s o f S t a t e C a p a c i t y
FIGURE 5.3. HIGH LEVELS OF RULE OF LAW AND LOW LEVELS OF CORRUPTION AS SUFFICIENT CONDITIONS FOR
PEACE
Overall, this analysis shows the importance of the rule of law and an absence of corruption.
This suggests that the predictability of political institutions plays an important role in
preventing conflict. This is supported by the inclusion of political stability rather than
democracy as a condition in the solution. The analysis of the peace outcome thus supports
arguments linking low corruption and the rule of law to peace rather than arguments focusing
on democracy or political stability. There is little empirical evidence linking tax capabilities,
high quality of political institutions or secure land access to peace.
DISCUSSION
Comparing the results of the peace and conflict analysis highlights the importance of the rule
of law. Table 4.8 includes those pathways from the previous analyses that are particularly
robust to the inclusion of other conditions and are therefore judged to be the most prevalent.
Combining high levels of the rule of law with low levels of corruption describes countries that
remained peaceful while conflict countries are described by low levels of rule of law combined
with high levels of authoritarianism.
Consistency: 0.93
Coverage: 0.70
D i m e n s i o n s o f S t a t e C a p a c i t y 1 3 1
TABLE 5.6. COMPARING CONDITIONS FOR CONFLICT AND PEACE OUTCOMES
Conflict Outcome Peace Outcome
Prevalent solution AUT * rol cor * ROL
The conflict outcome including authoritarianism and low levels of the rule of law as well as
high levels of corruption where this is included, supports the theoretical arguments that
neopatrimonialism contributes to conflict. While neopatrimonialism most often refers to a
number of African cases, the cases covered by the pathway [rol * AUT * COR] include a
number of Central Asian cases (Turkmenistan, Uzbekistan and Kyrgyzstan), Yemen and Haiti
as well as African cases (Kenya, Burundi and Algeria).
Case studies of neopatrimonialism often focus on a limited number of African countries. From
this neopatrimonialism is often seen as a core feature of “the African state”. This
underestimates the differences between African states (deGrassi, 2008, p. 112) while at the
same time promoting an “African exceptionalism” (Pitcher et al., 2009, p. 150) that is not
based on the evidence available. By idealising a Western concept of the state based on
Weber’s legal-rational authority, studies of neopatrimonialism often “fall into the trap of the
modernization theories’ “unilinear evolutionism,” which posits that Third World/African
states are bound to follow the developmental path opened by the Western states before
them” (G. Martin, 2000). In some cases, the image of Africa at the core is based on primordial
notions of ethnicity and authority, lacking a historical perspective on, for instance by failing
to see the influence of indirect rule during colonial times on the formation of ethnic groups
(deGrassi, 2008, p. 114). As a result of this focus on Africa, other cases of neopatrimonialism
are often neglected. This analysis shows, however, that neopatrimonialism is relevant for
cases outside Africa as well.
Neopatrimonialism in the Central Asian region is characterized by blurred lines between state
and society, inherited from the Soviet and pre-Soviet era met with post-Soviet capitalism. This
continuation of Soviet and pre-Soviet features shows path dependency in the informal
institutions according to some authors (Gawrich, Melnykovska, & Schweickert, 2010;
McGlinchey, 2011). Common features of Central Asian neopatrimonialism include a strong
top and systematic clientelism. In particular the centralisation of authority is a common
feature with the first presidents of all five Central Asian countries serving a minimum of 15
years. In all five countries, the leaders found ways to prolong their terms and accumulate
power by increasing their power or limiting the power of other institutions. This centralisation
of power was accompanied by an ideological leadership in most states in the form of rhetoric
paternalism (i.e. the president as the “father of the nation”) or personality cults, again
reaching back to Soviet legacy (Gawrich et al., 2010).
Yet, while the Central Asian republics (Kazakhstan, Kyrgyzstan, Tajikistan, Turkmenistan,
Uzbekistan) share many features, this similarity should not be overstated as there are
differences in the strength of the authoritarian regime as well as the conflict outcome. For
instance, in my sample, two of the Central Asian republics (Kyrgyzstan and Uzbekistan)
1 3 2 D i m e n s i o n s o f S t a t e C a p a c i t y
experienced conflicts, while Turkmenistan did not (Kazakhstan and Tajikistan do not fall
within my definition of resource scarcity). There are two possible explanations for this, one
focusing on hard and soft authoritarianism and one going back to the impact of the revenues
of natural resources such as oil and gas. Neopatrimonial regimes are distinguished into softer
and harder forms, with softer regimes implying a higher degree of instability but also a higher
degree of political accountability. In the harder form of neopatrimonialism, the stabilising
qualities of strong authoritarianism to a certain extent override the conflict potential inherent
in the neopatrimonial regimes. This explains differences in autocratic stability and conflict
(Gawrich et al., 2010). In my sample highly authoritarian Turkmenistan (Polity IV score of -9)
remained peaceful while Kyrgyzstan with more political accountability (Polity IV score
improving from -3 to 4 between 1991 and 2010) experienced conflict. While this supports the
argument about anocracies and transitional regimes being vulnerable to conflict, Uzbekistan
with an also highly authoritarian regime (-9) also experienced conflict, which does not fit this
explanation. Yet, the specific characteristics of neopatrimonialism in Uzbekistan have been
used to explain the conflict it has experienced between 1999 and 2004, when the Islamic
Movement of Uzbekistan (IMU) and Jihad Islamic Group (JIG) unsuccessfully tried to
overthrow autocratic president Islam Karimov (UCDP, 2013).
The neopatrimonial system in Uzbekistan is based on a clan system centred around the
control over key administrative departments (in particular, security, law enforcement, tax
collection, custom, finances and export procurements). The patrimonial system of the pre-
Soviet and Soviet era, based on the president acting as a patron for local governors (who also
had their own client networks) was kept in check by Soviet ideological and anti-corruption
measures. After independence, the patrimonial system was strengthened when the major
export resources were concentrated under President Karimov’s personal control, resulting in
wealth accumulation in the president’s family and clan. Therefore the “marriage of the
monopoly of power with elements of the market economy [...] can be considered as a hybrid
decisively determining the latest version of neopatrimonialism” (Ilkhamov, 2007, p. 78). The
development of the Islamic Movement of Uzbekistan (IMU) took place against the backdrop
of the repression of an active Muslim civil society in the early nineties. The IMU’s leaders,
Tohir Yoldosh and Juma Namangani, started out as community leaders with the Adolat
(Justice) Islamic Party, protesting for the regional government to adhere to Muslim norms and
for the building of Islamic study centre. The centre was built, but closed down a few month
later amidst efforts by the state to repress Islamic religious and community activists. Yoldosh
and Namangani fled from repression to Tajikistan but returned as leaders of the IMU. The
IMU is responsible for various terrorists attacks, including bombings in Tashkent in 1999 and
2004 and for border clashes with Uzbek and Kyrgyz forces. State-based repression
contributed to the radicalisation of some Muslim activists (McGlinchey, 2011, pp. 120 – 121).
While the regime in Uzbekistan originally was successful in achieving stability and even some
kind of social consensus by keeping a delicate balance between the different factions and
clans, it turned to a more autocratic (“hard”) style of neopatrimonialism with more power at
D i m e n s i o n s o f S t a t e C a p a c i t y 1 3 3
the centre, which ultimately eroded the legitimacy of the state. This led to tensions and
protests, which were violently repressed by government forces (e.g. in Andijan in May 2005),
halting protests that the regime feared would turn into a colour revolution (Ilkhamov, 2007,
p. 79).
A second explanation for the difference in conflicts (in my sample, Turkmenistan remained
peaceful, while Uzbekistan and Kyrgyzstan experienced conflicts) links back to the economic
conditions discussed in the previous chapter. Turkmenistan has much more revenue from
natural resources than either Uzbekistan or Kyrgyzstan (though Uzbekistan has more
resources than Kyrgyzstan) and therefore, in the context of a patrimonial state, more
resources to spread around to appease different factions and clans. This relationship between
natural resources and patrimonial states and the related arguments on the rentier state will
be explored further in the integrated analysis in chapter 7. It shows that rentier states theory
explains the different outcomes of neopatrimonial states in Central Asia better than
explanations focusing on hard and soft power variants of neopatrimonialism.
These examples show how an autocratic and patrimonial state can contribute to conflict.
Regarding the peaceful outcome shows that it is high levels of the rule of law and low
corruption that contribute to peace and prevent conflict. This suggests that rule-based and
highly predictive behaviour by agents of the government contributes to peace. The cases
covered by this solution include liberal democracies (Switzerland, the Netherlands, Chile,
Japan, Cape Verde and South Korea) but also more authoritarian states, such as the United
Arab Emirates, Qatar, Bahrain and Bhutan. This highlights that regime type plays a lesser role
than often argued in preventing conflict. However, as the analysis including stability shows, it
is indeed countries with very high or very low levels of authoritarianism that remain peaceful.
The argument about the predictability about state actors goes back to Weber’s arguments on
legal-rational domination where legitimacy is based on rationally created rules (Gerth & Mills,
1991, p. 79). This argument has been employed to explain the democratic transition from a
one-party system to a multi-party democracy in Cape Verde in 1990/1991. The prevailing of
an “administrative” rather than “command” logic has been credited with enabling a
democratic and peaceful transition of power, setting Cape Verde apart from other former
Portuguese colonies in Africa such as Angola and Mozambique (Koudawo, as cited in Meyns,
2002, p. 156). Cape Verde’s effective administration with low corruption levels predates the
democratic transition and goes back to the one-party rule in the 1980s (Baker, 2006, p. 494).
Having a non-corrupt and effective bureaucracy in place reduced the prize of capturing the
state, reducing the incentive for violence. In addition, the fact that independence was won in
a non-violent struggle also increased the willingness of leaders to adhere to the non-violent
rule of democracy (Meyns, 2002, p. 159).
In the non-democratic states included here, predictability and low corruption is often due to
the need to attract foreign direct investment and the resulting adherence to Western
business practices. While there is evidence that countries with legal systems based on Islamic
1 3 4 D i m e n s i o n s o f S t a t e C a p a c i t y
law are less effective in contract enforcement and therefore see less international trade
(Powell & Rickard, 2010), the United Arab Emirates, for instance, haven taken a number of
measures to open their economy up to the global economy in an effort to reduce their
dependence on oil exports. Since joining the World Trade Organisation in 1995, various free
trade agreements have been negotiated and free trade zones have been implemented. While
there is a certain amount of patrimonialism based on wasta defined as “social networks of
interpersonal connections rooted in family and kinship ties and implicating the exercise of
power, influence, and information sharing through social and politico-business networks”
(Hutchings & Weir, 2006, p. 143), its influence has been limited by the various laws put into
place to promote diversification and attract foreign direct investment (Grant, Golawala, &
McKechnie, 2007). These arguments connecting the rule of law to economic reasons rather
than democracy is in line with findings that the rule of law has a stronger impact on economic
performance than democracy and that economic openness has a positive impact on the rule
of law (but a negative impact on democracy). The causal link for this might be that competing
internationally requires countries to develop functional institutions. At the same time, greater
openness enhances distributional conflicts, which have a negative impact on democracy
(Rigobon & Rodrik, 2005).
The spectrum between fully-fledged democracies and fully autocratic regimes is wide with
some countries presenting as “electoral democracies that fall into the twilight zone of
persistence without legitimation and institutionalization” (L. Diamond, 1999, p. 22) and
others that are “liberalized autocracies”, which prevail by keeping a delicate balance between
allowing some social, political or ideological power to the opposition but never so much it
actually threatens the regime. These cases are characterised by guided pluralism, controlled
elections and selective repression (Brumberg, 2002) as well as by some distance between the
state and society, which sets them apart from neopatrimonial states. Liberalized autocracies
use a “divide and rule” strategy to keep the opposition in check. They allow an
institutionalised civil society, but only to a certain extent. Their level of economic
development allows them to not focus on only one interest, group or resource, which enables
them to put different groups against each other in the struggle for support of the state
(Brumberg, 2002, p. 61; Carothers, 2002, p. 9). By allowing some room for opposition while
at the same time pitting different opposition groups against each other, the regime survives.
For instance, in some of these cases leaders have managed to claim the mainstream Muslim
interpretation of society and as a result, the opposition is divided between radical Islamists
and a more secular opposition who have trouble working together. Egypt following the fall of
Mubarak is a recent example of these type of power balances. With an opposition divided
between the Muslim Brotherhood and a more liberal democratic opposition and some power
still in the hands of the military, post-Mubarak Egypt failed to install a working political order.
D i m e n s i o n s o f S t a t e C a p a c i t y 1 3 5
CONCLUSION
This chapter has focused on state-based explanations for armed conflict, focusing on different
aspects of state capacities. The dimensions of state capacities discussed here are based on
the findings in previous case studies as well as the wider conflict literature. In particular,
theoretical arguments linking the following aspects to armed conflict were reviewed:
patrimonial states; institutional quality and capabilities to tax; land access and judicial
institutions and finally, regime type and political stability. Based on those theoretical
arguments seven conditions were analysed: Corruption, capabilities to tax, the quality of
political institutions, rule of law, land access, authoritarianism and political stability. The
analysis for a conflict outcome gave support for the link between patrimonial states and
armed conflict, arguing that high levels of authoritarianism combined with low levels of the
rule of law are sufficient for conflict. The analysis of the peace outcome also showed the
importance of the rule of law as high levels of rule of law were sufficient for peace when
combined with low levels of corruption. This chapter shows interesting links to the previous
chapter on economic conditions as the arguments on the neopatrimonial state are often
linked to the previously discussed arguments on the resource curse, which will be further
explored in chapter 7. Similarly, one explanation for high levels of rule of law in authoritarian
countries lies in the impact of trade openness and the related pressure to adhere to
international norms.
1 3 6 I n e q u a l i t y a n d A d a p t i v e S k i l l s
Chapter 6: SOCIAL EXPLANATIONS: INEQUALITY AND ADAPTIVE SKILLS
INTRODUCTION
This chapter focuses on factors in society that can neither be attributed to the economic
system (see chapter 4) nor focus on the state (see chapter 5). Within the adaptive capacities
framework, there are two factors in particular that stand out. The first is inequality in society
and the second is the skills to adapt to changing circumstances, such as knowledge, skilled
personnel and available technologies. Case studies of resource-scarce cases and the conflict
literature in general also emphasize inequality with a particular focus on the following three
dimensions: economic inequality, inequality in terms of political power between different
groups and gender inequality. While adaptive capacities include many of the factors that have
been discussed in previous chapters such as functioning institutions and economic resources,
this chapter focuses on adaptation skills, which are less prevalent in the research on conflict
but a key factor in research on adaptation to climate change. Three aspects are crucial to
adapt to dire environmental circumstances: access to knowledge, trained personnel and
access to technology. These arguments lead to eight different conditions: economic
inequality, economic inequality between groups, inequality in access to political power
between groups, gender inequality, access to science and technology, tertiary education,
access to agricultural research and brain drain, i.e. the emigration of skilled personnel. I
analyse these conditions using a fuzzy-set qualitative comparative analysis of 30 countries
with low levels of freshwater or low levels of arable land (see chapter 3 for details on the
method and case selection). The analysis shows two necessary conditions for conflict: low
levels of tertiary education and high levels of uneven development between groups. These
necessary conditions are reflected in the key pathways to conflict: Low levels of tertiary
education or high levels of uneven development between groups are sufficient for conflict.
There are also two pathways to peace: High levels of tertiary education or a combination of
high technology levels and low levels of uneven development are sufficient for peace.
Therefore, the results find high conflict-mitigating effects of adaptive skills and an important
role for socio-economic inequality between groups rather than individuals.
INEQUALITY IN SOCIETY
Within the research on adaptive capacities, equal distribution of and access to resources
within a community, nation or worldwide is seen as a determinant of adaptive capacities (Smit
et al., 2001, p. 897). Inequality can refer to individuals and groups and can be linked to a
variety of characteristics such as age, gender, socio-economic background or ethnicity. As it
narrows the range of options available to groups when confronted with environmental
changes, political-economic exclusion can be a critical factor for the outbreak of conflict.
Areas with low political capacity and economic irrelevance are unlikely to put enough
pressure on a government through peaceful campaigning to change its policies (Raleigh,
2010). For instance, in a study of coastal Vietnam, Kelly and Adger (2000, p. 47) argue that
I n e q u a l i t y a n d A d a p t i v e S k i l l s 1 3 7
the unequal distribution of resources is one of the root causes of social vulnerability. Similarly,
Paavola (2006, p. 211) argues that inequality between urban and rural population greatly
increases the vulnerability to climate change in Tanzania. Increased vulnerability and limited
levels of adaptive capacity most strongly affect the most vulnerable populations. Inequality
can refer to different resources such as natural resources, economic resources or political
power and it can focus on society as a whole or on inequality between specific groups.
Research on conflict focuses most often on three dimensions of inequality59 (with the first
and second receiving much more attention than the third): Economic inequality, inequality in
terms of political power and gender inequality. For each of these aspects, I review theoretical
arguments, quantitative results and the results from case studies in resource-scarce cases.
ECONOMIC INEQUALITY
Theories focusing on economic inequality reach back to Marxist theories, emphasizing the
inequality between classes, which contributes to despair and incentivizes a rebellion of the
working classes and the demand of political change as “society as a whole is more and more
splitting up into two great hostile camps, into two great classes directly facing each other” (K.
Marx & Engels, 1848). A key argument related to this is that it is not poverty per se but
horizontal inequality, i.e. inequality between groups in society that lead to grievances and
conflict (Østby, 2006; Russell, 1974; F. Stewart, 2000). According to Horowitz (1985, pp. 21 –
24), this risk is highest where economic inequalities run along ethnoreligious cleavages.
Similarly, Stewart (2002, p. 33) argues based on a number of case studies that horizontal
inequalities are powerful where ethnic boundaries coincide with economic and social ones.
In these cases, ethnicity becomes a mobilizing agent, enhancing ethnic divisions. These
arguments are closely linked to Gurr’s (1970) arguments about relative deprivation(see p. 19).
Actual or perceived discrepancies between the living standards people can achieve and those
that they feel entitled to, in particular in relation to other members of society, lead to
grievances and then to conflict.
The impact of economic inequality has also been examined by quantitative studies on conflict
onset but there is little consensus. Most studies focus not on inequality between groups but
inequality within society as a whole (using indicators such as the Gini index). Most of these
studies do not find any impact of economic inequality on the onset of conflict (Collier &
Hoeffler, 2004; Fearon & Laitin, 2003; Hauge & Ellingsen, 1998) but there are also studies that
find a positive relationship between inequality and conflict (Dixon, 2009, p. 716). Nafziger and
Auvinen (2002) find a positive relationship between economic inequality and humanitarian
emergencies, rather than conflict as inequality increases the vulnerability of certain groups in
society. Boix (2008) finds that countries with a high percentage of large estates rather than
smaller family-owned farms have a higher risk for conflict. Sambanis (2004a, pp. 181 – 184)
argues that there a several reasons for this lack of significant relationships, such as studies
59 Other dimensions include social inequalities (i.e., inequalities in access to and quality of public services, such as education, safe water, health services, housing etc.) (F. Stewart, 2002) but as these are highly case specific, they are not included in this analysis.
1 3 8 I n e q u a l i t y a n d A d a p t i v e S k i l l s
focusing on inequality across society as a whole rather than between-group inequality,
ignoring subnational variation, ignoring the issue of land distribution and aggregating various
types of conflict. Finally, the relationship between inequality and conflict might be indirect as
inequality might lead to a regime transition, which might in turn lead to conflict. This leads to
the following hypothesis:
H1: Countries with high levels of economic inequality between individuals experience conflicts.
Economic inequality between individuals is a sufficient condition for conflict.
Empirical studies, in particular from welfare economics, also take up theoretical arguments
focusing on inequality between groups rather than between individuals. Esteban and Ray
(1994), for instance, focus on polarization or clusters within society. They refer specifically to
situation with a small number of distinguishable groups, with high homogeneity within the
groups and high heterogeneity between groups (Esteban & Ray, 1994, p. 824). In highly
polarized societies, rebellion is costly, leading to conflict as a rare but very severe event.
Fractionalised societies experience conflict more frequently, but the conflicts are less severe
(Esteban & Ray, 2008). Similarly, Østby (2006) finds some support for a positive relationship
between socio-economic polarization and conflict onset.
Case studies emphasize that the relationship between scarce resources, hardened group
identities and violence is a complex one as conflict over resources breaks out more easily in
societies with strong collective identities, but often resource scarcity and resulting grievances
also lead to hardening group identities. Percival and Homer-Dixon (1998, p. 280) argue that
resource scarcity and the resulting grievances only lead to violence if groups with strong
collective identities that can coherently challenge state authority are present as well.
Scarcities and shared perceptions of grievances can contribute to group formation and group
coherence. For instance, in the case of South Africa, they (Percival & Homer-Dixon, 1998, pp.
292 – 293) show that environmental scarcities reduced rural incomes, leading to increased
rural-to-urban migration and increased grievances. Environmental scarcity also led to inter-
group competition for resources, in particular in urban settings, where individuals used group
identities to capture resources and ensure their support by distributing them according to
ethnic membership. As it became clear that the apartheid state would collapse, a violent
struggle for political power between different ethnic groups, factions and political parties
ensued, leading to political violence killing 12 000 people between 1990 and 1993. Ethnic
leaders instrumentalised ethnic differences to improve their access to political power, which
turned disputes over scarce resources into political battles. While resource scarcity and ethnic
heterogeneity were contributing factors in this, however, the greatest influence by far was
the political vacuum following the demise of the apartheid state. As the example of South
Africa shows, it is often difficult to clearly differentiate between arguments focusing on
economic resources and those focusing on political power. In the case of South Africa, political
leaders exploited a discrepancy in economic resources to change the landscape of political
influence. However, while there are quantitative studies focusing on the mere presence of
I n e q u a l i t y a n d A d a p t i v e S k i l l s 1 3 9
ethnic groups, case studies rarely argue that ethnic heterogeneity in itself is a factor. Rather
they focus on economic or political inequality between groups and its impact on conflict.
Arguments on inequality between groups lead to the following hypothesis:
H2: Countries with high levels of economic inequality between different groups experience
conflicts. Economic inequality between groups is a sufficient condition for conflict.
INEQUALITY IN POLITICAL POWER
The interplay between political power and groups in society plays an important role in case
studies and theoretical contributions but has more recently been analysed in quantitative
studies as well. Based on Tilly’s (1978) polity model, Wimmer, Cederman and Min (2009, pp.
321 – 322) differentiate between groups in society that control or have access to central
government and groups that are excluded from government but are still citizens of the
country. This differentiation presents three borderlines, at which conflicts can take place. The
first concerns the boundary to the world outside the territory of the state and the conflict
about who is or is not a legitimate part of the state and its citizens (e.g. secessions). A second
border separates those that have access to the central government from those that do not
with conflicts occurring about the question which groups the government should represent
(e.g. rebellion). Finally, a third border runs within the groups with access to power where
different ethnic elites might fight over the spoils of government (infighting). Groups excluded
from power therefore play an important role for rebellions, as a high degree of ethnic
exclusion erodes the legitimacy of the state (Wimmer et al., 2009, p. 322).
Case studies frequently mention the existence of different ethnic groups. Bächler (1999) and
Kahl (2006) both regard ethnic identity as crucial demarcation lines for building organizations,
finding allies and turning protest into communal violence, which helps in overcoming the
collective action problem. Kahl (1998) argues that in the case of Kenya, it is not so much the
existence of different ethnic groups itself, but the ties across different groups that made the
difference. While violence broke out between different ethnic groups in rural areas where
few ties between groups existed, this was prevented in urban settings where ties across
ethnic groups and along the lines of class, religion or profession were established. Outside
stressors such as natural disasters can also contribute to social segmentation and conflict as
stress and feelings of relative deprivation harden group lines, making it easier to
instrumentalise and manipulate ethnic division to instigate violence (A. Martin, 2005, pp. 333
– 334). Migration into areas that are predominantly inhabited by a different group has also
led to conflict over economic resources and political power. In the case of India, Swain (1996,
p. 198) argues that the influx of Bangladeshi migrants from the 1970s led to a hardening of
group identity and nativism with the indigenous group protecting “their” resources against
outsiders. In particular, political elites had an interest to build up a strong support group
based on group identities to keep their power. The state of Assam, in particular, has seen a
lot of political violence since the late 70s, mostly occurring around elections. Ethnicity can
present a fault line along which conflicts take part even in cases where different ethnic groups
1 4 0 I n e q u a l i t y a n d A d a p t i v e S k i l l s
are not clearly defined or land is not distributed along ethnic lines. For instance, in Rwanda a
great majority of Hutus and Tutsis did not benefit from the social revolution in 1959 as the
revolution led to increasing poverty and inequality, concentrating the wealth in the hands of
the ruling elite. However, ethnic differences were used by the Hutu elite to polarize and blame
the social injustice on the Tutsi, regardless of class (Bigagaza et al., 2002, p. 70). Whether
these groups are of ethnic, religious or other nature is of less relevance than the fact that
these groups exist in the collective mind and the way in which resources and power are shared
between them. While heterogeneity is rarely seen as key factor, it is mentioned in case studies
as diverse as Kenya (Adano et al., 2012; Boone, 2011; Butt, 2012; Kahl, 1998), Mali
(Benjaminsen, 2008), Ethiopia (Flintan & Tamrat, 2002; A. Martin, 2005), a number of Pacific
islands (Ware, 2005), Indonesia (Barber, 1998), Burundi (Oketch & Polzer, 2002) and Sudan
(Suliman, 2008).
The impact of ethnic heterogeneity on conflict occurrence is debated in the larger conflict
literature as well. While there is little conclusive evidence on the impact of ethnic
heterogeneity by itself, there is some evidence that shows that where specific groups are
systematically excluded from political power, this can lead to conflict. Most studies find no
significant relationship between heterogeneity and conflict (Collier & Hoeffler, 2004; Fearon,
Kasara, & Laitin, 2007; Fearon & Laitin, 2003), but others (Ellingsen, 2000; Hegre & Sambanis,
2006; Sambanis, 2004c) argue that ethnic fragmentization can contribute to violence. There
is also an argument that heterogeneity reduces the likelihood for violence as it makes
coordination more difficult (Collier & Hoeffler, 2004). This diversity in empirical evidence has
sparked arguments that focus less on the mere existence of groups per se but on the
ethnopolitical constellation. Wimmer, Cederman and Min (2009) argue that “armed
rebellions are more likely when the state excludes large sections of the state from central
state power on the basis of their ethnic background” (p. 317). In fact, they find that their
measure of the percentage of the population excluded from power is significant for all their
models and argue that it is political exclusion along ethnic lines rather than ethnic
heterogeneity itself that breeds conflict (Wimmer et al., 2009, p. 29). Following the arguments
on ethnopolitical constellations, the hypothesis on inequality in political power is:
H3: Countries with a high degree of ethnic exclusion experience conflicts. Ethnic exclusion is a
sufficient condition for conflict.
GENDER INEQUALITY
Gender inequalities have received much less focus than the inequalities between different
groups in societies by researchers focusing on conflicts over resource scarcity. This has been
criticized by Hartmann (2001, pp. 60–61) who points out that highly relevant factors, such as
women’s property rights or their role in the management of resources are frequently
neglected. The impact gender inequality has on intermediate factors such as the distribution
of resources or property rights remains systematically underanalysed. However, some case
studies discuss the role of women in some detail. For instance, in the case of Ethiopia, Flintan
I n e q u a l i t y a n d A d a p t i v e S k i l l s 1 4 1
and Tamrat (2002, p. 281) argue that women play an important role in conflict resolution and
mediation based on cultural ideas of femininity, which allows them to act as messengers
between different clans. As Flintan and Tamrat describe: “They will meet with other women
in recognised ‘no-man’ areas wearing specific sheepskin clothes showing that they come in
peace. They will return to their male counterparts carrying messages, demands and prospects
for resolution.” In the case of Burundi, Oketch and Polzer (2002, p. 104) point out that the
predatory system of the state denies women access to the state and its resources. In addition,
women were disadvantaged in the land inheritance system. However, whether this gender
inequality had any consequences for the outbreak or severity of conflict is not discussed
further.
In the more general conflict literature, the role of gender inequality has received much less
attention than ethnic inequality. There are some studies, however, that highlight empirical
relationships between gender inequality and internal conflict. There are two general
explanations for this (Melander, 2005): The first one argues that women are inherently more
peaceful than men and that societies in which women have more influence on politics are
therefore more peaceful. The second explanation focuses on the constructed nature of
gender roles and argues that where masculinity is constructed as domineering and repressive
towards women, this attitude can spill over to determine the relationship towards other
disadvantaged groups, for instance ethnic minorities and political opponents. The argument
is that the way gender roles are constructed and the attitudes men develop towards women
act as a blueprint for how men behave towards others and that in societies with egalitarian
gender roles, the related norms of respect and dignity are also carried on into the general
attitudes within society. Caprioli (2005, p. 163), for instance, argues that societies
characterized by gender inequality (operationalised in terms women percentage in labour
force and total fertility rate) have a higher likelihood of internal conflict. Applying Galtung’s
(1990) concepts of structural and cultural violence to gender inequality, she argues that
gendered structural hierarchies, which are maintained by violence and oppression result in a
culture that easily justifies violence as a means for conflict resolution. In this model, domestic
culture, and gender roles in particular, explain when grievances turn into violence. Melander
(2005) also argues that more equal societies, measured either in terms of female
representation in parliament or the ratio of female-to-male higher education attainment, are
associated with lower levels of intrastate armed conflict. These arguments are expressed in
the following hypothesis:
H4: Countries with high levels of gender equality remain peaceful. Gender equality is a
sufficient condition for peace.
ADAPTIVE SKILLS
Adaptive skills as a causal factor for peace and conflict have not received much attention in
the conflict studies literature or in case studies of conflicts in resource-scarce countries. They
are, however, a key factor in the debate on climate change adaptation. Since the skills needed
1 4 2 I n e q u a l i t y a n d A d a p t i v e S k i l l s
for adapting to climate change are similar in nature to those needed to adapt to resource
scarcity, I am introducing them here as a condition. While aspects of adaptive capacities such
as technology and education have been discussed in the conflict studies literature, the
theoretical arguments rarely focus on adaptive skills.
Access to knowledge and technology such as, for instance, efficient cooling systems, improved
seeds and desalination technologies, is a key factor determining adaptive skills. As adaptation
skills itself, access to technology refers to different levels of society from the local to the
national level and to different sectors. Research and innovation to develop new technologies
or revive and adapt old ones is an important aspect of this (Adger et al., 2007, p. 727).
Understanding complex problems requiring adaptation and developing solutions
(technological or otherwise) requires a high level of human capital. Therefore a lack of trained
and skilled personnel can limit a nations capacity to adapt even where technologies exist. This
is an aspect emphasized by Homer-Dixon, who focuses on “human ingenuity” or “ideas
applied to solve practical technical and social problems” (Homer-Dixon, 1999, p. 109), an
argument most prominently advanced by the Cornucopian perspective on scarcity. He
differentiates between social and technical ingenuity and argues that resource-scarce
countries need both, but that social ingenuity is a precursor for technical ingenuity as
resource-scarce countries first need
sophisticated and stable systems of markets, legal regimes, financial agencies and educational and research
institutions to promote the development and distribution of new grains adapted for dry climates and eroded
soils, of alternative cooking technologies to compensate for the loss of firewood, and of water conservation
technologies. (Homer-Dixon, 1999, p. 110)
Social ingenuity allows societies to adapt to consequences of environmental change in ways
that go beyond technological innovation, for instance by establishing emergency credits in
cases of crop failure or by anticipating food shortfalls and effectively organizing food aid
(Homer-Dixon, 1999, p. 111). This adaptation happens on all levels of society and the access
to information provided by social ingenuity is of particular relevance on a local and household
level.
While there is little disagreement that a lack of access to science and technology will limit
adaptive skills as it narrows the range of potential responses (Smit et al., 2001, p. 896), there
is less research on the influence of science and technology on the likelihood for conflict,
though a mitigating effect of education has been shown. One study taking the level of
technology into account (Maxwell & Reuveny, 2000) argues that the impact of technology can
either increase or decrease the likelihood of conflict, depending on how it affects the resource
stock and the human fertility rate and therefore argue that policies for technology transfer
need to not only consider the impact on resources but also on human behavior. In general,
however, the level of technology and the impact this has on conflict, has found little attention.
This most likely due to the role of technology as a factor mitigating conflict, i.e. it is the
absence of technology that contributes to conflict. However, the absence of a factor is less
I n e q u a l i t y a n d A d a p t i v e S k i l l s 1 4 3
likely to be analysed as much research focuses on cases where conflicts occurred and the
factors present (and not absent) in these cases. However, access to technology and education
can also contribute to grievances where the access is discriminatory. For instance, the case
study of Gaza (K. Kelly & Homer-Dixon, 1995) explicitly focuses on the discriminatory access
to technology such as the prohibition of drilling new wells or rehabilitating existing wells for
Palestinians in Gaza but not for Israeli settlers. The resulting inequality in access to freshwater
contributes to grievances and conflict. There is little research on which technologies can help
to prevent conflict in resource-scarce cases. However, while certain technologies such as
desalination or irrigation technology play a greater role in preventing conflict over resource
scarcity than others, the specific technologies that will alleviate resource scarcity are highly
dependent on the specific case. However, societies with a high level of access to technology
in general have access to the technologies most needed in their circumstances. The
operationalization therefore includes a measure of the general level of science and
technology. As agricultural technology plays such an important role in cases with scarce
freshwater and arable land, a measure of access to agricultural research is included as well.
As adaptive capacities are conflict-mitigating factors, I assume that countries with high levels
of technology remain peaceful.
H5: High levels of technology are sufficient for peace.
I also assume that countries with a conflict outcome have low levels of technology:
H6: Low levels of technology are a necessary condition for conflict.
There is more research on the impact of education, focusing on different aspects, such as the
level, expansions, inequality and content of education (Østby & Urdal, 2011, p. 3) with the
greatest focus on the levels of education. There are various theoretical links between the level
of education and peace, which fall into three groups: reduction in grievances, increase in
opportunity costs and increase in stability (Østby & Urdal, 2011, p. 3). Higher levels of
education can contribute to reducing grievances on an individual and a community level.
Investements in education have a direct positive impact on people’s lives and increases
economic growth and social equality (Thyne, 2006). Arguments focusing on opportunity costs
for rebels argue that higher levels of education mean better income opportunities and thus
lower incentives to join rebel armies (Collier & Hoeffler, 2004). Similarly, Barakt and Urdal
(2009) find that high percentages of young men (youth bulges) are more likely to increase the
risk of conflict in societies where male secondary education is low. Arguments focusing on
stability hold that education increases the ability of people to participate in decision-making
processes in a non-violent way (Hanf & Bauerle, 2009).
With regard to conflicts in resource-scarce countries, two different impacts of education seem
logical. Firstly, education provides opportunities for income and livelihood beyond living off
subsistence agriculture in areas where this is not feasible. In addition, a better-educated
society will be more able to adapt to environmental change. These arguments, however, have
1 4 4 I n e q u a l i t y a n d A d a p t i v e S k i l l s
rarely been discussed in case studies. A case study of Ethiopia (Flintan & Tamrat, 2002, p.
275), for instance, points out that 80% of the indigenous population in the Afar River Basin
rely on subsistence farming and that the level of education is low but fail to discuss how this
might have affected violence in the area.
When it comes to the capacies to adapt, primary education and literacy, which much of the
conflict literature focuses on is of less relevance, even though there are studies showing that
even relatively low levels of formal education can increase the capacities to adapt on an
individual level (Wamsler, 2011). The focus here is on tertiary rather than on primary or
secondary education since this captures the theoretical argument about adaptive skills better.
To put in place the type of measures mentioned above (e.g. legal regimes, irrigation
technologies, emergency credit lines) highly-skilled personnel is needed, which is captured
better by focusing on university graduates than on literacy rates or primary school enrolment
rates. As the rate of people with a high level of education is not only determined by the
number of people educated but also by the number of highly-skilled people that emigrate,
the brain drain also plays a role in determining adaptive skills of a society. Similar to
technology, I assume that high levels of knowledge are a mitigating factor:
H7: Countries with high levels of knowledge remain peaceful. High levels of knowledge are a
sufficient condition for peace.
H8: Conflict countries have low levels of knowledge. Low levels of knowledge are a necessary
condition for conflict.
OPERATIONALISATION AND CALIBRATION OF CONDITIONS
The theoretical explanations and the hypotheses laid out above lead to a total of eight
conditions. There are four conditions linked to inequality (uneven economic development
between groups, economic inequality, inequality in political power and gender inequality) and
four focusing on adaptive skills (access to science and technology, tertiary education, access
to agricultural research and brain drain). Data for these conditions come from various
indicators. As in the previous chapters, I use data from the years prior to the conflict in the
conflict cases to avoid reverse causalities. Where this was not available, I used the closest
available year. For peaceful cases, I use the average over the entire period in order to reduce
the impact of one-time events such as natural disasters, for instance. The raw data is
calibrated using the “calibrate” function in fsQCA, which turns raw data into scores between
zero and one using thresholds specified by the researcher60. The thresholds I used and the
reasoning for these thresholds is given below.
60 For an overview of raw and calibrated data as well as the years data was taken from and details on data that is estimated using different sources please see Table E.2, Table E.3 and Table E.4 in the appendix.
I n e q u a l i t y a n d A d a p t i v e S k i l l s 1 4 5
UNEVEN ECONOMIC DEVELOPMENT BETWEEN GROUPS [UNEVEN]
Data on uneven economic development along group lines comes from the Fund for Peace’s
Failed States Index (2013b). The Failed States Index includes 12 indicators, which are assessed
through a specialised content-analysis software. In assessing uneven economic development,
the authors argue that “when there are ethnic, religious, or regional disparities, the governed
tend to be uneven in their commitment to the social contract” (The Fund for Peace, 2013b).
The indicator includes aspects related to measures such as the Gini coefficient and income
shares of the highest and lowest 10% but also to uneven service delivery such as urban-rural
service distribution and access to improved services as well as measures of the population
living in slums. Generally, the information given by the Fund for Peace on the Index’s
methodology and, in particular, the data used is not comprehensive. The index is first
available in the year 2005, but whether data comes from earlier years is not clear. For this
reason, there is a possibility of feedback loops and reverse causalities with this indicator.
Countries are scored between one and 10 with higher numbers representing more
unevenness. In this study, countries are calibrated using data gaps with the threshold for
countries within the set of countries with high levels of uneven economic development set at
9, the crossover threshold set at 7 and the threshold for fully out of the set set at 3.
ECONOMIC INEQUALITY [INEQ]
Economic inequality is most frequently measured by the Gini coefficient or index, which
measures the inequality between individuals in terms of, for instance, wealth or income. In
this study, the focus is on the distribution of income or consumption (depending on data
available) using a dataset provided by the World Bank (2013a). In the Gini coefficient, a value
of zero corresponds to a situation of total equality (with everyone earning the same amount)
while a value of one (or 100 for the gini index) refers to a situation of total inequality (one
person earning everything). While this means that all values fall between zero and one as they
need to for a fuzzy-set analysis, very high and low values do not usually occur in bigger groups
of individuals. In my samples all values fall between 24.9 (Japan) and 63.2 (Lesotho), providing
insufficient spread across the spectrum. For this reason, the data is recalibrated using
naturally occurring gaps in the data at 25 for fully out of the set of countries with high levels
of inequality and 47 for countries fully in the set of countries with high levels of inequality.
The crossover threshold is set at 36.
INEQUALITY IN POLITICAL POWER [EPR]
The fluid and multiple nature of ethnic identities makes measuring ethnic groups a difficult
task. Often different identities at different levels exists (e.g. belonging to an ethnic group as
well as a subgroup). Ethnic belonging is context specific (the same person might identify
themselves as American, Caucasian or of Irish descent, for instance, depending on the
situation). Over the years many attempts have been made by researchers to capture the
ethnic makeup of countries, with a number of datasets based on the Atlas Narodov Mira, a
listing of ethnic groups done by Soviet ethnographers in the 1960s (e.g. Easterly & Levine,
1997). Other attempts include the fractionalization index by Alesina et al. (2003), mostly
1 4 6 I n e q u a l i t y a n d A d a p t i v e S k i l l s
based on data from the Encyclopedia Britannica and a study by Fearon (2003) who constructs
a measure of cultural diversity that includes a measure of how close different groups in
society are, based on similarities in their languages. In this study, I use the ethnic power
relations (EPR) dataset (Cederman, Min, & Wimmer, 2009) as it measures not only which
groups exist but also whether they are included in the political game. This is much closer to
the theoretical arguments laid out above, where the exclusion from power plays a more
important role than merely the existence of different groups. The EPR dataset is based on a
survey of country and regional experts. For each country the groups relevant to the political
game at a given time are given. The lines among which these groups are defined are not
necessarily ethnic, but also include linguistic, religious or regional groups. The salience of
these groups can change over time. All groups were then coded according to their access to
power. Groups could be considered to have a monopoly or a dominant hold on power, but
they could also be considered senior or junior partners in power-sharing regimes. In terms of
exclusion from central power, groups are coded as having regional autonomy or as powerless
or even as discriminated. The EPR dataset focuses on country nationals as non-nationals play
only a limited role in the domestic political game. This means that high numbers of non-
national inhabitants (for instance in the Arab Gulf states) are not coded as excluded from
political power. It is possible that the exclusion of a large percentage of inhabitants
contributes to grievances and violent conflict. This has not been the case in my sample,
however, as those countries with the highest percentage of foreign-born inhabitants in my
sample are all peaceful61.
The Ethnic Power Relations (EPR) dataset is not available for all countries in my dataset.
Therefore, I have assessed data for the missing cases using case knowledge and desk research.
As data on ethnic groups and exclusion and inclusion of groups are often contested or not
available, this is difficult. However, I have consulted various, independent resources before
making any judgments to make these assessments as robust as possible. As for the share of
the excluded, their exact status (i.e. merely excluded or discriminated against) is not
distinguished here, I am only assessing the relative size of the politically relevant groups and
their status as either included or excluded62. While Wimmer et al. (2009, p. 322) hypothesize
that a “high degree of ethnic exclusion will increase the likelihood of rebellion”, no clear
thresholds are given what should be considered a high degree of exclusion. Taking a closer
look at my data, I concluded to use 20% as a threshold for fully-in the dataset of ethnically
excluded groups as this is a naturally occurring gap in the data. The threshold for being more
in than out of the sample of countries with excluded groups is set fairly low at 5%. As even
fairly small excluded groups can have quite an impact, this is theoretically feasible. In addition,
it utilizes another (smaller) gap in the data. Finally, the threshold for fully out of the set of
61 The countries with the highest percentage of international migrants (2010 numbers) are: United Arab Emirates (86.7%), Qatar (83.2%), Kuwait (62.6%), Bahrain (53.2%), Singapore (42.6%) and Jordan (42.2%) (United Nations Population Division, 2013). 62 For more information on the situation in countries the EPR dataset does not cover see the footnotes to Table E.2 in the appendix.
I n e q u a l i t y a n d A d a p t i v e S k i l l s 1 4 7
countries that exclude parts of their population is set at 0, resulting in 13 countries where no
groups of the population are excluded from the political game.
GENDER INEQUALITY [GEND]
Various ways to measure the gender equality within a society exist (Dijkstra, 2006). In this
study, data on women’s economic, political and social rights from the CIRI Human Rights
database (Cingranelli & Richards, 2010) is used for reasons of data availability and coverage.
Three aspects of women’s rights are assessed separately: Political rights include rights such
as the right to vote, to run for political office, to hold elected and appointed government
positions, to join political parties and to petition government officials. Economic rights include
equal pay for equal work, free choice of profession or employment without the need to obtain
a husband or male relative's consent, the right to gainful employment without the need to
obtain a husband or male relative's consent, equality in hiring and promotion practices, job
security (maternity leave, unemployment benefits, no arbitrary firing or layoffs, etc.), non-
discrimination by employers, the right to be free from sexual harassment in the workplace,
the right to work at night, the right to work in occupations classified as dangerous and the
right to work in the military and the police force. Finally, social rights include the right to equal
inheritance, to enter into marriage on a basis of equality with men, to travel abroad, to obtain
a passport, to confer citizenship to children or a husband, to initiate a divorce, to own,
acquire, manage, and retain property brought into marriage, to participate in social, cultural,
and community activities, to an education, the freedom to choose a residence/domicile,
freedom from female genital mutilation of children and of adults without their consent and
freedom from forced sterilization. Countries are scored from zero to three taking into account
the legal situation and government practices in enforcing these rights. In this study, the
average of political, social and economic rights is used. This average is then calibrated in
accordance with the coding scheme of the dataset: the threshold for fully out the set of
countries with gender equality is set at 0.5 and the threshold for fully in is set at 1.5. The
crossover-threshold is set at 1.28, which was judged appropriately as it utilizes a small data
gap.
SCIENCE AND TECHNOLOGY [TECH]
Access to science and technology is operationalised using the “Science and Technology”
indicator from the Environmental Sustainability Index (Yale Center for Environmental Law and
Policy (YCELP), Center for International Earth Science Information Network (CIESIN), World
Economic Forum, & Joint Research Centre (JRC)/ European Commission, 2005). This indicator
is made up of five components: the World Economic Forum’s Innovation Index, the World
Telecommunication Union’s Digital Access Index, the female primary education completion
rate, the gross tertiary enrollment rate and the number of researchers per million inhabitants.
As such it combines two important aspects of adaptive capacity: access to technology and
human capital. To aggregate the indicators, they are converted to z-scores of which the
average is used. For missing countries, I followed the calculations of the index using available
raw data. Threshold are set at one and minus one (at one standard deviation). The crossover
1 4 8 I n e q u a l i t y a n d A d a p t i v e S k i l l s
threshold is set at 0. While the use of simple statistical measures as threshold is generally
discouraged for QCA (Ragin, 2008a, p. 118), qualitative thresholds are difficult to establish in
the context of this aggregated index. However, the thresholds used are in line case based
knowledge and categorises five countries as fully out of the set (Djibouti, Bhutan, Nepal,
Burundi and Haiti) and five countries as fully in the set (Singapore, Japan, South Korea, the
Netherlands and Switzerland).
TERTIARY EDUCATION [EDU]
The capacity to adapt to changes in environment is an important mechanism to prevent
conflicts over resources. Education is an important variable in this and I operationalise this in
terms of the percentage of the population having attained a tertiary degree. University-level
education captures a specific aspect of adaptive skills - being able to find new solutions -
better than some other measures. The focus on formal education does not imply that other
forms of knowledge and experience are not relevant. However, tertiary education is used
here not only for the skills and knowledge students acquire but also for the access to globally
available evidence-based research it provides. I employ data by Lee and Barro (2010) on
educational attainment and use the average percentage of people over the age of 25 with
tertiary degrees between 1990 and 2010. I calibrated countries where more than 10% of the
population have attained a tertiary degree as fully in and countries where less than 3% have
attained a tertiary degree as fully out of the set of countries with high adaptability skills. The
crossover point is set at seven percent. These thresholds are based on small data gaps and in
line with case based knowledge.
ACCESS TO AGRICULTURAL RESEARCH [ACCAGR]
Access to agricultural research is based on data provided by the International Fund for
Agriculture (IFAD), where the indicator “access to agricultural research and extension
services” is part of their performance-based allocation system and assesses to what “extent
the agricultural research and extension system is accessible to poor farmers, including women
farmers, and is responsive to the needs and priorities of the poor farmers” (IFAD, 2003, p. 18).
As the other condition provided by IFAD, data comes from the time period 2004 – 2010, so
there is a chance of feedback loops and reverse causalities. The condition was included as
agricultural research captures more specifically the needs of a agricultural population and
agricultural dependence is a sufficient condition for conflict. The research system as well as
the availability of research to farmers is evaluated and countries are scored from one to six
with six being the best score. Countries are considered fully in the set with a score of five or
higher, and fully out of the set with a score of three or lower, which means that agricultural
research system is “weak and does not address the needs of poor farmers” (IFAD, 2003, p.
18). As a score of four stands for “major efforts to improve the participation of poor farmers“
(IFAD, 2003, p. 8), which points to more in that out of the set of countries with access to
agricultural research, the crossover threshold is set between three and four at 3.5.
I n e q u a l i t y a n d A d a p t i v e S k i l l s 1 4 9
BRAIN DRAIN [BRAIN]
Another factor that is frequently credited with reducing the level of skilled personnel, in
particular in developing countries is the migration of skilled personnel to other countries
(Kapur & McHale, 2005). For this reason, I am including a measure of the emigration rate of
people with high levels of education between 1990 and 2010 from the World Bank’s panel
data on international migration (Schiff & Sjoblom, 2012). Countries are calibrated as fully in
the set of countries with high levels of brain drain with a emigration rate of skilled personnel
of 15% or above. Cases are calibrated as fully out of the set with an emigration rate of 3% or
less. The crossover threshold is set at 5.5%. These thresholds are based on data gaps and in
line with case-based knowledge.
ANALYSIS
Recall that QCA does not assume causality to be symmetric, i.e. if the presence of A is
sufficient for the outcome, it is not assumed that the absence of A is sufficient for the non-
outcome. Therefore the analysis of the conflict outcome tells us little about the analysis of
the peace outcome and both outcomes are analyzed separately. In both cases, I first focus on
the analysis of necessity and then on the analysis of sufficiency. The analysis of the conflict
outcome shows two necessary conditions, high uneven development between groups and
low levels of tertiary education. This is mirrored in the sufficient pathway, which combines
high levels of uneven development between groups and low levels of tertiary education.
However, this combination is not very robust as it changes with the inclusion of different
conditions.
CONFLICT OUTCOME: ANALYSIS OF NECESSITY
The analysis of necessary conditions for the conflict outcome shows two conditions that stand
out63. With a consistency64 of 0.89, low levels of tertiary education are very close to the 0.90
threshold for a necessary condition. With a consistency of 0.90, uneven economic
development is a necessary condition for conflict, meaning that all (or almost all) countries
with a conflict outcome experience high levels of uneven development.
63 For an overview of all consistency and coverage scores see Table E.5 in the appendix. 64 Consistency scores give the degree to which empirical evidence supports the existence of a set-theoretic relationship
(Rihoux & Ragin, 2008, p. 183). Coverage scores assess the relation in size between the condition set and the outcome set
(C. Q. Schneider & Wagemann, 2012, p. 325).
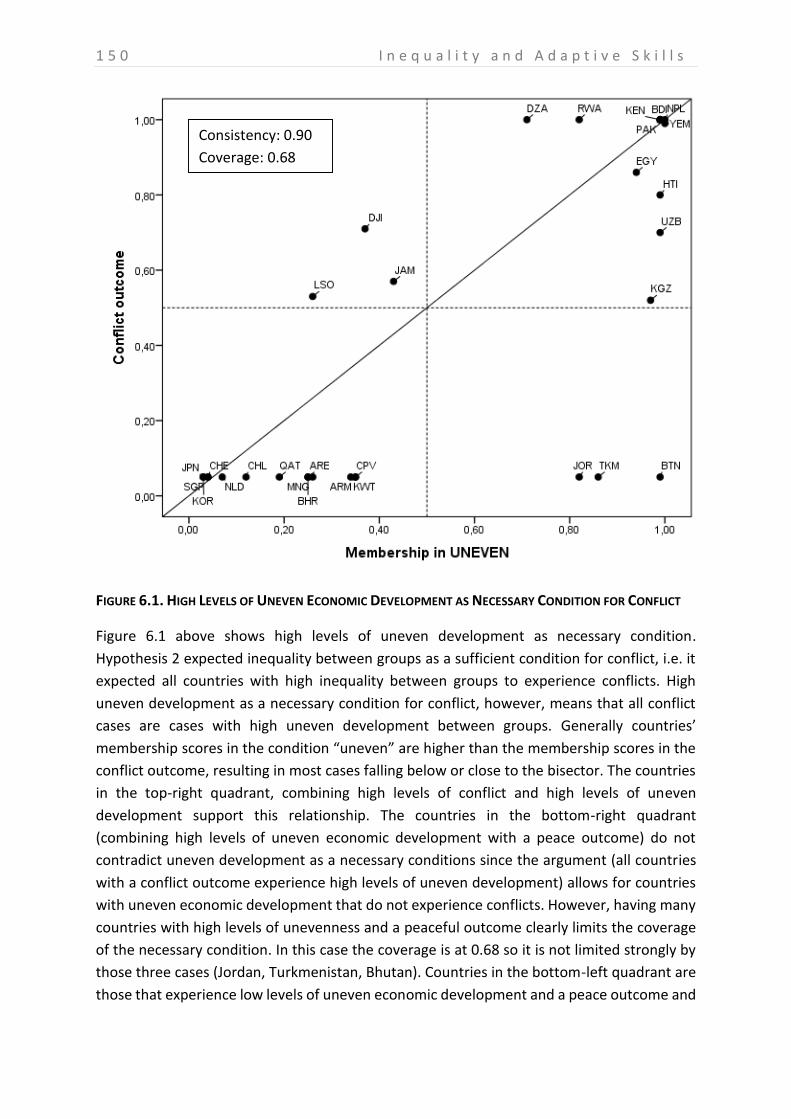
1 5 0 I n e q u a l i t y a n d A d a p t i v e S k i l l s
FIGURE 6.1. HIGH LEVELS OF UNEVEN ECONOMIC DEVELOPMENT AS NECESSARY CONDITION FOR CONFLICT
Figure 6.1 above shows high levels of uneven development as necessary condition.
Hypothesis 2 expected inequality between groups as a sufficient condition for conflict, i.e. it
expected all countries with high inequality between groups to experience conflicts. High
uneven development as a necessary condition for conflict, however, means that all conflict
cases are cases with high uneven development between groups. Generally countries’
membership scores in the condition “uneven” are higher than the membership scores in the
conflict outcome, resulting in most cases falling below or close to the bisector. The countries
in the top-right quadrant, combining high levels of conflict and high levels of uneven
development support this relationship. The countries in the bottom-right quadrant
(combining high levels of uneven economic development with a peace outcome) do not
contradict uneven development as a necessary conditions since the argument (all countries
with a conflict outcome experience high levels of uneven development) allows for countries
with uneven economic development that do not experience conflicts. However, having many
countries with high levels of unevenness and a peaceful outcome clearly limits the coverage
of the necessary condition. In this case the coverage is at 0.68 so it is not limited strongly by
those three cases (Jordan, Turkmenistan, Bhutan). Countries in the bottom-left quadrant are
those that experience low levels of uneven economic development and a peace outcome and
Consistency: 0.90
Coverage: 0.68
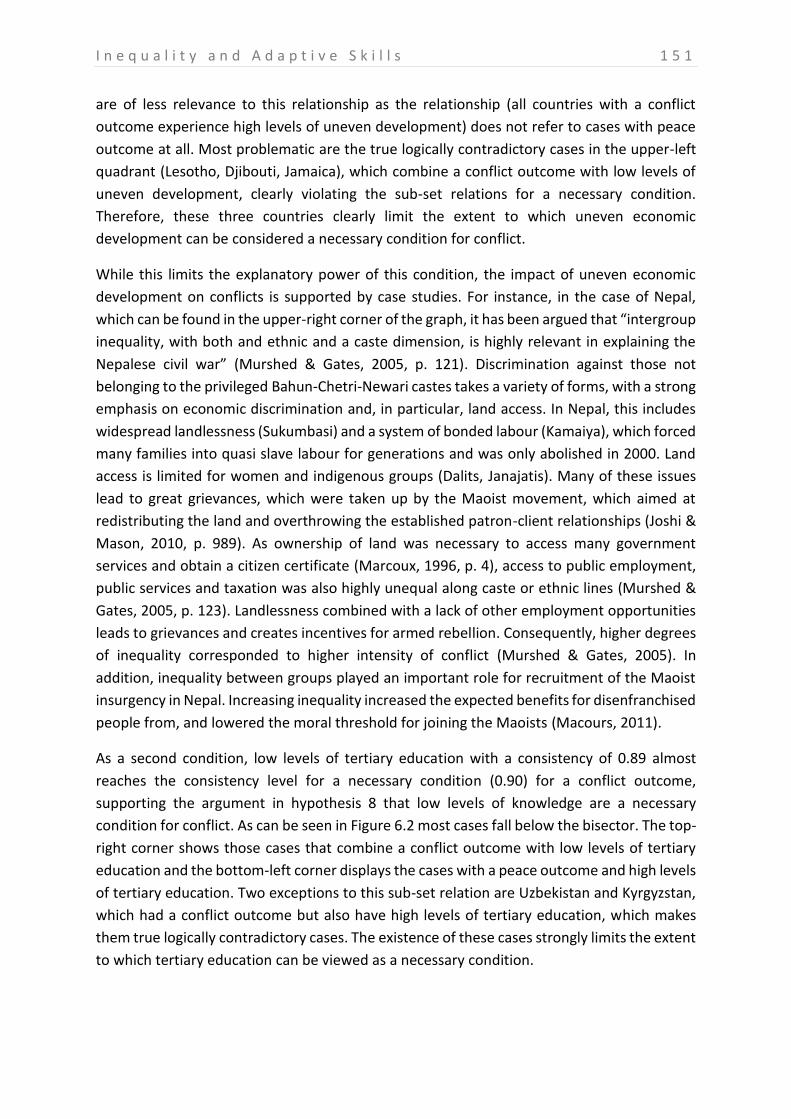
I n e q u a l i t y a n d A d a p t i v e S k i l l s 1 5 1
are of less relevance to this relationship as the relationship (all countries with a conflict
outcome experience high levels of uneven development) does not refer to cases with peace
outcome at all. Most problematic are the true logically contradictory cases in the upper-left
quadrant (Lesotho, Djibouti, Jamaica), which combine a conflict outcome with low levels of
uneven development, clearly violating the sub-set relations for a necessary condition.
Therefore, these three countries clearly limit the extent to which uneven economic
development can be considered a necessary condition for conflict.
While this limits the explanatory power of this condition, the impact of uneven economic
development on conflicts is supported by case studies. For instance, in the case of Nepal,
which can be found in the upper-right corner of the graph, it has been argued that “intergroup
inequality, with both and ethnic and a caste dimension, is highly relevant in explaining the
Nepalese civil war” (Murshed & Gates, 2005, p. 121). Discrimination against those not
belonging to the privileged Bahun-Chetri-Newari castes takes a variety of forms, with a strong
emphasis on economic discrimination and, in particular, land access. In Nepal, this includes
widespread landlessness (Sukumbasi) and a system of bonded labour (Kamaiya), which forced
many families into quasi slave labour for generations and was only abolished in 2000. Land
access is limited for women and indigenous groups (Dalits, Janajatis). Many of these issues
lead to great grievances, which were taken up by the Maoist movement, which aimed at
redistributing the land and overthrowing the established patron-client relationships (Joshi &
Mason, 2010, p. 989). As ownership of land was necessary to access many government
services and obtain a citizen certificate (Marcoux, 1996, p. 4), access to public employment,
public services and taxation was also highly unequal along caste or ethnic lines (Murshed &
Gates, 2005, p. 123). Landlessness combined with a lack of other employment opportunities
leads to grievances and creates incentives for armed rebellion. Consequently, higher degrees
of inequality corresponded to higher intensity of conflict (Murshed & Gates, 2005). In
addition, inequality between groups played an important role for recruitment of the Maoist
insurgency in Nepal. Increasing inequality increased the expected benefits for disenfranchised
people from, and lowered the moral threshold for joining the Maoists (Macours, 2011).
As a second condition, low levels of tertiary education with a consistency of 0.89 almost
reaches the consistency level for a necessary condition (0.90) for a conflict outcome,
supporting the argument in hypothesis 8 that low levels of knowledge are a necessary
condition for conflict. As can be seen in Figure 6.2 most cases fall below the bisector. The top-
right corner shows those cases that combine a conflict outcome with low levels of tertiary
education and the bottom-left corner displays the cases with a peace outcome and high levels
of tertiary education. Two exceptions to this sub-set relation are Uzbekistan and Kyrgyzstan,
which had a conflict outcome but also have high levels of tertiary education, which makes
them true logically contradictory cases. The existence of these cases strongly limits the extent
to which tertiary education can be viewed as a necessary condition.
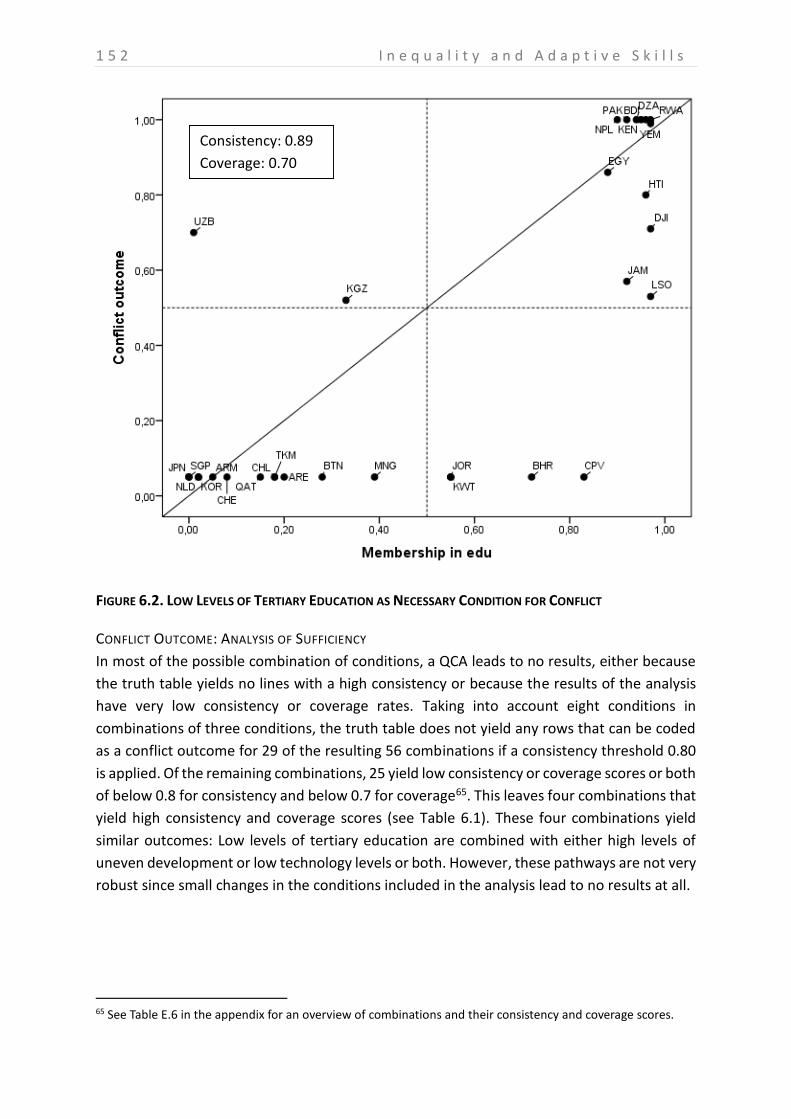
1 5 2 I n e q u a l i t y a n d A d a p t i v e S k i l l s
FIGURE 6.2. LOW LEVELS OF TERTIARY EDUCATION AS NECESSARY CONDITION FOR CONFLICT
CONFLICT OUTCOME: ANALYSIS OF SUFFICIENCY
In most of the possible combination of conditions, a QCA leads to no results, either because
the truth table yields no lines with a high consistency or because the results of the analysis
have very low consistency or coverage rates. Taking into account eight conditions in
combinations of three conditions, the truth table does not yield any rows that can be coded
as a conflict outcome for 29 of the resulting 56 combinations if a consistency threshold 0.80
is applied. Of the remaining combinations, 25 yield low consistency or coverage scores or both
of below 0.8 for consistency and below 0.7 for coverage65. This leaves four combinations that
yield high consistency and coverage scores (see Table 6.1). These four combinations yield
similar outcomes: Low levels of tertiary education are combined with either high levels of
uneven development or low technology levels or both. However, these pathways are not very
robust since small changes in the conditions included in the analysis lead to no results at all.
65 See Table E.6 in the appendix for an overview of combinations and their consistency and coverage scores.
Consistency: 0.89
Coverage: 0.70
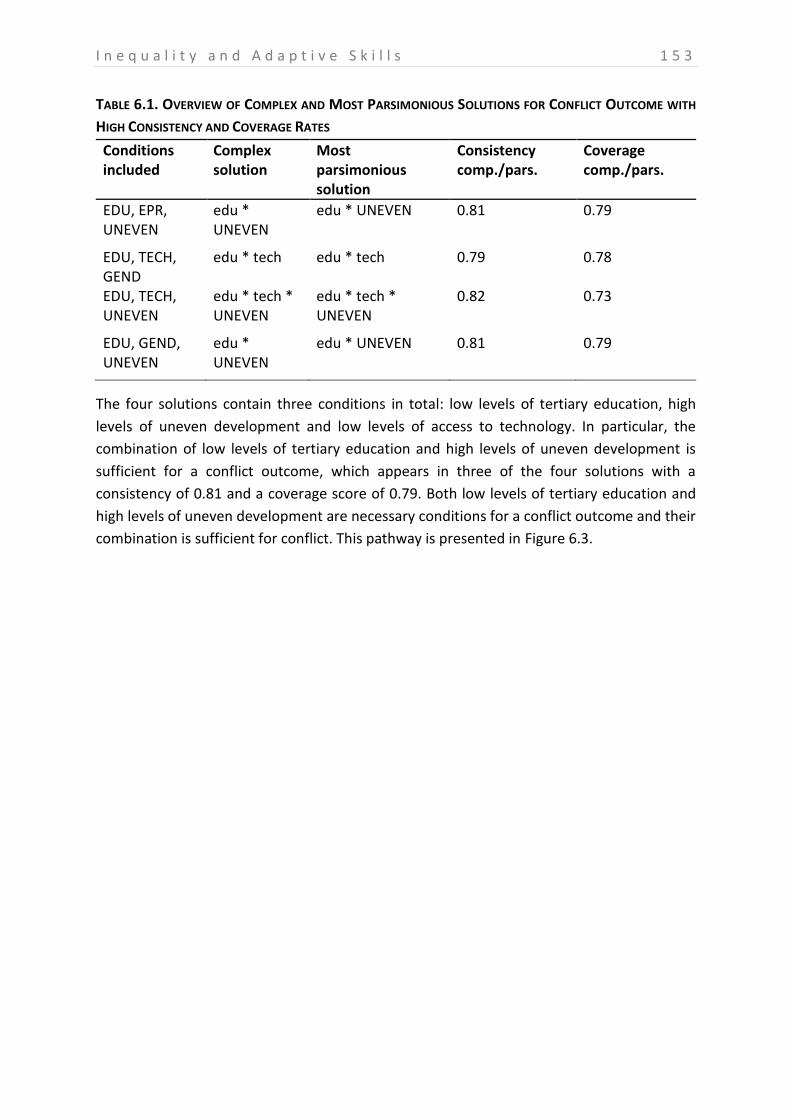
I n e q u a l i t y a n d A d a p t i v e S k i l l s 1 5 3
TABLE 6.1. OVERVIEW OF COMPLEX AND MOST PARSIMONIOUS SOLUTIONS FOR CONFLICT OUTCOME WITH
HIGH CONSISTENCY AND COVERAGE RATES
Conditions included
Complex solution
Most parsimonious solution
Consistency comp./pars.
Coverage comp./pars.
EDU, EPR, UNEVEN
edu * UNEVEN
edu * UNEVEN 0.81 0.79
EDU, TECH, GEND
edu * tech edu * tech 0.79 0.78
EDU, TECH, UNEVEN
edu * tech * UNEVEN
edu * tech * UNEVEN
0.82 0.73
EDU, GEND, UNEVEN
edu * UNEVEN
edu * UNEVEN 0.81 0.79
The four solutions contain three conditions in total: low levels of tertiary education, high
levels of uneven development and low levels of access to technology. In particular, the
combination of low levels of tertiary education and high levels of uneven development is
sufficient for a conflict outcome, which appears in three of the four solutions with a
consistency of 0.81 and a coverage score of 0.79. Both low levels of tertiary education and
high levels of uneven development are necessary conditions for a conflict outcome and their
combination is sufficient for conflict. This pathway is presented in Figure 6.3.
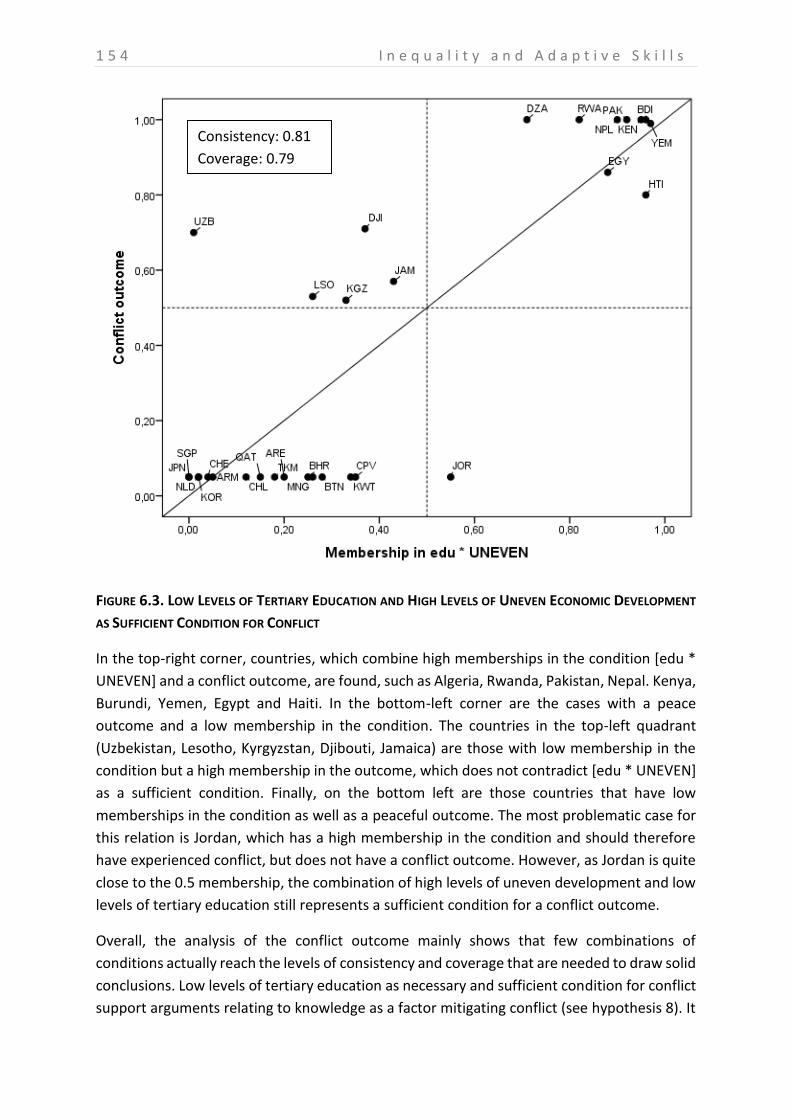
1 5 4 I n e q u a l i t y a n d A d a p t i v e S k i l l s
FIGURE 6.3. LOW LEVELS OF TERTIARY EDUCATION AND HIGH LEVELS OF UNEVEN ECONOMIC DEVELOPMENT
AS SUFFICIENT CONDITION FOR CONFLICT
In the top-right corner, countries, which combine high memberships in the condition [edu *
UNEVEN] and a conflict outcome, are found, such as Algeria, Rwanda, Pakistan, Nepal. Kenya,
Burundi, Yemen, Egypt and Haiti. In the bottom-left corner are the cases with a peace
outcome and a low membership in the condition. The countries in the top-left quadrant
(Uzbekistan, Lesotho, Kyrgyzstan, Djibouti, Jamaica) are those with low membership in the
condition but a high membership in the outcome, which does not contradict [edu * UNEVEN]
as a sufficient condition. Finally, on the bottom left are those countries that have low
memberships in the condition as well as a peaceful outcome. The most problematic case for
this relation is Jordan, which has a high membership in the condition and should therefore
have experienced conflict, but does not have a conflict outcome. However, as Jordan is quite
close to the 0.5 membership, the combination of high levels of uneven development and low
levels of tertiary education still represents a sufficient condition for a conflict outcome.
Overall, the analysis of the conflict outcome mainly shows that few combinations of
conditions actually reach the levels of consistency and coverage that are needed to draw solid
conclusions. Low levels of tertiary education as necessary and sufficient condition for conflict
support arguments relating to knowledge as a factor mitigating conflict (see hypothesis 8). It
Consistency: 0.81
Coverage: 0.79
I n e q u a l i t y a n d A d a p t i v e S k i l l s 1 5 5
also shows a role for tertiary education rather than any of the other conditions capturing
adaptive capacity such as access to science and technology or access to agricultural research.
Tertiary education as measure of adaptive skills is broader as it focuses on the general level
of skill rather than on specific aspects (such as science and technology or agricultural
research), which might be more relevant in specific cases whereas tertiary education is
relevant in all countries. High levels of uneven development as a necessary and sufficient
condition for conflict supports arguments relating to inequality between groups rather than
economic inequality between individuals or political or gender inequality.
The situation is quite different in the case of the peace outcome. This supports the argument
that with mitigating conditions such as education and access to technology, it is less about
the absence of these adaptive skills leading to conflict and more about the presence of
adaptive skills that prevents conflicts from erupting.
PEACE OUTCOME: ANALYSIS OF NECESSITY
The analysis of necessary conditions for a peace outcome shows that there are no conditions
that reach the required threshold of 0.90. High levels of tertiary education and high levels of
access to technology (both with a consistency of 0.73) come closest to this threshold66 but
are far from being considered as necessary conditions.
PEACE OUTCOME: ANALYSIS OF SUFFICIENCY
Analysing the sufficient conditions gives generally higher consistency and coverage scores
than the analysis of the conflict outcome. In particular, high levels of education or the
combination of high technology levels and low levels of unequal development are sufficient
for a peace outcome as can be seen in Table 6.2.
66 For an overview of all consistency and coverage scores see Table E.7 in the appendix.
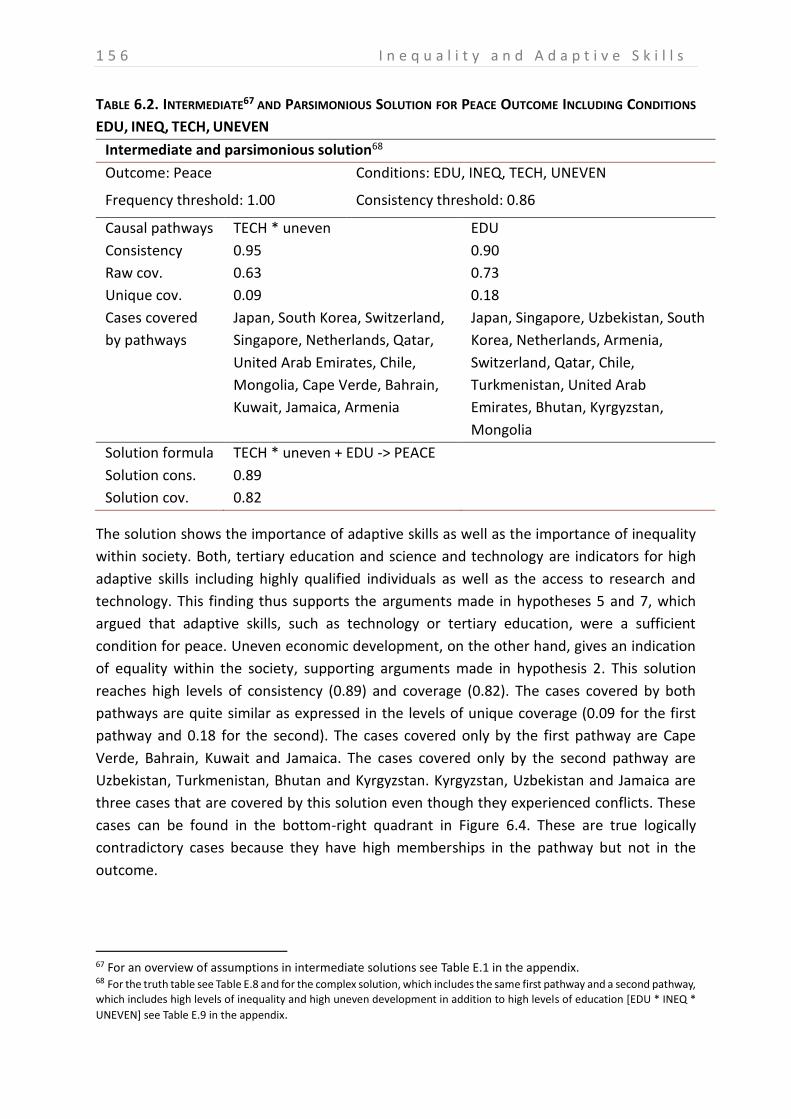
1 5 6 I n e q u a l i t y a n d A d a p t i v e S k i l l s
TABLE 6.2. INTERMEDIATE67 AND PARSIMONIOUS SOLUTION FOR PEACE OUTCOME INCLUDING CONDITIONS
EDU, INEQ, TECH, UNEVEN
Intermediate and parsimonious solution68
Outcome: Peace Conditions: EDU, INEQ, TECH, UNEVEN
Frequency threshold: 1.00 Consistency threshold: 0.86
Causal pathways TECH * uneven EDU
Consistency 0.95 0.90
Raw cov. 0.63 0.73
Unique cov. 0.09 0.18
Cases covered
by pathways
Japan, South Korea, Switzerland,
Singapore, Netherlands, Qatar,
United Arab Emirates, Chile,
Mongolia, Cape Verde, Bahrain,
Kuwait, Jamaica, Armenia
Japan, Singapore, Uzbekistan, South
Korea, Netherlands, Armenia,
Switzerland, Qatar, Chile,
Turkmenistan, United Arab
Emirates, Bhutan, Kyrgyzstan,
Mongolia
Solution formula TECH * uneven + EDU -> PEACE
Solution cons. 0.89
Solution cov. 0.82
The solution shows the importance of adaptive skills as well as the importance of inequality
within society. Both, tertiary education and science and technology are indicators for high
adaptive skills including highly qualified individuals as well as the access to research and
technology. This finding thus supports the arguments made in hypotheses 5 and 7, which
argued that adaptive skills, such as technology or tertiary education, were a sufficient
condition for peace. Uneven economic development, on the other hand, gives an indication
of equality within the society, supporting arguments made in hypothesis 2. This solution
reaches high levels of consistency (0.89) and coverage (0.82). The cases covered by both
pathways are quite similar as expressed in the levels of unique coverage (0.09 for the first
pathway and 0.18 for the second). The cases covered only by the first pathway are Cape
Verde, Bahrain, Kuwait and Jamaica. The cases covered only by the second pathway are
Uzbekistan, Turkmenistan, Bhutan and Kyrgyzstan. Kyrgyzstan, Uzbekistan and Jamaica are
three cases that are covered by this solution even though they experienced conflicts. These
cases can be found in the bottom-right quadrant in Figure 6.4. These are true logically
contradictory cases because they have high memberships in the pathway but not in the
outcome.
67 For an overview of assumptions in intermediate solutions see Table E.1 in the appendix. 68 For the truth table see Table E.8 and for the complex solution, which includes the same first pathway and a second pathway,
which includes high levels of inequality and high uneven development in addition to high levels of education [EDU * INEQ *
UNEVEN] see Table E.9 in the appendix.
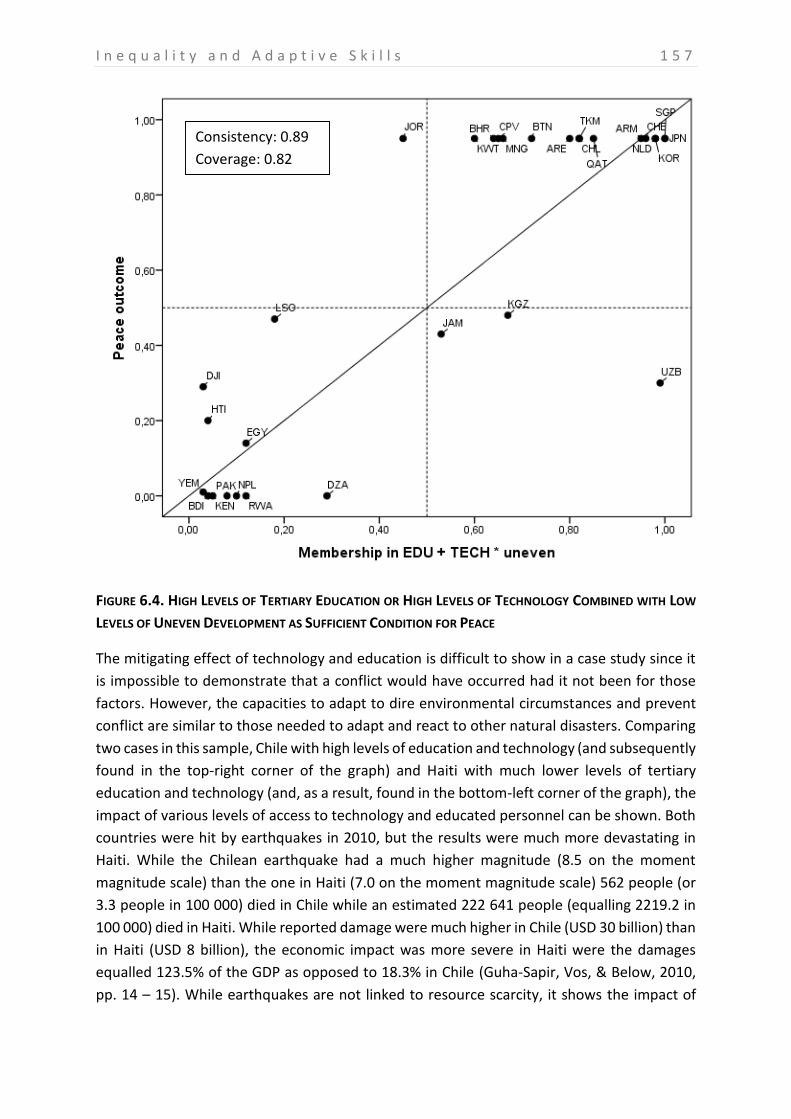
I n e q u a l i t y a n d A d a p t i v e S k i l l s 1 5 7
FIGURE 6.4. HIGH LEVELS OF TERTIARY EDUCATION OR HIGH LEVELS OF TECHNOLOGY COMBINED WITH LOW
LEVELS OF UNEVEN DEVELOPMENT AS SUFFICIENT CONDITION FOR PEACE
The mitigating effect of technology and education is difficult to show in a case study since it
is impossible to demonstrate that a conflict would have occurred had it not been for those
factors. However, the capacities to adapt to dire environmental circumstances and prevent
conflict are similar to those needed to adapt and react to other natural disasters. Comparing
two cases in this sample, Chile with high levels of education and technology (and subsequently
found in the top-right corner of the graph) and Haiti with much lower levels of tertiary
education and technology (and, as a result, found in the bottom-left corner of the graph), the
impact of various levels of access to technology and educated personnel can be shown. Both
countries were hit by earthquakes in 2010, but the results were much more devastating in
Haiti. While the Chilean earthquake had a much higher magnitude (8.5 on the moment
magnitude scale) than the one in Haiti (7.0 on the moment magnitude scale) 562 people (or
3.3 people in 100 000) died in Chile while an estimated 222 641 people (equalling 2219.2 in
100 000) died in Haiti. While reported damage were much higher in Chile (USD 30 billion) than
in Haiti (USD 8 billion), the economic impact was more severe in Haiti were the damages
equalled 123.5% of the GDP as opposed to 18.3% in Chile (Guha-Sapir, Vos, & Below, 2010,
pp. 14 – 15). While earthquakes are not linked to resource scarcity, it shows the impact of
Consistency: 0.89
Coverage: 0.82
1 5 8 I n e q u a l i t y a n d A d a p t i v e S k i l l s
adaptive skills when faced with natural hazards. The type of capacities necessary to prepare
for the impact of an earthquake are similar to those necessary to prepare for the adverse
effect of other environmental issues and the level of effectiveness of adaptive skills is
important for the social and economic consequences of natural hazards (Heltberg, Siegel, &
Jorgensen, 2010). With regard to armed conflict, factors that mitigate the effects of resource
scarcity (such as the availability of technology or skilled personnel) can prevent the
mechanisms explained in previous chapters from taking place. While mitigating the effects of
dire environmental circumstances needs different technologies and skills that effectively
responding to a natural disaster, the capacities needed are similar. For instance,
dissemination of agricultural technology that increases yields and can thus prevent insecure
livelihoods, thereby reducing conflict over land might be an adequate step in a resource-
scarce country. In a country prone to earthquakes, putting in place back-up communication
systems that enable the coordination of relief efforts might be important. However, at the
heart of both these steps is the capacity to correctly identify risks the country faces, have the
capacities to be informed about, adapt or develop appropriate technologies and have the
capacities to put them in place. Of course, this comparison is imperfect. For instance, the
percentage of the country affected by the earthquake was much lower in Chile, which meant
there were more facilities available that had not been affected. Chile is also much more
developed than Haiti and development is closely linked to adaptive skills. Nevertheless, the
differences in the reaction differed so much that the impact of capacities to adapt can be
shown.
The experience in Haiti showed that the country was not prepared for a major earthquake,
resulting in a lack of adequate infrastructure prior to and following the earthquake. This
refers, in particular, to the low quality standards of physical infrastructure, the lack of
technological infrastructure available in the aftermath of the earthquake and the lack of
skilled personnel. The collapse of many buildings, which caused most fatalities, was aided by
the low quality of many buildings and a lack of urban planning. Many of the taller structures
were built with unreinforced support structures and relatively heavy slab floors and many of
the single-storey houses were built without reinforcements as well. In addition, many
buildings lacked a strong foundation to anchor the houses (Kovacs, 2010, p. 4). The lack of
urban planning and building oversight led to a Port-au-Prince being a sprawling city built with
substandard materials, many of which collapsed during the earthquake (Gros, 2011, p. 142).
In particular, it meant that many buildings were built in areas with soft soils and on steep
slopes, which led to further damage due to landslides (Kovacs, 2010, p. 5). The particular
vulnerability of people living in informal settlements supports the argument about high levels
of technology in combination with low levels of uneven development. In highly uneven
societies even if technology is available, it is unlikely that groups with the lowest economic
development can reap the full benefits of the mitigating effects of technology. It was not only
buildings but also much of the public infrastructure including roads, the airport and several
hospitals that were damaged, limiting the access for relief efforts (Kovacs, 2010, p. 5; Nelson,
I n e q u a l i t y a n d A d a p t i v e S k i l l s 1 5 9
Sigal, & Zambrano, 2010, p. 5). The lack of skilled personnel, in particular within government
ministries, has been seen as a key reason for the devastating impacts of the earthquake as
there were insufficient capacities in, for instance, the government agencies supervising
buildings in Port-au-Prince. Pierre-Louis (2011, p. 198) attributes this to general lack of
educated personnel and the brain drain away from government to foreign NGOs in Haiti as
those offer higher salaries and to foreign countries offering resident status to Haitian with
university degrees. Gros (2011, p. 149) argues that one of the step to prevent such a tragedy
from occurring again would be to reinstate the Haitian military as it would have “the technical
capability in the forms of heavy equipment, communications technology, and aerial
transportation” and skilled personnel as “perhaps half of its [the military’s] personnel would
be highly trained technical professionals: doctors, engineers, geologists, architects,
environmental scientists, operations managers, communications specialists, search and
rescue experts, and so on” (Gros, 2011, p. 150), underscoring the need for the two conditions
prevalent in the solution formula: availability of appropriate technology and skilled personnel.
The lack of these capacities (in addition to low funds and low state capacities) meant that
Haiti was not well-prepared for an emergency even though the country has experienced
earthquakes and hurricanes before. For instance, at the time of the earthquake, Haiti did not
have a contingency plan for any catastrophe and most communication with the exception of
two (or, according to Nelson et al. (2010, p. 11), one) radio stations broke down completely,
preventing government agencies from communicating with the public. Technological
solutions available to aid relief efforts were not in place and while technological solutions
such as mapping platforms that allow SMS information to be geo-referenced and mapped
were eventually used to great effect in relief efforts, the coordination to put them into place
was ad-hoc and therefore more complicated and long-winded than necessary. For instance,
Ushahidi, one mapping service, was only available to US marines working in relief efforts more
than two weeks after the earthquake and many key figures were not aware of the system
even a year after the disaster (Nelson et al., 2010, p. 14).
The situation was quite different in Chile, which has led to the conclusion that “the disparity
in the impact of these two earthquakes is in part explained by the differences in disaster
preparedness and the quality of housing, infrastructure and services” (IFRC, 2010, p. 11).
Better infrastructure refers to higher quality of buildings, meaning less of them collapsed and
to higher-quality infrastructure, meaning less of it was destroyed allowing better access for
search and rescue and relief efforts (The Economist, 2010a). Most buildings withstood the
earthquake with only minor damages, largely due to building codes that reflect the current
international engineering and design knowledge. As these codes are generally enforced, they
are applied widely. Most homes built since the 1970s, using wood frames or reinforced
masonry, sustained no or only minor damage during the earthquake. Of the taller structures
only four collapsed and 50 were damaged so severely that they had to be demolished (Kovacs,
2010, p. 8). While there was intensive damage, in particular to infrastructure, disrupting the
service delivery of water, electricity and phone lines in part of the country and damaging the
1 6 0 I n e q u a l i t y a n d A d a p t i v e S k i l l s
terminal of Santiago airport, the application of engineering know-how and appropriate
technology greatly limited the damage as well as the fatalities. In addition, Chile had much
higher capacities following the earthquake – not only with regards to the immediate rescue
medical efforts but also considering reconstruction. There was an effective insurance system
in place and the government has launched a housing reconstruction programme for USD 2.5
billion (Kovacs, 2010, p. 9), showing the importance of institutions based on human ingenuity.
Of course, many other factors, among them the lack of state capacity and capital to invest in
necessary infrastructure had a great impact on the extent of the damage (Gros, 2011). It is
difficult to disentangle these factors from those focused on here – the lack of skilled personnel
in agencies supervising buildings, for instance, can be seen as a matter of state capacities or
as matter of skilled personnel, depending on the perspective. The investment in state-of-the-
art technology is, of course, also determined by the available funds. However, this is not the
only relevant factor as evidenced by high-income countries such as Canada, which are not
investing in infrastructure at the level needed to withstand a natural disaster such as a
earthquake (Kovacs, 2010, pp. 17 – 18). Therefore, the application of appropriate technology
is not only dependent on the level of economic development or indeed the same thing as
being a highly developed country. In this thesis, the impact of state capacity on the link
between resource scarcity and conflict has been the focus of chapter 5 and the impact of
economic development has been explored in chapter 4. For this reason the focus in this
chapter and case study is on technology and skills while acknowledging the importance of
other factors. Chapter 7 brings these aspects together in a integrated analysis.
The combination of high levels of tertiary education or high levels of technology and low levels
of uneven development is rather robust as can be seen in Table 6.3 where inequality is
replaced by other conditions. The resulting parsimonious solutions all include in the [EDU +
TECH * uneven] solution displayed above.
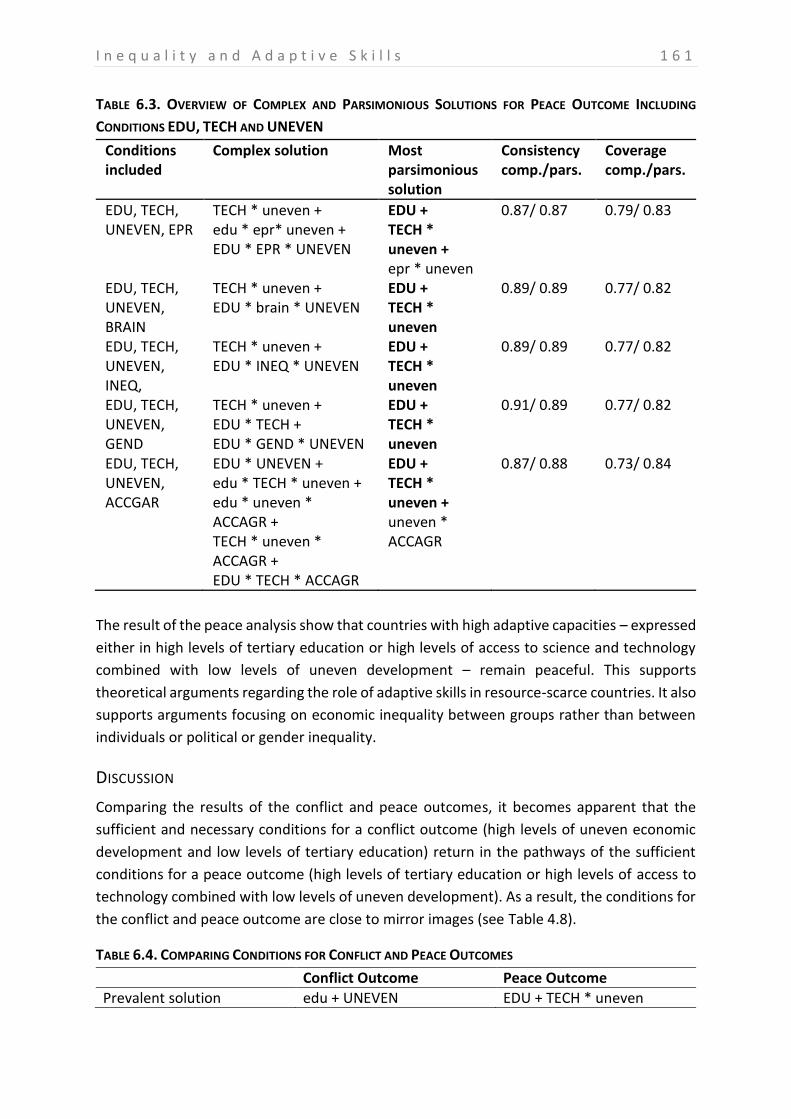
I n e q u a l i t y a n d A d a p t i v e S k i l l s 1 6 1
TABLE 6.3. OVERVIEW OF COMPLEX AND PARSIMONIOUS SOLUTIONS FOR PEACE OUTCOME INCLUDING
CONDITIONS EDU, TECH AND UNEVEN
Conditions included
Complex solution Most parsimonious solution
Consistency comp./pars.
Coverage comp./pars.
EDU, TECH, UNEVEN, EPR
TECH * uneven + edu * epr* uneven + EDU * EPR * UNEVEN
EDU + TECH * uneven + epr * uneven
0.87/ 0.87 0.79/ 0.83
EDU, TECH, UNEVEN, BRAIN
TECH * uneven + EDU * brain * UNEVEN
EDU + TECH * uneven
0.89/ 0.89 0.77/ 0.82
EDU, TECH, UNEVEN, INEQ,
TECH * uneven + EDU * INEQ * UNEVEN
EDU + TECH * uneven
0.89/ 0.89 0.77/ 0.82
EDU, TECH, UNEVEN, GEND
TECH * uneven + EDU * TECH + EDU * GEND * UNEVEN
EDU + TECH * uneven
0.91/ 0.89 0.77/ 0.82
EDU, TECH, UNEVEN, ACCGAR
EDU * UNEVEN + edu * TECH * uneven + edu * uneven * ACCAGR + TECH * uneven * ACCAGR + EDU * TECH * ACCAGR
EDU + TECH * uneven + uneven * ACCAGR
0.87/ 0.88 0.73/ 0.84
The result of the peace analysis show that countries with high adaptive capacities – expressed
either in high levels of tertiary education or high levels of access to science and technology
combined with low levels of uneven development – remain peaceful. This supports
theoretical arguments regarding the role of adaptive skills in resource-scarce countries. It also
supports arguments focusing on economic inequality between groups rather than between
individuals or political or gender inequality.
DISCUSSION
Comparing the results of the conflict and peace outcomes, it becomes apparent that the
sufficient and necessary conditions for a conflict outcome (high levels of uneven economic
development and low levels of tertiary education) return in the pathways of the sufficient
conditions for a peace outcome (high levels of tertiary education or high levels of access to
technology combined with low levels of uneven development). As a result, the conditions for
the conflict and peace outcome are close to mirror images (see Table 4.8).
TABLE 6.4. COMPARING CONDITIONS FOR CONFLICT AND PEACE OUTCOMES
Conflict Outcome Peace Outcome
Prevalent solution edu + UNEVEN EDU + TECH * uneven
1 6 2 I n e q u a l i t y a n d A d a p t i v e S k i l l s
However, these conditions were much stronger in the analysis of the peace outcome. While
many of the potential combinations of conditions did not yield an outcome at all, or yielded
outcomes with low levels of consistency and coverage, analysing the same combinations for
a peace outcome brought much stronger support for the solution formula shown above. In
addition, the consistency and coverage scores were much higher for the peace than for the
conflict outcome. This suggests that education, access to technology and uneven
development are more relevant for a peace than for a conflict outcome. The reason for this
lies in the mitigating effect of education and technology, which makes societies less
vulnerable for conflicts. This shows a key benefit of qualitative comparative analysis as a
method as it assumes asymmetric causality, which results in separate analyses for conflict and
peace cases. These differences in the impact of mitigating factors in conflict and peace cases
would not have been apparent with statistical methods, for instance.
My results also show an important role for tertiary education, with low levels of tertiary
education being a necessary condition for a conflict outcome and high levels of education as
one path in the sufficient solution for a peace outcome. This supports the general mitigating
effect of education that has been emerging in the wider conflict literature (Dixon, 2009, pp.
715 – 716). While it has frequently been argued that the key link between formalised
education and higher adaptive capacities is mainly through higher income and higher socio-
economic status (e.g. Cutter, Boruff, & Shirley, 2003, p. 248), a number of links between
higher levels of formal education and adaptive capacities such as increased awareness and
understanding of existing risk, greater access to, and provision of information on how to
reduce risks, higher acceptance and adequate use of institutional support and the
improvement of coping strategies exist (Wamsler, 2011, p. 30). In two case studies of low-
income settlements in Brazil and El Salvador, Wamsler (2011) shows that the adaptive
capacities of the individual people are influenced by their levels of education. However,
tertiary education has not received a lot of focus in the debate on education and conflict,
which centers around indicators such as literacy rates or primary or secondary enrolment
(Thyne, 2006) or the secondary enrolment of males, focusing on opportunity costs of joining
rebel groups and foregoing an education (Collier & Hoeffler, 2004).
The sufficient solution for a peace outcome also shows that having high levels of access to
technology and science in combination with low levels of uneven economic development is
sufficient for a peace outcome. The combinations of high access to technology and uneven
economic development highlights the role of vulnerable groups. Where technology and
science is in principle available, but does not reach all people due to high levels of uneven
economic development, this leaves certain groups in society vulnerable and increases
grievances, lowering the chances for a peaceful outcome. The notion of ingenuity reflected in
both, access to technology and science and in high levels of tertiary education plays an
important role in the current debate on social consequences of climate change and its focus
on adaptation and mitigation. However, ingenuity is a very broad notion including aspects of
political and legal institutions, education, technological innovation and more. While the
I n e q u a l i t y a n d A d a p t i v e S k i l l s 1 6 3
argument that societies need more ingenuity to solve the issues related to environmental
change is certainly true, it is also rather unsatisfactory as it is difficult to pinpoint what
ingenuity contains.
The chapter has examined the influence of societal inequality on conflict in resource-scarce
countries. While inequality is frequently mentioned as an important source of conflict in case
studies, it appeared of less relevance in this analysis. Of the three dimension of inequality –
economic inequality, inequality of political power and gender inequality, economic inequality
was the only one that appeared to matter. More specifically, uneven economic development
between different groups (or polarization) made a difference while economic inequality
between individuals did not. This supports the arguments put forward by Esteban and Ray
(1994) that polarization matters more than inequality for social conflict as well as the concept
of relative deprivation, which argues that deprivation relative to other groups or to the
perceived entitlement matters more than the actual level of development. However, Baten
and Mumme (2013) find a significant impact of both relative and absolute levels of
deprivation in a long-term study using anthropometric data. It also supports Østby’s (2008)
argument that socio-economic polarization leads to higher levels of conflict. Østby (2008, p.
151) differentiates between social and economic polarization with economic polarization
focusing on household assets and social polarization focusing on access to education as one
type of public service. The indicator used in this study includes both measures of income
inequality as well as measures of inequality in service delivery and therefore supports the
arguments Østby makes.
However, it is only the condition measuring uneven economic development between groups
that is relevant in this analysis, while another measure of economic inequality, measured in
terms of the gini coefficient [INEQ] is not. The gini coefficient measures across individuals, not
across groups, which might limit its explanatory power in terms of inequality between groups,
even though countries with high differences between different group usually display high gini
coefficients as well. The condition uneven economic development [UNEVEN], in contrast, is
named “uneven economic development along group lines” (The Fund for Peace, 2013a) and
focuses on “ethnic, religious or regional disparities” (The Fund for Peace, 2013b). However, it
is unclear exactly how this is measured. The sub-indicators mentioned in the methodology
section (gini coefficient, income share of highest 10%, income share of lowest 10%, urban-
rural service distribution, access to improved services, slum population) include one measure
referring to regional disparities (urban-rural service distribution) but does not explain how
exactly the different groups are included. The exact nature of the data collected and method
for data collection and analysis is not explained in detail, which makes it impossible to know
whether and to what extent differences between ethnic or religious groups are really taken
into account. This consequently limits the confidence in arguing that between-group
inequality definitely plays a greater role than inequality between individuals. As the indicators
of the index are only available from 2005 onwards, reverse causality (i.e. conflict leading to
1 6 4 I n e q u a l i t y a n d A d a p t i v e S k i l l s
uneven economic development between groups) is also possible as many of the conflicts in
the dataset took place before 2005.
Other conditions that were included in this analysis such as the level of brain drain or access
to agricultural research, turned out to not play an important role in the solution terms. While
there is no evidence that countries with a high brain drain have more - or conversely less -
graduates to begin with it is likely that the total number of university graduates matters more
than the level of brain drain. In addition, remittances from professionals abroad might help
to relieve poverty and decrease the likelihood for conflict. Access to agricultural research
might be covered by the more general conditions of access to science and technology.
However, combinations of conditions including access to agriculture for a conflict outcome
usually did not yield truth table rows with a sufficiently high consistency to code them “1” for
the conflict outcome69. When replacing science and technology or tertiary education in the
solution presented in Table 6.2 with access to agricultural research, those solutions that
include access to agricultural research have much lower consistency and coverage scores, and
the parsimonious solutions do not include ACCAGR as a condition for the most part70. This
suggests that the overall level of access to science and technology plays a more important
role than the more specific access to agricultural research.
CONCLUSION
This chapter has focused on factors in the social make-up in society: inequality in society and
the adaptive skills in society. Arguments relating to inequality were reviewed with a particular
focus on economic inequality, inequality of political power and gender inequality. The analysis
of both, the peace and conflict analysis showed that economic inequality mattered most in
explaining the (non-)onset of conflict. In particular, horizontal inequalities where economic
inequalities followed ethnic or groups lines had an impact on conflict. The level of adaptive
skills in conflict has been less in the focus of conflict researchers but has frequently discussed
in the light of the social consequences of climate change. While there are many potential ways
of defining and measuring adaptive skills, this chapter has focused on access to technology,
science and research. The analysis showed that the presence of adaptive skills had a much
greater impact on preventing conflict than the absence of adaptive skills had in causing
conflict. High levels of tertiary education or high levels of access to science and technology
combined with low levels of horizontal inequality are sufficient for a peaceful outcome, which
suggests that having high levels of skilled personnel or having access to technology for all
groups in society can help to prevent conflict.
69 See Table E.6 in the appendix. 70 See Table E.10 in the appendix
I n t e g r a t e d P a t h w a y s 1 6 5
Chapter 7: BRINGING ECONOMIC, POLITICAL AND SOCIAL EXPLANATIONS
TOGETHER
INTRODUCTION
So far, this thesis has explored different theoretical arguments explaining conflict and peace
and how these theories apply to resource-scarce countries. Chapter 4 has focused on
economic theories, linking development, dependence on exports and natural resources and
diversification to conflict. The analysis found two main pathways to conflict: Least developed
countries (characterised by high levels of agriculture and low levels of oil) and high levels of
oil combined with low levels of exports are sufficient for conflict. The analysis found two main
sufficient pathways for peace: Low levels of agriculture combined with high levels of exports
and low levels of agriculture combined with low levels of oil and poverty. These results
supports arguments linking the level of development to conflict and arguments that countries
that are integrated into the global economy are peaceful. Chapter 5 has focused on state-
based explanations, focusing on various aspects of state capacities. The analysis found one
main sufficient pathway for conflict, which combined high levels of authoritarianism with low
levels of the rule of law. The analysis of the peace outcome also found one main pathway
combining high levels of the rule of law with low corruption levels. Both outcomes support
arguments that link neopatrimonialism to conflict. Finally, chapter 6 has focused on social
factors as causes of conflicts and applied arguments relating to inequality and adaptive
capacities. The analysis of the conflict outcome found two main pathways: low levels of
tertiary education or high levels of uneven development between groups. The analysis of the
peace outcome also found two pathways: high levels of tertiary education or high levels of
access to science and technology combined with low levels of uneven development between
groups. Both results highlight the importance of adaptive skills as well as the impact of
economic inequality between groups.
This separation between economic, political and societal factors along the lines of the
adaptive capacities framework was introduced in order to provide structure to the large
number of theoretical explanations and potential conditions. In addition, the total of 22
conditions included in the various analyses cannot be included in a single analysis. This
chapter aims at overcoming this separation by bringing the economic, political and social
conditions together. It shows that the most prevalent pathways can be summarised into three
causal explanations for conflicts in resource-scarce countries: one focusing on patrimonial
states, one focusing on least developed countries and one focusing on countries that are oil-
rich but poorly integrated into the global economy. This supports the main findings from the
chapters on economic and political explanations. It also shows that adaptive skills play a lesser
role for the conflict outcome. These results are in line with theoretical arguments focusing on
development and conflict and patrimonialism and conflict. The combination of high oil levels
1 6 6 I n t e g r a t e d P a t h w a y s
and low levels of exports in the third pathway confirms a finding from the chapter on
economic resources that is not supported in the literature.
Integrating social, economic and political explanations for the peace outcome also shows that
there are two types of resource-scarce countries that remain peaceful: Those that are not
dependent on agriculture and experience even development between groups and those that
are non-agrarian and integrated into the global economy with high adaptive skills. The first
pathway is in line with the arguments on peace and development presented in the chapter
on economic explanations. The second pathway highlights the importance of adaptive skills
for peace, which is an argument that has received little attention in the literature.
The remainder of this chapter focuses on two key themes in explaining peace and conflict in
resource-scarce countries: the level of development and role of authoritarianism. It shows
that development mainly matters for highly developed countries, which tend to remain
peaceful, and for the least developed, which tend to experience conflicts, but less for the
countries with medium levels of development, where other explanations play a more
important role. Turning to other important factors, the relationship between authoritarianism
and natural resources is explored. After reviewing arguments that link regime type, natural
resources and conflict, in particular arguments relating to the resource curse and to the
rentier state, the empirical results are evaluated. My results show little support for the
resource curse argument and limited support for the rentier state argument.
PATHWAYS TO CONFLICT
Considering the pathways shown so far in conflict countries, there were five prevalent
pathways (see Table 7.1). From the economic chapter, it was shown that the combination of
low levels of oil and high agricultural population [OIL * agr] and the combination of high oil
levels and low integration into the global economy [OIL * exp] lead to conflict. There is one
state-based explanation, focusing on patrimonial states, which combines authoritarian
systems and a lack of the rule of law [AUT * rol]. The two pathways in chapter 6, high levels
of uneven economic development between groups and low levels of tertiary education
[UNEVEN + edu] were shown to lack robustness.
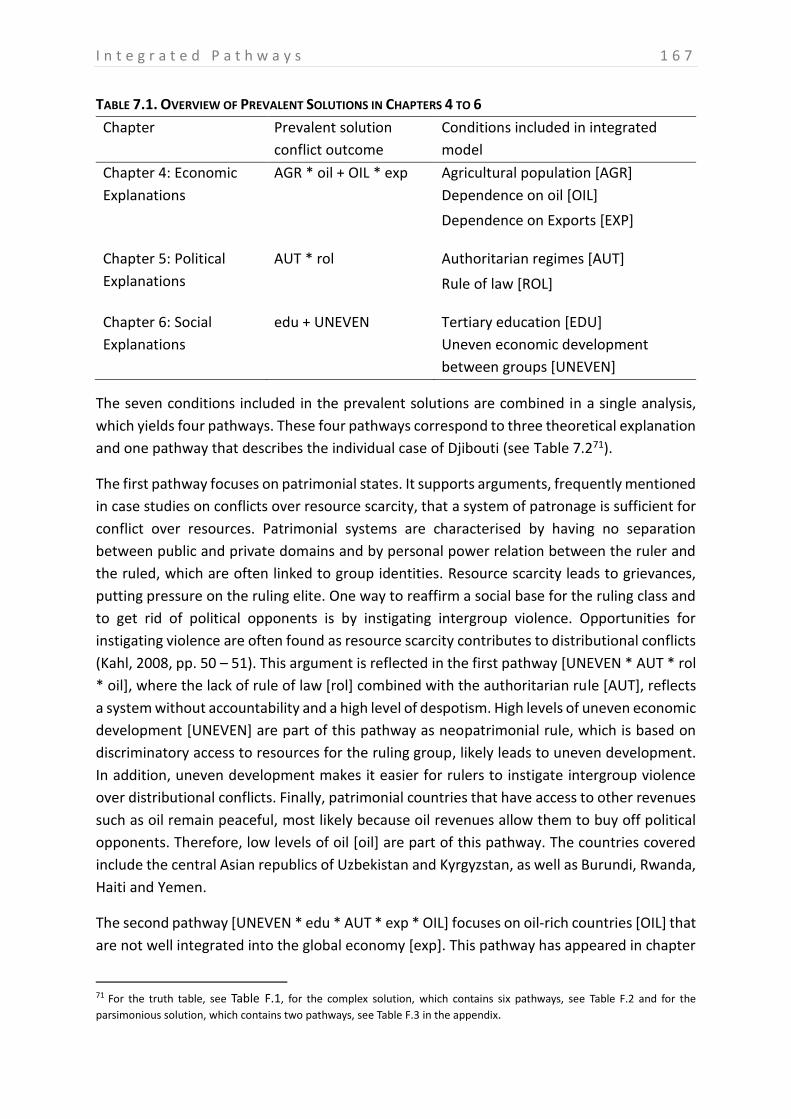
I n t e g r a t e d P a t h w a y s 1 6 7
TABLE 7.1. OVERVIEW OF PREVALENT SOLUTIONS IN CHAPTERS 4 TO 6
Chapter Prevalent solution
conflict outcome
Conditions included in integrated
model
Chapter 4: Economic
Explanations
AGR * oil + OIL * exp Agricultural population [AGR]
Dependence on oil [OIL]
Dependence on Exports [EXP]
Chapter 5: Political
Explanations
AUT * rol Authoritarian regimes [AUT]
Rule of law [ROL]
Chapter 6: Social
Explanations
edu + UNEVEN Tertiary education [EDU]
Uneven economic development
between groups [UNEVEN]
The seven conditions included in the prevalent solutions are combined in a single analysis,
which yields four pathways. These four pathways correspond to three theoretical explanation
and one pathway that describes the individual case of Djibouti (see Table 7.271).
The first pathway focuses on patrimonial states. It supports arguments, frequently mentioned
in case studies on conflicts over resource scarcity, that a system of patronage is sufficient for
conflict over resources. Patrimonial systems are characterised by having no separation
between public and private domains and by personal power relation between the ruler and
the ruled, which are often linked to group identities. Resource scarcity leads to grievances,
putting pressure on the ruling elite. One way to reaffirm a social base for the ruling class and
to get rid of political opponents is by instigating intergroup violence. Opportunities for
instigating violence are often found as resource scarcity contributes to distributional conflicts
(Kahl, 2008, pp. 50 – 51). This argument is reflected in the first pathway [UNEVEN * AUT * rol
* oil], where the lack of rule of law [rol] combined with the authoritarian rule [AUT], reflects
a system without accountability and a high level of despotism. High levels of uneven economic
development [UNEVEN] are part of this pathway as neopatrimonial rule, which is based on
discriminatory access to resources for the ruling group, likely leads to uneven development.
In addition, uneven development makes it easier for rulers to instigate intergroup violence
over distributional conflicts. Finally, patrimonial countries that have access to other revenues
such as oil remain peaceful, most likely because oil revenues allow them to buy off political
opponents. Therefore, low levels of oil [oil] are part of this pathway. The countries covered
include the central Asian republics of Uzbekistan and Kyrgyzstan, as well as Burundi, Rwanda,
Haiti and Yemen.
The second pathway [UNEVEN * edu * AUT * exp * OIL] focuses on oil-rich countries [OIL] that
are not well integrated into the global economy [exp]. This pathway has appeared in chapter
71 For the truth table, see Table F.1, for the complex solution, which contains six pathways, see Table F.2 and for the
parsimonious solution, which contains two pathways, see Table F.3 in the appendix.
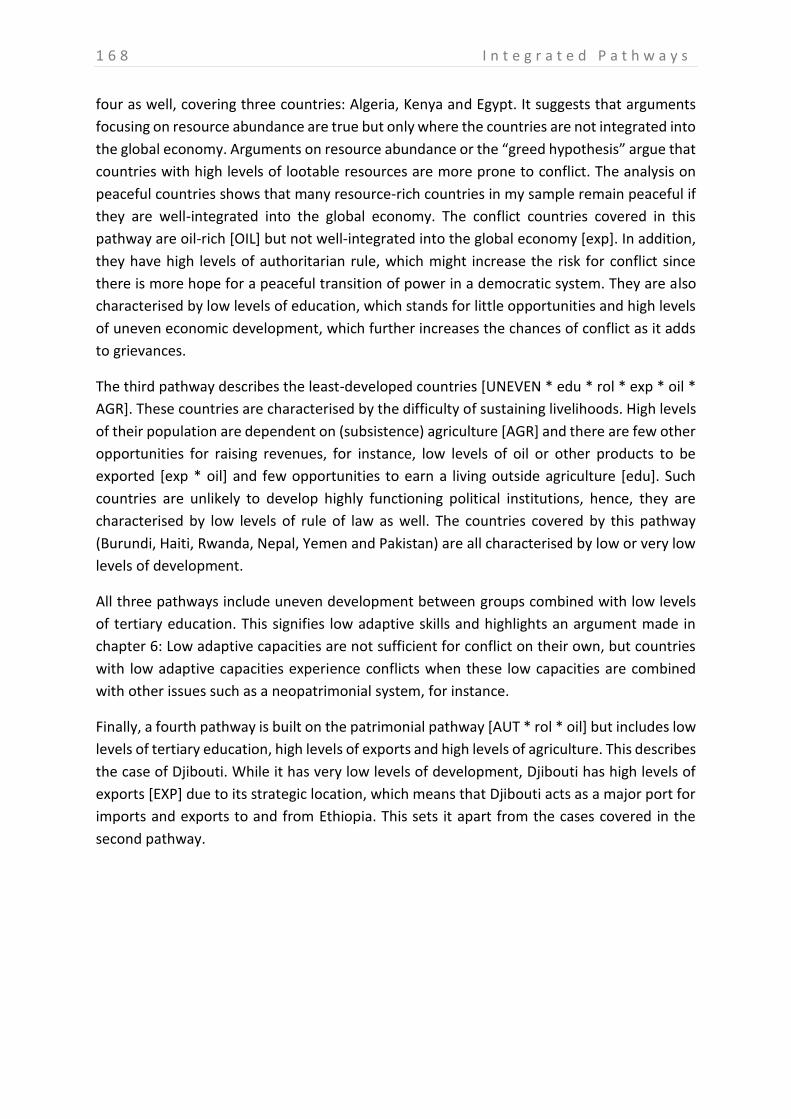
1 6 8 I n t e g r a t e d P a t h w a y s
four as well, covering three countries: Algeria, Kenya and Egypt. It suggests that arguments
focusing on resource abundance are true but only where the countries are not integrated into
the global economy. Arguments on resource abundance or the “greed hypothesis” argue that
countries with high levels of lootable resources are more prone to conflict. The analysis on
peaceful countries shows that many resource-rich countries in my sample remain peaceful if
they are well-integrated into the global economy. The conflict countries covered in this
pathway are oil-rich [OIL] but not well-integrated into the global economy [exp]. In addition,
they have high levels of authoritarian rule, which might increase the risk for conflict since
there is more hope for a peaceful transition of power in a democratic system. They are also
characterised by low levels of education, which stands for little opportunities and high levels
of uneven economic development, which further increases the chances of conflict as it adds
to grievances.
The third pathway describes the least-developed countries [UNEVEN * edu * rol * exp * oil *
AGR]. These countries are characterised by the difficulty of sustaining livelihoods. High levels
of their population are dependent on (subsistence) agriculture [AGR] and there are few other
opportunities for raising revenues, for instance, low levels of oil or other products to be
exported [exp * oil] and few opportunities to earn a living outside agriculture [edu]. Such
countries are unlikely to develop highly functioning political institutions, hence, they are
characterised by low levels of rule of law as well. The countries covered by this pathway
(Burundi, Haiti, Rwanda, Nepal, Yemen and Pakistan) are all characterised by low or very low
levels of development.
All three pathways include uneven development between groups combined with low levels
of tertiary education. This signifies low adaptive skills and highlights an argument made in
chapter 6: Low adaptive capacities are not sufficient for conflict on their own, but countries
with low adaptive capacities experience conflicts when these low capacities are combined
with other issues such as a neopatrimonial system, for instance.
Finally, a fourth pathway is built on the patrimonial pathway [AUT * rol * oil] but includes low
levels of tertiary education, high levels of exports and high levels of agriculture. This describes
the case of Djibouti. While it has very low levels of development, Djibouti has high levels of
exports [EXP] due to its strategic location, which means that Djibouti acts as a major port for
imports and exports to and from Ethiopia. This sets it apart from the cases covered in the
second pathway.
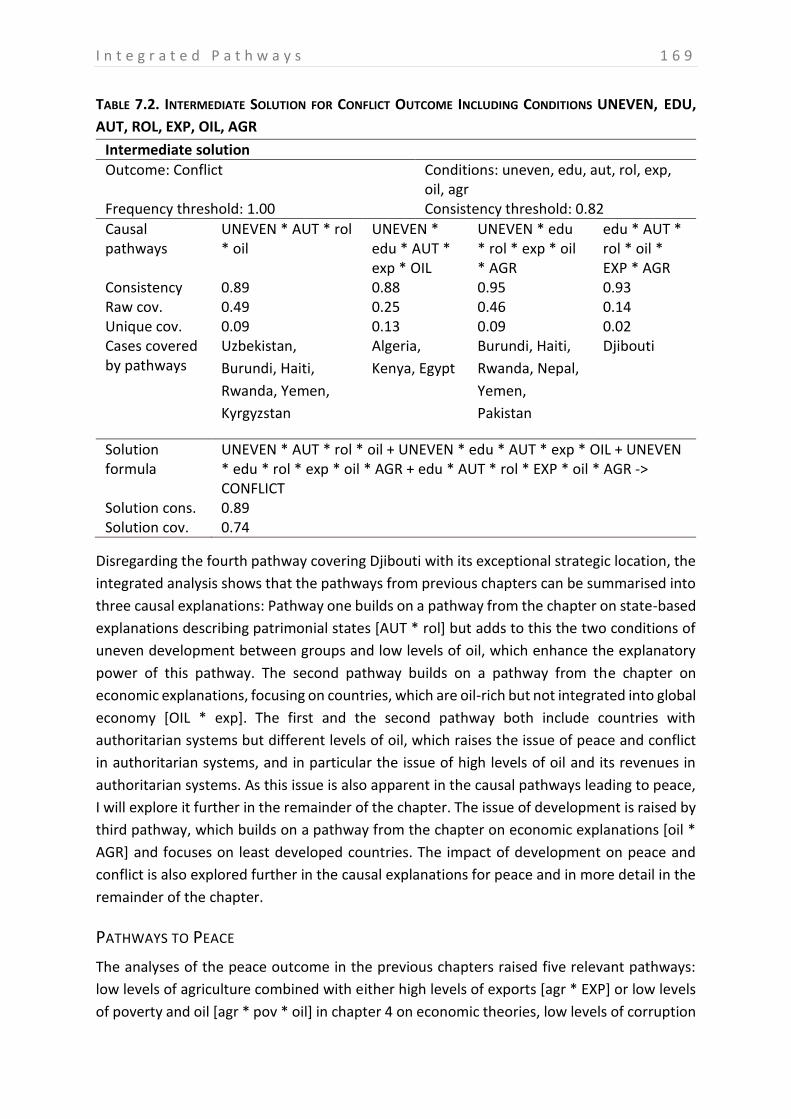
I n t e g r a t e d P a t h w a y s 1 6 9
TABLE 7.2. INTERMEDIATE SOLUTION FOR CONFLICT OUTCOME INCLUDING CONDITIONS UNEVEN, EDU,
AUT, ROL, EXP, OIL, AGR
Intermediate solution
Outcome: Conflict Conditions: uneven, edu, aut, rol, exp, oil, agr
Frequency threshold: 1.00 Consistency threshold: 0.82
Causal pathways
UNEVEN * AUT * rol * oil
UNEVEN * edu * AUT * exp * OIL
UNEVEN * edu * rol * exp * oil * AGR
edu * AUT * rol * oil * EXP * AGR
Consistency 0.89 0.88 0.95 0.93 Raw cov. 0.49 0.25 0.46 0.14 Unique cov. 0.09 0.13 0.09 0.02 Cases covered by pathways
Uzbekistan,
Burundi, Haiti,
Rwanda, Yemen,
Kyrgyzstan
Algeria,
Kenya, Egypt
Burundi, Haiti,
Rwanda, Nepal,
Yemen,
Pakistan
Djibouti
Solution formula
UNEVEN * AUT * rol * oil + UNEVEN * edu * AUT * exp * OIL + UNEVEN * edu * rol * exp * oil * AGR + edu * AUT * rol * EXP * oil * AGR -> CONFLICT
Solution cons. 0.89 Solution cov. 0.74
Disregarding the fourth pathway covering Djibouti with its exceptional strategic location, the
integrated analysis shows that the pathways from previous chapters can be summarised into
three causal explanations: Pathway one builds on a pathway from the chapter on state-based
explanations describing patrimonial states [AUT * rol] but adds to this the two conditions of
uneven development between groups and low levels of oil, which enhance the explanatory
power of this pathway. The second pathway builds on a pathway from the chapter on
economic explanations, focusing on countries, which are oil-rich but not integrated into global
economy [OIL * exp]. The first and the second pathway both include countries with
authoritarian systems but different levels of oil, which raises the issue of peace and conflict
in authoritarian systems, and in particular the issue of high levels of oil and its revenues in
authoritarian systems. As this issue is also apparent in the causal pathways leading to peace,
I will explore it further in the remainder of the chapter. The issue of development is raised by
third pathway, which builds on a pathway from the chapter on economic explanations [oil *
AGR] and focuses on least developed countries. The impact of development on peace and
conflict is also explored further in the causal explanations for peace and in more detail in the
remainder of the chapter.
PATHWAYS TO PEACE
The analyses of the peace outcome in the previous chapters raised five relevant pathways:
low levels of agriculture combined with either high levels of exports [agr * EXP] or low levels
of poverty and oil [agr * pov * oil] in chapter 4 on economic theories, low levels of corruption
1 7 0 I n t e g r a t e d P a t h w a y s
and high levels of the rule of law [cor * ROL] in chapter 5 on state-based explanations and
high levels of tertiary education or high levels of access to science and technology and even
development between groups [EDU + TECH * uneven] in chapter 6 on societal conditions.
TABLE 7.3. OVERVIEW OF PREVALENT SOLUTIONS IN CHAPTERS 4 TO 6
Chapter Prevalent solution
peace outcome
Conditions included in integrated
model
Chapter 4: Economic
Explanations
agr * EXP + agr * pov
*oil
Agricultural population [AGR]
Dependence on oil [OIL]
Dependence on Exports [EXP]
Poverty [POV]
Chapter 5: Political
Explanations
cor * ROL Rule of law [ROL]
Corruption [COR]
Chapter 6: Social
Explanations
EDU + TECH * uneven Tertiary education [EDU]
Uneven economic development
between groups [UNEVEN]
Science and technology [TECH]
Integrating the conditions from previous analyses shows two types of countries that remain
peaceful: Countries with low dependence on agriculture with even development between
groups and non-agrarian countries that are highly integrated into the global economy with
high adaptive skills. Both these types are represented in the following analysis, which contains
all nine conditions that were included in the solutions for peace outcomes in earlier chapters.
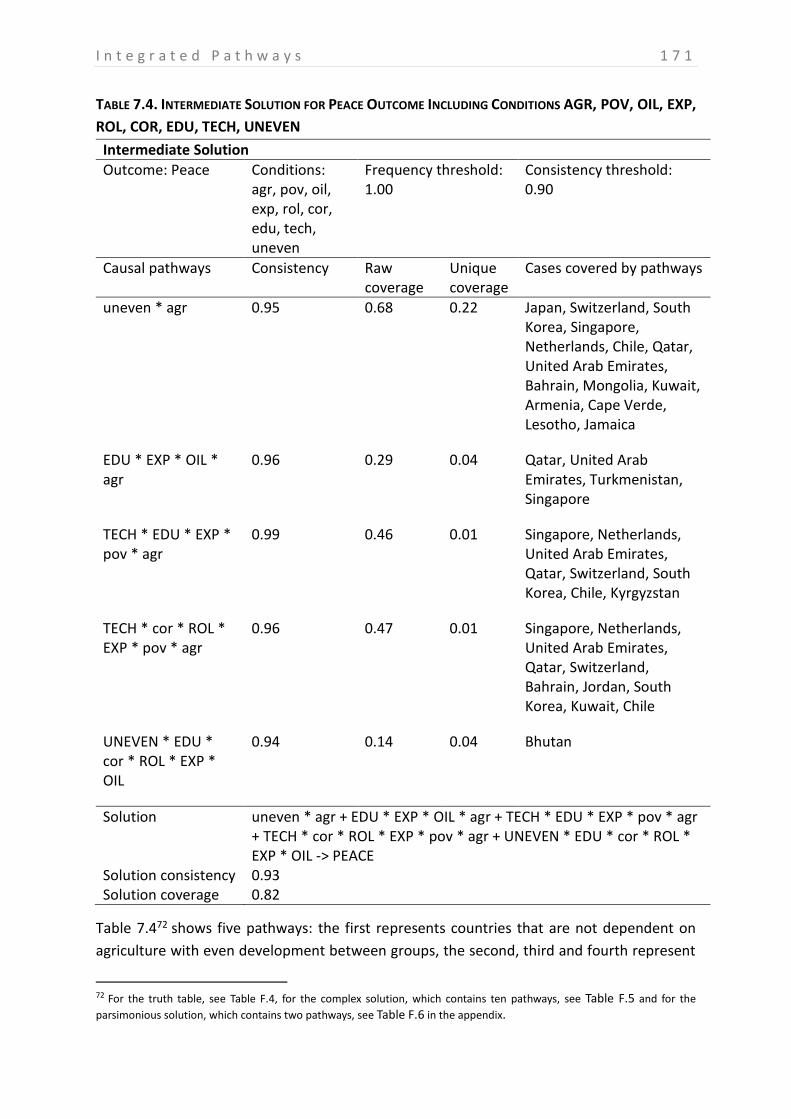
I n t e g r a t e d P a t h w a y s 1 7 1
TABLE 7.4. INTERMEDIATE SOLUTION FOR PEACE OUTCOME INCLUDING CONDITIONS AGR, POV, OIL, EXP,
ROL, COR, EDU, TECH, UNEVEN
Intermediate Solution
Outcome: Peace Conditions: agr, pov, oil, exp, rol, cor, edu, tech, uneven
Frequency threshold: 1.00
Consistency threshold: 0.90
Causal pathways Consistency Raw coverage
Unique coverage
Cases covered by pathways
uneven * agr 0.95 0.68 0.22 Japan, Switzerland, South Korea, Singapore, Netherlands, Chile, Qatar, United Arab Emirates, Bahrain, Mongolia, Kuwait, Armenia, Cape Verde, Lesotho, Jamaica
EDU * EXP * OIL * agr
0.96 0.29 0.04 Qatar, United Arab Emirates, Turkmenistan, Singapore
TECH * EDU * EXP * pov * agr
0.99 0.46 0.01 Singapore, Netherlands, United Arab Emirates, Qatar, Switzerland, South Korea, Chile, Kyrgyzstan
TECH * cor * ROL * EXP * pov * agr
0.96 0.47 0.01 Singapore, Netherlands, United Arab Emirates, Qatar, Switzerland, Bahrain, Jordan, South Korea, Kuwait, Chile
UNEVEN * EDU * cor * ROL * EXP * OIL
0.94 0.14 0.04 Bhutan
Solution uneven * agr + EDU * EXP * OIL * agr + TECH * EDU * EXP * pov * agr + TECH * cor * ROL * EXP * pov * agr + UNEVEN * EDU * cor * ROL * EXP * OIL -> PEACE
Solution consistency 0.93 Solution coverage 0.82
Table 7.472 shows five pathways: the first represents countries that are not dependent on
agriculture with even development between groups, the second, third and fourth represent
72 For the truth table, see Table F.4, for the complex solution, which contains ten pathways, see Table F.5 and for the
parsimonious solution, which contains two pathways, see Table F.6 in the appendix.
1 7 2 I n t e g r a t e d P a t h w a y s
non-agrarian countries with high integration into the global economy and high adaptive
capacities. Finally, the fifth pathway covers the individual case of Bhutan. The first pathway
covers countries with low dependence on agriculture and low levels of uneven development
[uneven * agr]. This means that not being dependent on agriculture in combination with not
having uneven development between groups is sufficient for peace. In contrast to the
remaining pathways, the first pathway does not cover only or mainly highly developed
countries but also a number of countries with lower levels of development such as Mongolia,
Kuwait, Armenia, Cape Verde, Lesotho and Jamaica. This shows that resource-scarce
developing countries can remain peaceful if they are not highly dependent on agriculture and
do not experience uneven development between groups. This raises the question of
development and its relation to peace and conflict, which will be explored more in depth
further on.
Pathways two to four have in common a focus on non-agrarian countries with high adaptive
skills and high exports. All countries covered by these pathways have low dependence on
agriculture [agr]. They all have high adaptive skills (expressed through either high levels of
tertiary education (second pathway) or high access to technology (fourth pathway) or both
(third pathway). They are all highly integrated into the global economy with high levels of
exports [EXP]. As all three pathways cover industrialised countries that are well-integrated
into the global economy with high adaptive skills, it is not surprising that there is considerable
overlap in the cases covered by the three pathways. The third and fourth pathway cover the
same countries except for one county (the third pathway covers Kyrgyzstan while the fourth
covers Kuwait). The second pathway contains high levels of oil, so it contains less countries
than the third or fourth pathway, but all countries that are covered by the second pathway
are also covered by the third and fourth, except for Turkmenistan. Interestingly, conditions
focusing on state capacities seem to play a lesser role in these pathways. Only the fourth
pathway contains high levels of rule of law and low corruption levels, the other two do not.
In general, all three of these pathways highlight aspects that I have discussed in previous
chapters. The combination of low dependence on agriculture and high exports was discussed
in chapter 4 and the impact of high adaptive skills was discussed in chapter 6. That their
combination is sufficient for peace makes sense since the adaptability skills such as tertiary
education and access to technology can not only help a country adapt to resource scarcity but
also to be successful on a global market, for instance by producing high-value export products.
This contributes to high income and high levels of development, which is then linked to peace.
The final pathway covers only Bhutan and is thus mainly a characterisation of that single case.
However, it still contains two of the three characteristics of pathways two, three and four,
namely high adaptive skills and high integration into the global economy. It also contains low
corruption and high rule of law.
Disregarding the case of Bhutan, there are two types of countries that remain peaceful.
Countries are peaceful if they are not dependent on agriculture with high levels of equality
I n t e g r a t e d P a t h w a y s 1 7 3
between different groups in society or if they are non-agrarian and integrated into the global
economy with high adaptive skills. The first pathway support the strong link between
development and peace in the literature. Pathways two to four highlights aspects that provide
more cause for argument. Trade has been seen as contributing to both, conflict and peace,
but my results suggest that trade when combined with high adaptive skills is sufficient for
peace. These result also highlights the importance of adaptive capacities. Arguments focusing
on adaptive skills mainly come for literature on adaptation to climate change. However, this
analysis shows that high levels of education and high levels of access to technology also play
a role in preventing conflict in resource-scarce countries.
THE ROLE OF DEVELOPMENT
Development is an overarching theme for many of the conditions discussed in the previous
chapters, which raises the question whether peace and conflict outcomes do not depend
mostly on the level of development rather than on any of the other conditions discussed in
the previous chapters. This applies for instance to conditions such as agricultural dependence
and poverty, which were discussed in the chapter on economic explanations but also to
factors focusing on state capacities and on education levels and access to science and
technology. This chapter focuses on the links between the various chapters, using economic
development as the lens to bring the ways different conditions are connected into focus. The
introduction has argued that development as multi-facetted concept is represented in many
of the conditions presented here. I present five arguments linking development and
conditions included in this dissertation, such as poverty, inequality, opportunities for looting,
state capacities and education. Considering the pathways in the empirical chapters support
links between various of these explanations and peace and conflict.
A first theoretical argument focuses on absolute levels of poverty and argues that poverty
and deprivation can motivate conflict as a grievance. Where people have few opportunities
to generate incomes for themselves and their families, the opportunity costs for joining a
rebel army are rather low (absolute level of poverty) (Grossman, 1991). The link focusing on
poverty and the security of human livelihoods in chapter 4 on economic conditions showed
that one pathway to conflict describes situations where people have little opportunities to
generate an income. In the analysis in chapter 4, this is reflected by the pathway [oil * AGR],
which describes situations where a large percentage of the population is dependent on
agriculture and little other opportunities for income-generation (such as oil) are available.
This is supported by one of the pathways in the analysis above in Table 7.2, where high
percentages of people dependent on agriculture and low levels of oil are joined by other
conditions that signify a lack of opportunities for income generation such as low levels of
highly skilled personnel (who would have employment opportunities outside agriculture) and
low integration into the global economy (which might provide jobs in export-oriented
businesses. The pathway also includes high levels of uneven economic development between
groups and low levels of the rule of law [UNEVEN * edu * rol *exp * oil * AGR]. Most cases
1 7 4 I n t e g r a t e d P a t h w a y s
(with the exception of Pakistan) covered by these pathways (Burundi, Haiti, Rwanda, Nepal,
Yemen and Pakistan) fall into the category of least developed countries, suggesting that
having very low levels of development is a sufficient condition for conflict in resource-scarce
countries. For a peace outcome, a low percentage of people depending on agriculture is a
necessary condition for peace, meaning that all countries with a peace outcome had low
levels of dependence on agriculture.
A second explanation for links between development and conflict focuses on relative levels
of poverty, arguing that where people feel that their standard of living is below what they
could achieve, in particular in comparison to other people in society, this can lead to
grievances and motivate conflict (Gurr, 1970).The link focusing on inequality was also
included in chapter 6, which included two conditions focusing on economic inequality, one
measuring inequality between individuals based on the gini indicator [INEQ] and one focusing
on unequal development between groups [UNEVEN]. The analysis shows that having low
levels of uneven development between groups was an important sufficient condition for
peace when combined with high levels of access to technology [uneven*TECH].
A third link focuses on the opportunities for looting. Developing countries are at a higher risk
for conflict because they often have higher levels of lootable commodities. The reason for this
is that land-based assets (such as most primary commodities) are dominant where their value
is high in comparison to the value of other economic activities. As the value of other economic
activities is usually low in developing countries, they are more frequently dominated by land-
based assets. Therefore, the prize for winning or losing power in the state (and thereby access
to resources) is much higher (Collier & Hoeffler, 2004). This theoretical link is explored in
chapter 4 on economic explanations where having high levels of oil or high levels of natural
resources are included as conditions. The analysis showed that having oil contributed to
conflict if countries were not well-integrated into the global economy. High levels of oil or
natural resources contribute to a peace outcome, most likely due to the stabilizing effect of
oil and gas revenues but other factors, such as integration into the global economy are more
important.
A fourth link focuses on state capacities, arguing that more developed countries have a more
efficient system of political institutions, which more effectively either find non-violent
solutions for thorny issues or more effectively squash rebellions(Fearon & Laitin, 2003). The
links between different aspects of state capacity such as administrative capacities,
management of land access, judicial institutions, neopatrimonial states and regime type and
conflict were explored in chapter 5. The analysis of the conflict outcome showed that
authoritarian regimes with low levels of the rule of law [AUT * rol] were a sufficient pathway
for conflict. Rule of law in combination with low levels of corruption [ROL * cor] was a
sufficient pathway for peace. Both results support arguments on the patrimonial state.
A final link between development and peace focuses on education, arguing that higher levels
of education lead to more peaceful societies. Theoretical arguments linking education to
I n t e g r a t e d P a t h w a y s 1 7 5
peace are that education increases the knowledge about the world and therefore empathy
and that education increases reasoning skills. Increased empathy and reasoning then lead to
less conflict (Pinker, 2011). Other links between a higher skill level in the population and peace
are increased adaptive skills, which are of particular importance in resource-scarce countries,
and increased opportunities to earn a living for individuals. The link between education and
conflict is explored in the chapter on adaptive capacities, which includes the condition of high
levels of tertiary education. The analysis of the conflict outcome shows that low levels of
education are a necessary condition for a conflict outcome. High levels of tertiary education
are also one sufficient pathway to peace. High adaptive skills are sufficient in non-agrarian
countries that are highly integrated into the global economy.
This overview shows that many aspects of development play a role in explaining peace and
conflict in resource-scarce countries. A closer look at the empirical evidence in this section
shows that the overall level of development matters, but that its influence is greatest for
highly developed countries (which remain peaceful) and least developed countries (which
experience conflicts).
THE ROLE OF DEVELOPMENT IN RESOURCE-SCARCE COUNTRIES
An obvious question when considering the results of previous analysis is, whether these
results are not, in fact, simply determined by the level of development in a country. The
answer to this is yes, but only because development is such a multi-faceted concept including
so many notions. At the same time, however the results show that different facets of
development are linked to conflict and peace in various and complex ways. In a scenario study
of conflict, climate change and development, Devitt and Tol (2012) argue that there are two
poverty traps: conflict and climate since both conflict and climate change can prevent
economic development. They argue (Devitt & Tol, 2012, pp. 129 – 130) that the relationship
between those three factors is essentially a race: If countries grow fast enough, they will be
rich and peaceful and can easily adapt to climate change. If countries do not develop fast
enough, they will be hit by both, climate change and conflict, which will reinforce each other
and keep those countries in a poverty trap.
One of the most common aspects of development is income, frequently measured as GDP per
capita as I did in chapter 4, which includes the condition economic development [ECOD].
Focusing on the GDP per capita, a relationship between GDP per capita and conflict emerges
that is quite different from the common linear or curvilinear correlation. Countries with
extremely low levels of development experience conflicts while countries with an extremely
high level of development remain peaceful. However, for the in-between countries, the
relationship between development and conflict is less obvious. In my sample, cases with a
very high level of development (measured in GDP per capita) are peaceful. In fact, the country
with the highest GDP per capita and a conflict outcome is Jamaica at a GDP per capita of USD
3345 in 2000. Similarly, all countries with a very low GDP per capita experienced conflicts. The
country with the lowest GDP per capita and a peace outcome is Mongolia with GDP per capita
1 7 6 I n t e g r a t e d P a t h w a y s
of USD 469. As all extremely rich countries are peaceful but not all peaceful countries are rich
and all extremely poor countries experience conflicts but not all countries with conflicts are
poor, being extremely rich is a sufficient condition for peace and being extremely poor is a
sufficient condition for conflict.
The correlation between per-capita income and conflict is one of the best-known and most
robust in the conflict literature. However, there are also factors that cast doubt on this link,
such as the possibility of reverse causalities. Conflicts contribute to economic losses as they
redirect resources from productive activities to destruction and by destroying physical
infrastructure, in particular transport and communication infrastructure, which is vital for a
working economy. In addition, in the chaos of civil war a lot of personal assets are left behind,
destroyed or stolen. Civil war (or even the threat of war) also leads to capital flight as people
shift their assets abroad if they can and international companies disinvest, further hampering
the economy (V. A. B. Davies, 2008). Public money is also diverted away from development
issues (such as health or education) towards the military, with negative impacts on
development, mainly affecting the most vulnerable groups in the population such as women
and children (Ghobarah, Huth, & Russett, 2003). In addition, social capital is destroyed as
people are killed and displaced, which also affects the economy negatively (Collier et al., 2003,
pp. 13 – 16). Econometric models suggest that civil war slows GDP growth down by 2.2% per
year. Considering that the average length for a civil war is seven years, the post-war GDP
would then be 15% lower than it should have been without the civil war (Collier, 1999). For
instance, GDP per capita fell from 211 USD in 1991 to USD 110 in 1999 in Burundi (Sambanis,
2004b, p. 265). Other aspects of development are also severely affected armed conflict. For
instance, a conflict with 2500 battle deaths is estimated to lessen life expectancy by one year,
to raise infant mortality by 10%, to raise undernourishment by 3.3%, and to deprive an
additional 1.8% of the population from access to potable water (Gates, Hegre, Nygård, &
Strand, 2012). For this reason civil war has been referred to as “development in reverse”
(Collier et al., 2003, p. 13).However, war has also been linked positively to the development
of technologies and institutions, in particular in the development of Western nation state
(Tilly, 1992). The issue of conflict leading to a reduction in the level of development has been
addressed by most studies focusing on development as a cause for conflict, for instance by
using lagged income. However, even lagged income might not fully prevent this reverse
causality as people might already expect political instability in the year prior to the conflict
breaking out, which would, of course, affect the economic performance (Blattman & Miguel,
2010, pp. 24 – 25)
This relationship also holds when looking at other ways of defining development (for more
information on different definitions and measurements see Chapter 4:). Looking at the United
Nations’ list of least-developed countries (UN-OHRLLS, 2012), eight of the countries in my
sample are least developing countries: Bhutan, Burundi, Djibouti, Haiti, Lesotho, Nepal,
Rwanda and Yemen. Of these, Bhutan is the only peaceful country. The category of developed
countries is less clear cut but in common practice includes the following countries from my
I n t e g r a t e d P a t h w a y s 1 7 7
sample (UNSD, 2011): Japan, South Korea, the Netherlands and Switzerland, all of which were
peaceful. Two other categories fall in between least developed and developed countries:
developing and transition countries. In both cases, some of the countries experienced conflict
(Algeria, Egypt, Jamaica, Kenya and Pakistan in the category of developing countries and
Uzbekistan and Kyrgyzstan in the category of transition countries) while other did not
(Bahrain, Cape Verde, Chile, Jordan, Kuwait, Mongolia, Qatar, Singapore and the United Arab
Emirates for the category of developing countries and Turkmenistan and Armenia for the
category of transition countries). Using the Human Development Index, countries that fall into
the category of low human development (Burundi, Djibouti, Haiti, Kenya, Lesotho, Nepal,
Pakistan, Rwanda and Yemen) all fall into the conflict category while those in the category of
very high human development (Bahrain, Chile, Japan, South Korea, the Netherlands, Qatar,
Singapore, Switzerland and the United Arab Emirates) are all peaceful. However, the
relationship is less clear cut when considering those in the middle categories of high and
medium development. One of three countries with high human development experienced
conflict (Jamaica but not Armenia and Kuwait) and four of nine countries with medium human
development experienced conflict (Algeria, Egypt, Kyrgyzstan and Uzbekistan experienced
conflict while Bhutan, Cape Verde, Jordan, Mongolia and Turkmenistan) did not. My argument
therefore is that development explains some conflict cases, namely those with very low levels
of development and some peaceful cases (those with very high levels of development) but
that it does not explain the cases with an in-between level of development. These cases are
also included in my previous analyses: the pathway focusing on high dependence on
agriculture and low levels of oil covers those countries that fall into the category of least-
developed countries, while high economic development was shown to be a necessary
condition for peace. For the in-between cases, other pathways that focus on specific aspects
of development or on different explanations altogether can explain more than the focus on
development.
THE ROLE OF DEVELOPMENT FOR PEACE AND CONFLICT
The argument that development explains mainly cases with very low and very high levels of
development, but that it is less relevant for the in-between countries opens the question
whether this is specific to resource-scarce countries or whether this relation might hold in
general. Assuming threshold effects explains the strong and robust correlation of conflict and
low economic development but provides a different explanation than the linear or curvilinear
relationships that dominate the literature. Research by Blattman and Miguel (2010, p. 7),
which is presented in Figure 7.1, suggests that threshold effects can be found in a larger
sample as well. Figure 7.1 shows a high incidence of civil war for countries where the GDP per
capita lies below the 20th percentile and a low incidence for conflict for countries which lie
above the 60th percentile according to GDP per capita. However, for the countries between
the 20th and 60th percentile this relationship is not apparent. This suggests that factors other
than the level of development might give better explanations for the occurrence of armed
conflict or civil war in cases with an intermediate level of development.
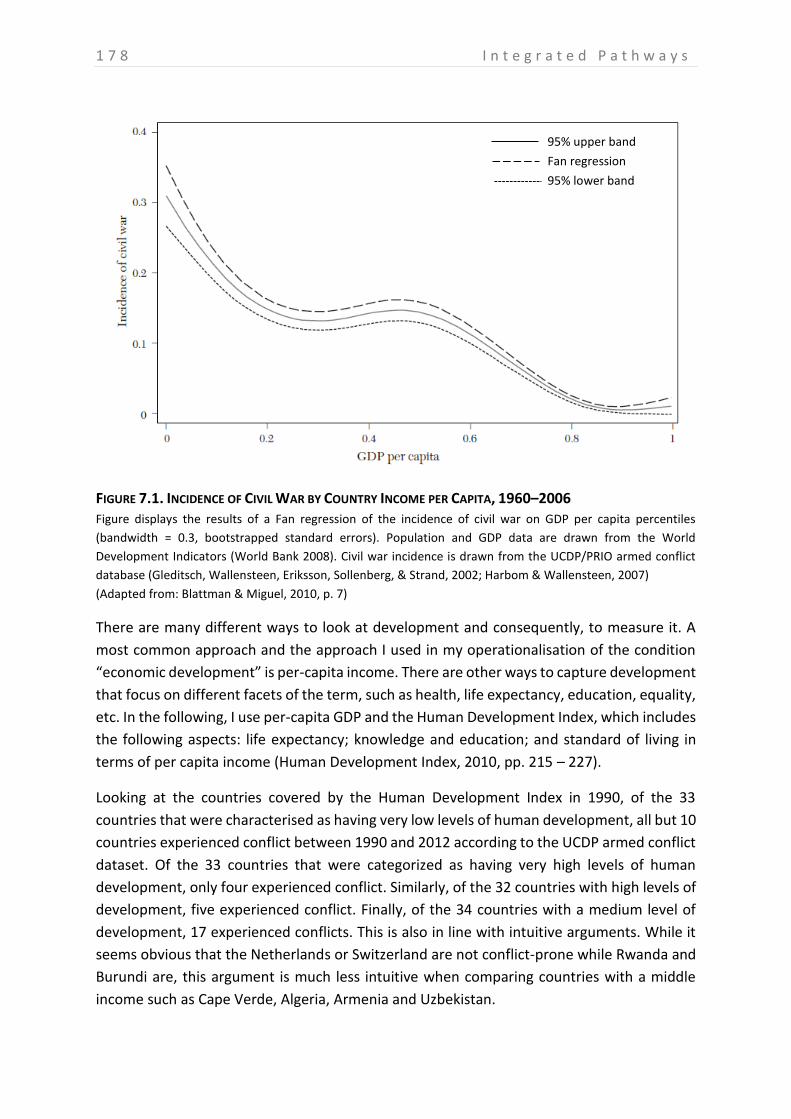
1 7 8 I n t e g r a t e d P a t h w a y s
Figure displays the results of a Fan regression of the incidence of civil war on GDP per capita percentiles
(bandwidth = 0.3, bootstrapped standard errors). Population and GDP data are drawn from the World
Development Indicators (World Bank 2008). Civil war incidence is drawn from the UCDP/PRIO armed conflict
database (Gleditsch, Wallensteen, Eriksson, Sollenberg, & Strand, 2002; Harbom & Wallensteen, 2007)
(Adapted from: Blattman & Miguel, 2010, p. 7)
There are many different ways to look at development and consequently, to measure it. A
most common approach and the approach I used in my operationalisation of the condition
“economic development” is per-capita income. There are other ways to capture development
that focus on different facets of the term, such as health, life expectancy, education, equality,
etc. In the following, I use per-capita GDP and the Human Development Index, which includes
the following aspects: life expectancy; knowledge and education; and standard of living in
terms of per capita income (Human Development Index, 2010, pp. 215 – 227).
Looking at the countries covered by the Human Development Index in 1990, of the 33
countries that were characterised as having very low levels of human development, all but 10
countries experienced conflict between 1990 and 2012 according to the UCDP armed conflict
dataset. Of the 33 countries that were categorized as having very high levels of human
development, only four experienced conflict. Similarly, of the 32 countries with high levels of
development, five experienced conflict. Finally, of the 34 countries with a medium level of
development, 17 experienced conflicts. This is also in line with intuitive arguments. While it
seems obvious that the Netherlands or Switzerland are not conflict-prone while Rwanda and
Burundi are, this argument is much less intuitive when comparing countries with a middle
income such as Cape Verde, Algeria, Armenia and Uzbekistan.
FIGURE 7.1. INCIDENCE OF CIVIL WAR BY COUNTRY INCOME PER CAPITA, 1960–2006
95% upper band
Fan regression
95% lower band
I n t e g r a t e d P a t h w a y s 1 7 9
This relationship can also be expressed in terms of correlations. I first analyse a full dataset
with all countries for which the 1990 Human Development Index was available, excluding
those with conflicts between 1975 and 1990 to avoid reverse causalities. After the first
analysis of this full dataset of 96 cases, those cases that are characterised as having a low or
very high level of development are excluded, so that only 49 cases with medium or high levels
of development remain. The full dataset and the logged number of battle deaths are
correlated at -0.501 (significant at 0.01 level). When reducing the sample to only those
countries that are characterised as having medium or high levels of development, the
correlation drops to -0.219 (not significant). Using the GDP per capita as a measure of
development rather than the human development index, a similar effect can be seen. The log
of the GDP per capita and the log of battle deaths are correlated at -0.306 (significant at 0.01
level) for the entire data set of 88 countries (again excluding those with conflicts between
1975 and 1990) but this correlation drops to -0.041 (not significant) when countries, which
are defined as having a high or having a low income are excluded so that the 44 cases with an
upper- or lower-middle income remain. This clearly shows that the strong correlation
between development and conflict that is frequently found in the literature is mainly due to
very developed countries that remain peaceful and very poor countries that experience
conflicts. The relationship is much weaker for the intermediate cases, which suggests that
other explanations play a more important role for those cases in general.
While my argument is that GDP per capita matters most for the extremely rich and extremely
poor and much less for countries with a middle income, other authors have argued the
opposite. Hibbs (1973), for instance argues that the reason why rich countries are peaceful is
the reduction of class conflict in rich societies, as negotiated outcomes can more easily be
reached. Since class conflicts are the strongest during the early phase of industrialisation, he
argues that the relationship between development and conflict is curvilinear, where
development (and the begin of industrialisation) can contribute to violence in very poor
countries. This link is supported by Hegre et al. (2001, p. 40), who find that increasing
development increases the risk for conflict up to a certain level of development, after which
the risk of conflict falls with increasing development. Another theoretical argument expecting
a curvilinear relationship argues that in cases of abject poverty, people lack the resources
necessary for rebellion and it is only when a certain level of development is reached that
people are able to struggle against the status quo as pointed out by Davies:
Far from making people into revolutionaries, enduring poverty makes for concern with one’s self or solitary family
at best and resignation or mute despair at worst. When it is a choice between losing their chains or their lives,
people will mostly choose to keep their chains. (1962, p. 7).
However, the evidence I presented here shows that very low levels of development are more
closely linked to conflict than still low but not quite as desperate situations. This is true for
resource-scarce and non-resource scarce countries and it suggests that people will fight if
risking their life is their best chance of survival.
1 8 0 I n t e g r a t e d P a t h w a y s
DEVELOPMENT AS A HISTORICAL PROCESS
Resource-scarce countries experience conflicts when they are very poor and they remain
peaceful when they are very rich. This is not a very surprising finding, nor does it tell us much
about why some countries are poor and others are not. Historical development and how
historical processes shaped the conditions I take as a starting point is not explored in depth
in this dissertation. The key theme of this thesis is not how countries reached their status quo
but explore how the status quo differs in resource scarce countries that remained peaceful
from those that experienced conflict. This issue of status quo vs. historical development is
true for all conditions in this analysis. Considering the nations of Haiti and the Dominican
Republic, which share the island of Hispaniola, this becomes apparent (J. M. Diamond, 2005,
pp. 329 – 357).
While Haiti had a forest cover of over 60% in 1923, this is less than 2% today (Federal Research
Division, 2006). In comparison, the forest cover of the Dominican Republic is still at 28%. This
trend continues: between 1990 and 2005, Haiti lost about 9.5% of its forest cover while the
forest cover in the Dominican Republic remained more or less the same (Williams, 2011, p.
26). Haiti also has a much higher population density. While it is only about 60% the size of the
Dominican Republic, Haiti has roughly the same population. Food production shows a similar
effect: between 1961 and 2005 Haiti’s food production has decreased by 4% while food
production in the Dominican Republic increased by 142% (A. Fischer & Levy, 2011, p. 254).
The economic situations mirrors the natural environment. Both countries are developing
nations facing many of the typical problems of developing nations but almost all of these are
much more severe in Haiti. For instance, the per capita income in Haiti is only a fifth of that
of the Dominican Republic, service delivery is much worse, drug trafficking is wide-spread and
while the Dominican Republic has an export sector including the export of minerals,
agricultural products and tourism, providing revenues and income opportunities outside
subsistence agriculture, export-oriented production in Haiti is practically non-existent.
Considering these factors shows that Haiti falls within the group of least-developed countries
with high dependence on agriculture while the Dominican Republic does not. Subsequently,
while Haiti has experienced conflict in 1991, 2001 and 2004, the Dominican Republic has
remained peaceful since the late 60s.
From the outset, Haiti on was less suited to agriculture than the Dominican Republic as the
Dominican Republic receives more rain and is also less mountainous. In the history of the two
countries, there are three turning points that led to the different levels in forest cover and
economic development today.
Firstly, different colonial histories contributed to higher population density and less forest
cover on Haiti. The histories of Haiti and the Dominican Republic began to diverge in the 18th
century when Spain controlled the Eastern part of the island (what was later to become the
Dominican Republic) and France controlled the Western part. The French colony was much
I n t e g r a t e d P a t h w a y s 1 8 1
richer with a larger population and more slaves and an economy based on sugar plantations,
while the Spanish colony was based on cattle hides. The influx of slaves to Haiti led to a much
higher population density. In addition, the ships bringing the slaves left the island carrying
Haitian timber, which quickly led to deforestation.
Secondly, during early independence the Dominican Republic received more investment and
more skilled immigrants setting up businesses while Haiti was crippled repaying retribution
to France. Both parts of the island were briefly united under French rule in 1795 but the
French were soon after defeated by a slave rebellion. Haiti became independent in 1804 and
in the aftermath of the rebellion many of the white landowners were killed and the land
divided into small farms, which was the beginning of an economy based on subsistence
agriculture. However, France and many other countries refused to recognise Haiti as an
independent country unless Haiti agreed to pay retribution for the property lost by French
settlers. In order to lift an embargo imposed by France, the United States and Britain, Haiti
paid the sum of 150 million gold francs. However, to do so, it had to take out large loans,
which crippled its opportunities to invest in infrastructure and the development of the
economy. In 1850, Haiti was the smaller of the two countries with the larger population with
an economy based on subsistence farming. Foreign ownership of land was prohibited. The
Dominican Republic was larger in terms of area but with a much smaller population, an
economy based on cattle. Quite differently from Haiti, the Dominican Republic encouraged
immigration. Both parts of the island were characterised by political instability but the
Dominican Republic developed a market economy and – as it was viewed as a partly-European
society and friendly country – received much more foreign investment then Haiti, which was
seen as an adverse country of African slaves. The Dominican Republic also saw the
immigration of many small but skilled and economically important immigrant groups. As a
result, the Dominican Republic developed an export-oriented economy, exporting agricultural
produce such as sugar, coffee, cacao and tobacco while Haiti remained based on subsistence
agriculture.
Finally, during independence both countries experienced political instability and dictatorships
but the Dominican Republic developed countermeasures to protect the environment such as
the establishment of natural reserves and measures to curb logging. It subsidized imported
gas to use as an alternative to charcoal. In addition to these top-down measures, the
Dominican Republic has an active civil society focusing on environmental issues. Haiti failed
to implement effective countermeasures and wide-spread poverty forced people to rely on
subsistence agriculture and charcoal for cooking, which led to continued deforestation and
soil degradation.
This example goes to show to what extent conditions such as development and resource
scarcity are the result of historical processes. While these historical trajectories matter very
much, there are many case studies discussing them in detail for many cases. What this study
1 8 2 I n t e g r a t e d P a t h w a y s
adds is a comparison across cases, which loses complexity and history within cases but adds
insights drawn from the comparison.
This limits the extent to which the findings here can be used to formulate policy. While earlier
results show that there are two ways to peace – having low dependence on agriculture and
even development between groups or being an non-agrarian country with high integration
into the global economy and high adaptive skills – they give no answer to the question on
how to get to one of these states. There are some aspects that merit a closer look, though.
The analysis of development for instance shows an important role for dependence on
agriculture in particular. This suggests that resource-scarce countries might be well advised
to focus on how income generating opportunities outside subsistence agriculture can be
created on a micro level. The analysis also shows the impact of adaptability skills in preventing
conflict, in particular access to science and tertiary education, which suggests that finding
ways to make investments in higher education and research a priority could help to prevent
conflicts.
AUTHORITARIANISM AND RESOURCE ABUNDANCE
The relationship between authoritarianism, resources and conflict is complex. While there are
arguments linking both authoritarian regimes and resource abundance to conflict, there are
also arguments linking both to peace. In arguments linking resource abundance to conflict,
authoritarian regimes play an important role and in arguments linking authoritarian regimes
to conflict, resource revenues play an important role. In the following sections, I review the
arguments linking resource abundance, authoritarianism and peace and conflict, in particular
the arguments relating to the rentier state. My analysis finds some support for the rentier
state argument in the integrated analysis above where the second pathway combined high
levels of exports and high levels of oil in a sufficient condition for peace (see Table 7.4).
However, high levels of oil were also sufficient for conflict when combined with low
integration into the global economy (see Table 7.2).
There are two key arguments that focus on resource availability, the state and conflict,
drawing different conclusions: Resource abundance (or resource curse) arguments state that
high levels of resources lead to conflicts via a number of mechanisms. Arguments focusing on
the rentier state, on the other hand, focus on the stabilising effects of resource revenues. My
analyses give more support to arguments on the rentier state and shows that countries with
an abundance of oil stay peaceful in the rentier state, where it is combined with authoritarian
rule and high integration into the global economy. In cases where countries are not integrated
into the global economy, oil is sufficient for conflict. Neopatrimonialism, a concept that is
closely linked to debate about the rentier state also contributes to conflict, where low levels
of resources are available.
I n t e g r a t e d P a t h w a y s 1 8 3
RESOURCE ABUNDANCE
I reviewed arguments on why an abundance of resources that are easy to loot and sell might
contribute to conflict and the empirical evidence for these arguments were in chapter 4. In
summary, there are at least six mechanisms linking an abundance of resources to conflict
(Humphreys, 2005, pp. 510 – 513). The greedy rebels mechanism focuses on the motivation
for conflict that is provided by an abundance of resources that can be easily looted. Resources
motivate conflict because rebels can benefit from them in quasi-criminal activities, because
resources increase the prize for capturing the state and because the availability of resources
in certain areas might increase the motivation for secession and the motivation not to let
certain areas secede. Similarly, resources might increase motivation for outside forces, such
as states or corporations, to engage in conflict (the greedy outsider mechanism). Resources
can also contribute to grievances, such as rising inequality, higher vulnerability to trade shocks
and unequal distribution of resource revenues, which provide motivation for conflict
(grievances mechanism). The feasibility mechanism focuses on the natural resources that
enable conflict by providing financing for rebels. The weak states mechanism argues that
resources weaken the capacities of the state. As there is no need to tax citizens, citizens have
less control over governments, e.g. less information about the activities of the state, less
monitoring of the government and one less instrument to withdraw support from the
government. This leads to a loss of legitimacy and therefore increases the risk for violence.
On the other hand, not having to collect taxes also means that states do not need to create
the bureaucratic institutions to collect taxes, also leading to weaker state capacities. Finally,
the sparse networks mechanism argues that economies that are highly dependent on
resources have a smaller manufacturing sector and, as a result, less internal trade. Internal
trade, however, leads to an increase in social cohesion and interregional interdependence,
which in turn reduces the risk for conflict.
Resource abundance theories focus on different types of lootable resources, including
minerals, diamonds and oil. While the chapter on economic conditions include measures for
oil and for mineral natural resources, this integrated analysis focuses only on the role of oil
and gas.
Most research on the resource curse focuses on non-democratic countries. While there are
countries that are both resource-rich and democratic such as Norway and Botswana, those
rarely experience conflicts. Most of the mechanisms referred to above are less relevant for
democracies. For instance, democracies mostly have peaceful institutions for conflict
resolution, which reduces grievances. The terms for distributing and using resource revenues
are determined in the democratic elections and therefore enjoy popular support. In addition,
democratic governments draw legitimacy from democratic elections, which increases
accountability. For these reasons, resource-rich democracies do not usually experience large-
scale political violence. Most arguments relating to resource abundance and authoritarianism
argue that an abundance of resources, mainly oil, cause authoritarianism.
1 8 4 I n t e g r a t e d P a t h w a y s
RENTIER STATES
In contradiction to those arguments, are arguments about the rentier state, which link an
abundance of resources to peace and stability in authoritarian regimes. This argument stems
from Middle Eastern studies focusing on Iran and the Gulf monarchies (Beblawi & Luciani,
1987; Mahdavy, 1970). The key argument is that high resource revenues skew a rentier state’s
political economy toward distribution rather than production and authoritarianism rather
than democracy (Peters & Moore, 2009, p. 257). High resource revenues draw the attention
away from economic growth, leading to a system of distribution (Peters & Moore, 2009, p.
259). As oil revenues mean that there is no need to tax citizens, governments do not need the
acquiescence of the citizens to taxation and to the way in which the state’s revenues are
spent, thus lowering accountability of the government (Huntington, 1993, p. 65). High
resource revenues also contribute to the political stability of authoritarian regimes through
various mechanisms (Basedau & Lay, 2009, pp. 761 – 762): The state can spend resource
revenues on extensive security apparatus, which can help to suppress (open) opposition and
rebellion, contributing to political stability. In addition, outside forces might be interested in
keeping the current regime in power to ensure the continued access to resources, in
particular to oil. On the other hand, revenues can be used to buy off political opponents and
reduce grievances by providing high levels of public services (e.g. health care, education) and
by redistributing wealth, for instance through public employment schemes and subsidies. It
has been argued that this is a case of reverse taxation, where the state does not tax the citizen
but the citizen taxes the state by receiving a government pay-put for remaining quiet (Ayubi,
1990, p. 144). Public employment schemes contribute to bloated bureaucracies and state
institutions. Patronage networks where resource revenues are distributed through personal
ties can also contribute to stability as long as all potential political rivals are accommodated.
Oil revenues generally accrue to the central state, which also contributes to political stability
but limits accountability. As a result, the state is “large, centralized and repressive” (L.
Diamond, 2010, p. 98). High levels of resource revenues thus explain the lack of democracy in
rentier state theories.
Other authors argue that the rentier state theories overstate both the willingness of the state
to offer tax-free benefits and the willingness of the citizens to give up political rights in
exchange for these benefits. In the case of Bahrain, for instance, Gengler (2011) shows that
other factors, such as the confessionally-defined position as a member of the political in- or
out-group play a more important role for their behaviour in the political game.
Rentier states are linked to the concept of neopatrimonialism, which was discussed in chapter
5. However, the relationship of the two concepts is rarely discussed explicitly. This might be
due to the “catch-all” (Erdmann & Engel, 2006) nature of the concept of neopatrimonialism,
which makes it difficult to explicitly define the relationship between the two-concepts.
Frequently, rentier states are seen as a subtype of neopatrimonial states but sometimes the
two concepts are seen as separate but overlapping. There are two bases of legitimacy in
neopatrimonial regimes: traditional heritage, such as family, ethnicity or religion, and access
I n t e g r a t e d P a t h w a y s 1 8 5
to material rewards, such as public jobs or subsidies. This aspect of granting access to public
resources links the concept of neopatrimonialism to the concept of the rentier state as the
distribution of resource revenues plays an important role in rentier state arguments (Bank &
Richter, 2010, p. 2). This makes the rentier state a sub-type of neopatrimonial regimes where
legitimacy is achieved through resource revenues. Similarly, Schlumberger (2010, p. 245)
argues that “rentier states are able to finance neopatrimonial networks” and that the access
to resources explains the higher longevity of Arab as compared to Sub-Saharan
neopatrimonial regimes. Thus, the rentier state is seen as a particular stable form of
neopatrimonialism. Hendrix (2010, p. 282) on the other hand, views neopatrimonialism and
rentier-autocraticness as two separate but overlapping dimensions of state capacity.
Employing principal factor analysis he shows that there are three key dimensions of state
capacity: rational legality, rentier-autocraticness and neopatrimonialism. Rentier-
autocraticness captures high-revenue rentier autocracies such as Saudi Arabia, Kuwait,
Angola, Hungary and Oman while neopatrimonialism captures systems where the autocratic
ruler is the direct beneficiary of the resource revenues, such as Bahrain, Oman, Kuwait, Gabon
and Iran. There is considerable overlap where the direct beneficiary in high-revenue rentier
autocracies is the autocratic ruler such as in Kuwait and Oman.
AUTHORITARIANISM AND OIL IN PATHWAYS TO CONFLICT
My empirical results above show one pathway where high levels of oil lead to conflict if they
are combined with low levels of integration into the global economy (see Table 7.2). In these
cases, oil makes up a large part of the exports but exports in general do not make up a large
part of the GDP. As such countries are highly dependent on oil in their exports but not very
dependent on exports overall. One explanation why these countries experience conflicts is
then that the oil revenues are not high enough to achieve the type of stabilising function that
revenues have in rentier states. This is in line with arguments by Basedau and Lay (2009) who
argue that countries that have high levels of per-capita oil wealth remain peaceful while those
with high levels of oil dependence but not necessarily high per-capita rents are more prone
to violence. The empirical support for resource abundance theories is therefore very limited.
There is some support for the rentier state theories as one of the pathways in Table 7.4
combines high levels of authoritarianism and high levels of oil. However, this pathway and
two more pathways that lead to peace also contain high levels of integration into the global
economy. The two additional pathways are also characterised by low levels of agricultural
dependence, which suggests other ways such as high levels of industrialisation to secure
livelihoods. This suggests that authoritarian regimes remain peaceful if they are highly
integrated into the global economy and if livelihoods are secure and, thus, a certain standard
of living is achieved. Essentially, authoritarian regimes are peaceful if they are integrated into
the global economy and if the population does not suffer. High resource revenues are one
way to achieve both, integration into the global economy and a high standard of living, but
other authoritarian countries, such as Singapore, have achieved both without high resource
revenues.
1 8 6 I n t e g r a t e d P a t h w a y s
Overall, these results suggest that the level of integration into the global economy is of
greater importance for authoritarian regimes than the level of resource revenues. The
discussion of links between integration into the global economy and internal armed conflict
in chapter 4 showed that mechanisms go both ways: While there are arguments that link
increased integration into the global economy to an increased conflict risk (e.g. vulnerability
to trade shocks), other arguments seem to support a link between trade and peace (e.g. trade
providing alternative incomes and therefore reducing political competition; trade leading to
growth and, thus, higher incomes).
DOES TRADE LEAD TO PEACE?
These analyses suggest that high levels of exports (or high integration into the global
economy) are sufficient for peace if combined with low levels of agricultural dependence and
high adaptive capacities. Opening up the economies and reducing trade barriers is a common
recipe for economic development. The World Bank and the International Monetary Fund, for
instance, have advised many states in Africa and Latin America to follow through on this with
very mixed results. While some economies have prospered, others have suffered under the
regime. However, some of the most economically successful countries of recent years, such
as China, have not followed this policy.
Do these pathways suggest that the World Bank is right? Should countries like Haiti simply
open up their markets to become rich? There are a number of fallacies in drawing this
conclusions. Firstly, I am focusing on a specific outcome, which is not development, but peace.
While peace is certainly better for development than conflict, the fact that trade can be
sufficient for peace does not mean that it is sufficient for development, democracy or human
rights. In fact, it is not – as we has been shown many of the peaceful countries with high
integration into the global economy are non-democratic states with dubious human rights
records such as some Arab Gulf states and some states in Central Asia.
Secondly, the focus of this pathway is on exports. Policy advice regarding trade frequently
includes the advice to open up internal markets for imports from other countries, thus
focusing on imports not exports. Therefore, the policy advice that could be based on this
pathway is for other countries to reduce trade barriers to increase exports from the country
in question, not for the country itself to reduce trade barriers for other countries.
Finally, historical pathways should not be discounted: It is as the result of such processes that
some countries ended up peaceful and highly integrated into the global economy. QCA tells
us that both these traits occur together but gives no indication of the causal relationship. In
addition, in the case of trade, the theoretical literature is highly divided as well – there are
good arguments why trade is linked to peace but there are also good arguments linking trade
to conflict. That some of the most peaceful and economically successful countries are those
that are highly integrated into the global economy does not mean that opening up economies
now will necessarily lead to peace. The world tends to be too complex and too interconnected
for such generic advice.
I n t e g r a t e d P a t h w a y s 1 8 7
CONCLUSION
This chapter brought together the different pathways from previous chapters. The combined
analysis shows three pathways that lead to conflict: least developed countries,
neopatrimonial countries and oil-rich countries that are not well integrated into the global
economy. It also showed two types of countries that remained peaceful: Those that are not
dependent on agriculture and experience even development between groups and those that
are non-agrarian and integrated into the global economy with high adaptability skills. These
results showed the importance of development in explaining peace and conflict in least
developed and highly developed countries while the level of development is of less
importance for the intermediate countries where other factors might play a bigger role. The
remainder of the chapter focused on three of these factors that are characterised by complex
relationships to peace and conflict: resource abundance, authoritarianism and integration
into the global economy. There are contradictory arguments on how these factors will
contribute to conflict. Resource abundance theories argue that high levels of lootable
resources contribute to conflict in authoritarian systems and rentier state theories argue that
resource revenues can contribute to political stability in authoritarian systems. My analysis
finds support for the rentier state theories as countries that have high levels of
authoritarianism, high levels of oil and high integration into the global economy remained
peaceful but also showed the limits of the rentier state arguments with regards to internal
conflict as other countries with high levels of authoritarianism and high levels of integration
into the global economy also remained peaceful as long as livelihoods were secure. The
analysis finds some but limited support for the resource abundance arguments as high levels
of oil contribute to conflict but only where countries are not well integrated into the global
economy. Overall, this suggests that the level of integration into the global economy plays a
more important role in authoritarian regimes than the level of resources.
1 8 8 C o n c l u s i o n
Chapter 8: CONCLUSION
In a world of finite resources, and more particularly, in a situation where those resources
necessary to produce food and sustain livelihoods are threatened by impeding climate
change, what effects does this scarcity of resources have on social interaction? Does a lack of
resources, such as land or water, entice people to fight for these limited resources?
Conventional wisdom suggests that when their livelihoods are threatened, people will fight
over resources. However, the academic literature paints a more complex picture and remains
divided about whether and to what extent resource scarcity contributes to conflict.
The main contribution of this dissertation is to argue and show empirically that peace and
conflict in resource-scarce countries occur under specific sets of conditions. Conflicts occur in
least-developed countries, in (neo)patrimonial countries and in countries that are not
integrated into the global economy but relatively rich in oil. Resource-scarce countries remain
peaceful if their population is not highly dependent on agriculture for their livelihoods and
the level of development is relatively even between different groups in society or if they are
not highly dependent on agriculture but highly integrated into the global economy with high
levels of adaptive skills.
PATHWAYS TO PEACE AND CONFLICT
RESEARCH PUZZLE
The results contribute to the literature on resource scarcity and conflict by explaining
contradictory results in previous empirical analyses on links between resource scarcity and
armed conflict. The literature finds strong theoretical links between resources and conflict
arguing that conflicts frequently break out over scarce resources. Resource scarcity theorists
argue that resource scarcity is linked to armed conflict via various mechanisms, the most
prominent of which are inter-group dynamics, migratory pressures and state manipulation
but the empirical evidence on this link is mixed at best and contradictory at times. There is
empirical evidence in case studies of conflicts in resource-scarce cases and in some
quantitative studies focusing mainly on population density. However, most quantitative
studies find no correlation between measures of resource scarcity (such as degradation,
population density or forest cover) and conflict. There are also case studies in resource-scarce
countries that find that other factors (besides resource scarcity) play a bigger role in
instigating conflict. This is the starting point of the analysis presented in this dissertation. The
existence of case studies supporting and case studies negating the link between resource
scarcity and conflict suggests that other conditions in resource-scarce countries play a role.
The premise of this dissertation is that whether conflict erupts in resource-scarce cases is
determined by the differences in social, economic and political conditions in different
countries. Therefore, this dissertation focused on the research question: Under which sets of
political, social and economic conditions does armed conflict occur in countries with low levels
of freshwater or arable land or both?
C o n c l u s i o n 1 8 9
RESEARCH METHOD
Using fuzzy-set qualitative comparative analyses (fsQCA) as main research method, I
compared cases where livelihood resources are scarce, focusing on freshwater and arable
land as the most important resources for agriculture and food production. I defined countries
as resource-scarce by employing per-capita thresholds that signified the amount of land or
freshwater needed to sustain the livelihood of one person. This led me to the 30 cases
included in the analysis, 14 of which experienced conflict between 1990 and 2010. As many
potential economic, social or political conditions exist, I selected the 22 conditions included
in the empirical analysis in a three-step process. Firstly, I introduced a framework on the
determinants of capacities to adapt to adverse effects of climate change proposed by the
Intergovernmental Panel on Climate Change (IPCC). This allowed me to structure the many
potential conditions in case studies that had not been analysed systematically previously.
Secondly, I selected the conditions based on an extensive review of qualitative case studies
and categorised them as political, economic or social conditions. Thirdly, I evaluated these
conditions against the theoretical knowledge and empirical evidence of the larger conflict
literature.
ECONOMIC, POLITICAL AND SOCIAL PATHWAYS TO PEACE AND CONFLICT
Three empirical showed separate pathways including only economic (chapter 4), political
(chapter 5) or social (chapter 6) conditions. Chapter 4 highlighted the importance of
dependence on agriculture as a sufficient condition for conflict (if combined with low oil
revenues) and as a necessary condition for peace. In addition, the results draw attention to
the role of trade as being oil-rich but not well-integrated into the global economy is sufficient
for conflict and having high exports (but not being dependent on agriculture) is sufficient for
peace. Chapter 5 on political explanations focused on different dimensions of state weakness.
The results supported the argument that neopatrimonial states experience conflicts as being
authoritarian with low levels of the rule of law was sufficient for conflict. This was mirrored
in the results for a peace outcome as low levels of corruption with high levels of the rule of
law were sufficient for peace. Chapter 6 on social conditions focused on inequality and
adaptive skills. The results showed that having uneven economic development between
groups or low levels of tertiary education were sufficient for conflict while having high levels
of tertiary education or high levels of technology combined with even development between
groups were sufficient for peace.
PATHWAYS TO PEACE AND CONFLICT INTEGRATING ECONOMIC, POLITICAL AND SOCIAL CONDITIONS
The arguments put forward in these empirical chapters were brought together in an
integrated analysis in chapter 7, which showed three integrated pathways to conflict and two
integrated pathways to peace. Important aspects in both, the conflict and peace pathways
were the level of development and dependence on agriculture, trade, neopatrimonialism and
rentier states and adaptive capacities.
1 9 0 C o n c l u s i o n
The Level of Development and Dependence on Agriculture
One pathway for a conflict outcome focuses on least-developed countries with high levels of
poverty and high levels of subsistence agriculture and few other income opportunities. This
pathway covers countries such as Burundi, Rwanda, Nepal, Haiti, Yemen and Pakistan. As the
link between low levels of development and conflict is well established and therefore
unsurprising. However, there is a clear link between least developed countries with a
population highly dependent on subsistence agriculture and few other opportunities for
income and resource scarcity. In such situations, resource scarcity places additional stress on
the population, which likely contributes to the outbreak of conflict. This is illustrated in case
studies of Rwanda and Haiti, for instance. This suggests that in these cases resource scarcity
might contribute to conflict.
This is supported by the results of the analysis of the peace outcome. All pathways for a peace
outcome include low levels of agricultural dependence. One of the pathways combines low
levels of dependence on agriculture and low levels of uneven development between groups.
This pathway covers a diverse group of countries, including liberal democracies with high
levels of development (Japan, Switzerland, South Korea, the Netherlands and Chile) but also
some oil-rich states in the Gulf (Qatar, United Arab Emirates, Bahrain and Kuwait) and some
countries with lower levels of development (Mongolia, Armenia, Cape Verde, Lesotho and
Jamaica). The last group is the most interesting since it suggests that even countries with low
levels of development can be peaceful in situations of resource scarcity if the livelihoods of
the majority of the people does not depend on subsistence agriculture and if the development
is even between different groups in society.
Neopatrimonialism
A second pathway for a conflict outcome focuses on neopatrimonial countries, which are
authoritarian, corrupt, lack a lawful order and where the level of economic development is
highly dependent on ethnic belonging. This pathway covers countries such as Uzbekistan,
Burundi, Haiti, Rwanda, Yemen and Kyrgyzstan. The neopatrimonial pathway is unsurprising
since neopatrimonial structures have frequently been linked to conflict and there is no reason
to believe neopatrimonialism plays out differently in cases with high levels of resource
scarcity than in those with lower levels.
Trade and Rentier States
The results regarding trade are more complex: Countries with high levels of exports and high
levels of oil remain peaceful but countries that are oil-rich but not well-integrated into the
global economy experience conflicts. The main difference between the countries covered by
those two pathways is the amount of resource revenues, which is much higher for the peace
countries. They benefit from the stabilising effects of high revenues, which the countries in
the conflict pathway do not. This support the arguments of rentier state theories.
C o n c l u s i o n 1 9 1
Adaptive Skills
A group of pathways to peace combine low levels of dependence on agriculture with high
integration into the global economy and high adaptive skills. These pathways cover countries
with a variety of economic models that are all non-agrarian and have high export levels, for
example industrialised economies such as Japan or South Korea, oil-exporting economies such
as Qatar and the United Arab Emirates, entrepôt economies such as Singapore and post-
industrial economies such as the Netherlands. Adaptive skills allowed these countries to
adapt to the difficult natural environment. The economies in these countries are based on
exports (partly of oil and partly of other goods) and at least for some countries, adaptive skills
such as high levels of education and access to research and technology have provided them
with opportunities to develop alternatives to agriculture to secure livelihoods. For other
countries, such as the oil-rich states, the opposite is true as well: High resource revenues have
enabled them to invest in technology and education, thus increasing their adaptive skills.
CONTRIBUTIONS TO THE LITERATURE
This dissertation contributes to the conflict studies literature in a number of ways. Firstly, it
presents the QCA as a method to analyse complex causalities, which has not frequently been
employed in the conflict studies literature. Secondly, it contributes to the literature on
resource scarcity and conflict by clearly establishing under which conditions conflicts occur in
resource-scarce countries. While the sample selection limit the results to resource-scarce
countries, the result that conflicts occur in countries highly dependent on subsistence
agriculture suggest that resource scarcity might be a causal factor for conflict in these cases.
The findings also contribute to the literature by introducing the adaptive skills as a relevant
condition for preventing conflicts. Finally, the results also touch upon the larger debates on
resource abundance and conflict and on climate change and conflict.
QCA AS A METHOD TO EXPLORE COMPLEX CAUSALITIES
I chose QCA as main research method as it enabled me to explore the complex causalities
present in the literature on resource scarcity and conflict and find specific configurations of
sufficient and necessary conditions. QCA allows for the comparison of combinations of
conditions, which meant I could take the economic, political and social conditions specific to
each case into account while at the same time retaining comparability across cases. Many of
the theoretical arguments put forward by resource scarcity theorists are conjunctural, such
as arguments that resource scarcity contributes to conflict where access to resources is linked
to ethnic or religious groups. QCA allowed me to test such conjunctural hypotheses, which
explains previous contradictory empirical evidence. A finding such as that oil is sufficient for
conflict but only where countries are not well-integrated into the global economy, for
instance, reflects this conjunctural logic. QCA also assumes asymmetric causality and
therefore requires separate analyses of the peace and conflict outcomes. This has brought
about some interesting insights, such as the role of adaptive capacities, which have received
less attention previously due to a focus on conflict rather than peace in much of the literature.
1 9 2 C o n c l u s i o n
However, the results presented by a qualitative comparative analysis are highly dependent
on my case selection. Overall, QCA can bring a new perspective to fields that are characterised
by contradictory empirical evidence employing different research methods. In particular, the
focus on context conditions can be helpful to explore differences between cases and diverging
results between different case studies or between case studies and results from other
approaches.
DOES RESOURCE SCARCITY CONTRIBUTE TO CONFLICT?
This dissertation has asked and answered the questions under which conditions conflict
breaks out in resource-scarce countries. This has sidestepped the bigger question whether
resource scarcity causes conflict. As a result of the research question focusing on resource-
scarce countries only, the analysis did not compare countries with and without resource
scarcity. However, the results of the analysis of resource-scarce countries suggests that
resource scarcity is a causal factor in cases that are highly dependent on subsistence
agriculture. However, these results are highly dependent on the cases included. The case
selection is based on resource scarcity, but as there is no established definition of resource
scarcity, this dissertation operates under a very specific assumptions about what resource
scarcity is. However, thinking about resource scarcity in a different way, such as focusing on
perceived scarcity or scarcity on a sub-national level may yield different results.
I focused on actual rather than perceived scarcity as a definition including perceptions would
have necessarily included some of the factors (such as level of development or access to
technology) that were included as conditions. As a result of this choice, my case selection
includes some countries such as Switzerland or the Netherlands that most people would not
consider resource-scarce while other countries, such as for instance Ethiopia or Sudan, where
resource scarcity is mostly due to a lack of infrastructure, are excluded. The sample in my
analysis is global but some regions such as the Middle East and Eastern Africa are naturally
more prominently represented than other regions. The conflicts were also not spread evenly:
while many of the Middle Eastern cases remained peaceful, for instance, none of the Eastern
African did. This is also apparent in the results where some pathways to peace or conflict
clearly represent certain types of states. For instance, the authoritarian, resource-rich and
highly export dependent state as a pathway to peace clearly represents the states in the Arab
Gulf region. My sample and thus my results are not representative of all countries but they
are representative of countries with low levels of freshwater or arable land or both.
Therefore, I cannot draw general conclusions about sufficient and necessary conditions for
peace and conflict but only for the conditions of peace and conflict in resource-scarce
countries.
Using national averages rather than a more disaggregated level obscures real differences
within countries. It also led to a selection of mostly small countries and left out resource-
scarce areas in larger countries. Focusing on national averages makes drawing causal
connections difficult since it is possible that the resource-scarce area is not the same as the
C o n c l u s i o n 1 9 3
conflict area. This is particularly true in large countries. Ideally, research on the effects of the
natural environment on human-human interaction would be based on much smaller research
units. However, while there is progress in collecting natural and social science data on a
disaggregated level, this is not yet sufficient for the cross-country comparison of various
conditions that I set out to do in this analysis.
However, the result of the analysis using a sample of resource-scarce countries still give some
answers to the question whether resource scarcity has a causal effect on armed conflict.
Overall, the results support the hypothesis of this dissertation that there are specific
combinations of economic, political and social conditions under which conflicts occur in
resource-scarce countries. Of the three types of countries that experience conflicts, one
focuses on least-developed countries. More specifically, it focuses on countries with high
levels of subsistence agriculture and little other opportunities to generate income. On a
theoretic level, it seems likely that resource scarcity is a causal factor in such countries. Armed
conflict is a highly risky behaviour to engage in, so it is not the first choice for most people
when good other alternatives are available. In these cases, there are few avenues available:
With low education and few other sources for income, agriculture is a way for most people
to sustain their livelihoods and those of their families. When these livelihoods are becoming
more and more difficult to sustain due to land degradation or population growth, there are
few viable options left. When violence is then instigated the incentives to take part and maybe
come away with part of the neighbour’s land are high.
Resource scarcity as a causal factor for conflict in least developed countries also explains the
discrepancies in the results of case studies and quantitative case studies as many of the case
studies most strongly arguing for a connection between resource scarcity and conflict focus
on case studies with high levels of subsistence agriculture, a lack of other revenues, low
education levels and high poverty levels, such as Rwanda, for instance. Most quantitative
studies, however, do not limit their sample to these countries, so there is no correlation
between resource scarcity and conflict. However, there are some studies that restrict their
sample to African countries, many of which fall into the category of least developed countries
(Buhaug & Rød, 2006; Hendrix & Glaser, 2007; Theisen & Brandsegg, 2007). Two of these
studies (Hendrix & Glaser, 2007; Theisen & Brandsegg, 2007) find some links between
resource scarcity and conflict while the third does not.
Surprisingly, the interaction between resource scarcity and subsistence agriculture is not
widely tested in quantitative studies, even though it might be an interesting avenue to
support results from case studies that find a causal link between resource scarcity and armed
conflict. This implies two things: Firstly, rejecting resource scarcity as a cause for armed
conflict because of a lack of statistical evidence might be premature in cases where resource
scarcity threatens livelihoods. Secondly, more research explicitly hypothesising the link
between resource scarcity, high rates of subsistence agriculture and armed conflict is needed.
1 9 4 C o n c l u s i o n
Research focusing on levels of subsistence agriculture rather than on more general levels and
links to violent conflict might present an interesting avenue for future research.
ADAPTIVE SKILLS
The use of the adaptive capacities framework led me to include adaptive skills as conditions,
which have received a lot of attention in literature on climate change adaptation but have
been less present in the conflict studies literature. The key argument is that societies that are
better able to adapt to difficult or changing circumstances are better at adapting to resource
scarcity, and consequently better at preventing conflicts over resources. Capacities to adapt
have a number of determinants, which I presented in the adaptive capacities framework in
chapter 2. Among these are economic resources, functioning institutions, technology,
information and skills, equity and infrastructure. While most of these, such as economic
resources, institutions and equity are quite prominent in the conflict studies literature, some
others, which I have summarized as “adaptive skills” (technology, information, skills) are not.
While some aspects, such as education, have been explored in the conflict studies literature,
most of these arguments have not focused on adaptive skills or explored arguments linking
adaptive skills to peace and conflict. The main reason for this is the focus on conflict cases
and causes for conflict, rather than on peaceful cases and causes for peace.
Having high adaptive skills is part of a sufficient pathway to peace if combined with high levels
of exports and low levels of dependence on agriculture. As the combination of high levels of
exports and low levels of agriculture is not sufficient on its own, this suggests having high
adaptive skills play a role for peace in resource-scarce countries. This makes sense on a
theoretical level as countries need adaptive skills to adopt to difficult circumstances. Having
high levels of technology or education allows them to find ways to secure livelihoods that do
not depend on agriculture but rather focus on other ways to generate revenues as reflected
in the sufficient pathways to peace.
Arguments linking adaptive skills to peace are closely linked to the arguments on the ingenuity
gap by Homer-Dixon (1995) who points out that resource scarcity leads to more complex, less
predictable and more urgent social and technological problems. However, in many societies
the supply of ingenuity is restricted through a lack of functioning markets, lack of economic
resources, social friction or constraints on science. This then leads to an “ingenuity gap” of
ideas to solve social or technical problems. This is related to arguments made by
Cornucopians that argue that resource scarcity theorists underestimate the human ability to
adapt to changing circumstances through technological innovation. However, the analysis
shows that the abilities to adapt are not spread equally. While some countries can prevent
conflicts by adapting to scarcity, this is not possible for all. Some countries in the sample of
peaceful countries with high levels of adaptive skills have profited from circumstances. For
instance, many of the oil-rich countries are able to achieve high levels of adaptive skills
because of the high revenues from oil that they can invest in education and technology.
Singapore built an entrepôt economy based on trade, profiting from a history as a trading
C o n c l u s i o n 1 9 5
post. This necessitated and allowed for the investment in education and technology, for
instance.
Adaptive skills and their role in preventing conflict presents an interesting avenue for future
research. In particular, future research could center on questions such as which adaptive skills
are the most relevant for preventing conflict, under which conditions societies develop these
skills and what can be done to further the development of these skills in countries that lack
them at the moment.
OIL AND WAR: RESOURCE CURSE THEORIES
In the debate on resources and conflict, resource scarcity arguments often take a backseat to
arguments focusing on the resource curse, which argue that an abundance of resources is
linked to conflict as an abundance of resources can finance conflicts, make political control
over resources a particularly lucrative goal and weaken state institutions. These various links
between an abundance of resources and conflict were reviewed in greater detail earlier in
this dissertation (see p. 82). Resource abundance arguments focus on different types of
resources that resource scarcity arguments: While resource scarcity arguments are focused
on livelihood resources that are typically inherent to an area, such as land, water and forests,
for instance, resource abundance arguments focus on lootable resources that can be moved
and sold, such as minerals, oil or gold. However, the opposite argument that an abundance
or resources can contribute to political stability exists as well. Rentier state theories argue
that resource revenues can be used to achieve political stability by buying off political
opponents, by financing a strong security apparatus and by financing a high standard of living,
which reduces grievances.
My research finds only very limited support for the resource curse argument and more for
the rentier state argument. Within the sample of resource-scarce countries, resource
abundance played a role in two pathways: It is sufficient for conflict in countries that are not
well integrated into the global economy and it is sufficient for peace in countries that are
highly integrated into the global economy. The most likely explanation for this is that
countries with high levels of oil but low levels of exports have much lower revenues from oil
than countries with high levels of oil and high levels of exports. As a result these countries do
not experience the stabilizing effect of resource revenues, such as a high standard of living
and a high level of service delivery. This suggests that arguments focusing on resource
abundance as a cause for conflict apply mostly to countries with medium levels of oil or
countries without stabilizing mechanisms such as a large oil-funded welfare state while
rentier state arguments apply to those with high levels of oil revenues and high levels of
exports.
RESOURCE SCARCITY AND CLIMATE CHANGE
Much of the literature on how changes in the natural environment affect armed conflict has
focused on the impact of climate change on conflict. Different links between climate change
and armed conflict are hypothesized, many focusing on economic loss (see p. 12 for an
1 9 6 C o n c l u s i o n
overview of the arguments and the empirical evidence). For instance, variability in rainfall or
temperature has been linked to decreased agricultural production and economic loss, which
are then linked to conflict. For both these links, the empirical evidence is mixed. My research
can contribute to this literature as it focuses on the hypothesized causal chain. The link
between changes in temperature and rainfall and agricultural decline is closely linked to
resource scarcity. I focus on freshwater availability and available land that is suitable for rain-
fed agriculture, which are both affected by rainfall levels and in the case of land also by
temperatures. Therefore, the argument of this dissertation that resource scarcity and
agricultural decline lead to conflict only in countries with high levels of dependence on
agriculture and few other income opportunities, applies to studies of climate change and
conflict as well. Whether the agricultural decline and economic decline due to climate change
increases the risk of conflict is highly dependent on the context in these countries and
considering the results of this dissertation it seems likely that this is only the case in least
developed countries.
Including a focus on least developed countries and more specifically, high levels of subsistence
agriculture might be a helpful step for research on climate change and conflict. As the field is
characterized by contradictory results and a clear causal link between climate change and
decline in agriculture can be established in some cases, including levels of subsistence
agriculture could provide interesting comparative results.
CONCLUSION
This dissertation has contributed to the literature on resource scarcity and armed conflict by
explaining previous contradictory empirical results. While the literature on conflict includes
strong theoretical arguments on links between resource scarcity and the environment,
empirical evidence on these links is mixed. By employing a fuzzy-set qualitative comparative
analysis, which has not been applied to this field before, I show that there are specific
configurations of conditions under which countries experience conflicts. I have defined and
operationalised resource scarcity and selected 30 resource-scarce cases for a comparative
study. In the main body of this thesis, I have reviewed many of the theories in the larger
conflict literature and how they apply to case studies of resource-scarce countries. I have
identified a total of 22 relevant economic, political and social conditions and gathered data
on all of them. The results show three causal pathways to conflict (being least developed,
being patrimonial and being resource-rich but not integrated into the global economy) and
two pathways to peace (being not dependent on agriculture and experiencing even
development between groups or being non-agrarian and integrated into the global economy
with high adaptability skills). These pathways explain the contradiction in empirical results. In
particular, the pathway focusing on countries with high dependence on agriculture explains
the strong evidence from some case studies as this provides the strongest causal link and
most case studies that propose such a link focus on cases with high levels of subsistence
agriculture. In addition, the results speak to the larger debates on abundance of resources
C o n c l u s i o n 1 9 7
and conflict and on climate change and conflict. In particular, I argue that the level of
development matters only for the very poor and very rich countries. I show that integration
into the global economy is sufficient for peace in resource-rich countries, which supports
rentier state arguments rather than resource abundance arguments. The analysis of the
peace outcome also show an important role for adaptive skills as conflict-mitigating factors.
While research on the effects of the natural environment on social interactions is frequently
difficult, research on this topic is of ever more importance under impeding climate change.
1 9 8 B i b l i o g r a p h y
BIBLIOGRAPHY
Abdallah, A. A. (2008). State building, independence and post-conflict reconstruction in
Djibouti. In Perspectives on Djibouti. Lund: Lund University & Somalia International
Rehabilitation Centre. Retrieved from
http://www.sirclund.se/Conference%20report%202007.pdf#page=269
Acemoglu, D., Johnson, S., & Robinson, J. A. (2000). The colonial origins of comparative
development: An empirical investigation (Working Paper No. 7771). Cambridge:
National Bureau of Economic Research. Retrieved from
http://www.nber.org/papers/w7771
Adano, W. R., Dietz, T., Witsenburg, K., & Zaal, F. (2012). Climate change, violent conflict and
local institutions in Kenya’s drylands. Journal of Peace Research, 49(1), 65–80.
doi:10.1177/0022343311427344
Adger, W. N. (2003). Social capital, collective action, and adaptation to climate change.
Economic Geography, 79(4), 387–404. doi:10.1111/j.1944-8287.2003.tb00220.x
Adger, W. N., Agrawala, S., Mirza, M. M. Q., Conde, C., O’Brien, K., Pulhin, J., … Takahashi, K.
(2007). Assessment of adaptation practices, options, constraints and capacity. In M.
L. Parry, O. F. Canziani, J. P. Palutikof, P. J. van der Linden, & C. E. Hanson (Eds.),
Climate change 2007: Impact, adaptation and vulnerability. Contribution of working
group II to the fourth assessment report of the intergovernmental panel on climate
change. Cambridge and New York: Cambridge University Press. Retrieved from
http://www.ipcc.ch/publications_and_data/ar4/wg2/en/ch17.html
Adger, W. N., & Kelly, P. M. (1999). Social vulnerability to climate change and the
architecture of entitlements. Mitigation and Adaptation Strategies for Global
Change, 4(3-4), 253–266. doi:10.1023/A:1009601904210
Adger, W. N., & Vincent, K. (2005). Uncertainty in adaptive capacity. Comptes Rendus
Geoscience, 337(4), 399–410. doi:10.1016/j.crte.2004.11.004
Agbamu, J. U. (2000). Agricultural research-extension linkage systems: An international
perspective. Agricultural Research & Extension Network, (106). Retrieved from
http://www.odi.org.uk/publications/4220-research-finance-agricultural-extension
Alcamo, J., Döll, P., Kaspar, F., & Siebert, S. (1997). Global change and global scenarios of
water use and availability: An application of watergap 1.0. Center for Environmental
Systems Research (CESR), University of Kassel. Retrieved from http://www.usf.uni-
kassel.de/usf/archiv/dokumente/projekte/watergap.teil1.pdf
Alcamo, J., Henrichs, T., & Rösch, T. (2000). World water in 2025: Global modeling and
scenario analysis for the world commission on water for the 21st century (No. 2).
Center for Environmental Systems Research (CESR), University of Kassel. Retrieved
from http://www.usf.uni-kassel.de/usf/archiv/dokumente/kwws/kwws.2.pdf
Alesina, A., Devleeschauwer, A., Easterly, W., Kurlat, S., & Wacziarg, R. (2003).
Fractionalization. Journal of Economic Growth, 8(2), 155 – 194.
doi:10.1023/A:1024471506938
B i b l i o g r a p h y 1 9 9
Alexandratos, N. (1999). World food and agriculture: Outlook for the medium and longer
term. Proceedings of the National Academy of Sciences of the United States of
America, 96(11), 5908 –5914. doi:10.1073/pnas.96.11.5908
Amarasinghe, U. A., Mutuwatta, L., & Sakthidavel, R. (1999). Water scarcity variations within
a country: A case study of Sri Lanka (Research Report No. 32). Colombo:
International Water Management Institute (IWMI).
Amenta, E., & Poulsen, J. D. (1994). Where to begin? A survey of five approaches to
selecting independent variables for qualitative comparative analysis. Sociological
Methods & Research, 23(1), 22–53. doi:10.1177/0049124194023001002
Anderson, C. A. (2001). Heat and violence. Current Directions in Psychological Science, 10(1),
33–38. doi:10.1111/1467-8721.00109
Anderson, C. A., Bushman, B. J., & Groom, R. W. (1997). Hot years and serious and deadly
assault: Empirical tests of the heat hypothesis. Journal of Personality and Social
Psychology, 73(6), 1213–1223. doi:10.1037/0022-3514.73.6.1213
André, C., & Platteau, J.-P. (1998). Land relations under unbearable stress: Rwanda caught in
the Malthusian trap. Journal of Economic Behavior & Organization, 34(1), 1–47.
doi:10.1016/S0167-2681(97)00045-0
Armstrong, F. (2009). The age of stupid. Dogwoof Pictures.
Auliciems, A., & DiBartolo, L. (1995). Domestic violence in a subtropical environment: Police
calls and weather in Brisbane. International Journal of Biometeorology, 39(1), 34–39.
doi:10.1007/BF01320891
Ayubi, N. (1990). Arab bureaucracies: Expanding size, changing roles. In G. Luciani (Ed.), The
Arab state (pp. 129 – 149). Berkeley and Los Angeles: University of California Press.
Azam, J.-P., & Mesnard, A. (2003). Civil war and the social contract. Public Choice, 115(3/4),
455–475. doi:10.1023/A:1024265631528
Bächler, G. (1998a). Violence through environmental discrimination: Causes, Rwanda arena,
and conflict model. Dordrecht: Springer.
Bächler, G. (1998b). Why environmental transformation causes violence: A synthesis
(Environmental Change and Security Project Report No. 4) (pp. 24–44). Washington
D.C.: Wilson Center. Retrieved from
http://www.wilsoncenter.org/sites/default/files/ACF1497.pdf
Badgley, C., Moghtader, J., Quintero, E., Zakem, E., Chappell, M. J., Aviles-Vazquez, K., …
Perfecto, I. (2007). Organic agriculture and the global food supply. Renewable
Agriculture and Food Systems, 22(2), 86–108. doi:10.1017/S1742170507001640
Bahry, L. (1999). Elections in Qatar: A window of democracy opens in the Gulf. Middle East
Policy, 6(4), 118–127. doi:10.1111/j.1475-4967.1999.tb00356.x
Baker, B. (2006). Cape Verde: The most democratic nation in Africa? The Journal of Modern
African Studies, 44(04), 493–511. doi:10.1017/S0022278X06002060
Baldauf, S. (2006). Africans are already facing climate change. Christian Science Monitor.
Retrieved from http://www.csmonitor.com/2006/1106/p04s01-woaf.html
Ban, K. (2007, June 16). A climate culprit in Darfur. The Washington Post, p. A15.
2 0 0 B i b l i o g r a p h y
Bank, A., & Richter, T. (2010). Neopatrimonialism in the Middle East and north Africa:
Overview, critique and alternative conceptualization. Presented at the GIGA
Workshop Neopatrimonialism in Various World Regions, Hamburg: GIGA German
Institute of Global and Area Studies. Retrieved from http://giga-
hamburg.org/content/fsp1/pdf/neopat/paper_neopat_workshop_bank-richter.pdf
Barakat, B., & Urdal, H. (2009). Breaking the waves? Does education mediate the
relationship between youth bulges and political violence? (World Bank Policy
Research Working Paper No. 5114). Washington D.C.: The World Bank. Retrieved
from http://papers.ssrn.com/abstract=1503808
Barber, C. V. (1998). Forest resource scarcity and social conflict in Indonesia. Environment:
Science and Policy for Sustainable Development, 40, 4–9.
doi:10.1080/00139159809604579
Barbieri, K., & Reuveny, R. (2005). Economic globalization and civil war. Journal of Politics,
67(4), 1228–1247. doi:10.1111/j.1468-2508.2005.00358.x
Barnett, J. (2000). Destabilizing the environment—conflict thesis. Review of International
Studies, 26(02), 271–288.
Barnett, J. (2001). The meaning of environmental security: Ecological politics and policy in
the new security era. London and New York: Zed Books.
Barnett, J., & Adger, W. N. (2007). Climate change, human security and violent conflict.
Political Geography, 26(6), 639–655. doi:10.1016/j.polgeo.2007.03.003
Barrios, S., Bertinelli, L., & Strobl, E. (2006). Climatic change and rural–urban migration: The
case of Sub-Saharan Africa. Journal of Urban Economics, 60(3), 357–371.
doi:10.1016/j.jue.2006.04.005
Barro, R. J., & Lee, J.-W. (2010). A new data set of educational attainment in the world,
1950–2010 (Working Paper No. 15902). Cambridge: National Bureau of Economic
Research. Retrieved from http://www.nber.org/papers/w15902
Basedau, M., & Lay, J. (2009). Resource curse or rentier peace? The ambiguous effects of oil
wealth and oil dependence on violent conflict. Journal of Peace Research, 46(6),
757–776. doi:10.1177/0022343309340500
Baten, J., & Mumme, C. (2013). Does inequality lead to civil wars? A global long-term study
using anthropometric indicators (1816–1999). European Journal of Political Economy,
32, 56–79. doi:10.1016/j.ejpoleco.2013.06.007
Batista, C., Lacuesta, A., & Vicente, P. (2007). Brain drain or brain gain: Micro evidence from
an African success story (Department of Economics Discussion Paper Series No. 343).
Oxford: University of Oxford. Retrieved from
http://www.economics.ox.ac.uk/Research/wp/pdf/paper343.pdf
Baumgartner, M. (2008). Regularity theories reassessed. Philosophia, 36(3), 327–354.
doi:10.1007/s11406-007-9114-4
Bayer, R., & Rupert, M. C. (2004). Effects of civil wars on international trade, 1950-92.
Journal of Peace Research, 41(6), 699–713. doi:10.1177/0022343304047433
B i b l i o g r a p h y 2 0 1
Bazzi, S., & Blattman, C. (2011). Economic shocks and conflict: The (absence of?) evidence
from commodity prices (CGDEV Working Paper No. 247). Washington D.C.: Center for
Global Development (CGDEV). Retrieved from
https://relooney.fatcow.com/0_NS4053_2075.pdf
Beaumont, P. (1997). Water and armed conflict in the Middle East - fantasy or reality? In N.
P. Gleditsch (Ed.), Conflict and the Environment (Vol. 33, pp. 355–374). Dordrecht:
Kluwer Academic Publishers.
Beblawi, H., & Luciani, G. (Eds.). (1987). The rentier state. New York: Croom Helm.
Bednar, R. (2009, June 2). Earth 2100. American Broadcasting Company (ABC).
Behringer, W. (2007). Kulturgeschichte des Klimas: Von der Eiszeit bis zur globalen
Erwärmung. München: C.H.Beck.
Benjaminsen, T. A. (2008). Does supply-induced scarcity drive violent conflicts in the African
Sahel? The case of the Tuareg rebellion in northern Mali. Journal of Peace Research,
45(6), 819–836. doi:10.1177/0022343308096158
Benjaminsen, T. A., Alinon, K., Buhaug, H., & Buseth, J. T. (2012). Does climate change drive
land-use conflicts in the Sahel? Journal of Peace Research, 49(1), 97–111.
doi:10.1177/0022343311427343
Bennett, T. S. (2007). What a way to go: Life at the end of empire. Documentary,
VisionQuest Pictures.
Bergholt, D., & Lujala, P. (2012). Climate-related natural disasters, economic growth, and
armed civil conflict. Journal of Peace Research, 49(1), 147–162.
doi:10.1177/0022343311426167
Berg-Schlosser, D., & Cronqvist, L. (2008). Multi-value QCA. In B. Rihoux & C. C. Ragin (Eds.),
Configurational comparative methods: Qualitative comparative analysis (QCA) and
related techniques (pp. 69 – 86). Los Angeles: Sage Publications.
Berg-Schlosser, D., & De Meur, G. (2008). Comparative research design: Case and variable
selection. In B. Rihoux & C. C. Ragin (Eds.), Configurational comparative methods:
Qualitative comparative analysis (QCA) and related techniques (pp. 19 – 32). Los
Angeles: Sage Publications.
Berg-Schlosser, D., De Meur, G., Rihoux, B., & Ragin, C. C. (2008). Qualitative comparative
analysis (QCA) as an approach. In B. Rihoux & C. C. Ragin (Eds.), Configurational
comparative methods: Qualitative comparative analysis (QCA) and related
techniques (pp. 1 – 17). Los Angeles: Sage Publications.
Besley, T. J., & Persson, T. (2008). The incidence of civil war: Theory and evidence (Working
Paper No. 14585). Cambridge: National Bureau of Economic Research. Retrieved
from http://www.nber.org/papers/w14585
Bigagaza, J., Abong, C., & Mukarubuga, C. (2002). Land scarcity, distribution and conflict in
Rwanda. In K. Sturman & J. Lind (Eds.), Scarcity and surfeit: The ecology of Africa’s
conflicts (pp. 320 – 356). Pretoria: Institute for Security Studies (ISS). Retrieved from
http://www.iss.co.za/pubs/Books/ScarcitySurfeit/Chapter3.pdf
2 0 2 B i b l i o g r a p h y
Binningsbø, H., de Soysa, I., & Gleditsch, N. P. (2007). Green giant or straw man?
Environmental pressure and civil conflict, 1961–99. Population & Environment, 28(6),
337–353.
Bittner, J. (2007, May 3). Klimawandel: Die Klima-Kriege. Die Zeit. Hamburg. Retrieved from
http://www.zeit.de/2007/19/Klimawandel
Blattman, C., & Miguel, E. (2010). Civil war. Journal of Economic Literature, 48(1), 3–57.
doi:10.1257/jel.48.1.3
Bobrow-Strain, A. (2001). Between a ranch and a hard place: Violence, scarcity and meaning
in Chiapas, Mexico. In N. L. Peluso & M. Watts (Eds.), Violent Environments (pp. 155–
185). Ithaca: Cornell University Press.
Bocchi, S., Disperati, S. P., & Rossi, S. (2006). Environmental security: A geographic
information system analysis approach—the case of Kenya. Environmental
Management, 37(2), 186–199. doi:10.1007/s00267-004-0331-3
Boege, V. (1999). Mining, environmental degradation and war: The Bougainville case. In M.
Suliman (Ed.), Ecology, politics and violent conflict. London: Zed Books.
Boix, C. (2003). Democracy and redistribution. Cambridge: Cambridge University Press.
Boix, C. (2008). Economic roots of civil wars and revolutions in the contemporary world.
World Politics, 60(03), 390–437. doi:10.1017/S0043887100009047
Boone, C. (2011). Politically allocated land rights and the geography of electoral violence the
case of Kenya in the 1990s. Comparative Political Studies, 44(10), 1311–1342.
doi:10.1177/0010414011407465
Borger, J. (2007, May 11). Climate change could lead to global conflict, says Beckett. The
Guardian. London. Retrieved from
http://www.guardian.co.uk/world/2007/may/11/politics.greenpolitics
Boserup, E. (1965). The conditions of agricultural growth: The economics of agrarian change
under population pressure. Chicago: Aldine.
Boutros-Ghali, B. (1992). An agenda for peace: Preventive diplomacy, peacemaking and
peace-keeping. International Relations, 11(3), 201–218.
doi:10.1177/004711789201100302
Braithwaite, A. (2005). Location, location, location…identifying hot spots of international
conflict. International Interactions, 31(3), 251–273.
doi:10.1080/03050620500294234
Brancati, D. (2007). Political aftershocks: The impact of earthquakes on intrastate conflict.
Journal of Conflict Resolution, 51(5), 715. doi:10.1177/0022002707305234
Bremer, S., Singer, J. D., & Luterbacher, U. (1973). The population density and war
proneness of European nations, 1816-1965. Comparative Political Studies, 6(3), 329–
348. doi:10.1177/001041407300600303
Brock, L. (1991). Peace through parks: The environment on the peace research agenda.
Journal of Peace Research, 407–423. doi:10.1177/0022343391028004006
Brooks, N. (2003). Vulnerability, risk and adaptation: A conceptual framework. Tyndall
Centre for Climate Change Research Working Paper, 38, 1–16.
B i b l i o g r a p h y 2 0 3
Brooks, N., Adger, W. N., & Kelly, P. M. (2005). The determinants of vulnerability and
adaptive capacity at the national level and the implications for adaptation. Global
Environmental Change, 15(2), 151–163. doi:10.1016/j.gloenvcha.2004.12.006
Brown, C., & Boswell, T. (1995). Strikebreaking or solidarity in the great steel strike of 1919:
A split labor market, game-theoretic, and QCA analysis. American Journal of
Sociology, 100(6), 1479–1519.
Brown, D. (1994). The state and ethnic politics in Southeast Asia. London and New York:
Routledge. Retrieved from
http://library.perdana.org.my/Digital_Content/NLM/pnm_bk/M320.59BRO.pdf
Brown, N. (2006, May 24). Are we changing planet earth? London: BBC One. Retrieved from
http://www.bbc.co.uk/programmes/b0074t9c
Brückner, M. (2010). Population size and civil conflict risk: Is there a causal link? The
Economic Journal, 120(544), 535–550. doi:10.1111/j.1468-0297.2010.02352.x
Brückner, M., & Ciccone, A. (2010). International commodity prices, growth and the
outbreak of civil war in Sub-Saharan Africa. The Economic Journal, 120(544), 519–
534. doi:10.1111/j.1468-0297.2010.02353.x
Bruinsma, J. (Ed.). (2003). World agriculture: Towards 2015/2030: An FAO perspective.
London: Earthscan. Retrieved from
http://www.fao.org/fileadmin/user_upload/esag/docs/y4252e.pdf
Brumberg, D. (2002). The trap of liberalized autocracy. Journal of Democracy, 13(4), 56–68.
doi:10.1353/jod.2002.0064
Buhaug, H. (2006). Relative capability and rebel objective in civil war. Journal of Peace
Research, 43(6), 691–708. doi:10.1177/0022343306069255
Buhaug, H. (2010a). Climate not to blame for African civil wars. Proceedings of the National
Academy of Sciences, 107(38), 16477–16482. doi:10.1073/pnas.1005739107
Buhaug, H. (2010b). Dude, where’s my conflict? Conflict Management and Peace Science,
27(2), 107 –128. doi:10.1177/0738894209343974
Buhaug, H., & Gates, S. (2002). The geography of civil war. Journal of Peace Research, 39(4),
417–433. doi:10.1177/0022343302039004003
Buhaug, H., Gates, S., & Lujala, P. (2009). Geography, rebel capability, and the duration of
civil conflict. Journal of Conflict Resolution, 53(4), 544–569.
doi:10.1177/0022002709336457
Buhaug, H., Gleditsch, N. P., & Theisen, O. M. (2008). Implications of climate change for
armed conflict. In World Bank Workshop on the Social Dimensions of Climate
Change, The World Bank, Washington. Retrieved from
http://siteresources.worldbank.org/INTRANETSOCIALDEVELOPMENT/Resources/SDC
CWorkingPaper_Conflict.pdf
Buhaug, H., & Lujala, P. (2005). Accounting for scale: Measuring geography in quantitative
studies of civil war. Political Geography, 24(4), 399–418.
doi:10.1016/j.polgeo.2005.01.006
2 0 4 B i b l i o g r a p h y
Buhaug, H., & Rød, J. K. (2006). Local determinants of African civil wars, 1970-2001. Political
Geography, 25(3), 315–335. doi:10.1016/j.polgeo.2006.02.005
Burke, M. B., Miguel, E., Satyanath, S., Dykema, J. A., & Lobell, D. B. (2009). Warming
increases the risk of civil war in Africa. Proceedings of the National Academy of
Sciences of the United States of America, 106(49), 20670–20674.
doi:10.1073/pnas.0907998106
Butt, B. (2012). Commoditizing the safari and making space for conflict: Place, identity and
parks in East Africa. Political Geography, 31(2), 104–113.
doi:10.1016/j.polgeo.2011.11.002
Caprioli, M. (2005). Primed for Violence: The Role of Gender Inequality in Predicting Internal
Conflict. International Studies Quarterly, 49(2), 161–178. doi:10.1111/j.0020-
8833.2005.00340.x
Caren, N., & Panofsky, A. (2005). TQCA: A technique for adding temporality to qualitative
comparative analysis. Sociological Methods & Research, 34(2), 147 – 172.
doi:10.1177/0049124105277197
Carey, M. (2012). Climate and history: A critical review of historical climatology and climate
change historiography. Wiley Interdisciplinary Reviews: Climate Change, 3(3), 233–
249. doi:10.1002/wcc.171
Carius, A., & Imbusch, K. (1999). Environment and security in international politics. In A.
Carius & K. M. Lietzmann (Eds.), Environmental change and security (pp. 7 – 30).
Dordrecht: Springer.
Carothers, T. (2002). The end of the transition paradigm. Journal of Democracy, 13(1), 5–21.
doi:10.1353/jod.2002.0003
Casas, J. (Ed.). (1999). The national agricultural research systems in the west Asia and north
Africa region. Aleppo: International Center for Agricultural Research in Dry Areas
(ICARDA), Food and Agricultural Organization of the United Nations (FAO),
Association of Agricultural Research Institutions in the Near East and North Africa
(AARINENA, and Centre International de Hautes Études Agronomiques
Méditerranéennes (CIHEAM).
CDC, IISD, & Saferworld. (2009). Climate change and conflict: Lessons from community
conservancies in northern Kenya. Conservation Development Centre (CDC),
International Institute for Sustainable Development (IISD) & Saferworld. Retrieved
from http://www.iisd.org/publications/pub.aspx?id=1202
Cederman, L.-E., Buhaug, H., & Rød, J. K. (2009). Ethno-nationalist dyads and civil war: a GIS-
based analysis. Journal of Conflict Resolution, 53(4), 496–525.
doi:10.1177/0022002709336455
Cederman, L.-E., & Girardin, L. (2007). Beyond fractionalization: Mapping ethnicity onto
nationalist insurgencies. American Political Science Review, 101(1), 173.
doi:10.1017/S0003055407070086
B i b l i o g r a p h y 2 0 5
Cederman, L.-E., & Gleditsch, K. S. (2009). Introduction to special issue on “disaggregating
civil war.” Journal of Conflict Resolution, 53(4), 487–495.
doi:10.1177/0022002709336454
Cederman, L.-E., Min, B., & Wimmer, A. (2009). Ethnic power relations dataset. Retrieved
May 25, 2012, from http://hdl.handle.net/1902.1/11796
Chambers, R., Saxena, N. C., & Shah, T. (1990). To the hands of the poor: Water and trees.
Boulder: Westview Press.
Chan, S. (2003). Explaining war termination: A boolean analysis of causes. Journal of Peace
Research, 40(1), 49–66. doi:10.1177/0022343303040001205
Chappell, M. J., & LaValle, L. A. (2009). Food security and biodiversity: Can we have both? An
agroecological analysis. Agriculture and Human Values, 28(1), 3–26.
doi:10.1007/s10460-009-9251-4
Cheeseman, N., & Ford, R. (2007). Ethnicity as political cleavage (Afrobarometer Working
Paper No. 83). Retrieved from
http://mercury.ethz.ch/serviceengine/Files/ISN/91891/ipublicationdocument_single
document/9d945a99-a657-4dbc-9392-1de84e4a4868/en/AfropaperNo83.pdf
Chojnacki, S., & Reisch, G. (2008). Perspectives on war: Collecting, comparing and
disaggregating data on violent conflicts. Beiträge Aus Sicherheitspolitik Und
Friedensforschung, 26(4), 233–245.
Christian Aid. (2006). The climate of poverty: Facts, fears and hope. London: Christian Aid.
Retrieved from
http://www.christianaid.org.uk/resources/policy/climate_change.aspx
CIA World Factbook. (2012a). Crude oil - production. The World Factbook. Retrieved
December 5, 2012, from https://www.cia.gov/library/publications/the-world-
factbook/fields/2241.html#top
CIA World Factbook. (2012b). Export - commodities. The World Factbook. Retrieved
December 21, 2012, from https://www.cia.gov/library/publications/the-world-
factbook/fields/2049.html#uz
CIA World Factbook. (2012c). Oil - exports. The World Factbook. Retrieved December 5,
2012, from https://www.cia.gov/library/publications/the-world-
factbook/rankorder/2176rank.html
Ciccone, A. (2011). Economic shocks and civil conflict: A comment. American Economic
Journal: Applied Economics, 3(4), 215–227. doi:10.1257/app.3.4.215
Cincotta, R. P., Engelman, R., & Anastasion, D. (2003). The security demographic.
Washington D.C.: Population Action International.
Cingranelli, D. L., & Richards, D. L. (2010). The Cingranelli-Richards (CIRI) human rights
dataset. Retrieved from http://www.humanrightsdata.org
Clark, W. C., Crutzen, P. J., & Schellnhuber, H. J. (2004). Science for global sustainability:
Toward a new paradigm. In H. J. Schellnhuber, P. J. Crutzen, W. C. Clark, M. Claussen,
& H. Held (Eds.), Earth system analysis for sustainability. Berlin and Cambridge:
Massachusetts Institute of Technology and Freie Universität Berlin.
2 0 6 B i b l i o g r a p h y
Clover, J. L. (2007). Framing issues of environmental security in Angola & Mozambique - The
nexus of land, conflicts and sustainable livelihoods in post-conflict situations
(Doctoral thesis). University of Witwatersrand, Johannesburg. Retrieved from
http://wiredspace.wits.ac.za/handle/10539/6953
CNA. (2007). National security and the threat of climate change. Alexandria: Center for
Naval Analyses (CNA). Retrieved from http://www.cna.org/reports/climate
Cohn, E. G., & Rotton, J. (1997). Assault as a function of time and temperature: A
moderator-variable time-series analysis. Journal of Personality and Social
Psychology, 72(6), 1322–1334. doi:10.1037/0022-3514.72.6.1322
Collier, P. (1999). On the economic consequences of civil war. Oxford Economic Papers,
51(1), 168–183. doi:10.1093/oep/51.1.168
Collier, P. (2000). Rebellion as a quasi-criminal activity. Journal of Conflict Resolution, 44(6),
839–853. doi:10.1177/0022002700044006008
Collier, P., Elliot, V. L., Hegre, H., Hoeffler, A., Reynal-Querol, M., & Sambanis, N. (2003).
Breaking the conflict trap: Civil war and development policy (A World Bank Policy
Research Report). Washington D.C.: World Bank and Oxford University Press.
Collier, P., & Hoeffler, A. (1998). On economic causes of civil war. Oxford Economic Papers,
50(4), 563–573. doi:10.1093/oep/50.4.563
Collier, P., & Hoeffler, A. (2004). Greed and grievance in civil war. Oxford Economic Papers,
56(4), 563–595. doi:10.1093/oep/gpf064
Collier, P., & Hoeffler, A. (2007). Civil war. In T. Sandler & K. Hartley (Eds.), Handbook of
defense economics: Defense in a globalized world (Vol. 2, pp. 711–739). Amsterdam
and London: Elsevier. Retrieved from
http://www.sciencedirect.com/science/article/pii/S1574001306020230
Collier, P., Hoeffler, A., & Rohner, D. (2009). Beyond greed and grievance: Feasibility and
civil war. Oxford Economic Papers, 61(1), 1–27. doi:10.1093/oep/gpn029
Collier, P., & Sambanis, N. (2002). Understanding civil war. Journal of Conflict Resolution,
46(1), 3–12. doi:10.1177/0022002702046001001
Compasss.org. (2012). Bibliography. Compasss. Retrieved May 29, 2012, from
http://www.compasss.org/bibdata.htm
Cramer, C. (2006). Civil war is not a stupid thing: Accounting for violence in developing
countries. London: C. Hurst & Company.
Cronqvist, L. (2005). Introduction to multi-value qualitative comparative analysis (MVQCA).
COMPASSS Didactical Papers, 4.
Crutzen, P. J. (2002). Geology of mankind. Nature, 415(6867), 23–23. doi:10.1038/415023a
Cutter, S. L., Boruff, B. J., & Shirley, W. L. (2003). Social vulnerability to environmental
hazards. Social Science Quarterly, 84(2), 242–261. doi:10.1111/1540-6237.8402002
Dalby, S. (2002). Environmental security. Minneapolis: University of Minnesota Press.
Davey, S., & Ragin, C. C. (2009). fs/QCA, Version 2.5. Tucson: University of Arizona. Retrieved
from http://www.u.arizona.edu/~cragin/fsQCA/software.shtml
B i b l i o g r a p h y 2 0 7
Davies, J. C. (1962). Toward a theory of revolution. American Sociological Review, 27(1), 5–
19.
Davies, V. A. B. (2008). Postwar capital flight and inflation. Journal of Peace Research, 45(4),
519–537. doi:10.1177/0022343308091359
Davis, G. A. (2009). Trade in mineral resources: Background paper to the 2010 world trade
report (Staff Working Paper No. ERSD-2010-01). World Trade Organization, Economic
Research and Statistics Division. Retrieved from
http://www.wto.org/english/res_e/reser_e/ersd201001_e.pdf
De Meur, G., Rihoux, B., & Yamasaki, S. (2008). Addressing the critiques of QCA. In B. Rihoux
& C. C. Ragin (Eds.), Configurational comparative methods: Qualitative comparative
analysis (QCA) and related techniques (pp. 147 – 165). Los Angeles: Sage
Publications.
De Rouen, K. R., & Sobek, D. (2004). The dynamics of civil war duration and outcome.
Journal of Peace Research, 41(3), 303 –320. doi:10.1177/0022343304043771
De Soysa, I. (2002a). Ecoviolence: Shrinking pie, or honey pot? Global Environmental Politics,
2(4), 1–34. doi:10.1162/152638002320980605
De Soysa, I. (2002b). Paradise is a bazaar? Greed, creed, and governance in civil war, 1989-
99. Journal of Peace Research, 39(4), 395–416. doi:10.1177/0022343302039004002
De Soysa, I., & Gleditsch, N. P. (1999). To cultivate peace: Agriculture in a world of conflict
(Environmental Change and Security Project Report No. 5) (pp. 15–25). Washington
D.C.: Woodrow Wilson International Center for Scholars.
De Waal, A. (2007, June 25). Is climate change the culprit for Darfur? Making sense of
Darfur. Retrieved from http://www.ssrc.org/blogs/darfur/2007/06/25/is-climate-
change-the-culprit-for-darfur/
Debiel, T. (2002). Do crisis regions have a chance of lasting peace? The difficult
transformation from structures of violence. In T. Debiel & A. Klein (Eds.), Fragile
peace: State failure, violence and development in crisis regions (pp. 1 – 30). London
and New York: Zed Books.
deGrassi, A. (2008). “Neopatrimonialism” and agricultural development in Africa:
Contributions and limitations of a contested concept. African Studies Review, 51(3),
107–133. doi:10.2307/27667382
Deligiannis, T. (2012). The evolution of environment-conflict research: Toward a livelihood
framework. Global Environmental Politics, 12(1), 78–100.
Des Forges, A. L. (1999). “Leave none to tell the story”: Genocide in rwanda. New York:
Human Rights Watch.
Dessler, D. (1994). How to sort causes in the study of environmental change and violent
conflict. In N. Graeger & D. Smith (Eds.), Environment, poverty, conflict (pp. 91–112).
Oslo: International Peace Research Institute.
Dessler, D. (1999). New publications (Environmental Change and Security Project Report No.
5). Washington D.C.: Woodrow Wilson International Center for Scholars. Retrieved
from http://www.wilsoncenter.org/topics/pubs/Report5-Sect4.pdf
2 0 8 B i b l i o g r a p h y
Detraz, N. (2011). Threats or vulnerabilities? Assessing the link between climate change and
security. Global Environmental Politics, 11(3), 104–120.
doi:doi:10.1162/GLEP_a_00071
Deudney, D. (1990). The case against linking environmental degradation and national
security. Millennium: Journal of International Studies, 19(3), 461–76.
doi:10.1177/03058298900190031001
Devitt, C., & Tol, R. S. (2012). Civil war, climate change, and development: A scenario study
for Sub-Saharan Africa. Journal of Peace Research, 49(1), 129–145.
doi:10.1177/0022343311427417
Diamond, J. M. (2005). Collapse: How societies choose to fail or succeed. New York: Viking
Penguin.
Diamond, L. (1999). Developing democracy: Toward consolidation. Baltimore: John Hopkins
University Press.
Diamond, L. (2010). Why are there no Arab democracies? Journal of Democracy, 21(1), 93–
112. doi:10.1353/jod.0.0150
Dijkstra, A. G. (2006). Towards a fresh start in measuring gender equality: A contribution to
the debate. Journal of Human Development, 7(2), 275–283.
doi:10.1080/14649880600768660
Dixon, J. (2009). What causes civil wars? Integrating quantitative research findings.
International Studies Review, 11(4), 707–735. doi:10.1111/j.1468-2486.2009.00892.x
Do, Q.-T., & Iyer, L. (2010). Geography, poverty and conflict in Nepal. Journal of Peace
Research, 47(6), 735–748. doi:10.1177/0022343310386175
Dokken, K. (1997). Environmental conflict and international integration. In N. P. Gleditsch
(Ed.), Conflict and the environment (Vol. 33). Dordrecht: Kluwer Academic Publishers.
Dolisca, F. (2005). Population pressure, land tenure, deforestation, and farming systems in
Haiti: The case of Forêt des Pins Reserve (Dissertation). Auburn University, Auburn.
Retrieved from http://etd.auburn.edu/etd/handle/10415/731
Drach, M. C. S. von. (2010, May 17). Klima und Frieden: Klima als Frage von Krieg und
Frieden. sueddeutsche.de. Retrieved from
http://www.sueddeutsche.de/wissen/klima-und-frieden-klima-als-frage-von-krieg-
und-frieden-1.831291
Drury, A. C., & Olson, R. S. (1998). Disasters and political unrest: An empirical investigation.
Journal of Contingencies and Crisis Management, 6(3), 153–161. doi:10.1111/1468-
5973.00084
Dyer, G. (2011). Climate wars: The fight for survival as the world overheats. Oxford:
Oneworld Publications.
Easterbrook, G. (1995). A moment on the earth: The coming age of environmental optimism.
New York: Viking.
Easterly, W., & Levine, R. (1997). Africa’s growth tragedy: Policies and ethnic divisions. The
Quarterly Journal of Economics, 112(4), 1203–1250. doi:10.1162/003355300555466
B i b l i o g r a p h y 2 0 9
Eberle, S. D., Martin, C. W., & Schneider, G. (2003). The spillovers of globalization and civil
war: Opposite or parallel sources of violent domestic conflict? Presented at the ECPR
Joint Sessions of Workshops, Edinburgh.
Eck, K. (2005). A beginner’s guide to conflict data: Finding and using the right dataset (UCDP
Papers No. 1). Uppsala: Uppsala Conflict Data Program.
Eck, K., Kreutz, J., & Sundberg, R. (2010). Introducing the UCDP non-state conflict dataset.
Uppsala. Retrieved from http://www.pcr.uu.se/research/ucdp/datasets/ucdp_non-
state_conflict_dataset_/
ECOSOC. (1997). Comprehensive assessment of the freshwater resources of the world:
Report of the secretary-general (Commission on Sustainable Development No.
E/CN.17/1997/9). United Nations Economic and Social Council (ECOSOC). Retrieved
from http://www.un.org/esa/documents/ecosoc/cn17/1997/ecn171997-9.htm
Ehrlich, P. R. (1968). The population bomb. New York: Ballantine Books.
Ehrlich, P. R., & Ehrlich, A. H. (1990). The population explosion. London: Frederick Muller.
Ejigu, M. (2009). Environmental scarcity, insecurity and conflict: The cases of Uganda,
Rwanda, Ethiopia and Burundi. In H. G. Brauch, N. C. Behera, P. Kameri-Mbote, J.
Grin, Ú. O. Spring, B. Chourou, … H. Krummenacher (Eds.), Facing global
environmental change: Environmental, human, energy, food, health and water
security concepts (pp. 895–914). Berlin and Heidelberg: Springer.
Elbadawi, I., & Hegre, H. (2008). Globalization, economic shocks, and internal armed
conflict. Defence and Peace Economics, 19(1), 37–60.
doi:10.1080/10242690701365160
Elbadawi, I., & Sambanis, N. (2002). How much war will we see? Journal of Conflict
Resolution, 46(3), 307 –334. doi:10.1177/0022002702046003001
Ellingsen, T. (2000). Colourful community or ethnic witches’ brew? Journal of Conflict
Resolution, 44(2), 228–249. doi:10.1177/0022002700044002004
Emmenegger, P. (2011). Job security regulations in Western democracies: A fuzzy set
analysis. European Journal of Political Research, 50(3), 336–364. doi:10.1111/j.1475-
6765.2010.01933.x
Emmenegger, P., Kvist, J., & Skaaning, S.-E. (2013). Making the most of configurational
comparative analysis: An assessment of QCA applications in comparative welfare-
state research. Political Research Quarterly, 66(1), 185 – 190.
Engle, N. L. (2011). Adaptive capacity and its assessment. Global Environmental Change,
21(2), 647–656. doi:10.1016/j.gloenvcha.2011.01.019
Erdmann, G., & Engel, U. (2007). Neopatrimonialism reconsidered: Critical review and
elaboration of an elusive concept. Commonwealth & Comparative Politics, 45(1), 95–
119. doi:10.1080/14662040601135813
Esteban, J., & Ray, D. (1994). On the measurement of polarization. Econometrica, 62(4),
819–851. doi:10.2307/2951734
Esteban, J., & Ray, D. (2008). Polarization, fractionalization and conflict. Journal of Peace
Research, 45(2), 163–182. doi:10.1177/0022343307087175
2 1 0 B i b l i o g r a p h y
Esty, D. C., Goldstone, J. A., Gurr, T. R., Harff, B., Levy, M. A., Dabelko, G. D., … Unger, A. N.
(1998). The statefailure taskforce report: Phase II findings. McLean: Science
Applications International Corporation.
European Commission Standing Committee on Agricultural Research. (2012a). SCAR -
National research systems - Netherlands. Research & Innovation. Retrieved April 12,
2013, from http://ec.europa.eu/research/agriculture/scar/nl_en.htm
European Commission Standing Committee on Agricultural Research. (2012b). SCAR -
National research systems - Switzerland. Research & Innovation. Retrieved April 12,
2013, from http://ec.europa.eu/research/agriculture/scar/ch_en.htm
Fagan, B. M. (2004). The long summer: How climate changed civilization. New York: Basic
Books.
Fairhead, J. (2001). International dimensions of conflict over natural and environmental
resources. In N. L. Peluso & M. Watts (Eds.), Violent environments. Ithaca and
London: Cornell University Press.
Falkenmark, M., Lundqvist, J., & Widstrand, C. (1989). Macro‐scale water scarcity requires
micro‐scale approaches. Natural Resources Forum, 13(4), 258–267.
doi:10.1111/j.1477-8947.1989.tb00348.x
FAO. (1997a). Irrigation potential in Africa: A basin approach (No. 4). Rome: Food and
Agricultural Organization of the United Nations (FAO). Retrieved from
http://www.fao.org/docrep/W4347E/W4347E00.htm
FAO. (1997b). Tajikistan. Food and Agriculture Organization of the United Nations (FAO).
Retrieved June 28, 2011, from
http://www.fao.org/nr/water/aquastat/countries_regions/tajikistan/index.stm
FAO. (2000). Land resource potential and constraints at regional and country levels (World
Soil Resources Report No. 90). Rome: Food and Agricultural Organization of the
United Nations (FAO). Retrieved from ftp://ftp.fao.org/agl/agll/docs/wsr.pdf
FAO. (2003). Review of world water resources by country (Water Reports No. 23). Rome:
Food and Agricultural Organization of the United Nations (FAO). Retrieved from
ftp://ftp.fao.org/agl/aglw/docs/wr23e.pdf
FAO. (2009). Faostat. Food and Agricultural Organization of the United Nations (FAO).
Retrieved from http://faostat.fao.org/site/377/default.aspx#ancor
FAO. (2011). Computation of long-term average annual renewable water resources by
country (in km3/year): Syrian Arab Republic. Food and Agricultural Organization of
the United Nations (FAO). Retrieved from
http://www.fao.org/nr/water/aquastat/data/wbsheets/aquastat_water_balance_sh
eet_syr_en.pdf
FAO. (2012). Population - Agricultural and economically active population. Methods &
Standards. Retrieved January 8, 2013, from
http://faostat3.fao.org/home/index.html#METADATA
B i b l i o g r a p h y 2 1 1
FAO. (2013). Gender and land rights database. Food and Agriculture Organization of the
United Nations (FAO). Retrieved March 7, 2013, from
http://www.fao.org/gender/landrights/en/
Farah, I., Hussein, A., & Lind, J. (2002). Deegaan, politics and war in Somalia. In K. Sturman &
J. Lind (Eds.), Scarcity and surfeit: The ecology of Africa’s conflicts (pp. 320 – 356).
Pretoria: Institute for Security Studies (ISS). Retrieved from
http://www.iss.co.za/pubs/Books/ScarcitySurfeit/Chapter7.pdf
Faris, S. (2007, April). The real roots of Darfur. The Atlantic. Retrieved from
http://www.theatlantic.com/doc/200704/darfur-climate/2
Faurés, J.-M., Svendsen, M., Turral, H., Berkoff, J., Bhattarai, M., Caliz, A. M., … Groenfeldt,
D. (2007). Reinventing irrigation. In D. Molden (Ed.), Water for food, water for life: A
comprehensive assessment of water management in agriculture. London: Earthscan.
Retrieved from
http://www.iwmi.cgiar.org/assessment/Water%20for%20Food%20Water%20for%20
Life/Chapters/Chapter%209%20Irrigation.pdf
Fearon, J. D. (2003). Ethnic and cultural diversity by country. Journal of Economic Growth,
8(2), 195–222. doi:10.1023/A:1024419522867
Fearon, J. D. (2005). Primary commodity exports and civil war. Journal of Conflict Resolution,
49(4), 483–507. doi:10.1177/0022002705277544
Fearon, J. D., Kasara, K., & Laitin, D. D. (2007). Ethnic minority rule and civil war onset.
American Political Science Review, 101(01), 187–193.
doi:10.1017/S0003055407070219
Fearon, J. D., & Laitin, D. D. (2003). Ethnicity, insurgency, and civil war. American Political
Science Review, 97(01), 75–90. doi:10.1017/S0003055403000534
Federal Research Division. (2006). Country profile: Haiti. Washington D.C.: Library of
Congress. Retrieved from http://lcweb2.loc.gov/frd/cs/profiles/Haiti.pdf
Fischer, A., & Levy, M. A. (2011). Designing environmental restoration programs in politically
fragile states: Lessons from Haiti. In Strengthening post-conflict security and
diplomacy. Washington D.C. and Tokyo: The Environmental Law institute (ELI), the
Global Infrastructure Fund (GIF) & the Center for Global Partnership of the Japan
Foundation (CGP). Retrieved from
http://ac4.ei.columbia.edu/files/2011/10/Designing-environmental-restoration-
programs-in-politically-fragile-states-Lessons-from-Haiti.pdf
Fischer, G., Shah, M., van Velthuizen, H., & Nachtergaele, F. O. (2006). Agro-ecological zones
assessment. In W. H. Verheye (Ed.), Encyclopedia of life support systems. Oxford:
Eolss. Retrieved from http://www.iiasa.ac.at/Admin/PUB/Documents/RP-06-003.pdf
Fjelde, H., & von Uexkull, N. (2012). Climate triggers: Rainfall anomalies, vulnerability and
communal conflict in Sub-Saharan Africa. Political Geography, 31(7), 444–453.
doi:10.1016/j.polgeo.2012.08.004
Flintan, F., & Tamrat, I. (2002). Spilling blood over water? The case of Ethiopia. In J. Lind & K.
Sturman (Eds.), Scarcity and surfeit: The ecology of Africa’s conflicts (pp. 243–319).
2 1 2 B i b l i o g r a p h y
Pretoria: Institute for Security Studies (ISS). Retrieved from
http://www.iss.co.za/pubs/Books/ScarcitySurfeit/Chapter6.pdf
Frankel, J. A., & Romer, D. (1999). Does trade cause growth? The American Economic
Review, 89(3), 379–399. doi:10.1257/aer.89.3.379
Friedmann, L. (2009, March 23). A global “national security” issue lurks at Bangladesh’s
border. The New York Times. Retrieved from
http://www.nytimes.com/cwire/2009/03/23/23climatewire-a-global-national-
security-issue-lurks-at-ba-
10247.html?scp=15&sq=climate%20change%20conflict&st=cse
Furlong, K., Gleditsch, N. P., & Hegre, H. (2006). Geographic opportunity and neomalthusian
willingness: Boundaries, shared rivers, and conflict. International Interactions, 32(1),
79–108. doi:10.1080/03050620600596421
Gallup, J. L., Sachs, J. D., & Mellinger, A. D. (1999). Geography and economic development.
International Regional Science Review, 22(2), 179–232.
doi:10.1177/016001799761012334
Galtung, J. (1990). Cultural violence. Journal of Peace Research, 27(3), 291–305.
doi:10.1177/0022343390027003005
Gates, S., Hegre, H., Nygård, H. M., & Strand, H. (2012). Development consequences of
armed conflict. World Development, 40(9), 1713–1722.
doi:10.1016/j.worlddev.2012.04.031
Gawrich, A., Melnykovska, I., & Schweickert, R. (2010). More than oil and geography -
Neopatrimonialism as an explanation of bad governance and autocratic stability in
Central Asia. Presented at the GIGA Workshop Neopatrimonialism in Various World
Regions, Hamburg: GIGA German Institute of Global and Area Studies. Retrieved
from http://www.giga-
hamburg.de/content/fsp1/pdf/neopat/paper_neopat_workshop_gawrich.pdf
Gengler, J. J. (2011). Ethnic conflict and political mobilization in Bahrain and the Arab gulf
(Doctoral thesis). University of Michigan, Ann Arbor. Retrieved from
http://bahrainipolitics.blogspot.nl/2011/09/ethnic-conflict-and-political.html
Gerring, J. (2005). Causation: A unified framework for the social sciences. Journal of
Theoretical Politics, 17(2), 163–198. doi:10.1177/0951629805050859
Gerth, H. H., & Mills, C. W. (Eds.). (1991). From Max Weber: Essays in sociology. Oxford:
Routledge.
Ghobarah, H. A., Huth, P., & Russett, B. (2003). Civil wars kill and maim people—long after
the shooting stops. American Political Science Review, 97(02), 189–202.
doi:10.1017.S0003055403000613
Giannone, D. (2010). Political and ideological aspects in the measurement of democracy:
The Freedom House case. Democratization, 17(1), 68–97.
doi:10.1080/13510340903453716
Giordano, M. F., Giordano, M. A., & Wolf, A. T. (2005). International resource conflict and
mitigation. Journal of Peace Research, 42(1), 47–65. doi:10.1177/0022343305049666
B i b l i o g r a p h y 2 1 3
Giri, B. R. (2004). Bhutan: Ethnic policies in the dragon kingdom. Asian Affairs, 35(3), 353–
364. doi:10.1080/0306837042000303939
Gizelis, T.-I., & Wooden, A. E. (2010). Water resources, institutions, & intrastate conflict.
Political Geography, 29(8), 444–453. doi:10.1016/j.polgeo.2010.10.005
Gleditsch, N. P. (1998). Armed conflict and the environment: A critique of the literature.
Journal of Peace Research, 381–400. doi:10.1177/0022343398035003007
Gleditsch, N. P. (2001). Armed conflict and the environment. In N. P. Gleditsch & P. F. Diehl
(Eds.), Environmental conflict (pp. 251–272). Boulder: Westview Press.
Gleditsch, N. P. (2012). Whither the weather? Climate change and conflict. Journal of Peace
Research, 49(1), 3–9. doi:10.1177/0022343311431288
Gleditsch, N. P., Furlong, K., Hegre, H., Lacina, B., & Owen, T. (2006). Conflicts over shared
rivers: Resource scarcity or fuzzy boundaries? Political Geography, 25(4), 361–382.
doi:10.1016/j.polgeo.2006.02.004
Gleditsch, N. P., Nordas, R., & Salehyan, I. (2007). Climate change and conflict: The migration
link. New York: International Peace Institute (IPI).
Gleditsch, N. P., & Theisen, O. M. (2007). Resources, the environment, and conflict. Retrieved
from http://www.prio.no/files/file48356_gleditsch_theisen_160906.doc
Gleditsch, N. P., Wallensteen, P., Eriksson, M., Sollenberg, M., & Strand, H. (2002). Armed
conflict 1946-2001: A new dataset. Journal of Peace Research, 39(5), 615 –637.
doi:10.1177/0022343302039005007
Gleick, P. H. (1989). Climate change and international politics: Problems facing developing
countries. AMBIO: A Journal of the Human Environment, 18(6), 333–339.
Gleick, P. H. (1990). Environment, resources, and international security and politics. In E. H.
Arnett (Ed.), Science and international security. Responding to a changing world
(American Association for the Advancement of Science., pp. 501–523). Washington
D.C.
Gleick, P. H. (1991). Environment and security: The clear connections. Bulletin of the Atomic
Scientists, 47(3), 16–21.
Gleick, P. H. (1993). Water and conflict: Fresh water resources and international security.
International Security, 18(1), 79–112.
Gleick, P. H. (2000). The world’s water 2000-2001: The biennial report on freshwater
resources. Washington, Covelo and London: Island Press.
Gleick, P. H., Chalecki, E. L., & Wong, A. (2002). Measuring water well-being: Water
indicators and indices. In P. H. Gleick, W. C. Burns, E. L. Chalecki, M. Cohen, K. K.
Cushing, A. S. Mann, … A. K. Wong (Eds.), The world’s water 2002-2003: The biennial
report on freshwater resources (pp. 87 – 112). Washington, Covelo and London:
Island Press.
Goertz, G., & Mahoney, J. (2005). Two-level theories and fuzzy-set analysis. Sociological
Methods & Research, 33(4), 497–538. doi:10.1177/0049124104266128
Goldstone, J. A. (1993). Revolution and rebellion in the early modern world. Berkeley and Los
Angeles: University of California Press.
2 1 4 B i b l i o g r a p h y
Goldstone, J. A. (2002). Population and security: How demographic change can lead to
violent conflict. Journal of International Affairs, 56(1), 3–22.
Grant, J., Golawala, F. S., & McKechnie, D. S. (2007). The United Arab Emirates: The twenty-
first century beckons. Thunderbird International Business Review, 49(4), 507–533.
doi:10.1002/tie.20155
Grinsted, A., Moore, J. C., & Jevrejeva, S. (2010). Reconstructing sea level from paleo and
projected temperatures 200 to 2100 ad. Climate Dynamics, 34(4), 461–472.
doi:10.1007/s00382-008-0507-2
Groenewald, Y. (2007, December 18). The climate wars. Mail & Guardian. Cape Town.
Retrieved from http://mg.co.za/article/2007-12-18-the-climate-wars/
Gros, J.-G. (2011). Anatomy of a Haitian tragedy: When the fury of nature meets the debility
of the state. Journal of Black Studies, 42(2), 131–157.
doi:10.1177/0021934710394442
Grossman, H. I. (1991). A general equilibrium model of insurrections. The American
Economic Review, 81(4), 912–921. doi:10.2307/2006650
Guha-Sapir, D., Vos, F., & Below, R. (2010). Annual disaster statistical review 2010. Brussels:
Centre for research on the epidemiology of disasters (CRED) & Université catholique
de Louvain. Retrieved from
http://cip.management.dal.ca/publications/ADSR_2010.pdf
Gurr, T. R. (1970). Why men rebel. Princeton: Princeton University Press.
Gurr, T. R. (2000). Ethnic warfare on the wane. Foreign Affairs, 79(3), 52–64.
Haas, E. (1993). Collective conflict management: Evidence for a new world order? In Weiss,
Thomas G (Ed.), Collective security in a changing world (pp. 63–117). Boulder: Lynne
Rienner.
Haggard, S. (1990). Pathways from the periphery: The politics of growth in the newly
industrializing countries. Ithaca: Cornell University Press.
Haggard, S., MacIntyre, A., & Tiede, L. (2008). The rule of law and economic development.
Annual Review of Political Science, 11(1), 205–234.
doi:10.1146/annurev.polisci.10.081205.100244
Hagmann, T. (2005). Confronting the concept of environmentally induced conflict. Peace,
Conflict and Development, 6(6), 1–22.
Hallberg, J. D. (2012). PRIO conflict site 1989–2008: A geo-referenced dataset on armed
conflict. Conflict Management and Peace Science, 29(2), 219–232.
doi:10.1177/0738894211433168
Hanf, T., & Bauerle, P. (2009). Factors determining democratic attitudes in deeply divided
societies. Eschborn: Deutsche Gesellschaft für Technische Zusammenarbeit (GTZ).
Retrieved from
http://www.ineesite.org/uploads/files/resources/factors_determining_democratic_
attitudes_04_09.pdf
Harbom, L., & Wallensteen, P. (2007). Armed conflict, 1989—2006. Journal of Peace
Research, 44(5), 623–634. doi:10.1177/0022343307080859
B i b l i o g r a p h y 2 1 5
Hardin, G. (1968). The tragedy of the commons. Science, 162(3859), 1243–1248.
doi:10.1126/science.162.3859.1243
Hartmann, B. (2001). Will the circle be unbroken? A critique of the project on environment,
population, and security. In N. L. Peluso & M. Watts (Eds.), Violent environments (pp.
39–62). Ithaca: Cornell University Press.
Harvey, F. (2011, July 6). Climate change will increase threat of war, Chris Huhne to warn.
The Guardian. London. Retrieved from
http://www.theguardian.com/environment/2011/jul/06/climate-change-war-chris-
huhne
Hauge, W., & Ellingsen, T. (1998). Beyond environmental scarcity: Causal pathways to
conflict. Journal of Peace Research, 35(3), 219–317.
doi:10.1177/0022343398035003003
Hegre, H. (forthcoming). Civil conflict and development. In N. van de Walle & C. Lancaster
(Eds.), Oxford handbook on the politics of development. Oxford: Oxford University
Press.
Hegre, H., Ellingsen, T., Gates, S., & Gleditsch, N. P. (2001). Toward a democratic civil peace?
Democracy, political change, and civil war, 1816–1992. American Political Science
Review, 95(1), 33–48.
Hegre, H., Gissinger, R., & Gleditsch, N. P. (2003). Globalization and internal conflict. In G.
Schneider, K. Barbieri, & N. P. Gleditsch (Eds.), Globalization and armed conflict (pp.
251 – 275). Oxford: Rowman & Littlefield.
Hegre, H., & Sambanis, N. (2006). Sensitivity analysis of empirical results on civil war onset.
Journal of Conflict Resolution, 50(4), 508–535. doi:10.1177/0022002706289303
Heintze, H.-J. (2002). An independent judiciary in crisis regions: Challenges for international
law in cases of state failure and armed conflict. In T. Debiel & A. Klein (Eds.), Fragile
peace: State failure, violence and development in crisis regions (pp. 1 – 30). London
and New York: Zed Books.
Heltberg, R., Siegel, P. B., & Jorgensen, S. L. (2010). Social policies for adaptation to climate
change. In R. Mearns & A. Norton (Eds.), Social dimensions of climate change: Equity
and vulnerability in a warming world. Washington D.C.: The International Bank for
Reconstruction and Development and The World Bank.
Henderson, E. A., & Singer, J. D. (2000). Civil war in the post-colonial world, 1946-92. Journal
of Peace Research, 37(3), 275–299. doi:10.1177/0022343300037003001
Hendrix, C. S. (2010). Measuring state capacity: Theoretical and empirical implications for
the study of civil conflict. Journal of Peace Research, 47(3), 273 –285.
doi:10.1177/0022343310361838
Hendrix, C. S., & Glaser, S. M. (2007). Trends and triggers: Climate, climate change and civil
conflict in Sub-Saharan Africa. Political Geography, 26(6), 695–715.
doi:10.1016/j.polgeo.2007.06.006
Hendrix, C. S., & Salehyan, I. (2012). Climate change, rainfall, and social conflict in Africa.
Journal of Peace Research, 49(1), 35–50. doi:10.1177/0022343311426165
2 1 6 B i b l i o g r a p h y
Hensel, P. R., & McLaughlin, S. (2009). The issues correlates of war dataset. Retrieved from
http://www.paulhensel.org/icow.html#issues
Hensel, P. R., Mitchell, S. M., & Sowers, T. E. (2006). Conflict management of riparian
disputes. Political Geography, 25(4), 383–411. doi:10.1016/j.polgeo.2005.11.001
Henson, R. (2011). The rough guide to climate change. London: Rough Guides.
Herbst, J. (2000). States and power in Africa: Comparative lessons in authority and control.
Princeton: Princeton University Press.
Hibbs, D. A. (1973). Mass political violence: A cross-national causal analysis. New York,
London, Sydney and Toronto: John Wiley and Sons.
High Representative and the European Commission. (2008). Climate change and
international security: Paper from the High Representative and the European
Commission to the European Council. Retrieved from
http://www.consilium.europa.eu/uedocs/cms_data/docs/pressdata/en/reports/993
87.pdf
Hildyard, N. (1999). Blood, babies and the social root fo conflict. In M. Suliman (Ed.),
Ecology, politics and violent conflict. London: Zed Books.
Hino, A. (2009). Time-series QCA: Studying temporal change through Boolean analysis.
Sociological Theory and Methods, 24(2), 247–265.
Holsti, K. J. (1991). Peace and war: Armed conflicts and international order, 1648-1989.
Cambridge: Cambridge University Press.
Holsti, K. J. (1996). The state, war, and the state of war. Cambridge: Cambridge University
Press.
Homer-Dixon, T. F. (1991). On the threshold: Environmental changes as causes of acute
conflict. International Security, 16(2), 76–116. doi:10.2307/2539061
Homer-Dixon, T. F. (1994). Environmental scarcities and violent conflict: Evidence from
cases. International Security, 19(1), 5–40.
Homer-Dixon, T. F. (1995). The ingenuity gap: Can poor countries adapt to resource scarcity?
Population and Development Review, 21(3), 587–612.
Homer-Dixon, T. F. (1996a). Debate (Environmental Change and Security Project Report No.
2) (pp. 58–60). Washington D.C.: Woodrow Wilson International Center for Scholars.
Retrieved from http://www.wilsoncenter.org/topics/pubs/ACFA6.pdf
Homer-Dixon, T. F. (1996b). Strategies for studying causation in complex ecological-political
systems. The Journal of Environment & Development, 5(2), 132.
Homer-Dixon, T. F. (1999). Environment, scarcity, and violence. Princeton: Princeton
University Press.
Homer-Dixon, T. F., & Levy, M. A. (1995). Correspondence: Environment and security.
International Security, 20(3), 189–198.
Horowitz, D. L. (1985). Ethnic groups in conflict. Berkeley, Los Angeles and London:
University of California Press.
Howard, P. N., & Homer-Dixon, T. F. (1996). Environmental scarcity and violent conflict: The
case of Chiapas, Mexico (Occasional Paper). Washington D.C.: American Association
B i b l i o g r a p h y 2 1 7
for the Advancement of Science and the University of Toronto. Retrieved from
http://www.homerdixon.com/projects/eps/chiapas/chiapas1.htm
Hsiang, S. M., Burke, M., & Miguel, E. (2013). Quantifying the influence of climate on human
conflict. Science, 1237557. doi:10.1126/science.1235367
Hsiang, S. M., Meng, K. C., & Cane, M. A. (2011). Civil conflicts are associated with the global
climate. Nature, 476(7361), 438–441. doi:10.1038/nature10311
Huat, C. B. (2003). Multiculturalism in Singapore: An instrument of social control. Race &
Class, 44(3), 58–77. doi:10.1177/0306396803044003025
Hui, E. C.-M., Ho, V. S.-M., & Ho, D. K.-H. (2004). Land value capture mechanisms in Hong
Kong and Singapore: A comparative analysis. Journal of Property Investment &
Finance, 22(1), 76–100. doi:10.1108/14635780410525153
Hume, D. (1739). A treatise of human nature. Reprinted: Mineola: Courier Dover, 2003.
Hume, D. (1748). An enquiry concerning human understanding. Reprinted: Norderstedt:
GRIN Verlag, 2009.
Humphreys, M. (2005). Natural resources, conflict, and conflict resolution. Journal of
Conflict Resolution, 49(4), 508–537. doi:10.1177/0022002705277545
Huntington, S. P. (1993). The third wave: Democratization in the late twentieth century.
Norman: University of Oklahoma Press.
Hutchings, K., & Weir, D. (2006). Guanxi and Wasta: A comparison. Thunderbird
International Business Review, 48(1), 141–156. doi:10.1002/tie.20090
Hvidt, M. (2009). The Dubai model: An outline of key components of the development
process in Dubai. International Journal of Middle East Studies, 41(3), 397–418.
doi:10.1017/S0020743809091508
IFAD. (2003). Report of the panel on the performance-based allocation system. Rome:
International Fund for Agricultural Development (IFAD). Retrieved from
http://www.ifad.org/gbdocs/eb/80/e/EB-2003-80-R-3.pdf
IFAD. (2005). 2004 progress report on the implementation of the performance-based
allocation system. Rome: International Fund for Agricultural Development (IFAD).
Retrieved from http://www.ifad.org/gbdocs/gc/28/e/GC-28-L-9.pdf
IFAD. (2006). PBAS: Rural sector performance assessments 2005 - 2006. International Fund
for Agricultural Development (IFAD). Retrieved from
http://www.ifad.org/gbdocs/eb/89/e/pbas_rural.pdf
IFAD. (2007). Progress report on the implementation of the performance-based allocation
system. Rome: International Fund for Agricultural Development (IFAD). Retrieved
from http://www.ifad.org/gbdocs/eb/92/e/EB-2007-92-R-46-Add-1.pdf
IFAD. (2010). Progress report on the implementation of the performance-based allocation
system: Addendum. Rome: International Fund for Agricultural Development (IFAD).
Retrieved from http://www.ifad.org/gbdocs/eb/101/e/EB-2010-101-R-45-ADD-1.pdf
IFRC. (2010). World disasters report 2010: Focus on urban risk. International Federation of
Red Cross and Red Crescent Societies (IFRC). Retrieved from
http://www.ifrc.org/en/publications-and-reports/world-disasters-report/wdr2010/
2 1 8 B i b l i o g r a p h y
IIASA World Population Program, & Vienna Institute of Demography. (2011). Absolute
population by age, sex and education. International Institute for Applied Systems
Analysis (IIASA). Retrieved from
http://www.iiasa.ac.at/Research/POP/edu07/index.html?sb=11
Ilkhamov, A. (2007). Neopatrimonialism, interest groups and patronage networks: the
impasses of the governance system in Uzbekistan. Central Asian Survey, 26(1), 65–
84. doi:10.1080/02634930701423491
IMF. (2011). World Economic Outlook. International Monetary Fund. Retrieved February 13,
2012, from http://www.imf.org/external/pubs/ft/weo/faq.htm#q4b
IPCC. (2007). Climate change 2007: Synthesis report. Contribution of working groups I, II and
III to the fourth assessment report of the Interngovernmental Panel on Climate
Change. Geneva: Intergovernmental Panel on Climate Change (IPCC). Retrieved from
http://www.ipcc.ch/publications_and_data/ar4/syr/en/contents.html
Jensen, P. S., & Gleditsch, K. S. (2009). Rain, growth, and civil war: The importance of
location. Defence and Peace Economics, 20(5), 359–372.
doi:10.1080/10242690902868277
Joshi, M., & Mason, T. D. (2010). Land tenure, democracy, and patterns of violence during
the Maoist insurgency in Nepal, 1996–2005. Social Science Quarterly, 91(4), 984–
1006. doi:10.1111/j.1540-6237.2010.00745.x
Kahl, C. H. (1998). Population growth, environmental degradation, and state-sponsored
violence: The case of Kenya, 1991-93. International Security, 23(2), 80–119.
doi:10.2307/2539380
Kahl, C. H. (2008). States, scarcity, and civil strife in the developing world. Princeton:
Princeton University Press.
Kamrava, M. (2009). Royal factionalism and political liberalization in Qatar. The Middle East
Journal, 63(3), 401–420. doi:10.3751/63.3.13
Kaplan, R. (1994). The coming anarchy: How scarcity, crime, overpopulation and disease are
threatening the social fabric of our planet. Atlantic Monthly, 44–74.
Kapur, D., & McHale, J. (2005). Give us your best and brightest: The global hunt for talent
and its impact on the developing world. Washington, D.C.: Center for Global
Development.
Kelly, K., & Homer-Dixon, T. F. (1995). Environmental scarcity and violent conflict: The case
of Gaza (Occasional Paper). Washington D.C.: American Association for the
Advancement of Science and the University of Toronto. Retrieved from
http://www.library.utoronto.ca/pcs/eps/gaza/gaza1.htm
Kelly, P. M., & Adger, W. N. (2000). Theory and practice in assessing vulnerability to climate
change and facilitating adaptation. Climatic Change, 47(4), 325–352.
doi:10.1023/A:1005627828199
Kenrick, D. T., & MacFarlane, S. W. (1986). Ambient temperature and horn honking: A field
study of the heat/aggression relationship. Environment and Behavior, 18(2), 179–
191. doi:10.1177/0013916586182002
B i b l i o g r a p h y 2 1 9
Kingdom of Bahrain, & United Nations. (2003). Millenium Development Goals: First report.
Manama: United Nations Development Programme (UNDP). Retrieved from
http://www.undp.org.bh/Files/MDG03/Goal1.pdf
Klare, M. T. (2001). Resource wars: The new landscape of global conflict. New York:
Metropolitan Books.
Koubi, V., Bernauer, T., Kalbhenn, A., & Spilker, G. (2012). Climate variability, economic
growth, and civil conflict. Journal of Peace Research, 49(1), 113–127.
doi:10.1177/0022343311427173
Kovacs, P. (2010). Reducing the risk of earthquake damage in Canada: Lessons from Haiti
and Chile. Institute for Catastrophic Loss Reduction. Retrieved from
http://www.davidhyde.ca/admin/pdf/73.pdf
Krause, V., & Suzuki, S. (2005a). Analysis: Trade openness, economic development and civil
war onset in the post-colonial world, 1950–1992. Conflict, Security & Development,
5(1), 23–43. doi:10.1080/14678800500103234
Krause, V., & Suzuki, S. (2005b). Causes of civil war in Asia and Sub-Saharan Africa: A
comparison. Social Science Quarterly, 86(1), 160–177. doi:10.1111/j.0038-
4941.2005.00296.x
Larrick, R. P., Timmerman, T. A., Carton, A. M., & Abrevaya, J. (2011). Temper, temperature,
and temptation heat-related retaliation in baseball. Psychological Science, 22(4),
423–428. doi:10.1177/0956797611399292
Lawrence, P., Meigh, J., & Sullivan, C. (2002). The water poverty index: An international
comparison. Keele Economics Research Paper, 19. Retrieved from
http://citeseerx.ist.psu.edu/viewdoc/download?doi=10.1.1.13.2349&rep=rep1&type
Le Billon, P. (2001). The political ecology of war: Natural resources and armed conflicts.
Political Geography, 20(5), 561–584.
Lee, J. R. (2010). Climate change and armed conflict: Hot and cold wars. London and New
York: Routledge.
Lee, S.-W. (1997). Not a one-time event: Environmental change, ethnic rivalry, and violent
conflict in the third world. The Journal of Environment & Development, 6(4), 365–
396. doi:10.1177/107049659700600402
Levy, J. S. (1989). Great power wars 1495 - 1815. Ann Arbor: Inter-University Consortium for
Political and Social Research. Retrieved from
http://www.icpsr.umich.edu/icpsrweb/ICPSR/studies/9955
Levy, M. A. (1995). Time for a third wave of environment and security scholarship?
(Environmental Change and Security Project Report No. 1) (pp. 44–58). Washington
D.C.: Woodrow Wilson International Center for Scholars. Retrieved from
http://www.wilsoncenter.org/sites/default/files/report1a.pdf#page=44
Levy, M. A. (1996). Debate (Environmental Change and Security Project Report No. 2).
Washington D.C.: Woodrow Wilson International Center for Scholars. Retrieved from
http://www.wilsoncenter.org/topics/pubs/ACFA6.pdf
2 2 0 B i b l i o g r a p h y
Levy, M. A., Thorkelson, C., Vörösmarty, C., Douglas, E., & Humphreys, M. (2005).
Freshwater availabilities anomalies and outbreak of internal war: Results from a
global spatial time series analysis. Presented at the International Human Security
and Climate Change Workshop, Holmen Fjord Hotel, Aker, near Oslo: Global
Environmental Change and Human Security Programme (GECHS). Retrieved from
http://www.gechs.org/downloads/holmen/Levy_etal.pdf
Libiszewski, S. (1997). Integrating political and technical approaches: Lessons from the
Israeli-Jordanian water negotiations. In N. P. Gleditsch (Ed.), Conflict and the
environment (Vol. 33, pp. 385–402). Dordrecht: Kluwer Academic Publishers.
Lietzmann, K. M., & Vest, G. D. (1999). Environment and security in an international context
(Environmental Change and Security Project Report No. 5) (pp. 34–48). North
Atlantic Treaty Organization.
Lipschutz, R. (1997). Environmental conflict and environmental determinism: The relative
importance of social and natural factors. In N. P. Gleditsch (Ed.), Conflict and the
environment (Vol. 33). Dordrecht: Kluwer Academic Publishers.
Lodgaard, S., & Hjort af Ornäs, A. (Eds.). (1992). The Environment and International Security.
Oslo: Peace Research Institute Oslo.
Lomborg, B. (2001). Resource constraints or abundance? In N. P. Gleditsch & P. F. Diehl
(Eds.), Environmental conflict (pp. 125–152). Boulder: Westview Press.
Lonergan, S. C. (2001). Water and Conflict: Rhetoric and Reality. In P. F. Diehl & N. P.
Gleditsch (Eds.), Environmental conflict (pp. 109–124). Boulder: Westview Press.
Lowi, M. R. (2004). Oil rents and political breakdown in patrimonial states: Algeria in
comparative perspective. The Journal of North African Studies, 9(3), 83–102.
doi:10.1080/1362938042000325822
Luard, E. (1986). War in international society. London: IB Tauris.
Lujala, P. (n.d.). The spoils of nature: Armed civil conflict and rebel access to natural
resources, 15–28.
Lujala, P., Gleditsch, N. P., & Gilmore, E. (2005). A diamond curse? Journal of Conflict
Resolution, 49(4), 538–562. doi:10.1177/0022002705277548
Lujala, P., Rød, J. K., & Thieme, N. (2007). Fighting over oil: Introducing a new dataset.
Conflict Management and Peace Science, 24(3), 239–256.
doi:10.1080/07388940701468526
Lynas, M. (2008). Six degrees: Our future on a hotter planet. London: Harper Perennial.
Mackie, J. L. (1965). Causes and conditions. American Philosophical Quarterly, 2(4), 245–264.
Macours, K. (2011). Increasing inequality and civil conflict in Nepal. Oxford Economic Papers,
63(1), 1–26. doi:10.1093/oep/gpq013
Magee, C. S. P., & Massoud, T. G. (2011). Openness and internal conflict. Journal of Peace
Research, 48(1), 59–72. doi:10.1177/0022343310388834
Maggetti, M. (2007). De facto independence after delegation: A fuzzy-set analysis.
Regulation & Governance, 1(4), 271–294. doi:10.1111/j.1748-5991.2007.00023.x
B i b l i o g r a p h y 2 2 1
Mahdavy, H. (1970). The patterns and problems of economic development in rentier states:
The case of Iran. In M. A. Cook (Ed.), Studies in the economic history of the Middle
East: From the rise of Islam to the present day (pp. 428–467). Oxford: Oxford
University Press.
Mail & Guardian. (2007, November 22). History shows climate changes led to famine, war.
Mail & Guardian. Cape Town. Retrieved from http://mg.co.za/article/2007-11-22-
history-shows-climate-changes-led-to-famine-war/
Malthus, T. R. (1789). An essay on the principle of population (13th ed.). Reprinted: Oxford:
Oxford University Press, 1993.
Mann, M. (1986). The autonomous power of the state: Its origins, mechanisms and results.
In J. A. Hall (Ed.), States in history (pp. 109 – 136). Oxford: Blackwell.
Mann, M. E. (2013). Hockey stick and the climate wars: Dispatches from the front lines. New
York: Columbia University Press.
Marcoux, A. (1996). Population change-natural resources-environment linkages in the Arab
states region. FAO Population Programme Service. Retrieved from
http://www.un.org/popin/fao/arabstat.htm#water
Marshall, M. G. (2011). Major episodes of political violence 1946 - 2011. Retrieved August
25, 2011, from http://www.systemicpeace.org/warlist.htm
Marshall, M. G., Jaggers, K., & Gurr, T. R. (2011). Polity IV project: Political regime
characteristics and transitions: 1800 - 2010. Retrieved November 21, 2011, from
http://www.systemicpeace.org/polity/polity4.htm
Martin, A. (2005). Environmental conflict between refugee and host communities. Journal of
Peace Research, 42(3), 329–346. doi:10.1177/0022343305052015
Martin, A., Blowers, A., & Boersema, J. (2006). Is environmental scarcity a cause of civil
wars? Environmental Sciences, 3(1), 1–4. doi:10.1080/15693430600593981
Martin, G. (2000). Book reviews. Africa Today, 47(3), 177–181.
Martin, P., Mayer, T., & Thoenig, M. (2008). Civil wars and international trade. Journal of the
European Economic Association, 6(2-3), 541–550. doi:10.1162/JEEA.2008.6.2-3.541
Marx, A. (2010). Crisp-set qualitative comparative analysis (csQCA) and model specification:
Benchmarks for future csQCA applications. International Journal of Multiple Research
Approaches, 4(2), 138–158.
Marx, K., & Engels, F. (1848). The Communist manifesto. Republished in: Socialist Register,
1998, 34(34). Retrieved from
https://jps.library.utoronto.ca/index.php/srv/article/view/5709
Mason, T. D., Weingarten, J. P., & Fett, P. J. (1999). Win, lose, or draw: Predicting the
outcome of civil wars. Political Research Quarterly, 52(2), 239 –268.
doi:10.1177/106591299905200201
Mathews, J. T. (1989). Redefining security. Foreign Affairs, 162–177.
Matthew, R. A. (2001). Environmental stress and human security in northern Pakistan
(Environmental Change and Security Project Report No. 7) (pp. 17–31).
2 2 2 B i b l i o g r a p h y
Matthew, R. A. (2002). In defense of environment and security research (Environmental
Change and Security Project Report No. 8) (pp. 109 – 124). Washington D.C.:
Woodrow Wilson International Center for Scholars. Retrieved from
http://www.wilsoncenter.org/topics/pubs/Report_8_Matthew.pdf
Matthew, R. A., Halle, M., & Switzer, J. (Eds.). (2002). Conserving the peace: Resources,
livelihoods and security. Winnipeg: International Institute for Sustainable
Development.
Maxwell, J. W., & Reuveny, R. (2000). Resource scarcity and conflict in developing countries.
Journal of Peace Research, 37(3), 301 – 322. doi:10.1177/0022343300037003002
McGlinchey, E. (2011). Chaos, violence, dynasty: Politics and Islam in Central Asia.
Pittsburgh: University of Pittsburgh Press.
McMichael, A. J. (1993). Planetary overload. Cambridge, New York and Melbourne:
Cambridge University Press.
Meadows, D. H. (1972). The limits to growth: A report for the Club of Rome’s project on the
predicament of mankind (2nd ed.). New York: Universe.
Meier, P., Bond, D., & Bond, J. (2007). Environmental influences on pastoral conflict in the
Horn of Africa. Political Geography, 26(6), 716–735.
doi:10.1016/j.polgeo.2007.06.001
Melander, E. (2005). Gender equality and intrastate armed conflict. International Studies
Quarterly, 49(4), 695–714. doi:10.1111/j.1468-2478.2005.00384.x
Mesfin, B. (2011). Elections, politics and external involvement in Djibouti (Situation Report).
Institute for Security Studies (ISS). Retrieved from
http://www.issafrica.org/uploads/15Apr11Djibouti.pdf
Metelits, C. M. (2009). The consequences of rivalry explaining insurgent violence using fuzzy
sets. Political Research Quarterly, 62(4), 673–684. doi:10.1177/1065912908322413
Meyns, P. (2002). Cape Verde: An African exception. Journal of Democracy, 13(3), 153–165.
doi:10.1353/jod.2002.0049
Migdal, J. S. (2001). State in society: Studying how states and societies transform and
constitute one another. Cambridge: Cambridge University Press.
Miguel, E., Satyanath, S., & Sergenti, E. (2004). Economic shocks and civil conflict: An
instrumental variables approach. Journal of Political Economy, 112(4), 725–753.
doi:10.1086/421174
Mill, J. S. (1886). System of logic ratiocinative and inductive being a connected view of the
principles of evidence and the methods of scientific investigation. Reprinted:
Whitefish: Kessinger Publishing, 2004.
Mjøs, O. D. (2007). Presentation speech. The Nobel Peace Prize: The Norwegian Nobel
Committee. Retrieved April 26, 2009, from
http://nobelpeaceprize.org/en_GB/laureates/laureates-2007/presentation-2007/
Molle, F., & Mollinga, P. (2003). Water poverty indicators: Conceptual problems and policy
issues. Water Policy, 5(5), 529–544.
B i b l i o g r a p h y 2 2 3
Munck, G. L., & Verkuilen, J. (2002). Conceptualizing and measuring democracy: Evaluating
alternative indices. Comparative Political Studies, 35(1), 5–34.
doi:10.1177/001041400203500101
Murshed, S. M., & Gates, S. (2005). Spatial-horizontal inequality and the Maoist insurgency
in Nepal. Review of Development Economics, 9(1), 121–134. doi:10.1111/j.1467-
9361.2005.00267.x
Myers, N. (1987). Population, environment, and conflict. Environmental Conservation, 14(1),
15–22. doi:10.1017/S037689290001105X
Myers, N. (1989). Environment and security. Foreign Policy, (74), 23–41.
Myers, N. (1993). Ultimate security: The environmental basis of political stability. New York:
Norton.
Myers, N. (2002). Environmental refugees: A growing phenomenon of the 21st century.
Philosophical Transactions of the Royal Society of London. Series B: Biological
Sciences, 357(1420), 609–613. doi:10.1098/rstb.2001.0953
Nafziger, E. W., & Auvinen, J. (2002). Economic development, inequality, war, and state
violence. World Development, 30(2), 153–163. doi:10.1016/S0305-750X(01)00108-5
NARO. (2011). Research and development (R & D) activities. National agriculture and food
research organisation (NARO). Retrieved April 12, 2013, from
http://www.naro.affrc.go.jp/english/about/activities/index.html
Nash, M. (2010). Climate refugees. Documentary, Climate Refugees. Retrieved from
http://www.climaterefugees.com/Home.html
Nel, P., & Righarts, M. (2008). Natural disasters and the risk of violent civil conflict.
International Studies Quarterly, 52(1), 159–185.
Nelson, A., Sigal, I., & Zambrano, D. (2010). Media, information systems and communities:
Lessons from Haiti. Communicating with disaster affected communities (CDAC),
Internews & John S. and James L. Knight Foundation. Retrieved from
http://www.alnap.org/resource/6268.aspx
Niemeijer, D., & Mazzucato, V. (2002). Soil degradation in the West African Sahel: How
serious is it? Environment: Science and Policy for Sustainable Development, 44(2),
20–31. doi:10.1080/00139150209605596
North, D. C. (1981). Structure and change in economic history. New York: Norton.
North, D. C., & Weingast, B. R. (1989). Constitutions and commitment: The evolution of
institutions governing public choice in seventeenth-century England. The Journal of
Economic History, 49(04), 803–832. doi:10.1017/S0022050700009451
O’Lear, S., & Diehl, P. F. (2007). Not drawn to scale: Research on resource and
environmental conflict. Geopolitics, 12(1), 166–182.
doi:10.1080/14650040601031263
O’Loughlin, J., & Witmer, F. D. W. (2011). The localized geographies of violence in the North
Caucasus of Russia, 1999–2007. Annals of the Association of American Geographers,
101(1), 178–201. doi:10.1080/00045608.2010.534713
2 2 4 B i b l i o g r a p h y
O’Loughlin, J., Witmer, F. D. W., Linke, A. M., Laing, A., Gettelman, A., & Dudhia, J. (2012).
Climate variability and conflict risk in East Africa, 1990–2009. Proceedings of the
National Academy of Sciences, 109(45), 18344–18349.
doi:10.1073/pnas.1205130109
Ohlsson, L. (1998). Water and social resource scarcity (FAO Issue Paper). Rome: Food and
Agricultural Organization of the United Nations.
Ohlsson, L. (1999). Environment, scarcity, and conflict: A study of Malthusian concerns.
Göteborg: Department of Peace and Development Research, Göteborg University.
Ohlsson, L., & Turton, A. R. (1999). The turning of a screw: Social resource scarcity as a
bottle-neck in adaptation to water scarcity. SOAS Occasional Paper. Retrieved from
http://www.soas.ac.uk/water/publications/papers/file38362.pdf
Oketch, J. S., & Polzer, T. (2002). Conflict and coffee in Burundi. In J. Lind & K. Sturman
(Eds.), Scarcity and surfeit: The ecology of Africa’s conflicts (pp. 85 – 156). Pretoria:
Institute for Security Studies (ISS). Retrieved from
http://www.iss.co.za/pubs/Books/ScarcitySurfeit/Chapter3.pdf
Østby, G. (2006). Horizontal inequalities, political environment and civil conflict: Evidence
from 55 developing countries (CRISE Working Paper No. 28). Oxford: Centre for
Research on Inequality, Human Security and Ethnicity (CRISE), Queen Elizabeth
House.
Østby, G. (2008). Polarization, horizontal inequalities and violent civil conflict. Journal of
Peace Research, 45(2), 143–162. doi:10.1177/0022343307087169
Østby, G., & Urdal, H. (2011). Education and civil conflict: A review of the quantitative,
empirical literature. Background Paper to UNESCO’s Education For All Global
Monitoring Report. Retrieved from
http://unesco.atlasproject.eu/unesco/file/336a35c6-ad13-46f7-b4ac-
f9a8e7835ccf/c8c7fe00-c770-11e1-9b21-0800200c9a66/190777e.pdf
Ostrom, E. (1990). Governing the commons: The evolution of institutions for collective
action. Cambridge: Cambridge University Press.
Ostrom, E. (2000). Private and common property rights. In (B. Bouckaert & G. De Geest,
Eds.)Encyclopedia of law and economics. Ghent: Edward Elgar. Retrieved from
http://www.sfu.ca/~allen/common%20property.pdf
Paavola, J. (2006). Justice in adaptation to climate change in Tanzania. In W. N. Adger, J.
Paavola, S. Huq, & M. J. Mace (Eds.), Fairness in adaptation to climate change.
Cambridge: MIT Press.
Parenti, C. (2012). Tropic of chaos: Climate change and the new geography of violence. New
York: Nation Books.
Paskal, C. (2010). Global warring: How environmental, economic, and political crises will
redraw the world map. New York: Palgrave Macmillan.
Peluso, N. L., & Watts, M. (Eds.). (2001a). Violent environments. Ithaca: Cornell University
Press.
B i b l i o g r a p h y 2 2 5
Peluso, N. L., & Watts, M. (2001b). Violent environments. In N. L. Peluso & M. Watts (Eds.),
Violent Environments (pp. 3 – 38). Ithaca: Cornell University Press.
Percival, V., & Homer-Dixon, T. F. (1996). Environmental scarcity and violent conflict: The
case of Rwanda. The Journal of Environment & Development, 5(3), 270–291.
doi:10.1177/107049659600500302
Percival, V., & Homer-Dixon, T. F. (1998). Environmental scarcity and violent conflict: The
case of South Africa. Journal of Peace Research, 35(3), 279–298.
doi:10.1177/0022343398035003002
Perras, A. (2010, May 17). Klimagipfel Kopenhagen: Krieg und Klima. sueddeutsche.de.
München. Retrieved from http://www.sueddeutsche.de/politik/klimagipfel-
kopenhagen-krieg-und-klima-1.141170
Peters, A. M., & Moore, P. W. (2009). Beyond boom and bust: External rents, durable
authoritarianism, and institutional adaptation in the Hashemite kingdom of Jordan.
Studies in Comparative International Development, 44(3), 256–285.
doi:10.1007/s12116-009-9053-0
Pew Research Center. (2009). Mapping the global Muslim population: A report on the size
and distribution of the world’s Muslim population. Washington D.C.: Pew Research
Center. Retrieved from
http://www.pewforum.org/newassets/images/reports/Muslimpopulation/Muslimpo
pulation.pdf
Pierre-Louis, F. (2011). Earthquakes, nongovernmental organizations, and governance in
Haiti. Journal of Black Studies, 42(2), 186–202. doi:10.1177/0021934710395389
Pimentel, D., Bailey, O., Kim, P., Mullaney, E., Calabrese, J., Walman, L., … Yao, X. (1999). Will
limits of the earth’s resources control human numbers? Environment, Development
and Sustainability, 1(1), 19–39. doi:10.1023/A:1010008112119
Pinfari, M. (2011). Time to agree: Is time pressure good for peace negotiations? Journal of
Conflict Resolution, 55(5), 683–709. doi:10.1177/0022002711414370
Pitcher, A., Moran, M. H., & Johnston, M. (2009). Rethinking patrimonialism and
neopatrimonialism in Africa. African Studies Review, 52(1), 125–156.
doi:10.1353/arw.0.0163
Powell, E. J., & Rickard, S. J. (2010). International trade and domestic legal systems:
Examining the impact of Islamic law. International Interactions, 36(4), 335–362.
doi:10.1080/03050629.2010.523668
Przeworski, A., Alvarez, M. E., Cheibub, J. A., & Limongi, F. (2000). Democracy and
development: Political institutions and well-being in the world, 1950-1990.
Cambridge: Cambridge University Press.
Ragin, C. C. (1987). The comparative method: Moving beyond qualitative and quantitative
strategies. Berkeley and Los Angeles: University of California Press.
Ragin, C. C. (2000). Fuzzy-set social science. Chicago: University of Chicago Press.
Ragin, C. C. (2008a). Qualitative comparative analysis using fuzzy sets (fsQCA). In B. Rihoux &
C. C. Ragin (Eds.), Configurational comparative methods: Qualitative comparative
2 2 6 B i b l i o g r a p h y
analysis (QCA) and related techniques (pp. 87 – 121). Thousand Oaks and London:
Sage Publications.
Ragin, C. C. (2008b). Redesigning social inquiry: Fuzzy sets and beyond. Chicago: University
of Chicago Press.
Raleigh, C. (2010). Political marginalization, climate change, and conflict in African Sahel
states. International Studies Review, 12(1), 69–86. doi:10.1111/j.1468-
2486.2009.00913.x
Raleigh, C., & Kniveton, D. (2012). Come rain or shine: An analysis of conflict and climate
variability in East Africa. Journal of Peace Research, 49(1), 51–64.
doi:10.1177/0022343311427754
Raleigh, C., Linke, A., Hegre, H., & Karlsen, J. (2010). Introducing ACLED: An Armed Conflict
Location and Event Dataset Special Data Feature. Journal of Peace Research, 47(5),
651–660. doi:10.1177/0022343310378914
Raleigh, C., & Urdal, H. (2007). Climate change, environmental degradation and armed
conflict. Political Geography, 26(6), 674–694. doi:10.1016/j.polgeo.2007.06.005
Rama, M. (1998). How bad is unemployment in Tunisia? Assessing labor market efficiency in
a developing country. The World Bank Research Observer, 13(1), 59–77.
doi:10.1093/wbro/13.1.59
Raskin, P., Gleick, P. H., Kirshen, P., Pontius, R. G., & Strzepek, K. (1997). Water futures:
Assessment of long-range patterns and problems. Comprehensive assessment of the
freshwater resources of the world. Stockholm: Stockholm Environment Institute.
Regan, P. M. (2002). Third-party interventions and the duration of intrastate conflicts.
Journal of Conflict Resolution, 46(1), 55. doi:10.1177/0022002702046001004
Renner, M. (1989). National security: The economic and environmental dimensions
(Worldwatch Paper No. 89) (pp. 53–55). Washington D.C.: Worldwatch Institute.
Renner, M. (1997). Fighting for survival: Environmental decline, social conflict, and the new
age of insecurity. London: Earthscan.
Renner, M. (1999). Ending violent conflict (Worldwatch Paper No. 146). Washington D.C.:
Worldwatch Institute.
Reuveny, R. (2007). Climate change-induced migration and violent conflict. Political
Geography, 26(6), 656–673. doi:10.1016/j.polgeo.2007.05.001
Revkin, A. C. (2007, April 3). Reports from four fronts in the war on warming. The New York
Times. New York. Retrieved from
http://www.nytimes.com/2007/04/03/science/earth/03clim.html
Richardson, L. F. (1960). Statistics of deadly quarrels. (Q. Wright & C. C. Lienau, Eds.).
Pittsburgh and Chicago: Boxwood and Quadrangle.
Rigobon, R., & Rodrik, D. (2005). Rule of law, democracy, openness, and income. Economics
of Transition, 13(3), 533–564. doi:10.1111/j.1468-0351.2005.00226.x
Rihoux, B., & Ragin, C. C. (2008). Configurational comparative methods: Qualitative
comparative analysis (QCA) and related techniques. Los Angeles: Sage Publications.
B i b l i o g r a p h y 2 2 7
Rihoux, B., Ragin, C. C., Yamasaki, S., & Bol, D. (2008). Conclusions - the Way(s) Ahead. In B.
Rihoux & C. C. Ragin (Eds.), Configurational comparative methods: Qualitative
comparative analysis (QCA) and related techniques. Los Angeles: Sage Publications.
Rijsberman, F. R. (2006). Water scarcity: Fact or fiction? Agricultural Water Management,
80(1-3), 5–22. doi:10.1016/j.agwat.2005.07.001
Rockström, J., Steffen, W., Noone, K., Persson, Å., Chapin, F. S., Lambin, E. F., … Foley, J. A.
(2009). A safe operating space for humanity. Nature, 461(7263), 472–475.
doi:10.1038/461472a
Rønnfeldt, C. F. (1997). Three generations of environment and security research. Journal of
Peace Research, 34(4), 473–482. doi:10.1177/0022343397034004009
Ross, M. L. (2001). Does oil hinder democracy? World Politics, 53(03), 325–361.
doi:10.1353/wp.2001.0011
Ross, M. L. (2004). How do natural resources influence civil war? Evidence from thirteen
cases. International Organization, 58(01), 35–67. doi:10.1017/S002081830458102X
Ross, M. L. (2006). A closer look at oil, diamonds, and civil war. Annual Review of Political
Science, 9(1), 265–300. doi:10.1146/annurev.polisci.9.081304.161338
Rotton, J., & Cohn, E. G. (2004). Outdoor temperature, climate control, and criminal assault:
The spatial and temporal ecology of violence. Environment and Behavior, 36(2), 276–
306. doi:10.1177/0013916503259515
Russell, D. E. H. (1974). Rebellion, revolution, and armed force: A comparative study of
fifteen countries with special emphasis on Cuba and South Africa. San Diego:
Academic Press.
Sager, F., & Andereggen, C. (2012). Dealing with complex causality in realist synthesis: The
promise of qualitative comparative analysis. American Journal of Evaluation, 33(1),
60–78. doi:10.1177/1098214011411574
Sait, S., & Lim, H. (2006). Land, law and Islam: Property and human rights in the Muslim
world. London and New York: Zed Books.
Salehyan, I. (2008). From climate change to conflict? No consensus yet. Journal of Peace
Research, 45(3), 315. doi:10.1177/0022343308088812
Salehyan, I., & Gleditsch, K. S. (2006). Refugees and the spread of civil war. International
Organization, 60(02), 335–366. doi:10.1017/S0020818306060103
Sambanis, N. (2001). Do ethnic and nonethnic civil wars have the same causes? Journal of
Conflict Resolution, 45(3), 259–282. doi:10.1177/0022002701045003001
Sambanis, N. (2004a). Poverty and the organization of political violence. Brookings Trade
Forum, 2004(1), 165–211. doi:10.1353/btf.2005.0014
Sambanis, N. (2004b). Using case studies to expand economic models of civil war.
Perspectives on Politics., 2(2), 259–280. doi:10.1017/S1537592704040149
Sambanis, N. (2004c). What is civil war? Conceptual and empirical complexities of an
operational definition. Journal of Conflict Resolution, 48(6), 814–858.
doi:10.1177/0022002704269355
2 2 8 B i b l i o g r a p h y
Sandbakken, C. (2006). The limits to democracy posed by oil rentier states: The cases of
Algeria, Nigeria and Libya. Democratization, 13(1), 135–152.
doi:10.1080/13510340500378464
Scarritt, J. R., & Mozaffar, S. (1999). The specification of ethnic cleavages and ethnopolitical
groups for the analysis of democratic competition in contemporary Africa.
Nationalism and Ethnic Politics, 5(1), 82–117. doi:10.1080/13537119908428555
Scheffran, J. (2011). Security risks of climate change: vulnerabilities, threats, conflicts and
strategies. In H. G. Brauch, Ú. O. Spring, C. Mesjasz, J. Grin, P. Kameri-Mbote, B.
Chourou, … J. Birkmann (Eds.), Coping with global environmental change, disasters
and security (pp. 735–756). Berlin and Heidelberg: Springer. Retrieved from
http://link.springer.com/chapter/10.1007/978-3-642-17776-7_42
Scheffran, J., & Battaglini, A. (2011). Climate and conflicts: The security risks of global
warming. Regional Environmental Change, 11(1), 27–39. doi:10.1007/s10113-010-
0175-8
Scherrer, C. P. (2002). Structural prevention of ethnic violence. New York: Palgrave
Macmillan.
Schiff, M., & Sjoblom, M. C. (2012). Panel data on international migration. Research at the
World Bank. Retrieved May 6, 2013, from http://go.worldbank.org/4IJSEHH7P0
Schlumberger, O. (2010). Opening old bottles in search of new wine: On nondemocratic
legitimacy in the Middle East. Middle East Critique, 19(3), 233–250.
doi:10.1080/19436149.2010.514473
Schneider, C. Q., & Wagemann, C. (2006). Reducing complexity in qualitative comparative
analysis (QCA): Remote and proximate factors and the consolidation of democracy.
European Journal of Political Research, 45(5), 751–786. doi:10.1111/j.1475-
6765.2006.00635.x
Schneider, C. Q., & Wagemann, C. (2012). Set-theoretic methods for the social sciences: A
guide to qualitative comparative analysis. Cambridge: Cambridge University Press.
Schraeder, P. J. (1993). Ethnic politics in Djibouti: From “eye of the hurricane” to “boiling
cauldron.” African Affairs, 92(367), 203–221.
Schreiber, W. (2010). Kriege und bewaffnete Konflikte 2010: Ein erster Überblick (AKUF
Analysen No. 9). Hamburg: Arbeitsgemeinschaft Kriegsursachenforschung (AKUF),
Universität Hamburg. Retrieved from http://www.sozialwiss.uni-
hamburg.de/publish/Ipw/Akuf/publ/AKUF-Analysen-09.pdf
Schwartz, D. M., Deligiannis, T., & Homer-Dixon, T. F. (2001). The environment and violent
conflict. In N. P. Gleditsch & P. F. Diehl (Eds.), Environmental conflict (pp. 273–294).
Boulder: Westview Press.
Schwartz, D. M., & Singh, A. (1999). Environmental conditions, resources, and conflicts: An
introductory overview and data collection. Nairobi: United Nations Environment
Programme (UNEP). Retrieved from
http://na.unep.net/siouxfalls/publications/Conflicts.pdf
B i b l i o g r a p h y 2 2 9
Schwartz, P., & Randall, D. (2003). An abrupt climate change scenario and its implications for
United States national security. Washington D.C.: Pentagon Office of Net
Assessments. Retrieved from
http://www.accc.gv.at/pdf/pentagon_climate_change.pdf
Seckler, D., Amarasinghe, U. A., Molden, D., de Silva, R., & Barker, R. (1998). World water
demand and supply, 1990 to 2025: Scenarios and issues (Research Report No. 19).
Colombo: International Water Management Institute (IWMI).
Sen, A. (1999). Development as freedom. Oxford: Oxford University Press.
Sharma, K. (2006). The political economy of civil war in Nepal. World Development, 34(7),
1237–1253. doi:10.1016/j.worlddev.2005.12.001
Shiklomanov, I. (2000). Appraisal and assessment of world water resources. Water
International, 25(1), 11–32. doi:10.1080/02508060008686794
Simon, J. (1981). The ultimate resource. Princeton: Princeton University Press.
Sivard, R. L. (1996). World military and social expenditures, 1996 (16th ed.). Washington
D.C.: World Priorities.
Skocpol, T. (1985). Bringing the state back in: Strategies of analysis in current research. In P.
B. Evans, D. Rueschemeyer, & T. Skocpol (Eds.), Bringing the state back in (pp. 3 –
43). Cambridge: Cambridge University Press.
Slettebak, R. T. (2012). Don’t blame the weather! Climate-related natural disasters and civil
conflict. Journal of Peace Research, 49(1), 163–176. doi:10.1177/0022343311425693
Smil, V. (1997). China’s environment and security: Simple myths and complex realities. SAIS
Review, 17(1), 107–126.
Smit, B., Pilifosova, O., Burton, I., Challenger, B., Huq, S., Klein, R. J. T., & Yohe, G. W. (2001).
Adaptation to climate change in the context of sustainable development and equity.
In J. J. McCarthy, O. F. Canziane, N. A. Leary, D. J. Dokken, & K. S. White (Eds.),
Climate change 2001: Impacts, adaptation, and vulnerability: Contribution of working
group II to the third assessment report of the intergovernmental panel on climate
change. Cambridge: Cambridge University Press.
Smit, B., & Wandel, J. (2006). Adaptation, adaptive capacity and vulnerability. Global
Environmental Change, 16(3), 282–292. doi:10.1016/j.gloenvcha.2006.03.008
Smith, B. (2004). Oil wealth and regime survival in the developing world, 1960–1999.
American Journal of Political Science, 48(2), 232–246. doi:10.1111/j.0092-
5853.2004.00067.x
Smith, D., & Vivekananda, J. (2007). A climate of conflict: The links between climate change,
peace and war. London: International Alert. Retrieved from
http://www.international-alert.org/resources/publications/climate-conflict
Smucker, G. R., White, T. A., & Bannister, M. (2002). Land tenure and the adoption of
agricultural technology in Haiti. Presented at the 9th Biennal Conference of the
International Association for the Study of Common Property, Victoria Falls,
Zimbabwe. Retrieved from http://dlc.dlib.indiana.edu/dlc/handle/10535/1274
2 3 0 B i b l i o g r a p h y
Sorokin, P. A. (1937). Social and cultural dynamics: Fluctuation of social relationships, war,
and revolution (Vol. 3). London: George Allen & Unwin.
Soroos, M. S. (1997a). The endangered atmosphere: Preserving a global commons.
Columbia: University of South Carolina Press.
Soroos, M. S. (1997b). The Turbot war: Resolution of an international fishery dispute. In N.
P. Gleditsch (Ed.), Conflict and the environment (Vol. 33, pp. 235 – 252). Dordrecht:
Kluwer Academic Publishers.
Stalley, P. (2003). Environmental scarcity and international conflict. Conflict Management
and Peace Science, 20(2), 33. doi:10.1177/073889420302000202
State of Kuwait, Ministry of Planning. (2003). Kuwait: Country report on the Millennium
Development Goals: Achievements and challenges. Retrieved from
http://planipolis.iiep.unesco.org/upload/Kuwait/Kuwait%20MDG.pdf
Statistics Authority. (2008). The Millennium Development Goals in the state of Qatar.
Retrieved from
http://www.qsa.gov.qa/eng/pdf/Millinum_development_goals/MDG_2REPORT_EN.
Statistics Singapore. (2011). Census of population 2010 statistical release 1: Demographic
characteristics, education, language and religion. Retrieved June 14, 2012, from
http://www.singstat.gov.sg/pubn/popn/c2010sr1.html
Stern, E. K. (1996). High politics’ and crisis: Military and environmental dimensions of
security. In A. Hjort af Ornäs & S. Laggard (Eds.), The environment and international
security. Environmental Policy and Society.
Steudler, D., & Williamson, I. P. (2005). Evaluation of national land administration system in
Switzerland. Survey Review, 38(298), 317–330.
Stevenson, W. B., & Greenberg, D. (2000). Agency and social networks: Strategies of action
in a social structure of position, opposition, and opportunity. Administrative Science
Quarterly, 45(4), 651–678. doi:10.2307/2667015
Stewart, F. (2000). Crisis prevention: Tackling horizontal inequalities. Oxford Development
Studies, 28(3), 245–262. doi:10.1080/713688319
Stewart, F. (2002). Horizontal inequalities: A neglected dimension of development (QEH
Working Paper Series No. 81). Oxford: Queen Elizabeth House (QEH). Retrieved from
http://www3.qeh.ox.ac.uk/pdf/qehwp/qehwps81.pdf
Stewart, I. (2008a). Fight for the future. Earth: The climate wars. London: BBC2. Retrieved
from http://www.bbc.co.uk/programmes/b00djvq9/episodes/guide
Stewart, I. (2008b). Fightback. Earth: The climate wars. London: BBC2. Retrieved from
http://www.bbc.co.uk/programmes/b00djvq9/episodes/guide
Stewart, I. (2008c). The battle begins. Earth: The climate wars. London: BBC2. Retrieved
from http://www.bbc.co.uk/programmes/b00djvq9/episodes/guide
Stocker, T. F., & Qin, D. (Eds.). (2013). Climate change 2013: The physical science basis:
Working group I contribution to the fifth assessment report of the
Intergovernmental Panel on Climate Change: Summary for policymakers. Geneva:
B i b l i o g r a p h y 2 3 1
Intergovernmental Panel on Climate Change (IPCC). Retrieved from
http://www.ipcc.ch/report/ar5/wg1/#.Ut_KeSdwa9I
Suliman, M. (2008). The war in Darfur: The resource dimension. Respect, Sudanese Journal
for Human Rights’ Culture and Issues of Cultural Diversity, 8.
Sullivan, C. (2002). Calculating a water poverty index. World Development, 30(7), 1195–
1210. doi:10.1016/S0305-750X(02)00035-9
Sullivan, C. (2009, December 23). Future scarcity seen sparking local conflicts, not full-scale
wars. The New York Times. New York. Retrieved from
http://www.nytimes.com/gwire/2009/12/23/23greenwire-future-scarcity-seen-
sparking-local-conflicts-
62509.html?pagewanted=2&sq=conflict%20resource%20scarcity&st=cse&scp=10
Suzuki, A., & Loizides, N. (2011). Escalation of interstate crises of conflictual dyads: Greece-
Turkey and India-Pakistan. Cooperation and Conflict. Retrieved from
http://works.bepress.com/neophytos_loizides/20
Swain, A. (1996). Displacing the conflict: Environmental destruction in Bangladesh and
ethnic conflict in India. Journal of Peace Research, 33(2), 189–204.
doi:10.1177/0022343396033002005
Tan, C. T., Pereira, J. J., bin Mokhtar, M., Komoo, I., & Yahaya, N. (2012). Adaptive capacity
to climate change: An assessment framework. In Understanding Science and R&D
Capacity Needs. Petaling Jaya: Malaysian Metereological Department. Retrieved
from
http://www.met.gov.my/images/pdf/national_papers/ncecc2012/abstract_mrtanchi
ngtiong.pdf
Taylor, M. (2006). The great warming: The signs and the science. Documentary, Stonehaven
productions. Retrieved from http://www.thegreatwarming.com/
The Economist. (2010a, February). Another earthquake in Latin America: Destruction in
Chile. The Economist. Retrieved from
http://www.economist.com/node/15591569?story_id=15591569&source=features_
box_main
The Economist. (2010b, July 10). International: Climate wars; security and the environment.
The Economist, 396(8690), 59–60.
The Fund for Peace. (2013a). Failed states index FAQ. The Fund for Peace (FFP). Retrieved
June 7, 2013, from http://ffp.statesindex.org/faq
The Fund for Peace. (2013b). The indicators. The Fund for Peace (FFP). Retrieved May 2,
2013, from http://ffp.statesindex.org/indicators
The Heritage Foundation, & Wall Street Journal. (2013). Index of economic freedom.
Retrieved March 7, 2013, from http://www.heritage.org/index/
The White House. (1997). A national security strategy for a new century. Retrieved from
http://clinton2.nara.gov/WH/EOP/NSC/Strategy/#providing
The World Business Organization. (2004). Middle East review 2003/04: The economic and
business report (27th ed.). Essex: Walden Publishing.
2 3 2 B i b l i o g r a p h y
Theisen, O. M. (2006). Other pathways to conflict? Environmental scarcities and domestic
conflict. Presented at the 47th Annual Convention of the International Studies
Association, San Diego.
Theisen, O. M. (2008). Blood and soil? Resource scarcity and internal armed conflict
revisited. Journal of Peace Research, 45(6), 801–818.
doi:10.1177/0022343308096157
Theisen, O. M. (2012). Climate clashes? Weather variability, land pressure, and organized
violence in Kenya, 1989–2004. Journal of Peace Research, 49(1), 81–96.
doi:10.1177/0022343311425842
Theisen, O. M., & Brandsegg, K. B. (2007). The environment and non-state conflicts.
Presented at the Annual Convention of the International Studies Association,
Chicago.
Theisen, O. M., Gleditsch, N. P., & Buhaug, H. (2013). Is climate change a driver of armed
conflict? Climatic Change, 117(3), 613–625. doi:10.1007/s10584-012-0649-4
Theisen, O. M., Holtermann, H., & Buhaug, H. (2011). Climate wars? Assessing the claim that
drought breeds conflict. International Security, 36(3), 79–106.
doi:10.1162/ISEC_a_00065
Theobald, R. (1982). Patrimonialism. World Politics, 34(4), 548–559. doi:10.2307/2010334
Thiem, A., & Dusa, A. (2013). QCA: A package for qualitative comparative analysis. The R
Journal, 5(1), 87 – 97.
Thies, C. G. (2010). Of rulers, rebels, and revenue: State capacity, civil war onset, and
primary commodities. Journal of Peace Research, 47(3), 321 –332.
doi:10.1177/0022343310361841
Thyne, C. L. (2006). ABC’s, 123’s, and the golden rule: The pacifying effect of education on
civil war, 1980–1999. International Studies Quarterly, 50(4), 733–754.
doi:10.1111/j.1468-2478.2006.00423.x
Tillema, H. K. (1991). International armed conflict since 1945: A bibliographic handbook of
wars and military interventions. Boulder: Westview Press.
Tilly, C. (1978). From mobilization to revolution. New York: McGraw-Hill.
Tilly, C. (1992). Coercion, capital, and European states: AD 990-1992. Cambridge and Oxford:
Wiley-Blackwell.
Tir, J., & Diehl, P. F. (1998). Demographic pressure and interstate conflict: Linking population
growth and density to militarized disputes and wars, 1930-89. Journal of Peace
Research, 319–339. doi:10.1177/0022343398035003004
Tir, J., Schafer, P., Diehl, P. F., & Goertz, G. (1998). Territorial changes, 1816–1996:
Procedures and data. Conflict Management and Peace Science, 16(1), 89.
doi:10.1177/073889429801600105
Tir, J., & Stinnett, D. M. (2012). Weathering climate change: Can institutions mitigate
international water conflict? Journal of Peace Research, 49(1), 211–225.
doi:10.1177/0022343311427066
B i b l i o g r a p h y 2 3 3
Tol, R., & Wagner, S. (2010). Climate change and violent conflict in Europe over the last
millennium. Climatic Change, 99(1), 65–79. doi:10.1007/s10584-009-9659-2
Tollefsen, A. F., Strand, H., & Buhaug, H. (2012). PRIO-GRID: A unified spatial data structure.
Journal of Peace Research, 49(2), 363–374. doi:10.1177/0022343311431287
Toset, H. P. W., Gleditsch, N. P., & Hegre, H. (2000). Shared rivers and interstate conflict.
Political Geography, 19(8), 971–996. doi:10.1016/S0962-6298(00)00038-X
Turner, M. D. (2004). Political ecology and the moral dimensions of “resource conflicts”: The
case of farmer–herder conflicts in the Sahel. Political Geography, 23(7), 863–889.
doi:10.1016/j.polgeo.2004.05.009
UCDP. (2011a). Definitions. Uppsala Conflict Data Program (UCDP). Retrieved from
http://www.pcr.uu.se/research/ucdp/definitions/
UCDP. (2011b). UCDP battle-related deaths dataset v.5-2011, 1989-2010. Uppsala Conflict
Data Program (UCDP). Retrieved from
http://www.pcr.uu.se/research/ucdp/datasets/ucdp_battle-
related_deaths_dataset/
UCDP. (2011c). UCDP non-state conflict dataset v.2.3-2011, 1989-2010. Uppsala Conflict
Data Program (UCDP). Retrieved from
http://www.pcr.uu.se/research/ucdp/datasets/ucdp_non-state_conflict_dataset_/
UCDP. (2013). Uzbekistan. UCDP conflict encyclopedia. Retrieved March 8, 2013, from
http://www.ucdp.uu.se/gpdatabase/gpcountry.php?id=166®ionSelect=6-
Central_and_Southern_Asia#
UN. (2003). Interim report of the secretary-general on the prevention of armed conflict.
United Nations. Retrieved from http://www.reliefweb.int/rw/lib.nsf/db900sid/DPAL-
5Y7B5J/$file/PREVENTION%20OF%20ARMED%20%20CONFLICT.pdf?openelement
UNDP. (1994). Human development report 1994. New York: United Nations Development
Programme (UNDP).
UNDP. (2011). Human development report 2011: Sustainability and equity: A better future
for all. New York: United Nations Development Programme (UNDP). Retrieved from
http://hdr.undp.org/en/reports/global/hdr2011/download/
UNDP, UNEP, World Bank, & WRI. (2000). A guide to world resources 2000 - 2001: People
and ecosystems: The fraying web of life. Washington D.C.: World Resources Institute
(WRI). Retrieved from http://pdf.wri.org/world_resources_2000-
2001_people_and_ecosystems.pdf
UNEP. (2007). GEO 4: Global Environment Outlook: Environment for Development. United
Nations Environment Programme (UNEP). Retrieved from
http://www.unep.org/geo/GEO4/report/GEO-4_Report_Full_en.pdf
UNEP, & SOPAC. (2004). EVI: Description of indicators. Palisades: South Pacific Applied
Geoscience Commission (SOPAC) & United Nations Environmental Program (UNEP).
Retrieved from
http://www.vulnerabilityindex.net/Files/EVI%20Descriptions%202005.pdf
2 3 4 B i b l i o g r a p h y
UNESCO Institute for Statistics. (2011). Data centre. Retrieved November 21, 2011, from
http://stats.uis.unesco.org/unesco/TableViewer/document.aspx?ReportId=143&IF_L
anguage=eng
United Nations Population Division. (2013). International migrant stock as percentage of
total population. International Migration. Retrieved October 16, 2013, from
http://esa.un.org/unmigration/migrantstocks2013.htm?mtotals
UN-OHRLLS. (2002, 2005). The Criteria for the identification of the LDCs. UN Office of the
High Representative for the Least Developed Countries, Landlocked Developing
Countries and Small Island Developing States (UN-OHRLLS). Retrieved February 13,
2012, from http://www.un.org/special-rep/ohrlls/ldc/ldc%20criteria.htm
UN-OHRLLS. (2012). About LDCs. UN Office of the High Representative for the Least
Developed Countries, Landlocked Developing Countries and Small Island Developing
States (UN-OHRLLS). Retrieved December 12, 2012, from
http://www.unohrlls.org/en/ldc/25/
UNSD. (2011). Composition of macro geographical (continental) regions, geographical sub-
regions, and selected economic and other groupings. United Nations Statistics
Division (UNSD). Retrieved February 13, 2012, from
http://unstats.un.org/unsd/methods/m49/m49regin.htm#ftnc
Urdal, H. (2005). People vs. Malthus: Population pressure, environmental degradation, and
armed conflict revisited. Journal of Peace Research, 42(4), 417–434.
doi:10.1177/0022343305054089
Urdal, H. (2008). Population, resources, and political violence: A subnational study of India,
1956-2002. Journal of Conflict Resolution, 52(4), 590–617.
doi:10.1177/0022002708316741
Uvin, P. (1996). Development, aid, and conflict: Reflections from the case of Rwanda
(Research for Action No. 24). Helsinki: UNU/World Institute for Development
Research. Retrieved from http://www.wider.unu.edu/publications/working-
papers/previous/en_GB/rfa-24/_files/82530848357488691/default/RFA24.pdf
Van der Maat, E. (2011). Sleeping hegemons: Third-party intervention following territorial
integrity transgressions. Journal of Peace Research, 48(2), 201–215.
doi:10.1177/0022343310396267
Verpoorten, M. (2012). Leave none to claim the land: A Malthusian catastrophe in Rwanda?
Journal of Peace Research, 49(4), 547–563. doi:10.1177/0022343312437773
Vörösmarty, C., Green, P., Salisbury, J., & Lammers, R. B. (2000). Global water resources:
Vulnerability from climate change and population growth. Science, 289(5477), 284.
Walter, B. F. (2004). Does conflict beget conflict? Explaining recurring civil war. Journal of
Peace Research, 41(3), 371–388. doi:10.1177/0022343304043775
Wamsler, C. (2011). Climate change, adaptation and formal education: The role of schooling
for increasing societies’ adaptive capacities (Interim Report No. IR-11-024).
Laxenburg: International Institute for Applied Systems Analysis (IIASA). Retrieved
from http://www.lunduniversity.lu.se/o.o.i.s?id=12683&postid=1719853
B i b l i o g r a p h y 2 3 5
Ware, H. (2005). Demography, migration and conflict in the Pacific. Journal of Peace
Research, 42(4), 435–454. doi:10.1177/0022343305054090
WBGU. (2007). Welt im Wandel: Sicherheitsrisiko Klimawandel. Berlin: Wissenschaftlicher
Beirat der Bundesregierung Globale Umweltveränderungen (WBGU).
Weber, M. (1978). Economy and society: An outline of interpretive sociology. Berkeley and
Los Angeles: University of California Press.
Wee, C. J. W.-L. (2002). From universal to local culture: The state, ethnic identity, and
capitalisam in Singapore. In C. J. W.-L. Wee (Ed.), Local cultures and the “new Asia”:
The state, culture, and capitalism in Southeast Asia (pp. 129–157). Singapore:
Institute of Southeast Asian Studies.
Wei, S.-J. (2000). Natural openness and good government (Working Paper No. 7765).
Cambridge: National Bureau of Economic Research. Retrieved from
http://www.nber.org/papers/w7765
Weidmann, N. B. (2009). Geography as motivation and opportunity: Group concentration
and ethnic conflict. Journal of Conflict Resolution, 53(4), 526–543.
doi:10.1177/0022002709336456
Welzer, H. (2012). Climate wars: What people will be killed for in the 21st century.
Cambridge & Malden: Polity.
Westing, A. H. (Ed.). (1986). Global resources and international conflict: Environmental
factors in strategic policy and action. Oxford: Oxford University Press.
Wild, S. (2013, August 2). Violence increases as climate heats up. Mail & Guardian. Retrieved
from http://mg.co.za/article/2013-08-02-00-violence-increases-as-climate-heats-up/
Williams, V. J. (2011). A case study of the desertification of Haiti. Journal of Sustainable
Development, 4(3), 20–31. doi:10.5539/jsd.v4n3p20
Wimmer, A., Cederman, L.-E., & Min, B. (2009). Ethnic politics and armed conflict: A
configurational analysis of a new global data set. American Sociological Review,
74(2), 316–337. doi:10.1177/000312240907400208
Witsenburg, K. M., & Adano, W. R. (2009). Of rain and raids: Violent livestock raiding in
northern Kenya. Civil Wars, 11(4), 514–538. doi:10.1080/13698240903403915
Wolf, A. T., Kramer, A., Carius, A., & Dabelko, G. D. (2005). Managing water conflict and
cooperation. In State of the world 2005: Redefining global security (pp. 80–99).
Washington D.C.: Worldwatch Institute.
World Bank. (2009). Herfindahl index 4-digit. Economic diversification and growth in
developing countries toolkit. Retrieved December 19, 2012, from
http://info.worldbank.org/etools/prmed/IndicatorScorecard.aspx?indid=39
World Bank. (2012a). A short history. Data. Retrieved June 18, 2012, from
http://data.worldbank.org/about/country-classifications/a-short-history
World Bank. (2012b). Agricultural raw materials exports (% of merchandise exports). Data.
Retrieved October 15, 2012, from
http://data.worldbank.org/indicator/TX.VAL.FUEL.ZS.UN
2 3 6 B i b l i o g r a p h y
World Bank. (2012c). Control of corruption. Retrieved March 20, 2012, from
http://info.worldbank.org/governance/wgi/pdf/cc.pdf
World Bank. (2012d). Exports of goods and services (% of GDP). World Data Bank. Retrieved
January 11, 2013, from
http://databank.worldbank.org/Data/Views/Reports/TableView.aspx?IsShared=true
&IsPopular=series
World Bank. (2012e). GNI per capita. Data. Retrieved July 17, 2012, from
http://data.worldbank.org/indicator/NY.GNP.PCAP.KD
World Bank. (2012f). How we classify countries. Retrieved February 13, 2012, from
http://data.worldbank.org/about/country-classifications
World Bank. (2012g). Total natural resources rents. World Development Indicators.
Retrieved January 11, 2012, from
http://databank.worldbank.org/Data/Views/Reports/TableView.aspx
World Bank. (2013a). GINI index. Data. Retrieved March 7, 2013, from
http://data.worldbank.org/indicator/SI.POV.GINI?page=4
World Bank. (2013b). Rule of law. Washington D.C.: World Bank. Retrieved from
http://info.worldbank.org/governance/wgi/pdf/rl.pdf
Yale Center for Environmental Law and Policy (YCELP), Center for International Earth Science
Information Network (CIESIN), World Economic Forum, & Joint Research Centre
(JRC)/ European Commission. (2005). Environmental sustainability index. NASA
Scocioeconomic Data and Applications Center. Retrieved from
http://sedac.ciesin.columbia.edu/data/set/esi-environmental-sustainability-index-
2005
Yamasaki, S., & Rihoux, B. (2008). A commented review of applications. In B. Rihoux & C. C.
Ragin (Eds.), Configurational comparative methods: Qualitative comparative analysis
(QCA) and related techniques (pp. 123 – 145). Los Angeles: Sage Publications.
Yasin, M. Y. (2010). Regional dynamics of inter-ethnic conflicts in the Horn of Africa: An
analysis of the Afar-Somali conflict in Ethiopia and Djibouti (Doctoral thesis).
Universität Hamburg, Hamburg. Retrieved from http://ediss.sub.uni-
hamburg.de/volltexte/2011/5127/pdf/Yas_Diss_2010.pdf
Yohe, G., & Moss, R. (1999). Economic sustainability, indicators and climate change. In
Proceedings of the IPCC Meeting. Colombo, Sri Lanka.
Young, A. (1999). Is there really spare land? A critique of estimates of available cultivable
land in developing countries. Environment, Development and Sustainability, 1(1), 3–
18.
Zevenbergen, J. (2002). Systems of land registration: Aspects and effects (Doctoral thesis).
Technische Universiteit Delft, Delft. Retrieved from
http://ncg.knaw.nl/Publicaties/Geodesy/pdf/51Zevenbergen.pdf
Zhang, D. D., Brecke, P., Lee, H. F., He, Y.-Q., & Zhang, J. (2007). Global climate change, war,
and population decline in recent human history. Proceedings of the National
Academy of Sciences, 104(49), 19214–19219. doi:10.1073/pnas.0703073104
B i b l i o g r a p h y 2 3 7
Zimmermann, W. (2011). Towards land governance in the Middle East and North Africa
region. Land Tenure Journal, 1(11), 101 – 125.
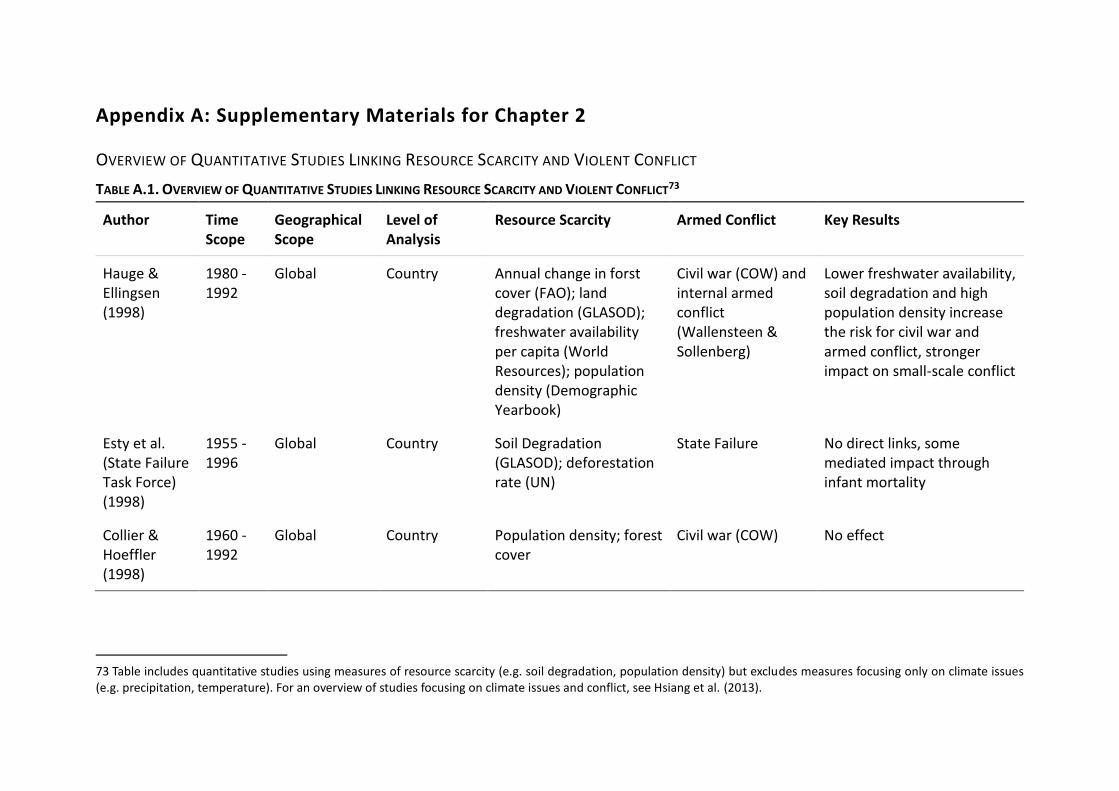
Appendix A: Supplementary Materials for Chapter 2
OVERVIEW OF QUANTITATIVE STUDIES LINKING RESOURCE SCARCITY AND VIOLENT CONFLICT
TABLE A.1. OVERVIEW OF QUANTITATIVE STUDIES LINKING RESOURCE SCARCITY AND VIOLENT CONFLICT73
Author Time Scope
Geographical Scope
Level of Analysis
Resource Scarcity Armed Conflict Key Results
Hauge & Ellingsen (1998)
1980 - 1992
Global Country Annual change in forst cover (FAO); land degradation (GLASOD); freshwater availability per capita (World Resources); population density (Demographic Yearbook)
Civil war (COW) and internal armed conflict (Wallensteen & Sollenberg)
Lower freshwater availability, soil degradation and high population density increase the risk for civil war and armed conflict, stronger impact on small-scale conflict
Esty et al. (State Failure Task Force) (1998)
1955 - 1996
Global Country Soil Degradation (GLASOD); deforestation rate (UN)
State Failure No direct links, some mediated impact through infant mortality
Collier & Hoeffler (1998)
1960 - 1992
Global Country Population density; forest cover
Civil war (COW) No effect
73 Table includes quantitative studies using measures of resource scarcity (e.g. soil degradation, population density) but excludes measures focusing only on climate issues (e.g. precipitation, temperature). For an overview of studies focusing on climate issues and conflict, see Hsiang et al. (2013).
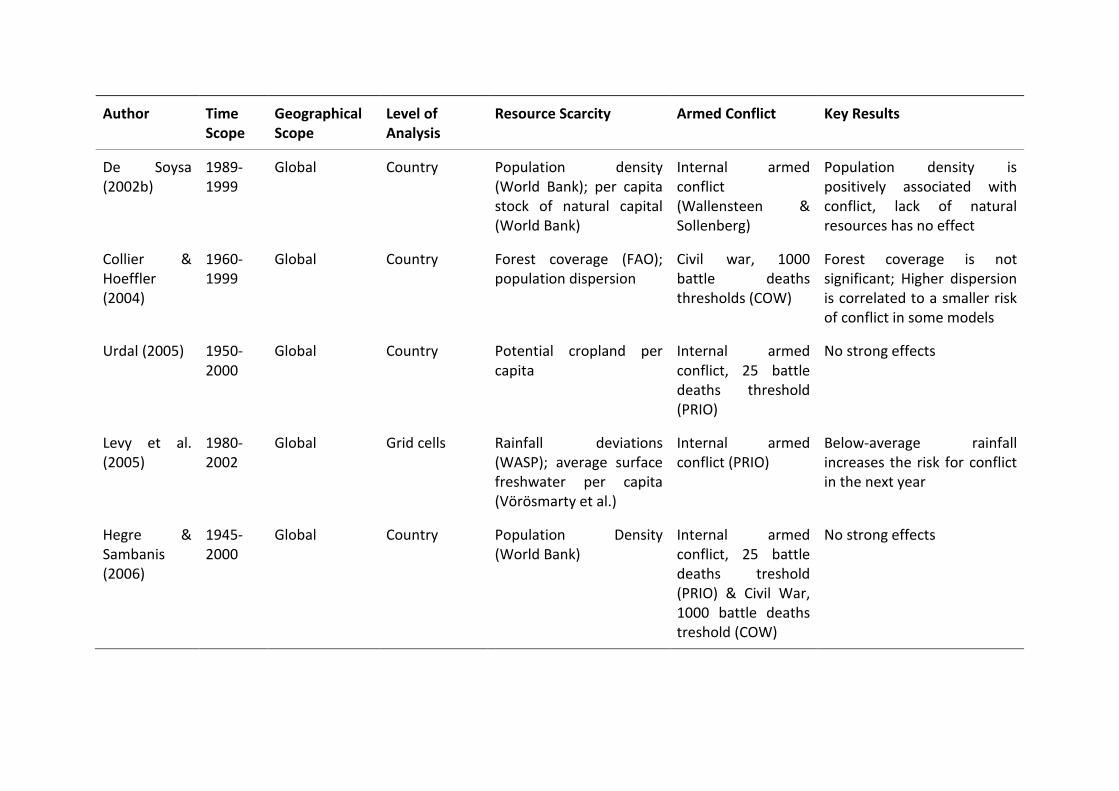
Author Time Scope
Geographical Scope
Level of Analysis
Resource Scarcity Armed Conflict Key Results
De Soysa (2002b)
1989-1999
Global Country Population density (World Bank); per capita stock of natural capital (World Bank)
Internal armed conflict (Wallensteen & Sollenberg)
Population density is positively associated with conflict, lack of natural resources has no effect
Collier & Hoeffler (2004)
1960-1999
Global Country Forest coverage (FAO); population dispersion
Civil war, 1000 battle deaths thresholds (COW)
Forest coverage is not significant; Higher dispersion is correlated to a smaller risk of conflict in some models
Urdal (2005) 1950-2000
Global Country Potential cropland per capita
Internal armed conflict, 25 battle deaths threshold (PRIO)
No strong effects
Levy et al. (2005)
1980-2002
Global Grid cells Rainfall deviations (WASP); average surface freshwater per capita (Vörösmarty et al.)
Internal armed conflict (PRIO)
Below-average rainfall increases the risk for conflict in the next year
Hegre & Sambanis (2006)
1945-2000
Global Country Population Density (World Bank)
Internal armed conflict, 25 battle deaths treshold (PRIO) & Civil War, 1000 battle deaths treshold (COW)
No strong effects
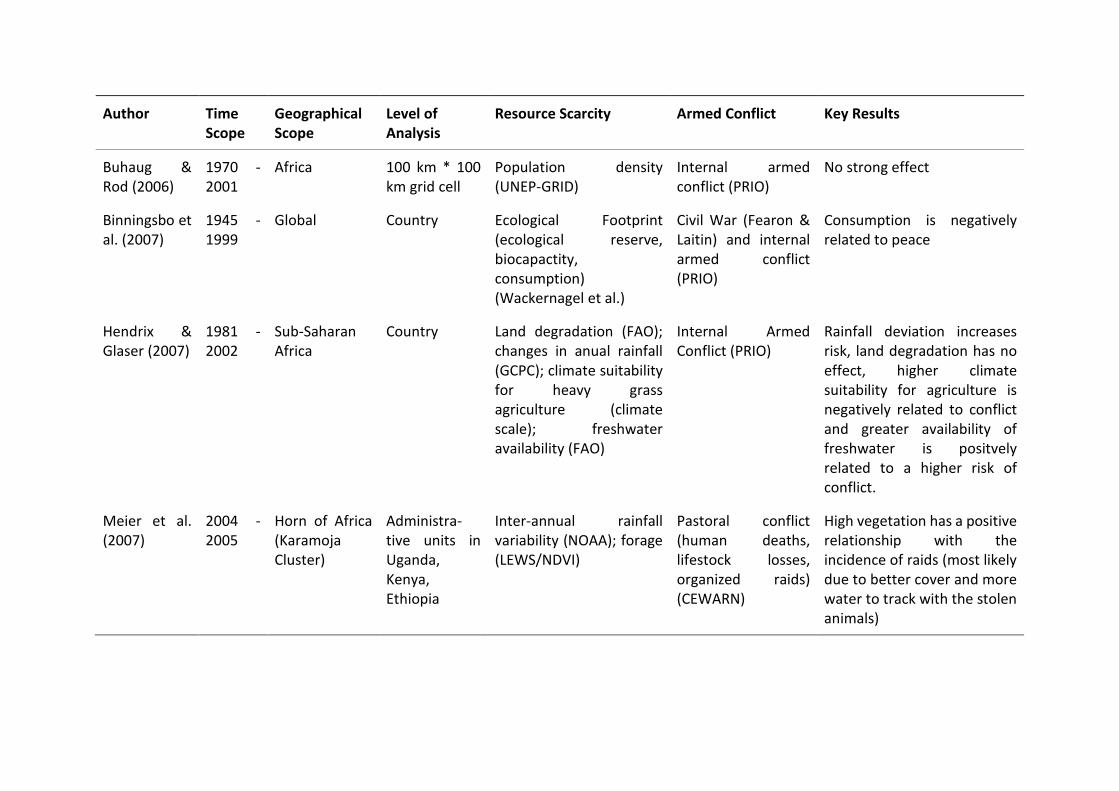
Author Time Scope
Geographical Scope
Level of Analysis
Resource Scarcity Armed Conflict Key Results
Buhaug & Rod (2006)
1970 - 2001
Africa 100 km * 100 km grid cell
Population density (UNEP-GRID)
Internal armed conflict (PRIO)
No strong effect
Binningsbo et al. (2007)
1945 - 1999
Global Country Ecological Footprint (ecological reserve, biocapactity, consumption) (Wackernagel et al.)
Civil War (Fearon & Laitin) and internal armed conflict (PRIO)
Consumption is negatively related to peace
Hendrix & Glaser (2007)
1981 - 2002
Sub-Saharan Africa
Country Land degradation (FAO); changes in anual rainfall (GCPC); climate suitability for heavy grass agriculture (climate scale); freshwater availability (FAO)
Internal Armed Conflict (PRIO)
Rainfall deviation increases risk, land degradation has no effect, higher climate suitability for agriculture is negatively related to conflict and greater availability of freshwater is positvely related to a higher risk of conflict.
Meier et al. (2007)
2004 - 2005
Horn of Africa (Karamoja Cluster)
Administra-tive units in Uganda, Kenya, Ethiopia
Inter-annual rainfall variability (NOAA); forage (LEWS/NDVI)
Pastoral conflict (human deaths, lifestock losses, organized raids) (CEWARN)
High vegetation has a positive relationship with the incidence of raids (most likely due to better cover and more water to track with the stolen animals)
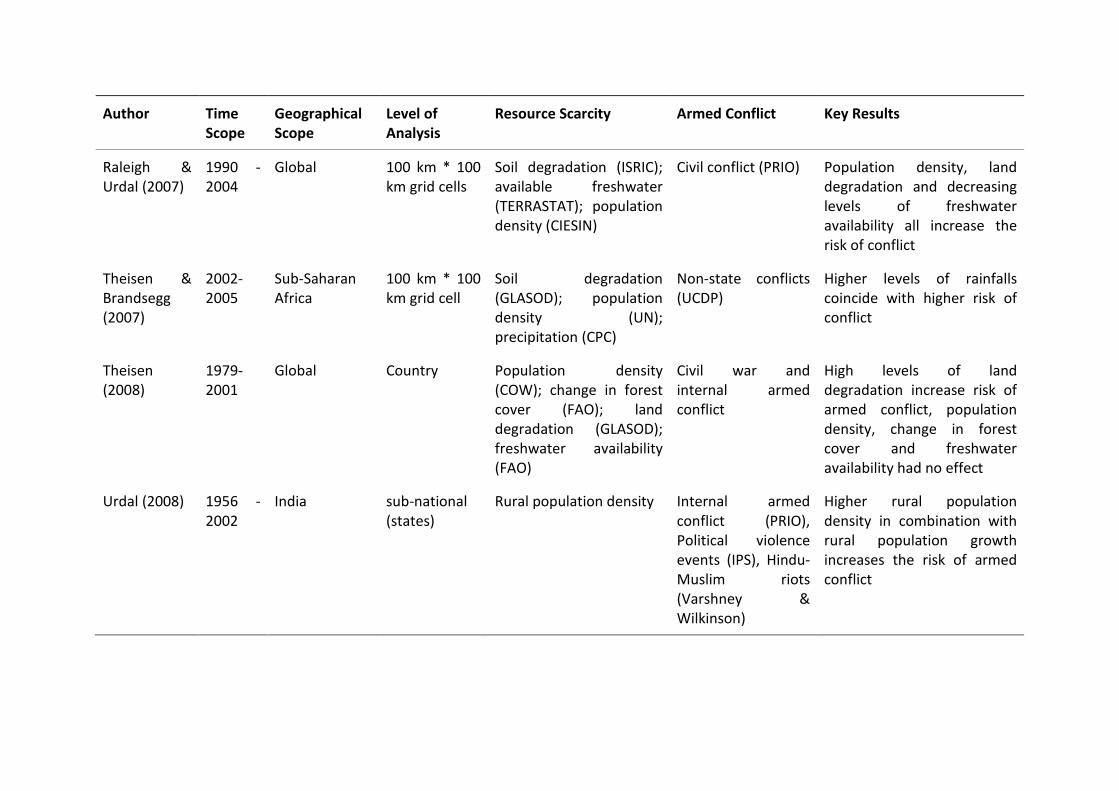
Author Time Scope
Geographical Scope
Level of Analysis
Resource Scarcity Armed Conflict Key Results
Raleigh & Urdal (2007)
1990 - 2004
Global 100 km * 100 km grid cells
Soil degradation (ISRIC); available freshwater (TERRASTAT); population density (CIESIN)
Civil conflict (PRIO) Population density, land degradation and decreasing levels of freshwater availability all increase the risk of conflict
Theisen & Brandsegg (2007)
2002-2005
Sub-Saharan Africa
100 km * 100 km grid cell
Soil degradation (GLASOD); population density (UN); precipitation (CPC)
Non-state conflicts (UCDP)
Higher levels of rainfalls coincide with higher risk of conflict
Theisen (2008)
1979-2001
Global Country Population density (COW); change in forest cover (FAO); land degradation (GLASOD); freshwater availability (FAO)
Civil war and internal armed conflict
High levels of land degradation increase risk of armed conflict, population density, change in forest cover and freshwater availability had no effect
Urdal (2008) 1956 - 2002
India sub-national (states)
Rural population density Internal armed conflict (PRIO), Political violence events (IPS), Hindu-Muslim riots (Varshney & Wilkinson)
Higher rural population density in combination with rural population growth increases the risk of armed conflict
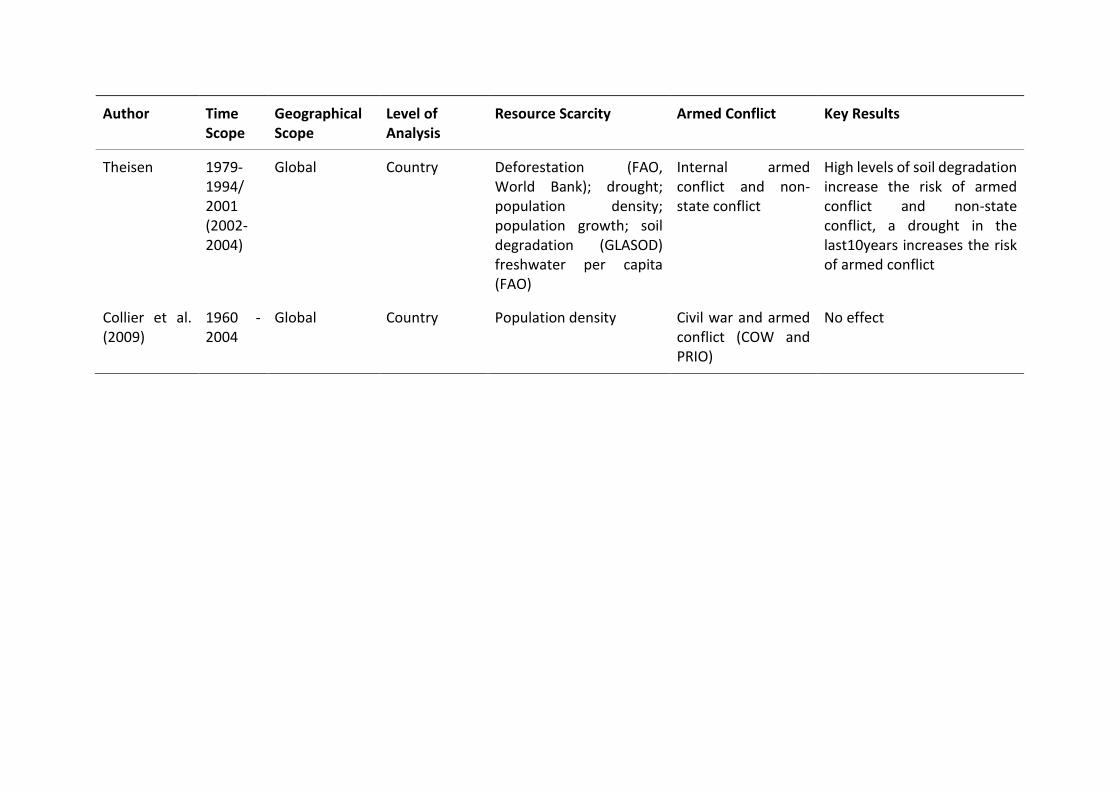
Author Time Scope
Geographical Scope
Level of Analysis
Resource Scarcity Armed Conflict Key Results
Theisen 1979-1994/ 2001 (2002-2004)
Global Country Deforestation (FAO, World Bank); drought; population density; population growth; soil degradation (GLASOD) freshwater per capita (FAO)
Internal armed conflict and non-state conflict
High levels of soil degradation increase the risk of armed conflict and non-state conflict, a drought in the last10years increases the risk of armed conflict
Collier et al. (2009)
1960 - 2004
Global Country Population density Civil war and armed conflict (COW and PRIO)
No effect
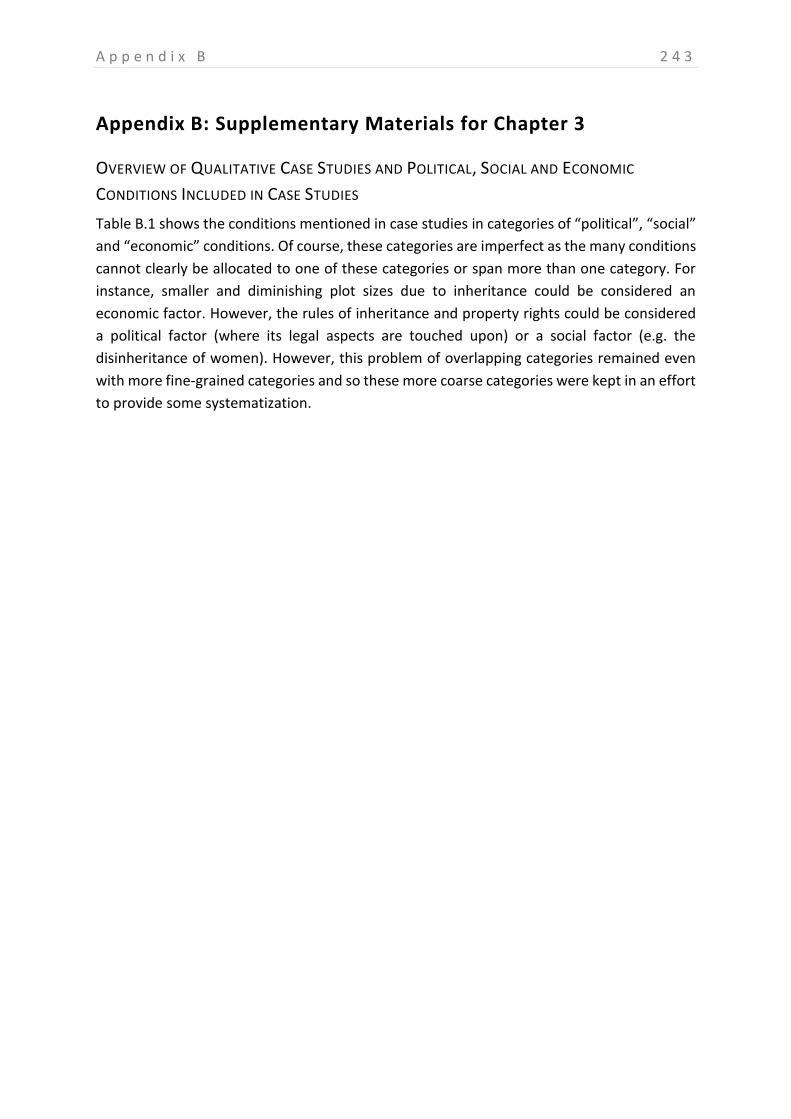
A p p e n d i x B 2 4 3
Appendix B: Supplementary Materials for Chapter 3
OVERVIEW OF QUALITATIVE CASE STUDIES AND POLITICAL, SOCIAL AND ECONOMIC
CONDITIONS INCLUDED IN CASE STUDIES
Table B.1 shows the conditions mentioned in case studies in categories of “political”, “social”
and “economic” conditions. Of course, these categories are imperfect as the many conditions
cannot clearly be allocated to one of these categories or span more than one category. For
instance, smaller and diminishing plot sizes due to inheritance could be considered an
economic factor. However, the rules of inheritance and property rights could be considered
a political factor (where its legal aspects are touched upon) or a social factor (e.g. the
disinheritance of women). However, this problem of overlapping categories remained even
with more fine-grained categories and so these more coarse categories were kept in an effort
to provide some systematization.
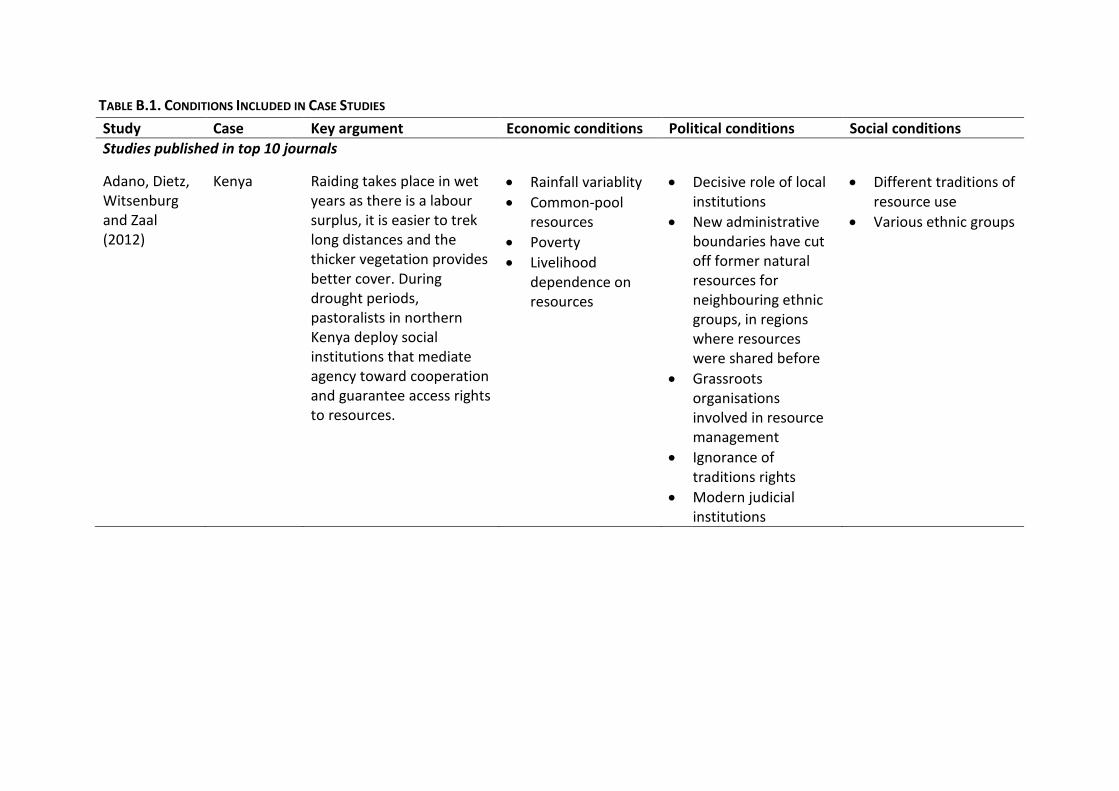
TABLE B.1. CONDITIONS INCLUDED IN CASE STUDIES
Study Case Key argument Economic conditions Political conditions Social conditions
Studies published in top 10 journals
Adano, Dietz, Witsenburg and Zaal (2012)
Kenya Raiding takes place in wet years as there is a labour surplus, it is easier to trek long distances and the thicker vegetation provides better cover. During drought periods, pastoralists in northern Kenya deploy social institutions that mediate agency toward cooperation and guarantee access rights to resources.
Rainfall variablity
Common-pool resources
Poverty
Livelihood dependence on resources
Decisive role of local institutions
New administrative boundaries have cut off former natural resources for neighbouring ethnic groups, in regions where resources were shared before
Grassroots organisations involved in resource management
Ignorance of traditions rights
Modern judicial institutions
Different traditions of resource use
Various ethnic groups
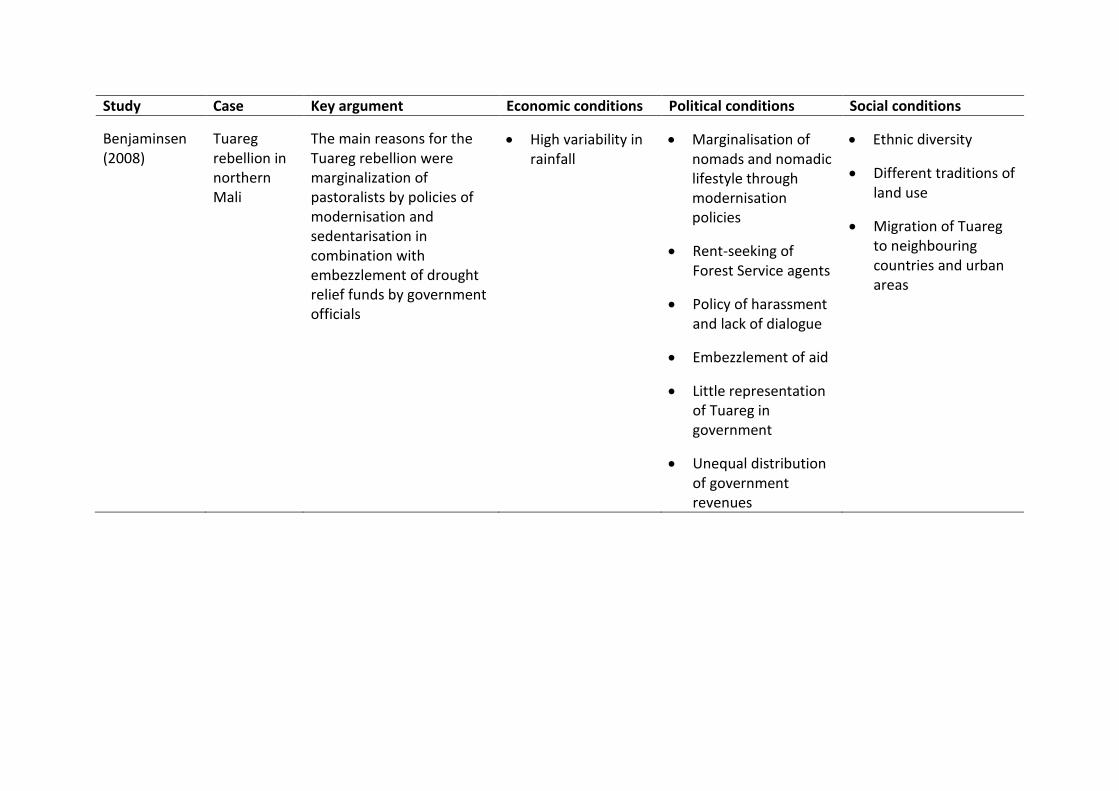
Study Case Key argument Economic conditions Political conditions Social conditions
Benjaminsen (2008)
Tuareg rebellion in northern Mali
The main reasons for the Tuareg rebellion were marginalization of pastoralists by policies of modernisation and sedentarisation in combination with embezzlement of drought relief funds by government officials
High variability in rainfall
Marginalisation of nomads and nomadic lifestyle through modernisation policies
Rent-seeking of Forest Service agents
Policy of harassment and lack of dialogue
Embezzlement of aid
Little representation of Tuareg in government
Unequal distribution of government revenues
Ethnic diversity
Different traditions of land use
Migration of Tuareg to neighbouring countries and urban areas
Study Case Key argument Economic conditions Political conditions Social conditions
Benjaminsen, Alinon, Buhaug & Buseth (2012)
inland delta of Niger river in Mali
Structural factors rather than environmental conditions are main drivers behind conflict
Agricultural encroachment on key productive resources for pastoralism and on livestock corridors
Strong dependence on rain-fed farming and livestock keeping
Land rights neglect importance of land-use issues and pastoralism
Rent-seeking among government officials
Decentralisation creating political vacuum
Boone (2011) Kenya Rural violence occurred where the state acted as allocator of land rights and manipulated these rights in the run-up to the election
State ownership and allocation of land
Patronage system Ethnic diversity
History of grievances over land allocation during colonial times and early independence
High population density
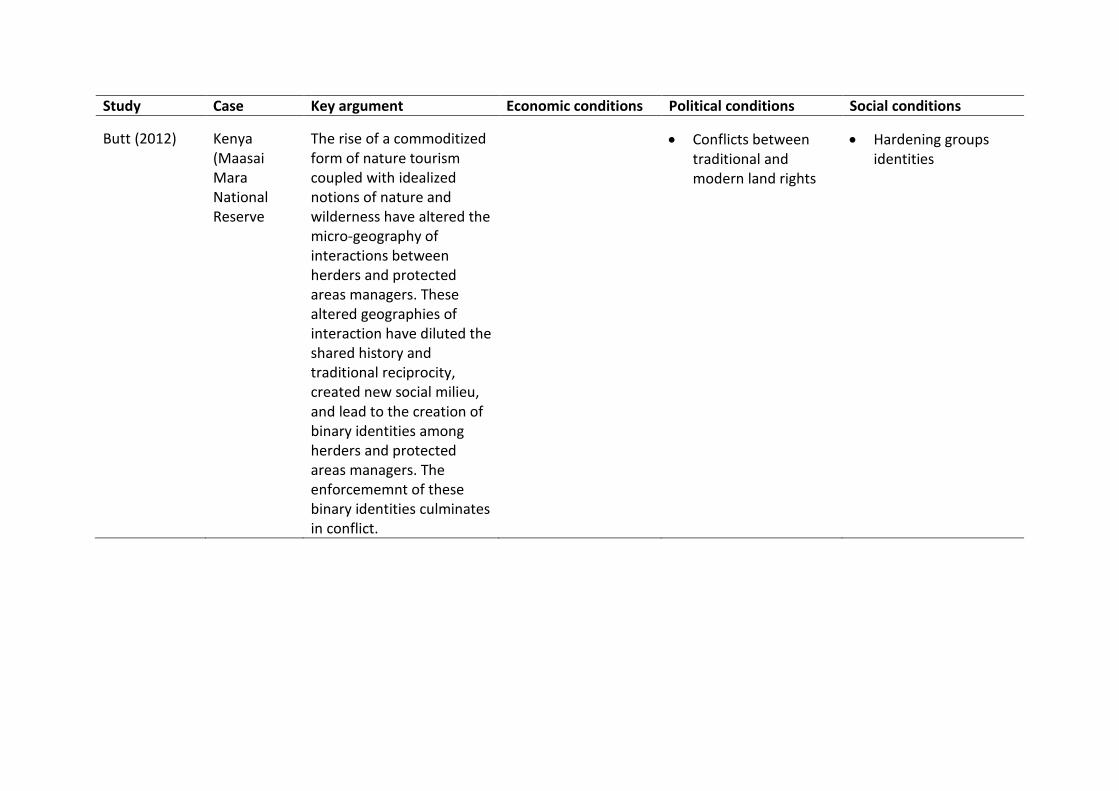
Study Case Key argument Economic conditions Political conditions Social conditions
Butt (2012) Kenya (Maasai Mara National Reserve
The rise of a commoditized form of nature tourism coupled with idealized notions of nature and wilderness have altered the micro-geography of interactions between herders and protected areas managers. These altered geographies of interaction have diluted the shared history and traditional reciprocity, created new social milieu, and lead to the creation of binary identities among herders and protected areas managers. The enforcememnt of these binary identities culminates in conflict.
Conflicts between traditional and modern land rights
Hardening groups identities
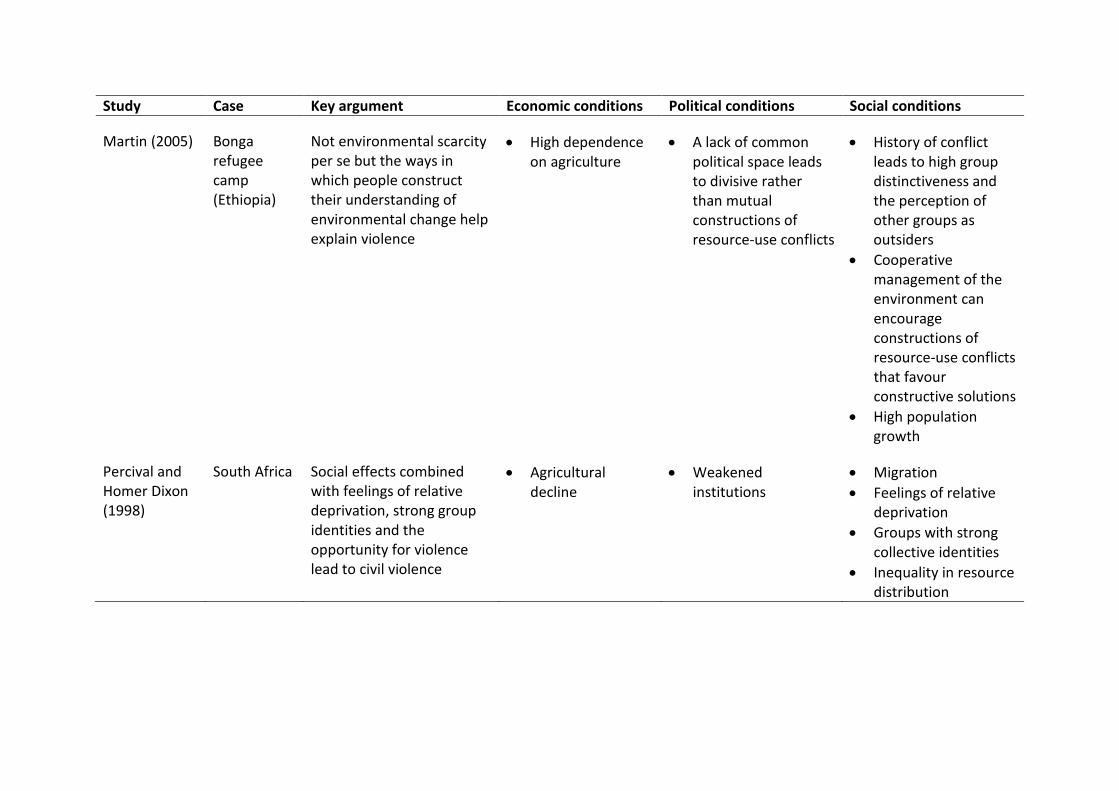
Study Case Key argument Economic conditions Political conditions Social conditions
Martin (2005) Bonga refugee camp (Ethiopia)
Not environmental scarcity per se but the ways in which people construct their understanding of environmental change help explain violence
High dependence on agriculture
A lack of common political space leads to divisive rather than mutual constructions of resource-use conflicts
History of conflict leads to high group distinctiveness and the perception of other groups as outsiders
Cooperative management of the environment can encourage constructions of resource-use conflicts that favour constructive solutions
High population growth
Percival and Homer Dixon (1998)
South Africa Social effects combined with feelings of relative deprivation, strong group identities and the opportunity for violence lead to civil violence
Agricultural decline
Weakened institutions
Migration
Feelings of relative deprivation
Groups with strong collective identities
Inequality in resource distribution
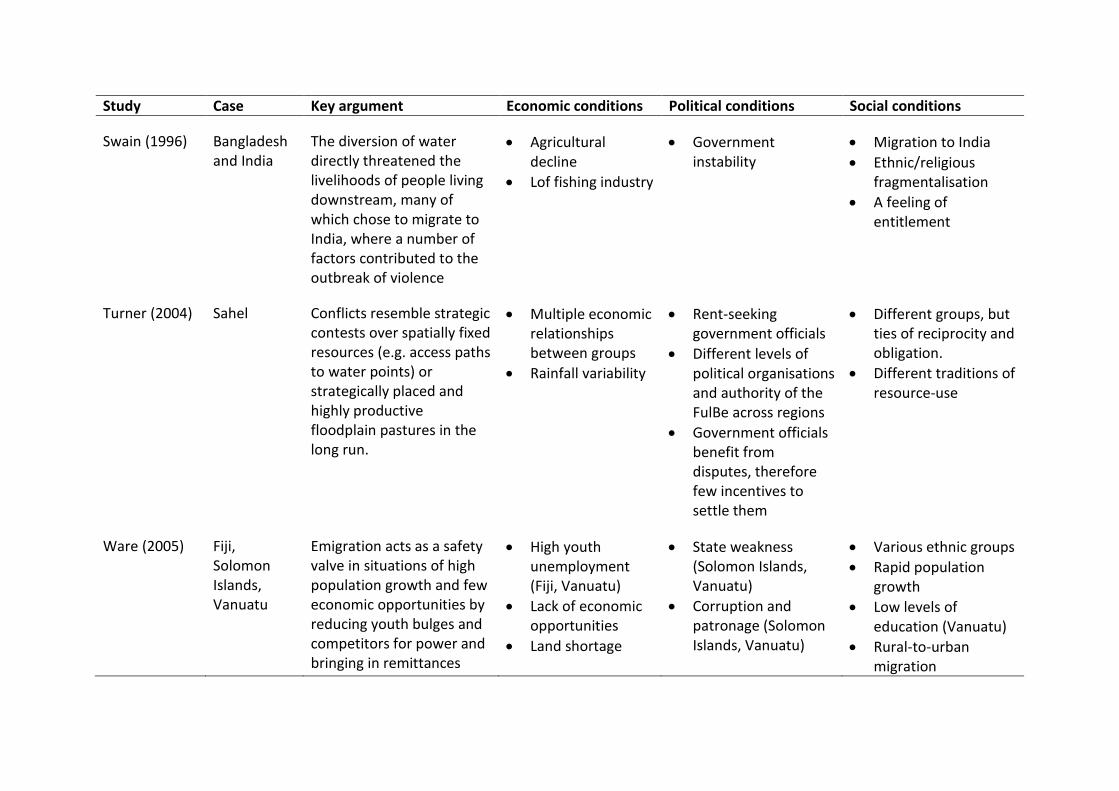
Study Case Key argument Economic conditions Political conditions Social conditions
Swain (1996) Bangladesh and India
The diversion of water directly threatened the livelihoods of people living downstream, many of which chose to migrate to India, where a number of factors contributed to the outbreak of violence
Agricultural decline
Lof fishing industry
Government instability
Migration to India
Ethnic/religious fragmentalisation
A feeling of entitlement
Turner (2004) Sahel Conflicts resemble strategic contests over spatially fixed resources (e.g. access paths to water points) or strategically placed and highly productive floodplain pastures in the long run.
Multiple economic relationships between groups
Rainfall variability
Rent-seeking government officials
Different levels of political organisations and authority of the FulBe across regions
Government officials benefit from disputes, therefore few incentives to settle them
Different groups, but ties of reciprocity and obligation.
Different traditions of resource-use
Ware (2005) Fiji, Solomon Islands, Vanuatu
Emigration acts as a safety valve in situations of high population growth and few economic opportunities by reducing youth bulges and competitors for power and bringing in remittances
High youth unemployment (Fiji, Vanuatu)
Lack of economic opportunities
Land shortage
State weakness (Solomon Islands, Vanuatu)
Corruption and patronage (Solomon Islands, Vanuatu)
Various ethnic groups
Rapid population growth
Low levels of education (Vanuatu)
Rural-to-urban migration
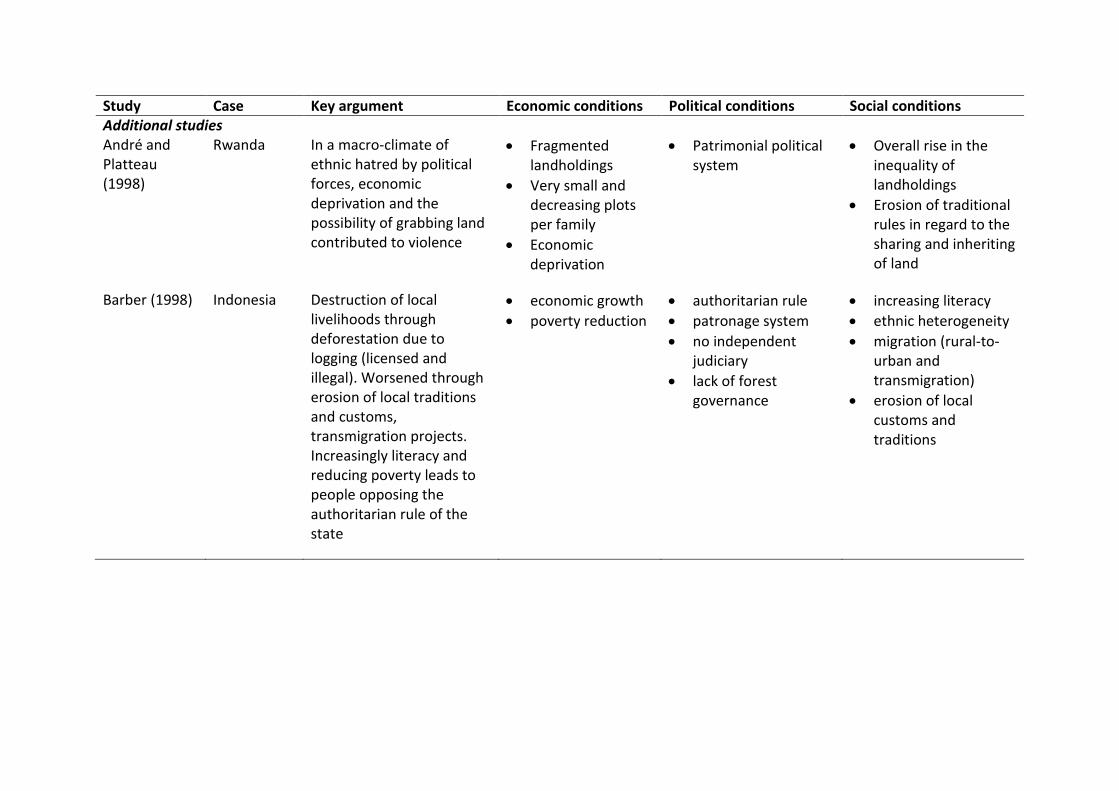
Study Case Key argument Economic conditions Political conditions Social conditions Additional studies André and Platteau (1998)
Rwanda In a macro-climate of ethnic hatred by political forces, economic deprivation and the possibility of grabbing land contributed to violence
Fragmented landholdings
Very small and decreasing plots per family
Economic deprivation
Patrimonial political system
Overall rise in the inequality of landholdings
Erosion of traditional rules in regard to the sharing and inheriting of land
Barber (1998) Indonesia Destruction of local livelihoods through deforestation due to logging (licensed and illegal). Worsened through erosion of local traditions and customs, transmigration projects. Increasingly literacy and reducing poverty leads to people opposing the authoritarian rule of the state
economic growth
poverty reduction
authoritarian rule
patronage system
no independent judiciary
lack of forest governance
increasing literacy
ethnic heterogeneity
migration (rural-to-urban and transmigration)
erosion of local customs and traditions
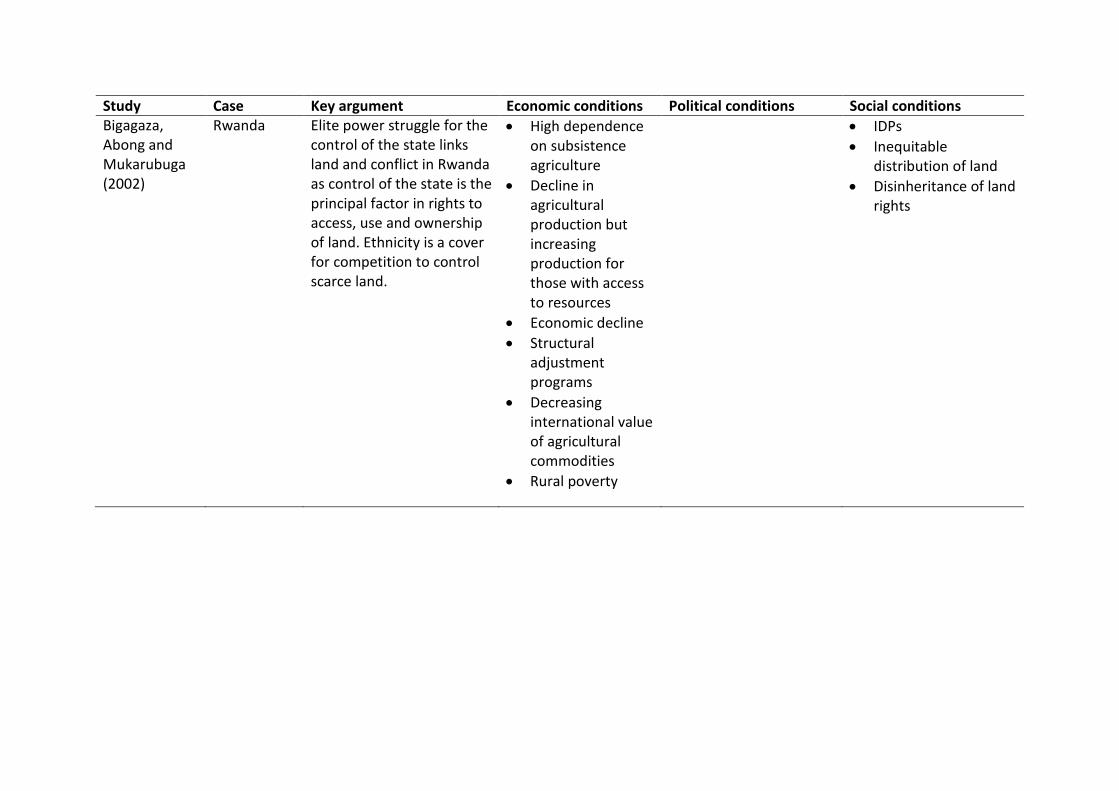
Study Case Key argument Economic conditions Political conditions Social conditions Bigagaza, Abong and Mukarubuga (2002)
Rwanda Elite power struggle for the control of the state links land and conflict in Rwanda as control of the state is the principal factor in rights to access, use and ownership of land. Ethnicity is a cover for competition to control scarce land.
High dependence on subsistence agriculture
Decline in agricultural production but increasing production for those with access to resources
Economic decline
Structural adjustment programs
Decreasing international value of agricultural commodities
Rural poverty
IDPs
Inequitable distribution of land
Disinheritance of land rights
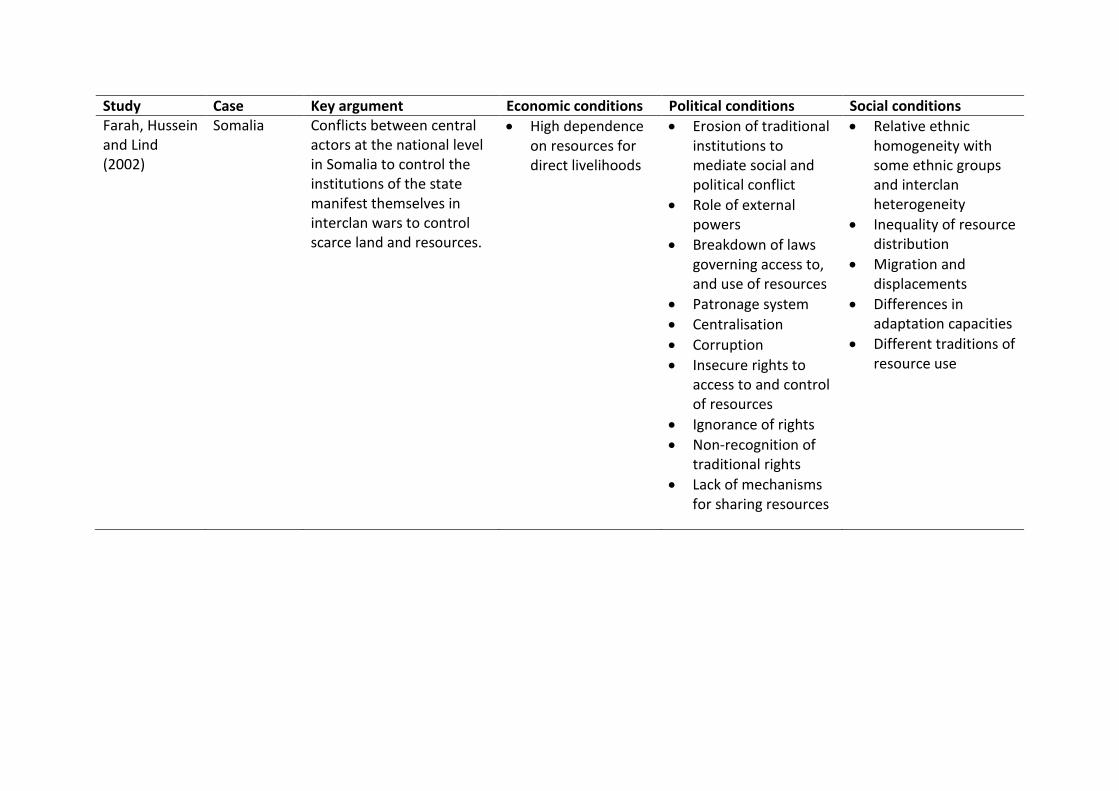
Study Case Key argument Economic conditions Political conditions Social conditions Farah, Hussein and Lind (2002)
Somalia Conflicts between central actors at the national level in Somalia to control the institutions of the state manifest themselves in interclan wars to control scarce land and resources.
High dependence on resources for direct livelihoods
Erosion of traditional institutions to mediate social and political conflict
Role of external powers
Breakdown of laws governing access to, and use of resources
Patronage system
Centralisation
Corruption
Insecure rights to access to and control of resources
Ignorance of rights
Non-recognition of traditional rights
Lack of mechanisms for sharing resources
Relative ethnic homogeneity with some ethnic groups and interclan heterogeneity
Inequality of resource distribution
Migration and displacements
Differences in adaptation capacities
Different traditions of resource use
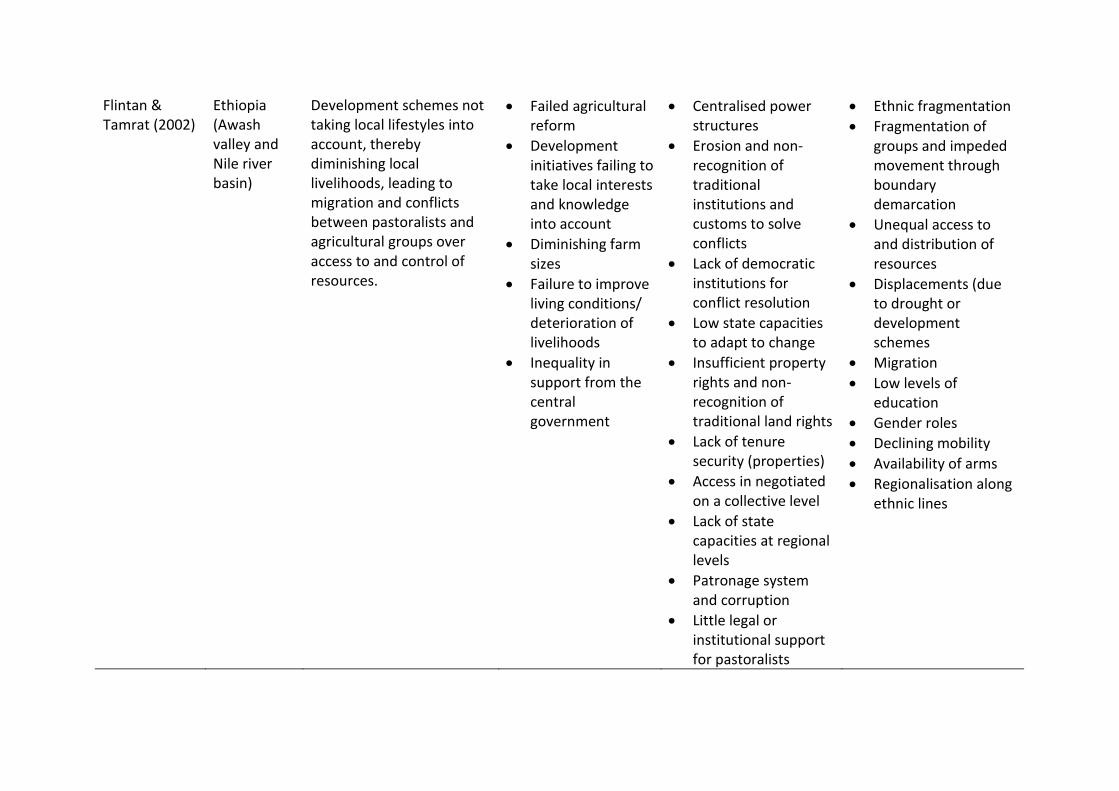
Flintan & Tamrat (2002)
Ethiopia (Awash valley and Nile river basin)
Development schemes not taking local lifestyles into account, thereby diminishing local livelihoods, leading to migration and conflicts between pastoralists and agricultural groups over access to and control of resources.
Failed agricultural reform
Development initiatives failing to take local interests and knowledge into account
Diminishing farm sizes
Failure to improve living conditions/ deterioration of livelihoods
Inequality in support from the central government
Centralised power structures
Erosion and non-recognition of traditional institutions and customs to solve conflicts
Lack of democratic institutions for conflict resolution
Low state capacities to adapt to change
Insufficient property rights and non-recognition of traditional land rights
Lack of tenure security (properties)
Access in negotiated on a collective level
Lack of state capacities at regional levels
Patronage system and corruption
Little legal or institutional support for pastoralists
Ethnic fragmentation
Fragmentation of groups and impeded movement through boundary demarcation
Unequal access to and distribution of resources
Displacements (due to drought or development schemes
Migration
Low levels of education
Gender roles
Declining mobility
Availability of arms
Regionalisation along ethnic lines
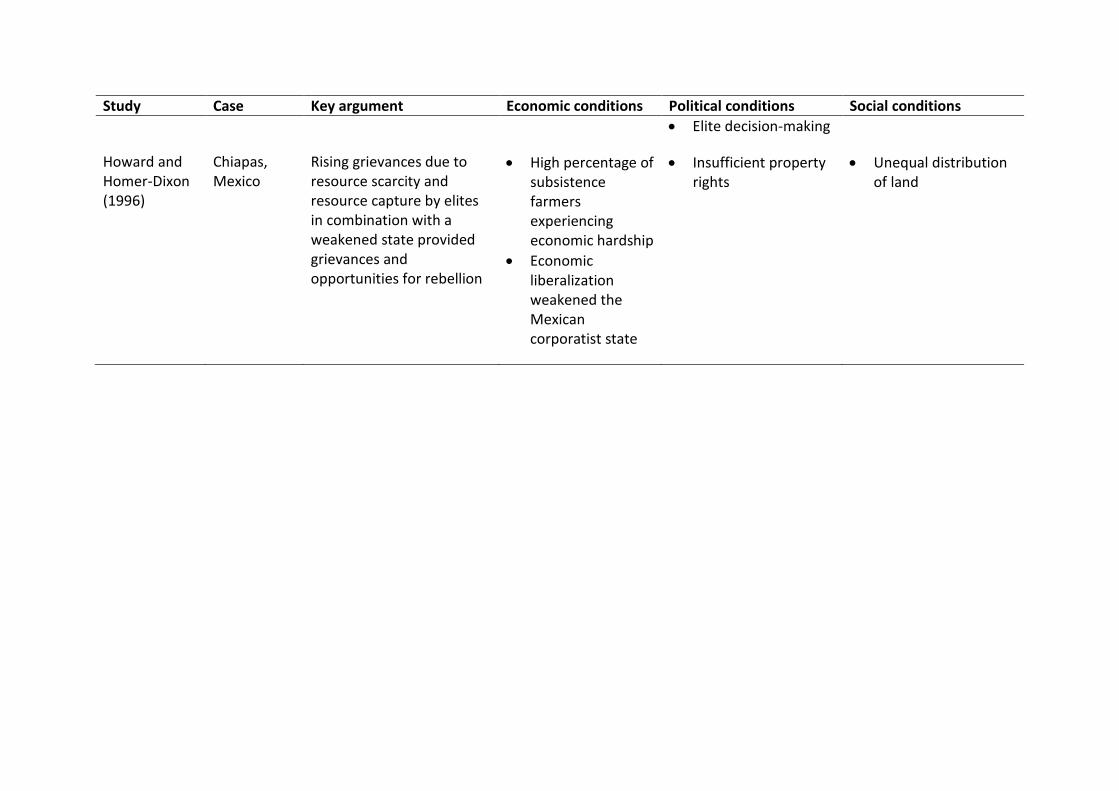
Study Case Key argument Economic conditions Political conditions Social conditions
Elite decision-making
Howard and Homer-Dixon (1996)
Chiapas, Mexico
Rising grievances due to resource scarcity and resource capture by elites in combination with a weakened state provided grievances and opportunities for rebellion
High percentage of subsistence farmers experiencing economic hardship
Economic liberalization weakened the Mexican corporatist state
Insufficient property rights
Unequal distribution of land
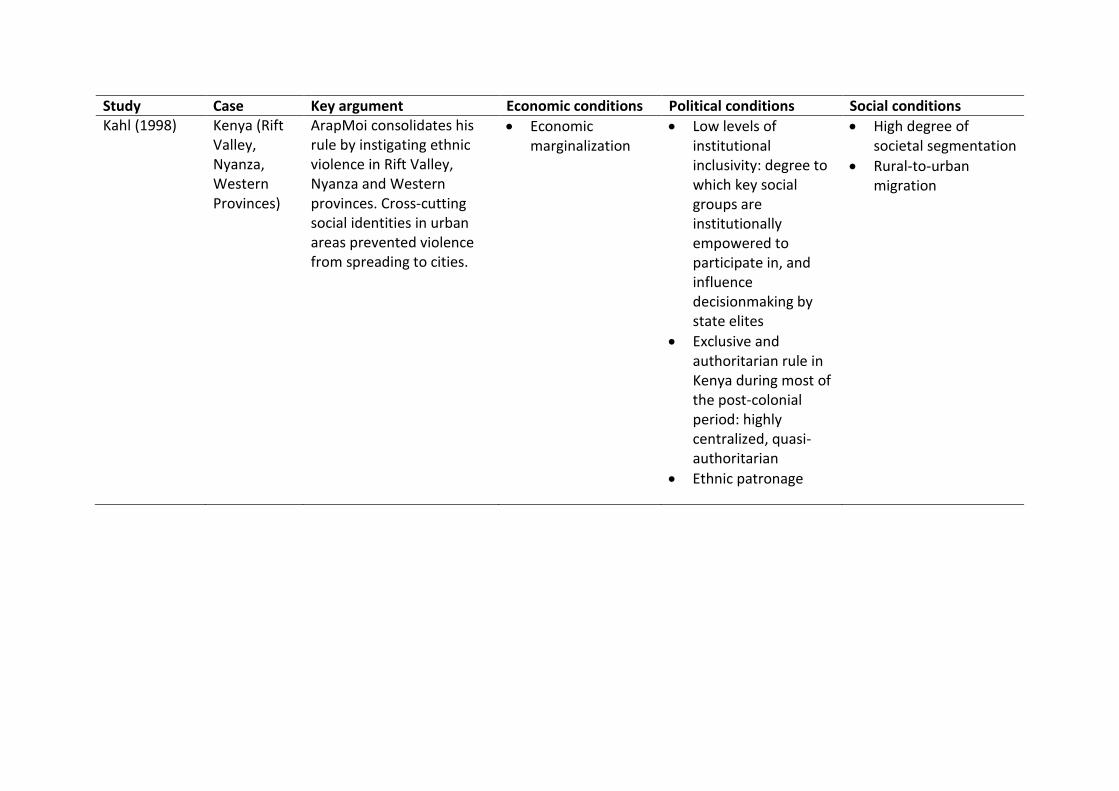
Study Case Key argument Economic conditions Political conditions Social conditions Kahl (1998) Kenya (Rift
Valley, Nyanza, Western Provinces)
ArapMoi consolidates his rule by instigating ethnic violence in Rift Valley, Nyanza and Western provinces. Cross-cutting social identities in urban areas prevented violence from spreading to cities.
Economic marginalization
Low levels of institutional inclusivity: degree to which key social groups are institutionally empowered to participate in, and influence decisionmaking by state elites
Exclusive and authoritarian rule in Kenya during most of the post-colonial period: highly centralized, quasi-authoritarian
Ethnic patronage
High degree of societal segmentation
Rural-to-urban migration
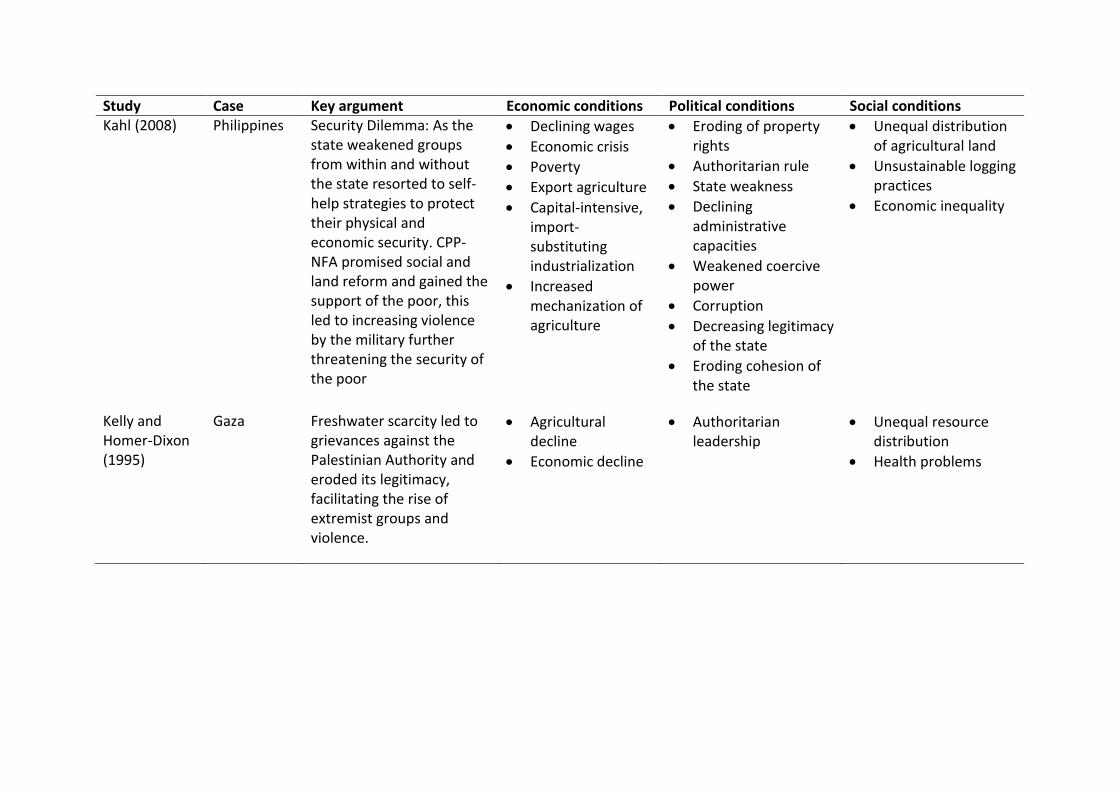
Study Case Key argument Economic conditions Political conditions Social conditions Kahl (2008) Philippines Security Dilemma: As the
state weakened groups from within and without the state resorted to self-help strategies to protect their physical and economic security. CPP-NFA promised social and land reform and gained the support of the poor, this led to increasing violence by the military further threatening the security of the poor
Declining wages
Economic crisis
Poverty
Export agriculture
Capital-intensive, import-substituting industrialization
Increased mechanization of agriculture
Eroding of property rights
Authoritarian rule
State weakness
Declining administrative capacities
Weakened coercive power
Corruption
Decreasing legitimacy of the state
Eroding cohesion of the state
Unequal distribution of agricultural land
Unsustainable logging practices
Economic inequality
Kelly and Homer-Dixon (1995)
Gaza Freshwater scarcity led to grievances against the Palestinian Authority and eroded its legitimacy, facilitating the rise of extremist groups and violence.
Agricultural decline
Economic decline
Authoritarian leadership
Unequal resource distribution
Health problems
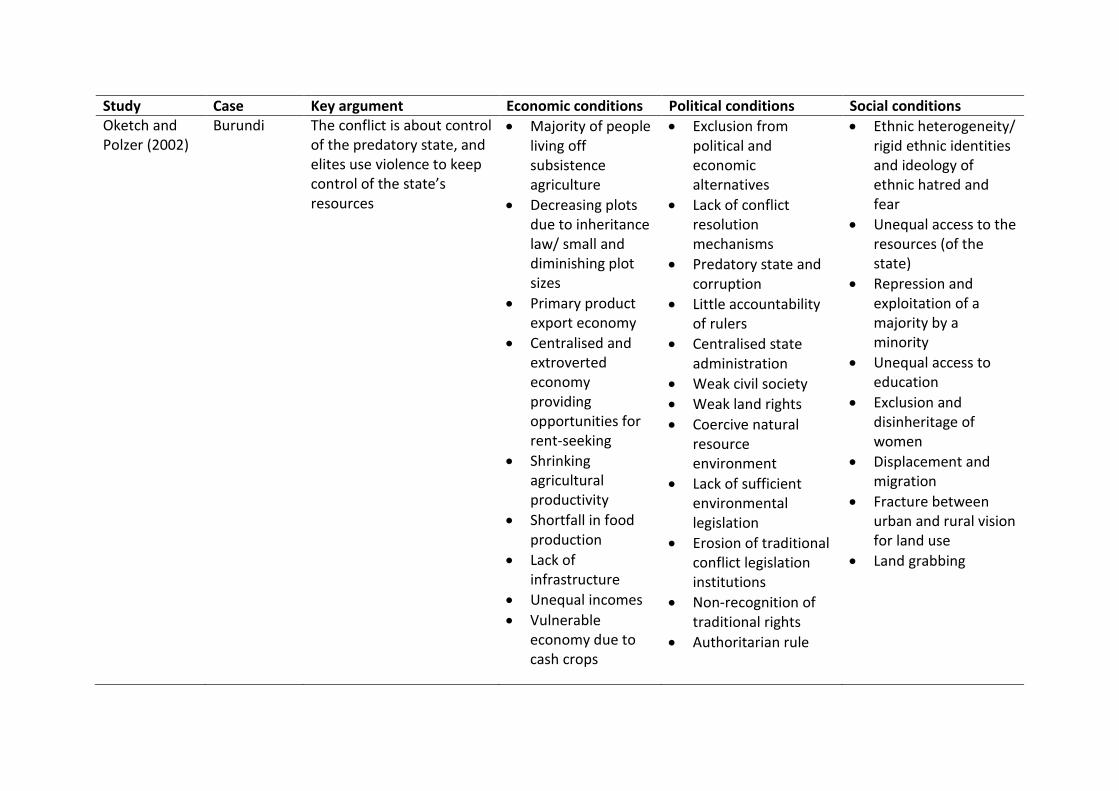
Study Case Key argument Economic conditions Political conditions Social conditions Oketch and Polzer (2002)
Burundi The conflict is about control of the predatory state, and elites use violence to keep control of the state’s resources
Majority of people living off subsistence agriculture
Decreasing plots due to inheritance law/ small and diminishing plot sizes
Primary product export economy
Centralised and extroverted economy providing opportunities for rent-seeking
Shrinking agricultural productivity
Shortfall in food production
Lack of infrastructure
Unequal incomes
Vulnerable economy due to cash crops
Exclusion from political and economic alternatives
Lack of conflict resolution mechanisms
Predatory state and corruption
Little accountability of rulers
Centralised state administration
Weak civil society
Weak land rights
Coercive natural resource environment
Lack of sufficient environmental legislation
Erosion of traditional conflict legislation institutions
Non-recognition of traditional rights
Authoritarian rule
Ethnic heterogeneity/ rigid ethnic identities and ideology of ethnic hatred and fear
Unequal access to the resources (of the state)
Repression and exploitation of a majority by a minority
Unequal access to education
Exclusion and disinheritage of women
Displacement and migration
Fracture between urban and rural vision for land use
Land grabbing
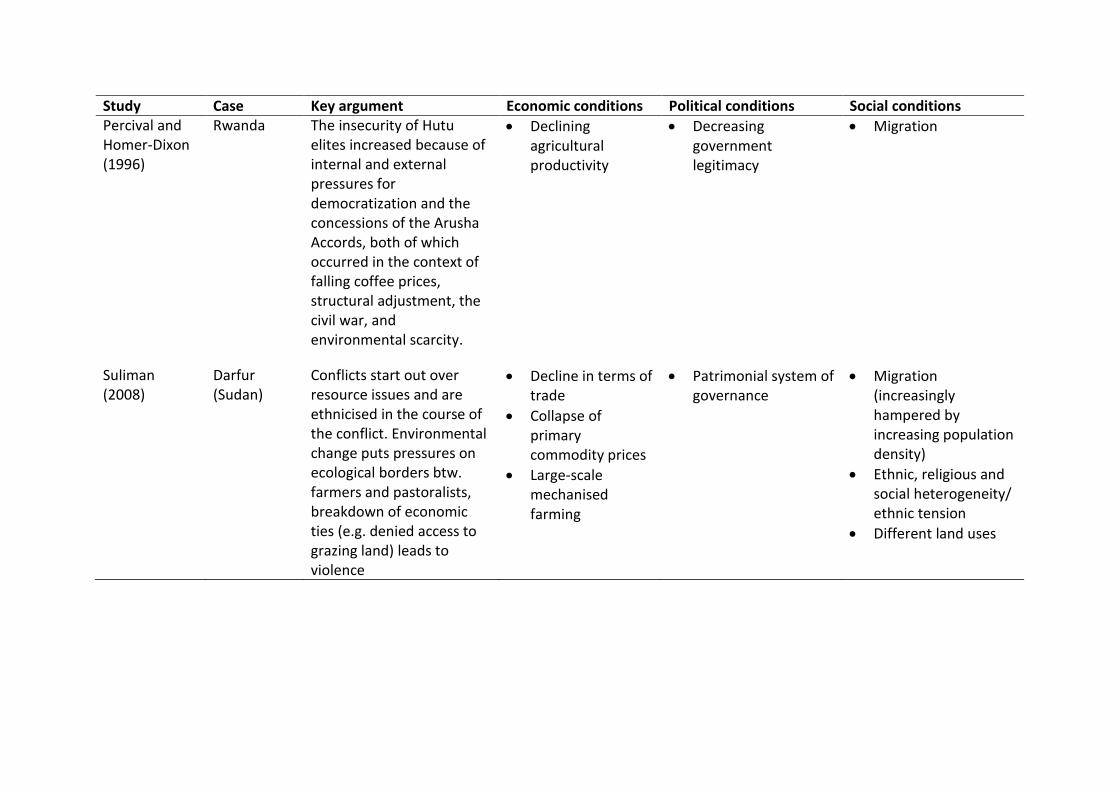
Study Case Key argument Economic conditions Political conditions Social conditions Percival and Homer-Dixon (1996)
Rwanda The insecurity of Hutu elites increased because of internal and external pressures for democratization and the concessions of the Arusha Accords, both of which occurred in the context of falling coffee prices, structural adjustment, the civil war, and environmental scarcity.
Declining agricultural productivity
Decreasing government legitimacy
Migration
Suliman (2008)
Darfur (Sudan)
Conflicts start out over resource issues and are ethnicised in the course of the conflict. Environmental change puts pressures on ecological borders btw. farmers and pastoralists, breakdown of economic ties (e.g. denied access to grazing land) leads to violence
Decline in terms of trade
Collapse of primary commodity prices
Large-scale mechanised farming
Patrimonial system of governance
Migration (increasingly hampered by increasing population density)
Ethnic, religious and social heterogeneity/ ethnic tension
Different land uses
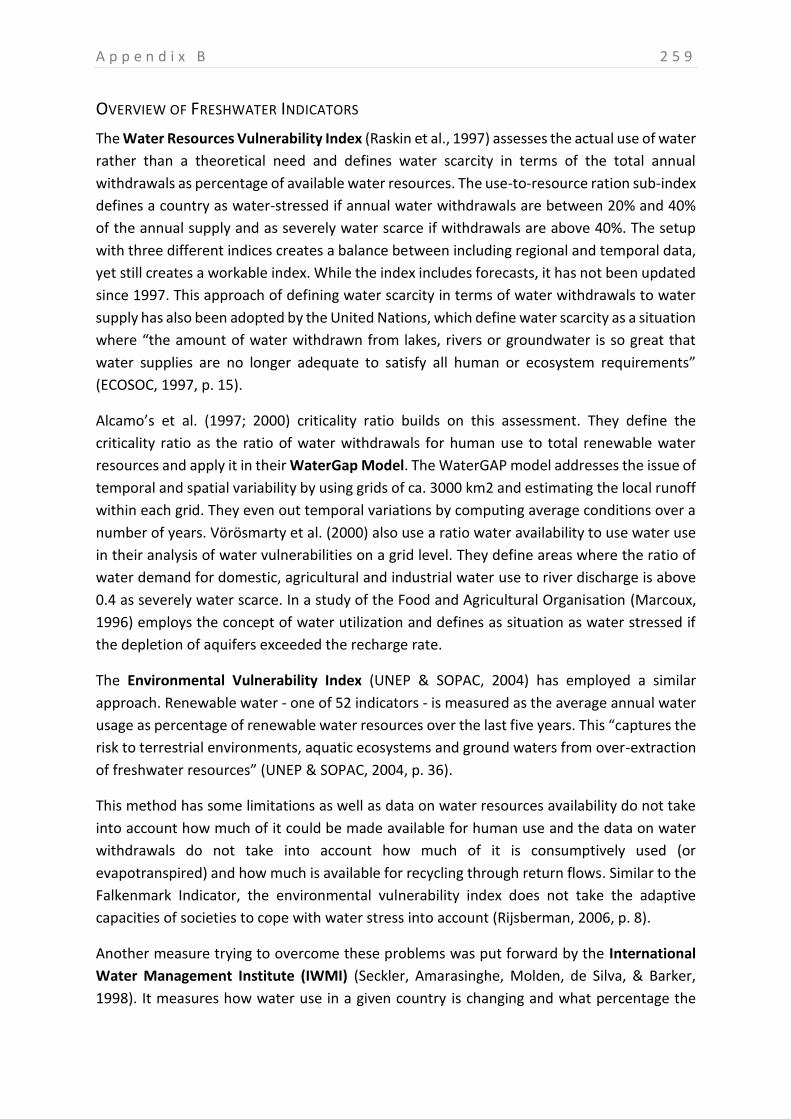
A p p e n d i x B 2 5 9
OVERVIEW OF FRESHWATER INDICATORS
The Water Resources Vulnerability Index (Raskin et al., 1997) assesses the actual use of water
rather than a theoretical need and defines water scarcity in terms of the total annual
withdrawals as percentage of available water resources. The use-to-resource ration sub-index
defines a country as water-stressed if annual water withdrawals are between 20% and 40%
of the annual supply and as severely water scarce if withdrawals are above 40%. The setup
with three different indices creates a balance between including regional and temporal data,
yet still creates a workable index. While the index includes forecasts, it has not been updated
since 1997. This approach of defining water scarcity in terms of water withdrawals to water
supply has also been adopted by the United Nations, which define water scarcity as a situation
where “the amount of water withdrawn from lakes, rivers or groundwater is so great that
water supplies are no longer adequate to satisfy all human or ecosystem requirements”
(ECOSOC, 1997, p. 15).
Alcamo’s et al. (1997; 2000) criticality ratio builds on this assessment. They define the
criticality ratio as the ratio of water withdrawals for human use to total renewable water
resources and apply it in their WaterGap Model. The WaterGAP model addresses the issue of
temporal and spatial variability by using grids of ca. 3000 km2 and estimating the local runoff
within each grid. They even out temporal variations by computing average conditions over a
number of years. Vörösmarty et al. (2000) also use a ratio water availability to use water use
in their analysis of water vulnerabilities on a grid level. They define areas where the ratio of
water demand for domestic, agricultural and industrial water use to river discharge is above
0.4 as severely water scarce. In a study of the Food and Agricultural Organisation (Marcoux,
1996) employs the concept of water utilization and defines as situation as water stressed if
the depletion of aquifers exceeded the recharge rate.
The Environmental Vulnerability Index (UNEP & SOPAC, 2004) has employed a similar
approach. Renewable water - one of 52 indicators - is measured as the average annual water
usage as percentage of renewable water resources over the last five years. This “captures the
risk to terrestrial environments, aquatic ecosystems and ground waters from over-extraction
of freshwater resources” (UNEP & SOPAC, 2004, p. 36).
This method has some limitations as well as data on water resources availability do not take
into account how much of it could be made available for human use and the data on water
withdrawals do not take into account how much of it is consumptively used (or
evapotranspired) and how much is available for recycling through return flows. Similar to the
Falkenmark Indicator, the environmental vulnerability index does not take the adaptive
capacities of societies to cope with water stress into account (Rijsberman, 2006, p. 8).
Another measure trying to overcome these problems was put forward by the International
Water Management Institute (IWMI) (Seckler, Amarasinghe, Molden, de Silva, & Barker,
1998). It measures how water use in a given country is changing and what percentage the
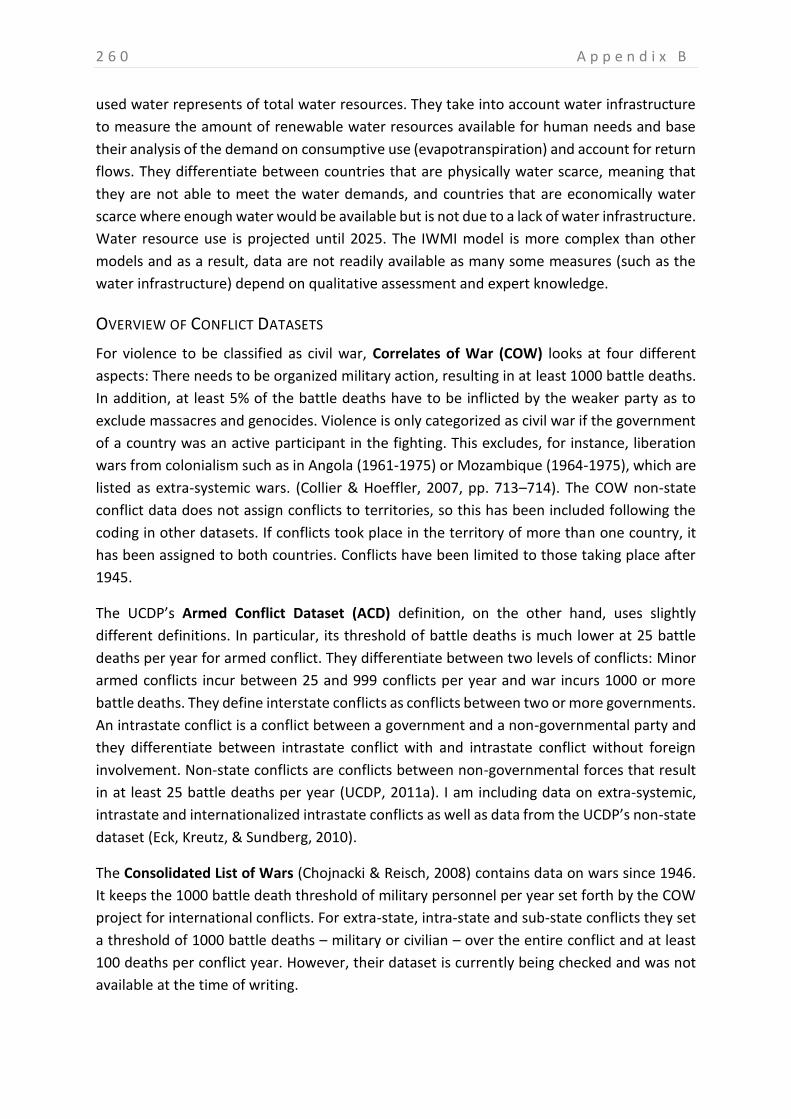
2 6 0 A p p e n d i x B
used water represents of total water resources. They take into account water infrastructure
to measure the amount of renewable water resources available for human needs and base
their analysis of the demand on consumptive use (evapotranspiration) and account for return
flows. They differentiate between countries that are physically water scarce, meaning that
they are not able to meet the water demands, and countries that are economically water
scarce where enough water would be available but is not due to a lack of water infrastructure.
Water resource use is projected until 2025. The IWMI model is more complex than other
models and as a result, data are not readily available as many some measures (such as the
water infrastructure) depend on qualitative assessment and expert knowledge.
OVERVIEW OF CONFLICT DATASETS
For violence to be classified as civil war, Correlates of War (COW) looks at four different
aspects: There needs to be organized military action, resulting in at least 1000 battle deaths.
In addition, at least 5% of the battle deaths have to be inflicted by the weaker party as to
exclude massacres and genocides. Violence is only categorized as civil war if the government
of a country was an active participant in the fighting. This excludes, for instance, liberation
wars from colonialism such as in Angola (1961-1975) or Mozambique (1964-1975), which are
listed as extra-systemic wars. (Collier & Hoeffler, 2007, pp. 713–714). The COW non-state
conflict data does not assign conflicts to territories, so this has been included following the
coding in other datasets. If conflicts took place in the territory of more than one country, it
has been assigned to both countries. Conflicts have been limited to those taking place after
1945.
The UCDP’s Armed Conflict Dataset (ACD) definition, on the other hand, uses slightly
different definitions. In particular, its threshold of battle deaths is much lower at 25 battle
deaths per year for armed conflict. They differentiate between two levels of conflicts: Minor
armed conflicts incur between 25 and 999 conflicts per year and war incurs 1000 or more
battle deaths. They define interstate conflicts as conflicts between two or more governments.
An intrastate conflict is a conflict between a government and a non-governmental party and
they differentiate between intrastate conflict with and intrastate conflict without foreign
involvement. Non-state conflicts are conflicts between non-governmental forces that result
in at least 25 battle deaths per year (UCDP, 2011a). I am including data on extra-systemic,
intrastate and internationalized intrastate conflicts as well as data from the UCDP’s non-state
dataset (Eck, Kreutz, & Sundberg, 2010).
The Consolidated List of Wars (Chojnacki & Reisch, 2008) contains data on wars since 1946.
It keeps the 1000 battle death threshold of military personnel per year set forth by the COW
project for international conflicts. For extra-state, intra-state and sub-state conflicts they set
a threshold of 1000 battle deaths – military or civilian – over the entire conflict and at least
100 deaths per conflict year. However, their dataset is currently being checked and was not
available at the time of writing.
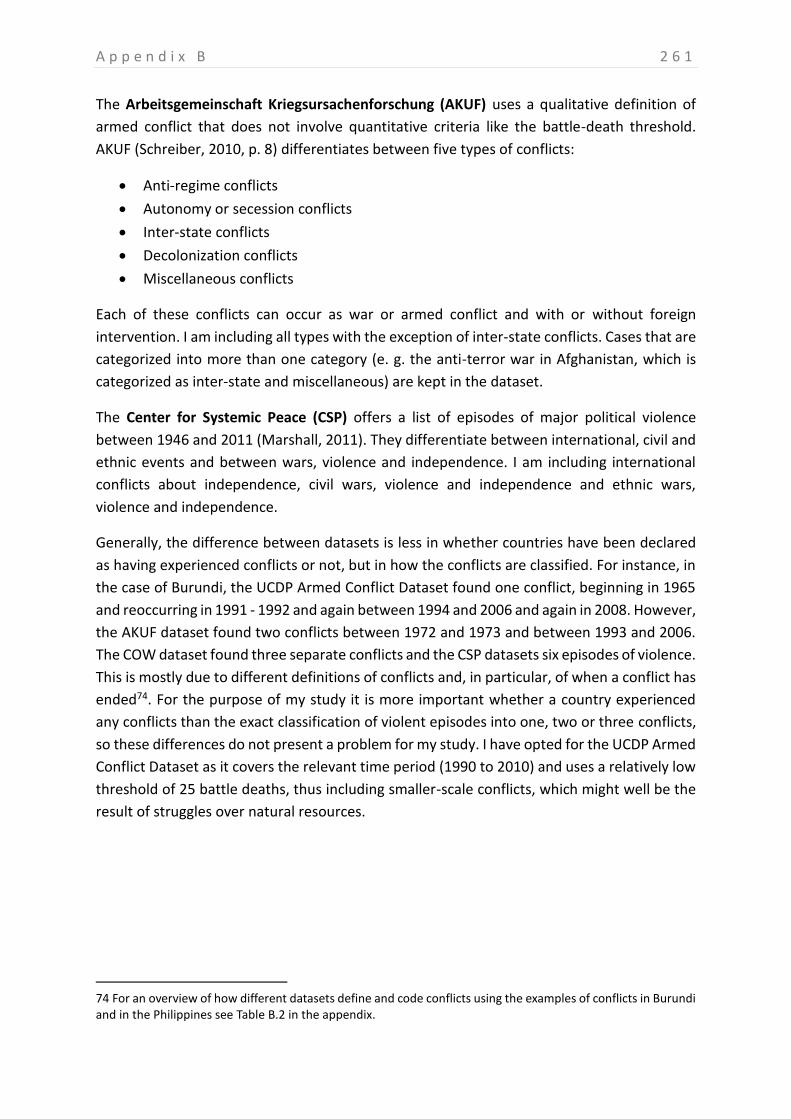
A p p e n d i x B 2 6 1
The Arbeitsgemeinschaft Kriegsursachenforschung (AKUF) uses a qualitative definition of
armed conflict that does not involve quantitative criteria like the battle-death threshold.
AKUF (Schreiber, 2010, p. 8) differentiates between five types of conflicts:
Anti-regime conflicts
Autonomy or secession conflicts
Inter-state conflicts
Decolonization conflicts
Miscellaneous conflicts
Each of these conflicts can occur as war or armed conflict and with or without foreign
intervention. I am including all types with the exception of inter-state conflicts. Cases that are
categorized into more than one category (e. g. the anti-terror war in Afghanistan, which is
categorized as inter-state and miscellaneous) are kept in the dataset.
The Center for Systemic Peace (CSP) offers a list of episodes of major political violence
between 1946 and 2011 (Marshall, 2011). They differentiate between international, civil and
ethnic events and between wars, violence and independence. I am including international
conflicts about independence, civil wars, violence and independence and ethnic wars,
violence and independence.
Generally, the difference between datasets is less in whether countries have been declared
as having experienced conflicts or not, but in how the conflicts are classified. For instance, in
the case of Burundi, the UCDP Armed Conflict Dataset found one conflict, beginning in 1965
and reoccurring in 1991 - 1992 and again between 1994 and 2006 and again in 2008. However,
the AKUF dataset found two conflicts between 1972 and 1973 and between 1993 and 2006.
The COW dataset found three separate conflicts and the CSP datasets six episodes of violence.
This is mostly due to different definitions of conflicts and, in particular, of when a conflict has
ended74. For the purpose of my study it is more important whether a country experienced
any conflicts than the exact classification of violent episodes into one, two or three conflicts,
so these differences do not present a problem for my study. I have opted for the UCDP Armed
Conflict Dataset as it covers the relevant time period (1990 to 2010) and uses a relatively low
threshold of 25 battle deaths, thus including smaller-scale conflicts, which might well be the
result of struggles over natural resources.
74 For an overview of how different datasets define and code conflicts using the examples of conflicts in Burundi and in the Philippines see Table B.2 in the appendix.
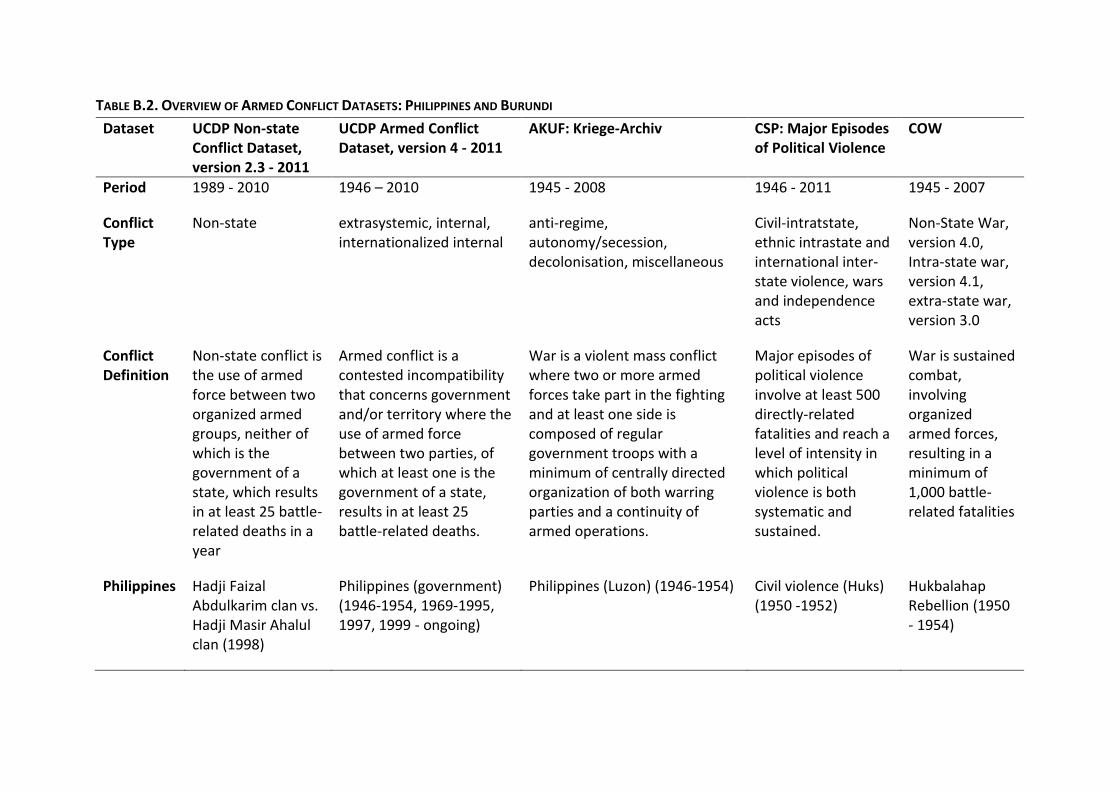
TABLE B.2. OVERVIEW OF ARMED CONFLICT DATASETS: PHILIPPINES AND BURUNDI
Dataset UCDP Non-state Conflict Dataset, version 2.3 - 2011
UCDP Armed Conflict Dataset, version 4 - 2011
AKUF: Kriege-Archiv CSP: Major Episodes of Political Violence
COW
Period 1989 - 2010 1946 – 2010 1945 - 2008 1946 - 2011 1945 - 2007
Conflict Type
Non-state extrasystemic, internal, internationalized internal
anti-regime, autonomy/secession, decolonisation, miscellaneous
Civil-intratstate, ethnic intrastate and international inter-state violence, wars and independence acts
Non-State War, version 4.0, Intra-state war, version 4.1, extra-state war, version 3.0
Conflict Definition
Non-state conflict is the use of armed force between two organized armed groups, neither of which is the government of a state, which results in at least 25 battle-related deaths in a year
Armed conflict is a contested incompatibility that concerns government and/or territory where the use of armed force between two parties, of which at least one is the government of a state, results in at least 25 battle-related deaths.
War is a violent mass conflict where two or more armed forces take part in the fighting and at least one side is composed of regular government troops with a minimum of centrally directed organization of both warring parties and a continuity of armed operations.
Major episodes of political violence involve at least 500 directly-related fatalities and reach a level of intensity in which political violence is both systematic and sustained.
War is sustained combat, involving organized armed forces, resulting in a minimum of 1,000 battle-related fatalities
Philippines Hadji Faizal Abdulkarim clan vs. Hadji Masir Ahalul clan (1998)
Philippines (government) (1946-1954, 1969-1995, 1997, 1999 - ongoing)
Philippines (Luzon) (1946-1954) Civil violence (Huks) (1950 -1952)
Hukbalahap Rebellion (1950 - 1954)
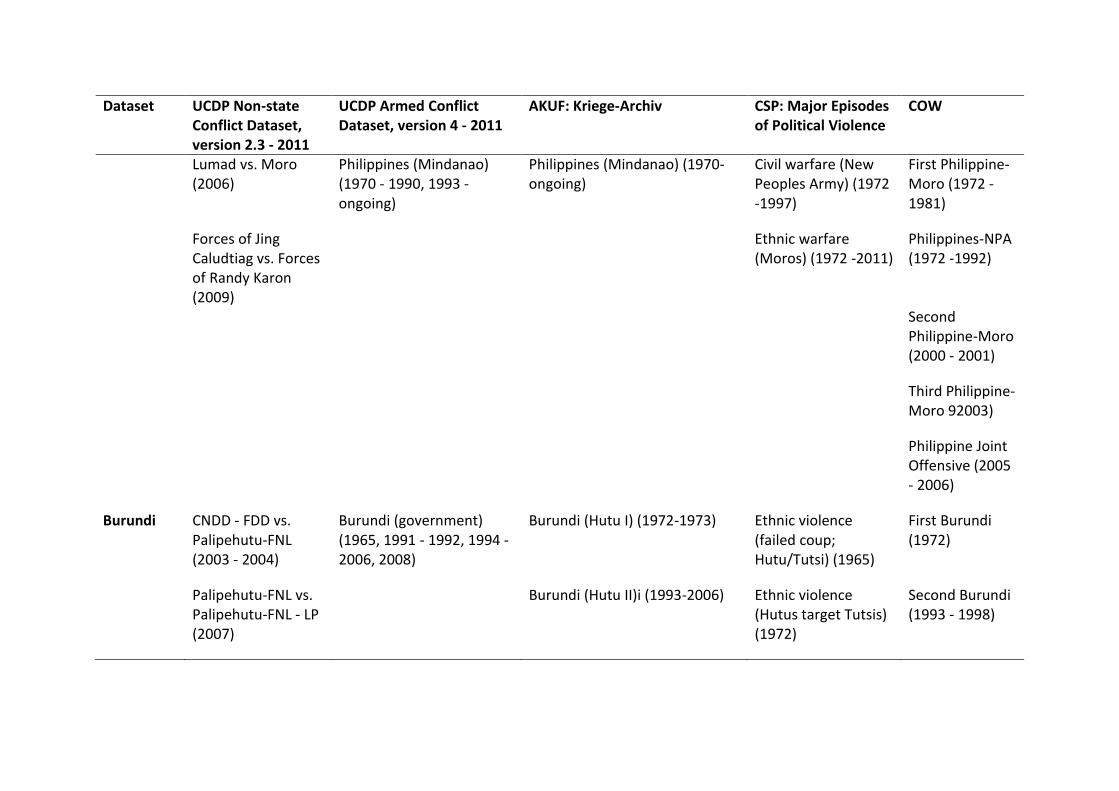
Dataset UCDP Non-state Conflict Dataset, version 2.3 - 2011
UCDP Armed Conflict Dataset, version 4 - 2011
AKUF: Kriege-Archiv CSP: Major Episodes of Political Violence
COW
Lumad vs. Moro (2006)
Philippines (Mindanao) (1970 - 1990, 1993 - ongoing)
Philippines (Mindanao) (1970-ongoing)
Civil warfare (New Peoples Army) (1972 -1997)
First Philippine-Moro (1972 - 1981)
Forces of Jing Caludtiag vs. Forces of Randy Karon (2009)
Ethnic warfare (Moros) (1972 -2011)
Philippines-NPA (1972 -1992)
Second Philippine-Moro (2000 - 2001)
Third Philippine-Moro 92003)
Philippine Joint Offensive (2005 - 2006)
Burundi CNDD - FDD vs. Palipehutu-FNL (2003 - 2004)
Burundi (government) (1965, 1991 - 1992, 1994 - 2006, 2008)
Burundi (Hutu I) (1972-1973) Ethnic violence (failed coup; Hutu/Tutsi) (1965)
First Burundi (1972)
Palipehutu-FNL vs. Palipehutu-FNL - LP (2007)
Burundi (Hutu II)i (1993-2006) Ethnic violence (Hutus target Tutsis) (1972)
Second Burundi (1993 - 1998)
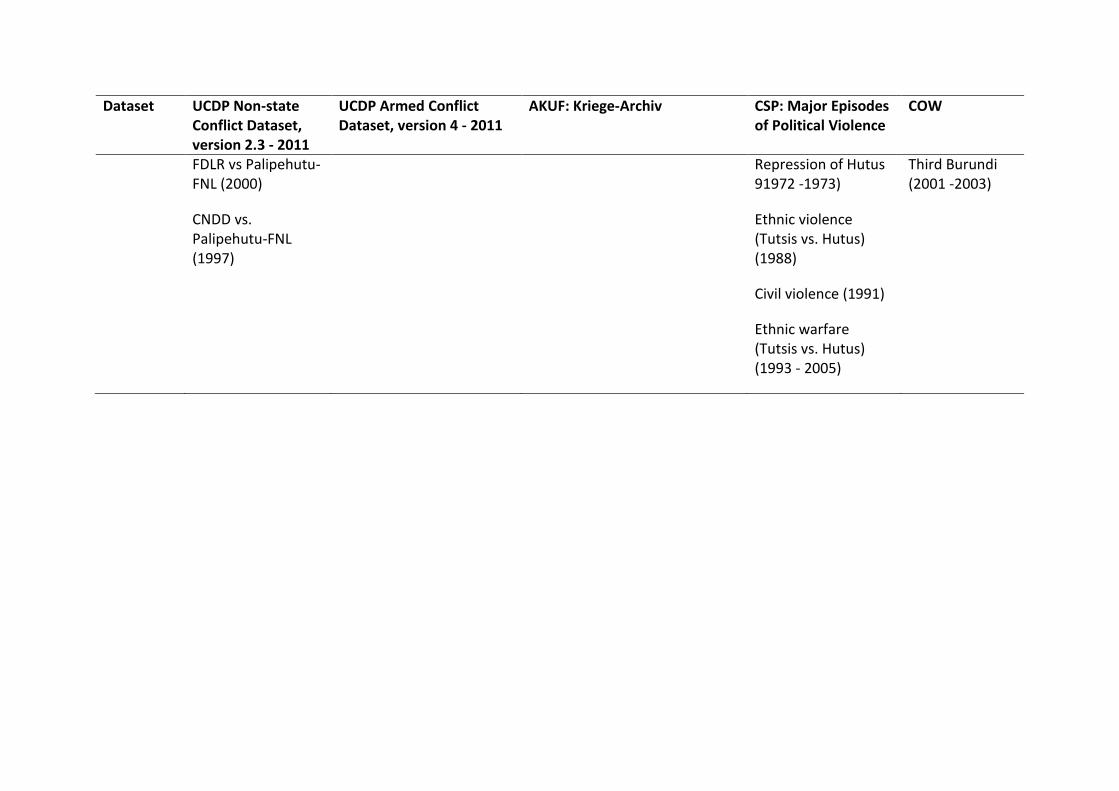
Dataset UCDP Non-state Conflict Dataset, version 2.3 - 2011
UCDP Armed Conflict Dataset, version 4 - 2011
AKUF: Kriege-Archiv CSP: Major Episodes of Political Violence
COW
FDLR vs Palipehutu-FNL (2000)
Repression of Hutus 91972 -1973)
Third Burundi (2001 -2003)
CNDD vs. Palipehutu-FNL (1997)
Ethnic violence (Tutsis vs. Hutus) (1988)
Civil violence (1991)
Ethnic warfare (Tutsis vs. Hutus) (1993 - 2005)
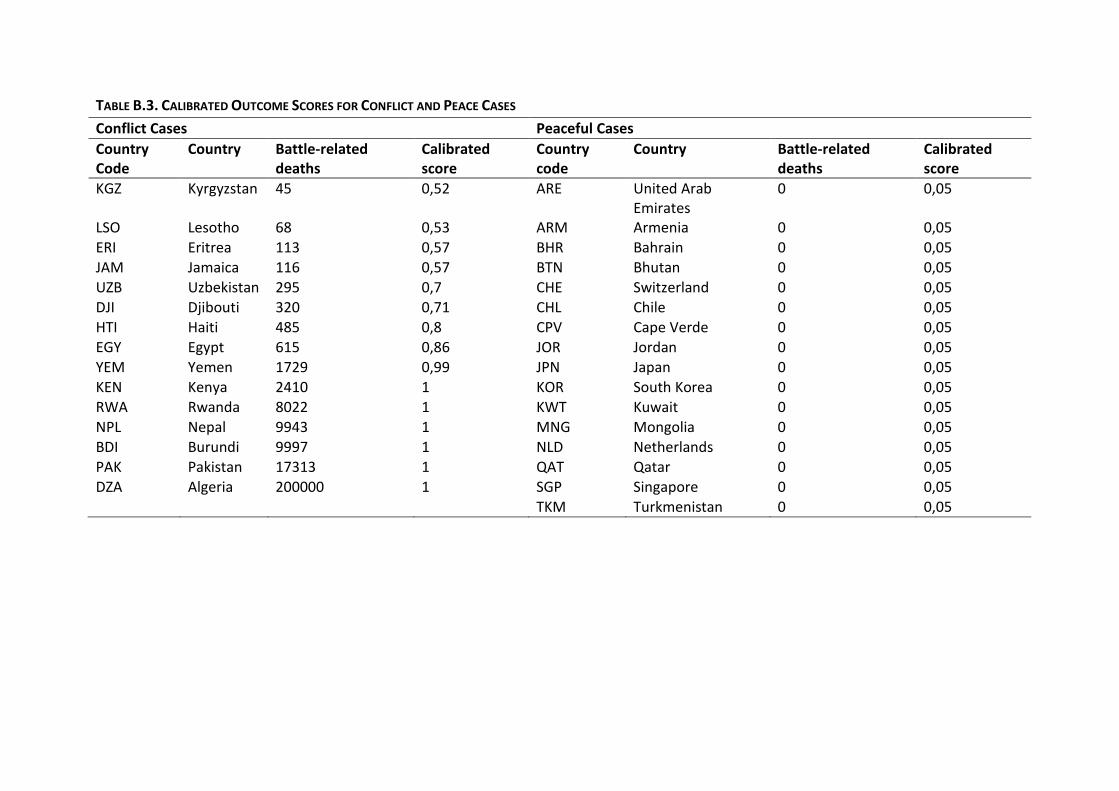
TABLE B.3. CALIBRATED OUTCOME SCORES FOR CONFLICT AND PEACE CASES
Conflict Cases Peaceful Cases
Country Code
Country Battle-related deaths
Calibrated score
Country code
Country Battle-related deaths
Calibrated score
KGZ Kyrgyzstan 45 0,52 ARE United Arab Emirates
0 0,05
LSO Lesotho 68 0,53 ARM Armenia 0 0,05
ERI Eritrea 113 0,57 BHR Bahrain 0 0,05 JAM Jamaica 116 0,57 BTN Bhutan 0 0,05 UZB Uzbekistan 295 0,7 CHE Switzerland 0 0,05 DJI Djibouti 320 0,71 CHL Chile 0 0,05 HTI Haiti 485 0,8 CPV Cape Verde 0 0,05 EGY Egypt 615 0,86 JOR Jordan 0 0,05 YEM Yemen 1729 0,99 JPN Japan 0 0,05 KEN Kenya 2410 1 KOR South Korea 0 0,05 RWA Rwanda 8022 1 KWT Kuwait 0 0,05
NPL Nepal 9943 1 MNG Mongolia 0 0,05 BDI Burundi 9997 1 NLD Netherlands 0 0,05 PAK Pakistan 17313 1 QAT Qatar 0 0,05 DZA Algeria 200000 1 SGP Singapore 0 0,05 TKM Turkmenistan 0 0,05
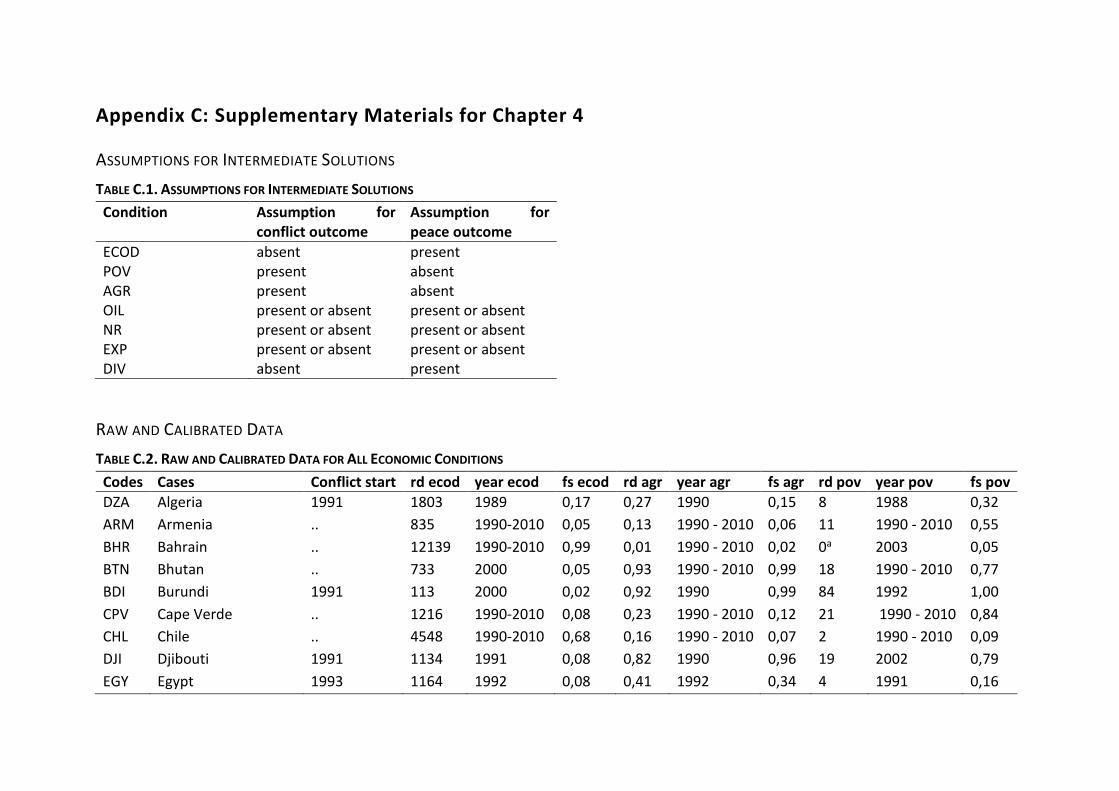
Appendix C: Supplementary Materials for Chapter 4
ASSUMPTIONS FOR INTERMEDIATE SOLUTIONS
TABLE C.1. ASSUMPTIONS FOR INTERMEDIATE SOLUTIONS
Condition Assumption for conflict outcome
Assumption for peace outcome
ECOD absent present POV present absent AGR present absent OIL present or absent present or absent NR present or absent present or absent EXP present or absent present or absent DIV absent present
RAW AND CALIBRATED DATA
TABLE C.2. RAW AND CALIBRATED DATA FOR ALL ECONOMIC CONDITIONS
Codes Cases Conflict start rd ecod year ecod fs ecod rd agr year agr fs agr rd pov year pov fs pov
DZA Algeria 1991 1803 1989 0,17 0,27 1990 0,15 8 1988 0,32
ARM Armenia .. 835 1990-2010 0,05 0,13 1990 - 2010 0,06 11 1990 - 2010 0,55
BHR Bahrain .. 12139 1990-2010 0,99 0,01 1990 - 2010 0,02 0a 2003 0,05
BTN Bhutan .. 733 2000 0,05 0,93 1990 - 2010 0,99 18 1990 - 2010 0,77
BDI Burundi 1991 113 2000 0,02 0,92 1990 0,99 84 1992 1,00
CPV Cape Verde .. 1216 1990-2010 0,08 0,23 1990 - 2010 0,12 21 1990 - 2010 0,84
CHL Chile .. 4548 1990-2010 0,68 0,16 1990 - 2010 0,07 2 1990 - 2010 0,09
DJI Djibouti 1991 1134 1991 0,08 0,82 1990 0,96 19 2002 0,79
EGY Egypt 1993 1164 1992 0,08 0,41 1992 0,34 4 1991 0,16
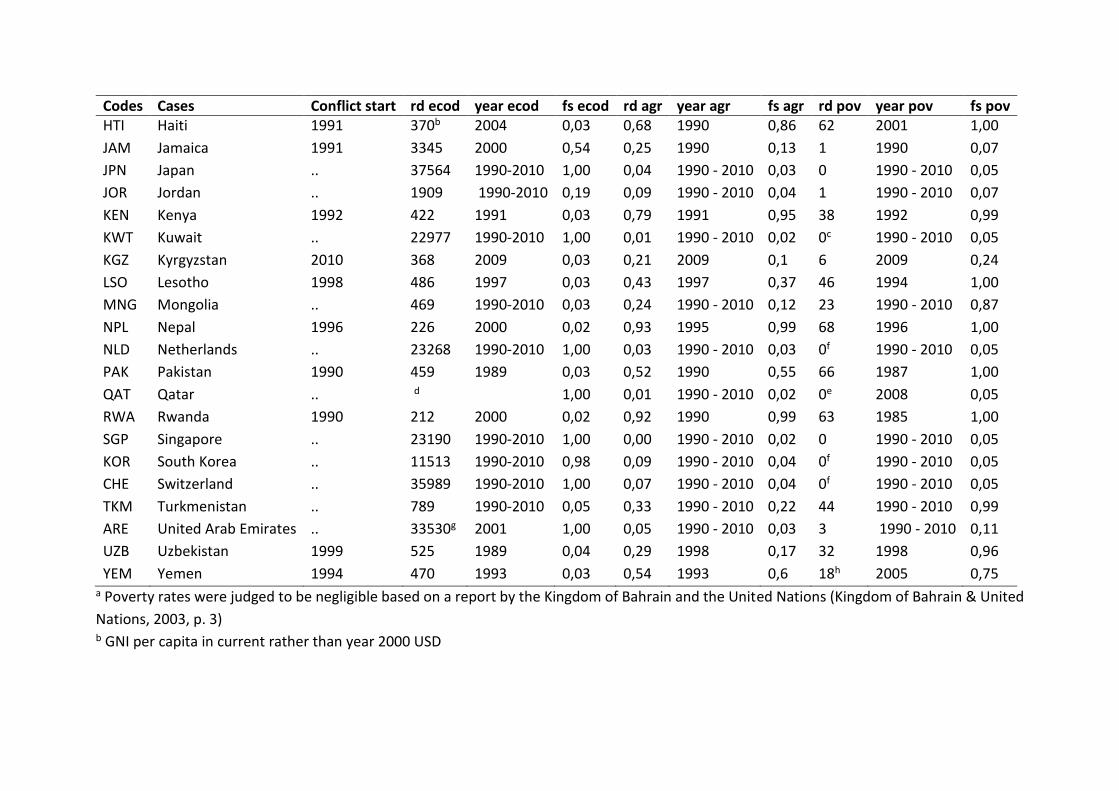
Codes Cases Conflict start rd ecod year ecod fs ecod rd agr year agr fs agr rd pov year pov fs pov HTI Haiti 1991 370b 2004 0,03 0,68 1990 0,86 62 2001 1,00
JAM Jamaica 1991 3345 2000 0,54 0,25 1990 0,13 1 1990 0,07
JPN Japan .. 37564 1990-2010 1,00 0,04 1990 - 2010 0,03 0 1990 - 2010 0,05
JOR Jordan .. 1909 1990-2010 0,19 0,09 1990 - 2010 0,04 1 1990 - 2010 0,07
KEN Kenya 1992 422 1991 0,03 0,79 1991 0,95 38 1992 0,99
KWT Kuwait .. 22977 1990-2010 1,00 0,01 1990 - 2010 0,02 0c 1990 - 2010 0,05
KGZ Kyrgyzstan 2010 368 2009 0,03 0,21 2009 0,1 6 2009 0,24
LSO Lesotho 1998 486 1997 0,03 0,43 1997 0,37 46 1994 1,00
MNG Mongolia .. 469 1990-2010 0,03 0,24 1990 - 2010 0,12 23 1990 - 2010 0,87
NPL Nepal 1996 226 2000 0,02 0,93 1995 0,99 68 1996 1,00
NLD Netherlands .. 23268 1990-2010 1,00 0,03 1990 - 2010 0,03 0f 1990 - 2010 0,05
PAK Pakistan 1990 459 1989 0,03 0,52 1990 0,55 66 1987 1,00
QAT Qatar .. d 1,00 0,01 1990 - 2010 0,02 0e 2008 0,05
RWA Rwanda 1990 212 2000 0,02 0,92 1990 0,99 63 1985 1,00
SGP Singapore .. 23190 1990-2010 1,00 0,00 1990 - 2010 0,02 0 1990 - 2010 0,05
KOR South Korea .. 11513 1990-2010 0,98 0,09 1990 - 2010 0,04 0f 1990 - 2010 0,05
CHE Switzerland .. 35989 1990-2010 1,00 0,07 1990 - 2010 0,04 0f 1990 - 2010 0,05
TKM Turkmenistan .. 789 1990-2010 0,05 0,33 1990 - 2010 0,22 44 1990 - 2010 0,99
ARE United Arab Emirates .. 33530g 2001 1,00 0,05 1990 - 2010 0,03 3 1990 - 2010 0,11
UZB Uzbekistan 1999 525 1989 0,04 0,29 1998 0,17 32 1998 0,96
YEM Yemen 1994 470 1993 0,03 0,54 1993 0,6 18h 2005 0,75 a Poverty rates were judged to be negligible based on a report by the Kingdom of Bahrain and the United Nations (Kingdom of Bahrain & United
Nations, 2003, p. 3) b GNI per capita in current rather than year 2000 USD
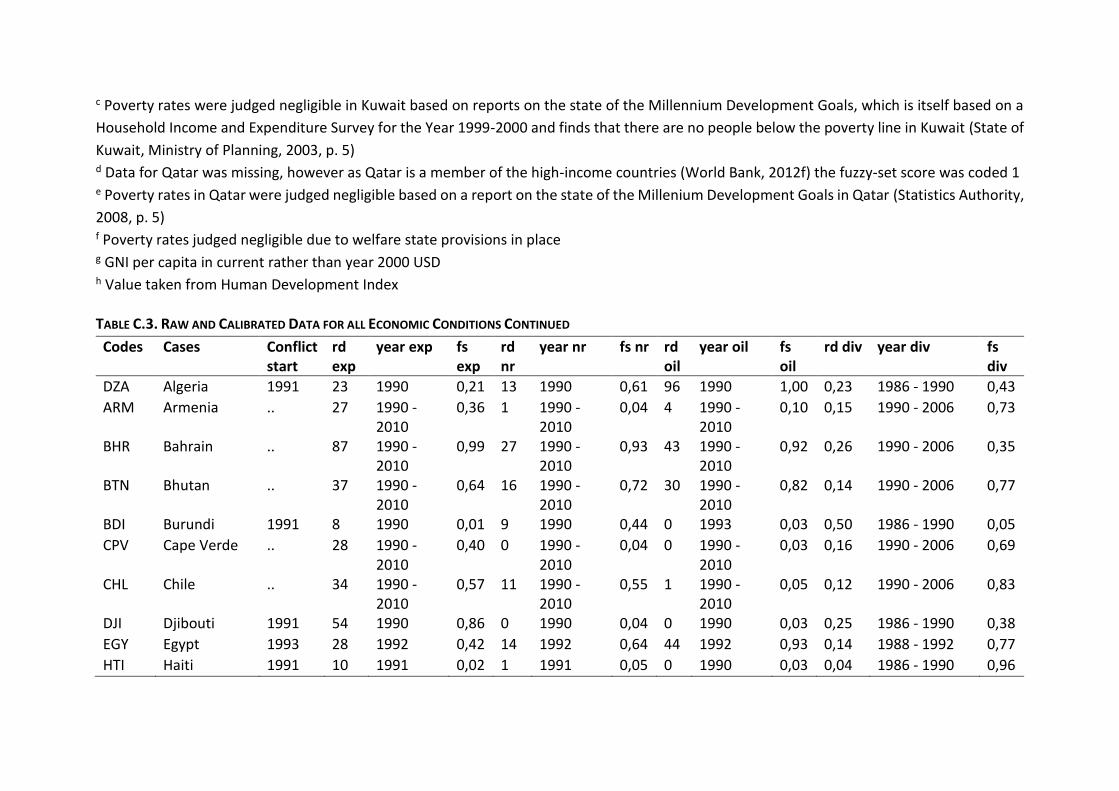
c Poverty rates were judged negligible in Kuwait based on reports on the state of the Millennium Development Goals, which is itself based on a
Household Income and Expenditure Survey for the Year 1999-2000 and finds that there are no people below the poverty line in Kuwait (State of
Kuwait, Ministry of Planning, 2003, p. 5) d Data for Qatar was missing, however as Qatar is a member of the high-income countries (World Bank, 2012f) the fuzzy-set score was coded 1 e Poverty rates in Qatar were judged negligible based on a report on the state of the Millenium Development Goals in Qatar (Statistics Authority,
2008, p. 5) f Poverty rates judged negligible due to welfare state provisions in place g GNI per capita in current rather than year 2000 USD h Value taken from Human Development Index
TABLE C.3. RAW AND CALIBRATED DATA FOR ALL ECONOMIC CONDITIONS CONTINUED
Codes Cases Conflict start
rd exp
year exp fs exp
rd nr
year nr fs nr rd oil
year oil fs oil
rd div year div fs div
DZA Algeria 1991 23 1990 0,21 13 1990 0,61 96 1990 1,00 0,23 1986 - 1990 0,43
ARM Armenia .. 27 1990 -2010
0,36 1 1990 -2010
0,04 4 1990 - 2010
0,10 0,15 1990 - 2006 0,73
BHR Bahrain .. 87 1990 -2010
0,99 27 1990 - 2010
0,93 43 1990 - 2010
0,92 0,26 1990 - 2006 0,35
BTN Bhutan .. 37 1990 -2010
0,64 16 1990 - 2010
0,72 30 1990 - 2010
0,82 0,14 1990 - 2006 0,77
BDI Burundi 1991 8 1990 0,01 9 1990 0,44 0 1993 0,03 0,50 1986 - 1990 0,05
CPV Cape Verde .. 28 1990 -2010
0,40 0 1990 - 2010
0,04 0 1990 - 2010
0,03 0,16 1990 - 2006 0,69
CHL Chile .. 34 1990 -2010
0,57 11 1990 - 2010
0,55 1 1990 - 2010
0,05 0,12 1990 - 2006 0,83
DJI Djibouti 1991 54 1990 0,86 0 1990 0,04 0 1990 0,03 0,25 1986 - 1990 0,38
EGY Egypt 1993 28 1992 0,42 14 1992 0,64 44 1992 0,93 0,14 1988 - 1992 0,77
HTI Haiti 1991 10 1991 0,02 1 1991 0,05 0 1990 0,03 0,04 1986 - 1990 0,96
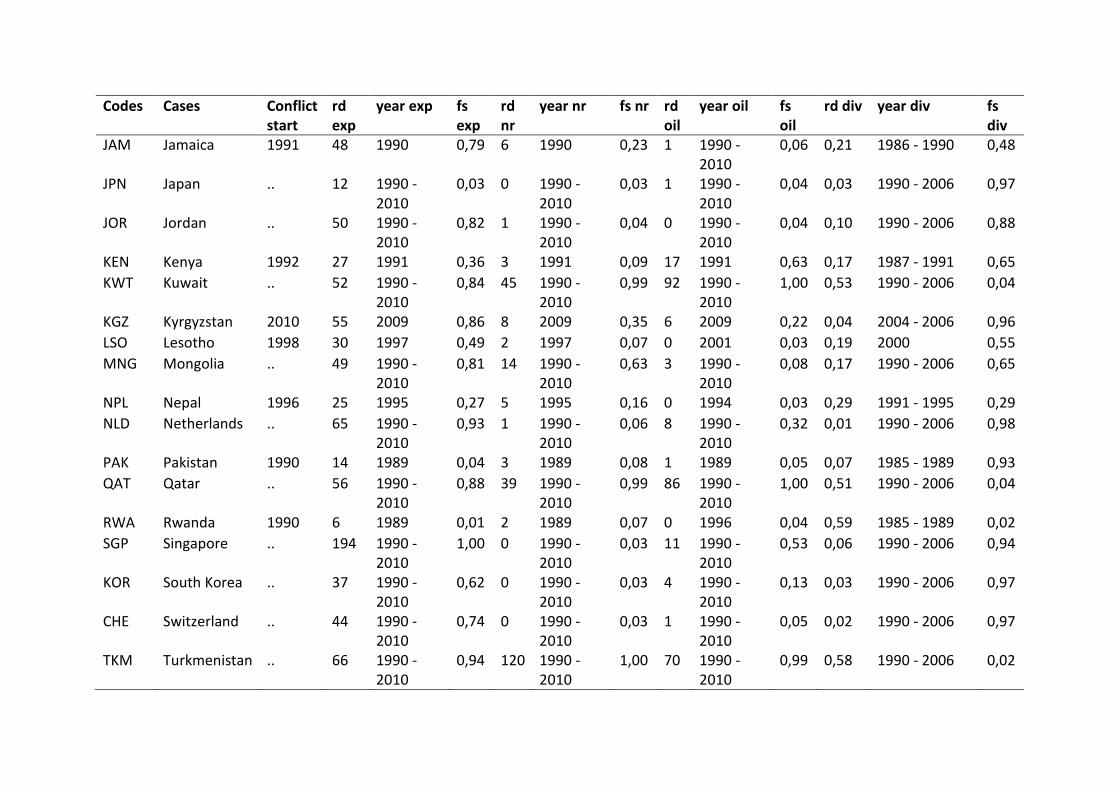
Codes Cases Conflict start
rd exp
year exp fs exp
rd nr
year nr fs nr rd oil
year oil fs oil
rd div year div fs div
JAM Jamaica 1991 48 1990 0,79 6 1990 0,23 1 1990 - 2010
0,06 0,21 1986 - 1990 0,48
JPN Japan .. 12 1990 -2010
0,03 0 1990 - 2010
0,03 1 1990 - 2010
0,04 0,03 1990 - 2006 0,97
JOR Jordan .. 50 1990 -2010
0,82 1 1990 - 2010
0,04 0 1990 - 2010
0,04 0,10 1990 - 2006 0,88
KEN Kenya 1992 27 1991 0,36 3 1991 0,09 17 1991 0,63 0,17 1987 - 1991 0,65
KWT Kuwait .. 52 1990 -2010
0,84 45 1990 - 2010
0,99 92 1990 - 2010
1,00 0,53 1990 - 2006 0,04
KGZ Kyrgyzstan 2010 55 2009 0,86 8 2009 0,35 6 2009 0,22 0,04 2004 - 2006 0,96
LSO Lesotho 1998 30 1997 0,49 2 1997 0,07 0 2001 0,03 0,19 2000 0,55
MNG Mongolia .. 49 1990 -2010
0,81 14 1990 - 2010
0,63 3 1990 - 2010
0,08 0,17 1990 - 2006 0,65
NPL Nepal 1996 25 1995 0,27 5 1995 0,16 0 1994 0,03 0,29 1991 - 1995 0,29
NLD Netherlands .. 65 1990 -2010
0,93 1 1990 - 2010
0,06 8 1990 - 2010
0,32 0,01 1990 - 2006 0,98
PAK Pakistan 1990 14 1989 0,04 3 1989 0,08 1 1989 0,05 0,07 1985 - 1989 0,93
QAT Qatar .. 56 1990 -2010
0,88 39 1990 - 2010
0,99 86 1990 - 2010
1,00 0,51 1990 - 2006 0,04
RWA Rwanda 1990 6 1989 0,01 2 1989 0,07 0 1996 0,04 0,59 1985 - 1989 0,02
SGP Singapore .. 194 1990 -2010
1,00 0 1990 - 2010
0,03 11 1990 - 2010
0,53 0,06 1990 - 2006 0,94
KOR South Korea .. 37 1990 -2010
0,62 0 1990 - 2010
0,03 4 1990 - 2010
0,13 0,03 1990 - 2006 0,97
CHE Switzerland .. 44 1990 -2010
0,74 0 1990 - 2010
0,03 1 1990 - 2010
0,05 0,02 1990 - 2006 0,97
TKM Turkmenistan .. 66 1990 -2010
0,94 120 1990 - 2010
1,00 70 1990 - 2010
0,99 0,58 1990 - 2006 0,02
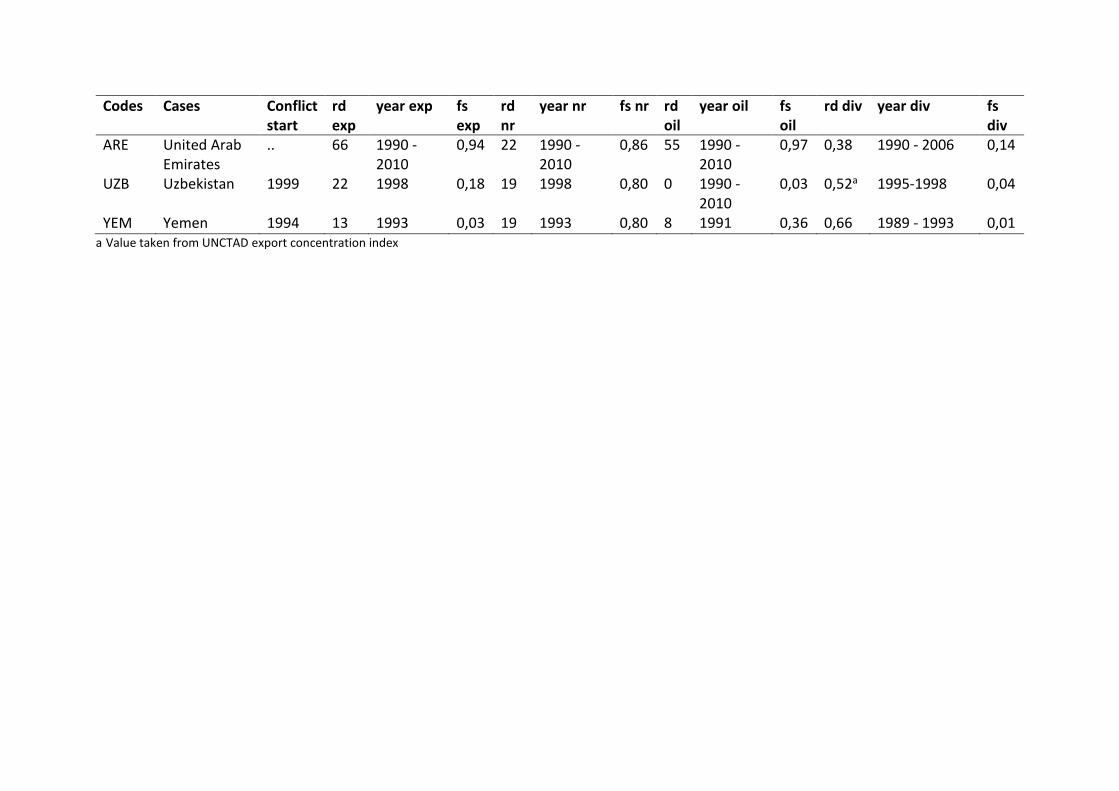
Codes Cases Conflict start
rd exp
year exp fs exp
rd nr
year nr fs nr rd oil
year oil fs oil
rd div year div fs div
ARE United Arab Emirates
.. 66 1990 -2010
0,94 22 1990 - 2010
0,86 55 1990 - 2010
0,97 0,38 1990 - 2006 0,14
UZB Uzbekistan 1999 22 1998 0,18 19 1998 0,80 0 1990 - 2010
0,03 0,52a 1995-1998 0,04
YEM Yemen 1994 13 1993 0,03 19 1993 0,80 8 1991 0,36 0,66 1989 - 1993 0,01 a Value taken from UNCTAD export concentration index
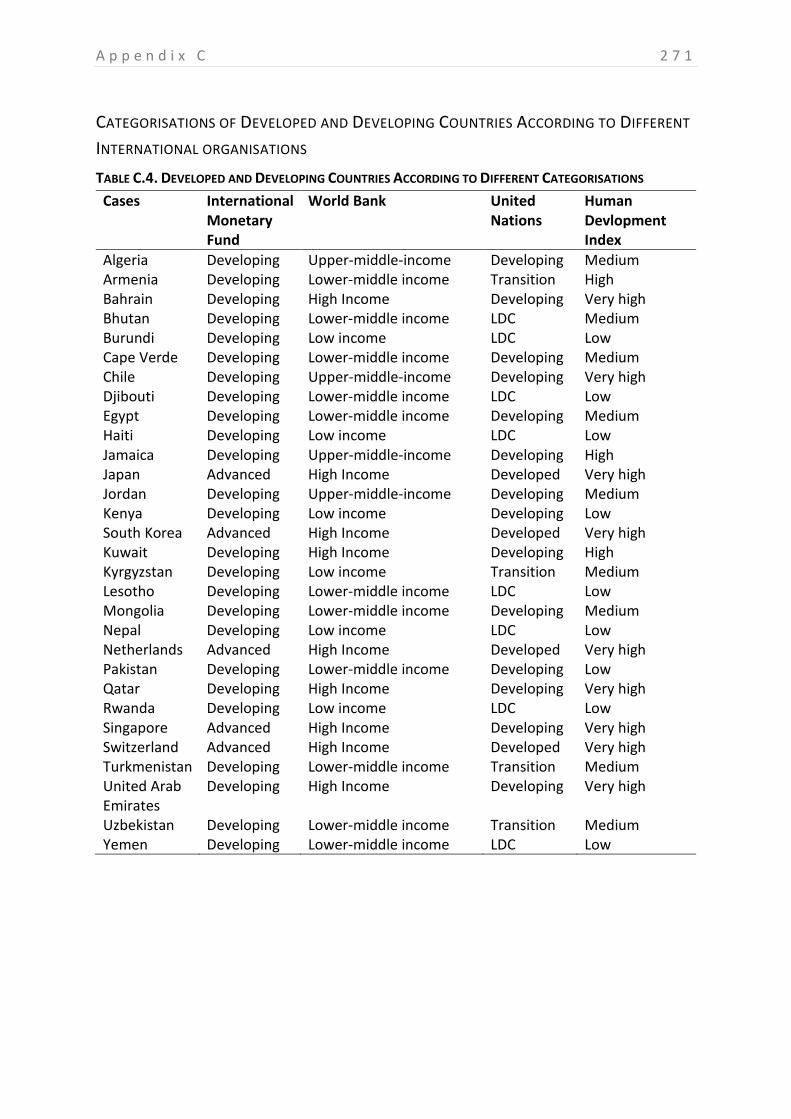
A p p e n d i x C 2 7 1
CATEGORISATIONS OF DEVELOPED AND DEVELOPING COUNTRIES ACCORDING TO DIFFERENT
INTERNATIONAL ORGANISATIONS
TABLE C.4. DEVELOPED AND DEVELOPING COUNTRIES ACCORDING TO DIFFERENT CATEGORISATIONS
Cases International Monetary Fund
World Bank United Nations
Human Devlopment Index
Algeria Developing Upper-middle-income Developing Medium Armenia Developing Lower-middle income Transition High Bahrain Developing High Income Developing Very high Bhutan Developing Lower-middle income LDC Medium Burundi Developing Low income LDC Low Cape Verde Developing Lower-middle income Developing Medium Chile Developing Upper-middle-income Developing Very high Djibouti Developing Lower-middle income LDC Low Egypt Developing Lower-middle income Developing Medium Haiti Developing Low income LDC Low Jamaica Developing Upper-middle-income Developing High Japan Advanced High Income Developed Very high Jordan Developing Upper-middle-income Developing Medium Kenya Developing Low income Developing Low South Korea Advanced High Income Developed Very high Kuwait Developing High Income Developing High Kyrgyzstan Developing Low income Transition Medium Lesotho Developing Lower-middle income LDC Low Mongolia Developing Lower-middle income Developing Medium Nepal Developing Low income LDC Low Netherlands Advanced High Income Developed Very high Pakistan Developing Lower-middle income Developing Low Qatar Developing High Income Developing Very high Rwanda Developing Low income LDC Low Singapore Advanced High Income Developing Very high Switzerland Advanced High Income Developed Very high Turkmenistan Developing Lower-middle income Transition Medium United Arab Emirates
Developing High Income Developing Very high
Uzbekistan Developing Lower-middle income Transition Medium Yemen Developing Lower-middle income LDC Low
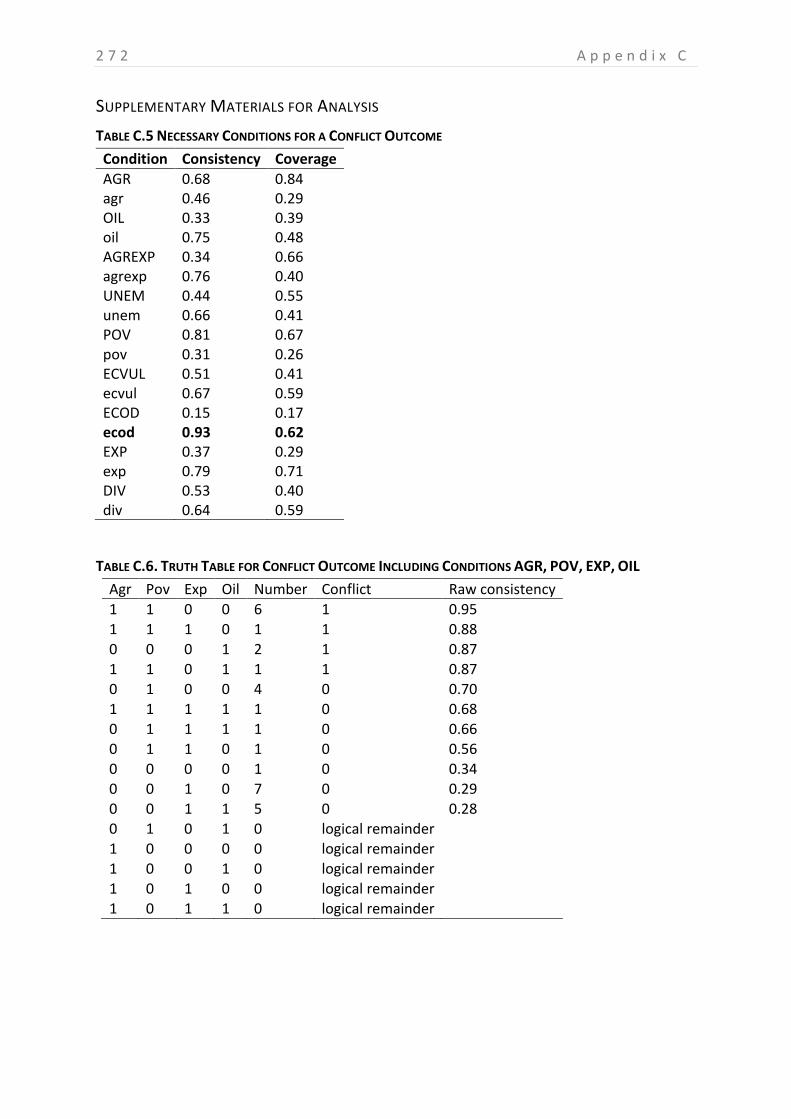
2 7 2 A p p e n d i x C
SUPPLEMENTARY MATERIALS FOR ANALYSIS
TABLE C.5 NECESSARY CONDITIONS FOR A CONFLICT OUTCOME
Condition Consistency Coverage
AGR 0.68 0.84 agr 0.46 0.29 OIL 0.33 0.39 oil 0.75 0.48 AGREXP 0.34 0.66 agrexp 0.76 0.40 UNEM 0.44 0.55 unem 0.66 0.41 POV 0.81 0.67 pov 0.31 0.26 ECVUL 0.51 0.41 ecvul 0.67 0.59 ECOD 0.15 0.17 ecod 0.93 0.62 EXP 0.37 0.29 exp 0.79 0.71 DIV 0.53 0.40 div 0.64 0.59
TABLE C.6. TRUTH TABLE FOR CONFLICT OUTCOME INCLUDING CONDITIONS AGR, POV, EXP, OIL
Agr Pov Exp Oil Number Conflict Raw consistency
1 1 0 0 6 1 0.95
1 1 1 0 1 1 0.88 0 0 0 1 2 1 0.87 1 1 0 1 1 1 0.87
0 1 0 0 4 0 0.70 1 1 1 1 1 0 0.68 0 1 1 1 1 0 0.66 0 1 1 0 1 0 0.56 0 0 0 0 1 0 0.34 0 0 1 0 7 0 0.29 0 0 1 1 5 0 0.28 0 1 0 1 0 logical remainder 1 0 0 0 0 logical remainder
1 0 0 1 0 logical remainder 1 0 1 0 0 logical remainder 1 0 1 1 0 logical remainder
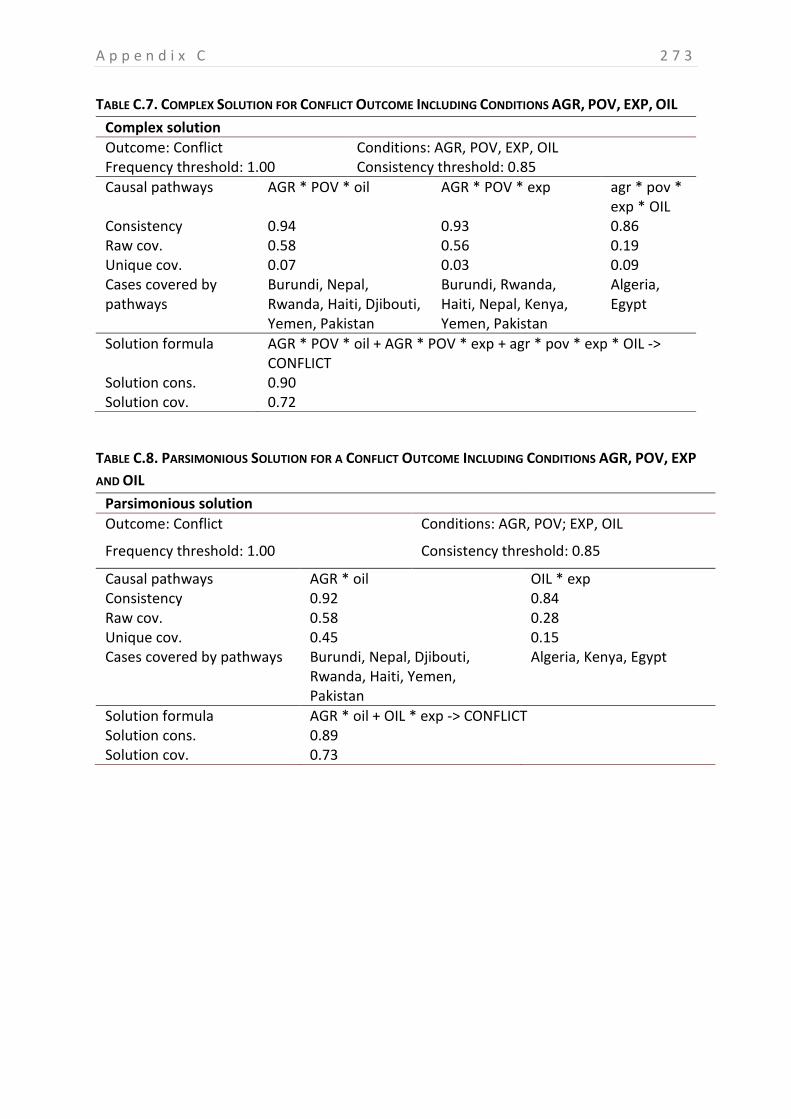
A p p e n d i x C 2 7 3
TABLE C.7. COMPLEX SOLUTION FOR CONFLICT OUTCOME INCLUDING CONDITIONS AGR, POV, EXP, OIL
Complex solution
Outcome: Conflict Conditions: AGR, POV, EXP, OIL Frequency threshold: 1.00 Consistency threshold: 0.85
Causal pathways AGR * POV * oil AGR * POV * exp agr * pov * exp * OIL
Consistency 0.94 0.93 0.86 Raw cov. 0.58 0.56 0.19 Unique cov. 0.07 0.03 0.09 Cases covered by pathways
Burundi, Nepal, Rwanda, Haiti, Djibouti, Yemen, Pakistan
Burundi, Rwanda, Haiti, Nepal, Kenya, Yemen, Pakistan
Algeria, Egypt
Solution formula AGR * POV * oil + AGR * POV * exp + agr * pov * exp * OIL -> CONFLICT
Solution cons. 0.90 Solution cov. 0.72
TABLE C.8. PARSIMONIOUS SOLUTION FOR A CONFLICT OUTCOME INCLUDING CONDITIONS AGR, POV, EXP
AND OIL
Parsimonious solution
Outcome: Conflict Conditions: AGR, POV; EXP, OIL
Frequency threshold: 1.00 Consistency threshold: 0.85
Causal pathways AGR * oil OIL * exp Consistency 0.92 0.84 Raw cov. 0.58 0.28 Unique cov. 0.45 0.15 Cases covered by pathways Burundi, Nepal, Djibouti,
Rwanda, Haiti, Yemen, Pakistan
Algeria, Kenya, Egypt
Solution formula AGR * oil + OIL * exp -> CONFLICT Solution cons. 0.89 Solution cov. 0.73
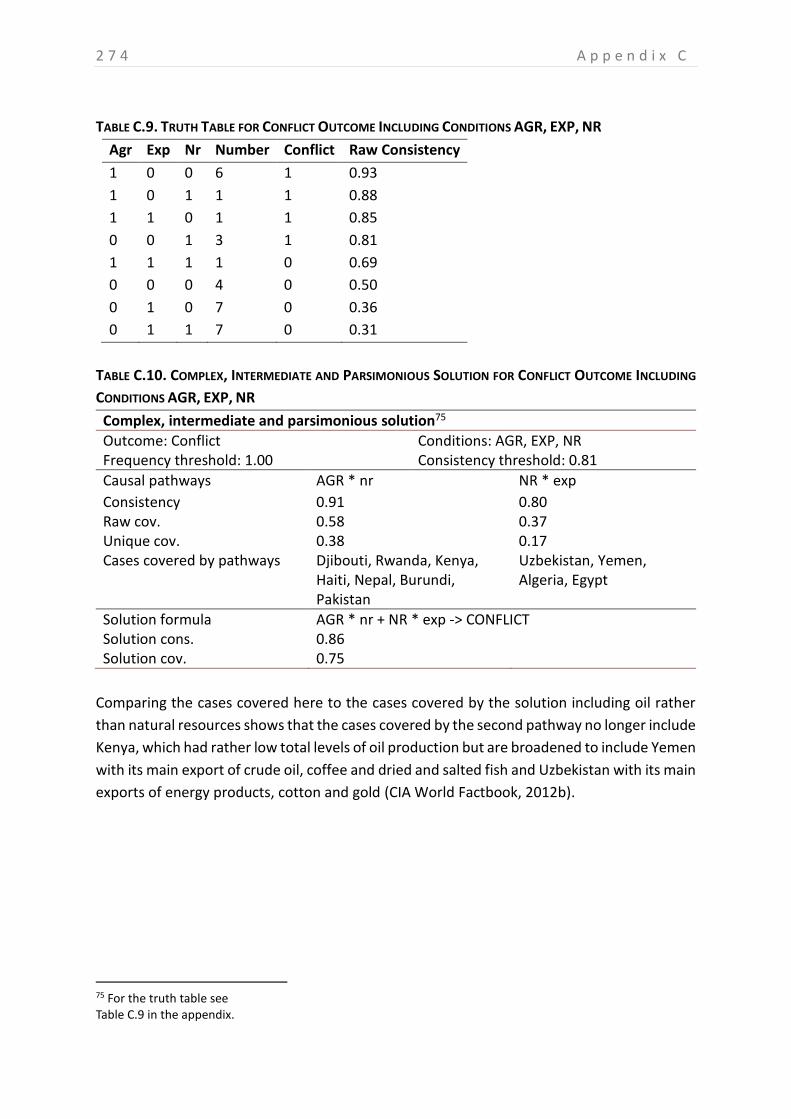
2 7 4 A p p e n d i x C
TABLE C.9. TRUTH TABLE FOR CONFLICT OUTCOME INCLUDING CONDITIONS AGR, EXP, NR
Agr Exp Nr Number Conflict Raw Consistency
1 0 0 6 1 0.93
1 0 1 1 1 0.88
1 1 0 1 1 0.85
0 0 1 3 1 0.81
1 1 1 1 0 0.69
0 0 0 4 0 0.50
0 1 0 7 0 0.36
0 1 1 7 0 0.31
TABLE C.10. COMPLEX, INTERMEDIATE AND PARSIMONIOUS SOLUTION FOR CONFLICT OUTCOME INCLUDING
CONDITIONS AGR, EXP, NR
Complex, intermediate and parsimonious solution75
Outcome: Conflict Conditions: AGR, EXP, NR Frequency threshold: 1.00 Consistency threshold: 0.81
Causal pathways AGR * nr NR * exp
Consistency 0.91 0.80 Raw cov. 0.58 0.37 Unique cov. 0.38 0.17 Cases covered by pathways Djibouti, Rwanda, Kenya,
Haiti, Nepal, Burundi, Pakistan
Uzbekistan, Yemen, Algeria, Egypt
Solution formula AGR * nr + NR * exp -> CONFLICT Solution cons. 0.86 Solution cov. 0.75
Comparing the cases covered here to the cases covered by the solution including oil rather
than natural resources shows that the cases covered by the second pathway no longer include
Kenya, which had rather low total levels of oil production but are broadened to include Yemen
with its main export of crude oil, coffee and dried and salted fish and Uzbekistan with its main
exports of energy products, cotton and gold (CIA World Factbook, 2012b).
75 For the truth table see Table C.9 in the appendix.
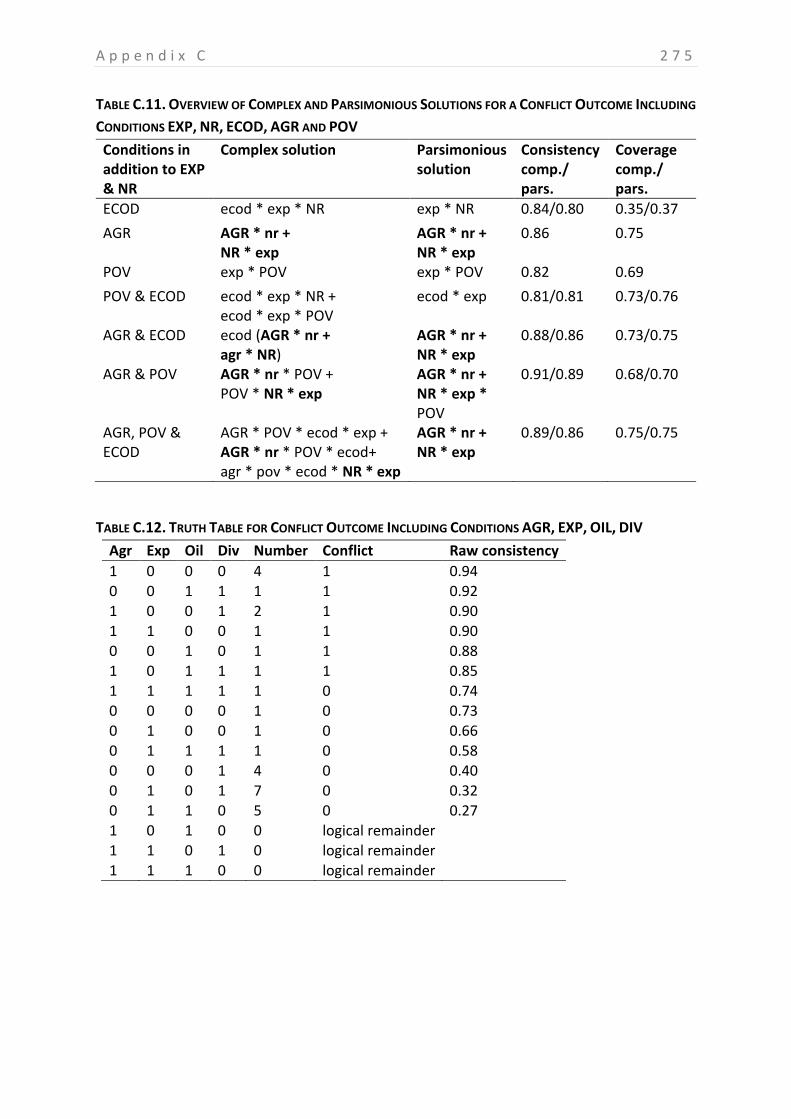
A p p e n d i x C 2 7 5
TABLE C.11. OVERVIEW OF COMPLEX AND PARSIMONIOUS SOLUTIONS FOR A CONFLICT OUTCOME INCLUDING
CONDITIONS EXP, NR, ECOD, AGR AND POV
Conditions in addition to EXP & NR
Complex solution Parsimonious solution
Consistency comp./ pars.
Coverage comp./ pars.
ECOD ecod * exp * NR exp * NR 0.84/0.80 0.35/0.37
AGR AGR * nr + NR * exp
AGR * nr + NR * exp
0.86 0.75
POV exp * POV exp * POV 0.82 0.69
POV & ECOD ecod * exp * NR + ecod * exp * POV
ecod * exp 0.81/0.81 0.73/0.76
AGR & ECOD ecod (AGR * nr + agr * NR)
AGR * nr + NR * exp
0.88/0.86 0.73/0.75
AGR & POV AGR * nr * POV + POV * NR * exp
AGR * nr + NR * exp * POV
0.91/0.89 0.68/0.70
AGR, POV & ECOD
AGR * POV * ecod * exp + AGR * nr * POV * ecod+ agr * pov * ecod * NR * exp
AGR * nr + NR * exp
0.89/0.86 0.75/0.75
TABLE C.12. TRUTH TABLE FOR CONFLICT OUTCOME INCLUDING CONDITIONS AGR, EXP, OIL, DIV
Agr Exp Oil Div Number Conflict Raw consistency
1 0 0 0 4 1 0.94 0 0 1 1 1 1 0.92 1 0 0 1 2 1 0.90
1 1 0 0 1 1 0.90 0 0 1 0 1 1 0.88 1 0 1 1 1 1 0.85 1 1 1 1 1 0 0.74 0 0 0 0 1 0 0.73 0 1 0 0 1 0 0.66 0 1 1 1 1 0 0.58 0 0 0 1 4 0 0.40 0 1 0 1 7 0 0.32 0 1 1 0 5 0 0.27 1 0 1 0 0 logical remainder 1 1 0 1 0 logical remainder
1 1 1 0 0 logical remainder
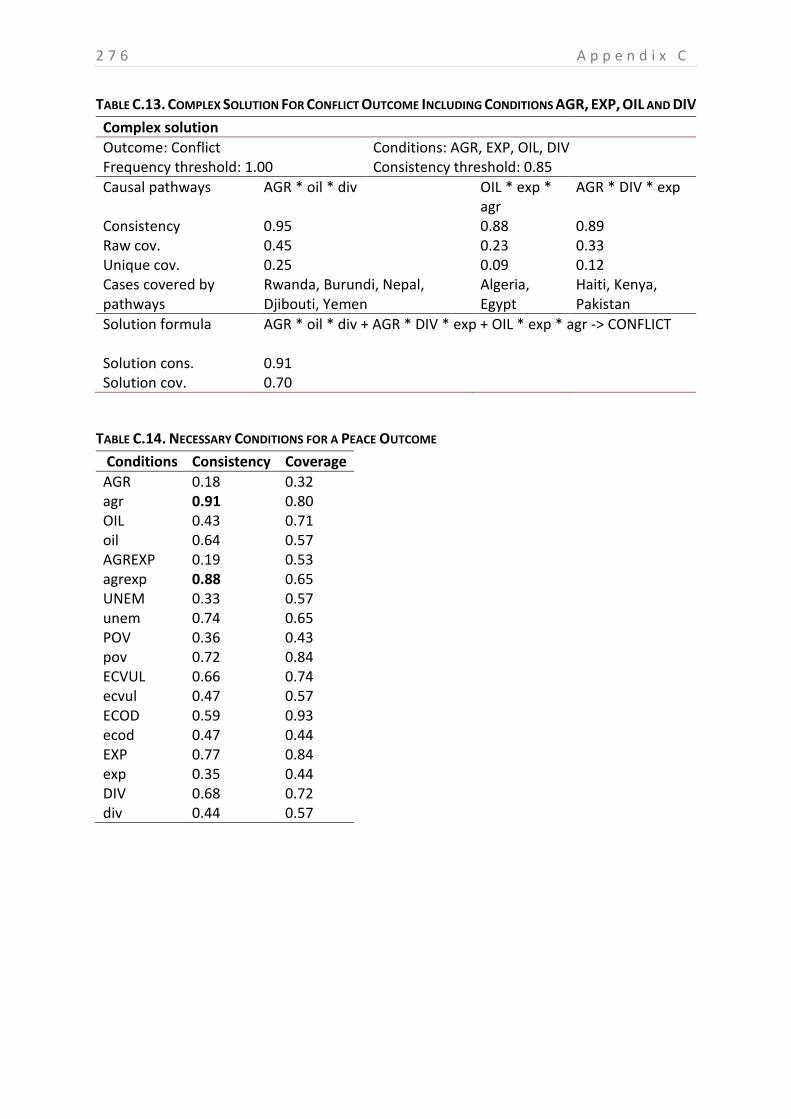
2 7 6 A p p e n d i x C
TABLE C.13. COMPLEX SOLUTION FOR CONFLICT OUTCOME INCLUDING CONDITIONS AGR, EXP, OIL AND DIV
Complex solution
Outcome: Conflict Conditions: AGR, EXP, OIL, DIV Frequency threshold: 1.00 Consistency threshold: 0.85
Causal pathways AGR * oil * div OIL * exp * agr
AGR * DIV * exp
Consistency 0.95 0.88 0.89 Raw cov. 0.45 0.23 0.33 Unique cov. 0.25 0.09 0.12 Cases covered by pathways
Rwanda, Burundi, Nepal, Djibouti, Yemen
Algeria, Egypt
Haiti, Kenya, Pakistan
Solution formula AGR * oil * div + AGR * DIV * exp + OIL * exp * agr -> CONFLICT
Solution cons. 0.91 Solution cov. 0.70
TABLE C.14. NECESSARY CONDITIONS FOR A PEACE OUTCOME
Conditions Consistency Coverage
AGR 0.18 0.32 agr 0.91 0.80 OIL 0.43 0.71 oil 0.64 0.57 AGREXP 0.19 0.53 agrexp 0.88 0.65 UNEM 0.33 0.57 unem 0.74 0.65 POV 0.36 0.43 pov 0.72 0.84 ECVUL 0.66 0.74 ecvul 0.47 0.57 ECOD 0.59 0.93 ecod 0.47 0.44 EXP 0.77 0.84 exp 0.35 0.44 DIV 0.68 0.72 div 0.44 0.57
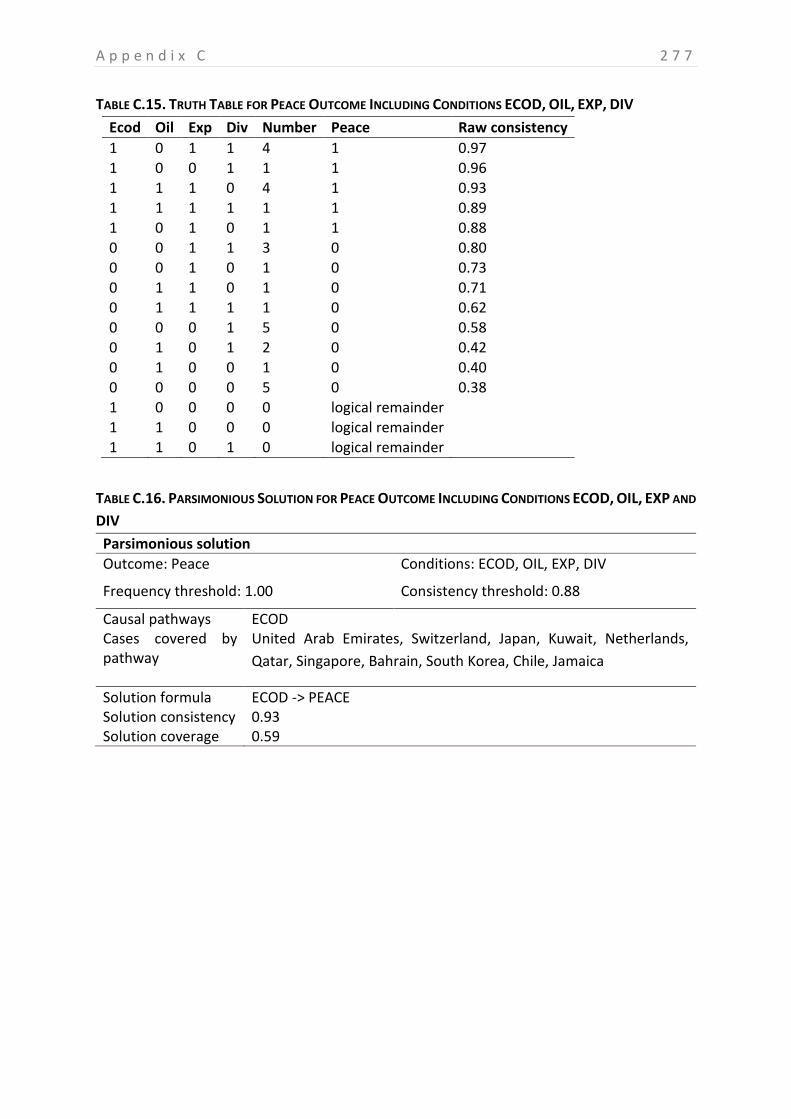
A p p e n d i x C 2 7 7
TABLE C.15. TRUTH TABLE FOR PEACE OUTCOME INCLUDING CONDITIONS ECOD, OIL, EXP, DIV
Ecod Oil Exp Div Number Peace Raw consistency
1 0 1 1 4 1 0.97 1 0 0 1 1 1 0.96 1 1 1 0 4 1 0.93 1 1 1 1 1 1 0.89 1 0 1 0 1 1 0.88 0 0 1 1 3 0 0.80 0 0 1 0 1 0 0.73 0 1 1 0 1 0 0.71 0 1 1 1 1 0 0.62 0 0 0 1 5 0 0.58 0 1 0 1 2 0 0.42
0 1 0 0 1 0 0.40 0 0 0 0 5 0 0.38 1 0 0 0 0 logical remainder 1 1 0 0 0 logical remainder
1 1 0 1 0 logical remainder
TABLE C.16. PARSIMONIOUS SOLUTION FOR PEACE OUTCOME INCLUDING CONDITIONS ECOD, OIL, EXP AND
DIV
Parsimonious solution
Outcome: Peace Conditions: ECOD, OIL, EXP, DIV
Frequency threshold: 1.00 Consistency threshold: 0.88
Causal pathways ECOD Cases covered by pathway
United Arab Emirates, Switzerland, Japan, Kuwait, Netherlands,
Qatar, Singapore, Bahrain, South Korea, Chile, Jamaica
Solution formula ECOD -> PEACE Solution consistency 0.93 Solution coverage 0.59
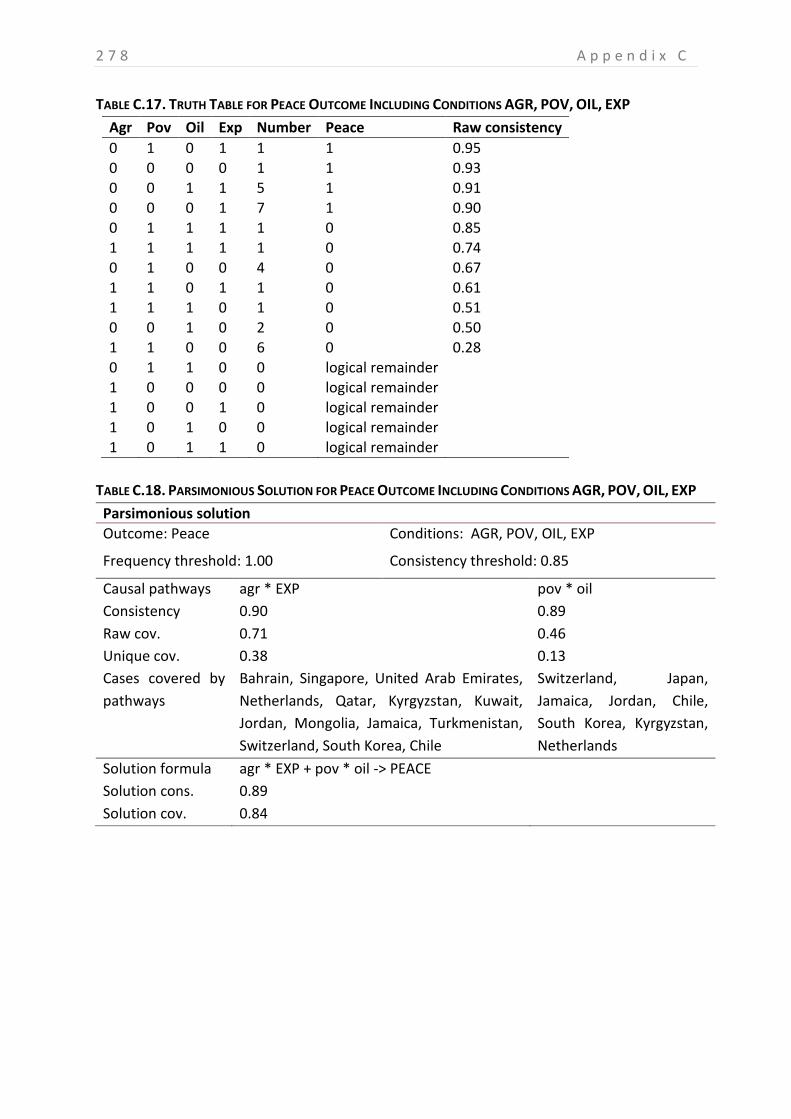
2 7 8 A p p e n d i x C
TABLE C.17. TRUTH TABLE FOR PEACE OUTCOME INCLUDING CONDITIONS AGR, POV, OIL, EXP
Agr Pov Oil Exp Number Peace Raw consistency
0 1 0 1 1 1 0.95 0 0 0 0 1 1 0.93 0 0 1 1 5 1 0.91 0 0 0 1 7 1 0.90 0 1 1 1 1 0 0.85 1 1 1 1 1 0 0.74 0 1 0 0 4 0 0.67 1 1 0 1 1 0 0.61 1 1 1 0 1 0 0.51 0 0 1 0 2 0 0.50 1 1 0 0 6 0 0.28
0 1 1 0 0 logical remainder 1 0 0 0 0 logical remainder 1 0 0 1 0 logical remainder 1 0 1 0 0 logical remainder
1 0 1 1 0 logical remainder
TABLE C.18. PARSIMONIOUS SOLUTION FOR PEACE OUTCOME INCLUDING CONDITIONS AGR, POV, OIL, EXP
Parsimonious solution
Outcome: Peace Conditions: AGR, POV, OIL, EXP
Frequency threshold: 1.00 Consistency threshold: 0.85
Causal pathways agr * EXP pov * oil
Consistency 0.90 0.89
Raw cov. 0.71 0.46
Unique cov. 0.38 0.13
Cases covered by
pathways
Bahrain, Singapore, United Arab Emirates,
Netherlands, Qatar, Kyrgyzstan, Kuwait,
Jordan, Mongolia, Jamaica, Turkmenistan,
Switzerland, South Korea, Chile
Switzerland, Japan,
Jamaica, Jordan, Chile,
South Korea, Kyrgyzstan,
Netherlands
Solution formula agr * EXP + pov * oil -> PEACE
Solution cons. 0.89
Solution cov. 0.84
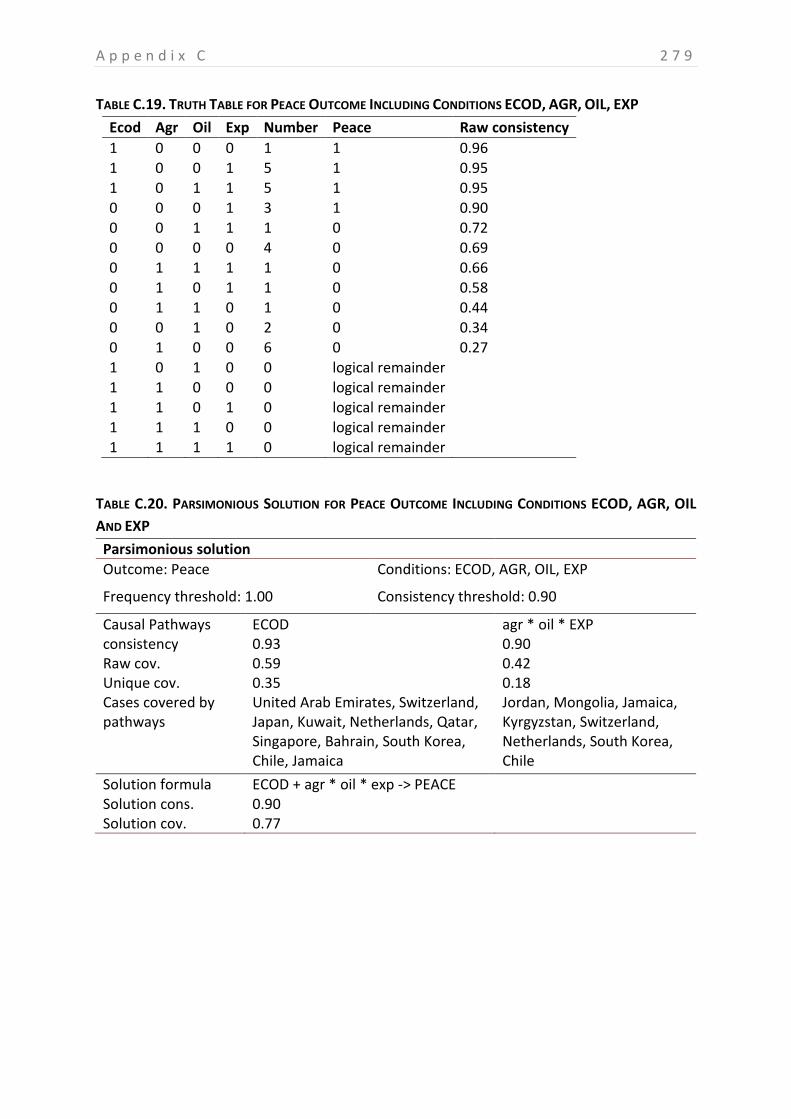
A p p e n d i x C 2 7 9
TABLE C.19. TRUTH TABLE FOR PEACE OUTCOME INCLUDING CONDITIONS ECOD, AGR, OIL, EXP
Ecod Agr Oil Exp Number Peace Raw consistency
1 0 0 0 1 1 0.96 1 0 0 1 5 1 0.95 1 0 1 1 5 1 0.95 0 0 0 1 3 1 0.90 0 0 1 1 1 0 0.72 0 0 0 0 4 0 0.69 0 1 1 1 1 0 0.66 0 1 0 1 1 0 0.58 0 1 1 0 1 0 0.44 0 0 1 0 2 0 0.34 0 1 0 0 6 0 0.27
1 0 1 0 0 logical remainder 1 1 0 0 0 logical remainder 1 1 0 1 0 logical remainder 1 1 1 0 0 logical remainder
1 1 1 1 0 logical remainder
TABLE C.20. PARSIMONIOUS SOLUTION FOR PEACE OUTCOME INCLUDING CONDITIONS ECOD, AGR, OIL
AND EXP
Parsimonious solution
Outcome: Peace Conditions: ECOD, AGR, OIL, EXP
Frequency threshold: 1.00 Consistency threshold: 0.90
Causal Pathways ECOD agr * oil * EXP consistency 0.93 0.90 Raw cov. 0.59 0.42 Unique cov. 0.35 0.18 Cases covered by pathways
United Arab Emirates, Switzerland, Japan, Kuwait, Netherlands, Qatar, Singapore, Bahrain, South Korea, Chile, Jamaica
Jordan, Mongolia, Jamaica, Kyrgyzstan, Switzerland, Netherlands, South Korea, Chile
Solution formula ECOD + agr * oil * exp -> PEACE Solution cons. 0.90 Solution cov. 0.77
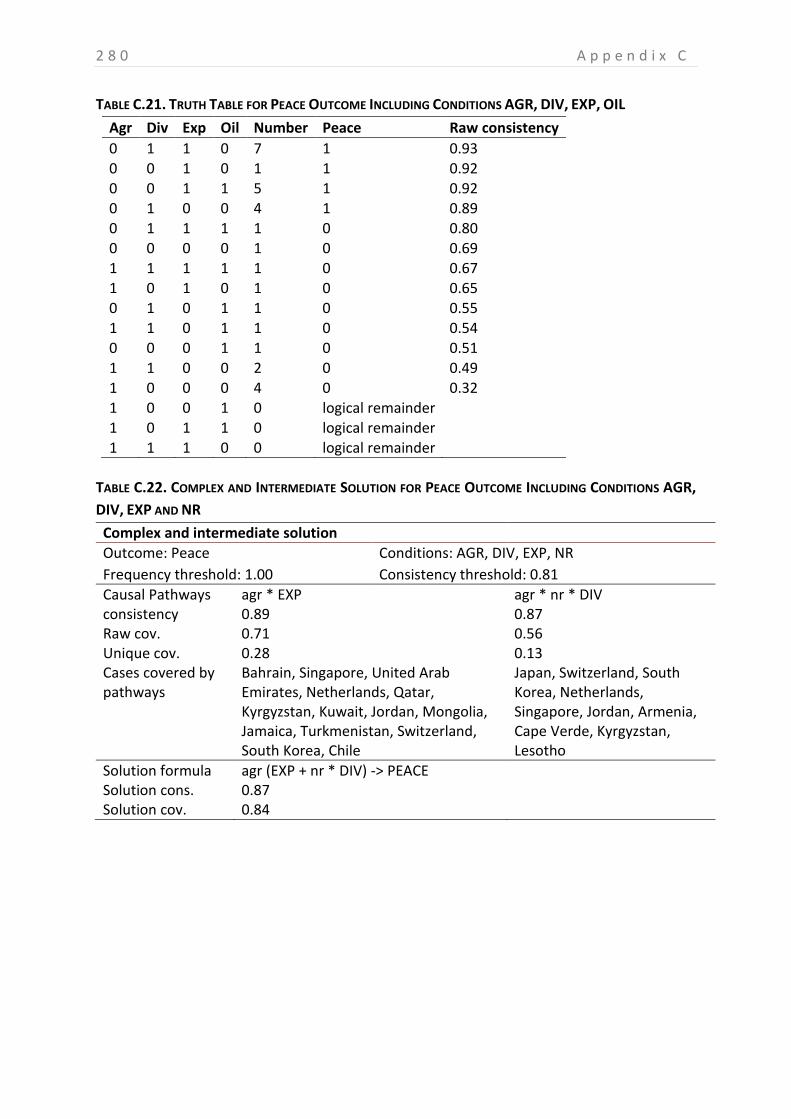
2 8 0 A p p e n d i x C
TABLE C.21. TRUTH TABLE FOR PEACE OUTCOME INCLUDING CONDITIONS AGR, DIV, EXP, OIL
Agr Div Exp Oil Number Peace Raw consistency
0 1 1 0 7 1 0.93 0 0 1 0 1 1 0.92 0 0 1 1 5 1 0.92 0 1 0 0 4 1 0.89 0 1 1 1 1 0 0.80 0 0 0 0 1 0 0.69 1 1 1 1 1 0 0.67 1 0 1 0 1 0 0.65 0 1 0 1 1 0 0.55 1 1 0 1 1 0 0.54 0 0 0 1 1 0 0.51
1 1 0 0 2 0 0.49 1 0 0 0 4 0 0.32 1 0 0 1 0 logical remainder 1 0 1 1 0 logical remainder 1 1 1 0 0 logical remainder
TABLE C.22. COMPLEX AND INTERMEDIATE SOLUTION FOR PEACE OUTCOME INCLUDING CONDITIONS AGR,
DIV, EXP AND NR
Complex and intermediate solution
Outcome: Peace Conditions: AGR, DIV, EXP, NR
Frequency threshold: 1.00 Consistency threshold: 0.81
Causal Pathways agr * EXP agr * nr * DIV consistency 0.89 0.87 Raw cov. 0.71 0.56 Unique cov. 0.28 0.13 Cases covered by pathways
Bahrain, Singapore, United Arab Emirates, Netherlands, Qatar, Kyrgyzstan, Kuwait, Jordan, Mongolia, Jamaica, Turkmenistan, Switzerland, South Korea, Chile
Japan, Switzerland, South Korea, Netherlands, Singapore, Jordan, Armenia, Cape Verde, Kyrgyzstan, Lesotho
Solution formula agr (EXP + nr * DIV) -> PEACE Solution cons. 0.87 Solution cov. 0.84
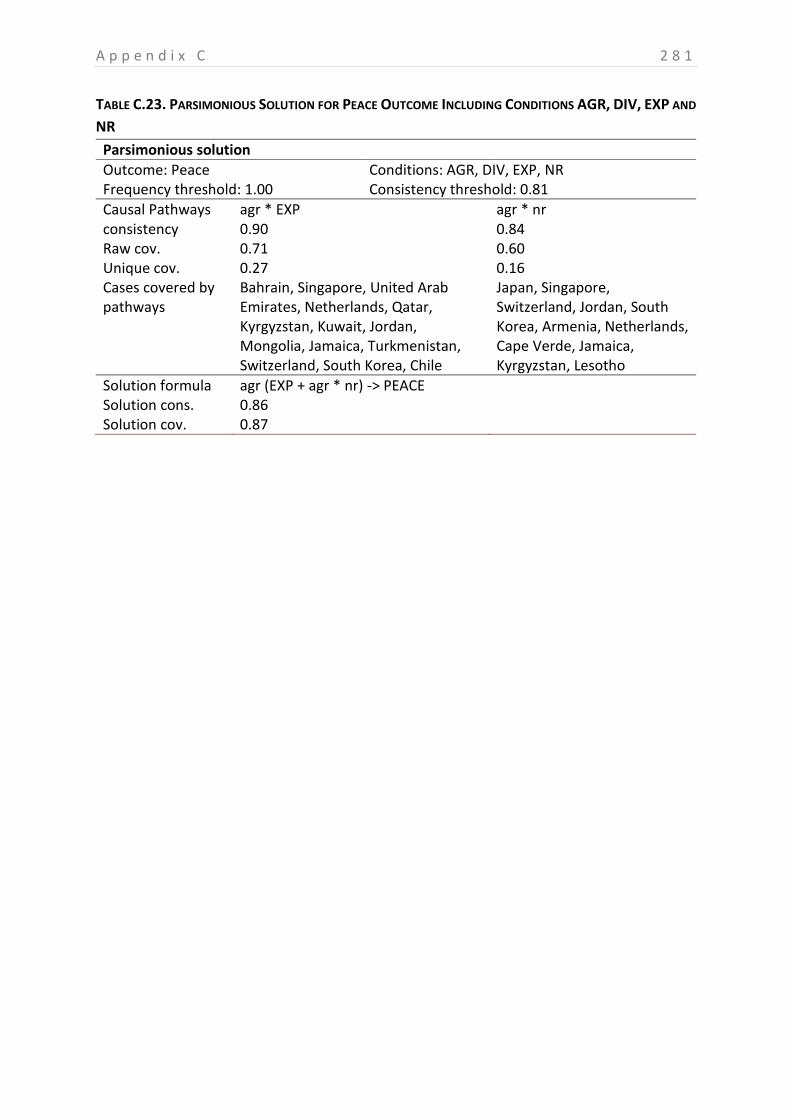
A p p e n d i x C 2 8 1
TABLE C.23. PARSIMONIOUS SOLUTION FOR PEACE OUTCOME INCLUDING CONDITIONS AGR, DIV, EXP AND
NR
Parsimonious solution
Outcome: Peace Conditions: AGR, DIV, EXP, NR Frequency threshold: 1.00 Consistency threshold: 0.81
Causal Pathways agr * EXP agr * nr consistency 0.90 0.84 Raw cov. 0.71 0.60 Unique cov. 0.27 0.16 Cases covered by pathways
Bahrain, Singapore, United Arab Emirates, Netherlands, Qatar, Kyrgyzstan, Kuwait, Jordan, Mongolia, Jamaica, Turkmenistan, Switzerland, South Korea, Chile
Japan, Singapore, Switzerland, Jordan, South Korea, Armenia, Netherlands, Cape Verde, Jamaica, Kyrgyzstan, Lesotho
Solution formula agr (EXP + agr * nr) -> PEACE Solution cons. 0.86 Solution cov. 0.87
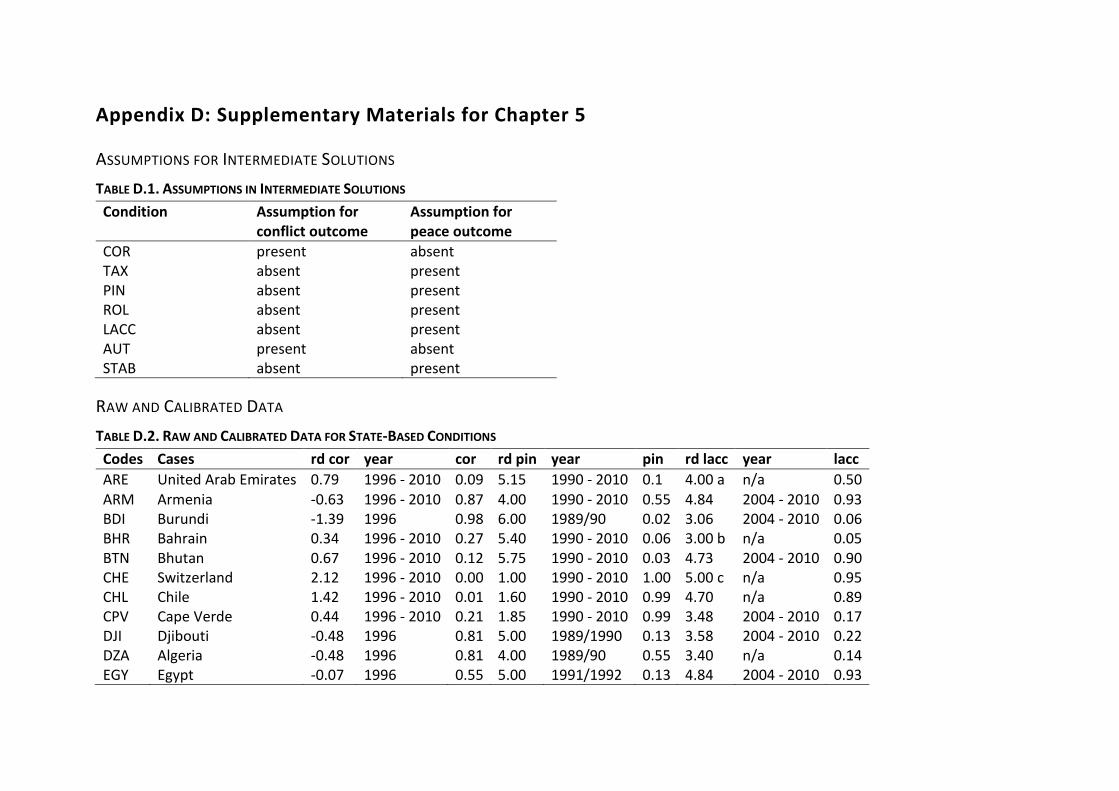
Appendix D: Supplementary Materials for Chapter 5
ASSUMPTIONS FOR INTERMEDIATE SOLUTIONS
TABLE D.1. ASSUMPTIONS IN INTERMEDIATE SOLUTIONS
Condition Assumption for conflict outcome
Assumption for peace outcome
COR present absent TAX absent present PIN absent present ROL absent present LACC absent present AUT present absent STAB absent present
RAW AND CALIBRATED DATA
TABLE D.2. RAW AND CALIBRATED DATA FOR STATE-BASED CONDITIONS
Codes Cases rd cor year cor rd pin year pin rd lacc year lacc
ARE United Arab Emirates 0.79 1996 - 2010 0.09 5.15 1990 - 2010 0.1 4.00 a n/a 0.50 ARM Armenia -0.63 1996 - 2010 0.87 4.00 1990 - 2010 0.55 4.84 2004 - 2010 0.93 BDI Burundi -1.39 1996 0.98 6.00 1989/90 0.02 3.06 2004 - 2010 0.06 BHR Bahrain 0.34 1996 - 2010 0.27 5.40 1990 - 2010 0.06 3.00 b n/a 0.05 BTN Bhutan 0.67 1996 - 2010 0.12 5.75 1990 - 2010 0.03 4.73 2004 - 2010 0.90 CHE Switzerland 2.12 1996 - 2010 0.00 1.00 1990 - 2010 1.00 5.00 c n/a 0.95 CHL Chile 1.42 1996 - 2010 0.01 1.60 1990 - 2010 0.99 4.70 n/a 0.89 CPV Cape Verde 0.44 1996 - 2010 0.21 1.85 1990 - 2010 0.99 3.48 2004 - 2010 0.17 DJI Djibouti -0.48 1996 0.81 5.00 1989/1990 0.13 3.58 2004 - 2010 0.22 DZA Algeria -0.48 1996 0.81 4.00 1989/90 0.55 3.40 n/a 0.14 EGY Egypt -0.07 1996 0.55 5.00 1991/1992 0.13 4.84 2004 - 2010 0.93
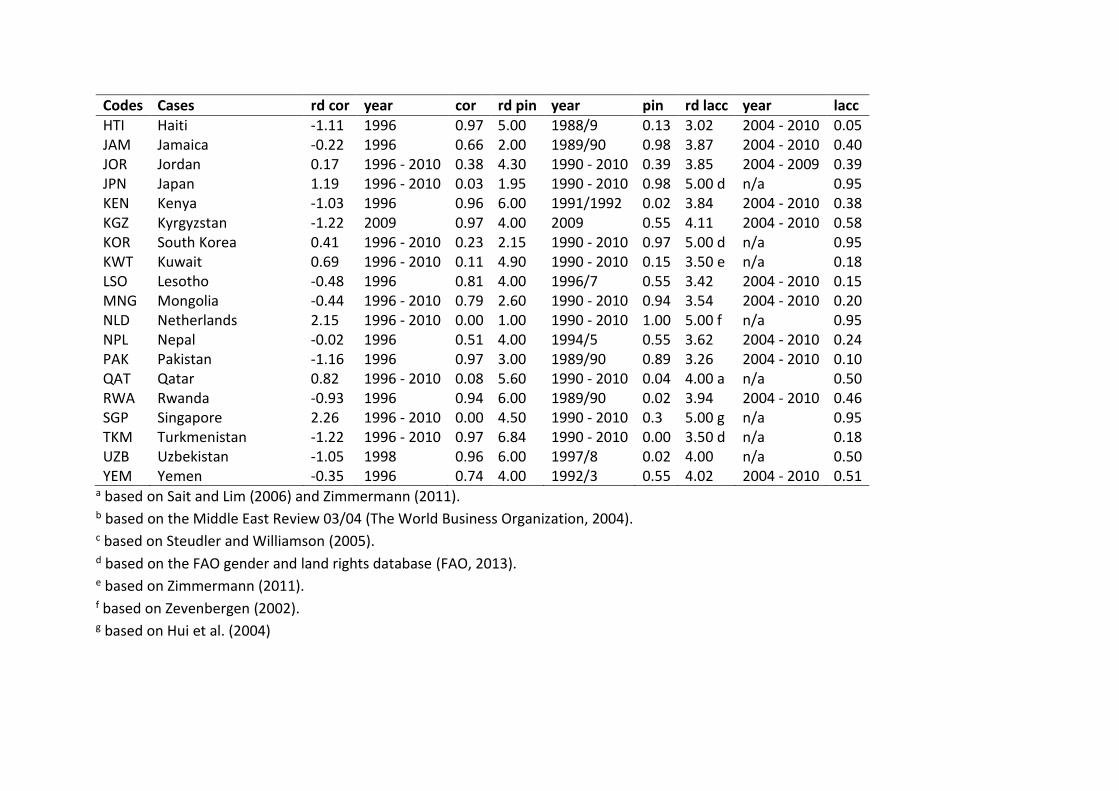
Codes Cases rd cor year cor rd pin year pin rd lacc year lacc HTI Haiti -1.11 1996 0.97 5.00 1988/9 0.13 3.02 2004 - 2010 0.05 JAM Jamaica -0.22 1996 0.66 2.00 1989/90 0.98 3.87 2004 - 2010 0.40 JOR Jordan 0.17 1996 - 2010 0.38 4.30 1990 - 2010 0.39 3.85 2004 - 2009 0.39 JPN Japan 1.19 1996 - 2010 0.03 1.95 1990 - 2010 0.98 5.00 d n/a 0.95 KEN Kenya -1.03 1996 0.96 6.00 1991/1992 0.02 3.84 2004 - 2010 0.38 KGZ Kyrgyzstan -1.22 2009 0.97 4.00 2009 0.55 4.11 2004 - 2010 0.58 KOR South Korea 0.41 1996 - 2010 0.23 2.15 1990 - 2010 0.97 5.00 d n/a 0.95 KWT Kuwait 0.69 1996 - 2010 0.11 4.90 1990 - 2010 0.15 3.50 e n/a 0.18 LSO Lesotho -0.48 1996 0.81 4.00 1996/7 0.55 3.42 2004 - 2010 0.15 MNG Mongolia -0.44 1996 - 2010 0.79 2.60 1990 - 2010 0.94 3.54 2004 - 2010 0.20 NLD Netherlands 2.15 1996 - 2010 0.00 1.00 1990 - 2010 1.00 5.00 f n/a 0.95 NPL Nepal -0.02 1996 0.51 4.00 1994/5 0.55 3.62 2004 - 2010 0.24 PAK Pakistan -1.16 1996 0.97 3.00 1989/90 0.89 3.26 2004 - 2010 0.10 QAT Qatar 0.82 1996 - 2010 0.08 5.60 1990 - 2010 0.04 4.00 a n/a 0.50 RWA Rwanda -0.93 1996 0.94 6.00 1989/90 0.02 3.94 2004 - 2010 0.46 SGP Singapore 2.26 1996 - 2010 0.00 4.50 1990 - 2010 0.3 5.00 g n/a 0.95 TKM Turkmenistan -1.22 1996 - 2010 0.97 6.84 1990 - 2010 0.00 3.50 d n/a 0.18 UZB Uzbekistan -1.05 1998 0.96 6.00 1997/8 0.02 4.00 n/a 0.50 YEM Yemen -0.35 1996 0.74 4.00 1992/3 0.55 4.02 2004 - 2010 0.51
a based on Sait and Lim (2006) and Zimmermann (2011). b based on the Middle East Review 03/04 (The World Business Organization, 2004). c based on Steudler and Williamson (2005). d based on the FAO gender and land rights database (FAO, 2013). e based on Zimmermann (2011). f based on Zevenbergen (2002). g based on Hui et al. (2004)
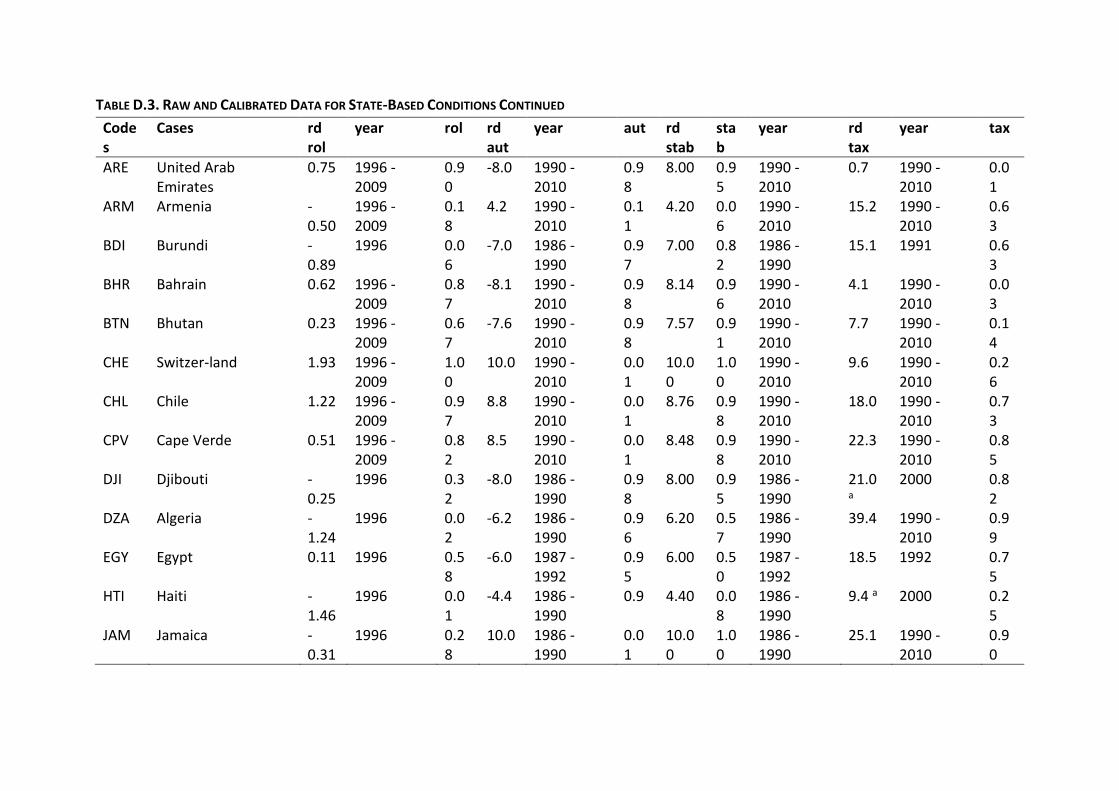
TABLE D.3. RAW AND CALIBRATED DATA FOR STATE-BASED CONDITIONS CONTINUED
Codes
Cases rd rol
year rol rd aut
year aut rd stab
stab
year rd tax
year tax
ARE United Arab Emirates
0.75 1996 - 2009
0.90
-8.0 1990 - 2010
0.98
8.00 0.95
1990 - 2010
0.7 1990 - 2010
0.01
ARM Armenia -0.50
1996 - 2009
0.18
4.2 1990 - 2010
0.11
4.20 0.06
1990 - 2010
15.2 1990 - 2010
0.63
BDI Burundi -0.89
1996 0.06
-7.0 1986 - 1990
0.97
7.00 0.82
1986 - 1990
15.1 1991 0.63
BHR Bahrain 0.62 1996 - 2009
0.87
-8.1 1990 - 2010
0.98
8.14 0.96
1990 - 2010
4.1 1990 - 2010
0.03
BTN Bhutan 0.23 1996 - 2009
0.67
-7.6 1990 - 2010
0.98
7.57 0.91
1990 - 2010
7.7 1990 - 2010
0.14
CHE Switzer-land 1.93 1996 - 2009
1.00
10.0 1990 - 2010
0.01
10.00
1.00
1990 - 2010
9.6 1990 - 2010
0.26
CHL Chile 1.22 1996 - 2009
0.97
8.8 1990 - 2010
0.01
8.76 0.98
1990 - 2010
18.0 1990 - 2010
0.73
CPV Cape Verde 0.51 1996 - 2009
0.82
8.5 1990 - 2010
0.01
8.48 0.98
1990 - 2010
22.3 1990 - 2010
0.85
DJI Djibouti -0.25
1996 0.32
-8.0 1986 - 1990
0.98
8.00 0.95
1986 - 1990
21.0 a
2000 0.82
DZA Algeria -1.24
1996 0.02
-6.2 1986 - 1990
0.96
6.20 0.57
1986 - 1990
39.4 1990 - 2010
0.99
EGY Egypt 0.11 1996 0.58
-6.0 1987 - 1992
0.95
6.00 0.50
1987 - 1992
18.5 1992 0.75
HTI Haiti -1.46
1996 0.01
-4.4 1986 - 1990
0.9 4.40 0.08
1986 - 1990
9.4 a 2000 0.25
JAM Jamaica -0.31
1996 0.28
10.0 1986 - 1990
0.01
10.00
1.00
1986 - 1990
25.1 1990 - 2010
0.90
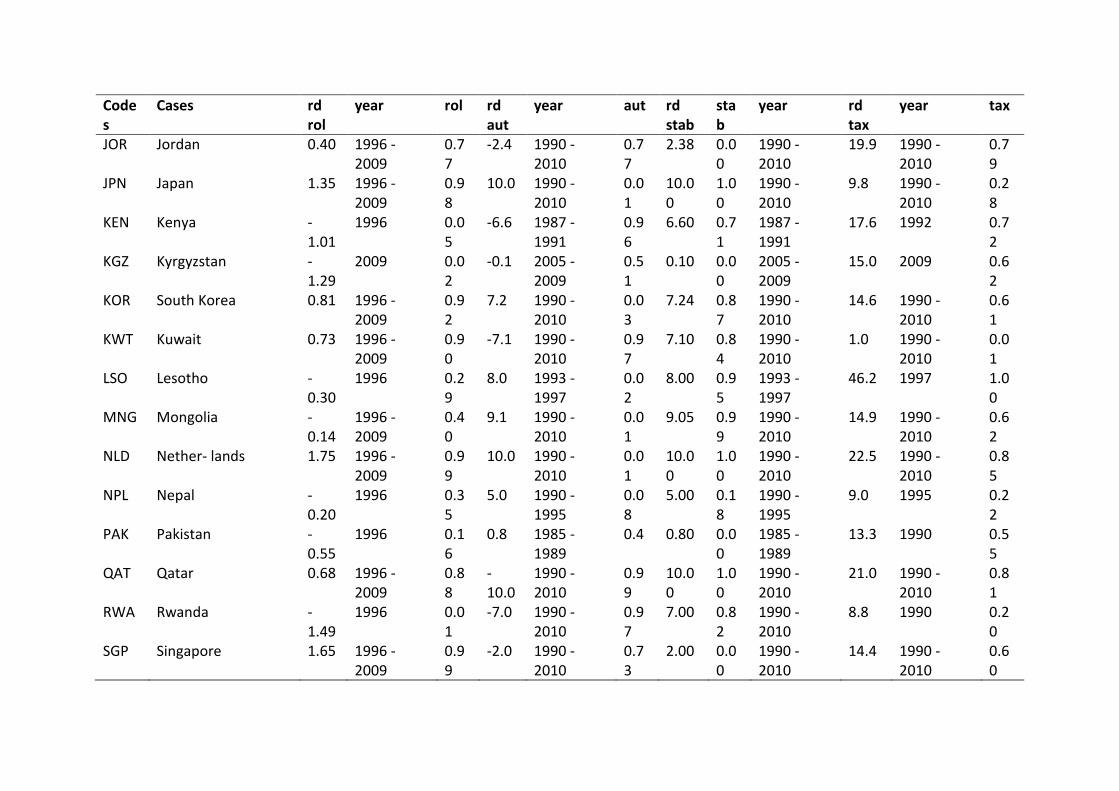
Codes
Cases rd rol
year rol rd aut
year aut rd stab
stab
year rd tax
year tax
JOR Jordan 0.40 1996 - 2009
0.77
-2.4 1990 - 2010
0.77
2.38 0.00
1990 - 2010
19.9 1990 - 2010
0.79
JPN Japan 1.35 1996 - 2009
0.98
10.0 1990 - 2010
0.01
10.00
1.00
1990 - 2010
9.8 1990 - 2010
0.28
KEN Kenya -1.01
1996 0.05
-6.6 1987 - 1991
0.96
6.60 0.71
1987 - 1991
17.6 1992 0.72
KGZ Kyrgyzstan -1.29
2009 0.02
-0.1 2005 - 2009
0.51
0.10 0.00
2005 - 2009
15.0 2009 0.62
KOR South Korea 0.81 1996 - 2009
0.92
7.2 1990 - 2010
0.03
7.24 0.87
1990 - 2010
14.6 1990 - 2010
0.61
KWT Kuwait 0.73 1996 - 2009
0.90
-7.1 1990 - 2010
0.97
7.10 0.84
1990 - 2010
1.0 1990 - 2010
0.01
LSO Lesotho -0.30
1996 0.29
8.0 1993 - 1997
0.02
8.00 0.95
1993 - 1997
46.2 1997 1.00
MNG Mongolia -0.14
1996 - 2009
0.40
9.1 1990 - 2010
0.01
9.05 0.99
1990 - 2010
14.9 1990 - 2010
0.62
NLD Nether- lands 1.75 1996 - 2009
0.99
10.0 1990 - 2010
0.01
10.00
1.00
1990 - 2010
22.5 1990 - 2010
0.85
NPL Nepal -0.20
1996 0.35
5.0 1990 - 1995
0.08
5.00 0.18
1990 - 1995
9.0 1995 0.22
PAK Pakistan -0.55
1996 0.16
0.8 1985 - 1989
0.4 0.80 0.00
1985 - 1989
13.3 1990 0.55
QAT Qatar 0.68 1996 - 2009
0.88
-10.0
1990 - 2010
0.99
10.00
1.00
1990 - 2010
21.0 1990 - 2010
0.81
RWA Rwanda -1.49
1996 0.01
-7.0 1990 - 2010
0.97
7.00 0.82
1990 - 2010
8.8 1990 0.20
SGP Singapore 1.65 1996 - 2009
0.99
-2.0 1990 - 2010
0.73
2.00 0.00
1990 - 2010
14.4 1990 - 2010
0.60
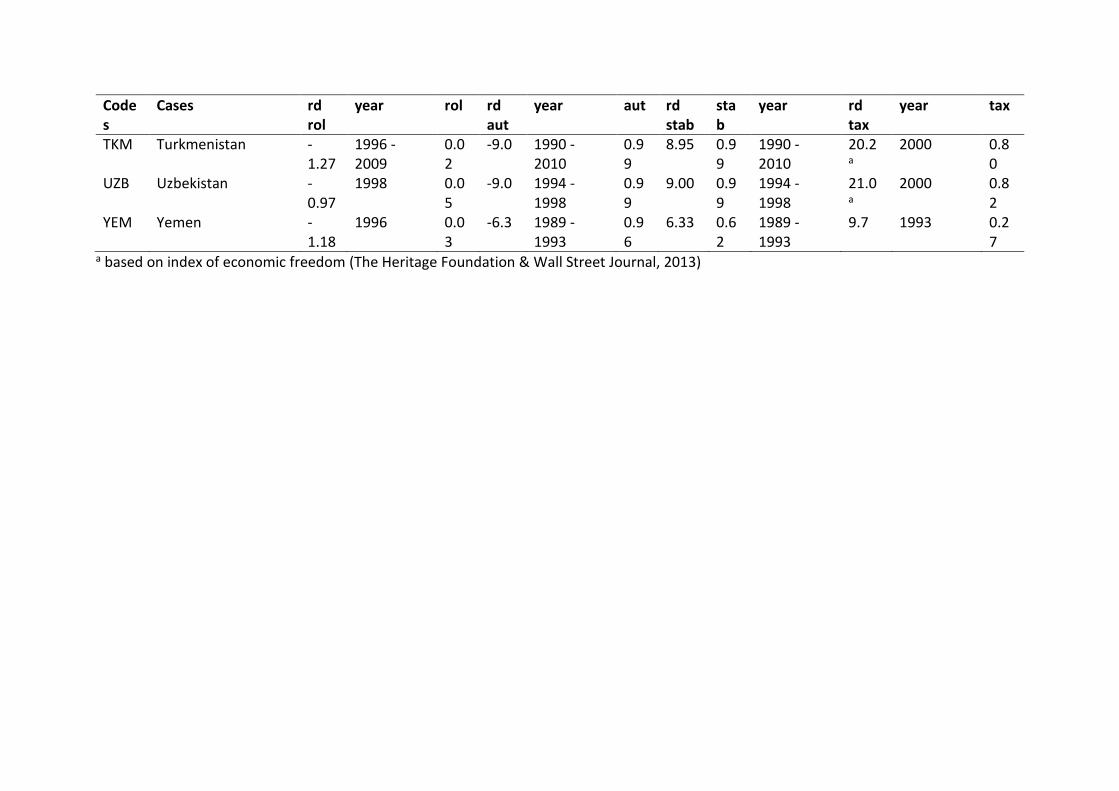
Codes
Cases rd rol
year rol rd aut
year aut rd stab
stab
year rd tax
year tax
TKM Turkmenistan -1.27
1996 - 2009
0.02
-9.0 1990 - 2010
0.99
8.95 0.99
1990 - 2010
20.2 a
2000 0.80
UZB Uzbekistan -0.97
1998 0.05
-9.0 1994 - 1998
0.99
9.00 0.99
1994 - 1998
21.0 a
2000 0.82
YEM Yemen -1.18
1996 0.03
-6.3 1989 - 1993
0.96
6.33 0.62
1989 - 1993
9.7 1993 0.27
a based on index of economic freedom (The Heritage Foundation & Wall Street Journal, 2013)
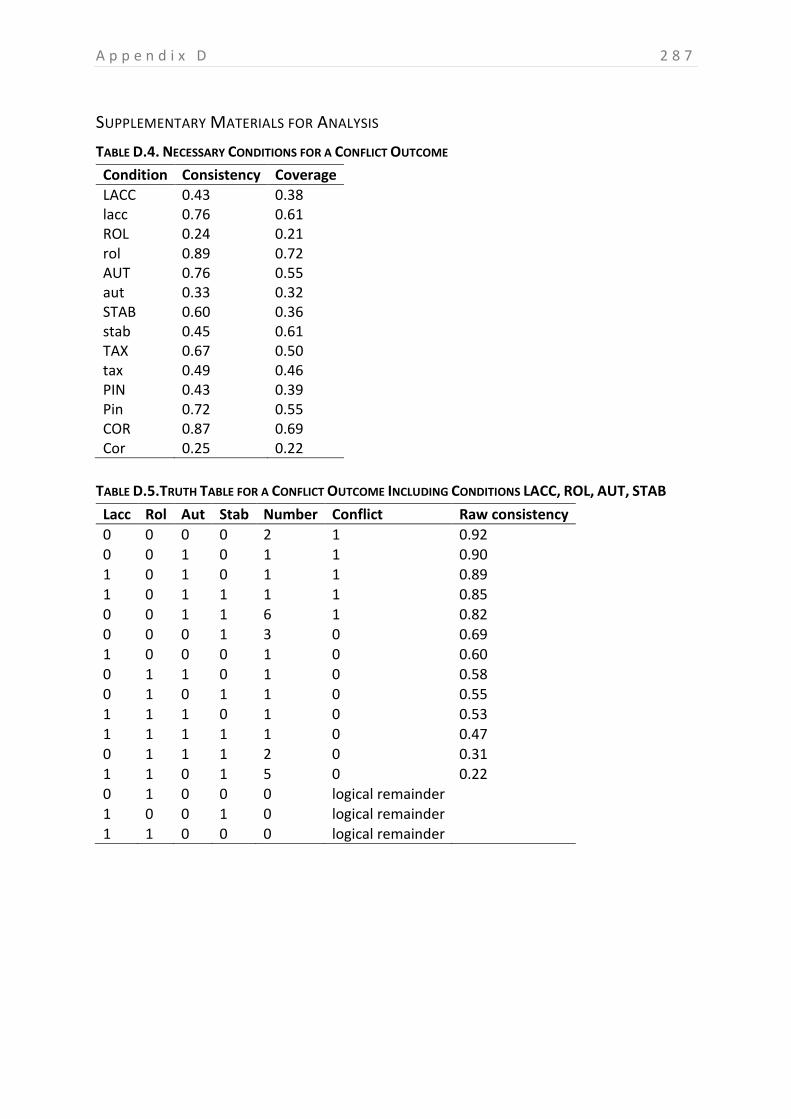
A p p e n d i x D 2 8 7
SUPPLEMENTARY MATERIALS FOR ANALYSIS
TABLE D.4. NECESSARY CONDITIONS FOR A CONFLICT OUTCOME
TABLE D.5.TRUTH TABLE FOR A CONFLICT OUTCOME INCLUDING CONDITIONS LACC, ROL, AUT, STAB
Lacc Rol Aut Stab Number Conflict Raw consistency
0 0 0 0 2 1 0.92 0 0 1 0 1 1 0.90 1 0 1 0 1 1 0.89 1 0 1 1 1 1 0.85
0 0 1 1 6 1 0.82 0 0 0 1 3 0 0.69 1 0 0 0 1 0 0.60 0 1 1 0 1 0 0.58 0 1 0 1 1 0 0.55 1 1 1 0 1 0 0.53 1 1 1 1 1 0 0.47 0 1 1 1 2 0 0.31 1 1 0 1 5 0 0.22 0 1 0 0 0 logical remainder 1 0 0 1 0 logical remainder 1 1 0 0 0 logical remainder
Condition Consistency Coverage
LACC 0.43 0.38 lacc 0.76 0.61 ROL 0.24 0.21 rol 0.89 0.72 AUT 0.76 0.55 aut 0.33 0.32 STAB 0.60 0.36 stab 0.45 0.61 TAX 0.67 0.50 tax 0.49 0.46 PIN 0.43 0.39 Pin 0.72 0.55 COR 0.87 0.69 Cor 0.25 0.22
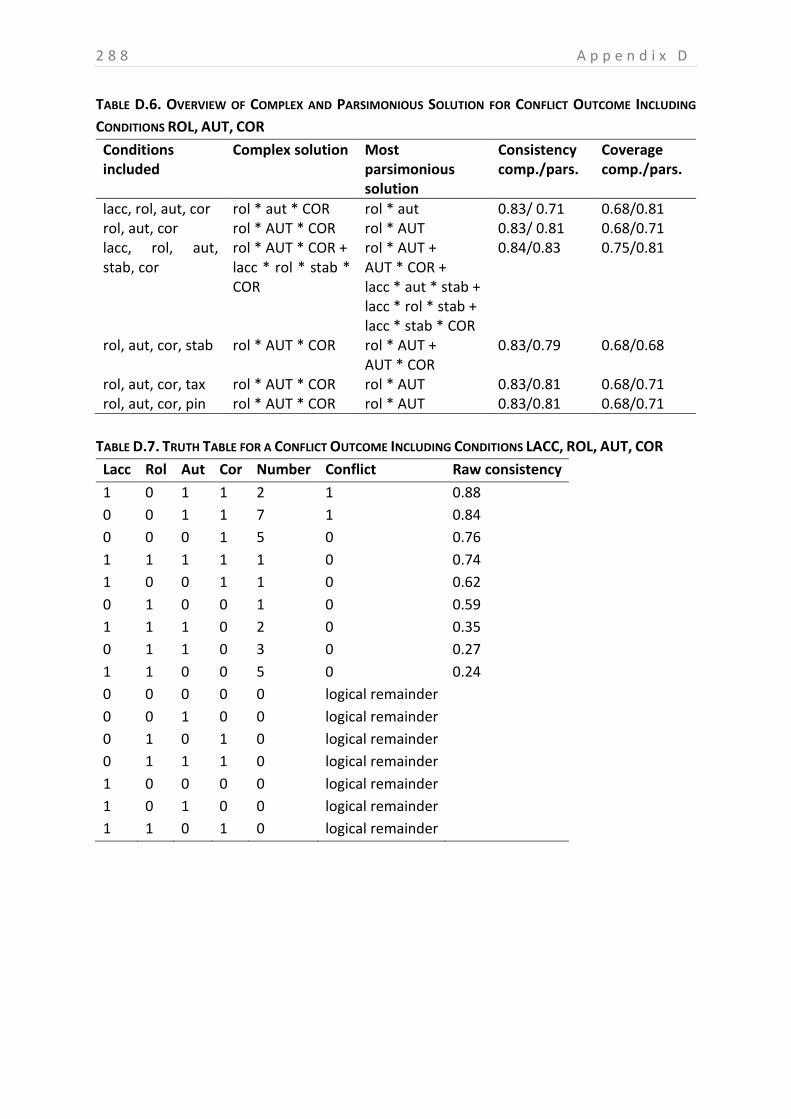
2 8 8 A p p e n d i x D
TABLE D.6. OVERVIEW OF COMPLEX AND PARSIMONIOUS SOLUTION FOR CONFLICT OUTCOME INCLUDING
CONDITIONS ROL, AUT, COR
Conditions included
Complex solution Most parsimonious solution
Consistency comp./pars.
Coverage comp./pars.
lacc, rol, aut, cor rol * aut * COR rol * aut 0.83/ 0.71 0.68/0.81 rol, aut, cor rol * AUT * COR rol * AUT 0.83/ 0.81 0.68/0.71 lacc, rol, aut, stab, cor
rol * AUT * COR + lacc * rol * stab * COR
rol * AUT + AUT * COR + lacc * aut * stab + lacc * rol * stab + lacc * stab * COR
0.84/0.83 0.75/0.81
rol, aut, cor, stab rol * AUT * COR rol * AUT + AUT * COR
0.83/0.79 0.68/0.68
rol, aut, cor, tax rol * AUT * COR rol * AUT 0.83/0.81 0.68/0.71 rol, aut, cor, pin rol * AUT * COR rol * AUT 0.83/0.81 0.68/0.71
TABLE D.7. TRUTH TABLE FOR A CONFLICT OUTCOME INCLUDING CONDITIONS LACC, ROL, AUT, COR
Lacc Rol Aut Cor Number Conflict Raw consistency
1 0 1 1 2 1 0.88
0 0 1 1 7 1 0.84
0 0 0 1 5 0 0.76
1 1 1 1 1 0 0.74
1 0 0 1 1 0 0.62
0 1 0 0 1 0 0.59
1 1 1 0 2 0 0.35
0 1 1 0 3 0 0.27
1 1 0 0 5 0 0.24
0 0 0 0 0 logical remainder
0 0 1 0 0 logical remainder
0 1 0 1 0 logical remainder
0 1 1 1 0 logical remainder
1 0 0 0 0 logical remainder
1 0 1 0 0 logical remainder
1 1 0 1 0 logical remainder
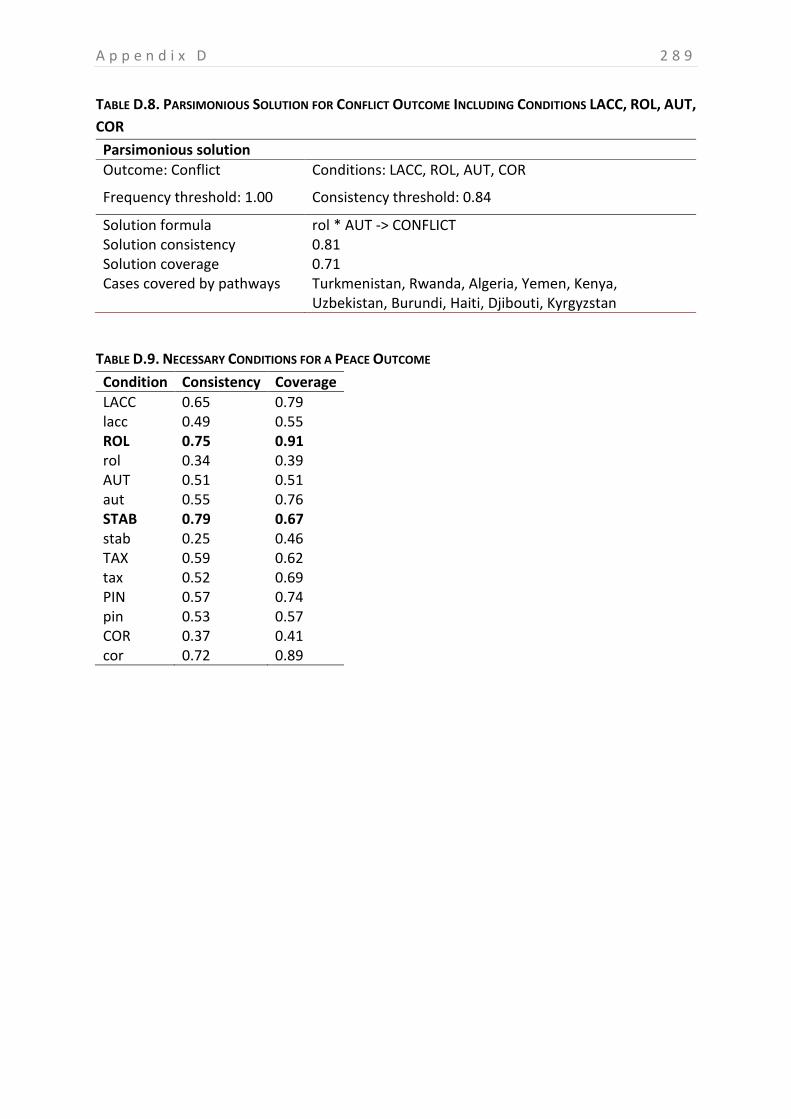
A p p e n d i x D 2 8 9
TABLE D.8. PARSIMONIOUS SOLUTION FOR CONFLICT OUTCOME INCLUDING CONDITIONS LACC, ROL, AUT,
COR
Parsimonious solution
Outcome: Conflict Conditions: LACC, ROL, AUT, COR
Frequency threshold: 1.00 Consistency threshold: 0.84
Solution formula rol * AUT -> CONFLICT Solution consistency 0.81 Solution coverage 0.71 Cases covered by pathways Turkmenistan, Rwanda, Algeria, Yemen, Kenya,
Uzbekistan, Burundi, Haiti, Djibouti, Kyrgyzstan
TABLE D.9. NECESSARY CONDITIONS FOR A PEACE OUTCOME
Condition Consistency Coverage
LACC 0.65 0.79 lacc 0.49 0.55 ROL 0.75 0.91 rol 0.34 0.39 AUT 0.51 0.51 aut 0.55 0.76 STAB 0.79 0.67 stab 0.25 0.46 TAX 0.59 0.62 tax 0.52 0.69 PIN 0.57 0.74 pin 0.53 0.57 COR 0.37 0.41 cor 0.72 0.89
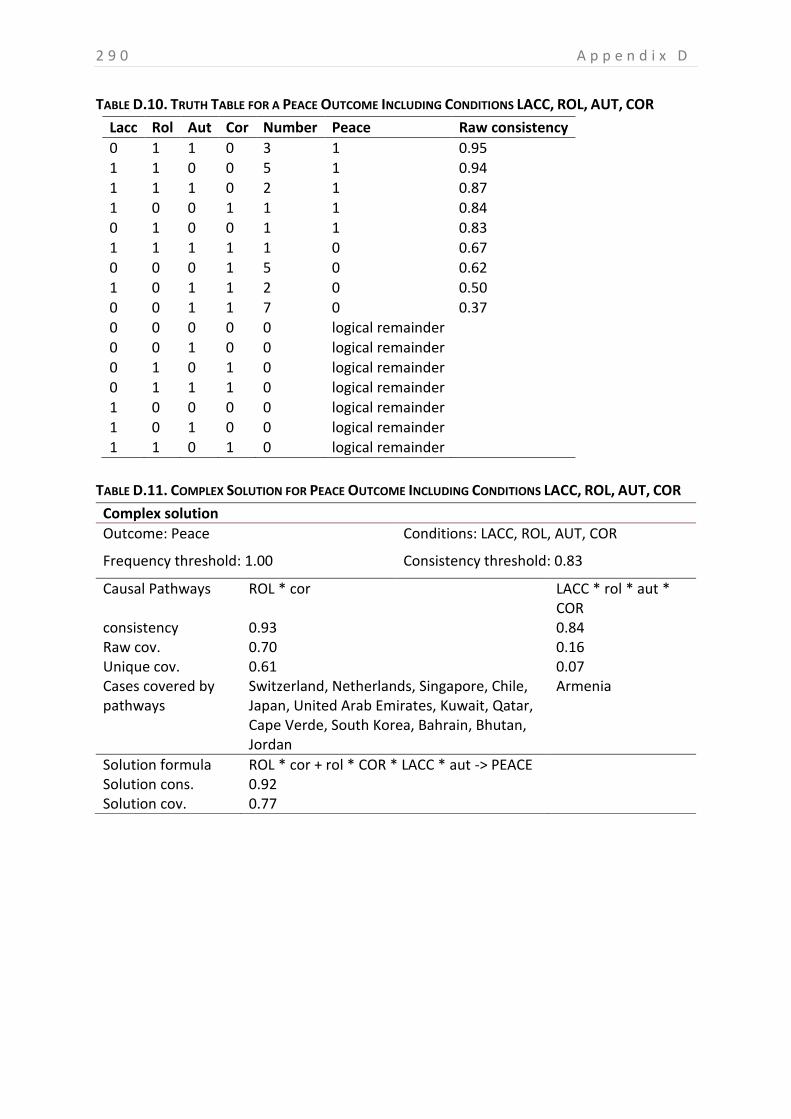
2 9 0 A p p e n d i x D
TABLE D.10. TRUTH TABLE FOR A PEACE OUTCOME INCLUDING CONDITIONS LACC, ROL, AUT, COR
Lacc Rol Aut Cor Number Peace Raw consistency
0 1 1 0 3 1 0.95 1 1 0 0 5 1 0.94 1 1 1 0 2 1 0.87 1 0 0 1 1 1 0.84 0 1 0 0 1 1 0.83 1 1 1 1 1 0 0.67 0 0 0 1 5 0 0.62 1 0 1 1 2 0 0.50 0 0 1 1 7 0 0.37 0 0 0 0 0 logical remainder 0 0 1 0 0 logical remainder
0 1 0 1 0 logical remainder 0 1 1 1 0 logical remainder 1 0 0 0 0 logical remainder 1 0 1 0 0 logical remainder
1 1 0 1 0 logical remainder
TABLE D.11. COMPLEX SOLUTION FOR PEACE OUTCOME INCLUDING CONDITIONS LACC, ROL, AUT, COR
Complex solution
Outcome: Peace Conditions: LACC, ROL, AUT, COR
Frequency threshold: 1.00 Consistency threshold: 0.83
Causal Pathways ROL * cor LACC * rol * aut * COR
consistency 0.93 0.84 Raw cov. 0.70 0.16 Unique cov. 0.61 0.07 Cases covered by pathways
Switzerland, Netherlands, Singapore, Chile, Japan, United Arab Emirates, Kuwait, Qatar, Cape Verde, South Korea, Bahrain, Bhutan, Jordan
Armenia
Solution formula ROL * cor + rol * COR * LACC * aut -> PEACE Solution cons. 0.92 Solution cov. 0.77
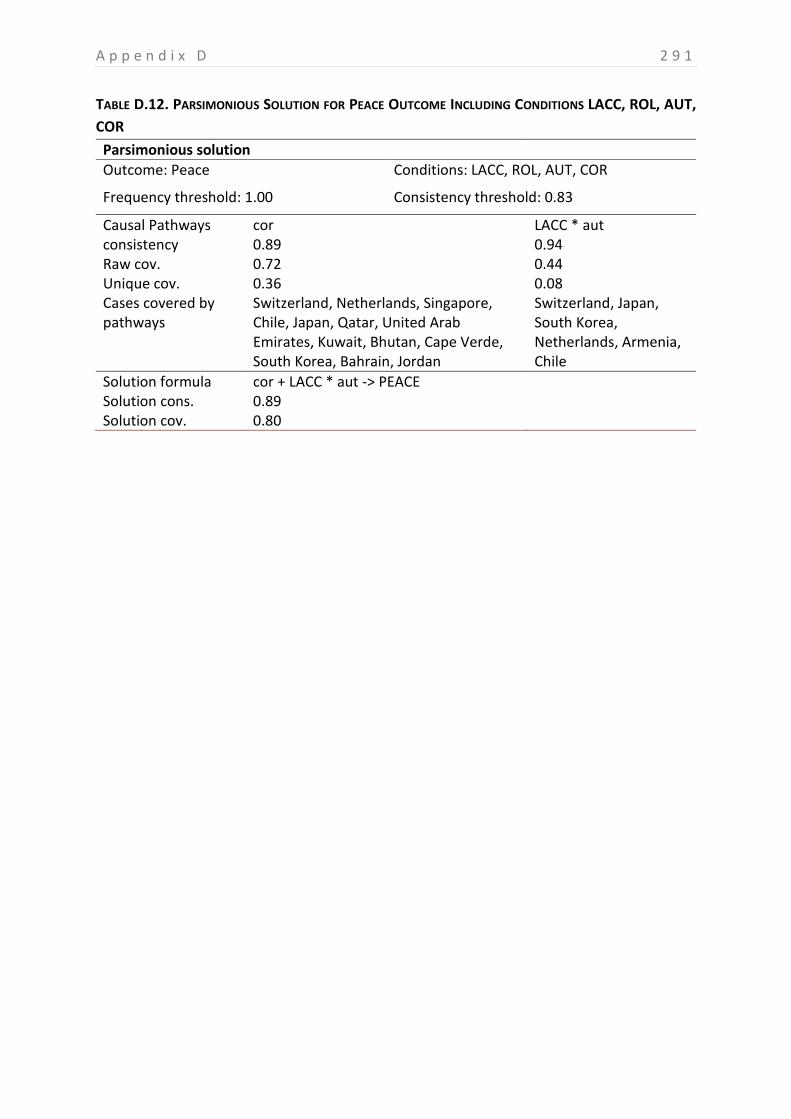
A p p e n d i x D 2 9 1
TABLE D.12. PARSIMONIOUS SOLUTION FOR PEACE OUTCOME INCLUDING CONDITIONS LACC, ROL, AUT,
COR
Parsimonious solution
Outcome: Peace Conditions: LACC, ROL, AUT, COR
Frequency threshold: 1.00 Consistency threshold: 0.83
Causal Pathways cor LACC * aut consistency 0.89 0.94 Raw cov. 0.72 0.44 Unique cov. 0.36 0.08 Cases covered by pathways
Switzerland, Netherlands, Singapore, Chile, Japan, Qatar, United Arab Emirates, Kuwait, Bhutan, Cape Verde, South Korea, Bahrain, Jordan
Switzerland, Japan, South Korea, Netherlands, Armenia, Chile
Solution formula cor + LACC * aut -> PEACE Solution cons. 0.89 Solution cov. 0.80
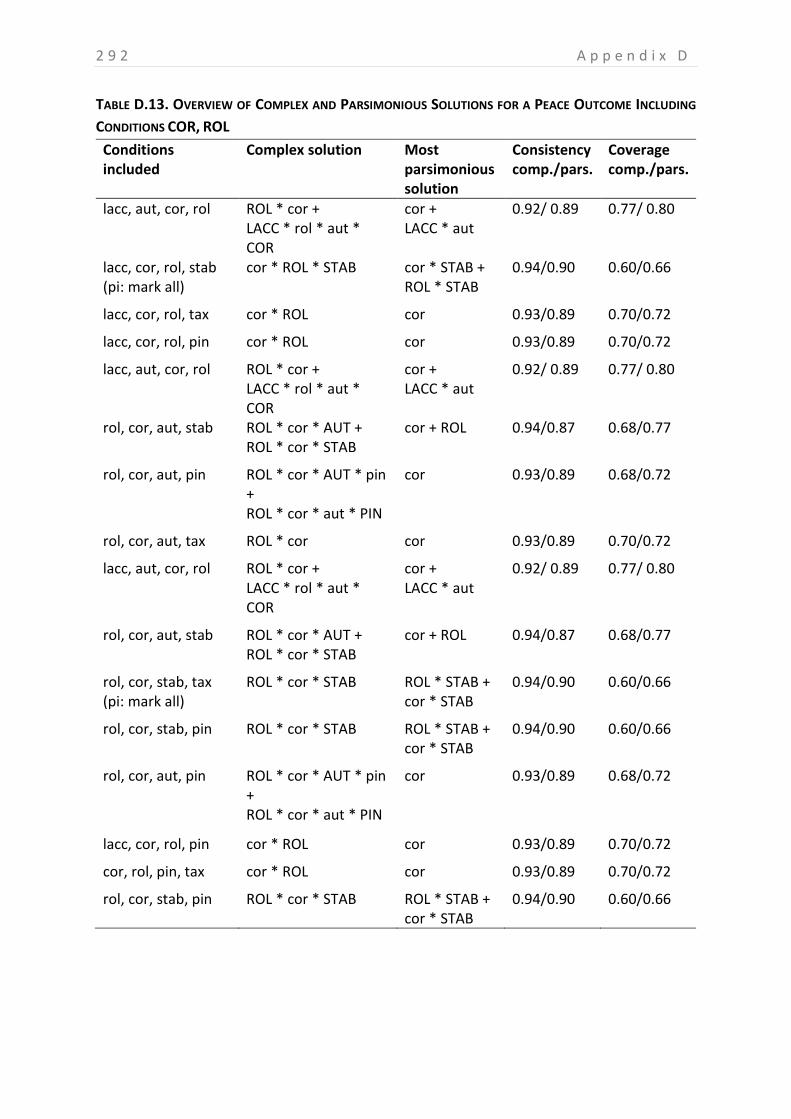
2 9 2 A p p e n d i x D
TABLE D.13. OVERVIEW OF COMPLEX AND PARSIMONIOUS SOLUTIONS FOR A PEACE OUTCOME INCLUDING
CONDITIONS COR, ROL
Conditions included
Complex solution Most parsimonious solution
Consistency comp./pars.
Coverage comp./pars.
lacc, aut, cor, rol ROL * cor + LACC * rol * aut * COR
cor + LACC * aut
0.92/ 0.89 0.77/ 0.80
lacc, cor, rol, stab (pi: mark all)
cor * ROL * STAB cor * STAB + ROL * STAB
0.94/0.90 0.60/0.66
lacc, cor, rol, tax cor * ROL cor 0.93/0.89 0.70/0.72
lacc, cor, rol, pin cor * ROL cor 0.93/0.89 0.70/0.72
lacc, aut, cor, rol ROL * cor + LACC * rol * aut * COR
cor + LACC * aut
0.92/ 0.89 0.77/ 0.80
rol, cor, aut, stab ROL * cor * AUT + ROL * cor * STAB
cor + ROL 0.94/0.87 0.68/0.77
rol, cor, aut, pin ROL * cor * AUT * pin + ROL * cor * aut * PIN
cor 0.93/0.89 0.68/0.72
rol, cor, aut, tax ROL * cor cor 0.93/0.89 0.70/0.72
lacc, aut, cor, rol ROL * cor + LACC * rol * aut * COR
cor + LACC * aut
0.92/ 0.89 0.77/ 0.80
rol, cor, aut, stab ROL * cor * AUT + ROL * cor * STAB
cor + ROL 0.94/0.87 0.68/0.77
rol, cor, stab, tax (pi: mark all)
ROL * cor * STAB ROL * STAB + cor * STAB
0.94/0.90 0.60/0.66
rol, cor, stab, pin ROL * cor * STAB ROL * STAB + cor * STAB
0.94/0.90 0.60/0.66
rol, cor, aut, pin ROL * cor * AUT * pin + ROL * cor * aut * PIN
cor 0.93/0.89 0.68/0.72
lacc, cor, rol, pin cor * ROL cor 0.93/0.89 0.70/0.72
cor, rol, pin, tax cor * ROL cor 0.93/0.89 0.70/0.72
rol, cor, stab, pin ROL * cor * STAB ROL * STAB + cor * STAB
0.94/0.90 0.60/0.66
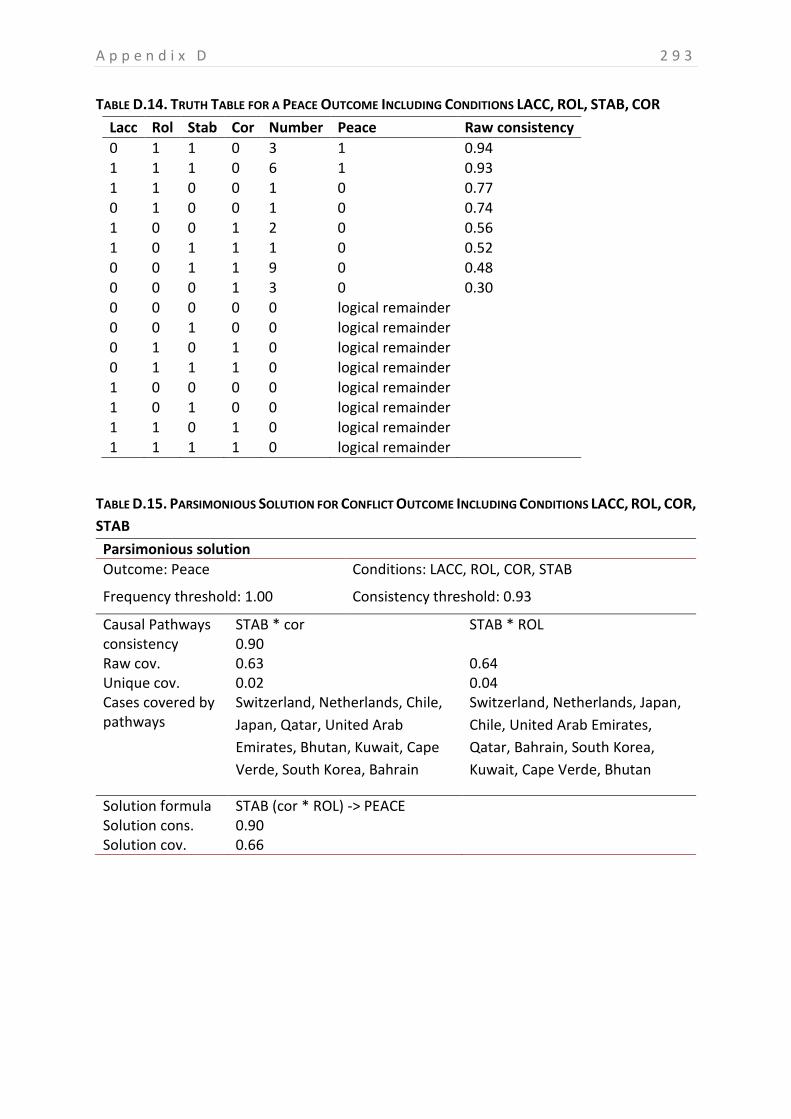
A p p e n d i x D 2 9 3
TABLE D.14. TRUTH TABLE FOR A PEACE OUTCOME INCLUDING CONDITIONS LACC, ROL, STAB, COR
Lacc Rol Stab Cor Number Peace Raw consistency
0 1 1 0 3 1 0.94 1 1 1 0 6 1 0.93 1 1 0 0 1 0 0.77 0 1 0 0 1 0 0.74 1 0 0 1 2 0 0.56 1 0 1 1 1 0 0.52 0 0 1 1 9 0 0.48 0 0 0 1 3 0 0.30 0 0 0 0 0 logical remainder 0 0 1 0 0 logical remainder 0 1 0 1 0 logical remainder
0 1 1 1 0 logical remainder 1 0 0 0 0 logical remainder 1 0 1 0 0 logical remainder 1 1 0 1 0 logical remainder
1 1 1 1 0 logical remainder
TABLE D.15. PARSIMONIOUS SOLUTION FOR CONFLICT OUTCOME INCLUDING CONDITIONS LACC, ROL, COR,
STAB
Parsimonious solution
Outcome: Peace Conditions: LACC, ROL, COR, STAB
Frequency threshold: 1.00 Consistency threshold: 0.93
Causal Pathways STAB * cor STAB * ROL consistency 0.90 Raw cov. 0.63 0.64 Unique cov. 0.02 0.04 Cases covered by pathways
Switzerland, Netherlands, Chile,
Japan, Qatar, United Arab
Emirates, Bhutan, Kuwait, Cape
Verde, South Korea, Bahrain
Switzerland, Netherlands, Japan,
Chile, United Arab Emirates,
Qatar, Bahrain, South Korea,
Kuwait, Cape Verde, Bhutan
Solution formula STAB (cor * ROL) -> PEACE Solution cons. 0.90 Solution cov. 0.66
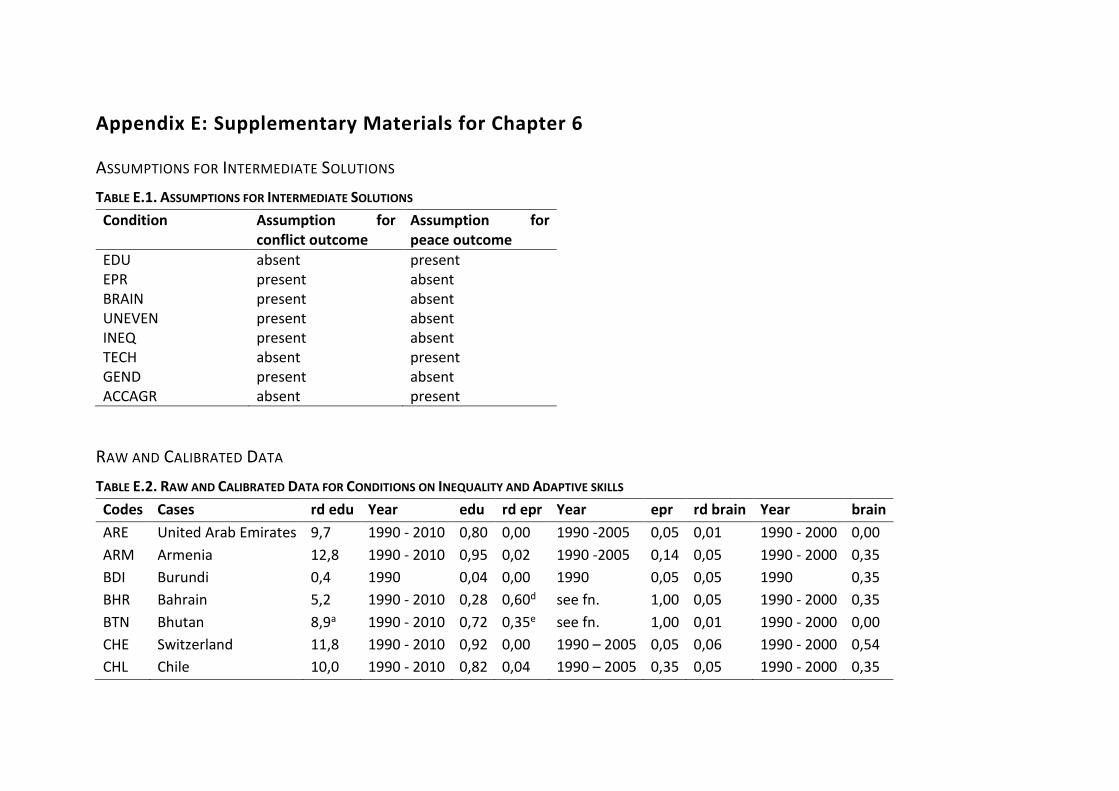
Appendix E: Supplementary Materials for Chapter 6
ASSUMPTIONS FOR INTERMEDIATE SOLUTIONS
TABLE E.1. ASSUMPTIONS FOR INTERMEDIATE SOLUTIONS
Condition Assumption for conflict outcome
Assumption for peace outcome
EDU absent present EPR present absent BRAIN present absent UNEVEN present absent INEQ present absent TECH absent present GEND present absent ACCAGR absent present
RAW AND CALIBRATED DATA
TABLE E.2. RAW AND CALIBRATED DATA FOR CONDITIONS ON INEQUALITY AND ADAPTIVE SKILLS
Codes Cases rd edu Year edu rd epr Year epr rd brain Year brain
ARE United Arab Emirates 9,7 1990 - 2010 0,80 0,00 1990 -2005 0,05 0,01 1990 - 2000 0,00
ARM Armenia 12,8 1990 - 2010 0,95 0,02 1990 -2005 0,14 0,05 1990 - 2000 0,35
BDI Burundi 0,4 1990 0,04 0,00 1990 0,05 0,05 1990 0,35
BHR Bahrain 5,2 1990 - 2010 0,28 0,60d see fn. 1,00 0,05 1990 - 2000 0,35
BTN Bhutan 8,9a 1990 - 2010 0,72 0,35e see fn. 1,00 0,01 1990 - 2000 0,00
CHE Switzerland 11,8 1990 - 2010 0,92 0,00 1990 – 2005 0,05 0,06 1990 - 2000 0,54
CHL Chile 10,0 1990 - 2010 0,82 0,04 1990 – 2005 0,35 0,05 1990 - 2000 0,35
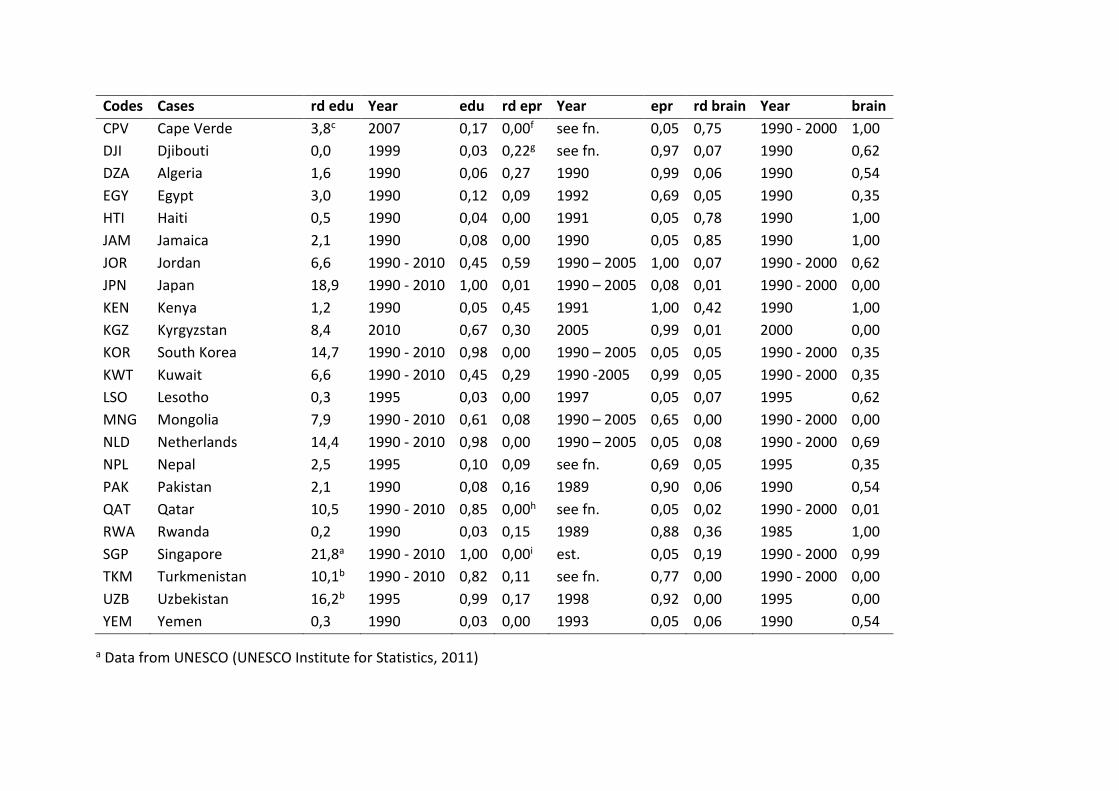
Codes Cases rd edu Year edu rd epr Year epr rd brain Year brain
CPV Cape Verde 3,8c 2007 0,17 0,00f see fn. 0,05 0,75 1990 - 2000 1,00
DJI Djibouti 0,0 1999 0,03 0,22g see fn. 0,97 0,07 1990 0,62
DZA Algeria 1,6 1990 0,06 0,27 1990 0,99 0,06 1990 0,54
EGY Egypt 3,0 1990 0,12 0,09 1992 0,69 0,05 1990 0,35
HTI Haiti 0,5 1990 0,04 0,00 1991 0,05 0,78 1990 1,00
JAM Jamaica 2,1 1990 0,08 0,00 1990 0,05 0,85 1990 1,00
JOR Jordan 6,6 1990 - 2010 0,45 0,59 1990 – 2005 1,00 0,07 1990 - 2000 0,62
JPN Japan 18,9 1990 - 2010 1,00 0,01 1990 – 2005 0,08 0,01 1990 - 2000 0,00
KEN Kenya 1,2 1990 0,05 0,45 1991 1,00 0,42 1990 1,00
KGZ Kyrgyzstan 8,4 2010 0,67 0,30 2005 0,99 0,01 2000 0,00
KOR South Korea 14,7 1990 - 2010 0,98 0,00 1990 – 2005 0,05 0,05 1990 - 2000 0,35
KWT Kuwait 6,6 1990 - 2010 0,45 0,29 1990 -2005 0,99 0,05 1990 - 2000 0,35
LSO Lesotho 0,3 1995 0,03 0,00 1997 0,05 0,07 1995 0,62
MNG Mongolia 7,9 1990 - 2010 0,61 0,08 1990 – 2005 0,65 0,00 1990 - 2000 0,00
NLD Netherlands 14,4 1990 - 2010 0,98 0,00 1990 – 2005 0,05 0,08 1990 - 2000 0,69
NPL Nepal 2,5 1995 0,10 0,09 see fn. 0,69 0,05 1995 0,35
PAK Pakistan 2,1 1990 0,08 0,16 1989 0,90 0,06 1990 0,54
QAT Qatar 10,5 1990 - 2010 0,85 0,00h see fn. 0,05 0,02 1990 - 2000 0,01
RWA Rwanda 0,2 1990 0,03 0,15 1989 0,88 0,36 1985 1,00
SGP Singapore 21,8a 1990 - 2010 1,00 0,00i est. 0,05 0,19 1990 - 2000 0,99
TKM Turkmenistan 10,1b 1990 - 2010 0,82 0,11 see fn. 0,77 0,00 1990 - 2000 0,00
UZB Uzbekistan 16,2b 1995 0,99 0,17 1998 0,92 0,00 1995 0,00
YEM Yemen 0,3 1990 0,03 0,00 1993 0,05 0,06 1990 0,54
a Data from UNESCO (UNESCO Institute for Statistics, 2011)
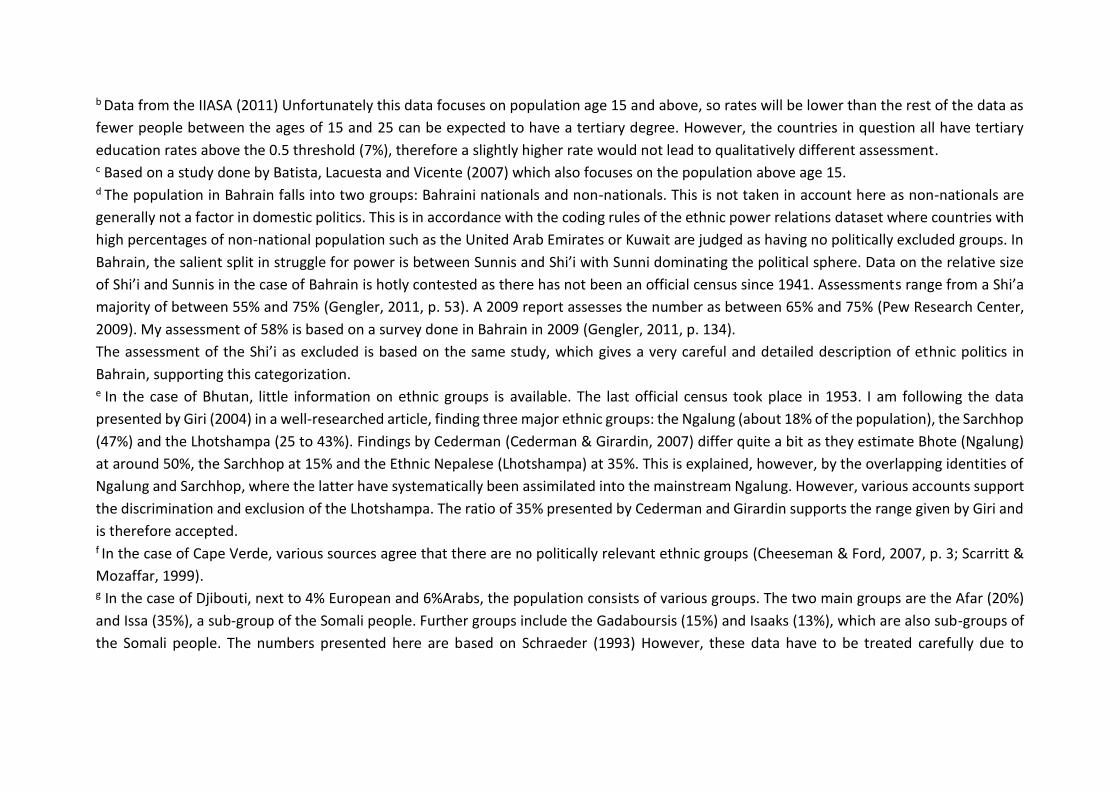
b Data from the IIASA (2011) Unfortunately this data focuses on population age 15 and above, so rates will be lower than the rest of the data as
fewer people between the ages of 15 and 25 can be expected to have a tertiary degree. However, the countries in question all have tertiary
education rates above the 0.5 threshold (7%), therefore a slightly higher rate would not lead to qualitatively different assessment. c Based on a study done by Batista, Lacuesta and Vicente (2007) which also focuses on the population above age 15. d The population in Bahrain falls into two groups: Bahraini nationals and non-nationals. This is not taken in account here as non-nationals are
generally not a factor in domestic politics. This is in accordance with the coding rules of the ethnic power relations dataset where countries with
high percentages of non-national population such as the United Arab Emirates or Kuwait are judged as having no politically excluded groups. In
Bahrain, the salient split in struggle for power is between Sunnis and Shi’i with Sunni dominating the political sphere. Data on the relative size
of Shi’i and Sunnis in the case of Bahrain is hotly contested as there has not been an official census since 1941. Assessments range from a Shi’a
majority of between 55% and 75% (Gengler, 2011, p. 53). A 2009 report assesses the number as between 65% and 75% (Pew Research Center,
2009). My assessment of 58% is based on a survey done in Bahrain in 2009 (Gengler, 2011, p. 134).
The assessment of the Shi’i as excluded is based on the same study, which gives a very careful and detailed description of ethnic politics in
Bahrain, supporting this categorization. e In the case of Bhutan, little information on ethnic groups is available. The last official census took place in 1953. I am following the data
presented by Giri (2004) in a well-researched article, finding three major ethnic groups: the Ngalung (about 18% of the population), the Sarchhop
(47%) and the Lhotshampa (25 to 43%). Findings by Cederman (Cederman & Girardin, 2007) differ quite a bit as they estimate Bhote (Ngalung)
at around 50%, the Sarchhop at 15% and the Ethnic Nepalese (Lhotshampa) at 35%. This is explained, however, by the overlapping identities of
Ngalung and Sarchhop, where the latter have systematically been assimilated into the mainstream Ngalung. However, various accounts support
the discrimination and exclusion of the Lhotshampa. The ratio of 35% presented by Cederman and Girardin supports the range given by Giri and
is therefore accepted. f In the case of Cape Verde, various sources agree that there are no politically relevant ethnic groups (Cheeseman & Ford, 2007, p. 3; Scarritt &
Mozaffar, 1999). g In the case of Djibouti, next to 4% European and 6%Arabs, the population consists of various groups. The two main groups are the Afar (20%)
and Issa (35%), a sub-group of the Somali people. Further groups include the Gadaboursis (15%) and Isaaks (13%), which are also sub-groups of
the Somali people. The numbers presented here are based on Schraeder (1993) However, these data have to be treated carefully due to
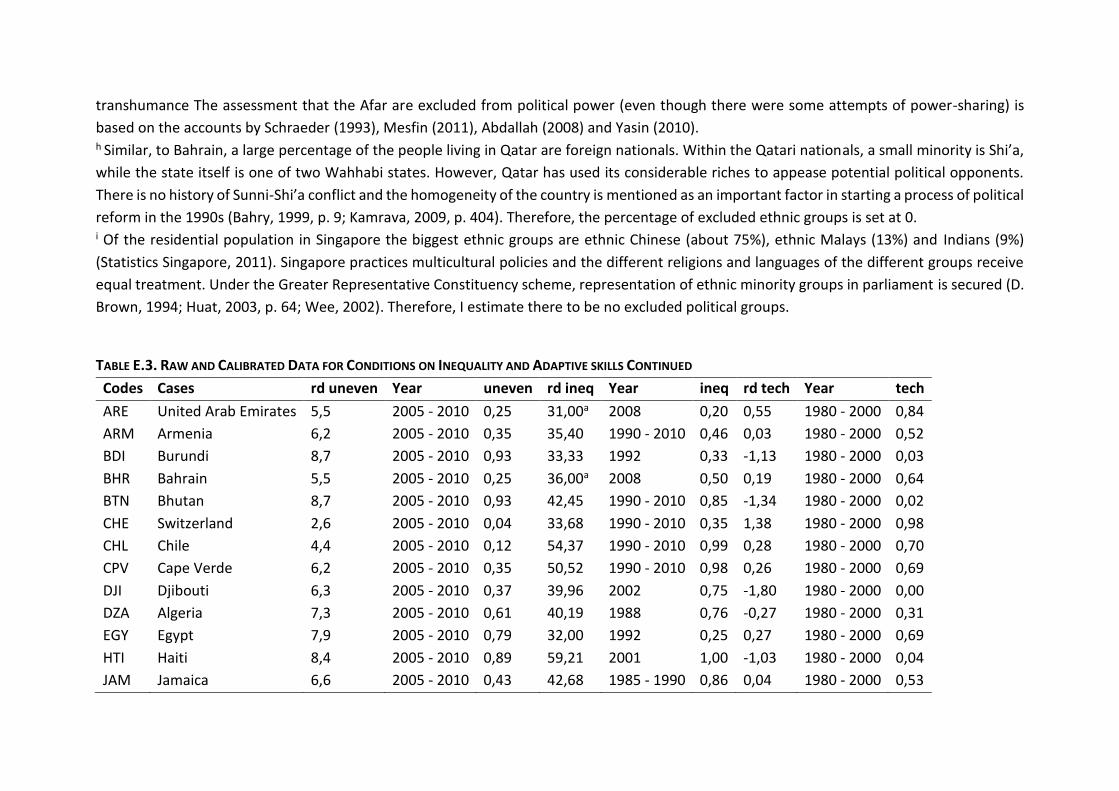
transhumance The assessment that the Afar are excluded from political power (even though there were some attempts of power-sharing) is
based on the accounts by Schraeder (1993), Mesfin (2011), Abdallah (2008) and Yasin (2010). h Similar, to Bahrain, a large percentage of the people living in Qatar are foreign nationals. Within the Qatari nationals, a small minority is Shi’a,
while the state itself is one of two Wahhabi states. However, Qatar has used its considerable riches to appease potential political opponents.
There is no history of Sunni-Shi’a conflict and the homogeneity of the country is mentioned as an important factor in starting a process of political
reform in the 1990s (Bahry, 1999, p. 9; Kamrava, 2009, p. 404). Therefore, the percentage of excluded ethnic groups is set at 0. i Of the residential population in Singapore the biggest ethnic groups are ethnic Chinese (about 75%), ethnic Malays (13%) and Indians (9%)
(Statistics Singapore, 2011). Singapore practices multicultural policies and the different religions and languages of the different groups receive
equal treatment. Under the Greater Representative Constituency scheme, representation of ethnic minority groups in parliament is secured (D.
Brown, 1994; Huat, 2003, p. 64; Wee, 2002). Therefore, I estimate there to be no excluded political groups.
TABLE E.3. RAW AND CALIBRATED DATA FOR CONDITIONS ON INEQUALITY AND ADAPTIVE SKILLS CONTINUED
Codes Cases rd uneven Year uneven rd ineq Year ineq rd tech Year tech
ARE United Arab Emirates 5,5 2005 - 2010 0,25 31,00a 2008 0,20 0,55 1980 - 2000 0,84
ARM Armenia 6,2 2005 - 2010 0,35 35,40 1990 - 2010 0,46 0,03 1980 - 2000 0,52
BDI Burundi 8,7 2005 - 2010 0,93 33,33 1992 0,33 -1,13 1980 - 2000 0,03
BHR Bahrain 5,5 2005 - 2010 0,25 36,00a 2008 0,50 0,19 1980 - 2000 0,64
BTN Bhutan 8,7 2005 - 2010 0,93 42,45 1990 - 2010 0,85 -1,34 1980 - 2000 0,02
CHE Switzerland 2,6 2005 - 2010 0,04 33,68 1990 - 2010 0,35 1,38 1980 - 2000 0,98
CHL Chile 4,4 2005 - 2010 0,12 54,37 1990 - 2010 0,99 0,28 1980 - 2000 0,70
CPV Cape Verde 6,2 2005 - 2010 0,35 50,52 1990 - 2010 0,98 0,26 1980 - 2000 0,69
DJI Djibouti 6,3 2005 - 2010 0,37 39,96 2002 0,75 -1,80 1980 - 2000 0,00
DZA Algeria 7,3 2005 - 2010 0,61 40,19 1988 0,76 -0,27 1980 - 2000 0,31
EGY Egypt 7,9 2005 - 2010 0,79 32,00 1992 0,25 0,27 1980 - 2000 0,69
HTI Haiti 8,4 2005 - 2010 0,89 59,21 2001 1,00 -1,03 1980 - 2000 0,04
JAM Jamaica 6,6 2005 - 2010 0,43 42,68 1985 - 1990 0,86 0,04 1980 - 2000 0,53
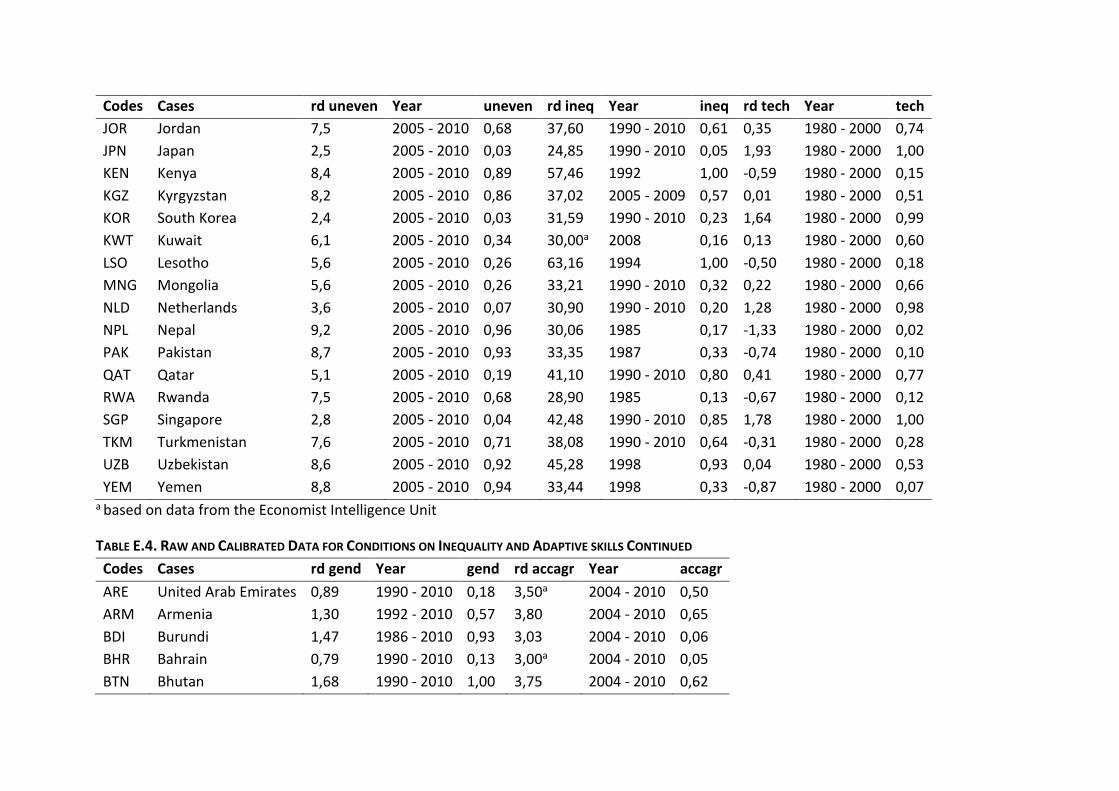
Codes Cases rd uneven Year uneven rd ineq Year ineq rd tech Year tech
JOR Jordan 7,5 2005 - 2010 0,68 37,60 1990 - 2010 0,61 0,35 1980 - 2000 0,74
JPN Japan 2,5 2005 - 2010 0,03 24,85 1990 - 2010 0,05 1,93 1980 - 2000 1,00
KEN Kenya 8,4 2005 - 2010 0,89 57,46 1992 1,00 -0,59 1980 - 2000 0,15
KGZ Kyrgyzstan 8,2 2005 - 2010 0,86 37,02 2005 - 2009 0,57 0,01 1980 - 2000 0,51
KOR South Korea 2,4 2005 - 2010 0,03 31,59 1990 - 2010 0,23 1,64 1980 - 2000 0,99
KWT Kuwait 6,1 2005 - 2010 0,34 30,00a 2008 0,16 0,13 1980 - 2000 0,60
LSO Lesotho 5,6 2005 - 2010 0,26 63,16 1994 1,00 -0,50 1980 - 2000 0,18
MNG Mongolia 5,6 2005 - 2010 0,26 33,21 1990 - 2010 0,32 0,22 1980 - 2000 0,66
NLD Netherlands 3,6 2005 - 2010 0,07 30,90 1990 - 2010 0,20 1,28 1980 - 2000 0,98
NPL Nepal 9,2 2005 - 2010 0,96 30,06 1985 0,17 -1,33 1980 - 2000 0,02
PAK Pakistan 8,7 2005 - 2010 0,93 33,35 1987 0,33 -0,74 1980 - 2000 0,10
QAT Qatar 5,1 2005 - 2010 0,19 41,10 1990 - 2010 0,80 0,41 1980 - 2000 0,77
RWA Rwanda 7,5 2005 - 2010 0,68 28,90 1985 0,13 -0,67 1980 - 2000 0,12
SGP Singapore 2,8 2005 - 2010 0,04 42,48 1990 - 2010 0,85 1,78 1980 - 2000 1,00
TKM Turkmenistan 7,6 2005 - 2010 0,71 38,08 1990 - 2010 0,64 -0,31 1980 - 2000 0,28
UZB Uzbekistan 8,6 2005 - 2010 0,92 45,28 1998 0,93 0,04 1980 - 2000 0,53
YEM Yemen 8,8 2005 - 2010 0,94 33,44 1998 0,33 -0,87 1980 - 2000 0,07 a based on data from the Economist Intelligence Unit
TABLE E.4. RAW AND CALIBRATED DATA FOR CONDITIONS ON INEQUALITY AND ADAPTIVE SKILLS CONTINUED
Codes Cases rd gend Year gend rd accagr Year accagr
ARE United Arab Emirates 0,89 1990 - 2010 0,18 3,50a 2004 - 2010 0,50
ARM Armenia 1,30 1992 - 2010 0,57 3,80 2004 - 2010 0,65
BDI Burundi 1,47 1986 - 2010 0,93 3,03 2004 - 2010 0,06
BHR Bahrain 0,79 1990 - 2010 0,13 3,00a 2004 - 2010 0,05
BTN Bhutan 1,68 1990 - 2010 1,00 3,75 2004 - 2010 0,62
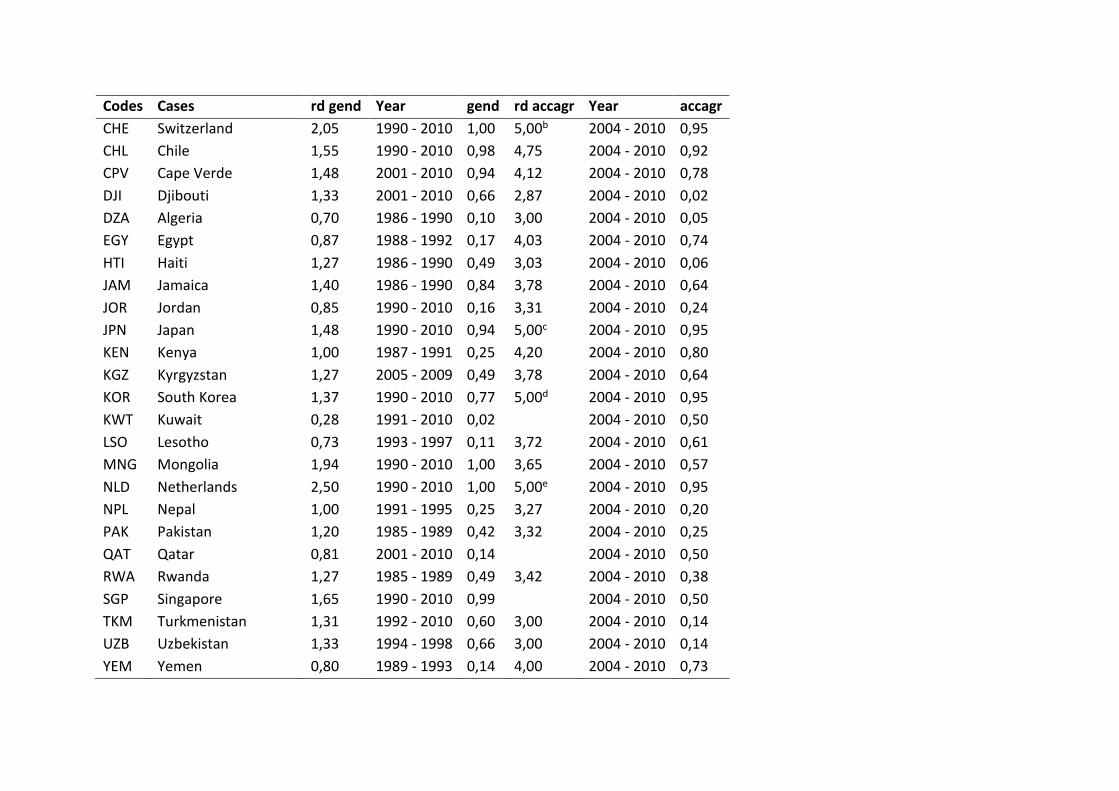
Codes Cases rd gend Year gend rd accagr Year accagr
CHE Switzerland 2,05 1990 - 2010 1,00 5,00b 2004 - 2010 0,95
CHL Chile 1,55 1990 - 2010 0,98 4,75 2004 - 2010 0,92
CPV Cape Verde 1,48 2001 - 2010 0,94 4,12 2004 - 2010 0,78
DJI Djibouti 1,33 2001 - 2010 0,66 2,87 2004 - 2010 0,02
DZA Algeria 0,70 1986 - 1990 0,10 3,00 2004 - 2010 0,05
EGY Egypt 0,87 1988 - 1992 0,17 4,03 2004 - 2010 0,74
HTI Haiti 1,27 1986 - 1990 0,49 3,03 2004 - 2010 0,06
JAM Jamaica 1,40 1986 - 1990 0,84 3,78 2004 - 2010 0,64
JOR Jordan 0,85 1990 - 2010 0,16 3,31 2004 - 2010 0,24
JPN Japan 1,48 1990 - 2010 0,94 5,00c 2004 - 2010 0,95
KEN Kenya 1,00 1987 - 1991 0,25 4,20 2004 - 2010 0,80
KGZ Kyrgyzstan 1,27 2005 - 2009 0,49 3,78 2004 - 2010 0,64
KOR South Korea 1,37 1990 - 2010 0,77 5,00d 2004 - 2010 0,95
KWT Kuwait 0,28 1991 - 2010 0,02 2004 - 2010 0,50
LSO Lesotho 0,73 1993 - 1997 0,11 3,72 2004 - 2010 0,61
MNG Mongolia 1,94 1990 - 2010 1,00 3,65 2004 - 2010 0,57
NLD Netherlands 2,50 1990 - 2010 1,00 5,00e 2004 - 2010 0,95
NPL Nepal 1,00 1991 - 1995 0,25 3,27 2004 - 2010 0,20
PAK Pakistan 1,20 1985 - 1989 0,42 3,32 2004 - 2010 0,25
QAT Qatar 0,81 2001 - 2010 0,14 2004 - 2010 0,50
RWA Rwanda 1,27 1985 - 1989 0,49 3,42 2004 - 2010 0,38
SGP Singapore 1,65 1990 - 2010 0,99 2004 - 2010 0,50
TKM Turkmenistan 1,31 1992 - 2010 0,60 3,00 2004 - 2010 0,14
UZB Uzbekistan 1,33 1994 - 1998 0,66 3,00 2004 - 2010 0,14
YEM Yemen 0,80 1989 - 1993 0,14 4,00 2004 - 2010 0,73
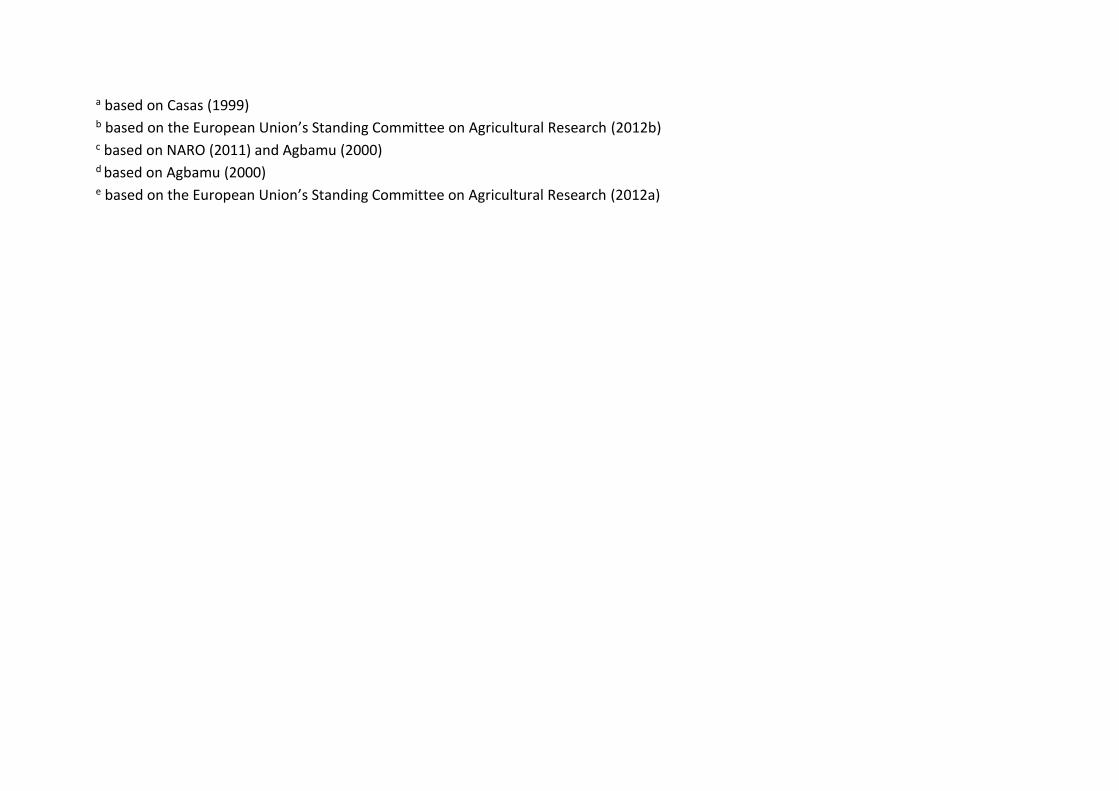
a based on Casas (1999) b based on the European Union’s Standing Committee on Agricultural Research (2012b) c based on NARO (2011) and Agbamu (2000) d based on Agbamu (2000) e based on the European Union’s Standing Committee on Agricultural Research (2012a)
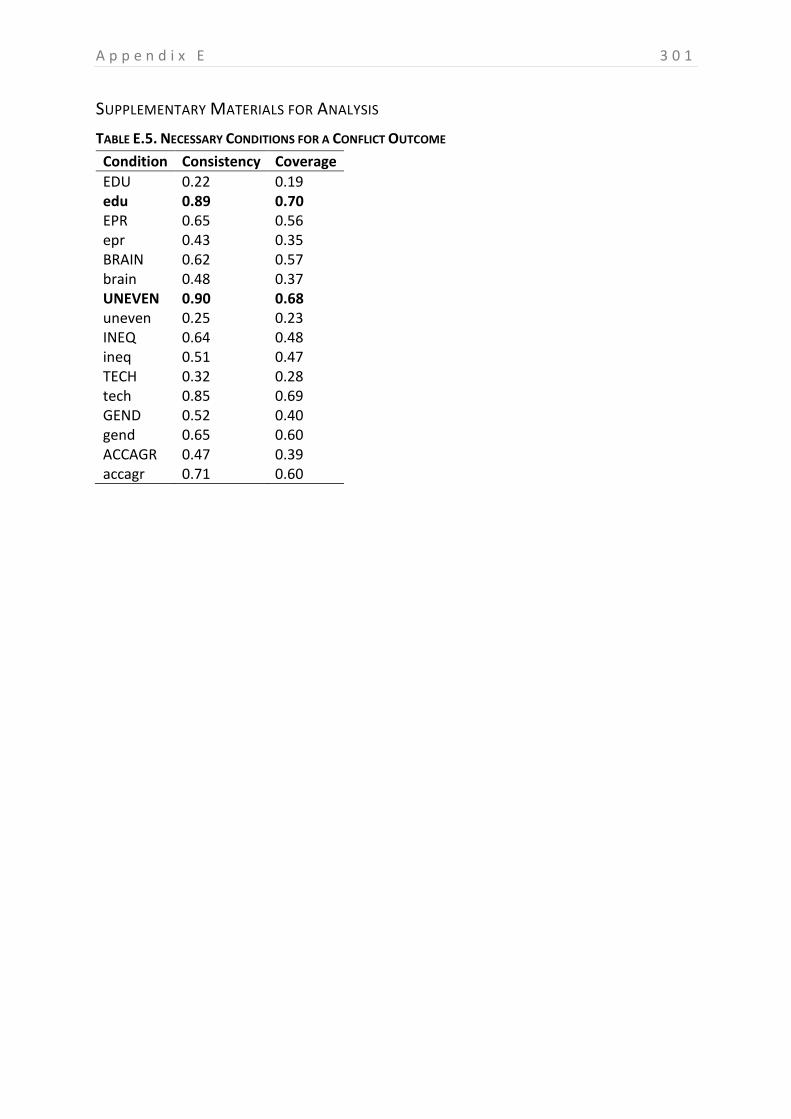
A p p e n d i x E 3 0 1
SUPPLEMENTARY MATERIALS FOR ANALYSIS
TABLE E.5. NECESSARY CONDITIONS FOR A CONFLICT OUTCOME
Condition Consistency Coverage
EDU 0.22 0.19 edu 0.89 0.70 EPR 0.65 0.56 epr 0.43 0.35 BRAIN 0.62 0.57 brain 0.48 0.37 UNEVEN 0.90 0.68 uneven 0.25 0.23 INEQ 0.64 0.48 ineq 0.51 0.47 TECH 0.32 0.28 tech 0.85 0.69 GEND 0.52 0.40 gend 0.65 0.60 ACCAGR 0.47 0.39 accagr 0.71 0.60
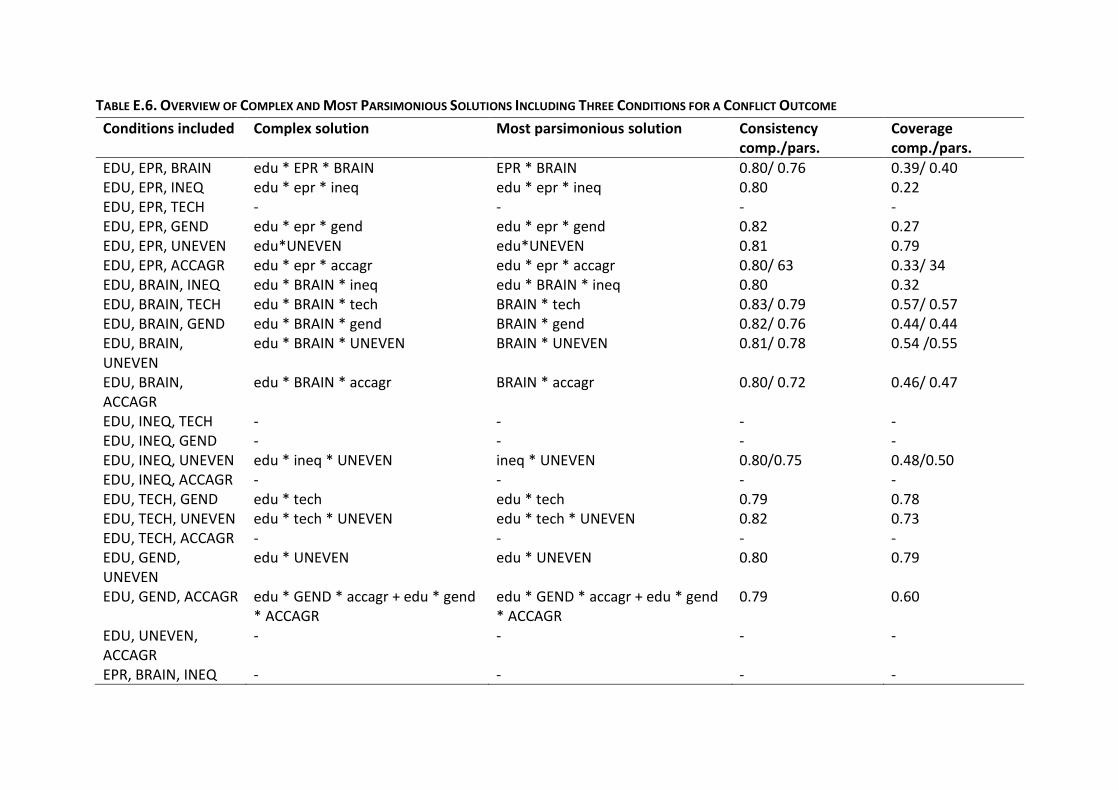
TABLE E.6. OVERVIEW OF COMPLEX AND MOST PARSIMONIOUS SOLUTIONS INCLUDING THREE CONDITIONS FOR A CONFLICT OUTCOME
Conditions included Complex solution Most parsimonious solution Consistency comp./pars.
Coverage comp./pars.
EDU, EPR, BRAIN edu * EPR * BRAIN EPR * BRAIN 0.80/ 0.76 0.39/ 0.40 EDU, EPR, INEQ edu * epr * ineq edu * epr * ineq 0.80 0.22 EDU, EPR, TECH - - - - EDU, EPR, GEND edu * epr * gend edu * epr * gend 0.82 0.27 EDU, EPR, UNEVEN edu*UNEVEN edu*UNEVEN 0.81 0.79 EDU, EPR, ACCAGR edu * epr * accagr edu * epr * accagr 0.80/ 63 0.33/ 34 EDU, BRAIN, INEQ edu * BRAIN * ineq edu * BRAIN * ineq 0.80 0.32 EDU, BRAIN, TECH edu * BRAIN * tech BRAIN * tech 0.83/ 0.79 0.57/ 0.57 EDU, BRAIN, GEND edu * BRAIN * gend BRAIN * gend 0.82/ 0.76 0.44/ 0.44 EDU, BRAIN, UNEVEN
edu * BRAIN * UNEVEN BRAIN * UNEVEN 0.81/ 0.78 0.54 /0.55
EDU, BRAIN, ACCAGR
edu * BRAIN * accagr BRAIN * accagr 0.80/ 0.72 0.46/ 0.47
EDU, INEQ, TECH - - - - EDU, INEQ, GEND - - - - EDU, INEQ, UNEVEN edu * ineq * UNEVEN ineq * UNEVEN 0.80/0.75 0.48/0.50 EDU, INEQ, ACCAGR - - - - EDU, TECH, GEND edu * tech edu * tech 0.79 0.78 EDU, TECH, UNEVEN edu * tech * UNEVEN edu * tech * UNEVEN 0.82 0.73 EDU, TECH, ACCAGR - - - - EDU, GEND, UNEVEN
edu * UNEVEN edu * UNEVEN 0.80 0.79
EDU, GEND, ACCAGR edu * GEND * accagr + edu * gend * ACCAGR
edu * GEND * accagr + edu * gend * ACCAGR
0.79 0.60
EDU, UNEVEN, ACCAGR
- - - -
EPR, BRAIN, INEQ - - - -

Conditions included Complex solution Most parsimonious solution Consistency comp./pars.
Coverage comp./pars.
EPR, BRAIN, TECH EPR * BRAIN * tech EPR * BRAIN * tech 0.80 0.38 EPR, BRAIN, GEND EPR * BRAIN * GEND + epr * BRAIN
* gend EPR * BRAIN * GEND + epr * BRAIN * gend
0.82 0.38
EPR, BRAIN, UNEVEN BRAIN * UNEVEN BRAIN * UNEVEN 0.78 0.55 EPR, BRAIN, ACCAGR - - - - EPR, INEQ, TECH - - - - EPR, INEQ, GEND - - - - EPR, INEQ, UNEVEN - - - - EPR, INEQ, ACCAGR - - - - EPR, TECH, GEND EPR * tech * gend EPR * tech * gend 0.80 0.43 EPR, TECH, UNEVEN - - - - EPR, TECH, ACCAGR - - - - EPR, GEND, UNEVEN epr * gend * UNEVEN epr * gend * UNEVEN 0.79 0.25
EPR, GEND, ACCAGR EPR * gend * ACCAGR EPR * gend * ACCAGR
0.82 0.30
EPR, UNEVEN, ACCAGR
- - - -
BRAIN, INEQ, TECH - - - - BRAIN, INEQ, GEND - - - - BRAIN, INEQ, UNEVEN
- - - -
BRAIN, INEQ, ACCAGR
- - - -
BRAIN, TECH, GEND BRAIN * tech BRAIN * tech 0.80 0.57 BRAIN, TECH, UNEVEN
BRAIN * tech * UNEVEN BRAIN * tech * UNEVEN 0.81 0.52
BRAIN, TECH, ACCGAR
BRAIN * tech * accagr BRAIN * tech * accagr 0.80 0.45
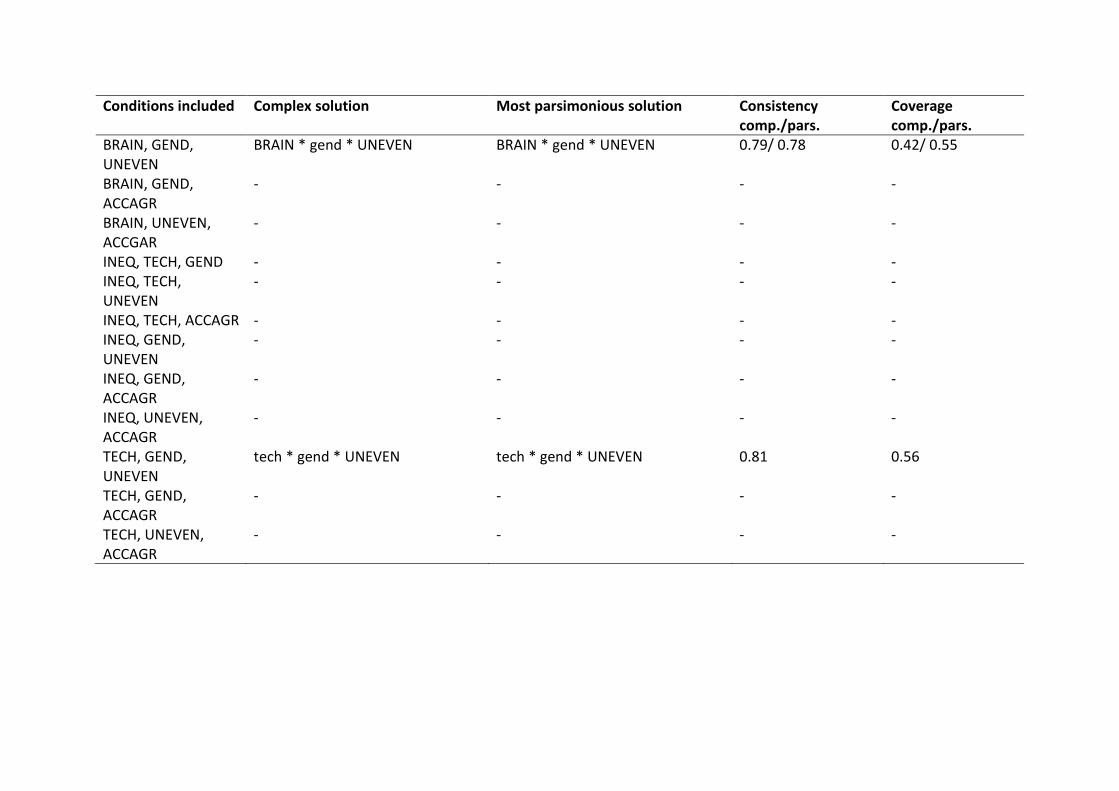
Conditions included Complex solution Most parsimonious solution Consistency comp./pars.
Coverage comp./pars.
BRAIN, GEND, UNEVEN
BRAIN * gend * UNEVEN BRAIN * gend * UNEVEN 0.79/ 0.78 0.42/ 0.55
BRAIN, GEND, ACCAGR
- - - -
BRAIN, UNEVEN, ACCGAR
- - - -
INEQ, TECH, GEND - - - - INEQ, TECH, UNEVEN
- - - -
INEQ, TECH, ACCAGR - - - - INEQ, GEND, UNEVEN
- - - -
INEQ, GEND, ACCAGR
- - - -
INEQ, UNEVEN, ACCAGR
- - - -
TECH, GEND, UNEVEN
tech * gend * UNEVEN tech * gend * UNEVEN 0.81 0.56
TECH, GEND, ACCAGR
- - - -
TECH, UNEVEN, ACCAGR
- - - -
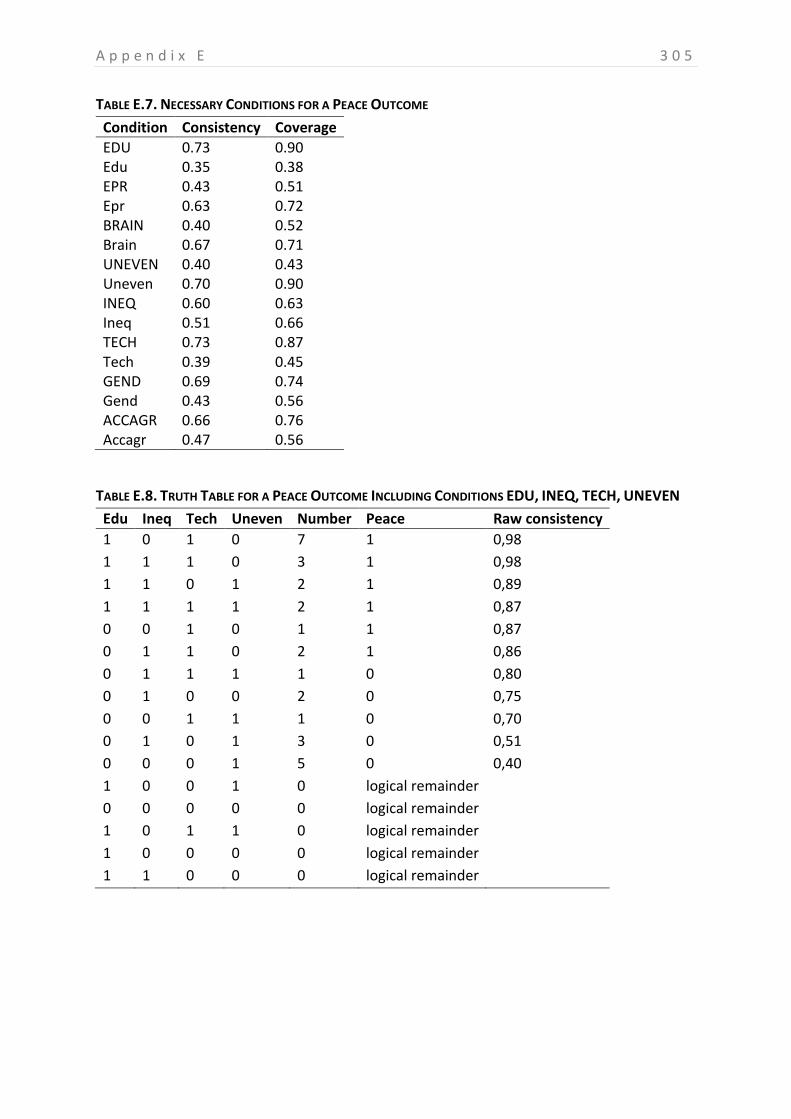
A p p e n d i x E 3 0 5
TABLE E.7. NECESSARY CONDITIONS FOR A PEACE OUTCOME
Condition Consistency Coverage
EDU 0.73 0.90 Edu 0.35 0.38 EPR 0.43 0.51 Epr 0.63 0.72 BRAIN 0.40 0.52 Brain 0.67 0.71 UNEVEN 0.40 0.43 Uneven 0.70 0.90 INEQ 0.60 0.63 Ineq 0.51 0.66 TECH 0.73 0.87 Tech 0.39 0.45 GEND 0.69 0.74 Gend 0.43 0.56 ACCAGR 0.66 0.76 Accagr 0.47 0.56
TABLE E.8. TRUTH TABLE FOR A PEACE OUTCOME INCLUDING CONDITIONS EDU, INEQ, TECH, UNEVEN
Edu Ineq Tech Uneven Number Peace Raw consistency
1 0 1 0 7 1 0,98
1 1 1 0 3 1 0,98
1 1 0 1 2 1 0,89
1 1 1 1 2 1 0,87
0 0 1 0 1 1 0,87
0 1 1 0 2 1 0,86
0 1 1 1 1 0 0,80
0 1 0 0 2 0 0,75
0 0 1 1 1 0 0,70
0 1 0 1 3 0 0,51
0 0 0 1 5 0 0,40
1 0 0 1 0 logical remainder
0 0 0 0 0 logical remainder
1 0 1 1 0 logical remainder
1 0 0 0 0 logical remainder
1 1 0 0 0 logical remainder
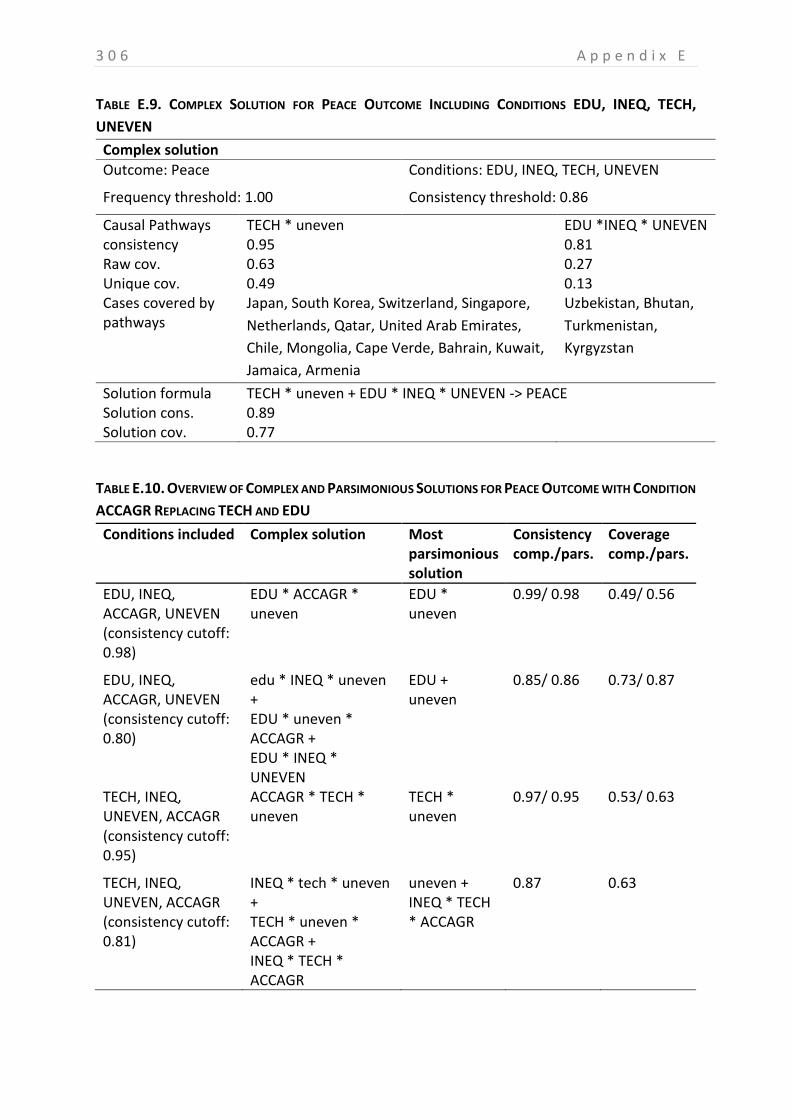
3 0 6 A p p e n d i x E
TABLE E.9. COMPLEX SOLUTION FOR PEACE OUTCOME INCLUDING CONDITIONS EDU, INEQ, TECH,
UNEVEN
Complex solution
Outcome: Peace Conditions: EDU, INEQ, TECH, UNEVEN
Frequency threshold: 1.00 Consistency threshold: 0.86
Causal Pathways TECH * uneven EDU *INEQ * UNEVEN consistency 0.95 0.81 Raw cov. 0.63 0.27 Unique cov. 0.49 0.13 Cases covered by pathways
Japan, South Korea, Switzerland, Singapore,
Netherlands, Qatar, United Arab Emirates,
Chile, Mongolia, Cape Verde, Bahrain, Kuwait,
Jamaica, Armenia
Uzbekistan, Bhutan,
Turkmenistan,
Kyrgyzstan
Solution formula TECH * uneven + EDU * INEQ * UNEVEN -> PEACE Solution cons. 0.89 Solution cov. 0.77
TABLE E.10. OVERVIEW OF COMPLEX AND PARSIMONIOUS SOLUTIONS FOR PEACE OUTCOME WITH CONDITION
ACCAGR REPLACING TECH AND EDU
Conditions included Complex solution Most parsimonious solution
Consistency comp./pars.
Coverage comp./pars.
EDU, INEQ, ACCAGR, UNEVEN (consistency cutoff: 0.98)
EDU * ACCAGR * uneven
EDU * uneven
0.99/ 0.98 0.49/ 0.56
EDU, INEQ, ACCAGR, UNEVEN (consistency cutoff: 0.80)
edu * INEQ * uneven + EDU * uneven * ACCAGR + EDU * INEQ * UNEVEN
EDU + uneven
0.85/ 0.86 0.73/ 0.87
TECH, INEQ, UNEVEN, ACCAGR (consistency cutoff: 0.95)
ACCAGR * TECH * uneven
TECH * uneven
0.97/ 0.95 0.53/ 0.63
TECH, INEQ, UNEVEN, ACCAGR (consistency cutoff: 0.81)
INEQ * tech * uneven + TECH * uneven * ACCAGR + INEQ * TECH * ACCAGR
uneven + INEQ * TECH * ACCAGR
0.87 0.63
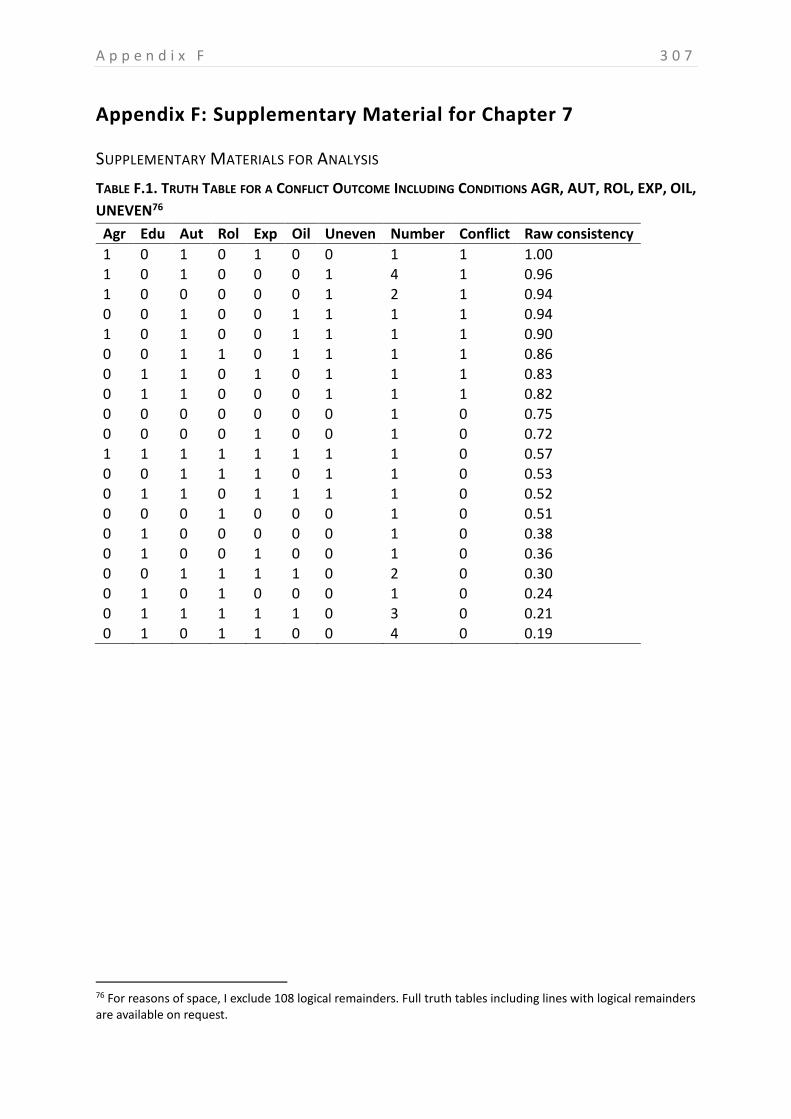
A p p e n d i x F 3 0 7
Appendix F: Supplementary Material for Chapter 7
SUPPLEMENTARY MATERIALS FOR ANALYSIS
TABLE F.1. TRUTH TABLE FOR A CONFLICT OUTCOME INCLUDING CONDITIONS AGR, AUT, ROL, EXP, OIL,
UNEVEN76
Agr Edu Aut Rol Exp Oil Uneven Number Conflict Raw consistency
1 0 1 0 1 0 0 1 1 1.00 1 0 1 0 0 0 1 4 1 0.96 1 0 0 0 0 0 1 2 1 0.94 0 0 1 0 0 1 1 1 1 0.94 1 0 1 0 0 1 1 1 1 0.90 0 0 1 1 0 1 1 1 1 0.86
0 1 1 0 1 0 1 1 1 0.83 0 1 1 0 0 0 1 1 1 0.82 0 0 0 0 0 0 0 1 0 0.75 0 0 0 0 1 0 0 1 0 0.72 1 1 1 1 1 1 1 1 0 0.57 0 0 1 1 1 0 1 1 0 0.53 0 1 1 0 1 1 1 1 0 0.52 0 0 0 1 0 0 0 1 0 0.51 0 1 0 0 0 0 0 1 0 0.38 0 1 0 0 1 0 0 1 0 0.36 0 0 1 1 1 1 0 2 0 0.30 0 1 0 1 0 0 0 1 0 0.24
0 1 1 1 1 1 0 3 0 0.21 0 1 0 1 1 0 0 4 0 0.19
76 For reasons of space, I exclude 108 logical remainders. Full truth tables including lines with logical remainders are available on request.
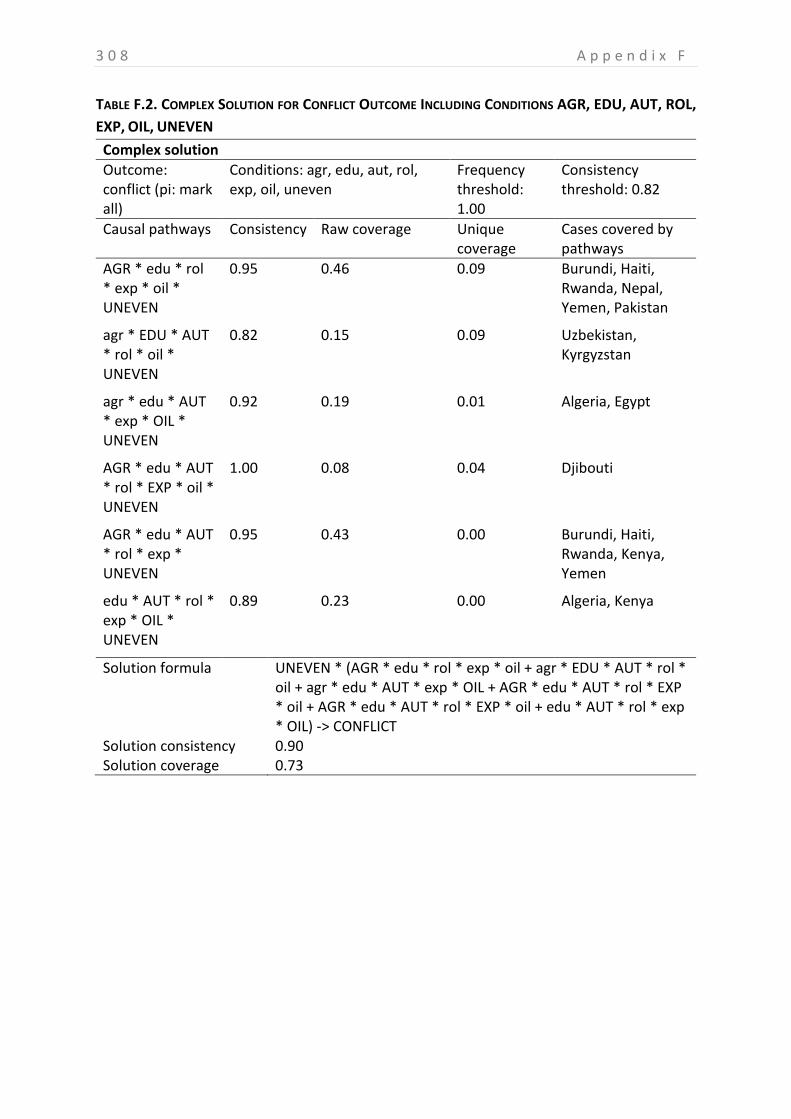
3 0 8 A p p e n d i x F
TABLE F.2. COMPLEX SOLUTION FOR CONFLICT OUTCOME INCLUDING CONDITIONS AGR, EDU, AUT, ROL,
EXP, OIL, UNEVEN
Complex solution
Outcome: conflict (pi: mark all)
Conditions: agr, edu, aut, rol, exp, oil, uneven
Frequency threshold: 1.00
Consistency threshold: 0.82
Causal pathways Consistency Raw coverage Unique coverage
Cases covered by pathways
AGR * edu * rol * exp * oil * UNEVEN
0.95 0.46 0.09 Burundi, Haiti, Rwanda, Nepal, Yemen, Pakistan
agr * EDU * AUT * rol * oil * UNEVEN
0.82 0.15 0.09 Uzbekistan, Kyrgyzstan
agr * edu * AUT * exp * OIL * UNEVEN
0.92 0.19 0.01 Algeria, Egypt
AGR * edu * AUT * rol * EXP * oil * UNEVEN
1.00 0.08 0.04 Djibouti
AGR * edu * AUT * rol * exp * UNEVEN
0.95 0.43 0.00 Burundi, Haiti, Rwanda, Kenya, Yemen
edu * AUT * rol * exp * OIL * UNEVEN
0.89 0.23 0.00 Algeria, Kenya
Solution formula UNEVEN * (AGR * edu * rol * exp * oil + agr * EDU * AUT * rol * oil + agr * edu * AUT * exp * OIL + AGR * edu * AUT * rol * EXP * oil + AGR * edu * AUT * rol * EXP * oil + edu * AUT * rol * exp * OIL) -> CONFLICT
Solution consistency 0.90 Solution coverage 0.73
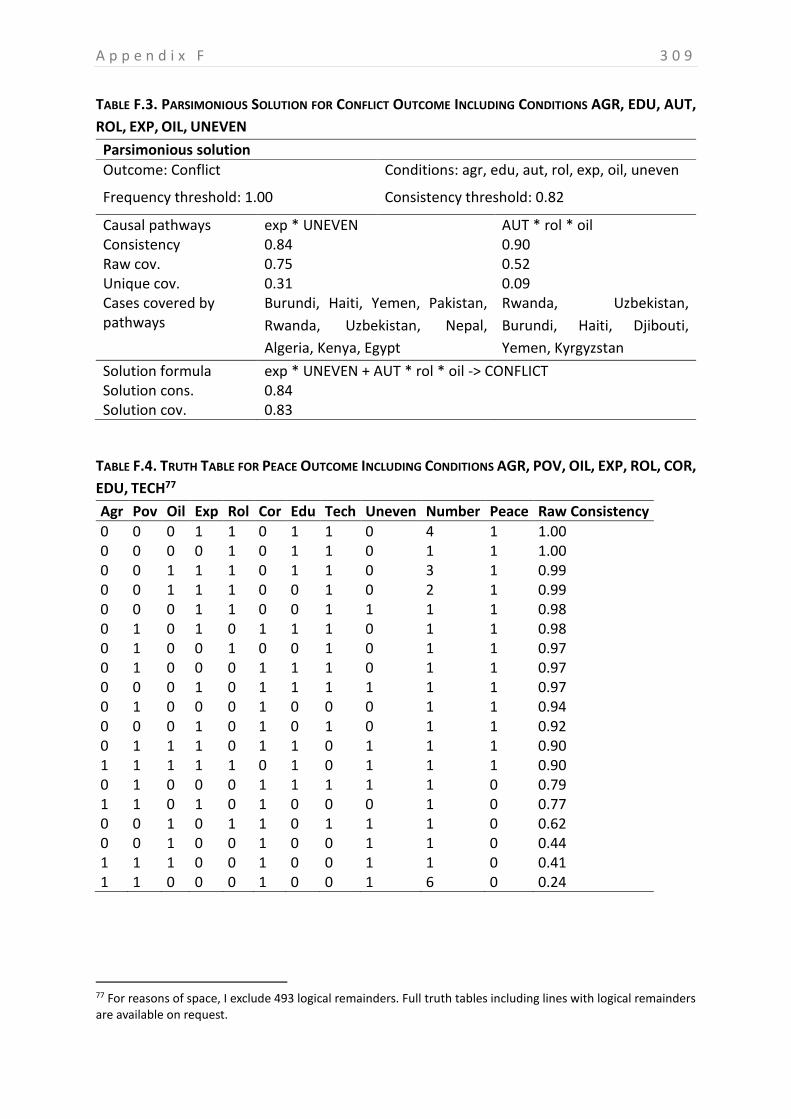
A p p e n d i x F 3 0 9
TABLE F.3. PARSIMONIOUS SOLUTION FOR CONFLICT OUTCOME INCLUDING CONDITIONS AGR, EDU, AUT,
ROL, EXP, OIL, UNEVEN
Parsimonious solution
Outcome: Conflict Conditions: agr, edu, aut, rol, exp, oil, uneven
Frequency threshold: 1.00 Consistency threshold: 0.82
Causal pathways exp * UNEVEN AUT * rol * oil Consistency 0.84 0.90 Raw cov. 0.75 0.52 Unique cov. 0.31 0.09 Cases covered by pathways
Burundi, Haiti, Yemen, Pakistan,
Rwanda, Uzbekistan, Nepal,
Algeria, Kenya, Egypt
Rwanda, Uzbekistan,
Burundi, Haiti, Djibouti,
Yemen, Kyrgyzstan Solution formula exp * UNEVEN + AUT * rol * oil -> CONFLICT Solution cons. 0.84 Solution cov. 0.83
TABLE F.4. TRUTH TABLE FOR PEACE OUTCOME INCLUDING CONDITIONS AGR, POV, OIL, EXP, ROL, COR,
EDU, TECH77
Agr Pov Oil Exp Rol Cor Edu Tech Uneven Number Peace Raw Consistency
0 0 0 1 1 0 1 1 0 4 1 1.00 0 0 0 0 1 0 1 1 0 1 1 1.00 0 0 1 1 1 0 1 1 0 3 1 0.99 0 0 1 1 1 0 0 1 0 2 1 0.99 0 0 0 1 1 0 0 1 1 1 1 0.98 0 1 0 1 0 1 1 1 0 1 1 0.98 0 1 0 0 1 0 0 1 0 1 1 0.97 0 1 0 0 0 1 1 1 0 1 1 0.97 0 0 0 1 0 1 1 1 1 1 1 0.97 0 1 0 0 0 1 0 0 0 1 1 0.94 0 0 0 1 0 1 0 1 0 1 1 0.92 0 1 1 1 0 1 1 0 1 1 1 0.90 1 1 1 1 1 0 1 0 1 1 1 0.90 0 1 0 0 0 1 1 1 1 1 0 0.79 1 1 0 1 0 1 0 0 0 1 0 0.77 0 0 1 0 1 1 0 1 1 1 0 0.62 0 0 1 0 0 1 0 0 1 1 0 0.44 1 1 1 0 0 1 0 0 1 1 0 0.41 1 1 0 0 0 1 0 0 1 6 0 0.24
77 For reasons of space, I exclude 493 logical remainders. Full truth tables including lines with logical remainders are available on request.
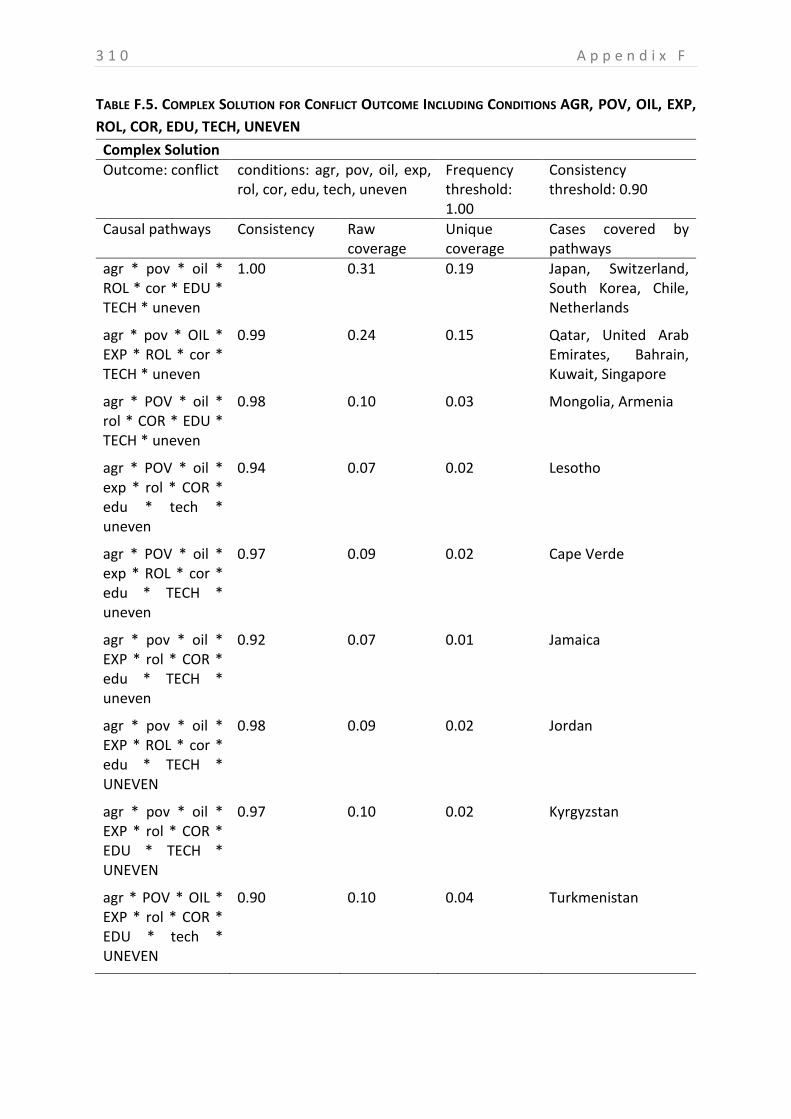
3 1 0 A p p e n d i x F
TABLE F.5. COMPLEX SOLUTION FOR CONFLICT OUTCOME INCLUDING CONDITIONS AGR, POV, OIL, EXP,
ROL, COR, EDU, TECH, UNEVEN
Complex Solution
Outcome: conflict conditions: agr, pov, oil, exp, rol, cor, edu, tech, uneven
Frequency threshold: 1.00
Consistency threshold: 0.90
Causal pathways Consistency Raw coverage
Unique coverage
Cases covered by pathways
agr * pov * oil * ROL * cor * EDU * TECH * uneven
1.00 0.31 0.19 Japan, Switzerland, South Korea, Chile, Netherlands
agr * pov * OIL * EXP * ROL * cor * TECH * uneven
0.99 0.24 0.15 Qatar, United Arab Emirates, Bahrain, Kuwait, Singapore
agr * POV * oil * rol * COR * EDU * TECH * uneven
0.98 0.10 0.03 Mongolia, Armenia
agr * POV * oil * exp * rol * COR * edu * tech * uneven
0.94 0.07 0.02 Lesotho
agr * POV * oil * exp * ROL * cor * edu * TECH * uneven
0.97 0.09 0.02 Cape Verde
agr * pov * oil * EXP * rol * COR * edu * TECH * uneven
0.92 0.07 0.01 Jamaica
agr * pov * oil * EXP * ROL * cor * edu * TECH * UNEVEN
0.98 0.09 0.02 Jordan
agr * pov * oil * EXP * rol * COR * EDU * TECH * UNEVEN
0.97 0.10 0.02 Kyrgyzstan
agr * POV * OIL * EXP * rol * COR * EDU * tech * UNEVEN
0.90 0.10 0.04 Turkmenistan
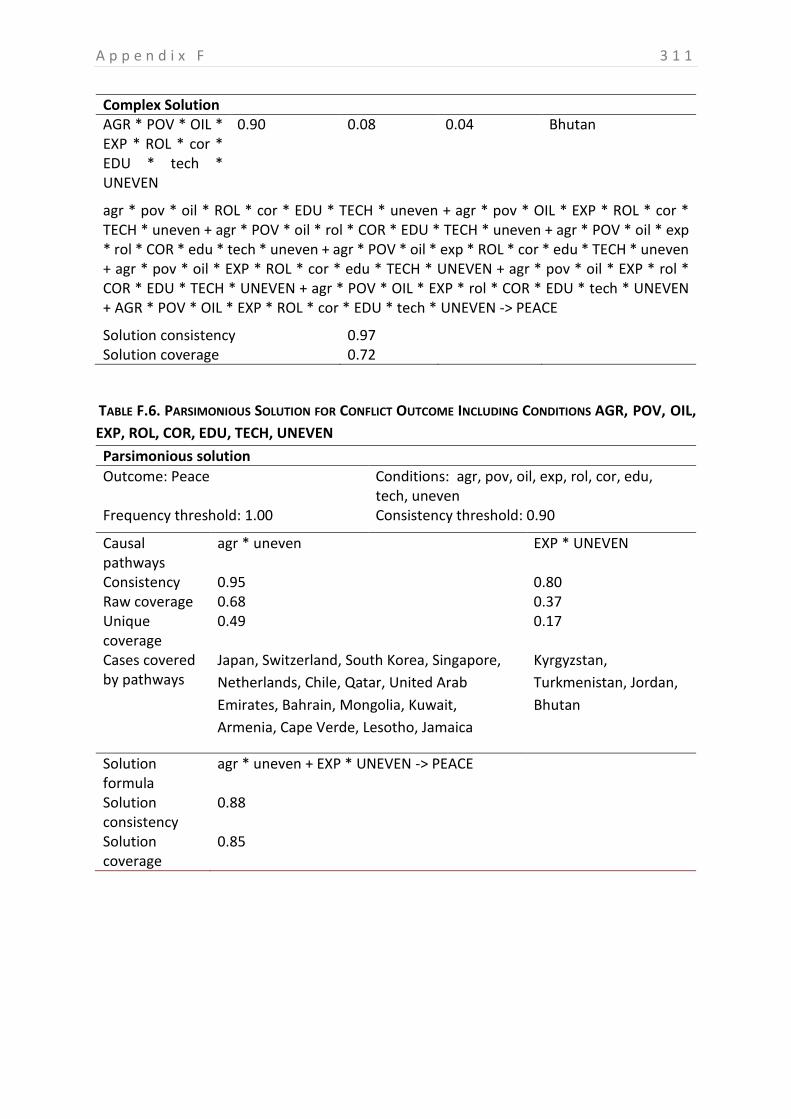
A p p e n d i x F 3 1 1
Complex Solution AGR * POV * OIL * EXP * ROL * cor * EDU * tech * UNEVEN
0.90 0.08 0.04 Bhutan
agr * pov * oil * ROL * cor * EDU * TECH * uneven + agr * pov * OIL * EXP * ROL * cor * TECH * uneven + agr * POV * oil * rol * COR * EDU * TECH * uneven + agr * POV * oil * exp * rol * COR * edu * tech * uneven + agr * POV * oil * exp * ROL * cor * edu * TECH * uneven + agr * pov * oil * EXP * ROL * cor * edu * TECH * UNEVEN + agr * pov * oil * EXP * rol * COR * EDU * TECH * UNEVEN + agr * POV * OIL * EXP * rol * COR * EDU * tech * UNEVEN + AGR * POV * OIL * EXP * ROL * cor * EDU * tech * UNEVEN -> PEACE
Solution consistency 0.97 Solution coverage 0.72
TABLE F.6. PARSIMONIOUS SOLUTION FOR CONFLICT OUTCOME INCLUDING CONDITIONS AGR, POV, OIL,
EXP, ROL, COR, EDU, TECH, UNEVEN
Parsimonious solution
Outcome: Peace Conditions: agr, pov, oil, exp, rol, cor, edu, tech, uneven
Frequency threshold: 1.00 Consistency threshold: 0.90
Causal pathways
agr * uneven EXP * UNEVEN
Consistency 0.95 0.80 Raw coverage 0.68 0.37 Unique coverage
0.49 0.17
Cases covered by pathways
Japan, Switzerland, South Korea, Singapore,
Netherlands, Chile, Qatar, United Arab
Emirates, Bahrain, Mongolia, Kuwait,
Armenia, Cape Verde, Lesotho, Jamaica
Kyrgyzstan,
Turkmenistan, Jordan,
Bhutan
Solution formula
agr * uneven + EXP * UNEVEN -> PEACE
Solution consistency
0.88
Solution coverage
0.85
3 1 2 D u t c h S u m m a r y
Appendix G: Nederlandse Samenvatting/Dutch Summary:
Wegen naar vrede – wegen naar conflict. Een kwalitatieve
vergelijkende analyse van sociale, economische en politieke
voorwaarden bij schaarste aan grondstoffen.
Veroorzaakt klimaatverandering conflicten? Hoewel het publieke debat, dat door
journalisten, internationale organisaties en overheden wordt gevoerd, de notie van
"klimaatoorlogen" ondersteunt en daarbij verwijst naar voorbeelden zoals het conflict in
Darfur, schetst wetenschappelijk onderzoek een complexer beeld. Door de vele invloeden van
de klimaatverandering, behandelt deze vraag een aantal verschillende aspecten, zoals de
gevolgen van extreme weerscondities (bijvoorbeeld overstromingen of tyfoons), van de
stijgende zeespiegel of van veranderingen in temperatuur en neerslag. Ik richt mij op één
verband tussen klimaatverandering en conflict: schaarste aan hulpbronnen die in het
levensonderhoud voorzien zoals landbouwgrond en water. Dit argument raakt aan een
oudere discussie over schaarste aan hulpbronnen en conflict, maar is van hernieuwde
relevantie omdat klimaatverandering het zoetwater en bouwland in veel regio's zal
verminderen. In de literatuur over schaarste aan hulpbronnen en conflicten spelen natuurlijke
hulpbronnen, zoals zoetwater, bodem en bossen een belangrijke rol in het verbinden van de
veranderingen in de natuurlijke omgeving aan sociale gevolgen, zoals gewapende conflicten.
Theorieën over schaarste aan hulpbronnen (Bächler, 1998a; Homer-Dixon, 1999; Kahl, 2008)
stellen dat een gebrek aan hulpbronnen leidt tot volatiele situaties waarin er gemakkelijker
een conflict uitbreekt. Zij stellen dat er verschillende mechanismen zijn die schaarste aan
hulpbronnen en conflicten koppelen, zoals conflict tussen groepen, migratiedruk en
manipulatie van de overheid door machtige groepen.
Verklaringen gericht op conflict tussen groepen betogen dat de concurrentie om schaarse
hulpbronnen de bestaande scheidslijnen in de gemeenschap verergert. Als conflicten in
termen van etnische, sociale, religieuze of politieke groeperingen worden gevat, kan dit
leiden tot een verharding van identiteiten en conflict tussen groepen (A. Martin, Blowers, &
Boersema, 2006). Een tweede mechanisme is gericht op migratiedruk (Homer-Dixon, 1999,
blz. 74). Schaarste moedigt mensen aan om te migreren naar andere gebieden, waar dit kan
leiden tot spanningen tussen degenen die al in het gebied wonen en de nieuwkomers.
Daarnaast kan de instroom van nieuwkomers leiden tot een toenemende spanning in het
nieuwe gebied, wat tot verdere migratie leidt. Het derde mechanisme bestaat uit de
manipulatie van de overheid door machtige groepen (Homer-Dixon, 1999, blz. 74.) Kahl
(2008, blz. 50-51): In een situatie van schaarse hulpbronnen kunnen machtige groepen
geneigd zijn gebruik te maken van hun macht om hun toegang tot schaarse hulpbronnen te
veilig te stellen. Door het manipuleren van overheidsbeleid kunnen ze toegang tot de
hulpbronnen tot zichzelf en hun aanhangers beperken. Dit kan bijdragen aan sociale onrust
of zelfs tot conflict leiden.
D u t c h S u m m a r y 3 1 3
Het is belangrijk om op te merken dat de meeste theorieën over schaarste aan hulpbronnen
geen direct verband leggen tussen de schaarste aan hulpbronnen en conflicten. Het verband
tussen hulpbronnen en conflicten wordt in twijfel getrokken door wetenschappers die
beweren dat dit argument op een soort ecologisch determinisme neerkomt (Barnett, 2000;
Peluso & Watts, 2001a) en dat het de vele manieren waarop mensen zich kunnen aanpassen
aan veranderingen in hun natuurlijke omgeving negeert (Lomborg, 2001).
Het empirische bewijs voor een verband tussen schaarste aan hulpbronnen en gewapende
conflicten is zwak. Er is een aanzienlijke hoeveelheid empirisch onderzoek over het verband
tussen schaarste aan hulpbronnen en gewapende conflicten, maar er zijn geen definitieve
resultaten. Hoewel er veel kwalitatieve casestudies zijn die een sterk verband tussen
schaarste aan hulpbronnen en gewapende conflicten vinden, wordt dit niet ondersteund door
kwantitatieve studies. Deze tegenstelling is de puzzel die ik onderzoek in dit proefschrift. Ik
betoog dat de reden voor deze tegenstelling is dat er verschillende economische, sociale en
politieke condities in de verschillende landen zijn, die in combinatie met de schaarste aan
hulpbronnen optreden. Om bij te dragen aan deze leemte in de literatuur is dit proefschrift
erop gericht de volgende onderzoeksvraag te beantwoorden:
Onder welke combinaties van politieke, sociale en economische condities vindt gewapend
conflict plaats in landen met lage niveaus van zoetwater of bouwland of beide?
Hoewel de meeste kwantitatieve studies politieke, sociale en economische condities per
definitie negeren, , kunnen kwalitatieve studies met een klein aantal cases deze condities niet
vergelijken. Deze kloof kan worden overbrugd door de methode van kwalitatieve
vergelijkende analyse (QCA) omdat deze methode gebruik maakt van conjuncturele logica en
vergelijking van meerdere cases. Door middel van QCA kan ik een aantal sociale, economische
en politieke condities in situaties met/zonder conflict in 30 landen met schaarste aan
hulpbronnen vergelijken, en noodzakelijke en voldoende (combinaties van) condities voor
conflict of vrede bepalen.
Ik gebruik een aanpassingsvermogen kader om de condities die ik opneem in de QCA te
kiezen. Deze zijn gebaseerd op een uitgebreide evaluatie van case studies en de algemene
literatuur over conflict. Ik voeg condities toe uit het debat over aanpassingsvermogen in de
klimaatverandering literatuur, die tot nu weinig aandacht hebben gekregen in het debat over
de schaarste aan hulpbronnen en conflicten. Deze procedure leidt tot 22 condities, met
inbegrip van economische condities (economische ontwikkeling, agrarische bevolking,
armoede, afhankelijkheid van de export, afhankelijkheid van natuurlijke hulpbronnen, de
afhankelijkheid van olie en economische diversificatie), politieke condities (corruptie, hoge
capaciteiten voor belastingen, hoge kwaliteit van politieke instellingen, rechtsstaat,
autoritaire regimes en politieke stabiliteit) en sociale condities (ongelijke economische
ontwikkeling tussen groepen, economische ongelijkheid, ongelijkheid in politieke macht,
genderongelijkheid, toegang tot wetenschap en technologie, een hoog niveau van het hoger
onderwijs en de toegang tot landbouwkundig onderzoek). Deze condities worden
3 1 4 D u t c h S u m m a r y
geanalyseerd in drie afzonderlijke hoofdstukken, gericht op economische, sociale en politieke
verklaringen en worden dan samengebracht in een geïntegreerde analyse.
Ik vergelijk deze voorwaarden in 30 landen78 , die allemaal een laag absoluut niveau van
zoetwater per capita of een laag niveau van gelijkwaardige potentiële landbouwgrond per
capita of allebei hebben. Van de dertig landen, hebben 14 landen gewapende conflicten
tussen 1990 en 2010 ondervonden. Gewapend conflict wordt gedefinieerd als conflict tussen
de staat en één of meerdere gewapende groepen of tussen twee of meer gewapende
groepen, die resulteert in meer dan 25 veldslag doden. Zestien landen hebben geen conflicten
tussen 1990 en 2010 gehad.
Er zijn drie belangrijke economische verklaringen die nauw verbonden zijn met vrede en
conflict. Het eerste argument is gericht op economische ontwikkeling, voornamelijk armoede
en afhankelijkheid van de landbouw, de tweede richt zich op export afhankelijkheden en de
derde op de impact van economische diversificatie. De analyse ondersteunt argumenten die
lage niveaus van ontwikkeling aan conflicten koppelen en vindt dat hoge niveaus van olie
voldoende zijn voor conflict indiend landen niet goed in de wereldeconomie geïntegreerd zijn.
De analyse ondersteunt ook argumenten die hoge niveaus van ontwikkeling en hoge
integratie in de wereldeconomie aan vrede koppelen.
Er zijn verschillende argumenten die aspecten van het politieke systeem aan vrede en conflict
koppelen, voornamelijk gericht op de verschillende aspecten van zwakke staten, zoals (neo)
patrimonialisme, bestuurlijke capaciteiten en het regime type. De analyse bevestigt de
stelling dat (neo)patrimonialisme (gekenmerkt door een autoritair regime, corruptie en lage
niveaus van rechtsorde) gekoppeld is aan conflict en een sterke rechtsorde en lage corruptie
aan vrede.
Er worden twee maatschappelijke condities geanalyseerd: ongelijkheid in de samenleving en
vaardigheden, die nodig zijn om aan te passen aan veranderende condities, zoals kennis,
vakkundig personeel en beschikbare technologieën. De analyse laat zien dat hoge
aanpassingsvaardigheden, met name een hoog gekwalificeerde bevolking, een noodzakelijke
conditie voor vrede zijn als het niveau van ontwikkeling gelijk is tussen groepen. Daarom
vinden de resultaten een groot conflict inperkend effect van aanpassingsvaardigheden en een
belangrijke rol voor de sociaal-economische ongelijkheid tussen groepen.
Het scheiden van economische, politieke en maatschappelijke factoren langs de lijnen van het
aanpassingsvermogen kader beoogde structuur te bieden aan het grote aantal theoretische
verklaringen en mogelijke condities. Bovendien kan het totaal van 22 condities, vanwege
methodologische redenen, niet in een enkele analyse worden geïntegreerd. De laatste
geïntegreerde analyse brengt de economische, politieke en sociale condities samen. Het laat
78 Algerije, Armenië, Bahrein, Bhutan, Burundi, Chili, Djibouti, Egypte, Haïti, Jamaica, Japan, Jemen, Jordanië, Kaapverdië, Kenia, Kirgizië, Koeweit, Lesotho, Mongolië, Nederland, Nepal, Oezbekistan, Pakistan, Qatar, Rwanda, Singapore, Turkmenistan, Verenigde Arabische Emiraten, Zuid-Korea en Zwitserland
D u t c h S u m m a r y 3 1 5
zien dat er drie typen van landen met conflicten zijn: (neo)patrimoniale landen (Oezbekistan,
Burundi, Haïti, Rwanda, Jemen, Kyrgyzstan), minst ontwikkelde landen (Burundi, Haïti,
Rwanda, Nepal, Jemen, Pakistan) en landen rijk aan olie maar slecht geïntegreerd in de
wereldeconomie (Algerije, Kenia, Egypte).
De geïntegreerde analyse toont ook aan dat er twee soorten van landen met schaarste aan
hulpbronnen zijn die vredig blijven: Degenen die niet afhankelijk zijn van de landbouw met
een gelijkwaardigeontwikkeling tussen groepen (Japan, Zwitserland, Zuid-Korea, Singapore,
Nederland, Chili, Qatar, Verenigde Arabische Emiraten, Bahrein, Mongolië, Koeweit, Armenië,
Kaapverdië, Lesotho, Jamaica) en degenen die niet afhankelijk van landbouw en geïntegreerd
in de wereldeconomie zijn met hoge aanpassingsvaardigheden (Qatar, Verenigde Arabische
Emiraten, Turkmenistan, Singapore, Nederland, Zwitserland, Zuid-Korea, Chili, Kirgizië,
Bahrein, Jordanië, Koeweit). Het eerste pad is in lijn met argumenten over de rol van
ontwikkeling voor vrede. Het tweede pad benadrukt het belang van adaptieve vaardigheden
voor vrede. Dit laatste argument heeft tot nu toe weinig aandacht gekregen in de literatuur.
Het proefschrift belicht twee belangrijke thema's in het verklaren van vrede en conflict in
landen met schaarste aan hulpbronnen: het niveau van ontwikkeling en de rol van
autoritarisme, voornamelijk in landen die rijk zijn aan olie. Het laat zien dat ontwikkeling
vooral van belang is voor hoogontwikkelde landen die vredig blijven en voor de minst
ontwikkelde landen die conflicten ervaren. Ontwikkeling speelt een kleinere rol voor landen
met een gemiddeld niveau van ontwikkeling, waar andere verklaringen belangrijker zijn. Als
het gaat om de rol van natuurlijke hulpbronnen (zoals olie) en autoritarisme vindt het
proefschrift weinig steun voor het argument over natuurlijke hulpbronnen als vloek omdat
vele van de olierijke landen vredig blijven, en slechts beperkte ondersteuning voor de rentier
staat argument.
Dit proefschrift draagt bij aan de literatuur over klimaatverandering en conflicten door te
laten zien dat er duidelijke combinaties van condities zijn waaronder conflicten uitbreken in
landen met schaarste aan hulpbronnen. Landen met schaarste aan hulpbronnen blijven
vredig als hun bevolking niet sterk afhankelijk is van de landbouw voor hun levensonderhoud
en het niveau van ontwikkeling relatief gelijk is tussen verschillende groepen in de
maatschappij of als ze niet sterk afhankelijk zijn van de landbouw, maar in hoge mate
geïntegreerd in de wereldeconomie met een hoog niveau van aanpassingsvaardigheden.
Bovendien presenteert het proefschrift met kwalitatieve vergelijkende analyse een methode
om complexe causale verbanden te analyseren, hetgeen tot nu toe niet vaak is toegepast in
de literatuur over conflicten. Het resultaat dat conflicten vaker in landen optreden die sterk
afhankelijk zijn van landbouw wijst ook uit dat de schaarste aan hulpbronnen een causale
factor voor conflict kan zijn. Het proefschrift draagt ook bij aan de literatuur door de invoering
van aanpassingsvaardigheden als een relevante voorwaarde voor conflictpreventie.