
Patents and Trademarks, System Operations Manual, i-STAT ...
424
-
Upload
khangminh22 -
Category
Documents
-
view
0 -
download
0
Transcript of Patents and Trademarks, System Operations Manual, i-STAT ...


i-STAT Alinity – System Operations Manual Art: 746981-01 Rev. E Rev. Date: 23-Apr-2018
Patents: www.abbott.us/patents
Trademarks i-STAT and Alinity are trademarks of the Abbott Group of Companies in various jurisdictions.
Windows is a registered trademark of Microsoft Corporation.
©2018 Abbott Point of Care Inc. All rights reserved. Printed in USA.
Prinsessegracht 202514 AP
Table of Contents
Foreword ixi-STAT ALINITY INSTRUMENT - END USER LICENSE AGREEMENT.................................. x
Regulatory compliance xvSymbols xxvDefinitions and Terminology xxxi
1 - i-STAT Alinity Reference.................................................................................. 1
1.1 - Complete i‑STAT Alinity System Overview 3
1.2 - i-STAT Alinity Instrument 7Principles of Operation.............................................................................................................8More Options..........................................................................................................................10Calibration of the i-STAT Alinity instrument........................................................................23Specifications......................................................................................................................... 24
Wireless Labeling........................................................................................................24Precautions and Limitations................................................................................................... 25Messages and Troubleshooting ............................................................................................. 27Quality Check Failure Codes................................................................................................. 28Cleaning and Disinfecting......................................................................................................39
1.3 - i-STAT Alinity Results Screen 41
1.4 - i-STAT Alinity Rechargeable Battery 45Principles of Operation...........................................................................................................45Specifications......................................................................................................................... 46Precautions and Limitations................................................................................................... 46
1.5 - i-STAT Alinity Base Station 49Specifications......................................................................................................................... 50Precautions and Limitations................................................................................................... 51Troubleshooting .................................................................................................................... 52Cleaning and Disinfecting......................................................................................................52
1.6 - i-STAT Alinity Electronic Simulator 53Principles of Operation...........................................................................................................53Specifications......................................................................................................................... 54Precautions and Limitations................................................................................................... 54Cleaning and Disinfecting......................................................................................................55
iii
i-STAT Alinity — System Operations Manual Art: 745538-01 Rev. L Rev. Date: 12-Nov-2019

1.7 - Perform Electronic Simulator Testing 57Perform the Thermal Probe Check.........................................................................................58
1.8 - i-STAT Alinity Printer 59Principles of Operation...........................................................................................................60Specifications......................................................................................................................... 60Precautions and Limitations................................................................................................... 61Troubleshooting..................................................................................................................... 62Cleaning and Disinfecting......................................................................................................64
1.9 - Manufacturer's Quality System Instructions 65
1.10 - Liquid Quality Controls 67i-STAT Controls.....................................................................................................................67i‑STAT Controls testing......................................................................................................... 68i-STAT Solutions................................................................................................................... 69i-STAT TriControls................................................................................................................70i‑STAT TriControls Control testing.......................................................................................71i-STAT TriControls Control Solutions.................................................................................. 72ACT Controls......................................................................................................................... 73ACT Controls testing............................................................................................................. 74ACT Solutions........................................................................................................................75Evaluating QC Results........................................................................................................... 75
1.11 - Calibration Verification (Cal Ver) 77Calibration Verification testing..............................................................................................78i-STAT Calibration Verification (Cal Ver) Solutions............................................................81
1.12 - i-STAT Cartridges 83Principles of Operation...........................................................................................................83Receiving a New Shipment of Cartridges.............................................................................. 87Specifications......................................................................................................................... 87Precautions and Limitations................................................................................................... 88
1.13 - Software Updates 89Software Update and Installation using USB memory device via Base Station....................89Software Update and Installation via Abbott Managed Cloud (Server) Wired Network
Connection....................................................................................................................93Software Update and Installation via Abbott Managed Cloud (Server) Wireless
Network Connection.....................................................................................................97
1.14 - i-STAT Alinity Charge Station 101Light Indicators.................................................................................................................... 102
iv
i-STAT Alinity — System Operations Manual Art: 745538-01 Rev. L Rev. Date: 12-Nov-2019

Specifications....................................................................................................................... 103Software Update...................................................................................................................104Precautions and Limitations................................................................................................. 105Troubleshooting .................................................................................................................. 106Cleaning and Disinfecting....................................................................................................108
2 - AlinIQ Network Connectivity for i-STAT (NCi).........................................111
2.1 - AlinIQ NCi - Network Connectivity for i‑STAT 113AlinIQ NCi - General Section..............................................................................................115AlinIQ NCi - Proxy Server Connection............................................................................... 117AlinIQ NCi - Wireless Network Connection....................................................................... 119AlinIQ NCi - Wired Network Connection........................................................................... 123AlinIQ NCi - Save the Network Connectivity (ancc) file ...................................................125AlinIQ NCi - Copy NC (ancc) file onto a USB memory stick............................................ 126AlinIQ NCi - Upload an NC (ancc) file to an instrument.................................................... 126AlinIQ NCi - Customization and Connectivity....................................................................127AlinIQ NCi - Determining Success or Failure..................................................................... 127
3 - AlinIQ Customization Workspace for i-STAT (CWi)................................ 129
3.1 - AlinIQ CWi - Customization Workspace for i-STAT 131Workspaces ......................................................................................................................... 131Best Practices....................................................................................................................... 132Getting Started .....................................................................................................................133CWi - Home page.................................................................................................................136
3.2 - Manage Healthcare Organization 137Overview - Healthcare Organization....................................................................................137Best Practices....................................................................................................................... 138Getting Started......................................................................................................................138
3.3 - Manage Users 139Overview.............................................................................................................................. 139Best Practices....................................................................................................................... 139Getting Started......................................................................................................................140
3.4 - Manage and Assemble Profiles 143Best Practices....................................................................................................................... 144Creating a Category..............................................................................................................145*General Settings Category..................................................................................................149
Basic Functions......................................................................................................... 150Date........................................................................................................................... 152Communications........................................................................................................153
v
i-STAT Alinity — System Operations Manual Art: 745538-01 Rev. L Rev. Date: 12-Nov-2019

Operator Actions....................................................................................................... 154Critical Callback........................................................................................................158Print........................................................................................................................... 162i-STAT Reserved.......................................................................................................162Summary................................................................................................................... 163
*Operator Settings Category................................................................................................ 164List Actions............................................................................................................... 168Operator Expiration...................................................................................................171Summary................................................................................................................... 171
*Patient Settings Category................................................................................................... 172ID Entry.....................................................................................................................173Patient Information and Positive Patient Identification (PPID)................................ 175Summary................................................................................................................... 176
*Analyte Settings Category..................................................................................................177Units.......................................................................................................................... 178Sample Types............................................................................................................ 179Ranges....................................................................................................................... 180Enable/Disable Analyte.............................................................................................183Hematocrit................................................................................................................. 184Adjustments...............................................................................................................186ACT (Activated Clotting Time)................................................................................ 187Critical Tests..............................................................................................................188Summary................................................................................................................... 188
*Quality Settings Category ................................................................................................. 189Electronic Simulator..................................................................................................190QC Notifications .......................................................................................................191Liquid QC (Quality Control) Schedules....................................................................196Cal Ver Schedules..................................................................................................... 199Summary................................................................................................................... 201
User Defined Message Category .........................................................................................202Summary................................................................................................................... 203
Training Settings Category...................................................................................................203Basic Functions......................................................................................................... 204Summary................................................................................................................... 206
STATNotes Category...........................................................................................................207Data Entry .................................................................................................................209Selection List ............................................................................................................213Selection List with Text box..................................................................................... 214Mode..........................................................................................................................215Delivery System........................................................................................................ 219Patient Temperature.................................................................................................. 222Manage Sets.............................................................................................................. 223Summary................................................................................................................... 225
Result Notes Category..........................................................................................................226Data Entry .................................................................................................................227Selection List.............................................................................................................230Selection List with Text box..................................................................................... 232Repeat Test Item........................................................................................................233Action Range Comment............................................................................................ 234QC Auto Fail Comment............................................................................................ 235
vi
i-STAT Alinity — System Operations Manual Art: 745538-01 Rev. L Rev. Date: 12-Nov-2019

Manage Sets.............................................................................................................. 236Summary................................................................................................................... 238
Connectivity Settings Category............................................................................................239Connectivity Map...................................................................................................... 240Summary................................................................................................................... 241
Assemble a Profile .............................................................................................................. 242Install a Profile from a USB.................................................................................................244
3.5 - AlinIQ CWi – Customization Workspace for i-STATTroubleshooting 245
4 - Cartridge and Test Information................................................................... 251
4.1 - Cartridge and Test Information 253Cartridge Specifications....................................................................................................... 253
Expected Values........................................................................................................ 269
4.2 - Technical Bulletin - Supplemental Test Information for thei‑STAT Alinity System 273Specific Performance Characteristics - SODIUM............................................................... 274Specific Performance Characteristics - POTASSIUM.........................................................276Specific Performance Characteristics - HEMATOCRIT..................................................... 278Specific Performance Characteristics - LACTATE............................................................. 280Specific Performance Characteristics - pH.......................................................................... 282Specific Performance Characteristics - PCO2..................................................................... 284Specific Performance Characteristics - PO2........................................................................ 286Specific Performance Characteristics - CHLORIDE........................................................... 288Specific Performance Characteristics - IONIZED CALCIUM............................................290Specific Performance Characteristics - GLUCOSE.............................................................292Specific Performance Characteristics - BUN.......................................................................294Specific Performance Characteristics - CREATININE and ESTIMATED
GLOMERULAR FILTRATION RATE.................................................................... 296Specific Performance Characteristics - TCO2..................................................................... 299Specific Performance Characteristics - Kaolin Activated Clotting Time (KaolinACT) ....... 301REFERENCES.....................................................................................................................305
vii
i-STAT Alinity — System Operations Manual Art: 745538-01 Rev. L Rev. Date: 12-Nov-2019

viii
i-STAT Alinity — System Operations Manual Art: 745538-01 Rev. L Rev. Date: 12-Nov-2019

ForewordThe Abbott i‑STAT Alinity system is designed to function consistently and dependably from day to day.It is supported by dedicated professionals who excel in engineering, medical technology, training, andservice.
Abbott Point of Care is dedicated to manufacturing high-quality and reliable instrumentation. We lookforward to serving your needs.
ix
i-STAT Alinity — System Operations Manual Art: 746982-01 Rev. D Rev. Date: 25-Sep-2017

i-STAT ALINITY INSTRUMENT - END USER LICENSEAGREEMENT
Please read the EULA prior to using this device. Your use of the device is conditioned upon youracceptance of the terms of the EULA.
Any use of this device shall indicate your acceptance of the terms of the EULA.
If you do not accept the terms of the EULA, do not use this device.
The Software, and all intellectual property rights therein, is owned by APOC and its licensors. You maynot (i) use the Software to access or attempt to access any other APOC systems, programs or data that arenot made available for public use; (ii) copy, reproduce, alter, merge, modify, adapt, translate, republish,upload, post, transmit, resell or distribute in any way the Software (or the Devices) or decompile, reverseengineer, disassemble, or otherwise reduce the Software to a human perceivable form; (iii) permit anythird party to benefit from the use or functionality of the Software via a rental, lease, timesharing, servicebureau, or other arrangement; (iv) transfer any of the rights granted to you under this EULA; (v) workaround any technical limitations in the Software, use any tool to enable features or functionalities that areotherwise disabled in the Software, or decompile, disassemble, or otherwise reverse engineer the Softwareexcept as otherwise permitted by applicable law; (vi) perform or attempt to perform any actions thatwould interfere with the proper working of the Software; or (vii) otherwise use the Software except asexpressly allowed under the EULA.
The Software is provided “As Is” without warranty of any kind. TO THE MAXIMUM EXTENTPERMITTED BY APPLICABLE LAW, APOC AND SUPPLIERS SHALL NOT BE LIABLEFOR ANY INDIRECT, SPECIAL, INCIDENTAL, PUNITIVE, EXEMPLARY, ORCONSEQUENTIAL DAMAGES OR FOR ANY DAMAGES RELATING TO LOSS OFBUSINESS, TELECOMMUNICATION FAILURES, THE LOSS, CORRUPTION OR THEFT OFDATA, VIRUSES, SPYWARE, LOSS OF PROFITS OR INVESTMENT, USE OF THESOFTWARE WITH HARDWARE OR OTHER SOFTWARE THAT DOES NOT MEET APOC’SSYSTEMS REQUIREMENTS OR THE LIKE, WHETHER BASED IN CONTRACT, TORT(INCLUDING NEGLIGENCE), PRODUCT LIABILITY OR OTHERWISE, EVEN IF APOCAND/OR ITS SUPPLIERS, OR EITHER OF THEIR REPRESENTATIVES HAVE BEENADVISED OF THE POSSIBILITY OF SUCH DAMAGES, AND EVEN IF A REMEDY SETFORTH HEREIN IS FOUND TO HAVE FAILED OF ITS ESSENTIAL PURPOSE. SOMESTATES DO NOT ALLOW THE LIMITATION AND/OR EXCLUSION OF LIABILITY FORINCIDENTAL OR CONSEQUENTIAL DAMAGES, SO THE ABOVE LIMITATION OREXCLUSION MAY NOT APPLY TO YOU.
PLEASE READ THIS END USER LICENSE AGREEMENT (“EULA”) BEFORE USING THEDEVICE. USE OF THE DEVICE INDICATES END USER’S ACCEPTANCE OF THIS EULA.ACCEPTANCE OF THIS AGREEMENT IS A CONDITION TO THE RIGHTS GRANTEDHEREIN. IF END USER DOES NOT AGREE WITH THE TERMS OF THIS EULA, END USERSHOULD NOT USE THE DEVICE.
1. INTRODUCTION. Thank you for selecting the i-STAT Analyzer (which includes certain softwarecomponents (collectively, the “Device”). This EULA is a legal agreement between you (“you”, “EndUser”), and Abbott Point of Care Inc. (“APOC”, “we”, “our” or “us”) that describes the terms andconditions applicable to your use of the software installed on or used in connection with the Device,including any software already pre-installed on the Device, software that you may download from
x
i-STAT Alinity — System Operations Manual Art: 746982-01 Rev. D Rev. Date: 25-Sep-2017

https://www.pointofcare.abbott/int/en/i-stat-alinity-support, tools and web-based components,together with all modifications, enhancements, updates or upgrades thereof (collectively,the“Software”).
2. LICENSE GRANT AND RESTRICTIONS. Subject to the terms and conditions of this EULA,APOC grants you a personal, limited, non-exclusive, non-transferable, non-assignable license,during the Term (as defined in Section 4), to electronically access and use the Software, for the solepurpose of using the Device solely in accordance with the Systems Operations Manual (the“Manual”) . You are not licensed or permitted under this EULA to do any of the following and shallnot allow any third party to do any of the following: (i) access or attempt to access any other APOCsystems, programs or data that are not made available for public use; (ii) copy, reproduce, alter,merge, modify, adapt, translate, republish, upload, post, transmit, resell or distribute in any way theSoftware (or the Devices) or decompile, reverse engineer, disassemble, or otherwise reduce theSoftware to a human perceivable form; (iii) permit any third party to benefit from the use orfunctionality of the Software via a rental, lease, timesharing, service bureau, or other arrangement;(iv) transfer any of the rights granted to you under this EULA; (v) work around any technicallimitations in the Software, use any tool to enable features or functionalities that are otherwisedisabled in the Software, or decompile, disassemble, or otherwise reverse engineer the Softwareexcept as otherwise permitted by applicable law; (vi) perform or attempt to perform any actions thatwould interfere with the proper working of the Software; or (vii) otherwise use the Software exceptas expressly allowed under this Section 2.
3. RESERVATION OF RIGHTS AND OWNERSHIP. The Software is licensed not sold, andAPOC reserves all rights not expressly granted to you in this EULA. The Software is the proprietaryand confidential property of APOC and its licensors and is protected by copyright, trade secret andother intellectual property laws. APOC and its licensors own the title, copyright, and otherworldwide intellectual property rights in the Software and all copies of the Software. This EULAdoes not grant you any rights to trademarks or service marks of APOC.
4. TERM AND TERMINATION. The Software is licensed during the time that the Devices are beingused by End User, subject to compliance with the terms of this EULA and the Manual (the “Term”).This EULA shall terminate automatically if you fail to comply with any of its terms or conditions,including, without limitation, if you make any attempts to copy the Software, or transfer any copy ofthe Software or any portion thereof to another party or any attempt to modify the Software in anyway. Upon termination you must immediately cease using the Software. Any termination of thisEULA shall not affect APOC’s rights hereunder.
5. PRIVACY. For details about our privacy policies, please refer to the Privacy Policy contained at www.pointofcare.abbott (“Privacy Policy”). You agree to be bound by the Privacy Policy, as it maybe amended from time to time in accordance with its terms.
6. DISCLAIMER OF WARRANTIES. EXCEPT AS EXPRESSLY PROVIDED HEREIN, THESOFTWARE, SERVICES, AND ANY CONTENT ACCESSIBLE THROUGH THE SOFTWAREARE PROVIDED “AS-IS” AND, TO THE MAXIMUM EXTENT PERMITTED BYAPPLICABLE LAW, APOC, ITS AFFILIATES, LICENSORS, THIRD-PARTY CONTENT ORSERVICE PROVIDERS, DEALERS AND SUPPLIERS (IF ANY), (APOC, et al ARECOLLECTIVELY REFERRED TO HEREIN AS THE “SUPPLIERS”) DISCLAIM ALLGUARANTEES AND WARRANTIES, WHETHER EXPRESS, IMPLIED OR STATUTORY,REGARDING THE SOFTWARE, SERVICES, CONTENT, AND RELATED MATERIALS,INCLUDING ANY WARRANTY OF FITNESS FOR A PARTICULAR PURPOSE, TITLE,MERCHANTABILITY, AND NON-INFRINGEMENT. WITHOUT LIMITING THEGENERALITY OF THE FOREGOING, APOC MAKES NO WARRANTY, AND PROVIDES NOASSURANCE, THAT THE SOFTWARE WILL MEET CERTIFICATION REQUIREMENTS OFANY REGULATORY AUTHORITY OR OTHER ASSOCIATION LICENSING AGENCY,
xi
i-STAT Alinity — System Operations Manual Art: 746982-01 Rev. D Rev. Date: 25-Sep-2017

WITHIN OR OUTSIDE OF THE UNITED STATES. APOC DOES NOT WARRANT THAT THESOFTWARE IS SECURE OR FREE FROM BUGS, VIRUSES, INTERRUPTION, OR ERRORS,OR THAT THE SOFTWARE WILL MEET YOUR REQUIREMENTS. APOC DOES NOTWARRANT THAT THE USE OF THE SOFTWARE WILL BE UNINTERRUPTED OR ERRORFREE. SOME STATES DO NOT ALLOW THE EXCLUSION OF IMPLIED WARRANTIES, SOTHE ABOVE EXCLUSIONS MAY NOT APPLY TO YOU. IN THAT EVENT, ANY IMPLIEDWARRANTIES ARE LIMITED IN DURATION TO 60 DAYS FROM THE DATE OFPURCHASE OR DELIVERY OF THE SOFTWARE, AS APPLICABLE. HOWEVER, SOMESTATES DO NOT ALLOW LIMITATIONS ON HOW LONG AN IMPLIED WARRANTYLASTS, SO THE ABOVE LIMITATION MAY NOT APPLY TO YOU. THIS WARRANTYGIVES YOU SPECIFIC LEGAL RIGHTS, AND YOU MAY HAVE OTHER RIGHTS THATVARY FROM STATE TO STATE.
7. LIMITATION OF LIABILITY AND DAMAGES. THE ENTIRE CUMULATIVE LIABILITYOF APOC AND SUPPLIERS FOR ANY REASON ARISING FROM OR RELATING TO THISEULA SHALL BE LIMITED TO FIVE HUNDRED DOLLARS OR THE AMOUNT PAID BYYOU FOR THE SOFTWARE, WHICHEVER IS LESS. TO THE MAXIMUM EXTENTPERMITTED BY APPLICABLE LAW, APOC AND SUPPLIERS SHALL NOT BE LIABLE FORANY INDIRECT, SPECIAL, INCIDENTAL, PUNITIVE, EXEMPLARY, OR CONSEQUENTIALDAMAGES OR FOR ANY DAMAGES RELATING TO LOSS OF BUSINESS,TELECOMMUNICATION FAILURES, THE LOSS, CORRUPTION OR THEFT OF DATA,VIRUSES, SPYWARE, LOSS OF PROFITS OR INVESTMENT, USE OF THE SOFTWAREWITH HARDWARE OR OTHER SOFTWARE THAT DOES NOT MEET APOC’S SYSTEMSREQUIREMENTS OR THE LIKE, WHETHER BASED IN CONTRACT, TORT (INCLUDINGNEGLIGENCE), PRODUCT LIABILITY OR OTHERWISE, EVEN IF APOC AND/OR ITSSUPPLIERS, OR EITHER OF THEIR REPRESENTATIVES HAVE BEEN ADVISED OF THEPOSSIBILITY OF SUCH DAMAGES, AND EVEN IF A REMEDY SET FORTH HEREIN ISFOUND TO HAVE FAILED OF ITS ESSENTIAL PURPOSE. SOME STATES DO NOT ALLOWTHE LIMITATION AND/OR EXCLUSION OF LIABILITY FOR INCIDENTAL ORCONSEQUENTIAL DAMAGES, SO THE ABOVE LIMITATION OR EXCLUSION MAY NOTAPPLY TO YOU.
8. AUDIT. You agree that APOC may audit End User’s use of the Software for compliance with theseterms at any time, upon reasonable notice. In the event that such audit reveals any use of theSoftware by You other than in full compliance with the terms of this EULA, End User shallreimburse APOC for all reasonable expense related to such audit in addition to any other liabilitiesEnd User may incur as a result of such non-compliance.
9. AMENDMENT. APOC shall have the right, to change or add to the terms of this EULA at any timeupon notice by any means APOC determines in its discretion to be reasonable, including postinginformation concerning any such change, addition, deletion, discontinuance or conditions inSoftware or on any APOC sponsored web site. Any use of the Software by you after APOC’spublication of any such changes shall constitute your acceptance of this EULA as modified.
10. EXPORT LAW. The Software is subject to U.S. export control laws and may be subject to exportor import regulations in other countries. Unless in compliance with applicable law and specificallyauthorized in writing by the APOC prior to any Software access, You shall not export the Softwareunder any circumstances whatsoever. In any case, You will indemnify and hold the APOC harmlessfrom any and all claims, losses, liabilities, damages, fines, penalties, costs and expenses (includingreasonable attorney’s fees) arising from, or relating to, any breach by You of any of Yourobligations under this section.
11. MISCELLANEOUS. Except as expressly set forth in this EULA, this EULA is a completestatement of the EULA between you and APOC and sets forth the entire liability of APOC and
xii
i-STAT Alinity — System Operations Manual Art: 746982-01 Rev. D Rev. Date: 25-Sep-2017

Suppliers, and your exclusive remedy with respect to the Software, and its use. Suppliers and theiragents, employees, distributors, and dealers are not authorized to make modifications to this EULA,or to make any additional representations, commitments, or warranties binding on APOC. Thewaiver by either party of a breach of any provision of this Agreement or the failure by either party toexercise any right hereunder shall not operate or be construed as a waiver of any subsequent breachof that right or as a waiver of any other right. Any waiver of the terms herein by APOC must be in awriting signed by an authorized officer of APOC and expressly referencing the applicable provisionsof this EULA. If any provisions of this EULA are determined to be invalid or unenforceable underapplicable law, such provision shall be ineffective to the limited extent of such invalidity orunenforceability, without rendering invalid or unenforceable the remaining provisions of this EULA.If a court of competent jurisdiction declares any such provisions to be invalid or unenforceable, theparties hereto shall request that such court reduce the scope, delete specific words or phrases fromthe provision, or replace the provision with a provision that is valid and enforceable and that comesclosest to expressing the original intention of the parties hereto, and this EULA shall be enforceableas so modified in the court in which the provision was declared invalid or unenforceable. ThisEULA will be governed by the laws of the state of Illinois as applied to agreements entered into andto be performed entirely within Illinois, without regard to its choice of law or conflicts of lawprinciples that would require the application of law of a different jurisdiction, and applicable federallaw. Neither this EULA nor any of Your rights or obligations hereunder may be assigned by You inwhole or in part without the prior written approval of APOC. Any other attempted assignment shallbe null and void. Headings are included for convenience only, and shall not be considered ininterpreting this EULA. As used in this EULA, the word including means including but not limitedto. This EULA does not limit any rights that APOC may have under trade secret, copyright, patent orother laws. The provisions of Sections 2, 5, 6, 7, 8 and 11 shall survive the termination of thisEULA.
xiii
i-STAT Alinity — System Operations Manual Art: 746982-01 Rev. D Rev. Date: 25-Sep-2017

xiv
i-STAT Alinity — System Operations Manual Art: 746982-01 Rev. D Rev. Date: 25-Sep-2017
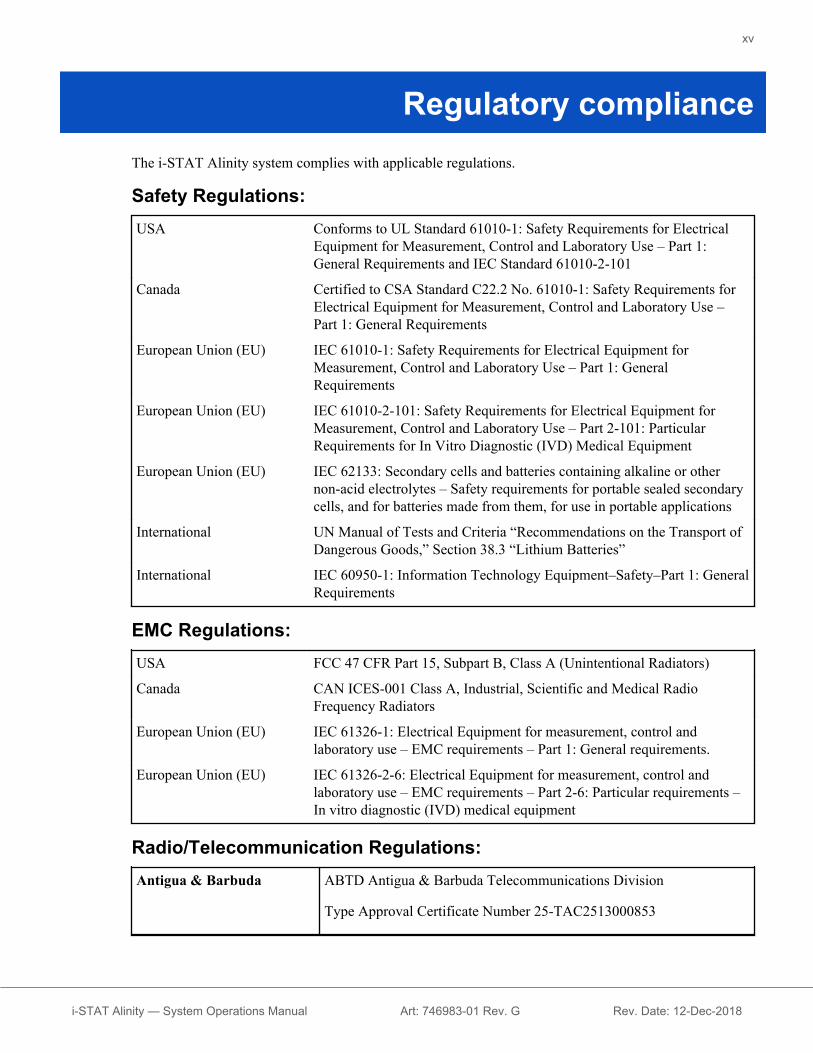
Regulatory complianceThe i‑STAT Alinity system complies with applicable regulations.
Safety Regulations:USA Conforms to UL Standard 61010-1: Safety Requirements for Electrical
Equipment for Measurement, Control and Laboratory Use – Part 1:General Requirements and IEC Standard 61010-2-101
Canada Certified to CSA Standard C22.2 No. 61010-1: Safety Requirements forElectrical Equipment for Measurement, Control and Laboratory Use –Part 1: General Requirements
European Union (EU) IEC 61010-1: Safety Requirements for Electrical Equipment forMeasurement, Control and Laboratory Use – Part 1: GeneralRequirements
European Union (EU) IEC 61010-2-101: Safety Requirements for Electrical Equipment forMeasurement, Control and Laboratory Use – Part 2-101: ParticularRequirements for In Vitro Diagnostic (IVD) Medical Equipment
European Union (EU) IEC 62133: Secondary cells and batteries containing alkaline or othernon-acid electrolytes – Safety requirements for portable sealed secondarycells, and for batteries made from them, for use in portable applications
International UN Manual of Tests and Criteria “Recommendations on the Transport ofDangerous Goods,” Section 38.3 “Lithium Batteries”
International IEC 60950-1: Information Technology Equipment–Safety–Part 1: GeneralRequirements
EMC Regulations:USA FCC 47 CFR Part 15, Subpart B, Class A (Unintentional Radiators)
Canada CAN ICES-001 Class A, Industrial, Scientific and Medical RadioFrequency Radiators
European Union (EU) IEC 61326-1: Electrical Equipment for measurement, control andlaboratory use – EMC requirements – Part 1: General requirements.
European Union (EU) IEC 61326-2-6: Electrical Equipment for measurement, control andlaboratory use – EMC requirements – Part 2-6: Particular requirements –In vitro diagnostic (IVD) medical equipment
Radio/Telecommunication Regulations:Antigua & Barbuda ABTD Antigua & Barbuda Telecommunications Division
Type Approval Certificate Number 25-TAC2513000853
xv
i-STAT Alinity — System Operations Manual Art: 746983-01 Rev. G Rev. Date: 12-Dec-2018
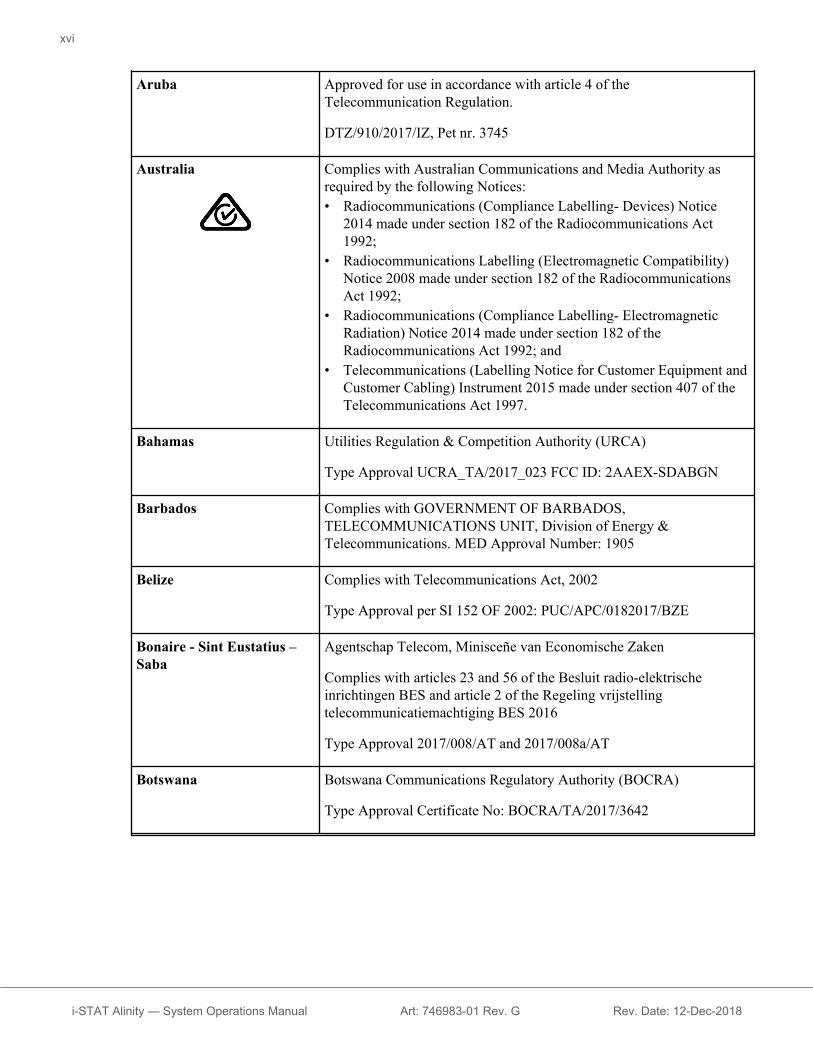
Aruba Approved for use in accordance with article 4 of theTelecommunication Regulation.
DTZ/910/2017/IZ, Pet nr. 3745
Australia Complies with Australian Communications and Media Authority asrequired by the following Notices:• Radiocommunications (Compliance Labelling- Devices) Notice
2014 made under section 182 of the Radiocommunications Act1992;
• Radiocommunications Labelling (Electromagnetic Compatibility)Notice 2008 made under section 182 of the RadiocommunicationsAct 1992;
• Radiocommunications (Compliance Labelling- ElectromagneticRadiation) Notice 2014 made under section 182 of theRadiocommunications Act 1992; and
• Telecommunications (Labelling Notice for Customer Equipment andCustomer Cabling) Instrument 2015 made under section 407 of theTelecommunications Act 1997.
Bahamas Utilities Regulation & Competition Authority (URCA)
Type Approval UCRA_TA/2017_023 FCC ID: 2AAEX-SDABGN
Barbados Complies with GOVERNMENT OF BARBADOS,TELECOMMUNICATIONS UNIT, Division of Energy &Telecommunications. MED Approval Number: 1905
Belize Complies with Telecommunications Act, 2002
Type Approval per SI 152 OF 2002: PUC/APC/0182017/BZE
Bonaire - Sint Eustatius –Saba
Agentschap Telecom, Minisceñe van Economische Zaken
Complies with articles 23 and 56 of the Besluit radio-elektrischeinrichtingen BES and article 2 of the Regeling vrijstellingtelecommunicatiemachtiging BES 2016
Type Approval 2017/008/AT and 2017/008a/AT
Botswana Botswana Communications Regulatory Authority (BOCRA)
Type Approval Certificate No: BOCRA/TA/2017/3642
xvi
i-STAT Alinity — System Operations Manual Art: 746983-01 Rev. G Rev. Date: 12-Dec-2018

British Virgin Islands Telecommunications Regulatory Commission
Granted Equipment Type Approval for FCC Identifier 2AAEX-SDABGN in accordance with section 42 of the TelecommunicationsAct 2006.
Type Approval Number: VRGTA/011/2017
Brunei AITI Authority for Info-communications Technology Industry ofBrunei Darussalam
Equipment Registration Certificate DRQ-D-BRUSIN-03-1998-7494-LPD-39421
Burkina Faso ARCEP Type Approval 2017-000031
Autorite de Regulation des Communications Electroniques et des Postes
Authority of Regulations of Communications Electronic and Posts
Canada Industry Canada RSS 210: Licence-Exempt Radio Apparatus:
Category I Equipment
Certification No.: 7228C-SDABGN
Cayman Islands Utility Regulation and Competition Office
GRANT OF EQUIPMENT AUTHORISATION IN THE CAYMANISLANDS
Certificate. No: KY1504003
Colombia Communications Regulatory Commission (CRC) - Exempt
Curacao Director Bureau Telecommunicatie en Post
Type Approval Nos. 2017/054/TA and 2017/054a/TA
Dominica National Telecommunications Regulatory Commission (NTRC)
Type Approval No. DMA-0217-0539p
Dominican Republic Istituto Dominicano de las Telecomunicaciones (INDOTEL)
Type Approval 17003658
Egypt NTRA National Telecom Regulatory Authority
xvii
i-STAT Alinity — System Operations Manual Art: 746983-01 Rev. G Rev. Date: 12-Dec-2018
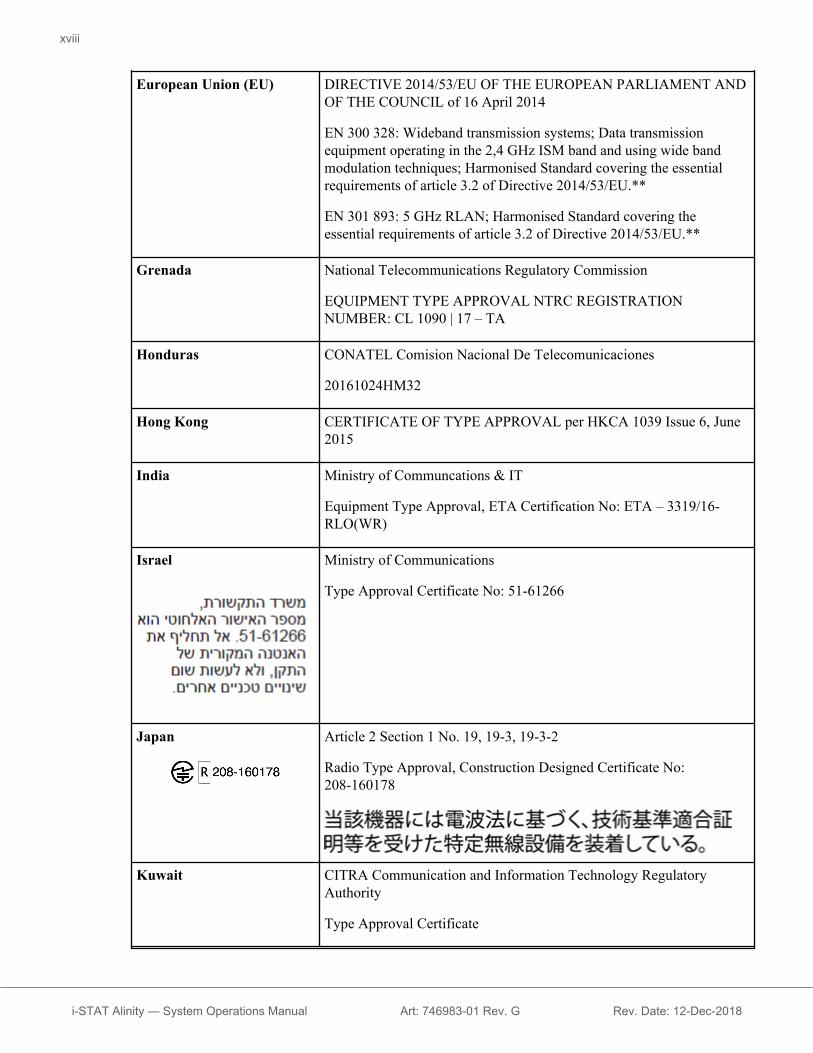
European Union (EU) DIRECTIVE 2014/53/EU OF THE EUROPEAN PARLIAMENT ANDOF THE COUNCIL of 16 April 2014
EN 300 328: Wideband transmission systems; Data transmissionequipment operating in the 2,4 GHz ISM band and using wide bandmodulation techniques; Harmonised Standard covering the essentialrequirements of article 3.2 of Directive 2014/53/EU.**
EN 301 893: 5 GHz RLAN; Harmonised Standard covering theessential requirements of article 3.2 of Directive 2014/53/EU.**
Grenada National Telecommunications Regulatory Commission
EQUIPMENT TYPE APPROVAL NTRC REGISTRATIONNUMBER: CL 1090 | 17 – TA
Honduras CONATEL Comision Nacional De Telecomunicaciones
20161024HM32
Hong Kong CERTIFICATE OF TYPE APPROVAL per HKCA 1039 Issue 6, June2015
India Ministry of Communcations & IT
Equipment Type Approval, ETA Certification No: ETA – 3319/16-RLO(WR)
Israel Ministry of Communications
Type Approval Certificate No: 51-61266
Japan Article 2 Section 1 No. 19, 19-3, 19-3-2
Radio Type Approval, Construction Designed Certificate No:208-160178
Kuwait CITRA Communication and Information Technology RegulatoryAuthority
Type Approval Certificate
xviii
i-STAT Alinity — System Operations Manual Art: 746983-01 Rev. G Rev. Date: 12-Dec-2018

Lebanon Ministry of Telecommunications Approval 1031-16-041
Lesotho Lesotho Communications Authority
Lesotho Communications Authority Act 2012, Section 5
Libya General Authority for Communications
Type Approval Certificate No. 343-C1-2017
Madagascar Autorite de Regulation des Technologies de Communication (ARTEC)
No 17/026/ARTEC/DG/DHCT/SSS/test
Mauritius Information & Communication Technologies Authority (ICTA)
Type Approval Certificate Reference Number: TA/2017/0214
Mexico Instituto Federal de Telecomunicaciones (IFT)
Certificate No: RCPISAN18-1533
Certificado de Producto Nuevo de Conformidad con Norma OficialMexicana
Certificate No: 1802CE09991
Morocco Numéro d’agrément : MR 12797
Date d’agrément : ANRT 2016
Mozambique Instituto Nacional das Comunicacoes de Mocambique (INCM)
Telecommunication and Radiocommunications Agreements approvedby Decree 37/2009 of 13 August
No. 1/R/IMS/2017
New Zealand Conforms to: Ministry of Business, Innovation & Employment, RadioSpectrum Management as required by notices under:• Section 134 (1) (g) of the New Zealand Radiocommunications Act
1989
Oman Telecommunication Regulatory Authority, Approval Number:TRA/TA-R/4501/17
xix
i-STAT Alinity — System Operations Manual Art: 746983-01 Rev. G Rev. Date: 12-Dec-2018

Pakistan Pakistan Telecommunication Authority (PTA), Type ApprovalCertificate TAC NO: 9.197/2017
Peru Ministerio De Transportes Y Comunicaciones, Certificado DeHomologacion, Code: TRSS39479, Report: 2158-2017-MTC/29.CGH.CH
Applied Technical Standard: PNAF-R.M. No. 187-2005-MTC/03, pub.04/03/2005 – R.M. No. 777-2005-MTC/03, pub. 11/05/2005
Philippines National Telecommunications Commission
Type Acceptance Certificate No. ESD-1714467C
Qatar Communications Regulatory Authority
Certificate of Type Approval CRA/SA/2016/R-5837
Saudi Arabia Ministry of Communication and Information Technology (MCIT)
Conformity Certificate TA 24012017-24012019-18944
Serbia Confirmation of Conformity – R&TTE Number P1617182700
Singapore Info-communications Media Development Authority
Regulation 20(6) of the Telecommunications (Dealers) Regulations(Cap 323, Rg 6)
Registration Number: N0123-17 (5 GHz)
Registration Number: N0074-17 (2.4 GHz)
Sri Lanka Telecommunications Regulatory Commission of Sri Lanka, TRC/SM/MISC/00041/17/WIFI-106
xx
i-STAT Alinity — System Operations Manual Art: 746983-01 Rev. G Rev. Date: 12-Dec-2018

St. Lucia National Telecommunications Regulatory Commission (Saint Lucia)
Telecommunications (Terminal Equipment and Public Networks)Regulations, No. 10 or 2002
Certification of Type Approval, Certificate No.:LCT/AP17.118D
St. Maarten Bureau of Telecommunication and Post
Type Approval Certificate no 2017/018-b/TA
St. Vincent & theGrenadines
National Telecommunications Regulatory Commission
Telecommunications (Terminal Equipment and Public Networks)Regulations, No. 13 of 2002
Certificate of Type Approval, Certificate No.: SVG_050520171055
Turks and Caicos Turks and Caicos Islands Telecommunication Commission
Approval Certification under TCITC Ordinance PART V
United Arab Emirates Telecommunications Regulatory Authority
Telecom Equipment Registration Certificate ER53962/17 under LawNo.3 of 2003
Uganda Uganda Communications Commission Type Approved
USA FCC 47 CFR Part 15, Subpart C - Intentional Radiators
FCC 47 CFR Part 15, Subpart E - Unlicensed National InformationInfrastructure Devices
FCC ID: 2AAEX-SDABGN
xxi
i-STAT Alinity — System Operations Manual Art: 746983-01 Rev. G Rev. Date: 12-Dec-2018
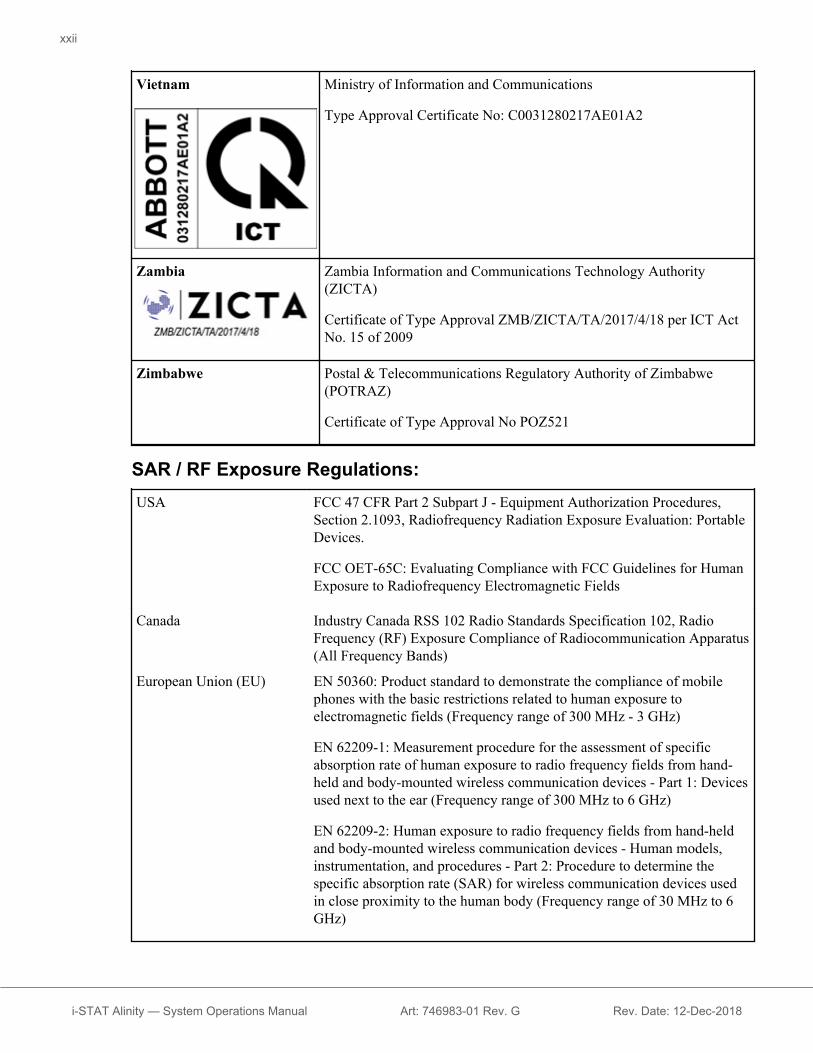
Vietnam Ministry of Information and Communications
Type Approval Certificate No: C0031280217AE01A2
Zambia Zambia Information and Communications Technology Authority(ZICTA)
Certificate of Type Approval ZMB/ZICTA/TA/2017/4/18 per ICT ActNo. 15 of 2009
Zimbabwe Postal & Telecommunications Regulatory Authority of Zimbabwe(POTRAZ)
Certificate of Type Approval No POZ521
SAR / RF Exposure Regulations:USA FCC 47 CFR Part 2 Subpart J - Equipment Authorization Procedures,
Section 2.1093, Radiofrequency Radiation Exposure Evaluation: PortableDevices.
FCC OET-65C: Evaluating Compliance with FCC Guidelines for HumanExposure to Radiofrequency Electromagnetic Fields
Canada Industry Canada RSS 102 Radio Standards Specification 102, RadioFrequency (RF) Exposure Compliance of Radiocommunication Apparatus(All Frequency Bands)
European Union (EU) EN 50360: Product standard to demonstrate the compliance of mobilephones with the basic restrictions related to human exposure toelectromagnetic fields (Frequency range of 300 MHz - 3 GHz)
EN 62209-1: Measurement procedure for the assessment of specificabsorption rate of human exposure to radio frequency fields from hand-held and body-mounted wireless communication devices - Part 1: Devicesused next to the ear (Frequency range of 300 MHz to 6 GHz)
EN 62209-2: Human exposure to radio frequency fields from hand-heldand body-mounted wireless communication devices - Human models,instrumentation, and procedures - Part 2: Procedure to determine thespecific absorption rate (SAR) for wireless communication devices usedin close proximity to the human body (Frequency range of 30 MHz to 6GHz)
xxii
i-STAT Alinity — System Operations Manual Art: 746983-01 Rev. G Rev. Date: 12-Dec-2018

Environmental Regulations:European Union (EU) RoHS Directive 2011/65/EU
European Union (EU) WEEE Directive 2012/19/EU
European Union (EU) REACH Regulation 1907/2006/EC
European Union (EU) Packaging and Packaging Waste Directive 94/62/EC
Federal Communications Commission (FCC) Statement(United States only)
This equipment has been tested and found to comply with the limits for a Class A digital device, pursuantto Part 15 of the Federal Communications Commission (FCC) Rules. These limits are designed to providereasonable protection against harmful interference when the equipment is operated in a commercialenvironment.
This equipment generates, uses, and can radiate radio frequency energy and, if not installed and used inaccordance with the operator’s manual, can cause harmful interference to radio communications.Operation of this equipment in a residential area is likely to cause harmful interference in which case youwill be required to correct the interference, at your own expense.
Changes or modifications not expressly approved by the manufacturer could void your authority tooperate the equipment.
Canadian Department of Communications Industry Canada Notice(Canada only)
This Class A digital apparatus complies with Canadian ICES-001.
FCC Part 15 / Industry Canada Information:This device complies with Part 15 Subpart C and Subpart E of FCC Rules and Industry Canada licence-exempt RSS-210 standard(s). Operation is subject to the following two conditions:
(1) This device may not cause harmful interference, and(2) This device must accept any interference, including interference that may cause undesiredoperation of this device.
This product contains transmitter module:FCC ID: 2AAEX-SDABGNIC: 7228C-SDABGN
SAR / RF Exposure Notice:This equipment complies with FCC/IC radiation exposure limits set forth for an uncontrolled environmentand meets the FCC radio frequency (RF) Exposure Guidelines in Supplement C to OET-65 and RSS-102of the IC (Industry Canada) radio frequency (RF) Exposure rules.
Under Industry Canada regulations, this radio transmitter may only operate using an antenna of a type andmaximum (or lesser) gain approved for the transmitter by Industry Canada. To reduce potential radio
xxiii
i-STAT Alinity — System Operations Manual Art: 746983-01 Rev. G Rev. Date: 12-Dec-2018
interference to other users, the antenna type and its gain should be so chosen that the equivalentisotropically radiated power (e.i.r.p.) is not more than that necessary for successful communication.
This radio transmitter (identify the device by certification number, or model number if Category II) hasbeen approved by Industry Canada to operate with the antenna types listed below with the maximumpermissible gain and required antenna impedance for each antenna type indicated. Antenna types notincluded in this list, having a gain greater than the maximum gain indicated for that type, are strictlyprohibited for use with this device.
For product available in the USA/Canada market, only channels 1-11 can be operated. Selection of otherchannels is not possible.
If this device is to be operated in the 5.15~5.25GHz frequency range, it is restricted to indoorenvironments only.
Antenna: Laird Technologies, Mini-NanoBlade
Antenna gain information: Embedded Antenna: 2.5dBi (2.4 GHz), 4.8dBi (5 GHz)
Frequency Tolerance:+/-20ppm
** See website for Declaration of Conformity for associated EMC/RED/LVD standards.
xxiv
i-STAT Alinity — System Operations Manual Art: 746983-01 Rev. G Rev. Date: 12-Dec-2018
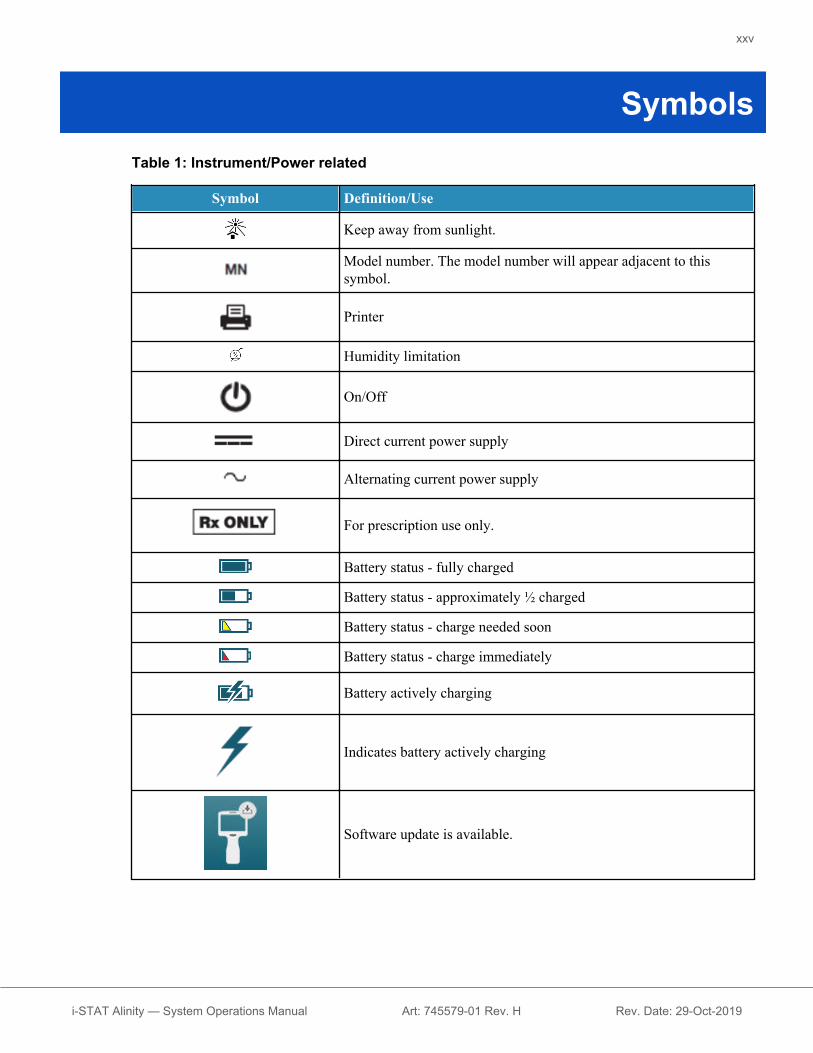
SymbolsTable 1: Instrument/Power related
Symbol Definition/Use
Keep away from sunlight.
Model number. The model number will appear adjacent to thissymbol.
Printer
Humidity limitation
On/Off
Direct current power supply
Alternating current power supply
For prescription use only.
Battery status - fully charged
Battery status - approximately ½ charged
Battery status - charge needed soon
Battery status - charge immediately
Battery actively charging
Indicates battery actively charging
Software update is available.
xxv
i-STAT Alinity — System Operations Manual Art: 745579-01 Rev. H Rev. Date: 29-Oct-2019

Table 2: Alert Icons
Symbol Definition/Use
Pass
Fail
Warning
Instrument locked
Information
Low battery
Table 3: Wireless Network Status
Symbol Definition/Use
Best
Very good
Good
Fair
Poor
No Connection
Wireless disabled
Wireless connecting
Table 4: Wired Network Status
Symbol Definition/Use
Connected
Disabled
xxvi
i-STAT Alinity — System Operations Manual Art: 745579-01 Rev. H Rev. Date: 29-Oct-2019

Table 5: Cartridge related
Symbol Definition/Use
14 days room temperature storage at 18-30oC
2 months room temperature storage at 18-30oC
Use by or expiration date.An expiration date expressed as YYYY-MM-DD means the last day the productcan be used.
An expiration date expressed as YYYY-MM means the product cannot be usedpast the last day of the month specified.
Manufacturer's lot number or batch code. The lot number or batch will appearadjacent to this symbol.
Sufficient for <n> tests
Table 6: Regulatory and Safety Related; Miscellaneous
Symbol Definition/Use
Authorized representative for Regulatory Affairs in the European Community.
Biological risks
Temperature limitations. The upper and lower limits for storage are adjacent toupper and lower arms.
Serial number. The serial number will appear adjacent to this symbol.
Catalog number, list number, or reference
USB
Do not reuse.
Date of manufacture
Manufacturer
Consult instructions for use or see System Manual for instructions.
xxvii
i-STAT Alinity — System Operations Manual Art: 745579-01 Rev. H Rev. Date: 29-Oct-2019

Symbol Definition/Use
Note the following information.
In vitro diagnostic medical device
Compliance to the European directive on in vitro diagnostic devices (98/79/EC)
ETL product safety listing mark for U.S. and Canada
Electrical hazard
Attention: See instructions for use.
CAUTION: Indicates a hazardous situation, which if not avoided, could resultin minor or moderate injury or damage to the equipment.
WARNING: Indicates a hazardous situation, which if not avoided, could resultin serious injury or death.
Separate waste collection for this electrical/electronic item indicated; Equipmentmanufactured / put on the market after 13 August 2005; Indicates compliancewith Article 10(3) of Directive 2002/96/EC (WEEE) for the European Union(EU).
Table 7: Control related
Symbol Definition/Use
Control
Table 8: For use on i‑STAT Value Assignment Sheets
Symbol Definition/Use
Mean
R Range
xxviii
i-STAT Alinity — System Operations Manual Art: 745579-01 Rev. H Rev. Date: 29-Oct-2019

Table 9: Analytes
Symbol Test
ACT Activated Clotting Time
ACT-K Kaolin activator
Na Sodium
K Potassium
Cl Chloride
Glu Glucose
Lac Lactate
Crea Creatinine
pH pH
PCO2 Partial pressure of carbon dioxide.
PO2 Partial pressure of oxygen.
iCa Ionized Calcium
BUN/UREA Urea nitrogen/Urea
Hct Hematocrit
Hb Hemoglobin
TCO2 Total carbon dioxide concentration.
HCO3 Bicarbonate
BE (b&ecf) Base excess (b for blood, ecf for extra cellular fluid)
AnGap Anion Gap
sO2 Oxygen saturation
eGFR Estimated Glomerular Filtration Rate
eGFR-a Black/African-American Estimated Glomerular Filtration Rate
xxix
i-STAT Alinity — System Operations Manual Art: 745579-01 Rev. H Rev. Date: 29-Oct-2019

xxx
i-STAT Alinity — System Operations Manual Art: 745579-01 Rev. H Rev. Date: 29-Oct-2019
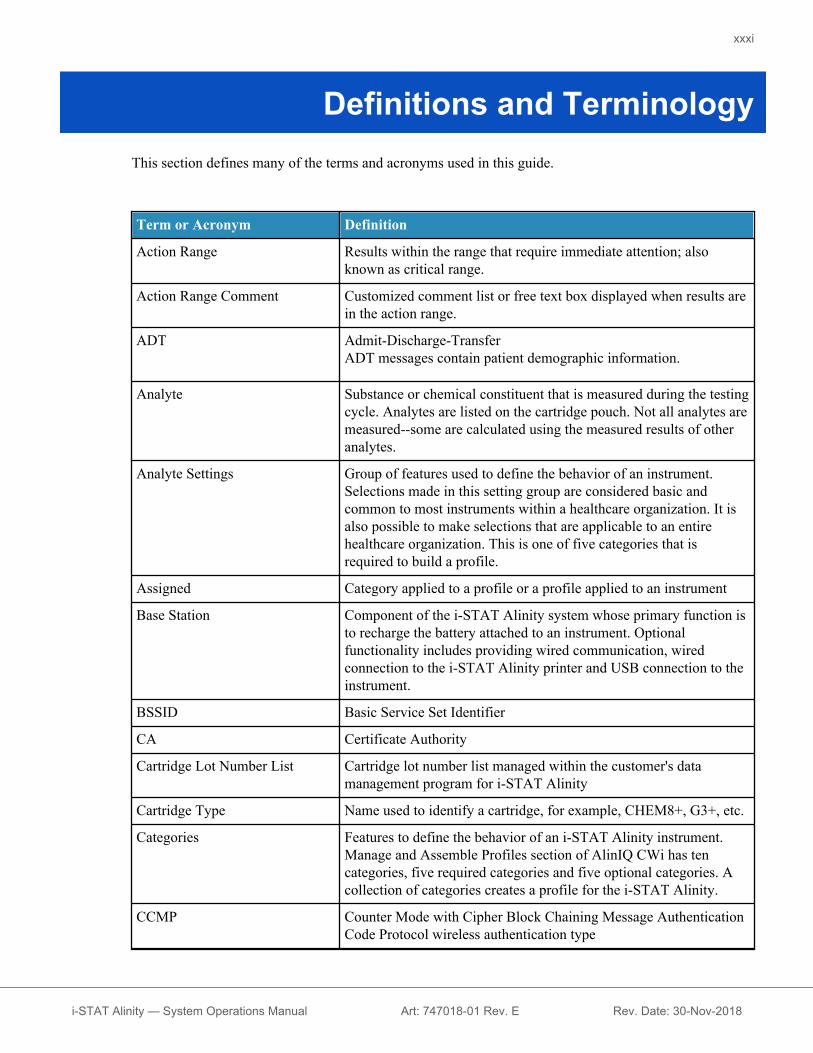
Definitions and TerminologyThis section defines many of the terms and acronyms used in this guide.
Term or Acronym Definition
Action Range Results within the range that require immediate attention; alsoknown as critical range.
Action Range Comment Customized comment list or free text box displayed when results arein the action range.
ADT Admit-Discharge-TransferADT messages contain patient demographic information.
Analyte Substance or chemical constituent that is measured during the testingcycle. Analytes are listed on the cartridge pouch. Not all analytes aremeasured--some are calculated using the measured results of otheranalytes.
Analyte Settings Group of features used to define the behavior of an instrument.Selections made in this setting group are considered basic andcommon to most instruments within a healthcare organization. It isalso possible to make selections that are applicable to an entirehealthcare organization. This is one of five categories that isrequired to build a profile.
Assigned Category applied to a profile or a profile applied to an instrument
Base Station Component of the i-STAT Alinity system whose primary function isto recharge the battery attached to an instrument. Optionalfunctionality includes providing wired communication, wiredconnection to the i‑STAT Alinity printer and USB connection to theinstrument.
BSSID Basic Service Set Identifier
CA Certificate Authority
Cartridge Lot Number List Cartridge lot number list managed within the customer's datamanagement program for i-STAT Alinity
Cartridge Type Name used to identify a cartridge, for example, CHEM8+, G3+, etc.
Categories Features to define the behavior of an i‑STAT Alinity instrument.Manage and Assemble Profiles section of AlinIQ CWi has tencategories, five required categories and five optional categories. Acollection of categories creates a profile for the i‑STAT Alinity.
CCMP Counter Mode with Cipher Block Chaining Message AuthenticationCode Protocol wireless authentication type
xxxi
i-STAT Alinity — System Operations Manual Art: 747018-01 Rev. E Rev. Date: 30-Nov-2018

Term or Acronym Definition
Change (edit) To make different. Only unassigned categories or profiles may bechanged.
Charge Station Component of the i‑STAT Alinity system whose primary function isto charge the rechargeable battery. The Charge Station has a USBport for charging other devices.
CLEW Standardization software
Cloud Abbott Managed Cloud
Collapse All Compress the view of the hierarchy to display only the roots of eachProfile or Category on the Summary.
Connectivity Map Programming data required to connect another system to the i‑STATAlinity
Connectivity Settings Group of features used to define the behavior of an instrument.Selections made in this setting group are names, IP addresses andports of other systems with which the i-STAT Alinity is tocommunicate information.
CPB Cardiopulmonary Bypass Surgery Setting. The CPB function adjustshematocrit and hemoglobin results for the dilutional effect of pumpfluid during cardiopulmonary bypass surgery.
Create from Existing Using a previously created category or profile to create a new one.
CWi Customization Workspace for i‑STAT
Data Entry To enter data using the keypad or by scanning
Delivery System Method used to deliver oxygen to a patient
DHCP Dynamic Host Configuration Protocol
Discard To delete settings prior to publishing
DNS Domain Name System
Draft Unfinished settings that can be saved and completed later
EAP Extensible Authentication Protocol wireless authentication type
eVAS Electronic Value Assignment Sheet
Expand All Extension of the view of the hierarchy to display details of theprofile or category on the summary.
Features Options or settings that control the behavior of the i‑STAT Alinityinstrument
Finish Later Save the settings defined as a Draft
xxxii
i-STAT Alinity — System Operations Manual Art: 747018-01 Rev. E Rev. Date: 30-Nov-2018

Term or Acronym Definition
General Settings Group of features used to define the behavior of an instrument.Selections made in this setting group are basic and common to mostinstruments within a healthcare organization. It is also possible tomake selections that are applicable to an entire healthcareorganization. This is one of five categories that is required to build aprofile.
HCO Healthcare Organization
HIS Hospital Information System
HTTP Hypertext Transfer Protocol
Instrument i‑STAT Alinity instrument
IP Internet Protocol
IP Address Internet Protocol Address. Identifier for a computer or device
K2EDTA or K3EDTA Setting Anticoagulant used by the manufacturer of the LaboratoryHematology Instrument to calibrate. For best agreement of i‑STATand hematology analyzer hematocrit results, the i‑STATcustomization setting is selected according to the calibration of thecomparative hematology analyzer (MH-K2EDTA or MH-K3EDTA).Note: This setting is not determined by the purple top tube used forpatient testing in the laboratory.
LIS Laboratory Information System
MAC Media Access Control
Manage Items Items get responses. An item is an on-screen prompt that requires aresponse by the operator. Items are grouped together in sets. Sets areassigned to a cartridge type (for example, EG7+, CHEM8+). Whencartridge testing is performed, the defined set of items will bedisplayed, prompting the operator to enter the information.
Manage Sets Sets are collections of items grouped together and assigned tocartridge types (for example, EG7+, CHEM8+). When a cartridgetype is tested, the defined set of items will be displayed, promptingthe operator to enter the information.
Mode Ventilator mode for delivery of oxygen
MSCHAPv2 Microsoft Challenge Handshake Authentication Protocol, Version 2
NC Network Configuration
Network Port Part of the system connection that uses a Network Port number tosend or receive service request from a client
Observations Connectivity mapping for test records. Area for entering IP addressand network port for the POC data manager.
xxxiii
i-STAT Alinity — System Operations Manual Art: 747018-01 Rev. E Rev. Date: 30-Nov-2018
Term or Acronym Definition
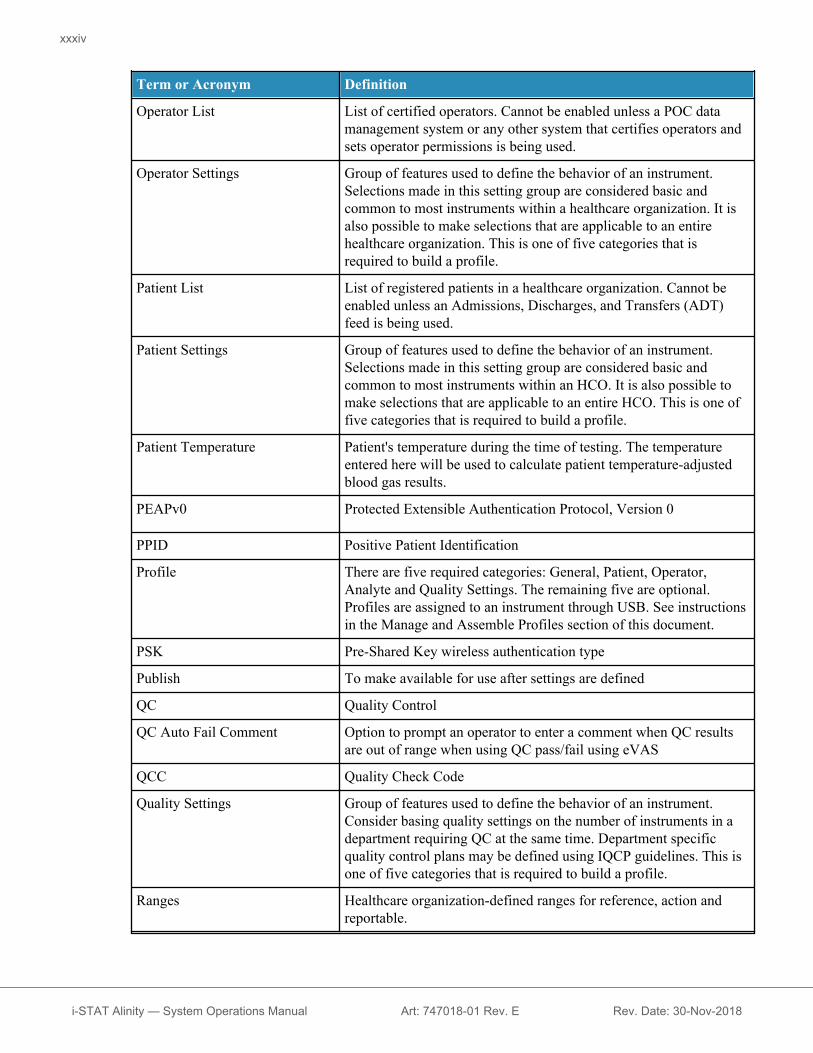
Operator List List of certified operators. Cannot be enabled unless a POC datamanagement system or any other system that certifies operators andsets operator permissions is being used.
Operator Settings Group of features used to define the behavior of an instrument.Selections made in this setting group are considered basic andcommon to most instruments within a healthcare organization. It isalso possible to make selections that are applicable to an entirehealthcare organization. This is one of five categories that isrequired to build a profile.
Patient List List of registered patients in a healthcare organization. Cannot beenabled unless an Admissions, Discharges, and Transfers (ADT)feed is being used.
Patient Settings Group of features used to define the behavior of an instrument.Selections made in this setting group are considered basic andcommon to most instruments within an HCO. It is also possible tomake selections that are applicable to an entire HCO. This is one offive categories that is required to build a profile.
Patient Temperature Patient's temperature during the time of testing. The temperatureentered here will be used to calculate patient temperature-adjustedblood gas results.
PEAPv0 Protected Extensible Authentication Protocol, Version 0
PPID Positive Patient Identification
Profile There are five required categories: General, Patient, Operator,Analyte and Quality Settings. The remaining five are optional.Profiles are assigned to an instrument through USB. See instructionsin the Manage and Assemble Profiles section of this document.
PSK Pre-Shared Key wireless authentication type
Publish To make available for use after settings are defined
QC Quality Control
QC Auto Fail Comment Option to prompt an operator to enter a comment when QC resultsare out of range when using QC pass/fail using eVAS
QCC Quality Check Code
Quality Settings Group of features used to define the behavior of an instrument.Consider basing quality settings on the number of instruments in adepartment requiring QC at the same time. Department specificquality control plans may be defined using IQCP guidelines. This isone of five categories that is required to build a profile.
Ranges Healthcare organization-defined ranges for reference, action andreportable.
xxxiv
i-STAT Alinity — System Operations Manual Art: 747018-01 Rev. E Rev. Date: 30-Nov-2018

Term or Acronym Definition
Repeat Test Option to prompt an operator to repeat a test
Result Notes Prompts displayed on the screen after results are displayed.Designed to be used if post-analytical actions or comments areneeded. They can be mandatory or optional. The notes will betransmitted along with the results to the data manager.
ReVAS Electronic Value Assignment Sheet for customers in Germany.
Reviewer Name Healthcare organization-designated connectivity manager for thedefined vendor. Found in the Connectivity Settings category. This isa required response.
Sample Type Blood sample type. Venous, arterial and capillary are currentlysupported by the i‑STAT Alinity System.
Selection List or Text Box User-created list of responses.
SN Serial Number
SSID Service Set Identifier
STATNotes Prompts displayed on the screen during the test cycle. Designed toprovide information about the patient's status at the time of testing.STATNotes are used primarily, though not exclusively, for therecording of ventilator parameters. They can be mandatory oroptional. The STATNotes will be transmitted along with the resultsto the data manager.
Summary Display of all details within a Profile or Category
TKIP Temporal Key Integrity Protocol wireless network authenticationtype
TLS Transport Layer Security
Training Settings Group of settings used to create the screens that display during atraining event.
TTLS Tunneled Transport Layer Security
UDP User Datagram Protocol
Units Standard of measurement for an analyte
USB Universal Serial Bus
User Defined Message Message created to display on the instrument before any selectionsare made.
User Role There are 3 user roles in the CWi. The roles define what CWiprivileges each user has.
xxxv
i-STAT Alinity — System Operations Manual Art: 747018-01 Rev. E Rev. Date: 30-Nov-2018
Term or Acronym Definition
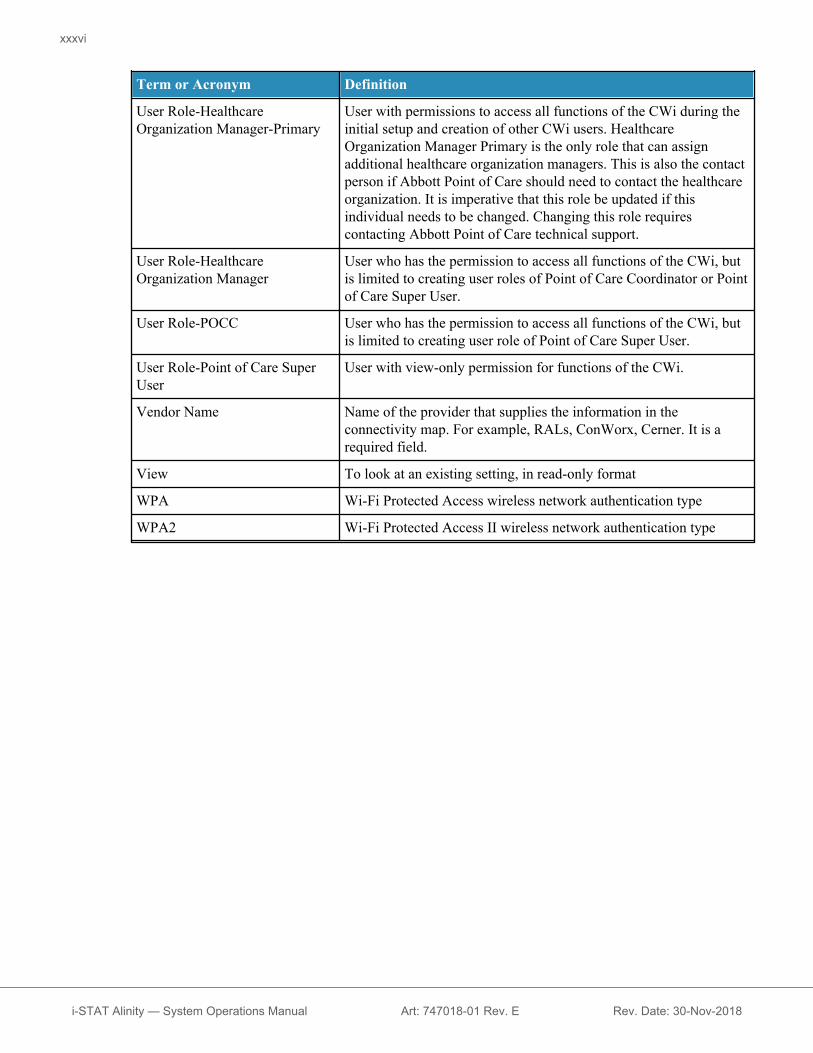
User Role-HealthcareOrganization Manager-Primary
User with permissions to access all functions of the CWi during theinitial setup and creation of other CWi users. HealthcareOrganization Manager Primary is the only role that can assignadditional healthcare organization managers. This is also the contactperson if Abbott Point of Care should need to contact the healthcareorganization. It is imperative that this role be updated if thisindividual needs to be changed. Changing this role requirescontacting Abbott Point of Care technical support.
User Role-HealthcareOrganization Manager
User who has the permission to access all functions of the CWi, butis limited to creating user roles of Point of Care Coordinator or Pointof Care Super User.
User Role-POCC User who has the permission to access all functions of the CWi, butis limited to creating user role of Point of Care Super User.
User Role-Point of Care SuperUser
User with view-only permission for functions of the CWi.
Vendor Name Name of the provider that supplies the information in theconnectivity map. For example, RALs, ConWorx, Cerner. It is arequired field.
View To look at an existing setting, in read-only format
WPA Wi-Fi Protected Access wireless network authentication type
WPA2 Wi-Fi Protected Access II wireless network authentication type
xxxvi
i-STAT Alinity — System Operations Manual Art: 747018-01 Rev. E Rev. Date: 30-Nov-2018


This page intentionally left blank.
i-STAT Alinity — System Operations Manual Art: 746989-01 Rev. A Rev. Date: 02-Oct-2016
1.1 - Complete i‑STAT Alinity SystemOverview
The i‑STAT Alinity instrument is an analytical, in vitro diagnostic device. The instrument requiresi‑STAT single-use cartridges containing electrodes and sensors to perform quantitative diagnostic testingon whole blood. Together, the instrument and cartridge allow the user to perform clinical testing andrelated administrative tasks.
The i‑STAT Alinity design enables the instrument to be taken to the patient’s bedside (point of care) or aconvenient location near the point of care.
After the insertion of a filled test cartridge, the instrument carefully monitors and controls the testingprocess. The only user intervention is in the form of data entry, performed via the touchscreen or bybarcode capture. Throughout the cycle, the instrument performs a series of quality checks. These checksare designed to monitor the status of the instrument and the quality of the cartridge. An i‑STAT Alinityinstrument, a cartridge with the required test, and two or three drops of blood will allow the caregiver toview quantitative test results within minutes.
For the purposes of this system operations manual, the i‑STAT Alinity system components and associatedaccessories will be discussed. Additional information related to the entire system can be found in thei‑STAT Alinity system documentation listed below.
Note: Where unavailability of results while awaiting replacement instruments orcartridges is unacceptable, Abbott Point of Care Inc. recommends maintaining both abackup i‑STAT Alinity instrument and cartridges from an alternate lot number.
i‑STAT Alinity Documentation:• i‑STAT Alinity System Operations Manual, including:
○ i‑STAT Alinity Reference○ i‑STAT Cartridge and Test Information Sheets○ AlinIQ NCi - Network Connectivity for i‑STAT Alinity○ AlinIQ CWi - Customization Workspace for i‑STAT Alinity
• i‑STAT Alinity Quick Reference Guide• i‑STAT Alinity Getting Started Guides:
○ i‑STAT Alinity Instrument○ i‑STAT Alinity Base Station○ i‑STAT Alinity Rechargeable Battery○ i‑STAT Alinity Electronic Simulator○ i‑STAT Alinity Printer○ i‑STAT Alinity Charge Station
3
i-STAT Alinity — System Operations Manual Art: 745526-01 Rev. F Rev. Date: 25-Apr-2019

i‑STAT Alinity system:• i‑STAT Alinity Instrument• i‑STAT Alinity Base Station• i‑STAT Alinity Rechargeable Battery• i‑STAT cartridge• i‑STAT Alinity Printer• AlinIQ NCi
• i‑STAT Alinity Electronic Simulator• i‑STAT Controls solutions• i‑STAT TriControls Control solutions• i‑STAT Calibration Verification solutions• i‑STAT TriControls Calibration Verification solutions• AlinIQ CWi• i‑STAT Alinity Charge Station
Note: Not all cartridges are available in all regions. Check with your local representativefor availability in specific markets.
Note that the component representations shown in the table are not drawn to scale.
i‑STAT Alinity System Components
i‑STAT Alinity Instrument
Portable, ergonomically designed handheldanalytical instrument used to perform in vitrodiagnostic testing with the use of i‑STATcartridges.
Base Station
Provides recharging, printing, and networkconnectivity capabilities to the instrument.
4
i-STAT Alinity — System Operations Manual Art: 745526-01 Rev. F Rev. Date: 25-Apr-2019

i‑STAT Alinity System Components
Rechargeable BatteryThis Lithium-Ion rechargeable single cell battery isthe primary source of power for the instrument.Power levels and charging status are indicated onthe screen of the instrument.
Cartridgesi‑STAT cartridges contain test reagents which arelocated on sensors on the top of the cartridge. Theinstrument and cartridge work together to generatea clinically meaningful result.
Printer
Provides the ability to print all results (patient tests,quality control, etc.) generated by the i‑STATAlinity.
Electronic SimulatorProvides an independent check on the instrument'sability to take accurate and sensitive measurementsof voltage, current and resistance from thecartridge.
5
i-STAT Alinity — System Operations Manual Art: 745526-01 Rev. F Rev. Date: 25-Apr-2019
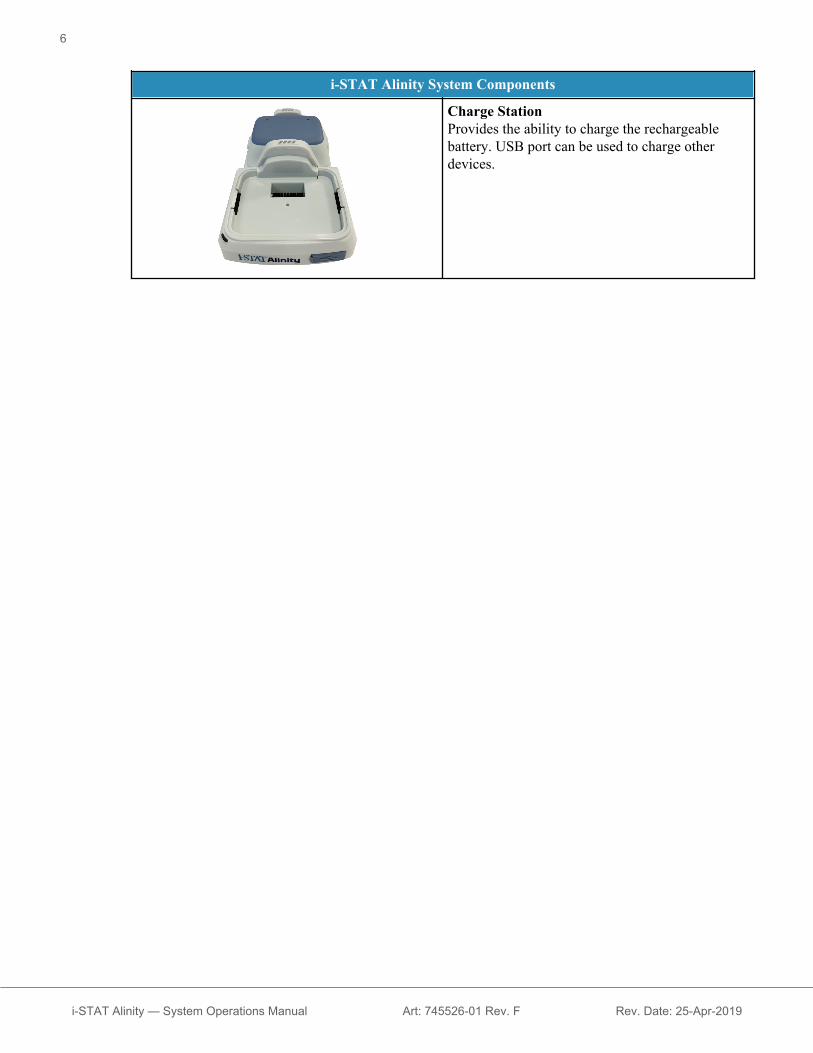
i‑STAT Alinity System Components
Charge StationProvides the ability to charge the rechargeablebattery. USB port can be used to charge otherdevices.
6
i-STAT Alinity — System Operations Manual Art: 745526-01 Rev. F Rev. Date: 25-Apr-2019

1.2 - i-STAT Alinity Instrument
Intended UseThe i‑STAT Alinity instrument with i‑STAT cartridges is intended for use in point of care or clinicallaboratory settings. The i‑STAT Alinity system is intended for the quantitative measurement of variousanalytes in arterial, venous and capillary whole blood.
For in vitro diagnostic use.
Note: Not all cartridges are available in all regions. Check with your local representativefor availability in specific markets.
Verify the instrument for cartridge testing
Note: Verification is only required once per cartridge type per instrument.
Prior to using an instrument requiring a specific cartridge type, verify the instrument supports thecartridge:1. Initiate a liquid quality control test per the instructions in Liquid Quality Controls of the System
Operations Manual.2. Ensure the instrument can successfully scan the cartridge pouch barcode.3. If the cartridge is not recognized, contact your local representative.
7
i-STAT Alinity — System Operations Manual Art: 745527-01 Rev. H Rev. Date: 06-Nov-2019

Principles of OperationThe i‑STAT Alinity instrument is an analytical, in vitro diagnostic device. The design enables it to betaken to the patient’s bedside (point of care) or a convenient location near the point of care. Theinstrument requires i‑STAT single-use cartridges containing sensors to perform quantitative diagnostictesting on whole blood. After the insertion of a filled test cartridge, the instrument carefully monitors andcontrols the testing process. The only user intervention is in the form of data entry. Data entry isperformed via the touchscreen or by barcode capture. Throughout the cycle, the instrument performs aseries of quality checks. These checks are designed to monitor the status of the instrument and the qualityof the cartridge. The instrument and cartridge together allow the user to perform clinical testing andadministrative tasks related to in vitro quantification of various analytes in a whole blood sample.
The i‑STAT Alinity instrument includes the following subsystems:• analytical measurement module: interfaces with the i‑STAT single-use test cartridges and controls
execution of the measurement test cycle• user module: a central computing unit with embedded firmware that controls the user interaction with
the device and supports communication with outside peripherals• user interface: allows data input, display of information, audio and visual alerts• rechargeable battery
Analytical Measurement ModuleThe core measurement technology of the i‑STAT Alinity system is in the micro-fabricated electro-chemical sensors located in the i‑STAT single-use disposable cartridges. As a result, the measurementtechnology used by the instrument and the principles governing operations associated with the generationof test results remain unchanged from the existing on-market i‑STAT instruments.
These fully automated dedicated microprocessor controlled operations include:• Motion control of the fluid via mechanical actuators• Thermal control of the sensors during the test cycle• Acquisition of sensor electrical signals (voltage, current or resistance) throughout the test cycle, as
well as environmental parameters like temperature and pressure• Timing and sequence of measurement events• Signal processing and conversion of sensor and environmental signals into analytical test results• Instrument self-tests and cartridge quality checks to prevent the delivery of an incorrect result in case
of an instrument malfunction or if a cartridge or pre-analytical error is detected
User ModuleThe i‑STAT Alinity instrument is equipped with a dedicated microprocessor to control user interactionwith the device, synchronization of the test cycle with the user interface, and communication. Thecombination of the hardware microprocessor with peripherals and RTOS (Real Time Operating System)offer essential features for control of the instrument.
Operations controlled by the combination of the microprocessor and RTOS include:• low power audio processor with built-in speakers• display and navigation of instrument screens• networking applications
• CMOS-based area array with LED aiming and illumination barcode module:
8
i-STAT Alinity — System Operations Manual Art: 745527-01 Rev. H Rev. Date: 06-Nov-2019

○ module allows convenient data entry in linear as well as 2D barcode symbology○ image based barcode scanner does not require precise orientation alignment of the target and the
instrument, making scanning much more user friendly○ image of the barcode is displayed on the LCD screen during the scanning operation to further aid
the user and to make scanning easier
User Interfacei‑STAT Alinity is designed to maximize the user experience. The design of the user interface was guidedby Human Factors Engineering principles.
Both the size and resolution of the display have been increased to improve readability. The instrumentemploys a five inch diagonal backlit LCD in landscape orientation.
The keypad was implemented with a resistive touchscreen, enabling a user wearing multilayer surgicalgloves to perform data entry. A full QWERTY and numeric touchscreen keyboard enhances theinformational content that can be entered and stored with a test.
i‑STAT Alinity is equipped with a 1D/2D barcode scanner.
i‑STAT Alinity features several connectivity options. The instrument contains dual band (2.4GHz, 5GHz)IEEE802.11 a/b/g/n wireless module. Connectivity to the i‑STAT Alinity portable printer is available viainfrared communication or through wired connection to the printer employing the Base Station.
Rechargeable BatteryThe i‑STAT Alinity instrument is powered by a Lithium-Ion rechargeable battery pack which includes thebattery cell as well as the charging and fuel gauge electronics. The rechargeable battery pack is directlyattached to the bottom of the instrument. The battery pack and Base Station design allows the battery tobe charged without detaching it from the instrument. The fuel gauge in the battery pack accuratelymeasures the battery capacity while also providing protection against short circuit, over-current and over-voltage.
9
i-STAT Alinity — System Operations Manual Art: 745527-01 Rev. H Rev. Date: 06-Nov-2019

More OptionsThis section describes the selections and information found behind the More Options button.
From the Home Screen touch More Options and this screen displays:
Note:• A button that is greyed out (light blue button with grey text) indicates that it is either
inactive or has no data behind it.• Data Management system controls permission levels of operators. Many of the
selections below will be protected if permission levels are set. If they are not, all
10
i-STAT Alinity — System Operations Manual Art: 745527-01 Rev. H Rev. Date: 06-Nov-2019

selections will be open to all operators. In this case, facility policy should outline whatusers are allowed to access what functions under More Options.
11
i-STAT Alinity — System Operations Manual Art: 745527-01 Rev. H Rev. Date: 06-Nov-2019

The next section of this document will describe the buttons and options for each. Breadcrumb trail on theinstrument screen will help with navigation.
Review Results
Last Result Displays data from the last test performed, cartridge orelectronic simulator.
Patient Result Review results based on the following selections:
All Patient Results
Patient Results by ID
Rejected Patient Results Instrument must be customizedto allow for rejection of cartridgeresults.
Quality Results Review results based on the following selections:
Quality Control Results
Cal/Ver Results
Simulator Results
Proficiency Results
Quality Check Code Results
Star-Out Results
Canceled Results Instrument must be customized to allow for the cancelling of atest.
All Results Display of all results on instrument regardless of testingpathway.
Transmit Unsent Results
Force the transmission of all results in the instrument. Instrument must becustomized to transmit results via wired or wireless transmission.
Enable/Disable Wireless
Enabled Instrument must be configured for wirelesstransmission by using the NCi utility. When theinstrument is configured, this button will becomeactive and enable is the default.
Disable Prevents instrument from communicating viawireless transmission.
12
i-STAT Alinity — System Operations Manual Art: 745527-01 Rev. H Rev. Date: 06-Nov-2019

View Action Ranges and Analyte Info
An individual button is displayed for each analyte available forthe i‑STAT Alinity system. Those buttons greyed out requireactivation via a customization profile or are not available atthis time. Shown with the analyte is the unit of measure. Unitsof measure maybe modified via a customization profile or onthe instrument via More Options > Instrument Options >Instrument Settings > Set Units
Touching an active analyte button displays a second page ofinformation:
Measurement range - Default is displayed unless a new rangeis set via a customization profile.
Critical Test - Default of no will be displayed unless modifiedvia a customization profile.
Touching the View Reference Range button will reveal theranges set for this analyte via a customization profile.
Note: No ranges are the default.
Touching View Action (Critical) Ranges will reveal theranges set for this analyte via a customization profile.
Note: No ranges are the default.
Instrument Status:
Important information such as firmware version, barometricpressure and profile name are listed here.
Quality Options: Quality Control
PerformUnscheduled QC
When liquid QC testing is not scheduled via a customizationprofile or if an additional liquid QC testing event is desired,this is the testing pathway. Follow the prompts on the screento perform testing.
Scheduled QC If liquid QC testing has been set via a customization profile,this is the testing pathway. Follow the prompts on the screento perform testing.
Perform CartridgeQC
This feature allows liquid control testing to releasecartridges, based on lot number, for patient or proficiencytesting. This method of QC testing must be set up via acustomization profile as well as activation in the datamanagement system.
Perform ElectronicSimulator Test
Follow the prompts to perform testing.
13
i-STAT Alinity — System Operations Manual Art: 745527-01 Rev. H Rev. Date: 06-Nov-2019

Quality Options: Cal Ver
Perform Unscheduled Cal Ver When calibration verificationtesting is not scheduled via acustomization profile or if anadditional cal/ver testing event isdesired, this is the testingpathway. Follow the prompts onthe screen to perform testing
Scheduled Cal Ver If calibration verification testinghas been set via a customizationprofile, this is the testingpathway. Follow the prompts onthe screen to perform testing.
Quality Options
Perform Proficiency Test Follow the prompts on the screen to performtesting.
Update eVAS Install from USB - Follow prompts on thescreen to install instrument software.
Note: Some preformatted USB flashdrives may not work with the Alinitysystem. To avoid issues, reformat thedrive using a Windows PC beforeusing the USB flash drive with theAlinity system.
If the instrument does not detect the basestation, try the following:• remove the instrument and re-seat it on the
Base Station• check to ensure that the Base Station is
getting power (blue light illuminated)
If the instrument does not detect the USB drive,try the following:• remove the USB and reinsert• ensure that the USB is formatted
Install from Server
View Disabled Cartridges Cartridges are disabled due to expired QC.
14
i-STAT Alinity — System Operations Manual Art: 745527-01 Rev. H Rev. Date: 06-Nov-2019
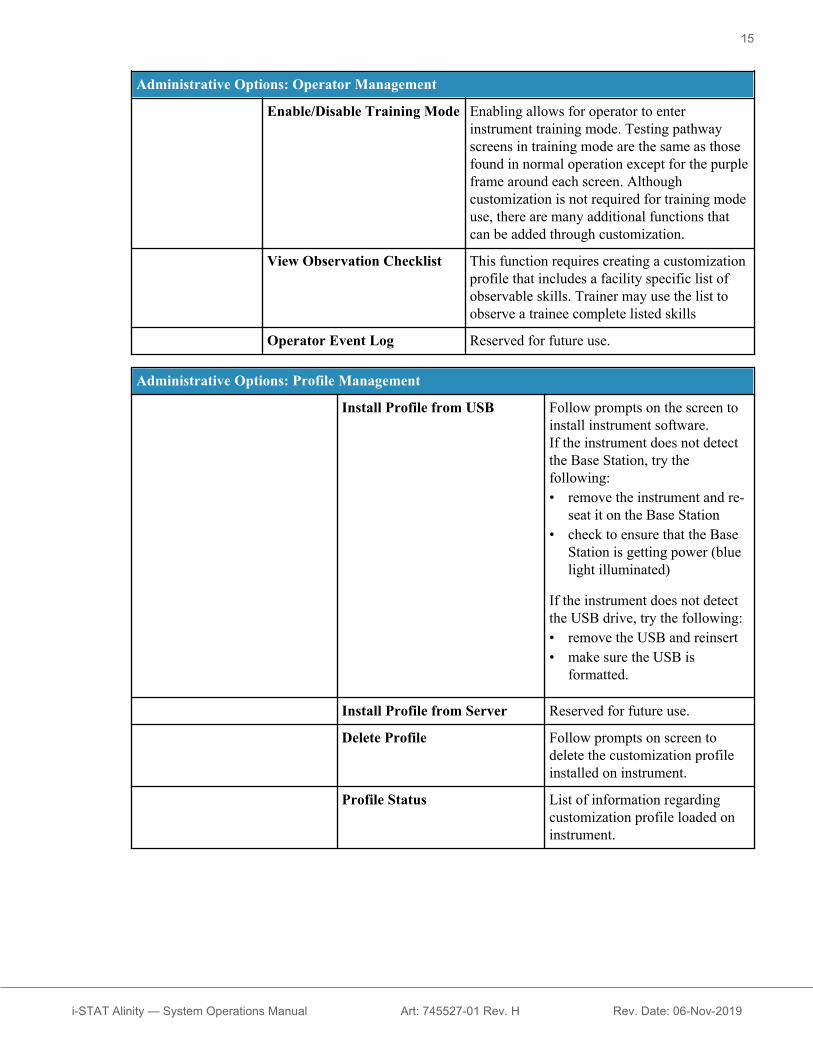
Administrative Options: Operator Management
Enable/Disable Training Mode Enabling allows for operator to enterinstrument training mode. Testing pathwayscreens in training mode are the same as thosefound in normal operation except for the purpleframe around each screen. Althoughcustomization is not required for training modeuse, there are many additional functions thatcan be added through customization.
View Observation Checklist This function requires creating a customizationprofile that includes a facility specific list ofobservable skills. Trainer may use the list toobserve a trainee complete listed skills
Operator Event Log Reserved for future use.
Administrative Options: Profile Management
Install Profile from USB Follow prompts on the screen toinstall instrument software.If the instrument does not detectthe Base Station, try thefollowing:• remove the instrument and re-
seat it on the Base Station• check to ensure that the Base
Station is getting power (bluelight illuminated)
If the instrument does not detectthe USB drive, try the following:• remove the USB and reinsert• make sure the USB is
formatted.
Install Profile from Server Reserved for future use.
Delete Profile Follow prompts on screen todelete the customization profileinstalled on instrument.
Profile Status List of information regardingcustomization profile loaded oninstrument.
15
i-STAT Alinity — System Operations Manual Art: 745527-01 Rev. H Rev. Date: 06-Nov-2019

Administrative Options: Test Record Management
Review Test Record Functions as a review resultsLast ResultPatient ResultsQuality ResultsCanceled ResultsAll results
Review Training Records View tests performed while in thetraining mode.
Transmit Records Select the range of records to betransmitted.
Delete Records Select the range of records to bedeleted.
Test Record Status List of information regarding testrecords stored on instrument.
Administrative Options: List Management
Update All Lists Function used to update patient,operator and cartridge lot list. Acustomization profile enablinglists must be in use on theinstrument.
Delete Lists Displays lists to be deleted.Choose list(s) and follow promptson the screen to complete.
List Status Displays information pertainingto patient, operator and cartridgelot list.
16
i-STAT Alinity — System Operations Manual Art: 745527-01 Rev. H Rev. Date: 06-Nov-2019

Instrument Options
Synchronize All Initiate communications withdata management system andAbbott Managed Server tosynchronize lists (operator,patient, cartridge) and eVAS/ReVAS(Germany only) that areenabled on the instrument.
Software Installation Install from USB - Followprompts on the screen to installinstrument software.If the instrument does not detectthe Base Station, try thefollowing:• remove the instrument and re-
seat it on the Base Station• check to ensure that the Base
Station is getting power (bluelight illuminated).
If the instrument does not detectthe USB drive, try the following:• remove the USB and reinsert• make sure the USB is
formatted (as display messageindicates).
Install Pending - Instructinstrument to install softwareupdate.
Check for Update - WhenAbbott Managed Serverconnectivity is set up on theinstrument, touching this buttoncauses the instrument to checkfor new software. If a newversion of software is available,the update will automaticallystart downloading onto theinstrument. See SoftwareUpdates section of this manualfor complete details fordownloading and installingsoftware via the Abbott ManagedServer.
17
i-STAT Alinity — System Operations Manual Art: 745527-01 Rev. H Rev. Date: 06-Nov-2019

Instrument Options
Software Status - List ofinformation associated withsoftware and eVAS.
Instrument Options: Instrument Settings
Follow prompts on screen to:
Set Language Note: When choosing alanguage that includesdiacritical marks in itsalphabet, the keypad'sappearance will change. Seethe section Keypad changes forlanguages using diacriticalmarks for details.
Set Clock Note: When the instrument isconfigured to communicatewith a data manager, theinstrument will automaticallysynchronize its date and timewith the data manager's time.See the section InstrumentClock Date/TimeSynchronization for details.
Set Units
Set Date Format
18
i-STAT Alinity — System Operations Manual Art: 745527-01 Rev. H Rev. Date: 06-Nov-2019

Instrument Options: Network Settings
Install Network Settings Follow prompts on screen toinstall network settings from aUSB stick. The NCi utility isused to create the ancc file thatwill be installed via the USBstick.
Note: Somepreformatted USB flashdrives may not workwith the Alinity system.To avoid issues,reformat the drive usinga Windows PC beforeusing the USB flashdrive with the Alinitysystem.
If the instrument does not detectthe Base Station, try thefollowing:• remove the instrument and re-
seat it on the Base Station• check to ensure that the Base
Station is getting power (bluelight illuminated).
If the instrument does not detectthe USB drive, try the following:• remove the USB and reinsert• make sure the USB is
formatted.
Network Services Follow prompts on the screen toselect the Abbott ManagedServer and to enable/disableeVAS update and FirmwareDelivery from the Server asdesired. Use of the NCi isrequired to enable the instrumentto make a network connection tothe Server. The Local Serveroption in this flow is reserved forfuture use.
19
i-STAT Alinity — System Operations Manual Art: 745527-01 Rev. H Rev. Date: 06-Nov-2019

Instrument Options: Network Settings
Enable/Disable Wireless This must be enabled in order forthe instrument to have the abilityto communicate wirelessly. Useof the NCi utility is required tomake the connection between theinstrument and the wireless.Disabling stops the instrumentfrom communicating with thewireless
Delete Network Settings Follow prompts to complete thisaction.
Network Status List of information associatedwith wireless and wiredcommunication.
Instrument Options: Instrument Service
Reset Instrument Choose an option on the screen,by touching the text boxindicating the action desired.Follow the prompts on the screento complete the action.
Export Logs Follow prompts on screen toexport instrument logs to a USBstick.
View Running Applications -Software information
Used primarily by technicalsupport.
Set Region Code Touch this button and followprompts on screen to completethe region code setup.
Perform ConditioningCartridge
Touch this button to performconditioning procedure using aconditioning cartridge. ContactTechnical Support or localrepresentative to obtain theconditioning cartridge andinstructions for use.
20
i-STAT Alinity — System Operations Manual Art: 745527-01 Rev. H Rev. Date: 06-Nov-2019

Keypad changes for languages using diacritical marksBased on the language chosen during instrument setup (see Getting Started Guide for the i‑STAT Alinityinstrument), the on screen keypad will display keys that have a small white dot in the upper right handcorner, as shown:
Touch the character until the additional options display at the bottom of the keypad:
After several seconds, the additional characters will disappear allowing the operator to continue typingwithout requiring any additional keystrokes.
21
i-STAT Alinity — System Operations Manual Art: 745527-01 Rev. H Rev. Date: 06-Nov-2019

Instrument Clock Date/Time SynchronizationWhen the instrument is configured to transmit test results to a data manager or to receive patient,operator, or cartridge lists from a data manager, the instrument will automatically synchronize the dateand time of its clock with the data manager’s time. This option eliminates the need to adjust theinstrument’s clock at the beginning and end of Daylight Saving Time.
To enable communication with data manager:1. Install a customization profile with one of the following features selected:
-Test Records-Operator List-Patient List-Cartridge List
2. Use NCi to configure the instrument for wired or wireless connectivity.
Note: When selecting only wireless connectivity ensure that wireless is enabled onboth the instrument and in the customization profile.
To ensure instrument time is synchronized with the data manager after a change in Daylight Saving Time,power on the instrument and leave it on the Home screen until the correct time is displayed on the Homescreen before performing cartridge testing.For instrument time synchronization to occur, the instrument must also have a wired or wirelessconnection to the network hosting the data manager. The instrument may attempt to synchronize timewhen it is communicating with a data manager to send results or receive lists. The instrument will alsoattempt to synchronize time at power-on, so long as the Home screen is being displayed.
By default, instrument date/time synchronization is enabled, provided the conditions above are met, andthe option to Synchronize Clock with Data Manager is enabled. To disable the automaticsynchronization of date/time, run the Set Clock flow on the instrument and uncheck the box forSynchronize Clock with Data Manager. Unchecking this box disables automatic synchronization ofdate/time with the data manager and enables the option to manually adjust the date/time. TheSynchronize Clock with Data Manager check box is only available on the Set Clock screen when theinstrument is configured to communicate with a data manager.
22
i-STAT Alinity — System Operations Manual Art: 745527-01 Rev. H Rev. Date: 06-Nov-2019

Calibration of the i-STAT Alinity instrumentThe instrument houses the mechanical and electrical systems necessary to control fluid movement withinthe cartridge, control the temperature, measure barometric pressure, measure electrical signals generatedby the sensors, and display and transmit results. The instrument’s functions are factory calibrated tospecifications that are programmed into the instrument along with acceptability limits, which, whenexceeded, cause the instrument to display quality check messages, or to display *** rather than results.
Abbott Point of Care developed the internal simulator that functions as a signal-checking mechanism onevery cartridge inserted. The internal simulator is a combination of hardware and software that tests theability of the instrument to accurately read sensor signals. The instrument performs an internal simulatortest on every cartridge run. The internal simulator simulates potentiometric, amperometric, andconductiometric signals at three levels consistent with a range that includes very high and very lowconcentrations of analytes. The simulation is conducted depending upon the cartridge inserted to performthis testing. Therefore, the set of sensors on the inserted cartridge determines the signals tested.
23
i-STAT Alinity — System Operations Manual Art: 745527-01 Rev. H Rev. Date: 06-Nov-2019

Specificationsi-STAT Alinity Instrument Specifications
Dimensions: Height x Width x Depth 10.1 in (25.6 cm) x 5.6 in (14.3 cm) x 3.2 in (8.1 cm)
Weight 1.5 lb (660 g) without battery1.9 lb (840 g) with battery
Operational range: Temperature andhumidity
16 to 30ºC (61 to 86ºF) for clinical testing
10 to 40ºC (50 to 104ºF) other than clinical testing
10 to 90% non-condensing relative humidity, withmaximum saturation temperature of 34ºC (93.2ºF)
Testing Environment Indoors, on a dry, clean, horizontal, stable surface.
Avoid nearby vibration equipment such as centrifuges.
Avoid direct sunlight.
Altitude up to 3,048 meters (10,000 feet)
Storage range: Temperature and humidity -10 to 60ºC (14 to 140ºF)
10 to 90% non-condensing, with maximum saturationtemperature of 50ºC (122ºF)
Display 5 in, 800 x 480 pixels with touchscreen, measureddiagonally
Power source Lithium Ion Rechargeable Battery, 3.65 (nominal) VDC,19.3 Wh
Exterior materials No natural or synthetic rubber latex is used anywhere onthe exterior of this product, the product packaging, or theaccessories.
Wireless LabelingThe i-STAT Alinity instrument includes the FCC mark and FCC module identifier.
Table 1–1: Wireless specifications for the i-STAT Alinity instruments
Wireless Characteristic i-STAT Alinity Instrument
Network Standard IEEE 802.11a, IEEE 802.11b, IEEE 802.11g, IEEE 802.11n (1-stream)
Maximum RF Power 200 mW
Typical Maximum SAR 765 mW/kg at 0 cm
24
i-STAT Alinity — System Operations Manual Art: 745527-01 Rev. H Rev. Date: 06-Nov-2019

Wireless Characteristic i-STAT Alinity Instrument
Wireless QoS requirements None. Best-effort delivery service is sufficient.
Radio Band CenterFrequencies
802.11b/g/n
802.11a/n
2.412 – 2.472 GHz
5.180 – 5.825 GHz
Modulation Types OFDM (64QAM, 16QAM, QPSK, BPSK)
DSSS (CCK, DQPSK, DBPSK)
DSSS-OFDM (64QAM, 16QAM, QPSK, BPSK)
Table 1–2: Security Authentication Protocols
Authentication Type WPA Type Authentication Method Cipher Type
GroupwiseTransient Key
PairwiseTransient Key
WPA Personal WPA PSK TKIP TKIP
WPA Enterprise WPA EAP TKIP TKIP
WPA2 Personal WPA2 PSK CCMP CCMP
WPA2 Enterprise WPA2 EAP CCMP CCMP
WPA2/WPA MixedPersonal
WPA2 PSK TKIP CCMP
WPA2/WPA MixedEnterprise
WPA2 EAP TKIP CCMP
Precautions and LimitationsFor best results, observe the following precautions to prevent damage to the instrument, to ensure thesafety of the operator and the integrity of the results.DO:
• use care when placing the instrument on a surface that is unstable, such as a patient bed. Placing theinstrument on an unstable surface may cause the instrument to fall. Place the instrument on a tabletopor counter to minimize the likelihood of a fall.
• always place the instrument and peripherals on a stable surface or in a location where they will notcause injury if dropped.
• use only the accessories and consumables specified or supplied for this system by Abbott Point ofCare.
• protect patients from nosocomial infections by disinfecting the instrument periodically and wheneverblood is spilled or transferred to an instrument. For more information, see the i‑STAT Alinity QuickReference Guide.
• follow site specific guidelines for integration of wireless devices into a hospital environment.• keep the cartridge and the instrument at the temperature of the room where they are to be used.
Condensation on a cold cartridge can prevent proper contact with the instrument.
25
i-STAT Alinity — System Operations Manual Art: 745527-01 Rev. H Rev. Date: 06-Nov-2019

• check with authorities for local, state, and/or national requirements for disposal.
DO NOT:• attempt to remove a cartridge during the testing cycle. The force that would be necessary to do so
could damage the instrument. The message Cartridge Locked in Instrument. Do NotAttempt to Remove the Cartridge. remains on the screen until the instrument unlocks thecartridge.
• use the instrument in environmental conditions that exceed the operating temperature and humidityspecifications.
• make any unauthorized repairs or modifications to this product as this may cause personal injury ordamage to the unit.
NOTE:
• Protection provided by this equipment may be impaired if used in a manner not specified by AbbottPoint of Care.
• Operators should use standard precautions whenever handling the instrument, cartridge, andperipherals to protect themselves from blood-borne pathogens. Standard precautions, such as thewearing of gloves, are designed to protect personnel from blood-borne pathogens and pathogens fromother body substances. These precautions are based on the assumption that blood, body fluids, andtissue can contain infectious agents and should therefore be treated as biohazardous materials. Formore information, refer to the CDC/NIH manual Biosafety in Microbiological and BiomedicalLaboratories, 4th edition, 1999, or to the WHO Laboratory Biosafety Manual, 2nd edition, 2003.
• The instrument can be rendered inoperative by damage caused by mishandling -- for example,dropping the instrument.
• Clinical settings that demand fail-safe testing should have a backup instrument or test source available.• The instrument and its peripherals are not listed by any authority with respect to suitability for use in
oxygen-enriched atmospheres.• Synchronizing the instrument date/time to a data manager with an incorrect date/time could render the
instrument unusable. To disable automatic date/time synchronization, run the Set Clock flow anduncheck the box Synchronize Clock with Data Manager. Then press Set Date/Time Manually andset the correct date/time.
26
i-STAT Alinity — System Operations Manual Art: 745527-01 Rev. H Rev. Date: 06-Nov-2019

Messages and TroubleshootingThis section contains information to help the operator identify and resolve failures and alerts that might bepresent in the i‑STAT Alinity system. Also included are explanatory and warning messages. At the timeof an event, a Quality Check Failure (QCF) message and information on how to resolve it is displayedon the instrument. At some time after the QCF occurs, it may be necessary to retrieve this information. Todo this, the user can touch Review Results to display the QCF and its associated numeric code. Thesenumeric codes and resolutions are listed in the Quality Check Failure Codes table in this section. Thisinformation will aid the administrator in answering questions for performing troubleshooting.
AlertsAn alert condition presents itself when an action is required. Some alerts need the operator's immediateaction (for example, Critically Low Battery) and others may require the administrator's attention (forexample, Low Memory). The alert displays on the screen and the display persists until the operator takesaction. Touching the Alert button displays additional details.
Example of an Alert Screen
Alert Title
Cause and/or Resolution
Use the information shown on the screen for appropriate action(s). If alert persists, contact the systemadministrator.
27
i-STAT Alinity — System Operations Manual Art: 745527-01 Rev. H Rev. Date: 06-Nov-2019
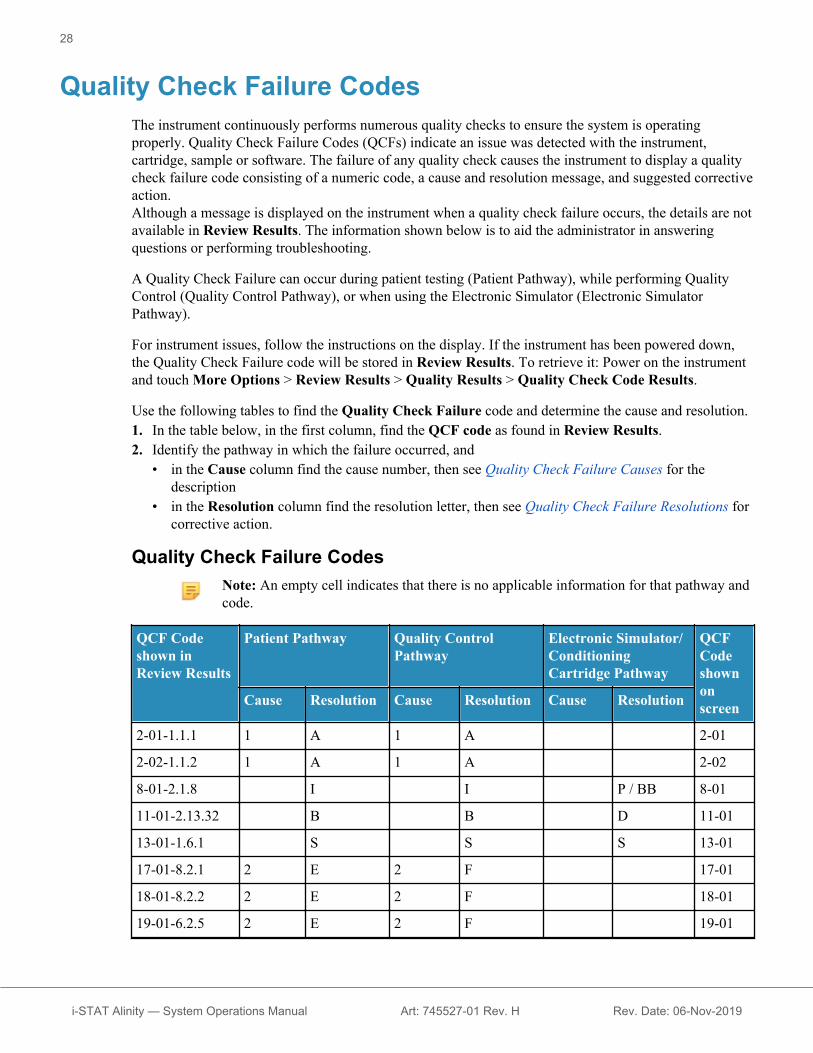
Quality Check Failure CodesThe instrument continuously performs numerous quality checks to ensure the system is operatingproperly. Quality Check Failure Codes (QCFs) indicate an issue was detected with the instrument,cartridge, sample or software. The failure of any quality check causes the instrument to display a qualitycheck failure code consisting of a numeric code, a cause and resolution message, and suggested correctiveaction.Although a message is displayed on the instrument when a quality check failure occurs, the details are notavailable in Review Results. The information shown below is to aid the administrator in answeringquestions or performing troubleshooting.
A Quality Check Failure can occur during patient testing (Patient Pathway), while performing QualityControl (Quality Control Pathway), or when using the Electronic Simulator (Electronic SimulatorPathway).
For instrument issues, follow the instructions on the display. If the instrument has been powered down,the Quality Check Failure code will be stored in Review Results. To retrieve it: Power on the instrumentand touch More Options > Review Results > Quality Results > Quality Check Code Results.
Use the following tables to find the Quality Check Failure code and determine the cause and resolution.1. In the table below, in the first column, find the QCF code as found in Review Results.2. Identify the pathway in which the failure occurred, and
• in the Cause column find the cause number, then see Quality Check Failure Causes for thedescription
• in the Resolution column find the resolution letter, then see Quality Check Failure Resolutions forcorrective action.
Quality Check Failure CodesNote: An empty cell indicates that there is no applicable information for that pathway andcode.
QCF Codeshown inReview Results
Patient Pathway Quality ControlPathway
Electronic Simulator/ConditioningCartridge Pathway
QCFCodeshownonscreenCause Resolution Cause Resolution Cause Resolution
2-01-1.1.1 1 A 1 A 2-01
2-02-1.1.2 1 A 1 A 2-02
8-01-2.1.8 I I P / BB 8-01
11-01-2.13.32 B B D 11-01
13-01-1.6.1 S S S 13-01
17-01-8.2.1 2 E 2 F 17-01
18-01-8.2.2 2 E 2 F 18-01
19-01-6.2.5 2 E 2 F 19-01
28
i-STAT Alinity — System Operations Manual Art: 745527-01 Rev. H Rev. Date: 06-Nov-2019

QCF Codeshown inReview Results
Patient Pathway Quality ControlPathway
Electronic Simulator/ConditioningCartridge Pathway
QCFCodeshownonscreenCause Resolution Cause Resolution Cause Resolution
20-01-3.1.11 G F 20-01
21-01-3.1.3 3 G 3 F 21-01
22-01-6.1.3 4 X 4 F 22-01
22-01-6.1.5 4 X 4 F 22-01
22-01-6.1.8 4 X 4 F 22-01
22-01-6.1.9 4 X 4 F 22-01
22-01-6.1.10 4 X 4 F 22-01
22-01-6.1.11 4 X 4 F 22-01
22-01-6.1.12 4 X 4 F 22-01
22-01-6.1.15 4 X 4 F 22-01
23-01-3.3.21 G F 23-01
24-01-3.1.5 G F 24-01
25-01-6.1.13 5 X 5 F 25-01
25-01-6.1.14 5 X 5 F 25-01
26-01-6.2.1 X F 26-01
26-01-6.2.2 X F 26-01
26-01-6.2.3 X F 26-01
26-01-6.2.4 X F 26-01
27-01-4.1.11 G F 27-01
28-01-4.1.2 G F 28-01
29-01-4.1.3 G F 29-01
30-01-6.1.4 6 W 12 F 30-01
30-01-6.1.7 6 W 12 F 30-01
30-02-4.1.4 6 H 12 F 30-02
31-01-4.1.5 7 G 7 F 31-01
31-02-6.1.16 7 X 7 F 31-02
32-01-4.1.6 G F 32-01
33-01-4.1.8 G F 33-01
34-01-4.1.11 7 G 7 F 34-01
29
i-STAT Alinity — System Operations Manual Art: 745527-01 Rev. H Rev. Date: 06-Nov-2019

QCF Codeshown inReview Results
Patient Pathway Quality ControlPathway
Electronic Simulator/ConditioningCartridge Pathway
QCFCodeshownonscreenCause Resolution Cause Resolution Cause Resolution
35-01-4.1.7 8 H 13 F 35-01
36-01-4.1.10 8 H 13 F 36-01
37-01-4.1.9 6 H 12 F 37-01
38-01-4.1.12 9 G 9 F 38-01
39-01-6.1.6 9 G 9 F 39-01
40-01-3.3.3 G F 40-01
41-01-3.1.21 G F 41-01
42-01-3.1.6 G F 42-01
44-01-6.1.1 5 X 5 F 44-01
46-01-6.1.2 5 X 5 F 46-01
47-01-2.1.7 N N J / Z 47-01
48-01-2.13.2 B B C / AA 48-01
49-01-3.3.1 14 U 14 V 49-01
50-01-2.1.1 G F C / AA 50-01
50-01-2.1.2 G F C / AA 50-01
50-01-2.1.3 G F C / AA 50-01
50-01-2.1.6 G F C / AA 50-01
51-01-2.1.4 G F C / AA 51-01
51-01-2.1.9 G F C / AA 51-01
52-01-2.1.5 G F C / AA 52-01
53-01-2.9.3 T T T 53-01
57-01-2.4.1 B B D 57-01
59-01-4.5.1 B B D 59-01
60-01-1.6.2 B B C / AA 60-01
63-01-2.9.1 D D D 63-01
63-01-2.9.2 D D D 63-01
66-01-2.2.1 B B D 66-01
66-01-2.2.2 B B D 66-01
66-01-2.2.3 B B D 66-01
30
i-STAT Alinity — System Operations Manual Art: 745527-01 Rev. H Rev. Date: 06-Nov-2019

QCF Codeshown inReview Results
Patient Pathway Quality ControlPathway
Electronic Simulator/ConditioningCartridge Pathway
QCFCodeshownonscreenCause Resolution Cause Resolution Cause Resolution
68-01-2.4.2 B B D 68-01
69-01-4.6.1 G F 69-01
69-01-4.6.2 G F 69-01
69-01-5.6.1 G F 69-01
69-01-5.6.2 G F 69-01
69-01-6.6.1 G F 69-01
69-01-6.6.2 G F 69-01
69-02-4.6.3 K K 69-02
69-02-4.6.4 K K 69-02
69-02-5.6.3 K K 69-02
69-02-5.6.4 K K 69-02
69-02-5.6.5 K K 69-02
69-02-6.6.3 K K 69-02
69-02-6.6.4 K K 69-02
69-03-7.6.1 C / AA 69-03
69-03-7.6.2 C / AA 69-03
69-04-7.6.3 L / CC 69-04
70-01-1.6.3 B B D 70-01
72-01-2.1.10 D D D 72-01
72-01-2.1.11 D D D 72-01
79-01-2.3.1 15 U 15 V 79-01
80-01-3.4.1 G F 80-01
80-01-3.4.2 G F 80-01
80-01-3.4.3 G F 80-01
80-01-3.4.4 G F 80-01
82-01-1.2.1 B B D 82-01
82-01-2.10.3 B B D 82-01
87-01-3.2.1 G F 87-01
88-01-1.6.33 B B C / AA 88-01
31
i-STAT Alinity — System Operations Manual Art: 745527-01 Rev. H Rev. Date: 06-Nov-2019

QCF Codeshown inReview Results
Patient Pathway Quality ControlPathway
Electronic Simulator/ConditioningCartridge Pathway
QCFCodeshownonscreenCause Resolution Cause Resolution Cause Resolution
89-01-2.7.32 B B C / AA 89-01
90-01-2.4.3 D D D 90-01
90-01-2.4.4 D D D 90-01
90-01-2.4.5 D D D 90-01
90-01-2.4.6 D D D 90-01
90-01-2.4.7 D D D 90-01
90-01-2.4.8 D D D 90-01
90-01-2.4.9 D D D 90-01
90-01-2.4.10 D D D 90-01
90-01-2.4.11 D D D 90-01
90-01-2.4.12 D D D 90-01
90-01-2.4.13 D D D 90-01
90-02-2.4.14 B B D 90-02
90-02-2.4.16 B B D 90-02
90-02-2.4.17 B B D 90-02
90-02-2.4.18 B B D 90-02
90-03-2.4.15 19 Y 19 Y 90-03
90-04-2.4.19 D 90-04
91-01-2.6.32 B B D 91-01
92-01-2.10.1 B B D 92-01
92-01-2.10.2 B B D 92-01
93-01-2.5.32 B B D 93-01
93-01-2.5.33 B B D 93-01
94-01-1.6.32 B B D 94-01
95-01-1.7.1 R R 95-01
99-01-2.13.1 G F C / AA 99-01
99-02-2.2.4 C / AA 99-02
117-01-5.1.30 G F 117-01
118-01-5.1.28 G F 118-01
32
i-STAT Alinity — System Operations Manual Art: 745527-01 Rev. H Rev. Date: 06-Nov-2019
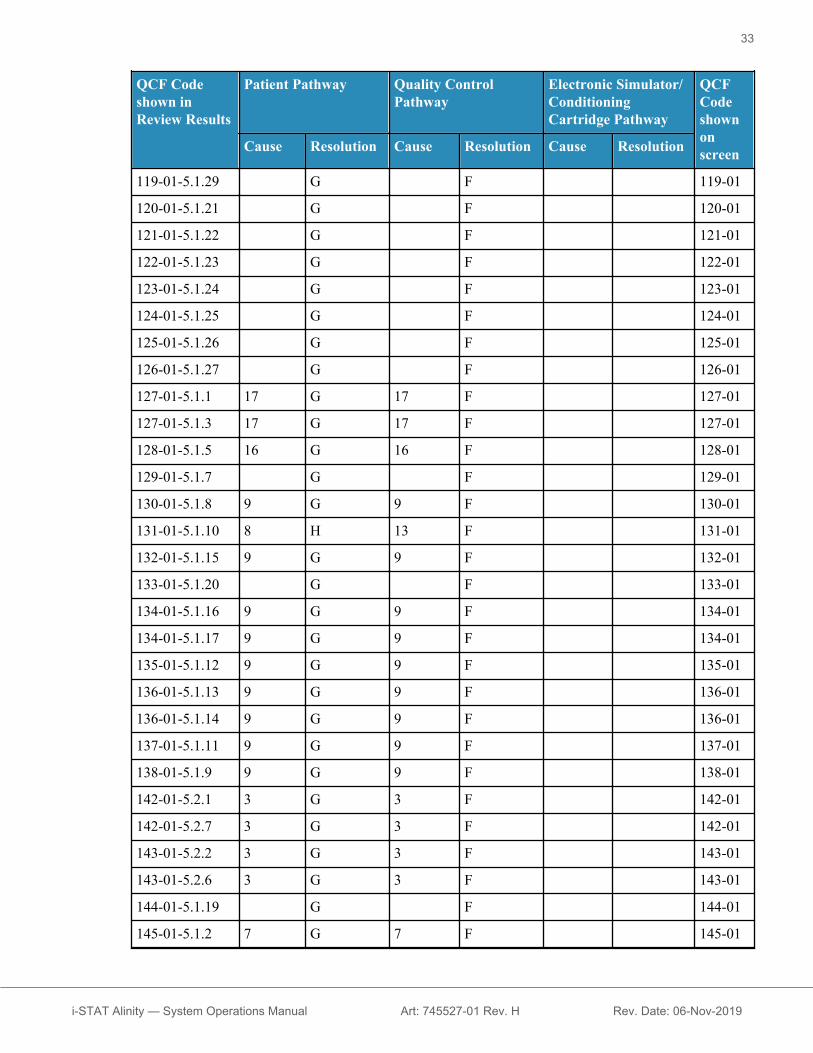
QCF Codeshown inReview Results
Patient Pathway Quality ControlPathway
Electronic Simulator/ConditioningCartridge Pathway
QCFCodeshownonscreenCause Resolution Cause Resolution Cause Resolution
119-01-5.1.29 G F 119-01
120-01-5.1.21 G F 120-01
121-01-5.1.22 G F 121-01
122-01-5.1.23 G F 122-01
123-01-5.1.24 G F 123-01
124-01-5.1.25 G F 124-01
125-01-5.1.26 G F 125-01
126-01-5.1.27 G F 126-01
127-01-5.1.1 17 G 17 F 127-01
127-01-5.1.3 17 G 17 F 127-01
128-01-5.1.5 16 G 16 F 128-01
129-01-5.1.7 G F 129-01
130-01-5.1.8 9 G 9 F 130-01
131-01-5.1.10 8 H 13 F 131-01
132-01-5.1.15 9 G 9 F 132-01
133-01-5.1.20 G F 133-01
134-01-5.1.16 9 G 9 F 134-01
134-01-5.1.17 9 G 9 F 134-01
135-01-5.1.12 9 G 9 F 135-01
136-01-5.1.13 9 G 9 F 136-01
136-01-5.1.14 9 G 9 F 136-01
137-01-5.1.11 9 G 9 F 137-01
138-01-5.1.9 9 G 9 F 138-01
142-01-5.2.1 3 G 3 F 142-01
142-01-5.2.7 3 G 3 F 142-01
143-01-5.2.2 3 G 3 F 143-01
143-01-5.2.6 3 G 3 F 143-01
144-01-5.1.19 G F 144-01
145-01-5.1.2 7 G 7 F 145-01
33
i-STAT Alinity — System Operations Manual Art: 745527-01 Rev. H Rev. Date: 06-Nov-2019

QCF Codeshown inReview Results
Patient Pathway Quality ControlPathway
Electronic Simulator/ConditioningCartridge Pathway
QCFCodeshownonscreenCause Resolution Cause Resolution Cause Resolution
146-01-5.1.4 6 H 12 F 146-01
146-01-5.1.6 6 H 12 F 146-01
148-01-5.1.18 G F 148-01
149-01-5.2.3 G F 149-01
149-01-5.2.8 G F 149-01
150-01-5.2.4 G F 150-01
150-01-5.2.9 G F 150-01
151-01-5.2.5 G F 151-01
151-01-5.2.10 G F 151-01
152-01-5.2.11 G F 152-01
165-01-8.1.1 17 X 17 F 165-01
166-01-8.1.2 18 X 18 F 166-01
167-01-8.1.3 6 W 12 F 167-01
170-01-8.1.4 X F 170-01
171-01-8.1.5 X F 171-01
172-01-8.1.6 X F 172-01
173-01-8.1.7 X F 173-01
174-01-8.1.8 X F 174-01
175-01-8.1.9 X F 175-01
1
Quality Check Failure CausesCauses
1 The internal temperature is not within 16 to 30oC (61 to 86oF).
2 No clot was detected during testing.
1 System Administrator Note: If code displays after operator repeats testing, instruct the operator to performconditioning using a Conditioning Cartridge. Contact Technical Support or local representative for ConditioningCartridge and instructions for use.
34
i-STAT Alinity — System Operations Manual Art: 745527-01 Rev. H Rev. Date: 06-Nov-2019

Causes
3 Cartridge was rejected during the testing cycle. Probable causes:• Operator pressed too hard on the center of the cartridge• Used cartridge inserted• Cartridge was frozen and thawed before testing
4 Sample was rejected during the testing cycle. Probable causes:• Bubbles in the sample• Microclots in the sample• Used cartridge inserted• Snap closure not secure
5 Sample was rejected during the testing cycle. Probable causes:• Bubbles in the sample• Too little sample used to fill the cartridge• Clots in the sample
6 Excess blood was added to the cartridge. When filling the cartridge, the blood advanced past thelevel indicated by the 'fill to' arrow.
7 Sample was rejected during the testing cycle. Probable cause:• Snap closure not secure.
8 An insufficient amount of blood was used to fill the cartridge. When filling the cartridge, theblood did not reach the level indicated by the 'fill to' arrow.
9 Sample was rejected during the testing cycle. Probable causes:• Bubbles in the sample• Insufficient amount of sample used to fill the cartridge
10 Sample was rejected during the testing cycle. Probable causes:• Microclots in the sample• Snap closure not secure
11 Reserved for future use.
12 Excess sample was added to the cartridge. When filling the cartridge, the sample advanced pastthe level indicated by the 'fill to' arrow.
13 An insufficient amount of sample was used to fill the cartridge. When filling the cartridge, thesample did not reach the level indicated by the 'fill to' arrow.
14 Cartridge was rejected. Probable cause:• Instrument cannot lock cartridge in place to begin testing
15 Cartridge was rejected. Probable causes:• Instrument cannot lock cartridge in place to begin testing• Debris on cartridge
35
i-STAT Alinity — System Operations Manual Art: 745527-01 Rev. H Rev. Date: 06-Nov-2019

Causes
16 Sample was rejected during the testing cycle. Probable causes:• Bubbles in the sample• Insufficient mixing of sample used to fill the cartridge• Wrong sample type
17 Cartridge was rejected during the testing cycle. Probable causes:• Excess sample was added to the cartridge• Used cartridge inserted
18 Cartridge was rejected during the testing cycle. Probable causes:• Bubbles in the sample• Microclots in the sample• Used cartridge inserted• Snap closure not secure• Too little sample used to fill the cartridge
19 Cartridge was rejected during the testing cycle. Probable causes:• Cartridge pouch opened too soon after removal from refrigerator• Cartridge not filled immediately after opening pouch
Quality Check Failure ResolutionsResolutions
A Navigate to the Home Screen, then touch More Options. Touch Instrument Status and assessthe instrument's temperature. Move the instrument to an appropriate environment.
B Perform an Electronic Simulator test. If the test results in a PASS, the instrument is ready for useotherwise contact system administrator for further instruction.
C Repeat Electronic Simulator testing. If the test results in a PASS, the instrument is ready for useotherwise contact system administrator for further instruction.
D Contact the system administrator for further instruction.
E Do not collect the sample for this cartridge in a device that contains anticoagulant. Draw newsample. Repeat testing with a freshly filled cartridge. Carefully observe the help providedthroughout the testing pathway. If the same quality check failure displays, contact the systemadministrator for further instruction.
F Prepare a new bottle of material per the manufacturer's instruction. Repeat testing with a freshlyfilled cartridge. Carefully observe the help provided throughout the testing pathway. If the samequality check failure displays, contact the system administrator for further instruction.
G Repeat testing with a freshly filled cartridge. Carefully observe the help provided throughout thetesting pathway. If the same quality check failure displays, contact the system administrator forfurther instruction.
36
i-STAT Alinity — System Operations Manual Art: 745527-01 Rev. H Rev. Date: 06-Nov-2019

Resolutions
H When filling a cartridge, use care to advance blood to the level indicated by the 'fill to' arrow.Repeat testing with a freshly filled cartridge. Carefully observe the help provided throughout thetesting pathway. If the same quality check failure displays, contact the system administrator forfurther instruction.
I Instrument did not reset correctly. Perform an electronic simulator test. If the test results in aPASS, the instrument is ready for use otherwise contact system administrator for furtherinstruction.
J The simulator was not fully inserted. Repeat testing. Make sure that the cover retaining ring doesnot interfere with Electronic Simulator insertion. Ensure the Simulator is fully inserted. TheSimulator is fully inserted when the click is heard. If the same quality check failure displays,contact the system administrator for further instruction.
K Always scan the barcode found on the pouch that contained the cartridge in use. Scanning anyother barcode can cause this error. Repeat testing with a freshly filled cartridge. Carefully observethe help provided throughout the testing pathway. If the same quality check failure displays,contact the system administrator for further instruction.
L A cartridge was detected when an Electronic Simulator was expected. Repeat testing ensuring toinsert an Electronic Simulator. Make sure that the cover retaining ring does not interfere withSimulator insertion. Ensure the Simulator is fully inserted. The Simulator is fully inserted whenthe click is heard. If the same quality check failure displays, contact the system administrator forfurther instruction.
M Reserved for future use.
N The cartridge was not fully inserted. Repeat testing with a freshly filled cartridge. Ensure thecartridge is fully inserted. The cartridge is fully inserted when the click is heard. If the samequality check failure displays, contact the system administrator for further instruction.
P The instrument did not reset correctly. Repeat electronic simulator testing. If the test results in aPASS, the instrument is ready for use otherwise contact the system administrator for furtherinstruction.
R Test has been successfully cancelled.
S OSi software installation required. Contact the system administrator for further instructions
T Install the most recent OSi software. Contact the system administrator for further instructions.
U Power off the instrument. Insert the Latch Return Tool into the cartridge port until it stops.Immediately remove the tool from the instrument. Repeat testing with a freshly filled cartridge. Ifthe same quality check failure displays, contact the system administrator for further instruction.
V Power off the instrument. Insert the Latch Return Tool into the cartridge port until it stops.Immediately remove the tool from the instrument. Prepare a new bottle of material per themanufacturer's instruction. Repeat testing with a freshly filled cartridge. If the same quality checkfailure displays, contact the system administrator for further instruction.
W When filling a cartridge, use care to advance blood to the level indicated by the 'fill to' arrow.Draw new sample. Repeat testing with a freshly filled cartridge. Carefully observe the helpprovided throughout the testing pathway. If the same quality check failure displays, contact thesystem administrator for further instruction.
37
i-STAT Alinity — System Operations Manual Art: 745527-01 Rev. H Rev. Date: 06-Nov-2019

Resolutions
X Draw new sample. Repeat testing with a freshly filled cartridge. Carefully observe the helpprovided throughout the testing pathway. If the same quality check failure displays, contact thesystem administrator for further instruction.
Y Cartridge pouch must be out of the refrigerator for a minimum of 5 minutes before opening. Afteropening the pouch, immediately begin to follow the prompts on the screen. If the same qualitycheck failure displays, contact the system administrator for further instruction.
Z The Conditioning Cartridge was not fully inserted. Repeat conditioning. Ensure the ConditioningCartridge is fully inserted. The Conditioning Cartridge is fully inserted when the click is heard. Ifthe same quality check failure displays, contact the system administrator for further instruction.
AA Repeat conditioning with Conditioning Cartridge testing. If conditioning completes successfully,the instrument is ready for use, otherwise contact the system administrator for further instruction.
BB Instrument did not reset correctly. Repeat conditioning with Conditioning Cartridge. Ifconditioning completes successfully, the instrument is ready for use, otherwise contact the systemadministrator for further instruction.
CC A cartridge was detected when a Conditioning Cartridge was expected. Repeat conditioningensuring to insert a Conditioning Cartridge. Ensure the Conditioning Cartridge is fully inserted.The Conditioning Cartridge is fully inserted when the click is heard. If the same quality checkfailure displays, contact the system administrator for further instruction.
38
i-STAT Alinity — System Operations Manual Art: 745527-01 Rev. H Rev. Date: 06-Nov-2019

Cleaning and DisinfectingComplete instructions for cleaning and disinfecting are found in the Quick Reference Guide. The graphicsbelow are a visual representation of the wiping procedure for disinfection.
Note: When cleaning and disinfecting the instrument, the rechargeable battery must beattached.
39
i-STAT Alinity — System Operations Manual Art: 745527-01 Rev. H Rev. Date: 06-Nov-2019

40
i-STAT Alinity — System Operations Manual Art: 745527-01 Rev. H Rev. Date: 06-Nov-2019

1.3 - i-STAT Alinity Results ScreenThe content of a result screen is specific to the cartridge type and material being tested. The following isan example of a patient result screen along with a description of the information shown on the screen:
Displayed at the top of the screen are:1. Cartridge type i‑STAT CHEM8+2. Date and time when test was completed 16FEB2025 09:453. Options menu4. Wireless signal strength5. Battery strength6. Sample identification PT: 123456
The body of the screen shows:
Analyte: Unit of measurement: Result:
Na (Sodium) mmol/L 129K (Potassium) mmol/L 3.1Cl (Chloride) mmol/L 8.1TCO2 (Total CarbonDioxide)
mmol/L 9
BUN (Urea Nitrogen) mg/dL 48Crea (Creatinine) mg/dL 3.8Glu (Glucose) mg/dL 274iCa (Ionized Calcium) mmol/L 0.94Anion Gap mmol/L 42
41
i-STAT Alinity — System Operations Manual Art: 745531-01 Rev. E Rev. Date: 29-Oct-2019

On the right side of the screen are action buttons for:
Options Menu Begins another test without returning to Homescreen
View Entered Info Displays information associated with the testPrint Prints result to i‑STAT Alinity printerTransmit Transmits result to Data Manager
On the bottom of the screen are the icons:
touch to display the Home screen. touch to display the next screen.
Interpreting ResultsResults for an analyte
Analyte: Na (Sodium)Unit of measurement: mmol/L
Result: 129
Analyte: Hb* (Hemoglobin)Unit of measurement: g/dL
(* indicates a calculated result)
Result: 14
Suppressed Results - Stars (***)Various conditions cause results to be suppressed. The instrument displays stars (***), referred to as a"star out", as shown in the example below:
Reasons such as those listed below may produce starred out results:
• an uncharacteristic sensor signal• a bad sensor• improperly stored cartridge• interfering substance in the sample• aged sample containing products of metabolism• cartridge results that are not reportable based on a failed quality check while performing a test
If stars display, take corrective action:• A star out can be caused if a cartridge is handled improperly by the user. Follow facility policy for
handling starred out results.
42
i-STAT Alinity — System Operations Manual Art: 745531-01 Rev. E Rev. Date: 29-Oct-2019

• If no facility policy is in place, check the supply of cartridges in use with a control solution. If thecontrol is in range, collect a new sample and test immediately. If starred out results display again,there may be an interfering substance in the sample. Refer to the Cartridge and Test Information sheetfor the starred out analyte(s) for a list of interfering substances. Use an alternate method for testing.
• If the control is out-of-range or if stars are displayed again, there may be a problem with the cartridgelot. Use another lot if available. If another lot is not available, test patient sample using anothermethod. Contact technical support with regard to lot number in question.
Suppressed Results - Out of rangeUnder some conditions results may be preceded by the symbols for greater than (>) or less than (<). Thiscan occur when results are outside the system’s measurement ranges. Facility Policy should be in place toadvise end users on additional course of action if necessary. Below is an example of a result that is out ofrange:
Suppressed Results - Null SetThe < > flag indicates that the results for this test were dependent on the result of a test flagged as either >or <. A null set result is shown in this example:
Stop ACT Test ResultThe [X] indicates the ACT test was stopped by the operator before the test completed. The ability to stopan ACT test is set via AlinIQ CWi parameter: Analyte Settings > ACT > Stop ACT Test.
43
i-STAT Alinity — System Operations Manual Art: 745531-01 Rev. E Rev. Date: 29-Oct-2019

44
i-STAT Alinity — System Operations Manual Art: 745531-01 Rev. E Rev. Date: 29-Oct-2019

1.4 - i-STAT Alinity Rechargeable BatteryOverviewThis Lithium-Ion rechargeable battery is designed for use only with the i‑STAT Alinity instrument. Whenattached to the instrument, it is the power source for all functionality. Thumb tabs on either side of thebattery enable easy removal and replacement of the battery on the instrument.
For instructions on using the battery, refer to the i‑STAT Alinity Rechargeable Battery Getting StartedGuide.
DescriptionThe rechargeable battery allows the instrument to perform testing. The battery recharges when it isattached to the instrument and docked in a powered Base Station. The battery can also be detached fromthe instrument and charged with the Charge Station. An indicator on the upper right hand side of theinstrument screen indicates the battery level and charging status of the battery. An alert displays if thebattery level drops to 10%. Testing is disabled when the battery level drops below 5%. Instructions forattaching the battery are found in the i‑STAT Alinity Rechargeable Battery Getting Started Guide. For afull list of all battery icons available for display on the instrument, see the Quick Reference Guide.
Principles of OperationThe battery pack contains a Lithium-Ion rechargeable battery cell and electronics for charging and fuelgauge functionality. The fuel gauge predicts the battery capacity while also providing protection againstshort circuit, over current and over voltage. The battery pack and Base Station are designed to allow forthe battery to be charged without detaching from the instrument.
45
i-STAT Alinity — System Operations Manual Art: 745529-01 Rev. E Rev. Date: 30-Nov-2018
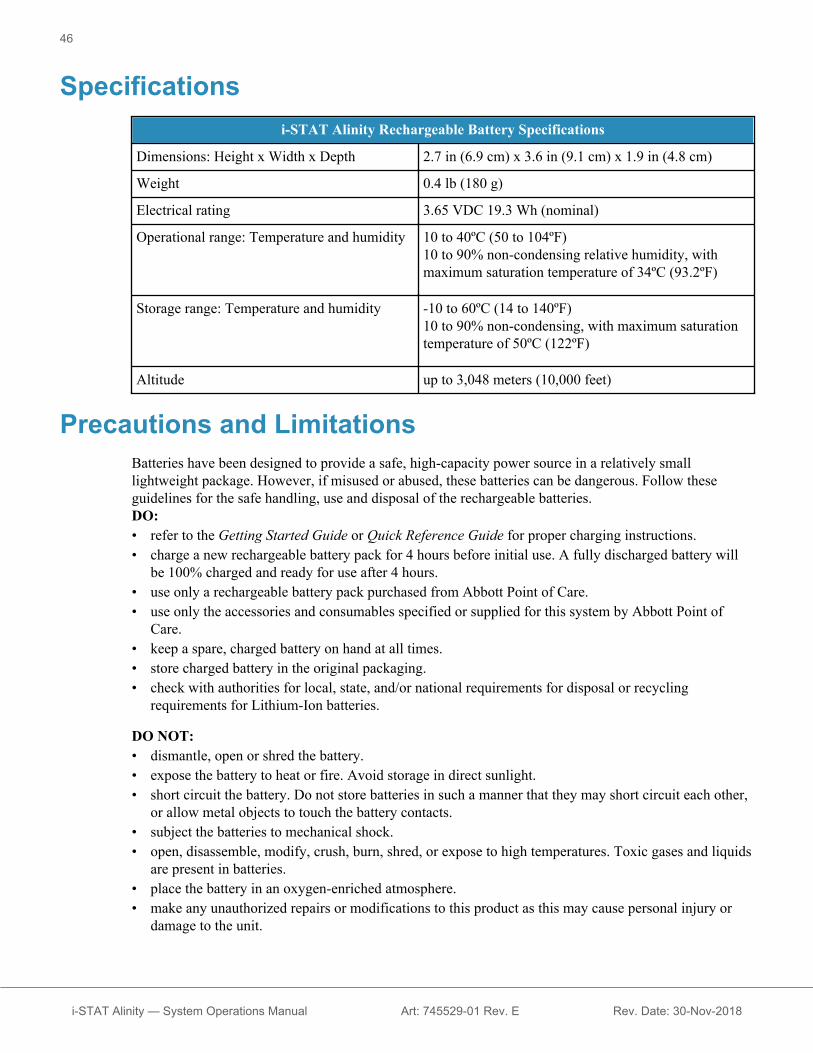
Specificationsi-STAT Alinity Rechargeable Battery Specifications
Dimensions: Height x Width x Depth 2.7 in (6.9 cm) x 3.6 in (9.1 cm) x 1.9 in (4.8 cm)
Weight 0.4 lb (180 g)
Electrical rating 3.65 VDC 19.3 Wh (nominal)
Operational range: Temperature and humidity 10 to 40ºC (50 to 104ºF)10 to 90% non-condensing relative humidity, withmaximum saturation temperature of 34ºC (93.2ºF)
Storage range: Temperature and humidity -10 to 60ºC (14 to 140ºF)10 to 90% non-condensing, with maximum saturationtemperature of 50ºC (122ºF)
Altitude up to 3,048 meters (10,000 feet)
Precautions and LimitationsBatteries have been designed to provide a safe, high-capacity power source in a relatively smalllightweight package. However, if misused or abused, these batteries can be dangerous. Follow theseguidelines for the safe handling, use and disposal of the rechargeable batteries.DO:• refer to the Getting Started Guide or Quick Reference Guide for proper charging instructions.• charge a new rechargeable battery pack for 4 hours before initial use. A fully discharged battery will
be 100% charged and ready for use after 4 hours.• use only a rechargeable battery pack purchased from Abbott Point of Care.• use only the accessories and consumables specified or supplied for this system by Abbott Point of
Care.• keep a spare, charged battery on hand at all times.• store charged battery in the original packaging.• check with authorities for local, state, and/or national requirements for disposal or recycling
requirements for Lithium-Ion batteries.
DO NOT:• dismantle, open or shred the battery.• expose the battery to heat or fire. Avoid storage in direct sunlight.• short circuit the battery. Do not store batteries in such a manner that they may short circuit each other,
or allow metal objects to touch the battery contacts.• subject the batteries to mechanical shock.• open, disassemble, modify, crush, burn, shred, or expose to high temperatures. Toxic gases and liquids
are present in batteries.• place the battery in an oxygen-enriched atmosphere.• make any unauthorized repairs or modifications to this product as this may cause personal injury or
damage to the unit.
46
i-STAT Alinity — System Operations Manual Art: 745529-01 Rev. E Rev. Date: 30-Nov-2018

NOTE:• A fully charged battery, if not periodically recharged, will self-discharge over time. Prevent self-
discharge by keeping the rechargeable battery pack in an instrument that is on a powered Base Station.• Protection provided by this equipment may be impaired if used in a manner not specified by Abbott
Point of Care.• The instrument and its peripherals are not listed by any authority with respect to suitability for use in
oxygen-enriched atmospheres.• In the event of a battery leaking, do not allow any leakage to come into contact with the skin or eyes.
If contact has been made, wash the affected area with copious amounts of water and seek medicaladvice.
47
i-STAT Alinity — System Operations Manual Art: 745529-01 Rev. E Rev. Date: 30-Nov-2018

48
i-STAT Alinity — System Operations Manual Art: 745529-01 Rev. E Rev. Date: 30-Nov-2018

1.5 - i-STAT Alinity Base Station
OverviewThe primary function of the Base Station is to charge the rechargeable battery while it is attached to thei‑STAT Alinity instrument. The Base Station is intended for use only with the i‑STAT Alinity instrument.When an instrument is not charging in the unit, the Base Station looks as shown in this illustration:
For instructions on installing and using the Base Station, refer to the i‑STAT Alinity Base Station GettingStarted Guide.
DescriptionThe i‑STAT Alinity Base Station:• charges the battery that is attached to the instrument• powers the instrument when docked• powers the instrument when the instrument is docked and cartridge testing is being performed• provides connection to the printer• provides for wired ethernet connection• updates software and file transfers via USB port• light indicates proper connection to power source
49
i-STAT Alinity — System Operations Manual Art: 745528-01 Rev. E Rev. Date: 30-Nov-2018

Specificationsi-STAT Alinity Base Station Specifications
Dimensions: Height x Width x Depth 11.8 in (29.9 cm) x 5.9 in (15 cm) x 2.7 in (6.9 cm)without AC adapter
Weight 2.4 lb (1090 g)
Communication Interface Ethernet 10/100 base t, RS-232, USB 2.0
LED Indicators Color: BlueStatus: Power
Operational range: Temperature andhumidity
10 to 40ºC (50 to 104ºF)10 to 90% non-condensing, with maximum saturationtemperature of 34ºC (93.2F)
Testing Environment Indoors, on a dry, clean, horizontal, stable surface.
Avoid nearby vibration equipment such as centrifuges.
Avoid direct sunlight.
Altitude up to 3,048 meters (10,000 feet)
Storage range: Temperature and humidity -10 to 60ºC (14 to 140ºF)10 to 90% non-condensing, with maximum saturationtemperature of 34ºC (93.2F)
External Power Supply Unit Input: 110-240 VAC, 50-60 Hz, 1.5AOutput: 5.3V DC, 6.6A
50
i-STAT Alinity — System Operations Manual Art: 745528-01 Rev. E Rev. Date: 30-Nov-2018

Precautions and LimitationsFor safety when using the Base Station:
DO:
• use only the accessories and consumables specified or supplied for this system by Abbott Point ofCare.
• use only the power supply shipped in the box with the Base Station. Attempting to use a different typeof manufacturer's adapter could damage the unit and cause fire or explosion hazards.
• be sure to install all cables and power supplies so they do not pose a trip hazard. Mount equipment socables and accessories stay clear of walkways.
• always use the Base Station or Charge Station for charging. Refer to the rechargeable battery GettingStarted Guide on instructions for proper charging.
• connect only Abbott Point of Care provided printers to the Base Station printer port.• check with authorities for local, state, and/or national requirements for disposal.
DO NOT:• try to connect any non-electrically isolated equipment to the Base Station.• connect the Base Station to unauthorized medical devices or other equipment.• place metal objects on or near the exposed battery charging contacts.• place the instrument in an oxygen-enriched atmosphere.• make any unauthorized repairs or modifications to this product, as it may cause personal injury or
damage to the unit.
NOTE:
• The AC adapter power supply plug acts as a disconnect device for the Base Station and therefore, theAC socket outlet must be installed (or located) near the Base Station and must be easily accessible ifthe Base Station needs to be unplugged. When correctly connected to power, the blue light on the BaseStation will be illuminated. After an instrument is docked, the blue light above the screen will beilluminated. This may take several seconds. If the blue light does not illuminate, check the powersupply. Ensure that the Base Station is connected properly and that the instrument is seated correctly inthe Base Station.
• Protection provided by this equipment may be impaired if used in a manner not specified by AbbottPoint of Care.
• The instrument and its peripherals are not listed by any authority with respect to suitability for use inoxygen-enriched atmospheres.
• The Base Station must be on a flat, level, horizontal surface such as a table top. Falling equipment maycause injury. Always place the equipment on a stable level surface in a location where it will not causeinjury if dropped.
51
i-STAT Alinity — System Operations Manual Art: 745528-01 Rev. E Rev. Date: 30-Nov-2018
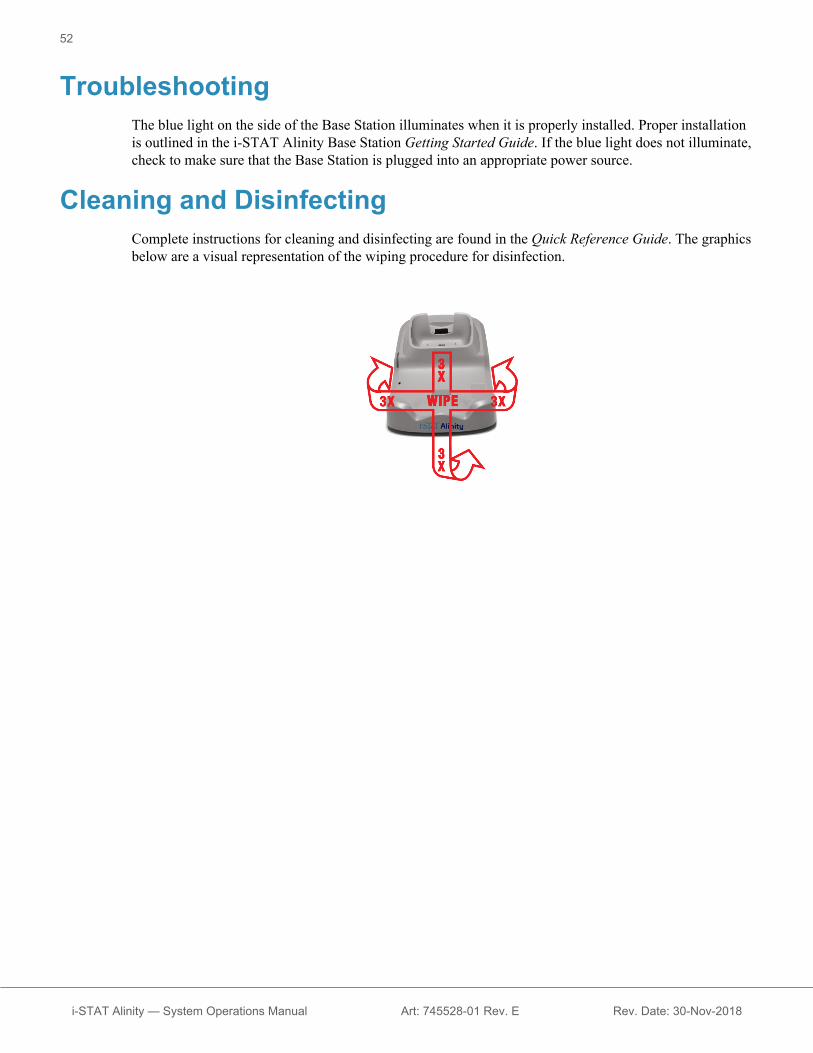
TroubleshootingThe blue light on the side of the Base Station illuminates when it is properly installed. Proper installationis outlined in the i‑STAT Alinity Base Station Getting Started Guide. If the blue light does not illuminate,check to make sure that the Base Station is plugged into an appropriate power source.
Cleaning and DisinfectingComplete instructions for cleaning and disinfecting are found in the Quick Reference Guide. The graphicsbelow are a visual representation of the wiping procedure for disinfection.
52
i-STAT Alinity — System Operations Manual Art: 745528-01 Rev. E Rev. Date: 30-Nov-2018
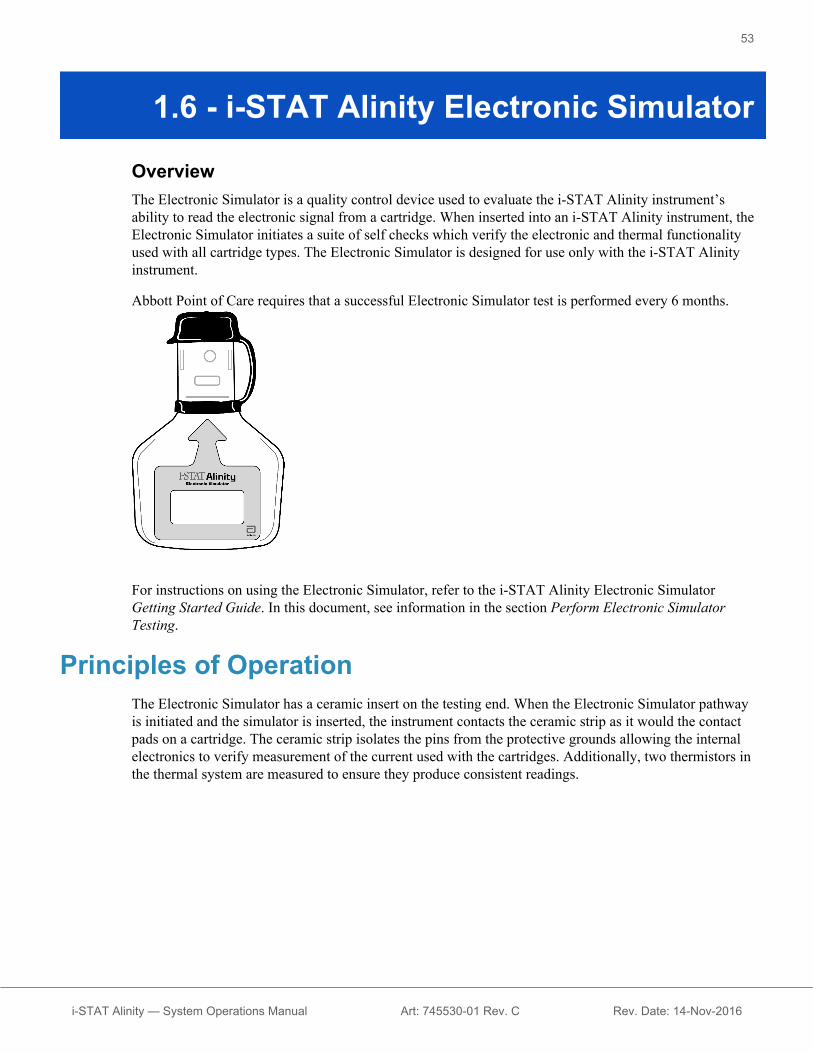
1.6 - i-STAT Alinity Electronic Simulator
OverviewThe Electronic Simulator is a quality control device used to evaluate the i‑STAT Alinity instrument’sability to read the electronic signal from a cartridge. When inserted into an i‑STAT Alinity instrument, theElectronic Simulator initiates a suite of self checks which verify the electronic and thermal functionalityused with all cartridge types. The Electronic Simulator is designed for use only with the i‑STAT Alinityinstrument.
Abbott Point of Care requires that a successful Electronic Simulator test is performed every 6 months.
For instructions on using the Electronic Simulator, refer to the i‑STAT Alinity Electronic SimulatorGetting Started Guide. In this document, see information in the section Perform Electronic SimulatorTesting.
Principles of OperationThe Electronic Simulator has a ceramic insert on the testing end. When the Electronic Simulator pathwayis initiated and the simulator is inserted, the instrument contacts the ceramic strip as it would the contactpads on a cartridge. The ceramic strip isolates the pins from the protective grounds allowing the internalelectronics to verify measurement of the current used with the cartridges. Additionally, two thermistors inthe thermal system are measured to ensure they produce consistent readings.
53
i-STAT Alinity — System Operations Manual Art: 745530-01 Rev. C Rev. Date: 14-Nov-2016

Specificationsi-STAT Alinity Electronic Simulator Specifications
Dimensions: Height x Width x Length 2.8 in (6.9 cm) x .6 in (1.6 cm) x 4.3 in (10.8 cm)without cap
2.8 in (6.9 cm) x .6 in (1.6 cm) x 4.4 in (11.1 cm) withcap
Operational range: Temperature and humidity 16 to 30ºC (61 to 86ºF)10 to 90% non-condensing, with maximum saturationtemperature of 34ºC (93.2ºF)
Storage range: Temperature and humidity -10 to 60ºC (14 to 140ºF)10 to 90% non-condensing, with maximum saturationtemperature of 34ºC (93.2ºF)
Altitude up to 3,048 meters (10,000 feet)
Precautions and LimitationsFor best results, observe the following precautions:
DO:
• use only the accessories and consumables specified or supplied for this system by Abbott Point ofCare.
• place the removable cap over the contacts when the Electronic Simulator is not in use or whencleaning or disinfecting.
• check with authorities for local, state, and/or national requirements for disposal.
DO NOT:
• attempt to remove the Electronic Simulator while a test is being performed.• drop the Electronic Simulator, as doing so can cause it to malfunction.• place the Electronic Simulator in an oxygen-enriched atmosphere.• make any unauthorized repairs or modifications to this product.• use the Electronic Simulator with any instrument other than the i‑STAT Alinity.• touch the area under the cap.
NOTE:
• Function provided by this equipment may be impaired if used in a manner not specified by AbbottPoint of Care.
• The instrument can become contaminated with blood during use. Operators should use standardprecautions whenever handling the instrument, cartridge, and peripherals to protect themselves fromblood-borne pathogens and pathogens from other body substances. Standard precautions, such as thewearing of gloves, are designed to protect personnel from blood-borne pathogens and pathogens from
54
i-STAT Alinity — System Operations Manual Art: 745530-01 Rev. C Rev. Date: 14-Nov-2016

other body substances. These precautions are based on the assumption that blood, body fluids, andtissue can contain infectious agents and should therefore be treated as biohazardous materials. Formore information, refer to the CDC/NIH manual Biosafety in Microbiological and BiomedicalLaboratories, 4th edition, 1999, or to the WHO Laboratory Biosafety Manual, 2nd edition, 2003.
• The instrument and its peripherals are not listed by any authority with respect to suitability for use inoxygen-enriched atmospheres.
Cleaning and DisinfectingComplete instructions for cleaning and disinfecting are found in the Quick Reference Guide. The graphicsbelow are a visual representation of the wiping procedure for disinfection.
55
i-STAT Alinity — System Operations Manual Art: 745530-01 Rev. C Rev. Date: 14-Nov-2016

56
i-STAT Alinity — System Operations Manual Art: 745530-01 Rev. C Rev. Date: 14-Nov-2016

1.7 - Perform Electronic Simulator TestingAlthough the instrument performs internal electronic checks and calibration during each test cycle, theElectronic Simulator test provides an independent check on the ability of the instrument to take accurateand sensitive measurements of voltage, current and resistance from the cartridge. The instrument will passor fail this electronic test depending on whether or not it measures these signals within limits specified inthe instrument software.
Electronic Simulator
The Electronic Simulator is a quality control device used to evaluate the i‑STAT Alinity instrument’sability to read the electronic signal from a cartridge. The test cycle for the Electronic Simulator isapproximately 60 seconds.
Relative humidityThe Electronic Simulator test will fail if high humidity interferes with the measurements. It is thereforeunnecessary to record humidity where the instruments are in use.
Storing the Electronic SimulatorStore the Electronic Simulator with the cap on in the box in which it was shipped.
Perform a test using the Electronic SimulatorRefer to the Quick Reference Guide.
57
i-STAT Alinity — System Operations Manual Art: 745578-01 Rev. B Rev. Date: 17-Oct-2016

Perform the Thermal Probe CheckUse the procedure below to check the thermal probes on each instrument twice a year.
Note: Please refer to the Manufacturer's Quality System Instructions (MQSI) foradditional information.
1. If the instrument and Electronic Simulator have been stored separately in areas where the ambienttemperature differs by more than 3°C or 5°F, allow the Simulator and instrument to equilibrate to thesame temperature, out of drafts, for 30 minutes before inserting the Simulator into the instrument.Minimize handling the Simulator to maintain its thermal uniformity and stability.
2. From the Home screen, touch More Options > Quality Options > Perform Electronic SimulatorTest and then follow the screen prompts.
3. Remove the cap from the end of the Electronic Simulator and insert the Electronic Simulator into theinstrument.
4. When results are displayed, the difference between the thermal probes can be viewed on theinstrument’s screen by touching the View Entered Info tab on the right side of the screen.
5. Interpret the thermal probe check value:• Acceptable: PASS• Not acceptable: FAIL message with a Quality Check Failure Code. Repeat the procedure to
confirm results. If the repeat test fails contact Technical Support.
58
i-STAT Alinity — System Operations Manual Art: 745578-01 Rev. B Rev. Date: 17-Oct-2016

1.8 - i-STAT Alinity Printer
OverviewThe portable printer prints information about patient and quality control tests. It is designed to be usedonly with the i‑STAT Alinity instrument. The printer can receive data directly from the instrumentthrough infrared radiation (IR) transmission or through a data cable connected to the Base Station.
You can print information such as:
• Name of test• Patient ID• Quality Test ID• Test result(s)• Sample type selected• Date and time the test was performed• Operator ID• Lot number of the cartridge• Lot number of liquid quality material• Serial number of the instrument• Application software version in the instrument• Standardization software in the instrument
The printer is recharged using a power adapter connected to an outlet. For additional information onprinter assembly and use, see the i‑STAT Alinity printer Getting Started Guide.
59
i-STAT Alinity — System Operations Manual Art: 745525-01 Rev. C Rev. Date: 25-Sep-2017

Principles of OperationTo print patient results:1. From the instrument's Home screen, touch More Options > Review Results > All Results2. Scan or Enter Operator ID.3. Choose results by touching the checkbox in front of the result identifier. Use Page ➡ key to advance
the page if applicable.4. Ensure that the instrument and the printer are on a flat, level and horizontal surface. Align the
instrument's IR port with the printer IR window.5. Touch Print Selected. An audible beep is heard when the instrument has successfully transmitted all
results to the printer. Printer may still be printing when beep is heard.
Specifications
Dimensions: Height x Width x Depth 2.9 in (7.2 cm) x 5.4 in (13.6 cm) x 4.7 in (12.0 cm)
Weight 1.1 lb (500 g)
Power ratings (AC adapter) Input: 100-240 VAC, 50/60Hz, 1.1 A
Output: 12 VDC, 3.0 A
Power ratings (battery pack) 4.8 V
Operational range: Temperature and humidity 15 to 40ºC (59 to 104ºF)
20 to 90% Non-condensing relative humidity
Storage range: Temperature and humidity -20 to 50ºC (-4 to 122ºF)
10 to 90% Non-condensing
Communication link Infrared or Serial/RJ12
Paper black print thermal paper5.7 cm wide
Available from Abbott Point of Care
60
i-STAT Alinity — System Operations Manual Art: 745525-01 Rev. C Rev. Date: 25-Sep-2017

Precautions and LimitationsFor best results, observe the following precautions when using the i‑STAT Alinity printer.DO:
• use only a rechargeable battery pack purchased from Abbott Point of Care.• use only the power adapter and supply provided with the i‑STAT Alinity printer kit.• use an i‑STAT Alinity printer when attempting to print from an i‑STAT Alinity instrument.• check with authorities for local, state, and/or national requirements for disposal.
DO NOT:
• operate the printer without paper.• pull paper through the paper mechanism. Damage to the printer can result. Use the paper feed button.• allow the power supply to become a trip hazard.• place the printer in an oxygen-enriched atmosphere.• disturb the instrument or the printer until printing is complete, since this will interrupt the printout. If
printing is interrupted, realign the instrument and the printer, or replace the instrument in the BaseStation to resume printing.
• place printers side by side. Doing so may cause instrument to printer communication problems.
NOTE:• The instrument and its peripherals are not listed by any authority with respect to suitability for use in
oxygen-enriched atmospheres.• In the event of a battery leaking, do not allow any leakage to come into contact with the skin or eyes.
If contact has been made, wash the affected area with copious amounts of water and seek medicaladvice.
• If a printout appears inconsistent with a patient's clinical assessment, verify that the correct patientrecord was selected (patient ID, date and time of test, etc.). If the record is not correct, select thecorrect record and print. If the printout still does not match the data in the instrument, the printer needsservice and the printed results must not be used. If another printer is available, retry.
• Fluorescent light sources can cause interference with communications sent to the i‑STAT Alinityprinter. When light from a fluorescent source of sufficient proximity or brightness has a direct pathinto the printer's infrared radiation (IR) window, the printer might fail to respond when records aresent for printing over a serial (wired) connection to a Base Station.
61
i-STAT Alinity — System Operations Manual Art: 745525-01 Rev. C Rev. Date: 25-Sep-2017

TroubleshootingThis section provides tips for diagnosing and fixing problems with the i‑STAT Alinity printer.
Note: Attempting to print from an i‑STAT Alinity instrument to any printer other than ani‑STAT Alinity printer may be unsuccessful.
When a problem occurs, it may be indicated by the printer's POWER or STATUS lights. To diagnose andcorrect a problem, refer to the information below:
Printer Problem Resolution
The printer does not print. The POWERindicator light is green or orange, and theSTATUS indicator light is green.
• Check that the results are displayed on the instrument,or that results have been selected from List underReview Results.
• If printing directly from the instrument, check that thedistance between the instrument and the printer isbetween 1 and 5 inches (2.5 to 12.7 cm).
• Perform a printer self-test to ensure that the printer isfunctioning:1. Power off the printer.2. While pressing the Paper Feed button, press down on
the Power button until the printout begins. Then letgo of both buttons.
3. Check to see that the resulting printout is clear andcomplete.
The printer is not printing over a wiredconnection to the Base Station. ThePOWER indicator light is green or orange,and the STATUS indicator light is green.
If the printer is close to a fluorescent light:• Reposition the printer or shield the infrared radiation
(IR) window to prevent direct line-of-sight between thefluorescent light and the IR window.
• Relocate the printer or fluorescent light to a greaterdistance from each other.
• Turn off fluorescent lights within close proximity of theprinter when printing records over a serial connection.
• Print directly from the instrument over an IRconnection.
The printer is feeding paper, but nothing isprinted.
Check that the paper is feeding from under the roll.
The printer is not printing and thePOWER indicator is red.
Recharge the battery.
The printer's POWER indicator does notilluminate when the printer is powered on.
Recharge the battery.
The printer does not print, and theSTATUS indicator is orange.
Add paper to the printer.
The printer does not print, and theSTATUS indicator is red.
The print head is hot. Allow the print head to cool beforeattempting to reprint.
62
i-STAT Alinity — System Operations Manual Art: 745525-01 Rev. C Rev. Date: 25-Sep-2017

When some print problems occur, a message prints that indicates the cause:
Printout Text System Administrator Action
Printer Failure. Discardprintout. Use anotherprinter. Report failedprinter to SystemAdministrator.001
Reset the failed printer:1. Turn off the printer and unplug the power cord.2. Open the battery compartment and unplug the battery.3. Leave the battery unplugged for at least 10 seconds.
Then reconnect the battery and close the batterycompartment.
4. Reconnect the power cord. Then, press the power buttonto turn the printer on. Attempt to print a record from theinstrument. If a printer failure occurs, contact TechnicalSupport.
Printer Failure. Use anotherprinter. Report failedprinter to SystemAdministrator. 002
Reset the failed printer:1. Turn off the printer and unplug the power cord.2. Open the battery compartment and unplug the battery.3. Leave the battery unplugged for at least 10 seconds.
Then reconnect the battery and close the batterycompartment.
4. Reconnect the power cord. Then, press the power buttonto turn the printer on. Attempt to print a record from theinstrument. If a printer failure occurs, contact TechnicalSupport.
Printer Failure. Use anotherprinter. Report failedprinter to SystemAdministrator. 003
Reset the failed printer:1. Turn off the printer and unplug the power cord.2. Open the battery compartment and unplug the battery.3. Leave the battery unplugged for at least 10 seconds.
Then reconnect the battery and close the batterycompartment.
4. Reconnect the power cord. Then, press the power buttonto turn the printer on. Attempt to print a record from theinstrument. If a printer failure occurs, contact TechnicalSupport.
Printer Failure. Use anotherprinter. Report failedprinter to SystemAdministrator. 004
Reset the failed printer:1. Turn off the printer and unplug the power cord.2. Open the battery compartment and unplug the battery.3. Leave the battery unplugged for at least 10 seconds.
Then reconnect the battery and close the batterycompartment.
4. Reconnect the power cord. Then, press the power buttonto turn the printer on. Attempt to print a record from theinstrument. If a printer failure occurs, contact TechnicalSupport.
63
i-STAT Alinity — System Operations Manual Art: 745525-01 Rev. C Rev. Date: 25-Sep-2017

Cleaning and DisinfectingComplete instructions for cleaning and disinfecting are found in the Quick Reference Guide. The graphicsbelow are a visual representation of the wiping procedure for disinfection.
64
i-STAT Alinity — System Operations Manual Art: 745525-01 Rev. C Rev. Date: 25-Sep-2017

1.9 - Manufacturer's Quality SystemInstructions
The list below defines the i‑STAT Alinity System MQSI components.
1 Check New or Replacement Instruments with the Electronic SimulatorUse the Electronic Simulator to verify operation of a new or replacement instrument before use.
2 Check Temperature Strip for a New Shipment of CartridgesVerify that the temperature in transit was maintained by reading the temperature strip includedin each shipping container.
3 Ensure Proper Cartridge Storage according to these criteria:• Refrigerator storage conditions for stored cartridges range from 2 to 8ºC (35 to 46ºF).• Cartridges are not exposed to temperatures exceeding 30ºC (86ºF).• Cartridges are not used after the expiration date printed on the individual pouch and box.• A cartridge taken from refrigerated storage must stand in its pouch at room temperature for 5
minutes before use.• A box of pouched cartridges must stand at room temperature for one hour before use.• A cartridge allowed to come to room temperature must be labeled with its new expiration
date. See the Quick Reference Guide.• A cartridge is used immediately after it is removed from its pouch.
4 Ensure Thermal Probe Check is PerformedEnsure the thermal probe check is performed with the electronic simulator every 6 months oneach instrument. This check can be performed in conjunction with the instrument's softwareupdates.
5 Train Staff on Avoidance of Pre- and Post-analytical ErrorsEnsure that users are trained to avoid pre-analytical errors such as those associated with samplecollection, delays in testing, inadequate sample mixing, and post-analytical errors (resultsreporting and communication).
There may be additional accreditation organization requirements and individual codes, statutes, orregulations which are not addressed here.
65
i-STAT Alinity — System Operations Manual Art: 745532-01 Rev.C Rev. Date: 14-Nov-2016

66
i-STAT Alinity — System Operations Manual Art: 745532-01 Rev.C Rev. Date: 14-Nov-2016

1.10 - Liquid Quality ControlsPerform liquid quality control testing in accordance with facility protocols, best practices, and regulatoryrequirements.
Note: Only i‑STAT Controls, i‑STAT TriControls Control and ACT solutions can beused with a non-customized instrument. See the AlinIQ CWi section of this manual forinstruction on creating and assigning customization profiles to instruments.
i-STAT ControlsStorageStore refrigerated at 2 to 8ºC (35 to 46ºF) until the printed expiration date on the box and ampule labels.
Unopened ampules of i‑STAT Controls solutions can also be maintained at room temperature (18 to30ºC or 64 to 86ºF) for up to 5 days.
Do not use i‑STAT Controls solutions past the labeled expiration date on the box and ampule labels.
Ampule useBarcode on the ampule must be scanned before the ampule is opened.
i‑STAT Controls ampule testing must be performed within 10 minutes of opening the ampule.
i‑STAT Controls ampule testing must be performed immediately upon opening when testing pH, PCO2,PO2 or iCa.
RangesAssigned ranges are provided in the form of value assignment sheets (VAS). These are located on https://www.pointofcare.abbott/int/en/i-stat-alinity-support. Abbott Point of Care makes available both eVASand ReVAS. ReVAS ranges are provided as a feature for the German market and for those customers whoprefer ranges set using Rilibak guidelines.
Electronic value assignment sheets (eVAS or ReVAS) may be downloaded to a customized instrumentvia the Abbott Managed Cloud or USB. See the System Operations Manual for information andinstruction on creating customization profiles. Selection of eVAS or ReVAS must be made during thecreation of the profile.
Note: Follow facility policy regarding control results that do not fall within assignedranges.
DisposalCheck with authorities for local, state, and/or national requirements for disposal.
67
i-STAT Alinity — System Operations Manual Art: 745533-01 Rev. E Rev. Date: 12-Feb-2018

i‑STAT Controls testingPrerequisites
• Ampules, cartridges, and instruments must be at the same temperature.• i‑STAT Controls solutions require different temperature stabilization times depending on whether or
not PO2 is to be measured. If PO2 is to be measured, equilibrate the ampule for 4 hours. If not,equilibrate the ampule for approximately 30 minutes at room (ambient) temperature.
• Do not use the solution left in a syringe, ampule or capillary tube for additional testing of cartridgesthat contain sensors for iCa, pH, PCO2 or PO2. However, cartridges without these sensors may betested with remaining fluids if within 10 minutes of opening the ampule.
• Since aqueous based solutions such as controls lack the buffering capabilities of whole blood, thetransfer process from ampule to cartridge must be more expedient than with a patient sample.
Procedure for Performing i‑STAT Controls Testing1. Press Power and allow instrument to power on.
Note: After powering on the instrument, one or more alert messages may display.Read the message carefully and perform the functions necessary to evaluate and/orclear the alert. The Home screen will display when the alerts have been successfullymanaged.
2. From the Home screen touch More Options > Quality Options > Quality Control. Select the buttonthat is appropriate for the testing. Continue to follow the prompts on the screen. There are threepathways available for performing liquid QC tests. The default is unscheduled (see the QuickReference Guide). The other two options are available when the instrument is customized by thesystem administrator (see the Customization Workspace for i‑STAT (AlinIQ CWi)).
3. Enter the required information by following the prompts on the screen. Prepare the cartridge andcontrol solution for testing.
4. Shake the ampule vigorously for 5 to 10 seconds to equilibrate the liquid and gas phases. To shake,hold the ampule at the tip and bottom with forefinger and thumb to minimize increasing thetemperature of the solution. If necessary, tap the tip of the ampule to send solution back into thebottom section of the ampule.
5. Protect fingers with gauze, tissue or glove, or use an ampule breaker to snap off the tip of the ampuleat the neck.
6. Immediately transfer the solution from the ampule into a capillary tube or syringe (refer toinformation for transferring the control solution, below), and then immediately transfer the solutioninto a cartridge. Help graphics on the instrument show the transfer of control material to the cartridgevia a syringe with a blunt tip needle.
7. Immediately close the cartridge and insert it into an instrument – it is important to prevent exposingthe solution to room air since this will alter the results.
Transferring the control solution: syringe with blunt tip needlePlain syringes (1cc or 3cc sterile syringes with blunt tip needles) are recommended to transfer aqueouscontrol solutions from the ampule to the cartridge.
To use a syringe:1. Place the end of the blunt tip needle into the bottom of the ampule.2. Slowly remove approximately 1cc of solution from the ampule into the syringe.
68
i-STAT Alinity — System Operations Manual Art: 745533-01 Rev. E Rev. Date: 12-Feb-2018

• If air is trapped between the leading edge of the solution and the plunger, do not invert the syringeto expel it; this will not affect solution near the tip of the syringe.
• If air bubbles are continually drawn into the syringe, or if a bubble is trapped near the tip of thesyringe, discard the ampule and syringe.
3. Remove syringe from the ampule and expel one or two drops from the syringe.4. Place needle into the sample cartridge and fill the cartridge to the fill mark.5. Close cartridge and begin testing immediately.
Transferring the control solution: capillary tubePlain capillary tubes are recommended to transfer aqueous control solution from the ampule to thecartridge. Capillary tubes with sufficient fill capacity are required. For example, when filling a cartridgethat requires 95 µl, use a 150 µl capillary tube.
To use a capillary tube:1. Place a clean, dry finger over one end of the tube and insert open end of the tube into the bottom of the
ampule.2. When the open end of the tube touches the bottom of the ampule, tip the ampule slightly. Remove
finger from the other end to allow filling by capillary action. Completely fill the tube with the controlsolution.
3. Place a finger over the open end of the tube. Remove the tube from the ampule.4. Place open end of the tube into the sample cartridge. Remove finger to allow the control solution to
fill the cartridge to the fill mark.5. Close cartridge immediately after filling.6. Testing should be started immediately.
i-STAT SolutionsAqueous-based control solutions are available for verifying the integrity of newly received cartridges.i‑STAT Control Level 1, 2 and 3 are formulated at three clinically relevant levels with defined pH andhematocrit values and with known concentrations of:
Sodium PCO2 Glucose
Potassium PO2 Lactate
Chloride TCO2 BUN/Urea
Ionized Calcium Creatinine
Each level of control is packaged in a box containing 10 individual 1.7 mL glass ampules.
The control solutions do not contain human serum or serum products, but they do contain buffers andpreservatives.
This table lists the reactive ingredients for i-STAT Control materials:
Analyte Control Level 1 Control Level 2 Control Level 3
Na (mmol/L) 127 141 169
K (mmol/L) 3.1 4.0 6.8
69
i-STAT Alinity — System Operations Manual Art: 745533-01 Rev. E Rev. Date: 12-Feb-2018

Analyte Control Level 1 Control Level 2 Control Level 3
Cl (mmol/L) 85 100 122
Glu (mmol/L) 2.5 7.3 17
Urea (mmol/L) 18 4 2.7
iCa (mmol/L) 1.6 1.3 0.8
Lac (mmol/L) 8.4 2.3 1
Crea (µmol/L) 386 155 46
PCO2 (mmHg) 66 30 22
PO2 (mmHg) 61 100 140
H+ (pH) 7.15 7.41 7.60
i-STAT TriControlsStorageStore refrigerated at 2 to 8ºC (35 to 46ºF) until the printed expiration date on the box and ampule labels.
Unopened ampules of i‑STAT TriControls solutions can also be maintained at room temperature (18 to30ºC or 64 to 86ºF) for up to 5 days.
Do not use i‑STAT TriControls solutions past the labeled expiration date on the box and ampule labels.
Ampule useBarcode on the ampule must be scanned before the ampule is opened.
i‑STAT TriControls ampule testing must be performed within 10 minutes of opening the ampule.
i‑STAT TriControls ampule testing must be performed immediately upon opening when testing pH,PCO2, PO2 or iCa.
RangesAssigned ranges are provided in the form of value assignment sheets (VAS). These are located on https://www.pointofcare.abbott/int/en/i-stat-alinity-support. Abbott Point of Care makes available both eVASand ReVAS. ReVAS ranges are provided as a feature for the German market and for those customers whoprefer ranges set using Rilibak guidelines.
Electronic value assignment sheets (eVAS or ReVAS) may be downloaded to a customized instrumentvia the Abbott Managed Cloud or USB. See the System Operations Manual for information andinstruction on creating customization profiles. Selection of eVAS or ReVAS must be made during thecreation of the profile.
Note: Follow facility policy regarding control results that do not fall within assignedranges.
70
i-STAT Alinity — System Operations Manual Art: 745533-01 Rev. E Rev. Date: 12-Feb-2018
DisposalCheck with authorities for local, state, and/or national requirements for disposal.
i‑STAT TriControls Control testingPrerequisites
• Ampules, cartridges, and instruments must be at the same temperature.• i‑STAT TriControls Control solutions require different temperature stabilization times depending on
whether or not PO2 is to be measured. If PO2 is to be measured, equilibrate the ampule for 4 hours. Ifnot, equilibrate the ampule for approximately 30 minutes at room (ambient) temperature.
• Do not use the solution left in a syringe, ampule or capillary tube for additional testing of cartridgesthat contain sensors for iCa, pH, PCO2 or PO2. However, cartridges without these sensors may betested with remaining fluids if within 10 minutes of opening the ampule.
• Since aqueous based solutions such as controls lack the buffering capabilities of whole blood, thetransfer process from ampule to cartridge must be more expedient than with a patient sample.
Procedure for Performing i‑STAT TriControls Control Testing1. Press Power and allow instrument to power on.
Note: After powering on the instrument, one or more alert messages may display.Read the message carefully and perform the functions necessary to evaluate and/orclear the alert. The Home screen will display when the alerts have been successfullymanaged.
2. From the Home screen touch More Options > Quality Options > Quality Control. Select the buttonthat is appropriate for the testing. Continue to follow the prompts on the screen. There are threepathways available for performing liquid QC tests. The default is unscheduled (see the QuickReference Guide). The other two options are available when the instrument is customized by thesystem administrator (see the Customization Workspace for i‑STAT (AlinIQ CWi)).
3. Enter the required information by following the prompts on the screen. Prepare the cartridge andcontrol solution for testing.
4. Shake the ampule vigorously for 5 to 10 seconds to equilibrate the liquid and gas phases. To shake,hold the ampule at the tip and bottom with forefinger and thumb to minimize increasing thetemperature of the solution. If necessary, tap the tip of the ampule to send solution back into thebottom section of the ampule.
5. Protect fingers with gauze, tissue or glove, or use an ampule breaker to snap off the tip of the ampuleat the neck.
6. Immediately transfer the solution from the ampule into a capillary tube or syringe (refer toinformation for transferring the control solution, below), and then immediately transfer the solutioninto a cartridge. Help graphics on the instrument show the transfer of control material to the cartridgevia a syringe with a blunt tip needle.
7. Immediately close the cartridge and insert it into an instrument – it is important to prevent exposingthe solution to room air since this will alter the results.
Transferring the control solution: syringe with blunt tip needlePlain syringes (1cc or 3cc sterile syringes with blunt tip needles) are recommended to transfer aqueouscontrol solutions from the ampule to the cartridge.
71
i-STAT Alinity — System Operations Manual Art: 745533-01 Rev. E Rev. Date: 12-Feb-2018
To use a syringe:1. Place the end of the blunt tip needle into the bottom of the ampule.2. Slowly remove approximately 1cc of solution from the ampule into the syringe.
• If air is trapped between the leading edge of the solution and the plunger, do not invert the syringeto expel it; this will not affect solution near the tip of the syringe.
• If air bubbles are continually drawn into the syringe, or if a bubble is trapped near the tip of thesyringe, discard the ampule and syringe.
3. Remove syringe from the ampule and expel one or two drops from the syringe.4. Place needle into the sample cartridge and fill the cartridge to the fill mark.5. Close cartridge and begin testing immediately.
Transferring the control solution: capillary tubePlain capillary tubes are recommended to transfer aqueous control solution from the ampule to thecartridge. Capillary tubes with sufficient fill capacity are required. For example, when filling a cartridgethat requires 95 µl, use a 150 µl capillary tube.
To use a capillary tube:1. Place a clean, dry finger over one end of the tube and insert open end of the tube into the bottom of the
ampule.2. When the open end of the tube touches the bottom of the ampule, tip the ampule slightly. Remove
finger from the other end to allow filling by capillary action. Completely fill the tube with the controlsolution.
3. Place a finger over the open end of the tube. Remove the tube from the ampule.4. Place open end of the tube into the sample cartridge. Remove finger to allow the control solution to
fill the cartridge to the fill mark.5. Close cartridge immediately after filling.6. Testing should be started immediately.
i-STAT TriControls Control SolutionsAqueous-based control solutions are available for verifying the integrity of newly received cartridges.i‑STAT TriControls Control Level 1, 2 and 3 are formulated at three clinically relevant levels withdefined pH and hematocrit values and with known concentrations of:
Sodium PCO2 Glucose
Potassium PO2 Lactate
Chloride TCO2 BUN/Urea
Ionized Calcium Creatinine
Each level of control is packaged in a box containing 10 individual 1.7 mL glass ampules.
The control solutions do not contain human serum or serum products, but they do contain buffers andpreservatives.
This table lists the reactive ingredients for i‑STAT TriControls Control solutions:
72
i-STAT Alinity — System Operations Manual Art: 745533-01 Rev. E Rev. Date: 12-Feb-2018
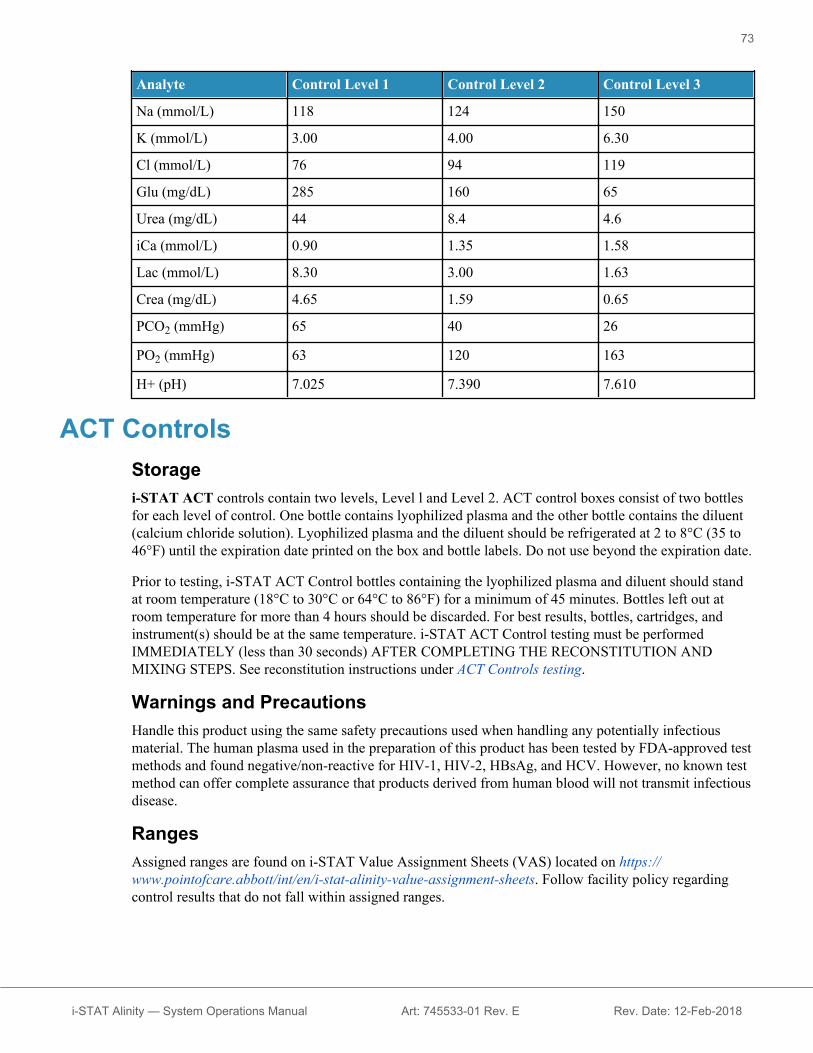
Analyte Control Level 1 Control Level 2 Control Level 3
Na (mmol/L) 118 124 150
K (mmol/L) 3.00 4.00 6.30
Cl (mmol/L) 76 94 119
Glu (mg/dL) 285 160 65
Urea (mg/dL) 44 8.4 4.6
iCa (mmol/L) 0.90 1.35 1.58
Lac (mmol/L) 8.30 3.00 1.63
Crea (mg/dL) 4.65 1.59 0.65
PCO2 (mmHg) 65 40 26
PO2 (mmHg) 63 120 163
H+ (pH) 7.025 7.390 7.610
ACT ControlsStoragei‑STAT ACT controls contain two levels, Level l and Level 2. ACT control boxes consist of two bottlesfor each level of control. One bottle contains lyophilized plasma and the other bottle contains the diluent(calcium chloride solution). Lyophilized plasma and the diluent should be refrigerated at 2 to 8°C (35 to46°F) until the expiration date printed on the box and bottle labels. Do not use beyond the expiration date.
Prior to testing, i‑STAT ACT Control bottles containing the lyophilized plasma and diluent should standat room temperature (18°C to 30°C or 64°C to 86°F) for a minimum of 45 minutes. Bottles left out atroom temperature for more than 4 hours should be discarded. For best results, bottles, cartridges, andinstrument(s) should be at the same temperature. i‑STAT ACT Control testing must be performedIMMEDIATELY (less than 30 seconds) AFTER COMPLETING THE RECONSTITUTION ANDMIXING STEPS. See reconstitution instructions under ACT Controls testing.
Warnings and PrecautionsHandle this product using the same safety precautions used when handling any potentially infectiousmaterial. The human plasma used in the preparation of this product has been tested by FDA-approved testmethods and found negative/non-reactive for HIV-1, HIV-2, HBsAg, and HCV. However, no known testmethod can offer complete assurance that products derived from human blood will not transmit infectiousdisease.
RangesAssigned ranges are found on i‑STAT Value Assignment Sheets (VAS) located on https://www.pointofcare.abbott/int/en/i-stat-alinity-value-assignment-sheets. Follow facility policy regardingcontrol results that do not fall within assigned ranges.
73
i-STAT Alinity — System Operations Manual Art: 745533-01 Rev. E Rev. Date: 12-Feb-2018

DisposalDispose of this product as biohazardous waste according to all local, state, and national regulations.
Reconstitution InstructionsSee instructions under ACT Controls testing.
ACT Controls testingPrerequisites
• Ampules, cartridges, and instruments must be at the same temperature.• i‑STAT ACT Control bottles containing the lyophilized plasma and diluent should stand at room
temperature (18 to 30°С or 64 to 86°F) for a minimum of 45 minutes.• i‑STAT ACT Control testing must be performed IMMEDIATELY (less than 30 seconds) AFTER
COMPLETING THE RECONSTITUTION AND MIXING STEPS.
Procedure for Performing ACT Controls
1. Press Power and allow instrument to power on.
Note: After powering on the instrument, one or more alert messages may display.Read the message carefully and perform the functions necessary to evaluate and/orclear the alert. The Home screen will display when the alerts have been successfullymanaged.
2. From the Home screen touch More Options > Quality Options > Quality Control. Three optionsare available. The default is Perform Unscheduled QC.
3. Touch the appropriate button and continue to follow the prompts on the screen.4. Prepare the control solution as follows:
Note: Best practice is to reconstitute and use one level at a time.
A. Allow lyophilized plasma and diluent to stand at room temperature for 45 minutes.B. Remove the cap and stopper from lyophilized plasma and remove the cap from the diluent bottle.C. Pour the entire contents of the diluent into the lyophilized plasma bottle. Discard the empty bottle.D. Place the stopper back on the reconstituted control bottle, closing the bottle appropriately so that
the contents do not leak or spill.E. Allow the bottle to sit at room temperature for 1minute.F. Mix the contents of the bottle by swirling gently for 1 minute, then inverting slowly for 30
seconds.
Note: To minimize foaming of the control sample, avoid vigorous or rapid mixingmotion.
G. Visually inspect the control bottle to ensure the sample is fully reconstituted. If not, discard andrepeat from step A.
H. IMMEDIATELY:• Transfer the solution from the bottle into the cartridge using a plastic transfer pipette or a non-
anticoagulated plastic syringe.• Close the cartridge
74
i-STAT Alinity — System Operations Manual Art: 745533-01 Rev. E Rev. Date: 12-Feb-2018
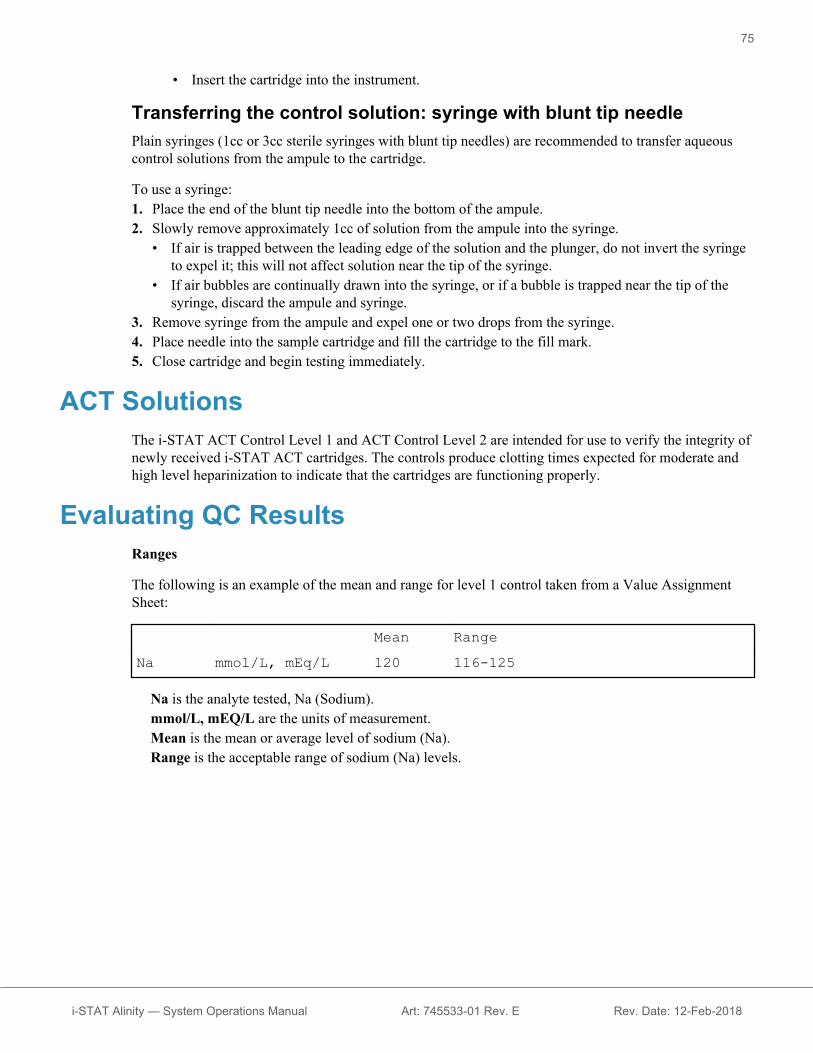
• Insert the cartridge into the instrument.
Transferring the control solution: syringe with blunt tip needlePlain syringes (1cc or 3cc sterile syringes with blunt tip needles) are recommended to transfer aqueouscontrol solutions from the ampule to the cartridge.
To use a syringe:1. Place the end of the blunt tip needle into the bottom of the ampule.2. Slowly remove approximately 1cc of solution from the ampule into the syringe.
• If air is trapped between the leading edge of the solution and the plunger, do not invert the syringeto expel it; this will not affect solution near the tip of the syringe.
• If air bubbles are continually drawn into the syringe, or if a bubble is trapped near the tip of thesyringe, discard the ampule and syringe.
3. Remove syringe from the ampule and expel one or two drops from the syringe.4. Place needle into the sample cartridge and fill the cartridge to the fill mark.5. Close cartridge and begin testing immediately.
ACT SolutionsThe i‑STAT ACT Control Level 1 and ACT Control Level 2 are intended for use to verify the integrity ofnewly received i‑STAT ACT cartridges. The controls produce clotting times expected for moderate andhigh level heparinization to indicate that the cartridges are functioning properly.
Evaluating QC ResultsRanges
The following is an example of the mean and range for level 1 control taken from a Value AssignmentSheet:
Mean RangeNa mmol/L, mEq/L 120 116-125
Na is the analyte tested, Na (Sodium).mmol/L, mEQ/L are the units of measurement.Mean is the mean or average level of sodium (Na).Range is the acceptable range of sodium (Na) levels.
75
i-STAT Alinity — System Operations Manual Art: 745533-01 Rev. E Rev. Date: 12-Feb-2018

76
i-STAT Alinity — System Operations Manual Art: 745533-01 Rev. E Rev. Date: 12-Feb-2018

1.11 - Calibration Verification (Cal Ver)Calibration Verification is a procedure performed to confirm that the calibration of an instrument or testsystem has remained stable throughout the reportable range. This procedure is also called a linearitycheck.
Note: Only i‑STAT Calibration Verification and i‑STAT TriControls CalibrationVerification solutions can be used with a non-customized instrument. See the AlinIQCWi section of this manual for instruction on creating and assigning customizationprofiles to instruments.
The following four items are reasons to perform calibration verification:
1. Validate the reportable range of a test before the test system is put into use.The accuracy of results over the entire reportable range could be assessed by testing the same patientsamples on the new system and on a system with known accuracy and comparing results using anacceptable difference criteria.
The target values have been determined over many lots of cartridges and results on these solutionswhen compared to the target values indicate the performance of a particular lot of cartridges.
2. Verify that a change in reagent lot numbers does not affect either the reportable range orcontrol values.Lot-to-lot variation over the entire reportable range for any reagent system could be assessed bytesting calibration verification solutions on old and new lots in parallel. Quality controls samples withconcentrations at decision points should always be used to assess new lots of reagent before results arereported.
3. Verify that results have not been affected by maintenance or repair procedures.The user cannot perform any maintenance procedures on the i‑STAT Alinity System. The software inthe instrument is updated periodically. Calibration verification solutions could be tested to verify thatthe system performs as before the upgrade.
Repaired and newly purchased instruments are received with factory calibration. Testing calibrationverification samples or comparing patient sample results on a new or repaired instrument with an olderinstrument will assess cartridge performance. The Electronic Simulator, rather than calibrationverification or control solutions, provides better assurance that the instrument is functioning correctly.Any variations in instrument performance will not be statistically discernable above the performanceof the cartridges. When multiple instruments are to be used at a facility, Abbott Point of Care Inc.recommends including at least two instruments in any performance verification studies so thatstatistics reflect the “system.”
4. Troubleshoot when control values are out-of-range.Should quality control sample results fall outside of the acceptable ranges, the use of calibrationverification samples with very low or very high concentrations could be helpful in characterizing areagent problem. The characteristics of the sensors and results of control solutions are sufficient forTechnical Support specialists to help users resolve out-of-range control problems.
StorageStore refrigerated at 2 to 8°C (35 to 46°F) until the printed expiration date on the box and ampule labels.
77
i-STAT Alinity — System Operations Manual Art: 745537-01 Rev. C Rev. Date: 25-Sep-2017

Unopened ampules of i‑STAT Calibration Verification and i‑STAT TriControls CalibrationVerification and solutions can also be maintained at room temperature (18 to 30°C or 64 to 86°F ) for upto 5 days.
Do not use i‑STAT Calibration Verification and i‑STAT TriControls Calibration Verificationsolutions past the labeled expiration date on the box and ampule labels.
Ampule useBarcode on the ampule must be scanned before the ampule is opened.
i‑STAT Calibration Verification and i‑STAT TriControls Calibration Verification ampule testingmust be performed within 10 minutes of opening the ampule.
i‑STAT Calibration Verification and i‑STAT TriControls Calibration Verification ampule testingmust be performed immediately upon opening the ampule when testing pH, PCO2, PO2, iCa.
RangesAssigned ranges are provided in the form of value assignment sheets (VAS). These are located on https://www.pointofcare.abbott/int/en/i-stat-alinity-support. Abbott Point of Care makes available both eVASand ReVAS. ReVAS ranges are provided as a feature for the German market and for those customers whoprefer ranges set using Rilibak guidelines.
Electronic value assignment sheets (eVAS or ReVAS) may be downloaded to a customized instrumentvia the Abbott Managed Cloud or USB. See the System Operations Manual for information andinstruction on creating customization profiles. Selection of eVAS or ReVAS must be made during thecreation of the profile.
Note: Follow facility policy regarding control results that do not fall within assignedranges.
DisposalCheck with authorities for local, state, and/or national requirements for disposal.
Calibration Verification testingPrerequisites• Ampules, cartridges, and instruments must be at the same temperature.• i‑STAT Calibration Verification and i‑STAT TriControls Calibration Verification solutions
require different temperature stabilization times depending on whether or not PO2 is to be measured. IfPO2 is to be measured, equilibrate the ampule for 4 hours. If not, equilibrate the ampule forapproximately 30 minutes at room (ambient) temperature.
• Do not use the solution left in a syringe, ampule or capillary tube for additional testing of cartridgesthat contain sensors for iCa, pH, PCO2, or PO2. However, cartridges without these sensors may betested with remaining fluids if within 10 minutes of opening the ampule.
• Since aqueous based solutions such as controls lack the buffering capabilities of whole blood, thetransfer process from ampule to cartridge must be more expedient than with a patient sample.
• Refer to the value assignment sheets posted on the Abbott Point of Care website at www.abbottpointofcare.com.
78
i-STAT Alinity — System Operations Manual Art: 745537-01 Rev. C Rev. Date: 25-Sep-2017

Procedure1. Press Power and allow the instrument to power on.
Note: After powering on the instrument, one or more alert messages may display.Read the message carefully and perform the functions necessary to evaluate and/orclear the alert. The Home screen will display when the alerts have been successfullymanaged.
2. From the Home screen touch More Options > Quality Options > Cal/Ver. Select the button that isappropriate for the testing.
3. Enter the required information by following the prompts on the screen. Prepare the cartridge andcontrol solution for testing.
4. Shake the ampule vigorously for 5 to 10 seconds to equilibrate the liquid and gas phases. To shake,hold the ampule at the tip and bottom with forefinger and thumb to minimize increasing thetemperature of the solution. If necessary, tap the tip of the ampule to send solution back into thebottom section of the ampule.
5. Protect fingers with gauze, tissue or glove, or use an ampule breaker to snap off the tip of the ampuleat the neck.
6. Immediately transfer the solution from the ampule into a capillary tube or syringe (refer toinformation for transferring the control solution, below), and then immediately transfer the solutioninto a cartridge. Help graphics on the instrument show transfer of Cal Ver material to the cartridge viasyringe with blunt tip needle.
7. Immediately close the cartridge and insert it into an instrument – it is important to prevent exposingthe solution to room air since this will alter the results.
Transferring the Cal Ver solution: syringe with blunt tip needlePlain syringes (1cc or 3cc sterile syringes with blunt tip needles) are recommended to transfer aqueousCal Ver solutions from the ampule to the cartridge.
To use a syringe:1. Place the end of the blunt tip needle into the bottom of the ampule.2. Slowly remove approximately 1cc of solution from the ampule into the syringe.
• If air is trapped between the leading edge of the solution and the plunger, do not invert the syringeto expel it; this will not affect solution near the tip of the syringe.
• If air bubbles are continually drawn into the syringe, or if a bubble is trapped near the tip of thesyringe, discard the ampule and syringe.
3. Remove syringe from the ampule and expel one or two drops from the syringe.4. Place needle into the sample cartridge and fill the cartridge to the fill mark.5. Close cartridge and begin testing immediately.
Transferring the Cal Ver solution: capillary tubePlain capillary tubes are recommended to transfer aqueous control solution from the ampule to thecartridge. Capillary tubes with sufficient fill capacity are required. For example, when filling a cartridgethat requires 95 µl, use a 150 µl capillary tube.
To use a capillary tube:1. Place a clean, dry finger over one end of the tube and insert open end of the tube into the bottom of the
ampule.
79
i-STAT Alinity — System Operations Manual Art: 745537-01 Rev. C Rev. Date: 25-Sep-2017

2. When the open end of the tube touches the bottom of the ampule, tip the ampule slightly. Removefinger from the other end to allow filling by capillary action. Completely fill the tube with the Cal Versolution.
3. Place a finger over the open end of the tube. Remove the tube from the ampule.4. Place open end of the tube into the sample cartridge. Remove finger to allow the Cal Ver solution to
fill the cartridge to the fill mark.5. Close cartridge immediately after filling.6. Testing should be started immediately.
Evaluating Cal Ver ResultsRanges
Calibration throughout the reportable range of each analyte is verified if each analyte value falls withinthe corresponding range in the Value Assignment Sheet.
If a result for a level falls outside the assigned range, follow laboratory policy. Contact Technical Supportfor troubleshooting information.
Note: If the calibration verification set is to be used to assess linearity, plot the analytevalue against the mean value of the acceptable range. The concentrations of analytes in thecalibration verification set are not intended or prepared to be equally spaced.
The following is an example of the mean and range for level 1 Cal Ver solution taken from a ValueAssignment Sheet:
Mean RangeNa mmol/L, mEq/L 120 116-125
Na is the analyte tested, Na (Sodium).mmol/L, mEQ/L are the units of measurement.Mean is the mean or average level of sodium (Na).Range is the acceptable range of sodium (Na) levels.
80
i-STAT Alinity — System Operations Manual Art: 745537-01 Rev. C Rev. Date: 25-Sep-2017

i-STAT Calibration Verification (Cal Ver) Solutionsi-STAT Calibration Verification (Cal Ver) SolutionsA five-level calibration verification set is available to verify the calibration of i‑STAT cartridgesthroughout the reportable range.
Sodium PCO2 Glucose
Potassium PO2 Lactate
Chloride pH BUN/Urea
Ionized Calcium Creatinine
Each set contains four 1.7 mL glass ampules of each level.
Reactive ingredients for i-STAT Calibration Verification materialsAnalyte Cal Ver Level
1Cal Ver Level2
Cal Ver Level3
Cal Ver Level4
Cal Ver Level5
Na (mmol/L) 108 127 141 169 187
K (mmol/L) 2.3 3.1 4.0 6.8 8.5
Cl (mmol/L) 71 85 100 122 133
Glu (mmol/L) 1.8 2.5 7.3 17 35
Urea (mmol/L) 44.6 18 4 2.7 1.8
iCa (mmol/L) 2.5 1.6 1.3 0.8 0.2
Lac (mmol/L) 19.5 8.4 2.3 1 0.6
Crea (µmol/L) 1486 386 155 46 17
PCO2 (mmHg) 95 66 30 22 18
PO2 (mmHg) 43 61 100 140 400
H+ (pH) 6.81 7.15 7.41 7.60 7.95
81
i-STAT Alinity — System Operations Manual Art: 745537-01 Rev. C Rev. Date: 25-Sep-2017

i-STAT TriControls Calibration Verification solutionsA five-level calibration verification set is available to verify the calibration of i‑STAT cartridgesthroughout the reportable range.
Sodium PCO2 Glucose
Potassium PO2 Lactate
Chloride TCO2 BUN/Urea
Ionized Calcium Hematocrit Creatinine
pH
Each set contains four 1.7 mL glass ampules of each level.
Reactive ingredients for i-STAT TriControls Calibration VerificationmaterialsAnalyte Cal Ver Level
1Cal Ver Level2
Cal Ver Level3
Cal Ver Level4
Cal Ver Level5
Na (mmol/L) 97 118 124 150 159
K (mmol/L) 2.30 3.00 4.00 6.30 8.20
Cl (mmol/L) 67 76 94 119 134
Glu (mg/dL) 595 285 160 65 53
Urea (mg/dL) 114 44 8.4 4.6 3.0
iCa (mmol/L) 0.40 0.90 1.35 1.58 2.40
Lac (mmol/L) 17.7 8.30 3.00 1.63 1.52
Crea (mg/dL) 15.6 4.65 1.59 0.65 0.55
PCO2 (mmHg) 96 65 40 26 12
PO2 (mmHg) 40 63 120 163 500
H+ (pH) 6.550 7.025 7.390 7.610 7.850
82
i-STAT Alinity — System Operations Manual Art: 745537-01 Rev. C Rev. Date: 25-Sep-2017

1.12 - i-STAT Cartridges
Overviewi‑STAT cartridges contain test reagents which are located on sensors on the top of the cartridge. Theinstrument and cartridge work together to generate a clinically meaningful result.
The cartridges are designed for use with the i‑STAT Alinity instrument.Note: Not all cartridges are available in all regions. Check with your local representativefor availability in specific markets.
Principles of Operation
SensorsThe sensors are electrodes microfabricated on silicon chips located within the cartridge. Electrodes havechemically sensitive coatings such as ion-selective membranes and enzyme layers. Each sensor is
83
i-STAT Alinity — System Operations Manual Art: 745524-01 Rev. F Rev. Date: 04-Nov-2019

connected to a contact pad by a signal line. The sensors respond to the calibrant solution and the sampleby producing measurable signals related to analyte concentration.
Contact padsThe contact pads conduct the signals generated by the sensors to the instrument. In order for these tofunction properly, care must be exercised not to contaminate the contact pads during cartridge handling.
Sensor ChannelThe sensor channel directs the sample from the sample chamber to the sensors. An extension of thischannel becomes a waste chamber to receive the calibrant solution as it is displaced by the sample.
Air ChamberAn air chamber is located in blood gas/electrolyte/chemistry/hematocrit cartridges between the samplechamber and sensor channel. This creates an air segment between the calibrant solution, if applicable, andthe sample to prevent the two from mixing. The size of the air segment is monitored by the instrument.
Calibrant PackDuring the first part of the testing cycle, the calibrant solution is automatically released from the foil packand is positioned over the sensors. The foil pack may be pierced with improper cartridge handling. If fluidis released prematurely, a Quality Check Failure may occur.
Fill ToThe blue arrow on the white label cartridge and the clear arrow on the blue cover cartridge is intended tohelp the operator fill the cartridge correctly. Samples that fall above or below the indicated level mayresult in a Quality Check Failure.
Sample ChamberThe sample chamber includes the sample well and the channel leading from the well up to the fill mark.When filled, the sample chamber contains sufficient sample for testing. Sample volume and placement aremonitored by the instrument.
BladderThe bladder is connected to the sample well. The instrument presses on the bladder to displace calibrantsolution from the sensors, to move the sample from the sample chamber to the sensors, or to mix sampleand reagents.
Sample WellThe area on the cartridge where the sample is introduced into the sample chamber.
ClosureThe closure creates an airtight seal necessary for proper fluid movement within the cartridge. The closurealso ensures that calibrant and sample remain contained within the cartridge during the testing cycle andsubsequent disposal.
Cartridge on the left in the illustration contains natural rubber latex on the snap closure. The cartridgeshown on the right is not made with natural rubber latex.
84
i-STAT Alinity — System Operations Manual Art: 745524-01 Rev. F Rev. Date: 04-Nov-2019

Heating elementsAll i‑STAT cartridges require thermal control at 37°C (98.6°F), and include heating elements on theunderside of the sensor chips which are contacted and heated by the instrument's thermal probes.
Standardization and calibrationStandardization is the process by which a manufacturer establishes “true” values for representativesamples. A multi-point calibration curve, the slope or sensitivity of which is defined by coefficients in theCLEW software, is derived for each sensor by this standardization process. These calibration curves arestable over many lots.
A one-point calibration is performed each time a cartridge requiring calibration is used. During the firstpart of the testing cycle, the calibrant solution is automatically released from its foil pack and ispositioned over the sensors. The signals produced by the sensors’ responses to the calibrant solution aremeasured. This one-point calibration adjusts the offset of the stored calibration curve. Next, theinstrument automatically moves the sample over the sensors and the signals produced by the sensors’responses to the sample are measured. While coefficients are used rather than graphic calibration curves,the calculation of the result is equivalent to reading the sample’s concentration from an adjustedcalibration curve.
Types of cartridge sensorsSensors are thin film electrodes microfabricated onto silicon chips. Sensing functionality is imparted toeach electrode by a number of chemically sensitive films coated over the active region of the electrodes.
The cartridges have three different types of sensors built in: potentiometric, amperometric, andconductometric.
Potentiometric sensorsIn potentiometric measurements, the difference in potential that exists between an indicatorelectrode and a reference electrode is measured. Ion-selective electrodes (ISE) are examples ofpotentiometric sensors. The indicator electrode is designed to be sensitive to a particular ion in asolution. In cases where other ions are sensed by the system, selectivity coefficients can be usedto correct for this interference. An enzyme can be added to an ISE to produce ions from analytesof interest that are not themselves ions.
Potentiometric sensors utilize two important concepts. The first concept is the Nernst Equationwhich relates the measured potential to the activity of the ion being measured. It is written as:
E = E° + RT/nF ln a
Where E is the potential, E° is a constant dependent on the electrode/sensor system, R is the gasconstant, T is the absolute temperature, F is Faraday’s constant, (n) is the valence (positive ornegative charge) for the ion being measured, and (a) is the activity of that ion.
The Nernst equation can be rewritten as:
E = E° + S log a
Where S replaces the constant term which defines the slope of the sensor. The slope is the changein millivolts per tenfold change in the activity of the analyte. For a positively-charged monovalention, the theoretical slope would be 59.1 mV at 25°C.
85
i-STAT Alinity — System Operations Manual Art: 745524-01 Rev. F Rev. Date: 04-Nov-2019
The second concept is Activity versus Concentration where ion-selective electrodes measureactivity rather than concentration. Activity (a) is related to concentration (c) through the activitycoefficient (γ). It is written as:
a = γcNote: While ion activities, which reflect free rather than total ion concentrations,are the physiologically relevant quantity, activity values are converted toconventional concentration units so that values obtained by direct ISEmeasurements can be compared to values obtained from methods that measuretotal ion concentrations. The latter includes the indirect methods, which haveactivity coefficients close to unity or one, and flame photometric, atomicabsorption and titration methods.
Amperometric sensorsIn amperometric measurements, a potential is applied to the measuring electrode while currentgenerated by the resulting oxidation or reduction reactions in the test system is measured. Thecurrent generated is directly proportional to the concentration of the analyte. An enzyme can beadded to a layer on or near an amperometric sensor to produce electroactive species from analytesof interest that cannot themselves be oxidized or reduced.
Conductometric sensorsIn conductometric measurements, an alternating current is applied between two electrodes incontact with the test solution and the resulting voltage difference is measured. The conductivityof the solution is proportional to the magnitude of the voltage difference. In aqueous solutions,conductivity is dependent upon the concentration of electrolytes; an increase in the electrolyteconcentration causes an increase in conductivity.
Determination of analyte concentrationPotentiometric and amperometric sensors are used for the determination of analyte concentration. Forboth sensors, the concentration of the analyte can be calculated using:1. The known value of the analyte concentration in the calibrant solution2. The measured voltage (potentiometric) or current (amperometric) signal generated by the analyte in
the calibrant3. The measured signal generated by the analyte in the test solution
For potentiometric sensors, the analyte activity in the sample is calculated from the Nernst equationaccording to:
Esample - Ecalibrant = S log (asample/acalibrant)
Complex solutions such as blood deviate slightly from Nernstian behavior due to interfering ions andmatrix effects that result in junction potentials. By including selectivity coefficients in the Nernst equation(Nikolsky equation), these effects can be minimized. By characterizing the reference electrode in differentsolutions, effects of matrix on the reference junction potential can also be minimized.
86
i-STAT Alinity — System Operations Manual Art: 745524-01 Rev. F Rev. Date: 04-Nov-2019
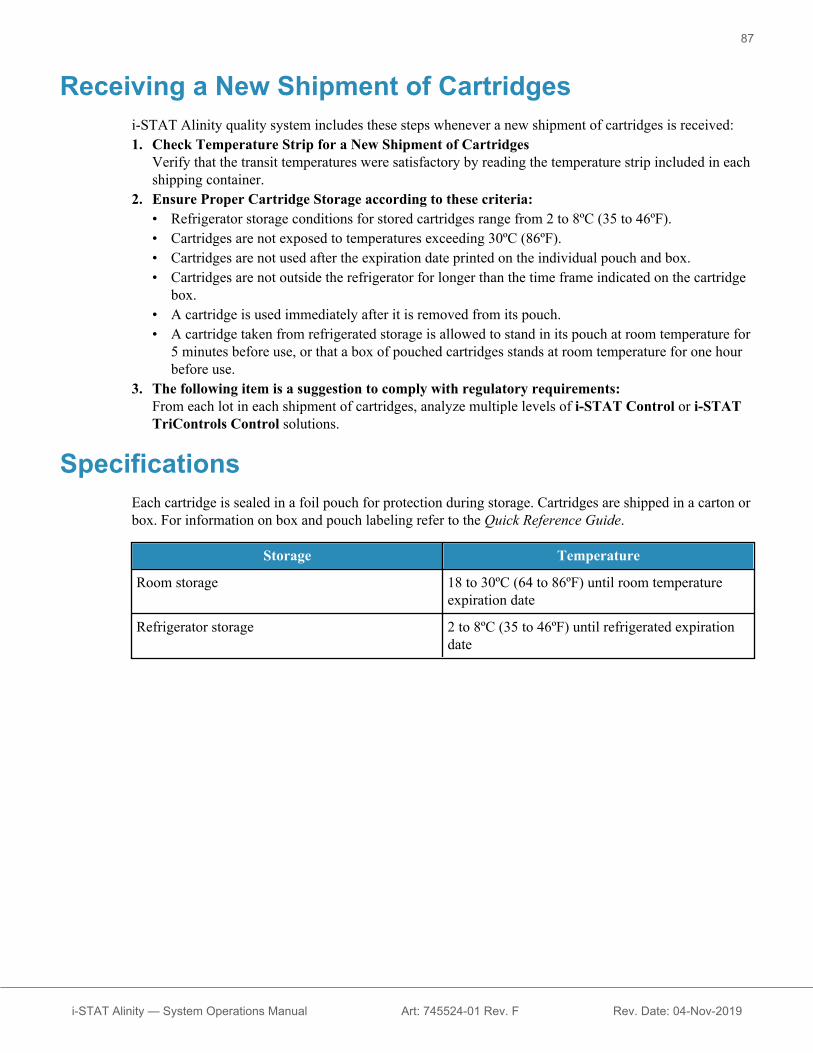
Receiving a New Shipment of Cartridgesi‑STAT Alinity quality system includes these steps whenever a new shipment of cartridges is received:1. Check Temperature Strip for a New Shipment of Cartridges
Verify that the transit temperatures were satisfactory by reading the temperature strip included in eachshipping container.
2. Ensure Proper Cartridge Storage according to these criteria:• Refrigerator storage conditions for stored cartridges range from 2 to 8ºC (35 to 46ºF).• Cartridges are not exposed to temperatures exceeding 30ºC (86ºF).• Cartridges are not used after the expiration date printed on the individual pouch and box.• Cartridges are not outside the refrigerator for longer than the time frame indicated on the cartridge
box.• A cartridge is used immediately after it is removed from its pouch.• A cartridge taken from refrigerated storage is allowed to stand in its pouch at room temperature for
5 minutes before use, or that a box of pouched cartridges stands at room temperature for one hourbefore use.
3. The following item is a suggestion to comply with regulatory requirements:From each lot in each shipment of cartridges, analyze multiple levels of i-STAT Control or i‑STATTriControls Control solutions.
SpecificationsEach cartridge is sealed in a foil pouch for protection during storage. Cartridges are shipped in a carton orbox. For information on box and pouch labeling refer to the Quick Reference Guide.
Storage Temperature
Room storage 18 to 30ºC (64 to 86ºF) until room temperatureexpiration date
Refrigerator storage 2 to 8ºC (35 to 46ºF) until refrigerated expirationdate
87
i-STAT Alinity — System Operations Manual Art: 745524-01 Rev. F Rev. Date: 04-Nov-2019

Precautions and LimitationsAlthough cartridges are not fragile, they consist of sensors and other sensitive components that will alterthe test results, or generate Quality Check Failure Codes (QCF) codes, if they are not properly filled andhandled.DO:• dispose of the cartridge in a container for biohazardous waste, in accordance with your facility's
policies and with local, state, and national regulatory guidelines.• keep the cartridge and the instrument at the temperature of the room where they are to be used.
Condensation on a cold cartridge can prevent proper contact with the instrument.
DO NOT:• use a cartridge if either the refrigerated or room temperature dates have passed. See the Quick
Reference Guide.• remove a cartridge from its protective pouch until it is at room temperature 18 to 30ºC (or 64 to 86ºF).• return cartridges to the refrigerator after bringing them to room temperature.• expose cartridges to temperatures above 30ºC (86ºF).• use a cartridge that is expired or that shows signs of damage.• use a cartridge if the foil pouch or clear plastic portion pack has been punctured.• apply pressure to the central area of the label because the calibrant pack inside could burst
prematurely.• place the cartridges in an oxygen-enriched atmosphere.• touch the sensors on the top of the cartridge.• use a cartridge onto which blood or any other fluid has spilled. Avoid filling cartridges on surfaces
where the cartridge could pick up fibers, fluid, debris, or other materials that could lodge in theinstrument.
• attempt to remove the cartridge while the message Cartridge Locked in instrument. Donot attempt to remove the cartridge. remains on the screen.
NOTES:• The instrument and its peripherals are not listed by any authority with respect to suitability for use in
oxygen-enriched atmospheres.
• Follow manufacturer's recommendations for handling and storing samples drawn into lithium orbalanced heparin.
88
i-STAT Alinity — System Operations Manual Art: 745524-01 Rev. F Rev. Date: 04-Nov-2019

1.13 - Software UpdatesSoftware updates to the i-STAT Alinity instrument are delivered twice a year. Each software updatecontains two elements in a single package: CLEW software and application software. These updates maybe downloaded and installed either by a network connection to the Abbott Managed Cloud (Server), orfrom the Abbott Point of Care website via a USB memory device.
• Software update and installation using USB memory device via Base Station is a two-step process. Itrequires downloading the software from https://www.pointofcare.abbott/int/en/i-stat-alinity-supportonto a USB memory device, and then downloading and installing the software onto the instrument viathe Base Station.
• Software update and installation via Abbott Managed Cloud (Server) with a wired or wireless networkconnection requires an instrument operator to check for software update using the instrument, and theninitiate the software download onto the instrument. Once the instrument has received the software, aninstall confirmation will be displayed. The operator can choose to install the software at a later time. Ifthe operator cancels the install confirmation the instrument will display an icon on the home pageindicating the software is available for installation. The software icon will display until installation iscomplete.
Note: Best practice is to enable use of an Operator List to protect the Update Software flows frombeing executed by unauthorized personnel.
Software Update and Installation using USB memorydevice via Base Station
Use this procedure to update the instrument software via USB memory device.
Note: This procedure takes approximately 5 to 15 minutes to complete. Therefore, it is recommendedthis procedure be executed outside of the clinical work area.
Prerequisites:
Equipment:• i‑STAT Alinity instrument(s) to be updated• Base Station with power cable connected to AC mains power• Formatted USB memory device• PC with network connection to the Abbott Point of Care website https://
www.pointofcare.abbott/int/en/i-stat-alinity-support
Before attempting to update software from USB, prepare a USB memory device using the followingsteps:1. Obtain a FAT32 formatted USB 2.0 memory device1
2. Remove any package files (.apkg file extension) from the top level of the directory structure of thememory device.
3. Retrieve the i‑STAT Alinity instrument software package from the Abbott Point of Care website https://www.pointofcare.abbott/int/en/i-stat-alinity-support
89
i-STAT Alinity — System Operations Manual Art: 754496-01 Rev. C Rev. Date: 06-May-2019

4. Copy the software package to the memory device5. Safely remove the memory device from your PC
Before attempting to update instrument software from USB, ensure the following:1. The instrument is placed in the powered Base Station.
To verify:
The Base Station and instrument light should be blue and the following battery symbol in theupper right-hand corner on the instrument should be displayed.
2. The instrument is running software version OSi05 or later.To verify:
From the Home screen, navigate to: More Options > Instrument Status
Select page that shows the Firmware and verify the name of the firmware is OSi05 or later (i.e.,OSi06, OSi07, OSi08, etc.).
Procedure:Perform the following steps to download and install a software update using the USB memory device:
CAUTION: During the installation, do not remove the instrument or the USB memory device fromthe Base Station. When the installation is complete, the instrument will display a message indicating thatnew software has been installed. The display of this message is the indication that it is safe to remove theinstrument and USB memory device from the Base Station.
1. From the Home screen, navigate to: More Options > Instrument Options > Software Installation >Install From USB
2. Follow the on-screen instructions.3. When presented with the name of the software package to be installed, record the name before
proceeding (this information may be used at the end of the procedure to verify that the software updatehas been completed).• Press Next to continue with the installation of the software package, OR• Press Cancel to terminate the installation
4. Continue to follow the on-screen instructions. During the installation process, the instrument screenwill go blank and remain blank for several minutes. This is normal.• Do not remove the instrument from the Base Station.• Do not remove the memory device from the Base Station.
5. When the installation is complete, the instrument screen will illuminate and display a message thatnew software has been installed. The display of this message is the indication that the installation iscomplete and it is safe to remove the instrument and USB memory device from the Base Station.
90
i-STAT Alinity — System Operations Manual Art: 754496-01 Rev. C Rev. Date: 06-May-2019

6. Follow the instructions on screen to complete the Electronic Simulator testing, or touch Exit Alerts toresume normal operation of the instrument.
Note: It is recommended that Electronic Simulator Test be completed immediately following asoftware update. Depending on the instrument customization, testing may be disabled until anElectronic Simulator Test with passing result is completed.
91
i-STAT Alinity — System Operations Manual Art: 754496-01 Rev. C Rev. Date: 06-May-2019
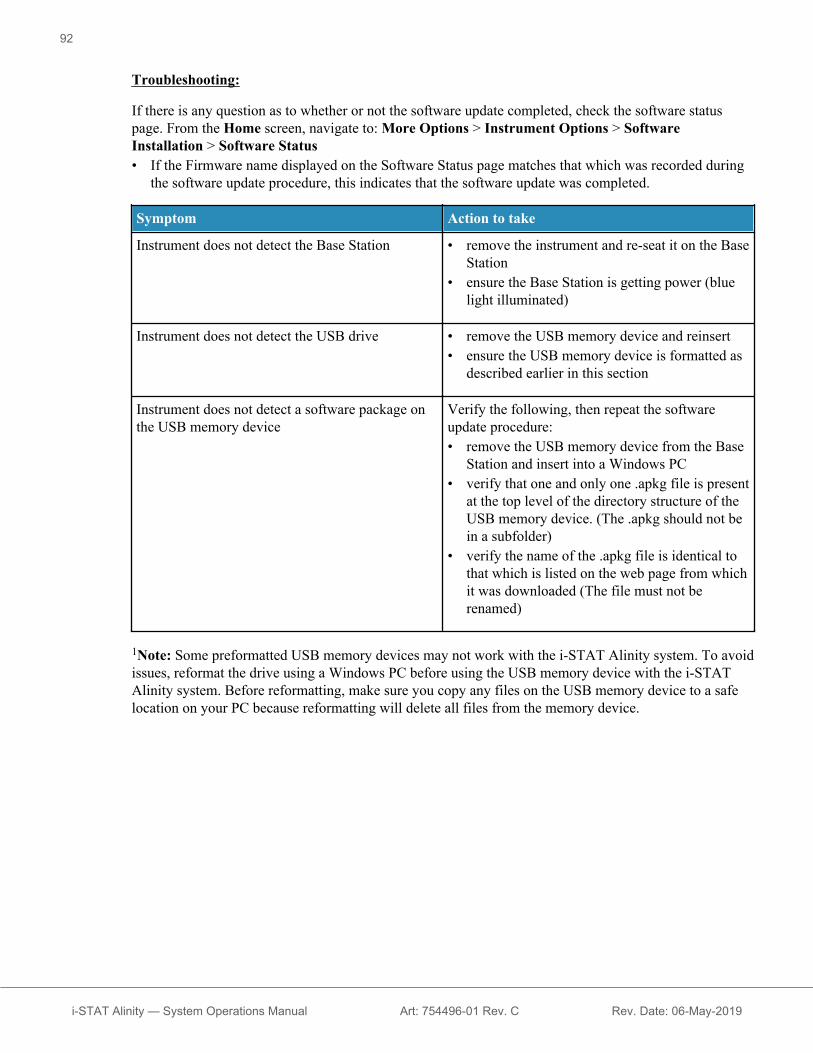
Troubleshooting:
If there is any question as to whether or not the software update completed, check the software statuspage. From the Home screen, navigate to: More Options > Instrument Options > SoftwareInstallation > Software Status• If the Firmware name displayed on the Software Status page matches that which was recorded during
the software update procedure, this indicates that the software update was completed.
Symptom Action to take
Instrument does not detect the Base Station • remove the instrument and re-seat it on the BaseStation
• ensure the Base Station is getting power (bluelight illuminated)
Instrument does not detect the USB drive • remove the USB memory device and reinsert• ensure the USB memory device is formatted as
described earlier in this section
Instrument does not detect a software package onthe USB memory device
Verify the following, then repeat the softwareupdate procedure:• remove the USB memory device from the Base
Station and insert into a Windows PC• verify that one and only one .apkg file is present
at the top level of the directory structure of theUSB memory device. (The .apkg should not bein a subfolder)
• verify the name of the .apkg file is identical tothat which is listed on the web page from whichit was downloaded (The file must not berenamed)
1Note: Some preformatted USB memory devices may not work with the i‑STAT Alinity system. To avoidissues, reformat the drive using a Windows PC before using the USB memory device with the i‑STATAlinity system. Before reformatting, make sure you copy any files on the USB memory device to a safelocation on your PC because reformatting will delete all files from the memory device.
92
i-STAT Alinity — System Operations Manual Art: 754496-01 Rev. C Rev. Date: 06-May-2019

Software Update and Installation via Abbott ManagedCloud (Server) Wired Network Connection
Use this procedure to update the instrument software using a wired connection to Abbott’s ManagedCloud (Server).
Note:• The healthcare organization network must allow instruments to connect to the Abbott Managed Cloud
(Server).• This procedure may take between 15 minutes and 1 hour to complete. Therefore, it is recommended
this procedure be executed outside of the clinical work area.
Prerequisites:
Equipment:• i-STAT Alinity instrument(s) with appropriate Network Configuration file installed• Base Station with power cable connected to AC mains power• Ethernet cable connected to healthcare organization network and Base Station• Internet access
Before attempting to update instrument software from the Abbott Managed Cloud (Server), ensure thefollowing:1. The instrument is configured with a network configuration that allows wired connection to the
internet.See AlinIQ NCi - Network Connectivity for i‑STAT for instructions on configuring instrument fornetwork connection. The wired connection must be enabled. If the healthcare organization networkrequires use of a proxy to access the internet, the Proxy Server settings must also be configured.
2. The instrument is placed in the powered Base Station, and the Base Station has a connection to thehealthcare organization network.To verify:
A. The Base Station and instrument light should be blue and the following battery symbol in theupper right-hand corner on the instrument should be displayed.
B. From the Home screen, navigate to: More Options > Instrument Options > Network Settings >Network Status
C. Navigate to Wired Network Connection section and verify the wired network interface has an IPaddress.
3. The instrument is running software version OSi05 or later.To verify:
A. From the Home screen, navigate to: More Options > Instrument StatusB. Select page that shows the Firmware and verify the name of the firmware is OSi05 or later (i.e.,
OSi06, OSi07, OSi08, etc.).4. Abbott Managed Cloud (Server) services for software update enabled on instrument.
To verify:A. From the Home screen, navigate to: More Options > Instrument Options > Network Settings >
Enable/Disable Cloud Services
93
i-STAT Alinity — System Operations Manual Art: 754496-01 Rev. C Rev. Date: 06-May-2019

B. Enter your Operator ID and press Next to view the Enable/Disable Cloud Services screen. ForFirmware Delivery, verify Enabled is selected.
5. The battery charge level is no less than 51%.To verify:
A. From the Home Screen, navigate to: More Options > Instrument StatusB. Locate Battery and verify level is 51% or higher.
Procedure:
Perform the following steps to download and install software update using the Abbott Managed Cloud(Server) with Wired Connectivity:
CAUTION: During the installation, do not remove the instrument from the Base Station. When theinstallation is complete, the instrument will display a message indicating that new software has beeninstalled. When installation is complete, the instrument may be removed from the Base Station.
1. From the Home screen, navigate to: More Options > Instrument Options > Software Installation >Check for Update
2. After the software download is completed, installation of software can begin. Please skip step 3.3. Software download and installation can be performed at different times if needed. The i‑STAT Alinity
will display the following symbol on the Home screen in the lower right hand corner ifsoftware is downloaded but not installed. Touch this icon to display the Software Installation menu.Touch the Install Pending button to install the software.
4. Follow the on-screen instructions to continue with software installation.5. When presented with the name of the software package to be installed, record the name before
proceeding (this information may be used at the end of the procedure to verify that the software updatehas been completed).• Touch Next to continue with the installation of the software package, OR• Touch Cancel to terminate the installation
6. Continue to follow the on-screen instructions. During the installation process, the instrument screenwill go blank and remain blank for several minutes. This is normal.• Do not remove the instrument from the Base Station
7. When the installation is complete, the instrument will display a message indicating that new softwarehas been installed. The display of this message is the indication that it is safe to resume normaloperation of the instrument.
94
i-STAT Alinity — System Operations Manual Art: 754496-01 Rev. C Rev. Date: 06-May-2019

8. Follow the instructions on screen to complete the Electronic Simulator testing, or press Exit Alerts toresume normal operation of the instrument.
Note: It is recommended that Electronic Simulator Test be completed immediately following asoftware update. Depending on the instrument customization, testing may be disabled until anElectronic Simulator Test with passing result is completed.
Troubleshooting:
If there is any question as to whether or not the software update completed, check the software statuspage. From the Home screen, navigate to: More Options > Instrument Options > SoftwareInstallation > Software Status• If the Firmware name displayed on the Software Status page matches that which was recorded during
the software update procedure, this indicates that the software update was completed.
Symptom Action to take
Battery status indicator does not indicate battery ischarging
• Remove the instrument and re-seat it on theBase Station
• Ensure the Base Station is getting power (Bluelight on Base Station is illuminated)
95
i-STAT Alinity — System Operations Manual Art: 754496-01 Rev. C Rev. Date: 06-May-2019

Symptom Action to take
Check for Update button is not enabled Verify the following as described in theprerequisites, then repeat the software updateprocedure:• The instrument is running software version
OSi05 or later• Abbott Managed Cloud (Server) services for
software update enabled on instrument• The battery charge level is no less than 51%
Instrument indicates a connection could not bemade to the Abbott Managed Cloud (Server)service, OR
Instrument powers off before completing thesoftware download, OR
Instrument does not power on within 10 minutesafter screen going blank
Verify the following as described in theprerequisites, then repeat the software updateprocedure:• i-STAT Alinity instrument(s) with appropriate
Network Configuration file installed• Base Station with power cable connected to AC
mains power• Ethernet Cable connected to healthcare
organization network• The healthcare organization network is
allowing the instrument to connect to theinternet in order to have access to the AbbottManaged Cloud (Server).
Repeated attempts to update software via wirednetwork connection fail
Follow the procedure to perform software updateusing USB memory device
96
i-STAT Alinity — System Operations Manual Art: 754496-01 Rev. C Rev. Date: 06-May-2019
Software Update and Installation via Abbott ManagedCloud (Server) Wireless Network Connection
Use this procedure to update the instrument software using a wireless connection to Abbott’s ManagedCloud (Server).
Note:• The healthcare organization network must allow instruments to connect to the Abbott Managed Cloud
(Server).• This procedure may take between 15 minutes and 1 hour to complete. Therefore, it is recommended
this procedure be executed outside of the clinical work area.
Prerequisites:
Equipment:• i‑STAT Alinity instrument(s) with appropriate Network Configuration file installed• Wireless network• Internet access
Before attempting to update instrument software from the Abbott Managed Cloud (Server), ensure thefollowing:1. The instrument is configured with a network configuration that allows wireless connection to the
internet.See AlinIQ NCi - Network Connectivity for i‑STAT for instructions on configuring instrument fornetwork connection. The wireless connection must be enabled. If the healthcare organization networkrequires use of a proxy to access the internet, the Proxy Server settings must also be configured.
2. The instrument has a wireless connection to the healthcare organization network.To verify:
A. Home screen shows symbol in the upper right-hand corner and the wireless signalstrength is 3 solid bars or greater.
B. From the Home screen, navigate to: More Options > Instrument Options > Network Settings >Network Status
C. Locate the Wireless Connection Details section and verify the wireless network interface has an IPaddress.
3. The instrument is running software version OSi05 or later.To verify:A. From the Home screen, navigate to: More Options > Instrument StatusB. Locate the Firmware item and verify the name of the firmware is OSi05 or later (i.e., OSi06,
OSi07, OSi08, etc.).4. Enable Abbott Managed Cloud (Server) Services is selected on the instrument.
To verify:
A. From the Home screen, navigate to: More Options > Instrument Options > Network Settings >Enable/Disable Cloud Services
B. Enter your Operator ID and press Next to view the Enable/Disable Cloud Services screen. ForFirmware Delivery verify Enabled is selected.
5. The battery charge level is no less than 51%.
97
i-STAT Alinity — System Operations Manual Art: 754496-01 Rev. C Rev. Date: 06-May-2019

To verify:
A. From the Home Screen, navigate to: More Options > Instrument StatusB. Locate Battery and verify level is 51% or higher.
Procedure:
Perform the following steps to download and install software update using the Abbott Managed Cloud(Server) with Wireless Connectivity:
CAUTION: During the software installation, do not remove the battery from the instrument. When theinstallation is complete, the instrument will display a message indicating that new software has beeninstalled. The display of this message is the indication that it is safe to resume normal operation of theinstrument.
1. From the Home screen, navigate to: More Options > Instrument Options > Software Installation >Check for Update
2. After the software download is completed, installation of software can begin. Please skip step 3.3. Software download and installation can be performed at different times if needed. The i‑STAT Alinity
will display the following symbol on the Home screen in the lower right hand corner ifsoftware is downloaded but not installed. Touch this icon to display the Software Installation menu.Touch the Install Pending button to install the software.
4. Follow the on-screen instructions to continue with software installation.5. When presented with the name of the software package to be installed, record the name before
proceeding (this information may be used at the end of the procedure to verify that the software updatehas been completed).• Press Next to continue with the installation of the software package, OR• Press Cancel to terminate the installation
6. Continue to follow the on-screen instructions. During the installation process, the instrument screenwill go blank and remain blank for several minutes. This is normal.• Do not remove the instrument from the Base Station
7. When the installation is complete, the instrument will display a message indicating that new softwarehas been installed. The display of this message is the indication that it is safe to resume normaloperation of the instrument.
98
i-STAT Alinity — System Operations Manual Art: 754496-01 Rev. C Rev. Date: 06-May-2019
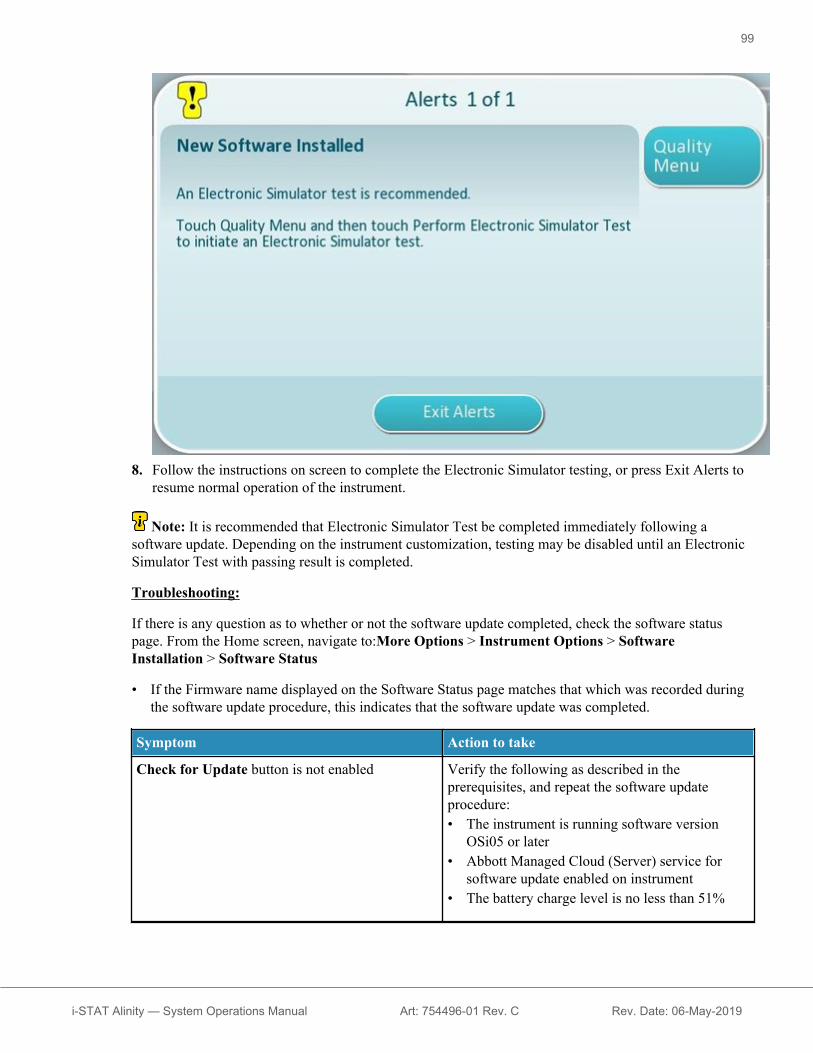
8. Follow the instructions on screen to complete the Electronic Simulator testing, or press Exit Alerts toresume normal operation of the instrument.
Note: It is recommended that Electronic Simulator Test be completed immediately following asoftware update. Depending on the instrument customization, testing may be disabled until an ElectronicSimulator Test with passing result is completed.
Troubleshooting:
If there is any question as to whether or not the software update completed, check the software statuspage. From the Home screen, navigate to:More Options > Instrument Options > SoftwareInstallation > Software Status
• If the Firmware name displayed on the Software Status page matches that which was recorded duringthe software update procedure, this indicates that the software update was completed.
Symptom Action to take
Check for Update button is not enabled Verify the following as described in theprerequisites, and repeat the software updateprocedure:• The instrument is running software version
OSi05 or later• Abbott Managed Cloud (Server) service for
software update enabled on instrument• The battery charge level is no less than 51%
99
i-STAT Alinity — System Operations Manual Art: 754496-01 Rev. C Rev. Date: 06-May-2019

Symptom Action to take
Instrument indicates a connection could not bemade to the Abbott Managed Cloud (Server)service, OR
Instrument powers off before completing thesoftware download, OR
Instrument does not power on within 10 minutesafter screen going blank
Verify the following as described in theprerequisites, and repeat the software updateprocedure:• The wireless signal strength is 3 solid bars or
greater• Instrument is reporting a valid IP address for
the wireless connection• i-STAT Alinity instrument(s) with appropriate
Network Configuration file installed• The healthcare organization network is
allowing the instrument to connect to theinternet in order to have access to the AbbottManaged Cloud (Server)
Repeated attempts to update software via wirelessnetwork connection fail
Follow the procedure to perform software updateusing USB memory device
100
i-STAT Alinity — System Operations Manual Art: 754496-01 Rev. C Rev. Date: 06-May-2019

1.14 - i-STAT Alinity Charge Station
OverviewThe primary function of the Charge Station is to charge the rechargeable battery for the i‑STAT Alinityinstrument. The Charge Station is intended for use only with the i‑STAT Alinity rechargeable battery.The Charge Station looks as shown in these illustrations:
For instructions on installing and using the Charge Station, refer to the i‑STAT Alinity Charge StationGetting Started Guide.
DescriptionThe i‑STAT Alinity Charge Station:• charges the battery• provides the ability, via USB port, to update Charge Station operating software• provides the ability, via USB port, to charge other devices• provides indication of proper connection to power source, via power light• provides indication of battery charging status, via LED status indicators• provides connection to power supply• provides a button for initiating Charge Station software update
101
i-STAT Alinity — System Operations Manual Art: 757655-01 Rev. A Rev. Date: 31-Aug-2018

Light IndicatorsThe Charge Station has a power light on the lower left corner, and a row of 4 LED status indicatorscorresponding to each battery charging area. Graphic found in "Sensitive Areas" at end of this sectionhighlights location of power light and LED status indicators.
Charge Station power lightThe power light, on the lower left corner of the Charge Station, provides the following indications:
Charge Station is not powered - light is off
Charge Station is powered - light is on
Charge Station is powered but is not functioning properly - light is blinking
Battery charging areaEach of the two battery charging areas has a row of 4 blue LEDs to indicate the charge status of a battery.When the Charge Station is first plugged in, all the LEDs blink twice. Placing a battery in a charging areacauses the LEDs to display in one of these patterns:
LED Status Indicators
100% Battery is fully charged – all LEDs on
75% to 99% Battery is charging and is currentlybetween 75% and 99% charged – 3 LEDson, 1 pulsing
50% to 74% Battery is charging and is currentlybetween 50% and 74% charged – 2 LEDson, 1 pulsing, 1 off
25% to 49% Battery is charging and is currentlybetween 25% and 49% charged – 1 LEDon, 1 pulsing, 2 off
0% to 24% Battery is charging and is currentlybetween 0% and 24% charged – 1 LEDpulsing, 3 off
No battery No battery is in the battery charging area– LEDs off
Battery error
Battery error – all four LEDs blinking
Software update error
Software update error – one or moreLEDs blinking (see Troubleshooting)
102
i-STAT Alinity — System Operations Manual Art: 757655-01 Rev. A Rev. Date: 31-Aug-2018

Specificationsi-STAT Alinity Charge Station Specifications
Dimensions: Height x Width x Depth 7.4 in (18.8 cm) x 4.1 in (10.4 cm) x 3.0 in (7.7 cm)without AC adapter
Weight 1.32 lb (600 g)
Operational range: Temperature andhumidity
10 to 40ºC (50 to 104ºF)10 to 90% non-condensing, with maximum saturationtemperature of 34ºC (93.2ºF)
Operating Environment Indoors, on a dry, clean, horizontal or vertical, stablesurface.
Avoid nearby vibration equipment such as centrifuges.
Avoid direct sunlight.
Barometric Pressure Range 350mmHg – 800mmHg
Storage range: Temperature and humidity -10 to 60ºC (14 to 140ºF)10 to 90% non-condensing, with maximum saturationtemperature of 50ºC (122ºF)
External Power Supply Unit Input: 110-240 VAC, 50-60 Hz, 1.2AOutput: 24V DC, 1.875A
USB Interface Compatible with FAT32 formatted USB memory devices.Provides up to 1.2A for charging other devices.
103
i-STAT Alinity — System Operations Manual Art: 757655-01 Rev. A Rev. Date: 31-Aug-2018

Software UpdateIn the event that Abbott Point of Care makes a software update available, customer sites will be notified.The Charge Station USB port can be used to install the update.
Prerequisites – Equipment:• Charge Station to be updated• FAT32 formatted USB 2.0 compatible memory device• PC with network connection to the Abbott Point of Care website: https://
www.pointofcare.abbott/int/en/i-stat-alinity-support
Before attempting to update software from a USB memory device:1. Retrieve the i‑STAT Alinity Charge Station software package from the Abbott Point of Care website:
https://www.pointofcare.abbott/int/en/i-stat-alinity-support2. Copy the package i‑STAT Alinity Charge Station Software Application Package file to the USB
memory device.3. Safely remove the memory device from your PC.
To update software on the Charge Station:1. Verify the Charge Station power light is on indicating the Charge Station is powered and functioning
properly.2. Remove any devices connected to the Charge Station USB port.3. On the back of the Charge Station, press and hold the reset button for approximately 3 seconds. Verify
that both sets of battery charging area LEDs display the following pattern. This indicates the ChargeStation is in software update mode and the USB memory device can be inserted:
4. Insert the USB memory device into the USB port. The LEDs will blink sequentially during the updatecycle.
5. Software has been successfully updated when both sets of LEDs stop blinking sequentially. Verify thefollowing LED pattern on both sets of battery charging area LEDs indicating the software updatecompleted:
If this pattern is not observed see Troubleshooting for a description of the possible causes of the errorand potential corrective actions.
Note: If the following pattern is observed on both sets of battery charging area LEDs,the software version on the USB memory device is already installed on the ChargeStation.
6. Unplug Charge Station from power supply and re-plug.Verify Charge Station power light turns on.Refer to the table LED Status Indicators. Verify battery charging area LEDs indicate eitherbattery charge status or no battery installed.
104
i-STAT Alinity — System Operations Manual Art: 757655-01 Rev. A Rev. Date: 31-Aug-2018

Precautions and LimitationsFor safety when using the Charge Station:
DO:
• use only the accessories and consumables specified or supplied for this system by Abbott Point ofCare.
• use only the power supply shipped in the box with the Charge Station. Attempting to use a differenttype of manufacturer's adapter could damage the unit and cause fire or explosion hazards.
• be sure to install power supply so it does not pose a trip hazard. Mount equipment so cables andaccessories stay clear of walkways.
• use the Charge Station for charging. Refer to the rechargeable battery Getting Started Guide oninstructions for proper charging.
• check with authorities for local, state, and/or national requirements for disposal.
DO NOT:• try to connect any non-electrically isolated equipment to the Charge Station.• connect the Charge Station to unauthorized medical devices or other equipment.• place metal objects on or near the exposed battery charging contacts.• place the Charge Station in an oxygen-enriched atmosphere.• make any unauthorized repairs or modifications to this product, as it may cause personal injury or
damage to the unit.
NOTE:
• The AC adapter power supply plug acts as a disconnect device for the Charge Station and therefore,the AC socket outlet must be installed (or located) near the Charge Station and must be easilyaccessible if the Charge Station needs to be unplugged. When correctly connected to power, the bluelight on the lower left corner of the Charge Station will be illuminated.
• Protection provided by this equipment may be impaired if used in a manner not specified by AbbottPoint of Care.
• The instrument and its peripherals are not listed by any authority with respect to suitability for use inoxygen-enriched atmospheres.
• The Charge Station should be placed on a flat, level, horizontal surface such as a table top, or it maybe mounted on a wall. Falling equipment may cause injury. Always place the equipment on a stablesurface in a location where it will not cause injury if dropped.
105
i-STAT Alinity — System Operations Manual Art: 757655-01 Rev. A Rev. Date: 31-Aug-2018

TroubleshootingWhen charging battery or device:
Symptom Action to take
Power light on lower left cornerof Charge Station is off
• See the Charge Station Getting Started Guide for details.• Check that the Charge Station is plugged into power source.• Check the connection between the AC adapter and the power
plug.• Check that the plug on the AC adapter is securely inserted into
the receptacle on the back of the Charge Station.
Power light on lower left cornerof Charge Station is blinking
• Indicates the Charge Station is not functioning properly. UnplugCharge Station from power supply and re-plug.
• If problem persists, contact Abbott Point of Care technicalsupport.
Battery charging area LEDs donot illuminate when battery isplaced in Charge Station
• Check that the Charge Station power light is on.• Remove the battery and reseat it in the Charge Station.
All four battery charging areaLEDs blink when battery isplaced in Charge Station
• Indicates a battery error. Remove and replace battery. If problempersists, contact Abbott Point of Care technical support.
Device connected to USB port isnot charging
• Check to ensure the USB battery charging requirements of theconnected device are compatible with the Charge Station USBInterface specifications.
• Check the cable connections between the Charge Station and theconnected device.
• Check to ensure that the cable used to connect the device to theCharge Station is functioning properly by connecting the deviceto an alternate USB battery charging source.
Battery charging area LEDsindicate battery is charging, butwhen the same battery is used inan i‑STAT Alinity instrument,the instrument shuts downimmediately after attempting topower on
Indicates battery should be replaced. Obtain a new battery and insertinto battery charging area.
106
i-STAT Alinity — System Operations Manual Art: 757655-01 Rev. A Rev. Date: 31-Aug-2018

When updating software:Symptom Action to take
One or more, but not all, batterycharging area LEDs blink insoftware update mode
Indicates one of the following errors in updating Charge Stationsoftware:
Upper and lower batterycharging area LEDpattern
Software update error description
Waiting for USB memory device to beinserted into USB port
File with file extension .apoc_pkg notfound in the top level of the directorystructure of the memory device.
More than one file with fileextension .apoc_pkg was found in thetop level of the directory structure of thememory device.
The software update file cannot be read.
The software update file was found tobe corrupted.
• USB memory device not formattedwith FAT32 file system.
• The software update file was foundto be corrupted.
Correct the indicated error and repeat the software update procedure.
107
i-STAT Alinity — System Operations Manual Art: 757655-01 Rev. A Rev. Date: 31-Aug-2018
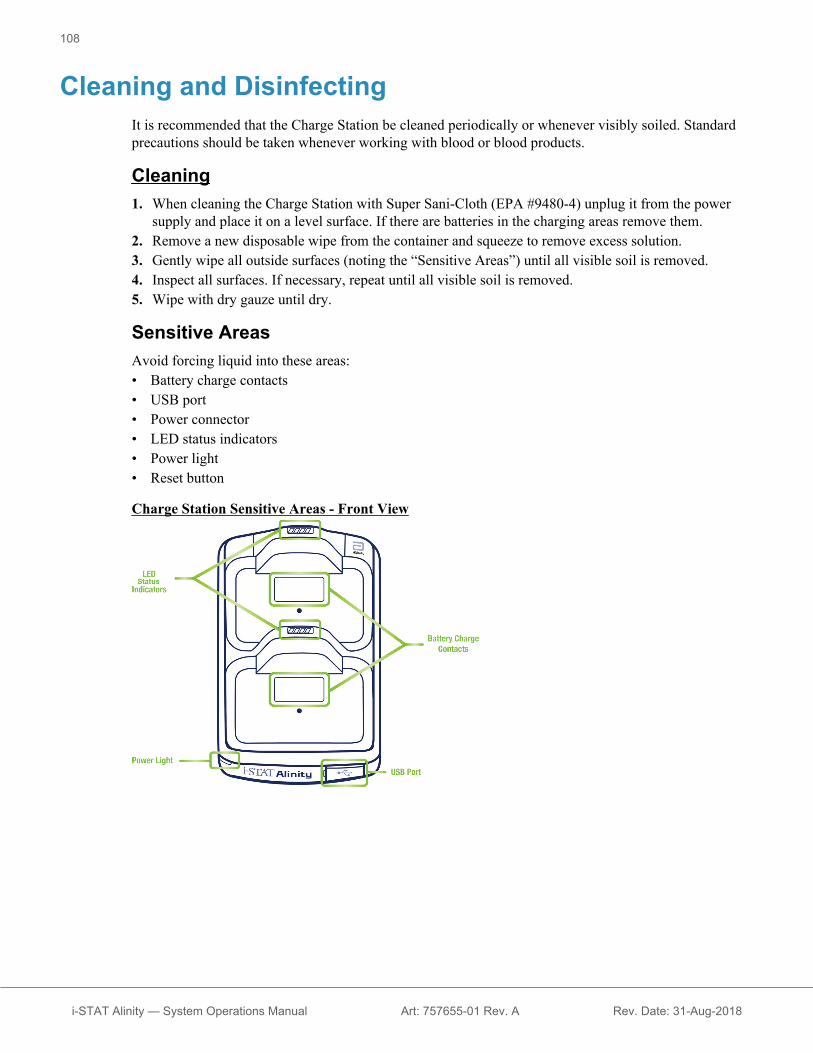
Cleaning and DisinfectingIt is recommended that the Charge Station be cleaned periodically or whenever visibly soiled. Standardprecautions should be taken whenever working with blood or blood products.
Cleaning1. When cleaning the Charge Station with Super Sani-Cloth (EPA #9480-4) unplug it from the power
supply and place it on a level surface. If there are batteries in the charging areas remove them.2. Remove a new disposable wipe from the container and squeeze to remove excess solution.3. Gently wipe all outside surfaces (noting the “Sensitive Areas”) until all visible soil is removed.4. Inspect all surfaces. If necessary, repeat until all visible soil is removed.5. Wipe with dry gauze until dry.
Sensitive AreasAvoid forcing liquid into these areas:• Battery charge contacts• USB port• Power connector• LED status indicators• Power light• Reset button
Charge Station Sensitive Areas - Front View
108
i-STAT Alinity — System Operations Manual Art: 757655-01 Rev. A Rev. Date: 31-Aug-2018
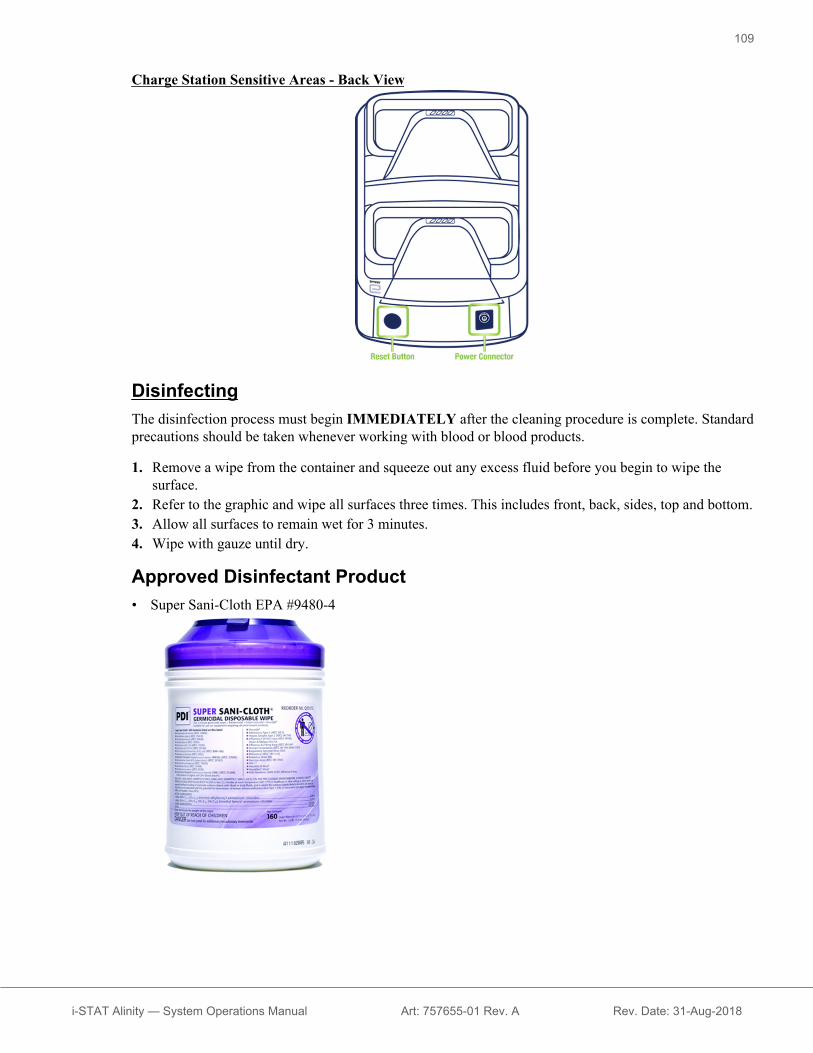
Charge Station Sensitive Areas - Back View
DisinfectingThe disinfection process must begin IMMEDIATELY after the cleaning procedure is complete. Standardprecautions should be taken whenever working with blood or blood products.
1. Remove a wipe from the container and squeeze out any excess fluid before you begin to wipe thesurface.
2. Refer to the graphic and wipe all surfaces three times. This includes front, back, sides, top and bottom.3. Allow all surfaces to remain wet for 3 minutes.4. Wipe with gauze until dry.
Approved Disinfectant Product• Super Sani-Cloth EPA #9480-4
109
i-STAT Alinity — System Operations Manual Art: 757655-01 Rev. A Rev. Date: 31-Aug-2018

110
i-STAT Alinity — System Operations Manual Art: 757655-01 Rev. A Rev. Date: 31-Aug-2018


This page intentionally left blank.
i-STAT Alinity — System Operations Manual Art: 746987-01 Rev. A Rev. Date: 02-Oct-2016
2.1 - AlinIQ NCi - Network Connectivity fori‑STAT
The Network Connectivity utility for i‑STAT (AlinIQ NCi) is used to configure the instrument to connectto wired and wireless networks. The NCi utility package must be downloaded from the Abbott Point ofCare website. It is best practice to load NCi onto a computer that is installed behind the healthcarefacility's firewall, and that has antivirus software installed on it.
The following is an overview of the steps required to perform the configuration:1. Download the NCi from Abbott Point of Care and install on a Windows PC.2. Use the NCi to create NC (ancc) file that contains the network parameters and security credentials
required by the instrument to connect to the facility network.3. Upload the ancc files to the instruments.
Before beginning:
• Read this document in its entirety.• Share this document with the IT department. Their help will be needed to:
○ define how the instrument is to connect (wired, wireless, both) to the network○ define the network to which the instruments are to connect (SSID, authentication protocol)○ supply network access credentials for the network (that is, username, password, security
certificates/keys)○ identify connection details (proxy server, IP address and DNS server address modes, etc.)○ a worksheet, found at the end of this section, is provided as an aid to gather the information needed
to create the ancc file via the NCi utility.
Have available:• i‑STAT Alinity base station• FAT32 formatted USB 2.0 memory stick
Note: Some preformatted USB flash drives may not work with the Alinity system. Toavoid issues, reformat the drive using a Windows PC before using the USB flash drivewith the Alinity system.
• computer running Microsoft Windows 7 or Windows 10 and Internet Explorer 11 or Edge browser
After securing all of the above:• Download the NCi utility package from the Abbott Point of Care website to your computer. The
package will download to your desktop, unless you specify otherwise. See the instruction below.
113
i-STAT Alinity — System Operations Manual Art: 747079-01 Rev. E Rev. Date: 27-Oct-2017

Installing NCi:• Navigate to the Abbott Point of Care website• Find the link to the NCi utility• Follow the instructions on the screen
When the installation of NCi completes, this icon will appear on the desktop:
To run NCi, double click the icon. The NCi screen displays.Note: NCi consists of one screen, though it must be scrolled to be viewed in its entirety.For this reason, the screen is shown here in sections.
114
i-STAT Alinity — System Operations Manual Art: 747079-01 Rev. E Rev. Date: 27-Oct-2017

AlinIQ NCi - General SectionOn the first section of the NCi screen, specify whether this NC file will be used for multiple i‑STATAlinity instruments or a single instrument. Unless your facility requires that each instrument have its ownunique security credentials, a single NC file may be used for all instruments connecting to the samenetwork.
Numbered labels ( ) are used in this section to highlight areas of the screen. These labels are for thepurpose of this document only. They are not part of the actual NCi screen.
The configuration will be used for:Select one of these radio buttons:
Multiple instrumentsUse this NC file for multiple instruments. This is the default.
Note: This option may not be available if your facility requires individualEnterprise Security Certificates for each instrument.
InstrumentThis NC file will apply only to one instrument. If this option is selected, the instrument's serialnumber is required:
SN-Serial number of the instrument to which this NC file applies.When a serial number is specified, the NC file name will include it, as shown here:DefaultConfig.snnnnn.ancc
Configuration Name
115
i-STAT Alinity — System Operations Manual Art: 747079-01 Rev. E Rev. Date: 27-Oct-2017

Name for the NC file. Specify up to 53 alphanumeric characters.
NC File NameThis field is automatically populated with the NC file name and cannot be changed.
Copy info from an existing fileClick this option to open an existing NC file, copy its contents, and then save it to a new name.Navigate to the folder containing the NC file you wish to copy.
Note: Attempting to rename an NC file causes unpredictable results. Instead, usethe function Copy info from an existing file and save the file to a new name.
Edit an existing fileClick this option to edit an existing NC file. Navigate to the folder containing the NC file youwish to edit.
The next section of the NCi screen is for configuring a connection to a proxy server.
116
i-STAT Alinity — System Operations Manual Art: 747079-01 Rev. E Rev. Date: 27-Oct-2017

AlinIQ NCi - Proxy Server ConnectionUse this section of the screen to supply information for connecting to the internet using a proxy server.Proxy server information is required if the instrument is to connect to the internet via a proxy server. Thismay be required to download eVAS directly from Abbott Point of Care to the instrument via the internet.
My network uses a proxy server to access the internetSelecting this check box displays the following prompts:
Proxy Server Type:Select either:• HTTP HTTP proxy intercepts web access• Socks Provides proxy service for UDP data and DNS look up operations in addition to web
access.
Proxy Server Address:Required. IP address of the proxy server• Port: Port used by the proxy server. The default is 8080.
Proxy Server User Name:Network name of the proxy server
Proxy Server Password:Network password for the proxy server. By default, bullets (••••) are displayed as you type the
password. To display the actual password after typing it, click this symbol:
117
i-STAT Alinity — System Operations Manual Art: 747079-01 Rev. E Rev. Date: 27-Oct-2017

The next section of the NCi screen is for connecting wirelessly.
118
i-STAT Alinity — System Operations Manual Art: 747079-01 Rev. E Rev. Date: 27-Oct-2017
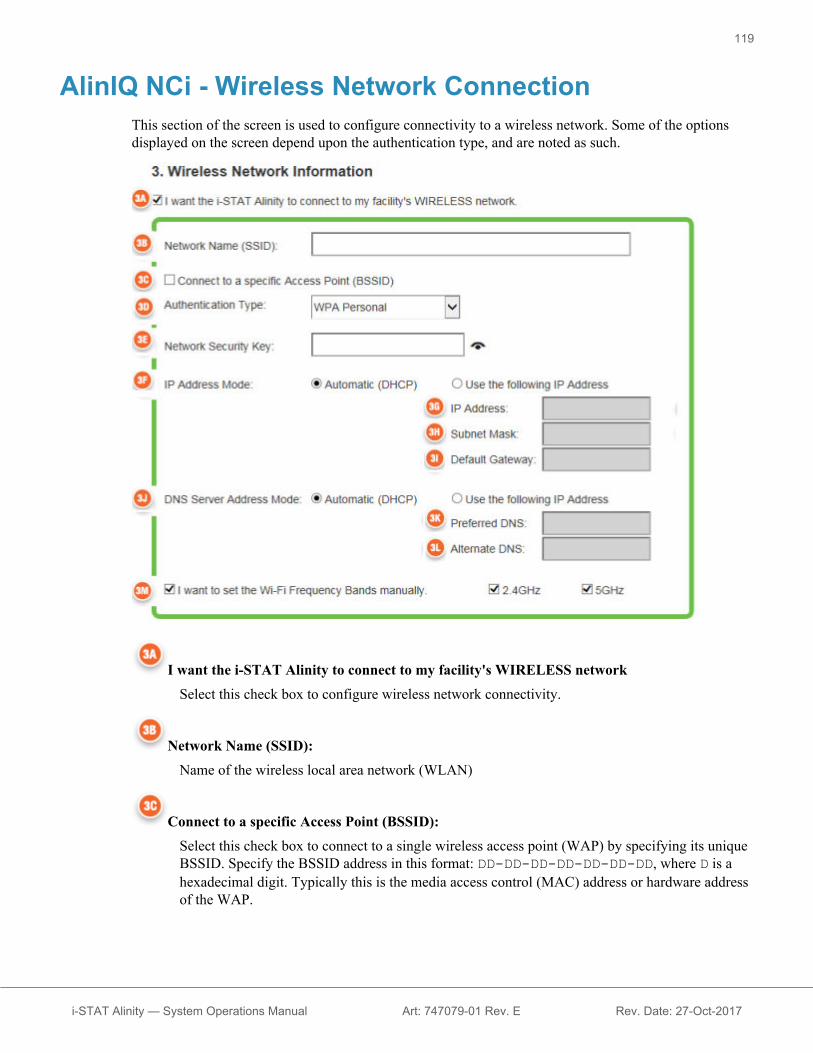
AlinIQ NCi - Wireless Network ConnectionThis section of the screen is used to configure connectivity to a wireless network. Some of the optionsdisplayed on the screen depend upon the authentication type, and are noted as such.
I want the i-STAT Alinity to connect to my facility's WIRELESS networkSelect this check box to configure wireless network connectivity.
Network Name (SSID):Name of the wireless local area network (WLAN)
Connect to a specific Access Point (BSSID):Select this check box to connect to a single wireless access point (WAP) by specifying its uniqueBSSID. Specify the BSSID address in this format: DD-DD-DD-DD-DD-DD-DD, where D is ahexadecimal digit. Typically this is the media access control (MAC) address or hardware addressof the WAP.
119
i-STAT Alinity — System Operations Manual Art: 747079-01 Rev. E Rev. Date: 27-Oct-2017
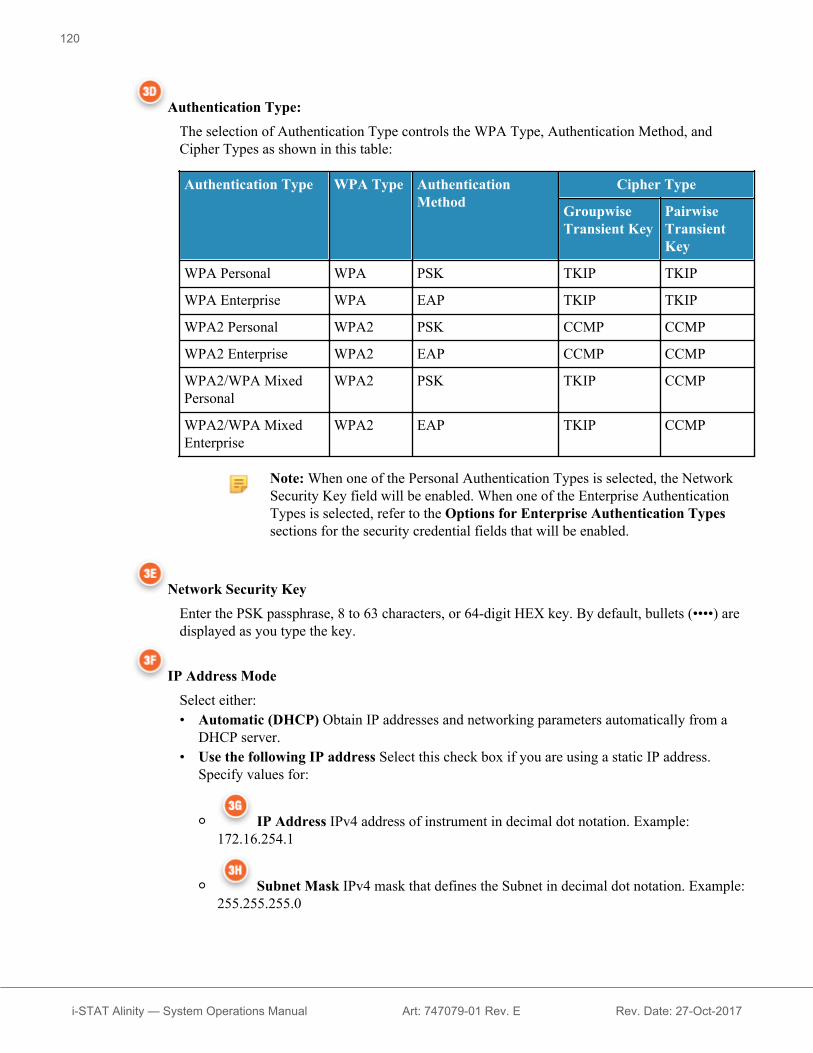
Authentication Type:The selection of Authentication Type controls the WPA Type, Authentication Method, andCipher Types as shown in this table:
Authentication Type WPA Type AuthenticationMethod
Cipher Type
GroupwiseTransient Key
PairwiseTransientKey
WPA Personal WPA PSK TKIP TKIP
WPA Enterprise WPA EAP TKIP TKIP
WPA2 Personal WPA2 PSK CCMP CCMP
WPA2 Enterprise WPA2 EAP CCMP CCMP
WPA2/WPA MixedPersonal
WPA2 PSK TKIP CCMP
WPA2/WPA MixedEnterprise
WPA2 EAP TKIP CCMP
Note: When one of the Personal Authentication Types is selected, the NetworkSecurity Key field will be enabled. When one of the Enterprise AuthenticationTypes is selected, refer to the Options for Enterprise Authentication Typessections for the security credential fields that will be enabled.
Network Security KeyEnter the PSK passphrase, 8 to 63 characters, or 64-digit HEX key. By default, bullets (••••) aredisplayed as you type the key.
IP Address ModeSelect either:• Automatic (DHCP) Obtain IP addresses and networking parameters automatically from a
DHCP server.• Use the following IP address Select this check box if you are using a static IP address.
Specify values for:
○ IP Address IPv4 address of instrument in decimal dot notation. Example:172.16.254.1
○ Subnet Mask IPv4 mask that defines the Subnet in decimal dot notation. Example:255.255.255.0
120
i-STAT Alinity — System Operations Manual Art: 747079-01 Rev. E Rev. Date: 27-Oct-2017

○ Default Gateway IP address for routing device that passes traffic between differentsubnets and networks in decimal dot notation. Example: 172.16.254.1
○ DNS Server Address Mode Select either:‒ Automatic (DHCP) Obtain IP addresses and networking parameters automatically
from a DHCP server.‒ Use the following IP address Select this check box if you need to specify the DNS
server address manually. Specify values for:
• Preferred DNS IPv4 address of the server in decimal dot notation.
• Alternate DNS IPv4 address of the server in decimal dot notation.
I want to set the Wi-Fi Frequency Bands manually.Select this check box to configure the instrument to use either the 2.4 or 5 GHz frequency bandexclusively. When both values are selected, the instrument will automatically select which bandto use. Select one of the check boxes to limit the instrument to that band only:
2.4G5G
Options for Enterprise Authentication TypesWhen Authentication Type selected is WPA Enterprise, WPA2 Enterprise, or WPA2/WPA Enterprise,the options shown here are enabled:
EAP MethodSelect one of the following:
TLSTTLS/MSCHAPv2PEAPv0/EAP-MSCHAPv2
Validate the Server CertificateSelect this check box to configure the instrument to validate the server certificate. Unselect thecheck box if this is not required.
Server NameNetwork name of the authentication server.
CA Certificate FileName of the file that contains the Certificate Authority certificate.
Client Certificate FileName of the file that contains the client certificate.
Client Key FileName of the file that contains the client key.
121
i-STAT Alinity — System Operations Manual Art: 747079-01 Rev. E Rev. Date: 27-Oct-2017

Client Key PasswordPassword for the client key.
Username/IdentityUsername required by the authentication server.
122
i-STAT Alinity — System Operations Manual Art: 747079-01 Rev. E Rev. Date: 27-Oct-2017

AlinIQ NCi - Wired Network ConnectionSpecify the following information for connectivity to a wired network:
I want the i‑STAT Alinity to connect to my facility's WIRED networkTo configure connectivity for a wired network, select this check box and specify values for:
Authentication TypeOPEN (this value is not modifiable)
IP Address ModeSelect one of these values:• Automatic (DHCP) - Obtain IP addresses and networking parameters automatically from a
DHCP server.• Use the following IP Address - Select this button to use a static IP address.
Note: If you specify a static IP address you must also specify DNS addresses.
IP AddressIPv4 address of instrument in decimal dot notation.
123
i-STAT Alinity — System Operations Manual Art: 747079-01 Rev. E Rev. Date: 27-Oct-2017
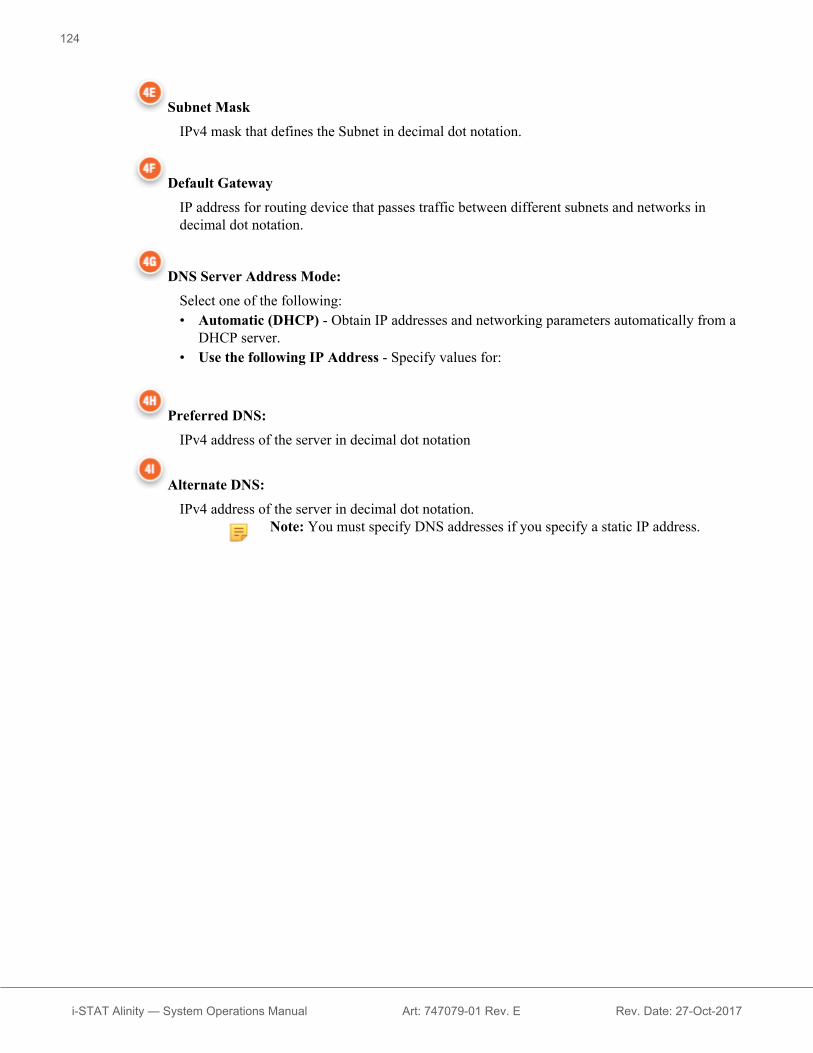
Subnet MaskIPv4 mask that defines the Subnet in decimal dot notation.
Default GatewayIP address for routing device that passes traffic between different subnets and networks indecimal dot notation.
DNS Server Address Mode:Select one of the following:• Automatic (DHCP) - Obtain IP addresses and networking parameters automatically from a
DHCP server.• Use the following IP Address - Specify values for:
Preferred DNS:IPv4 address of the server in decimal dot notation
Alternate DNS:IPv4 address of the server in decimal dot notation.
Note: You must specify DNS addresses if you specify a static IP address.
124
i-STAT Alinity — System Operations Manual Art: 747079-01 Rev. E Rev. Date: 27-Oct-2017

AlinIQ NCi - Save the Network Connectivity (ancc) fileAfter supplying the information for connectivity, you are prompted to save the ancc file. The saved filecan then be loaded onto a USB memory stick, and then uploaded to an i‑STAT Alinity instrument.
At the bottom of the NCi screen, choose Save Network Connectivity (ancc) File, then click Continue.
Depending upon the browser in use the ancc file will be saved to the Downloads directory, or, at thebottom of the screen a banner may display with the prompts shown below.
Note: Best practice is to select Save which will save the file to the Downloads directory.Opening NC (ancc) files in a text editor is not recommended.
Do you want to open or save filename.ancc?Open
Open the ancc file in a text editor.Save
Save the file to the Downloads directory.Save as
Save the file to a specified destination.Note: If you use this option make note of the destination where the file is saved.This information will be needed to load the ancc file onto the USB memory stick.
Save and openNot recommended.
CancelDo not save the file.
125
i-STAT Alinity — System Operations Manual Art: 747079-01 Rev. E Rev. Date: 27-Oct-2017

AlinIQ NCi - Copy NC (ancc) file onto a USB memorystick
NC files are uploaded to instruments via USB memory stick as described in the next section.
The following rules apply to the number and type of NC (ancc) files that may reside on the USB memorystick:• Any ancc file to be uploaded to an instrument must reside at the top level of the directory structure of
the USB memory stick. The ancc file should not be in a folder.• The USB memory stick may contain multiple ancc files created with serial numbers, but the serial
numbers must be unique (there cannot be more than one ancc file with the same serial number at toplevel).
• The USB memory stick may contain one and only one ancc file created without a serial number. Ifboth serialized and non-serialized ancc files are placed on the USB memory stick at the top level, thenupon upload to the instrument, the instrument will attempt to upload a serialized ancc file if it finds aserial that matches that of the instrument itself, otherwise it will attempt to upload the non-serializedancc file.
Use the following steps to copy the ancc file onto the USB memory stick:1. Plug the USB memory stick into the USB slot of the computer. A message displays indicating that the
operating system recognizes the drive and it is ready to use.2. From the Start menu, click Computer > Downloads.3. In the displayed list, find the filename.ancc file and right-click on it.4. Click Send to: drive name and press Enter. This loads the file onto the memory stick.5. Repeat steps 3 and 4 for each ancc file to be copied.
AlinIQ NCi - Upload an NC (ancc) file to an instrumentTo upload an NC (ancc) file, an i‑STAT Alinity base station and a USB memory stick that the NC (ancc)file resides on are needed.
Note: Some preformatted USB flash drives may not work with the Alinity system. Toavoid issues, reformat the drive using a Windows PC before using the USB flash drivewith the Alinity system.
Follow these steps:1. Plug the USB memory stick into the USB slot of the base station.2. Place the i‑STAT Alinity instrument in the base station.3. Touch More Options4. Touch Instrument Options5. Touch Network Settings6. Install Network Settings7. Enter Operator ID, touch Next8. Follow instructions on the i‑STAT Alinity screen.
126
i-STAT Alinity — System Operations Manual Art: 747079-01 Rev. E Rev. Date: 27-Oct-2017

AlinIQ NCi - Customization and ConnectivityAfter creating the NC (ancc) file, refer to the section in this document for AlinIQ CustomizationWorkspace for i‑STAT (AlinIQ CWi). Connectivity features in the CWi enable the instrument to transmitto and receive information from remote systems.
AlinIQ NCi - Determining Success or FailureAfter you have used NCi to configure connectivity, you can test the connection. Follow the steps shownhere:
• To check a wired network connection, place the i‑STAT Alinity instrument in the base station that isconnected to the facility's network and power on the instrument. On the instrument screen, in the upper
right corner, the ethernet symbol displays indicating an active connection.• To check a wireless network connection, remove the i‑STAT Alinity instrument from the base station.
On the instrument screen, in the upper right corner, the wireless internet symbol displays. This symbol
represents a strong signal. Some or all of the bars in the signal should be filled in, dependingupon the signal strength in the location. A location that displays the symbol with all bars emptyrepresents no signal. If the symbol displays with all bars empty, move the instrument to a locationcloser to the wireless access point.
127
i-STAT Alinity — System Operations Manual Art: 747079-01 Rev. E Rev. Date: 27-Oct-2017

128
i-STAT Alinity — System Operations Manual Art: 747079-01 Rev. E Rev. Date: 27-Oct-2017

NetworkConnectivityWorksheet Art:747180-01Rev.B Rev.Date:25-Sep-2017
NetworkConnectivityfori-STATAlinityWorksheet1A-Theconfigurationwillbeusedfor:Multipleinstruments
Enteranameforconfiguration(maximum53characters)1DConfigurationName:
2A-UsingaProxyServertoAccessInternet2BSelecteitherHTTPorSocks
HTTP Yes/NoSocks Yes/No
EnterIPaddressandportoftheproxyserver2CProxyServerAddress: Port:2DProxyServerUserName:2EProxyServerPassword:IfconnectiontoaWirelessNetworkisrequired,completeinformationbelow
3A-ConnecttoWirelessEnterNameofthewirelesslocalareanetwork(WLAN)3BNetworkName(SSID):Ifconnectiontoasingleaccesspointisrequired,EnterBSSID3CConnecttoaspecificAccessPoint(BSSID):3DAuthenticationType:ForPersonalAuthentication,selectoneofthefollowingoptions
PERSONALWPAPersonal Yes/No
WPA2Personal Yes/NoWPA2/WPAPersonal Yes/No
EnterPSKPassphrase(8to63characters),or64-digitHEXkey3ENetworkSecurityKey:SelecteitherAutomatic(DHCP)orStaticIPAddressOption3FIPAddressMode:
Automatic(DHCP) Yes/NoStaticIPAddress Yes/No
IfStaticIPAddressOptionisselected,enterIPAddress,SubnetMaskandOptionalDefaultGateway3GIPAddress:3HSubnetMask:3IDefaultGateway:SelecteitherAutomatic(DHCP)orStaticIPAddressOption3JDNSServerAddressMode:
Automatic(DHCP) Yes/NoStaticIPAddress Yes/No
IfStaticIPAddressOptionisselected,enterPreferredandAlternateDNS3KPreferredDNS:3LAlternateDNS:IfoperationinasingleWi-FiFrequencybandisrequired,selectoneofthefrequencybands3MWi-FiFrequencyBands:
2.4GHz Yes/No5GHz Yes/No
1of2
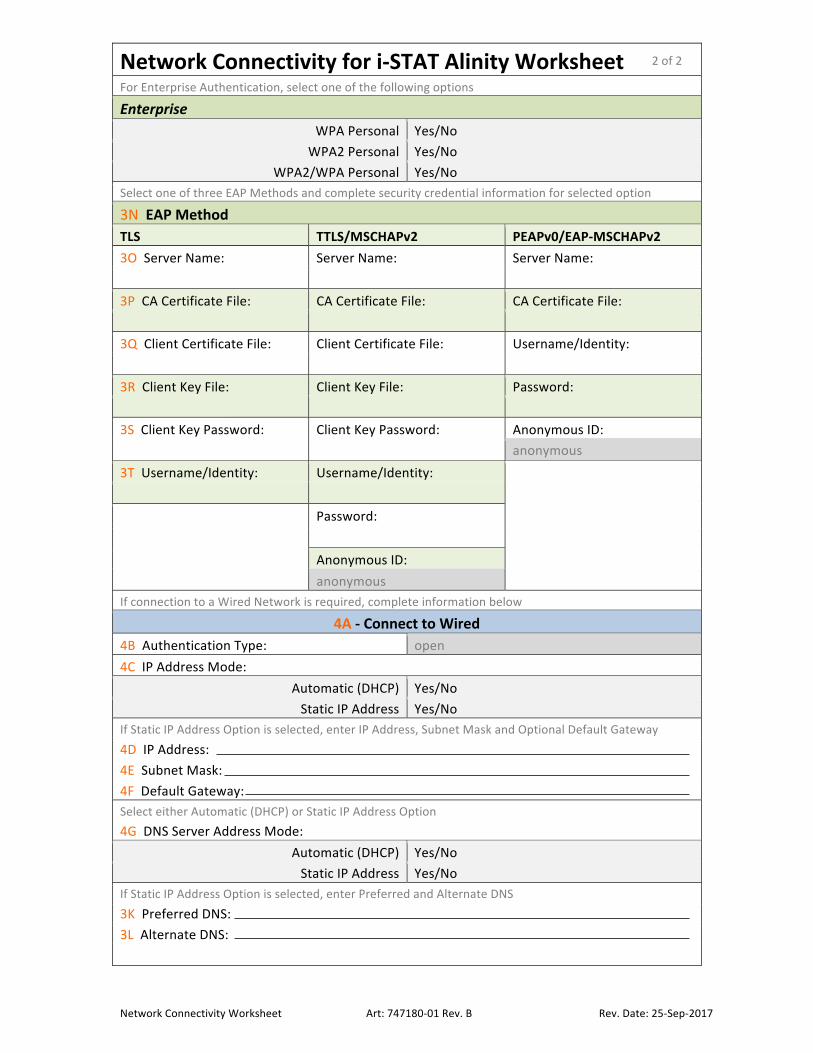
NetworkConnectivityWorksheet Art:747180-01Rev.B Rev.Date:25-Sep-2017
NetworkConnectivityfori-STATAlinityWorksheetForEnterpriseAuthentication,selectoneofthefollowingoptions
Enterprise WPAPersonal Yes/No
WPA2Personal Yes/NoWPA2/WPAPersonal Yes/No
SelectoneofthreeEAPMethodsandcompletesecuritycredentialinformationforselectedoption
3NEAPMethodTLS TTLS/MSCHAPv2 PEAPv0/EAP-MSCHAPv23OServerName: ServerName: ServerName: 3PCACertificateFile: CACertificateFile: CACertificateFile: 3QClientCertificateFile: ClientCertificateFile: Username/Identity: 3RClientKeyFile: ClientKeyFile: Password: 3SClientKeyPassword: ClientKeyPassword: AnonymousID: anonymous3TUsername/Identity: Username/Identity: Password:
AnonymousID:anonymous
IfconnectiontoaWiredNetworkisrequired,completeinformationbelow
4A-ConnecttoWired4BAuthenticationType: open4CIPAddressMode:
Automatic(DHCP) Yes/NoStaticIPAddress Yes/No
IfStaticIPAddressOptionisselected,enterIPAddress,SubnetMaskandOptionalDefaultGateway4DIPAddress:4ESubnetMask:4FDefaultGateway:SelecteitherAutomatic(DHCP)orStaticIPAddressOption4GDNSServerAddressMode:
Automatic(DHCP) Yes/NoStaticIPAddress Yes/No
IfStaticIPAddressOptionisselected,enterPreferredandAlternateDNS3KPreferredDNS:3LAlternateDNS:
2of2


This page intentionally left blank.
i-STAT Alinity — System Operations Manual Art: 746988-01 Rev. A Rev. Date: 02-Oct-2016

3.1 - AlinIQ CWi - Customization Workspacefor i-STAT
This section contains a general description of the CWi (Customization Workspace for i‑STAT). i‑STATAlinity instruments can be customized for use in a variety of healthcare settings. Customization iscontrolled by the assignment of a profile to an instrument. Abbott Point of Care recommends that youread this document in its entirety before logging in to CWi. Specifics on the functions and features areoutlined in the following sections.
CWi is a web-based software application that enables healthcare professionals to manage customizationsettings for the i‑STAT Alinity instrument. Customization settings allow the HCO to change the userexperience at the individual instrument level. CWi also manages users that maintain the customization ofthe i‑STAT Alinity.
Out-of-the-box, the i‑STAT Alinity is a fully-functioning instrument whose workflow contains nocustomization. Customization allows the healthcare organization to change the operating characteristics ofeach instrument. For example, the instrument, out-of-the-box, has no reference ranges defined. To definethese ranges and upload them to the instrument(s), a profile must be created.
A profile is a collection of customization options found in categories. Each instrument within a healthcareorganization (HCO) can have a different profile. The specifics of the profile are determined by the needsof the operating location. As an example, for an instrument used in the NICU it may be necessary to turnoff the instrument's sound to avoid disturbing the infants or to prompt operators to perform requiredquality control testing.
Customization also enables the administrator or POCC to establish action ranges based on a variety of ageranges. In addition, an administrator or POCC may establish actions to be taken when results fall outsideof the reference range. Customization may be used to require operators to record critical callbackdocumentation on the instrument.
WorkspacesCWi is a collection of four workspaces. The workspaces are:Manage and Assemble Profiles
Use this workspace to define the instrument's settings for options such as data entry format,inactivity time interval allowed before powering off, and action to take when the memory is full.Most of the customization of the i‑STAT Alinity is accomplished using the options in the Profileworkspace.
Manage UsersIn this workspace create a list of CWi users, their contact information, and their CWi role (POCC,POC Super User, HCO Manager).
Manage Healthcare OrganizationThis workspace displays the name of the customer's healthcare organization.
Manage Instruments
131
i-STAT Alinity — System Operations Manual Art: 746298-01 Rev. J Rev. Date: 04-Nov-2019

This workspace is used for registering instruments and assigning profiles. (This feature isunavailable at this time.)
Details and information for all options are included in the section for each workspace. The workspacesare shown on the Home page:
Best PracticesThere are references to best practices throughout this guide. These represent the options used by themajority of Abbott Point of Care established customers in creating their current i‑STAT customizationprofiles. Those options, along with features available only on the i‑STAT Alinity system were assembledand titled "best practices". They are intended only as examples. Each HCO should establish its own bestpractices.
How to ProceedBegin by contacting Abbott Point of Care and establishing your Healthcare Organization (HCO) (refer tothe next section, Getting Started). Next, define the primary CWi user (refer to the section Manage Users).
Note:• Abbott Point of Care strongly encourages a healthcare organization (HCO) to establish
more than one HCO manager. Then, in the event that one HCO manager is unavailable,other HCO managers can use the system.
• One HCO manager only is specified as the "primary". To change the primary HCOmanager, contact Abbott Point of Care technical support by email:[email protected].
• Only a primary HCO manager can assign the role of healthcare organization managerto another CWi user.
132
i-STAT Alinity — System Operations Manual Art: 746298-01 Rev. J Rev. Date: 04-Nov-2019

Getting StartedThe function of CWi is to customize the i‑STAT Alinity instrument. Users of CWi may wish to verifyinformation for their site, edit user information, or add instruments. Abbott Point of Care stronglyrecommends that you read this section in its entirety before logging in to CWi.
Note: The computer used to access CWi should reside behind the healthcare facility's ITfirewall and have antivirus software installed.
If you have an established HCO and you are logging in to CWi, you can skip the information below andlog in as usual. The following information is provided for users who will be logging in to CWi for thefirst time.
In order to ensure the security of users' customizations, profiles and other data, Abbott Point of Careestablishes the healthcare organization (HCO). This is done once. At the time the HCO is created, anHCO primary manager must be identified. The HCO primary manager is the person responsible for theCWi. An HCO must always have an HCO primary manager. If the HCO primary manager needs to bereplaced, contact Abbott Point of Care.
Abbott Point of Care is responsible for establishing:• the healthcare organization within the CWi• the primary Health Care Organization manager. One HCO manager only is specified as the "primary".
The primary HCO manager has permission to access all functions of the CWi including creating theHCO facilities during the initial setup and creating other CWi users.
• the user name and temporary password for the primary HCO manager
Prerequisites
The healthcare organization information required by Abbott Point of Care includes:• name of the healthcare organization• facilities• city• postal code• country• language
For the primary HCO manager, specify:• email address• first and last name• contact information
Note: For all features of the software to work properly, use CWi with the InternetExplorer® web browser.
133
i-STAT Alinity — System Operations Manual Art: 746298-01 Rev. J Rev. Date: 04-Nov-2019

To begin using CWi:1. Using Internet Explorer, navigate to https://www.pointofcare.abbott/int/en/
offerings/support/i-stat-alinity2. Click on the link for AlinIQ CWi3. Log in with the email address supplied by Abbott Point of Care and click the "Next" button.
4. Enter the password provided by Abbott Point of Care and click the "Log in" button. If 5 failedattempts are made, the system will lock out the user for 1 hour. After 1 hour, the user can make up to 5more attempts.
Note:• If the link to AlinIQ CWi found on https://
www.pointofcare.abbott/int/en/offerings/support/i-stat-alinity does not open the application, contact Technical Support for furtherassistance.
• Abbott Point of Care strongly recommends that you change the password after loggingin to CWi for the first time.
134
i-STAT Alinity — System Operations Manual Art: 746298-01 Rev. J Rev. Date: 04-Nov-2019

AlinIQ CWi imposes password requirements. They are as follows:
Must be 8 to 20 characters long and contain 3 of the 4 (example: Pr86h22h):
uppercase character
lowercase character
number
special character
Cannot contain:
ampersand (&)
blank space
less than symbol (<)
control character
On the Home page, next to the 'Welcome' is the email address of the user who is logged on. Next to the
email address is a " " gear icon. Click on the icon to open the User Settings screen. The password andlanguage settings can be adjusted from this page.
To change the user password or language settings, enter the new password or select a language from thedrop down menu and click the "Save" button.
135
i-STAT Alinity — System Operations Manual Art: 746298-01 Rev. J Rev. Date: 04-Nov-2019
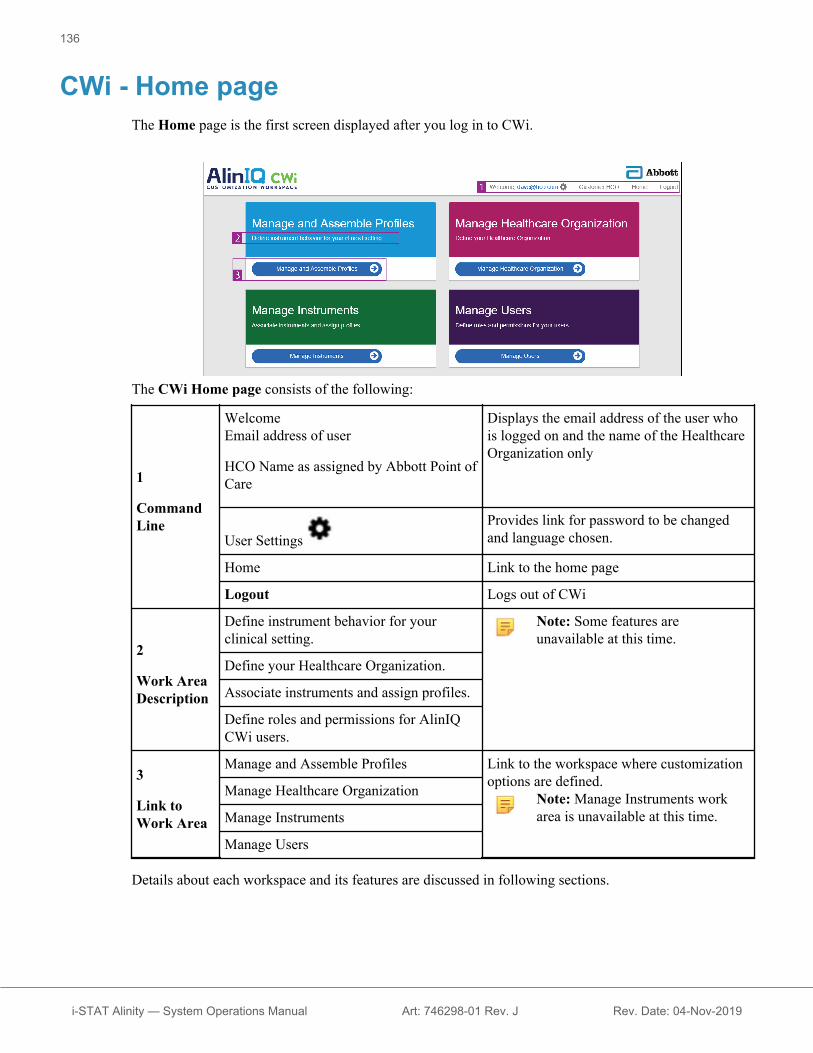
CWi - Home pageThe Home page is the first screen displayed after you log in to CWi.
The CWi Home page consists of the following:
1
CommandLine
WelcomeEmail address of user
HCO Name as assigned by Abbott Point ofCare
Displays the email address of the user whois logged on and the name of the HealthcareOrganization only
User Settings Provides link for password to be changedand language chosen.
Home Link to the home page
Logout Logs out of CWi
2
Work AreaDescription
Define instrument behavior for yourclinical setting.
Note: Some features areunavailable at this time.
Define your Healthcare Organization.
Associate instruments and assign profiles.
Define roles and permissions for AlinIQCWi users.
3
Link toWork Area
Manage and Assemble Profiles Link to the workspace where customizationoptions are defined.
Note: Manage Instruments workarea is unavailable at this time.
Manage Healthcare Organization
Manage Instruments
Manage Users
Details about each workspace and its features are discussed in following sections.
136
i-STAT Alinity — System Operations Manual Art: 746298-01 Rev. J Rev. Date: 04-Nov-2019

3.2 - Manage Healthcare Organization
Overview - Healthcare OrganizationThe Healthcare Organization is the unique identifier assigned to an organization by Abbott Point of Care.Information that you supply to Abbott Point of Care for your healthcare organization on the CWi formwill be used during the initial setup of the CWi program. You can view the Manage HealthcareOrganization workspace to ensure that the information for your healthcare organization is correct.
In order to ensure the security of profiles and other data, Abbott Point of Care establishes a uniqueidentifier for each healthcare organization. This is done once. At the time the healthcare organization iscreated, the Primary Healthcare Organization manager must be identified. The Primary HealthcareOrganization manager is the person responsible for the CWi. A healthcare organization must always haveone Primary Healthcare Organization manager. If the Primary Healthcare Organization manager needs tobe replaced, contact Technical Support.
Abbott Point of Care is responsible for establishing:• the healthcare organization within the CWi• the primary healthcare organization manager. One healthcare organization manager only is specified
as the "primary" and indicated in the Manage User list with a check mark (✓). The primary healthcareorganization manager has permission to access all functions of the CWi during the initial setup andcreation of other CWi users.
• the initial user name and password for the primary healthcare organization manager
The Manage Healthcare Organization workspace displays this information:• name• city• postal code• country• language• date format*• decimal character*
*Click "Change" in the Manage Healthcare Organization workspace to change Date Format andDecimal Character settings.
137
i-STAT Alinity — System Operations Manual Art: 746301-01 Rev. G Rev. Date: 16-Apr-2018

Best PracticesThere are references to best practices throughout this guide. Manage healthcare organization informationneeded for the initial setup includes: name of healthcare organization, city, postal code, country, andlanguage. Each healthcare organization should establish its own best practices.
Getting StartedThe healthcare organization information required by Abbott Point of Care includes:• name of the healthcare organization• city• postal code• country• language
For the primary healthcare organization manager, specify:• email address• first and last names• contact information
138
i-STAT Alinity — System Operations Manual Art: 746301-01 Rev. G Rev. Date: 16-Apr-2018

3.3 - Manage UsersThis workspace is used to identify all users of the CWi, and specify the level of access for each. Operatorsof the i‑STAT Alinity instrument may be identified in the data management system.
OverviewWithin the healthcare organization, all users who are authorized to access CWi must be defined. The typeof role assigned to a user determines which actions can be performed.
• Primary Healthcare Organization Manager One healthcare organization manager only is specifiedas the "primary" and is indicated in the Manage Users list with a check mark (✓). The primaryhealthcare organization manager has permission to access all functions of the CWi including creatingthe healthcare organization and creating other CWi users. ○ Only the primary healthcare organization manager can assign the role of healthcare organization
manager to another user.○ It is important to keep the primary healthcare organization manager current. Should the assigned
primary healthcare organization manager need to be changed or password need to be reset, contacttechnical support by email: [email protected].
• Healthcare Organization Manager has permission to access all functions of the CWi includingcreating other CWi users, except for the primary healthcare organization manager.○ Other healthcare organization managers can only assign the roles of Point of Care Super User and
Point of Care Coordinator.• Point of Care Coordinator (POCC) has permission to access all functions of the CWi program, but is
limited to assigning the role of Point of Care Super User when creating other users.• Point of Care Super User has limited permission to CWi program, including ability to view profiles
and categories, view instruments with profiles, and view healthcare organization information.
Best PracticesWhen defining users:• Abbott Point of Care strongly encourages healthcare organizations to establish more than one
healthcare organization manager for the CWi. Then, in the event that one of the healthcareorganization managers is unavailable, any other healthcare organization manager can use the system.
• One healthcare organization manager is specified as the "primary" and indicated in the Manage Userlist with a check mark (✓). To change the primary healthcare organization manager, contact AbbottPoint of Care technical support by email: [email protected].
139
i-STAT Alinity — System Operations Manual Art: 746303-01 Rev. I Rev. Date: 17-Apr-2019

Getting StartedTo access this workspace, from the Home page, in the lower right corner, click Manage Users.
This screen displays:
The name of the Healthcare Organization is at the top of the screen. Note that this name is assigned byAbbott Point of Care.
Command Line Actions
On the upper right corner of the screen, in addition to Create, the command line includes these actions:• View - CWi user can be viewed• Change - Change information for a CWi user• Delete - Delete a CWi user• Back - Go back to previous page
To create a user, in the upper right corner of the screen, click Create.
This screen displays:
140
i-STAT Alinity — System Operations Manual Art: 746303-01 Rev. I Rev. Date: 17-Apr-2019

On this screen any field marked with an asterisk (*) requires a value to be provided. To create a user, therequired fields are:• Email address - User's email address. Enter up to 40 characters.• First name• Last name• Password - AlinIQ CWi imposes password requirements. They are as follows:
○ Must be 8 to 20 characters long and contain 3 out of 4 (example: Pr86h22h)‒ uppercase character‒ lowercase character‒ number‒ special character
○ Cannot contain:‒ ampersand (&)‒ blank space‒ less than symbol (<)‒ control characters
• Confirm password - Retype password.• Language - Select a language from the drop down list.• Role - Select one of the following from the drop down list:
Healthcare Organization ManagerPoint of Care Super UserPoint of Care Coordinator
141
i-STAT Alinity — System Operations Manual Art: 746303-01 Rev. I Rev. Date: 17-Apr-2019

To delete these specifications, click Discard.
To save them, Click Next and the Summary tab displays.
At the bottom of the screen these options display:• Previous - displays the Create User screen allowing you to edit any specifications• Discard - deletes these specifications• Save - saves the user as defined
The Search field is used to find free-field text (i.e. email addresses or user names) in the User Workspacetable.
The Filter option is used to limit what is displayed in the User Workspace table.
142
i-STAT Alinity — System Operations Manual Art: 746303-01 Rev. I Rev. Date: 17-Apr-2019
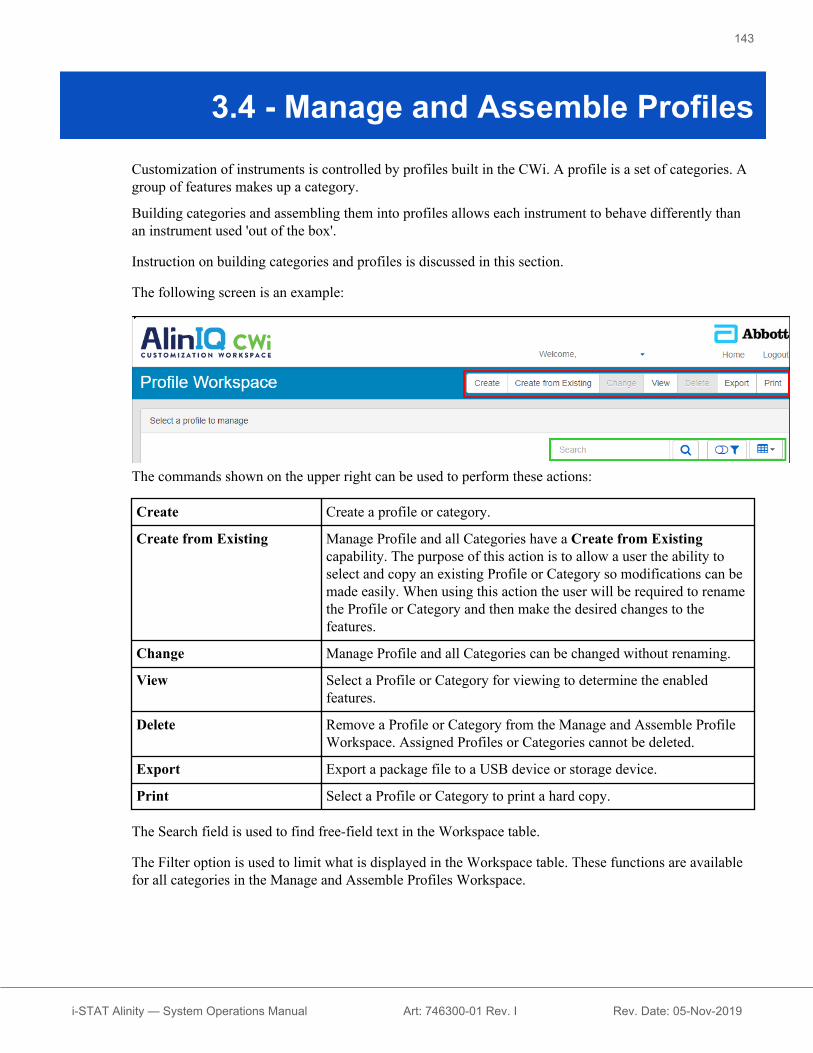
3.4 - Manage and Assemble ProfilesCustomization of instruments is controlled by profiles built in the CWi. A profile is a set of categories. Agroup of features makes up a category.
Building categories and assembling them into profiles allows each instrument to behave differently thanan instrument used 'out of the box'.
Instruction on building categories and profiles is discussed in this section.
The following screen is an example:
The commands shown on the upper right can be used to perform these actions:
Create Create a profile or category.
Create from Existing Manage Profile and all Categories have a Create from Existingcapability. The purpose of this action is to allow a user the ability toselect and copy an existing Profile or Category so modifications can bemade easily. When using this action the user will be required to renamethe Profile or Category and then make the desired changes to thefeatures.
Change Manage Profile and all Categories can be changed without renaming.
View Select a Profile or Category for viewing to determine the enabledfeatures.
Delete Remove a Profile or Category from the Manage and Assemble ProfileWorkspace. Assigned Profiles or Categories cannot be deleted.
Export Export a package file to a USB device or storage device.
Print Select a Profile or Category to print a hard copy.
The Search field is used to find free-field text in the Workspace table.
The Filter option is used to limit what is displayed in the Workspace table. These functions are availablefor all categories in the Manage and Assemble Profiles Workspace.
143
i-STAT Alinity — System Operations Manual Art: 746300-01 Rev. I Rev. Date: 05-Nov-2019

Best PracticesFor ease of use, Abbott Point of Care recommends these guidelines when using the Manage andAssemble Profiles Workspace.
• Profile and Category Naming - Name the Profile with the area where the i‑STAT Alinity instrumentwill be used, for example: NICU, Emergency Department, Respiratory Care.Name Categories by specifying their use for all areas or for specific areas, such as: Hospital-wideGeneral Settings, ICU Operator Settings, NICU Analyte Settings, Emergency Department QualitySettings.
• Print the APOC Profile or all APOC Categories individually - prior to creating categories andprofiles. After printing, review and identify the desired changes to each Category by marking thechanges on the printout. Use the printout when creating the categories and assembling the profile.
• Print the Laboratory Reference and Action (Critical) ranges - including units of measure for eachanalyte that will be used on the i-STAT Alinity. This can minimize the time needed to build theAnalyte Settings Unit and Range feature.
• Enable Age and Gender in Patient Settings - if the Analyte Settings Ranges are created with Ageand Gender applied. If eGFR is being used, this feature is required.
• If Liquid QC and/or Cal Ver Schedules are used - A list of the site's areas and the cartridges used ineach area can be helpful when creating the Quality Settings Category.
• Contact the IT department or patient registration - If using barcoded patient armbands or labels.Ensure that the type of barcode on the armband or label is enabled in the Patient Settings Category.
• Contact Human Resources or Employee Services - If using barcoded employee badges. Ensure thatthe type of barcode on the badge is enabled in the Operator Settings Category.
• Contact Laboratory Information System administrator - If using an accession/specimen ID entry.It will be necessary to find out which barcode type will be scanned and to determine where thebarcoded labels will be printed. Printing functions in the LIS may need to be changed in order foraccession number labels to be printed on the testing floor.
Note: Selections made in categories and profiles change screen content andsequencing. Best practice would be to evaluate all selections made when building theprofile by:○ uploading the profile○ performing testing in the patient and control pathways○ evaluating the outcome to ensure that results and behavior are as expected.
144
i-STAT Alinity — System Operations Manual Art: 746300-01 Rev. I Rev. Date: 05-Nov-2019
Creating a CategoryTo create a category, navigate to the Home page and click Manage and Assemble Profiles. The tencategories are shown on the right side of the screen.
The categories used to build a profile are shown below. You can choose the categories in any order. Theasterisk (*) indicates that these are required categories:• *General Settings• *Operator Settings• *Quality Settings• *Patient Settings• *Analyte Settings
In addition to the required categories, there are optional categories that can be included in a profile:• User Defined Message• Training Settings• STATNotes• Result Notes• Connectivity Settings
Note: Profiles are created by assembling categories. When creating profiles for the firsttime, it is necessary to create categories first.
Details on each category are in the following sections.
145
i-STAT Alinity — System Operations Manual Art: 746300-01 Rev. I Rev. Date: 05-Nov-2019

Category Index*General Settings
• Basic Functions○ Sound○ Volume Levels○ Inactivity○ Software Updates○ Decimal Character○ Memory Full Action
• Date○ Date Entry○ Date Display
• Communications○ Result Auto Transmit○ Power Down Communications○ Wireless Communications
• Operator Actions○ Accept or Reject Results○ Test Cancellation○ Test Selection○ Accession/Specimen ID Entry
• Critical Callback○ Critical Callback Documentation
• Print○ Test Result Printout○ i-STAT printing
*Operator Settings
• ID Entry• List Actions
○ Search for Operator ID on Operator List○ Operator ID on Operator List-Certification Expired Action○ Operator ID not on Operator List Action
• Operator Expiration○ Operator Certification Expiration Notification
146
i-STAT Alinity — System Operations Manual Art: 746300-01 Rev. I Rev. Date: 05-Nov-2019

*Patient Settings• ID Entry• Patient Information and Positive Patient Identification (PPID)
○ Age and Sex○ Patient List
• Basic Functions○ Patient Age/Gender Entry
*Analyte Settings• Units• Sample Types
○ Default Sample Types○ Custom Sample Types○ Sample Type Entry Options
• Ranges• Enable/Disable Analyte
○ Apply Globally○ Apply by Panel
• Hematocrit○ Hematocrit Setting (Calibration by Laboratory Hematology Analyzer)○ Apply CPB Protein Algorithm to Hematocrit Setting
• Adjustments○ BE Equation○ eGFR Equation○ eGFR Variants
• ACT○ ACTk Mode○ Stop ACT Test
• Critical Tests
147
i-STAT Alinity — System Operations Manual Art: 746300-01 Rev. I Rev. Date: 05-Nov-2019

*Quality Settings• Electronic Simulator
○ Simulator Testing Schedule• QC Notifications
○ Control Test Settings○ Control Test Out of Range Settings (Manual Pass/Fail Determination Only)○ Cal Ver Test Settings○ Cal Ver Test Out of Range Settings (Manual Pass/Fail Determination Only)○ eVAS Type○ Cartridge Lot QC Settings
• Liquid QC Schedules○ Frequency
• Cal Ver Schedules○ Frequency
User Defined Message• User Defined Message
Training Settings• Basic Functions
○ Training Mode○ Training Pathway Cartridges○ Operator Direct Observation Checklist○ Training Scenarios
STATNotes• STATNotes
○ Manage Items○ Manage Sets
Result Notes• Result Notes
○ Manage Items○ Manage Sets
Connectivity Settings• Connectivity Map
○ Test Records○ Device Events○ Operator List○ Patient List○ Cartridge List○ Log Events
148
i-STAT Alinity — System Operations Manual Art: 746300-01 Rev. I Rev. Date: 05-Nov-2019
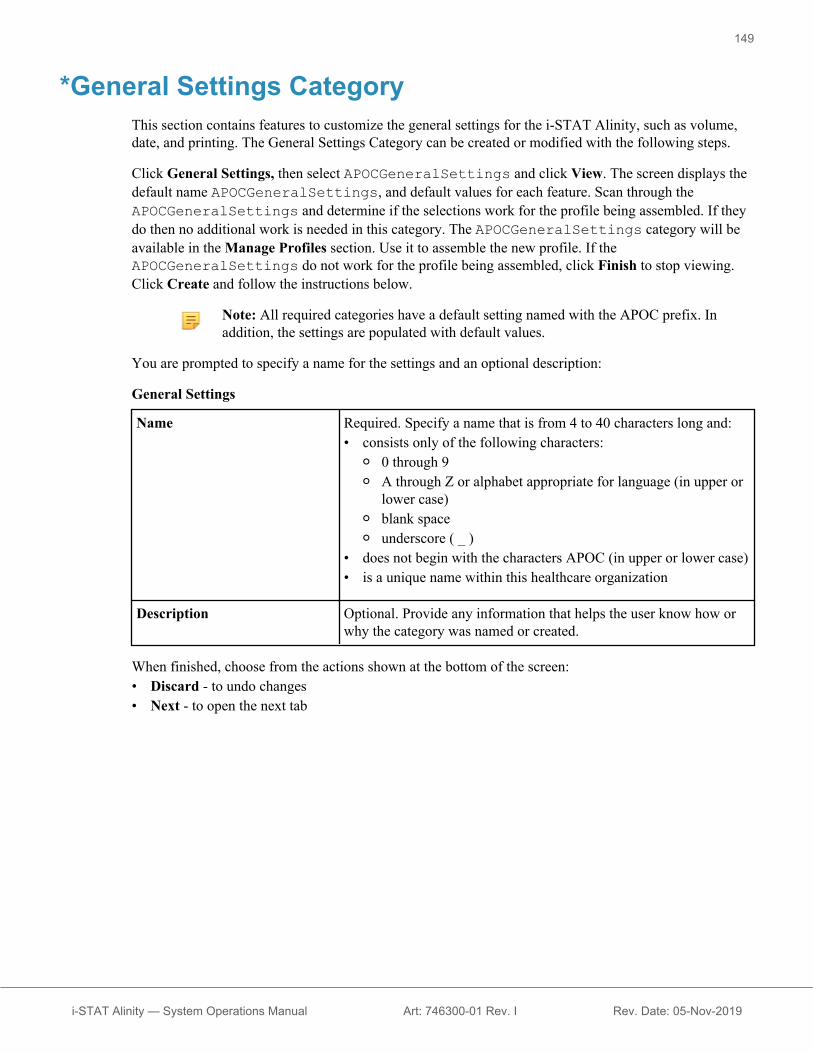
*General Settings CategoryThis section contains features to customize the general settings for the i‑STAT Alinity, such as volume,date, and printing. The General Settings Category can be created or modified with the following steps.
Click General Settings, then select APOCGeneralSettings and click View. The screen displays thedefault name APOCGeneralSettings, and default values for each feature. Scan through theAPOCGeneralSettings and determine if the selections work for the profile being assembled. If theydo then no additional work is needed in this category. The APOCGeneralSettings category will beavailable in the Manage Profiles section. Use it to assemble the new profile. If theAPOCGeneralSettings do not work for the profile being assembled, click Finish to stop viewing.Click Create and follow the instructions below.
Note: All required categories have a default setting named with the APOC prefix. Inaddition, the settings are populated with default values.
You are prompted to specify a name for the settings and an optional description:
General Settings
Name Required. Specify a name that is from 4 to 40 characters long and:• consists only of the following characters:
○ 0 through 9○ A through Z or alphabet appropriate for language (in upper or
lower case)○ blank space○ underscore ( _ )
• does not begin with the characters APOC (in upper or lower case)• is a unique name within this healthcare organization
Description Optional. Provide any information that helps the user know how orwhy the category was named or created.
When finished, choose from the actions shown at the bottom of the screen:• Discard - to undo changes• Next - to open the next tab
149
i-STAT Alinity — System Operations Manual Art: 746300-01 Rev. I Rev. Date: 05-Nov-2019
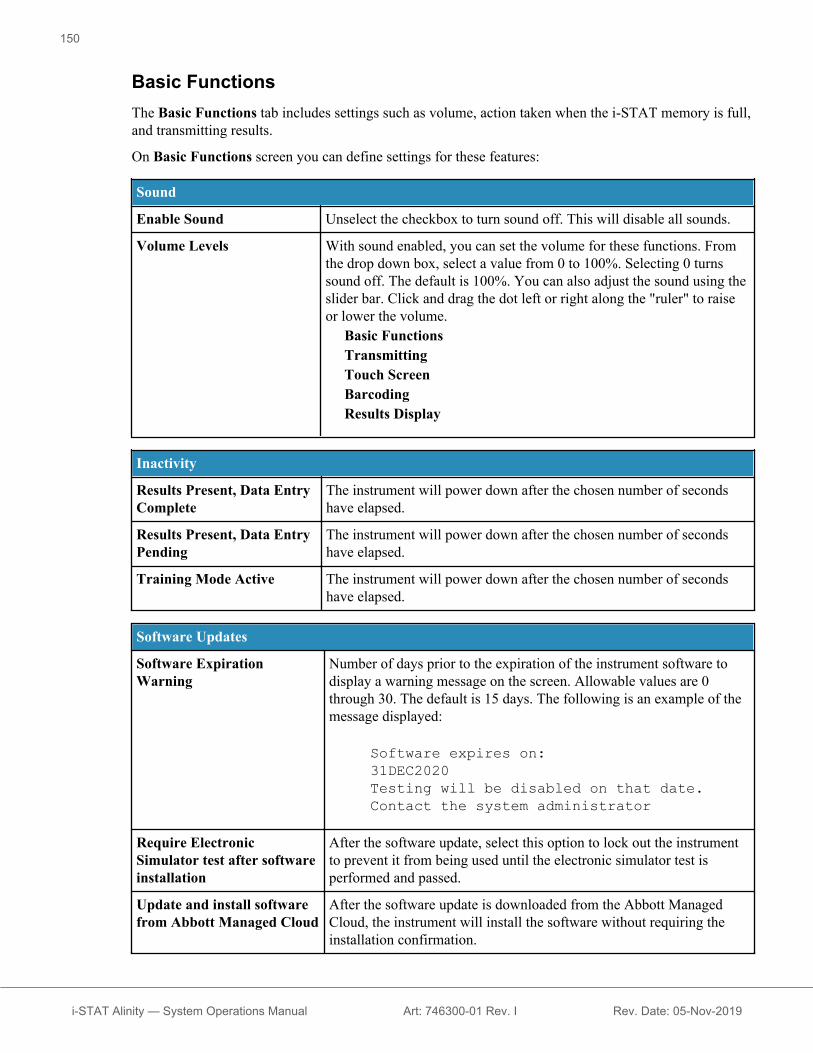
Basic FunctionsThe Basic Functions tab includes settings such as volume, action taken when the i‑STAT memory is full,and transmitting results.
On Basic Functions screen you can define settings for these features:
Sound
Enable Sound Unselect the checkbox to turn sound off. This will disable all sounds.
Volume Levels With sound enabled, you can set the volume for these functions. Fromthe drop down box, select a value from 0 to 100%. Selecting 0 turnssound off. The default is 100%. You can also adjust the sound using theslider bar. Click and drag the dot left or right along the "ruler" to raiseor lower the volume.
Basic FunctionsTransmittingTouch ScreenBarcodingResults Display
Inactivity
Results Present, Data EntryComplete
The instrument will power down after the chosen number of secondshave elapsed.
Results Present, Data EntryPending
The instrument will power down after the chosen number of secondshave elapsed.
Training Mode Active The instrument will power down after the chosen number of secondshave elapsed.
Software Updates
Software ExpirationWarning
Number of days prior to the expiration of the instrument software todisplay a warning message on the screen. Allowable values are 0through 30. The default is 15 days. The following is an example of themessage displayed:
Software expires on:31DEC2020Testing will be disabled on that date.Contact the system administrator
Require ElectronicSimulator test after softwareinstallation
After the software update, select this option to lock out the instrumentto prevent it from being used until the electronic simulator test isperformed and passed.
Update and install softwarefrom Abbott Managed Cloud
After the software update is downloaded from the Abbott ManagedCloud, the instrument will install the software without requiring theinstallation confirmation.
150
i-STAT Alinity — System Operations Manual Art: 746300-01 Rev. I Rev. Date: 05-Nov-2019

Decimal Character
Select the decimal point or comma for the display of results on theinstrument. Decimal point is the default.
Memory Full Action
The instrument can store 500 results (including Patient, QC, Training results). This setting controls theaction taken when the memory is full:
Overwrite the oldest recordwithout notification
New records overwrite oldrecords. The oldest record isoverwritten first, the next oldestrecord is overwritten next, and soon. This is the default.
Memory full notification atinstrument start-up
When the instrument is poweredup a start up alert will displayindicating the memory is full.The operator is prompted to clearthe memory, otherwise oldrecords may be overwritten.
Lockout all Testing Pathwaysuntil memory is cleared
Testing will be suspended untilthe memory is cleared. Lockoutmessage displays on theinstrument at start up.
When finished, choose from the options shown at the bottom of the screen:• Previous to go back to the previous screen• Discard to undo changes• Finish Later to create a draft• Next to open the next tab
151
i-STAT Alinity — System Operations Manual Art: 746300-01 Rev. I Rev. Date: 05-Nov-2019

DateThese settings control the format of the date when it is entered and displayed on the i-STAT Alinity.
Date Entry Select one of these options for the format to be used when entering the date intothe instrument. The default is mm/dd/yy:
mm/dd/yydd/mm/yy
Date Display Select one of these options for the format of the date as it is displayed on theinstrument. The default is dd/mm/yyyy:
dd/mm/yyyymm/dd/yyyyddMMMyyyy
When finished, choose from the options shown at the bottom of the screen:• Previous to go back to the previous screen• Discard to undo changes• Finish Later to create a draft• Next to open the next tab
152
i-STAT Alinity — System Operations Manual Art: 746300-01 Rev. I Rev. Date: 05-Nov-2019

CommunicationsThese settings control the communication method and action taken if upload fails or is delayed.
Result AutoTransmit
Transmit all result or results to data manager once displayed on the instrumentand after all required entries are completed or after the inactivity time is reached.
Power DownCommunications
Select the action to be taken for data transmission when the instrument powersdown:
None No data will be communicated or transmitted frominstrument to data management system or cloudservice when the instrument powers down.
Unsent Results Unsent results will be transmitted to the datamanagement system when the instrument powersdown.
All (Unsent Results, Lists,eVAS)
All unsent results, Operator/Patient/Cartridge Lists,if enabled, and eVAS, if new version available,will be communicated and transmitted to or fromthe data management system and cloud servicewhen the instrument powers down.
WirelessCommunications
Enables wireless communication for the i‑STAT Alinity instrument. The defaultsetting is enabled. Uncheck the box to disable. Wireless communication is notfully enabled until the instrument is configured using the NCi application. Seethe NCi section of this manual for additional instruction.
When finished, choose from the options shown at the bottom of the screen:• Previous to go back to the previous screen• Discard to undo changes• Finish Later to create a draft• Next to open the next tab
153
i-STAT Alinity — System Operations Manual Art: 746300-01 Rev. I Rev. Date: 05-Nov-2019

Operator ActionsThe features in this section determine the actions for Operators when working in the patient test pathwayor training mode pathway.
Operator Actions
Accept or Reject Results Determines whether the operator has the ability to accept or rejectresults after they are displayed on the instrument.
Enable Accept or RejectResults
Select the check box to allow operatorsto accept or reject test results afterresults display on the instrument. Ifresults are rejected no patient treatmentshould be performed from the rejectedresults. Unselect the check box andoperators will not have the option ofrejecting or accepting results after theydisplay on the instrument. If results aretransmitted to the data managementsystem, only those that are accepted willgo through to the LIS/EMR. Rejectedresults will not be sent to the LIS/EMR.
Rejection Comment Select either option:
Optional The operator is prompted to enter acomment for rejecting test results.
Mandatory The operator is prompted to enter amandatory comment for rejecting testresults.
Rejection Comment Style Controls display of comments on the i‑STAT Alinity. Select either:
Comment List Only comments chosen from theselection list will be displayed andavailable for attaching to a rejectedresult.
Comment List with textbox
Comments chosen from the commentlist along with a text box that will accept20 characters will be displayed andavailable for attaching to a rejectedresult. A maximum of 6 comments canbe displayed with a text box.
Rejection Comments At least one comment is required when the Accept/Reject feature isenabled. The comment list is created by the CWi user. Thecomments will display on the instrument screen when a result isrejected. Operator selects the most appropriate. Rejection commentswill be attached to the test record and can be viewed under theReview Results > Patient Results > Rejected Patient Results
154
i-STAT Alinity — System Operations Manual Art: 746300-01 Rev. I Rev. Date: 05-Nov-2019

Test Cancellation
Enable Test Cancellation Allows the operator to cancel a test during testing. Select the checkbox to enable test cancellation. The default is disabled. Canceledtests can be viewed by going to Review Results > CanceledResults.
Test Selection Requires the operator to select analytes to be reported from all of theanalytes available on the cartridge scanned. Select the check box torequire tests to be selected. Unselect the check box if you do notwant to require tests to be selected.
Accession/Specimen ID entry Accession or Specimen ID number generated from facility LIS whena test is ordered:
Enable Select the check box to enable prompting for anentry. If you select the check box to enableprompting, choose one of these options:
OptionalPrompt the operator for entry of the accession/specimen ID number. The operator may skip thisprompt.
Mandatory with OverridePrompt the operator for a mandatory entry. If theoverride feature is chosen by the operator no furtheraction is required and the instrument will advance tothe next screen.
MandatoryPrompt the operator for a mandatory entry. Cartridgetesting cannot continue until information is entered.
155
i-STAT Alinity — System Operations Manual Art: 746300-01 Rev. I Rev. Date: 05-Nov-2019
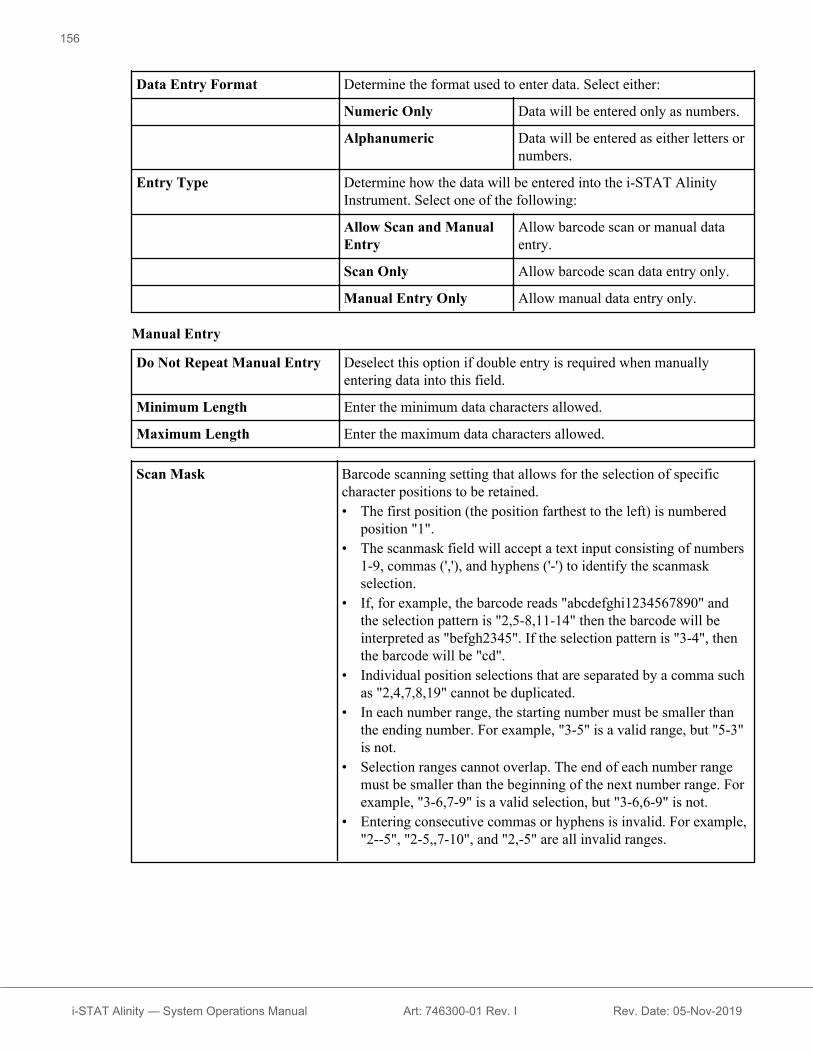
Data Entry Format Determine the format used to enter data. Select either:
Numeric Only Data will be entered only as numbers.
Alphanumeric Data will be entered as either letters ornumbers.
Entry Type Determine how the data will be entered into the i‑STAT AlinityInstrument. Select one of the following:
Allow Scan and ManualEntry
Allow barcode scan or manual dataentry.
Scan Only Allow barcode scan data entry only.
Manual Entry Only Allow manual data entry only.
Manual Entry
Do Not Repeat Manual Entry Deselect this option if double entry is required when manuallyentering data into this field.
Minimum Length Enter the minimum data characters allowed.
Maximum Length Enter the maximum data characters allowed.
Scan Mask Barcode scanning setting that allows for the selection of specificcharacter positions to be retained.• The first position (the position farthest to the left) is numbered
position "1".• The scanmask field will accept a text input consisting of numbers
1-9, commas (','), and hyphens ('-') to identify the scanmaskselection.
• If, for example, the barcode reads "abcdefghi1234567890" andthe selection pattern is "2,5-8,11-14" then the barcode will beinterpreted as "befgh2345". If the selection pattern is "3-4", thenthe barcode will be "cd".
• Individual position selections that are separated by a comma suchas "2,4,7,8,19" cannot be duplicated.
• In each number range, the starting number must be smaller thanthe ending number. For example, "3-5" is a valid range, but "5-3"is not.
• Selection ranges cannot overlap. The end of each number rangemust be smaller than the beginning of the next number range. Forexample, "3-6,7-9" is a valid selection, but "3-6,6-9" is not.
• Entering consecutive commas or hyphens is invalid. For example,"2--5", "2-5,,7-10", and "2,-5" are all invalid ranges.
156
i-STAT Alinity — System Operations Manual Art: 746300-01 Rev. I Rev. Date: 05-Nov-2019

Manual Check DigitMethod
If a facility uses a supported check digit algorithm when creating operator orpatient IDs, the i‑STAT Alinity can verify the entered ID format by calculatingthe check digit and comparing it to the entered ID number. If the check digitsdo not match, the ID is rejected.
Note: The i‑STAT Alinity System supports the Mod 10 and Mod 11check digit algorithms described in the HL7 Table 0061 (Check DigitScheme) in the HL7 Specification (Rev 1.4). Contact your LIS/HIS orIT departments to determine if your facility uses check digits in thecreation of operator and/or patient ID numbers, and if so, whichalgorithm is used.
Allowable values are:
No check digit on manualentry
Do not use a check digit when creatingoperator or patient IDs.
Mod 11 check digit onmanual entry
Use the Mod 11 algorithm when creatingoperator or patient IDs.
Mod 10 check digit onmanual entry
Use the Mod 10 algorithm when creatingoperator or patient IDs.
Scan Entry CheckDigit Method
Whether to use a check digit when scanning a value to create an operator orpatient ID.
No check digit on scan entry Do not use a check digit when creatingoperator or patient IDs.
Mod 11 check digit on scanentry
Use the Mod 11 algorithm when creatingoperator or patient IDs.
Mod 10 check digit on scanentry
Use the Mod 10 algorithm when creatingoperator or patient IDs.
Barcode Type Select all that apply.
When finished, choose from the options shown at the bottom of the screen:• Previous to go back to the previous screen• Discard to undo changes• Finish Later to create a draft• Next to open the next tab
157
i-STAT Alinity — System Operations Manual Art: 746300-01 Rev. I Rev. Date: 05-Nov-2019

Critical CallbackThis section describes the critical callback feature. This feature requires that action ranges are defined inthe Analyte Settings Category.
Critical Callback Documentation
Enable Critical CallbackDocumentation
Select this check box to enable the Critical Callback documentationfeature.
Mandatory with Override Prompt the operator for amandatory entry. If the overridefeature is chosen by the operatorno further action is required andthe instrument will advance tothe next screen.
Mandatory Prompt the operator for amandatory entry. Cartridgetesting cannot continue untilinformation is entered.
Patient Last Name Operator enters the patient’s last name for confirmation when acritical callback is read to the caregiver. Refer to the options below.If Positive Patient Identification (PPID) is enabled, this informationis automatically populated.
Options
Enable Select this check box to enable comments. If comments are enabled,select one of these options:
Optional Comment is optional.
Mandatory Comment is required.
Format Determine the format used to enter data. Select either:
Numeric Only Data will be entered only as numbers.
Alphanumeric Data will be entered as either letters ornumbers.
Entry Type Determine how the data will be entered into the i‑STAT Alinity instrument. Selectone of the following:
Allow Scan and Manual Entry Allow barcode scan or manual data entry.
Scan Only Allow barcode scan data entry only.
Manual Entry Only Allow manual data entry only.
Minimum Length Enter the minimum data charactersallowed.
158
i-STAT Alinity — System Operations Manual Art: 746300-01 Rev. I Rev. Date: 05-Nov-2019

Maximum Length Enter the maximum data charactersallowed.
Scan Mask Barcode scanning setting that allows for the selection of specific character positionsto be retained.• The first position (the position farthest to the left) is numbered position "1".• The scanmask field will accept a text input consisting of numbers 1-9, commas
(','), and hyphens ('-') to identify the scanmask selection.• If, for example, the barcode reads "abcdefghi1234567890" and the selection
pattern is "2,5-8,11-14" then the barcode will be interpreted as "befgh2345". Ifthe selection pattern is "3-4", then the barcode will be "cd".
• Individual position selections that are separated by a comma such as "2,4,7,8,19"cannot be duplicated.
• In each number range, the starting number must be smaller than the endingnumber. For example, "3-5" is a valid range, but "5-3" is not.
• Selection ranges cannot overlap. The end of each number range must be smallerthan the beginning of the next number range. For example, "3-6,7-9" is a validselection, but "3-6,6-9" is not.
• Entering consecutive commas or hyphens is invalid. For example, "2--5","2-5,,7-10", and "2,-5" are all invalid ranges.
Manual Check DigitMethod
If a facility uses a supported check digit algorithm when creating operator orpatient IDs, the i‑STAT Alinity can verify the entered ID format by calculatingthe check digit and comparing it to the entered ID number. If the check digitsdo not match, the ID is rejected.
Note: The i‑STAT Alinity System supports the Mod 10 and Mod 11check digit algorithms described in the HL7 Table 0061 (Check DigitScheme) in the HL7 Specification (Rev 1.4). Contact your LIS/HIS orIT departments to determine if your facility uses check digits in thecreation of operator and/or patient ID numbers, and if so, whichalgorithm is used.
Allowable values are:
No check digit on manualentry
Do not use a check digit when creatingoperator or patient IDs.
Mod 11 check digit onmanual entry
Use the Mod 11 algorithm when creatingoperator or patient IDs.
Mod 10 check digit onmanual entry
Use the Mod 10 algorithm when creatingoperator or patient IDs.
159
i-STAT Alinity — System Operations Manual Art: 746300-01 Rev. I Rev. Date: 05-Nov-2019

Scan Entry CheckDigit Method
Whether to use a check digit when scanning a value to create an operator orpatient ID.
No check digit on scan entry Do not use a check digit when creatingoperator or patient IDs.
Mod 11 check digit on scanentry
Use the Mod 11 algorithm when creatingoperator or patient IDs.
Mod 10 check digit on scanentry
Use the Mod 10 algorithm when creatingoperator or patient IDs.
Barcode Type Select all that apply.
Patient FirstName
Operator enters the patient’s first name for confirmation when a critical callback isread to the caregiver. If Positive Patient Identification (PPID) is enabled, thisinformation is automatically populated.
Note: For Patient First Name options see the section for Patient LastName Options. Options are the same for both.
Caregiver ID Operator enters the caregiver’s last name or ID for confirmation when acritical callback is read to the caregiver.
Format Note: Caregiver ID options for Format, Entry Type, MinimumLength, Maximum Length, Scan Mask, Manual Check DigitMethod, Scan Entry Check Digit Method and Barcode Type arethe same as those for Patient Last Name. See the informationshown earlier in this section.
Entry Type
Minimum Length
Maximum Length
Scan Mask
Manual Check DigitMethod
Scan Entry Check DigitMethod
Barcode Type
160
i-STAT Alinity — System Operations Manual Art: 746300-01 Rev. I Rev. Date: 05-Nov-2019

Comments
Options
Enable Select this check box to prompt the operator to enter a comment. Ifyou enable this feature, choose one of the following options:
Optional Prompts the operator to enter an optionalcomment.
Mandatory Prompts the operator to enter amandatory comment.
Comment Style Determines the type of information that can be entered as acomment:
Comment List Comments must be chosen from a list.
Comment List with textbox
Comments can be chosen from acomment list or entered into a text boxthat accepts up to 20 characters. Acomment will be displayed and availablefor attaching to a result.
Comments A list of comments created by the CWiuser. Operator selects the mostappropriate. The comment will beattached to the test record. Eachcomment can be 17 characters in lengthincluding spaces.
Comment Field Prompt Specify the text, up to 17 characters, todisplay on the instrument, as a prefix toa comment.
Note: The prefix specified asComment Field Prompt willdisplay with a comment. Forexample, if the Comment FieldPrompt built is CriticalResult and the operatorchooses Repeat per MDfrom the comment list on theinstrument, the full commentwill appear as CriticalResult Repeat per MD.
When finished, choose from the options shown at the bottom of the screen:• Previous to go back to the previous screen• Discard to undo changes• Finish Later to create a draft• Next to open the next tab
161
i-STAT Alinity — System Operations Manual Art: 746300-01 Rev. I Rev. Date: 05-Nov-2019

PrintThis section describes settings for printing from the instrument to the i‑STAT Alinity printer.
Test Result Printout Includes or excludes information that will be printed:
Show Reference Ranges Print reference ranges with the results onthe printout.
Note: Reference Ranges must bedefined in Analyte Settings inorder for the reference ranges to bedisplayed and available to print.
Show Patient Name, Gender,and Age
Print the patient name, gender and age onthe printout.
Note: If PPID is enabled in PatientSettings the patient name, genderand age will be available for print.If prompts for the Patient Name,gender and age are displayed andentered on the instrument theinformation will be available forprint.
Hide Operator ID onPrintout
Do not include the Operator ID on theprintout.
Hide Operator Name onPrintout
Do not include the Operator Name on theprintout.
Note: Operator list must beenabled in Operator Settings inorder for the operator name to bedisplayed and available for print.
i‑STAT Printing
Enable i‑STAT printing Unselect the check box if printing is not allowed or if there are noi‑STAT Alinity printers available.
When finished, choose from the options shown at the bottom of the screen:• Previous to go back to the previous screen• Discard to undo changes• Finish Later to create a draft• Publish to make settings available to use in a Profile
i-STAT Reserved
For Abbott Point of Care use only and to be used only at the direction of Abbott Point of Care.
162
i-STAT Alinity — System Operations Manual Art: 746300-01 Rev. I Rev. Date: 05-Nov-2019

SummaryThe Summary is a collapsed view of the settings that can be expanded to provide a complete display. TheSummary should be reviewed prior to Publish. Once the settings are confirmed, click on the Publishbutton to finalize them. A Category can be added to a Profile only when the publish status is completed.
When finished, choose from the options shown at the bottom of the screen:• Previous to go back to the previous screen• Discard to undo changes• Finish Later to create a draft• Publish to make settings available to use in a Profile
163
i-STAT Alinity — System Operations Manual Art: 746300-01 Rev. I Rev. Date: 05-Nov-2019

*Operator Settings CategoryThis section contains features for identifying operators, such as, method for entering the operator's ID,enhancing security by utilizing an operator list, and giving notification when an operator's certification isdue to expire. The Operator Settings category can be created using the following steps.
Click Operator Settings, then select APOCOperatorSettings and click View. The screen displaysthe default name APOCOperatorSettings, and default values for each feature. Scan through theAPOCOperatorSettings and determine if the selections work for the profile being assembled. Ifthey do then no additional work is needed in this category. The APOCOperatorSettings categorywill be available in the Manage Profiles section. Use it to assemble the new profile. If theAPOCOperatorSettings do not work for the profile being assembled, click Finish to stop viewing.Click Create and follow the instructions below.
Note: All required categories have a default setting named with the APOC prefix. Inaddition, the settings are populated with default values.
You are prompted to specify a name for the settings and an optional description:
Operator Settings
Name Required. Specify a name that is from 4 to 40 characters long and:• consists only of the following characters:
○ 0 through 9○ A through Z or alphabet appropriate for language (in upper or
lower case)○ blank space○ underscore ( _ )
• does not begin with the characters APOC (in upper or lower case)• is a unique name within this healthcare organization
Description Optional. Provide any information that helps the user know how orwhy the category was named or created.
When finished, choose from the actions shown at the bottom of the screen:• Discard - to undo changes• Next - to open the next tab
164
i-STAT Alinity — System Operations Manual Art: 746300-01 Rev. I Rev. Date: 05-Nov-2019
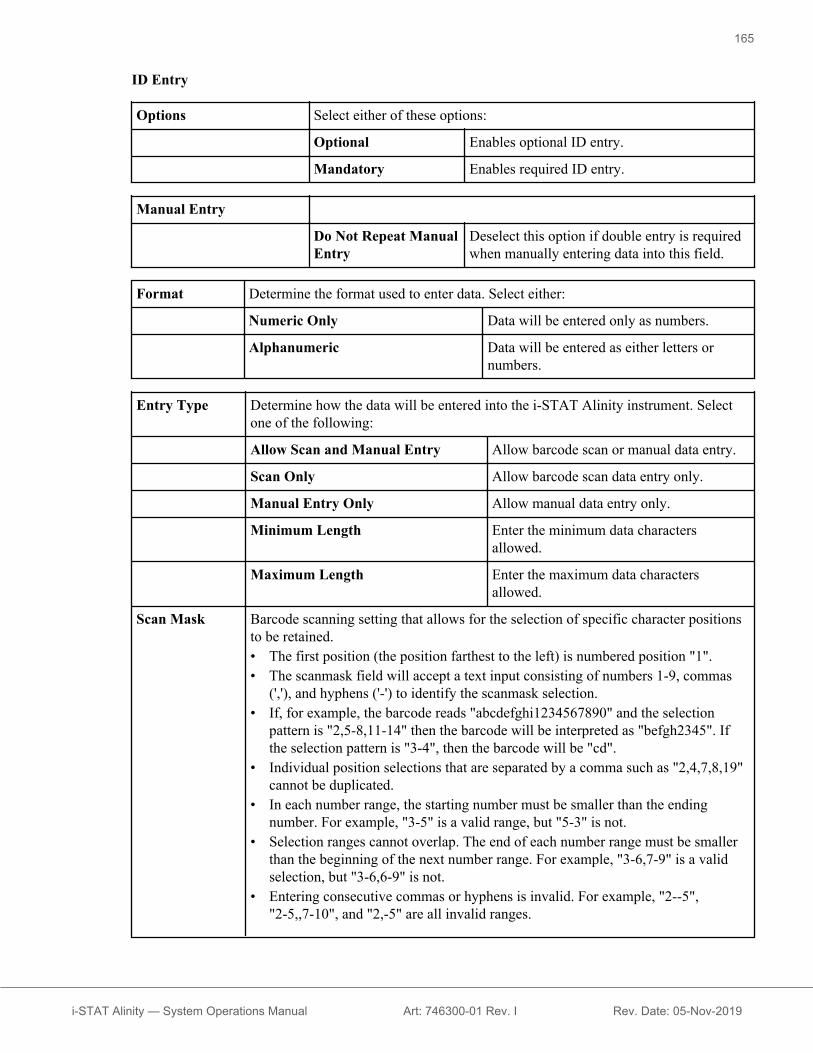
ID Entry
Options Select either of these options:
Optional Enables optional ID entry.
Mandatory Enables required ID entry.
Manual Entry
Do Not Repeat ManualEntry
Deselect this option if double entry is requiredwhen manually entering data into this field.
Format Determine the format used to enter data. Select either:
Numeric Only Data will be entered only as numbers.
Alphanumeric Data will be entered as either letters ornumbers.
Entry Type Determine how the data will be entered into the i‑STAT Alinity instrument. Selectone of the following:
Allow Scan and Manual Entry Allow barcode scan or manual data entry.
Scan Only Allow barcode scan data entry only.
Manual Entry Only Allow manual data entry only.
Minimum Length Enter the minimum data charactersallowed.
Maximum Length Enter the maximum data charactersallowed.
Scan Mask Barcode scanning setting that allows for the selection of specific character positionsto be retained.• The first position (the position farthest to the left) is numbered position "1".• The scanmask field will accept a text input consisting of numbers 1-9, commas
(','), and hyphens ('-') to identify the scanmask selection.• If, for example, the barcode reads "abcdefghi1234567890" and the selection
pattern is "2,5-8,11-14" then the barcode will be interpreted as "befgh2345". Ifthe selection pattern is "3-4", then the barcode will be "cd".
• Individual position selections that are separated by a comma such as "2,4,7,8,19"cannot be duplicated.
• In each number range, the starting number must be smaller than the endingnumber. For example, "3-5" is a valid range, but "5-3" is not.
• Selection ranges cannot overlap. The end of each number range must be smallerthan the beginning of the next number range. For example, "3-6,7-9" is a validselection, but "3-6,6-9" is not.
• Entering consecutive commas or hyphens is invalid. For example, "2--5","2-5,,7-10", and "2,-5" are all invalid ranges.
165
i-STAT Alinity — System Operations Manual Art: 746300-01 Rev. I Rev. Date: 05-Nov-2019

Manual Check DigitMethod
If a facility uses a supported check digit algorithm when creating operator orpatient IDs, the i‑STAT Alinity can verify the entered ID format by calculatingthe check digit and comparing it to the entered ID number. If the check digitsdo not match, the ID is rejected.
Note: The i‑STAT Alinity System supports the Mod 10 and Mod 11check digit algorithms described in the HL7 Table 0061 (Check DigitScheme) in the HL7 Specification (Rev 1.4). Contact your LIS/HIS orIT departments to determine if your facility uses check digits in thecreation of operator and/or patient ID numbers, and if so, whichalgorithm is used.
Allowable values are:
No check digit on manualentry
Do not use a check digit when creatingoperator or patient IDs.
Mod 11 check digit onmanual entry
Use the Mod 11 algorithm when creatingoperator or patient IDs.
Mod 10 check digit onmanual entry
Use the Mod 10 algorithm when creatingoperator or patient IDs.
Scan Entry CheckDigit Method
Whether to use a check digit when scanning a value to create an operator orpatient ID.
No check digit on scan entry Do not use a check digit when creatingoperator or patient IDs.
Mod 11 check digit on scanentry
Use the Mod 11 algorithm when creatingoperator or patient IDs.
Mod 10 check digit on scanentry
Use the Mod 10 algorithm when creatingoperator or patient IDs.
Barcode Type Select all that apply.
Operator IDPresentation
Determine how the operator ID will be displayed on the i‑STAT Alinity. Selectfrom the following options:
Display Operator ID Display the entire operator ID.
Partially Display Operator ID Display only the last 3 digits of theoperator ID.
Hide Operator ID Display none of the operator ID.
166
i-STAT Alinity — System Operations Manual Art: 746300-01 Rev. I Rev. Date: 05-Nov-2019
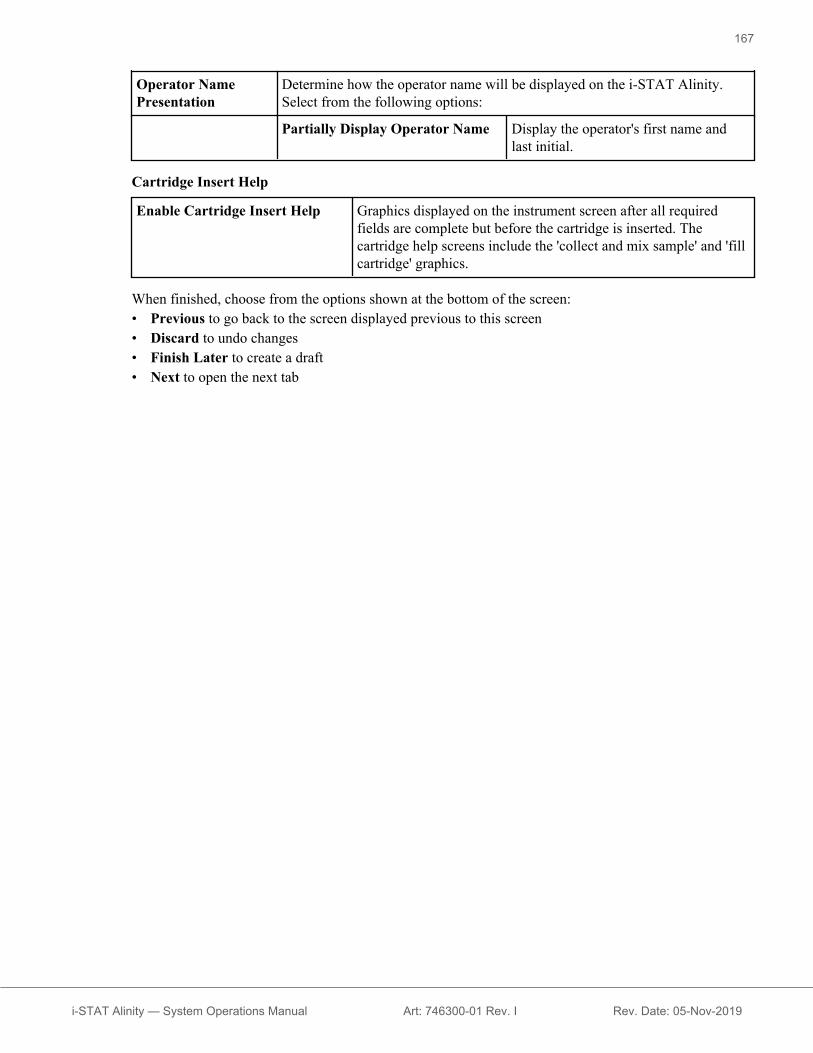
Operator NamePresentation
Determine how the operator name will be displayed on the i‑STAT Alinity.Select from the following options:
Partially Display Operator Name Display the operator's first name andlast initial.
Cartridge Insert Help
Enable Cartridge Insert Help Graphics displayed on the instrument screen after all requiredfields are complete but before the cartridge is inserted. Thecartridge help screens include the 'collect and mix sample' and 'fillcartridge' graphics.
When finished, choose from the options shown at the bottom of the screen:• Previous to go back to the screen displayed previous to this screen• Discard to undo changes• Finish Later to create a draft• Next to open the next tab
167
i-STAT Alinity — System Operations Manual Art: 746300-01 Rev. I Rev. Date: 05-Nov-2019
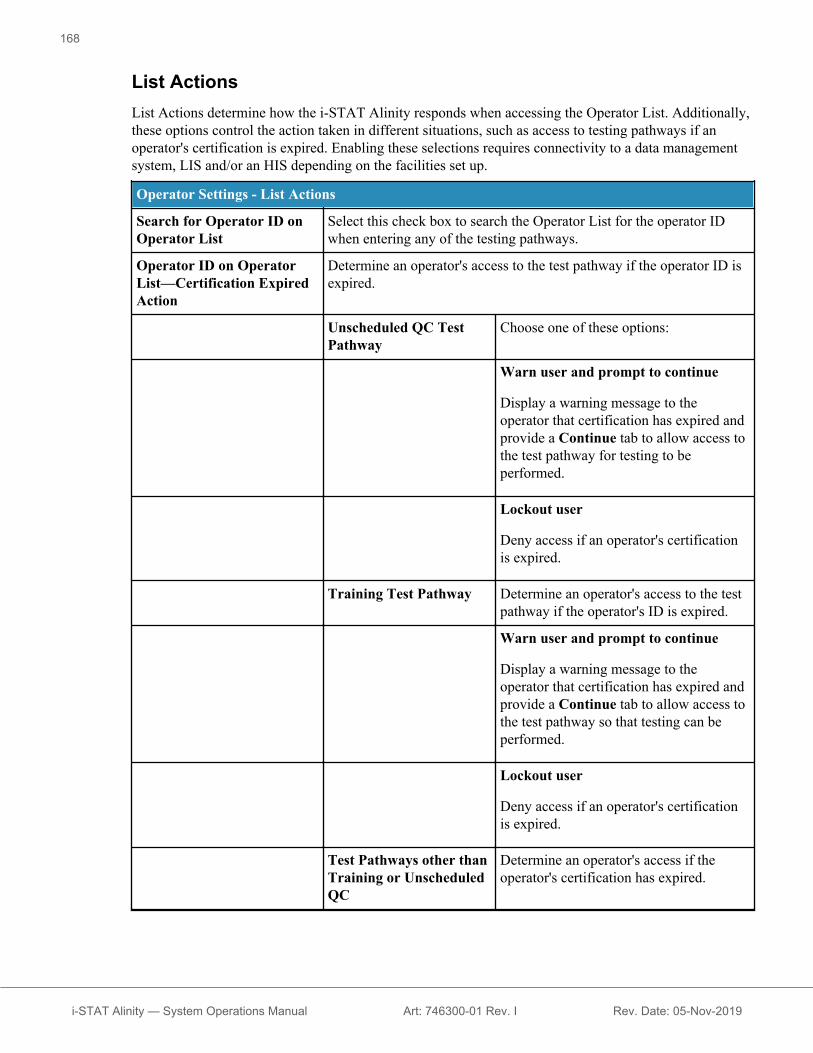
List ActionsList Actions determine how the i‑STAT Alinity responds when accessing the Operator List. Additionally,these options control the action taken in different situations, such as access to testing pathways if anoperator's certification is expired. Enabling these selections requires connectivity to a data managementsystem, LIS and/or an HIS depending on the facilities set up.
Operator Settings - List Actions
Search for Operator ID onOperator List
Select this check box to search the Operator List for the operator IDwhen entering any of the testing pathways.
Operator ID on OperatorList—Certification ExpiredAction
Determine an operator's access to the test pathway if the operator ID isexpired.
Unscheduled QC TestPathway
Choose one of these options:
Warn user and prompt to continue
Display a warning message to theoperator that certification has expired andprovide a Continue tab to allow access tothe test pathway for testing to beperformed.
Lockout user
Deny access if an operator's certificationis expired.
Training Test Pathway Determine an operator's access to the testpathway if the operator's ID is expired.
Warn user and prompt to continue
Display a warning message to theoperator that certification has expired andprovide a Continue tab to allow access tothe test pathway so that testing can beperformed.
Lockout user
Deny access if an operator's certificationis expired.
Test Pathways other thanTraining or UnscheduledQC
Determine an operator's access if theoperator's certification has expired.
168
i-STAT Alinity — System Operations Manual Art: 746300-01 Rev. I Rev. Date: 05-Nov-2019

Operator Settings - List Actions
Warn user and prompt to continue
Display a message to the operatorwarning that certification has expired andallow access to the test pathway so thattesting can be performed.
Lockout user
Deny access if an operator's certificationis expired.
Operator ID not onOperator List Action
Determine what access an operator will have in the test pathways whenthe operator ID is not on the Operator List.
Unscheduled QC TestPathway
Choose one of these options:
Warn user and prompt to continue
Display a warning message to theoperator stating that the operator's ID isnot on the Operator List and allow accessto the test pathway for testing to beperformed.
Lockout user
Deny access if an operator's ID is not onthe Operator List.
Training Test Pathway Determine an operator's access to the testpathway if the operator's ID is expired.
Warn user and prompt to continue
Display a warning message to theoperator stating that the operator's ID isnot on the Operator List and allow accessto the test pathway for testing to beperformed.
Lockout user
Deny access if an operator's ID is not onthe Operator List.
Test Pathways other thanTraining or UnscheduledQC
Determine an operator's access to the testpathway if the operator's ID is expired.
169
i-STAT Alinity — System Operations Manual Art: 746300-01 Rev. I Rev. Date: 05-Nov-2019
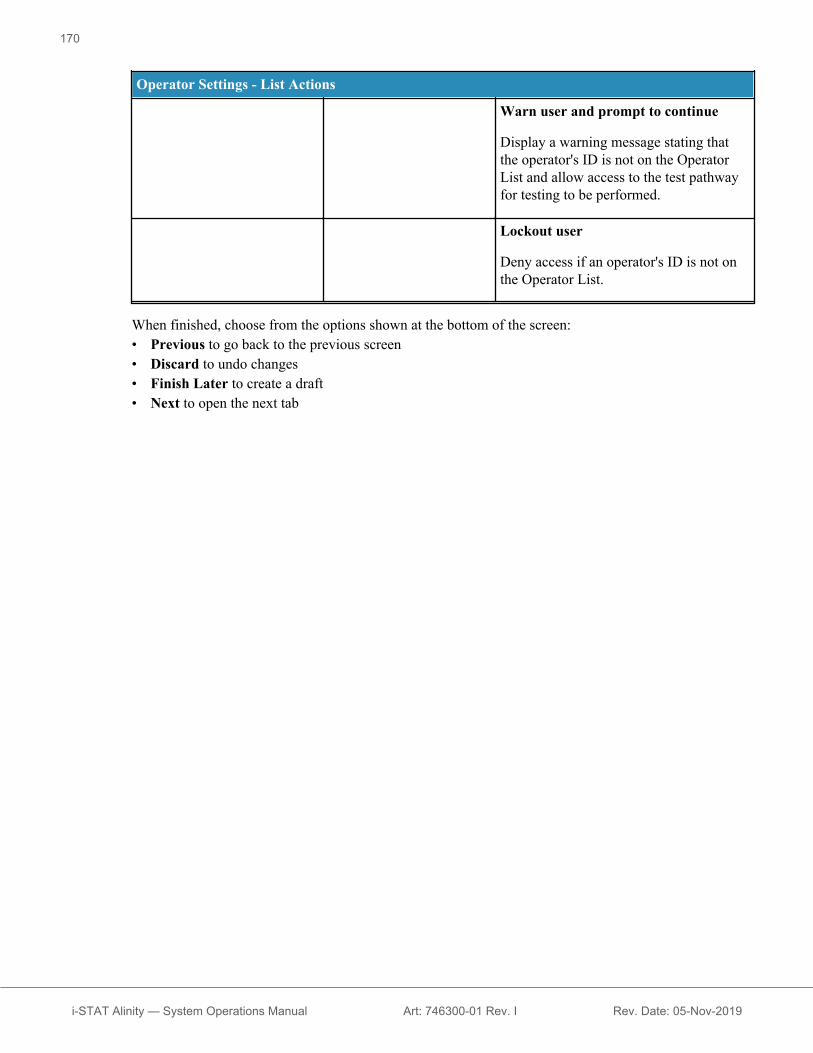
Operator Settings - List Actions
Warn user and prompt to continue
Display a warning message stating thatthe operator's ID is not on the OperatorList and allow access to the test pathwayfor testing to be performed.
Lockout user
Deny access if an operator's ID is not onthe Operator List.
When finished, choose from the options shown at the bottom of the screen:• Previous to go back to the previous screen• Discard to undo changes• Finish Later to create a draft• Next to open the next tab
170
i-STAT Alinity — System Operations Manual Art: 746300-01 Rev. I Rev. Date: 05-Nov-2019
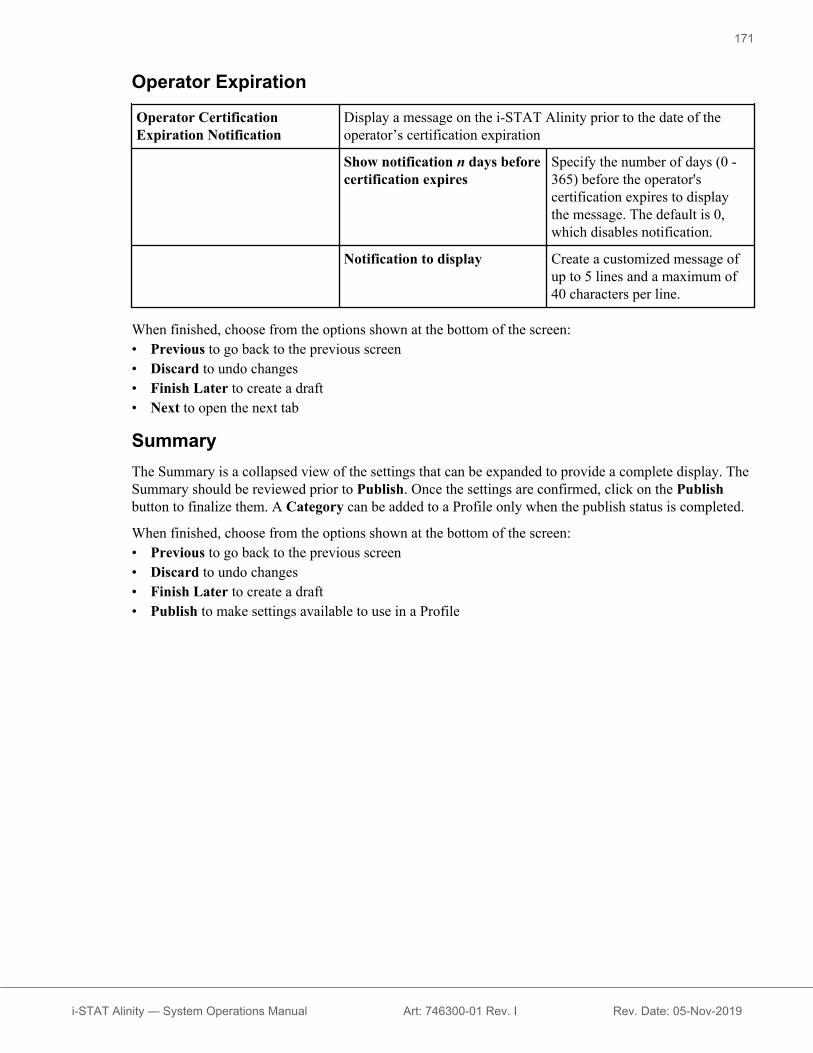
Operator Expiration
Operator CertificationExpiration Notification
Display a message on the i‑STAT Alinity prior to the date of theoperator’s certification expiration
Show notification n days beforecertification expires
Specify the number of days (0 -365) before the operator'scertification expires to displaythe message. The default is 0,which disables notification.
Notification to display Create a customized message ofup to 5 lines and a maximum of40 characters per line.
When finished, choose from the options shown at the bottom of the screen:• Previous to go back to the previous screen• Discard to undo changes• Finish Later to create a draft• Next to open the next tab
SummaryThe Summary is a collapsed view of the settings that can be expanded to provide a complete display. TheSummary should be reviewed prior to Publish. Once the settings are confirmed, click on the Publishbutton to finalize them. A Category can be added to a Profile only when the publish status is completed.
When finished, choose from the options shown at the bottom of the screen:• Previous to go back to the previous screen• Discard to undo changes• Finish Later to create a draft• Publish to make settings available to use in a Profile
171
i-STAT Alinity — System Operations Manual Art: 746300-01 Rev. I Rev. Date: 05-Nov-2019

*Patient Settings CategoryThis section contains features to customize the patient settings for the i‑STAT Alinity. The PatientSettings category can be created with the following steps.
Click Patient Settings, then select APOCPatientSettings and click View. The screen displays thedefault name APOCPatientSettings, and default values for each feature. Scan through theAPOCPatientSettings and determine if the selections work for the profile being assembled. If theydo then no additional work is needed in this category. The APOCPatientSettings category will beavailable in the Manage Profiles section. Use it to assemble the new profile. If theAPOCPatientSettings do not work for the profile being assembled, click Finish to stop viewing.Click Create and follow the instructions below.
Note: All required categories have a default setting named with the APOC prefix. Inaddition, the settings are populated with default values.
You are prompted to specify a name for the settings and an optional description:
Patient Settings Name Required. Specify a name that is from 4 to 40 characters long and:• consists only of the following characters:
○ 0 through 9○ A through Z or alphabet appropriate for language (in upper
or lower case)○ blank space○ underscore ( _ )
• does not begin with the characters APOC (in upper or lowercase)
• is a unique name within this healthcare organization
Description Optional. Provide any information that helps the user know how orwhy the category was named or created.
When finished, choose from the options shown at the bottom of the screen:• Discard to undo changes• Next to open the next tab
172
i-STAT Alinity — System Operations Manual Art: 746300-01 Rev. I Rev. Date: 05-Nov-2019

ID Entry
Options Select either of these options:
Optional Enables optional ID entry.
Mandatory Enables required ID entry.
Manual Entry
Do Not Repeat Manual Entry Deselect this option if doubleentry is required when manuallyentering data into this field.
Format Determine the format used to enter data. Select either:
Numeric Only Data will be entered only as numbers.
Alphanumeric Data will be entered as either letters ornumbers.
Entry Type Determine how the data will be entered into the i‑STAT Alinity instrument. Selectone of the following:
Allow Scan and Manual Entry Allow barcode scan or manual data entry.
Scan Only Allow barcode scan data entry only.
Manual Entry Only Allow manual data entry only.
Minimum Length Enter the minimum data charactersallowed.
Maximum Length Enter the maximum data charactersallowed.
Scan Mask Barcode scanning setting that allows for the selection of specific character positionsto be retained.• The first position (the position farthest to the left) is numbered position "1".• The scanmask field will accept a text input consisting of numbers 1-9, commas
(','), and hyphens ('-') to identify the scanmask selection.• If, for example, the barcode reads "abcdefghi1234567890" and the selection
pattern is "2,5-8,11-14" then the barcode will be interpreted as "befgh2345". Ifthe selection pattern is "3-4", then the barcode will be "cd".
• Individual position selections that are separated by a comma such as "2,4,7,8,19"cannot be duplicated.
• In each number range, the starting number must be smaller than the endingnumber. For example, "3-5" is a valid range, but "5-3" is not.
• Selection ranges cannot overlap. The end of each number range must be smallerthan the beginning of the next number range. For example, "3-6,7-9" is a validselection, but "3-6,6-9" is not.
• Entering consecutive commas or hyphens is invalid. For example, "2--5","2-5,,7-10", and "2,-5" are all invalid ranges.
173
i-STAT Alinity — System Operations Manual Art: 746300-01 Rev. I Rev. Date: 05-Nov-2019
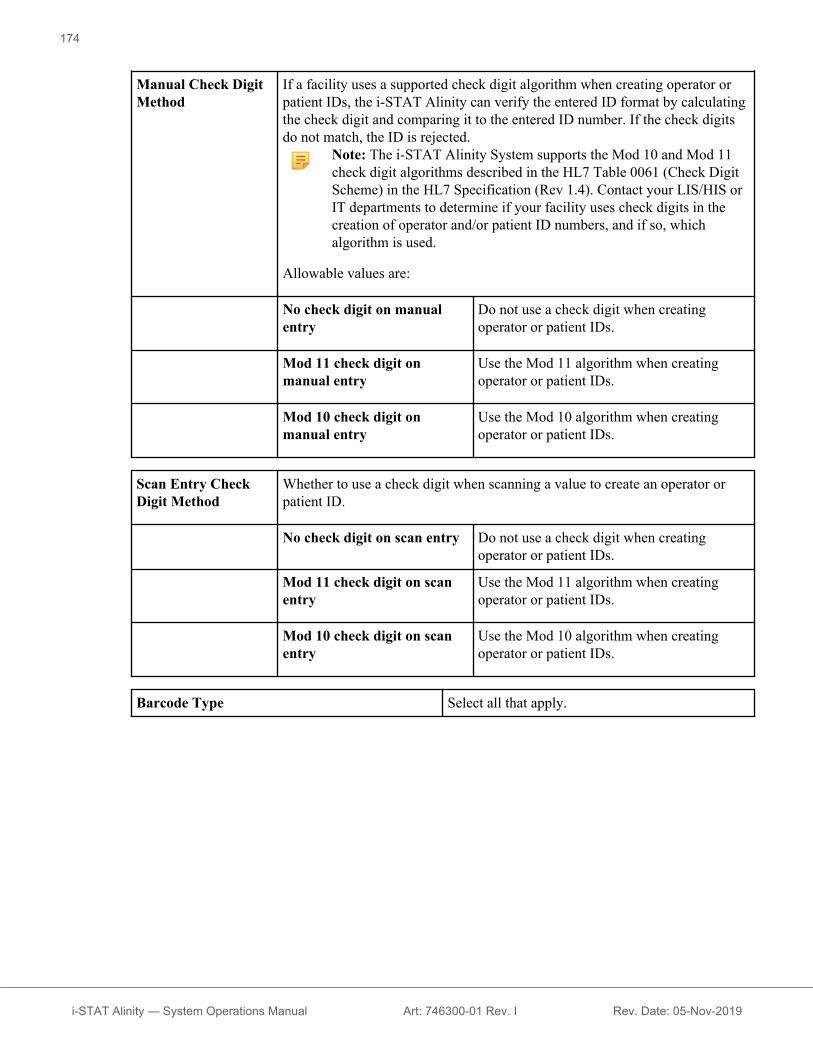
Manual Check DigitMethod
If a facility uses a supported check digit algorithm when creating operator orpatient IDs, the i‑STAT Alinity can verify the entered ID format by calculatingthe check digit and comparing it to the entered ID number. If the check digitsdo not match, the ID is rejected.
Note: The i‑STAT Alinity System supports the Mod 10 and Mod 11check digit algorithms described in the HL7 Table 0061 (Check DigitScheme) in the HL7 Specification (Rev 1.4). Contact your LIS/HIS orIT departments to determine if your facility uses check digits in thecreation of operator and/or patient ID numbers, and if so, whichalgorithm is used.
Allowable values are:
No check digit on manualentry
Do not use a check digit when creatingoperator or patient IDs.
Mod 11 check digit onmanual entry
Use the Mod 11 algorithm when creatingoperator or patient IDs.
Mod 10 check digit onmanual entry
Use the Mod 10 algorithm when creatingoperator or patient IDs.
Scan Entry CheckDigit Method
Whether to use a check digit when scanning a value to create an operator orpatient ID.
No check digit on scan entry Do not use a check digit when creatingoperator or patient IDs.
Mod 11 check digit on scanentry
Use the Mod 11 algorithm when creatingoperator or patient IDs.
Mod 10 check digit on scanentry
Use the Mod 10 algorithm when creatingoperator or patient IDs.
Barcode Type Select all that apply.
174
i-STAT Alinity — System Operations Manual Art: 746300-01 Rev. I Rev. Date: 05-Nov-2019

When finished, choose from the options shown at the bottom of the screen:• Previous to go back to the previous screen• Discard to undo changes• Finish Later to create a draft• Next to open the next tab
Patient Information and Positive Patient Identification (PPID)Patient Information customization features control prompting for patient age and sex, and whether patientgender obtained from the patient list is to be used as the patient sex. The Positive Patient Identification(PPID) feature enables the i‑STAT Alinity to present secondary patient identifiers (patient’s name, birthdate, and gender) obtained from the hospital’s Admission, Discharge, and Transfer (ADT) data basedupon the entered patient identification number. Using these secondary identifiers, the operator canconfirm the patient's identity. The PPID feature helps hospitals improve the accuracy of patientidentification by obtaining at least two forms of patient identification prior to diagnostic testing.
Age and Sex
Prompt for age and sex ifPatient List is Not Enabled orinformation is not in thePatient List
Patient age and sex prompt is required if reference and action rangesare built with age and sex applied in Analyte Settings. In order todisplay results for eGFR, the Prompt for age and sex if PatientList is Not Enabled or information is not in the Patient Listoption must be enabled.
Note: Sex types displayed on the instrument for manualentry of Age and Sex are Male, Female, and Unknown. Ifa sex type is selected from the list, but a reference andaction range are not set for that sex type, no reference oraction range will display with the results.
Use Patient List Select this check box to search the patient list for this patient ID. Ifyou enable this feature, the following options are available:
Patient ID not on List Choose one of these options for theaction to take if the patient ID is noton the patient list:
Allow testingDefault is to display a message towarn the user and prompt them tocontinue.
Require repeat ID entry to allowtestingSelect this option to require user torepeat patient ID entry in order toproceed with patient testing.
Prohibit testingSelect this option to prohibit patienttesting.
175
i-STAT Alinity — System Operations Manual Art: 746300-01 Rev. I Rev. Date: 05-Nov-2019

Age and Sex
Confirm Patient Displayed onInstrument
Determines the method used to confirm the patient ID. Select one ofthe following:
Confirm The operator confirms the patient ID.
Replicate Year of Birth The operator is prompted to enter thefour digits of the patient’s year ofbirth. The year of birth, from the ADTfeed, is displayed on the instrumentscreen.
Enter Year of Birth The operator is prompted to enter thefour digits of the patient’s year ofbirth.
Mapping Gender to Sex
Gender in list may NOT beequivalent to Sex at Birth: Donot allow mapping
Select this option if the Gender contained in the patient list is notequivalent to the patient's sex at birth. This is the default option.
Gender in list is equivalent toSex at Birth: Allow mapping
Select this option if the Gender contained in the patient list isequivalent to the patient's sex at birth. When this option is selected,if Gender is available from the patient list, patient gender will beused for items that require patient sex (reference ranges, actionranges, eGFR) and the operator will not be prompted to enter patientsex.
When finished, choose from the options shown at the bottom of the screen:• Previous to go back to the previous screen• Discard to undo changes• Finish Later to create a draft• Next to open the next tab
SummaryThe Summary is a collapsed view of the settings that can be expanded to provide a complete display. TheSummary should be reviewed prior to Publish. Once the settings are confirmed, click on the Publishbutton to finalize them. A Category can be added to a Profile only when the publish status is completed.
When finished, choose from the options shown at the bottom of the screen:• Previous to go back to the previous screen• Discard to undo changes• Finish Later to create a draft• Publish to make settings available to use in a Profile
176
i-STAT Alinity — System Operations Manual Art: 746300-01 Rev. I Rev. Date: 05-Nov-2019

*Analyte Settings CategoryThis section contains features to customize the analyte settings for the i‑STAT Alinity, such as units,reference and action ranges. The Analyte Settings category can be created or modified with the followingsteps.
Click Analyte Settings, then select APOCAnalyteSettings and click View. The screen displays thedefault name APOCAnalyteSettings, and default values for each feature. Scan through theAPOCAnalyteSettings and determine if the selections work for the profile being assembled. If theydo then no additional work is needed in this category. The APOCAnalyteSettings category will beavailable in the Manage Profiles section. Use it to assemble the new profile. If theAPOCAnalyteSettings do not work for the profile being assembled, click Finish to stop viewing.Click Create and follow the instructions below.
Note: All required categories have a default setting named with the APOC prefix. Inaddition, the settings are populated with default values.
You are prompted to specify a name for the settings and an optional description:
Analyte Settings
Name Required. Specify a name that is from 4 to 40 characters long and:• consists only of the following characters:
○ 0 through 9○ A through Z or alphabet appropriate for language (in upper or
lower case)○ blank space○ underscore ( _ )
• does not begin with the characters APOC (in upper or lower case)• is a unique name within this healthcare organization
Description Optional. Provide any information that helps the user know how orwhy the category was named or created.
When finished, choose from the options shown at the bottom of the screen:• Discard to undo changes• Next to open the next tab
177
i-STAT Alinity — System Operations Manual Art: 746300-01 Rev. I Rev. Date: 05-Nov-2019

UnitsSpecify the measurement unit to be used for an analyte. In addition, for some analytes you can select theanalyte name. For example, BUN or Urea. To change a value, click the drop down list and select anoption.
Note: If you change units for an analyte, you may also need to adjust reference ranges,action ranges, and custom reportable ranges for that analyte.
When finished, choose from the options shown at the bottom of the screen:• Previous to go back to the previous screen• Discard to undo changes• Finish Later to create a draft• Next to open the next tab
178
i-STAT Alinity — System Operations Manual Art: 746300-01 Rev. I Rev. Date: 05-Nov-2019

Sample Types
Sample Types
Use Default Sample Types Unselect this check box to use Custom Sample Types. Defaultsample types are:
ArterialVenousCapillaryUnspecified
Custom Sample Types Define a name for each custom sample type. Specify a name up to20 characters long. A maximum of 6 sample types can be defined. Inthe drop down box next to the name, select the sample type: other,arterial, venous, or capillary. The default sample type that is selectedfrom the drop down box will provide the graphics help displays onthe instrument while the operator is using the patient testingpathway.
Sample Type Entry Options Determine whether the operator is prompted to enter the type ofsample used.
Enable Unselect the check box if you do not want toprompt the operator for the sample type.
OptionalUser is prompted to enter optional sample type.
Mandatory with overrideUser is prompted to enter mandatory sample type.If the override feature is chosen by the operator nofurther action is required and the instrument willadvance to the next screen.
MandatoryUser is required to enter sample type.
When finished, choose from the options shown at the bottom of the screen:• Previous to go back to the previous screen• Discard to undo changes• Finish Later to create a draft• Next to open the next tab
179
i-STAT Alinity — System Operations Manual Art: 746300-01 Rev. I Rev. Date: 05-Nov-2019
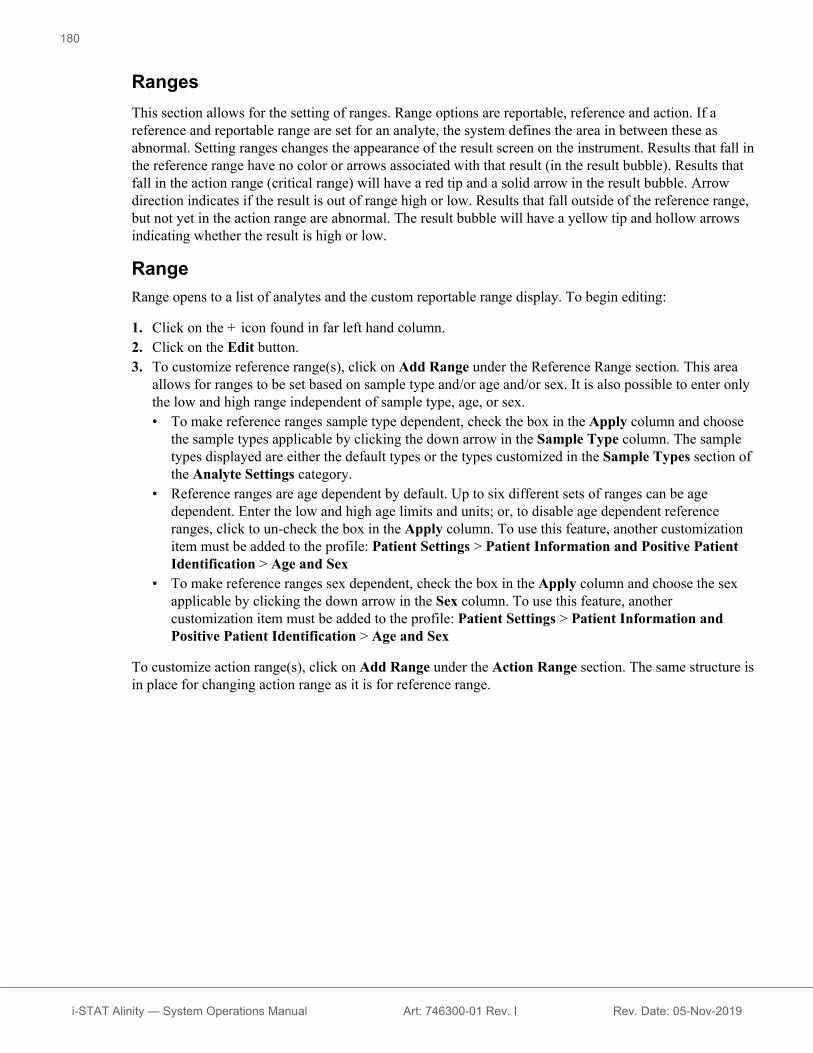
RangesThis section allows for the setting of ranges. Range options are reportable, reference and action. If areference and reportable range are set for an analyte, the system defines the area in between these asabnormal. Setting ranges changes the appearance of the result screen on the instrument. Results that fall inthe reference range have no color or arrows associated with that result (in the result bubble). Results thatfall in the action range (critical range) will have a red tip and a solid arrow in the result bubble. Arrowdirection indicates if the result is out of range high or low. Results that fall outside of the reference range,but not yet in the action range are abnormal. The result bubble will have a yellow tip and hollow arrowsindicating whether the result is high or low.
RangeRange opens to a list of analytes and the custom reportable range display. To begin editing:
1. Click on the + icon found in far left hand column.2. Click on the Edit button.3. To customize reference range(s), click on Add Range under the Reference Range section. This area
allows for ranges to be set based on sample type and/or age and/or sex. It is also possible to enter onlythe low and high range independent of sample type, age, or sex.• To make reference ranges sample type dependent, check the box in the Apply column and choose
the sample types applicable by clicking the down arrow in the Sample Type column. The sampletypes displayed are either the default types or the types customized in the Sample Types section ofthe Analyte Settings category.
• Reference ranges are age dependent by default. Up to six different sets of ranges can be agedependent. Enter the low and high age limits and units; or, to disable age dependent referenceranges, click to un-check the box in the Apply column. To use this feature, another customizationitem must be added to the profile: Patient Settings > Patient Information and Positive PatientIdentification > Age and Sex
• To make reference ranges sex dependent, check the box in the Apply column and choose the sexapplicable by clicking the down arrow in the Sex column. To use this feature, anothercustomization item must be added to the profile: Patient Settings > Patient Information andPositive Patient Identification > Age and Sex
To customize action range(s), click on Add Range under the Action Range section. The same structure isin place for changing action range as it is for reference range.
180
i-STAT Alinity — System Operations Manual Art: 746300-01 Rev. I Rev. Date: 05-Nov-2019

Below is an example of reference, abnormal and action ranges. In this example, the reference range wasset as 4.0-7.5. The low action range was set at 2.0 and the high action range was set at 15.0. Theinstrument calculates the abnormal range. When ranges are set and the profile is loaded onto theinstrument, the result screen will reflect these changes. An example of a result screen displaying rangecustomization can be found in the Quick Reference Guide, Section 6, BEST PRACTICE EXAMPLE.
Note: Never enter reference, action or custom reportable ranges outside of themanufacturers reportable range. Please see section 4 Cartridge and Test Information forthe manufacturers reportable range per analyte.
Custom Reportable RangesRestrict the display range to custom values. For example, healthcare organization managers may wish tolimit the display ranges to values that have been verified using calibration verification materials. Set thelow and high values. Narrowing the reportable range of certain tests may affect the presentation of otherdependent test results. In the table below, if any of the results in the first column are outside the reportablerange, the dependent test results listed in the second column will be suppressed (displayed as <>).
Note: Never enter a null (blank) value for the Custom Reportable range for Low or High.The values can be left as -99999.9 for Low or 99999.9 for High.
181
i-STAT Alinity — System Operations Manual Art: 746300-01 Rev. I Rev. Date: 05-Nov-2019

Table 3–1: Reportable Range Limitations
Test (Outside the Reportable Range) Dependent Suppressed Tests (displayed as <>)
Na K, Cl, BUN, Anion Gap, Hgb, Hct
Hct Cl, Bun, Anion Gap, Hgb
PCO2 TCO2, Anion Gap, Base Excess, HCO3, sO2
pH TCO2, Anion Gap, Base Excess, HCO3, sO2
HCO3 TCO2, Anion Gap, Base Excess, sO2
Cl Anion Gap
K Anion Gap
TCO2 Anion Gap
PO2 sO2
Click Update to save changes to analyte or click Cancel to discard. Repeat this process for all analytesneeded.
When finished selecting all ranges for all desired analytes, choose from the options shown at the bottomof the screen:• Previous to go back to the previous screen• Discard to undo changes• Finish Later to create a draft• Next to open the next tab
182
i-STAT Alinity — System Operations Manual Art: 746300-01 Rev. I Rev. Date: 05-Nov-2019

Enable/Disable AnalyteThis section is used to disable analytes. The system default is all analytes are enabled, except for eGFR.
Apply Globally Analytes can be disabled for all cartridge types. Example, if glucose isdisabled, no cartridge that performs glucose will display a glucose result.
Apply by Panel Analytes can be disabled on select cartridge types except BhCG.Example, glucose is available on CHEM8+ and EC8+. If glucose is notto be reported when an EC8+ is tested, disable the glucose by panel(cartridge type). The glucose would display when the CHEM8+ cartridgeis tested, because it was not disabled on the CHEM8+ cartridge.
When finished, choose from the options shown at the bottom of the screen:• Previous to go back to the previous screen• Discard to undo changes• Finish Later to create a draft• Next to open the next tab
183
i-STAT Alinity — System Operations Manual Art: 746300-01 Rev. I Rev. Date: 05-Nov-2019

HematocritOn this tab, select settings for testing Hematocrit.
Hematocrit Setting (Calibrationby Laboratory HematologyAnalyzer)
Specify the anticoagulant used to calculate hematocrit result. Forbest agreement of i‑STAT Alinity and hematology analyzerhematocrit results, the i‑STAT Alinity customization setting isselected according to the calibration of the comparativehematology analyzer (MH‑K2EDTA or MH‑K3EDTA). Sincemost clinical hematology analyzers are calibrated by themicrohematocrit method using K3EDTA anticoagulant, thei‑STAT Alinity System default customization is K3EDTA.Select either:
K2EDTAK3EDTA
The default is K3EDTA.
Apply CPB Protein Algorithm toHematocrit
The Apply CPB option is intended for use when samples arecollected from patients on cardiopulmonary bypass. The CPBfunction adjusts hematocrit and hemoglobin results for thedilutional effect of pump fluid during cardiopulmonary bypasssurgery. However, the facility may validate its use for otherpatient populations known to have protein levels significantlylower than the normal adult population.
Note: If an instrument customized as “CPB, alwaysapply” is used for patients who are not on the pump, it ispossible that the hematocrit results will be reportedfalsely high. If an instrument customized as “CPB, neverapply” is used for patients who are on the pump or havedecreased levels of protein, the hematocrit results may bereported falsely low.
An instrument that is customized to prompt for CPB requires theoperator to answer Yes or No. Yes indicates that the CPBcorrection should be applied. No indicates that the CPB correctionshould not be applied. Select one of the following:
CPB, PromptPrompts the operator to apply CPB correction when the cartridgehas a hematocrit sensor.
CPB, always applyApply CPB correction every time a cartridge with a hematocritsensor is used.
CPB, never applyDo not apply CPB correction when running a cartridge with ahematocrit sensor.
184
i-STAT Alinity — System Operations Manual Art: 746300-01 Rev. I Rev. Date: 05-Nov-2019

When finished, choose from the options shown at the bottom of the screen:• Previous to go back to the previous screen• Discard to undo changes• Finish Later to create a draft• Next to open the next tab
185
i-STAT Alinity — System Operations Manual Art: 746300-01 Rev. I Rev. Date: 05-Nov-2019

AdjustmentsThe settings for result displays of base excess and eGFR (Estimated Glomerular Filtration Rate) aredetermined in this tab.
BE Equation Base excess of the extracellular fluid or standard base excess is theconcentration of titratable base minus the concentration of titratable acidwhen titrating the average intracellular fluid (plasma plus interstitial fluid)to an arterial plasma pH of 7.40 at PCO2 of 40 mmHg at 37°C. Excessconcentration of base in the average ECF remains virtually constantduring acute changes in the PCO2 and reflects only nonrespiratorycomponent of pH disturbances. Select either option:
Extra Cellular FluidBase Excess of Extracellular Fluid (BEecf)
BEecf = HCO3 – 24.8 + 16.2 (pH – 7.4)This is the default.
BloodBase Excess of Blood (BEb)
BEb = (1 - 0.014*Hb) * [HCO3 - 24.8 + (1.43 * Hb+ 7.7) * (pH - 7.4)]
eGFR Equation MDRD (default)
CKD-EPI 2009
eGFR Variants Select one of these options:
Display both eGFR and Black/African American eGFR
Display only eGFR
Display only Black/African American eGFRNote: Black/African American eGFR displays as eGFR-a on theinstrument screen.
When finished, choose from the options shown at the bottom of the screen:• Previous to go back to the previous screen• Discard to undo changes• Finish Later to create a draft• Next to open the next tab
186
i-STAT Alinity — System Operations Manual Art: 746300-01 Rev. I Rev. Date: 05-Nov-2019

ACT (Activated Clotting Time)This screen allows you to customize the setting for ACT testing with Kaolin activator. You can selectbetween the current 37° (Pre-warm) result calibration and an ambient temperature (Non-warm) resultcalibration.
Options on the screen are:
ACTk Mode For ACT-K (Kaolin ACT) cartridges, select either:
Pre-warm37°C result calibrationapplies to patient test pathway onlypre-warm is the default
Non-warmambient temperature result calibration
Stop ACT Test Determines whether an operator can stop an ACT test while it isbeing performed. Select the check box to enable stopping a test.This is the default. Unselect the check box to prevent anoperator from stopping a test.
When finished, choose from the options shown at the bottom of the screen:• Previous to go back to the previous screen• Discard to undo changes• Finish Later to create a draft• Next to open the next tab
187
i-STAT Alinity — System Operations Manual Art: 746300-01 Rev. I Rev. Date: 05-Nov-2019

Critical TestsCritical tests can be selected by the customer.
When finished, choose from the options shown at the bottom of the screen:• Previous to go back to the previous screen• Discard to undo changes• Finish Later to create a draft• Next to open the next tab
SummaryThe Summary is a collapsed view of the settings that can be expanded to provide a complete display. TheSummary should be reviewed prior to Publish. Once the settings are confirmed, click on the Publishbutton to finalize them. A Category can be added to a Profile only when the publish status is completed.
When finished, choose from the options shown at the bottom of the screen:• Previous to go back to the previous screen• Discard to undo changes• Finish Later to create a draft• Publish to make settings available to use in a Profile
188
i-STAT Alinity — System Operations Manual Art: 746300-01 Rev. I Rev. Date: 05-Nov-2019
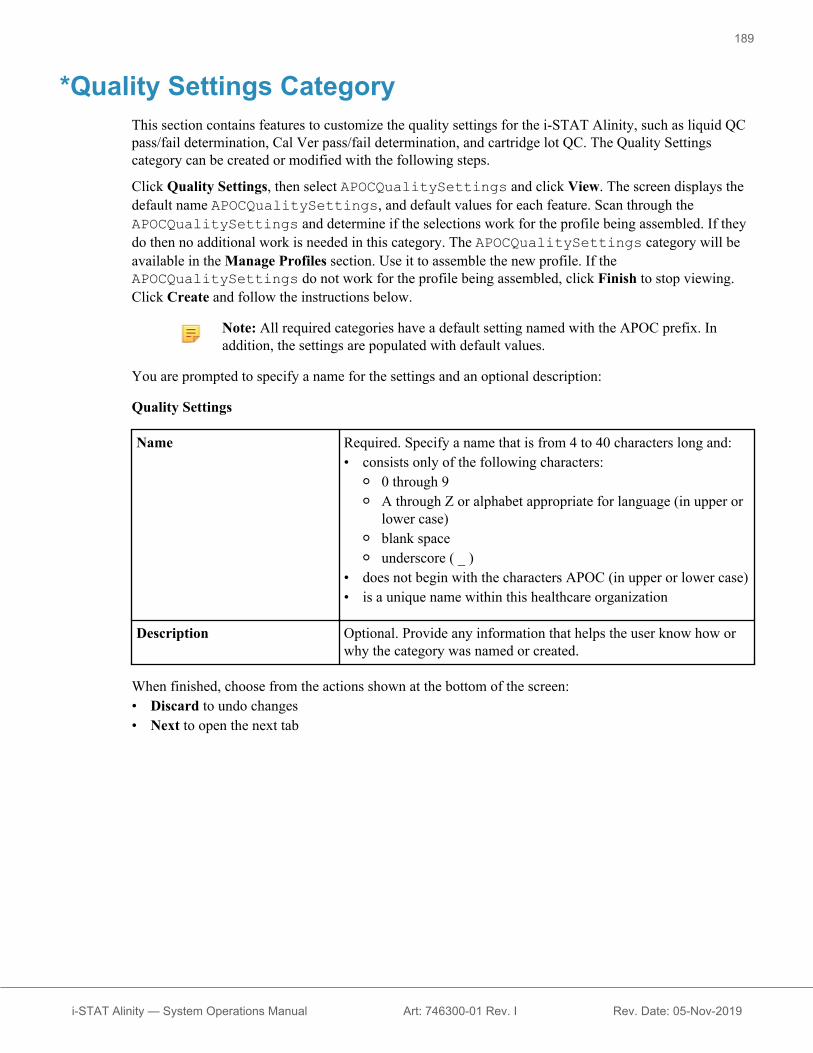
*Quality Settings CategoryThis section contains features to customize the quality settings for the i‑STAT Alinity, such as liquid QCpass/fail determination, Cal Ver pass/fail determination, and cartridge lot QC. The Quality Settingscategory can be created or modified with the following steps.
Click Quality Settings, then select APOCQualitySettings and click View. The screen displays thedefault name APOCQualitySettings, and default values for each feature. Scan through theAPOCQualitySettings and determine if the selections work for the profile being assembled. If theydo then no additional work is needed in this category. The APOCQualitySettings category will beavailable in the Manage Profiles section. Use it to assemble the new profile. If theAPOCQualitySettings do not work for the profile being assembled, click Finish to stop viewing.Click Create and follow the instructions below.
Note: All required categories have a default setting named with the APOC prefix. Inaddition, the settings are populated with default values.
You are prompted to specify a name for the settings and an optional description:
Quality Settings
Name Required. Specify a name that is from 4 to 40 characters long and:• consists only of the following characters:
○ 0 through 9○ A through Z or alphabet appropriate for language (in upper or
lower case)○ blank space○ underscore ( _ )
• does not begin with the characters APOC (in upper or lower case)• is a unique name within this healthcare organization
Description Optional. Provide any information that helps the user know how orwhy the category was named or created.
When finished, choose from the actions shown at the bottom of the screen:• Discard to undo changes• Next to open the next tab
189
i-STAT Alinity — System Operations Manual Art: 746300-01 Rev. I Rev. Date: 05-Nov-2019

Electronic SimulatorTesting for the external Electronic Simulator can be scheduled to be performed based on an interval of anumber of days. This setting is usually determined by compliance with regulatory agencies.
Note: Internal Electronic Simulator testing is performed every time a cartridge is tested onthe i‑STAT Alinity.
Simulator Testing Schedule
Run Electronic Simulatorevery n days
Determines how frequently the external electronic simulator istested. Specify a number of days in the range 0 - 365. The default is0, which turns off testing.
Note: Abbott Point of Care manufacturer's requirement isfor the electronic simulator to be tested every 6 months(182 days).
When finished, choose from the options shown at the bottom of the screen:• Previous to go back to the previous screen• Discard to undo changes• Finish Later to create a draft• Next to open the next tab
190
i-STAT Alinity — System Operations Manual Art: 746300-01 Rev. I Rev. Date: 05-Nov-2019
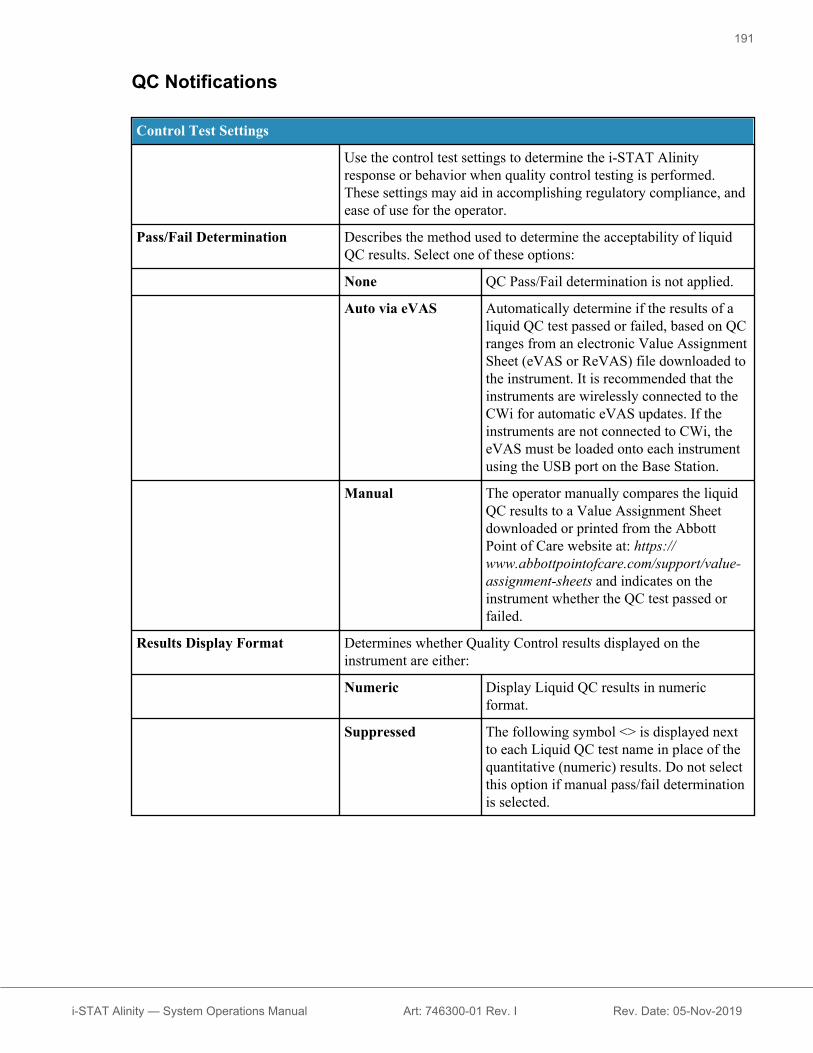
QC Notifications
Control Test Settings
Use the control test settings to determine the i‑STAT Alinityresponse or behavior when quality control testing is performed.These settings may aid in accomplishing regulatory compliance, andease of use for the operator.
Pass/Fail Determination Describes the method used to determine the acceptability of liquidQC results. Select one of these options:
None QC Pass/Fail determination is not applied.
Auto via eVAS Automatically determine if the results of aliquid QC test passed or failed, based on QCranges from an electronic Value AssignmentSheet (eVAS or ReVAS) file downloaded tothe instrument. It is recommended that theinstruments are wirelessly connected to theCWi for automatic eVAS updates. If theinstruments are not connected to CWi, theeVAS must be loaded onto each instrumentusing the USB port on the Base Station.
Manual The operator manually compares the liquidQC results to a Value Assignment Sheetdownloaded or printed from the AbbottPoint of Care website at: https://www.abbottpointofcare.com/support/value-assignment-sheets and indicates on theinstrument whether the QC test passed orfailed.
Results Display Format Determines whether Quality Control results displayed on theinstrument are either:
Numeric Display Liquid QC results in numericformat.
Suppressed The following symbol <> is displayed nextto each Liquid QC test name in place of thequantitative (numeric) results. Do not selectthis option if manual pass/fail determinationis selected.
191
i-STAT Alinity — System Operations Manual Art: 746300-01 Rev. I Rev. Date: 05-Nov-2019

Fluid Settings
Only allow APOC fluids Unselect the check box if non-APOC control fluids are used.
Cartridge Help
Display Insert Cartridge Help Graphics displayed on the instrument screen after all required fieldsare complete but before the cartridge is inserted. The cartridge helpscreens include the 'collect and mix sample' and 'fill cartridge'graphics.
Control Test Out of Range Settings (Manual Pass/Fail Determination Only)
These settings determine the operator action when Liquid QualityControl results are outside of the acceptable range and Pass/FailDetermination is set to Manual.
Comments
Comment Code Enable Select this check box to prompt the operator to enter acomment code when results are out of range. Choose one ofthe following options:
OptionalPrompt the operator for an optional entry.
MandatoryPrompt the operator for a mandatory entry. Cartridge testingcannot continue until information is entered.
Comment Style Determines how comments are displayed on the instrument when a LiquidQuality Control result is out of acceptable range. Choose either of these options:
Comment List Comments must be chosen from a selection list. See belowfor creating comments that will display.
Comment Listwith Text Box
Operator will be prompted to choose a comment or to type acomment into the text box provided. It is a one or the otherselection by the operator. A maximum of 6 comments can bedisplayed with a text box.
Comments A list of comments created by the CWi user. Operator selects the mostappropriate. The comment will be attached to the test record. Each comment canbe 20 characters in length including spaces.
192
i-STAT Alinity — System Operations Manual Art: 746300-01 Rev. I Rev. Date: 05-Nov-2019

Cal Ver Test SettingsCalibration Verification (Cal Ver) test settings can assist the operator and support compliance withregulatory agencies.
Cal Ver Test Settings
Pass/Fail Determination Describes the method used to determine the acceptability of Cal Verresults. Select one of these options:
None Cal Ver Pass/Fail determination is not applied.
Auto via eVAS Automatically determine if the results of a CalVer test passed or failed, based on Cal Verranges from an electronic Value AssignmentSheet (eVAS or ReVAS) file downloaded tothe instrument. It is recommended that theinstruments are wirelessly connected to theCWi for automatic eVAS updates. If theinstruments are not connected to CWi, theeVAS must be loaded onto each instrumentusing the USB port on the Base Station.
Manual The operator manually compares the Cal Verresults to a Value Assignment Sheetdownloaded or printed from the Abbott Pointof Care website at: https://www.abbottpointofcare.com/support/value-assignment-sheets and indicates on theinstrument whether the Cal Ver test passed orfailed.
Results Display Format Determines whether the Cal Ver results displayed on the instrumentare either:
Numeric Cal Ver results are displayed in numericformat.
Suppressed The following symbol <> is displayed next toeach Cal Ver test name in place of thequantitative (numeric) results. Do not selectthis option if manual pass/fail determination isselected.
Fluid Settings
Only Allow APOC fluids Unselect the check box if non-APOC Cal Ver fluids will be used.
Cartridge Help
Display Insert Cartridge Help Graphics displayed on the instrument screen after all required fieldsare complete but before the cartridge is inserted. The cartridge helpscreens include the 'collect and mix sample' and 'fill cartridge'graphics.
193
i-STAT Alinity — System Operations Manual Art: 746300-01 Rev. I Rev. Date: 05-Nov-2019
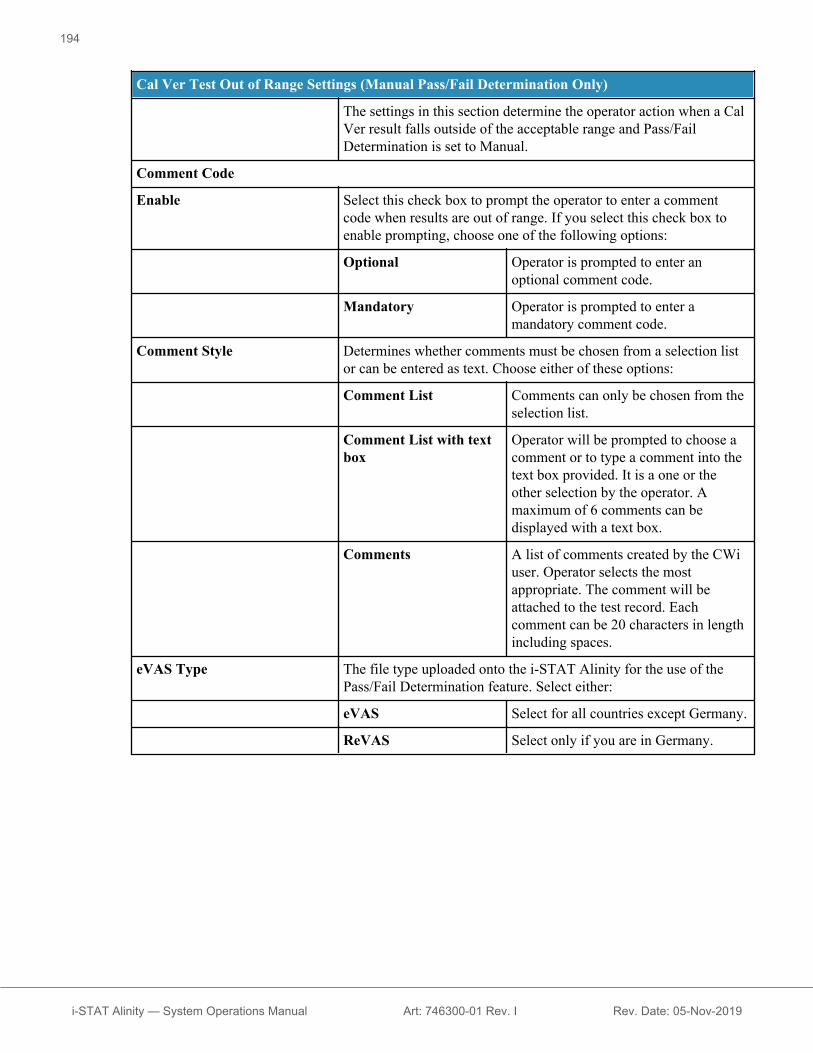
Cal Ver Test Out of Range Settings (Manual Pass/Fail Determination Only)
The settings in this section determine the operator action when a CalVer result falls outside of the acceptable range and Pass/FailDetermination is set to Manual.
Comment Code
Enable Select this check box to prompt the operator to enter a commentcode when results are out of range. If you select this check box toenable prompting, choose one of the following options:
Optional Operator is prompted to enter anoptional comment code.
Mandatory Operator is prompted to enter amandatory comment code.
Comment Style Determines whether comments must be chosen from a selection listor can be entered as text. Choose either of these options:
Comment List Comments can only be chosen from theselection list.
Comment List with textbox
Operator will be prompted to choose acomment or to type a comment into thetext box provided. It is a one or theother selection by the operator. Amaximum of 6 comments can bedisplayed with a text box.
Comments A list of comments created by the CWiuser. Operator selects the mostappropriate. The comment will beattached to the test record. Eachcomment can be 20 characters in lengthincluding spaces.
eVAS Type The file type uploaded onto the i‑STAT Alinity for the use of thePass/Fail Determination feature. Select either:
eVAS Select for all countries except Germany.
ReVAS Select only if you are in Germany.
194
i-STAT Alinity — System Operations Manual Art: 746300-01 Rev. I Rev. Date: 05-Nov-2019

Cartridge Lot QC Settings
User-defined cartridge QC settings to aid in compliance withregulatory agency requirements or recommendations. Do not selectthe options below if the data management system in use does notsupport cartridge lot QC. The data management system must be ableto accept cartridge lot numbers and change the status so thatcartridges are available for use.
Search Cartridge List for Cartridge Lot Number
Enable Select this check box to search for the lot number in a list ofcartridges in use or ready for use.
Lot Number not on List --QC Tests
Determine the action to be taken if thelot number is not on the list:
WarnDisplay a warning to the operator andallow the test to be run in the QC testpathway only. Patient and proficiencytesting is disabled until the cartridgelot number is available in thecartridge list.
LockoutDo not allow the test to be run untilthe lot number has been added to thelist of cartridges.
Cartridge QC Warning Screen
Enable Cartridge QC WarningScreen
Select this check box to display a warning screen on the instrumentwhen the i‑STAT cartridge QC is due. If you select this feature, thefollowing option is available:
Show warning n days inadvance
Specify the number of days inadvance of the QC deadline when thewarning message will be displayed.Allowable values range from 1through 365. The default is 1.
When finished, choose from the options shown at the bottom of the screen:• Previous to go back to the previous screen• Discard to undo changes• Finish Later to create a draft• Next to open the next tab
195
i-STAT Alinity — System Operations Manual Art: 746300-01 Rev. I Rev. Date: 05-Nov-2019

Liquid QC (Quality Control) SchedulesThis feature is used to define a liquid quality control (QC) plan for the i‑STAT Alinity instruments. Acustomized QC testing schedule can include: the cartridge types and liquid QC fluids to be used, thecartridge types that are enabled by running the liquid QC, and the schedule for performing liquid QC. Upto 3 liquid quality control schedules can be defined. The options for liquid QC schedules are shown hereonce, since the options are identical for all three.
Note: Not all products are available in all regions. Check with your local representativefor availability in specific markets.
Frequency Select one of the following:
Off This is the default.
Daily Run liquid QC every day.
Every___________ Blank is filled in with a day of the week selectionfrom the drop down list.
Every_____ ______ ofeach month
The first blank is filled in with first, second, thirdor fourth chosen from drop down list. The secondblank is filled in with day of the week chosen fromthe drop down list. Example - Every 2nd Thursdayof the month.
Every n days startingon mmddyy
Schedule liquid QC to run according to a timeinterval and a start date. The time interval is anumber of days in the range 28 to 90. Select thestart date from the pop-up calendar.
Time This option is enabled only when a value other thanOff has been specified for Frequency.
Testing due atHH:mm
Time of day when liquid QC testing is due to bedone. Specify a value for hours and minutes in therange 00:00 to 23:59. Default is 00:00 (midnight).
Grace period Additional amount of time allowed before and aftertesting due time to perform liquid QC testing iftesting is not done at the scheduled time. After thisamount of time elapses, patient testing is disabled.Grace period also determines when the alertmessage for scheduled QC will display on theinstrument.
n hoursNumber of hours. 8 hours is default. Range is 0 to255.
Apply Schedule to Select which months to perform testing. Any or allmonths of the year can be selected.
Cartridge QC Profile If Frequency is specified, define at least oneCartridge QC Profile.
196
i-STAT Alinity — System Operations Manual Art: 746300-01 Rev. I Rev. Date: 05-Nov-2019

Add QC Profile Click Add QC Profile. This panel displays:
QC Cartridge Click the arrow to display a drop down list of cartridges. From the list, selectthe cartridge for this profile. This is the parent cartridge.
Dependent Cartridges When more than one type of cartridge can test for the same analyte,one cartridge can be the dependent of the other. When testing isperformed, the result for an analyte common to both cartridges thenapplies to both the cartridge that was tested as well as its dependent.For example, a CHEM8+ cartridge tests for sodium. An E3+ cartridgealso tests for sodium. If CHEM8+ is selected from the drop down listtitled "QC Cartridge", then an E3+ cartridge can be selected as itsdependent. The CHEM8+ is the parent and the E3+ is the dependent.When QC testing is done for the CHEM8+ cartridge and the result is a'pass' for sodium, then the E3+ cartridge is also considered as havingpassed the test for sodium.
Option to select one or more cartridges as dependents. Choose adependent by selecting the check box next to the cartridge name.
Note: All analytes used within the facility should be includedin liquid QC and Cal Ver testing schedules.
Note: A QC cartridge that is selected as a parent cartridge inone Cartridge QC Profile cannot be a dependent cartridge inanother Cartridge QC Profile within the same schedule. It canbe a dependent cartridge in a Cartridge QC Profile belongingto a different schedule.
197
i-STAT Alinity — System Operations Manual Art: 746300-01 Rev. I Rev. Date: 05-Nov-2019

Cartridges and Analytes
QC Fluids Select up to 6 different fluids in 1 QC schedule. Selections must notbe duplicated.
Note: Only APOC controls will work with Auto Pass/FailDetermination with eVAS. After fluids have been selected,click Update QC Profile.
When finished, choose from the options shown at the bottom of the screen:• Previous to go back to the previous screen• Discard to undo changes• Finish Later to create a draft• Next to open the next tab
198
i-STAT Alinity — System Operations Manual Art: 746300-01 Rev. I Rev. Date: 05-Nov-2019

Cal Ver SchedulesThis feature is used to define a Cal Ver testing schedule for the i‑STAT Alinity instruments. Acustomized Cal Ver testing schedule can include: the cartridge types and Cal Ver fluids to be used, thecartridge types that are enabled by running the Cal Ver fluids, and the schedule for performing Cal Vertesting. Up to 3 Cal Ver testing schedules can be defined. The options for schedules are shown here once,since the options are identical for all three.
Note: Not all products are available in all regions. Check with your local representativefor availability in specific markets.
Frequency Select one of the following:
Off This is the default.
Every_____ ______ ofeach month
The first blank is filled in with first, second, thirdor fourth chosen from drop down list. The secondblank is filled in with day of the week chosen fromthe drop down list. Example - Every 2nd Thursdayof the month.
Time This option is enabled only when a value other thanOff has been specified for Frequency.
Testing due atHH:mm
Time of day when Cal Ver is due to be done.Specify a value for hours and minutes in the range00:00 to 23:59. Default is 00:00 (midnight).
Grace period Additional amount of time allowed before and aftertesting due time to perform Cal Ver testing iftesting is not done at the scheduled time. After thisamount of time elapses, patient testing is disabled.Grace period also determines when the alertmessage for scheduled Cal Ver will display on theinstrument.
n hoursNumber of hours. 8 hours is default. Range is 0 to255.
Apply Schedule to Select which months to perform testing. Any or allmonths of the year can be selected.
Cartridge QC Profile If Frequency is specified, define at least oneCartridge QC Profile.
Add QC Profile Click Add QC Profile. This panel displays:
199
i-STAT Alinity — System Operations Manual Art: 746300-01 Rev. I Rev. Date: 05-Nov-2019

QC Cartridge Click the arrow to display a drop down list of cartridges. From the list, selectthe cartridge for this profile. This is the parent cartridge.
Dependent Cartridges When more than one type of cartridge can test for the same analyte,one cartridge can be the dependent of the other. When testing isperformed, the result for an analyte common to both cartridges thenapplies to both the cartridge that was tested as well as its dependent.For example, a CHEM8+ cartridge tests for sodium. An E3+ cartridgealso tests for sodium. If CHEM8+ is selected from the drop down listtitled "QC Cartridge", then an E3+ cartridge can be selected as itsdependent. The CHEM8+ is the parent and the E3+ is the dependent.When QC testing is done for the CHEM8+ cartridge and the result is a'pass' for sodium, then the E3+ cartridge is also considered as havingpassed the test for sodium.
Option to select one or more cartridges as dependents. Choose adependent by selecting the check box next to the cartridge name.
Note: All analytes used within the facility should be includedin liquid QC and Cal Ver testing schedules.
Note: A QC cartridge that is selected as a parent cartridge inone Cartridge QC Profile cannot be a dependent cartridge inanother Cartridge QC Profile within the same schedule. It canbe a dependent cartridge in a Cartridge QC Profile belongingto a different schedule.
QC Fluids Select up to 6 different fluids in 1 QC schedule. Selections must notbe duplicated. After fluids have been selected, click Update QCProfile.
200
i-STAT Alinity — System Operations Manual Art: 746300-01 Rev. I Rev. Date: 05-Nov-2019

When finished, choose from the options shown at the bottom of the screen:• Previous to go back to the previous screen• Discard to undo changes• Finish Later to create a draft• Next to open the next tab
SummaryThe Summary is a collapsed view of the settings that can be expanded to provide a complete display. TheSummary should be reviewed prior to Publish. Once the settings are confirmed, click on the Publishbutton to finalize them. A Category can be added to a Profile only when the publish status is completed.
When finished, choose from the options shown at the bottom of the screen:• Previous to go back to the previous screen• Discard to undo changes• Finish Later to create a draft• Publish to make settings available to use in a Profile
201
i-STAT Alinity — System Operations Manual Art: 746300-01 Rev. I Rev. Date: 05-Nov-2019

User Defined Message CategoryThis category enables creation of a user-defined message that will display on the i‑STAT Alinityinstrument prior to cartridge insertion in testing pathways. This category is optional.
To create new user-defined messages, click on Create. The screen displays the default nameTemporaryName. Change the name, using the specifications shown below:User Defined Message
Name Required. Specify a name that is from 4 to 40 characters long and:• consists only of the following characters:
○ 0 through 9○ A through Z or alphabet appropriate for language (in upper or
lower case)○ blank space○ underscore ( _ )
• does not begin with the characters APOC (in upper or lower case)• is a unique name within this healthcare organization
Description Optional. Provide any information that helps the user know how orwhy the category was named or created.
When finished, choose from the options shown at the bottom of the screen:• Discard to undo changes• Next to open the next tab
User Defined Message The screen for entry of the user-defined message content displays. Amaximum of 40 characters per line, and a maximum of 10 lines canbe specified.
After entering the user-defined message, choose from the options shown at the bottom of the screen:• Previous to go back to the screen displayed previous to this screen• Discard to undo changes• Finish Later to create a draft• Next to open the next tab
202
i-STAT Alinity — System Operations Manual Art: 746300-01 Rev. I Rev. Date: 05-Nov-2019

SummaryThe Summary is a collapsed view of the settings that can be expanded to provide a complete display. TheSummary should be reviewed prior to Publish. Once the settings are confirmed, click on the Publishbutton to finalize them. A Category can be added to a Profile only when the publish status is completed.
When finished, choose from the options shown at the bottom of the screen:• Previous to go back to the previous screen• Discard to undo changes• Finish Later to create a draft• Publish to make settings available to use in a Profile
Training Settings CategoryIn the Training Settings Category you can create user-defined training scenarios, to provide a consistentlearning experience for all operators. Every operator will view the same patient information and results,created in the training scenarios. This will provide standardized training material for the individualoverseeing point of care testing.
To create new category settings, click on Create. The screen displays the default name, TemporaryName.Change the name, using the specifications shown below:
Training Settings
Name Required. Specify a name that is from 4 to 40 characters long and:• consists only of the following characters:
○ 0 through 9○ A through Z or alphabet appropriate for language (in upper or
lower case)○ blank space○ underscore ( _ )
• does not begin with the characters APOC (in upper or lower case)• is a unique name within this healthcare organization
Description Optional. Provide any information that helps the user know how orwhy the category was named or created.
When finished, choose from the options shown at the bottom of the screen:• Discard to undo changes• Next to open the next tab
203
i-STAT Alinity — System Operations Manual Art: 746300-01 Rev. I Rev. Date: 05-Nov-2019

Basic FunctionsOptions on this tab control access to training mode and provide a workspace to create training scenarios.
Training Mode
Allow Instrument to EnterTraining Mode
To deny access to the training path, unselect the check box. If accessto the training path is enabled, choose one of these options:
Require permissions This is the default.
No permissions required Select to allow access to thetraining path regardless ofpermissions.
Training Pathway Cartridges
Allow Expired Cartridges inTraining Pathway
Select this check box to allow expired cartridges to be used in thetraining path.
Operator Direct Observation Checklist
Edit Observation Checklist Select this option to create a checklist of items to display on thei‑STAT Alinity instrument. Observation checklist is intended to beused as a location on the instrument where a super user (trainer) andan operator can see a comprehensive list of the skills needed toremain competent. The super user (trainer) observes the operatorperforming the skills and communicates to the POCC (administrator)that the operator successfully completed the list.A text box displays and up to 40 characters can be entered. To save,click Add Observation. This will display another text box for anadditional item. When all items have been entered, specify anidentifier for the revision in the Checklist Revision text box.
Update Observation Checklist Select this option after all the checklist items have been created and aChecklist Revision value was supplied. The checklist items andchecklist revision information will display.
Training Scenarios
Add Training Scenario Select this option to open a workspace to create training scenarios.Be aware of the following:• For the patient information to be displayed on the i‑STAT Alinity
instrument, the PPID feature in Patient Settings must be enabled.• For analyte values to display as critical, abnormal, or normal
values, reference and action ranges in Analyte Settings arerequired.
204
i-STAT Alinity — System Operations Manual Art: 746300-01 Rev. I Rev. Date: 05-Nov-2019
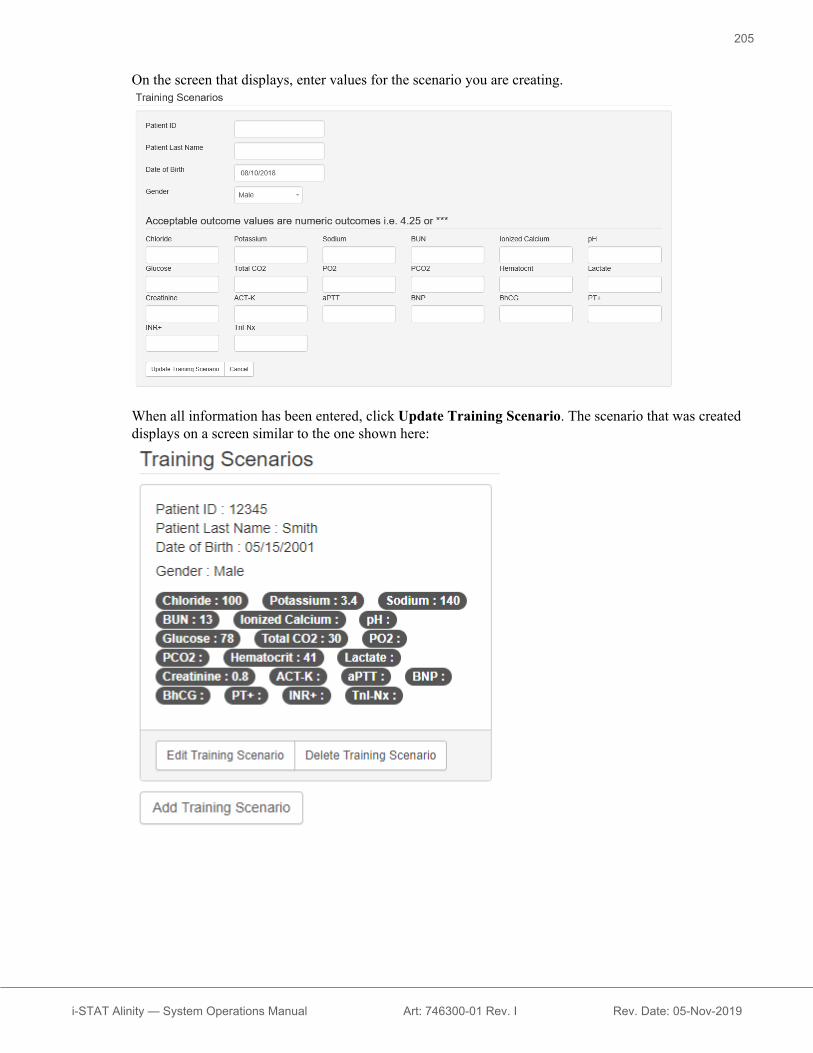
On the screen that displays, enter values for the scenario you are creating.
When all information has been entered, click Update Training Scenario. The scenario that was createddisplays on a screen similar to the one shown here:
205
i-STAT Alinity — System Operations Manual Art: 746300-01 Rev. I Rev. Date: 05-Nov-2019

You can select:• Edit Training Scenario to make changes• Delete Training Scenario to discard• Add Training Scenario to create another scenario
When finished, choose from the options shown at the bottom of the screen:• Previous to go back to the previous screen• Discard to undo changes• Finish Later to create a draft• Next to open the next tab
SummaryThe Summary is a collapsed view of the settings that can be expanded to provide a complete display. TheSummary should be reviewed prior to Publish. Once the settings are confirmed, click on the Publishbutton to finalize them. A Category can be added to a Profile only when the publish status is completed.
When finished, choose from the options shown at the bottom of the screen:• Previous to go back to the previous screen• Discard to undo changes• Finish Later to create a draft• Publish to make settings available to use in a Profile
206
i-STAT Alinity — System Operations Manual Art: 746300-01 Rev. I Rev. Date: 05-Nov-2019
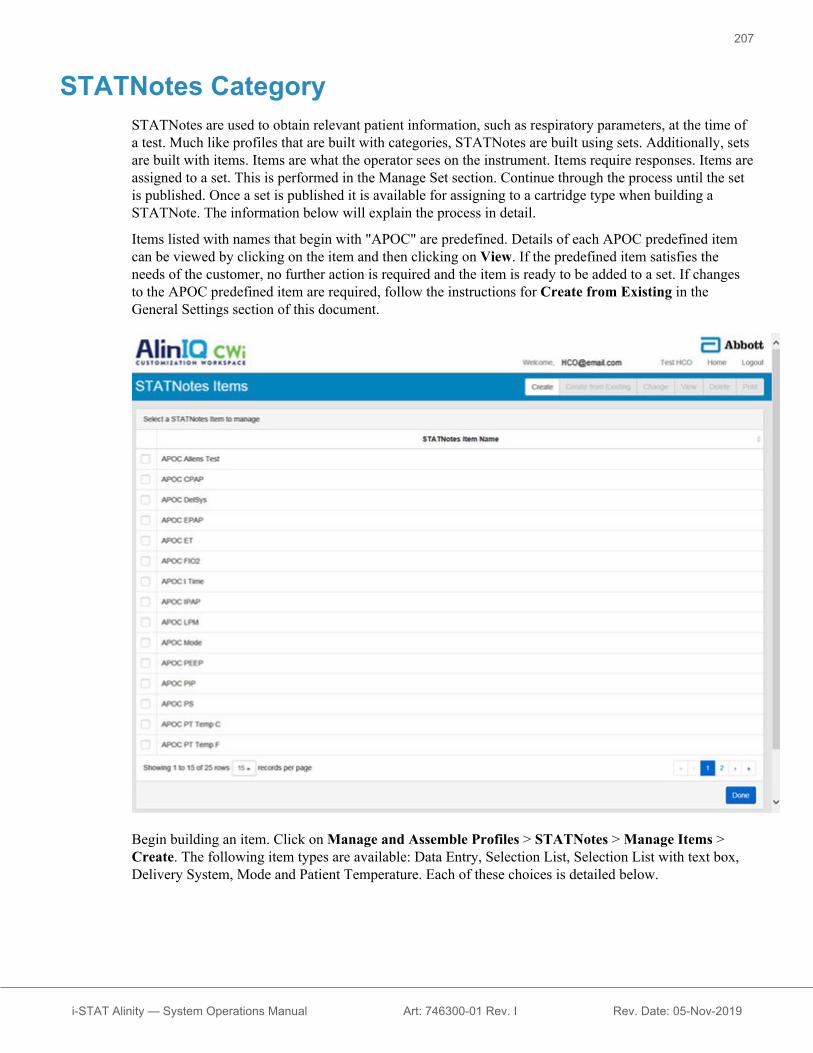
STATNotes CategorySTATNotes are used to obtain relevant patient information, such as respiratory parameters, at the time ofa test. Much like profiles that are built with categories, STATNotes are built using sets. Additionally, setsare built with items. Items are what the operator sees on the instrument. Items require responses. Items areassigned to a set. This is performed in the Manage Set section. Continue through the process until the setis published. Once a set is published it is available for assigning to a cartridge type when building aSTATNote. The information below will explain the process in detail.
Items listed with names that begin with "APOC" are predefined. Details of each APOC predefined itemcan be viewed by clicking on the item and then clicking on View. If the predefined item satisfies theneeds of the customer, no further action is required and the item is ready to be added to a set. If changesto the APOC predefined item are required, follow the instructions for Create from Existing in theGeneral Settings section of this document.
Begin building an item. Click on Manage and Assemble Profiles > STATNotes > Manage Items >Create. The following item types are available: Data Entry, Selection List, Selection List with text box,Delivery System, Mode and Patient Temperature. Each of these choices is detailed below.
207
i-STAT Alinity — System Operations Manual Art: 746300-01 Rev. I Rev. Date: 05-Nov-2019
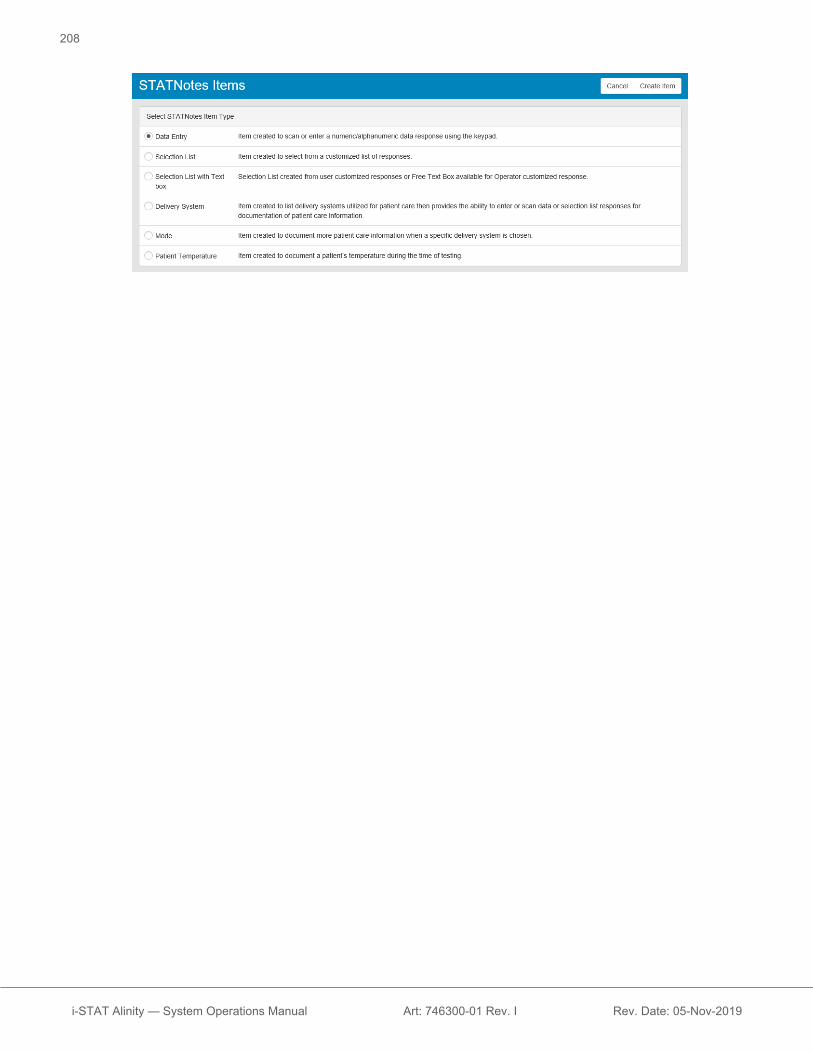
208
i-STAT Alinity — System Operations Manual Art: 746300-01 Rev. I Rev. Date: 05-Nov-2019

Data EntryThis section describes creating a Data Entry item that will prompt the operator to supply information,either using the keypad or by scanning.
209
i-STAT Alinity — System Operations Manual Art: 746300-01 Rev. I Rev. Date: 05-Nov-2019

On this screen, define the following:
Item Name Required. Specify a name that is from 1 to 20 characters long and:• does not begin with the characters APOC (in upper or lower case)• is a unique name within this healthcare organization.
Item Prompt on Analyzer Required. Specify a prompt that is from 1 to 20 characters long and:• does not begin with the characters APOC (in upper or lower case)• is a unique name within this healthcare organization.
Description Optional.
Entry Select one of the following:
Entry, optional Prompt the operator for an optional entry.
Entry, mandatory withoverride
Prompt the operator for a mandatory entry.If the override feature is chosen by theoperator no further action is required andthe instrument will advance to the nextscreen.
Entry, mandatory Prompt the operator for a mandatory entry.Cartridge testing cannot continue untilinformation is entered.
Format Determine the format used to enter data. Select either:
Numeric Only Data will be entered only as numbers.
Alphanumeric Data will be entered as either letters ornumbers.
210
i-STAT Alinity — System Operations Manual Art: 746300-01 Rev. I Rev. Date: 05-Nov-2019

Entry Type Determine how the data will be entered into the i‑STAT Alinity instrument. Selectone of the following:
Allow Scan and Manual Entry Allow barcode scan or manual data entry.
Scan Only Allow barcode scan data entry only.
Manual Entry Only Allow manual data entry only.
Minimum Length Enter the minimum data charactersallowed.
Maximum Length Enter the maximum data charactersallowed.
Scan Mask Barcode scanning setting that allows for the selection of specific character positionsto be retained.• The first position (the position farthest to the left) is numbered position "1".• The scanmask field will accept a text input consisting of numbers 1-9, commas
(','), and hyphens ('-') to identify the scanmask selection.• If, for example, the barcode reads "abcdefghi1234567890" and the selection
pattern is "2,5-8,11-14" then the barcode will be interpreted as "befgh2345". Ifthe selection pattern is "3-4", then the barcode will be "cd".
• Individual position selections that are separated by a comma such as "2,4,7,8,19"cannot be duplicated.
• In each number range, the starting number must be smaller than the endingnumber. For example, "3-5" is a valid range, but "5-3" is not.
• Selection ranges cannot overlap. The end of each number range must be smallerthan the beginning of the next number range. For example, "3-6,7-9" is a validselection, but "3-6,6-9" is not.
• Entering consecutive commas or hyphens is invalid. For example, "2--5","2-5,,7-10", and "2,-5" are all invalid ranges.
Manual Check DigitMethod
If a facility uses a supported check digit algorithm when creating operator orpatient IDs, the i‑STAT Alinity can verify the entered ID format by calculatingthe check digit and comparing it to the entered ID number. If the check digitsdo not match, the ID is rejected.
Note: The i‑STAT Alinity System supports the Mod 10 and Mod 11check digit algorithms described in the HL7 Table 0061 (Check DigitScheme) in the HL7 Specification (Rev 1.4). Contact your LIS/HIS orIT departments to determine if your facility uses check digits in thecreation of operator and/or patient ID numbers, and if so, whichalgorithm is used.
Allowable values are:
No check digit on manualentry
Do not use a check digit when creatingoperator or patient IDs.
211
i-STAT Alinity — System Operations Manual Art: 746300-01 Rev. I Rev. Date: 05-Nov-2019

Mod 11 check digit onmanual entry
Use the Mod 11 algorithm when creatingoperator or patient IDs.
Mod 10 check digit onmanual entry
Use the Mod 10 algorithm when creatingoperator or patient IDs.
Scan Entry CheckDigit Method
Whether to use a check digit when scanning a value to create an operator orpatient ID.
No check digit on scan entry Do not use a check digit when creatingoperator or patient IDs.
Mod 11 check digit on scanentry
Use the Mod 11 algorithm when creatingoperator or patient IDs.
Mod 10 check digit on scanentry
Use the Mod 10 algorithm when creatingoperator or patient IDs.
Barcode Type Select all that apply.
When the specifications for this item are complete, in the lower right corner of the screen:• Click Publish to complete the item so it will appear on the Manage Items list• Click Discard to delete the item
212
i-STAT Alinity — System Operations Manual Art: 746300-01 Rev. I Rev. Date: 05-Nov-2019

Selection ListUse Selection List to create a list of items that the operator can select from.
Item Name Required. Specify a name that is from 1 to 20 characters long and:• does not begin with the characters APOC (in upper or lower case)• is a unique name within this healthcare organization.
Item Prompt on Analyzer Required. Specify a prompt that is from 1 to 20 characters long and:• does not begin with the characters APOC (in upper or lower case)• is a unique name within this healthcare organization.
Description Optional.
Entry Prompt Select one of the following:
Entry, optionalPrompt the operator for an optional entry.
Entry, mandatory with overridePrompt the operator for a mandatory entry. If the override feature ischosen by the operator no further action is required and theinstrument will advance to the next screen.
Entry, mandatoryPrompt the operator for a mandatory entry. Cartridge testing cannotcontinue until information is entered.
Each item for the selection list is defined next.
Click Edit Selection List. A text box displays.
Enter up to 20 characters in the text box. This will be the first item in the selection list. To createadditional items, click Add Item.
Example of selection list item displayed on the i‑STAT Alinity:
The operator is prompted to choose one of the selection list responses.
After all selection list items have been created, click Update Selection List or Cancel.
• Click Publish to complete the item so it will appear on the Manage Items list• Click Discard to delete the item
213
i-STAT Alinity — System Operations Manual Art: 746300-01 Rev. I Rev. Date: 05-Nov-2019

Selection List with Text boxThis is nearly identical to the Selection List item with one important difference. With a Selection Listitem, the operator can choose from a list of items. In a Selection List with text box, the operator canchoose from a list of items or type a customized response into a text box.
Item Name Required. Specify a name that is from 1 to 20 characters long and:• does not begin with the characters APOC (in upper or lower case)• is a unique name within this healthcare organization.
Item Prompt on Analyzer Required. Specify a prompt that is from 1 to 20 characters long and:• does not begin with the characters APOC (in upper or lower case)• is a unique name within this healthcare organization.
Description Optional.
Entry Prompt Select one of the following:
Entry, optionalPrompt the operator for an optional entry.
Entry, mandatory with overridePrompt the operator for a mandatory entry. If the override feature ischosen by the operator no further action is required and theinstrument will advance to the next screen.
Entry, mandatoryPrompt the operator for a mandatory entry. Cartridge testing cannotcontinue until information is entered.
Each item for the selection list is defined next.
Click Edit Selection List. A text box displays.
Enter up to 20 characters in the text box. This will be the first item in the selection list. To createadditional items, click Add Item.
After all selection list items have been created, click Update Selection List or Cancel.
• Click Publish to complete the item so it will appear on the Manage Items list• Click Discard to delete the item
214
i-STAT Alinity — System Operations Manual Art: 746300-01 Rev. I Rev. Date: 05-Nov-2019

ModeUse the Mode item to document more detailed patient care information when a specific delivery system ischosen. "Mode" refers to ventilator modes. There are many different ventilator modes. Each mode hasdifferent settings. Each setting is created as a STATNote item. See the Table below for examples.
Note: All STATNotes items must be available before a Mode item can be created.
Example, the table below shows the various ventilator modes and the corresponding STATNotes items.
Table 3–2: Modes (Examples Only)
Mode STATNotes Items
A/C Set RateVtFIO2PEEPPSHeliox
CMV Set RateVtFIO2PEEPPSHelioxN
CPAP VtPIPFIO2PEEPPSiNOHelioxN
HFOV HZAMPDelta PBias FlowFIO2
215
i-STAT Alinity — System Operations Manual Art: 746300-01 Rev. I Rev. Date: 05-Nov-2019

Mode STATNotes Items
NIV Set RateVtFIO2PEEPPS
In the table above, A/C mode requires 6 STATNotes items. To check whether these STATNotes itemsexist: Click Manage and Assemble Profiles > STATNotes > Manage Items.
The screen displays all existing items.
If all of the STATNotes items needed for mode A/C are included in the list, this means that the A/C Modeitem can be built. It is also important to note, when checking the STATNotes list for an item, the itemmay exist under the "APOC" name. For example, if you are searching the list for the Set Rate item, itmay be listed as APOC set rate.
If any of the STATNotes items do not exist, create them.
When creating a Mode item, the following steps will be completed:
Item Name Required. Specify a name that is from 1 to 20 characters long and:• does not begin with the characters APOC (in upper or lower case)• is a unique name within this healthcare organization.
Item Prompt on Analyzer Required. Specify a prompt that is from 1 to 20 characters long and:• does not begin with the characters APOC (in upper or lower case)• is a unique name within this healthcare organization.
Description Optional.
For this example, do not specify a Description.
Entry Prompt Select one of the following:
Entry, optionalPrompt the operator for an optional entry.
Entry, mandatory with overridePrompt the operator for a mandatory entry. If the override feature ischosen by the operator no further action is required and theinstrument will advance to the next screen.
Entry, mandatoryPrompt the operator for a mandatory entry. Cartridge testing cannotcontinue until information is entered.
216
i-STAT Alinity — System Operations Manual Art: 746300-01 Rev. I Rev. Date: 05-Nov-2019
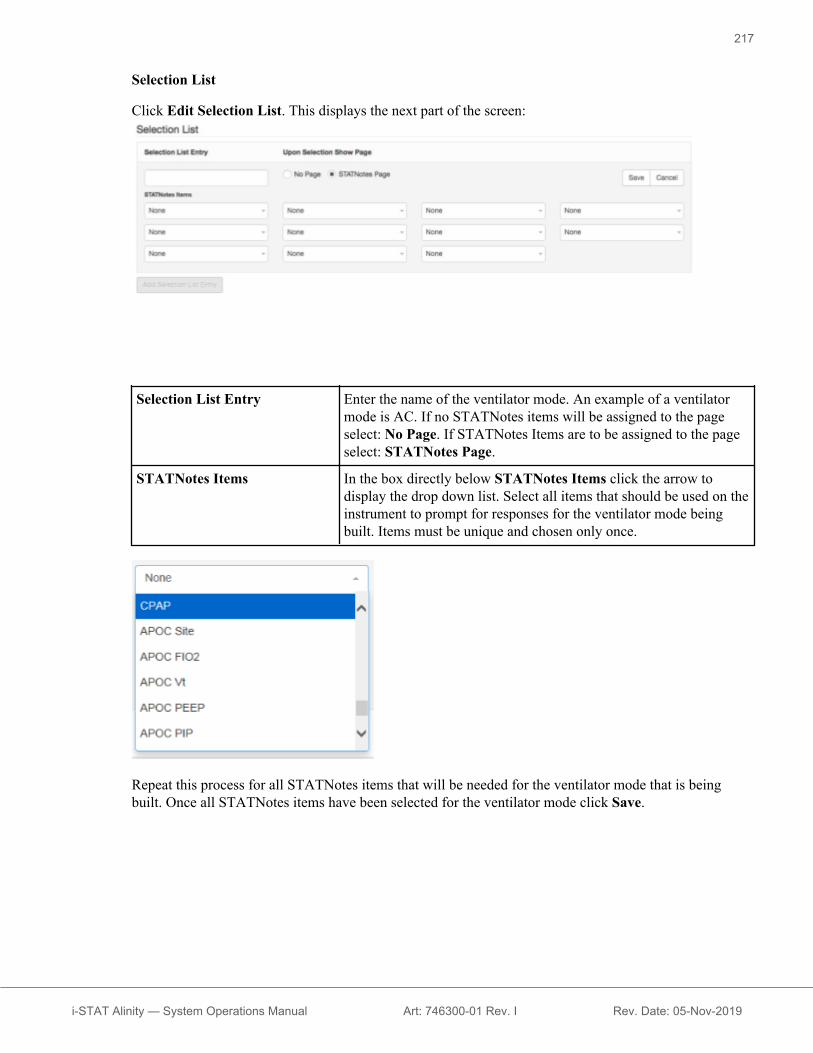
Selection List
Click Edit Selection List. This displays the next part of the screen:
Selection List Entry Enter the name of the ventilator mode. An example of a ventilatormode is AC. If no STATNotes items will be assigned to the pageselect: No Page. If STATNotes Items are to be assigned to the pageselect: STATNotes Page.
STATNotes Items In the box directly below STATNotes Items click the arrow todisplay the drop down list. Select all items that should be used on theinstrument to prompt for responses for the ventilator mode beingbuilt. Items must be unique and chosen only once.
Repeat this process for all STATNotes items that will be needed for the ventilator mode that is beingbuilt. Once all STATNotes items have been selected for the ventilator mode click Save.
217
i-STAT Alinity — System Operations Manual Art: 746300-01 Rev. I Rev. Date: 05-Nov-2019

The screen display will be similar to:
Note: The STATNotes items displayed in the example above may not be the promptdisplayed on the i‑STAT Alinity. Example: APOC PIP will display on the instrument asPIP. Also the STATNotes Item shown as None will not display on the instrument.
Follow the same steps as described above for every mode.
When finished, choose from the options shown at the bottom of the screen:• Click Publish to complete the item so it will appear on the Manage Items list• Click Discard to delete the item
218
i-STAT Alinity — System Operations Manual Art: 746300-01 Rev. I Rev. Date: 05-Nov-2019
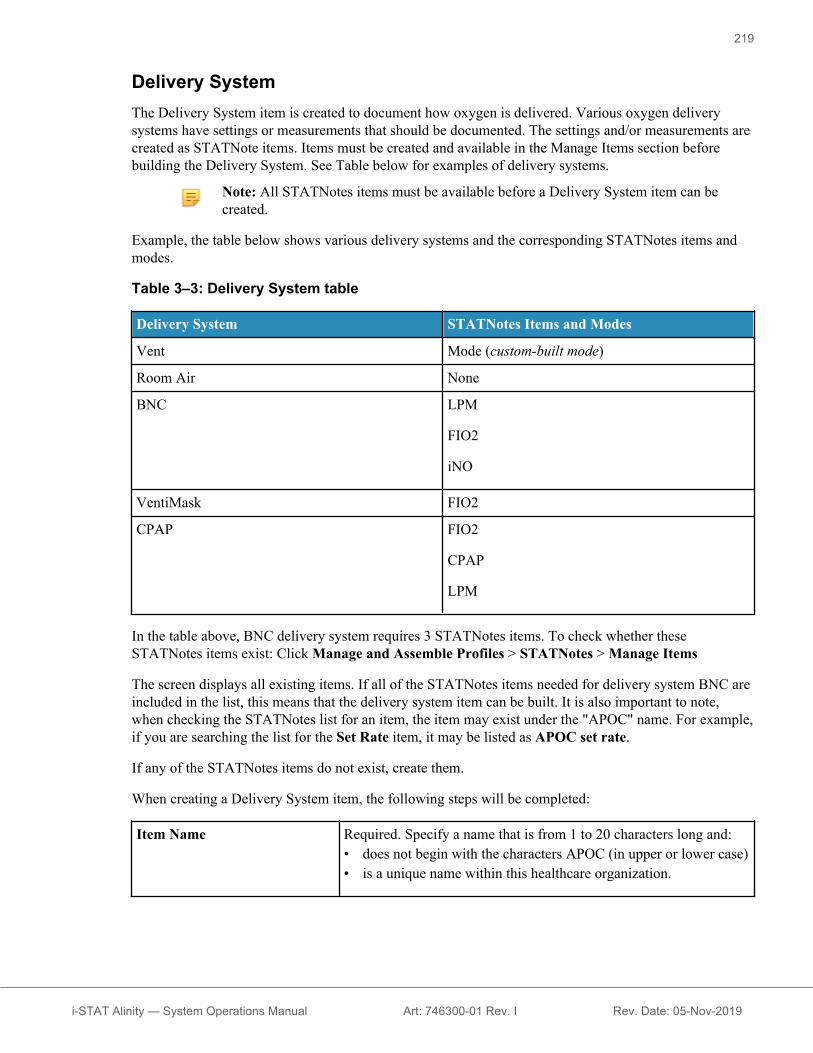
Delivery SystemThe Delivery System item is created to document how oxygen is delivered. Various oxygen deliverysystems have settings or measurements that should be documented. The settings and/or measurements arecreated as STATNote items. Items must be created and available in the Manage Items section beforebuilding the Delivery System. See Table below for examples of delivery systems.
Note: All STATNotes items must be available before a Delivery System item can becreated.
Example, the table below shows various delivery systems and the corresponding STATNotes items andmodes.
Table 3–3: Delivery System table
Delivery System STATNotes Items and Modes
Vent Mode (custom-built mode)
Room Air None
BNC LPM
FIO2
iNO
VentiMask FIO2
CPAP FIO2
CPAP
LPM
In the table above, BNC delivery system requires 3 STATNotes items. To check whether theseSTATNotes items exist: Click Manage and Assemble Profiles > STATNotes > Manage Items
The screen displays all existing items. If all of the STATNotes items needed for delivery system BNC areincluded in the list, this means that the delivery system item can be built. It is also important to note,when checking the STATNotes list for an item, the item may exist under the "APOC" name. For example,if you are searching the list for the Set Rate item, it may be listed as APOC set rate.
If any of the STATNotes items do not exist, create them.
When creating a Delivery System item, the following steps will be completed:
Item Name Required. Specify a name that is from 1 to 20 characters long and:• does not begin with the characters APOC (in upper or lower case)• is a unique name within this healthcare organization.
219
i-STAT Alinity — System Operations Manual Art: 746300-01 Rev. I Rev. Date: 05-Nov-2019

Item Prompt on Analyzer Required. Specify a prompt that is from 1 to 20 characters long and:• does not begin with the characters APOC (in upper or lower case)• is a unique name within this healthcare organization.
Description Optional.
Entry Prompt Select one of the following:
Entry, optionalPrompt the operator for an optional entry.
Entry, mandatory with overridePrompt the operator for a mandatory entry. If the override feature ischosen by the operator no further action is required and theinstrument will advance to the next screen.
Entry, mandatoryPrompt the operator for a mandatory entry. Cartridge testing cannotcontinue until information is entered.
The fields on this screen are:
Selection List A list of oxygen delivery systems identified with a page name. Eachdelivery system will have No Items, Mode or STATNotesPage applied.
Selection List Entry Name of the page for the delivery system. Example: BNC. SelectSTATNotes Items.
No Page The delivery system does not have settings or measurements.Example: Room Air. Once No Page is selected, click Save.
Mode The delivery system has various modes. Example: Ventilator. OnceMode is selected, click Save.
220
i-STAT Alinity — System Operations Manual Art: 746300-01 Rev. I Rev. Date: 05-Nov-2019

STATNotes Page The delivery system has various settings and measurements.Example: BNC, STATNotes items: FIO2, LPM, iNO.
In the box directly below STATNotes Items click the arrow todisplay the drop down list. Select all items that should be promptedfor responses on the instrument for the delivery system being built.
Repeat this process for all STATNotes items that will be needed for the delivery system that is beingbuilt. Once all STATNotes items have been selected for the delivery system click Save.
For all Delivery Systems Pages being built, click Add Selection List Entry, then repeat all steps fromSelection List Entry through STATNotes Page instruction.
Below is an example of a Delivery System with 4 Selection List entries:
Note: The STATNotes Items shown in the examples above may not match the promptdisplayed on the i‑STAT Alinity. Example: APOC FIO2 will display on the instrument asFIO2. Also the STATNotes Items shown as None will not display on the instrument.
When finished, choose from the options shown at the bottom of the screen:• Click Publish to complete the item so it will appear on the Manage Items list• Click Discard to delete the item
221
i-STAT Alinity — System Operations Manual Art: 746300-01 Rev. I Rev. Date: 05-Nov-2019

Patient TemperatureUse this item to prompt the operator to record the patient temperature at the time of testing.
To create a STATNotes Patient Temperature item, enter the following information on the screen:
Item Name Required. Specify a name that is from 1 to 20 characters long and:• does not begin with the characters APOC (in upper or lower case)• is a unique name within this healthcare organization.
Item Prompt on Analyzer Required. Specify a prompt that is from 1 to 20 characters long and:• does not begin with the characters APOC (in upper or lower case)• is a unique name within this healthcare organization.
Description Optional.
Entry Prompt Select one of the following:
Entry, optionalPrompt the operator for an optional entry.
Entry, mandatory with overridePrompt the operator for a mandatory entry. If the override feature ischosen by the operator no further action is required and theinstrument will advance to the next screen.
Entry, mandatoryPrompt the operator for a mandatory entry. Cartridge testing cannotcontinue until information is entered.
Unit The temperature scale used. Select one of these values:
Fahrenheit This is the default.
Celsius
When finished, choose from the options shown at the bottom of the screen:• Click Publish to complete the item so it will appear on the Manage Items list• Click Discard to delete the item
222
i-STAT Alinity — System Operations Manual Art: 746300-01 Rev. I Rev. Date: 05-Nov-2019

Manage SetsA STATNotes set is a collection of STATNotes items. Use Manage Items to display a list of all availableitems. Items must be created and available in the Manage items section before a Manage Set can be built.After verifying that all items exist, a STATNotes set can be created. Once a set is created, it can beapplied to cartridges. When patient testing is performed using a cartridge that has a STATNotes setapplied, the STATNotes items will be displayed on the instrument.
Click on Manage Sets > Create. This screen displays:
On this screen, specify:
STATNotes Set Name Required. Specify a name that is from 1 to 20 characters long and:• does not begin with the characters APOC (in upper or lower case)• is a unique name within this healthcare organization.
Description Optional.
STATNotes Items Select up to 6 items from the drop down boxes to create the set. Donot duplicate.
When finished, choose from the options shown at the bottom of the screen:• Click Publish to create the set• Click Discard to delete the set
After a STATNotes set has been published, click Done.
223
i-STAT Alinity — System Operations Manual Art: 746300-01 Rev. I Rev. Date: 05-Nov-2019
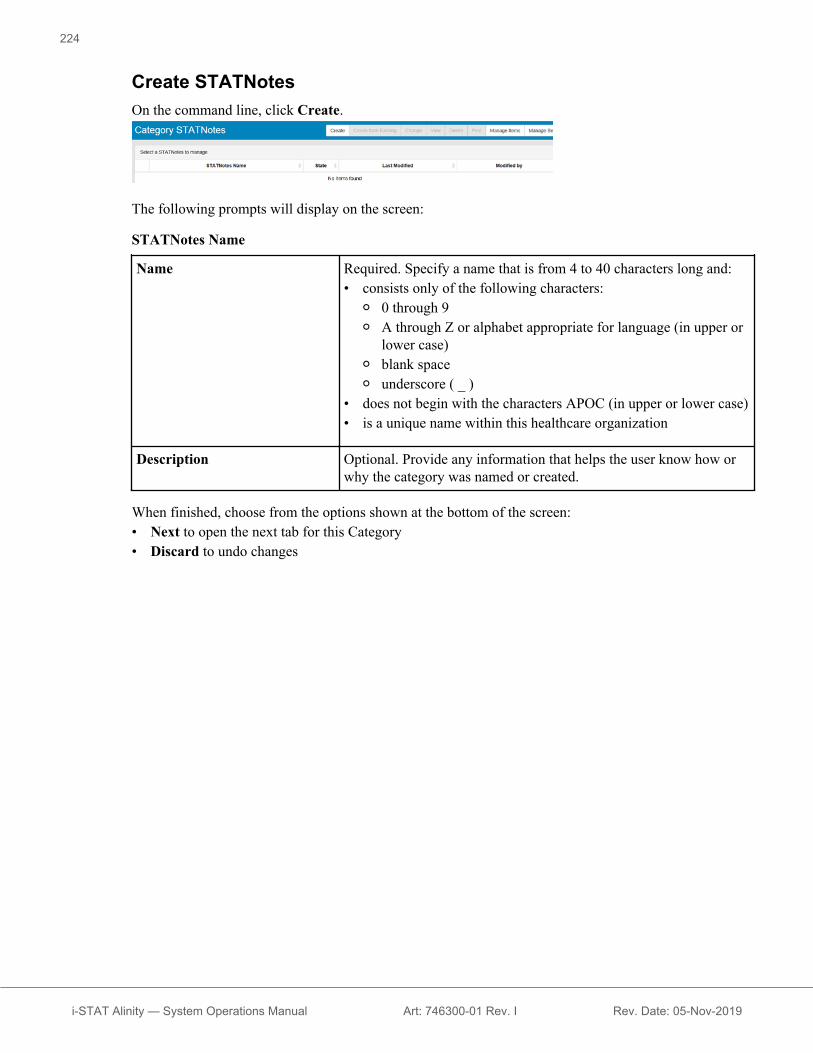
Create STATNotesOn the command line, click Create.
The following prompts will display on the screen:
STATNotes Name
Name Required. Specify a name that is from 4 to 40 characters long and:• consists only of the following characters:
○ 0 through 9○ A through Z or alphabet appropriate for language (in upper or
lower case)○ blank space○ underscore ( _ )
• does not begin with the characters APOC (in upper or lower case)• is a unique name within this healthcare organization
Description Optional. Provide any information that helps the user know how orwhy the category was named or created.
When finished, choose from the options shown at the bottom of the screen:• Next to open the next tab for this Category• Discard to undo changes
224
i-STAT Alinity — System Operations Manual Art: 746300-01 Rev. I Rev. Date: 05-Nov-2019

Applying STATNotes to a CartridgeTo apply STATNotes to a cartridge, click the drop down box next to the cartridge, and highlight the nameof the set.
When you have finished, choose from the options shown at the bottom of the screen:• Previous to go back to the previous screen• Discard to undo changes• Finish Later to create a draft• Next to open the next tab
SummaryThe Summary is a collapsed view of the settings that can be expanded to provide a complete display. TheSummary should be reviewed prior to Publish. Once the settings are confirmed, click on the Publishbutton to finalize them. A Category can be added to a Profile only when the publish status is completed.
When finished, choose from the options shown at the bottom of the screen:• Previous to go back to the previous screen• Discard to undo changes• Finish Later to create a draft• Publish to make settings available to use in a Profile
225
i-STAT Alinity — System Operations Manual Art: 746300-01 Rev. I Rev. Date: 05-Nov-2019
Result Notes CategoryResult Notes are used to prompt the operator for additional information after the display of patient resultsor quality results. Much like profiles that are built with categories, Result Notes are built using sets.Additionally, sets are built with items. Items are what the operator sees on the instrument. Items requireresponses. Items are assigned to a set. This is performed in the Manage Set section.
When building a set, it will be necessary to choose whether the set will display in the Patient pathway orthe Control and Cal Ver pathway. Continue through the process until the set is published. Once a set ispublished it is available for assigning to a cartridge type when building a Result Note. The informationbelow will explain the process in detail.
Begin building an item. Click on Manage and Assemble Profile > Result Notes > Manage Items >Create. The following item types are available: Data Entry, Selection List, Selection List with textbox, Repeat Test, Action Range Comment and QC Auto Fail Comment. Each of these choices isdetailed below.
226
i-STAT Alinity — System Operations Manual Art: 746300-01 Rev. I Rev. Date: 05-Nov-2019

Data EntryThis section describes creating a Data Entry item that will prompt the operator to supply information,either using the keypad or by scanning.
On this screen, define the following:
Item Name Required. Specify a name that is from 1 to 20 characters long and:• does not begin with the characters APOC (in upper or lower case)• is a unique name within this healthcare organization.
Item Prompt on Analyzer Required. Specify a prompt that is from 1 to 20 characters long and:• does not begin with the characters APOC (in upper or lower case)• is a unique name within this healthcare organization.
Description Optional.
Entry Prompt Select one of the following:
Entry, optionalPrompt the operator for an optional entry.
Entry, mandatory with overridePrompt the operator for a mandatory entry. If the override feature ischosen by the operator no further action is required and theinstrument will advance to the next screen.
Entry, mandatoryPrompt the operator for a mandatory entry. Cartridge testing cannotcontinue until information is entered.
227
i-STAT Alinity — System Operations Manual Art: 746300-01 Rev. I Rev. Date: 05-Nov-2019

Format Determine the format used to enter data. Select either:
Numeric Only Data will be entered only as numbers.
Alphanumeric Data will be entered as either letters ornumbers.
Entry Type Determine how the data will be entered into the i‑STAT Alinity instrument. Selectone of the following:
Allow Scan and Manual Entry Allow barcode scan or manual data entry.
Scan Only Allow barcode scan data entry only.
Manual Entry Only Allow manual data entry only.
Minimum Length Enter the minimum data charactersallowed.
Maximum Length Enter the maximum data charactersallowed.
Scan Mask Barcode scanning setting that allows for the selection of specific character positionsto be retained.• The first position (the position farthest to the left) is numbered position "1".• The scanmask field will accept a text input consisting of numbers 1-9, commas
(','), and hyphens ('-') to identify the scanmask selection.• If, for example, the barcode reads "abcdefghi1234567890" and the selection
pattern is "2,5-8,11-14" then the barcode will be interpreted as "befgh2345". Ifthe selection pattern is "3-4", then the barcode will be "cd".
• Individual position selections that are separated by a comma such as "2,4,7,8,19"cannot be duplicated.
• In each number range, the starting number must be smaller than the endingnumber. For example, "3-5" is a valid range, but "5-3" is not.
• Selection ranges cannot overlap. The end of each number range must be smallerthan the beginning of the next number range. For example, "3-6,7-9" is a validselection, but "3-6,6-9" is not.
• Entering consecutive commas or hyphens is invalid. For example, "2--5","2-5,,7-10", and "2,-5" are all invalid ranges.
228
i-STAT Alinity — System Operations Manual Art: 746300-01 Rev. I Rev. Date: 05-Nov-2019

Manual Check DigitMethod
If a facility uses a supported check digit algorithm when creating operator orpatient IDs, the i‑STAT Alinity can verify the entered ID format by calculatingthe check digit and comparing it to the entered ID number. If the check digitsdo not match, the ID is rejected.
Note: The i‑STAT Alinity System supports the Mod 10 and Mod 11check digit algorithms described in the HL7 Table 0061 (Check DigitScheme) in the HL7 Specification (Rev 1.4). Contact your LIS/HIS orIT departments to determine if your facility uses check digits in thecreation of operator and/or patient ID numbers, and if so, whichalgorithm is used.
Allowable values are:
No check digit on manualentry
Do not use a check digit when creatingoperator or patient IDs.
Mod 11 check digit onmanual entry
Use the Mod 11 algorithm when creatingoperator or patient IDs.
Mod 10 check digit onmanual entry
Use the Mod 10 algorithm when creatingoperator or patient IDs.
Scan Entry CheckDigit Method
Whether to use a check digit when scanning a value to create an operator orpatient ID.
No check digit on scan entry Do not use a check digit when creatingoperator or patient IDs.
Mod 11 check digit on scanentry
Use the Mod 11 algorithm when creatingoperator or patient IDs.
Mod 10 check digit on scanentry
Use the Mod 10 algorithm when creatingoperator or patient IDs.
Barcode Type Select all that apply.
When the specifications for this item are complete, choose from the options in the lower right corner ofthe screen:• Click Publish to complete the item so it will appear on the Manage Items list• Click Discard to delete the item
229
i-STAT Alinity — System Operations Manual Art: 746300-01 Rev. I Rev. Date: 05-Nov-2019

Selection ListUse Selection List to create a list of items that the operator can select from.
Item Name Required. Specify a name that is from 1 to 20 characters long and:• does not begin with the characters APOC (in upper or lower case)• is a unique name within this healthcare organization.
Item Prompt on Analyzer Required. Specify a prompt that is from 1 to 20 characters long and:• does not begin with the characters APOC (in upper or lower case)• is a unique name within this healthcare organization.
Description Optional.
Entry Select one of the following:
Entry, optionalPrompt the operator for an optional entry.
Entry, mandatory with overridePrompt the operator for a mandatory entry. If the override feature ischosen by the operator no further action is required and theinstrument will advance to the next screen.
Entry, mandatoryPrompt the operator for a mandatory entry. Cartridge testing cannotcontinue until information is entered.
Each item for the selection list is defined next.
Click Edit Selection List. A text box displays:
Enter up to 20 characters in the text box. This will be the first item in the selection list. To createadditional items, click Add Item.
230
i-STAT Alinity — System Operations Manual Art: 746300-01 Rev. I Rev. Date: 05-Nov-2019

After all selection list items have been created, click Update Selection List or Cancel.
• Click Publish to complete the item so it will appear on the Manage Items list• Click Discard to delete the item
The Result Notes Item Name list displays and now includes the Selection List item that was just created.
231
i-STAT Alinity — System Operations Manual Art: 746300-01 Rev. I Rev. Date: 05-Nov-2019

Selection List with Text boxThis is nearly identical to the Selection List item with one important difference. With a Selection Listitem, the operator can choose from a list of items. In a Selection List with Text box, the operator isprompted to choose their response either from the selection list or to type a customized response into atext box.
Item Name Required. Specify a name that is from 1 to 20 characters long and:• does not begin with the characters APOC (in upper or lower case)• is a unique name within this healthcare organization.
Item Prompt on Analyzer Required. Specify a prompt that is from 1 to 20 characters long and:• does not begin with the characters APOC (in upper or lower case)• is a unique name within this healthcare organization.
Description Optional.
Entry Prompt Select one of the following:
Entry, optionalPrompt the operator for an optional entry.
Entry, mandatory with overridePrompt the operator for a mandatory entry. If the override feature ischosen by the operator no further action is required and theinstrument will advance to the next screen.
Entry, mandatoryPrompt the operator for a mandatory entry. Cartridge testing cannotcontinue until information is entered.
Each item for the selection list is defined next.
Click Edit Selection List. A text box displays.
Enter up to 20 characters in the text box. This will be the first item in the selection list. To createadditional items, click Add Item.
After all selection list items have been created, click Update Selection List or Cancel.
• Click Publish to complete the item so it will appear on the Manage Items list• Click Discard to delete the item
232
i-STAT Alinity — System Operations Manual Art: 746300-01 Rev. I Rev. Date: 05-Nov-2019

Repeat Test ItemUse the Repeat Test Item to prompt the operator to answer "Yes" or "No" if a repeat test is needed.
On the screen that displays, enter values for:
Item Name Required. Specify a name that is from 1 to 20 characters long and:• does not begin with the characters APOC (in upper or lower case)• is a unique name within this healthcare organization.
Item Prompt on Analyzer Required. Specify a prompt that is from 1 to 20 characters long and:• does not begin with the characters APOC (in upper or lower case)• is a unique name within this healthcare organization.
Description Optional.
Entry Select one of the following:
Entry, optionalPrompt the operator for an optional entry.
Entry, mandatory with overridePrompt the operator for a mandatory entry. If the override feature ischosen by the operator no further action is required and theinstrument will advance to the next screen.
Entry, mandatoryPrompt the operator for a mandatory entry. Cartridge testing cannotcontinue until information is entered.
Under Selection List the values Yes and No are shown. These are the only possible responses displayedon the instrument.
• Click Publish to complete the item so it will appear on the Manage Items list• Click Discard to delete the item
233
i-STAT Alinity — System Operations Manual Art: 746300-01 Rev. I Rev. Date: 05-Nov-2019
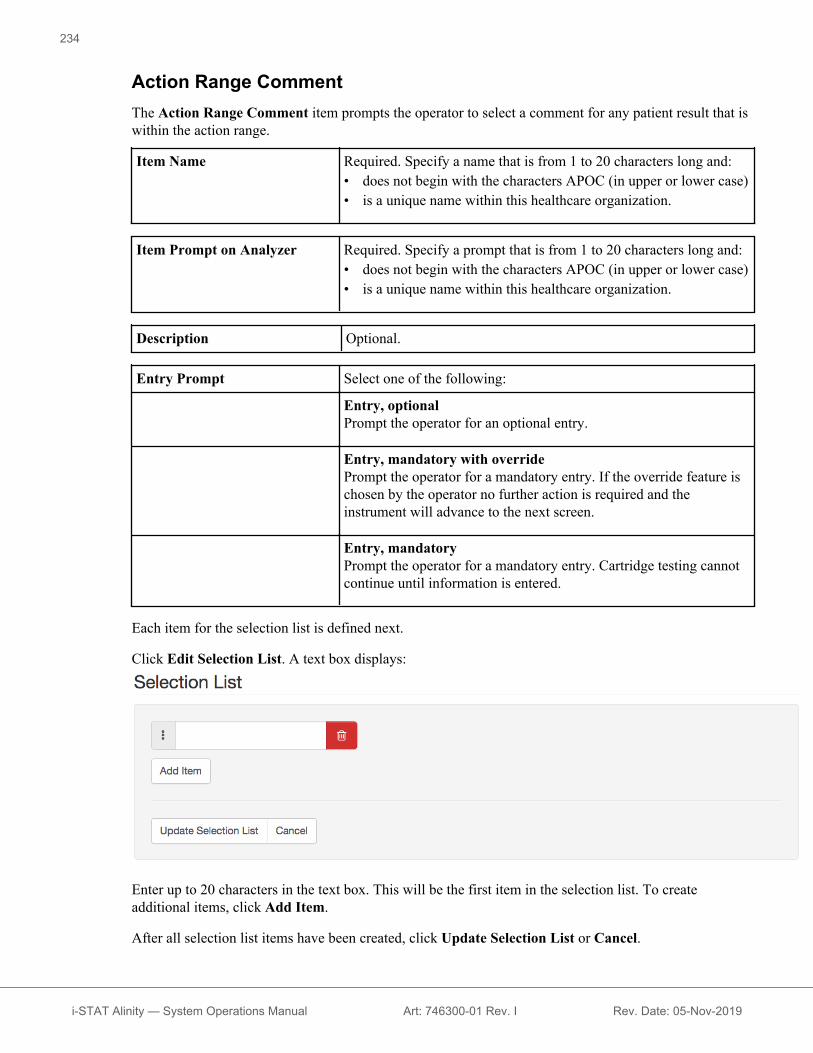
Action Range CommentThe Action Range Comment item prompts the operator to select a comment for any patient result that iswithin the action range.
Item Name Required. Specify a name that is from 1 to 20 characters long and:• does not begin with the characters APOC (in upper or lower case)• is a unique name within this healthcare organization.
Item Prompt on Analyzer Required. Specify a prompt that is from 1 to 20 characters long and:• does not begin with the characters APOC (in upper or lower case)• is a unique name within this healthcare organization.
Description Optional.
Entry Prompt Select one of the following:
Entry, optionalPrompt the operator for an optional entry.
Entry, mandatory with overridePrompt the operator for a mandatory entry. If the override feature ischosen by the operator no further action is required and theinstrument will advance to the next screen.
Entry, mandatoryPrompt the operator for a mandatory entry. Cartridge testing cannotcontinue until information is entered.
Each item for the selection list is defined next.
Click Edit Selection List. A text box displays:
Enter up to 20 characters in the text box. This will be the first item in the selection list. To createadditional items, click Add Item.
After all selection list items have been created, click Update Selection List or Cancel.
234
i-STAT Alinity — System Operations Manual Art: 746300-01 Rev. I Rev. Date: 05-Nov-2019
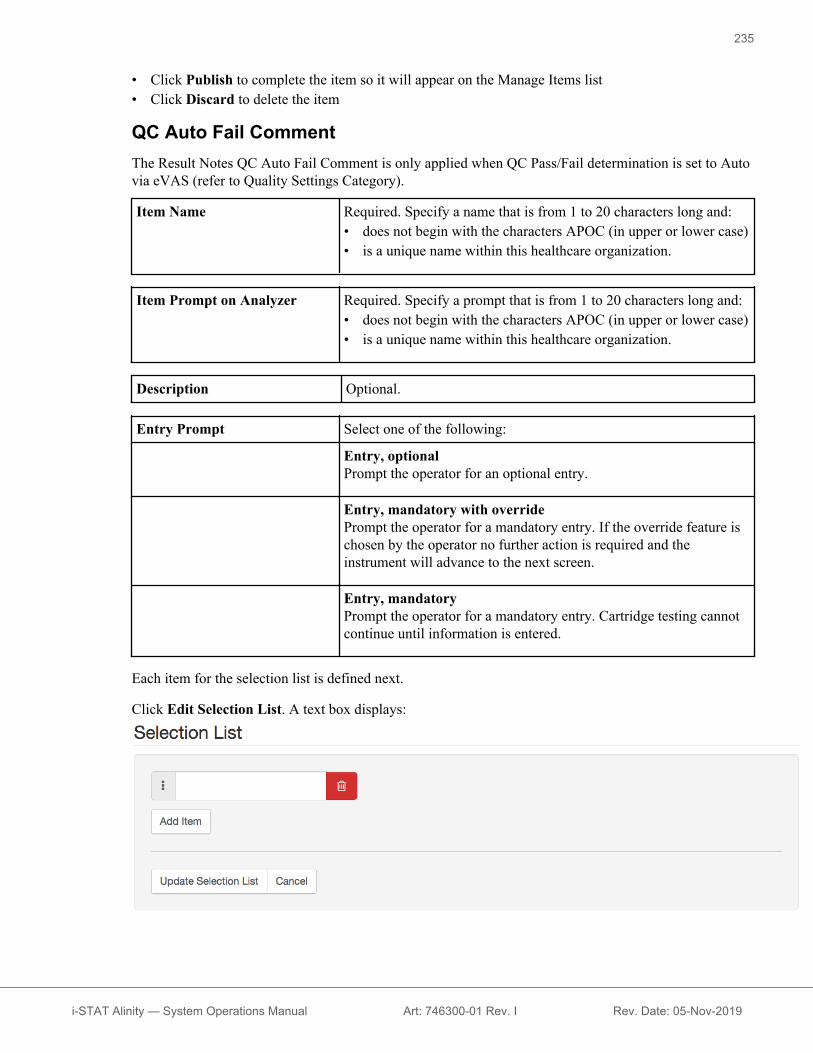
• Click Publish to complete the item so it will appear on the Manage Items list• Click Discard to delete the item
QC Auto Fail CommentThe Result Notes QC Auto Fail Comment is only applied when QC Pass/Fail determination is set to Autovia eVAS (refer to Quality Settings Category).
Item Name Required. Specify a name that is from 1 to 20 characters long and:• does not begin with the characters APOC (in upper or lower case)• is a unique name within this healthcare organization.
Item Prompt on Analyzer Required. Specify a prompt that is from 1 to 20 characters long and:• does not begin with the characters APOC (in upper or lower case)• is a unique name within this healthcare organization.
Description Optional.
Entry Prompt Select one of the following:
Entry, optionalPrompt the operator for an optional entry.
Entry, mandatory with overridePrompt the operator for a mandatory entry. If the override feature ischosen by the operator no further action is required and theinstrument will advance to the next screen.
Entry, mandatoryPrompt the operator for a mandatory entry. Cartridge testing cannotcontinue until information is entered.
Each item for the selection list is defined next.
Click Edit Selection List. A text box displays:
235
i-STAT Alinity — System Operations Manual Art: 746300-01 Rev. I Rev. Date: 05-Nov-2019

Enter up to 20 characters in the text box. This will be the first item in the selection list. To createadditional items, click Add Item.
After all selection list items have been created, click Update Selection List or Cancel.
• Click Publish to complete the item so it will appear on the Manage Items list• Click Discard to delete the item
Manage SetsA Result Notes set is a collection of Result Notes items. Use Manage Items to display a list of allavailable items. Items must be created and available in the Manage items section before a Manage Set canbe built. After verifying that all items exist, a Result Notes set can be created. When creating a ResultNotes set, the patient or control and Cal Ver testing pathway needs to be determined for the Result NotesSet. Once a set is created, it can be applied to cartridges. After patient testing or control and Cal Vertesting is performed using a cartridge, the Result Notes item will be displayed on the instrument.
Use Manage Sets > Create. This screen displays:
On the screen shown above, select either:
Patient pathway Apply Result Notes when performing patient testing.
Control and Cal Ver pathways Apply Result Notes when performing Control or Cal Ver testing.
Next, in the upper right corner of the screen, click Create Set.
Result Notes Set
Name Required. Specify a name that is from 4 to 40 characters long and:• consists only of the following characters:
○ 0 through 9○ A through Z or alphabet appropriate for language (in upper or
lower case)○ blank space○ underscore ( _ )
• does not begin with the characters APOC (in upper or lower case)• is a unique name within this healthcare organization
Description Optional.
Result Notes Items Select up to 6 items from the drop down boxes to create the set. Donot duplicate.
236
i-STAT Alinity — System Operations Manual Art: 746300-01 Rev. I Rev. Date: 05-Nov-2019

When finished, choose from the options shown at the bottom of the screen:• Discard to undo changes• Publish to create the set
After a Result Notes set has been published, click Done.
Create Result NotesOn the command line, click Create.
Result Notes
Name Required. Specify a name that is from 4 to 40 characters long and:• consists only of the following characters:
○ 0 through 9○ A through Z or alphabet appropriate for language (in upper or
lower case)○ blank space○ underscore ( _ )
• does not begin with the characters APOC (in upper or lower case)• is a unique name within this healthcare organization
Description Optional.
When finished, choose from the options shown below:• Next to open the next tab for this Category• Discard to undo changes.
237
i-STAT Alinity — System Operations Manual Art: 746300-01 Rev. I Rev. Date: 05-Nov-2019

Applying a Result Notes Set to a CartridgeTo apply a Result Notes set to a cartridge, click the drop down box next to the cartridge, and highlight thename of the set. Patient pathway Result Notes Sets can be applied to cartridges. Control and Cal Verpathways Result Notes Sets can only be applied to Control/CalVer Sets.
When finished, choose from the options shown at the bottom of the screen:• Previous to go back to the previous screen• Discard to undo changes• Finish Later to create a draft• Next to open the next tab
SummaryThe Summary is a collapsed view of the settings that can be expanded to provide a complete display. TheSummary should be reviewed prior to Publish. Once the settings are confirmed, click on the Publishbutton to finalize them. A Category can be added to a Profile only when the publish status is completed.
When finished, choose from the options shown at the bottom of the screen:• Previous to go back to the previous screen• Discard to undo changes• Finish Later to create a draft• Publish to make settings available to use in a Profile
238
i-STAT Alinity — System Operations Manual Art: 746300-01 Rev. I Rev. Date: 05-Nov-2019

Connectivity Settings CategoryThis section contains features to customize the connectivity settings for the i‑STAT Alinity to transmit toand receive from remote systems, such as operator, cartridge, and patient lists.
To create connectivity settings, click on Create. The screen displays the default nameTemporaryName. Change the name, using the specifications shown below:
Connectivity Settings
Name Required. Specify a name that is from 4 to 40 characters long and:• consists only of the following characters:
○ 0 through 9○ A through Z or alphabet appropriate for language (in upper or
lower case)○ blank space○ underscore ( _ )
• does not begin with the characters APOC (in upper or lower case)• is a unique name within this healthcare organization
Description Provide any information that helps the user know how or why thecategory was named or created.
When finished selecting values, choose from the options shown below:• Next to open the next tab for this Category• Discard to undo changes.
239
i-STAT Alinity — System Operations Manual Art: 746300-01 Rev. I Rev. Date: 05-Nov-2019
Connectivity MapTo enable the sending and receiving of data to and from the i‑STAT Alinity instrument, configure theconnections to the remote systems listed in the Connectivity Map.
The Connectivity Map includes:Test RecordsDevice EventsOperator ListPatient ListCartridge ListLog Events
For each remote system mapped, the following information is needed:• Reviewer Name - information system name, for example, InfoHQ• Vendor Name - for example, Abbott Point of Care• IP Address• Network Port
Instrument Clock Date/Time SynchronizationWhen the Connectivity Map settings are enabled for Test Records, Operator List, Patient List or CartridgeList and the instrument is connected to a network via wired or wireless interface, the instrument willautomatically synchronize the date and time of its clock with the data manager's time. This feature may bedisabled via the instrument Set Clock flow. See Instrument Clock Date/Time Synchronization in section1.2 i‑STAT Alinity Instrument for details.
If all the IP addresses in the Connectivity Map are the same, the instrument may synchronize time duringany of the data manager communication sessions (for example, transmitting results or receiving lists).
If the IP addresses in the Connectivity Map are not all the same, the instrument will synchronize timewith only one data manager. In this case, the instrument will select the one data manager according to thefirst enabled IP address in the Connectivity Map in the following order: Test Records, Operator List,Cartridge List, Patient List.
Note: Instruments can be set to initiate communication with internal sources each timethey power down. See the section Communications for details on Power DownCommunications.
When finished, choose from the options shown at the bottom of the screen:• Previous to go back to the previous screen• Discard to undo changes• Finish Later to create a draft• Next to open the next tab
240
i-STAT Alinity — System Operations Manual Art: 746300-01 Rev. I Rev. Date: 05-Nov-2019

SummaryThe Summary is a collapsed view of the settings that can be expanded to provide a complete display. TheSummary should be reviewed prior to Publish. Once the settings are confirmed, click on the Publishbutton to finalize them. A Category can be added to a Profile only when the publish status is completed.
When finished, choose from the options shown at the bottom of the screen:• Previous to go back to the previous screen• Discard to undo changes• Finish Later to create a draft• Publish to make settings available to use in a Profile
241
i-STAT Alinity — System Operations Manual Art: 746300-01 Rev. I Rev. Date: 05-Nov-2019

Assemble a ProfileAn i‑STAT Alinity profile is a collection of categories. There are five categories (indicated with anasterisk *) required to build a profile and five optional categories, all listed below.
These categories are required (indicated with an asterisk *) to build a profile:• *General Settings• *Operator Settings• *Quality Settings• *Patient Settings• *Analyte Settings
In addition to the required categories, there are optional categories that can be included in a profile:• User Defined Message• Training Settings• STATNotes• Result Notes• Connectivity Settings
To begin defining a profile, from the Home page: click Manage and Assemble Profiles > Profile >Create. This screen displays:
This screen has the following options:Profile
Name Required. Specify a name that is from 4 to 40 characters long and:• consists only of the following characters:
○ 0 through 9○ A through Z or alphabet appropriate for language (in upper or
lower case)○ blank space○ underscore ( _ )
• does not begin with the characters APOC (in upper or lower case)• is a unique name within this healthcare organization
Description Provide any information that helps the user know how or why theprofile was named or created.
242
i-STAT Alinity — System Operations Manual Art: 746300-01 Rev. I Rev. Date: 05-Nov-2019

In the bottom right corner of the screen, click either:• Discard to discard the information, or• Next to open the next tab
Select Pre-defined or customized categories for a ProfileClicking Next after specifying a Profile name opens the General Settings list. This is a list of all theexisting General Settings categories:
General Settings is a required category for a profile. Select a General Settings category by clicking thecheck box next to the name. To display the contents of the category, click Details. A Summary screenopens:
The Summary screen shows all the tabs for that category. Click any tab name to display the options forthat tab. After reviewing the details of the category, exit the Summary screen by clicking the X.
When finished selecting categories, choose from the options shown at the bottom of the screen:• Previous to go back to the previous screen• Discard to undo changes• Finish Later to create a draft• Next to open the next tab
To select all the categories for a profile, follow the same steps as described for General Settings. Selectone category for each of the required categories: General Settings, Operator Settings, Quality Settings,Patient Settings, and Analyte Settings. If a required category is not selected, the pre-defined category willbe applied to the profile. Optional categories may also be selected for the profile.
When selections are complete, choose from the options shown at the bottom of the screen:
243
i-STAT Alinity — System Operations Manual Art: 746300-01 Rev. I Rev. Date: 05-Nov-2019

• Previous to go back to the previous screen• Discard to undo changes• Finish Later to create a draft• Publish to make the Profile available to use
The Profile Name list displays and now includes the Profile that was just created.
Save and Export a ProfileAfter a profile is published it can be saved and exported. To save a profile, on the Profile Name list,select the check box next to the name of the profile to be saved. In the upper right corner of the screen,click Export. At the bottom of the screen a prompt similar to the one shown below displays:
Select:
Open (Not recommended)
Save To save the file. Click the down arrow and select:
Save as To save the file to a specificdestination (USB).
Save and open (Not recommended)
Cancel To not save the file.
Install a Profile from a USB1. Ensure that the correct profile.apkg file has been loaded onto the USB.2. Locate the USB port on the side of the Base Station and insert the USB.3. Place the instrument on the Base Station. Power on the instrument.4. Navigate to More Options > Administrative Options > Profile Management > Install Profile from
USB5. Follow the prompts on the screen to begin the installation process.6. The Activate USB Drive screen displays 2 check boxes. Both boxes must display a green check mark
(✔) for the installation to proceed. If necessary, troubleshooting steps are listed below.7. Confirm that the profile has been uploaded to the instrument by navigating to More Options >
Instrument Status then use Page key to advance to page 2. The profile name and date of install willbe displayed. If the correct information is not displayed, repeat the installation procedure.
Troubleshooting
If the instrument does not detect the Base Station, try the following:• remove the instrument and re-seat it on the Base Station• check to ensure the Base Station is getting power (blue light illuminated)
If the instrument does not detect the USB drive, try the following:• remove the USB and reinsert• make sure the USB is formatted
244
i-STAT Alinity — System Operations Manual Art: 746300-01 Rev. I Rev. Date: 05-Nov-2019

3.5 - AlinIQ CWi – Customization Workspacefor i-STAT Troubleshooting
Issue Solution
Category Name or Profile Name displays an errormessage
The following characters are not allowed whennaming categories or profiles:
< (less than): (colon)/ (forward slash)| (vertical bar or pipe)* (asterisk)> (greater than)" (double quote)\ (backslash)? (question mark)
Forgot AlinIQ CWi Password Launch CWi and enter Email address. Click theForgot Password? link. Check your email for amessage received [email protected] the instructions in the message to reset yourpassword.
No sound on i‑STAT Alinity Check General Settings Category to confirm thatsound is enabled on the profile assigned to theinstrument. Follow CWi instructions in this manualto make necessary changes.
Date display is incorrect on i‑STAT Alinity Check General Settings Category for DateDisplay. Follow CWi instructions in this manual tomake necessary changes.
i‑STAT Alinity wireless function does not work Check General Settings Category to confirm thecheck box has a check enabling the WirelessCommunication. Check the NCi settings forwireless connectivity.
Operator barcode will not scan Check Barcode settings in the Operator SettingsID Entry feature on the profile assigned to theinstrument. Follow CWi instructions in this manualto change the barcode type.
245
i-STAT Alinity — System Operations Manual Art: 746304-01 Rev. H Rev. Date: 29-Oct-2019

Issue Solution
i‑STAT Alinity only displays the last 3 numbers orletters of the Operator ID or No Operator ID. Theentire Operator ID should display.
Check the Operator ID Presentation feature inthe Operator ID Entry feature on the profileassigned to the instrument. Follow CWiinstructions in this manual to change the display.
i‑STAT Alinity only displays the operator’s firstname and last initial. The entire name shoulddisplay.
Check the Operator Name Presentation in theOperator ID Entry feature on the profile assignedto the instrument. If the check box is marked forPartially Display Operator Name, uncheck it todisplay entire name. Follow CWi instructions inthis manual.
i‑STAT Alinity will not upload operator list Check and confirm that the Search for OperatorID on Operator List feature in the OperatorSettings Category is checked on the profileassigned to the instrument. If not checked, followCWi instructions in this manual to change theprofile and enable the instrument to load theoperator list from the data management system.Check the Connectivity Settings Category toconfirm the IP address is programmed for operatorlist.
i‑STAT Alinity will not upload cartridge lot list Check to confirm Search Cartridge List forCartridge Lot Number is enabled in the QualitySettings Category on the profile assigned to theinstrument. If not enabled, follow CWi instructionsin this manual to enable Search Cartridge Listfor Cartridge Lot Number to load the cartridgelist from the data management system. Check theConnectivity Settings Category to confirm the IPaddress is programmed for cartridge list.
Patient armband barcode will not scan Check Barcode settings in the Patient Settings IDEntry feature on the profile assigned to theinstrument. Follow CWi instructions in this manualto change the barcode type.
Patient list will not upload onto the i‑STAT Alinity Check and confirm that the Search Patient Listfor Patient ID feature is enabled in the PatientSettings Category on the profile assigned to theinstrument. If it is not, follow the CWi instructionsin this manual to change the profile and enable theinstrument to load the Patient List from the datamanagement system. Check the ConnectivitySettings Category to confirm the IP address isprogrammed for Patient List.
246
i-STAT Alinity — System Operations Manual Art: 746304-01 Rev. H Rev. Date: 29-Oct-2019

Issue Solution
Analyte ranges were created with age and genderapplied but no reference ranges or action rangeswill display on the i‑STAT Alinity. The displayshows no color.
Check to confirm in Patient Settings, BasicFunctions that Patient Age/Gender Entry hasbeen enabled. If not, follow the directions in thismanual to change setting and upload profile withcorrection.
STATNotes set does not display when clicking onthe drop down arrow beside the cartridge.
A STATNotes set must be created and publishedunder the Manage Set tab before the set willappear as available for application to a cartridge.Follow the instructions in this manual to create aSTATNotes set.
Category created does not appear in the list ofavailable categories when creating a profile
Categories must be in the Published status toappear as available when creating a profile.
Cartridge QC Lot List is applied and defined inCWi and data management system but QC or CalVer results are not being displayed in the datamanagement system.
CWi Pass/Fail determination for QC or Cal Ver isrequired. If set to None the data managementsystem will not recognize the test performed.Follow the instructions in this manual to set Autovia eVAS or Manual.
247
i-STAT Alinity — System Operations Manual Art: 746304-01 Rev. H Rev. Date: 29-Oct-2019

Issue Solution
Instrument time does not agree with data managertime
1. Power on the instrument and allow it sufficienttime on the Home screen to connect to thenetwork and communicate with the datamanager.
2. Check the network status icon on theinstrument screen. If icon appears but indicatesno connection:For Wired connection:
- Ensure instrument is properly seated in thebase station.- Confirm the base station has a wiredconnection to the network.
For Wireless connection:- Ensure Wireless is Enabled via the Enable/Disable Wireless workflow.- Check Wireless Communication isEnabled in the customization profile,General Settings Category. Follow CWiinstructions in this manual to makenecessary changes.
3. Check that the network status icon on theinstrument screen shows instrument has anetwork connection. If not, then use NCi toverify the NC settings within the NC fileinstalled on the instrument are correct. FollowNCi instructions in this manual to makenecessary changes to network settings.
4. Check Connectivity Map in customizationprofile to confirm at least one of the followingis Enabled and has the correct IP Address andPort of the data manager: Test Results,Operator List, Cartridge List, Patient List.Follow CWi instructions in this manual tomake necessary changes.
5. Check the data manager to ensure it isoperational and supports communication withi‑STAT Alinity instruments.
Additional Information
AlinIQ CWi is a web-based application and therefore may experience periods of downtime. Scheduleddowntime will be noted when logging in. Unscheduled downtime, although never desired, may happenfrom time to time. (For example: security patches and application updates.)
Best practice would be to save all assigned profiles in a file on a healthcare organization manager'scomputer. If a profile needs to be loaded onto an instrument while the system is down, upload can be
248
i-STAT Alinity — System Operations Manual Art: 746304-01 Rev. H Rev. Date: 29-Oct-2019

performed from USB. Temporary loss of user access to AlinIQ CWi will not affect profiles alreadyloaded onto instruments.
249
i-STAT Alinity — System Operations Manual Art: 746304-01 Rev. H Rev. Date: 29-Oct-2019

250
i-STAT Alinity — System Operations Manual Art: 746304-01 Rev. H Rev. Date: 29-Oct-2019


This page intentionally left blank.
i-STAT Alinity — System Operations Manual Art: 746986-01 Rev. A Rev. Date: 02-Oct-2016

4.1 - Cartridge and Test InformationThis section is a guide for sample collection and handling information for each cartridge type in thei‑STAT Alinity System.
Note:• Not all cartridges are available in all regions. Check with your local representative for
availability in specific markets. Scanning a cartridge that is unavailable will result in apop-up window that displays Invalid Cartridge Type.
• Customization may affect analyte availability.
Cartridge SpecificationsShelf Life: Refrigerated at 2ºC to 8ºC (35ºF to 46ºF) until expiration date. Refer to the cartridge box forroom temperature storage requirements.
Preparation for Use: Individual cartridges may be used after standing five minutes at room temperature.An entire box of cartridges should stand at room temperature for one hour. All cartridges should be usedimmediately after opening pouch. If the pouch has been punctured, the cartridge should not be used.
Further information on cartridge storage and handling can be found in Sections 4 and 5 of the QuickReference Guide.
253
i-STAT Alinity — System Operations Manual Art: 747386-01 Rev. G Rev. Date: 29-Oct-2019
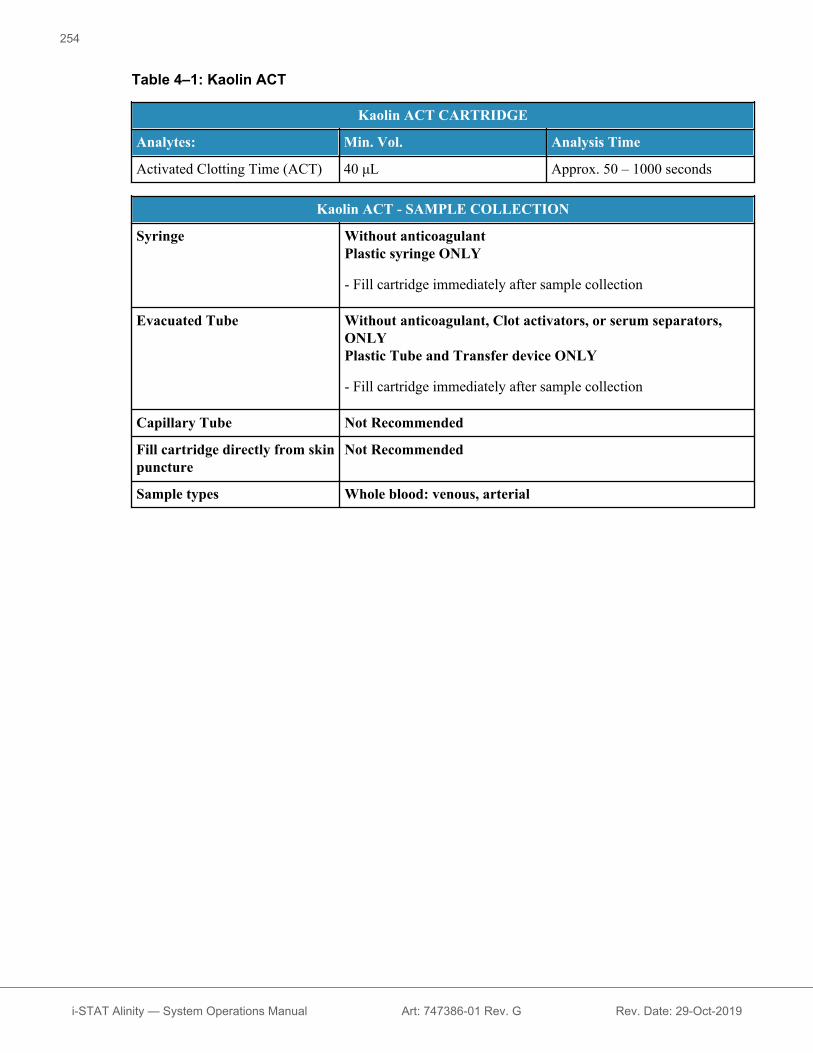
Table 4–1: Kaolin ACT
Kaolin ACT CARTRIDGE
Analytes: Min. Vol. Analysis Time
Activated Clotting Time (ACT) 40 μL Approx. 50 – 1000 seconds
Kaolin ACT - SAMPLE COLLECTION
Syringe Without anticoagulantPlastic syringe ONLY
- Fill cartridge immediately after sample collection
Evacuated Tube Without anticoagulant, Clot activators, or serum separators,ONLYPlastic Tube and Transfer device ONLY
- Fill cartridge immediately after sample collection
Capillary Tube Not Recommended
Fill cartridge directly from skinpuncture
Not Recommended
Sample types Whole blood: venous, arterial
254
i-STAT Alinity — System Operations Manual Art: 747386-01 Rev. G Rev. Date: 29-Oct-2019

Table 4–2: Creatinine
Creatinine CARTRIDGE
Analytes: Min. Vol. Analysis Time
eGFR*eGFR-a*
65 μL Approx. 130–200 seconds
*Calculated value
Creatinine - SAMPLE COLLECTION
Syringe Without anticoagulant• Mix sample immediately before filling cartridge.• Fill cartridge within 3 minutes of sample collection.
With balanced heparin anticoagulant• Mix sample immediately before filling cartridge.• Fill cartridge within 30 minutes of sample collection.
Evacuated Tube Without anticoagulant• Mix sample immediately before filling cartridge.• Fill cartridge within 3 minutes of sample collection.
With lithium heparin anticoagulant• Mix sample immediately before filling cartridge.• Fill cartridge within 30 minutes of sample collection.
Capillary Tube With balanced heparin anticoagulant• Mix sample immediately before filling cartridge.• Fill cartridge within 3 minutes of sample collection.
With lithium heparin anticoagulant
- if labeled for measurement of electrolytes.
• Mix sample immediately before filling cartridge.• Fill cartridge within 3 minutes of sample collection.
Fill cartridge directly from skinpuncture
While a sample can be transferred directly from a skin puncture to acartridge, a capillary tube is preferred.
Sample types Whole blood: venous, arterial, capillary
255
i-STAT Alinity — System Operations Manual Art: 747386-01 Rev. G Rev. Date: 29-Oct-2019

Table 4–3: CG8+
CG8+ CARTRIDGE
Analytes: Min. Vol. Analysis Time
Sodium (Na)Potassium (K)Ionized CalciumGlucose (Glu)Hematocrit (Hct)pHPCO2
PO2
TCO2*HCO3*BE*sO2*Hemoglobin* (Hb)
95 μL Approx. 130–200seconds
*Calculated value
CG8+ - SAMPLE COLLECTION
Syringe Without anticoagulant• Maintain anaerobic conditions prior to filling this cartridge.• Mix sample immediately before filling cartridge.• Fill cartridge within 3 minutes of sample collection.
With balanced heparin anticoagulant• Maintain anaerobic conditions prior to filling this cartridge.• Mix sample immediately before filling cartridge.• Fill cartridge within 10 minutes of sample collection.
Evacuated Tube Without anticoagulant• Maintain anaerobic conditions prior to filling this cartridge.• Mix sample immediately before filling cartridge.• Fill cartridge within 3 minutes of sample collection.
With lithium heparin anticoagulant• Maintain anaerobic conditions prior to filling this cartridge.• Mix sample immediately before filling cartridge.• Fill cartridge within 10 minutes of sample collection.
Capillary Tube With balanced heparin anticoagulant• Mix sample immediately before filling cartridge.• Fill cartridge within 3 minutes of sample collection.
Fill cartridge directly from skinpuncture
Not Recommended
Sample types Whole blood: venous, arterial, capillary
256
i-STAT Alinity — System Operations Manual Art: 747386-01 Rev. G Rev. Date: 29-Oct-2019

Table 4–4: CG4+
CG4+ CARTRIDGE
Analytes: Min. Vol. Analysis Time
pHPCO2
PO2
Lactate
TCO2*HCO3*BE*sO2*
95 μL Approx. 130–200seconds
*Calculated value
CG4+ - SAMPLE COLLECTION
Syringe Without anticoagulant• Maintain anaerobic conditions prior to filling this cartridge.• Fill cartridge immediately after sample collection.
With balanced heparin anticoagulant• Maintain anaerobic conditions prior to filling this cartridge.• Fill cartridge immediately after sample collection.
Evacuated Tube Without anticoagulant• Maintain anaerobic conditions prior to filling this cartridge.• Fill cartridge immediately after sample collection.
With lithium heparin anticoagulant• Maintain anaerobic conditions prior to filling this cartridge.• Fill cartridge immediately after sample collection.
Capillary Tube With balanced heparin anticoagulant• Fill cartridge immediately after sample collection.
With lithium heparin anticoagulant• Fill cartridge immediately after sample collection.
Fill cartridge directly from skinpuncture
Not Recommended
Sample types Whole blood: venous, arterial, capillary
257
i-STAT Alinity — System Operations Manual Art: 747386-01 Rev. G Rev. Date: 29-Oct-2019

Table 4–5: CHEM8+
CHEM8+ CARTRIDGE
Analytes: Min. Vol. Analysis Time
Sodium (Na)Potassium (K)Chloride (Cl)Urea Nitrogen(BUN)/UreaGlucose (Glu)Creatinine (Crea)Ionized Calcium(iCA)
TCO2
Hematocrit (Hct)Anion Gap*(AnGap)Hemoglobin* (Hb)eGFR*eGFR-a*
95 μL Approx. 130–200seconds
*Calculated value
CHEM8+ - SAMPLE COLLECTION
Syringe Without anticoagulant• Maintain anaerobic conditions prior to filling this cartridge.• Mix sample immediately before filling cartridge.• Fill cartridge within 3 minutes of sample collection.
With balanced heparin anticoagulant• Maintain anaerobic conditions prior to filling this cartridge.• Mix sample immediately before filling cartridge.• Fill cartridge within 10 minutes of sample collection.
Evacuated Tube Without anticoagulant• Maintain anaerobic conditions prior to filling this cartridge.• Mix sample immediately before filling cartridge.• Fill cartridge within 3 minutes of sample collection.
With lithium heparin anticoagulant• Maintain anaerobic conditions prior to filling this cartridge.• Mix sample immediately before filling cartridge.• Fill cartridge within 10 minutes of sample collection.
Capillary Tube With balanced heparin anticoagulant• Mix sample immediately before filling cartridge.• Fill cartridge within 3 minutes of sample collection.
Fill cartridge directly from skinpuncture
Not Recommended
Sample types Whole blood: venous, arterial, capillary
258
i-STAT Alinity — System Operations Manual Art: 747386-01 Rev. G Rev. Date: 29-Oct-2019
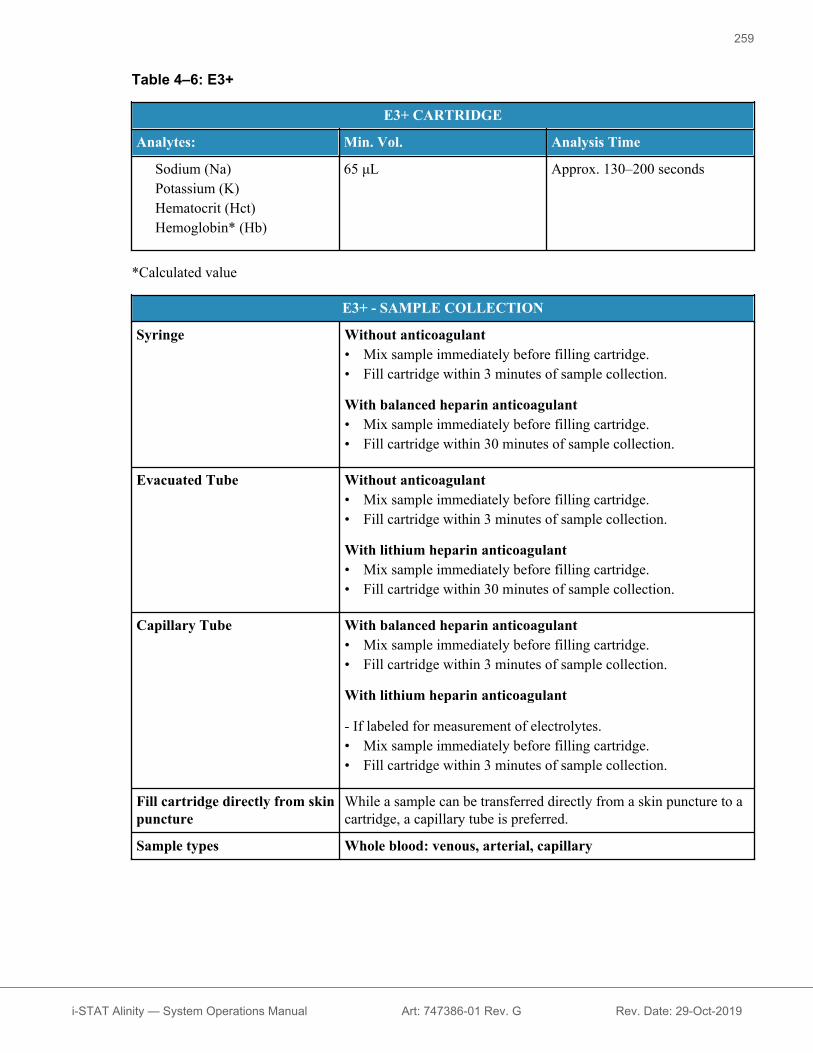
Table 4–6: E3+
E3+ CARTRIDGE
Analytes: Min. Vol. Analysis Time
Sodium (Na)Potassium (K)Hematocrit (Hct)Hemoglobin* (Hb)
65 μL Approx. 130–200 seconds
*Calculated value
E3+ - SAMPLE COLLECTION
Syringe Without anticoagulant• Mix sample immediately before filling cartridge.• Fill cartridge within 3 minutes of sample collection.
With balanced heparin anticoagulant• Mix sample immediately before filling cartridge.• Fill cartridge within 30 minutes of sample collection.
Evacuated Tube Without anticoagulant• Mix sample immediately before filling cartridge.• Fill cartridge within 3 minutes of sample collection.
With lithium heparin anticoagulant• Mix sample immediately before filling cartridge.• Fill cartridge within 30 minutes of sample collection.
Capillary Tube With balanced heparin anticoagulant• Mix sample immediately before filling cartridge.• Fill cartridge within 3 minutes of sample collection.
With lithium heparin anticoagulant
- If labeled for measurement of electrolytes.• Mix sample immediately before filling cartridge.• Fill cartridge within 3 minutes of sample collection.
Fill cartridge directly from skinpuncture
While a sample can be transferred directly from a skin puncture to acartridge, a capillary tube is preferred.
Sample types Whole blood: venous, arterial, capillary
259
i-STAT Alinity — System Operations Manual Art: 747386-01 Rev. G Rev. Date: 29-Oct-2019

Table 4–7: EC4+
EC4+ CARTRIDGE
Analytes: Min. Vol. Analysis Time
Sodium (Na)Potassium (K)Glucose (Glu)Hematocrit (Hct)Hemoglobin* (Hb)
65 μL Approx. 130–200 seconds
*Calculated value
EC4+ - SAMPLE COLLECTION
Syringe Without anticoagulant• Mix sample immediately before filling cartridge.• Fill cartridge within 3 minutes of sample collection.
With balanced heparin anticoagulant• Mix sample immediately before filling cartridge.• Fill cartridge within 30 minutes of sample collection.
Evacuated Tube Without anticoagulant• Mix sample immediately before filling cartridge.• Fill cartridge within 3 minutes of sample collection.
With lithium heparin anticoagulant• Mix sample immediately before filling cartridge.• Fill cartridge within 30 minutes of sample collection.
Capillary Tube With balanced heparin anticoagulant• Mix sample immediately before filling cartridge.• Fill cartridge within 3 minutes of sample collection.
With lithium heparin anticoagulant
- If labeled for measurement of electrolytes.• Mix sample immediately before filling cartridge.• Fill cartridge within 3 minutes of sample collection.
Fill cartridge directly from skinpuncture
While a sample can be transferred directly from a skin puncture to acartridge, a capillary tube is preferred.
Sample types Whole blood: venous, arterial, capillary
260
i-STAT Alinity — System Operations Manual Art: 747386-01 Rev. G Rev. Date: 29-Oct-2019
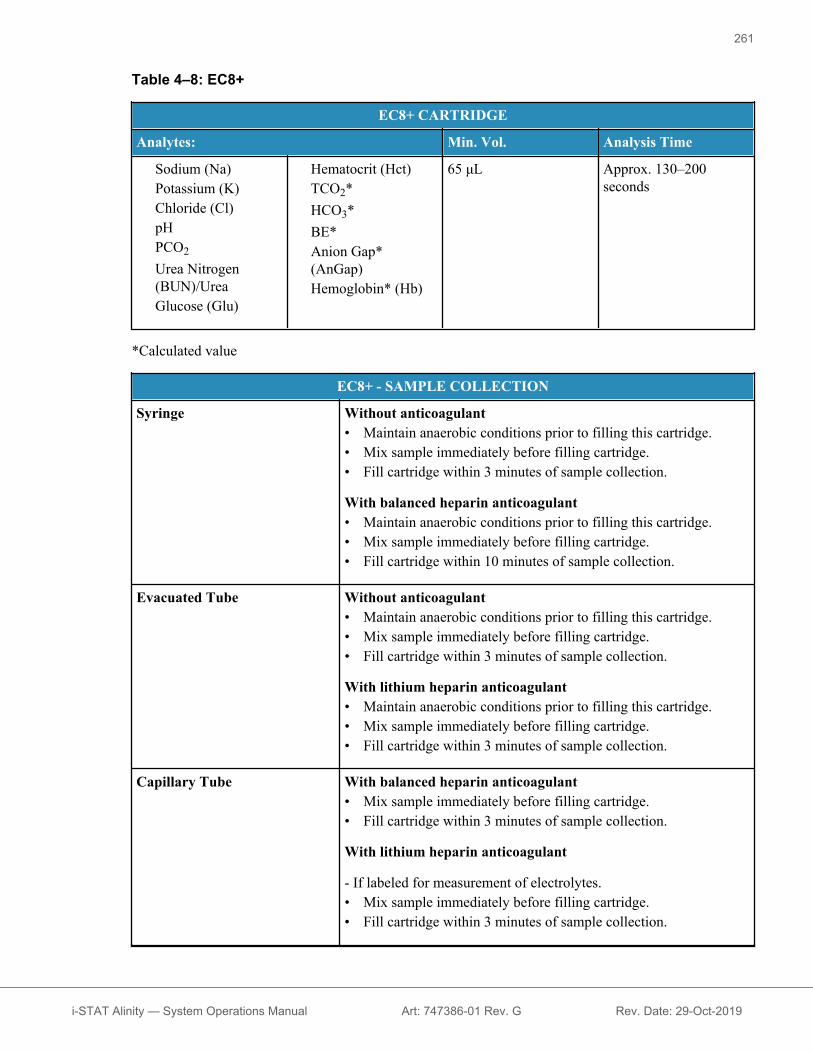
Table 4–8: EC8+
EC8+ CARTRIDGE
Analytes: Min. Vol. Analysis Time
Sodium (Na)Potassium (K)Chloride (Cl)pHPCO2
Urea Nitrogen(BUN)/UreaGlucose (Glu)
Hematocrit (Hct)TCO2*HCO3*BE*Anion Gap*(AnGap)Hemoglobin* (Hb)
65 μL Approx. 130–200seconds
*Calculated value
EC8+ - SAMPLE COLLECTION
Syringe Without anticoagulant• Maintain anaerobic conditions prior to filling this cartridge.• Mix sample immediately before filling cartridge.• Fill cartridge within 3 minutes of sample collection.
With balanced heparin anticoagulant• Maintain anaerobic conditions prior to filling this cartridge.• Mix sample immediately before filling cartridge.• Fill cartridge within 10 minutes of sample collection.
Evacuated Tube Without anticoagulant• Maintain anaerobic conditions prior to filling this cartridge.• Mix sample immediately before filling cartridge.• Fill cartridge within 3 minutes of sample collection.
With lithium heparin anticoagulant• Maintain anaerobic conditions prior to filling this cartridge.• Mix sample immediately before filling cartridge.• Fill cartridge within 3 minutes of sample collection.
Capillary Tube With balanced heparin anticoagulant• Mix sample immediately before filling cartridge.• Fill cartridge within 3 minutes of sample collection.
With lithium heparin anticoagulant
- If labeled for measurement of electrolytes.• Mix sample immediately before filling cartridge.• Fill cartridge within 3 minutes of sample collection.
261
i-STAT Alinity — System Operations Manual Art: 747386-01 Rev. G Rev. Date: 29-Oct-2019

EC8+ - SAMPLE COLLECTION
Fill cartridge directly from skinpuncture
Not Recommended
Sample types Whole blood: venous, arterial, capillary
262
i-STAT Alinity — System Operations Manual Art: 747386-01 Rev. G Rev. Date: 29-Oct-2019
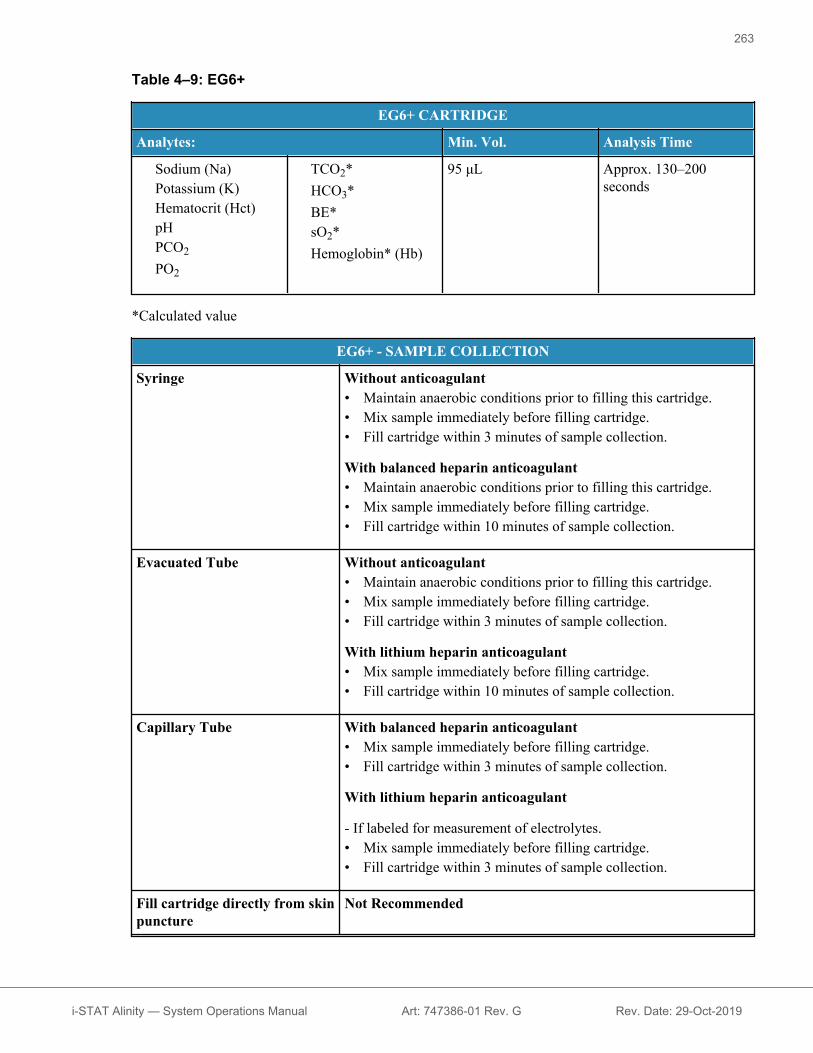
Table 4–9: EG6+
EG6+ CARTRIDGE
Analytes: Min. Vol. Analysis Time
Sodium (Na)Potassium (K)Hematocrit (Hct)pHPCO2
PO2
TCO2*HCO3*BE*sO2*Hemoglobin* (Hb)
95 μL Approx. 130–200seconds
*Calculated value
EG6+ - SAMPLE COLLECTION
Syringe Without anticoagulant• Maintain anaerobic conditions prior to filling this cartridge.• Mix sample immediately before filling cartridge.• Fill cartridge within 3 minutes of sample collection.
With balanced heparin anticoagulant• Maintain anaerobic conditions prior to filling this cartridge.• Mix sample immediately before filling cartridge.• Fill cartridge within 10 minutes of sample collection.
Evacuated Tube Without anticoagulant• Maintain anaerobic conditions prior to filling this cartridge.• Mix sample immediately before filling cartridge.• Fill cartridge within 3 minutes of sample collection.
With lithium heparin anticoagulant• Mix sample immediately before filling cartridge.• Fill cartridge within 10 minutes of sample collection.
Capillary Tube With balanced heparin anticoagulant• Mix sample immediately before filling cartridge.• Fill cartridge within 3 minutes of sample collection.
With lithium heparin anticoagulant
- If labeled for measurement of electrolytes.• Mix sample immediately before filling cartridge.• Fill cartridge within 3 minutes of sample collection.
Fill cartridge directly from skinpuncture
Not Recommended
263
i-STAT Alinity — System Operations Manual Art: 747386-01 Rev. G Rev. Date: 29-Oct-2019

EG6+ - SAMPLE COLLECTION
Sample types Whole blood: venous, arterial, capillary
264
i-STAT Alinity — System Operations Manual Art: 747386-01 Rev. G Rev. Date: 29-Oct-2019

Table 4–10: EG7+
EG7+ CARTRIDGE
Analytes: Min. Vol. Analysis Time
Sodium (Na)Potassium (K)Ionized CalciumHematocrit (Hct)pHPCO2
PO2
TCO2*HCO3*BE*sO2*Hemoglobin* (Hb)
95 μL Approx. 130–200seconds
*Calculated value
EG7+ - SAMPLE COLLECTION
Syringe Without anticoagulant• Maintain anaerobic conditions prior to filling this cartridge.• Mix sample immediately before filling cartridge.• Fill cartridge within 3 minutes of sample collection.
With balanced heparin anticoagulant• Maintain anaerobic conditions prior to filling this cartridge.• Mix sample immediately before filling cartridge.• Fill cartridge within 10 minutes of sample collection.
Evacuated Tube Without anticoagulant• Maintain anaerobic conditions prior to filling this cartridge.• Mix sample immediately before filling cartridge.• Fill cartridge within 3 minutes of sample collection.
With lithium heparin anticoagulant• Maintain anaerobic conditions prior to filling this cartridge.• Mix sample immediately before filling cartridge.• Fill cartridge within 10 minutes of sample collection.
Capillary Tube With balanced heparin anticoagulant• Mix sample immediately before filling cartridge.• Fill cartridge within 3 minutes of sample collection.
Fill cartridge directly from skinpuncture
Not Recommended
Sample types Whole blood: venous, arterial, capillary
265
i-STAT Alinity — System Operations Manual Art: 747386-01 Rev. G Rev. Date: 29-Oct-2019

Table 4–11: G
G CARTRIDGE
Analytes: Min. Vol. Analysis Time
Glucose (Glu) 65 μL Approx. 130–200 seconds
G - SAMPLE COLLECTION
Syringe Without anticoagulant• Mix sample immediately before filling cartridge.• Fill cartridge within 3 minutes of sample collection.
With balanced heparin anticoagulant• Mix sample immediately before filling cartridge.• Fill cartridge within 30 minutes of sample collection.
Evacuated Tube Without anticoagulant• Mix sample immediately before filling cartridge.• Fill cartridge within 3 minutes of sample collection.
With lithium heparin anticoagulant• Mix sample immediately before filling cartridge.• Fill cartridge within 30 minutes of sample collection.
Capillary Tube With balanced heparin anticoagulant• Mix sample immediately before filling cartridge.• Fill cartridge within 3 minutes of sample collection.
With lithium heparin anticoagulant
- If labeled for measurement of electrolytes.• Mix sample immediately before filling cartridge.• Fill cartridge within 3 minutes of sample collection.
Fill cartridge directly from skinpuncture
While a sample can be transferred directly from a skin puncture to acartridge, a capillary tube is preferred.
Sample types Whole blood: venous, arterial, capillary
266
i-STAT Alinity — System Operations Manual Art: 747386-01 Rev. G Rev. Date: 29-Oct-2019
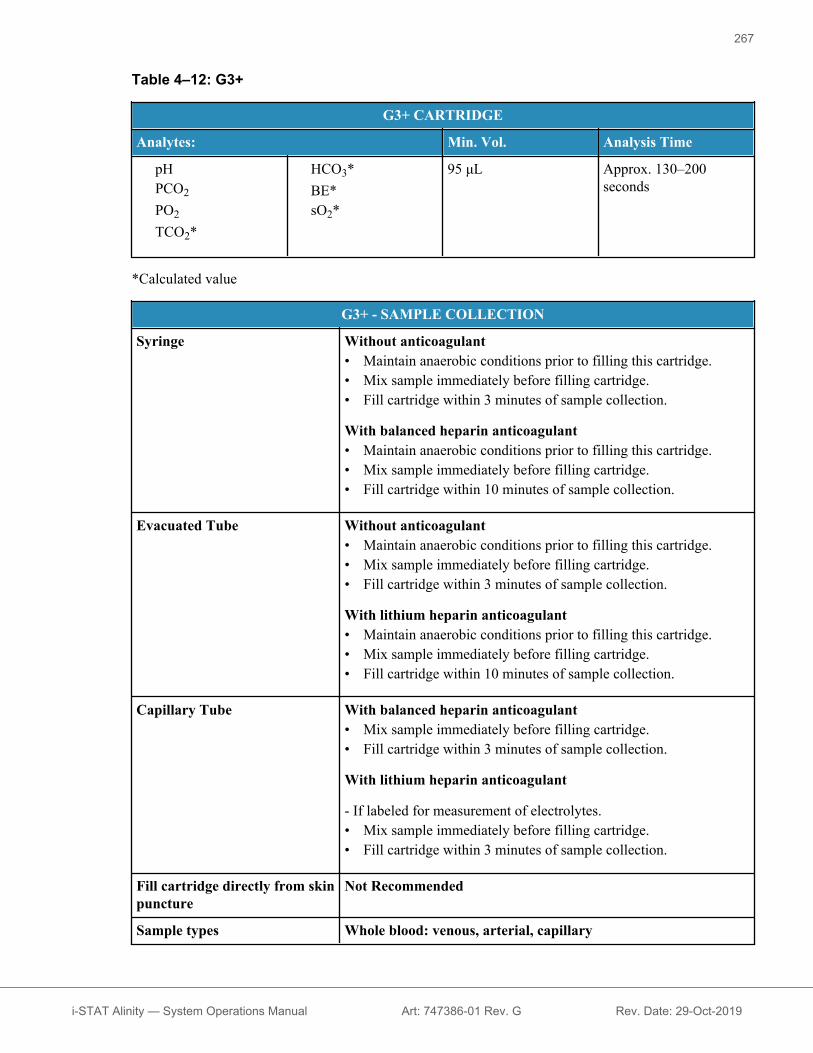
Table 4–12: G3+
G3+ CARTRIDGE
Analytes: Min. Vol. Analysis Time
pHPCO2
PO2
TCO2*
HCO3*BE*sO2*
95 μL Approx. 130–200seconds
*Calculated value
G3+ - SAMPLE COLLECTION
Syringe Without anticoagulant• Maintain anaerobic conditions prior to filling this cartridge.• Mix sample immediately before filling cartridge.• Fill cartridge within 3 minutes of sample collection.
With balanced heparin anticoagulant• Maintain anaerobic conditions prior to filling this cartridge.• Mix sample immediately before filling cartridge.• Fill cartridge within 10 minutes of sample collection.
Evacuated Tube Without anticoagulant• Maintain anaerobic conditions prior to filling this cartridge.• Mix sample immediately before filling cartridge.• Fill cartridge within 3 minutes of sample collection.
With lithium heparin anticoagulant• Maintain anaerobic conditions prior to filling this cartridge.• Mix sample immediately before filling cartridge.• Fill cartridge within 10 minutes of sample collection.
Capillary Tube With balanced heparin anticoagulant• Mix sample immediately before filling cartridge.• Fill cartridge within 3 minutes of sample collection.
With lithium heparin anticoagulant
- If labeled for measurement of electrolytes.• Mix sample immediately before filling cartridge.• Fill cartridge within 3 minutes of sample collection.
Fill cartridge directly from skinpuncture
Not Recommended
Sample types Whole blood: venous, arterial, capillary
267
i-STAT Alinity — System Operations Manual Art: 747386-01 Rev. G Rev. Date: 29-Oct-2019

Table 4–13: 6+
6+ CARTRIDGE
Analytes: Min. Vol. Analysis Time
Sodium (Na)Potassium (K)ChlorideUrea Nitrogen(BUN)/Urea
Glucose (Glu)Hematocrit (Hct)Hemoglobin* (Hb)
65 μL Approx. 130–200seconds
*Calculated value
6+ - SAMPLE COLLECTION
Syringe Without anticoagulant• Mix sample immediately before filling cartridge.• Fill cartridge within 3 minutes of sample collection.
With balanced heparin anticoagulant• Mix sample immediately before filling cartridge.• Fill cartridge within 30 minutes of sample collection.
Evacuated Tube Without anticoagulant• Mix sample immediately before filling cartridge.• Fill cartridge within 3 minutes of sample collection.
With lithium heparin anticoagulant• Mix sample immediately before filling cartridge.• Fill cartridge within 30 minutes of sample collection.
Capillary Tube With balanced heparin anticoagulant• Mix sample immediately before filling cartridge.• Fill cartridge within 3 minutes of sample collection.
With lithium heparin anticoagulant
- If labeled for measurement of electrolytes.• Mix sample immediately before filling cartridge.• Fill cartridge within 3 minutes of sample collection.
Fill cartridge directly from skinpuncture
While a sample can be transferred directly from a skin puncture to acartridge, a capillary tube is preferred.
Sample types Whole blood: venous, arterial, capillary
268
i-STAT Alinity — System Operations Manual Art: 747386-01 Rev. G Rev. Date: 29-Oct-2019

Expected ValuesTable 2: Measured Values
Measured
Test Units ReportableRange
Reference Range
(Arterial) (Venous)
Kaolin ActivatedClotting Time (ACT)
seconds 50- 1000 74 – 137(Prewarm)
82 – 152(Nonwarm)
74 – 137(Prewarm)
82 – 152(Nonwarm)
Sodium (Na) mmol/L (mEq/L) 100 – 180 138 – 146 138 – 146
Potassium (K) mmol/L (mEq/L) 2.0 – 9.0 3.5 – 4.9 3.5 – 4.9
Chloride (Cl) mmol/L (mEq/L) 65 – 140 98 – 109 98 – 109
Glucose (Glu) mmol/Lmg/dL
g/L
1.1 – 38.920 – 700
0.20 – 7.00
3.9 – 5.870 – 105
0.70 – 1.05
3.9 – 5.870 – 105
0.70 – 1.05
Lactate (Lac) mmol/L,mg/dL
0.30 – 20.002.7 – 180.2
0.36 – 1.253.2 – 11.3
0.90 – 1.708.1 – 15.3
Creatinine (Crea) mg/dL,μmol/L
0.2 – 20.018 – 1768
0.6 – 1.353 – 115
0.6 – 1.353 – 115
pH - 6.5 – 8.2 7.35 – 7.45 7.31 – 7.41
PCO2 mmHgkPa
5 – 1300.67 – 17.33
35 – 454.67 – 6.00
41 – 515.47 – 6.80
TCO2* mmol/L (mEq/L) 5 – 50 23 – 27 24 – 29
PO2 mmHgkPa
5 – 8000.7 – 106.6
80 – 10510.7 – 14.0
-
Ionized Calcium (iCa) mmol/Lmg/dL
0.25 – 2.501.0 – 10.0
1.12 – 1.324.5 – 5.3
1.12 – 1.324.5 – 5.3
269
i-STAT Alinity — System Operations Manual Art: 747386-01 Rev. G Rev. Date: 29-Oct-2019

Measured
Test Units ReportableRange
Reference Range
(Arterial) (Venous)
Urea Nitrogen (BUN)/Urea
mg/dLmmol/L
mg/dLg/L
3 – 1401 – 50
6 – 3000.06 – 3.00
8 – 262.9 – 9.4
17 – 560.17 – 0.56
8 – 262.9 – 9.4
17 – 560.17 – 0.56
Hematocrit (Hct) %PCVFraction
15 – 750.15 – 0.75
38 – 510.38 – 0.51
38 – 510.38 – 0.51
*(on the CHEM8+ cartridge only)
270
i-STAT Alinity — System Operations Manual Art: 747386-01 Rev. G Rev. Date: 29-Oct-2019

Table 3: Calculated Values
Calculated
Test Units ReportableRange
Reference Range
(Arterial) (Venous)
Hemoglobin (Hb) g/dLg/L
mmol/L
5.1 – 25.551 – 255
3.2 – 15.8
12 – 17120 – 170
7 – 11
12 – 17120 – 170
7 – 11
TCO2* mmol/L (mEq/L) 5 – 50 23 – 27 24 – 29
HCO3 mmol/L (mEq/L) 1.0 – 85.0 22 – 26 23 – 28
BE mmol/L (mEq/L) (-30) – (+30) (-2) – (+3) (-2) – (+3)
Anion Gap (AnGap) mmol/L (mEq/L) (-10) – (+99) 10 – 20 10 – 20
sO2 % 0 – 100 95 – 98 -
estimated GlomerularFiltration Rate(eGFR)
mL/min/1.73m2 0 – 60 >90 >90
estimated GlomerularFiltration Rate –Black/AfricanAmerican (eGFR-a)
mL/min/1.73m2 0 – 60 >90 >90
*(on all cartridges but the CHEM8+)
Note: Note Regarding System Reliability:The i-STAT System automatically runs a comprehensive set of quality checks of analyzerand cartridge performance each time a sample is tested. This internal quality system willsuppress results if the analyzer or cartridge does not meet certain internal specifications(see Quality Control section in System Operations Manual for detailed information). Tominimize the probability of delivering a result with medically significant error the internalspecifications are very stringent. It is typical for the system to suppress a very smallpercentage of results in normal operation given the stringency of these specifications. Ifhowever the analyzer or cartridges have been compromised, results may be persistentlysuppressed, and one or the other must be replaced to restore normal operating conditions.Where unavailability of results while awaiting replacement of analyzers or cartridgesis unacceptable, APOC recommends maintaining both a backup i-STAT Systeminstrument and cartridges from an alternate lot number.
271
i-STAT Alinity — System Operations Manual Art: 747386-01 Rev. G Rev. Date: 29-Oct-2019

272
i-STAT Alinity — System Operations Manual Art: 747386-01 Rev. G Rev. Date: 29-Oct-2019

4.2 - Technical Bulletin - Supplemental TestInformation for the i‑STAT Alinity SystemThis bulletin provides supplemental performance data for tests on the i-STAT Alinity System. All otherrelated information can found as indicated below.
See respective Cartridge & Test Information sheets for the following information pertaining to each test:• Intended Use• Contents• Metrological Traceability• Expected Values• Factors Affecting Results
See the Cartridge and Test Information for the following information pertaining to cartridges:• Shelf Life• Preparation for Use• Sample Type• Expected Values
See the i-STAT Alinity System Operations Manual for the following information related to the i-STATAlinity System:• Precautions and Limitations• Liquid Quality Controls• Determination of Analyte Concentration• i‑STAT Alinity System Components• Messages and Troubleshooting• i‑STAT Alinity Results Screen
See the i-STAT Alinity Quick Reference Guide for the following information:• System Components• Sample Collection and Handling• How to Begin Patient Testing• Troubleshooting
273
i-STAT Alinity — System Operations Manual Art: 746363-01 Rev. I Rev. Date: 12-Apr-2019

Specific Performance Characteristics - SODIUMThe performance data summarized for sodium was collected by professionals trained in the use of thei‑STAT Alinity System and comparative methods. Representative cartridges were used to collect the data.
Precision*
A multiday precision study was performed with aqueous calibration verification materials inrepresentative cartridges. Duplicates of each aqueous fluid were tested twice a day for 20 days.
Fluid type Fluid level n Mean
(mmol/L or mEq/L)
SD
(mmol/L ormEq/L)
%CV
Aqueous CalVer
Very LowAbnormal
80 99.5 0.32 0.3
LowAbnormal
80 121.2 0.32 0.3
Normal 80 133.7 0.34 0.3
HighAbnormal
80 160.8 0.38 0.2
Very HighAbnormal
80 180.2 0.56 0.3
*Note: Representative data, individual laboratories may vary from these data.
In the method comparison table, n is the number of specimens, and r is the correlation coefficient.
Method Comparison
Method comparison was demonstrated in a study comparing the i-STAT Alinity to the i-STAT 1 Wireless(i-STAT 1W) using representative cartridges. The studies were based on CLSI guideline EP9-A3. Wholeblood samples anticoagulated with lithium heparin were evaluated. Samples were analyzed in duplicateon both systems. A Weighted Deming regression analysis was performed using the first replicate resultfrom the i-STAT Alinity versus the mean of the duplicates from the i-STAT 1W.
274
i-STAT Alinity — System Operations Manual Art: 746363-01 Rev. I Rev. Date: 12-Apr-2019

In the method comparison table, n is the number of specimens, and r is the correlation coefficient.
n 174
slope 1.0
r 0.999
intercept -1
Xmin (mmol/L) 115
Xmax (mmol/L) 173
275
i-STAT Alinity — System Operations Manual Art: 746363-01 Rev. I Rev. Date: 12-Apr-2019

Specific Performance Characteristics - POTASSIUMThe performance data summarized for potassium was collected at Abbott Point of Care. Representativecartridges were used to collect the data.
Precision*
A multiday precision study was performed with aqueous calibration verification materials inrepresentative cartridges. Duplicates of each aqueous fluid were tested twice a day for 20 days.
Fluid type Fluid level n Mean
(mmol/L)
SD
(mmol/L)
%CV
Aqueous CalVer
Very LowAbnormal
80 2.31 0.010 0.4
Low Abnormal 80 2.90 0.015 0.5
Normal 80 3.81 0.023 0.6
High Abnormal 80 6.16 0.026 0.4
Very HighAbnormal
80 7.81 0.039 0.5
*Note: Representative data, individual laboratories may vary from these data.
Method Comparison
Method comparison was demonstrated in a study comparing the i-STAT Alinity to the i-STAT 1 Wireless(i-STAT 1W) using representative cartridges. The studies were based on CLSI guideline EP9-A3. Wholeblood samples anticoagulated with lithium heparin were evaluated. Samples were analyzed in duplicateon both systems. A Weighted Deming regression analysis was performed using the first replicate resultfrom the i-STAT Alinity versus the mean of the duplicates from the i-STAT 1W.
276
i-STAT Alinity — System Operations Manual Art: 746363-01 Rev. I Rev. Date: 12-Apr-2019

In the method comparison table, n is the number of specimens, and r is the correlation coefficient.
n 195
slope 1.00
r 1.00
intercept -0.01
Xmin (mmol/L) 2.0
Xmax (mmol/L) 9.0
277
i-STAT Alinity — System Operations Manual Art: 746363-01 Rev. I Rev. Date: 12-Apr-2019

Specific Performance Characteristics - HEMATOCRITThe performance data summarized for hematocrit was collected by professionals trained in the use of thei-STAT Alinity System and comparative methods. Representative cartridges were used to collect the data.
Precision*
A multiday precision study was performed with aqueous calibration verification materials inrepresentative cartridges. Duplicates of each aqueous fluid were tested twice a day for 20 days.
Fluid type Fluid level n Mean
(%PCV)
SD
(%PCV)
%CV
Aqueous CalVer
Very LowAbnormal
80 16.9 0.46 2.7
Low Abnormal 80 33.9 0.51 1.5
High Abnormal 80 55.2 0.49 0.9
Very HighAbnormal
80 65.0 0.39 0.6
*Note: Representative data, individual laboratories may vary from these data.
Method Comparison
Method comparison was demonstrated in a study comparing the i-STAT Alinity to the i-STAT 1 Wireless(i-STAT 1W) using representative cartridges. The studies were based on CLSI guideline EP9-A3. Wholeblood samples anticoagulated with lithium heparin were evaluated. Samples were analyzed in duplicateon both systems. A Weighted Deming regression analysis was performed using the first replicate resultfrom the i-STAT Alinity versus the mean of the duplicates from the i-STAT 1W.
278
i-STAT Alinity — System Operations Manual Art: 746363-01 Rev. I Rev. Date: 12-Apr-2019

In the method comparison table, n is the number of specimens, and r is the correlation coefficient.
n 229
slope 1.02
r 0.993
intercept -0.36
Xmin (%PCV) 18
Xmax (%PCV) 70
279
i-STAT Alinity — System Operations Manual Art: 746363-01 Rev. I Rev. Date: 12-Apr-2019

Specific Performance Characteristics - LACTATEThe performance data summarized for lactate was collected at Abbott Point of Care. Representativecartridges were used to collect the data.
Precision*
A multiday precision study was performed with aqueous calibration verification materials inrepresentative cartridges. Duplicates of each aqueous fluid were tested twice a day for 20 days.
Fluid type Fluid level n Mean
(mmol/L)
SD
(mmol/L)
%CV
Aqueous CalVer
Very LowAbnormal
80 0.45 0.01 2.44
Low Abnormal 80 0.86 0.01 1.16
Normal 80 2.12 0.01 0.52
High Abnormal 80 7.68 0.06 0.74
Very HighAbnormal
80 17.40 0.25 1.44
*Note: Representative data, individual laboratories may vary from these data.
Method Comparison
Method comparison was demonstrated in a study comparing the i-STAT Alinity to the i-STAT 1 Wireless(i-STAT 1W) using representative cartridges. The studies were based on CLSI guideline EP9-A3. Wholeblood samples anticoagulated with lithium heparin were evaluated. Samples were analyzed in duplicateon both systems. A Weighted Deming regression analysis was performed using the first replicate resultfrom the i-STAT Alinity versus the mean of the duplicates from the i-STAT 1W.
280
i-STAT Alinity — System Operations Manual Art: 746363-01 Rev. I Rev. Date: 12-Apr-2019

In the method comparison table, n is the number of specimens, and r is the correlation coefficient.
n 186
slope 0.99
r 1.000
intercept 0.01
Xmin (mmol/L) 0.41
Xmax (mmol/L) 19.54
281
i-STAT Alinity — System Operations Manual Art: 746363-01 Rev. I Rev. Date: 12-Apr-2019
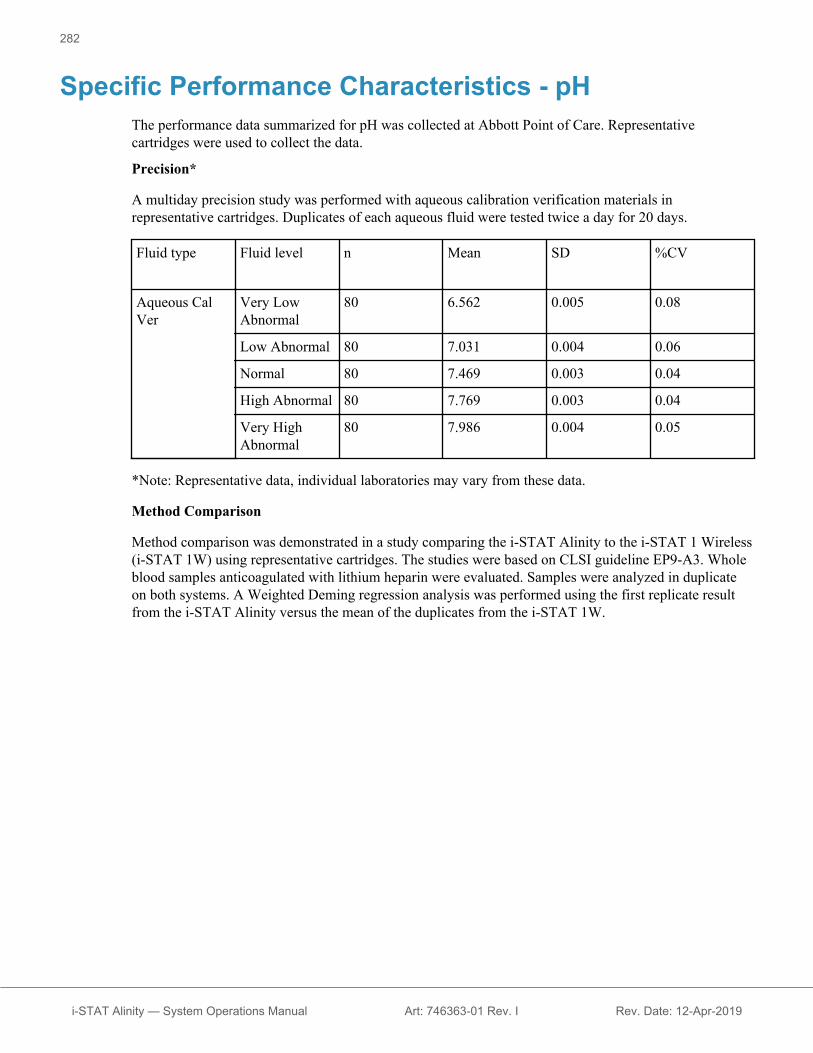
Specific Performance Characteristics - pHThe performance data summarized for pH was collected at Abbott Point of Care. Representativecartridges were used to collect the data.
Precision*
A multiday precision study was performed with aqueous calibration verification materials inrepresentative cartridges. Duplicates of each aqueous fluid were tested twice a day for 20 days.
Fluid type Fluid level n Mean SD %CV
Aqueous CalVer
Very LowAbnormal
80 6.562 0.005 0.08
Low Abnormal 80 7.031 0.004 0.06
Normal 80 7.469 0.003 0.04
High Abnormal 80 7.769 0.003 0.04
Very HighAbnormal
80 7.986 0.004 0.05
*Note: Representative data, individual laboratories may vary from these data.
Method Comparison
Method comparison was demonstrated in a study comparing the i-STAT Alinity to the i-STAT 1 Wireless(i-STAT 1W) using representative cartridges. The studies were based on CLSI guideline EP9-A3. Wholeblood samples anticoagulated with lithium heparin were evaluated. Samples were analyzed in duplicateon both systems. A Weighted Deming regression analysis was performed using the first replicate resultfrom the i-STAT Alinity versus the mean of the duplicates from the i-STAT 1W.
282
i-STAT Alinity — System Operations Manual Art: 746363-01 Rev. I Rev. Date: 12-Apr-2019

In the method comparison table, n is the number of specimens, and r is the correlation coefficient.
n 187
slope 0.990
r 0.999
intercept 0.075
Xmin 6.592
Xmax 8.189
283
i-STAT Alinity — System Operations Manual Art: 746363-01 Rev. I Rev. Date: 12-Apr-2019

Specific Performance Characteristics - PCO2The performance data summarized for PCO2 was collected at Abbott Point of Care. Representativecartridges were used to collect the data.
Precision*
A multiday precision study was performed with aqueous calibration verification materials inrepresentative cartridges. Duplicates of each aqueous fluid were tested twice a day for 20 days.
Fluid type Fluid level n Mean
(mmHg)
SD
(mmHg)
%CV
Aqueous CalVer
Very LowAbnormal
80 17.4 0.43 2.5
Low Abnormal 80 21.7 0.40 1.8
Normal 80 28.7 0.57 2.0
High Abnormal 80 56.2 1.18 2.1
Very HighAbnormal
80 84.5 1.93 2.3
*Note: Representative data, individual laboratories may vary from these data.
Method Comparison
Method comparison was demonstrated in a study comparing the i-STAT Alinity to the i-STAT 1 Wireless(i-STAT 1W) using representative cartridges. The studies were based on CLSI guideline EP9-A3. Wholeblood samples anticoagulated with lithium heparin were evaluated. Samples were analyzed in duplicateon both systems. A Weighted Deming regression analysis was performed using the first replicate resultfrom the i-STAT Alinity versus the mean of the duplicates from the i-STAT 1W.
284
i-STAT Alinity — System Operations Manual Art: 746363-01 Rev. I Rev. Date: 12-Apr-2019
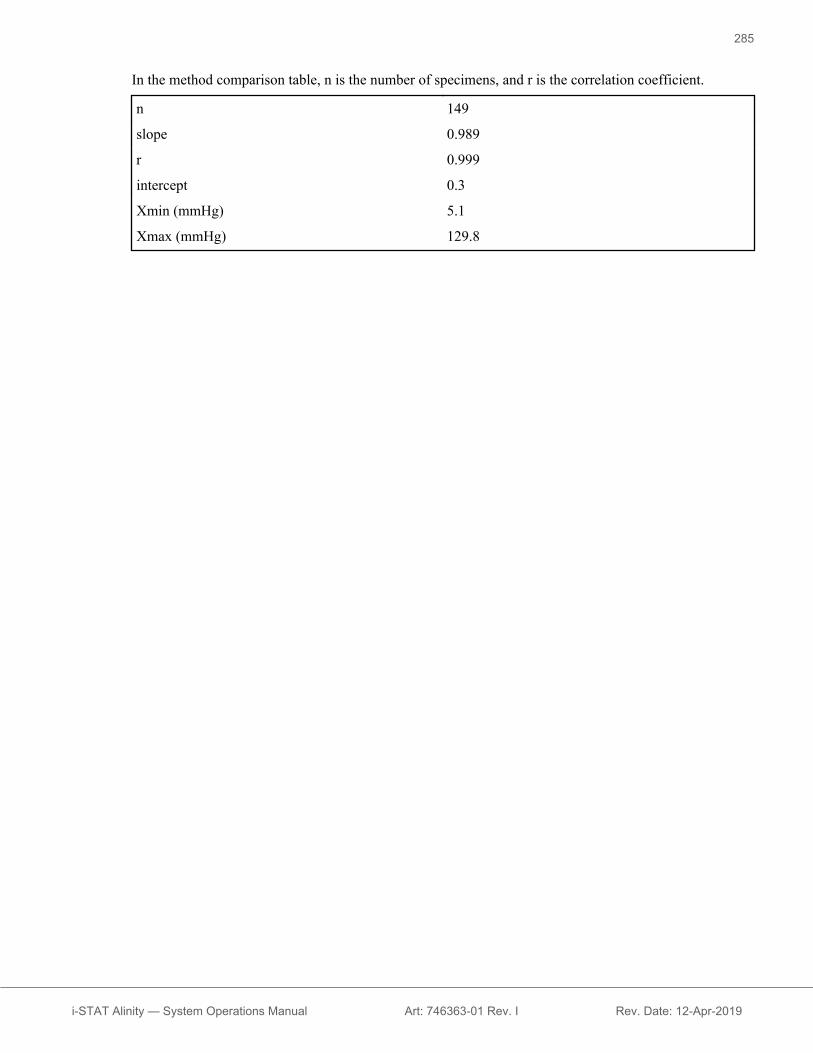
In the method comparison table, n is the number of specimens, and r is the correlation coefficient.
n 149
slope 0.989
r 0.999
intercept 0.3
Xmin (mmHg) 5.1
Xmax (mmHg) 129.8
285
i-STAT Alinity — System Operations Manual Art: 746363-01 Rev. I Rev. Date: 12-Apr-2019

Specific Performance Characteristics - PO2The performance data summarized for PO2 was collected at Abbott Point of Care. Representativecartridges were used to collect the data.
Precision*
A multiday precision study was performed with aqueous calibration verification materials inrepresentative cartridges. Duplicates of each aqueous fluid were tested twice a day for 20 days.
Fluid type Fluid level n Mean
(mmHg)
SD
(mmHg)
%CV
Aqueous CalVer
Very LowAbnormal
80 72.1 2.02 2.80
Low Abnormal 80 84.2 1.60 1.90
Normal 80 118.8 2.10 1.77
High Abnormal 80 152.1 3.49 2.29
Very HighAbnormal
80 377.1 8.52 2.26
*Note: Representative data, individual laboratories may vary from these data
Method Comparison
Method comparison was demonstrated in a study comparing the i-STAT Alinity to the i-STAT 1 Wireless(i-STAT 1W) using representative cartridges. The studies were based on CLSI guideline EP9-A3. Wholeblood samples anticoagulated with lithium heparin were evaluated. Samples were analyzed in duplicateon both systems. A Weighted Deming regression analysis was performed using the first replicate resultfrom the i-STAT Alinity versus the mean of the duplicates from the i-STAT 1W.
286
i-STAT Alinity — System Operations Manual Art: 746363-01 Rev. I Rev. Date: 12-Apr-2019

In the method comparison table, n is the number of specimens, and r is the correlation coefficient.
n 192
slope 0.986
r 0.998
intercept 0.0
Xmin (mmHg) 9
Xmax (mmHg) 705
287
i-STAT Alinity — System Operations Manual Art: 746363-01 Rev. I Rev. Date: 12-Apr-2019

Specific Performance Characteristics - CHLORIDEThe performance data summarized for chloride was collected at Abbott Point of Care. Representativecartridges were used to collect the data.
Precision*
A multiday precision study was performed with aqueous calibration verification materials inrepresentative cartridges. Duplicates of each aqueous fluid were tested twice a day for 20 days.
Fluid type Fluid level n Mean
(mmol/L)
SD
(mmol/L)
%CV
Aqueous CalVer
Very LowAbnormal
80 63.3 0.59 0.9
Low Abnormal 80 72.9 0.71 1.0
Normal 80 91.7 0.75 0.8
High Abnormal 80 112.4 0.90 0.8
Very HighAbnormal
80 124.1 1.08 0.9
*Note: Representative data, individual laboratories may vary from these data.
Method Comparison
Method comparison was demonstrated in a study comparing the i-STAT Alinity to the i-STAT 1 Wireless(i-STAT 1W) using representative cartridges. The studies were based on CLSI guideline EP9-A3. Wholeblood samples anticoagulated with lithium heparin were evaluated. Samples were analyzed in duplicateon both systems. A Weighted Deming regression analysis was performed using the first replicate resultfrom the i-STAT Alinity versus the mean of the duplicates from the i-STAT 1W.
288
i-STAT Alinity — System Operations Manual Art: 746363-01 Rev. I Rev. Date: 12-Apr-2019

In the method comparison table, n is the number of specimens, and r is the correlation coefficient.
Chloride Method Comparison
n 189
slope 1.01
r 0.999
intercept -0.76
Xmin (mmol/L) 66
Xmax (mmol/L) 140
289
i-STAT Alinity — System Operations Manual Art: 746363-01 Rev. I Rev. Date: 12-Apr-2019
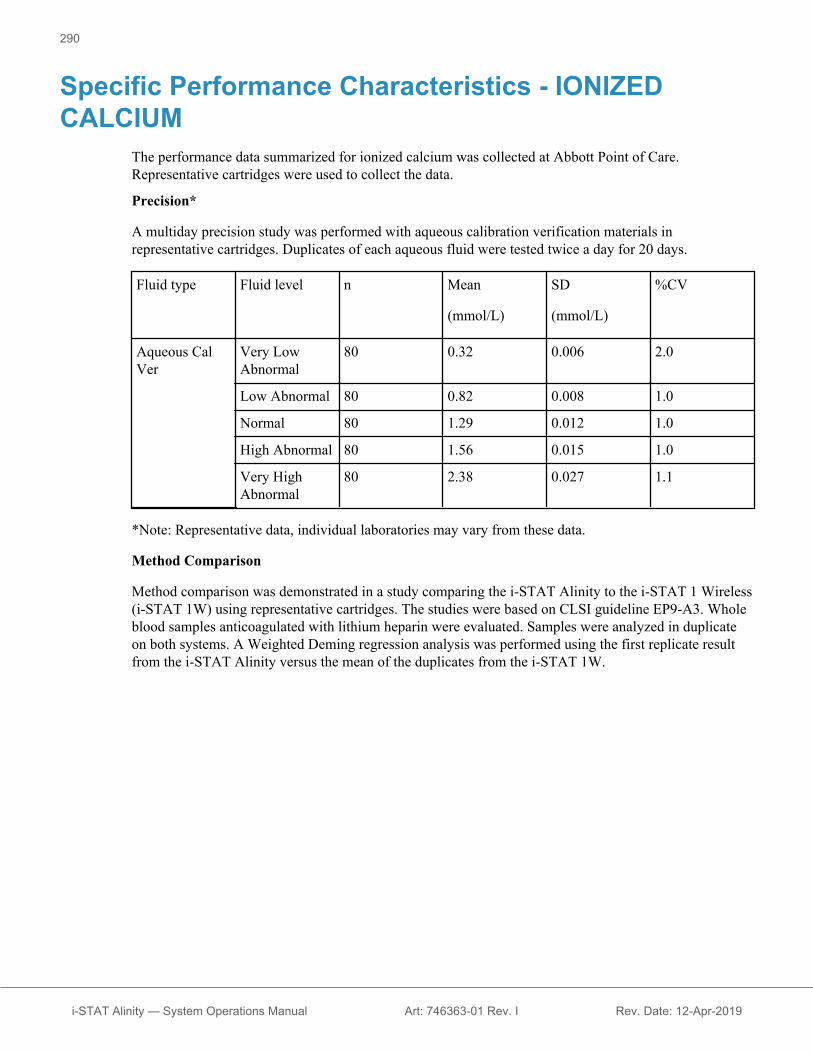
Specific Performance Characteristics - IONIZEDCALCIUM
The performance data summarized for ionized calcium was collected at Abbott Point of Care.Representative cartridges were used to collect the data.
Precision*
A multiday precision study was performed with aqueous calibration verification materials inrepresentative cartridges. Duplicates of each aqueous fluid were tested twice a day for 20 days.
Fluid type Fluid level n Mean
(mmol/L)
SD
(mmol/L)
%CV
Aqueous CalVer
Very LowAbnormal
80 0.32 0.006 2.0
Low Abnormal 80 0.82 0.008 1.0
Normal 80 1.29 0.012 1.0
High Abnormal 80 1.56 0.015 1.0
Very HighAbnormal
80 2.38 0.027 1.1
*Note: Representative data, individual laboratories may vary from these data.
Method Comparison
Method comparison was demonstrated in a study comparing the i-STAT Alinity to the i-STAT 1 Wireless(i-STAT 1W) using representative cartridges. The studies were based on CLSI guideline EP9-A3. Wholeblood samples anticoagulated with lithium heparin were evaluated. Samples were analyzed in duplicateon both systems. A Weighted Deming regression analysis was performed using the first replicate resultfrom the i-STAT Alinity versus the mean of the duplicates from the i-STAT 1W.
290
i-STAT Alinity — System Operations Manual Art: 746363-01 Rev. I Rev. Date: 12-Apr-2019

In the method comparison table, n is the number of specimens, and r is the correlation coefficient.
n 194
slope 1.005
r 1.000
intercept -0.001
Xmin (mmol/L) 0.40
Xmax (mmol/L) 2.44
291
i-STAT Alinity — System Operations Manual Art: 746363-01 Rev. I Rev. Date: 12-Apr-2019

Specific Performance Characteristics - GLUCOSEThe performance data summarized for glucose was collected by professionals trained in the use of thei‑STAT Alinity System and comparative methods. Representative cartridges were used to collect the data.
Precision*
A multiday precision study was performed with aqueous calibration verification materials inrepresentative cartridges. Duplicates of each aqueous fluid were tested twice a day for 20 days.
Fluid type Fluid level n Mean
(mg/dL)
SD
(mg/dL)
%CV
Aqueous CalVer
Very LowAbnormal
80 26.9 0.42 1.6
Low Abnormal 80 41.0 0.34 0.8
High Abnormal 80 125.0 0.32 0.3
Very HighAbnormal
80 286.7 0.77 0.3
HighestAbnormal
80 600.6 3.47 0.6
*Note: Representative data, individual laboratories may vary from these data.
Method Comparison
Method comparison was demonstrated in a study comparing the i-STAT Alinity to the i-STAT 1 Wireless(i-STAT 1W) using representative cartridges. The studies were based on CLSI guideline EP9-A3. Wholeblood samples anticoagulated with lithium heparin were evaluated. Samples were analyzed in duplicateon both systems. A Weighted Deming regression analysis was performed using the first replicate resultfrom the i-STAT Alinity versus the mean of the duplicates from the i-STAT 1W.
292
i-STAT Alinity — System Operations Manual Art: 746363-01 Rev. I Rev. Date: 12-Apr-2019

In the method comparison table, n is the number of specimens, and r is the correlation coefficient.
n 188
slope 1.00
r 1.000
intercept 1.17
Xmin (mg/dL) 24
Xmax (mg/dL) 671
293
i-STAT Alinity — System Operations Manual Art: 746363-01 Rev. I Rev. Date: 12-Apr-2019

Specific Performance Characteristics - BUNThe performance data summarized for BUN was collected at Abbott Point of Care. Representativecartridges were used to collect the data.
Precision*
A multiday precision study was performed with aqueous calibration verification materials inrepresentative cartridges. Duplicates of each aqueous fluid were tested twice a day for 20 days.
Fluid type Fluid level n Mean
(mg/dL)
SD
(mg/dL)
%CV
Aqueous CalVer
Very LowAbnormal
80 4.6 0.19 4.1
Low Abnormal 80 6.6 0.15 2.3
Normal 80 11.5 0.19 1.6
High Abnormal 80 54.3 0.66 1.2
Very HighAbnormal
80 108.4 1.07 1.0
*Note: Representative data, individual laboratories may vary from these data.
Method Comparison
Method comparison was demonstrated in a study comparing the i-STAT Alinity to the i-STAT 1 Wireless(i-STAT 1W) using representative cartridges. The studies were based on CLSI guideline EP9-A3. Wholeblood samples anticoagulated with lithium heparin were evaluated. Samples were analyzed in duplicateon both systems. A Weighted Deming regression analysis was performed using the first replicate resultfrom the i-STAT Alinity versus the mean of the duplicates from the i-STAT 1W.
294
i-STAT Alinity — System Operations Manual Art: 746363-01 Rev. I Rev. Date: 12-Apr-2019

In the method comparison table, n is the number of specimens, and r is the correlation coefficient.
n 194
slope 1.01
r 0.999
intercept -0.02
Xmin (mg/dL) 3
Xmax (mg/dL) 137
295
i-STAT Alinity — System Operations Manual Art: 746363-01 Rev. I Rev. Date: 12-Apr-2019

Specific Performance Characteristics - CREATININEand ESTIMATED GLOMERULAR FILTRATION RATE
The performance data summarized for creatinine was collected at Abbott Point of Care. Representativecartridges were used to collect the data.
Precision*
A multiday precision study was performed with aqueous calibration verification materials inrepresentative cartridges. Duplicates of each aqueous fluid were tested twice a day for 20 days.
Fluid type Fluid level n Mean
(mg/dL)
SD
(mg/dL)
%CV
Aqueous CalVer
Low Abnormal 80 0.27 0.028 10.3
Normal 80 1.05 0.025 2.4
High Abnormal 80 3.83 0.083 2.2
Very HighAbnormal
80 14.63 0.403 2.8
*Note: Representative data, individual laboratories may vary from these data.
Method Comparison
Method comparison was demonstrated in a study comparing the i-STAT Alinity to the i-STAT 1 Wireless(i-STAT 1W) using representative cartridges. The studies were based on CLSI guideline EP9-A3. Wholeblood samples anticoagulated with lithium heparin were evaluated. Samples were analyzed in duplicateon both systems. A Weighted Deming regression analysis was performed using the first replicate resultfrom the i-STAT Alinity versus the mean of the duplicates from the i-STAT 1W.
296
i-STAT Alinity — System Operations Manual Art: 746363-01 Rev. I Rev. Date: 12-Apr-2019
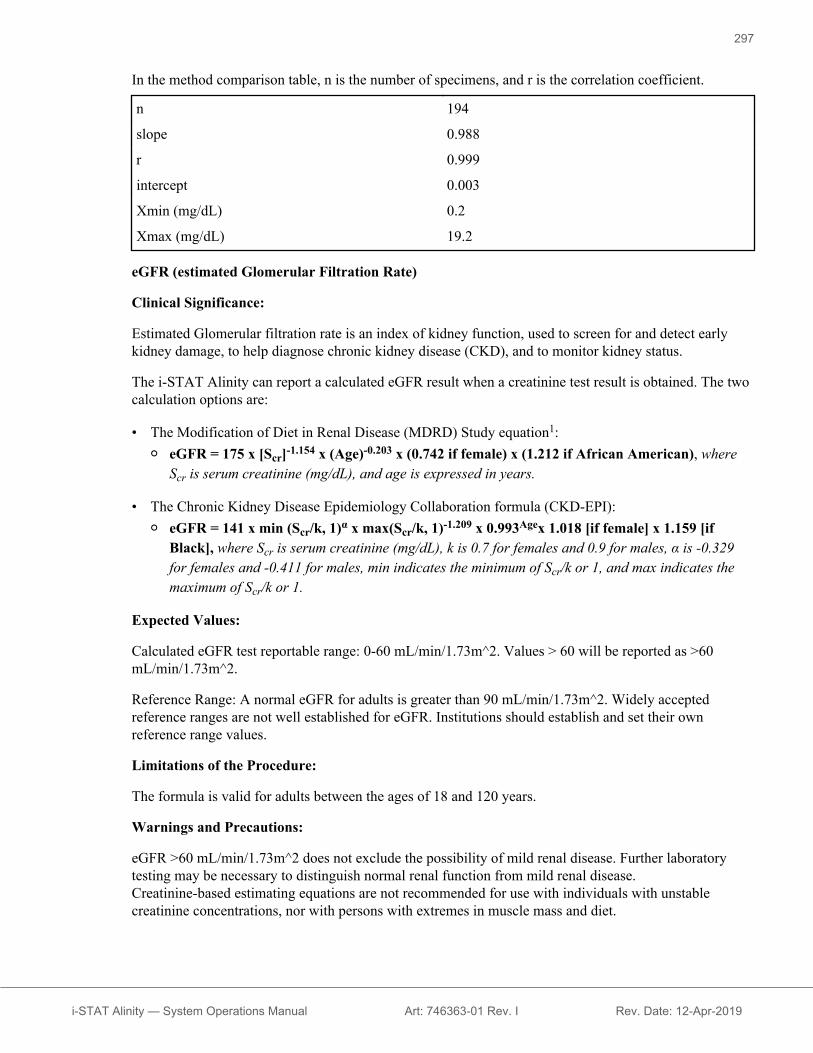
In the method comparison table, n is the number of specimens, and r is the correlation coefficient.
n 194
slope 0.988
r 0.999
intercept 0.003
Xmin (mg/dL) 0.2
Xmax (mg/dL) 19.2
eGFR (estimated Glomerular Filtration Rate)
Clinical Significance:
Estimated Glomerular filtration rate is an index of kidney function, used to screen for and detect earlykidney damage, to help diagnose chronic kidney disease (CKD), and to monitor kidney status.
The i-STAT Alinity can report a calculated eGFR result when a creatinine test result is obtained. The twocalculation options are:
• The Modification of Diet in Renal Disease (MDRD) Study equation1:○ eGFR = 175 x [Scr]-1.154 x (Age)-0.203 x (0.742 if female) x (1.212 if African American), where
Scr is serum creatinine (mg/dL), and age is expressed in years.
• The Chronic Kidney Disease Epidemiology Collaboration formula (CKD-EPI):○ eGFR = 141 x min (Scr/k, 1)α x max(Scr/k, 1)-1.209 x 0.993Agex 1.018 [if female] x 1.159 [if
Black], where Scr is serum creatinine (mg/dL), k is 0.7 for females and 0.9 for males, α is -0.329for females and -0.411 for males, min indicates the minimum of Scr/k or 1, and max indicates themaximum of Scr/k or 1.
Expected Values:
Calculated eGFR test reportable range: 0-60 mL/min/1.73m^2. Values > 60 will be reported as >60mL/min/1.73m^2.
Reference Range: A normal eGFR for adults is greater than 90 mL/min/1.73m^2. Widely acceptedreference ranges are not well established for eGFR. Institutions should establish and set their ownreference range values.
Limitations of the Procedure:
The formula is valid for adults between the ages of 18 and 120 years.
Warnings and Precautions:
eGFR >60 mL/min/1.73m^2 does not exclude the possibility of mild renal disease. Further laboratorytesting may be necessary to distinguish normal renal function from mild renal disease.Creatinine-based estimating equations are not recommended for use with individuals with unstablecreatinine concentrations, nor with persons with extremes in muscle mass and diet.
297
i-STAT Alinity — System Operations Manual Art: 746363-01 Rev. I Rev. Date: 12-Apr-2019

The MDRD eGFR equation has not been validated for those who are 70 years of age or older becausemuscle mass normally decreases with age. As a result, eGFR for patients older than 70 requires clinicalcorrelation but is still regarded as a useful tool when caring for patients older than 70.1
298
i-STAT Alinity — System Operations Manual Art: 746363-01 Rev. I Rev. Date: 12-Apr-2019

Specific Performance Characteristics - TCO2The performance data summarized for TCO2 was collected at Abbott Point of Care. Representativecartridges were used to collect the data.
Precision*
A multiday precision study was performed with aqueous calibration verification materials inrepresentative cartridges. Duplicates of each aqueous fluid were tested twice a day for 20 days.
Fluid type Fluid level n Mean
(mmol/L)
SD
(mmol/L)
%CV
Aqueous CalVer
Very LowAbnormal
80 9.2 0.24 2.6
Low Abnormal 80 14.9 0.40 2.7
Normal 80 19.6 0.58 3.0
High Abnormal 80 29.7 0.86 2.9
Very HighAbnormal
80 42.0 1.37 3.3
*Note: Representative data, individual laboratories may vary from these data.
Method Comparison
Method comparison was demonstrated in a study comparing the i-STAT Alinity to the i-STAT 1 Wireless(i-STAT 1W) using representative cartridges. The studies were based on CLSI guideline EP9-A3. Wholeblood samples anticoagulated with lithium heparin were evaluated. Samples were analyzed in duplicateon both systems. A Weighted Deming regression analysis was performed using the first replicate resultfrom the i-STAT Alinity versus the mean of the duplicates from the i-STAT 1W.
299
i-STAT Alinity — System Operations Manual Art: 746363-01 Rev. I Rev. Date: 12-Apr-2019

In the method comparison table, n is the number of specimens, and r is the correlation coefficient.
n 195
Slope 0.980
r 0.994
intercept 0.3
Xmin (mmol/L) 10
Xmax (mmol/L) 49
300
i-STAT Alinity — System Operations Manual Art: 746363-01 Rev. I Rev. Date: 12-Apr-2019
Specific Performance Characteristics - KaolinActivated Clotting Time (KaolinACT)
The performance data summarized for Kaolin Activated Clotting Time (KaolinACT) was collected byprofessionals trained in the use of the i‑STAT Alinity System and comparative methods. All data uses thepre-warm calibration.
Precision*
A multiday precision study was performed with plasma control materials using KaolinACT cartridges.Duplicates of each aqueous fluid were tested twice a day for 20 days.
Fluid type Fluid level n Mean(seconds)
SD(seconds)
%CV
PlasmaControl
Level 1 80 167 6 3.6
Level 2 80 455 13 2.9
*Representative data, individual laboratories may vary from these results.
Method Comparison
Method comparison was demonstrated in a study comparing the KaolinACT test performed on the i-STATAlinity to the CeliteACT test performed on the i-STAT1 Wireless (i-STAT1 W). The study was based onCLSI guideline EP09-A3. Non-anticoagulated whole blood altered with several levels of heparin and byhemodilution with lactated Ringer’s were evaluated. Samples were analyzed in duplicate on both systems.A Passing-Bablok regression analysis was performed using the first replicate result from the i-STATAlinity versus the first replicate result from the i STAT1 W.
301
i-STAT Alinity — System Operations Manual Art: 746363-01 Rev. I Rev. Date: 12-Apr-2019
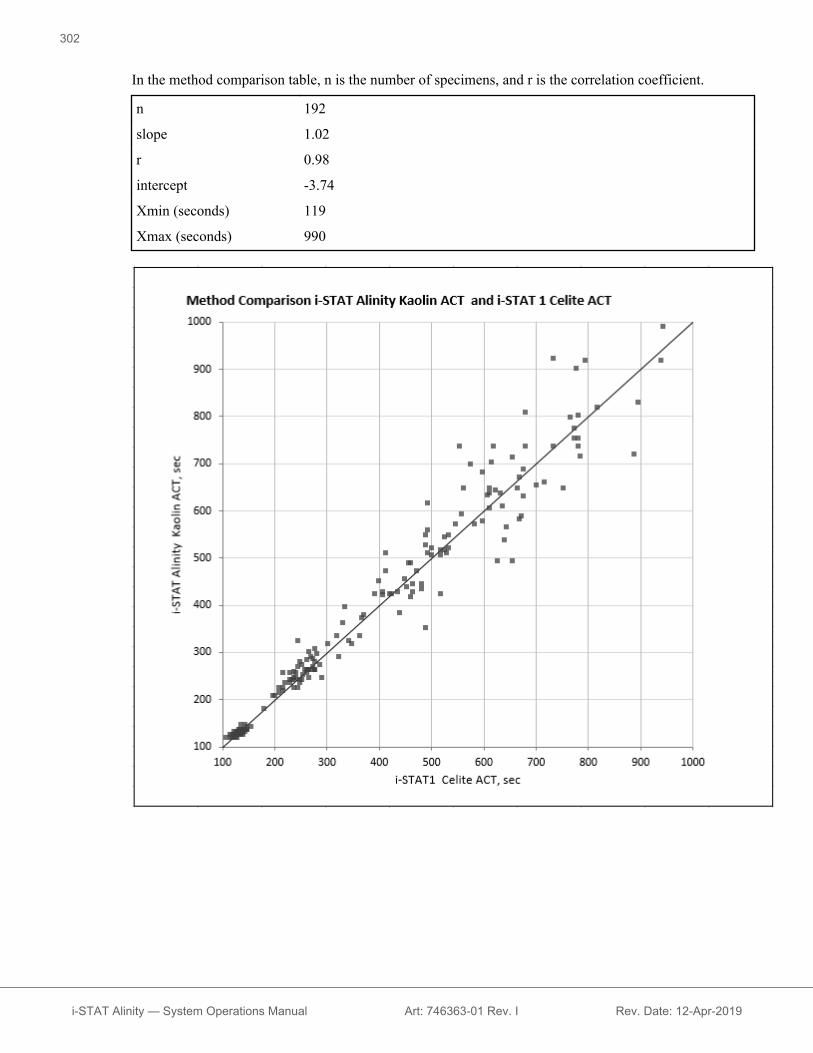
In the method comparison table, n is the number of specimens, and r is the correlation coefficient.
n 192
slope 1.02
r 0.98
intercept -3.74
Xmin (seconds) 119
Xmax (seconds) 990
302
i-STAT Alinity — System Operations Manual Art: 746363-01 Rev. I Rev. Date: 12-Apr-2019
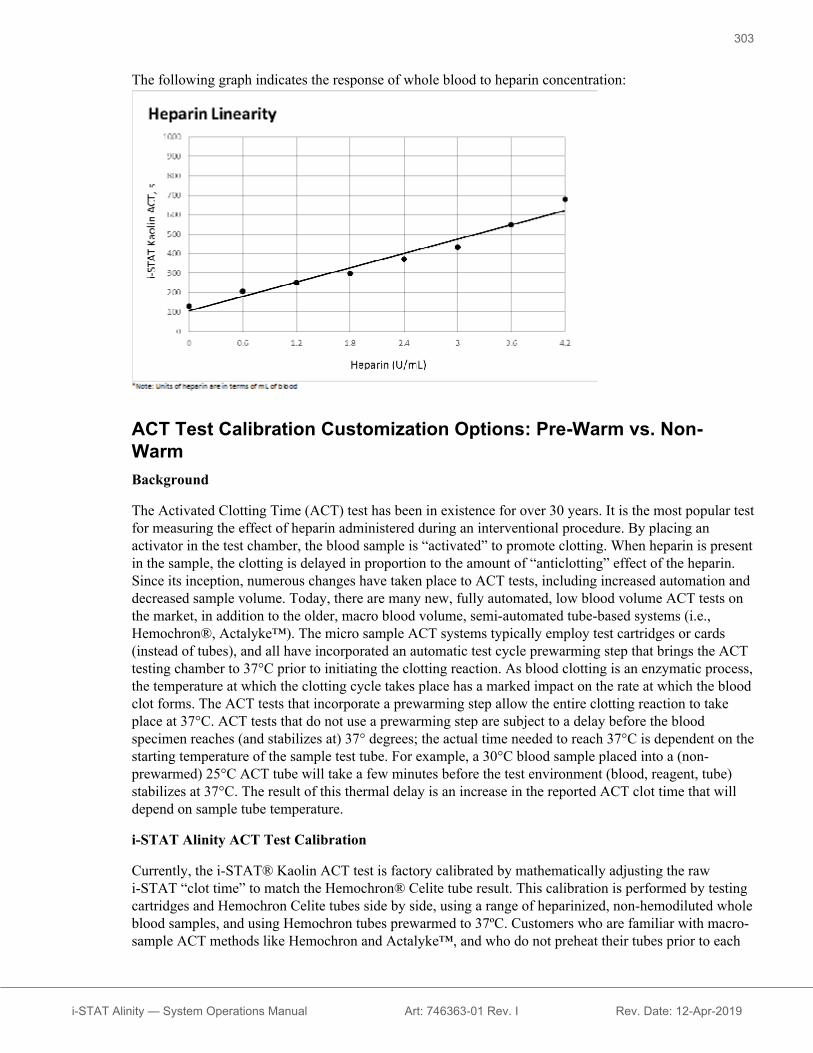
The following graph indicates the response of whole blood to heparin concentration:
ACT Test Calibration Customization Options: Pre-Warm vs. Non-WarmBackground
The Activated Clotting Time (ACT) test has been in existence for over 30 years. It is the most popular testfor measuring the effect of heparin administered during an interventional procedure. By placing anactivator in the test chamber, the blood sample is “activated” to promote clotting. When heparin is presentin the sample, the clotting is delayed in proportion to the amount of “anticlotting” effect of the heparin.Since its inception, numerous changes have taken place to ACT tests, including increased automation anddecreased sample volume. Today, there are many new, fully automated, low blood volume ACT tests onthe market, in addition to the older, macro blood volume, semi-automated tube-based systems (i.e.,Hemochron®, Actalyke™). The micro sample ACT systems typically employ test cartridges or cards(instead of tubes), and all have incorporated an automatic test cycle prewarming step that brings the ACTtesting chamber to 37°C prior to initiating the clotting reaction. As blood clotting is an enzymatic process,the temperature at which the clotting cycle takes place has a marked impact on the rate at which the bloodclot forms. The ACT tests that incorporate a prewarming step allow the entire clotting reaction to takeplace at 37°C. ACT tests that do not use a prewarming step are subject to a delay before the bloodspecimen reaches (and stabilizes at) 37° degrees; the actual time needed to reach 37°C is dependent on thestarting temperature of the sample test tube. For example, a 30°C blood sample placed into a (non-prewarmed) 25°C ACT tube will take a few minutes before the test environment (blood, reagent, tube)stabilizes at 37°C. The result of this thermal delay is an increase in the reported ACT clot time that willdepend on sample tube temperature.
i-STAT Alinity ACT Test Calibration
Currently, the i-STAT® Kaolin ACT test is factory calibrated by mathematically adjusting the rawi‑STAT “clot time” to match the Hemochron® Celite tube result. This calibration is performed by testingcartridges and Hemochron Celite tubes side by side, using a range of heparinized, non-hemodiluted wholeblood samples, and using Hemochron tubes prewarmed to 37ºC. Customers who are familiar with macro-sample ACT methods like Hemochron and Actalyke™, and who do not preheat their tubes prior to each
303
i-STAT Alinity — System Operations Manual Art: 746363-01 Rev. I Rev. Date: 12-Apr-2019

test, have found that the bias in results between their previous ACT method and the i-STAT ACT (pre-warm) may require changing familiar clotting time target values. To ease the changeover to the i-STATACT method, i-STAT provides a choice between the current 37ºC result calibration (pre-warm) and anambient temperature result calibration (non-warm). The non-warm calibration mode allows an i-STATACT cartridge to deliver results closer to macro-sample methods that do not employ automaticprewarming cycles. This is intended to reduce the need to make large changes to ACT target times orranges.
Since micro-sample methods (Medtronic HR-ACT, Hemochron Jr. ACT+) already incorporate preheatingof the test cuvettes, users with ACT target times and ranges based on these methods should continue touse the default i-STAT 37ºC calibration (pre-warm). To change this customization, see the CustomizationWorkspace section of the System Operations Manual.
Verify the instrument for cartridge testing
Note: Verification is only required once per cartridge type per instrument.
Prior to using an instrument requiring a specific cartridge type, verify the instrument supports thecartridge:1. Initiate a liquid quality control test per the instructions in the Liquid Quality Controls section of the
System Operations Manual.2. Ensure the instrument can successfully scan the cartridge pouch barcode.3. If the cartridge is not recognized, contact your local representative.
Verify customization on instrument
Prior to testing patient samples, it is recommended to check the result calculation customization set in theinstrument. Touch More Options > View Action Ranges and Analyte Information.
304
i-STAT Alinity — System Operations Manual Art: 746363-01 Rev. I Rev. Date: 12-Apr-2019

REFERENCES1. 1. Levey AS, Coresh J, Greene T, Stevens LA, Zhang YL, Hendriksen S, Kusek JW, Van Lente F;
Chronic Kidney Disease Epidemiology Collaboration. Using standardized serum creatinine values inthe modification of diet in renal disease study equation for estimating glomular filtration rate. AnnIntern Med. 2006; 145:247-254
MANUFACTURER
i-STAT and Alinity are trademarks of the Abbott Group of Companies in various jurisdictions.
305
i-STAT Alinity — System Operations Manual Art: 746363-01 Rev. I Rev. Date: 12-Apr-2019

306
i-STAT Alinity — System Operations Manual Art: 746363-01 Rev. I Rev. Date: 12-Apr-2019

Rev. Date: 23-APR-18 Art: 714173-01Q
SODIUM/NA
Sodium is measured by ion-selective electrode potentiometry. In the calculation of results for sodium, concentration is related to potential through the Nernst equation.
The i-STAT System uses direct (undiluted) electrochemical methods. Values obtained by direct methods may differ from those obtained by indirect (diluted) methods.1
See below for information on factors affecting results. Certain substances, such as drugs, may affect analyte levels in vivo.2
If results appear inconsistent with the clinical assessment, the patient sample should be retested using another cartridge.
Intended Use
The test for sodium, as part of the i-STAT System, is intended for use in the in vitro quantification of sodium in arterial, venous, or capillary whole blood.
Sodium measurements are used for monitoring electrolyte imbalances.
Contents
Each i-STAT cartridge contains one reference electrode (when potentiometric sensors are included in the cartridge configuration), sensors for the measurement of specific analytes and a buffered aqueous calibrant solution that contains known concentrations of analytes and preservatives. For cartridges that contain a sensor for the measurement of sodium, a list of reactive ingredients is indicated below:
Reactive Ingredient Minimum Quantity
Sodium (Na+) 121 mmol/L
Metrological Traceability
The i-STAT System test for sodium measures sodium amount-of-substance concentration in the plasma fraction of arterial, venous, or capillary whole blood (dimension mmol L-1) for in vitro diagnostic use. Sodium values assigned to i-STAT’s controls and calibration verification materials are traceable to the U.S. National Institute of Standards and Technology (NIST) standard reference material SRM956. i-STAT System controls and calibration verification materials are validated for use only with the i-STAT System and assigned values may not be commutable with other methods. Further information regarding metrological traceability is available from Abbott Point of Care Inc.
Expected Values
Reportable Reference Test/Abbreviation Units* Range Range3
Sodium/Na mmol/L (mEq/L) 100–180 138 – 146
*The i-STAT System can be configured with the preferred units.
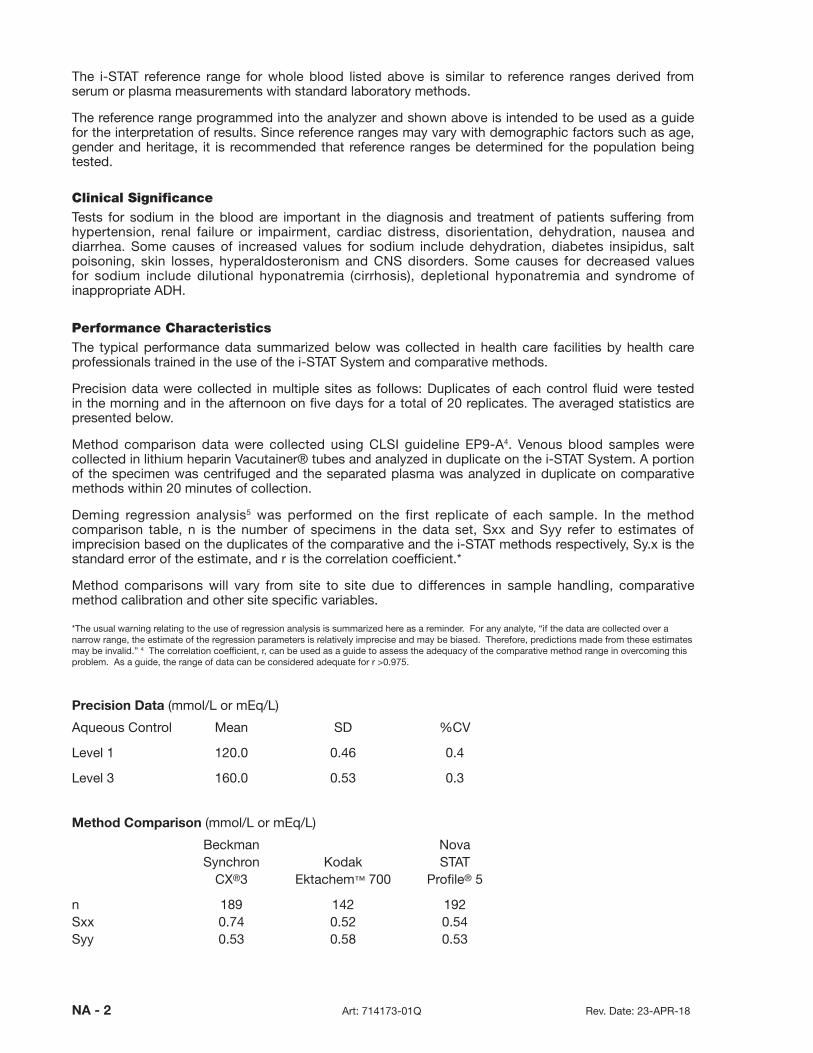
NA - 2 Art: 714173-01Q Rev. Date: 23-APR-18
The i-STAT reference range for whole blood listed above is similar to reference ranges derived from serum or plasma measurements with standard laboratory methods.
The reference range programmed into the analyzer and shown above is intended to be used as a guide for the interpretation of results. Since reference ranges may vary with demographic factors such as age, gender and heritage, it is recommended that reference ranges be determined for the population being tested.
Clinical SignificanceTests for sodium in the blood are important in the diagnosis and treatment of patients suffering from hypertension, renal failure or impairment, cardiac distress, disorientation, dehydration, nausea and diarrhea. Some causes of increased values for sodium include dehydration, diabetes insipidus, salt poisoning, skin losses, hyperaldosteronism and CNS disorders. Some causes for decreased values for sodium include dilutional hypona tremia (cirrhosis), depletional hyponatremia and syndrome of inappropriate ADH.
Performance CharacteristicsThe typical performance data summarized below was collected in health care facilities by health care professionals trained in the use of the i-STAT System and comparative methods.
Precision data were collected in multiple sites as follows: Duplicates of each control fluid were tested in the morning and in the afternoon on five days for a total of 20 replicates. The averaged statistics are presented below.
Method comparison data were collected using CLSI guideline EP9-A4. Venous blood samples were collected in lithium heparin Vacutainer® tubes and analyzed in duplicate on the i-STAT System. A portion of the specimen was centri fuged and the separated plasma was analyzed in duplicate on comparative methods within 20 minutes of collection.
Deming regression analysis5 was performed on the first replicate of each sample. In the method comparison table, n is the number of specimens in the data set, Sxx and Syy refer to estimates of imprecision based on the duplicates of the comparative and the i-STAT methods respectively, Sy.x is the standard error of the estimate, and r is the correlation coefficient.*
Method comparisons will vary from site to site due to differences in sample handling, comparative method calibration and other site specific variables.
*The usual warning relating to the use of regression analysis is summarized here as a reminder. For any analyte, “if the data are collected over a narrow range, the estimate of the regression parameters is relatively imprecise and may be biased. Therefore, predictions made from these estimates may be invalid.” 4 The correlation coefficient, r, can be used as a guide to assess the adequacy of the comparative method range in overcoming this problem. As a guide, the range of data can be considered adequate for r >0.975.
Precision Data (mmol/L or mEq/L)
Aqueous Control Mean SD %CV
Level 1 120.0 0.46 0.4
Level 3 160.0 0.53 0.3
Method Comparison (mmol/L or mEq/L)
Beckman Nova Synchron Kodak STAT CX®3 Ektachem™ 700 Profile® 5
n 189 142 192 Sxx 0.74 0.52 0.54 Syy 0.53 0.58 0.53

Rev. Date: 23-APR-18 Art: 714173-01Q NA - 3
Slope 1.00 0.98 0.95 Int’t -0.11 3.57 5.26 Sy.x 1.17 1.04 1.53 Xmin 126 120 124 Xmax 148 148 148 r 0.865 0.937 0.838
Cartridge Comparison
The performance characteristics of the sensors are equivalent in all cartridge configurations. System difference analysis was performed on 40 patient samples using the i-STAT 6+ and i-STAT EC4+ cartridges. In the 130–150 mmol/L range the average difference was 0.750.
Factors Affecting Results*
Sodium heparin may increase sodium results up to 1 mmol/L6.
Hemodilution of the plasma by more than 20% associated with priming cardiopulmonary bypass pumps, plasma volume expansion or other fluid administration therapies using certain solutions may cause clinically significant error on sodium, chloride, ionized calcium and pH results. These errors are associated with solutions that do not match the ionic characteristics of plasma. To minimize these errors when hemodiluting by more than 20%, use physiologically balanced multi-electrolyte solutions containing low-mobility anions (e.g., gluconate).
Interference studies were based on CLSI guideline EP7-A27. Test concentrations used were as per the CLSI guideline unless otherwise indicated.
When added to a plasma pool the following substances (at the concentrations indicated) were found to interfere with the i-STAT sodium assay:
Substance Test Concentration(mmol/L) Interference
Bromide 37.5 Use another method. See Note 1 below.
Nithiodote (sodium thiosulfate) 16.712 Increased i-STAT Sodium results. See Note 2 below.
The following substances are known not to significantly interfere with the i-STAT sodium assay at the stated test concentrations:
Substance Test Concentration(mmol/L)
Acetaminophen 1.32 Acetylcysteine 10.2
Ascorbate 0.34 Bromide (therapeutic) 2.5 8,9,10
β-Hydroxybutyrate 6.0 11
Lactate 6.6 Magnesium Chloride 1.0
Salicylate 4.34
NA - 4 Art: 714173-01Q Rev. Date: 23-APR-18
Note:
1) Bromide has been tested at two levels: the CLSI recommended level and a therapeutic plasma concentration level of 2.5 mmol/L. The latter is the peak plasma concentration associated with halothane anesthesia, in which bromide is released. APOC has not identified a therapeutic condition that would lead to levels consistent with the CLSI recommended level. Bromide at a concentration of 37.5 mmol/L increased i-STAT sodium results, while a therapeutic range of bromide (2.5 mmol/L) did not significantly interfere with i-STAT sodium results.
2) Nithiodote (sodium thiosulfate) is indicated for the treatment of acute cyanide poisoning. The journal article titled “Falsely increased chloride and missed anion gap elevation during treatment with sodium thiosulfate” indicated that sodium thiosulfate could be used in the treatment of calciphylaxis indicating that “the highest concentration likely to be seen in plasma [is] after infusion of a 12.5 g dose of sodium thiosulfate pentahydrate. Assuming that the 12.5 g dose of sodium thiosulfate pentahydrate is distributed in a typical blood volume of 5 L with a hematocrit of 40%, the peak sodium thiosulfate plasma concentration expected is 16.7 mmol/L.”12
*It is possible that other interfering substances may be encountered. The degree of interference at concentrations other than those listed might not be predictable.

Abbott Point of Care Inc.100 and 200 Abbott Park RoadAbbott Park, IL 60064 • USA
Emergo EuropePrinsessegracht 202514 AP The Hague
The Netherlands
©2018 Abbott Point of Care Inc. All rights reserved. Printed in USA.
Rev. Date: 23-APR-18 Art: 714173-01Q NA - 5
References1. N.W. Tietz, E.L. Pruden, O. Siggaard-Andersen, “Electrolytes “ in Tietz Textbook of Clinical Chemistry—Second Edition, C.A. Burtis and E.R. Ashwood, eds. (Philadelphia: W.B. Saunders Company, 1994).
2. D.S. Young, Effects of Drugs on Clinical Laboratory Tests, 3rd ed. (Washington, DC: American Association of Clinical Chemistry, 1990).
3. B.E. Statland, Clinical Decision Levels for Lab Tests (Oradell, NJ: Medical Economic Books, 1987).
4. CLSI. Method Comparison and Bias Estimation Using Patient Samples; Approved Guideline. NCCLS document EP9-A [ISBN 1-56238-283-7]. CLSI, 940 West Valley Road, Suite 1400, Wayne, Pennsylvania 19087-1898, USA 1995.
5. P.J. Cornbleet and N. Gochman, “Incorrect Least-Squares Regression Coefficients in Method-Comparison Analysis,” Clinical Chemistry 25:3, 432 (1979).
6. Tips on Specimen Collection. Vol 1. Monograph of Medical Laboratory Observer's "Tips from the Clinical Experts", published by Medical Economics in collaboration with Becton, Dickinson and Company. Mark Zacharia, ed. Montvale NJ; 1997:26.
7. Clinical and Laboratory Standards Institute (CLSI). Interference Testing in Clinical Chemistry; Approved Guideline-Second Edition. CLSI document EP7-A2 (ISBN 1-56238-584-4). Clinical and Laboratory Standards Institute, 940 West Valley Road, Suite 1400, Wayne, Pennsylvania 19087-1898, USA 2005.
8. Kharasch E.D., Hankins D., Mautz D., Thummel K.E.. Identification of the enzyme responsible for oxidative halothane metabolism: implications for prevention of halothane hepatitis. Lancet 1996; 347:1367-71.
9. Morrison J.E., Friesen R.H., Elevated serum bromide concentrations following repeated halothane anaesthesia in a child. Can J Asaesth 1990; 37 (7): 801-803.
10. Hankins D.C, Kharasch E.D., Determination of the halothane metabolites trifluoroacetic acid and bromide in plasma and urine by ion chromatography. J of Chromatography B. 692 (1997) 413-418.
11. Charles R.A, Bee Y.M, Eng P.H.K., Goh S.Y. Point of care blood ketone testing: screening for diabetic ketoacidosis at the emergency department. Singapore Med J 2007; 48 (11): 986.
12. Wendroth Scott M., Tiffany N. Heady, Doris M. Haverstick, Lorin M. Bachmann, Mitchell G. Scott, James C. Boyd, and David E. Bruns. Falsely increased chloride and missed anion gap elevation during treatment with sodium thiosulfate. Clinica Chimica Acta 2014; 431: 77–79.
i-STAT is a registered trademark of the Abbott Group of Companies in various jurisdictions. Vacutainer is a registered trademark of Becton Dickinson and Company, Franklin Lakes, NJ USA. CX®3 is a registered trademark of Beckman Coulter Incorporated, Fullerton CA USA. Ektachem was a trademark of Kodak Clinical Diagnostics. This system is now the Vitros®distributed by Ortho-Clinical Diagnostics, Rochester, NY USA. Stat Profile is a registered trademark of Nova Biomedical, Waltham, MA USA.


Rev. Date: 23-APR-18 Art: 714174-01P
POTASSIUM/K
Potassium is measured by ion-selective electrode potentiometry. In the calculation of results for potassium, concentration is related to potential through the Nernst equation.
The i-STAT® System uses direct (undiluted) electrochemical methods. Values obtained by direct methods may differ from those obtained by indirect (diluted) methods.1
See below for information on factors affecting results. Certain substances, such as drugs, may affect analyte levels in vivo.2
If results appear inconsistent with the clinical assessment, the patient sample should be retested using another cartridge.
Intended UseThe test for potassium, as part of the i-STAT System, is intended for use in the in vitro quantification of potassium in arterial, venous, or capillary whole blood.
Potassium measurements are used in the diagnosis and monitoring of diseases and clinical conditions that manifest high and low potassium levels.
ContentsEach i-STAT cartridge contains one reference electrode (when potentiometric sensors are included in the cartridge configuration), sensors for the measurement of specific analytes and a buffered aqueous calibrant solution that contains known concentrations of analytes and preservatives. For cartridges that contain a sensor for the measurement of potassium, a list of reactive ingredients is indicated below:
Reactive Ingredient Minimum QuantityPotassium (K+) 3.6 mmol/L
Metrological TraceabilityThe i-STAT System test for potassium measures potassium amount-of-substance concentration in the plasma fraction of arterial, venous, or capillary whole blood (dimension mmol L-1) for in vitro diagnostic use. Potassium values assigned to i-STAT’s controls and calibration verification materials are traceable to the U.S. National Institute of Standards and Technology (NIST) standard reference material SRM956. i-STAT System controls and calibration verification materials are validated for use only with the i-STAT System and assigned values may not be commutable with other methods. Further information regarding metrological traceability is available from Abbott Point of Care Inc.
Expected Values Reportable Reference Test/Abbreviation Units* Range Range3
Potassium/K mmol/L (mEq/L) 2 – 9 3.5 – 4.9**
*The i-STAT System can be configured with the preferred units.
**The reference range for potassium listed above has been reduced by 0.2 mmol/L from the range cited in Reference 3 to account for the difference between serum and plasma results.

K - 2 Art: 714174-01P Rev. Date: 23-APR-18
The i-STAT reference range for whole blood listed above is similar to reference ranges derived from serum or plasma measurements with standard laboratory methods.
The reference range programmed into the analyzer and shown above is intended to be used as a guide for the interpretation of results. Since reference ranges may vary with demographic factors such as age, gender and heritage, it is recommended that reference ranges be determined for the population being tested.
Clinical SignificanceTests for potassium in the blood are important in the diagnosis and treatment of patients suffering from hypertension, renal failure or impairment, cardiac distress, disorientation, dehydration, nausea and diarrhea. Some causes of increased values for potassium include renal glomerular disease, adrenocortical insufficiency, diabetic ketacidosis (DKA), sepsis and in vitro hemolysis. Some causes of decreased values for potassium include renal tubular disease, hyperaldosteronism, treatment of DKA, hyperinsulinism, metabolic alkalosis and diuretic therapy.
Performance CharacteristicsThe typical performance data summarized below was collected in health care facilities by health care professionals trained in the use of the i-STAT System and comparative methods.
Precision data were collected in multiple sites as follows: Duplicates of each control fluid were tested in the morning and in the afternoon on five days for a total of 20 replicates. The averaged statistics are presented below.
Method comparison data were collected using CLSI guideline EP9-A.4 Venous blood samples were collected in lithium heparin Vacutainer® tubes and analyzed in duplicate on the i-STAT System. A portion of the specimen was centri fuged and the separated plasma was analyzed in duplicate on comparative methods within 20 minutes of collection.
Deming regression analysis5 was performed on the first replicate of each sample. In the method comparison table, n is the number of specimens in the data set, Sxx and Syy refer to estimates of imprecision based on the duplicates of the comparative and the i-STAT methods respectively, Sy.x is the standard error of the estimate, and r is the correlation coefficient.*
Method comparisons will vary from site to site due to differences in sample handling, comparative method calibration and other site specific variables.
*The usual warning relating to the use of regression analysis is summarized here as a reminder. For any analyte, “if the data are collected over a narrow range, the estimate of the regression parameters is relatively imprecise and may be biased. Therefore, predictions made from these estimates may be invalid.”4 The correlation coefficient, r, can be used as a guide to assess the adequacy of the comparative method range in overcoming this problem. As a guide, the range of data can be considered adequate for r >0.975.
Precision Data (mmol/L or mEq/L)
Aqueous Control Mean SD %CV
Level 1 2.85 0.038 1.3
Level 3 6.30 0.039 0.6

Rev. Date: 23-APR-18 Art: 714174-01P K - 3
Method Comparison (mmol/L or mEq/L)
Beckman Nova Synchron Kodak STAT CX®3 Ektachem™ 700 Profile® 5
n 189 142 192 Sxx 0.060 0.031 0.065 Syy 0.055 0.059 0.055 Slope 0.97 1.06 0.99 Int't 0.02 -0.15 -0.01 Sy.x 0.076 0.060 0.112 Xmin 2.8 3.0 2.8 Xmax 5.7 9.2 5.8 r 0.978 0.993 0.948
Cartridge ComparisonThe performance characteristics of the sensors are equivalent in all cartridge configurations. System difference analysis was performed on 40 patient samples using the i-STAT 6+ and i-STAT EC4+ cartridges. In the 3.0–5.0 mmol/L range the average difference was 0.049.
Factors Affecting Results*If heparinized whole blood is allowed to stand before testing, potassium values will first decrease slightly, then increase over time. Potassium values will increase in iced specimens.
Potassium values from anticoagulated samples are preferred to serum values because 0.1 to 0.7 mmol/L potassium can be released from platelets1 and red blood cells during the clotting process. Potassium values obtained from skin puncture samples may vary due to hemolysis or an increase in tissue fluid from improper technique during the collection procedure.
Interference studies were based on CLSI guideline EP7-A2.6 Test concentrations used were as per the CLSI guideline unless otherwise indicated.
When added to a plasma pool the following substances (at the concentrations indicated) were found to interfere with the i-STAT potassium assay:
Substance Test Concentration (mmol/L) Interference
Bromide 37.5Use another method.
See Note 1 below.
Nithiodote (sodium thiosulfate) 16.78Decreased i-STAT Potassium results.
See Note 2 below.
The following substances are known not to significantly interfere with the i-STAT potassium assay at the stated test concentrations:
SubstanceTest Concentration
(mmol/L)Acetaminophen 1.32 Acetylcysteine 10.2
Ascorbate 0.34 Bromide 2.5
ß-Hydroxybutyrate 6.0 7
Lactate 6.6 Magnesium Chloride 1.0
Salicylate 4.34
Note 1: Bromide has been tested at two levels: the CLSI recommended level and a therapeutic plasma concentration of 2.5 mmol/L. The latter is the peak plasma concentration associated with halothane

K - 4 Art: 714174-01P Rev. Date: 23-APR-18
anesthesia, in which bromide is released. APOC has not identified a therapeutic condition that would lead to levels consistent with the CLSI recommended level. Bromide at a concentration of 37.5 mmol/L increased i-STAT potassium results and the rate of potassium star (***) outs, while a therapeutic range of bromide (2.5 mmol/L) did not significantly interfere with i-STAT potassium results.
Note 2: Nithiodote (sodium thiosulfate) is indicated for the treatment of acute cyanide poisoning. The journal article titled “Falsely increased chloride and missed anion gap elevation during treatment with sodium thiosulfate” indicated that sodium thiosulfate could be used in the treatment of calciphylaxis indicating that “the highest concentration likely to be seen in plasma [is] after infusion of a 12.5 g dose of sodium thiosulfate pentahydrate. Assuming that the 12.5 g dose of sodium thiosulfate pentahydrate is distributed in a typical blood volume of 5 L with a hematocrit of 40%, the peak sodium thiosulfate plasma concentration expected is 16.7 mmol/L.”8
*It is possible that other interfering substances may be encountered. The degree of interference at concentrations other than those listed might not be predictable.

Abbott Point of Care Inc.100 and 200 Abbott Park RoadAbbott Park, IL 60064 • USA
Emergo EuropePrinsessegracht 202514 AP The Hague
The Netherlands
©2018 Abbott Point of Care Inc. All rights reserved. Printed in USA.
Rev. Date: 23-APR-18 Art: 714174-01P K - 5
References1. N.W. Tietz, E.L. Pruden, O. Siggaard-Andersen, ”Electrolytes ” in Tietz Textbook of Clinical Chemistry—Second Edition, C.A. Burtis and E.R. Ashwood, eds. (Philadelphia: W.B. Saunders Company, 1994).
2. D.S. Young, Effects of Drugs on Clinical Laboratory Tests, 3rd ed. (Washington, DC: American Association of Clinical Chemistry, 1990).
3. B.E. Statland, Clinical Decision Levels for Lab Tests (Oradell, NJ: Medical Economic Books, 1987).
4. CLSI. Method Comparison and Bias Estimation Using Patient Samples; Approved Guideline. CLSI document EP9-A [ISBN 1-56238-283-7]. CLSI, 940 West Valley Road, Suite 1400, Wayne, Pennsylvania 19087-1898, USA 1995.
5. P.J. Cornbleet and N. Gochman, “Incorrect Least-Squares Regression Coefficients in Method-Comparison Analysis,” Clinical Chemistry 25:3, 432 (1979).
6. Clinical and Laboratory Standards Institute (CLSI). Interference Testing in Clinical Chemistry; Approved Guideline-Second Edition. CLSI document EP7-A2 (ISBN 1-56238-584-4). Clinical and Laboratory Standards Institute, 940 West Valley Road, Suite 1400, Wayne, Pennsylvania 19087-1898, USA 2005.
7. Charles R.A, Bee Y.M, Eng P.H.K., Goh S.Y. Point of care blood ketone testing: screening for diabetic ketoacidosis at the emergency department. Singapore Med J 2007; 48 (11): 986.
8. Wendroth Scott M., Tiffany N. Heady, Doris M. Haverstick, Lorin M. Bachmann, Mitchell G. Scott, James C. Boyd, and David E. Bruns. Falsely increased chloride and missed anion gap elevation during treatment with sodium thiosulfate. Clinica Chimica Acta 2014; 431: 77–79.
i-STAT is a registered trademark of the Abbott Group of Companies in various jurisdictions. Vacutainer is a registered trademark of Becton Dickinson and Company, Franklin Lakes, NJ USA. CX 3 is a registered trademark of Beckman Coulter Incorporated, Fullerton, CA USA. Ektachem was a trademark of Kodak Clinical Diagnostics. This system is now the Vitros distributed by Ortho-Clinical Diagnostics, Rochester, NY USA. Stat Profile is a registered trademark of Nova Biomedical, Waltham, MA USA.

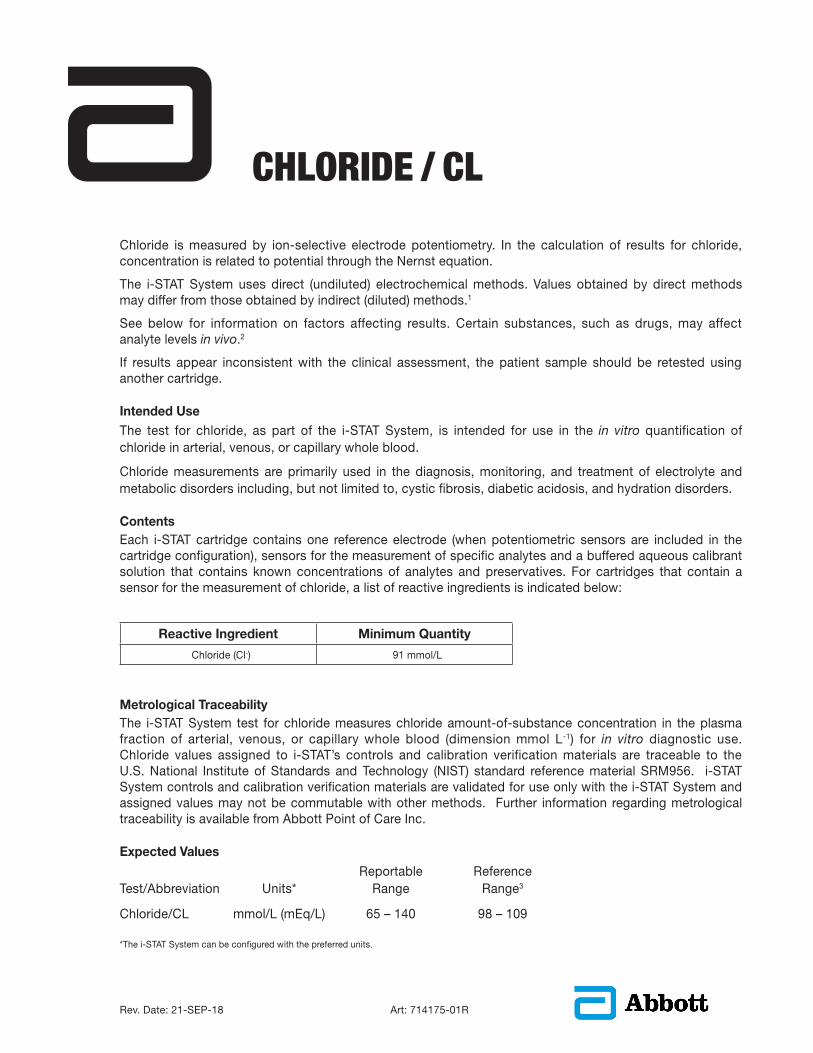
Rev. Date: 21-SEP-18 Art: 714175-01R
CHLORIDE / CL
Chloride is measured by ion-selective electrode potentiometry. In the calculation of results for chloride, concentration is related to potential through the Nernst equation.
The i-STAT System uses direct (undiluted) electrochemical methods. Values obtained by direct methods may differ from those obtained by indirect (diluted) methods.1
See below for information on factors affecting results. Certain substances, such as drugs, may affect analyte levels in vivo.2
If results appear inconsistent with the clinical assessment, the patient sample should be retested using another cartridge.
Intended UseThe test for chloride, as part of the i-STAT System, is intended for use in the in vitro quantification of chloride in arterial, venous, or capillary whole blood.
Chloride measurements are primarily used in the diagnosis, monitoring, and treatment of electrolyte and metabolic disorders including, but not limited to, cystic fibrosis, diabetic acidosis, and hydration disorders.
ContentsEach i-STAT cartridge contains one reference electrode (when potentiometric sensors are included in the cartridge configuration), sensors for the measurement of specific analytes and a buffered aqueous calibrant solution that contains known concentrations of analytes and preservatives. For cartridges that contain a sensor for the measurement of chloride, a list of reactive ingredients is indicated below:
Reactive Ingredient Minimum Quantity
Chloride (Cl-) 91 mmol/L
Metrological TraceabilityThe i-STAT System test for chloride measures chloride amount-of-substance concentration in the plasma fraction of arterial, venous, or capillary whole blood (dimension mmol L-1) for in vitro diagnostic use. Chloride values assigned to i-STAT’s controls and calibration verification materials are traceable to the U.S. National Institute of Standards and Technology (NIST) standard reference material SRM956. i-STAT System controls and calibration verification materials are validated for use only with the i-STAT System and assigned values may not be commutable with other methods. Further information regarding metrological traceability is available from Abbott Point of Care Inc.
Expected Values Reportable Reference Test/Abbreviation Units* Range Range3
Chloride/CL mmol/L (mEq/L) 65 – 140 98 – 109
*The i-STAT System can be configured with the preferred units.

CL - 2 Art: 714175-01R Rev. Date: 21-SEP-18
The i-STAT reference range for whole blood listed above is similar to reference ranges derived from serum or plasma measurements with standard laboratory methods.
The reference range programmed into the analyzer and shown above is intended to be used as a guide for the interpretation of results. Since reference ranges may vary with demographic factors such as age, gender and heritage, it is recommended that reference ranges be determined for the population being tested.
Clinical SignificanceTests for chloride in the blood are important in the diagnosis and treatment of patients suffering from hypertension, renal failure or impairment, cardiac distress, disorientation, dehydration, nausea and diarrhea. Some causes of increased values for chloride include prolonged diarrhea, renal tubular disease, hyperparathyroidism and dehydration. Some causes for decreased values for chloride include prolonged vomiting, burns, salt-losing renal disease, overhydration and thiazide therapy.
Performance CharacteristicsThe performance characteristics of the sensors are equivalent in all cartridge configurations.
The typical performance data summarized below was collected in health care facilities by health care professionals trained in the use of the i-STAT System and comparative methods.
Precision data were collected in multiple sites as follows: Duplicates of each control fluid were tested in the morning and in the afternoon on five days for a total of 20 replicates. The averaged statistics are presented below.
Method comparison data were collected using CLSI guideline EP9-A.4 Venous blood samples were collected in lithium heparin Vacutainer® tubes and analyzed in duplicate on the i-STAT System. A portion of the specimen was centri fuged and the separated plasma was analyzed in duplicate on comparative methods within 20 minutes of collection.
Deming regression analysis5 was performed on the first replicate of each sample. In the method comparison table, n is the number of specimens in the data set, Sxx and Syy refer to estimates of imprecision based on the duplicates of the comparative and the i-STAT methods respectively, Sy.x is the standard error of the estimate, and r is the correlation coefficient.*
Method comparisons will vary from site to site due to differences in sample handling, comparative method calibration and other site specific variables.
* The usual warning relating to the use of regression analysis is summarized here as a reminder. For any analyte, “if the data are collected over a narrow range, the estimate of the regression parameters is relatively imprecise and may be biased. Therefore, predictions made from these estimates may be invalid.”4 The correlation coefficient, r, can be used as a guide to assess the adequacy of the comparative method range in overcoming this problem. As a guide, the range of data can be considered adequate for r >0.975.
Precision Data (mmol/L or mEq/L)
Aqueous Control Mean SD CV %
Level 1 76.7 0.54 0.7
Level 3 114.0 0.56 0.5

Rev. Date: 21-SEP-18 Art: 714175-01R CL - 3
Method Comparison (mmol/L or mEq/L)
Beckman Synchron CX®3 Kodak Ektachem 700 Nova STAT Profile® 5
n 189 142 192
Sxx 1.27 0.41 0.89
Syy 0.88 0.90 0.88
Slope 0.99 0.88 0.93
Int’t -0.82 14.6 4.3
Sy.x 1.65 1.84 2.33
Xmin 93 63 96
Xmax 114 128 117
r 0.817 0.914 0.752
Factors Affecting Results*Hemodilution of the plasma by more than 20% associated with priming cardiopulmonary bypass pumps, plasma volume expansion or other fluid administration therapies using certain solutions may cause clinically significant error on sodium, chloride, ionized calcium and pH results. These errors are associated with solutions that do not match the ionic characteristics of plasma. To minimize these errors when hemodiluting by more than 20%, use physiologically balanced multi-electrolyte solutions containing low-mobility anions (e.g., gluconate).
Interference studies were based on CLSI guideline EP7-A2.6 Test concentrations used were as per the CLSI guideline unless otherwise indicated.
When added to a plasma pool the following substances (at the concentrations indicated) were found to interfere with the i-STAT chloride assay:
Substance Test Concentration(mmol/L) Interference
Acetylcysteine 10.2 Increased i-STAT Chloride results. See Note 1 below.
Bromide 37.5 Use another method.See Note 2 below.
Bromide (therapeutic) 2.5 7,8,9 Increased i-STAT Chloride results. Use another method.
Salicylate 4.34 Increased i-STAT Chloride results.
Use another method.See Note 3 below.
Thiocyanate 6.9 Increased i-STAT Chloride results. Use another method.
Nithiodote (sodium thiosulfate) 16.715 Increased i-STAT Chloride results. See Note 4 below.
Iodide 2.99 Increased i-STAT Chloride results. See Note 5 below.
The following substances are known not to significantly interfere with the i-STAT chloride assay at the stated test concentrations:
Substance Test Concentration(mmol/L)
Acetaminophen 1.32Acetylcysteine (therapeutic) 0.30 10,11,12
Ascorbate 0.34β-Hydroxybutyrate 6.0 13
Lactate 6.6Salicylate (therapeutic) 0.5 14
CL - 4 Art: 714175-01R Rev. Date: 21-SEP-18
Notes:
1) Acetylcysteine has been tested at two levels: the CLSI recommended level and a concentration of 0.30 mmol/L. The latter is 3 times the peak plasma therapeutic concentration associated with treatment to reverse acetaminophen poisoning. APOC has not identified a therapeutic condition that would lead to levels consistent with the CLSI recommended level. Acetylcysteine at a concentration of 10.2 mmol/L increased i-STAT chloride results, while an acetylcysteine concentration of 0.30 mmol/L did not significantly interfere with i-STAT chloride results.
2) Bromide has been tested at two levels: the CLSI recommended level and a therapeutic plasma concentration level of 2.5 mmol/L. The latter is the peak plasma concentration associated with halothane anesthesia, in which bromide is released. APOC has not identified a therapeutic condition that would lead to levels consistent with the CLSI recommended level. Bromide at a concentration of 37.5 mmol/L and 2.5 mmol/L increased i-STAT chloride results.
3) Salicylate has been shown to interfere at a concentration proscribed by the CLSI guideline, 4.34 mmol/L, which represents a toxic concentration. Salicylate at 0.5 mmol/L, which represents the upper end of the therapeutic concentration, has been shown not to significantly interfere with i-STAT chloride results.
4) Nithiodote (sodium thiosulfate) is indicated for the treatment of acute cyanide poisoning. The journal article titled “Falsely increased chloride and missed anion gap elevation during treatment with sodium thiosulfate” indicated that sodium thiosulfate could be used in the treatment of calciphylaxis indicating that “the highest concentration likely to be seen in plasma [is] after infusion of a 12.5 g dose of sodium thiosulfate pentahydrate. Assuming that the 12.5 g dose of sodium thiosulfate pentahydrate is distributed in a typical blood volume of 5 L with a hematocrit of 40%, the peak sodium thiosulfate plasma concentration expected is 16.7 mmol/L.”15
5) Iodide has been tested at the CLSI recommended level of 2.99 mmol/L which is close to the peak concentration after a lethal dose. A lethal dose is reported to be in the range of 2 - 4 grams16, which equates to 3.1 - 6.3 mmol/L assuming the dose is fully distributed in a typical blood volume of 5 L. APOC has not identified a therapeutic condition that would lead to levels consistent with the CLSI recommended level.
Iodide can be used to treat thyroid disease (i.e., hyperthyroidism). A study showed serum iodide reaches mean peak concentration between 1.8 mg/L (0.014 mmol/L) and 2.2 mg/L (0.017 mmol/L) after one month of supplementation at 50 mg/day17. The lowest concentration tested at APOC of 0.4 mmol/L has been shown to not significantly interfere with i-STAT chloride results.
*It is possible that other interfering substances may be encountered. The degree of interference at concentrations other than those listed might not be predictable.

Rev. Date: 21-SEP-18 Art: 714175-01R CL - 5
References
1. N.W. Tietz, E.L. Pruden, O. Siggaard-Andersen, ”Electrolytes ” in Tietz Textbook of Clinical Chemistry—Second Edition, C.A. Burtis and E.R. Ashwood, eds. (Philadelphia: W.B. Saunders Company, 1994).
2. D.S. Young, Effects of Drugs on Clinical Laboratory Tests, 3rd ed. (Washington, DC: American Association of Clinical Chemistry, 1990).
3. B.E. Statland, Clinical Decision Levels for Lab Tests (Oradell, NJ: Medical Economic Books, 1987).
4. CLSI. Method Comparison and Bias Estimation Using Patient Samples; Approved Guideline. CLSI document EP9-A [ISBN 1-56238-283-7]. CLSI, 940 West Valley Road, Suite 1400, Wayne, Pennsylvania 19087-1898, USA 1995.
5. P.J. Cornbleet and N. Gochman, “Incorrect Least-Squares Regression Coefficients in Method-Comparison Analysis,” Clinical Chemistry 25:3, 432 (1979).
6. Clinical and Laboratory Standards Institute (CLSI). Interference Testing in Clinical Chemistry; Approved Guideline-Second Edition. CLSI document EP7-A2 (ISBN 1-56238-584-4). Clinical and Laboratory Standards Institute, 940 West Valley Road, Suite 1400, Wayne, Pennsylvania 19087-1898, USA 2005.
7. Kharasch E.D, Hankins D., Mautz D., Thummel K.E.. Identification of the enzyme responsible for oxidative halothane metabolism: implications for prevention of halothane hepatitis. Lancet 1996; 347:1367-71.
8. Morrison J.E., Friesen R.H., Elevated serum bromide concentrations following repeated halothane anaesthesia in a child. Can J Asaesth 1990; 37 (7): 801-803.
9. Hankins D.C, Kharasch E.D., Determination of the halothane metabolites trifluoroacetic acid and bromide in plasma and urine by ion chromatography. J of Chromatography B. 692 (1997) 413-418.
10. Raftos JE, Chapman B, Kuchel PW. Role of N-acetylcysteine and cystine in glutathione synthesis in human erythrocytes. Redox Rep. 2009;14(3):115-24.
11. Whillier S, Raftos JE, Chapman B, Kuchel PW. Role of N-acetylcysteine and cystine in glutathione synthesis in human erythrocytes. Redox Rep. 2009;14(3):115-24.
12. Paolo Ventura, Rossana Panini, Maria CristinaPasini,, Gabriella Scarpetta and Gianfranco Salvioli. N -Acetyl-Cysteine Reduces Homocysteine Plasma Levels After Single Intravenous Adminstration by Increasing Thiols Urinary Excretion. Pharmacological Research. Volume 40, Issue 4, October 1999, Pages 345-350.
13. Charles R.A, Bee Y.M, Eng P.H.K., Goh S.Y. Point of care blood ketone testing: screening for diabetic ketoacidosis at the emergency department. Singapore Med J 2007; 48 (11): 986.
14. Gillian M. Borthwick, A. Sarah Johnson, Matthew Partington, John Burn, Robert Wilson and Helen M. Arthur.Therapeutic levels of aspirin and salicylate directly inhibit a model of angiogenesis through a Cox-independent mechanism. The FASEB Journal. 2006;20:2009-2016.
15. Wendroth Scott M., Tiffany N. Heady, Doris M. Haverstick, Lorin M. Bachmann, Mitchell G. Scott, James C. Boyd, and David E. Bruns. Falsely increased chloride and missed anion gap elevation during treatment with sodium thiosulfate. Clinica Chimica Acta 2014; 431: 77–79.
16. Gosselin, R.E., R.P. Smith, H.C. Hodge. Clinical Toxicology of Commercial Products. 5th ed. Baltimore: Williams and Wilkins, 1984., p. III-213.
17. Abraham, G.E., Serum inorganic iodide levels following ingestion of a tablet form of Lugol solution: Evidence for an enterohepatic circulation of iodine. The Original Internist, 11(3):112-118, 2005.
i-STAT is a trademark of the Abbott Group of Companies in various jurisdictions. Vacutainer is a trademark of Becton Dickinson and Company, Franklin Lakes, NJ USA. CX®3 is a trademark of Beckman Coulter Incorporated, Fullerton CA USA. Ektachem was a trademark of Kodak Clinical Diagnostics. This system is now the Vitros®distributed by Ortho-Clinical Diagnostics, Rochester, NY USA. Stat Profile is a trademark of Nova Biomedical, Waltham, MA USA.

Abbott Point of Care Inc.100 and 200 Abbott Park RoadAbbott Park, IL 60064 • USA
Emergo EuropePrinsessegracht 202514 AP The Hague
The Netherlands
©2018 Abbott Point of Care Inc. All rights reserved. Printed in USA.
CL - 6 Art: 714175-01R Rev. Date: 21-SEP-18

Rev. Date: 23-APR-18 Art: 714176-01R
BUN/UREA
Urea is hydrolyzed to ammonium ions in a reaction catalyzed by the enzyme urease.
urease Urea + H2O + 2H+
2NH+4 + CO2
The ammonium ions are measured potentiometrically by an ion-selective electrode. In the calculation of results for urea, concentration is related to potential through the Nernst Equation.
See below for information on factors affecting results. Certain substances, such as drugs, may affect analyte levels in vivo.1
If results appear inconsistent with the clinical assessment, the patient sample should be retested using another cartridge.
Intended UseThe test for blood urea nitrogen (BUN/urea), as part of the i-STAT® System, is intended for use in the in vitro quantification of BUN/urea in arterial, venous, or capillary whole blood.
Blood urea nitrogen measurements are used for the diagnosis, monitoring, and treatment of certain renal and metabolic diseases.
ContentsEach i-STAT cartridge contains one reference electrode (when potentiometric sensors are included in the cartridge configuration), sensors for the measurement of specific analytes, and a buffered aqueous calibrant solution that contains known concentrations of analytes and preservatives. For cartridges that contain a sensor for the measurement of urea nitrogen, a list of reactive ingredients is indicated below:
Reactive Ingredient Biological Source Minimum QuantityUrea N/A 4 mmol/L
Urease Canavalia ensiformis 0.12 IU
Metrological TraceabilityThe i-STAT System test for blood urea nitrogen/urea measures blood urea nitrogen/urea amount-of-substance concentration in the plasma fraction of arterial, venous, or capillary whole blood (dimension mmol L-1) for in vitro diagnostic use. BUN/urea values assigned to i-STAT’s controls and calibration verification materials are traceable to the U.S. National Institute of Standards and Technology (NIST) standard reference material SRM909. i-STAT System controls and calibration verification materials are validated for use only with the i-STAT System and assigned values may not be commutable with other methods. Further information regarding metrological traceability is available from Abbott Point of Care Inc.
Expected Values Reportable Reference Test/Abbreviation Units* Range Range2
Urea Nitrogen/BUN mg/dL 3 – 140 8 – 26Urea mmol/L 1 – 50 2.9 – 9.4Urea mg/dL 6 – 300 17 - 56Urea g/L 0.06 – 3.00 0.17 - 0.56
*The i-STAT System can be configured with the preferred units.

BUN - 2 Art: 714176-01R Rev. Date: 23-APR-18
To convert a BUN result in mg/dL to a urea result in mmol/L, multiply the BUN result by 0.357. To convert a urea result in mmol/L to a urea result in mg/dL, multiply the mmol/L result by 6. To convert a urea result in mg/dL to a urea result in g/L, divide the mg/dL result by 100.
The i-STAT reference ranges for whole blood listed above are similar to reference ranges derived from serum or plasma measurements with standard laboratory methods.
The reference range programmed into the analyzer and shown above is intended to be used as a guide for the interpretation of results. Since reference ranges may vary with demographic factors such as age, gender and heritage, it is recommended that reference ranges be determined for the population being tested.
Clinical SignificanceAn abnormally high level of urea nitrogen in the blood is an indication of kidney function impairment or failure. Some other causes of increased values for urea nitrogen include prerenal azotemia (e.g. shock), postrenal azotemia, GI bleeding and a high protein diet. Some causes of decreased values for urea nitrogen include pregnancy, severe liver insufficiency, overhydration and malnutrition.
Performance CharacteristicsThe typical performance data summarized below were collected in health care facilities by health care professionals trained in the use of the i-STAT System and comparative methods.
Precision data were collected in multiple sites as follows: Duplicates of each control fluid were tested in the morning and in the afternoon on five days for a total of 20 replicates. The averaged statistics are presented below.
Method comparison data were collected using CLSI guideline EP9-A.3 Venous blood samples were collected in lithium heparin Vacutainer® tubes and analyzed in duplicate on the i-STAT System. A portion of the specimen was centri fuged and the separated plasma was analyzed in duplicate on comparative methods within 20 minutes of collection.
Deming regression analysis4 was performed on the first replicate of each sample. In the method comparison table, n is the number of specimens in the data set, Sxx and Syy refer to estimates of imprecision based on the duplicates of the comparative and the i-STAT methods, respectively, Sy.x is the standard error of the estimate, and r is the correlation coefficient.*
Method comparisons will vary from site to site due to differences in sample handling, comparative method calibration and other site specific variables.
*The usual warning relating to the use of regression analysis is summarized here as a reminder. For any analyte, “if the data are collected over a narrow range, the estimate of the regression parameters is relatively imprecise and may be biased. Therefore, predictions made from these estimates may be invalid.”4 The correlation coefficient, r, can be used as a guide to assess the adequacy of the comparative method range in overcoming this problem. As a guide, the range of data can be considered adequate for r >0.975.
Precision Data (mg/dL)
Aqueous Control Mean SD %CV
Level 1 52.8 0.76 1.4
Level 3 5.5 0.45 8.2

Rev. Date: 23-APR-18 Art: 714176-01R BUN - 3
Method Comparison (mg/dL)
Beckman Coulter LX20®
Dade Dimension RxL-Xpand®
Beckman Coulter CX9®
n 39 32 26
Sxx 0.36 0.48 0.39
Syy 0.67 0.34 0.60
Slope 1.03 1.05 1.00
Int’t 1.39 -0.28 -0.38
Sy.x 0.99 0.31 0.85
Xmin 5 5 7
Xmax 70 38 66
r 0.997 0.998 0.997
Cartridge ComparisonThe performance characteristics of the sensors are equivalent in all cartridge configurations. System difference analysis was performed on 40 patient samples using the i-STAT 6+ and i-STAT EC8+ cartridges. In the 25–60 mg/dL range the average difference was -1.13. In the 60–140 mg/dL range the average difference was -0.77.
Factors Affecting Results*Endogenous ammonium ions will not affect results.
Interference studies were based on CLSI guideline EP7-A2.5 Test concentrations used were as per the CLSI guideline unless otherwise indicated.
When added to a plasma pool the following substances (at the concentrations indicated) were found to interfere with the i-STAT BUN assay:
Substance Test Concentration(mmol/L) Interference
Bromide 37.5 Use another method.See Note 1 below.
Hydroxyurea 0.92 Increased i-STAT BUN/UREA results.See Note 2 below.
Nithiodote (sodium thiosulfate) 16.77 Decreased i-STAT BUN/UREA results. See Note 3 below.
The following substances were shown not to significantly interfere with the i-STAT BUN assay at the stated test concentrations:
Substance Test Concentration(mmol/L)
Acetaminophen 1.32
Acetylcysteine 10.2
Ascorbate 0.34
Bromide 2.5
β-Hydroxybutyrate 6.0 6
Lactate 6.6
Salicylate 4.34
Thiocyanate 6.9
BUN - 4 Art: 714176-01R Rev. Date: 23-APR-18
Notes:
1) Bromide has been tested at two levels: the CLSI recommended level and a therapeutic plasma concentration of 2.5 mmol/L. The latter is the peak plasma concentration associated with halothane anesthesia, in which bromide is released. APOC has not identified a therapeutic condition that would lead to levels consistent with the CLSI recommended level. Bromide at a concentration of 37.5 mmol/L decreased i-STAT BUN/UREA results and increased the rate of BUN/UREA star (***) outs, while a therapeutic range of bromide (2.5 mmol/L) did not significantly interfere with i-STAT BUN/UREA results.
2) Hydroxyurea is a DNA synthesis inhibitor used in the treatment of various forms of cancer, sickle cell anemia, and HIV infection. This drug is used to treat malignancies including melanoma, metastatic ovarian cancer, and chronic myelogenous leukemia. It is also used in the treatment of polycythemia vera, thrombocythemia, and psoriasis. At typical doses ranging from 500 mg to 2 g/day, concentrations of hydroxyurea in patients’ blood may be sustained at approximately 100 to 500 μmol/L. Higher concentrations may be observed soon after dosing or at higher therapeutic doses.
3) Nithiodote (sodium thiosulfate) is indicated for the treatment of acute cyanide poisoning. The journal article titled “Falsely increased chloride and missed anion gap elevation during treatment with sodium thiosulfate” indicated that sodium thiosulfate could be used in the treatment of calciphylaxis indicating that “the highest concentration likely to be seen in plasma [is] after infusion of a 12.5 g dose of sodium thiosulfate pentahydrate. Assuming that the 12.5 g dose of sodium thiosulfate pentahydrate is distributed in a typical blood volume of 5 L with a hematocrit of 40%, the peak sodium thiosulfate plasma concentration expected is 16.7 mmol/L.”7
*It is possible that other interfering substances may be encountered. The degree of interference at concentrations other than those listed might not be predictable.

Rev. Date: 23-APR-18 Art: 714176-01R BUN - 5
References
1. D.S. Young, Effects of Drugs on Clinical Laboratory Tests, 3rd ed. (Washington, DC: American Association of Clinical Chemistry, 1990).
2. B.E. Statland, Clinical Decision Levels for Lab Tests (Oradell, NJ: Medical Economic Books, 1987).
3. CLSI. Method Comparison and Bias Estimation Using Patient Samples; Approved Guideline. CLSI document EP9-A [ISBN 1-56238-283-7]. CLSI, 940 West Valley Road, Suite 1400, Wayne, Pennsylvania 19087-1898 USA, 1995.
4. P.J. Cornbleet and N. Gochman, “Incorrect Least-Squares Regression Coefficients in Method-Comparison Analysis,” Clinical Chemistry 25:3, 432 (1979).
5. Clinical and Laboratory Standards Institute (CLSI). Interference Testing in Clinical Chemistry; Approved Guideline-Second Edition. CLSI document EP7-A2 (ISBN 1-56238-584-4). Clinical and Laboratory Standards Institute, 940 West Valley Road, Suite 1400, Wayne, Pennsylvania 19087-1898, USA 2005.
6. Charles R.A, Bee Y.M, Eng P.H.K., Goh S.Y. Point of care blood ketone testing: screening for diabetic ketoacidosis at the emergency department. Singapore Med J 2007; 48 (11): 986.
7. Wendroth Scott M., Tiffany N. Heady, Doris M. Haverstick, Lorin M. Bachmann, Mitchell G. Scott, James C. Boyd, and David E. Bruns. Falsely increased chloride and missed anion gap elevation during treatment with sodium thiosulfate. Clinica Chimica Acta 2014; 431: 77–79.
i-STAT is a registered trademark of the Abbott Group of Companies in various jurisdictions. Vacutainer is a registered trademark of Becton Dickinson and Company, Franklin Lakes, NJ USA. LX20 and CX9 are registered trademarks of Beckman Coulter Incorporated, Fullerton, CA USA. Dimension RxL-Xpand is a registered trademark of Dade Behring Inc., Deerfield, IL USA.

Abbott Point of Care Inc.100 and 200 Abbott Park RoadAbbott Park, IL 60064 • USA
Emergo EuropePrinsessegracht 202514 AP The Hague
The Netherlands
©2018 Abbott Point of Care Inc. All rights reserved. Printed in USA.
BUN - 6 Art: 714176-01R Rev. Date: 23-APR-18

Rev. Date: 23-APR-18 Art: 714177-01S
GLUCOSE/GLU
Glucose is measured amperometrically. Oxidation of glucose, catalyzed by the enzyme glucose oxidase, produces hydrogen peroxide (H2O2). The liberated hydrogen peroxide is oxidized at the electrode to produce a current which is proportional to the sample glucose concentration.
glucose oxidaseβ-D-glucose + H2O + O2 D-gluconic acid + H2O2
H2O2 2H+ + O2 + 2e-
See below for information on factors affecting results. Certain substances, such as drugs, may affect analyte levels in vivo.1
If results appear inconsistent with the clinical assessment, the patient sample should be retested using another cartridge.
Intended UseThe test for glucose, as part of the i-STAT® System, is intended for use in the in vitro quantification of glucose in arterial, venous, or capillary whole blood.
Glucose measurements are used in the diagnosis, monitoring, and treatment of carbohydrate metabolism disorders including, but not limited to, diabetes mellitus, neonatal hypoglycemia, idiopathic hypoglycemia, and pancreatic islet cell carcinoma.
ContentsEach i-STAT cartridge contains one reference electrode (when potentiometric sensors are included in the cartridge configuration), sensors for the measurement of specific analytes, and a buffered aqueous calibrant solution that contains known concentrations of analytes and preservatives. For cartridges that contain a sensor for the measurement of glucose, a list of reactive ingredients is indicated below:
Reactive Ingredient Biological Source Minimum QuantityGlucose N/A 7 mmol/L
Glucose Oxidase Aspergillus niger 0.002 IU
Metrological TraceabilityThe i-STAT System test for glucose measures glucose amount-of-substance concentration in the plasma fraction of arterial, venous, or capillary whole blood (dimension mmol L-1) for in vitro diagnostic use. Glucose values assigned to i-STAT’s controls and calibration verification materials are traceable to the U.S. National Institute of Standards and Technology (NIST) standard reference material SRM965. i-STAT System controls and calibration verification materials are validated for use only with the i-STAT System and assigned values may not be commutable with other methods. Further information regarding metrological traceability is available from Abbott Point of Care Inc.

Glu - 2 Art: 714177-01S Rev. Date: 23-APR-18
Expected Values Reportable Reference Test/Abbreviation Units* Range Range2
Glucose/Glu mg/dL 20 – 700 70 – 105 (fasting) mmol/L 1.1 – 38.9 3.9 – 5.8 g/L 0.20 – 7.00 0.70 – 1.05
* The i-STAT System can be configured with the preferred units.
To convert a result from mg/dL to mmol/L, multiply the mg/dL value by 0.055.
The i-STAT reference ranges for whole blood listed above are similar to reference ranges derived from serum or plasma measurements with standard laboratory methods.
The reference range programmed into the analyzer and shown above is intended to be used as a guide for the interpretation of results. Since reference ranges may vary with demographic factors such as age, gender and heritage, it is recommended that reference ranges be determined for the population being tested.
Clinical SignificanceGlucose is a primary energy source for the body and the only source of nutrients for brain tissue. Measurements for determination of blood glucose levels are important in the diagnosis and treatment of patients suffering from diabetes and hypoglycemia. Some causes for increased values of glucose include diabetes mellitus, pancreatitis, endocrine disorders (e.g., Cushing’s syndrome), drugs (e.g., steroids, thyrotoxicosis), chronic renal failure, stress, or I.V. glucose infusion. Some causes of decreased values of glucose include insulinoma, adrenocortical insufficiency, hypopituitarism, massive liver disease, ethanol ingestion, reactive hypoglycemia, and glycogen storage disease.
Performance Characteristics The typical performance data summarized below was collected in health care facilities by health care professionals trained in the use of the i-STAT System and comparative methods.
Precision data were collected at multiple sites as follows: Duplicates of each control fluid were tested in the morning and in the afternoon on five days for a total of 20 replicates. The averaged statistics are presented below.
Method comparison data were collected using CLSI guideline EP9-A.3 Venous blood samples were collected in lithium heparin Vacutainer® tubes and analyzed in duplicate on the i-STAT System. A portion of the specimen was centri fuged and the separated plasma was analyzed in duplicate on comparative methods within 20 minutes of collection.
Deming regression analysis4 was performed on the first replicate of each sample. In the method comparison table, n is the number of specimens in the data set, Sxx and Syy refer to estimates of imprecision based on the duplicates of the comparative and the i-STAT methods respectively, Sy.x is the standard error of the estimate, and r is the correlation coefficient.*
Method comparisons will vary from site to site due to differences in sample handling, comparative method calibration and other site specific variables.
* The usual warning relating to the use of regression analysis is summarized here as a reminder. For any analyte, “if the data are collected over a narrow range, the estimate of the regression parameters is relatively imprecise and may be biased. Therefore, predictions made from these estimates may be invalid.”4 The correlation coefficient, r, can be used as a guide to assess the adequacy of the comparative method range in overcoming this problem. As a guide, the range of data can be considered adequate for r >0.975.

Rev. Date: 23-APR-18 Art: 714177-01S Glu - 3
Precision Data (mg/dL)Aqueous Control Mean SD %CVLevel 1 41.8 0.68 1.6Level 3 289 2.4 0.8
Method Comparison (mg/dL)
Beckman Coulter LX20
Bayer 860 Dade Dimension RxL-Xpand
n 35 40 32
Sxx 2.21 4.71 0.98
Syy 0.69 0.96 0.59
Slope 1.03 0.99 1.01
Int’t -3.39 -1.67 -0.85
Sy.x 0.91 0.70 1.57
Xmin 45 58 48
Xmax 297 167 257
r 0.999 0.993 0.998
Cartridge ComparisonThe performance characteristics of the sensors are equivalent in all cartridge configurations. System difference analysis was performed on 34 patient samples using the i-STAT CHEM8+ and i-STAT CG8+ cartridges. In the 65–249 mg/dL range, the average difference was 0.80.
Factors Affecting Results*Glucose values will decrease in whole blood samples over time. Venous blood glucose is as much as 7 mg/dL less than capillary blood glucose as a result of tissue utilization.5
Interference studies were based on CLSI guideline EP7-A2.6 Test concentrations used were as per the CLSI guideline unless otherwise indicated.
When added to a plasma pool the following substances (at the concentrations indicated) were found to interfere with the i-STAT glucose assay:
Substance Test Concentration(mmol/L) Interference
Acetaminophen 1.32 Increased i-STAT Glucose results. See Note 1 Below.
Acetylcysteine 10.2 Decreased i-STAT Glucose results. See Note 2 below.
Bromide 37.5 Use another method. See Note 3 below.
Bromide (therapeutic) 2.5 7,8,9 Decreased i-STAT Glucose results. See Note 3 below.
Hydroxyurea 0.92 Increased i-STAT Glucose results. Use another method.
Thiocyanate 6.9 Decreased i-STAT Glucose results.
Nithiodote (sodium thiosulfate) 16.714 Decreased i-STAT Glucose results. See Note 7 below.
The following substances are known not to significantly interfere with the i-STAT glucose assay at the stated test concentrations:
Substance Test Concentration(mmol/L)
Acetaldehyde 0.045 10
Acetaminophen (therapeutic) 0.132 10
Acetoacetate 2.0Acetylcysteine (therapeutic) 0.3 11,12
Ascorbate 0.34

Glu - 4 Art: 714177-01S Rev. Date: 23-APR-18
Dopamine 0.006Formaldehyde 0.133 10
β–Hydroxybutyrate 6.0 13
Lactate 6.6Maltose 13.3Pyruvate 0.31Salicylate 4.34
Thiocyanate (therapeutic) 0.515
Uric Acid 1.4
Notes:
1) Acetaminophen has been shown to interfere with glucose results in the i-STAT 6+, EC8+, EC4+ and G products, at a concentration prescribed by the CLSI guideline, 1.32 mmol/L, which represents a toxic concentration of acetaminophen. Acetaminophen at 0.132 mmol/L, which represents the upper end of the therapeutic concentration, has been shown not to significantly interfere with i-STAT glucose results for all i-STAT cartridges. Acetaminophen at a test level of 1.32 mmol/L (toxic concentration) has been shown not to significantly interfere with glucose results in the i-STAT CHEM8+ and CG8+ products.
2) Acetylcysteine has been tested at two levels: the CLSI recommended level and a concentration of 0.30 mmol/L. The latter is 3 times the peak plasma therapeutic concentration associated with treatment to reverse acetaminophen poisoning. APOC has not identified a therapeutic condition that would lead to levels consistent with the CLSI recommended level. Acetylcysteine at a concentration of 10.2 mmol/L decreased i-STAT glucose results, while acetylcysteine at a concentration of 0.3 mmol/L did not signifi-cantly interfere with i-STAT glucose results.
3) Bromide has been tested at two levels: the CLSI recommended level and a therapeutic plasma con-centration level of 2.5 mmol/L. The latter is the peak plasma concentration associated with halothane anesthesia, in which bromide is released. APOC has not identified a therapeutic condition that would lead to levels consistent with the CLSI recommended level. Bromide tested at concentrations of 2.5 and 37.5 mmol/L decreased i-STAT glucose results.
4) Hydroxyurea is a DNA synthesis inhibitor used in the treatment of various forms of cancer, sickle cell anemia, and HIV infection. This drug is used to treat malignancies including melanoma, metastatic ovar-ian cancer, and chronic myelogenous leukemia. It is also used in the treatment of polycythemia vera, thrombocythemia, and psoriasis. At typical doses ranging from 500 mg to 2 g/day, concentrations of hydroxyurea in patients’ blood may be sustained at approximately 100 to 500 µmol/L. Higher concentra-tions may be observed soon after dosing or at higher therapeutic doses.
5) The dependence of the i-STAT glucose with respect to pH is as follows: Values below 7.4 at 37°C decrease results by approximately 0.9 mg/dL (0.05 mmol/L) per 0.1 pH units. Values above 7.4 at 37°C increase results by approximately 0.8 mg/dL (0.04 mmol/L) per 0.1 pH units.
6) The dependence of the i-STAT glucose with respect to PO2 is as follows: Oxygen levels of less than 20 mmHg (2.66 kPa) at 37°C may decrease results.
7) Nithiodote (sodium thiosulfate) is indicated for the treatment of acute cyanide poisoning. The journal article titled “Falsely increased chloride and missed anion gap elevation during treatment with sodium thiosulfate” indicated that sodium thiosulfate could be used in the treatment of calciphylaxis indicating that “the highest concentration likely to be seen in plasma [is] after infusion of a 12.5 g dose of sodium thio-sulfate pentahydrate. Assuming that the 12.5 g dose of sodium thiosulfate pentahydrate is distributed in a typical blood volume of 5 L with a hematocrit of 40%, the peak sodium thiosulfate plasma concentration expected is 16.7 mmol/L.”14
* It is possible that other interfering substance may be encountered. The degree of interference at concentrations other than those listed might not be predictable.

Rev. Date: 23-APR-18 Art: 714177-01S Glu - 5
References1. D.S. Young, Effects of Drugs on Clinical Laboratory Tests, 3rd ed. (Washington, DC: American Asso-ciation of Clinical Chemistry, 1990).2. P.C. Painter, J.Y. Cope, J.L. Smith, “Reference Ranges, Table 41-20” in Tietz Textbook of Clinical Chemistry—Second Edition, C.A. Burtis and E.R. Ashwood, eds. (Philadelphia: W.B. Saunders Company, 1994).3. CLSI. Method Comparison and Bias Estimation Using Patient Samples; Approved Guideline. CLSI document EP9-A [ISBN 1-56238-283-7]. CLSI, 940 West Valley Road, Suite 1400, Wayne, Pennsylvania 19087-1898, USA 1995.4. P.J. Cornbleet and N. Gochman, “Incorrect Least-Squares Regression Coefficients in Method-Com-parison Analysis,” Clinical Chemistry 25:3, 432 (1979).5. D.S. Young and E.W. Bermes, “Influence of Site Collection on Blood Gases and pH,” in TietzTextbook of Clinical Chemistry—Second Edition, C.A. Burtis and E.R. Ashwood, eds.(Philadelphia:W.B. Saunders Company, 1994).6. Clinical and Laboratory Standards Institute (CLSI). Interference Testing in Clinical Chemistry; Ap-proved Guideline-Second Edition. CLSI document EP7-A2 (ISBN 1-56238-584-4). Clinical and Laboratory Standards Institute, 940 West Valley Road, Suite 1400, Wayne, Pennsylvania 19087-1898, USA 2005.7. Hankins D.C, Kharasch E.D., Determination of the halothane metabolites trifluoroacetic acid and bro-mide in plasma and urine by ion chromatography. J of Chromatography B. 692 (1997) 413-418.8. Kharasch E.D, Hankins D., Mautz D., Thummel K.E. Identification of the enzyme responsible for oxida-tive halothane metabolism: implications for prevention of halothane hepatitis. Lancet 1996; 347:1367-71.9. Morrison J.E., Friesen R.H., Elevated serum bromide concentrations following repeated halothane anaesthesia in a child. Can J Asaesth 1990; 37 (7): 801-803.10. Wu, H.B. A., Tietz Clinical Guide to Laboratory Tests. 4th Edition. 2006.11. Whillier S, Raftos JE, Chapman B, Kuchel PW. Role of N-acetylcysteine and cystine in glutathione synthesis in human erythrocytes. Redox Rep. 2009;14(3):115-24.12. Paolo Ventura, Rossana Panini, Maria CristinaPasini, Gabriella Scarpetta and Gianfranco Salvioli. N-Acetyl-Cysteine Reduces Homocysteine Plasma Levels After Single Intravenous Administration by In-creasing Thiols Urinary Excretion. Pharmacological Research. Volume 40, Issue 4, October 1999, Pages 345-350.13. Charles R.A, Bee Y.M, Eng P.H.K., Goh S.Y. Point of care blood ketone testing: screening for diabetic ketoacidosis at the emergency department. Singapore Med J 2007; 48 (11): 986.14. Wendroth Scott M., Tiffany N. Heady, Doris M. Haverstick, Lorin M. Bachmann, Mitchell G. Scott, James C. Boyd, and David E. Bruns. Falsely increased chloride and missed anion gap elevation during treatment with sodium thiosulfate. Clinica Chimica Acta 2014; 431: 77–79.15. Wu Alan H.B. Tietz Clinical Guide to Laboratory Tests (Fourth Edition). W.B. Saunders Elsevier (2006) 1024. i-STAT is a registered trademark of the Abbott Group of companies in various jurisdictions. Vacutainer is a registered trademark of Becton Dickinson and Company, Franklin Lakes, NJ USA. LX20 is a registered trademark of Beckman Coulter Incorporated, Fullerton, CA USA. The Bayer 860 analyzer is manufactured by Bayer Diagnostics, Tarrytown, NY USA. Dimension RxL-Xpand is a registered trademark of Dade Behring Inc., Deerfield, IL USA.

Abbott Point of Care Inc.100 and 200 Abbott Park RoadAbbott Park, IL 60064 • USA
Emergo EuropePrinsessegracht 202514 AP The Hague
The Netherlands
©2018 Abbott Point of Care Inc. All rights reserved. Printed in USA.
Rev. Date: 23-APR-18 Art: 714177-01S Glu - 6
Rev. Date: 23-APR-18 Art: 714178-01P
HEMATOCRIT/HCT AND CALCULATED HEMOGLOBIN/HB
Hematocrit is determined conductometrically. The measured conductivity, after correction for electrolyte concentration, is inversely related to the hematocrit.
See below for information on factors affecting results. Certain substances, such as drugs, may affect analyte levels in vivo.1
If results appear inconsistent with the clinical assessment, the patient sample should be retested using another cartridge.
Intended UseThe test for hematocrit, as part of the i-STAT® System, is intended for use in the in vitro quantification of packed red blood cell volume fraction in arterial, venous, or capillary whole blood.
Hematocrit measurements can aid in the determination and monitoring of normal or abnormal total red cell volume status including, but not limited to, conditions such as anemia, erythrocytosis, and blood loss related to trauma and surgery.
ContentsEach i-STAT cartridge contains one reference electrode (when potentiometric sensors are included in the cartridge configuration), sensors for the measurement of specific analytes, and a buffered aqueous calibrant solution of known conductance that contains known concentrations of analytes and preservatives.
Metrological TraceabilityThe i-STAT System test for hematocrit measures packed red blood cell volume fraction in arterial, venous, or capillary whole blood (expressed as the % packed cell volume) for in vitro diagnostic use. Hematocrit values assigned to i-STAT’s working calibrators are traceable to the Clinical and Laboratory Standards Institute (CLSI) H7-A3 procedure for determining packed cell volume by the microhematocrit method.2 Further information regarding metrological traceability is available from Abbott Point of Care Inc.
Expected Values Reportable Reference Test/Abbreviation Units* Range Range3
Hematocrit/Hct %PCV 15 – 75 38 – 51** Fraction 0.15 – 0.75 0.38 – 0.51
Hemoglobin/Hb g/dL 5.1 – 25.5 12 – 17 g/L 51 – 255 120 – 170 mmol/L 3.2 – 15.8 7 – 11
* The i-STAT System can be configured with the preferred units.
**The reference ranges for hematocrit and hemoglobin span both female and male populations.
Hct - 2 Art: 714178-01P Rev. Date: 23-APR-18
To convert a result from %PCV to fraction packed cell volume, divide the %PCV result by 100. For the measurement of hematocrit, the i-STAT System can be customized to agree with methods calibrated by the microhematocrit reference method using either K3EDTA or K2EDTA anticoagulant. Mean cell volumes of K3EDTA anticoagulated blood are approximately 2-4% less than K2EDTA anticoagulated blood.2 While the choice of anticoagulant affects the microhematocrit method to which all hematocrit methods are calibrated, results from routine samples on hematology analyzers are independent of the anticoagulant used. Since most clinical hematology analyzers are calibrated by the microhematocrit method using K3EDTA anticoagulant, the i-STAT System default customization is K3EDTA.
The reference range programmed into the analyzer and shown above is intended to be used as a guide for the interpretation of results. Since reference ranges may vary with demographic factors such as age, gender and heritage, it is recommended that reference ranges be determined for the population being tested.
Clinical SignificanceHematocrit is a measurement of the fractional volume of red blood cells. This is a key indicator of the body’s state of hydration, anemia or severe blood loss, as well as the blood’s ability to transport oxygen. A decreased hematocrit can be due to either overhydration, which increases the plasma volume, or a decrease in the number of red blood cells caused by anemias or blood loss. An increased hematocrit can be due to loss of fluids, such as in dehydration, diuretic therapy, and burns, or an increase in red blood cells, such as in cardiovascular and renal disorders, polycythemia vera, and impaired ventilation.
Performance CharacteristicsThe typical performance data summarized below were collected in health care facilities by health care professionals trained in the use of the i-STAT System and comparative methods.
Precision data were collected in multiple sites as follows: Duplicates of each control fluid were tested in the morning and in the afternoon on five days for a total of 20 replicates. The averaged statistics are presented below.
Method comparison data were collected using CLSI guideline EP9-A.4 Venous blood samples, collected in lithium heparin Vacutainer® tubes, were analyzed in duplicate on the i-STAT System and on the comparative methods for hematocrit within 20 minutes of collection.
Deming regression analysis5 was performed on the first replicate of each sample. In the method comparison table, n is the number of specimens in the data set, Sxx and Syy refer to estimates of imprecision based on the duplicates of the comparative and the i-STAT methods respectively, Sy.x is the standard error of the estimate, and r is the correlation coefficient.*
Method comparisons will vary from site to site due to differences in sample handling, comparative method calibration and other site specific variables.
Interference studies were based on CLSI guideline EP7-P.6
*The usual warning relating to the use of regression analysis is summarized here as a reminder: For any analyte, “if the data is collected over a narrow range, the estimate of the regression parameters are relatively imprecise and may be biased. Therefore, predictions made from these estimates may be invalid”.5 The correlation coefficient, r, can be used as a guide to assess the adequacy of the comparative method range in overcoming this problem. As a guide, the range of data can be considered adequate if r>0.975.
Precision Data (%PCV)
Whole Blood Control Mean SD %CV
Low 30.0 0.44 1.5
High 49.0 0.50 1.0

Rev. Date: 23-APR-18 Art: 714178-01P Hct - 3
Method Comparison (%PCV)
Coulter® S Plus Nova STAT Profile® 5
Abbott Cell-Dyn 4000
Sysmex SE9500
n 142 192 29 29Sxx 0.50 0.46 0.41 0.53Syy 1.09 1.31 0.77 0.76Slope 0.98 1.06 1.06 1.11Int’t 1.78 -3.98 -1.42 -4.19Sy.x 2.03 2.063 1.13 0.98Xmin 18 21 19 24Xmax 51 50 46 47r 0.952 0.932 0.993 0.980
Factors Affecting Results*The measurement of certain blood samples with high erythrocyte sedimentation rates (ESR) may be affected by analyzer angle. While testing blood samples, beginning ninety (90) seconds after the cartridge is inserted, the analyzer should remain level until a result is obtained. A level surface includes running the handheld in the downloader/recharger.
Interferent EffectWBC Grossly elevated white blood cell counts may increase results.
Total Protein Hematocrit results are affected by the level of total protein as follows:
Displayed Result TP < 6.5 g/dL TP > 8.0 g/dL
HCT < 40 %PCV Hct decreased by ~1% PCV for each decrease of 1 g/dL TP
Hct increased by ~1% PCV for each increase 1 g/dL TP
HCT > 40 % PCV Hct decreased by ~0.75 % PCV for each decrease of 1 g/dL TP
Hct increased by ~0.75 %PCV for each increase 1 g/dL TP
Total protein levels may be low in neonatal and burn patient populations, as well as in additional clinical populations listed in Statland.3 Total protein levels may also be decreased in patients undergoing cardiopulmonary bypass (CPB) or ECMO, and with patients receiving large volumes of saline-based IV fluids. Care should be taken when using hematocrit results from patients with total protein levels below the adult reference range (6.5 to 8 g/dL).
The CPB sample type can be used to correct the hematocrit result for the dilutional affect of the pump prime in cardiovascular surgery. The CPB algorithm assumes that cells and plasma are diluted equally and that the pump priming solution has no added albumin or other colloid or packed red blood cells. Since perfusion practices vary, it is recommended that each practice verify the use of the CPB sample type and the length of time in which the CPB sample type should be used during the recovery period. Note that for hematocrit values above 30 %PCV, the CPB correction is ≤1.5 %PCV; the size of the correction at this level should not impact transfusion decisions.
Lipids Abnormally high lipids may increase results. Interference from lipids will be about two-thirds the size of the interference from protein.

Hct - 4 Art: 714178-01P Rev. Date: 23-APR-18
Sodium The sample electrolyte concentration is used to correct the measured conductivity prior to reporting hematocrit results. Factors that affect sodium will therefore also affect hematocrit.
Bromide Bromide (37.5 mmol/L) is known to result in an increased rate of star (***) outs. Bromide has been tested at two levels: the CLSI recommended level and a therapeutic plasma concentration level of 2.5 mmol/L. The latter is the peak plasma concentration associated with halothane anesthesia, in which bromide is released. APOC has not identified a therapeutic condition that would lead to levels consistent with the CLSI recommended level. Bromide at a concentration of 37.5 mmol/L increased the rate of HCT star (***) outs, while a therapeutic range of bromide (2.5 mmol/L) did not significantly interfere with i-STAT HCT results.
*It is possible that other interfering substances may be encountered. These results are representative and your results may differ somewhat due to test-to-test variation. The degree of interference at concentrations other than those listed might not be predictable.
Sample Collection and Handling
Erroneous hematocrit results can be obtained by improper sample handling.
n Hematocrit results can be affected by the settling of red blood cells in the collection device. The best way to avoid the affect of settling is to test the sample immediately. If there is a delay in testing of a minute or more, the sample must be remixed thoroughly:
o If the sample is in a collection tube, invert the tube gently 10 times.
o If the sample is in a syringe, roll the syringe between the palms for five seconds in one direction, then roll in a second direction for five seconds, then gently invert repeatedly for five seconds. Note that it may not be possible to adequately mix a blood sample in a 1 mL syringe. Samples from 1 mL syringes should not be used to determine hematocrit if testing is delayed. Discard one or two drops of blood from a syringe before filling a cartridge.
n Low hematocrit results can be caused by contamination of flush solutions in an arterial or venous line.
o Back flush a line with a sufficient amount of blood to remove intravenous solutions, heparin or medications that may contaminate the sample. Five to six times the volume of the catheter, connectors and needle is recommended.
Cartridge ComparisonThe performance characteristics of the sensors are equivalent in all cartridge configurations. System difference analysis was performed on 40 patient samples using the i-STAT 6+ and i-STAT E3+ cartridges. In the 15–30 %PCV range the average difference was 0.462. In the 30–50 %PCV range the average difference was 0.097.
Calculated Result for HemoglobinThe i-STAT System provides a calculated hemoglobin result which is determined as follows7:
hemoglobin (g/dL) = hematocrit (% PCV) x 0.34
hemoglobin (g/dL) = hematocrit (decimal fraction) x 34
To convert a hemoglobin result from g/dL to mmol/L, multiply the displayed result by 0.621. The calculation of hemoglobin from hematocrit assumes a normal MCHC.

Rev. Date: 23-APR-18 Art: 714178-01P Hct - 5
References1. D.S. Young, Effects of Drugs on Clinical Laboratory Tests, 3rd ed. (Washington, DC: American Association of Clinical Chemistry, 1990).
2. CLSI. Procedure for Determining Packed Cell Volume by the Microhematocrit Method; Approved Standard - Third Edition. CLSI document H7-A3 [ISBN 1-56238-413-9]. CLSI, 940 West Valley Road, Suite 1400, Wayne, Pennsylvania 19087-1898 USA, 2000.
3. B.E. Statland, Clinical Decision Levels for Lab Tests (Oradell, NJ: Medical Economic Books, 1987).
4. CLSI. Method Comparison and Bias Estimation Using Patient Samples; Approved Guideline. CLSI document EP9-A [ISBN 1-56238-283-7]. CLSI, 940 West Valley Road, Suite 1400, Wayne, Pennsylvania 19087-1898, USA 1995.
5. P.J. Cornbleet and N. Gochman, “Incorrect Least-Squares Regression Coefficients in Method-Comparison Analysis,” Clinical Chemistry 25:3, 432 (1979).
6. CLSI. Interference Testing in Clinical Chemistry; Proposed Guideline. CLSI document EP7-P [ISBN 1-56238-020-6]. CLSI, 940 West Valley Road, Suite 1400, Wayne, Pennsylvania 19087-1898, USA 1986.
7. J.D. Bower, P.G. Ackerman and G. Toto, eds., “Evaluation of Formed Elements of Blood,” in Clinical Laboratory Methods (St. Louis: The C.V. Mosby Company, 1974).
i-STAT is a registered trademark of the Abbott Group of Companies in various jurisdictions. Vacutainer is a registered trademark of Becton Dickinson and Company, Franklin Lakes, NJ USA. Coulter S Plus is a registered trademark of Beckman Coulter Incorporated, Fullerton, CA USA. Cell-Dyn is a registered trademark of Abbott Laboratories, Abbott Park, IL USA. SE9500 is a trademark of Sysmex America Inc., Mundelein, IL USA. STAT Profile is a registered trademark of Nova Biomedical, Waltham, MA USA.

Abbott Point of Care Inc.100 and 200 Abbott Park RoadAbbott Park, IL 60064 • USA
Emergo EuropePrinsessegracht 202514 AP The Hague
The Netherlands
©2018 Abbott Point of Care Inc. All rights reserved. Printed in USA.
Hct - 6 Art: 714178-01P Rev. Date: 23-APR-18

IONIZED CALCIUM/ICA
Rev. Date: 23-APR-18 Art: 714179-01R
Ionized calcium is measured by ion-selective electrode potentiometry. In the calcu lation of results for ionized calcium concentration is related to potential through the Nernst equation. Results are measured at 37°C.
See below for information on factors affecting results. Certain substances, such as drugs, may affect analyte levels in vivo.1
If results appear inconsistent with the clinical assessment, the patient sample should be retested using another cartridge.
Intended UseThe test for ionized calcium, as part of the i-STAT® System, is intended for use in the in vitro quantification of ionized calcium in arterial, venous, or capillary whole blood.
Ionized calcium measurements are used in the diagnosis, monitoring, and treatment of conditions including, but not limited to, parathyroid disease, a variety of bone diseases, chronic renal disease, tetany, and disturbances related to surgical and intensive care.
ContentsEach i-STAT cartridge contains one reference electrode (when potentiometric sensors are included in the cartridge configuration), sensors for the measurement of specific analytes, and a buffered aqueous calibrant solution that contains known concentrations of analytes and preservatives. For cartridges that contain a sensor for the measurement of ionized calcium, a list of reactive ingredients is indicated below:
Reactive Ingredient Minimum Quantity
Calcium (Ca2+) 0.9 mmol/L
Metrological TraceabilityThe i-STAT System test for ionized calcium measures ionized calcium (i.e., free calcium ion) amount-of-substance concentration in the plasma fraction of arterial, venous, or capillary whole blood (dimension mmol L-1) for in vitro diagnostic use. Ionized calcium values assigned to APOC controls and calibration verification materials are traceable to the U.S. National Institute of Standards and Technology (NIST) standard reference material SRM956. i-STAT System controls and calibration verification materials are validated for use only with the i-STAT System and assigned values may not be commutable with other methods. Further information regarding metrological traceability is available from Abbott Point Care Inc.
Expected Values Reportable Reference Test/Abbreviation Units* Range Range2
Ionized Calcium/iCa mmol/L 0.25 – 2.50 1.12 – 1.32 mg/dL 1.0 – 10.0 4.5 – 5.3
*The i-STAT System can be configured with the preferred units.

iCa - 2 Art: 714179-01R Rev. Date: 23-APR-18
To convert a result from mmol/L to mg/dL, multiply the mmol/L value by 4. To convert mmol/L to mEq/L multiply the mmol/L value by 2.
The reference range programmed into the analyzer and shown above is intended to be used as a guide for the interpretation of results. Since reference ranges may vary with demographic factors such as age, gender and heritage, it is recommended that reference ranges be determined for the population being tested.
Clinical SignificanceAlthough most of the calcium in blood is bound to protein or complexed to smaller anionic species, the biologically active fraction of calcium is free ionized calcium. Through its role in a number of enzymatic reactions and in membrane transport mechanisms, ionized calcium is vitally important in blood coagulation, nerve conduction, neuromuscular transmission and in muscle contraction. Increased ionized calcium (hypercalcemia) may result in coma. Other symptoms reflect neuromuscular disturbances, such as hyperreflexia and/or neurologic abnormalities such as neurasthenia, depression or psychosis. Decreased ionized calcium (hypocalcemia) often results in cramps (tetany), reduced cardiac stroke work and depressed left ventricular function. Prolonged hypocalcemia may result in bone demineralization (osteoporosis) which can lead to spontaneous fractures. Measurements of ionized calcium have proven of value under the following clinical conditions: transfusion of citrated blood, liver transplan tation, open heart surgery, neonatal hypocalcemia, renal disease, hyperparathyroidism, malignancy, hypertension and pancreatitis.
Performance CharacteristicsThe typical performance data summarized below was collected in health care facilities by health care professionals trained in the use of the i-STAT System and comparative methods.
Precision data were collected in multiple sites as follows: Duplicates of each control fluid were tested in the morning and in the afternoon on five days for a total of 20 replicates. The averaged statistics are presented below.
Method comparison data were collected using CLSI guide line EP9-A3. Venous blood samples were collected in lithium heparin Vacutainer® tubes and analyzed in duplicate on the i-STAT System and on the comparative methods within 10 minutes of each other.
Deming regression analysis4 was performed on the first replicate of each sample. In the method comparison table, n is the number of specimens in the data set, Sxx and Syy refer to estimates of imprecision based on the duplicates of the comparative and the i-STAT methods respectively, Sy.x is the standard error of the estimate, and r is the correlation coefficient.*
Method comparisons will vary from site to site due to differences in sample handling, comparative method calibration and other site specific variables.
* The usual warning relating to the use of regression analysis is summarized here as a reminder. For any analyte, “if the data are collected over a narrow range, the estimate of the regression parameters is relatively imprecise and may be biased. Therefore, predictions made from these estimates may be invalid.”4 The correlation coefficient, r, can be used as a guide to assess the adequacy of the comparative method range in overcoming this problem. As a guide, the range of data can be considered adequate for r >0.975.
Precision Data (mmol/L)
Aqueous Control Mean SD %CV
Level 1 1.60 0.017 1.1
Level 3 0.84 0.012 1.4
Method Comparison (mmol/L)

Rev. Date: 23-APR-18 Art: 714179-01R iCa - 3
Radiometer ICA1 Nova STAT Profile
n 47 57
Sxx 0.009 0.017
Syy 0.017 0.017
Slope 0.925 0.960
Int’t 0.113 0.062
Sy.x 0.035 0.029
Xmin 0.46 0.53
Xmax 2.05 2.05
r 0.982 0.982
Cartridge ComparisonThe performance characteristics of the sensors are equivalent in all cartridge configurations. System difference analysis was performed on 24 patient samples using i-STAT CHEM8+ and i-STAT CG8+ cartridges. In the 0.46 - 1.23 mmol/L range, the average difference was 0.003.
Factors Affecting Results*Venous stasis (prolonged tourniquet application) and forearm exercise may increase ionized calcium due to a decrease in pH caused by localized production of lactic acid5. Exposing the sample to air will cause an increase in pH due to the loss of CO2 which will decrease ionized calcium.
Heparin binds calcium. Each unit of heparin added per mL of blood will decrease ionized calcium by 0.01 mmol/L.5 Therefore, the correct ratio of heparin anticoagulant to blood must be achieved during sample collection. Intravenous injection of 10,000 units of heparin has been shown in adults to cause a significant decrease of ionized calcium of about 0.03 mmol/L.5 Use only unheparinized sample transfer devices when using i-STAT’s aqueous control and calibration verification materials.
Hemodilution of the plasma by more than 20% associated with priming cardiopulmonary bypass pumps, plasma volume expansion or other fluid administration therapies using certain solutions may cause clinically significant error on sodium, chloride, ionized calcium and pH results. These errors are associated with solutions that do not match the ionic characteristics of plasma. To minimize these errors when hemodiluting by more than 20%, use physiologically balanced multi-electrolyte solutions containing low-mobility anions (e.g., gluconate).
Interference studies were based on CLSI guideline EP7-A2.6 Test concentrations used were as per the CLSI guideline unless otherwise indicated.

iCa - 4 Art: 714179-01R Rev. Date: 23-APR-18
When added to a plasma pool, the following substances (at the concentration indicated) were found to interfere with the i-STAT Ionized Calcium assay:
Substance Test Concentration(mmol/L) Interference
Acetaminophen 1.32 Decreased i-STAT Ionized Calcium results. See Note below.
Acetylcysteine 10.2 Decreased i-STAT Ionized Calcium results. See Note below.
Bromide 37.5 Use another method. See Note below.
Magnesium 1.0 Increased i-STAT Ionized Calcium results by up to 0.04 mmol/L.
Lactate 6.6 Decreased i-STAT Ionized Calcium results by up to 0.07 mmol/L.
Nithiodote (sodium thiosulfate) 16.714 Decreased i-STAT Ionized Calcium results. See Note below.
Salicylate 4.34 Decreased i-STAT Ionized Calcium results. See Note below.
Salicylate (therapeutic) 0.5 9 Decreased i-STAT Ionized Calcium results by up to 0.03 mmol/L. See Note below.
Thiocyanate 6.9 Decreased i-STAT Ionized Calcium results.Use another method.
Leflunomide 0.03 Decreased i-STAT Ionized Calcium results. See Note below.
The following substances are known not to significantly interfere with the i-STAT Ionized Calcium assay at the stated test concentrations:
Substance Test Concentration(mmol/L)
Acetaminophen (therapeutic) 0.132Acetylcysteine (therapeutic) 0.30 7,8
Ascorbate 0.34Bromide (therapeutic) 2.5 10,11,12
β-Hydroxybutyrate 6.0 13
Notes: 1) Acetaminophen has been shown to interfere at a concentration proscribed by the CLSI guideline, 1.32 mmol/L, which represents a toxic concentration. Acetaminophen at 0.132 mmol/L, which represents the upper end of the therapeutic concentration, has been shown not to significantly interfere with i-STAT ionized calcium results.
2) Acetylcysteine has been tested at two levels; the CLSI recommended level and a concentration of 0.30 mmol/L. The latter is 3 times the peak plasma therapeutic concentration associated with treatment to reverse acetaminophen poisoning. APOC has not identified a therapeutic condition that would lead to levels consistent with the CLSI recommended level. Acetylcysteine at a concentration of 10.2 mmol/L decreased i-STAT ionized calcium results, while acetylcysteine at a concentration of 0.3 mmol/L did not significantly interfere with ionized calcium results.
3) Bromide has been tested at two levels; the CLSI recommended level and a therapeutic plasma concentration level of 2.5 mmol/L. The latter is the peak plasma concentration associated with halothane anesthesia, in which bromide is released. APOC has not identified a therapeutic condition that would lead to levels consistent with the CLSI recommended level. Bromide at a concentration of 37.5 mmol/L increased i-STAT ionized calcium results, while bromide at a concentration of 2.5 mmol/L did not significantly interfere with i-STAT ionized calcium results.
Rev. Date: 23-APR-18 Art: 714179-01R iCa - 5
4) Salicylate has been shown to significantly decrease ionized calcium results at a concentration proscribed by the CLSI guideline, 4.34 mmol/L, which represents a toxic concentration.Salicylate at 0.5 mmol/L, which represents the upper end of the therapeutic concentration, has been shown to decrease ionized calcium results by approximately 0.03 mmol/L.
5) Nithiodote (sodium thiosulfate) is indicated for the treatment of acute cyanide poisoning. The journal article titled “Falsely increased chloride and missed anion gap elevation during treatment with sodium thiosulfate” indicated that sodium thiosulfate could be used in the treatment of calciphylaxis indicating that “the highest concentration likely to be seen in plasma [is] after infusion of a 12.5 g dose of sodium thiosulfate pentahydrate. Assuming that the 12.5 g dose of sodium thiosulfate pentahydrate is distributed in a typical blood volume of 5 L with a hematocrit of 40%, the peak sodium thiosulfate plasma concentration expected is 16.7 mmol/L.”14
6). Leflunomide is an isoxazole immunomodulatory agent which inhibits dihydroorotate dehydrogenase (an enzyme involved in de novo pyrimidine synthesis) and has antiproliferative activity. It is used in the treatment of some immune diseases. Following oral administration, leflunomide is metabolized to an active metabolite, teriflunomide, which is responsible for essentially all of its activity in vivo. The active metabolite teriflunomide reaches a plasma concentration of 8.5 µg/mL (0.031 mmol/L) after a 100 mg loading dose and the steady state concentration is maintained at 63 µg/mL (0.23 mmol/L) after 24 weeks of maintenance dose at 25 mg/day15 when treating inflammatory polyarthropathy.
*It is possible that other interfering substances may be encountered. The degree of interference at concentrations other than those listed might not be predictable.

Abbott Point of Care Inc.100 and 200 Abbott Park RoadAbbott Park, IL 60064 • USA
Emergo EuropePrinsessegracht 202514 AP The Hague
The Netherlands
©2018 Abbott Point of Care Inc. All rights reserved. Printed in USA.
iCa - 6 Art: 714179-01R Rev. Date: 23-APR-18
References1. D.S. Young, Effects of Drugs on Clinical Laboratory Tests, 3rd ed. (Washington, DC: American Association of Clinical Chemistry, 1990).
2. P.C. Painter, J.Y. Cope, J.L. Smith, “Reference Ranges, Table 41–20” in Tietz Textbook of Clinical Chemistry—Second Edition, C.A. Burtis and E.R. Ashwood, eds. (Philadelphia: W.B. Saunders Company, 1994).
3. CLSI. Method Comparison and Bias Estimation Using Patient Samples; Approved Guideline. CLSI document EP9-A [ISBN 1-56238-283-7]. CLSI, 940 West Valley Road, Suite 1400, Wayne, Pennsylvania 19087-1898, USA 1995.
4. P.J. Cornbleet and N. Gochman, “Incorrect Least-Squares Regression Coefficients in Method-Comparison Analysis,” Clinical Chemistry 25:3, 432 (1979).
5. D. Fraser, G. Jones, S.W. Kooh, and I. Raddle, “Calcium and Phosphate Metabolism” in Tietz Textbook of Clinical Chemistry—Second Edition, C.A. Burtis and E.R. Ashwood, eds. (Philadelphia: W.B. Saunders Company, 1994).
6. Clinical and Laboratory Standards Institute (CLSI). Interference Testing in Clinical Chemistry; Approved Guideline-Second Edition. CLSI document EP7-A2 (ISBN 1-56238-584-4). Clinical and Laboratory Standards Institute, 940 West Valley Road, Suite 1400, Wayne, Pennsylvania 19087-1898, USA 2005.
7. Whillier S, Raftos JE, Chapman B, Kuchel PW. Role of N-acetylcysteine and cystine in glutathione synthesis in human erythrocytes. Redox Rep. 2009;14(3):115-24.
8. Paolo Ventura, Rossana Panini, Maria CristinaPasini,, Gabriella Scarpetta and Gianfranco Salvioli. N -Acetyl-Cysteine Reduces Homocysteine Plasma Levels After Single Intravenous Adminstration by Increasing Thiols Urinary Excretion. Pharmacological Research. Volume 40, Issue 4, October 1999, Pages 345-350.
9. Gillian M. Borthwick, A. Sarah Johnson, Matthew Partington, John Burn, Robert Wilson and Helen M. Arthur. Therapeutic levels of aspirin and salicylate directly inhibit a model of angiogenesis through a Cox-independent mechanism. The FASEB Journal. 2006;20:2009-2016.
10. Kharasch E.D, Hankins D., Mautz D., Thummel K.E.. Identification of the enzyme responsible for oxidative halothane metabolism: implications for prevention of halothane hepatitis. Lancet 1996; 347:1367-71.
11. Morrison J.E., Friesen R.H., Elevated serum bromide concentrations following repeated halothane anaesthesia in a child. Can J Asaesth 1990; 37 (7): 801-803.
12. Hankins D.C, Kharasch E.D., Determination of the halothane metabolites trifluoroacetic acid and bromide in plasma and urine by ion chromatography. J of Chromatography B. 692 (1997) 413-418.
13. Charles R.A, Bee Y.M, Eng P.H.K., Goh S.Y. Point of care blood ketone testing: screening for diabetic ketoacidosis at the emergency department. Singapore Med J 2007; 48 (11): 986.
14. Wendroth Scott M., Tiffany N. Heady, Doris M. Haverstick, Lorin M. Bachmann, Mitchell G. Scott, James C. Boyd, and David E. Bruns. Falsely increased chloride and missed anion gap elevation during treatment with sodium thiosulfate. Clinica Chimica Acta 2014; 431: 77–79.
15. Sanofi-Aventis Canada Inc. Product Monograph PrARAVA® Submission, Control No.: 187857. Date of Revision: December 23, 2015. http://products.sanofi.ca/en/arava.pdf (accessed January 9, 2018).
i-STAT is a trademark of the Abbott Group of Companies in various jurisdictions. Vacutainer is a trademark of Becton Dickinson and Company, Franklin Lakes, NJ USA. ICA 1 is a trademark of Radiometer Medical A/S, Copenhagen, Denmark. Stat Profile is a trademark of Nova Biomedical, Waltham, MA USA.

Rev. Date: 23-APR-18 Art: 714180-01N
PO2 AND CALCULATED OXYGEN SATURATED/sO2
PO2 is measured amperometrically. The oxygen sensor is similar to a conventional Clark electrode. Oxygen permeates through a gas permeable membrane from the blood sample into an internal electrolyte solution where it is reduced at the cathode. The oxygen reduction current is proportional to the dissolved oxygen concentration.
See below for information on factors affecting results. Certain substances, such as drugs, may affect analyte levels in vivo.1
If results appear inconsistent with the clinical assessment, the patient sample should be retested using another cartridge.
Intended UseThe test for PO2, as part of the i-STAT System, is intended for use in the in vitro quantification of oxygen partial pressure in arterial, venous, or capillary whole blood.
PO2 measurements are used in the diagnosis, monitoring, and treatment of respiratory disturbances and metabolic and respiratory-based acid-base disturbances.
ContentsEach i-STAT cartridge contains one reference electrode (when potentiometric sensors are included in the cartridge configuration), sensors for the measurement of specific analytes, and a buffered aqueous calibrant solution that contains known concentrations of analytes and preservatives.
Metrological Traceability
The i-STAT System test for oxygen partial pressure measures oxygen partial pressure in arterial, venous, or capillary whole blood (dimension kPa) for in vitro diagnostic use. PO2 values assigned to i-STAT’s controls and calibration verification materials are traceable to U.S. National Institute of Standards and Technology (NIST) standard reference materials via commercially available certified specialty medical gas standards. i-STAT System controls and calibration verification materials are validated for use only with the i-STAT System and assigned values may not be commutable with other methods. Further information regarding metrological traceability is available from Abbott Point of Care Inc.
Expected Values Reportable Reference Test Units* Range Range2
PO2 mmHg 5 – 800 80 – 105 kPa 0.7 – 106.6 10.7 – 14.0 sO2** % not applicable 95 – 98
*The i-STAT System can be configured with the preferred units. ** Calculated
To convert PO2 results from mmHg to kPa, multiply the mmHg value by 0.133.
The reference ranges shown are for a healthy population. Interpretation of blood gas measurements depend on the underlying condition (e.g., patient temperature, ventilation, posture and circulatory status).

P02-2 Art: 714180-01N Rev. Date: 23-APR-18
Clinical SignificancePO2 (partial pressure of oxygen) is a measurement of the tension or pressure of oxygen dissolved in blood. Some causes for decreased values of PO2 include decreased pulmonary ventilation (e.g., airway obstruction or trauma to the brain), impaired gas exchange between alveolar air and pulmonary capillary blood (e.g., bronchitis, emphysema, or pulmonary edema), and alteration in the flow of blood within the heart or lungs (e.g., congenital defects in the heart or shunting of venous blood into the arterial system without oxygenation in the lungs).
sO2 (oxygen saturation) is the amount of oxyhemoglobin expressed as a fraction of the total amount of hemoglobin able to bind oxygen (oxyhemoglobin plus deoxyhemoglobin).
(X3 + 150X)sO2=100 __________________
X3 + 150X + 23400
where X = PO2 • 10 (0.48(pH-7.4)-0.0013(HCO
3-25))
sO2 is calculated from measured PO2 and pH and from HCO3 calculated from measured PCO2 and pH. However, this calculation assumes normal affinity of oxygen for hemoglobin. It does not take into account erythrocyte diphosphoglycerate (2,3-DPG) concentrations which affect the oxygen dissociation curve. The calculation also does not take into account the effects of fetal hemoglobin or dysfunctional hemoglobins (carboxy-, met-, and sulfhemoglobin). Clinically significant errors can result from incorporation of such an estimated sO2 value for oxygen saturation in further calculations, such as shunt fraction, or by assuming the value obtained is equivalent to fractional oxyhemoglobin.
Oxygen saturation is a useful predictor of the amount of oxygen that is available for tissue perfusion. Some causes for decreased values of sO2 include low PO2 or impaired ability of hemoglobin to carry oxygen.
Temperature “Correction” Algorithm PO2 is a temperature-dependent quantity and is measured at 37°C. The PO2 reading at a body temperature other than 37°C can be ‘corrected’ by entering the patient’s temperature on the chart page of the analyzer. In this case, blood gas results will be displayed at both 37°C and the patient’s temperature. The PO2 at the patient’s temperature (Tp) is calculated as follows3:
Note: Patient temperature corrected results are only available on cartridges containing pH, PCO2, and PO2 sensors.
Performance Characteristics
The performance characteristics of the sensors are equivalent in all cartridge configurations.
The typical performance data summarized below was collected in a health care facility by health care professionals trained in the use of the i-STAT System and comparative method.
Precision data were collected in multiple sites as follows: Duplicates of each control fluid were tested in the morning and in the afternoon on five days for a total of 20 replicates. The averaged statistics are presented below.

Rev. Date: 23-APR-18 Art: 714180-01N P02-3
Method comparison data were collected using CLSI guideline EP9-A.4 Arterial blood samples were collected from hospital patients in 3 cc blood gas syringes and were analyzed in duplicate on the i-STAT System and the comparative method within 5 minutes of each other.
Deming regression analysis5 was performed on the first replicate of each sample. In the method comparison table, n is the number of specimens in the data set, Sxx and Syy refer to estimates of imprecision based on the duplicates of the comparative and the i-STAT methods respectively, Sy.x is the standard error of the estimate, and r is the correlation coefficient.* Method comparisons will vary from site to site due to differences in sample handling, comparative method calibration and other site specific variables.
* The usual warning relating to the use of regression analysis is summarized here as a reminder: For any analyte, “if the data is collected over a narrow range, the estimate of the regression parameters are relatively imprecise and may be biased. Therefore, predictions made from these estimates may be invalid”.6 The correlation coefficient, r, can be used as a guide to assess the adequacy of the comparative method range in overcoming this problem. As a guide, the range of data can be considered adequate if r>0.975.
Precision Data (mmHg)
Aqueous Control Mean SD %CV
Level 1 65.1 3.12 4.79
Level 3 146.5 6.00 4.10
Method Comparison (mmHg)
Radiometer ABL500
Radiometer ABL700
Bayer 845
n 45 29 30
Sxx 3.70 2.04 3.03
Syy 2.78 2.64 3.28
Slope 1.023 0.962 1.033
Int’t -2.6 1.2 -2.9
Sy.x 2.52 3.53 3.44
Xmin ---- 39 31
Xmax ---- 163 185
r 0.996 0.990 0.996
Factors Affecting Results*
Exposure of the sample to air will cause an increase in PO2 when values are below 150 mmHg and a decrease in PO2 when values are above 150 mmHg (approximate PO2 of room air).
Standing anaerobically at room temperature will decrease pH at a rate of 0.03 per hour, will increase PCO2 by approximately 4 mmHg per hour and will decrease PO2 at a rate of 2–6 mmHg per hour.6
Do not ice samples before testing – PO2 results may be falsely elevated in cold samples. Do not use a cold cartridge – PO2 results may be falsely decreased if the cartridge is cold.
*It is possible that other interfering substances may be encountered. These results are representative and your results may differ somewhat due to test-to-test variation. The degree of interference at concentrations other than those listed might not be predictable.
Factors Affecting Calculated ResultssO2 values calculated from a measured PO2 and an assumed oxyhemoglobin dissociation curve may differ significantly from the direct measurement.3
References

Abbott Point of Care Inc.100 and 200 Abbott Park RoadAbbott Park, IL 60064 • USA
Emergo EuropePrinsessegracht 202514 AP The Hague
The Netherlands
©2018 Abbott Point of Care Inc. All rights reserved. Printed in USA.
P02-4 Art: 714180-01N Rev. Date: 23-APR-18
1. D.S. Young, Effects of Drugs on Clinical Laboratory Tests, 3rd ed. (Washington, DC: American Association of Clinical Chemistry, 1990).
2. B.E. Statland, Clinical Decision Levels for Lab Tests (Oradel, NJ: Medical Economic Books, 1987).
3. CLSI. Blood Gas and pH Analysis and Related Measurements; Approved Guideline. CLSI document C46-A [ISBN 1-56238-444-9]. CLSI, 940 West Valley Road, Suite 1400, Wayne, Pennsylvania 19087-1898 USA, 2001.
4. CLSI. Method Comparison and Bias Estimation Using Patient Samples; Approved Guideline. CLSI document EP9-A [ISBN 1-56238-283-7]. CLSI, 940 West Valley Road, Suite 1400, Wayne, Pennsylvania 19087-1898, USA 1995.
5. P.J. Cornbleet and N. Gochman, “Incorrect Least-Squares Regression Coefficients in Method-Comparison Analysis,” Clinical Chemistry 25:3, 432 (1979).
6. E.L. Pruden, O. Siggaard-Andersen, and N.W. Tietz, “Blood Gases and pH,” in Tietz Textbook of Clinical Chemistry—Second Edition, C.A. Burtis and E.R. Ashwood, eds. (Philadelphia: W.B. Saunders Company, 1994).
i-STAT is a trademark of the Abbott Group of Companies in various jurisdictions. ABL is a registered trademark of Radiometer Medical A/S, Copenhagen,Denmark. Bayer 845 is manufactured by Bayer Diagnostics (Siemens), Tarrytown, NY USA.

Rev. Date: 23-APR-18 Art: 714181-01P
pH
pH is measured by direct potentiometry. In the calculation of results for pH, concen tra tion is related to potential through the Nernst equation. Results are reported at 37 °C.
See below for information on factors affecting results. Certain substances, such as drugs, may affect analyte levels in vivo.1
If results appear inconsistent with the clinical assessment, the patient sample should be retested using another cartridge.
Intended UseThe test for pH, as part of the i-STAT System, is intended for use in the in vitro quantification of pH in arterial, venous, or capillary whole blood.
pH measurements are used in the diagnosis, monitoring, and treatment of respiratory disturbances and metabolic and respiratory-based acid-base disturbances.
ContentsEach i-STAT cartridge contains one reference electrode (when potentiometric sensors are included in the cartridge configuration), sensors for the measurement of specific analytes, and a buffered aqueous calibrant solution that contains known concentrations of analytes and preservatives. For cartridges that contain a sensor for the measurement of pH, a list of reactive ingredients is indicated below:
Reactive Ingredient Minimum QuantityHydrogen Ion (H+) 6.66 pH
Metrological TraceabilityThe i-STAT System test for pH measures the hydrogen ion amount-of-substance concentration in the plasma fraction of arterial, venous, or capillary whole blood (expressed as the negative logarithm of the relative molal hydrogen ion activity) for in vitro diagnostic use. pH values assigned to i-STAT’s controls and calibration verification materials are traceable to the U.S. National Institute of Standards and Technology (NIST) standard reference materials SRMs 186-I, 186-II, 185, and 187. i-STAT System controls and calibration verification materials are validated for use only with the i-STAT System and assigned values may not be commutable with other methods. Further information regarding metrological traceability is available from Abbott Point of Care Inc.
Expected Values Reportable Reference Test/Abbreviation Units Range Range
pH 6.50 – 8.20 7.35 – 7.452 7.31 – 7.41* (arterial) (venous)
* Calculated from Siggaard-Andersen nomogram.
Venous samples normally measure 0.01 – 0.03 pH units lower than arterial samples.

pH-2 Art: 714181-01P Rev. Date: 23-APR-18
The reference range programmed into the analyzer and shown above is intended to be used as a guide for the interpretation of results. Since reference ranges may vary with demographic factors such as age, gender and heritage, it is recommended that reference ranges be determined for the population being tested.
Clinical SignificancepH is an index of the acidity or alkalinity of the blood with an arterial pH of <7.35 indicating an acidemia and >7.45 alkalemia.3
Temperature “Correction” AlgorithmpH is a temperature-dependent quantity that is measured on the i-STAT System at 37 °C. The pH reading at a body temperature other than 37 °C can be ‘corrected’ by entering the patient’s temperature on the chart page of the analyzer. In this case, blood gas results will be displayed at both 37 °C and the patient’s temperature. The pH at the patient’s temperature (Tp) is calculated as follows4:
Note: Patient temperature corrected results are only available on cartridges containing pH, PCO2, and PO2 sensors.
Performance CharacteristicsThe performance characteristics of the sensors are equivalent in all cartridge configurations.
The typical performance data summarized below was collected in health care facilities by health care professionals trained in the use of the i-STAT System and comparative methods.
Precision data were collected in multiple sites as follows: Duplicates of each control fluid were tested in the morning and in the afternoon on five days for a total of 20 replicates. The averaged statistics are presented below.
Method comparison data were collected using CLSI guideline EP9-A5. Venous blood samples were col-lected in evacuated tubes and arterial samples were collected in blood gas syringes with lithium hepa-rin anticoagulant. All sample were analyzed in duplicate on the i-STAT System and on the comparative methods within 10 minutes of each other. Arterial blood samples were collected from hospital patients in 3 mL blood gas syringes and were analyzed in duplicate on the i-STAT-System and the comparative method within 5 minutes of each other.
Deming regression analysis6 was performed on the first replicate of each sample. In the method comparison table, n is the number of specimens in the data set, Sxx and Syy refer to estimates of imprecision based on the duplicates of the comparative and the i-STAT methods respectively, Sy.x is the standard error of the estimate, and r is the correlation coefficient.*
Method comparisons will vary from site to site due to differences in sample handling, comparative method calibration and other site specific variables.
* The usual warning relating to the use of regression analysis is summarized here as a reminder: For any analyte, “if the data is collected over a narrow range, the estimate of the regression parameters are relatively imprecise and may be biased. Therefore, predictions made from these estimates may be invalid”.4 The correlation coefficient, r, can be used as a guide to assess the adequacy of the comparative method range in overcoming this problem. As a guide, the range of data can be considered adequate if r>0.975.

Rev. Date: 23-APR-18 Art: 714181-01P pH-3
Precision DataAqueous Control Mean SD %CV
Level 1 7.165 0.005 0.08
Level 3 7.656 0.003 0.04
Method Comparison Radiometer Nova Radiometer IL BGE ICA 1 STAT Profile 5 ABL500
n 62 47 57 45 Sxx 0.005 0.011 0.006 0.004 Syy 0.009 0.008 0.008 0.008 Slope 0.974 1.065 1.058 1.0265 Int't 0.196 -0.492 -0.436 -0.1857 Sy.x 0.012 0.008 0.010 0.0136 Xmin 7.210 7.050 7.050 Xmax 7.530 7.570 7.570 r 0.985 0.990 0.9920 0.986
Factors Affecting Results*Venous stasis (prolonged tourniquet application) and forearm exercise may decrease pH due to localized production of lactic acid. Exposing the sample to air will cause an increase in pH due to the loss of CO2. pH decreases on standing anaerobically at room temperature at a rate of 0.03 pH units per hour.3
Hemodilution of the plasma by more than 20% associated with priming cardiopulmonary bypass pumps, plasma volume expansion or other fluid administration therapies using certain solutions may cause clinically significant error on sodium, chloride, ionized calcium and pH results. These errors are associated with solutions that do not match the ionic characteristics of plasma. To minimize these errors when hemodiluting by more than 20%, use physiologically balanced multi-electrolyte solutions containing low-mobility anions (e.g., gluconate).
*It is possible that other interfering substances may be encountered. These results are representative and your results may differ somewhat due to test-to-test variation. The degree of interference at concentrations other than those listed might not be predictable.
Abbott Point of Care Inc.100 and 200 Abbott Park RoadAbbott Park, IL 60064 • USA
Emergo EuropePrinsessegracht 202514 AP The Hague
The Netherlands
©2018 Abbott Point of Care Inc. All rights reserved. Printed in USA.
pH-4 Art: 714181-01P Rev. Date: 23-APR-18
References1. D.S. Young, Effects of Drugs on Clinical Laboratory Tests, 3rd ed. (Washington, DC: American Association of Clinical Chemistry, 1990).
2. P.C. Painter, J.Y. Cope, J.L. Smith, “Reference Ranges, Table 41–20” in Tietz Textbook of Clinical Chemistry—Second Edition, C.A. Burtis and E.R. Ashwood, eds. (Philadelphia: W.B. Saunders Company, 1994).
3. E.L. Pruden, O. Siggaard-Andersen, and N.W. Tietz, Blood Gases and pH, in Tietz Textbook of Clinical Chemistry, Second Edition, ed. C.A. Burtis and E.R. Ashwood. (Philadelphia: W.B. Saunders Company, 1994.
4. CLSI. Blood Gas and pH Analysis and Related Measurements; Approved Guideline. CLSI document C46-A [ISBN 1-56238-444-9]. CLSI, 940 West Valley Road, Suite 1400, Wayne, Pennsylvania 19087-1898, USA 2001.
5. CLSI. Method Comparison and Bias Estimation Using Patient Samples; Approved Guideline. CLSI document EP9-A [ISBN 1-56238-283-7]. CLSI, 940 West Valley Road, Suite 1400, Wayne, Pennsylvania 19087-1898, USA 1995.
6. P.J. Cornbleet and N. Gochman, “Incorrect Least-Squares Regression Coefficients in Method-Comparison Analysis,” Clinical Chemistry 25:3, 432 (1979).
i-STAT is a trademark of the Abbott Group of Companies in various jurisdictions. BGE is a registered trademark of Instrumentation Laboratory, Lexington, MA USA. ICA 1 is a trademark of Radiometer Medical A/S, Copenhagen, Denmark. Stat Profile is a registered trademark of Nova Biomedical, Waltham, MA USA. ABL is a registered trademark of Radiometer Medical A/S, Copenhagen Denmark.

Rev. Date: 19-SEP-19 Art: 714182-01U
PCO2 AND CALCULATED VALUES FOR HCO3, BASE EXCESS AND ANION GAP
PCO2 is measured by direct potentiometry. In the calculation of results for PCO2, concen tration is related to potential through the Nernst equation. Results are reported at 37 °C.
Calculated ValuesWhen a cartridge includes sensors for both pH and PCO2, bicarbonate (HCO3), total carbon dioxide (TCO2) and base excess (BE) are calculated.1
log HCO3 = pH + log PCO2 – 7.608
BEecf = HCO3 – 24.8 + 16.2 (pH – 7.4)
BEb = (1 - 0.014*Hb) * [ HCO3 - 24.8 + (1.43 * Hb + 7.7) * (pH - 7.4) ]
Anion Gap is calculated in the EC8+ and CHEM8+ cartridges as follows:
Anion Gap (EC8+) = (Na + K) – (Cl + HCO3)
Anion Gap (CHEM8+) = (Na + K) – (Cl + (TCO2 - 1))
See below for information on factors affecting results. Certain substances, such as drugs, may affect analyte levels in vivo.2 If results appear inconsistent with the clinical assessment, the patient sample should be retested using another cartridge.
Intended UseThe test for PCO2, as part of the i-STAT System, is intended for use in the in vitro quantification of carbon dioxide partial pressure in arterial, venous, or capillary whole blood.
PCO2 measurements are used in the diagnosis, monitoring, and treatment of respiratory disturbances and metabolic and respiratory-based acid-base disturbances.
Bicarbonate is used in the diagnosis and treatment of numerous potentially serious disorders associated with changes in body acid-base balance.
ContentsEach i-STAT cartridge contains one reference electrode (when potentiometric sensors are included in the cartridge configuration), sensors for the measurement of specific analytes, and a buffered aqueous calibrant solution that contains known concentrations of analytes and preservatives. For cartridges that contain a sensor for the measurement of PCO2, a list of reactive ingredients is indicated below:
Reactive Ingredient Minimum QuantityCarbon Dioxide (CO2) 25.2 mmHg

PC02-2 Art: 714182-01U Rev. Date: 19-SEP-19
Metrological TraceabilityThe i-STAT System test for carbon dioxide partial pressure measures carbon dioxide partial pressure in arterial, venous, or capillary whole blood (dimension kPa) for in vitro diagnostic use. PCO2 values assigned to i-STAT’s controls and calibration verification materials are traceable to U.S. National Institute of Standards and Technology (NIST) standard reference materials via commercially available certified specialty medical gas standards. i-STAT System controls and calibration verification materials are validated for use only with the i-STAT System and assigned values may not be commutable with other methods. Further information regarding metrological traceability is available from Abbott Point of Care Inc.
Expected Values Reportable Reference Test/Abbreviation Units* Range Range
(arterial) (venous)
Partial Pressure Carbon Dioxide/PCO2 mmHg 5 – 130 35 – 453 41 – 51
kPa 0.67 – 17.33 4.67 – 6.00 5.47 – 6.80
Bicarbonate/HCO3 mmol/L 1.0 – 85.0 22 – 26** 23 – 28**
Base Excess/BE mmol/L (-30) – (+30) (-2) – (+3)3 (-2) – (+3)3
Anion Gap/AnGap mmol/L (-10) – (+99) 10 – 203 10 – 203
*The i-STAT System can be configured with the preferred units. **Calculated from Siggaard-Andersen nomogram.4
To convert PCO2 results from mmHg to kPa, multiply the mmHg value by 0.133.
The reference ranges programmed into the analyzer and shown above are intended to be used as guides for the interpretation of results. Since reference ranges may vary with demographic factors such as age, gender and heritage, it is recommended that reference ranges be determined for the population being tested.
Clinical SignificancePCO2 along with pH is used to assess acid-base balance. PCO2 (partial pressure of carbon dioxide), the respiratory component of acid-base balance, is a measure of the tension or pressure of carbon dioxide dissolved in the blood. PCO2 represents the balance between cellular production of CO2 and ventilatory removal of CO2 and a change in PCO2 indicates an alteration in this balance. Causes of primary respiratory acidosis (increase in PCO2) are airway obstruction, sedatives and anesthetics, respiratory distress syndrome, and chronic obstructive pulmonary disease. Causes of primary respiratory alkalosis (decreased PCO2) are hypoxia (resulting in hyperventilation) due to chronic heart failure, edema and neurologic disorders, and mechanical hyperventilation.
HCO3 (bicarbonate), the most abundant buffer in the blood plasma, is an indicator of the buffering capacity of blood. Regulated primarily by the kidneys, HCO3 is the metabolic component of acid-base balance. Causes of primary metabolic acidosis (decrease in HCO3) are ketoacidosis, lactate acidosis (hypoxia), and diarrhea. Causes of primary metabolic alkalosis (increase in HCO3) are vomiting and antacid treatment.
Base excess of the extracellular fluid (ECF) or standard base excess is defined as the concentra tion of titratable base minus the concentration of titratable acid when titrating the average ECF (plasma plus interstitial fluid) to an arterial plasma pH of 7.40 at PCO2 of 40 mmHg at 37 °C. Excess concentration of base in the average ECF remains virtually constant during acute changes in the PCO2 and reflects only the non-respiratory component of pH-disturbances.

Rev. Date: 19-SEP-19 Art: 714182-01U PC02-3
Anion gap is reported as the difference between the commonly measured cations sodium and potassium and the commonly measured anions chloride and bicarbonate. The size of the gap reflects unmeasured cations and anions and is therefore an analytical gap. Physiologically, a deficit of anions cannot exist. While relatively nonspecific, anion gap is useful for the detection of organic acidosis due to an increase in anions that are difficult to measure. Anion gap can be used to classify metabolic acidosis into high and normal anion gap types. Anion gap may be only slightly increased in diarrhea and renal failure, but elevated (often >25) due to an increase in organic anions in lactic acidosis, ketoaci dosis (alcoholic, diabetic, starvation) and uremia, an increase in inorganic anions in uremia, and an increase in anions from drugs such a salicylate and carbenicillin or toxins such as methanol and ethanol.
Temperature “Correction” Algorithm PCO2 is a temperature-dependent quantity and is measured at 37 °C. The PCO2 reading at a body temperature other than 37 °C can be ‘corrected’ by entering the patient’s temperature on the chart page of the analyzer. In this case, blood gas results will be displayed at both 37 °C and the patient’s temperature. The PCO2 at the patient’s temperature (Tp) is calculated as follows:1
Note: Patient temperature corrected results are available only on cartridges containing pH, PCO2, and PO2 sensors.
Performance CharacteristicsThe performance characteristics of the sensors are equivalent in all cartridge configurations.
The typical performance data summarized below were collected in a health care facility by health care professionals trained in the use of the i-STAT System and comparative methods.
Precision data were collected in multiple sites as follows: Duplicates of each control fluid were tested in the morning and in the afternoon on five days for a total of 20 replicates. The averaged statistics are presented below.
Method comparison data were collected using CLSI guideline EP9-A.5 Venous blood samples were collected in blood gas syringes. All samples were analyzed in duplicate on the i-STAT System and on the comparative methods within 10 minutes of each other. Arterial blood samples were collected from hospital patients in 3 cc blood gas syringes and were analyzed in duplicate on the i-STAT System and the comparative method within 5 minutes of each other.
Deming regression analysis6 was performed on the first replicate of each sample. In the method comparison table, n is the number of specimens in the data set, Sxx and Syy refer to estimates of imprecision based on the duplicates of the comparative and the i-STAT methods respectively, Sy.x is the standard error of the estimate, and r is the correlation coefficient.*
Method comparisons will vary from site to site due to differences in sample handling, comparative method calibration and other site specific variables.
* The usual warning relating to the use of regression analysis is summarized here as a reminder: For any analyte, “if the data is collected over a narrow range, the estimate of the regression parameters are relatively imprecise and may be biased. Therefore, predictions made from these estimates may be invalid”.7 The correlation coefficient, r, can be used as a guide to assess the adequacy of the comparative method range in overcoming this problem. As a guide, the range of data can be considered adequate if r>0.975.

PC02-2 Art: 714182-01U Rev. Date: 19-SEP-19
Precision Data (mmHg)
Aqueous Control Mean SD %CV
Level 1 63.8 1.57 2.5
Level 3 19.6 0.40 2.0
Method Comparison (mmHg)
PCO2 IL BGE
PCO2
Radiometer ABL500
n 62 29
Sxx 0.69 0.74
Syy 1.24 0.53
Slope 1.003 1.016
Int’t -0.8 1.1
Sy.x 1.65 0.32
Xmin 30.4 28
Xmax 99.0 91
r 0.989 0.999
Factors Affecting Results*Exposing the sample to air allows CO2 to escape which causes PCO2 to decrease and pH to increase and HCO3 and TCO2 to be under-estimated. The use of partial-draw tubes (evacuated tubes that are adjusted to draw less than the tube volume, e.g., a 5 cc tube with enough vacuum to draw only 3 cc) is not recommended for use with the i-STAT System because of the potential for decreased measured PCO2 results and calculated HCO3 and TCO2 values. Under-filling blood collection tubes may also cause decreased PCO2 results. Care must also be taken to eliminate “bubbling” of the sample with a pipette when filling a cartridge to avoid the loss of CO2 in the blood.
Allowing blood to stand (without exposure to air) before testing allows PCO2 to increase and pH to decrease, which will cause HCO3 and TCO2 to be over-estimated, due to metabolic processes.
For patients administered propofol (Diprivan®) or thiopental sodium (syn. thiomebumal sodium, penthiobarbital sodium, thiopentone sodium, thionembutal, Pentothal Sodium®, Nesdonal Sodium®, Intraval Sodium®, Trapanal®, and Thiothal Sodium7), i-STAT recommends the use of G3+, CG4+, CG8+, EG6+ and EG7+ cartridges, which are free from clinically significant interference at all relevant therapeutic doses. i-STAT does not recommend the use of EC8+ cartridges for patients receiving propofol (Diprivan®) or thiopental sodium.
* It is possible that other interfering substances may be encountered. These results are representative and your results may differ somewhat due to test-to-test variation. The degree of interference at concentrations other than those listed might not be predictable.
PCO2-4

Rev. Date: 19-SEP-19 Art: 714182-01U PC02-3
References1. CLSI. Blood Gas and pH Analysis and Related Measurements; Approved Guideline. CLSI document
C46-A [ISBN 1-56238-444-9]. CLSI, 940 West Valley Road, Suite 1400, Wayne, Pennsylvania 19087-1898, USA 2001.
2. D.S. Young, Effects of Drugs on Clinical Laboratory Tests, 3rd ed. (Washington, DC: American Association of Clinical Chemistry, 1990).
3. P.C. Painter, J.Y. Cope, J.L. Smith, “Reference Ranges, Table 41–20” in Tietz Textbook of Clinical Chemistry—Second Edition, C.A. Burtis and E.R. Ashwood, eds. (Philadelphia: W.B. Saunders Company, 1994).
4. E.L. Pruden, O. Siggaard-Andersen, and N.W. Tietz, Blood Gases and pH, in Tietz Textbook of Clinical Chemistry, Second Edition, ed. C.A. Burtis and E.R. Ashwood. (Philadelphia: W.B. Saunders Company, 1994).
5. CLSI. Method Comparison and Bias Estimation Using Patient Samples; Approved Guideline. CLSI document EP9-A [ISBN 1-56238-283-7]. CLSI, 940 West Valley Road, Suite 1400, Wayne, Pennsylvania 19087-1898, USA 1995.
6. P.J. Cornbleet and N. Gochman, “Incorrect Least-Squares Regression Coefficients in Method-Comparison Analysis,” Clinical Chemistry 25:3, 432 (1979).
7. The Merck Index, Eleventh Edition, Merck & Co., Inc., NJ 1989.
i-STAT is a trademark of the Abbott group of companies. Diprivan is a registered trademark of the AstraZeneca group of companies. Pentothal Sodium is a registered trademark of Abbott Labs., USA. Nesdonal Sodium is a registered trademark of Specia, France. Intraval Sodium is a registered trademark of May and Baker, Ltd., England. Trapanal is a registered trademark of Chemische Fabrik Promonta, Germany. ABL is a registered trademark of Radiometer Medical A/S, Copenhagen Denmark. BGE is a registered trademark of Instrumentation Laboratory, Lexington MA.
PCO2-5

Abbott Point of Care Inc. 100 and 200 Abbott Park RoadAbbott Park, IL 60064 • USA
Emergo EuropePrinsessegracht 202514 AP The Hague
The Netherlands
©2019 Abbott Point of Care Inc. All rights reserved. Printed in USA.
PC02-6 Art: 714182-01U Rev. Date: 19-SEP-19

TOTAL CARBON DIOXIDE/ (TCO2)
Rev. Date: 12-OCT-18 Art: 716661-01H
Intended UseThe test for TCO2, as part of the i-STAT System, is intended for use in the in vitro quantification of total carbon dioxide in arterial, venous, or capillary whole blood.
Carbon dioxide is used in the diagnosis, monitoring, and treatment of numerous potentially serious disorders associated with changes in body acid-base balance.
Method ExplanationThe measured TCO2 test method is calibrated to the International Federation of Clinical Chemistry (IFCC) TCO2 reference method1 with an algorithm, based on the Henderson-Hasselbalch equation, which uses pH, PCO2, and ionic strength (Na) measurements.
ContentsEach i-STAT cartridge contains one reference electrode (when potentiometric sensors are included in the cartridge configuration), sensors for the measurement of specific analytes, and a buffered aqueous calibration solution that contains known concentrations of analytes and preservatives. For cartridges that contain sensors for the measurement of TCO2, a list of reactive ingredients is indicated below:
Reactive Ingredient Minimum Quantity
Carbon Dioxide (CO2) 25.2 mmHg
Metrological TraceabilityThe i-STAT System test for total carbon dioxide (TCO2) measures the amount-of-substance total concentration of all forms of carbon dioxide in the plasma fraction of arterial, venous, or capillary whole blood (dimension mmol L-1) for in vitro diagnostic use. TCO2 values assigned to i-STAT System controls and calibration verification materials are traceable to the International Federation of Clinical Chemistry and Laboratory Medicine (IFCC) Reference Measurement Procedure for Substance Concentration Determination for Total Carbon Dioxide in Blood, Plasma or Serum.1 i-STAT System controls and calibration verification materials are validated for use only with the i-STAT System and assigned values may not be commutable with other methods. Further information regarding metrological traceability is available from Abbott Point of Care Inc.
Expected Values
TEST UNITSREPORTABLE
RANGEREFERENCE
RANGE
(arterial) (venous)
Total Carbon Dioxide/TCO2
mmol/L 5 – 50 23 – 27* 24 – 29*
*Calculated from Siggard-Andersen nomogram.2
Arial Regular,Helvetica Neue 55 Roman,Helvetica Neue 56 Italic,Helvetica Neue 7 6 Bold Italic,Helvetica Neue 95 Black
0.62

TCO2 - 2 Art: 716661-01H Rev. Date: 12-OCT-18
The reference ranges programmed into the analyzer and shown above are intended to be used as guides for the interpretation of results. Since reference ranges may vary with demographic factors such as age, gender, and heritage, it is recommended that reference ranges be determined for the population being tested.
Clinical SignificanceTCO2 is a measure of carbon dioxide which exists in several states: CO2 in physical solution or loosely bound to proteins, bicarbonate (HCO3) or carbonate (CO3) anions, and carbonic acid (H2CO3). Measurement of TCO2 as part of an electrolyte profile is useful chiefly to evaluate HCO3 concentration. TCO2 and HCO3 are useful in the assessment of acid-base imbalance (along with pH and PCO2) and electrolyte imbalance.
Calculated and Measured (Traceable) TCO2
The calculated TCO2 provided by the i-STAT System is determined from the measured and reported values of pH and PCO2 according to a simplified and standardized form of the Henderson-Hasselbalch equation.3
TCO2 = HCO3 + 0.03 PCO2
This calculated TCO2 measurement is metrologically traceable to the i-STAT pH and PCO2 measurements, which are in turn traceable to primary standard reference materials for pH and PCO2. Like all calculated parameters reported by the i-STAT System, the user can independently determine TCO2 values from the reported pH and PCO2 measurements using a combination of the equation for HCO3 given in the PCO2 Cartridge and Test Information (CTI) sheet, and the equation for TCO2 above.
On the CHEM8+ cartridge, TCO2 is metrologically traceable to the IFCC TCO2 reference method. The implication of direct traceability to this TCO2 reference method – and not to pH and PCO2 standard reference materials – is subtle but significant: the CHEM8+ is independent of the pH and PCO2 traceability. Given the metrological traceability of the CHEM8+ TCO2 measurement, the traceable TCO2 is considered to be a measured analyte.
Performance CharacteristicsPrecision data were collected in multiple sites following the protocol recommended by Abbott Point of Care. The means, SDs and CVs from 20 replicates at each site were averaged. The average statistics are presented below.
Method comparison data were collected using CLSI guideline EP9-A.4 Venous blood samples were collected in lithium heparin evacuated tubes from hospital patients. The whole blood samples were run in duplicate on the i-STAT System. The samples were then centrifuged to obtain plasma and analyzed in duplicate on the comparative instrument. All samples were analyzed on both methods within 15 minutes of each other.
Deming regression analysis5 was performed on the first replicate of each sample. In the method comparison table, n is the number of specimens in the first data set. Sxx and Syy refer to the estimates of imprecision based on the duplicates of the comparative and the i-STAT methods respectively. Sy.x is the standard error of the estimate, and r is the correlation coefficient.*
Method comparisons may vary from site to site due to differences in sample handling, comparative method calibration and other site specific variables. For TCO2, values measured on serum or plasma by chemistry analyzers may be slightly lower than TCO2 calculated from pH and PCO2 due to loss of CO2 during non-anaerobic handling.6 Up to 6 mmol/L CO2 can be lost per hour by exposure of the sample to air.7
*The usual warning relating to the use of regression analysis is summarized here as a reminder. For any analyte, “if the data is a narrow range, the estimate of the regression parameters are relatively imprecise and may be biased. Therefore, predictions made from estimates may be invalid”,4 The correlation coefficient, r, can be used as a guide to assess the adequacy of the comparative method ranges in overcoming the problem. As a guide, the range of data can be considered adequate if r>0.975.

Rev. Date: 12-OCT-18 Art: 716661-01H TCO2 - 3
Precision Data (mmol/L)
Aqueous Control Mean SD CV (%)
Level 1 17.4 0.62 3.6
Level 3 34.6 0.62 1.8
Method Comparison (mmol/L)
TCO2 (Calculated) IL BGE
TCO2 (Calculated) Beckman Coulter
CX®3
TCO2 (Measured) Beckman Coulter
LX®20n 62 51 35
Sxx 0.40 0.55 0.48
Syy 0.84 0.55 0.60
Slope 1.136 1.155 1.152
Int’t -4.1 -2.6 -1.5
Sy.x 1.38 1.56 0.96
Xmin 19.3 18.3 21
Xmax 43.9 36.1 35
r 0.965 0.935 0.943
Cartridge ComparisonPerformance characteristics for TCO2 are equivalent in all cartridge configurations. System difference analysis was performed on 40 patient samples using the i-STAT CHEM8+ and i-STAT EC8+ cartridges. In the 14-30 mmol/L range, the average difference was -0.7 mmol/L.
Factors Affecting Results*Exposing the sample to air allows CO2 to escape which causes TCO2 to be under-estimated. The use of partial draw tubes (evacuated tubes that are adjusted to draw less than the tube volume, e.g., a 5 mL tube with enough vacuum to draw only 3 mL) is not recommended for use with the i-STAT System because of the potential for decreased TCO2 values. Under-filling blood collection tubes may also cause decreased TCO2 results. Care must also be taken to eliminate “bubbling” of the sample with a pipette when filling a cartridge to avoid the loss of CO2 in the blood.
Allowing blood samples to stand (without exposure to air) before testing allows TCO2 to be over-estimated, due to metabolic processes.
*It is possible that other interfering substances may be encountered.

Abbott Point of Care Inc.Abbott Park, IL 60064 • USA
Emergo EuropePrinsessegracht 202514 AP The Hague
The Netherlands
©2018 Abbott Point of Care Inc. All rights reserved. Printed in USA.
Rev. Date: 12-OCT-18 Art: 716661-01H TCO2 - 4
References
1. IFCC Reference Measurement Procedure for Substance Concentration Determination for Total Carbon Dioxide in Blood, Plasma or Serum (IFCC 2001/3). Clin. Chem. Lab Med., 39(3), 2001.
2. E.L. Pruden, O. Siggard-Andersen, and N.W. Tietz, Blood Gases and pH, in Tietz Textbook of Clinical Chemistry, Second Edition, ed. C.A. Burtis and E.R. Ashwood. (Philadelphia: W.B. Saunders Company, 1994).
3. CLSI. Blood Gas and pH Analysis and Related Measurements; Approved Guideline. CLSI document C46-A [ISBN 1-56238-444-9]. CLSI, 940 West Valley Road, Suite 1400, Wayne, Pennsylvania 19087-1898, USA 2001.
4. CLSI. Method Comparison and Bias Estimation Using Patient Samples; Approved Guideline. CLSI document EP9-A [ISBN 1-56238-283-7]. CLSI, 940 West Valley Road, Suite 1400, Wayne, Pennsylvania 19087-1898, USA 1995.
5. P.J. Cornbleet and N. Gochman, “Incorrect Least Squares Regression Coefficients in Method-Comparison Analysis,” Clinical Chemistry 25:3, 432 (1979).
6. J.P.J. Ungerer, M.J. Ungerer, and W.J.H. Vermaak, Discordance Between Measured and Calculated Total Carbon Dioxide, Clinical Chemistry 36.12, 1990. 2093-2096.
7. M.G. Scott, J. Heusel, V.A. LeGrys, and O. Siggard-Andersen, Electrolytes and Blood Gases, in Tietz Textbook of Clinical Chemistry, Third Edition, ed. C.A. Burtis and E.R. Ashwood. (Philadelphia: W.B. Saunders Company, 1999).
i-STAT is a trademark of the Abbott Group of Companies in various jurisdictions.
CX®3 and LX®20 are registered trademarks of Beckman Coulter Instruments, Inc., Brea, CA USA.

Rev. Date: 23-APR-18 Art: 714183-01Y
CREATININE/CREA
Creatinine is measured amperometrically. Creatinine is hydrolyzed to creatine in a reaction catalyzed by the enzyme creatinine amidohydrolase. Creatine is then hydrolyzed to sarcosine in a reaction catalyzed by the enzyme creatine amidinohydrolase. The oxidation of sarcosine, catalyzed by the enzyme sarcosine oxidase, produces hydrogen peroxide (H2O2). The liberated hydrogen peroxide is oxidized at the platinum electrode to produce a current which is proportional to the sample creatinine concentration.
Creatinine AmidohydrolaseCreatinine + H2O Creatine
Creatine AmidinohydrolaseCreatine + H2O Sarcosine + Urea
Sarcosine OxidaseSarcosine + O2 + H2O Glycine + Formaldehyde + H2O2
H2O2 O2 + 2H+ +2e-
See below for information on factors affecting results. Certain substances, such as drugs, may affect analyte levels in vivo.1
If results appear inconsistent with the clinical assessment, the patient sample should be retested using another cartridge.
INTENDED USE
The test for creatinine, as part of the i-STAT® System, is for the quantitative determination of creatinine in whole blood on the i-STAT handheld.
Creatinine measurements are used in the diagnosis and treatment of renal diseases, in monitoring renal dialysis, and as a calculation basis for measuring other urine analytes.
Contents
Each i-STAT cartridge contains one reference electrode (when potentiometric sensors are included in the cartridge configuration), sensors for the measurement of specific analytes, and a buffered aqueous calibrant solution that contains known concentrations of analytes and preservatives. For cartridges that contain a sensor for the measurement of creatinine, a list of reactive ingredients is indicated below:
Reactive Ingredient Biological Source Minimum Quantity
Creatinine N/A 158.4 µmol/L
Creatine Amidinohydrolase Actinobacillus spp. 0.01 IU
Creatinine Amidohydrolase Microbial 0.02 IU
Sarcosine Oxidase Microbial 0.001 IU

Crea - 2 Art: 714183-01Y Rev. Date: 23-APR-18
Metrological Traceability
The i-STAT System test for creatinine measures creatinine amount-of-substance concentration in the plasma fraction of arterial, venous, or capillary whole blood (dimension μmol L-1) for in vitro diagnostic use. Creatinine values assigned to i-STAT’s controls and calibration verification materials are traceable to the U.S. National Institute of Standards and Technology (NIST) standard reference material SRM967. i-STAT System controls and calibration verification materials are validated for use only with the i-STAT System and assigned values may not be commutable with other methods. Further information regarding metrological traceability is available from Abbott Point of Care Inc.
Expected Values
Reportable Reference Test/Abbreviation Units* Range Range
Creatinine/Crea mg/dL 0.2 – 20.0 0.6 – 1.32
µmol/L 18 – 1768 53 – 115
To convert a creatinine result from mg/dL to µmol/L, multiply the mg/dL value by 88.4.
The i-STAT reference ranges for whole blood listed above are similar to reference ranges derived from serum or plasma measurements with standard laboratory methods.
The reference range programmed into the analyzer and shown above is intended to be used as a guide for the interpretation of results. Since reference ranges may vary with demographic factors such as age, gender and heritage, it is recommended that reference ranges be determined for the population being tested.
* The i-STAT System can be configured with the preferred units.
Clinical Significance
Elevated levels of creatinine are mainly associated with abnormal renal function and occur whenever there is a significant reduction in glomerular filtration rate or when urine elimination is obstructed. The concentration of creatinine is a better indicator of renal function than urea or uric acid because it is not affected by diet, exercise, or hormones.
The creatinine level has been used in combination with BUN to differentiate between prerenal and renal causes of an elevated urea/BUN.
Performance Characteristics
The typical performance data summarized below were collected in health care facilities by professionals trained in the use of the i-STAT System and comparative methods. Clinical settings vary and some may require different performance characteristics to assess renal function status than others (e.g., medication dosing, intravenous contrast use, and outpatient clinic). If deemed necessary by a health care facility, performance data should be obtained in specific clinical settings to assure patients’ needs are met.
Precision data were collected in multiple sites following the protocol recommended by Abbott Point of Care. The means, SDs and CVs from 20 replicates at each site were averaged. The average statistics are presented below.
Method comparison data were collected using CLSI guideline EP9-A.3 Venous blood samples, collected in lithium or sodium heparin Vacutainer® tubes, and arterial blood samples, collected in blood gas syringes, were analyzed in duplicate on the i-STAT System. A portion of each specimen was centrifuged, and the separated plasma was analyzed on the comparative method.
Deming regression analysis4 was performed on the first replicate of each sample. In the method comparison table, n is the number of specimens in the data set, Sxx and Syy refer to the estimates of imprecision based on the duplicates of the comparative and the i-STAT methods respectively, Sy.x is the standard error of the estimate, and r is the correlation coefficient.*
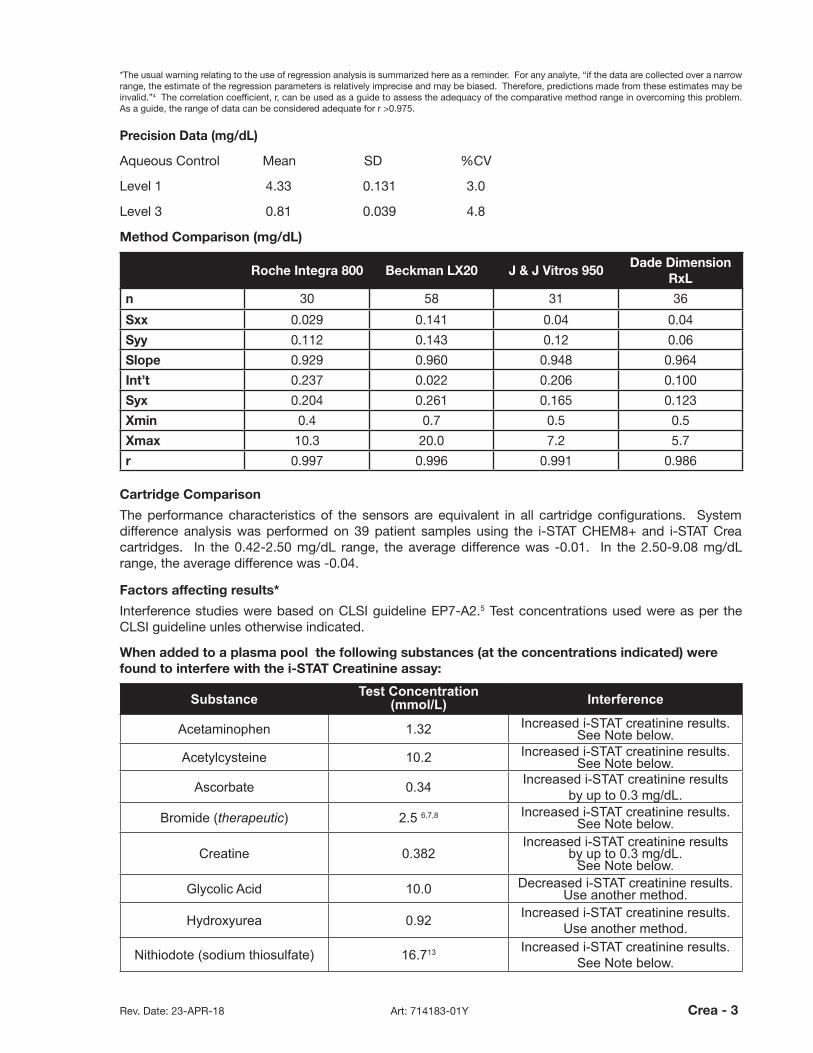
Rev. Date: 23-APR-18 Art: 714183-01Y Crea - 3
*The usual warning relating to the use of regression analysis is summarized here as a reminder. For any analyte, “if the data are collected over a narrow range, the estimate of the regression parameters is relatively imprecise and may be biased. Therefore, predictions made from these estimates may be invalid.”4 The correlation coefficient, r, can be used as a guide to assess the adequacy of the comparative method range in overcoming this problem. As a guide, the range of data can be considered adequate for r >0.975.
Precision Data (mg/dL)
Aqueous Control Mean SD %CV
Level 1 4.33 0.131 3.0
Level 3 0.81 0.039 4.8
Method Comparison (mg/dL)
Roche Integra 800 Beckman LX20 J & J Vitros 950Dade Dimension
RxL
n 30 58 31 36
Sxx 0.029 0.141 0.04 0.04
Syy 0.112 0.143 0.12 0.06
Slope 0.929 0.960 0.948 0.964
Int’t 0.237 0.022 0.206 0.100
Syx 0.204 0.261 0.165 0.123
Xmin 0.4 0.7 0.5 0.5
Xmax 10.3 20.0 7.2 5.7
r 0.997 0.996 0.991 0.986
Cartridge Comparison
The performance characteristics of the sensors are equivalent in all cartridge configurations. System difference analysis was performed on 39 patient samples using the i-STAT CHEM8+ and i-STAT Crea cartridges. In the 0.42-2.50 mg/dL range, the average difference was -0.01. In the 2.50-9.08 mg/dL range, the average difference was -0.04.
Factors affecting results*
Interference studies were based on CLSI guideline EP7-A2.5 Test concentrations used were as per the CLSI guideline unles otherwise indicated.
When added to a plasma pool the following substances (at the concentrations indicated) were found to interfere with the i-STAT Creatinine assay:
Substance Test Concentration(mmol/L) Interference
Acetaminophen 1.32 Increased i-STAT creatinine results. See Note below.
Acetylcysteine 10.2 Increased i-STAT creatinine results. See Note below.
Ascorbate 0.34 Increased i-STAT creatinine results by up to 0.3 mg/dL.
Bromide (therapeutic) 2.5 6,7,8 Increased i-STAT creatinine results. See Note below.
Creatine 0.382Increased i-STAT creatinine results
by up to 0.3 mg/dL. See Note below.
Glycolic Acid 10.0 Decreased i-STAT creatinine results. Use another method.
Hydroxyurea 0.92 Increased i-STAT creatinine results. Use another method.
Nithiodote (sodium thiosulfate) 16.713 Increased i-STAT creatinine results. See Note below.

Crea - 4 Art: 714183-01Y Rev. Date: 23-APR-18
The following substances are known not to significantly interfere with the i‑STAT Creatinine assay at the stated test concentrations:
Substance Test Concentration(mmol/L)
Acetaldehyde 0.045 9
Acetaminophen (therapeutic) 0.132 9
Acetylcysteine (therapeutic) 0.3 10,11
Bicarbonate 35.0Bilirubin 0.342
Calcium Chloride 5.0Dopamine 0.006
Formaldehyde 0.133 9
β–Hydroxybutyrate 6.0 12 Lactate 6.6
Methyldopa 0.071Pyruvate 0.31Salicylate 4.34 Uric Acid 1.4
Notes:
1) The normal range of creatine concentration in plasma is 0.17–0.70 mg/dL (13 – 53 µmol/L) in males and 0.35 – 0.93 mg/dL (27 – 71 µmol/L) in females.9 Creatine may be elevated in patients using cre-atine supplements, experiencing muscle trauma or other primary or secondary myopathies, taking statins for hyperlipidemia control, or in patients with hyperthyroidism or a rare genetic defect of the creatine transporter protein.
2) Hydroxyurea is a DNA synthesis inhibitor used in the treatment of various forms of cancer, sickle cell anemia, and HIV infection. This drug is used to treat malignancies including melanoma, metastatic ovarian cancer, and chronic myelogenous leukemia. It is also used in the treatment of polycythemia vera, thrombocythemia, and psoriasis. At typical doses ranging from 500 mg to 2 g/day, concentrations of hydroxyurea in patients’ blood may be sustained at approximately 100 to 500 µmol/L. Higher con-centrations may be observed soon after dosing or at higher therapeutic doses.
3) Acetaminophen has been shown to interfere at a concentration proscribed by the CLSI guideline, 1.32 mmol/L, which represents a toxic concentration. Acetaminophen at 0.132 mmol/L, which repre-sents the upper end of the therapeutic concentration, has been shown not to significantly interfere with i-STAT creatinine results.
4) Acetylcysteine has been tested at two levels: the CLSI recommended level and a concentration of 0.30 mmol/L. The latter is 3 times the peak plasma therapeutic concentration associated with treat-ment to reverse acetaminophen poisoning. APOC has not identified a therapeutic condition that would lead to levels consistent with the CLSI recommended level. Acetylcysteine at a concentration of 10.2 mmol/L increased i-STAT creatinine results, while acetylcysteine at a concentration of 0.3 mmol/L did not significantly interfere with i-STAT creatinine results.

Rev. Date: 23-APR-18 Art: 714183-01Y Crea - 5
5) Bromide has been tested at two levels: the CLSI recommended level and a therapeutic plasma concentration level of 2.5 mmol/L. The latter is the peak plasma concentration associated with halothane anesthesia, in which bromide is released. APOC has not identified a therapeutic condition that would lead to levels consistent with the CLSI recommended level. Bromide tested at concentrations of 2.5 and 37.5 mmol/L interfered with i-STAT creatinine results.
6) The dependence of the i-STAT creatinine with respect to Carbon Dioxide (CO2) is as follows:
For creatinine results ≤ 2.0 mg/dL, no correction for PCO2 is required.For creatinine results > 2.0 mg/dL, the following correction applies:
creatininecorrected = creatinine * (1 + 0.0025 * (PCO2 − 40))
7) Nithiodote (sodium thiosulfate) is indicated for the treatment of acute cyanide poisoning. The journal article titled “Falsely increased chloride and missed anion gap elevation during treatment with sodium thiosulfate” indicated that sodium thiosulfate could be used in the treatment of calciphylaxis indicating that “the highest concentration likely to be seen in plasma [is] after infusion of a 12.5 g dose of sodium thiosulfate pentahydrate. Assuming that the 12.5 g dose of sodium thiosulfate pentahydrate is dis-tributed in a typical blood volume of 5 L with a hematocrit of 40%, the peak sodium thiosulfate plasma concentration expected is 16.7 mmol/L.”13
*It is possible that other interfering substance may be encountered. The degree of interference at concentrations other than those listed might not be predictable.

Abbott Point of Care Inc.100 and 200 Abbott Park RoadAbbott Park, IL 60064 • USA
Emergo EuropePrinsessegracht 202514 AP The Hague
The Netherlands
©2018 Abbott Point of Care Inc. All rights reserved. Printed in USA.
Crea - 6 Art: 714183-01Y Rev. Date: 23-APR-18
References1. D. S. Young. Effects of Drugs on Clinical Laboratory Tests, 3rd ed. (Washington, DC: American
Association of Clinical Chemistry, 1990).
2. Tietz Textbook of Clinical Chemistry and Molecular Diagnostics 4th Edition. CA Burtis, ER Ash-wood, DE Bruns, ed., Elsevier Saunders Inc., 2006, page 2264.
3. CLSI. Method Comparison and Bias Estimation Using Patient Samples; Approved Guideline. CLSI document EP9-A [ISBN 1-56238-283-7]. CLSI, 940 West Valley Road, Suite 1400, Wayne, Pennsylvania 19087-1898, USA 1995.
4. P.J. Cornbleet and N. Gochman. “Incorrect Least-Squares Regression Coefficients in Method Comparison Analysis,” Clinical Chemistry 25:3, 432 (1979).
5. Clinical and Laboratory Standards Institute (CLSI). Interference Testing in Clinical Chemistry; Approved Guideline-Second Edition. CLSI document EP7-A2 (ISBN 1-56238-584-4). Clinical and Laboratory Standards Institute, 940 West Valley Road, Suite 1400, Wayne, Pennsylvania 19087- 1898, USA 2005.
6. Hankins D.C and Kharasch E.D. Determination of the halothane metabolites trifluoroacetic acid and bromide in plasma and urine by ion chromatography. J of Chromatography B. 692 (1997) 413-418.
7. Kharasch E.D., Hankins D., Mautz D., and Thummel K.E. Identification of the enzyme responsi-ble for oxidative halothane metabolism: implications for prevention of halothane hepatitis. Lancet 1996; 347:1367-71.
8. Morrison J.E. and Friesen R.H., Elevated serum bromide concentrations following repeated halo-thane anaesthesia in a child. Can J Anaesth 1990; 37 (7): 801-803.
9. Wu, H.B.A., Tietz Clinical Guide to Laboratory Tests. 4th Edition. 2006.
10. Whillier S, Raftos JE, Chapman B, Kuchel PW. Role of N-acetylcysteine and cystine in glutathi-one synthesis in human erythrocytes. Redox Rep. 2009;14(3):115-24.
11. Paolo Ventura, Rossana Panini, Maria CristinaPasini, Gabriella Scarpetta and Gianfranco Salvi-oli. N-Acetyl-Cysteine Reduces Homocysteine Plasma Levels After Single Intravenous Admin-stration by Increasing Thiols Urinary Excretion. Pharmacological Research. Volume 40, Issue 4, October 1999, Pages 345-350.
12. Charles R.A, Bee Y.M, Eng P.H.K., Goh S.Y. Point of care blood ketone testing: screening for dia-betic ketoacidosis at the emergency department. Singapore Med J 2007; 48 (11): 986.
13. Wendroth Scott M., Tiffany N. Heady, Doris M. Haverstick, Lorin M. Bachmann, Mitchell G. Scott, James C. Boyd, and David E. Bruns. Falsely increased chloride and missed anion gap elevation during treatment with sodium thiosulfate. Clinica Chimica Acta 2014; 431: 77–79.
i-STAT is a trademark of the Abbott Group of Companies in various jurisdictions. Vacutainer is a registered trademark of Becton Dickinson and Company, Franklin Lakes, NJ USA. Vitros is a registered trademark of Ortho-Clinical Diagnostics, Rochester, NY. Droxia and Hydrea are registered trademarks of Bristol-Myers Squibb Company, Princeton, NJ.

Rev. Date: 23-APR-18 Art: 714184-01P
LACTATE/LAC
Lactate is measured amperometrically. The enzyme lactate oxidase, immobilized in the lactate biosensor, selectively converts lactate to pyruvate and hydrogen peroxide (H2O2). The liberated hydrogen peroxide is oxidized at a platinum electrode to produce a current which is proportional to the sample lactate concentration.
Lactate OxidaseL-Lactate + O2 Pyruvate + H2O2
Platinum electrodeH2O2 2H+ + O2 + 2e-
See below for information on factors affecting results. Certain substances, such as drugs, may affect analyte levels in vivo.1
If results appear inconsistent with the clinical assessment, the patient sample should be retested using another cartridge.
Intended Use
The test for lactate, as part of the i-STAT System, is intended for use in the in vitro quantification of lactate in arterial, venous, or capillary whole blood.
The i-STAT lactate test is useful for (1) the diagnosis and treatment of lactic acidosis in conjunction with measurements of blood acid/base status, (2) monitoring tissue hypoxia and strenuous physical exertion, and (3) diagnosis of hyperlactatemia.
ContentsEach i-STAT cartridge contains one reference electrode (when potentiometric sensors are included in the cartridge configuration), sensors for the measurement of specific analytes, and a buffered aqueous calibrant solution that contains known concentrations of analytes and preservatives. For cartridges that contain a sensor for the measurement of lactate, a list of reactive ingredients is indicated below:
Reactive Ingredient Biological Source Minimum Quantity
Lactate N/A 1.8 mmol/L
Lactate Oxidase Aerococcus viridans 0.001 IU
Metrological TraceabilityThe i-STAT System test for lactate measures L-lactate amount-of-substance concentration in the plasma fraction of arterial, venous, or capillary whole blood (dimension mmol L-1) for in vitro diagnostic use. Presently, no international conventional reference measurement procedure or international conventional calibrator for lactate is available. Lactate values assigned to i-STAT’s controls and calibration verification materials are traceable to i-STAT’s working calibrator prepared from sodium L-lactate (Sigma-Aldrich

LAC - 2 Art: 714184-01P Rev. Date: 23-APR-18
Fluka, >99 % purity). i-STAT System controls and calibration verification materials are validated for use only with the i-STAT System and assigned values may not be commutable with other methods. Further information regarding metrological traceability is available from Abbott Point of Care Inc..
Expected Values Reportable Reference2 Test/Abbreviation Units* Range Range (arterial) (venous)
Lactate/Lac mmol/L 0.30 – 20.00 0.36 – 1.25 0.90 – 1.70 mg/dL 2.7 – 180.2 3.2 – 11.3 8.1 – 15.3
To convert a lactate result from mmol/L to mg/dL, multiply the mmol/L value by 9.01.
The i-STAT reference ranges for whole blood listed above are similar to reference ranges derived from serum or plasma measurements with standard laboratory methods.
The reference range shown above is intended to be used as a guide for the interpretation of results. Since reference ranges may vary with demographic factors such as age, gender and heritage, it is recommended that reference ranges be determined for the population being tested.
* The i-STAT System can be configured with the preferred units.
Clinical Significance
Elevated levels of lactate are mainly found in conditions of hypoxia such as shock, hypovolumia, and left ventricular failure; in conditions associated with diseases such as diabetes mellitus, neoplasia, and liver disease; and in conditions associated with drugs or toxins such as ethanol, methanol, or salicylates.2
Hyperlactatemia is an indicator commonly used to detect tissue hypoperfusion, particularly in the case of sepsis,3-5 but also in trauma6-8 and surgical9-11 settings.
Performance Characteristics
The typical performance data summarized below was collected in health care facilities by health care professionals trained in the use of the i-STAT System and comparative methods.
Precision data were collected using CLSI guideline EP5-A12. Duplicates of each level of control were tested on three lots of cartridges over 20 days for a total of 120 replicates.
Method comparison data were collected using CLSI guideline EP9-A13. Venous blood samples, collected in sodium heparin Vacutainer® tubes, and arterial blood samples, collected in blood gas syringes, were analyzed in duplicate on the i-STAT System. In the plasma study, a portion of each specimen was centrifuged, and the separated plasma was analyzed on the comparative method.
Deming regression analysis14 was performed on the first replicate of each sample. In the method comparison table, n is the number of specimens in the data set, Sxx and Syy refer to the estimates of imprecision based on the duplicates of the comparative and the i-STAT methods respectively, Sy.x is the standard error of the estimate, and r is the correlation coefficient.*
*The usual warning relating to the use of regression analysis is summarized here as a reminder: For any analyte, “if the data is collected over a narrow range, the estimate of the regression parameters are relatively imprecise and may be biased. Therefore, predictions made from these estimates may be invalid”.12 The correlation coefficient, r, can be used as a guide to assess the adequacy of the comparative method range in overcoming this problem. As a guide, the range of data can be considered adequate
if r>0.975.

Rev. Date: 23-APR-18 Art: 714184-01P LAC - 3
Precision Data Aqueous Control n Mean SD %CV (mmol/L) Level 1 120 6.35 0.08 1.21 Level 3 120 0.81 0.03 3.27
Method Comparison Radiometer ABL 725 Hitachi 917 (mmol/L) (whole blood vs. (i-STAT whole blood vs. whole blood) Hitachi plasma) n 47 47
Sxx 0.123 0.084
Syy 0.136 0.079
Slope 1.02 1.06
Int't 0.12 -0.32
Sy.x 0.18 0.17
Xmin 0.80 1.77
Xmax 14.20 14.24
r 0.998 0.997
Factors Affecting Results*Special collection procedures are necessary to prevent changes in lactate both during and after the blood is drawn. For steady state lactate concentrations, patients should be at rest for 2 hours and fasting. Venous samples should be obtained without the use of a tourniquet or immediately after the tourniquet is applied. Both venous and arterial samples may be collected into heparinized syringes.
Samples for lactate should be analyzed immediately on drawing as lactate increases by as much as 70% within 30 minutes at 25 ºC as a result of glycolysis.2
Interference studies were based on CLSI guideline EP7-A2.15 Test concentrations used were as per the CLSI guideline unless otherwise indicated.
When added to a plasma pool the following substances (at the concentrations indicated) were found to interfere with the i-STAT lactate assay:
Substance Test Concentration(mmol/L) Interference
Bromide 37.5 Use another method. See Note below
Glycolic Acid 10.0 16 Increased i-STAT lactate results. Use another method.
Hydroxyurea 0.92 Increased i-STAT lactate results. Use another method.
The following substances are known not to significantly interfere with the i-STAT lactate assay at the stated test concentrations:
Substance Test Concentration(mmol/L)
Acetaldehyde 0.045 16
Acetaminophen 1.32Acetylcysteine 10.2
Ascorbate 0.34Bromide (therapeutic) 2.5 17,18,19
Dopamine 0.006Formaldehyde 0.133 16
β-Hydroxybuterate 6.0 20
Pyruvate 0.31Salicylate 4.34Uric Acid 1.4

LAC - 4 Art: 714184-01P Rev. Date: 23-APR-18
Notes:
1) Hydroxyurea is a DNA synthesis inhibitor used in the treatment of various forms of cancer, sickle cell anemia, and HIV infection. This drug is used to treat malignancies including melanoma, metastatic ovar-ian cancer, and chronic myelogenous leukemia. It is also used in the treatment of polycythemia vera, thrombocythemia, and psoriasis. At typical doses ranging from 500 mg to 2 g/day, concentrations of hydroxyurea in patients’ blood may be sustained at approximately 100 to 500 μmol/L. Higher concentra-tions may be observed soon after dosing or at higher therapeutic doses.
2) Glycolic acid is a product of ethylene glycol metabolism. Unexpected increased lactate concentrations caused by glycolic acid may be a clue to the possibility of ethylene glycol ingestion as the cause of an otherwise unknown high anion gap metabolic acidosis.21,22 In a study of 35 patients who had ingested eth-ylene glycol, initial glycolic acid concentrations of 0 to 38 mmol/L corresponded to ethylene glycol levels of 0.97 - 130.6 mmol/L.22
3) Bromide has been tested at two levels; the CLSI recommended level and a therapeutic plasma con-centration level of 2.5 mmol/L. The latter is the peak plasma concentration associated with halothane anesthesia, in which bromide is released. APOC has not identified a therapeutic condition that would lead to levels consistent with the CLSI recommended level. Bromide at a concentration of 37.5 mmol/L decreased i-STAT lactate results, while a therapeutic range of bromide (2.5 mmol/L) did not significantly interfere with i-STAT lactate results.
* It is possible that other interfering substances may be encountered. The degree of interference at concentrations other than those listed might not be
predictable.

Rev. Date: 23-APR-18 Art: 714184-01P LAC - 5
References1. D.S. Young, Effects of Drugs on Clinical Laboratory Tests, 3rd ed. (Washington, DC: American
Association of Clinical Chemistry, 1990).
2. D.B. Sacks, Carbohydrates, in Tietz Textbook of Clinical Chemistry, Second Edition, ed. C.A. Burtis and E.R. Ashwood, (Philadelphia: W.B. Saunders Company, 1994).
3. Jones AE, Puskarich MA. Sepsis-induced tissue hypoperfusion. Crit Care Clin. 2009;25:769-779.
4. Dellinger RP, Levy MM, Carlet JM, et al. Surviving Sepsis Campaign: international guidelines for management of severe sepsis and septic shock: 2008. Crit Care Med. 2008;36:296-327.
5. Shapiro NI, Fisher C, Donnino M, et al. The feasibility and accuracy of point-of-care lactate measurement in emergency department patients with suspected infection. J Emerg Med.
2010;39:89-94.
6. Crowl AC, Young JS, Kahler DM, et al. Occult hypoperfusion is associated with increased morbidity in patients undergoing early femur fracture fixation. J Trauma. 2000;48:260-267.
7. Paladino L, Sinert R, Wallace D, et al. The utility of base deficit and arterial lactate in differentiating major from minor injury in trauma patients with normal vital signs. Resuscitation. 2008;77:363-368.
8. Blow O, Magliore L, Claridge JA, et al. The golden hour and the silver day: detection and correction of occult hypoperfusion within 24 hours improves outcome from major trauma. J Trauma. 1999;47:964-969.
9. Bakker J and Pinto de Lima A. Increased blood lacate levels: an important warning signal in surgical practice. Crit Care. 2004;8:96-98.
10. Husain FA, Martin MJ, Mullenix PS, et al. Serum lactate and base deficit as predictors of mortality and morbidity. Am J Surg. 2003;185:485-491.
11. Rossi AF, Khan DM, Hannan R, et al. Goal-directed medical therapy and point-of-care testing improve outcomes after congenital heart surgery. Intensive Care Med. 2005;31:98-104.
12. CLSI. Evaluation of Precision Performance of Clinical Chemistry Devices; Approved Guideline. CLSI document EP5-A [ISBN 1-56238-368-X]. CLSI, 940 West Valley Road, Suite 1400, Wayne, Pennsyl-vania 19087-1898, USA 1999.
13. CLSI. Method Comparison and Bias Estimation Using Patient Samples; Approved Guideline. CLSI document EP9-A [ISBN 1-56238-283-7]. CLSI, 940 West Valley Road, Suite 1400, Wayne,
Pennsylvania 19087-1898, USA 1995.
14. P.J. Cornbleet and N. Gochman, “Incorrect Least-Squares Regression Coefficients in Method Comparison Analysis,” Clinical Chemistry 25:3, 432 (1979).
15. Clinical and Laboratory Standards Institute (CLSI). Interference Testing in Clinical Chemistry; Approved Guideline-Second Edition. CLSI document EP7-A2 (ISBN 1-56238-584-4). Clinical and Laboratory Standards Institute, 940 West Valley Road, Suite 1400, Wayne, Pennsylvania 19087-1898, USA 2005.
16. Wu, H.B. A., Tietz Clinical Guide to Laboratory Tests. 4th Edition. 2006.
17. Kharasch E.D, Hankins D., Mautz D., Thummel K.E.. Identification of the enzyme responsible for oxidative halothane metabolism: implications for prevention of halothane hepatitis. Lancet 1996; 347:1367-71.
18. Morrison J.E., Friesen R.H., Elevated serum bromide concentrations following repeated halothane anaesthesia in a child. Can J Asaesth 1990; 37 (7): 801-803.
19. Hankins D.C, Kharasch E.D., Determination of the halothane metabolites trifluoroacetic acid and bromide in plasma and urine by ion chromatography. J of Chromatography B. 692 (1997) 413-418.

Abbott Point of Care Inc.100 and 200 Abbott Park RoadAbbott Park, IL 60064 • USA Emergo Europe
Prinsessegracht 202514 AP The Hague
The Netherlands
©2018 Abbott Point of Care Inc. All rights reserved. Printed in USA.
Rev. Date: 23-APR-18 Art: 714184-01P LAC - 6
20. Charles R.A, Bee Y.M, Eng P.H.K., Goh S.Y. Point of care blood ketone testing: screening for diabetic ketoacidosis at the emergency department. Singapore Med J 2007; 48 (11): 986.
21. Morgan, TJ, Clark C, Clague A. Artifactual elevation of measured plasma L-lactate concentration in the presence of glycolate. Crit Care Med 1999; 27:2177-2179.
22. Porter WH, Crellin M, Rutter PW, Oeltgen P. Interference by Glycolic Acid in the Beckman Synchron Method for Lactate: A Useful Clue for Unsuspected Ethylene Glycol Intoxication. Clin Chem 2000; 46:874-875.
i-STAT is a registered trademark of the Abbott Group of Companies in various jurisdictions. Vacutainer is a registered trademark of Becton Dickinson and Company, Franklin Lakes, NJ USA. ABL is a registered trademark of Radiometer Medical A/S, Copenhagen, Denmark. Droxia and Hydrea are registered trademarks of Bristol-Myers Squibb Company, Princeton, NJ.

KAOLIN ACTIVATED CLOTTING TIME/(KAOLINACT)
Rev. Date: 23-APR-18 Art: 715878-01P
The i-STAT® Kaolin Activated Clotting Time test, KaolinACT, is a measure of the time required for complete activation of the coagulation cascade.1
In traditional ACT tests, coagulation is initiated by mixing a whole blood sample with a particulate activator, and complete activation is indicated when extensive or localized clots form as activated thrombin converts fibrinogen to fibrin. These clots are mechanically detected.
The i-STAT KaolinACT test is similar to traditional ACT tests except that the endpoint is indicated by the conversion of a thrombin substrate other than fibrinogen and an electrochemical sensor is used to indicate the event of this conversion. The substrate used in the electrogenic assay has an amide linkage that mimics the thrombin-cleaved amide linkage in fibrinogen.
The substrate is H-D-phenylalanyl-pipecolyl-arginine-p-amino-p-methoxydiphenylamine which has the structure:
Phenylalanine - Pipecolic acid - Arginine -- NH - C6H4 - NH - C6H4 - OCH3
Thrombin cleaves the amide bond at the carboxy-terminus of the arginine residue (denoted by the two dashes) because the bond structurally resembles the thrombin-cleaved amide linkage in fibrinogen. The product of the thrombin-substrate reaction is the electrochemically inert tripeptide Phenylalanyl - Pipecolyl - Arginine and the electroactive compound NH3
+ - C6H4 - NH - C6H4 - OCH3. The formation of the electroactive compound is detected amperometrically, and the time of detection is measured in seconds. The test reports the Activated Clotting Time (ACT) in seconds.
The i-STAT KaolinACT test is calibrated to match the Hemochron Celite FTCA510 using prewarmed reagent tubes. However, users may choose to customize their individual i-STAT locations to report ACT results as calibrated against the Hemochron Celite ACT using non-prewarmed (ambient temperature) tubes. This customization affects the Patient path only and will not be applied to the Control or the Proficiency Testing pathway.
The customization in effect (prewarm or non-prewarm calibration mode) is identified on the analyzer screen. Please note that different locations within a given hospital may utilize different customization profiles. Prior to patient sample testing, ensure the appropriate calibration mode is employed. For a comprehensive discussion of this customization feature, please see the System Manual.
If results appear inconsistent with the clinical assessment, the patient sample should be re-tested using another cartridge.
Intended UseThe i-STAT Kaolin Activated Clotting Time (KaolinACT) test is an in vitro diagnostic test that uses fresh, whole blood, and is used to monitor high-dose heparin anticoagulation frequently associated with cardiovascular surgery.
Arial Regular,Helvetica Neue 55 Roman,Helvetica Neue 56 Italic,Helvetica Neue 7 6 Bold Italic,Helvetica Neue 95 Black
Helvetica Neue 55 Roman,Helvetica Neue 56 Italic,Helvetica Neue 75 Bo ld ,He lve t ica Neue 76 Bold Italic,Helvetica Neue 95 Black,Symbol (OTF) Regular,Zapf Dingbats ITC by BT Regular

Kaolin ACT - 2 Art: 715878-01P Rev. Date: 23-APR-18
ContentsEach i-STAT KaolinACT cartridge provides a sample collection chamber, sensors to detect the coagulation endpoint, and dry reagents necessary to initiate and allow coagulation. Stabilizers and reagents are coated on a section of the sensor channel and include the following reactive ingredients:
Reactive Ingredient Minimum Quantity
Kaolin 23.4 μg
Thrombin Substrate 0.09 μg
Metrological TraceabilityThe i-STAT System test for Kaolin Activated Clotting Time measures the time interval required for complete activation, by kaolin, of the coagulation cascade in arterial or venous whole blood (dimension seconds) for in vitro monitoring of high-level heparin therapy. Presently, no international conventional reference measurement procedure or international conventional calibrator for KaolinACT is available. KaolinACT values assigned to APOC’s controls are traceable to APOC’s selected reference measurement procedure, which employs Celite activated glass reagent tubes, an automated timer and traditional viscometric clot detection and is run under specified temperature and sample conditions. i-STAT System controls are validated for use only with the i-STAT System and assigned values may not be commutable with other methods. Further information regarding metrological traceability is available from Abbott Point of Care Inc.
Expected Values
Test/Abbreviation Units Reportable Range Reference Range (PREWRM)
Reference Range (NONWRM)
Activated Clotting Time/ACT
seconds 50 - 1000* 74 - 137 82- 152
* The range from 77 - 1000 seconds (PREWRM mode) has been verified through method comparison studies.
Clinical SignificanceThe ACT is primarily used to monitor a patient’s state of anticoagulation due to heparin that is administered during a medical or surgical procedure. It is commonly employed in cardiac catheterization, Percutaneous Transluminal Coronary Angioplasty (PTCA), renal dialysis, hemodialysis, and extra-corporeal circulation during bypass.
Performance CharacteristicsThe typical performance data summarized below were collected in health care facilities by health care professionals trained in the use of the i-STAT System and comparative methods. All data use the PREWRM calibration, unless otherwise noted.
Precision data were collected at i-STAT and during clinical trials following a protocol recommended by i-STAT and using plasma control material. Similar results can be expected in future performance studies provided the same experimental design and data analysis procedures are followed.
Plasma Control n Mean SD %CV
Level 1 119 169 seconds 4 seconds 2.0
Level 2 113 409 seconds 21 seconds 5.2

Rev. Date: 23-APR-18 Art: 715878-01P Kaolin ACT - 3
Method comparison data were collected using a modification of the CLSI guideline EP9-A.2 Venous or arterial blood samples were collected in plastic syringes and analyzed in duplicate on the i-STAT System and in duplicate using the comparative methods. All samples were analyzed immediately upon collection. The patient populations in the studies were those in which ACT is routinely used and included both aprotinin and non-aprotinin receiving patients. All were undergoing cardiac surgery. Sample types included baseline, heparin-treated, and heparin-reversed samples.
Deming regression analysis3 was performed on the first replicate of each sample. In the method comparison table, n is the number of specimens in the data set, Sxx and Syy refer to estimates of the imprecision based on the duplicates of the comparative and i-STAT methods respectively, Sy.x is the standard error of the estimate, and r is the correlation coefficient.
Method comparisons will vary from site to site due to differences in the sample handling, reagent and instrument systems in use, and other site-specific variables.
Hemochron FTK-ACT
CVOR Site 1 Site 2 Site 3
n 104 118 106
Sxx 9.1 % 6.8 % 7.6 %
Syy 3.6 % 4.0 % 3.6 %
Slope 0.96 1.05 0.96
Intercept -12 -38 -39
Xmin 68 111 81
Xmax 1286 1310 1102
r 0.906 0.940 0.971
Factors Affecting Results*The i-STAT KaolinACT test is not significantly prolonged in the presence of a therapeutic level (200−280 KIU/mL) of aprotinin (Trasylol). If a patient has been administered the maximum aprotinin dosage of 400 KIU/mL, Abbott Point of Care recommends that the first blood sample post administration of the drug be taken after 15 minutes to ensure the full distribution of the drug and to achieve a therapeutic plasma concentration.
*It is possible that other interfering substances may be encountered. These results are representative and your results may differ somewhat due to test-to-test variation. The degree of interference at concentrations other than those listed might not be predictable.
Heparin sensitivity was demonstrated using whole blood samples to which varying concentrations of heparin were added in vitro.
The following three graphs each indicate the response of a different donor with respect to heparin concentration:

Kaolin ACT - 4 Art: 715878-01P Rev. Date: 23-APR-18

Rev. Date: 23-APR-18 Art: 715878-01P Kaolin ACT - 5
The following two graphs indicate the response of the same three donors with respect to the ACT result on the Hemochron Kaolin FTK-ACT and the Medtronic HR-ACT.

Kaolin ACT - 6 Art: 715878-01P Rev. Date: 23-APR-18
Test LimitationsThe i-STAT KaolinACT test is to be used with fresh venous or arterial whole blood samples. The presence of exogenously added heparin, citrate, oxalate, or EDTA will interfere with test results. Poor technique in sample collection may also compromise the results. Samples drawn from insufficiently flushed catheters or from traumatic venipunctures may be contaminated with interfering substances. Samples should be collected into plastic syringes or tubes. Collection into glass may prematurely activate coagulation resulting in accelerated clotting times.
The analyzer should remain on a level surface with the display facing up during testing. If the analyzer is not level, the ACT result may be affected by more than 10 %. A level surface includes running the handheld in the downloader/recharger.
Hemodilution may affect test results.
Platelet dysfunction, hereditary or acquired, may affect the results of this test. This includes the administration of pharmacological compounds known as platelet inhibitors which affect platelet function. Factor deficiencies, dysprothrombinemias, other coagulopathies, and other pharmacological compounds may also affect the results of this test.
The i-STAT ACT test is not affected by fibrinogen concentration in the range from 100 - 500 mg/dL, or sample temperature from 15 - 37ºC.

Rev. Date: 23-APR-18 Art: 715878-01P Kaolin ACT - 7
Specimen Collection and PreparationThe i-STAT KaolinACT test can be performed using venous or arterial samples.
Venipunctures and Arterial Punctures• Collection technique resulting in good blood flow must be used. • The sample for testing should be drawn into a plastic collection device (either a plastic syringe or plastic evacuated tube). • The collection device cannot contain anticoagulants such as heparin, EDTA, oxalate, or citrate. • The collection device cannot contain clot activators or serum separators. • The sample should be immediately dispensed into the sample well of a cartridge. • If a second measurement is required, a fresh sample must be obtained.
Note: Some experts recommend drawing and discarding a sample of at least 1 mL prior to drawing sample for coagulation testing.4
Indwelling line• Fluid drip through the line must be discontinued. • If blood must be drawn from an indwelling line, possible heparin contamination and specimen dilution should be considered. The line should be flushed with 5 mL of saline and the first 5 mL of blood or six dead space volumes should be discarded. • Withdraw the sample for testing into a fresh plastic syringe. • The collection syringe cannot contain anticoagulants such as heparin, EDTA, oxalate, or citrate. • The sample should be immediately dispensed into the sample well of a cartridge. • If a second measurement is needed, draw a fresh sample.
Extracorporeal line• Flush the extracorporeal blood access line by withdrawing 5 mL of blood into a syringe and discard the syringe. • Withdraw the sample for testing into a fresh plastic syringe. • The collection syringe cannot contain anticoagulants such as heparin, EDTA, oxalate, or citrate. • The sample should be immediately dispensed into the sample well of a cartridge. • If a second measurement is needed, draw a fresh sample.
References
1. Hattersly, P. Activated coagulation time of whole blood. Journal of the American Medical Association 136:436-440, 1966.
2. CLSI. Method Comparison and Bias Estimation Using Patient Samples; Approved Guideline. CLSI document EP9-A (ISBN 1-56238-283-7). CLSI, 940 West Valley Road, Suite 1400, Wayne, Pennsylvania 19087, 1995.
3. P.J. Cornbleet and N. Gochman, “Incorrect Least-Squares Regression Coefficients in Method Comparison Analysis,” Clinical Chemistry 25:3, 432 (1979).
4. Corriveau, Donna: Fritsma, George (ed.): Hemostasis and Thrombosis in the Clinical Laboratory. Ed, J.B. Lippinncott Company, Philadelphia, 1988, pp 70-71.
i-STAT is a trademark of the Abbott Group of Companies in various jurisdictions. Celite is a trademark of Celite Corporation, Santa Barbara, CA, for its diatomaceous earth products. Hemochron is a trademark of International Technidyne Corporation, Edison, NJ.

Abbott Point of Care Inc.100 and 200 Abbott Park RoadAbbott Park, IL 60064 • USA Emergo Europe
Prinsessegracht 202514 AP The Hague
The Netherlands
©2018 Abbott Point of Care Inc. All rights reserved. Printed in USA.
Kaolin ACT - 8 Art: 715878-01P Rev. Date: 23-APR-18


![Patente [Patents]](https://static.fdokumen.com/doc/165x107/631d0295665120b3330c2251/patente-patents.jpg)