Past and future trajectories of forest loss in New Zealand
14
Past and future trajectories of forest loss in New Zealand Robert M. Ewers a,b,c, *, Andrew D. Kliskey d,1 , Susan Walker e , Daniel Rutledge f , Jon S. Harding a , Raphael K. Didham a, * a School of Biological Sciences, University of Canterbury, Private Bag 4800, Christchurch, New Zealand b Institute of Zoology, Zoological Societyof London, Regent’s Park, London NW1 4RY, UK c Department of Zoology, Cambridge University, Downing Street, Cambridge CB2 3EJ, UK d Department of Geography, University of Canterbury, Private Bag 4800, Christchurch, New Zealand e Landcare Research, Private Bag 1930, Dunedin, New Zealand f Landcare Research, Private Bag 3127, Hamilton, New Zealand ARTICLE INFO Article history: Received 23 March 2006 Received in revised form 12 June 2006 Accepted 20 June 2006 Available online 14 September 2006 Keywords: Deforestation Extinction threshold Habitat loss Landcover change Landscape threshold Restoration targets ABSTRACT Historically, New Zealand was dominated by forest below the alpine treeline, but about 1000 years of Polynesian and European colonisation has resulted in the destruction of nearly three-quarters of the indigenous forest cover. In this study, the historical patterns of defor- estation and forest fragmentation were assessed in relation to major topographical, climatic and anthropogenic variables that may drive forest loss. Deforestation has occurred almost equally on the two main islands, the North and South Islands, although the remaining indigenous forest is more fragmented in the North Island. Most deforestation has occurred in regions with a high-density of road networks, although gradients in climatic water avail- ability and soil fertility also had weak effects. Deforestation rates over the period 1997–2002 were very low (nationwide deforestation rate of just 0.01% p.a.), but varied widely among political districts. Expansion of plantation forestry was the single most important driver of recent deforestation. Only 10 of 73 political districts are afforded long-term protection of native forest cover (having more than 30% forest cover that is managed by the Department of Conservation). Forest cover in the majority of New Zealand landscapes has been reduced below the level of an expected ‘extinction threshold’ (circa 30% native habitat cover) in 55 political districts, and long-term trajectories predict that ongoing deforestation threatens to force another five districts below the critical threshold within the next 45 years. Except for the most heavily deforested regions, relatively modest annual rates of habitat restora- tion could bring forest cover back above the extinction threshold by the year 2050. Ó 2006 Elsevier Ltd. All rights reserved. 1. Introduction Three thousand years ago, forest covered virtually the entire land surface area of New Zealand below the alpine treeline (McGlone, 1989), but the arrival of the early Maori people about 1000 BP initiated widespread forest destruction. The Maori burned significant areas of lowland forest to encourage the growth of bracken fern (Pteridium aquilinum) that was used 0006-3207/$ - see front matter Ó 2006 Elsevier Ltd. All rights reserved. doi:10.1016/j.biocon.2006.06.018 * Corresponding authors: Tel.: +44 1223 336 675; fax: +44 1223 336 676 (R.M. Ewers), Tel.: +64 3 3642059; fax: +64 3 3642590 (R.K. Didham). E-mail addresses: [email protected] (R.M. Ewers), [email protected] (A.D. Kliskey), [email protected] (S. Walker), [email protected] (D. Rutledge), [email protected] (J.S. Harding), [email protected] (R.K. Didham). 1 Present address: Department of Biological Sciences, University of Alaska Anchorage, 3211 Providence Drive, Anchorage, AK 99508, United States. BIOLOGICAL CONSERVATION 133 (2006) 312 – 325 available at www.sciencedirect.com journal homepage: www.elsevier.com/locate/biocon
-
Upload
canterbury-nz -
Category
Documents
-
view
3 -
download
0
Transcript of Past and future trajectories of forest loss in New Zealand

B I O L O G I C A L C O N S E R V A T I O N 1 3 3 ( 2 0 0 6 ) 3 1 2 – 3 2 5
. sc iencedi rec t .com
ava i lab le at wwwjournal homepage: www.elsevier .com/ locate /b iocon
Past and future trajectories of forest loss in New Zealand
Robert M. Ewersa,b,c,*, Andrew D. Kliskeyd,1, Susan Walkere, Daniel Rutledgef,Jon S. Hardinga, Raphael K. Didhama,*aSchool of Biological Sciences, University of Canterbury, Private Bag 4800, Christchurch, New ZealandbInstitute of Zoology, Zoological Society of London, Regent’s Park, London NW1 4RY, UKcDepartment of Zoology, Cambridge University, Downing Street, Cambridge CB2 3EJ, UKdDepartment of Geography, University of Canterbury, Private Bag 4800, Christchurch, New ZealandeLandcare Research, Private Bag 1930, Dunedin, New ZealandfLandcare Research, Private Bag 3127, Hamilton, New Zealand
A R T I C L E I N F O
Article history:
Received 23 March 2006
Received in revised form
12 June 2006
Accepted 20 June 2006
Available online 14 September 2006
Keywords:
Deforestation
Extinction threshold
Habitat loss
Landcover change
Landscape threshold
Restoration targets
0006-3207/$ - see front matter � 2006 Elsevidoi:10.1016/j.biocon.2006.06.018
* Corresponding authors: Tel.: +44 1223 336 6E-mail addresses: [email protected]
Walker), [email protected] ((R.K. Didham).
1 Present address: Department of BiologicaUnited States.
A B S T R A C T
Historically, New Zealand was dominated by forest below the alpine treeline, but about
1000 years of Polynesian and European colonisation has resulted in the destruction of nearly
three-quarters of the indigenous forest cover. In this study, the historical patterns of defor-
estation and forest fragmentation were assessed in relation to major topographical, climatic
and anthropogenic variables that may drive forest loss. Deforestation has occurred almost
equally on the two main islands, the North and South Islands, although the remaining
indigenous forest is more fragmented in the North Island. Most deforestation has occurred
in regions with a high-density of road networks, although gradients in climatic water avail-
ability and soil fertility also had weak effects. Deforestation rates over the period 1997–2002
were very low (nationwide deforestation rate of just �0.01% p.a.), but varied widely among
political districts. Expansion of plantation forestry was the single most important driver of
recent deforestation. Only 10 of 73 political districts are afforded long-term protection of
native forest cover (having more than 30% forest cover that is managed by the Department
of Conservation). Forest cover in the majority of New Zealand landscapes has been reduced
below the level of an expected ‘extinction threshold’ (circa 30% native habitat cover) in 55
political districts, and long-term trajectories predict that ongoing deforestation threatens
to force another five districts below the critical threshold within the next 45 years. Except
for the most heavily deforested regions, relatively modest annual rates of habitat restora-
tion could bring forest cover back above the extinction threshold by the year 2050.
� 2006 Elsevier Ltd. All rights reserved.
1. Introduction
Three thousand years ago, forest covered virtually the entire
land surface area of New Zealand below the alpine treeline
er Ltd. All rights reserved
75; fax: +44 1223 336 676 ((R.M. Ewers), afadk@u
D. Rutledge), jon.harding@
l Sciences, University of
(McGlone, 1989), but the arrival of the early Maori people
about 1000 BP initiated widespread forest destruction. The
Maori burned significant areas of lowland forest to encourage
the growth of bracken fern (Pteridium aquilinum) that was used
.
R.M. Ewers), Tel.: +64 3 3642059; fax: +64 3 3642590 (R.K. Didham).aa.alaska.edu (A.D. Kliskey), [email protected] (S.canterbury.ac.nz (J.S. Harding), [email protected]
Alaska Anchorage, 3211 Providence Drive, Anchorage, AK 99508,
B I O L O G I C A L C O N S E R V A T I O N 1 3 3 ( 2 0 0 6 ) 3 1 2 – 3 2 5 313
as a food source, to make cross-country travel easier and also
as a strategy for hunting moa (Stevens et al., 1988). Maori
were, however, not the sole cause of deforestation during this
time, as climatic change, volcanism and naturally ignited fires
have all been implicated as factors driving Holocene vegeta-
tion change in New Zealand (Fleet, 1986; McGlone, 1989). As
a result of these combined factors, forest cover had been
reduced to an estimated 68% of the land surface by the time
European settlers arrived in the early 1800s (Salmon, 1975),
and about half of the lowland forests had been destroyed (Ste-
vens et al., 1988; McGlone, 1989).
The first European settlers in the early 19th Century ini-
tially cleared forest at a relatively slow rate (Arnold, 1994).
However, with a growing population, improvements to
roads and a new rail system, large-scale clearance of forest
on the plains began in earnest in the 1870s (Arnold, 1994).
Early New Zealand landholders were required by law to
improve their land, and many achieved this via the simple
act of burning the forest (Salmon, 1975). Primary forest
clearance continued into the mid-20th century, and after
the Second World War increasing amounts of forest in the
mountain ranges were converted to farmland (Stevens
et al., 1988) or fast-growing exotic plantations (Fleet, 1986).
The net result of Maori and European exploitation of New
Zealand’s indigenous forest was the destruction of approxi-
mately three-quarters of the forest, reducing it from 82% to
23% of the land surface area (Fleet, 1986; Leathwick et al.,
2003b, 2004).
1.1. Conservation implications of historical deforestation
In New Zealand, it is often assumed that clearing of primary
native forests is no longer of significant concern and that
the conservation issues associated with forest loss are no
longer relevant to threatened species management (Craig
et al., 2000; Clout, 2001). However, the historical effects of for-
est loss are frequently recognised as one of the greatest
threats to endangered species (Tilman et al., 1994; Sala
et al., 2000), and there is an emerging recognition of the role
that historical landuse change has in structuring present-
day species assemblages (Harding et al., 1998). Moreover,
theoretical developments on the nature of extinction debts
(Tilman et al., 1994), extinction thresholds (With and King,
1999), and synergistic interactions between forest loss and
invasive species (Didham et al., 2005a,b; Ewers and Didham,
2006), advise caution in adopting the overly simplistic inter-
pretation that historical deforestation is not relevant to pres-
ent-day conservation.
First, extinction debts create a long-term decline in spe-
cies richness for generations following the isolation of hab-
itat remnants, and illustrate the long-term conservation
implications of historical forest loss. The term extinction
debt was coined by Tilman et al. (1994) and describes a time
lag between the process of habitat loss and the eventual
collapse of populations. Extinction debts are paid through
time as communities in remnant habitats gradually relax
to a new equilibrium number of species (Ewers and Did-
ham, 2006). Community relaxation approximates an expo-
nential decay with a half-life from 25 to 100 years for
birds (Brooks et al., 1999), whereas for long-lived canopy
trees the debt may still be current more than a century fol-
lowing deforestation (Turner et al., 1996; Vellend et al.,
2006).
Second, much research has been focused on landscape
and extinction thresholds in fragmented landscapes (Ewers
and Didham, 2006). Landscape thresholds are the result of
‘‘rapid changes in the size and isolation of patches at critical
proportions of habitat in the landscape’’ (Andren, 1994), and
are predicted to occur at approximately 30% remaining habi-
tat cover (Andren, 1994). Below this value, there is often an
abrupt increase in the gap structure of landscapes, a marked
discontinuity in dispersal between isolated sub-populations
and a sharp decline in the probability of metapopulation per-
sistence (Hanski, 1998; Hanski and Ovaskainen, 2002), at
which point an extinction threshold has been passed. The
extinction threshold compounds the risks posed by forest
destruction, as even a small loss of habitat near the threshold
may result in a precipitous decline in the probability of spe-
cies persistence (With and King, 1999).
Third, many invasions do not propagate through undis-
turbed habitats and invasion risk increases disproportion-
ately following anthropogenic habitat loss (May and Norton,
1996; Lonsdale, 1999; Hobbs, 2001). A growing body of evi-
dence now shows that landscape context may be a critical
determinant of local-scale predation intensity exerted by
invasive species (Robinson et al., 1995; Hartley and Hunter,
1998; Ohlemuller et al., 2006). Furthermore, forest edges are
focal points for invasions of remnant habitat (Wiser et al.,
1998). In small fragments that consist completely of edge-
affected habitat, invasive plant species like Tradescantia
fluminensis (Commelinaceae) can influence the long-term via-
bility of forest remnants by dramatically reducing the species
richness, abundance and survival rates of native seedlings
(Standish et al., 2001), as well as reducing invertebrate diver-
sity and altering invertebrate community composition (Toft
et al., 2001).
1.2. Goals of this study
There has been no extensive analysis of patterns of defores-
tation in New Zealand, nor an investigation into the natural
and anthropogenic drivers of those patterns. The purpose of
this study was to determine historical patterns of deforesta-
tion and describe current patterns of forest fragmentation.
These variables were assessed in relation to major topo-
graphical and climatic features. Furthermore, because hu-
mans have been the dominant force behind the loss of
native forests worldwide, correlations between human popu-
lation density, recent changes in human population size and
proximity to highways (a spatial indicator of human activity)
were assessed as potential drivers of forest loss. Finally, the
amount of extant indigenous forest that is currently in-
cluded in the New Zealand protected areas network was
quantified, and predictive equations were used to model
the likely future of forest resources, with an emphasis on
forecasting when landscapes will pass below an expected
extinction threshold of 30% forest cover in the landscape.
For regions that have already fallen below the threshold, res-
toration goals to restore those landscapes by the year 2050
are presented.
314 B I O L O G I C A L C O N S E R V A T I O N 1 3 3 ( 2 0 0 6 ) 3 1 2 – 3 2 5
2. Methods
The New Zealand archipelago consists of several hundred is-
lands spread across 2.2 million km2 of the southern Pacific
Ocean. For the purposes of this study, forest loss estimates
were restricted to the two main islands, the North and South
Islands, for which reliable data were available. The two
islands combined represent 97% of the total land area of
the archipelago and support over 99% of the total human
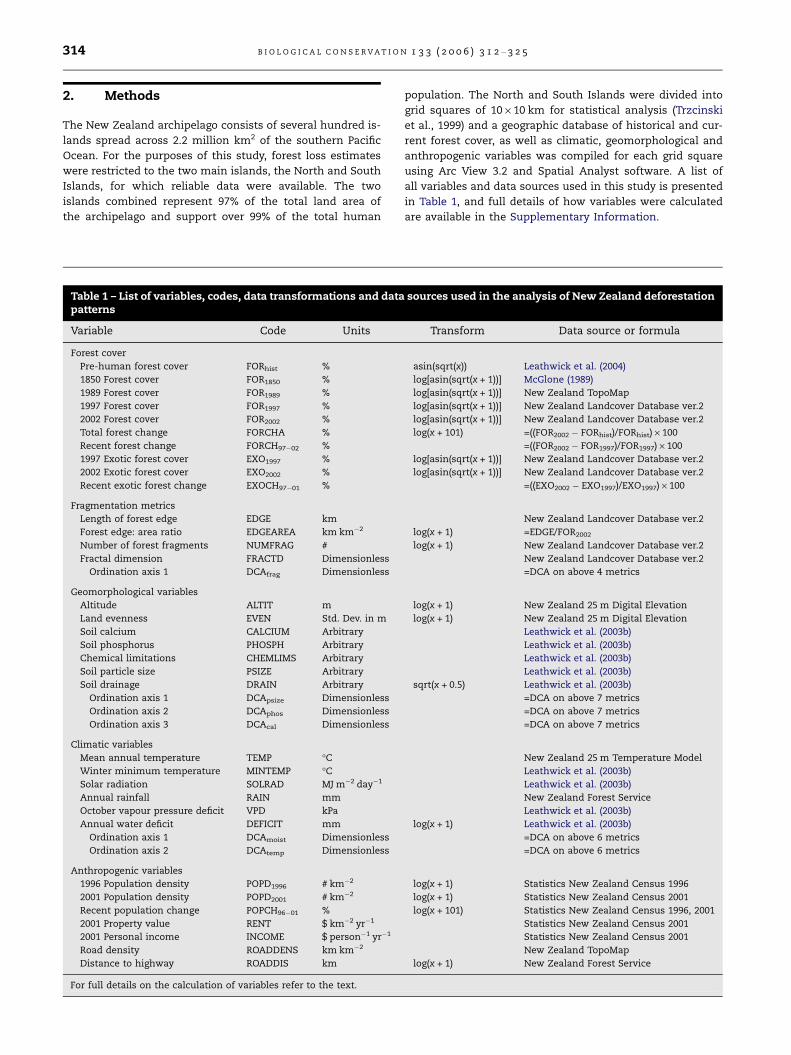
Table 1 – List of variables, codes, data transformations and datapatterns
Variable Code Units
Forest cover
Pre-human forest cover FORhist %
1850 Forest cover FOR1850 %
1989 Forest cover FOR1989 %
1997 Forest cover FOR1997 %
2002 Forest cover FOR2002 %
Total forest change FORCHA %
Recent forest change FORCH97�02 %
1997 Exotic forest cover EXO1997 %
2002 Exotic forest cover EXO2002 %
Recent exotic forest change EXOCH97�01 %
Fragmentation metrics
Length of forest edge EDGE km
Forest edge: area ratio EDGEAREA km km�2
Number of forest fragments NUMFRAG #
Fractal dimension FRACTD Dimensionless
Ordination axis 1 DCAfrag Dimensionless
Geomorphological variables
Altitude ALTIT m
Land evenness EVEN Std. Dev. in m
Soil calcium CALCIUM Arbitrary
Soil phosphorus PHOSPH Arbitrary
Chemical limitations CHEMLIMS Arbitrary
Soil particle size PSIZE Arbitrary
Soil drainage DRAIN Arbitrary
Ordination axis 1 DCApsize Dimensionless
Ordination axis 2 DCAphos Dimensionless
Ordination axis 3 DCAcal Dimensionless
Climatic variables
Mean annual temperature TEMP �CWinter minimum temperature MINTEMP �CSolar radiation SOLRAD MJ m�2 day�1
Annual rainfall RAIN mm
October vapour pressure deficit VPD kPa
Annual water deficit DEFICIT mm
Ordination axis 1 DCAmoist Dimensionless
Ordination axis 2 DCAtemp Dimensionless
Anthropogenic variables
1996 Population density POPD1996 # km�2
2001 Population density POPD2001 # km�2
Recent population change POPCH96�01 %
2001 Property value RENT $ km�2 yr�1
2001 Personal income INCOME $ person�1 yr�1
Road density ROADDENS km km�2
Distance to highway ROADDIS km
For full details on the calculation of variables refer to the text.
population. The North and South Islands were divided into
grid squares of 10 · 10 km for statistical analysis (Trzcinski
et al., 1999) and a geographic database of historical and cur-
rent forest cover, as well as climatic, geomorphological and
anthropogenic variables was compiled for each grid square
using Arc View 3.2 and Spatial Analyst software. A list of
all variables and data sources used in this study is presented
in Table 1, and full details of how variables were calculated
are available in the Supplementary Information.
sources used in the analysis of New Zealand deforestation
Transform Data source or formula
asin(sqrt(x)) Leathwick et al. (2004)
log[asin(sqrt(x + 1))] McGlone (1989)
log[asin(sqrt(x + 1))] New Zealand TopoMap
log[asin(sqrt(x + 1))] New Zealand Landcover Database ver.2
log[asin(sqrt(x + 1))] New Zealand Landcover Database ver.2
log(x + 101) =((FOR2002 � FORhist)/FORhist) · 100
=((FOR2002 � FOR1997)/FOR1997) · 100
log[asin(sqrt(x + 1))] New Zealand Landcover Database ver.2
log[asin(sqrt(x + 1))] New Zealand Landcover Database ver.2
=((EXO2002 � EXO1997)/EXO1997) · 100
New Zealand Landcover Database ver.2
log(x + 1) =EDGE/FOR2002
log(x + 1) New Zealand Landcover Database ver.2
New Zealand Landcover Database ver.2
=DCA on above 4 metrics
log(x + 1) New Zealand 25 m Digital Elevation
log(x + 1) New Zealand 25 m Digital Elevation
Leathwick et al. (2003b)
Leathwick et al. (2003b)
Leathwick et al. (2003b)
Leathwick et al. (2003b)
sqrt(x + 0.5) Leathwick et al. (2003b)
=DCA on above 7 metrics
=DCA on above 7 metrics
=DCA on above 7 metrics
New Zealand 25 m Temperature Model
Leathwick et al. (2003b)
Leathwick et al. (2003b)
New Zealand Forest Service
Leathwick et al. (2003b)
log(x + 1) Leathwick et al. (2003b)
=DCA on above 6 metrics
=DCA on above 6 metrics
log(x + 1) Statistics New Zealand Census 1996
log(x + 1) Statistics New Zealand Census 2001
log(x + 101) Statistics New Zealand Census 1996, 2001
Statistics New Zealand Census 2001
Statistics New Zealand Census 2001
New Zealand TopoMap
log(x + 1) New Zealand Forest Service
B I O L O G I C A L C O N S E R V A T I O N 1 3 3 ( 2 0 0 6 ) 3 1 2 – 3 2 5 315
2.1. Forest cover and forest fragmentation
Data on forest cover were obtained for five time periods; pre-
human (about 1000 years before present), 1850, 1989, 1997 and
2002 (Supplementary Methods). Three metrics were calcu-
lated for each grid square to reflect patterns of forest frag-
mentation in 2002 (Table 1); the number of fragments, the
edge:area ratio of indigenous forest, and the fractal dimen-
sion of the landscape. Data on indigenous scrub cover were
also obtained for 1997 and 2002, as scrub represents an impor-
tant stage in the process of forest regeneration and may be
considered immature forest (Supplementary Methods).
2.2. Climatic and geomorphological variables
Data for six climatic and five geomorphological variables were
obtained to represent abiotic features of the landscape that
may influence patterns of forest cover (Supplementary Meth-
ods). These variables fell into four categories: (1) energy avail-
ability; (2) water availability; (3) landforms; and (4) suitability
of the land for agriculture.
2.3. Anthropogenic drivers of deforestation
Total human population density (rural and urban population
combined) was obtained from the Statistics New Zealand
national census’ in 1996 and 2001, as were data on land values
and personal income levels (see Supplementary Methods).
Road density and the distance from each quadrat to the near-
est main highway were calculated.
Current and future deforestation are limited by the
amount of forest under conservation protection, so maps of
protected forest from the Department of Conservation
National Conservation Units dataset (September 2003) were
obtained. There were 86,436 km2 of land in New Zealand
represented in the National Conservation Units dataset,
of which 84,620 km2 (32% of total land area) is managed by
the Department of Conservation (Supplementary Methods).
2.4. Statistical analysis
The analysis of forest change was conducted in four parts:
(1) a regional analysis of current forest cover, (2) a grid
square analysis of cumulative deforestation patterns (pre-
human to 2002), (3) a grid square analysis of forest fragmen-
tation, and (4) regional predictions of long-term trajectories
in deforestation rates. Where necessary, variables were
transformed to meet assumptions of normality (Table 1).
Grid squares with less than 80 km2 land area (i.e. grid
squares intersecting lakes and coastlines) were excluded
from the analysis (Laurance et al., 2002). To account for
problems of spatial autocorrelation between grid squares,
the linear, quadratic and cubic combinations of longitude
and latitude of the centre of each 10 · 10 km grid square
were included as co-variates in all analyses (Legendre,
1993; Davies et al., 2003).
2.4.1. Current status of forest coverSummary tables of forest metrics were compiled for the 73
political districts of New Zealand. For each district, the
amount of historical deforestation and the amount and
degree of fragmentation of the current forest cover were
assessed. The proportion of each district that was classified
as plantation forest and indigenous scrub (analogous to
regenerating forest) was also summarized. Annual deforesta-
tion rates were calculated over the period 1997–2002 using a
compounding interest formula:
r ¼ ½ðFOR2002=FOR1997Þ1=t � 1� � 100
where r is the rate of change in forest cover (% yr�1) and t is
the time in years over which the rate of change is calculated
(t = 5).
2.4.2. Predictors of forest lossForest loss was only calculated where forest was historically
present, thus grid square analyses were restricted to grid
squares with more than 80% of the total grid square area
in forest before the arrival of humans. Preliminary correla-
tion analyses showed that many of the climatic and land-
form variables were intercorrelated, so separate detrended
correspondence analyses (DCA) were used to identify statis-
tically independent gradients in the two groups of variables
using CANOCO version 4.02 software (ter Braak, 1995). First,
the six climatic variables were reduced to two axes explain-
ing 98% of the variation in the climatic data set (Supplemen-
tary Table S1 a). The first axis reflected a moisture gradient
(DCAmoist), and the second a temperature gradient (DCAtemp),
as indicated by the high correlations between these variables
and site ordering along axes 1 and 2 respectively (Supple-
mentary Table S1 a). Second, the seven geomorphological
variables were reduced to three axes that explained 94%
of the landform variation (Supplementary Table S1 b). DCA
Axis 1 was most strongly correlated with soil particle size
(DCApsize), Axis 2 with soil phosphorus levels (DCAphos) and
Axis 3 with soil calcium (DCAcal). The identified gradients
(2 · climatic and 3 · geomorphological) were used in subse-
quent regression analyses.
Multiple regression in R software (R Development Core
Team, 2004) was used to investigate the effect of these five
axes plus the five anthropogenic variables on historical forest
change (FORCHA). Multicollinearity amongst the predictor
variables was assessed with correlation analysis. Because sig-
nificance tests are sensitive to the number of replicates, and
this analysis had a large sample size (n = 1984), parameter sig-
nificance was tested with a randomisation test based on
power analysis (Supplementary Methods).
ANOVA was employed to assess the drivers of recent forest
loss (FORCH97�02). Prior to analysis, grid squares with no for-
est cover in 1997 were excluded from the dataset. The data
were divided into two sets: those grid squares in which defor-
estation occurred (N = 129) and those where there was no
change in forest cover (N = 1665). ANOVA was used to test
for differences in the values of 13 predictor variables between
the two groups. As with the analysis of historical forest cover,
parameter significance was tested with a randomisation test
(Supplementary Methods).
2.4.3. Analysis of forest fragmentationThe three fragmentation metrics were strongly intercorre-
lated, so a DCA was used to identify statistically independent
316 B I O L O G I C A L C O N S E R V A T I O N 1 3 3 ( 2 0 0 6 ) 3 1 2 – 3 2 5
gradients in the metrics (ter Braak, 1995). Furthermore, frag-
mentation metrics are commonly tightly correlated with
forest cover in the landscape (Trzcinski et al., 1999; Fahrig,
2003). Consequently, FOR2002 was factored in as a covariable
in the DCA to obtain a measure of current fragmentation pat-
terns that was independent of forest cover (Trzcinski et al.,
1999). Prior to analysis, grid squares with no forest cover in
2002 were excluded from the dataset. The resulting partial
DCA reduced the three fragmentation metrics to two axes
that explained nearly all of the variation in the data (Supple-
mentary Table S2). The first axis (DCAfrag1) was used as a sur-
rogate index of forest fragmentation as this axis alone
accounted for 99% of the variation in the fragmentation met-
rics. The signs of the DCAfrag1 values were reversed to give a
more intuitive index, with the gradient from negative to posi-
tive values reflecting a gradient from low to high fragmenta-
tion. A multiple regression approach (as described above for
the analysis of historical forest cover, utilising the randomisa-
tion test detailed in the Supplementary Methods) was
employed to determine the significant drivers of forest
fragmentation.
2.4.4. Long-term trajectories of forest changeLong-term patterns of forest change in political districts were
assessed by fitting an exponential curve through four points,
FOR18750, FOR1989, FOR1997 and FOR2002. An exponential curve
was chosen on the a priori assumption that deforestation
rates were greatest soon after colonisation and have
decreased through time, and was invariably a good approxi-
mation to the empirical data. Because the likelihood of an
extinction threshold occurring increases greatly when forest
cover decreases below about 30% of a given landscape
(Andren, 1994), the exponential curves were used to estimate
the year in which forest cover is predicted to decline below
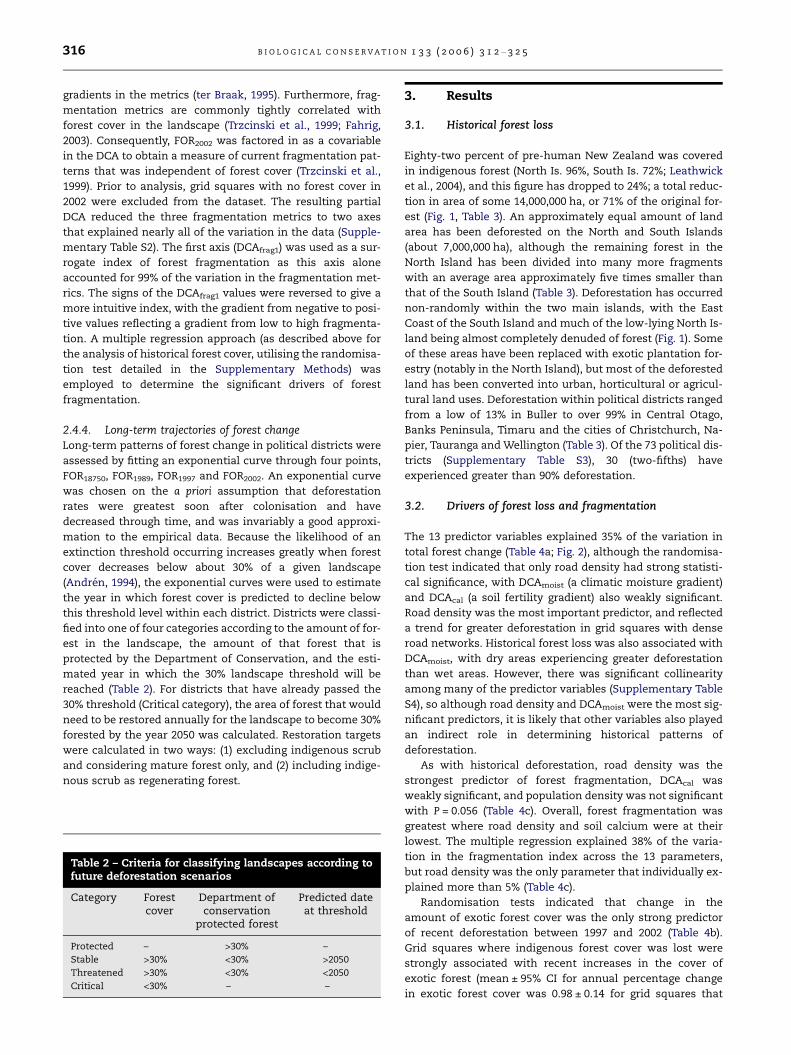
this threshold level within each district. Districts were classi-
fied into one of four categories according to the amount of for-
est in the landscape, the amount of that forest that is
protected by the Department of Conservation, and the esti-
mated year in which the 30% landscape threshold will be
reached (Table 2). For districts that have already passed the
30% threshold (Critical category), the area of forest that would
need to be restored annually for the landscape to become 30%
forested by the year 2050 was calculated. Restoration targets
were calculated in two ways: (1) excluding indigenous scrub
and considering mature forest only, and (2) including indige-
nous scrub as regenerating forest.
Table 2 – Criteria for classifying landscapes according tofuture deforestation scenarios
Category Forestcover
Department ofconservation
protected forest
Predicted dateat threshold
Protected – >30% –
Stable >30% <30% >2050
Threatened >30% <30% <2050
Critical <30% – –
3. Results
3.1. Historical forest loss
Eighty-two percent of pre-human New Zealand was covered
in indigenous forest (North Is. 96%, South Is. 72%; Leathwick
et al., 2004), and this figure has dropped to 24%; a total reduc-
tion in area of some 14,000,000 ha, or 71% of the original for-
est (Fig. 1, Table 3). An approximately equal amount of land
area has been deforested on the North and South Islands
(about 7,000,000 ha), although the remaining forest in the
North Island has been divided into many more fragments
with an average area approximately five times smaller than
that of the South Island (Table 3). Deforestation has occurred
non-randomly within the two main islands, with the East
Coast of the South Island and much of the low-lying North Is-
land being almost completely denuded of forest (Fig. 1). Some
of these areas have been replaced with exotic plantation for-
estry (notably in the North Island), but most of the deforested
land has been converted into urban, horticultural or agricul-
tural land uses. Deforestation within political districts ranged
from a low of 13% in Buller to over 99% in Central Otago,
Banks Peninsula, Timaru and the cities of Christchurch, Na-
pier, Tauranga and Wellington (Table 3). Of the 73 political dis-
tricts (Supplementary Table S3), 30 (two-fifths) have
experienced greater than 90% deforestation.
3.2. Drivers of forest loss and fragmentation
The 13 predictor variables explained 35% of the variation in
total forest change (Table 4a; Fig. 2), although the randomisa-
tion test indicated that only road density had strong statisti-
cal significance, with DCAmoist (a climatic moisture gradient)
and DCAcal (a soil fertility gradient) also weakly significant.
Road density was the most important predictor, and reflected
a trend for greater deforestation in grid squares with dense
road networks. Historical forest loss was also associated with
DCAmoist, with dry areas experiencing greater deforestation
than wet areas. However, there was significant collinearity
among many of the predictor variables (Supplementary Table
S4), so although road density and DCAmoist were the most sig-
nificant predictors, it is likely that other variables also played
an indirect role in determining historical patterns of
deforestation.
As with historical deforestation, road density was the
strongest predictor of forest fragmentation, DCAcal was
weakly significant, and population density was not significant
with P = 0.056 (Table 4c). Overall, forest fragmentation was
greatest where road density and soil calcium were at their
lowest. The multiple regression explained 38% of the varia-
tion in the fragmentation index across the 13 parameters,
but road density was the only parameter that individually ex-
plained more than 5% (Table 4c).
Randomisation tests indicated that change in the
amount of exotic forest cover was the only strong predictor
of recent deforestation between 1997 and 2002 (Table 4b).
Grid squares where indigenous forest cover was lost were
strongly associated with recent increases in the cover of
exotic forest (mean ± 95% CI for annual percentage change
in exotic forest cover was 0.98 ± 0.14 for grid squares that
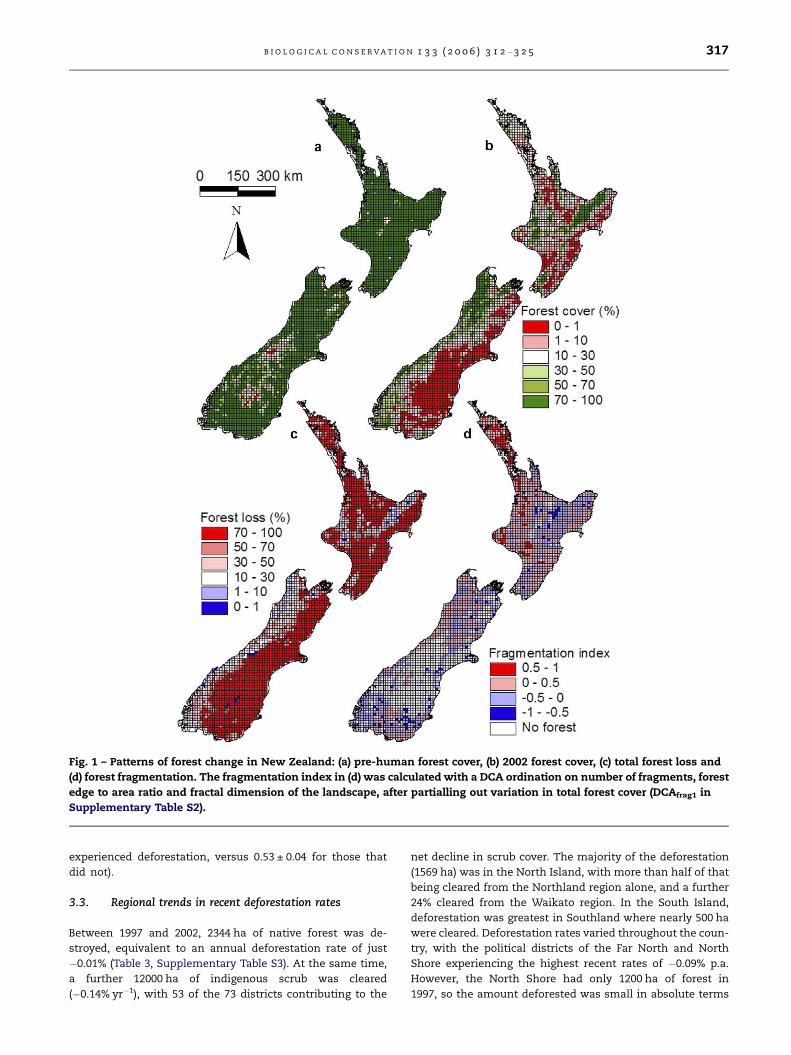
Fig. 1 – Patterns of forest change in New Zealand: (a) pre-human forest cover, (b) 2002 forest cover, (c) total forest loss and
(d) forest fragmentation. The fragmentation index in (d) was calculated with a DCA ordination on number of fragments, forest
edge to area ratio and fractal dimension of the landscape, after partialling out variation in total forest cover (DCAfrag1 in
Supplementary Table S2).
B I O L O G I C A L C O N S E R V A T I O N 1 3 3 ( 2 0 0 6 ) 3 1 2 – 3 2 5 317
experienced deforestation, versus 0.53 ± 0.04 for those that
did not).
3.3. Regional trends in recent deforestation rates
Between 1997 and 2002, 2344 ha of native forest was de-
stroyed, equivalent to an annual deforestation rate of just
�0.01% (Table 3, Supplementary Table S3). At the same time,
a further 12000 ha of indigenous scrub was cleared
(�0.14% yr�1), with 53 of the 73 districts contributing to the
net decline in scrub cover. The majority of the deforestation
(1569 ha) was in the North Island, with more than half of that
being cleared from the Northland region alone, and a further
24% cleared from the Waikato region. In the South Island,
deforestation was greatest in Southland where nearly 500 ha
were cleared. Deforestation rates varied throughout the coun-
try, with the political districts of the Far North and North
Shore experiencing the highest recent rates of �0.09% p.a.
However, the North Shore had only 1200 ha of forest in
1997, so the amount deforested was small in absolute terms
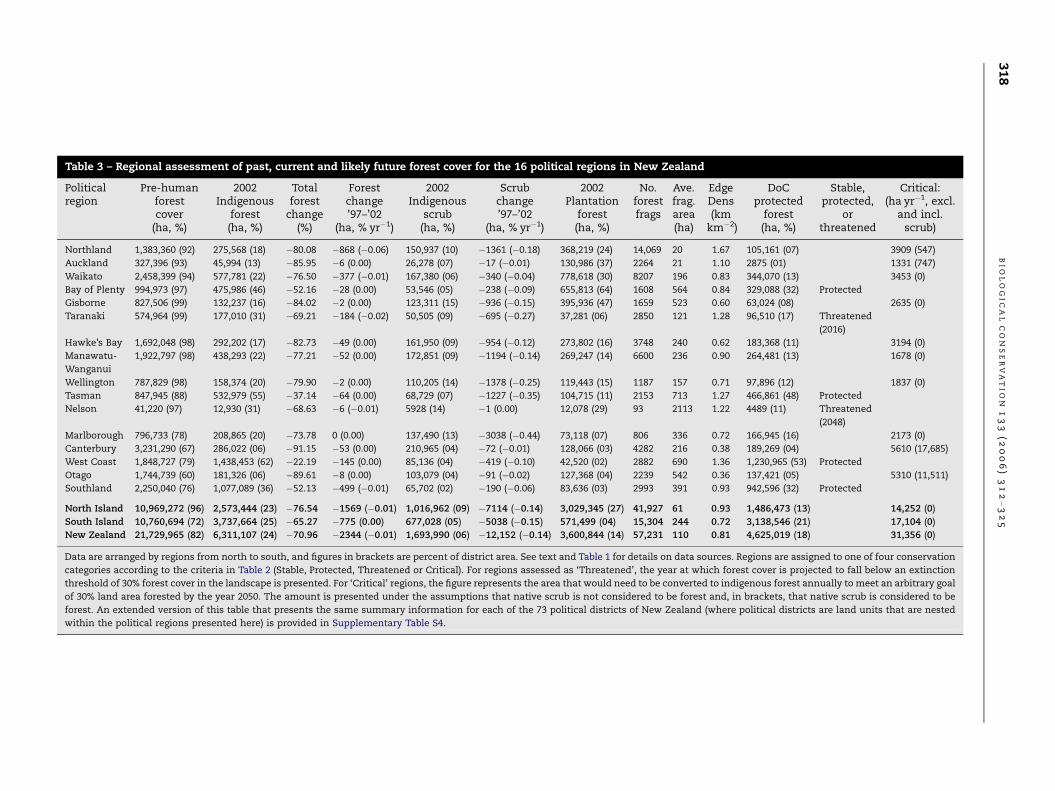
Table 3 – Regional assessment of past, current and likely future forest cover for the 16 political regions in New Zealand
Politicalregion
Pre-humanforestcover
(ha, %)
2002Indigenous
forest(ha, %)
Totalforest
change(%)
Forestchange’97–’02
(ha, % yr�1)
2002Indigenous
scrub(ha, %)
Scrubchange’97–’02
(ha, % yr�1)
2002Plantation
forest(ha, %)
No.forestfrags
Ave.frag.area(ha)
EdgeDens(km
km�2)
DoCprotected
forest(ha, %)
Stable,protected,
orthreatened
Critical:(ha yr�1, excl.
and incl.scrub)
Northland 1,383,360 (92) 275,568 (18) �80.08 �868 (�0.06) 150,937 (10) �1361 (�0.18) 368,219 (24) 14,069 20 1.67 105,161 (07) 3909 (547)
Auckland 327,396 (93) 45,994 (13) �85.95 �6 (0.00) 26,278 (07) �17 (�0.01) 130,986 (37) 2264 21 1.10 2875 (01) 1331 (747)
Waikato 2,458,399 (94) 577,781 (22) �76.50 �377 (�0.01) 167,380 (06) �340 (�0.04) 778,618 (30) 8207 196 0.83 344,070 (13) 3453 (0)
Bay of Plenty 994,973 (97) 475,986 (46) �52.16 �28 (0.00) 53,546 (05) �238 (�0.09) 655,813 (64) 1608 564 0.84 329,088 (32) Protected
Gisborne 827,506 (99) 132,237 (16) �84.02 �2 (0.00) 123,311 (15) �936 (�0.15) 395,936 (47) 1659 523 0.60 63,024 (08) 2635 (0)
Taranaki 574,964 (99) 177,010 (31) �69.21 �184 (�0.02) 50,505 (09) �695 (�0.27) 37,281 (06) 2850 121 1.28 96,510 (17) Threatened
(2016)
Hawke’s Bay 1,692,048 (98) 292,202 (17) �82.73 �49 (0.00) 161,950 (09) �954 (�0.12) 273,802 (16) 3748 240 0.62 183,368 (11) 3194 (0)
Manawatu-
Wanganui
1,922,797 (98) 438,293 (22) �77.21 �52 (0.00) 172,851 (09) �1194 (�0.14) 269,247 (14) 6600 236 0.90 264,481 (13) 1678 (0)
Wellington 787,829 (98) 158,374 (20) �79.90 �2 (0.00) 110,205 (14) �1378 (�0.25) 119,443 (15) 1187 157 0.71 97,896 (12) 1837 (0)
Tasman 847,945 (88) 532,979 (55) �37.14 �64 (0.00) 68,729 (07) �1227 (�0.35) 104,715 (11) 2153 713 1.27 466,861 (48) Protected
Nelson 41,220 (97) 12,930 (31) �68.63 �6 (�0.01) 5928 (14) �1 (0.00) 12,078 (29) 93 2113 1.22 4489 (11) Threatened
(2048)
Marlborough 796,733 (78) 208,865 (20) �73.78 0 (0.00) 137,490 (13) �3038 (�0.44) 73,118 (07) 806 336 0.72 166,945 (16) 2173 (0)
Canterbury 3,231,290 (67) 286,022 (06) �91.15 �53 (0.00) 210,965 (04) �72 (�0.01) 128,066 (03) 4282 216 0.38 189,269 (04) 5610 (17,685)
West Coast 1,848,727 (79) 1,438,453 (62) �22.19 �145 (0.00) 85,136 (04) �419 (�0.10) 42,520 (02) 2882 690 1.36 1,230,965 (53) Protected
Otago 1,744,739 (60) 181,326 (06) �89.61 �8 (0.00) 103,079 (04) �91 (�0.02) 127,368 (04) 2239 542 0.36 137,421 (05) 5310 (11,511)
Southland 2,250,040 (76) 1,077,089 (36) �52.13 �499 (�0.01) 65,702 (02) �190 (�0.06) 83,636 (03) 2993 391 0.93 942,596 (32) Protected
North Island 10,969,272 (96) 2,573,444 (23) �76.54 �1569 (�0.01) 1,016,962 (09) �7114 (�0.14) 3,029,345 (27) 41,927 61 0.93 1,486,473 (13) 14,252 (0)
South Island 10,760,694 (72) 3,737,664 (25) �65.27 �775 (0.00) 677,028 (05) �5038 (�0.15) 571,499 (04) 15,304 244 0.72 3,138,546 (21) 17,104 (0)
New Zealand 21,729,965 (82) 6,311,107 (24) �70.96 �2344 (�0.01) 1,693,990 (06) �12,152 (�0.14) 3,600,844 (14) 57,231 110 0.81 4,625,019 (18) 31,356 (0)
Data are arranged by regions from north to south, and figures in brackets are percent of district area. See text and Table 1 for details on data sources. Regions are assigned to one of four conservation
categories according to the criteria in Table 2 (Stable, Protected, Threatened or Critical). For regions assessed as ‘Threatened’, the year at which forest cover is projected to fall below an extinction
threshold of 30% forest cover in the landscape is presented. For ‘Critical’ regions, the figure represents the area that would need to be converted to indigenous forest annually to meet an arbitrary goal
of 30% land area forested by the year 2050. The amount is presented under the assumptions that native scrub is not considered to be forest and, in brackets, that native scrub is considered to be
forest. An extended version of this table that presents the same summary information for each of the 73 political districts of New Zealand (where political districts are land units that are nested
within the political regions presented here) is provided in Supplementary Table S4.
31
8B
IO
LO
GI
CA
LC
ON
SE
RV
AT
IO
N1
33
(2
00
6)
31
2–
32
5
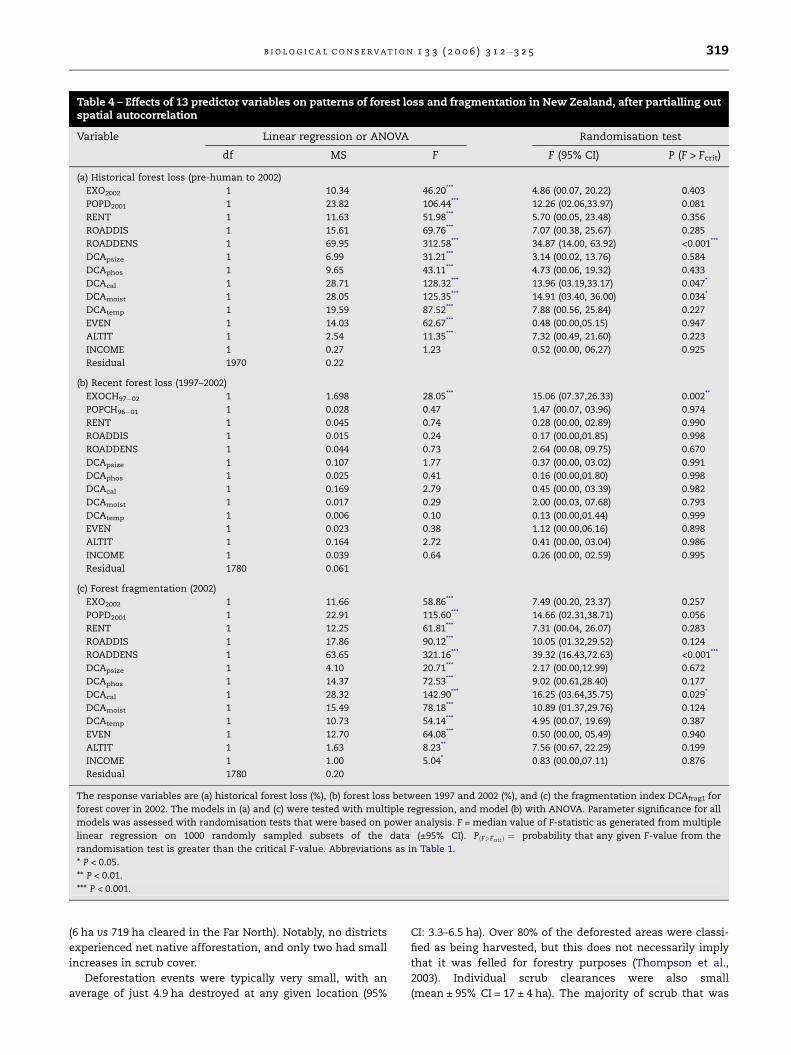
Table 4 – Effects of 13 predictor variables on patterns of forest loss and fragmentation in New Zealand, after partialling outspatial autocorrelation
Variable Linear regression or ANOVA Randomisation test
df MS F F (95% CI) P (F > Fcrit)
(a) Historical forest loss (pre-human to 2002)
EXO2002 1 10.34 46.20*** 4.86 (00.07, 20.22) 0.403
POPD2001 1 23.82 106.44*** 12.26 (02.06,33.97) 0.081
RENT 1 11.63 51.98*** 5.70 (00.05, 23.48) 0.356
ROADDIS 1 15.61 69.76*** 7.07 (00.38, 25.67) 0.285
ROADDENS 1 69.95 312.58*** 34.87 (14.00, 63.92) <0.001***
DCApsize 1 6.99 31.21*** 3.14 (00.02, 13.76) 0.584
DCAphos 1 9.65 43.11*** 4.73 (00.06, 19.32) 0.433
DCAcal 1 28.71 128.32*** 13.96 (03.19,33.17) 0.047*
DCAmoist 1 28.05 125.35*** 14.91 (03.40, 36.00) 0.034*
DCAtemp 1 19.59 87.52*** 7.88 (00.56, 25.84) 0.227
EVEN 1 14.03 62.67*** 0.48 (00.00,05.15) 0.947
ALTIT 1 2.54 11.35*** 7.32 (00.49, 21.60) 0.223
INCOME 1 0.27 1.23 0.52 (00.00, 06.27) 0.925
Residual 1970 0.22
(b) Recent forest loss (1997–2002)
EXOCH97�02 1 1.698 28.05*** 15.06 (07.37,26.33) 0.002**
POPCH96�01 1 0.028 0.47 1.47 (00.07, 03.96) 0.974
RENT 1 0.045 0.74 0.28 (00.00, 02.89) 0.990
ROADDIS 1 0.015 0.24 0.17 (00.00,01.85) 0.998
ROADDENS 1 0.044 0.73 2.64 (00.08, 09.75) 0.670
DCApsize 1 0.107 1.77 0.37 (00.00, 03.02) 0.991
DCAphos 1 0.025 0.41 0.16 (00.00,01.80) 0.998
DCAcal 1 0.169 2.79 0.45 (00.00, 03.39) 0.982
DCAmoist 1 0.017 0.29 2.00 (00.03, 07.68) 0.793
DCAtemp 1 0.006 0.10 0.13 (00.00,01.44) 0.999
EVEN 1 0.023 0.38 1.12 (00.00,06.16) 0.898
ALTIT 1 0.164 2.72 0.41 (00.00, 03.04) 0.986
INCOME 1 0.039 0.64 0.26 (00.00, 02.59) 0.995
Residual 1780 0.061
(c) Forest fragmentation (2002)
EXO2002 1 11.66 58.86*** 7.49 (00.20, 23.37) 0.257
POPD2001 1 22.91 115.60*** 14.66 (02.31,38.71) 0.056
RENT 1 12.25 61.81*** 7.31 (00.04, 26.07) 0.283
ROADDIS 1 17.86 90.12*** 10.05 (01.32,29.52) 0.124
ROADDENS 1 63.65 321.16*** 39.32 (16.43,72.63) <0.001***
DCApsize 1 4.10 20.71*** 2.17 (00.00,12.99) 0.672
DCAphos 1 14.37 72.53*** 9.02 (00.61,28.40) 0.177
DCAcal 1 28.32 142.90*** 16.25 (03.64,35.75) 0.029*
DCAmoist 1 15.49 78.18*** 10.89 (01.37,29.76) 0.124
DCAtemp 1 10.73 54.14*** 4.95 (00.07, 19.69) 0.387
EVEN 1 12.70 64.08*** 0.50 (00.00, 05.49) 0.940
ALTIT 1 1.63 8.23** 7.56 (00.67, 22.29) 0.199
INCOME 1 1.00 5.04* 0.83 (00.00,07.11) 0.876
Residual 1780 0.20
The response variables are (a) historical forest loss (%), (b) forest loss between 1997 and 2002 (%), and (c) the fragmentation index DCAfrag1 for
forest cover in 2002. The models in (a) and (c) were tested with multiple regression, and model (b) with ANOVA. Parameter significance for all
models was assessed with randomisation tests that were based on power analysis. F = median value of F-statistic as generated from multiple
linear regression on 1000 randomly sampled subsets of the data (±95% CI). PðF>FcritÞ ¼ probability that any given F-value from the
randomisation test is greater than the critical F-value. Abbreviations as in Table 1.
* P < 0.05.
** P < 0.01.
*** P < 0.001.
B I O L O G I C A L C O N S E R V A T I O N 1 3 3 ( 2 0 0 6 ) 3 1 2 – 3 2 5 319
(6 ha vs 719 ha cleared in the Far North). Notably, no districts
experienced net native afforestation, and only two had small
increases in scrub cover.
Deforestation events were typically very small, with an
average of just 4.9 ha destroyed at any given location (95%
CI: 3.3–6.5 ha). Over 80% of the deforested areas were classi-
fied as being harvested, but this does not necessarily imply
that it was felled for forestry purposes (Thompson et al.,
2003). Individual scrub clearances were also small
(mean ± 95% CI = 17 ± 4 ha). The majority of scrub that was

His
toric
al fo
rest
loss
(%
)
a
0.000 0.004 0.008 0.012 0.016
Road density (km.km-2)
-100
-80
-60
-40
-20
0
-0.2 0.0 0.2 0.4 0.6
DCAmoist
-100
-80
-60
-40
-20
0
-0.2 0.0 0.2 0.4
DCAcal
-100
-80
-60
-40
-20
0
0.0 0.6 1.5 3.0
Population density (#.km-2)
-100
-80
-60
-40
-20
0
r2 = 0.281
r 2 = 0.036r2 = NA
r2 = 0.498
a b
dc
Fig. 2 – Predictors of total forest change in New Zealand: (a) road density, (b) climatic moisture, (c) soil calcium, and (d) human
population density. Negative forest change values indicate deforestation, positive values indicate afforestation. DCAmoist
reflects a gradient from wet (negative values) to dry climates, and DCAcal a gradient from low to high soil calcium. Formulae
for the fitted lines are (a) Y = �160.12 � 34.05 · log10(X); (b) Y = �120.78 � 93.94 · log10(X + 0.3); (c) distance-weighted
least-squares; and (d) Y = �112.29 � 15.91 · log10(X).
320 B I O L O G I C A L C O N S E R V A T I O N 1 3 3 ( 2 0 0 6 ) 3 1 2 – 3 2 5
cleared was converted to plantation forestry (69%), and these
clearings tended to be much larger than the overall mean
clearance size (35 ± 16 ha). A further 27% of cleared scrub
was converted to high or low producing grassland (927 and
2541 ha, respectively).
By 2002, 55 of the 73 political districts had already passed
below the extinction threshold of 30% forest cover in the
landscape (Table 3, Supplementary Table S3). Of the remain-
ing 18 that have retained significant forest resources, 10 have
conservation protection in place for more than 30% of the
landscape (Supplementary Table S3), and predictive models
indicated that three are stable (Waitakere City, Lower Hurt
City and Upper Hurt City) and five are threatened (Waitomo,
Western Bay of Plenty, New Plymouth, Ruapehu and Nelson).
Several districts recognised as in imminent risk of declining
below the extinction threshold had experienced negligible
forest change in the last 5 years, but are within 3% of the
threshold value, justifying their classification as threatened
landscapes. Four of the five threatened districts are in the
North Island. The exception, Nelson, was far less fragmented
than the North Island districts, with an average fragment area
more than five times greater than any of the other threatened
landscapes (Supplementary Table S3).
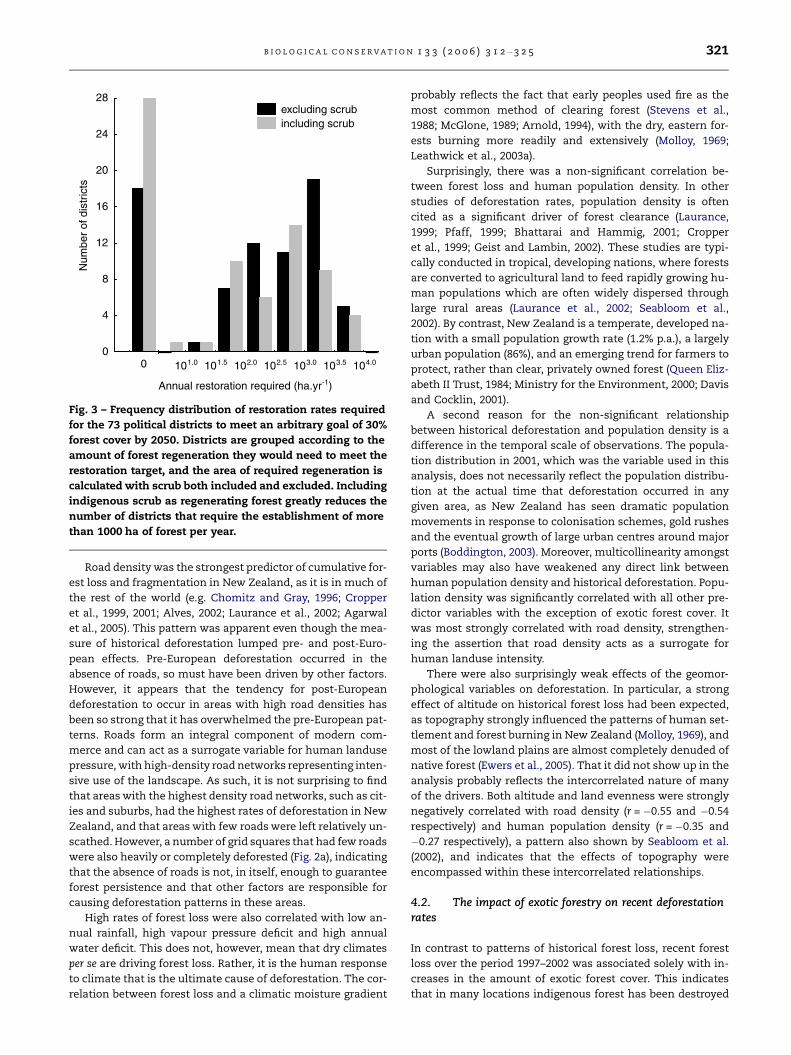
Annual restoration rates required for districts to meet the
arbitrary restoration target of 30% forest cover by the year
2050 varied widely (Fig. 3), from less than 50 ha yr�1 to more
than 6000 ha yr�1 (mean = 126 ha; 95% CI = 62–258 ha). Most
(31 of 55) districts that had less than 30% forest cover required
the establishment of less than 1000 ha yr�1 of new forest to
exceed the extinction threshold by 2050 (Supplementary Ta-
ble S4). For 10 of the 55 districts, the inclusion of existing
indigenous scrub as regenerating forest was enough to in-
crease their level of forest cover above the extinction thresh-
old without requiring additional restoration.
4. Discussion
4.1. Drivers of deforestation and forest fragmentation
Deforestation is a non-random process that reflects the par-
ticular history and conditions of a given location. For
instance, North American forest loss occurred primarily along
the coast and at low altitudes (Seabloom et al., 2002), whereas
in the relatively flat Amazonian Basin deforestation has prin-
cipally occurred along paved highways, with human popula-
tion density and climate also being important drivers
(Laurance et al., 2002). By contrast, the cumulative pattern
of deforestation in New Zealand was most strongly associated
with the density of road networks, a climatic moisture gradi-
ent and soil fertility.
0 101.0 101.5 102.0 102.5 103.0 103.5 104.0
Annual restoration required (ha.yr-1)
0
4
8
12
16
20
24
28
Num
ber
of d
istr
icts
excluding scrub including scrub
Fig. 3 – Frequency distribution of restoration rates required
for the 73 political districts to meet an arbitrary goal of 30%
forest cover by 2050. Districts are grouped according to the
amount of forest regeneration they would need to meet the
restoration target, and the area of required regeneration is
calculated with scrub both included and excluded. Including
indigenous scrub as regenerating forest greatly reduces the
number of districts that require the establishment of more
than 1000 ha of forest per year.
B I O L O G I C A L C O N S E R V A T I O N 1 3 3 ( 2 0 0 6 ) 3 1 2 – 3 2 5 321
Road density was the strongest predictor of cumulative for-
est loss and fragmentation in New Zealand, as it is in much of
the rest of the world (e.g. Chomitz and Gray, 1996; Cropper
et al., 1999, 2001; Alves, 2002; Laurance et al., 2002; Agarwal
et al., 2005). This pattern was apparent even though the mea-
sure of historical deforestation lumped pre- and post-Euro-
pean effects. Pre-European deforestation occurred in the
absence of roads, so must have been driven by other factors.
However, it appears that the tendency for post-European
deforestation to occur in areas with high road densities has
been so strong that it has overwhelmed the pre-European pat-
terns. Roads form an integral component of modern com-
merce and can act as a surrogate variable for human landuse
pressure, with high-density road networks representing inten-
sive use of the landscape. As such, it is not surprising to find
that areas with the highest density road networks, such as cit-
ies and suburbs, had the highest rates of deforestation in New
Zealand, and that areas with few roads were left relatively un-
scathed. However, a number of grid squares that had few roads
were also heavily or completely deforested (Fig. 2a), indicating
that the absence of roads is not, in itself, enough to guarantee
forest persistence and that other factors are responsible for
causing deforestation patterns in these areas.
High rates of forest loss were also correlated with low an-
nual rainfall, high vapour pressure deficit and high annual
water deficit. This does not, however, mean that dry climates
per se are driving forest loss. Rather, it is the human response
to climate that is the ultimate cause of deforestation. The cor-
relation between forest loss and a climatic moisture gradient
probably reflects the fact that early peoples used fire as the
most common method of clearing forest (Stevens et al.,
1988; McGlone, 1989; Arnold, 1994), with the dry, eastern for-
ests burning more readily and extensively (Molloy, 1969;
Leathwick et al., 2003a).
Surprisingly, there was a non-significant correlation be-
tween forest loss and human population density. In other
studies of deforestation rates, population density is often
cited as a significant driver of forest clearance (Laurance,
1999; Pfaff, 1999; Bhattarai and Hammig, 2001; Cropper
et al., 1999; Geist and Lambin, 2002). These studies are typi-
cally conducted in tropical, developing nations, where forests
are converted to agricultural land to feed rapidly growing hu-
man populations which are often widely dispersed through
large rural areas (Laurance et al., 2002; Seabloom et al.,
2002). By contrast, New Zealand is a temperate, developed na-
tion with a small population growth rate (1.2% p.a.), a largely
urban population (86%), and an emerging trend for farmers to
protect, rather than clear, privately owned forest (Queen Eliz-
abeth II Trust, 1984; Ministry for the Environment, 2000; Davis
and Cocklin, 2001).
A second reason for the non-significant relationship
between historical deforestation and population density is a
difference in the temporal scale of observations. The popula-
tion distribution in 2001, which was the variable used in this
analysis, does not necessarily reflect the population distribu-
tion at the actual time that deforestation occurred in any
given area, as New Zealand has seen dramatic population
movements in response to colonisation schemes, gold rushes
and the eventual growth of large urban centres around major
ports (Boddington, 2003). Moreover, multicollinearity amongst
variables may also have weakened any direct link between
human population density and historical deforestation. Popu-
lation density was significantly correlated with all other pre-
dictor variables with the exception of exotic forest cover. It
was most strongly correlated with road density, strengthen-
ing the assertion that road density acts as a surrogate for
human landuse intensity.
There were also surprisingly weak effects of the geomor-
phological variables on deforestation. In particular, a strong
effect of altitude on historical forest loss had been expected,
as topography strongly influenced the patterns of human set-
tlement and forest burning in New Zealand (Molloy, 1969), and
most of the lowland plains are almost completely denuded of
native forest (Ewers et al., 2005). That it did not show up in the
analysis probably reflects the intercorrelated nature of many
of the drivers. Both altitude and land evenness were strongly
negatively correlated with road density (r = �0.55 and �0.54
respectively) and human population density (r = �0.35 and
�0.27 respectively), a pattern also shown by Seabloom et al.
(2002), and indicates that the effects of topography were
encompassed within these intercorrelated relationships.
4.2. The impact of exotic forestry on recent deforestationrates
In contrast to patterns of historical forest loss, recent forest
loss over the period 1997–2002 was associated solely with in-
creases in the amount of exotic forest cover. This indicates
that in many locations indigenous forest has been destroyed
322 B I O L O G I C A L C O N S E R V A T I O N 1 3 3 ( 2 0 0 6 ) 3 1 2 – 3 2 5
to make way for exotic plantations, and demonstrates that
there is a strong role played by the forestry industry in driving
current patterns of deforestation (Walker et al., 2006). Further-
more, a large proportion of the indigenous scrub that was
cleared was converted to exotic plantations. The amount of
land covered by exotic forestry in New Zealand has been
increasing steadily since the end of the Second World War,
and the fact that recent expansion of forestry operations is
still associated with the loss of small indigenous forest rem-
nants is of concern.
4.3. Protection of indigenous forests
Of the forested land that remains in New Zealand, three-quar-
ters (46,250 km2) is Crown owned and protected from clear-
ance and development through administration by the
Department of Conservation. However, the distribution of that
protection is uneven between political districts. Most of the
landscapes with >30% forest fell into the protected category,
indicating that where abundant forest exists, the Department
of Conservation administers a significant proportion of the
forests for conservation purposes. Unfortunately, though,
landscapes with low amounts of forest cover, where surviving
remnants are of proportionately greater conservation value,
also tend to have the lowest proportion of protected forest
(Leathwick et al., 2003a; Walker et al., 2005, 2006).
The districts that are underrepresented in terms of the
remaining Crown-owned indigenous forests managed for con-
servation are predominantly in the lowlands and cities (Awim-
bo et al., 1996; Norton, 2000), where land prices are inevitably
high. This trend has been emphasized during the tenure re-
view process of high country lands that was initiated in the
1990s in New Zealand, where historic crown leasehold land
is in the process of being converted to either conservation es-
tate or freehold farmland (Mark et al., 2003). The net result of
this pattern is an extensive, but non-representative conserva-
tion estate – a problem shared by many nations in the world
(Pressey, 1994). We suggest that future forest protection prior-
ities in New Zealand should now be in two new directions.
The first priority for conservation protection is the target-
ing of landscapes that are at risk of forest cover declining be-
low the ‘extinction threshold’ of 30% forest cover. The
extinction threshold poses a considerable threat to metapop-
ulation persistence in deforested landscapes. As the thresh-
old is passed, dispersal between forest fragments is
disrupted to the extent that extinction rates of isolated popu-
lations increases and vacant fragments are not recolonised
(Kareiva and Wennergren, 1995). The loss of even a small
amount of forest near the threshold may, therefore, result
in an irreversible decline in species persistence (With and
King, 1999). If these landscapes can be maintained above
the extinction threshold by preemptive conservation mea-
sures, it may be possible to avoid future declines in the pop-
ulations of native species, thereby negating the need for
expensive, single-species management which becomes more
costly the rarer a taxon becomes (Garnett et al., 2003). How-
ever, we stress that habitat loss is only one of many factors
that interact to cause species declines (Didham et al.,
2005a,b, 2006), and that preventing future habitat loss will
not, in itself, guarantee the persistence of all species.
The second priority for conservation protection is the tar-
geting of forest fragments in landscapes with very low
amounts of forest cover. These landscapes can be combined
with the Land Environments of New Zealand categories to as-
sign simple priority values to fragments that are not yet pro-
tected, based on two variables: (1) the proportion of protected
forest in the landscape in which the fragment is located; and
(2) the proportion of protected forest in the Land Environ-
ments of New Zealand category within which the fragment
is classified. This simple ranking system has the potential to
provide a clear, ecologically relevant priority system for land
acquisitions.
One important consideration in developing a strategy like
this is that the land must be available for conservation
purposes; this may not be the case for much of the forest that
remains in the most threatened land environments of New
Zealand. The large majority of these fragments are located
on private land that is not for sale, and is not likely to be sold
in the foreseeable future. Thus, effective conservation man-
agement in these areas may rely more on private land cove-
nants through institutions such as the Queen Elizabeth II
National Trust (Queen Elizabeth II Trust, 1984) than on official
government protection through the Department of
Conservation.
4.4. Recent and future deforestation
The spatial distribution of recent deforestation was clumped
in several political regions at opposite ends of the nation, of
which Northland and Southland were the most notable.
Nearly 40% of all forest loss that occurred in New Zealand
from 1997 to 2002 occurred in Northland, which also contains
some of the most fragmented forest in New Zealand.
Although the Northland deforestation rates are still the high-
est in the country, it is notable that they have been greatly
reduced over the past 20 years, when indigenous forest was
being cleared at 1.5% yr�1 (Anderson et al., 1984). Deforesta-
tion rates in Southland are also relatively high, reflecting
the impact of logging activities on land owned by indigenous
groups. Southland is home to almost half of the forest granted
to named Maori people under the South Island Landless
Natives Act 1906, and these remain today as the only privately
owned forests in New Zealand that are not required to have
Sustainable Forest Management Plans under the 1993 Forests
Act (Ministry of Agriculture, 2001). As a consequence, it has
been recognised that there is potential for ongoing unsustain-
able harvesting of indigenous forest in this area (Ministry of
Agriculture, 2001).
Future forest loss scenarios were predicted using exponen-
tial decline curves rather than extrapolating current deforesta-
tion rates into the future, because deforestation rates are not
static through time (Bhattarai and Hammig, 2001; Laurance
et al., 2001). Forest destruction occurred extremely rapidly fol-
lowing the 1870s after establishment of European settlements
in New Zealand (Arnold, 1994) and as the forest has receded, so
has the rate at which further clearance has been made. To ac-
count for these changes through time, a regression approach
was used that smoothed out short-term variation in deforesta-
tion rates and allowed us to determine long-term trajectories
in forest cover. Because of the uncertainties implicit in any
B I O L O G I C A L C O N S E R V A T I O N 1 3 3 ( 2 0 0 6 ) 3 1 2 – 3 2 5 323
regression analysis and the unpredictable way in which year-
to-year deforestation rates can vary, the dates at which the
landscape threshold is predicted to be exceeded should be
interpreted solely as an indication of the relative threat to dif-
ferent landscapes. By contrast, the restoration targets provide
a clear indication of the magnitude of the conservation effort
required by the individual political districts.
For heavily deforested regions, such as in Canterbury and
Otago, the restoration effort required is considerable, with
many districts needing to restore between 2000 and 6000 ha
of forest each year. Encouragingly though, 6% of New Zealand
landcover is currently classified as indigenous scrub, which, if
left undisturbed for long enough time periods, should regen-
erate into indigenous forest, and so could be considered ‘‘for-
est-in-waiting.’’ When scrub is considered in this manner, the
restoration targets for many districts become more achiev-
able. It is also encouraging that when taken as a whole,
New Zealand has 30% of its total land area in either indige-
nous forest or indigenous scrub that should eventually regen-
erate into forest. However, data from the LandCover Database
shows a nationwide trend for declining native scrub cover,
suggesting that large areas of this landcover type are not
being allowed to regenerate into mature forest before being
cleared. Furthermore, only 162 ha of new scrub cover regener-
ated between 1997 and 2002. Of course, it is also possible that
the LandCover Database has underestimated the amount of
scrub regeneration that is occurring, because the early
encroachment of native scrub into grasslands is unlikely to
be recorded as a transition from grassland to scrub due to
the minor changes in the spectral signatures of the vegetation
cover at these early stages. To detect increases in scrub cover
at the early stages of regeneration, finer remote sensing tech-
niques, such as those employed by the EcoSat Project (Dy-
mond et al., 2004), may be required.
Obviously, the process of forest regeneration in a temper-
ate nation is slow and the final target of 30% landcover of
mature forest can not realistically be achieved by 2050. How-
ever, the land required to meet this set of district-level targets
could certainly be set aside by 2050, because relatively modest
annual additions to the conservation estate will be enough for
many districts to attain the eventual goal of restoring the New
Zealand landscape to the point where the historical impacts
of habitat loss are minimised.
Acknowledgements
John Thyne provided assistance with constructing the GIS
database, Stuart Waring and Kath Henderson at the Depart-
ment of Conservation provided the National Conservation
Units dataset, and Craig Briggs at Landcare Research provided
the pre-human vegetation cover layers. Ecki Brockerhoff, John
Craig, Kath Dickinson, Bill Laurance, Amanda Todd and an
anonymous reviewer gave helpful comments on the
manuscript.
Appendix A. Supplementary data
Supplementary data associated with this article can be found,
in the online version, at doi:10.1016/j.biocon.2006.06.018.
R E F E R E N C E S
Agarwal, D.K., Silander, J.A.J., Gelfand, A.E., Dewar, R.E.,Mickelson, J.G.J., 2005. Tropical deforestation in Madagascar:analysis using hierarchical, spatially explicit, Bayesianregression models. Ecological Modelling 185, 105–131.
Alves, D.S., 2002. Space–time dynamics of deforestation inBrazilian Amazonia. International Journal of Remote Sensing23, 2903–2908.
Anderson, R., Hogarth, I., Pickard, R., Ogle, C.C., 1984. Loss ofwildlife habitat in Northland, 1978–1983. New Zealand WildlifeService Technical Report No. 6, Department of Internal Affairs,Wellington.
Andren, H., 1994. Effects of habitat fragmentation on birds andmammals in landscapes with different proportions of suitablehabitat: a review. Oikos 71, 355–366.
Arnold, R., 1994. New Zealand’s Burning: The Settlers’ World inthe Mid 1880s. Victoria University Press, Wellington.
Awimbo, J.A., Norton, D.A., Overmars, F.B., 1996. An evaluation ofrepresentativeness for nature conservation, HokitikaEcological District, New Zealand. Biological Conservation 75,177–186.
Bhattarai, M., Hammig, M., 2001. Institutions and theEnvironmental Kuznets Curve for deforestation: acrosscountry analysis for Latin America, Africa and Asia.World Development 29, 995–1010.
Boddington, B., 2003. New Zealand’s population: a demographicoverview. New Zealand Population Review 29, 9–17.
Brooks, T.M., Pimm, S.L., Oyugi, J.O., 1999. Time lag betweendeforestation and bird extinction in tropical forest fragments.Conservation Biology 13, 1140–1150.
Chomitz, K.M., Gray, D.P., 1996. Roads, land, markets, anddeforestation: a spatial model of land use in Belize. The WorldBank Economic Review 10, 487–512.
Clout, M., 2001. Where protection is not enough: activeconservation in New Zealand. Trends in Ecology and Evolution16, 415–416.
Craig, J.L., Anderson, S.H., Clout, M., Creese, B., Mitchell, N.,Ogden, J., Roberts, M., Ussher, G., 2000. Conservation issues inNew Zealand. Annual Review of Ecology and Systematics 31,61–78.
Cropper, M., Griffiths, C., Mani, M., 1999. Roads, populationpressures, and deforestation in Thailand, 1976–1989. LandEconomics 75, 58–73.
Cropper, M., Puri, J., Griffiths, C., 2001. Predicting the location ofdeforestation: the role of roads and protected areas in northThailand. Land Economics 77, 172–186.
Davies, R.G., Hernandez, L.M., Eggleton, P., Didham, R.K., Fagan,L.L., Winchester, N.N., 2003. Environmental and spatialinfluences upon species composition of a termite assemblageacross neotropical forest islands. Journal of Tropical Ecology19, 509–524.
Davis, P., Cocklin, C., 2001. Protecting Habitats on Private Land:Perspectives from Northland, New Zealand. Department ofConservation, Wellington. 69 pp.
Didham, R.K., Ewers, R.M., Gemmell, N.J., 2005a. Comment on‘‘Avian extinction and mammalian introductions on oceanicislands’’. Science 307, 1412a.
Didham, R.K., Tylianakis, J.M., Hutchison, M.A., Ewers, R.M.,Gemmell, N.J., 2005b. Are invasive species the drivers ofecological change? Trends in Ecology and Evolution 20, 470–474.
Dymond, J.R., Shepherd, J.D., Ausseil, A.-G.E., 2004. ECOSAT: a newgeneration of ecolandscape descriptors derived from satelliteimagery. Available from: <http://www.landcareresearch.co.nz/services/ecosat/index.asp>. LandCare Research, PalmerstonNorth, New Zealand.
324 B I O L O G I C A L C O N S E R V A T I O N 1 3 3 ( 2 0 0 6 ) 3 1 2 – 3 2 5
Ewers, R.M., Didham, R.K., 2006. Confounding factors in thedetection of species responses to habitat fragmentation.Biological Reviews 81, 117–142.
Ewers, R.M., Didham, R.K., Wratten, S.D., Tylianakis, J.M., 2005.Remotely sensed landscape heterogeneity as a rapid tool forassessing local biodiversity value in a highly modified NewZealand landscape. Biodiversity and Conservation 14, 1469–1485.
Fahrig, L., 2003. Effects of habitat fragmentation on biodiversity.Annual Review of Ecology and Systematics 34, 487–515.
Fleet, H., 1986. The Concise Natural History of New Zealand.Heinemann Publishers, Auckland.
Garnett, S., Crowley, G., Balmford, A., 2003. The costs andeffectiveness of funding the conservation of Australianthreatened birds. BioScience 53, 658–665.
Geist, H.J., Lambin, E.F., 2002. Proximate causes and underlyingdriving forces of tropical deforestation. BioScience 52,143–150.
Hanski, I., 1998. Metapopulation dynamics. Nature 396, 41–49.Hanski, I., Ovaskainen, O., 2002. Extinction debt at extinction
threshold. Conservation Biology 16, 666–673.Harding, J.S., Benfield, E.F., Bolstad, P.V., Helfinan, G.S., Jones,
E.D.B.I., 1998. Stream biodiversity: the ghost of land use past.Proceedings of the National Academy of Sciences 95, 14843–14947.
Hartley, M.J., Hunter, M.L.J., 1998. A meta-analysis of forest cover,edge effects, and artificial nest predation rates. BiologicalConservation 15, 465–469.
Hobbs, R.J., 2001. Synergisms among habitat fragmentation,livestock grazing, and biotic invasions in southwesternAustralia. Conservation Biology 15, 1522–1528.
Kareiva, P.M., Wennergren, U., 1995. Connecting landscapepatterns to ecosystem and population processes. Nature 373,299–302.
Laurance, W.F., 1999. Reflections on the tropical deforestationcrisis. Biological Conservation 91, 109–117.
Laurance, W.F., Albernaz, A.K.M., Da Costa, C., 2001. Isdeforestation accelerating in the Brazilian Amazon?Environmental Conservation 28, 305–311.
Laurance, W.F., Albernaz, A.K.M., Schroth, G., Fearnside, P.M.,Bergen, S., Venticinque, E.M., Da Costa, C., 2002. Predictors ofdeforestation in the Brazilian Amazon. Journal ofBiogeography 29, 737–748.
Leathwick, J., Wilson, G., Rutledge, D., Wardle, P., Morgan, F.,Johnston, K., McLeod, M., Kirkpatrick, R., 2003a. LandEnvironments of New Zealand. David Bateman Ltd.,Auckland.
Leathwick, J., McGlone, M.S., Walker, S., 2004. New Zealand’sPotential Vegetation Pattern. Manaaki Whenua Press, Lincoln,New Zealand.
Leathwick, J.R., Overton, J.M., McLeod, M., 2003b. Anenvironmental domain classification of New Zealand and itsuse as a tool for biodiversity management. ConservationBiology 17, 1612–1623.
Legendre, P., 1993. Spatial autocorrelation: trouble or newparadigm? Ecology 74, 1659–1673.
Lonsdale, W.M., 1999. Global patterns of plant invasions and theconcept of invasibility. Ecology 80, 1522–1536.
Mark, A.F., Dickinson, K.J.M., Patrick, B.P., 2003. Indigenousgrassland protection in New Zealand. Frontiers in Ecology andthe Environment 1, 290–291.
May, S.A., Norton, T.W., 1996. Influence of fragmentation anddisturbance on the potential impact of feral predators onnative fauna in Australian forest ecosystems. WildlifeResearch 23, 387–400.
McGlone, M.S., 1989. The Polynesian settlement of New Zealandin relation to environmental and biotic changes. New ZealandJournal of Ecology 12, 115–129.
Ministry for the Environment, 2000. Final report of the MinisterialAdvisory Committee on Biodiversity and Private Land.Ministry for the Environment, Wellington, p. 112.
Ministry of Agriculture, 2001. Forestry Sector Issues. New ZealandMinistry of Agriculture and Forestry. Available from: <http://www.maf.govt.nz/forestry/publications/forestry-sector-issues/index.htm>.
Molloy, B.P.J., 1969. Recent history of the vegetation. In: Knox, G.A.(Ed.), The Natural History of Canterbury. Reed, Wellington, pp.340–360.
Norton, D.A., 2000. Conservation biology and private land: shiftingthe focus. Conservation Biology 14, 1221–1223.
Ohlemuller, R., Walker, S., Wilson, J.B., 2006. Local vs regionalfactors as determinants of the invasibility of indigenous forestfragments by alien plant species. Oikos 112, 493–501.
Pfaff, A.S.P., 1999. What drives deforestation in the BrazilianAmazon? Journal of Environmental Economics andManagement 37, 26–43.
Pressey, R.L., 1994. Ad hoc reservations: forward or backward stepsin developing representative reserve systems? ConservationBiology 8, 662–668.
Queen Elizabeth II Trust, 1984. Open Space Covenants. QueenElizabeth II National Trust, Wellington.
R Development Core Team, 2004. R: A Language for StatisticalComputing. R Foundation for Statistical Computing,Vienna.
Robinson, S.K., Thompson III, F.R., Donovan, T.M., Whitehead,D.R., Faaborg, J., 1995. Regional forest fragmentation andthe nesting success of migratory birds. Science 267,1987–1990.
Sala, O.E., Chapin, F.S.I., Armesto, J.J., Berlow, E., Bloomfield, J.,Dirzo, R., Huber-Sanwald, E., Huenneke, L.F., Jackson, R.B.,Kinzig, A., Leemans, R., Lodge, D.M., Mooney, H.A., Oesterheld,M., Poff, N.L., Sykes, M.T., Walker, B.H., Walker, M., Wall, D.H.,2000. Global biodiversity scenarios for the year 2100. Science287, 1770–1774.
Salmon, J.T., 1975. The influence of man on the biota. In: Kuschel,G. (Ed.), Biogeography and Ecology in New Zealand. Dr. W. Junkb.v. Publishers, The Hague, pp. 643–661.
Seabloom, E.W., Dobson, A., Stoms, D.M., 2002. Extinction ratesunder nonrandom patterns of habitat loss. Proceedings of theNational Academy of Sciences 99, 11229–11234.
Standish, R.J., Robertson, A.W., Williams, P.A., 2001. Theimpact of an invasive weed Tradescantia fluminensis onnative forest regeneration. Journal of Applied Ecology 38,1253–1263.
Stevens, G., McGlone, M.S., McCulloch, B., 1988. Prehistoric NewZealand. Heinemann Reed, Auckland.
ter Braak, C.J.F., 1995. Ordination. In: Jongman, R.H.G., ter Braak,C.J.F., van Tongeren, O.F.R. (Eds.), Data Analysis in Communityand Landscape Analysis. Cambridge University Press,Cambridge, pp. 91–173.
Thompson, S., Gruner, I., Gapare, N., 2003. New Zealand LandCover Database Version 2: Illustrated guide to target classes.New Zealand Ministry for the Environment.
Tilman, D., May, R.M., Lehman, C.L., Nowak, M.A., 1994. Habitatdestruction and the extinction debt. Nature 371, 65–66.
Toft, R.J., Harris, R.J., Williams, P.A., 2001. Impacts of the weedTradescantia fluminensis on insect communities infragmented forests in New Zealand. Biological Conservation102, 31–46.
Trzcinski, M.K., Fahrig, L., Merriam, G., 1999. Independent effectsof forest cover and fragmentation on the distribution of forestbreeding birds. Ecological Applications 9, 593–596.
Turner, I.M., Chua, K.S., Ong, J.S.Y., Soong, B.C., Tan, H.T.W., 1996.A century of plant species loss from an isolated fragment oflowland tropical rain forest. Conservation Biology 10,1229–1244.

B I O L O G I C A L C O N S E R V A T I O N 1 3 3 ( 2 0 0 6 ) 3 1 2 – 3 2 5 325
Vellend, M., Verheyen, K., Jacquemyn, H., Kolb, J., Van Calster, H.,Peterken, G., Hermy, M., 2006. Extinction debt of forest plantspersists for more than a century following habitatfragmentation. Ecology 87, 542–548.
Walker, S., Price, R., Rutledge, D., 2005. New Zealand’s RemainingIndigenous Cover: Recent Changes and Biodiversity ProtectionNeeds. Report number LC 0405/038, Landcare Research NewZealand, Wellington.
Walker, S., Price, R., Rutledge, D., Lee, W.G., 2006. Recent loss ofindigenous cover in New Zealand. New Zealand Journal ofEcology 30, 169–177.
Wiser, S.K., Allen, R.B., Clinton, P.W., Platt, K.H., 1998. Communitystructure and forest invasion by an exotic herb over 23 years.Ecology 79, 2071–2081.
With, K.A., King, A.W., 1999. Extinction thresholds for species infractal landscapes. Conservation Biology 13, 314–326.