Party Nationalization and the Politics of Geographic Redistribution in Spain
52
1 Party Nationalization and the Politics of Geographic Redistribution in Spain Mark Canavan Trinity College Dublin [email protected] August 30, 2014 Acknowledgements: This paper is part of a doctoral research project undertaken at Trinity College Dublin. I am grateful to the Irish Research Council for their generous financial support. I wish to thank Michael Gallagher, Jonathan Hopkin and Tom Louwerse for their insightful comments on the paper.
Transcript of Party Nationalization and the Politics of Geographic Redistribution in Spain

1
Party Nationalization and the
Politics of Geographic
Redistribution in Spain
Mark Canavan
Trinity College Dublin
August 30, 2014
Acknowledgements: This paper is part of a doctoral research project undertaken at Trinity College
Dublin. I am grateful to the Irish Research Council for their generous financial support. I wish to
thank Michael Gallagher, Jonathan Hopkin and Tom Louwerse for their insightful comments on the
paper.

2
Party Nationalization and the Politics of Geographic Redistribution in
Spain
Abstract
The paper explores the importance of geographic variations in political parties' electoral support on
these actors’ political distribution priorities when in government. The paper explores patterns in the
regional allocation of infrastructure investment to Provinces by central government in Spain from
1978-2010. It tests two central hypotheses related to the explanatory importance of electoral
geography for parties' geographic distribution priorities. Firstly, its tests the contention that regional
parties in Spain have historically been able to secure disproportional investment for core support
constituencies, when these parties are pivotal for government formation. Secondly, we explore a
more novel hypothesis relating the relative nationalization of the major governing parties of the
democratic era, to their propensity to engage political distribution towards favoured electoral
constituencies. The paper finds that parties vary significantly in their use of tactical 'pork-barrel'
spending, depending on the degree to which their electoral support is 'nationalized' across all
regions within the country.

3
1. Introduction
This paper investigates the importance of a political party’s ability to project its organization and
support across jurisdictions (such as districts and regions) for distributive policy. As conventionally
defined, distributive policy deals with political decisions over the allocation of government resources
between political and administrative jurisdictions. As defined by Weingast, Shepsle and Johnsen: ‘A
distributive policy is a political decision that concentrates benefits in a specific geographic
constituency and finances expenditures through generalized taxation’ (1981, 644).
In essence, the content of distributive policy entails decisions over the geographic allocation of
grants and direct provision of local public goods by central governments to lower level jurisdictions
or authorities, such as decisions over size and location of infrastructure investment. Infrastructure
investment especially when decided at central government level is usually also highly redistributive.
The regional allocation of infrastructure investment acts to redistribute money from certain regions
(those that pay taxes) to others (those in which the investment is made) (Solé-Ollé, 2010).
In line with an emerging political economy literature, we argue that the geography of electoral votes
may be more important than electoral and constitutional rules in some political systems for shaping
the preferences of governments over distributive policy and geographic redistribution (e.g. Jurado,
2013; Crisp, Potter and Olivella 2012; Simmons Hicken and Kollman 2010; Rodden 2010). This paper
supplements previous cross-sectional analyses (Lago-Penas and Lago-Penas, 2009; 2012; Hicken et
al. 2010; Crisp et al., 2012) investigating the proposition that the geographical dispersion of parties’
core support – and the relative success of parties in claiming votes throughout the whole nation –
significantly influence the content and allocation of their discretionary geographic spending during
their term in office. The dependent variable in this study is the regional distribution of infrastructure
spending by parties in central government, over their term of office.
In recent years, much literature in both political science and economics has paid increasing attention
to the factors that explain the regional allocation of public investment in infrastructure (Kemmerling
and Stephan, 2002; 2010; Knight, 2004; de la Fuente, 2004). Research in the field has focused
particularly on the efficiency/ equity trade-off in terms of geographic redistribution in conjunction
with the differing political partisan interests of governments in providing explanations for systematic
patterns in the allocation of investment.

4
The central concern of these within-country studies of regional investment, especially physical
infrastructure as well as intergovernmental grants, is determining the extent to which allocation
decisions at central government level are based on expected productivity output or equity concerns
(‘programmatic considerations’) or alternatively on the strength of regional lobbying or electoral
importance of a jurisdiction (‘tactical considerations’). In this conceptual distinction of government
allocation decisions – also relied upon in this paper – ‘tactical distribution’ reflects a government
responsiveness to or favouritism towards particular geographic constituencies in distributive policy.
‘Programmatic distribution’ on the other hand reflects responsiveness to a broader partisan or
‘national’ constituency interest. In this conception, it is important to emphasize that ‘programmatic
distribution’ is still reflective of a potentially partial view of the national interest, where the broadest
constituency interest a party might serve is their partisan constituency. However, while certain areas
with concentrations of party support may benefit more than others by a particular expenditure
program, legislators or parties favour partisans residing in certain districts only insofar as they
conform to the national distribution of party support (Franzese et al., 2007, 6).
Tactical distribution serves as a proxy for pork-barrel provision. In Spain, for instance, we observe
significant time variation in the use of tactical ‘pork barrel’ spending between governments. We
argue that this indicates the salience of geographic constituencies for parties as opposed to their
wider partisan constituencies. Explaining this temporal and cross-sectional variance in parties’ use of
tactical infrastructure spending is the central objective of this paper. The incentives to be responsive
to geographic or partisan constituencies likely vary with district and national level electoral
competitiveness, partisan polarization, and other features of specific elections as well as of more
permanent features of electoral and party systems (Franzese et al 2007, 6).
However, as we explore in the next section institutional factors have difficulty accounting for
temporal patterns within Spain (as well as other countries) in the level of pork barrel spending. For
instance, institutional factors have difficulty in accounting for why some governments in certain time
periods appear more prone to relying on ‘tactical distribution’ in regional investment.
This study argues that electoral geography of individual parties – and spatial patterns in party system
aggregation – structures policy-makers incentives to be attentive to particular geographic
constituencies or wider partisan constituencies. While nationalization of electoral performance in a
country induces wider programmatic priorities over geographic distribution, fragmentation of
electoral support along regional lines encourages the use of pork barrel spending both as a means to
reward loyal core supporters and as a side-payment to regionalist parties that are pivotal to
government formation. At one extreme, we argue that regionalist parties may bolster both the
lobbying impact and the electoral strength of regions with regards their efforts to secure

5
infrastructure allocations from central government. At the other extreme, regions that are poorly
represented by state-wide parties participating in central government, may be ignored or
‘disproportionally disfavoured’ in the game of geographic redistribution.
All governments need to buy out strong regional interests or muster electoral support across
regions. However, where party nationalization is strong, there might be fewer incentives for central
government actors to disproportionally favour particular regions over others. This is because strong
state-wide parties are more likely to internalize the cost of particularistic projects. We investigate
this proposition, exploring the effects of electoral geography – specifically the breadth of parties’
electoral support – on allocations of infrastructure investment among Spanish Provinces and
Autonomous Communities (regions) by the central governments in Spain from 1978-20101.
The remainder of this paper is organized as follows. The next section discusses the case selection
justification and how we attempt to control for potentially confounding institutional factors. The
subsequent section describes the main patterns in party nationalization and regional competition in
Spain. We then move on to a discussion of the empirical design and econometric methodology. The
final sections describe the results of the empirical analysis and discuss their implications for the
wider theoretical concerns.
2. Case Selection: Large Roads Expenditure in Spain 1978-2010
Spain is an interesting case to explore the effect of electoral geography on political distribution.
Firstly, as will be expanded below there is significant variation both between parties and over time in
the political geography of parties. Secondly, several institutional features that are argued to be the
leading driver of pork barrel politics are absent in the Spanish case. We list describe these
institutional incentives in Table 1 (appendix) giving empirical expectations in the Spanish case,
derived from predictions in the theoretical literature.
To summarize our analysis, it is argued that, in terms of institutional incentives, pork barrel or
particularistic spending is unlikely to be incentivised by the electoral system in Spain which is a
Closed List Proportional Representation System with d’Hondt formula. Unlike in single member
plurality electoral systems, PR systems lack the ‘district marginality incentive’ to target swing
districts in an effort to sway a small amount of influential voters to win a seat. In PR elections,
1 There are 52 Provinces in Spain which are synonymous with the electoral district. There are 17 Autonomous
Communities (ACs) that contain varying number of Provinces and Municipalities. We refer to Provinces and electoral districts and as ACs and regions as synonymous in the terminology of the paper.

6
parties have incentives to maximize total votes making votes valuable everywhere and, hence, there
is no reason to favour particular districts on the grounds of marginality. Similarly the ballot rules in
Closed List systems, on their own, are unlikely to generate incentives for individual candidates to
seek to build a ‘personal vote’ in their district by channelling particularistic funds (Carey and Shugart,
1995).
However two institutional features may have an effect on incentivising pork-barrel provision by
parties. Firstly, due to the fixed, historic nature of the electoral boundaries (based on historic
provinces) and the constitutional imperative of having a least two seats per Province, there is
significant malapportionment or over-representation of small, rural provinces. In terms of tactical
spending, this implies that the cost of a seat is ‘cheaper’ in an over-represented district than in an
under-represented district. For instance, in terms of the seat to vote ratio at the 2000 general
election, it took on average 90,873 votes for a single seat in Madrid (the most under-represented
Province) to an average of 18,169 and 28,199 votes in Soria and Teruel (the most over-represented).
FIGURE 1: MALAPPORTIONMENT ACROSS ELECTORAL DISTRICTS, SPAIN
Notes: (1) Apportionment measured as number of votes to seats for legislative lower house in general elections. (2) Source: own author calculations, data from Spanish Ministry of Interior. (3) All electoral districts (n=50) included except Ceuta and Melilla.
Other studies have shown that malapportionment can be an important determinant of the size of
intergovernmental grants (Atlas et al. 1995), or other central government transfers (Dragu and

7
Rodden, 2011), a district or region receives. The analysis controls for this institutional factor by
including the votes/seats ratio of each electoral district in the regression models.
The level of decentralization in Spain is another institutional factor that could incentivise pork barrel
spending, or simply ‘over-spending’, on local public goods such as infrastructure projects. Fiscal
decentralization could theoretically lead to increased central government spending on infrastructure
for two reasons.
Firstly, if there is a ‘mismatch’ between the spending competencies of regional governments and
their revenue raising competencies this could exacerbate the ‘fiscal common pool problem’ of
central government . If regionally voted expenditures on infrastructure, for instance, is financed via
central taxation this could lead to over-spending on local infrastructure. This problem – known as
‘vertical fiscal imbalance’ – is associated with larger public sectors in general and especially larger
government expenditure on items that are geographically concentrated (see e.g. Estache and Sinha,
1999). Despite regional governments having relatively large public sectors relative to central
government, there is a large vertical imbalance in revenue raising autonomy between central and
regional governments in Spain. In 2001-2003 for instance, regional government revenues accounted
for 21.2% total revenues, however 52.7% of these regional revenues were financed by
intergovernmental grants and subsidies from central government (Cantarero and Perez, 2012, 216).
In addition Spanish regional governments are still heavily reliant on central government for the
financing and planning of most large-scale projects (de la Fuente et al., 1995, 34; Alabate et al.
2010).
A central issue with regards central government control over the allocation of large roads
expenditure concerns the extent to which automatic matching grant mechanisms are used to
finance road building in the Provinces and Municipalities. Automatic matching grants might reduce
the discretion of central governments in deciding upon allocations if it is statutorily required to
automatically ‘match’ regional or provincial/municipal level authority expenditure. In other words,
with this financing mechanism lower level governments can initiate a centrally financed project
without explicit approval of central government. However, automatic matching grants are not
regularly employed to fund large roads infrastructure in Spain (Alabate et al. 2012; Bel, 2012) as
elsewhere (Blöchliger and Petzold, 2009).
Secondly, fiscal and political decentralization to regional governments could lead to higher – or at
least greater variability in – spending on local public goods, such as infrastructure, if there is
significant preference heterogeneity between jurisdictions (Oates, 2006). This claim is derived from
the highly abstract Tiebout (1956) economic justification for decentralization. It could occur in
8
practice, if regional governments pursue different regional development strategies. For instance,
Rodiguez-Pose (2000, 96) describes how the infrastructure and the attraction of FDI have been at
the heart of the Galician development and economic convergence strategy, while the Navarran
strategy has put less emphasis on infrastructure and concentrated effort on support for labour
activation measures, research and development, rural economic diversification schemes and
teaching and training.
We control for the effects of decentralization mainly via the case selection. The expenditure items
considered are highly centralized both fiscally – with regards their financing – and politically – with
regards discretionary autonomy by central government over size and location of expenditure
allocations and projects.
Contrary to what might be expected in a highly decentralized system of government, infrastructure
policy is highly dependent on central institutions, government as well as parliament, in Spain
(Alabate et al. 2012, 600). The central government is responsible for all commercial ports, airports,
virtually all its railways and the vast majority of motorways. We investigate only expenditures on
motorways and national secondary roads by the central government. The main reason for limiting
the study to large roads investment is for the practical reason that not all provinces are suitable
locations for ports or airports. Similarly, the large portion of railways expenditure (in the last decade
in any case) has been driven by a small number of High Speed Rail corridors and a similar logic
applies (Bel, 2012, ch.5). As Alabate et al. (2012, 607) point out, in Spain as a rule surface
transportation networks (including large roads infrastructure) have tended to be funded from
budget while airports and ports have in the main been (partially) funded by users charges, as in most
developed countries. Budget funded infrastructures are more likely to be determined by
considerations of redistribution and political objectives than (partially) user-funded public
infrastructure.
In summary, the main rationale behind choosing centrally financed large roads expenditures is the
assumption that roads expenditure is a universally applicable and universally prized local public good
across all Provinces (electoral districts) and Autonomous Communities (regions). In common with
the pork-barrel literature, we assume that infrastructure is a valuable political good for credit
claiming purposes due to its tangibility, visibility and the level of discretion underpinning locational
decisions (e.g. for the canonical formulation of this argument see Mayhew, 1974; see Tanzi and
Davoodi, 1998 for a representative argument of why political manipulation is often present in public
capital projects). As Rodquez-Pose (2000, 106) for example argues in the case of Spain:
‘[T]he development of infrastructure is…highly visible and supported by public opinion and politicians can capitalise on achievements before local and regional elections.’
9
In other words, parties comprising central governments have a high degree of discretion and
autonomy over the location and amount of large roads expenditure to each province during their
term of office and, as a result, an ability to implement their development and regional redistribution
priorities as well as an ability to use these expenditure allocations to pursue other political
objectives.
3. Patterns of Electoral and Political Geography in Spain
This section will briefly explore patterns in the ‘nationalization’ of electoral trends in Spain. It is
argued that two features of party competition are particularly important to consider for territorial
distribution. First, the importance of regionalist parties both electorally and legislatively at the
national level. Second, the variation between the two largest state-wide parties, in their level of
nationalization across electoral districts (Provinces) and across regions (Autonomous Communities).
While the main feature of central government level in Spain is bipolar competition between left and
right to win the plurality of seats in the Congress (the lower legislative house), the state-wide parties
are also faced with regionalist party competitors in a number of key electoral battle grounds with
large number of seats. In Catalan municipal province of Barcelona for instance, there are 30
parliamentary seats in play, 9% of the total number of seats in the Congress.
Two main features of this regionally fragmented pattern of competition are especially important to
consider. Firstly in terms of government formation, regionalist parties often play a pivotal role as
‘kingmakers’ for the two larger parties. Although individual regionalist parties tend to be quite small
at the national level, they have an outsized role in government formation due to the difficulty larger
parties have in winning a majority of seats in the Congress, and due to the centralist position of key
regionalist parties- especially the Catalonian CiU and the Basque PNV. Secondly, the ability of
regionalist parties to attract votes away from either of the state-wide parties may give them an
outsized role in framing the electoral debate and influencing the electoral promises of state-wide
parties to particular regions. Since regionalist parties are more likely to run on platforms that
emphasize ‘local’ issues, this may pressurize state-wide competitors to emphasize their ability to
defend or favour ‘local’ interests. This ‘localization’ of electoral platforms might become more
important for distributive purposes if an electoral district becomes pivotal to a party’s seat margins.
Two main sets of hypotheses have been put forth to explain variation in the nationalization of
electoral trends and of party support. Daniele Caramani’s influential study (2004) of trends in
nationalization in Western Europe generally posits a modernization perspective to explain the

10
observed pattern of positive secular nationalization. In this view, the persistence of sub-national
variation in electoral trends or party support can for the most part be explained by ethno-regional or
language differences between regions within a country.
FIGURE 2 SUPPORT FOR REGIONALIST PARTIES ACROSS YEARS 1978-2008
Notes: (1) Votes share of regionalist parties as a percentage of total regional vote in elections to legislative lower house (2) Regions selected are those with a significant regionalist party presence defined as greater than 5% in at least one election (3) Regionalist parties are those that espouse a regional specific or autonomist platform and receive the great majority of their votes in only one region. (4) Vertical dotted lines indicate phasing of major decentralization reforms in Spain.
Another influential study of party system aggregation and nationalization across regions by Chhibber
and Kollman (2004) emphasizes the importance of institutional centralization to explain variation in
levels of nationalization or levels of support for sub-national parties. Their central argument is that
ethno-regional diversity within countries is inadequate to explain variation in party nationalization
both within countries over time or between countries. Rather their emphasis is on the institutional
incentives that sub-national parties have to remain as separate entities or to cooperate to secure the
‘prize’ of central government offices. This institutionalist perspective also posits the notion that as
political centralization increases (decreases) voters also have a greater (lesser) incentive to support
distinct sub-national parties. The political centralization perspective suggests that the significant
successive decentralization reforms in Spain should increase support for regionalist parties and also
perhaps lead to a ‘denationalization’ of support for the state-wide parties.

11
However our descriptive analysis of time patterns in party nationalization does not give much
support to this institutionalist hypothesis. The electoral share of regional parties is relatively
constant across time periods. While there is a slight uptick after the establishment of regional
governments in 1984, it doesn’t seem to have significantly increased the vote share of smaller or
regional parties in national elections (see Figure 2).
FIGURE 3: RANGE IN SUPPORT OVER TIME FOR STATE-WIDE PARTIES ACROSS REGIONS 1982-2008
Notes: (1) range in support across elections expressed as percentage total regional vote share between elections for state wide parties (2) Party Acronyms: PP= Partido Popular; PSOE = Partido Socialist Obrero Espanol (3) x-axis: vote share of parties in national elections to lower house as percent total regional vote (4) y-axis: major regionalist parties = regionalist parties receive on average across period more than 10% total regional vote share; minor regionalist parties = less than 10% (5) Period chosen as the PP did not exist as a significant electoral entity until 1983.
If we look at Figure 3, we can see that there is significant variation across regions, as well as
provinces (electoral districts), in the vote share of the two main parties of the democratic period: the
left-wing Partido Socialist Obrero Espanol (PSOE) and the right-wing Partido Popular (PP). Especially
in the earlier years, the PP enjoyed much higher support in some regions (e.g. Castillia-y-Leon) than
others (e.g. Andalucía). In addition, the PP has historically, and still today, receives very limited
support among the ‘historic nationalities’ – especially the Basque Region and Catalonia – as well as
in the regions with significant support for regional parties especially the Canary Islands (with the
Galicia Region being an exception to this). The PSOE on the other hand, appears to have had a much
more homogenous share of support across all regions.

12
A more systematic measure of the geographic disparity in vote support across provinces is to look at
the evolution of the Gini Coefficient measure of the distribution of voter support for the two main
parties. The Gini Coefficient in this case is weighted by the size of the electorate in each region, and
can be considered as a measure of the nationalization of each political party. As well as the time
series for the distribution of votes of the PSOE and PP, Figure 4 also demonstrates party system
nationalization score (PSNS) over time as well as the party nationalization of the parties composing
government (PNG).
There are two options about how to measure the nationalization of government. Firstly, we could
adopt the strategy of only including the party that controls the government executive after
successive elections. Since Spain has never experienced any formal government coalitions, this
would mean that the PNG score would be the same as any of the three single parties that have
controlled government (UCD, PSOE or PP). However this approach would not take into account the
informal coalition dynamics that are a central feature of Spanish politics. While there has never been
a formal coalition between parties to form the government cabinet, there have been numerous
occasions when minority governments have formed that rely on support of smaller parties through
informal legislative agreements. With the exception of the United Left Coalition support for the
PSOE these smaller parties have been regionalist parties. We therefore adopt a more ad hoc
approach to defining the nationalization of the government during specific periods. We take the
average of all Gini coefficient nationalization score of all parties considered essential to government
formation and stability during specific periods. This average is weighted by the number of seats held
by each party in the Congress2.
As we can see in Figure 4 there is no striking time trend in the nationalization of either of the two
main parties except perhaps to observe that the People’s Party (PP) has tended to become more
nationalized over time, and is a good deal more nationalized than its predecessor, the Union Centro
Democratia (UCD) party. Certainly, the hypothesis that ‘denationalization’ or a regionalization of the
electorate is driven by political or fiscal decentralization doesn’t seem to be borne out by either the
time trends on the geographic dispersion of the vote shares of the main parties, or in the vote shares
of regionalist or autonomist parties. The vote share of regionalist parties in national elections has
2 Informal Legislative Coalitions in Spain: 1989-1993 PSOE with CC; 1993-1996 PSOE with PNV and CiU; 1996-2000 PP with
CiU, PNV and CC; 2004-2008 PSOE with IU and ERC. With regards to the first Zapatero government (2004-2008), some commentators have pointed out that this government should not be considered a ‘formal minority government’ in the sense that Strom (1990) has used, as the PSOE did not make a formal legislative support agreement with the ERC or IU (Field, 2008, 43). Although the second PSOE-led government of 2008-2011 was short of 7 seats of a majority and the government’s investiture did rely on abstention by the many of the smaller parties, Zapatero explicitly refused to make any legislative agreements with smaller parties and sought to govern alone.

13
fluctuated, or even trended downwards overtime, not what we would expect if institutional
decentralization were driving a process of regional party system fragmentation.
The most notable variation in the Gini coefficient trends is between parties. In particular, there are
substantial differences between the two largest parties- between the UCD and PSOE in 1978 and
1979 elections, and between the PP and the PSOE thereafter. The PSOE has a much higher degree of
nationalization. It receives a more homogenous share of the vote in each region than the UCD or PP
as well as being much more competitive in the regions with large support for autonomist or
nationalist parties – Catalonia, the Basque Region and the Canary Islands.
FIGURE 4: TIME SERIES OF EVOLUTION OF GINI COEFFICIENT OF VOTE SHARE OF MAIN PARTIES 1978-2008
Notes: (1) y-axis: Gini coefficient of vote share of parties in general elections to legislative lower house weighted by district vote share as % national total (2) Acronyms: PP = Party Popular; PSOE= Partido Socialist Obrero Espanol; UCD=Union Centro Democratia; PSNS = Party System Nationalization Score; PNG = Party Nationalization of Government (3) The vertical dotted lines indicate periods of consecutive terms of office for each party.
14
As outlined above, we expect this geographical dispersion to matter for public policy considerations.
We test whether the level of nationalization of the government incumbent party matters for how
public infrastructure investment is distributed between Provinces. In line with previous theoretical
expectations, we anticipate that the allocation of investment is likely to be better predicted by
‘programmatic criteria’ – primarily those relating to either the efficiency or equity of investment –
under governments whose parties have a ‘high nationalization’ to those with a lower nationalization.
We expect that tactical ‘pork barrel’ considerations better predict the allocation of public investment
under governments with lower nationalization.
How to define these tactical considerations is a difficult task. However generally, tactical
considerations are considered to be electoral or political. Parties in government that receive a more
heterogeneous vote share throughout districts and that are only very minor players in some regions
of the country – such as PP or its predecessor the UCD – are more likely to:
a) be able to rely on pork-barrel projects to bolster support in either core or marginal districts
because they are less restrained having to develop a reputation for geographical fairness and fiscal
rectitude and
b) they have less incentive to evenly distribute spending throughout all districts and regions, as
spending in opposition districts/regions that are not marginal is likely to be ineffective as a means of
bolstering support.
We test this proposition – parties with greater nationalization are more prone to programmatic
spending and allocation, and parties with lower nationalization are more prone to tactical spending
and allocation – by observing the allocation of roads expenditure between electoral districts
(Provinces) by each of these parties when they compose government.
We also investigate the effects that regional party participation in government ‘coalitions’ (as
support for minority governments) has on distribution to the regions they represent. We describe
these regions as ‘pivotal’ when their representative regional parties are essential for government
survival. In practice, pivotal regions are Catalonia and the Basque Region – during the PSOE minority
government 1993-1996 – to which we add the Canaries Region during the PP coalition government
1996-2000. Provinces in Catalonia are considered pivotal during the PSOE minority government
2004-2008, as the Catalan Republican Party was essential to government investiture and stability
during this period3. The expectations are that being a pivotal region should significantly increase the
3 During the González government of 1989–1993, the PSOE was short of one seat of an overall majority with
the Canarian Coalition providing its support. However this is not considered a ‘pivotal’ region during this government, as in reality the PSOE relied more heavily upon other legislative partners, such the United Left Coalition, for stability.
15
amount of investment funds dedicated to districts in these regions during this period. In the
terminology of the analysis, these regions should be ‘disproportionally’ favoured in their allocations
of investment. However, outside of this period we expect – especially for the duration of the UCD
(1978-1982) and PP (2000-2004) single party governments – that districts in these regions should be
‘disproportionately’ disfavoured in investment from central government. As we alluded to above,
this expectation is due to the historically low support these parties have gained in these regions.
4. Interpretative Framework: Is Infrastructure Allocation Driven by
Programmatic or Tactical Redistribution?
Infrastructure investment, especially when decided at central government, level is usually highly
redistributive. The regional allocation of infrastructure investment acts to redistribute money from
certain regions (those that pay taxes) to others (those in which the investment is made (Solé-Ollé,
2008). In line with Dixit and Londregan’s conceptualisation (1996), we identify two distinct forms of
redistributive policy: Tactical and Programmatic.
In ‘Tactical redistribution’, known as pork barrel politics in the US or particularistic spending
elsewhere, decisions over allocations are based on the political or electoral productivity of
investment. As Solé-Ollé (2008, 5) describes, the politicians’ (parties’) implicit allocation criterion
behind this form of redistribution is simply: ‘If I [we] invest in this region, am I [are we] more likely to
retain power’.
In ‘Programmatic redistribution’ the government withdraws resources from certain regions and
redistributes them to others based on ‘objective’ economic criteria. It is not clear what ‘objective’
criteria mean in this case since infrastructure investment could be directed either to regions with
high project impact (efficiency criteria) or to regions with low output levels to foster economic
convergence or regional development (equity criteria). Programmatic allocations may be decided
upon with possibly either policy motives or electoral considerations in mind, but subject to certain
legislative or constitutional constraints that ensure universal individual eligibility regardless of
geography. Programmatic redistribution usually has public good qualities in that redistribution is
from a given class of beneficiaries to another (e.g. from rich to poor regions) but within the class of
beneficiaries, particular regions that qualify cannot be excluded.
As Solé-Ollé discerns (2008, 6), under Programmatic redistribution the central government does not
directly choose the amount of money sent to each district, but sets broad policy objectives with
16
regards redistribution, which can be considered the responsiveness of investment to levels of
income. ‘Programmatic considerations’ can be thought of as those that governments make in setting
the formulae funding for geographic allocation (see Smith, 2007). We expect that government
ideology will be the largest determining factor of these programmatic considerations.
Right wing parties are expected to prioritize efficiency criteria in investment allocation, while left-
wing parties are expected to prioritize equity or income redistribution in investment allocation
(Cadot et al., 2006). Efficiency criteria emphasis the impact of investment on aggregate output
rather than on broadly ensuring equal distribution of infrastructure stock across areas or on using
infrastructure investment as part of a regional development or regional adjustment policy aimed at
convergence of regional output.
Communities with a higher marginal productivity of public investment are typically those with higher
income levels and effective infrastructure endowments (de la Fuente et al., 1995, 32). As
Kemmerling and Stephan (2010, 279) describe, in practice following an efficiency criteria tends to
imply that governments invest where there are more users of the infrastructure (i.e. more cars,
trucks or miles driven) which basically means investing in rich regions or where there is a lower stock
of capital (i.e. a region is ‘rich’ but already has the appropriate road stock it might not obtain more
investment).
Equity criterion on the other hand, emphasizes regional development priorities. Such programmatic
criteria aim to promote growth of poorer regions of a country to reduce or eliminate any locational
component of inequality in which people of similar characteristics have different incomes depending
on place of residence. They may also act as regional adjustment policies where the policy aim is to
help regions cope with transitory difficulties arising, for example, from adverse sectorial shocks (de
la Fuente et al., 1995, 32)
The regional development and ‘new economic geography’ literature generally recognises an
efficiency/ equity trade-off in the allocation of public investment (see Puga, 2002; de la Fuente
2002). As de la Fuente et al. (1995, 15) highlight, regional development policies that emphasize
equity and redistribution are nothing more than the territorial expression of two of the guiding
principles of public intervention in the welfare state: the reduction of inequality and the provision of
social insurance against diversifiable risks. However, such a policy may involve an efficiency cost in
terms of reducing aggregate income (nation-wide) below its potential. Focusing on regional
development instead of efficiency could discourage the concentration of specialized firms in large
urban regions, for instance, decreasing output growth due to agglomeration (Puga, 2002; Barca et al.
2011). This is documented in the case of Spain, by de la Fuente (2004), who finds that substantial

17
investments in the poorer regions did result in convergence in income, but at the cost of reducing
overall national growth.
We investigate the distribution of infrastructure investment between provinces according to the
Programmatic versus Tactical conceptualization. Broadly, three research questions attempt to
characterize investment priorities of individual governments:
1. Is infrastructure Investment being directed to the regions with higher project's impact thus following
an efficiency criterion?
2. Is investment being devoted to regions with low output levels thus following a (equity-based)
redistribution logic?
3. Alternatively, is investment being devoted to regions where the political productivity of investment
is highest?
The coefficients of the Efficiency/Equity variables (Capital stock endowment and GDP per capita in
each Province ) and structural variables (land area, population size and population density) will tell
us whether two electoral districts that are equal on economic terms (e.g. same GDP per capita and
same structural traits) receive the level of investment and, if this is not the case, the political
variables that correlate with some districts receiving more money than others despite their similarity
in terms of objective criteria (Solé-Ollé, 2008, 9).
If neither efficiency or equity criteria nor other ‘economic criteria’ of province can account for the
observed investment a province receives in a given year, we then turn to the ‘tactical criteria’ to see
what are the political drivers of infrastructure investment allocations. Evidence of particularistic or
pork-barrel spending (tactical redistribution) is if differences in levels of investment (between
districts that are economically equal) are correlated with differences in their inferred ‘political
productivity’.
The ‘political productivity’ of a province is proxied by a number of political variables that are
designed to indicate the potential electoral and lobbying influences of a particular district (see
Schady, 1995; Cadot et al., 2006). The ‘electoral power’ of a district depends upon whether a given
level of net transfers sways some voters in favour of the incumbent more easily than others
(whether it is a core or a swing/marginal district). The ‘lobbying power’ of a district depends on
whether its representatives have disproportional influence in government stability (in the case of
Spain this means if district elects a regional party supporting the government or if the district is
malapportioned). The estimates of electoral and lobbying influences should be seen as
complementary rather than as a test of one hypothesis against the other (Cadot et al., 2006, 1136).

18
5. Theorizing Tactical Redistribution: Who Receives Allocations?
The main theoretical models of tactical redistribution are those of Lindbeck and Weibull (1987) and
Cox and McCubbins (1986). Both are office seeking models of political distribution that seek to
define what the most rational distributive strategy is for politicians seeking to be re-elected. The
main empirical prediction of the first model is that monies will flow to swing districts where there
are a high proportion of swing voters. A swing voter is simply a voter whose attachment to her own
party is weak enough that a sufficiently large material inducement could entice her to vote for the
alternative party. The Cox and McCubbins model, by contrast, predicts that parties are risk adverse
in their distributive strategies and lack information to target swing voters. Hence, in this model they
target their core vote supporters.
The Dixit and Londregan model (1996) is often seen as a synergy of the Lindbeck and Weibull and
Cox and McCubbins models. As Golden and Min (2013, 78) describe in their comprehensive review
of the distributive politics literature, this model provides the main theoretical micro-foundations for
studies of distributive politics. Drawing on it, a considerable number of empirical articles investigate
whether core or swing voters receive more allocations by politicians. The main implication of the
model is that since voters with strong partisan attachments require larger transfers to vote for the
other party, in the game of distributive politics parties compete for political moderates. In Dixit-
Londregan, rational politicians are usually expected to engage in symmetrical strategies in which all
target swing voters.
However, in some situations politicians allocate goods to core voters with strong partisan
preferences. This type of particularistic spending, sometimes referred to as ‘Machine politics’ occurs
when a party has a substantial information advantage about its constituents and is able to precisely
target goods to specific individuals (ibid, 79). The rationale for allocating goods to one’s core
constituents is that the transfers can be precisely targeted due to informational advantages by
parties and there is effectively no waste.
Our analysis is relatively agnostic about whether tactical distribution aimed at re-election should be
towards swing or core districts. In some senses, it is difficult to know what a ‘swing district’ is under
a PR system with large district magnitude, as is the case in Spain. Indeed, as many theoretical
perspectives suggest (Besley and Case, 2003) – and most empirical applications investigating the
problem of targeting transfers to groups of voters imply – whether parties target core or swing
voters depends upon a number of contextual factors and likely varies from election to election.
19
The prediction central for our theoretical purposes is that parties with lower nationalization should
engage in more tactical spending overall, either to swing or to core districts, while parties with
higher nationalization should be less engaged in tactical spending.
Given this theoretical ambiguity we perform a descriptive exercise to ensure our empirical models
are specified correctly, checking the validity of our assumptions that there is essentially a linear
relationship between a district’s political affiliation and the level of investment it receives. For
instance, if there is essentially a curvilinear relationship (as the swing district argument would
suggest) between political affiliation and investment, then a linear specification would be
inappropriate. This situation might occur if, for example, districts at a particular ‘cut-point’ (such as
about 40% vote share for the incumbent party) consistently receive the maximum allocation of
investment, and core districts that vote in higher numbers for the incumbent party (say about 50%)
are systematically disfavoured with investment.
We graph the relationship between government incumbent party vote share in each district and the
amount of investment it receives in a given year and fit a (non-parametric) smoothing spline, which
fits a local regression line through the scatterplot (Green and Silverman, 1994). The purpose of this
exercise is to check the assumption that the responsiveness of investment to each district based on
its vote share is essentially linear in form, across different time periods.
The results of this analysis are presented in Figure 5 below. As we can see, for the first two
governments of the democratic period led by the UCD party (1978-1982), the relationship is highly
linear and symmetric. For the other two party periods- the PSOE governments (1983-1996 and 2005-
2010) and the PP governments (1996-2004), the relationship appears to be flatter on the left side (at
low levels of incumbent vote share). However, for the allocation of investment to be consistent with
the statics of the swing voter model we would expect there to be a concave relationship between
vote share and investment where the smoothing spline of investment should peak around a median
density cut-point and show a decline in investment towards core districts. There is little evidence of
this being the case. For the PP governments, we see a clearer pattern of a spike in investment
towards districts at the upper end of their vote share but not the decline in investment towards at
the higher end of their vote share.
For a true test of the swing voter versus the core voter models, one requires election data at the
individual level. Data is required on the number of voters in each district that are at the ideological
‘cut-point’ between the two largest (left and right wing) parties. Districts with larger number of
these voters should receive the largest transfers as these voters are most amenable to shifting their
vote in response to material inducements. However, given that this type of data is difficult to collect
20
and very infrequently available most studies of politically motivated geographical allocation
conceptualise districts at this ‘cut-point’ as those that are either the most competitive between the
two largest parties or alternatively those where the incumbent is most ‘at risk’ of winning or losing
an additional seats.
The empirical analysis in this section suggests that linear estimation of the relationship between
incumbent vote share and allocated investment is a good approximation, and a lot less arbitrary
than choosing a cut-point density for swing districts. To approximate the swing district hypothesis
we use a variable, Vote Margin that indicates the absolute difference in vote share between the
incumbent party and the main opposition party in each district at the previous election.

21
FIGURE 5: RELATIONSHIP BETWEEN INVESTMENT (PER CAPITA) AND INCUMBENT VOTE SHARE IN
SPAIN, SMOOTHING SPLINE FOR DIFFERENT PARTY-PERIODS
Notes: (1) x-axis: district vote share of incumbent party; y-axis: yearly investment per capita allocated to each district (2) Graph is smoothed and dots represent distinct points used as knots in piecewise smoothing; 3) Periods correspond to each parties’ control of government executive; 4) Estimation method: smoothing spline.
22
As well as the effect of incumbent vote share (Incumbent Vote) and the difference between the two
largest parties (Vote Margin), the analysis also investigates the influence of additional political
variables on the allocation of funds to districts. Firstly, we investigate the influence of legislative
malapportionment: the fewer votes are needed to win a seat the ‘cheaper’ a seat is to buy via pork-
barrel spending. This has been found to be an important variable in some contexts in determining
the size of inter-government grants to a particular district or region (e.g. see Rodden, 2010; Gibson
and Calvo 2000; Ames, 1995).
Secondly, partisan alignment between central and regional governments could also be an important
determinant. Credit claiming for a particular project is more electorally productive if both the
regional and central government can claim credit simultaneously (see Kemmerling and Stephan,
2010). This alignment logic may be more applicable to intergovernmental grants than direct
expenditures however it could also be important.
Finally, we investigate the impact of regional parties explicitly, considering the regions they
represent as pivotal regions if these parties are participating in government coalition or if they are
essential to the survival of a minority government.
6. Empirical Design
To test the main hypothesis, that party nationalization has a significant bearing on the incentives and
ability of parties to engage in tactically targeted allocations of investment spending rather than
programmatic spending, we consider two sets of models. The first set of models is run on the entire
sample period, with the unit of analysis the yearly roads investment in each province by central
government. The second set of models is run on sample subsets, with each sub-period covering a
term of office of each of the 10 governments that were elected and formed between 1978 and 2010.
The full sample period models explicitly test the hypothesis that lower party nationalization of the
government executive is associated with increased spending on physical infrastructure in either core
party strongholds or swing districts, controlling for a set of economic covariates. The sub-period
models more explicitly probe which political variables are most important in explaining expenditure
allocations to particular districts above what we would expect given their objective economic
characteristics, and whether this type of tactical political expenditure was more important during
some government periods than others.
The basic underlying equation will look like:

23
𝑖𝐽,𝑇 = 𝛼 + 𝛽1𝑍𝐽,𝑃 + 𝛽2𝐾𝐽,𝑇−1 + 𝛽3𝑌𝐽,𝑇−1 + 𝛽4𝑋𝐽,𝑇 + 𝜇𝐽,𝑇 (1)
Where Z= vector of political variables, K= capital stock per capita available at the end of the previous
year, Y= income per capita lagged by one year, X= vector of other structural controls, and 𝜇= error
term. The subscript J indicates electoral district, T indicates year, and P each terms of office. Note
that the coefficients β1….β4 are assumed to be period specific; the expectation that these
coefficients (or at least some of them) are not stable over time is the reason we choose to estimate
the model by sub-periods in addition to the full sample model. Note that the political variables are
not indexed by T, but only by P meaning that most of them do not show variation during the term of
office. This is also the main reason for not including district fixed effects in the equation. While this
may entail some loss of consistency, the vector X includes some district characteristics that are fixed
in time (e.g. land area), therefore ‘soaking up’ the unobserved district characteristics.
In the case of election years, we consider that the investment allocated is made by the government
in place prior to the election. This is reasonable since most voted expenditure allocations take place
early in the year, and are difficult (but not impossible) to alter prior to the scheduled annual budget.
To reiterate, the interpretation of this model will tell us whether two electoral districts with the
same capital stock per capita, Kt-1, the same income per capital, Yt-1, and same structural traits, X,
receive the same level of investment. If this is not the case, which political variables influence why
some districts receive more expenditure that others, even where their objective economic criteria
does not suggest that this should be the case (Solé-Ollé, 2008).
The first set of models using the full sample period, is estimated using a Hausman-Taylor (HT)
estimator. The HT estimation technique provides an alternative to the ‘all-or-nothing’ approach to
panel data regarding the correlation between the regressors (Xit) and the unobservable individual
specific effect (ait) (Baltagi et al. 2003, 361).
The HT estimator relaxes the hypothesis of exogenous regressors that is assumed by GLS random
effects methods but unlike the Fixed Effects estimator, it can handle endogenous time invariant
explanatory variables in the regression equation. The estimation of the causal effect cannot rely on
Fixed (unit) effects since time invariant regressors are eliminated by the within and first difference
transformations. A random effects model may be inappropriate since the exogeneity assumption
underpinning random effects method is unrealistic due to correlations between the regressors and
unobserved heterogeneity. We assume that the unobserved unit effects are fixed through time.
The HT estimator is an instrumental variable estimator without external instruments. The
distinguishing feature of this model is found in the assumptions on the correlation between the
individual unit specific effect and the sets of time-varying and time-invariant regressors. The

24
exogenous variables, i.e. the variables that are uncorrelated with unobserved individual unit effect,
serve as their own instruments. The time-varying endogenous variables are instrumented by the
deviation from individual means and the time-invariant endogenous variables are instrumented by
the individual average of the exogenous time variant variables.
The model is specified in a two-part formula, the second part containing the exogenous variables
that are assumed to be correlated with the random effects and used as instruments. The time
varying exogenous variables used as the instruments are population density, vote seat ratio and GDP
capita at t-1. All variables are at the district level and measured in logarithm. The total area (km2) of
each district is used as the time invariant exogenous variable. A Hausman test comparing the HT-
model with a Fixed (within) Effect model is non-significant, indicating the appropriateness of the
exogeneity assumptions for the instruments in the HT model (Baltagi, 2005, 132).
For the sub-period models, we adopt a different methodology since with shorter time periods the
individual unit heterogeneity and exogeneity assumptions required for the shorter panels are less
unrealistic. As well as this, the subset models do not include the lagged dependent variable on the
right hand side of the model due to a lack of degrees of freedom, so we need to take into account
time dynamics. In these specifications we estimate the models via GLS with random effects and a
first order autoregressive disturbance (AR1).
7. Data and Variables
In this section, we describe the variables used in the empirical analysis as well as the sources they
are drawn from. The data for each variable was obtained for the Spanish provincial level (the
electoral district level in Spain), which means that we have information for 50 provinces from 1978-
2010. We exclude the autonomous cities of Ceuta and Melilla due to concerns over the
comparability of these jurisdictions with others in Spain, and due to historical administrative
boundary changes of these units which make attempts to separately parse the data for each unit
unreliable. This gives us balanced sample of 1650 observations. The main variables are described
below.
7.1 Dependent Variable
The infrastructure data used only includes expenditure by central government on large roads and
highways. This is for several reasons to do with controlling for cross-district functionality (not all
types of infrastructure spending are applicable to all districts) and the effects of fiscal

25
decentralization as mentioned above. It is also because the infrastructure stock data for public roads
capital is the most comprehensive and complete. The data comes from the database elaborated by
and available through the research organization Foundation BBVA (FBBVA) and collected by the
Spanish Ministry of Public Works and Transport. Investment effort by central government in each
district is the main dependent variable, measured as a percentage of capital stock in existence at the
end of the previous year. Generally, roads investment accounts for more than half of transportation
investment in a given year (Castells and Solle-Ole, 2005, 1178).
We choose to measure infrastructure investment as a percentage of existing capital stock compared
to several possible alternatives. Other studies have used alternative measures such as percentage
year on year change in value of capital stock (Kemmerling and Stephan, 2010; Burgess et al., 2010)
or the monetary value of investment per capita (Alabate et al., 2012). It is likely our measure
captures variable infrastructure needs across jurisdictions that this latter measure does not. For
instance, measuring investment effort as per capita investment ignores potential variations in capital
depreciation across jurisdictions. The former measure suffers from the problem that the value of
capital stock may not always accurately reflect changes in central government investment, but could
equally reflect variations in productivity or procurement across jurisdictions (Golden and Picci,
2005). As Solé-Ollé asserts (2010, 303), measuring investment as a percentage of existing stock
introduces an error correction mechanism into the regression analysis, where the investment
‘adjusts’ to deviations in investment in response to a disequilibrium between the previous capital
stock and other determinants.
Figure 6 shows a time plot of the investment effort made by central government expressed as a
percentage of the existing capital (roads) stock at the end of the previous year, and also expressed as
a percentage of real GDP (current prices). We can see that spending measured as a percentage of
both denominators declined with the arrival of democracy in 1978, and experienced an abrupt
increase with the election of the left-wing PSOE in 1982. The PSOE period of government from 1982-
1996 undertook a sustained, substantial increase in infrastructure investment (despite a dip in
investment due to deficit reduction policies of the Gonzalez government in 1984-1986). Following
the election of the right-wing PP government in 1996, investment dipped below 1.2% GDP and
remained relatively stable until 2000, when it decreased again owning to the deficit reduction
policies of the PP government. However the PSOE government did not increase investment on its
return to office in 2004, except for a brief increase in investment aimed at fiscal stimulus in 2008
(OECD, 2010).
26
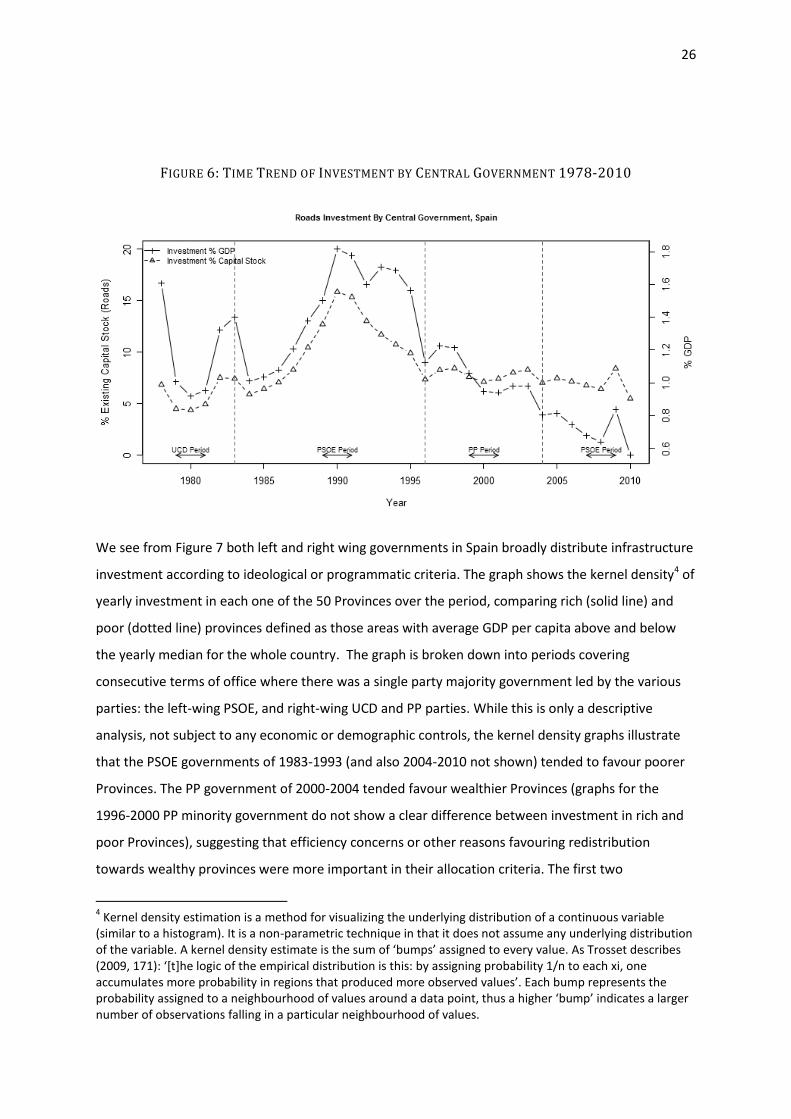
FIGURE 6: TIME TREND OF INVESTMENT BY CENTRAL GOVERNMENT 1978-2010
We see from Figure 7 both left and right wing governments in Spain broadly distribute infrastructure
investment according to ideological or programmatic criteria. The graph shows the kernel density4 of
yearly investment in each one of the 50 Provinces over the period, comparing rich (solid line) and
poor (dotted line) provinces defined as those areas with average GDP per capita above and below
the yearly median for the whole country. The graph is broken down into periods covering
consecutive terms of office where there was a single party majority government led by the various
parties: the left-wing PSOE, and right-wing UCD and PP parties. While this is only a descriptive
analysis, not subject to any economic or demographic controls, the kernel density graphs illustrate
that the PSOE governments of 1983-1993 (and also 2004-2010 not shown) tended to favour poorer
Provinces. The PP government of 2000-2004 tended favour wealthier Provinces (graphs for the
1996-2000 PP minority government do not show a clear difference between investment in rich and
poor Provinces), suggesting that efficiency concerns or other reasons favouring redistribution
towards wealthy provinces were more important in their allocation criteria. The first two
4 Kernel density estimation is a method for visualizing the underlying distribution of a continuous variable
(similar to a histogram). It is a non-parametric technique in that it does not assume any underlying distribution of the variable. A kernel density estimate is the sum of ‘bumps’ assigned to every value. As Trosset describes (2009, 171): ‘[t]he logic of the empirical distribution is this: by assigning probability 1/n to each xi, one accumulates more probability in regions that produced more observed values’. Each bump represents the probability assigned to a neighbourhood of values around a data point, thus a higher ‘bump’ indicates a larger number of observations falling in a particular neighbourhood of values.

27
governments of post-Franco Spain, controlled by the right-wing UCD did not tend to favour wealthy
provinces above the median income, and indeed appeared to redistribute towards poorer regions,
as others have also found (Solé-Ollé, 2010; de la Fuente, 2004). Although not presented here, the
graphs are roughly the same if we measure capital investment per capita.
FIGURE 7: PROGRAMMATIC REGIONAL REDISTRIBUTION, VARIOUS PARTIES IN GOVERNMENT.
Notes: (1) x-axis= Yearly roads Investment allocated to each district by central government (as % capital roads stock); y-axis= kernel density estimation (2) Poor/rich= Provincial GDP per capita below /above yearly median (3) Period 1 = UCD single majority party governments; period 2= PSOE single party majority governments; Period 3 = PP single party majority government; period 4= full democratic period 1978 until 2010.

28
7.2 Independent Variables
7.2.1. Economic Variables
The net capital stock (Roads) also comes from the FBBVA and is measured at 2005 prices. This
variable measures the overall estimated value existing capital stock of roads in each province less
estimated annual depreciation. The stock variable is used to compute the investment effort and also
as a control variable. The coefficient on the capital stock will indicate whether a province with a
higher endowment of transport infrastructure receives a higher or lower degree of expenditure. If a
government follows efficiency criteria (i.e. spending money where it is expected to have the greatest
impact on economic output) the coefficient of this variable should be positive. The stock variable
enters into the model with a lag of 1 year, indicating the capital stock available at the end of the
previous year.
The other economic controls included are: income per capita measured at provincial level,
population density, total land area, and an indicator of the level of responsibilities in the provision of
infrastructure by different regional governments in a given year.
Income per capita is GDP per capita at provincial level, expressed as thousands at 2000 euro prices.
The data comes from two sources, 1980-1995 income data comes from the Spanish National
Statistical Institute (Instituto Nacional de Estadística [INE]) Regional Accounts Database. Data for
1996-2010 come from Eurostat Regional Accounts Database. Data values for 1977-1979 were
imputed using linear interpolation techniques. Exchange rates for Pesos to European Currency Units
come from the IMF International Finance Statistics. The income variable captures whether the
central government invests in poorer or richer regions. To avoid endogeneity, the variable is
included at a lag of one year.
A central assumption adopted in the empirical analysis is that both the Capital Stock variable and the
Income per capita variable can substitute for level of utilization of infrastructure services. Since we
do not have data on roads utilization for the whole period, we assume that the wealthier a province
is the higher its infrastructure utilization rates. In other words the assumption that is critical to the
analysis is that there is a close positive correlation between measures of traffic congestion, volume
and usage (e.g. vehicle stock, miles driven, haulage intensity). While not ideal, it is a reasonable
assumption to make as it is fairly established that at the regional level, GDP growth and level tracks
growth and intensity of freight transport, which is the single largest contributor to capital
depreciation i.e. GDP growth gives us useful proxy for potential marginal output or need for
infrastructure investment based on intensity of use (see Garcia et al. 2008). The assumption is

29
frequently used in studies of the determinants of the regional allocation of infrastructure investment
(e.g. Alabate et al. 2012; Solé-Ollé, 2008; de la Fuente et al. 1995).
Some demographic and geographical variables are included to capture variable cost and demand.
Population density of each province is included as a measure of infrastructure demand. Population is
measured in thousands, and was obtained from the INE (various censuses). Population density
should in general decrease the cost of infrastructure investment per capita (Estache and Sinha,
1999) as dense, urban areas often have cost-advantages in providing infrastructure services.
However a relatively unexplored issue is that – specifically due to this cost advantage in the
provision of public goods – urban jurisdictions may optimally receive larger grants per capita than
rural areas. There is some evidence in European cities that this is the case (Dragu and Rodden, 2011,
7). In any case, population density is an important cost control in the analysis.
Total population is used as a measure of transport demand in each province, and it should increase
infrastructure investment per province. It enters the model as a denominator of the existing capital
stock.
Total Area of each Province in km2 is included as a measure of Province size. Larger provinces may
increase investment in infrastructure however this is highly co-linear with population density and is
excluded from the sub-period models. Without this variable we still have confidence in the estimates
owning the measurement of the dependent variable as a percentage of existing capital stock, rather
than as a monetary value.
The level of responsibilities variable is a dummy variable is taken from Alabate et al. (2012). It
indicates that the regional governments of Navarra and the Basque Country had greater
responsibility over primary roads in the period considered. The remaining regional governments only
had responsibility for secondary roads. The dummy variable should have a negative impact on the
spending by central government in Provinces of these two regions.
7.2.2 Political Variables
This section describes, firstly, the measurement of the main political independent variables used in
the full sample model; and secondly, it describes the political variables used as independent
variables in the various sub-period models, which attempt to measure the amount of tactical
redistribution each party engaged in during their term of office.
The main independent variable of interest is the degree of Party Nationalization of the Government
Executive (PNG). In the full sample model, this variable is used in an interaction term to discern if

30
governments with low nationalization are more prone to tactical distribution. PNG is interacted in
separate models with the vote share of the incumbent party in each district, designed to show the
responsiveness of investment to ‘party strongholds’ at different levels of party nationalization.
In addition, in a separate model PNG is interacted with a dummy variable that indicates whether a
district was a ‘swing’ district at the last election. A swing district is defined as one where there is less
than 5% absolute difference separating the two largest parties.
The information for these variables – and all the political variables (except Alignment) – comes from
the Spanish Ministry of Interior. Importantly, the PNG can only give us an indication whether periods
in which the government was occupied by either a single party with a low nationalization (such as
the UCD or PP) or was occupied by a (informal) coalition which included regional parties, which by
definition have extremely low nationalization, were more prone to delivering funding towards either
core or marginal districts. It does not make sense to include this variable in the sub-period models as
it does not vary over the period of office.
TABLE 2: DESCRIPTIVE STATISTICS OF VARIABLES USED IN EMPIRICAL ANALYSIS
Statistic Mean St. Dev. Min Max
Investment% capital stock 8.71 5.20 0.97 53.62
Investment per capita (euro) 187 159 7 1,443
Provincial GDP per capita (euro) 11,778 6,983 1,832.12 40,120.31
Capital Stock Value (millions, euro) 1,348 1,059 189.44 8,151.24
Area (Km-sq.) 10,042 4,874 1,560.10 21,766.30
Population Density (per Km-sq.) 121 160 8 795
Vote: Seats Ratio (thousands) 55,707 15,774 18,169 100,309
Incumbent District Vote (%) 41.97 10.22 0.00 67.53
Incumbent District Vote Margin (abs %) 14.07 10.46 0.08 53.41
PNG (Gini Coef.) 0.85 0.05 0.76 0.93
PSNS (Gini Coef.) 0.83 0.02 0.81 0.87
Aligned Regional Govs. Aligned 38% non-Aligned 62%
Pivotal Districts N= 80
We include five political variables that are hypothesized to influence government allocations across
provinces: Vote Margin, Incumbent Vote Share, Pivotal, and Alignment. These variables are included
in models estimated on samples covering the time periods by term of office.
The first variable is vote share of the incumbent government party as percentage of total district
vote in each electoral district at the preceding election. This variable measures the extent to which

31
parties divert funds towards political strongholds i.e. those provinces where they have a strong
electoral position relative to other parties.
The alternative electoral distributive tactic is to divert particularistic funds towards marginal or
swing districts, where additional spending has a disproportionate effect on the election outcome if it
can sway a small number of undecided or floating voters. As stated above, the theoretical
underpinnings of the ‘swing district hypothesis’ are shaky outside of the conventional first-past-the-
post context. In a proportional representation electoral system with large district magnitudes, it is
difficult to operationalise the notion of a swing district. The conventional approach is to use a
measure of marginality or district competitiveness. We define the variable Vote Margin as the
absolute difference between the two largest parties at the previous election, measured on a
continuous scale. Due to the high co-linearity of Incumbent Vote share and Vote Margin both
variables are not included in the models at the same time.
The third political variable included is the district vote to seats ratio (logged). This variable measures
the apportionment of seats to votes in each district. A higher seat to vote ratio reduces the amount
of votes it takes to win an additional seat, and increases the probability that a small number of
voters can sway an electoral race. A higher malapportionment of a district should increase the
investment a district receives (across all periods).
The fourth political variable is a dummy variable pivotal, indicating if any of the regional parties that
gain support in an electoral district are participating in government. This variable is discussed further
below.
The final political variable is a dummy variable indicating whether the regional government is or is
not aligned with the central government. Many fiscal federalism and political economy studies argue
that regions with governments that are aligned with the central level are likely to be favoured in
inter-regional fiscal redistribution, for credit-claiming purposes. Some scholars argue that favouring
regions with aligned partisans in power is a more likely political distributive strategy than targeting
swing districts in highly decentralized settings, as central government actors are less able to reap the
rewards from distributing regional finance (Leon, 2010; Kemmerling and Stephan, 2002).
We enter this variable in the full sample models as a control. However, since it is likely that this
variable makes more sense at the Regional (AC) level than at the electoral district (Provincial) level,
and since it is co-linear with Incumbent vote share of each district, we include this in a separate
model with variables aggregated at the Regional level.
We used different methods to determine whether governments are aligned. The first is the most
straightforward method, where two governments are aligned if they are controlled by the same

32
party (either as a single party majority/minority government or as a leader of a coalition). A second
approach suggest by Solé-Ollé and Sorribas-Navarro (2008), is to measure alignment on a categorical
scale, with maximum values indicating that both central and regional governments are controlled by
single party majorities, intermediate values indicating if one or more coalition partners in central
and regional government match, and no alignment indicating that no parties in control of either
government match. We used both approaches and found marginal differences using either measure.
The simple, former measure attains greater significance and this is the one presented.
8. Empirical Results
8.2 Models Estimated Using Full Sample Period 1978-2010
Table 2 and 3 presents the descriptive statistics and the correlation matrix for the main variables.
From Table 2, we can see that there is significant variability in the main regressors. In Table 3, notice
that there is significant co-linearity between some of the main political variables. This is hardly
surprising as many of the political variables measure similar phenomena.
TABLE 3: CORRELATION MATRIX OF VARIABLES INCLUDED IN ANALYSIS
Investment Investment
Per
Capita
GDP
Per
capita
Capital
Stock
Area
Density
Votes
/Seats
Incumbent
Vote
Vote
Margin
PNG
PSNS
Align-
ment
Pivotal
Investment 1
Investment
pc
0.505 1
GDP
pc -0.134 0.328 1
Capital
Stock
-0.083 0.015 0.573 1
Area 0.073 0.155 -0.165 -0.115 1
Density 0.038 0.480 -0.063 -0.389 0.516 1
Votes/Seats -0.033 -0.297 0.283 0.719 -0.04 -0.690 1
Incumbent
Vote
0.106 0.014 -0.104 -0.119 0.35 0.194 -0.018
1
Vote
Margin
0.092 -0.134 -0.197 -0.106 -0.00 -0.034 -0.078
0.555 1
PNG 0.077 0.087 0.378 0.138 -0.00 -0.012 0.108 0.065 -0.004 1
PSNS -0.191 0.210 0.645 0.390 -0.00 -0.007 0.265 0.114 -0.116 0.201 1
Alignment 0.122 0.071 -0.076 -0.112 0.23 0.188 -0.074
0.447 0.258 0.037 0.147 1
Pivotal -0.007 0.027 0.101 0.136 -0.22 -0.139 0.048 -0.329 -0.039 -0.27 0.100 -0.079 1
Table 4 below presents the results from three models estimated upon the full sample period. The
interaction terms in the three models are the main variables of interest in the full sample models.
33
The first model interacts the vote share of the incumbent party obtained in each electoral district
(from the previous election) with the level of nationalization of the party (or parties) composing
government during that period. The model is designed to test the notion that the more highly
nationalized parties are less likely to favour their core districts with infrastructure spending; while
governments with less nationalized parties are more likely to favour their core districts with
infrastructure spending. This hypothesis receives support in the models.
Model 1 indicates that during time periods where the parties in government have high levels of
nationalization (PNG= 0.90); core districts are not favoured to a significant extent. In fact at high
levels of PNG, the incumbent vote share of a district has a slightly negative association with
investment, indicating that government parties with higher nationalization (0.95 or higher) do not
tend to favour their core constituencies with distributive spending. However the picture is less clear
at the lower end of observed government party nationalization (0.80 or lower). The slope of the
coefficient on the interaction term at low values is basically flat, indicating the party ‘colour’ of a
district does not have a bearing on the distribution of infrastructure spending, when parties with low
nationalization occupy office (Figure 8 presented in the appendix graphs the interaction effect from
Model 1). The confidence intervals of this line however are large, making it statistically non-
significant. This indicates that at the lower end of PNG, district vote share has no predictive power
on the amount of infrastructure spending a district receives.
A possible explanation for this could be due to the fact that Spanish governments with low
nationalization are those that include regionalist parties that have the coalition bargaining power to
shape infrastructure allocation towards districts in their home regions rather than the core districts
of the main government party. These districts tend to have a low vote share for the main incumbent
party.
We investigate this proposition in the Model 2 by including an indicator variable for each district in a
region that elects a regionalist party participating in government during these periods. Interestingly,
this is an important variable that that strengthens the association between incumbent party district
vote share and amount of infrastructure investment in a district in a given year. In particular, it has
implications for the strength and direction of the relationship between core district vote and amount
of infrastructure investment during the tenure of a government (coalition) with low party
nationalization. Figure 9 plots the conditional effects of party nationalization on the responsive of
investment to the vote share of the incumbent in each district. As we can see when pivotal district
status is controlled for, the slope of the line becomes positive and significant for low levels of
government party nationalization.
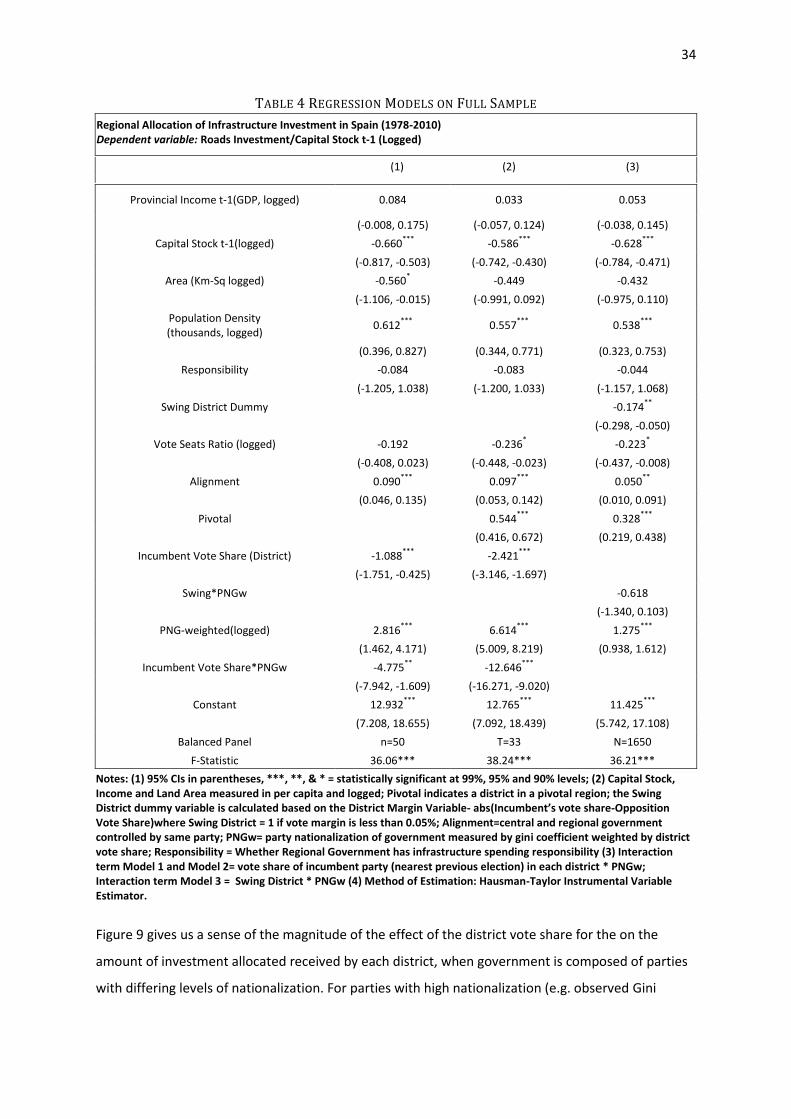
34
TABLE 4 REGRESSION MODELS ON FULL SAMPLE
Regional Allocation of Infrastructure Investment in Spain (1978-2010) Dependent variable: Roads Investment/Capital Stock t-1 (Logged)
(1) (2) (3)
Provincial Income t-1(GDP, logged) 0.084 0.033 0.053
(-0.008, 0.175) (-0.057, 0.124) (-0.038, 0.145)
Capital Stock t-1(logged) -0.660***
-0.586***
-0.628***
(-0.817, -0.503) (-0.742, -0.430) (-0.784, -0.471)
Area (Km-Sq logged) -0.560* -0.449 -0.432
(-1.106, -0.015) (-0.991, 0.092) (-0.975, 0.110)
Population Density (thousands, logged)
0.612***
0.557***
0.538***
(0.396, 0.827) (0.344, 0.771) (0.323, 0.753)
Responsibility -0.084 -0.083 -0.044
(-1.205, 1.038) (-1.200, 1.033) (-1.157, 1.068)
Swing District Dummy
-0.174**
(-0.298, -0.050)
Vote Seats Ratio (logged) -0.192 -0.236* -0.223
*
(-0.408, 0.023) (-0.448, -0.023) (-0.437, -0.008)
Alignment 0.090***
0.097***
0.050**
(0.046, 0.135) (0.053, 0.142) (0.010, 0.091)
Pivotal
0.544***
0.328***
(0.416, 0.672) (0.219, 0.438)
Incumbent Vote Share (District) -1.088***
-2.421***
(-1.751, -0.425) (-3.146, -1.697)
Swing*PNGw
-0.618
(-1.340, 0.103)
PNG-weighted(logged) 2.816***
6.614***
1.275***
(1.462, 4.171) (5.009, 8.219) (0.938, 1.612)
Incumbent Vote Share*PNGw -4.775**
-12.646***
(-7.942, -1.609) (-16.271, -9.020)
Constant 12.932
*** 12.765
*** 11.425
***
(7.208, 18.655) (7.092, 18.439) (5.742, 17.108)
Balanced Panel n=50 T=33 N=1650
F-Statistic 36.06*** 38.24*** 36.21***
Notes: (1) 95% CIs in parentheses, ***, **, & * = statistically significant at 99%, 95% and 90% levels; (2) Capital Stock, Income and Land Area measured in per capita and logged; Pivotal indicates a district in a pivotal region; the Swing District dummy variable is calculated based on the District Margin Variable- abs(Incumbent’s vote share-Opposition Vote Share)where Swing District = 1 if vote margin is less than 0.05%; Alignment=central and regional government controlled by same party; PNGw= party nationalization of government measured by gini coefficient weighted by district vote share; Responsibility = Whether Regional Government has infrastructure spending responsibility (3) Interaction term Model 1 and Model 2= vote share of incumbent party (nearest previous election) in each district * PNGw; Interaction term Model 3 = Swing District * PNGw (4) Method of Estimation: Hausman-Taylor Instrumental Variable Estimator.
Figure 9 gives us a sense of the magnitude of the effect of the district vote share for the on the
amount of investment allocated received by each district, when government is composed of parties
with differing levels of nationalization. For parties with high nationalization (e.g. observed Gini

35
coefficient ~ 0.90), core district strongholds do not appear to be favoured by investment decisions of
central government.
However when parties with lower nationalization compose government, districts that vote for the
incumbent party tend to be favoured disproportionally by investment. The coefficient of the
interaction term is significant at the .01% level, however we can be less confident of this effect for
districts that vote heavily for the incumbent party as the confidence intervals overlap (e.g. give the
incumbent upwards of 50%). Overall, the coefficient suggests that a district giving a mean level of
support to the government party (40%), will receive on average approximately 6% less investment
when the party comprising government is highly nationalized (Gini Coefficient ~ 0.90) than when it is
less nationalized (Gini Coefficient ~ 0.80). Since the mean level of investment per year is around 12%
of existing capital for the sample period, this is a substantial yearly effect.
FIGURE 9: MODEL 2 INTERACTION TERM – RELATIONSHIP BETWEEN INCUMBENT PARTY VOTE SHARE
OF DISTRICT AND AMOUNT OF INVESTMENT RECEIVED IN GIVEN YEAR
Another hypothesised determinant of regional favouritism is whether regionalist parties are pivotal
for government formation and survival. The descriptive statistics presenting investment to these
‘pivotal’ regions over time appear to support this pattern. Figure 10 plots investment efforts towards
these regions before, during and after their respective regionalist parties were pivotal for
government formation. The dotted line represents average investment towards the other 14 regions

36
excluding the pivotal regions. Both per capita roads investment and investment as a percentage of
existing roads stock are plotted to get a rounded picture of the investment effort.
FIGURE 10: TIME SERIES OF INVESTMENT TO DISTRICTS IN PIVOTAL REGIONS 1978-2010
(1) y-axis= log(roads investment) per capita (upper lines) and log(roads investment) as percent existing capital stock (2)Periods demarcated by dotted lines indicate years where regionalist parties were in informal agreements with minority governments led by either PSOE (1993-1996 & 2004-2008) and PP (1996-2000) offering legislative support in exchange for policy input during government tenure; (2) Party Abbreviations: CC = Canarian Coalition; CIU= Convergence and Union; ERC=Republican Left of Catalonia; PNV= Basque Nationalist Party; (4) Other governments received investiture and legislative support from regionalist parties (PP 2000 and PSOE 1989) but either had the legislative majority (e.g. PSOE in 1989 and the PP in 2000) or had enough support from other parties (e.g. PSOE in 2004).
On both measures, both the Canary Islands and Catalonia regions tended to receive below average
investment from the central government. This is also true of the Basque Region for the investment
as percentage capital stock. As we can see, however, during the periods of regionalist party coalition
for each region (between the vertical dotted lines), each region tends to receive either above or
equal to the mean investment allocation. This pattern is especially clear in the case of the Canary
Islands on the capital stock measure. There is a clear spike for the Canary Islands during the 1996-
2000 period when the Canarian Coalition (CC), a regionalist party, provided support for a PP-led
government. In the years after the CC exited from government, this region was allocated investment
substantially below the mean. Both Catalonia and the Basque Region were allocated investment
substantially below the average (as % capital stock) up until the Catalan Convergence and Union

37
(CiU) and the Basque Nationalist Party (PNV) became supporters of the PSOE minority government
in 1993, at which point both regions converged to the mean level of investment.
While Catalonia continued to receive the mean level of investment in the decade subsequent to the
CiU exit from the PP-led coalition in 2000, investment to the Basque region substantially dropped
below the mean for the decade subsequent to the PNV exit from the same coalition in 2000. Model
2 indicates that over the entire period (as a percentage existing capital stock), districts in these
regions received about 1% more investment in the years that ‘their’ respective regionalist parties
were pivotal for government formation. Again, the confidence intervals for this effect are quite large
(between 0.7% and 2%) and clearer picture of the magnitude of the average effects and the variance
across periods is given in the models estimated on specific government periods.
The final model (Model 3) estimated on the full sample is designed to test the hypothesis that
parties with lower nationalization favour swing districts as opposed to their core district strongholds.
This variable had to be estimated in a separate model due to the co-linearity between incumbent
vote share and marginal vote share. For reasons of clarity and interpretation, this model is estimated
using a dummy variable indicating swing vote districts. A swing vote district is a district in which the
majority incumbent party returned less than 5% of the vote share above or below the main
opposition party at the previous election. The substantive results do not change whether the model
is estimated using the continuous variable Swing district dummy variable or whether the original
continuous Vote Margin is used.
The confidence intervals of the coefficient estimated on the interaction term are very wide. This
indicates that the impact of swing district status on the amount of infrastructure investment a
district is allocated in a given year, at different levels of government party nationalization, is non-
significant. This could be interpreted to mean that parties in government both with high and low
values of nationalization, do not appear to favour swing districts when allocating infrastructure
investment. The result could also be consistent with the proposition that district marginality is not a
natural concept in PR elections with large districts or alternatively it could be due to the inadequacy
of the proxy measure: district competitiveness. In any case, the importance of marginality is further
explored in the models estimated on samples covering individual term of office sub-periods which
tell us more about the behaviour of specific governments.
While the full sample model is prone to problems of temporal heterogeneity and as a result we
should possibly have more confidence in the magnitude of effects derived from the sub-period
models, it does give an indication that in Spain, party nationalization has been an important factor in
certain time periods for restraining governments from pursuing regional favouritism in investment.

38
8.3 Models Estimated by Term of Office Sub-Periods
The second formal test of the hypothesis that parties with lower nationalization in government are
more likely to engage in pork-barrel distribution, is provided by the regression models estimated by
individual terms of office for each party. For each term of office (defined below) we ask: ‘Is Tactical
spending more prominent under governments composed of parties that are less nationalized?’
In practice, this means inquiring whether the governments composed of parties with lower
nationalization disproportionally favoured either their core or swing districts during their term in
office. Table 5 presents the pork barrel expectations for individual governments.
The central hypothesis is that the party ‘colour’ of each district should be a larger determinant of
how much investment funding it receives under governments where (a) the majority/plurality party
of government has a relatively low nationalization, and (b) regionalist parties are essential to
government investiture and stability. Alternatively, models are also estimated to check the
hypothesis that districts with the lowest margin of vote between the two largest parties are
preferred under governments with lower nationalization.
TABLE 5: EXPECTATIONS OF DISTRIBUTION BY EACH GOVERNMENT
1 2 3 4 5 6 7 8 9
Period
Main
Govt.
Party
Other
Coalition
Members
Party
National-
ization
Score
(PNS)
Govt.
National-
ization
Score
(PNG)
Core or
Marginal
Districts
Pivotal
Regions
Region
Gov.
Alignment
Income
Redistribution
1978-
79
UCD - 0.77 0.78 + - + -
1980-
82
UCD - 0.81 0.81 + - + -
1983-
86
PSOE - 0.90 0.89 - No Effect - +
1987-
89
PSOE - 0.90 0.89 - No Effect - +
1990-
93
PSOE - 0.89 0.88 - No Effect - +
1994-
96
PSOE CiU,,PNV 0.90 0.80 - + - +
1997-
00
PP CiU,PNV,CC 0.85 0.76 + + + -
2001-
04
PP - 0.81 0.86 + - + -
2005-
08
PSOE ERC, IU 0.92 0.91 - + - +
2009-
10
PSOE - 0.93 0.93 - No Effect - +

39
Essentially the hypotheses are derived from the variable political geography of incumbent parties.
One obvious problem of relying on this method is that we cannot control for the effects of ideology
on the allocation tactical investment. It is expected that the left-wing PSOE distributes more towards
poorer jurisdictions, and vice versa for the right-wing parties. To capture these different ideological
preferences, both the capital endowment and wealth of each district is controlled for in the analysis.
However, we cannot control for the fact the left-wing parties might be less prone to relying on pork-
barrel spending than right-wing parties (or vice versa). While it is unclear why left-wing parties
would be less prone to pork barrel spending (and this isn’t a well-established theoretical theme in
the literature) it is plausible that left wing and right wing parties and their voters would have distinct
preferences for pork-barrel transfers.
Unfortunately, the only solution is to interpret the results with caution given the covariance of left-
wing partisanship with higher party nationalization in the Spanish case. We estimate the responsive
of allocated investment (per capita) to each electoral district based on its vote share for the
incumbent party in each district as well as based on the absolute difference between the two largest
parties at the previous elections. Equation 1 is estimated for each time period corresponding to each
term of office in Spain from 1978-2010. There are ten party terms of office overall. Each model is
estimated using GLS with random effects and an AR (1) disturbance.
8.3.1 Programmatic Distribution
In terms of broad programmatic distribution, our results are consistent with other studies that find
that Spanish territorial spending tends to be highly redistributive towards Provinces with less
developed infrastructure endowments (de la Fuente, 2002 & 2004). The interpretation of the results
on the coefficients indicating programmatic distribution is based on the models presented in Table 7
(see appendix). Across all time periods (both left-wing and right-wing) governments tend to
distribute towards regions with lower endowments of capital stock, as indicated by the negative
coefficient on the lagged value of capital stock across all time periods. This redistribution towards
less capital developed regions is especially strong for the left-wing PSOE governments of the 1990s.
Only during two government terms – the UCD 1978-79 and PP 1997-2000 – is the capital
endowment of a Province an insignificant predictor of investment.
However in terms of the Programmatic expectations based on left-right ideology of the parties in
government, the results for the effects of Provincial income (GDP per capita) on capital investment
are more mixed and also counter-intuitive in terms of partisan expectations.

40
For the right-wing UCD governments 1978-1982, over both terms, the coefficient on the lagged
value of provincial income per capita is non-significant. However, this could be due to the fact that
during the first UCD government, investment tended to favour poorer provinces while during their
second term, it tended to favour relatively wealthier provinces when we control for other variables.
Similarly mixed results pertain for the PSOE governments. The results for longest consecutive PSOE
tenure in office – 1983-1996 – indicate that provinces with middle income (per capita) tended to
benefit the most from investment (when controlling for other factors). However, this differs for
individual terms of office. For instance, in the 1990s the PSOE’s allocation of investment was highly
redistributive towards poorer Provinces. In 1994-1996 period, for instance, a 10% decrease in GDP
per capita of a Province, increased annual investment to it by about 0.9%. The poorer Provinces in
terms of per capita income (between about 6,500 and 9,500 euros) received between 4% and 5%
more investment per year compared to the wealthier Provinces (between 14,000 and 16,000 euros)
during this period.
Contrary to expectations redistribution tended to be towards poorer provinces during the first PP
government 1997-2000, however Provincial income is an insignificant predictor of investment during
its second term (and possibly indicates greater redistribution towards wealthier regions). However,
all-in-all, provincial GDP is not a very strong predictor of investment expenditure across several
periods.
In terms of the structural/ functional controls, Population density is a strong negative predictor of
amount of investment allocated to a Province, indicating that as a percentage of existing capital
stock, rural and sparsely populated areas tend to receive more investment. This is likely because of
the higher costs of providing infrastructure in these areas. The dummy variable indicating a greater
level of responsibility by regional governments in a given period over infrastructure provision is
significant for several periods up until the late 1990s. This is possibly because the decentralization of
infrastructure responsibilities gradually became more standardized among all regions after this
period.
8.3.2 Tactical Distribution
This section describes the effect of the political variables (incumbent vote, vote margin, vote/seats
ratio and pivotal) on investment in each term of office. In terms of the expectations laid out in Table
5 regarding the tactical distribution activities of each party in government, the sub-period models
provide substantial support.

41
8.3.2.1 Incumbent Vote Share and District Vote Margin for Incumbent
The regression Tables 6 and 7 (see appendix) present results estimated by sub-period. The UCD
governments of 1978-79 and 1980-83 appear quite responsive to their stronghold districts. For
example, the results indicate that an increase of 10% from the mean in the vote share of a district
for the UCD during this period increased the subsequent investment effort (investment as a
percentage of capital stock) to the district by about 1.2% per year (see Table 6).The effect is even
more pronounced for the second UCD government, where the results indicate that a 10% increase in
the UCD vote share of a district increased investment by between 1.4% and 2.5%. Since the mean
yearly investment was approximately 9% of capital stock during this period, this is a substantial
difference.
The PP-led governments during this period also appear to have engaged in a significant level of
tactical distribution during its two terms in office, once as a minority government relying on
regionalist party legislative support (1996-2000) and again as a majority party government (2000-
2004). Interestingly, the PP appears to have favoured slightly different types of districts during both
periods. As a minority government the PP pursued a ‘risk-averse’ strategy (Cox, 2010, 348) of
targeting incumbent strongholds (those districts that gave it between 40% and 55% of the vote
[Table 7]) while during the majority government period it appears to have favoured marginal
districts, where it was most competitive with the PSOE in the 2000 election (Table 6).
The effects of this tactical distribution appear to be substantial (see Table 7). In the first period, a
10% increase in the vote share of a district for the PP, received between 1.13% and 1.27% higher
levels of investment (as a percent existing stock). Again, given the mean yearly investment was 8.2%
existing stock this is a substantial magnitude.
For the majority PP government 2000-2004, marginal districts received the greater levels of
investment controlling for other factors (see Table 6). As marginality increases by a percentage vote
(i.e. a district becomes more competitive between the PSOE and the PP) a district receives between
0 .3% and 0.7% increased investment. Districts where the difference between the PSOE and PP was
less than 5% in the 2000 election, received about 0.76% more investment per year than those where
the difference was in vote share was around 15%.
During the PSOE terms of office in general neither incumbent vote share nor margin of victory are
significant predictors of investment allocated, however this differs for individual terms of office.
Across all six terms of office (1983-1996 and 2005-2010) the PSOE does not tend to favour
stronghold districts while in office (Table 7). If anything the pattern seems to be the opposite with
42
the PSOE favouring districts that did not vote in high numbers for it. In general, the PSOE does not
seem to favour marginal districts; however, this is not the case across all time periods.
Interestingly, there is an exception to the general pattern for the PSOE during the 1993-1996 period
when the party held power as a minority government via informal legislative agreements with two
regionalist parties. There is also evidence that marginal districts were favoured during the 1983-
1986. During this later period marginal districts where the difference between the two largest
parties was about 10% received about 0.48% greater level of investment than those where the
(absolute) difference was about 20% between the PP and the PSOE (see Table 6). However, due to
the strong performance of the PSOE in 1983 (the first election it gained a majority of votes), there
were not a lot of ‘marginal’ districts, and the effects are largely driven by districts where the
difference between the PSOE and PP was less than 10% (rather than 5%), which we might not
consider marginal. For the 1993-1996 period on the other hand, there were far more districts where
the difference between the PP and PSOE was marginal (less than 5% and less than 10%) and these
districts received substantially more funding. For example, districts below 5% received about 1.36%
more investment per year than those where the difference was 15% between the two largest
parties. In the section below (section 9) we discuss possible reasons why it is only during this period
that there is significant evidence that the PSOE targeted marginal districts with funding.
8.3.2.2 Pivotal Regions
The results indicate the government supporting regionalist parties had significant effects on
investment to districts in their represented regions, during particular time periods.
During the PSOE minority government 1993-1996, for instance, districts in pivotal districts received
on average 4.4% higher investment than non-pivotal districts, shifting mean investment from
approximately 9.5% to 14% per district-year (see Table 6 and Table 7 in appendix)
Pivotal district status is a substantial predictor of investment allocation during the PP minority
government term (1996-2000), increasing investment by about 3.8% per year. Given that the mean
is 8.3% per year, this implies an increase to 11.73%, which is a substantial difference in investment.
However, pivotal region status does not have a significant effect on investment during the PSOE
minority government 2004-2008 (Catalonia is the only region considered pivotal during this period).
His could be because the main regionalist party that provided legislative support for this
government, the Catalan Republican Party (ERC) was just one of many (legislative) coalition partners
that the PSOE could rely upon for support.
43
The results are consistent with the descriptive analysis above, suggesting that these regions
(Catalonia, the Basque region and the Canary Islands) are favoured in comparison to mean
government investment when ‘their’ regionalist parties are pivotal to government formation and
legislative majorities. However, there is not much support for the observation that they are
‘disfavoured’ by investment-once other economic and district characteristics are controlled for- in
other periods.
8.3.2.3 Malapportionment
It is difficult to interpret the effects of malapportionment on investment effort to each district, but in
general, how over-represented a district is in terms of the vote to seat ratio is a significant predictor
during certain time periods for both the PSOE and the PP parties (see Table 6 and Table 7 in
appendix). During the 1993-1996 PSOE government for instance, highly over-represented districts
(those with an individual vote to seats ratio of about 30,000) received on average 11.5% investment
from central government, while ‘under-represented’ districts (vote to seats ratio of about 70,000)
received on average 8% investment allocation. Similarly for the PP government 1997-2000, the over-
represented districts received on average 10% while the over-represented districts received about
7% per year.
8.3.2.4 Partisan Alignment
As discussed above, we think it is likely that the effect of partisan alignment between regional and
central governments is more likely to be of significance for the Regional level (Autonomous
Community) rather than the District level (Provincial). In addition, the alignment of a region is highly
co-linear with the incumbent vote share of a district (Pearson’s r= 0.45). It is our view, that the
alignment hypothesis should be seen as complementary to the other ‘tactical distribution’
hypotheses rather than competing. For these reasons, we estimate the effect of partisan alignment
on investment effort to each of the 17 autonomous communities with the Provincial level data
aggregated to this level. Again, we use GLS (AR1) with random effects. However, estimating the
effect of alignment by term of office – as we have done with the other models – runs into a degrees
of freedom problem given the limited number of cross-sections (regions) available. As an alternative,
we opt to estimate the regional-level models on sub samples spanning longer time periods, covering
each party’s consecutive tenure in government. We do not include the period 1978-1982 in the
sample as there were very few regional governments prior to 1983. This forces us to exclude the
UCD party’s tenure in government.
44
Overall the results for the partisan alignment variable are not significant (these are presented in
Table 8 in appendix). This is contrary to the findings of the full sample model where alignment was a
significant predictor of investment to district-region. However most of the variables perform poorly
in terms of statistical significance in the models estimated on regional level data. This could be due
to either misspecification or measurement error in aggregating data. It could also be due to
substantive reasons however. Although partisan alignment may be important for certain types of
investment (particularly inter-governmental grants [e.g. see Leon, 2010]) it may be less important
for direct expenditure on public goods and services to lower level jurisdictions by central
government in Spain.
9. Discussion
There is significant support for the main hypothesis that relative levels of party nationalization affect
the distributive priorities of parties in government.
At the extreme end, parties with very low nationalization – the regionalist parties – have been able
to extract quite large concessions in the form of disproportional regional investment from central
government when they act as ‘king-makers’ to the larger state-wide parties. This finding is confirmed
by all models for the periods when regionalist parties had formal legislative agreements with the
two main state-wide parties to support them as minority governments (1993-2000). The findings
also reveal that the level of favouritism in investment towards districts in these regions is
substantial.
At an intermediate level of nationalization, there is evidence that parties are more prone to
engaging in pork barrel distribution. According to the models the less nationalized state-wide parties
– the UCD and the PP – appear to have engaged in more tactical spending to either their core or
marginal districts during their tenure in office, than the PSOE. The UCD governments especially
tended to target their stronghold districts: provinces in which they held very strong electoral
support. This picture is somewhat less clear for the PP governments, where there is less of a linear
relationship between district vote share and investment allocation. The results are consistent with
the notion that there is a slight curvilinear relationship between district vote share and investment
during the PP government periods, where districts that gave 40-50% vote share to the incumbent
are the most favoured, as opposed to either opposition districts or districts that gave a majority of
its votes to the incumbent party (extreme party strongholds).

45
In general there is quite significant support for the main hypothesis that comprehensively
nationalized parties in government rein-in regional favouritism and pork barrel spending.
However this isn’t a universal phenomenon. For instance, while the PSOE did not engage in much
tactical spending to either core or marginal districts during its two periods of consecutive control of
government from 1983-1996 and 2004-2010; it did tend to favour districts with lower vote to seat
ratios in most periods. During the period when it relied upon the support of regionalist parties to
form government it also targeted Marginal districts; those where they were closet to the PP in terms
of vote share at the previous election. While it is difficult to say why this might be the case, it could
be that regionalist parties encouraged this pork-barrel spending by the PSOE via a type of log-rolling
or regional balancing logic. Since, as we find the PSOE had to spend investment disproportionately in
the regionalist party strongholds (presumably) to maintain their continued legislative support during
this period, perhaps this made key ministers more responsive to demands for investment from their
own party’s electorally pivotally localities. This could also be because the party was especially wary
of losing support to the PP in these districts given its (unexpected) significantly decreased
performance in the previous election.
10. Conclusion
The results of this country study of the relationship between parties’ electoral geography and
distributive politics presented in this paper are strongly supportive of the general argument. We
find variation across parties in terms of their electoral nationalization seems to be co-linear with
their use of ‘pork-barrel’ spending during their term of office. This is especially the case for the
regionalist parties when they compose government. As we would expect, their regions tend to be
significantly favoured in terms of investment (when controlling for other factors) when these parties
are in government. This suggests that these regions are ‘disproportionally favoured’ when the
regionalist parties are in a ‘king-maker’ position for government formation and endurance.
We also observe greater levels of pork-barrel spending – either to core or marginal districts – by the
state-wide parties that are less nationalized. As shown in the descriptive analysis of geographical
trends in party support, both the (centre) right-wing UCD and PP parties have historically received
quite low levels of support in certain regions and certain districts. The PSOE on the other hand, has
historically received much more homogenous support across all jurisdictions. We argue that this
makes it more likely that the PSOE leaders would ‘rein-in’ regional favouritism and pork-barrel
spending because it internalizes the cost of this regional favouritism due to its representation of all
regions. The UCD and PP on the other hand both have a greater opportunity and greater incentive to

46
engage in regional favouritism in the form of pork-barrel spending. On the whole this is what we
find. Based on a range of measures of ‘tactical distribution’, investment during the UCD and PP
governments is much more responsive to short-term political factors than during the PSOE
governments.

47
Appendix
TABLE 1: FORMAL INSTITUTIONAL INCENTIVES FOR PARTICULARISTIC/ PORK BARREL PROVISION, SPANISH CASE
Institution
Category
Theoretical
Mechanism
Spanish Institutional
Variant
Empirical Expectation
Electoral Rules/
Electoral System Features
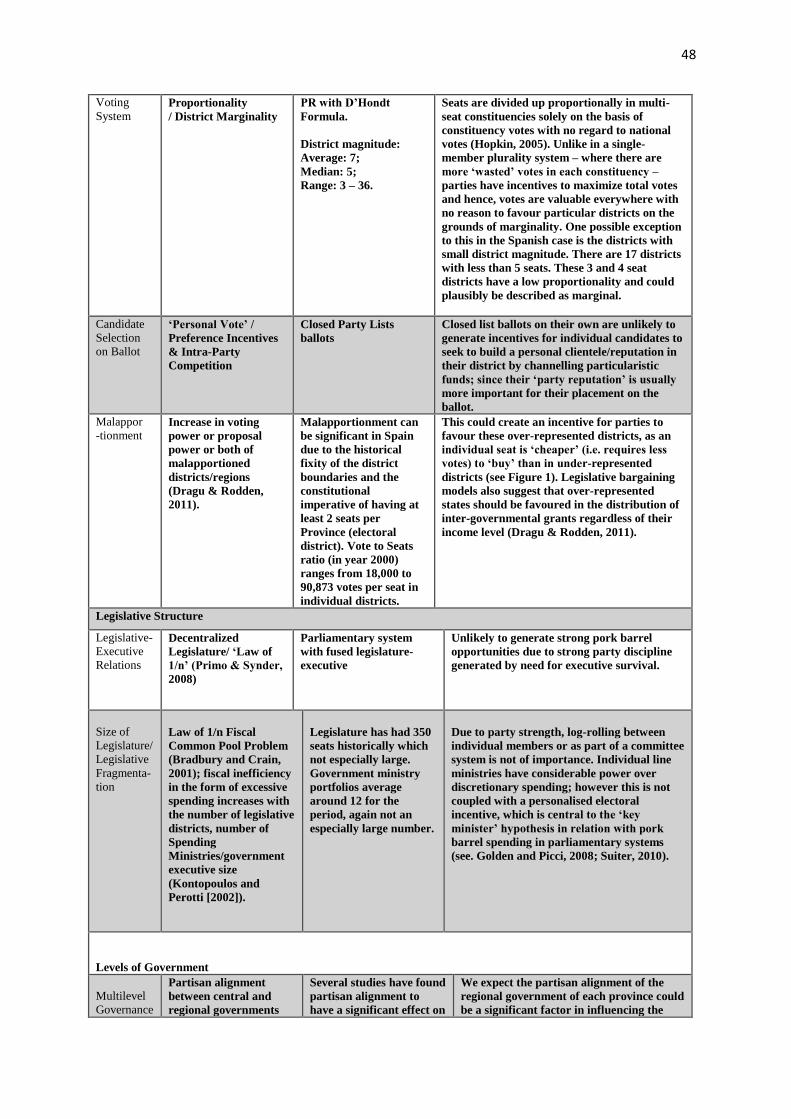
48
Voting
System Proportionality
/ District Marginality
PR with D’Hondt
Formula.
District magnitude:
Average: 7;
Median: 5;
Range: 3 – 36.
Seats are divided up proportionally in multi-
seat constituencies solely on the basis of
constituency votes with no regard to national
votes (Hopkin, 2005). Unlike in a single-
member plurality system – where there are
more ‘wasted’ votes in each constituency –
parties have incentives to maximize total votes
and hence, votes are valuable everywhere with
no reason to favour particular districts on the
grounds of marginality. One possible exception
to this in the Spanish case is the districts with
small district magnitude. There are 17 districts
with less than 5 seats. These 3 and 4 seat
districts have a low proportionality and could
plausibly be described as marginal.
Candidate
Selection
on Ballot
‘Personal Vote’ /
Preference Incentives
& Intra-Party
Competition
Closed Party Lists
ballots
Closed list ballots on their own are unlikely to
generate incentives for individual candidates to
seek to build a personal clientele/reputation in
their district by channelling particularistic
funds; since their ‘party reputation’ is usually
more important for their placement on the
ballot.
Malappor
-tionment Increase in voting
power or proposal
power or both of
malapportioned
districts/regions
(Dragu & Rodden,
2011).
Malapportionment can
be significant in Spain
due to the historical
fixity of the district
boundaries and the
constitutional
imperative of having at
least 2 seats per
Province (electoral
district). Vote to Seats
ratio (in year 2000)
ranges from 18,000 to
90,873 votes per seat in
individual districts.
This could create an incentive for parties to
favour these over-represented districts, as an
individual seat is ‘cheaper’ (i.e. requires less
votes) to ‘buy’ than in under-represented
districts (see Figure 1). Legislative bargaining
models also suggest that over-represented
states should be favoured in the distribution of
inter-governmental grants regardless of their
income level (Dragu & Rodden, 2011).
Legislative Structure
Legislative-
Executive
Relations
Decentralized
Legislature/ ‘Law of
1/n’ (Primo & Synder,
2008)
Parliamentary system
with fused legislature-
executive
Unlikely to generate strong pork barrel
opportunities due to strong party discipline
generated by need for executive survival.
Size of
Legislature/
Legislative
Fragmenta-
tion
Law of 1/n Fiscal
Common Pool Problem
(Bradbury and Crain,
2001); fiscal inefficiency
in the form of excessive
spending increases with
the number of legislative
districts, number of
Spending
Ministries/government
executive size
(Kontopoulos and
Perotti [2002]).
Legislature has had 350
seats historically which
not especially large.
Government ministry
portfolios average
around 12 for the
period, again not an
especially large number.
Due to party strength, log-rolling between
individual members or as part of a committee
system is not of importance. Individual line
ministries have considerable power over
discretionary spending; however this is not
coupled with a personalised electoral
incentive, which is central to the ‘key
minister’ hypothesis in relation with pork
barrel spending in parliamentary systems
(see. Golden and Picci, 2008; Suiter, 2010).
Levels of Government
Multilevel
Governance
Partisan alignment
between central and
regional governments
Several studies have found
partisan alignment to
have a significant effect on
We expect the partisan alignment of the
regional government of each province could
be a significant factor in influencing the
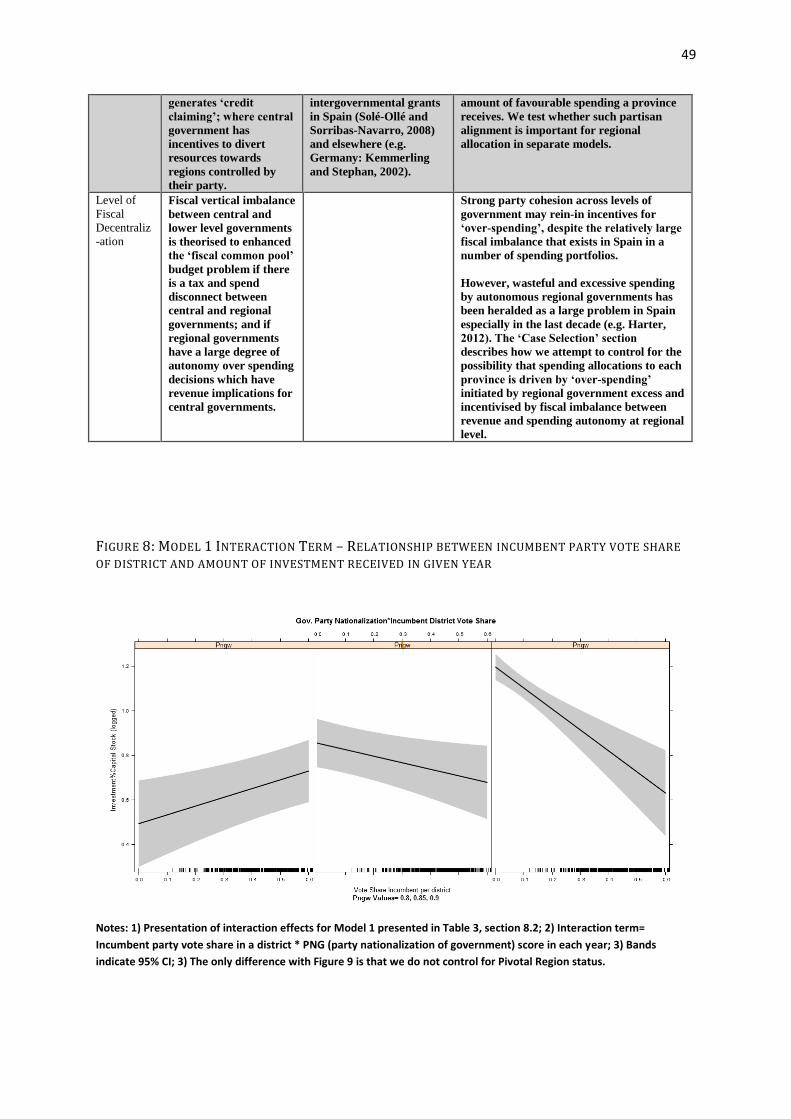
49
generates ‘credit
claiming’; where central
government has
incentives to divert
resources towards
regions controlled by
their party.
intergovernmental grants
in Spain (Solé-Ollé and
Sorribas-Navarro, 2008)
and elsewhere (e.g.
Germany: Kemmerling
and Stephan, 2002).
amount of favourable spending a province
receives. We test whether such partisan
alignment is important for regional
allocation in separate models.
Level of
Fiscal
Decentraliz
-ation
Fiscal vertical imbalance
between central and
lower level governments
is theorised to enhanced
the ‘fiscal common pool’
budget problem if there
is a tax and spend
disconnect between
central and regional
governments; and if
regional governments
have a large degree of
autonomy over spending
decisions which have
revenue implications for
central governments.
Strong party cohesion across levels of
government may rein-in incentives for
‘over-spending’, despite the relatively large
fiscal imbalance that exists in Spain in a
number of spending portfolios.
However, wasteful and excessive spending
by autonomous regional governments has
been heralded as a large problem in Spain
especially in the last decade (e.g. Harter,
2012). The ‘Case Selection’ section
describes how we attempt to control for the
possibility that spending allocations to each
province is driven by ‘over-spending’
initiated by regional government excess and
incentivised by fiscal imbalance between
revenue and spending autonomy at regional
level.
FIGURE 8: MODEL 1 INTERACTION TERM – RELATIONSHIP BETWEEN INCUMBENT PARTY VOTE SHARE
OF DISTRICT AND AMOUNT OF INVESTMENT RECEIVED IN GIVEN YEAR
Notes: 1) Presentation of interaction effects for Model 1 presented in Table 3, section 8.2; 2) Interaction term=
Incumbent party vote share in a district * PNG (party nationalization of government) score in each year; 3) Bands
indicate 95% CI; 3) The only difference with Figure 9 is that we do not control for Pivotal Region status.
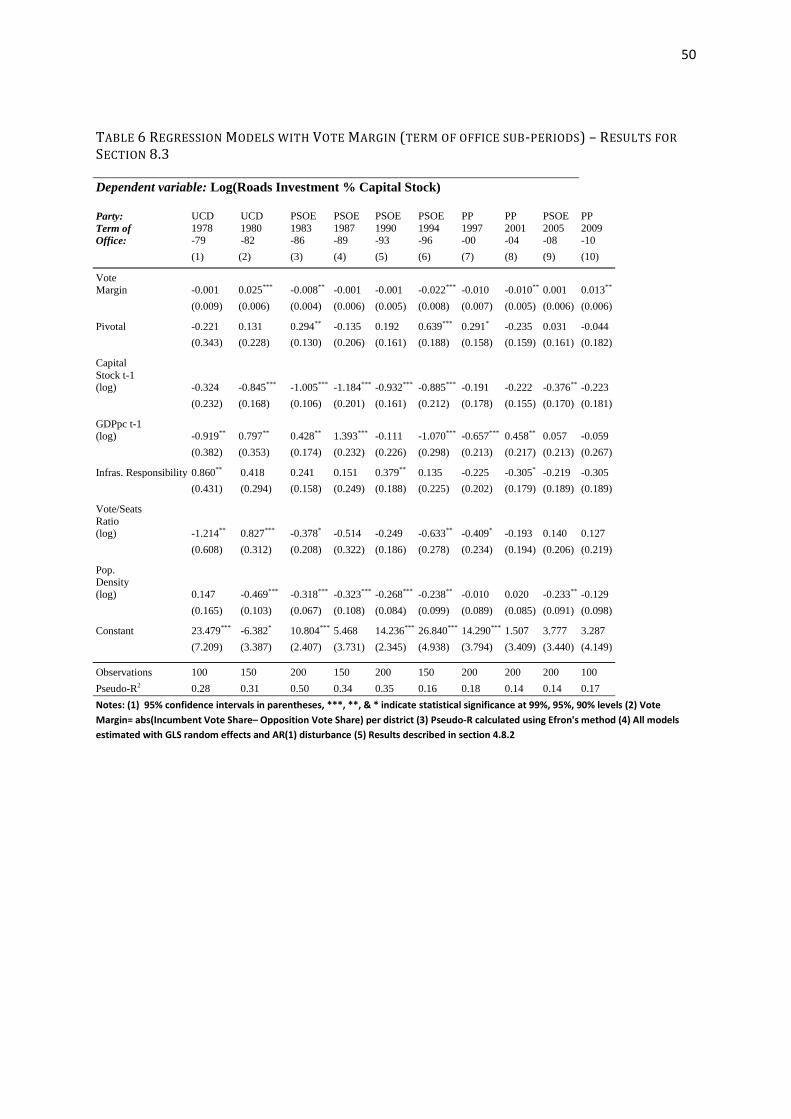
50
TABLE 6 REGRESSION MODELS WITH VOTE MARGIN (TERM OF OFFICE SUB-PERIODS) – RESULTS FOR
SECTION 8.3
Dependent variable: Log(Roads Investment % Capital Stock)
Party:
Term of
Office:
UCD
1978 -79
UCD
1980 -82
PSOE
1983 -86
PSOE
1987 -89
PSOE
1990 -93
PSOE
1994 -96
PP
1997 -00
PP
2001 -04
PSOE
2005 -08
PP
2009 -10
(1) (2) (3) (4) (5) (6) (7) (8) (9) (10)
Vote Margin -0.001 0.025*** -0.008** -0.001 -0.001 -0.022*** -0.010 -0.010** 0.001 0.013**
(0.009) (0.006) (0.004) (0.006) (0.005) (0.008) (0.007) (0.005) (0.006) (0.006)
Pivotal -0.221 0.131 0.294** -0.135 0.192 0.639*** 0.291* -0.235 0.031 -0.044
(0.343) (0.228) (0.130) (0.206) (0.161) (0.188) (0.158) (0.159) (0.161) (0.182)
Capital
Stock t-1 (log) -0.324 -0.845*** -1.005*** -1.184*** -0.932*** -0.885*** -0.191 -0.222 -0.376** -0.223
(0.232) (0.168) (0.106) (0.201) (0.161) (0.212) (0.178) (0.155) (0.170) (0.181)
GDPpc t-1 (log) -0.919** 0.797** 0.428** 1.393*** -0.111 -1.070*** -0.657*** 0.458** 0.057 -0.059
(0.382) (0.353) (0.174) (0.232) (0.226) (0.298) (0.213) (0.217) (0.213) (0.267)
Infras. Responsibility 0.860** 0.418 0.241 0.151 0.379** 0.135 -0.225 -0.305* -0.219 -0.305
(0.431) (0.294) (0.158) (0.249) (0.188) (0.225) (0.202) (0.179) (0.189) (0.189)
Vote/Seats
Ratio (log) -1.214** 0.827*** -0.378* -0.514 -0.249 -0.633** -0.409* -0.193 0.140 0.127
(0.608) (0.312) (0.208) (0.322) (0.186) (0.278) (0.234) (0.194) (0.206) (0.219)
Pop. Density
(log) 0.147 -0.469*** -0.318*** -0.323*** -0.268*** -0.238** -0.010 0.020 -0.233** -0.129
(0.165) (0.103) (0.067) (0.108) (0.084) (0.099) (0.089) (0.085) (0.091) (0.098)
Constant 23.479*** -6.382* 10.804*** 5.468 14.236*** 26.840*** 14.290*** 1.507 3.777 3.287
(7.209) (3.387) (2.407) (3.731) (2.345) (4.938) (3.794) (3.409) (3.440) (4.149)
Observations 100 150 200 150 200 150 200 200 200 100
Pseudo-R2 0.28 0.31 0.50 0.34 0.35 0.16 0.18 0.14 0.14 0.17
Notes: (1) 95% confidence intervals in parentheses, ***, **, & * indicate statistical significance at 99%, 95%, 90% levels (2) Vote
Margin= abs(Incumbent Vote Share– Opposition Vote Share) per district (3) Pseudo-R calculated using Efron's method (4) All models
estimated with GLS random effects and AR(1) disturbance (5) Results described in section 4.8.2

51
TABLE 0: REGRESSION MODELS WITH INCUMBENT VOTE SHARE AS % TOTAL DISTRICT VOTE (TERM OF
OFFICE SUB-PERIODS) – RESULTS FOR SECTION 8.3
Dependent variable: Log(Roads Investment % Capital Stock)
Party:
Term of Office:
UCD
1978 -79
UCD
1980 -82
PSOE
1983 -86
PSOE
1987 -89
PSOE
1990 -93
PSOE
1994 -96
PP
1997 -00
PP
2001-2004
PSOE
2005 -08
PP
2009 -10
(1) (2) (3) (4) (5) (6) (7) (8) (9) (10)
Incumbent Vote 0.018* 0.031*** -0.014*** -0.005 -0.001 -0.025** 0.012* -0.008 -0.006 -0.002
(0.011) (0.008) (0.005) (0.009) (0.007) (0.010) (0.007) (0.007) (0.009) (0.010)
Pivotal -0.091 0.309 0.163 -0.167 0.180 0.452** 0.566** -0.303 0.001 0.142
(0.343) (0.237) (0.124) (0.202) (0.153) (0.193) (0.238) (0.233) (0.163) (0.169)
Capital Stock t-1(log) -0.275 -0.778*** -1.029*** -1.213*** -0.933*** -0.913*** -0.268 -0.301* -0.411** -0.326*
(0.227) (0.166) (0.104) (0.203) (0.163) (0.216) (0.182) (0.157) (0.173) (0.190)
GDPpc t-1(log) -0.810** 0.716** 0.484*** 1.395*** -0.111 -1.144*** -0.724*** 0.347 0.035 -0.067
(0.369) (0.354) (0.169) (0.232) (0.226) (0.314) (0.212) (0.218) (0.213) (0.293)
Infras. Responsibility 1.156*** 0.563* 0.151 0.136 0.375* 0.147 -0.019 -0.218 -0.265 -0.306
(0.444) (0.313) (0.152) (0.248) (0.192) (0.231) (0.197) (0.181) (0.195) (0.200)
Vote/Seats Ratio(log) -0.648 0.737** -0.282 -0.476 -0.246 -0.305 -0.216 -0.211 0.175 0.187
(0.565) (0.308) (0.206) (0.326) (0.191) (0.275) (0.245) (0.207) (0.212) (0.232)
Pop.Density(log) 0.128 -0.368*** -0.336*** -0.338*** -0.269*** -0.330*** -0.061 -0.014 -0.252*** -0.191*
(0.154) (0.099) (0.065) (0.109) (0.085) (0.106) (0.092) (0.087) (0.094) (0.102)
Constant 15.499** -6.562* 10.055*** 5.497 14.243*** 25.287*** 12.955*** 3.738 4.227 4.008
(7.012) (3.470) (2.352) (3.714) (2.354) (4.737) (3.840) (3.518) (3.420) (4.542)
Observations 100 150 200 150 200 150 200 200 200 100
Pseudo-R2 0.31 0.30 0.52 0.35 0.35 0.14 0.19 0.11 0.15 0.13
Notes: (1) 95% confidence intervals in parentheses, ***, **, & * indicate statistical significance at 99%, 95%, 90% levels (2) Pseudo-R calculated using Efron's method (3) All models estimated with GLS random effects and AR(1) disturbance. (4) Results described in section 4.8.2

52
TABLE 8: REGRESSION MODELS WITH PARTISAN ALIGNMENT BETWEEN REGIONAL AND CENTRAL
GOVERNMENT (PARTY SUB-PERIODS) – RESULTS FOR SECTION 8.3.2.4
Dependent variable: Log(Roads Investment % Capital Stock)
Party: PSOE PP PSOE
Consecutive Tenure: 1983-1996 1997-2004 2005-2010
(1) (2) (3)
Alignment -0.025 -0.115 -0.041
(0.056) (0.093) (0.170)
Pivotal -0.006 0.055 -0.216
(0.191) (0.132) (0.219)
Capital Stock t-1(log) -0.760***
-0.164 -0.468***
(0.166) (0.202) (0.182)
GDPpc t-1(log) 0.626***
0.081 -0.043
(0.143) (0.145) (0.142)
Infras. Responsibility 0.196 -0.318 -0.139
(0.326) (0.216) (0.180)
Vote/Seats Ratio(log) -0.576 -0.456 0.431
(0.393) (0.397) (0.380)
Pop.Density(log) -0.500***
-0.009 -0.243**
(0.152) (0.111) (0.119)
Constant 2.071 6.473 2.941
(4.264) (4.294) (3.778)
Observations 238 153 102
Pseudo-R2
0.24 0.07 0.21
Notes: (1) Models estimated on Regional level data testing effect of partisan alignment on regional Investment ; (2) All data aggregate to regional level either average weighted by Provincial population size (3) Method of estimation: GLS with random effects and AR(1). (4) Efron's Pseudo-R