Particle dynamics in the Eastern Mediterranean Sea: A synthesis based on light transmission, PMC,...
26
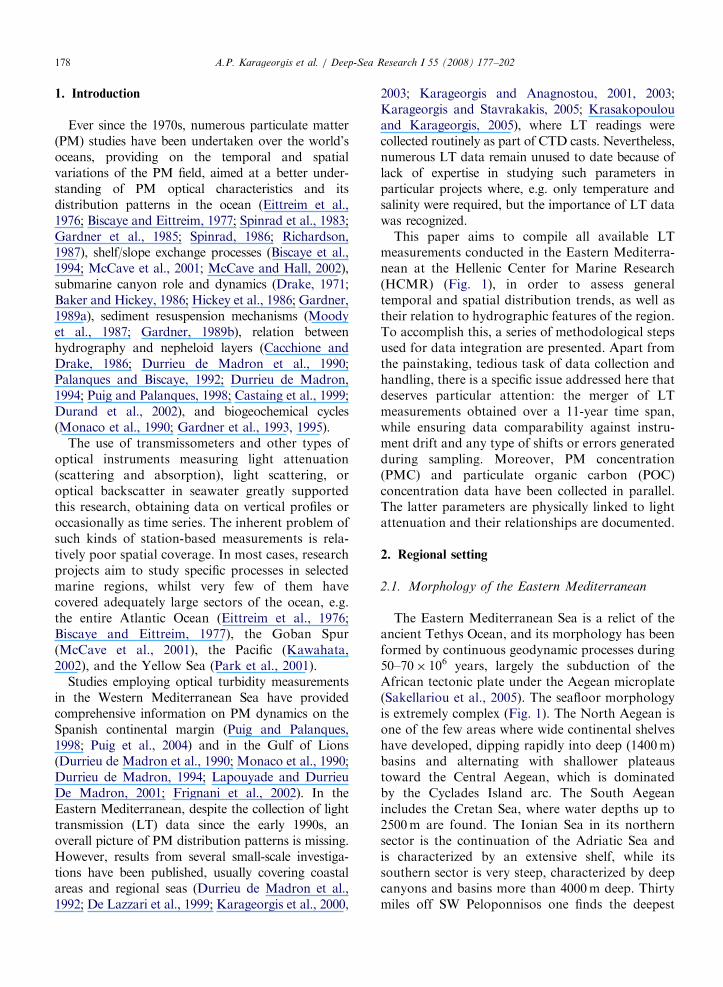
Deep-Sea Research I 55 (2008) 177–202 Particle dynamics in the Eastern Mediterranean Sea: A synthesis based on light transmission, PMC, and POC archives (1991–2001) Aristomenis P. Karageorgis a, , Wilford D. Gardner b , Dimitris Georgopoulos a , Alexey V. Mishonov c , Evangelia Krasakopoulou a , Christos Anagnostou a a Hellenic Centre for Marine Research, 46.7 km Athens-Sounio Avenue, Mavro Lithari, 19013 Anavyssos, Greece b Department of Oceanography, Texas A&M University, College Station, TX 77843, USA c NODC/NOAA, 1315 East West Highway, Silver Spring, MD 20910-3282, USA Received 28 June 2007; received in revised form 7 November 2007; accepted 12 November 2007 Available online 23 November 2007 Abstract During the last two decades light transmission (LT) data have been collected routinely in the Eastern Mediterranean Sea, within the framework of several research projects. A procedure was developed to obtain beam attenuation coefficient due to particles (c p ) at 660–670 nm adjusted for variations in mid-depth ‘clear’ water and instrumental drifts. Data from 3146 stations occupied between 1991 and 2001 were converted to a common format for the analysis of particulate matter (PM) temporal and spatial distribution patterns. The data were separated into ‘wet’ (December–May) and ‘dry’ (June–November) periods. The horizontal distribution of beam c p at various depths revealed clearly higher values in the surface nepheloid layer (SNL) in the vicinity of river mouths during the ‘wet’ period, whilst the increase was negligible during the ‘dry’ period. In contrast, the bottom nepheloid layer (BNL; 1–10 m above bottom) appeared to be turbid throughout the year, particularly on the continental shelves receiving riverine discharge. This feature is attributed to resuspension and advection of recently deposited bottom sediments due to waves and currents. However, the Eastern Mediterranean as a whole is impoverished in PM in the water column, particularly at depths 4200 m. The behavior of surface-water c p revealed a strong relationship to mesoscale dynamic features. Cyclonic eddies, which upwell nutrient-rich waters toward the surface, favor primary production, which was identified as elevated beam c p values. Beam c p was correlated with PM concentration (PMC) and particulate organic carbon (POC) concentration obtained by bottle sampling. Although there were regional differences in the correlations, no significant seasonal variations were observed. Two generic equations were generated that can be used for a first-order estimate of PMC and POC from historical LT measurements conducted in the area, provided that data are handled according to the proposed methodology. r 2007 Elsevier Ltd. All rights reserved. Keywords: Light transmission; Beam attenuation; Particulate matter; Particulate organic carbon; Eastern Mediterranean Sea ARTICLE IN PRESS www.elsevier.com/locate/dsri 0967-0637/$ - see front matter r 2007 Elsevier Ltd. All rights reserved. doi:10.1016/j.dsr.2007.11.002 Corresponding author. Tel.: +30 2291076369; fax: +30 2291076347. E-mail addresses: [email protected] (A.P. Karageorgis), [email protected] (W.D. Gardner), [email protected] (D. Georgopoulos), [email protected] (A.V. Mishonov), [email protected] (E. Krasakopoulou), [email protected] (C. Anagnostou).
Transcript of Particle dynamics in the Eastern Mediterranean Sea: A synthesis based on light transmission, PMC,...
ARTICLE IN PRESS
0967-0637/$ - see
doi:10.1016/j.ds
�CorrespondiE-mail addre
(D. Georgopoul
(C. Anagnostou
Deep-Sea Research I 55 (2008) 177–202
www.elsevier.com/locate/dsri
Particle dynamics in the Eastern Mediterranean Sea:A synthesis based on light transmission, PMC,
and POC archives (1991–2001)
Aristomenis P. Karageorgisa,�, Wilford D. Gardnerb, Dimitris Georgopoulosa,Alexey V. Mishonovc, Evangelia Krasakopouloua, Christos Anagnostoua
aHellenic Centre for Marine Research, 46.7 km Athens-Sounio Avenue, Mavro Lithari, 19013 Anavyssos, GreecebDepartment of Oceanography, Texas A&M University, College Station, TX 77843, USA
cNODC/NOAA, 1315 East West Highway, Silver Spring, MD 20910-3282, USA
Received 28 June 2007; received in revised form 7 November 2007; accepted 12 November 2007
Available online 23 November 2007
Abstract
During the last two decades light transmission (LT) data have been collected routinely in the Eastern Mediterranean
Sea, within the framework of several research projects. A procedure was developed to obtain beam attenuation coefficient
due to particles (cp) at 660–670 nm adjusted for variations in mid-depth ‘clear’ water and instrumental drifts. Data from
3146 stations occupied between 1991 and 2001 were converted to a common format for the analysis of particulate matter
(PM) temporal and spatial distribution patterns. The data were separated into ‘wet’ (December–May) and ‘dry’
(June–November) periods. The horizontal distribution of beam cp at various depths revealed clearly higher values in the
surface nepheloid layer (SNL) in the vicinity of river mouths during the ‘wet’ period, whilst the increase was negligible
during the ‘dry’ period. In contrast, the bottom nepheloid layer (BNL; 1–10m above bottom) appeared to be turbid
throughout the year, particularly on the continental shelves receiving riverine discharge. This feature is attributed to
resuspension and advection of recently deposited bottom sediments due to waves and currents. However, the Eastern
Mediterranean as a whole is impoverished in PM in the water column, particularly at depths 4200m. The behavior of
surface-water cp revealed a strong relationship to mesoscale dynamic features. Cyclonic eddies, which upwell nutrient-rich
waters toward the surface, favor primary production, which was identified as elevated beam cp values. Beam cp was
correlated with PM concentration (PMC) and particulate organic carbon (POC) concentration obtained by bottle
sampling. Although there were regional differences in the correlations, no significant seasonal variations were observed.
Two generic equations were generated that can be used for a first-order estimate of PMC and POC from historical LT
measurements conducted in the area, provided that data are handled according to the proposed methodology.
r 2007 Elsevier Ltd. All rights reserved.
Keywords: Light transmission; Beam attenuation; Particulate matter; Particulate organic carbon; Eastern Mediterranean Sea
front matter r 2007 Elsevier Ltd. All rights reserved.
r.2007.11.002
ng author. Tel.: +302291076369; fax: +30 2291076347.
sses: [email protected] (A.P. Karageorgis), [email protected] (W.D. Gardner), [email protected]
os), [email protected] (A.V. Mishonov), [email protected] (E. Krasakopoulou), [email protected]
).
ARTICLE IN PRESSA.P. Karageorgis et al. / Deep-Sea Research I 55 (2008) 177–202178
1. Introduction
Ever since the 1970s, numerous particulate matter(PM) studies have been undertaken over the world’soceans, providing on the temporal and spatialvariations of the PM field, aimed at a better under-standing of PM optical characteristics and itsdistribution patterns in the ocean (Eittreim et al.,1976; Biscaye and Eittreim, 1977; Spinrad et al., 1983;Gardner et al., 1985; Spinrad, 1986; Richardson,1987), shelf/slope exchange processes (Biscaye et al.,1994; McCave et al., 2001; McCave and Hall, 2002),submarine canyon role and dynamics (Drake, 1971;Baker and Hickey, 1986; Hickey et al., 1986; Gardner,1989a), sediment resuspension mechanisms (Moodyet al., 1987; Gardner, 1989b), relation betweenhydrography and nepheloid layers (Cacchione andDrake, 1986; Durrieu de Madron et al., 1990;Palanques and Biscaye, 1992; Durrieu de Madron,1994; Puig and Palanques, 1998; Castaing et al., 1999;Durand et al., 2002), and biogeochemical cycles(Monaco et al., 1990; Gardner et al., 1993, 1995).
The use of transmissometers and other types ofoptical instruments measuring light attenuation(scattering and absorption), light scattering, oroptical backscatter in seawater greatly supportedthis research, obtaining data on vertical profiles oroccasionally as time series. The inherent problem ofsuch kinds of station-based measurements is rela-tively poor spatial coverage. In most cases, researchprojects aim to study specific processes in selectedmarine regions, whilst very few of them havecovered adequately large sectors of the ocean, e.g.the entire Atlantic Ocean (Eittreim et al., 1976;Biscaye and Eittreim, 1977), the Goban Spur(McCave et al., 2001), the Pacific (Kawahata,2002), and the Yellow Sea (Park et al., 2001).
Studies employing optical turbidity measurementsin the Western Mediterranean Sea have providedcomprehensive information on PM dynamics on theSpanish continental margin (Puig and Palanques,1998; Puig et al., 2004) and in the Gulf of Lions(Durrieu de Madron et al., 1990; Monaco et al., 1990;Durrieu de Madron, 1994; Lapouyade and DurrieuDe Madron, 2001; Frignani et al., 2002). In theEastern Mediterranean, despite the collection of lighttransmission (LT) data since the early 1990s, anoverall picture of PM distribution patterns is missing.However, results from several small-scale investiga-tions have been published, usually covering coastalareas and regional seas (Durrieu de Madron et al.,1992; De Lazzari et al., 1999; Karageorgis et al., 2000,
2003; Karageorgis and Anagnostou, 2001, 2003;Karageorgis and Stavrakakis, 2005; Krasakopoulouand Karageorgis, 2005), where LT readings werecollected routinely as part of CTD casts. Nevertheless,numerous LT data remain unused to date because oflack of expertise in studying such parameters inparticular projects where, e.g. only temperature andsalinity were required, but the importance of LT datawas recognized.
This paper aims to compile all available LTmeasurements conducted in the Eastern Mediterra-nean at the Hellenic Center for Marine Research(HCMR) (Fig. 1), in order to assess generaltemporal and spatial distribution trends, as well astheir relation to hydrographic features of the region.To accomplish this, a series of methodological stepsused for data integration are presented. Apart fromthe painstaking, tedious task of data collection andhandling, there is a specific issue addressed here thatdeserves particular attention: the merger of LTmeasurements obtained over a 11-year time span,while ensuring data comparability against instru-ment drift and any type of shifts or errors generatedduring sampling. Moreover, PM concentration(PMC) and particulate organic carbon (POC)concentration data have been collected in parallel.The latter parameters are physically linked to lightattenuation and their relationships are documented.
2. Regional setting
2.1. Morphology of the Eastern Mediterranean
The Eastern Mediterranean Sea is a relict of theancient Tethys Ocean, and its morphology has beenformed by continuous geodynamic processes during50–70� 106 years, largely the subduction of theAfrican tectonic plate under the Aegean microplate(Sakellariou et al., 2005). The seafloor morphologyis extremely complex (Fig. 1). The North Aegean isone of the few areas where wide continental shelveshave developed, dipping rapidly into deep (1400m)basins and alternating with shallower plateaustoward the Central Aegean, which is dominatedby the Cyclades Island arc. The South Aegeanincludes the Cretan Sea, where water depths up to2500m are found. The Ionian Sea in its northernsector is the continuation of the Adriatic Sea andis characterized by an extensive shelf, while itssouthern sector is very steep, characterized by deepcanyons and basins more than 4000m deep. Thirtymiles off SW Peloponnisos one finds the deepest
ARTICLE IN PRESS
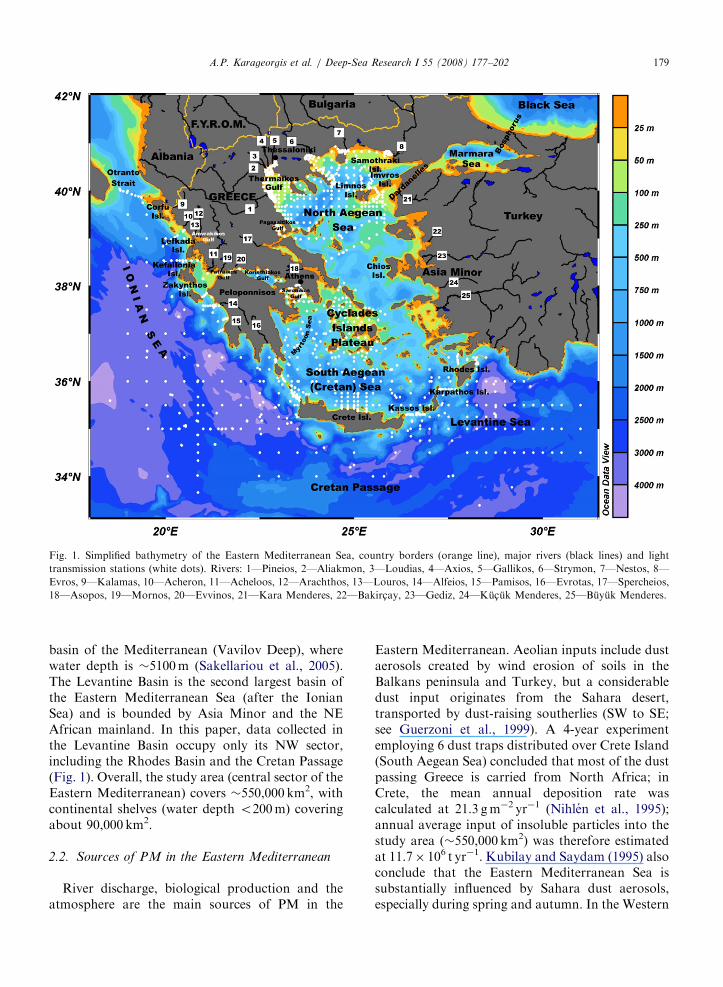
Fig. 1. Simplified bathymetry of the Eastern Mediterranean Sea, country borders (orange line), major rivers (black lines) and light
transmission stations (white dots). Rivers: 1—Pineios, 2—Aliakmon, 3—Loudias, 4—Axios, 5—Gallikos, 6—Strymon, 7—Nestos, 8—
Evros, 9—Kalamas, 10—Acheron, 11—Acheloos, 12—Arachthos, 13—Louros, 14—Alfeios, 15—Pamisos, 16—Evrotas, 17—Spercheios,
18—Asopos, 19—Mornos, 20—Evvinos, 21—Kara Menderes, 22—Bakirc-ay, 23—Gediz, 24—Kuc- uk Menderes, 25—Buyuk Menderes.
A.P. Karageorgis et al. / Deep-Sea Research I 55 (2008) 177–202 179
basin of the Mediterranean (Vavilov Deep), wherewater depth is �5100m (Sakellariou et al., 2005).The Levantine Basin is the second largest basin ofthe Eastern Mediterranean Sea (after the IonianSea) and is bounded by Asia Minor and the NEAfrican mainland. In this paper, data collected inthe Levantine Basin occupy only its NW sector,including the Rhodes Basin and the Cretan Passage(Fig. 1). Overall, the study area (central sector of theEastern Mediterranean) covers �550,000 km2, withcontinental shelves (water depth o200m) coveringabout 90,000 km2.
2.2. Sources of PM in the Eastern Mediterranean
River discharge, biological production and theatmosphere are the main sources of PM in the
Eastern Mediterranean. Aeolian inputs include dustaerosols created by wind erosion of soils in theBalkans peninsula and Turkey, but a considerabledust input originates from the Sahara desert,transported by dust-raising southerlies (SW to SE;see Guerzoni et al., 1999). A 4-year experimentemploying 6 dust traps distributed over Crete Island(South Aegean Sea) concluded that most of the dustpassing Greece is carried from North Africa; inCrete, the mean annual deposition rate wascalculated at 21.3 gm�2 yr�1 (Nihlen et al., 1995);annual average input of insoluble particles into thestudy area (�550,000 km2) was therefore estimatedat 11.7� 106 t yr�1. Kubilay and Saydam (1995) alsoconclude that the Eastern Mediterranean Sea issubstantially influenced by Sahara dust aerosols,especially during spring and autumn. In the Western
ARTICLE IN PRESSA.P. Karageorgis et al. / Deep-Sea Research I 55 (2008) 177–202180
Mediterranean, after comprehensive studies Martinet al. (1989) suggest that atmospheric input ofparticulates in the basin is equally important asthe river input, whilst Guerzoni et al. (1999) arguethat if 2/3 of the riverine input remains onthe continental shelf (water depth o100m) thenthe atmospheric contribution is up to �60% for theMediterranean as a whole.
The major rivers flowing into the EasternMediterranean (Fig. 1) discharge into the NorthAegean Sea, namely from west to east: Pineios,Aliakmon, Loudias, Axios, and Gallikos (Thermai-kos Gulf, NW Aegean Sea), Strymon, Nestos andEvros. In Western Greece, the rivers Kalamas,Acheron, and Acheloos discharge into the IonianSea; Arachthos and Louros discharge into the semi-enclosed Amvrakikos Gulf, which communicateswith the Ionian Sea through a narrow strait.The rivers Alfeios, Pamisos, and Evrotas drainPeloponnisos, discharging into the Ionian Sea.A number of smaller rivers discharge into semi-enclosed gulfs of the Hellenic mainland, namelySpercheios, Asopos, Mornos, and Evvinos andothers, whilst numerous streams, with small catch-ments (including Turkish rivers drainingAsia Minor, i.e. Kara Menderes, Bakirc-ay, Gediz,Kuc- uk Menderes, and Buyuk Menderes), contri-bute to the overall freshwater input to the sea.
A common characteristic of the Hellenic rivers istheir variable behavior between winter/spring andsummer/autumn. High freshwater discharge periodsbegin generally in December, following the com-mencement of the rainy season, and culminatearound May, when snow melts on the mountains.This seasonality results in relatively constant flowduring the ‘wet’ period (December–May) andintermittent flow during the ‘dry’ period (June–November). Because of increasing needs for fresh-water during the latter period even large riversbecome almost dry during July and August. Fresh-water outflow has decreased significantly becausethousands of wells now pump water from under-ground aquifers, mainly for irrigation. Further-more, dams have been constructed on many riversover the past 40 years for hydroelectric powerproduction and irrigation/watering purposes. Pou-los and Chronis (1997), based on water dischargefrom 16 large and 8 smaller Greek rivers, haveestimated that some 35,000� 106m3 of freshwaterflows into the Eastern Mediterranean. Turkishrivers discharge an additional �1250� 106m3 offreshwater into the Aegean Sea (Poulos et al., 1997).
Suspended solids of riverine origin are injectedinto the sea following the temporal variations offreshwater discharge. For example, PMC near theAxios River mouth in Thermaikos Gulf (NWAegean Sea) varied from 5mg l�1 (discharge270m3 s�1) during May 1997 to o1mg l�1 (dis-charge 33m3 s�1) during July 1997 (Karageorgisand Anagnostou, 2003). Recently, Lykousis et al.(2005) have estimated that the mean annualterrestrial flux of the rivers flowing into the NWAegean Sea is �5.5� 106 t yr�1, whilst an overallestimate for the principal Greek rivers, based onmeasured and estimated sediment loads, amounts to80–95� 106 t yr�1 (Poulos and Chronis, 1997). Thelatter figure is probably greater than presentdischarges because it is based on terrestrial fluxesmeasured before the extensive construction of damsin Greece and neighboring countries. In a morerecent estimate, Poulos and Collins (2002) suggestthat PM fluxes in the Mediterranean have suffered a54% decrease due to entrapment by reservoirs.
Another primary source of particles in the East-ern Mediterranean is the autochthonous primaryand secondary production. Phytoplankton, zoo-plankton, and their detritus are abundant in theeuphotic zone (80–100m in the North Aegean and110–150m in the South Aegean (Cretan Sea);Lykousis et al., 2002). The Eastern Mediterraneanis one of the well-known basins of low productivityof the world ocean due to limited nutrient supply toits surface waters from upwelling, mixing, andexternal sources including atmospheric input, river-ine and waste discharges (Dugdale and Wilkerson,1988). The mean annual primary production hasbeen estimated to range regionally and seasonallybetween 15.0 and 60 gCm�2 yr�1, being higherduring late winter–early spring in upwelling cyclonicregions as well as in areas influenced by land-basedsources (Dugdale and Wilkerson, 1988; Psarra et al.,2000; Lykousis et al., 2002; Moutin and Raimbault,2002). These conditions result in high watertransparency and general scarcity of particles,particularly in the sub-surface waters of the EasternMediterranean. Although limited data exist on POCdistribution for the oligotrophic Eastern Mediterra-nean, the vertical profiles exhibit coherent peakswithin the deep chlorophyll maximum zone near thebase of the euphotic layer, implying that algalbiomass constitutes a significant fraction of thePOC pool in this layer (Abdel-Moati, 1990; Socalet al., 1999; Ediger et al., 2005). However, the highPOC/Chl-a ratios observed in the surface mixed
ARTICLE IN PRESSA.P. Karageorgis et al. / Deep-Sea Research I 55 (2008) 177–202 181
layer of the Eastern Mediterranean by differentinvestigators (Rabitti et al., 1994; Socal et al., 1999;Ediger et al., 2005) suggest that the POC pool ispossibly dominated by bacteria, protozooplankton,detritus originating from regenerative productionand heterotrophic activities, and organic matter ofatmospheric origin.
2.3. Hydrological characteristics of the Eastern
Mediterranean
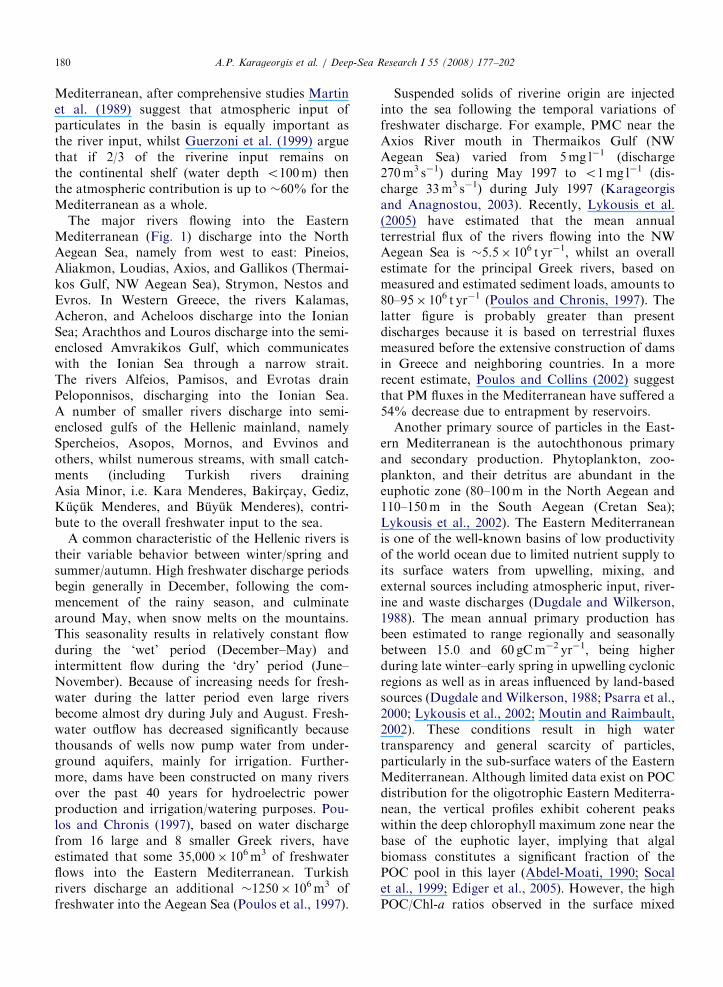
In the Eastern Mediterranean and the Aegean Seaseveral water masses can be identified. In the upperthermocline Modified North Atlantic (MAW) andBlack Sea (BSW) waters intrude into the area understudy from the Sicily Channel and the Straits ofDardanelles, respectively (Fig. 2). Both are char-acterized by their salinity minimum (Lacombe et al.,1958; Ovchinnikov, 1966; Hopkins, 1978).
According to Malanotte-Rizzoli et al. (1997,1999), using the ‘Physical Oceanography of theEastern Mediterranean’ (POEM) March–April 1986,October–November 1986 and August–September1987 data sets, the Atlantic-Ionian Stream (AIS)entering the Sicily channel bifurcates into two mainbranches advecting the MAW into the Ionian interior(Fig. 2). The first branch turns directly southwardfollowing the Ionian Anticyclone (IA) in the south-west Ionian, while the second extends further tothe north–northeast where it turns southward,advecting MAW on its left side and Ionian SurfaceWater (ISW) on its right, finally crossing the CretanPassage transporting MAW in the Levantine Basin(see also Fig. 1).
Along the western coasts of Greece (Fig. 2), aseries of two cyclones (one off the western coast ofCrete, the Cretan Cyclone (CC) and another one offthe southern part of Corfu Island) and the PelopsAnticyclone (PA) off southwest Peloponnisos,modulate the circulation of the Adriatic SurfaceWater (ASW) and the Levantine Surface Water(LSW).
Melding observations from the same period asabove with model dynamics, Robinson and Golnar-aghi (1994), produced a schematic of the upperthermocline general circulation in the LevantineBasin. The AIS jet crossing the Cretan Passageunder the name of Mid Mediterranean Jet (MMJ)meanders on the periphery of a number ofpermanent, recurrent or transient cyclonic andanticyclonic gyres (Fig. 2). In the northern part ofthe Levantine along the southern Turkish coast, the
Asia Minor Current (AMC) meanders in theperiphery of the Rhodes Cyclonic Gyre and theWestern Cyprus Cyclone, transporting warm, salineLSW westward (Ozsoy et al., 1989; Theocharis andKontoyiannis, 1999). Branches of AMC are de-flected as they intrude the Aegean from the easternstraits of the Cretan Arc (Rhodes, Karpathos andKassos straits; see also Fig. 1).
The LSW enters the Aegean from the eastern andwestern straits of the Cretan Arc (Fig. 2, Georgopouloset al., 1989; The POEMGroup, 1992; Theocharis et al.,1993). The AMC entering the Aegean from the easternstraits bifurcates, and one branch moves westward inthe Cretan Sea, while the other circulates northward,meeting the BSW over the Limnos Plateau.
The BSW (low-salinity and cold water, Fig. 2)intrudes the Aegean Sea from the Strait ofDardanelles, after passing through the BosphorusStrait and the Sea of Marmara (Unluata et al.,1990). The BSW circulates cyclonically in the NorthAegean, affecting first the northern and then theeastern coasts of the Aegean. Branches of low-salinity BSW enter the Thermaikos Gulf. Arrivingat the north barrier of Cyclades Plateau, BSWbifurcates and one branch moves southward to-wards the Cretan Sea, while the other, following theprevailing cyclonic circulation, moves eastwardmeandering around the Chios multi-lobe permanentcyclone (Zodiatis, 1994; Georgopoulos, 2002;Zervakis and Georgopoulos, 2002).
Under the surface layer, a distinct warm andsaline water mass, namely Levantine IntermediateWater (LIW) dominates the entire MediterraneanSea. The Rhodes Cyclonic Gyre and the WesternCyprus Cyclone, permanent dynamic features of theNorthern Levantine basin, are the most importantsources of both the LIW and, under extrememeteorological conditions, of the Eastern Mediter-ranean Deep Water (EMDW) in the area. Waterswith similar hydrological characteristics are alsoformed in the Cretan Sea during extremely coldwinters (Theocharis et al., 1998, 1999; Georgopou-los et al., 1989). Details of the circulation of LIWare described in Malanotte-Rizzoli et al. (1997).
The Adriatic is historically considered as a sourceof the Eastern Mediterranean Deep and bottomWaters (EMDW). Distinct lenses from the AegeanSea are identified at depths between 700 and 1100m.Data obtained between 1987 (Schlitzer et al., 1991)and 1995 (Roether et al., 1996) cruises revealed thatthe thermohaline circulation in the Eastern Medi-terranean has changed. Waters of high density
ARTICLE IN PRESS
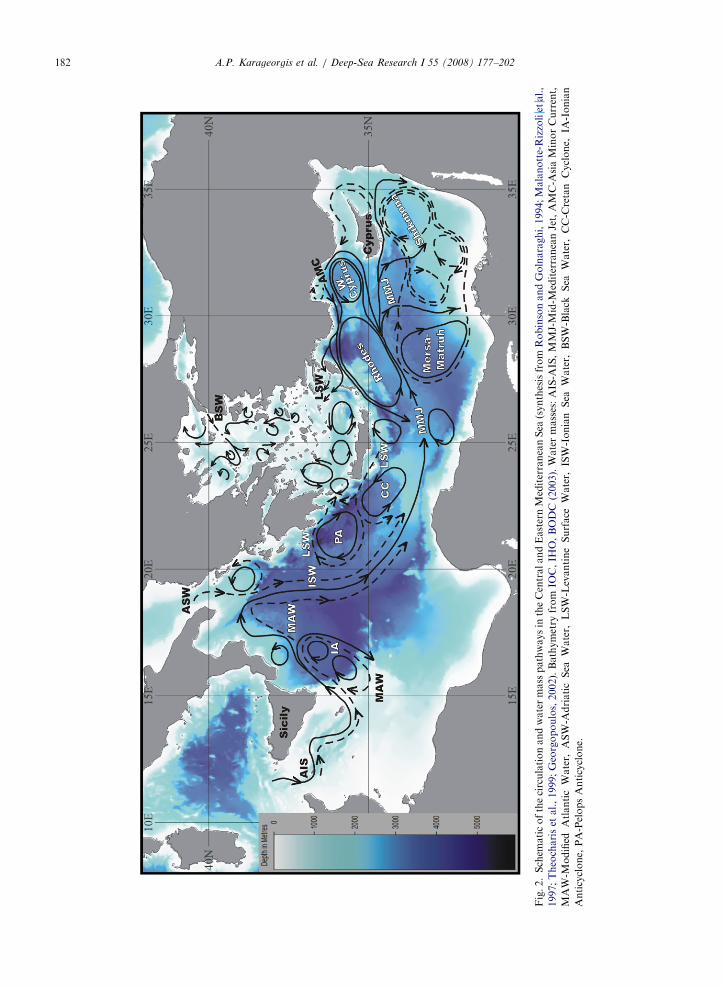
Fig.2.Schem
aticofthecirculationandwatermass
pathwaysin
theCentralandEasternMediterraneanSea
(synthesisfrom
RobinsonandGolnaraghi,1994;Malanotte-Rizzoliet
al.,
1997;Theochariset
al.,1999;Georgopoulos,2002).Bathymetry
from
IOC,IH
O,BODC
(2003).Watermasses:AIS-A
IS,MMJ-Mid-M
editerraneanJet,AMC-A
siaMinorCurrent,
MAW-M
odified
AtlanticWater,
ASW-A
driaticSea
Water,
LSW-LevantineSurface
Water,
ISW-Ionian
Sea
Water,
BSW-Black
Sea
Water,
CC-C
retan
Cyclone,
IA-Ionian
Anticyclone,
PA-PelopsAnticyclone.
A.P. Karageorgis et al. / Deep-Sea Research I 55 (2008) 177–202182
ARTICLE IN PRESSA.P. Karageorgis et al. / Deep-Sea Research I 55 (2008) 177–202 183
(warmer and saltier) formed in the Aegean, outflowfrom the straits of the Cretan Arc replacing theEMDW of Adriatic origin. This abrupt change,called the Eastern Mediterranean Transient (EMT),was attributed to high Aegean Sea salinity, resultingfrom changes in either the circulation or the large-scale water budget (Roether et al., 1996). Inaddition, Zervakis et al. (2000), suggest that reducedBlack Sea outflow into the North Aegean couldfacilitate dense water formation during the passageof cold atmospheric fronts in the winter.
3. Methodology
3.1. Transmissometry
3.1.1. Data set description
The initial data set comprises LT measurementsconducted in parallel with routine CTD casts at3193 stations, occupied between 1991 and 2001 inthe Eastern Mediterranean. The data were obtainedfrom 12 research projects, which conducted a totalof 40 oceanographic cruises (Table 1), exclusively onboard the R/V AEGAEO. LT measurements havebeen obtained using two models of transmiss-ometers, both emitting in the red part of thespectrum: (a) a 10-cm path length by SeaTech(670 nm); and (b) a 25-cm path length by Chelsea(660 nm). SeaTech instruments have been usedwidely for the exploration of turbidity variationsin nepheloid layers (e.g. Spinrad et al., 1983;Gardner et al., 1985; McCave et al., 2001) andmoreover to relate light attenuation and PMC(Baker and Lavelle, 1984; Gardner et al., 1985;Bishop, 1986; Moody et al., 1987; Gardner, 1989a).One or occasionally both transmissometers wereused, and were interfaced with a Seabird ElectronicsSBE-19+CTD deck unit, sampling at 24Hz.Usually CTD/LT casts were conducted down to10m above bottom (mab), but in several cruisesthey reached 1–2mab, when the characteristics ofnear-bottom waters were being addressed in theresearch project. During field work, routinecleaning of the transmissometer lenses occurredbefore each cast and an air calibration wasperformed at the beginning of each cruise. Periodi-cally, the instruments were sent to the manufacturerfor calibration.
All CTD/LT raw data were processed by thephysical oceanographer in charge of each researchproject. The measurements underwent consistentfiltering and processing, as described in the SBE
software manual (available at www.seabird.com);data were 1-dbar bin-averaged after quality controlof raw data. Data from the projects CINCS,MATER, and PELAGOS were extracted from theHellenic National Oceanographic Data Center(HNODC), where they were processed and storedfollowing the MEDATLAS protocol (Maillardet al., 2002).
Data formats were extremely variable; therefore,the primary goal at first was to convert metadata(sampling date and time, station location, maximumwater depth, type of instrument used, etc.) and LTdata, to a common format. A number of project-specific Visual Basicr codes were developed toconvert all data to a single format; i.e. to store datain one ASCII file per sampling station, holdingmetadata in a header line, followed by the watercolumn profile data. The beam attenuation coeffi-cient (c, m�1) was computed at the same time andstored in the file, according to the equation:
c ¼ �1
LlnðLT=100Þ,
where L is the transmissometer’s path length (m)and LT is light transmission in percent units.
Subsequently, all stations obtained during asingle cruise were transferred into a ‘cruise file’ ina format compatible for input to Ocean Data View(ODV; Schlitzer, 2003). Metadata, LT, c, and othermeasured parameters, i.e., temperature, salinity,dissolved oxygen, fluorescence, etc. were also storedin ODV.
3.1.2. Estimation of beam cp
Beam c is the sum of three types of attenuations:(1) attenuation due to particles (cp, m�1); (2)attenuation due to particle-free water (cw, m�1);and (3) attenuation due to colored dissolved organicmatter (cCDOM, m�1). However, at the wavelengthof the transmissometers employed, the last compo-nent can be considered as negligible (Jerlov, 1968;Bricaud et al., 1981); therefore, c ¼ cp+cw.
Attenuation due to particle-free water (cw) hasdifferent reported values, so the SeaTech companyadjusts the electronics of all instruments to yield acw of 0.364m�1 to achieve standardization. In thefield, values of cw may be slightly higher or lowerthan 0.364m�1 in the cleanest part of the oceanbecause of a few particles in the water, instability ordrift of the light-emitting diode, pressure effects onthe instrument, or insufficient cleaning of thetransmissometer windows (Gardner et al., 2006).
ARTICLE IN PRESS
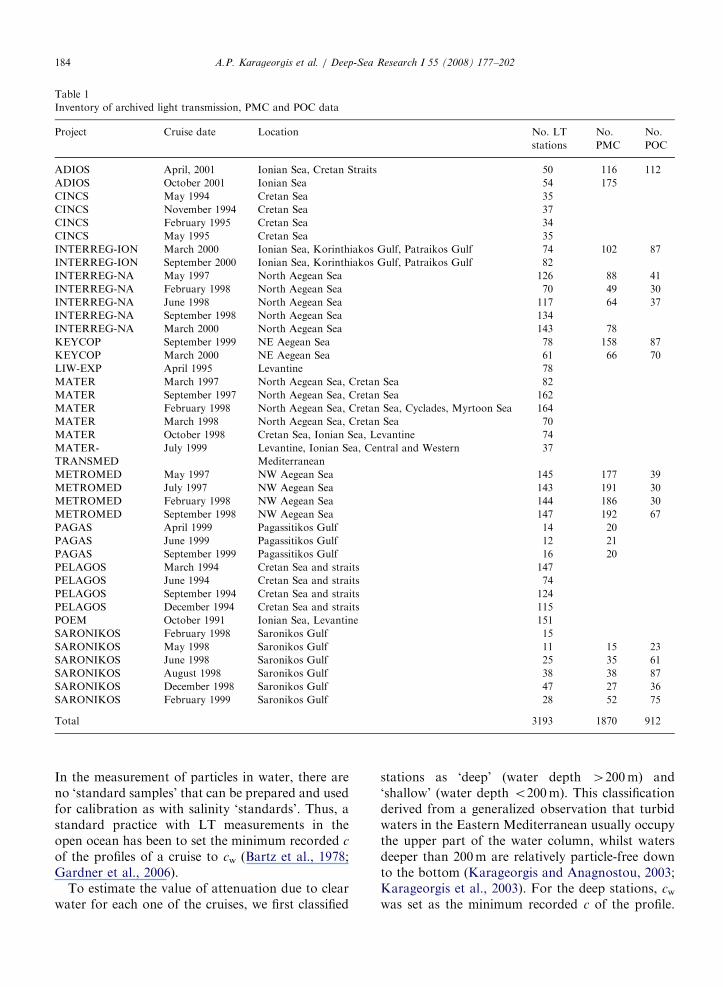
Table 1
Inventory of archived light transmission, PMC and POC data
Project Cruise date Location No. LT
stations
No.
PMC
No.
POC
ADIOS April, 2001 Ionian Sea, Cretan Straits 50 116 112
ADIOS October 2001 Ionian Sea 54 175
CINCS May 1994 Cretan Sea 35
CINCS November 1994 Cretan Sea 37
CINCS February 1995 Cretan Sea 34
CINCS May 1995 Cretan Sea 35
INTERREG-ION March 2000 Ionian Sea, Korinthiakos Gulf, Patraikos Gulf 74 102 87
INTERREG-ION September 2000 Ionian Sea, Korinthiakos Gulf, Patraikos Gulf 82
INTERREG-NA May 1997 North Aegean Sea 126 88 41
INTERREG-NA February 1998 North Aegean Sea 70 49 30
INTERREG-NA June 1998 North Aegean Sea 117 64 37
INTERREG-NA September 1998 North Aegean Sea 134
INTERREG-NA March 2000 North Aegean Sea 143 78
KEYCOP September 1999 NE Aegean Sea 78 158 87
KEYCOP March 2000 NE Aegean Sea 61 66 70
LIW-EXP April 1995 Levantine 78
MATER March 1997 North Aegean Sea, Cretan Sea 82
MATER September 1997 North Aegean Sea, Cretan Sea 162
MATER February 1998 North Aegean Sea, Cretan Sea, Cyclades, Myrtoon Sea 164
MATER March 1998 North Aegean Sea, Cretan Sea 70
MATER October 1998 Cretan Sea, Ionian Sea, Levantine 74
MATER-
TRANSMED
July 1999 Levantine, Ionian Sea, Central and Western
Mediterranean
37
METROMED May 1997 NW Aegean Sea 145 177 39
METROMED July 1997 NW Aegean Sea 143 191 30
METROMED February 1998 NW Aegean Sea 144 186 30
METROMED September 1998 NW Aegean Sea 147 192 67
PAGAS April 1999 Pagassitikos Gulf 14 20
PAGAS June 1999 Pagassitikos Gulf 12 21
PAGAS September 1999 Pagassitikos Gulf 16 20
PELAGOS March 1994 Cretan Sea and straits 147
PELAGOS June 1994 Cretan Sea and straits 74
PELAGOS September 1994 Cretan Sea and straits 124
PELAGOS December 1994 Cretan Sea and straits 115
POEM October 1991 Ionian Sea, Levantine 151
SARONIKOS February 1998 Saronikos Gulf 15
SARONIKOS May 1998 Saronikos Gulf 11 15 23
SARONIKOS June 1998 Saronikos Gulf 25 35 61
SARONIKOS August 1998 Saronikos Gulf 38 38 87
SARONIKOS December 1998 Saronikos Gulf 47 27 36
SARONIKOS February 1999 Saronikos Gulf 28 52 75
Total 3193 1870 912
A.P. Karageorgis et al. / Deep-Sea Research I 55 (2008) 177–202184
In the measurement of particles in water, there areno ‘standard samples’ that can be prepared and usedfor calibration as with salinity ‘standards’. Thus, astandard practice with LT measurements in theopen ocean has been to set the minimum recorded c
of the profiles of a cruise to cw (Bartz et al., 1978;Gardner et al., 2006).
To estimate the value of attenuation due to clearwater for each one of the cruises, we first classified
stations as ‘deep’ (water depth 4200m) and‘shallow’ (water depth o200m). This classificationderived from a generalized observation that turbidwaters in the Eastern Mediterranean usually occupythe upper part of the water column, whilst watersdeeper than 200m are relatively particle-free downto the bottom (Karageorgis and Anagnostou, 2003;Karageorgis et al., 2003). For the deep stations, cwwas set as the minimum recorded c of the profile.
ARTICLE IN PRESSA.P. Karageorgis et al. / Deep-Sea Research I 55 (2008) 177–202 185
For the shallow stations, cw was computed as theaverage of the deep-station c minima, c derivingfrom the same cruise. In cases where a cruiseoccupied only shallow stations, cw was set as theminimum c of the entire cruise. For shallow stationsit is possible that cw values contained a smallattenuation due to particles, so the reported cpvalues are slightly smaller than the true values.Subsequently, cp values were computed for eachcruise and the entire data set was stored in anew ODV compilation. Data obtained from multi-ple casts at the same station, usually restricted towater sampling in intermediate or near-surfacewaters, were removed from this compilation,and after data reduction the total number of castswas 2463.
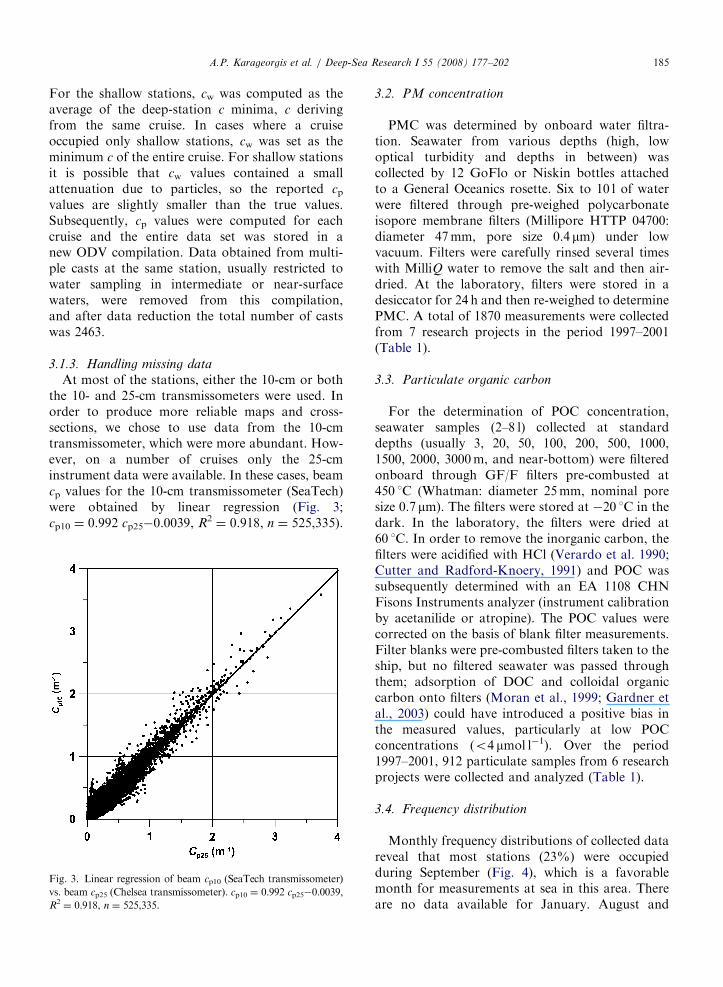
3.1.3. Handling missing data
At most of the stations, either the 10-cm or boththe 10- and 25-cm transmissometers were used. Inorder to produce more reliable maps and cross-sections, we chose to use data from the 10-cmtransmissometer, which were more abundant. How-ever, on a number of cruises only the 25-cminstrument data were available. In these cases, beamcp values for the 10-cm transmissometer (SeaTech)were obtained by linear regression (Fig. 3;cp10 ¼ 0.992 cp25�0.0039, R2
¼ 0.918, n ¼ 525,335).
Fig. 3. Linear regression of beam cp10 (SeaTech transmissometer)
vs. beam cp25 (Chelsea transmissometer). cp10 ¼ 0.992 cp25�0.0039,
R2¼ 0.918, n ¼ 525,335.
3.2. PM concentration
PMC was determined by onboard water filtra-tion. Seawater from various depths (high, lowoptical turbidity and depths in between) wascollected by 12 GoFlo or Niskin bottles attachedto a General Oceanics rosette. Six to 10 l of waterwere filtered through pre-weighed polycarbonateisopore membrane filters (Millipore HTTP 04700:diameter 47mm, pore size 0.4 mm) under lowvacuum. Filters were carefully rinsed several timeswith MilliQ water to remove the salt and then air-dried. At the laboratory, filters were stored in adesiccator for 24 h and then re-weighed to determinePMC. A total of 1870 measurements were collectedfrom 7 research projects in the period 1997–2001(Table 1).
3.3. Particulate organic carbon
For the determination of POC concentration,seawater samples (2–8 l) collected at standarddepths (usually 3, 20, 50, 100, 200, 500, 1000,1500, 2000, 3000m, and near-bottom) were filteredonboard through GF/F filters pre-combusted at450 1C (Whatman: diameter 25mm, nominal poresize 0.7 mm). The filters were stored at �20 1C in thedark. In the laboratory, the filters were dried at60 1C. In order to remove the inorganic carbon, thefilters were acidified with HCl (Verardo et al. 1990;Cutter and Radford-Knoery, 1991) and POC wassubsequently determined with an EA 1108 CHNFisons Instruments analyzer (instrument calibrationby acetanilide or atropine). The POC values werecorrected on the basis of blank filter measurements.Filter blanks were pre-combusted filters taken to theship, but no filtered seawater was passed throughthem; adsorption of DOC and colloidal organiccarbon onto filters (Moran et al., 1999; Gardner etal., 2003) could have introduced a positive bias inthe measured values, particularly at low POCconcentrations (o4 mmol l�1). Over the period1997–2001, 912 particulate samples from 6 researchprojects were collected and analyzed (Table 1).
3.4. Frequency distribution
Monthly frequency distributions of collected datareveal that most stations (23%) were occupiedduring September (Fig. 4), which is a favorablemonth for measurements at sea in this area. Thereare no data available for January. August and
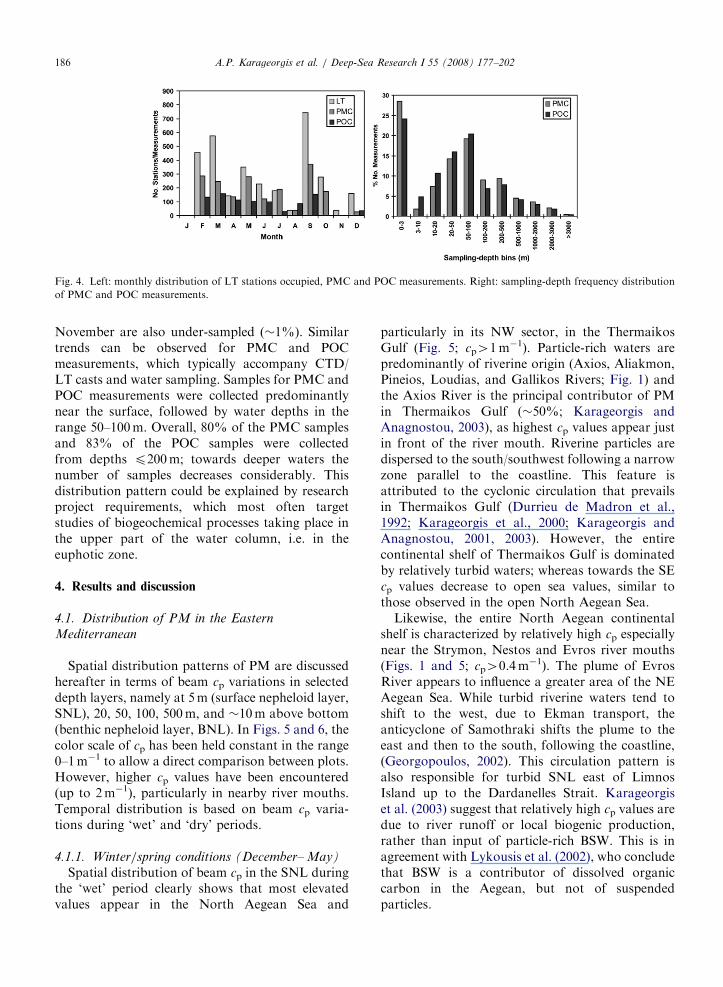
ARTICLE IN PRESS
Fig. 4. Left: monthly distribution of LT stations occupied, PMC and POC measurements. Right: sampling-depth frequency distribution
of PMC and POC measurements.
A.P. Karageorgis et al. / Deep-Sea Research I 55 (2008) 177–202186
November are also under-sampled (�1%). Similartrends can be observed for PMC and POCmeasurements, which typically accompany CTD/LT casts and water sampling. Samples for PMC andPOC measurements were collected predominantlynear the surface, followed by water depths in therange 50–100m. Overall, 80% of the PMC samplesand 83% of the POC samples were collectedfrom depths p200m; towards deeper waters thenumber of samples decreases considerably. Thisdistribution pattern could be explained by researchproject requirements, which most often targetstudies of biogeochemical processes taking place inthe upper part of the water column, i.e. in theeuphotic zone.
4. Results and discussion
4.1. Distribution of PM in the Eastern
Mediterranean
Spatial distribution patterns of PM are discussedhereafter in terms of beam cp variations in selecteddepth layers, namely at 5m (surface nepheloid layer,SNL), 20, 50, 100, 500m, and �10m above bottom(benthic nepheloid layer, BNL). In Figs. 5 and 6, thecolor scale of cp has been held constant in the range0–1m�1 to allow a direct comparison between plots.However, higher cp values have been encountered(up to 2m�1), particularly in nearby river mouths.Temporal distribution is based on beam cp varia-tions during ‘wet’ and ‘dry’ periods.
4.1.1. Winter/spring conditions (December– May)
Spatial distribution of beam cp in the SNL duringthe ‘wet’ period clearly shows that most elevatedvalues appear in the North Aegean Sea and
particularly in its NW sector, in the ThermaikosGulf (Fig. 5; cp41m�1). Particle-rich waters arepredominantly of riverine origin (Axios, Aliakmon,Pineios, Loudias, and Gallikos Rivers; Fig. 1) andthe Axios River is the principal contributor of PMin Thermaikos Gulf (�50%; Karageorgis andAnagnostou, 2003), as highest cp values appear justin front of the river mouth. Riverine particles aredispersed to the south/southwest following a narrowzone parallel to the coastline. This feature isattributed to the cyclonic circulation that prevailsin Thermaikos Gulf (Durrieu de Madron et al.,1992; Karageorgis et al., 2000; Karageorgis andAnagnostou, 2001, 2003). However, the entirecontinental shelf of Thermaikos Gulf is dominatedby relatively turbid waters; whereas towards the SEcp values decrease to open sea values, similar tothose observed in the open North Aegean Sea.
Likewise, the entire North Aegean continentalshelf is characterized by relatively high cp especiallynear the Strymon, Nestos and Evros river mouths(Figs. 1 and 5; cp40.4m�1). The plume of EvrosRiver appears to influence a greater area of the NEAegean Sea. While turbid riverine waters tend toshift to the west, due to Ekman transport, theanticyclone of Samothraki shifts the plume to theeast and then to the south, following the coastline,(Georgopoulos, 2002). This circulation pattern isalso responsible for turbid SNL east of LimnosIsland up to the Dardanelles Strait. Karageorgiset al. (2003) suggest that relatively high cp values aredue to river runoff or local biogenic production,rather than input of particle-rich BSW. This is inagreement with Lykousis et al. (2002), who concludethat BSW is a contributor of dissolved organiccarbon in the Aegean, but not of suspendedparticles.
ARTICLE IN PRESS
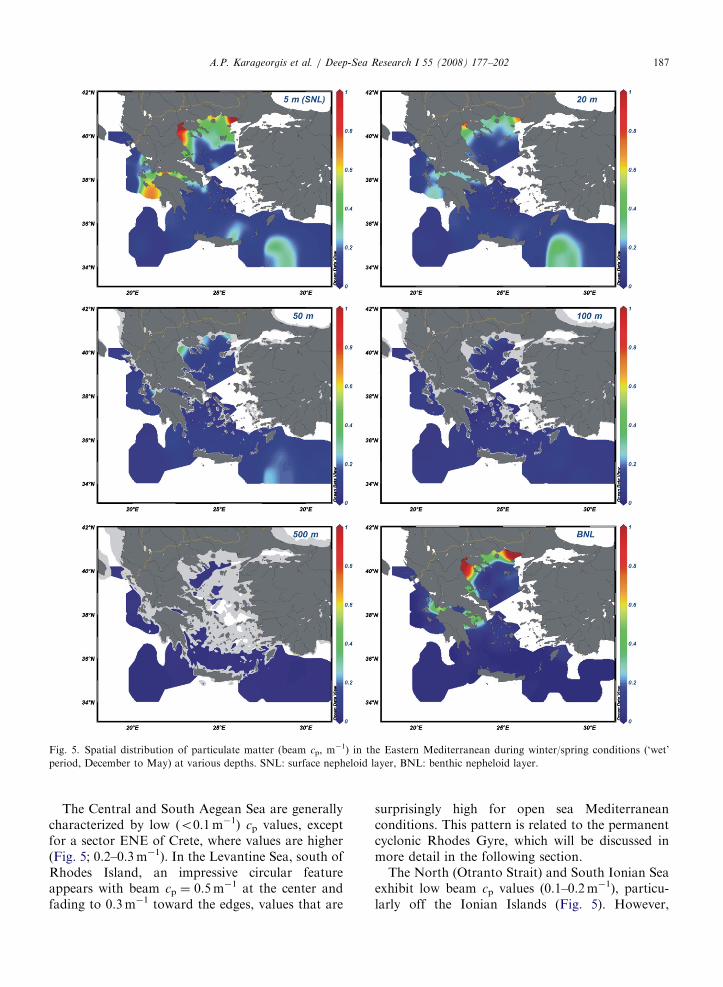
Fig. 5. Spatial distribution of particulate matter (beam cp, m�1) in the Eastern Mediterranean during winter/spring conditions (‘wet’
period, December to May) at various depths. SNL: surface nepheloid layer, BNL: benthic nepheloid layer.
A.P. Karageorgis et al. / Deep-Sea Research I 55 (2008) 177–202 187
The Central and South Aegean Sea are generallycharacterized by low (o0.1m�1) cp values, exceptfor a sector ENE of Crete, where values are higher(Fig. 5; 0.2–0.3m�1). In the Levantine Sea, south ofRhodes Island, an impressive circular featureappears with beam cp ¼ 0.5m�1 at the center andfading to 0.3m�1 toward the edges, values that are
surprisingly high for open sea Mediterraneanconditions. This pattern is related to the permanentcyclonic Rhodes Gyre, which will be discussed inmore detail in the following section.
The North (Otranto Strait) and South Ionian Seaexhibit low beam cp values (0.1–0.2m�1), particu-larly off the Ionian Islands (Fig. 5). However,
ARTICLE IN PRESS
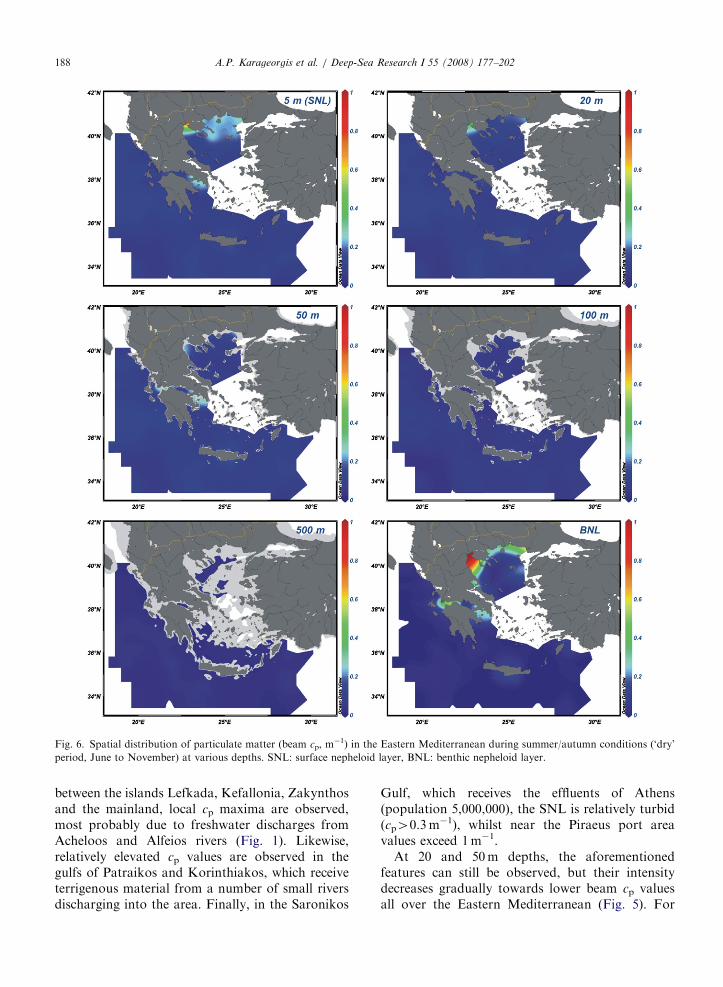
Fig. 6. Spatial distribution of particulate matter (beam cp, m�1) in the Eastern Mediterranean during summer/autumn conditions (‘dry’
period, June to November) at various depths. SNL: surface nepheloid layer, BNL: benthic nepheloid layer.
A.P. Karageorgis et al. / Deep-Sea Research I 55 (2008) 177–202188
between the islands Lefkada, Kefallonia, Zakynthosand the mainland, local cp maxima are observed,most probably due to freshwater discharges fromAcheloos and Alfeios rivers (Fig. 1). Likewise,relatively elevated cp values are observed in thegulfs of Patraikos and Korinthiakos, which receiveterrigenous material from a number of small riversdischarging into the area. Finally, in the Saronikos
Gulf, which receives the effluents of Athens(population 5,000,000), the SNL is relatively turbid(cp40.3m�1), whilst near the Piraeus port areavalues exceed 1m�1.
At 20 and 50m depths, the aforementionedfeatures can still be observed, but their intensitydecreases gradually towards lower beam cp valuesall over the Eastern Mediterranean (Fig. 5). For
ARTICLE IN PRESS
Table 2
Mean beam cp (m�1) during ‘wet’ and ‘dry’ periods in the Eastern
Mediterranean
Depth layer (m) ‘Wet’ period: mean
beam cp (m�1)71s
‘Dry’ period: mean
beam cp (m�1)71s
SNL-5 m 0.39170.533 0.18370.277
20 0.21870.207 0.13370.157
50 0.12270.117 0.11870.148
100 0.06670.073 0.06970.108
200 0.03970.055 0.03670.081
500 0.02470.031 0.02870.041
1000 0.00770.005 0.01370.012
BNL (1–10 mab) 0.33570.550 0.25470.418
A.P. Karageorgis et al. / Deep-Sea Research I 55 (2008) 177–202 189
example, the North Aegean shelf is characterized byrelatively turbid waters at 20m depth, but at 50mmost of the prominent features seen at 20m areabsent. The average cp value in the open sea is�0.1m�1, except for the Levantine, where, becauseof elevated biological productivity, cp values are0.2–0.3m�1. At 100, 200, and 500m depths, thePMC decreases and tends to be homogeneous in thearea, with average cp values of 0.07, 0.04, and0.02m�1, respectively (Table 2).
The BNL exhibits high optical variability (Fig. 5).All over the North Aegean continental shelf and upto �200m depth, the layers near the bottom wereturbid, with a thickness ranging from 1–2 to 60mabove bottom, and showing locally even higher cpvalues than the SNL (on average the SNL exhibitscp ¼ 0.33 and the BNL cp ¼ 0.29). Once more, mostturbid areas were found in the vicinity of rivermouths. BNLs are generally attributed to resuspen-sion of fine-grained surface sediment by wave-induced bottom currents (e.g. Gardner, 1989a, b;Poulos, 2001). This holds true for the shallow sectorof the continental shelf (depth 30–40m), whilst indeeper waters BNLs originate from lateral advec-tion of particles resuspended nearshore (e.g. Biscayeand Eittreim, 1977; Richardson, 1987; Durrieu deMadron et al., 1992; Karageorgis and Anagnostou,2003). Intense resuspension near river mouths isalso related to the composition of prodeltaic surfacesediments, being recently deposited, unconsolidatedand probably deficient in organic matter that couldbind the sediment and inhibit resuspension. En-hanced BNLs are also observed in coastal areas andenclosed gulfs, whereas in the open sea there is noevidence of sediment resuspension. However, thelack of BNLs in the deep sectors of the EasternMediterranean may be due to operational condi-tions. For example, in cases of stormy weather, the
casts were not conducted very near the bottom, forfear of a crash of the CTD/rosette unit. In addition,sometimes the available cable length was less thanthe actual station depth.
4.1.2. Summer/autumn conditions
(June– November)
The SNL during the ‘dry’ period exhibits lower cpvalues in the North Aegean Sea and particularly inThermaikos Gulf and other coastal areas influencedby river discharges (Fig. 6). Although the distribu-tion patterns are comparable to those of the ‘wet’period, absolute cp values are lower (o1m�1).Moreover, turbid zones do not extend as faroffshore as during the ‘wet’ period. Except in somecoastal areas (e.g., Saronikos and PagassitikosGulfs), the SNL is fairly homogeneous throughoutthe study area, exhibiting average cp values of0.18m�1. The situation is similar at 20 and 50mdepth, average cp values decreasing gradually to0.13 and 0.12m�1, respectively (Fig. 6; Table 2).The major differences in the spatial distribution ofcp between the ‘wet’ and the ‘dry’ period are mostlyin the upper water layers, to 50m depth. In deeperlayers, waters become extremely transparent withaverage cp values ranging between 0.07m�1 at100m and o0.02m�1 at 1000m depth (Fig. 6;Table 2). While mean BNL cp values are higher thanSNL cp values during the ‘dry’ period (0.25470.418and 0.18370.277, respectively), this relationship isreversed during the ‘wet’ period; i.e. SNL cp valuesare higher than BNL cp values (0.39170.533 and0.33570.550, respectively), though perhaps thedifferences are not statistically significant. ‘Wet’period cp values are greater than ‘dry’ period valuesin both layers. This pattern suggests clearly that theformation of BNLs is independent of season,although higher terrigenous inputs during the rain-fall periods may increase the intensity of the BNL insome coastal locations.
4.2. Relationships between cp and mesoscale dynamic
features
Apart from beam cp spatial variations during‘wet’ and ‘dry’ periods, a number of interestingfeatures were identified during data analysisdealing largely with elevated cp values either in theopen sea or coastal areas and were attributed tothe influence of cyclonic/anticyclonic gyres on thedistribution of cp. Some characteristic cases arediscussed hereafter.
ARTICLE IN PRESSA.P. Karageorgis et al. / Deep-Sea Research I 55 (2008) 177–202190
ARTICLE IN PRESSA.P. Karageorgis et al. / Deep-Sea Research I 55 (2008) 177–202 191
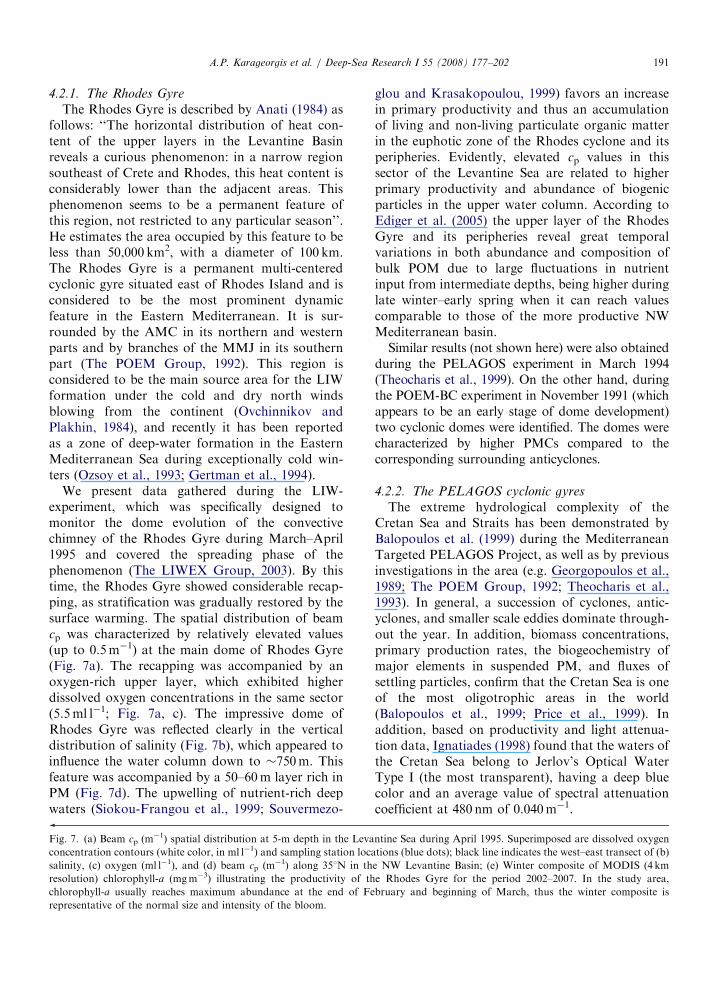
4.2.1. The Rhodes Gyre
The Rhodes Gyre is described by Anati (1984) asfollows: ‘‘The horizontal distribution of heat con-tent of the upper layers in the Levantine Basinreveals a curious phenomenon: in a narrow regionsoutheast of Crete and Rhodes, this heat content isconsiderably lower than the adjacent areas. Thisphenomenon seems to be a permanent feature ofthis region, not restricted to any particular season’’.He estimates the area occupied by this feature to beless than 50,000 km2, with a diameter of 100 km.The Rhodes Gyre is a permanent multi-centeredcyclonic gyre situated east of Rhodes Island and isconsidered to be the most prominent dynamicfeature in the Eastern Mediterranean. It is sur-rounded by the AMC in its northern and westernparts and by branches of the MMJ in its southernpart (The POEM Group, 1992). This region isconsidered to be the main source area for the LIWformation under the cold and dry north windsblowing from the continent (Ovchinnikov andPlakhin, 1984), and recently it has been reportedas a zone of deep-water formation in the EasternMediterranean Sea during exceptionally cold win-ters (Ozsoy et al., 1993; Gertman et al., 1994).
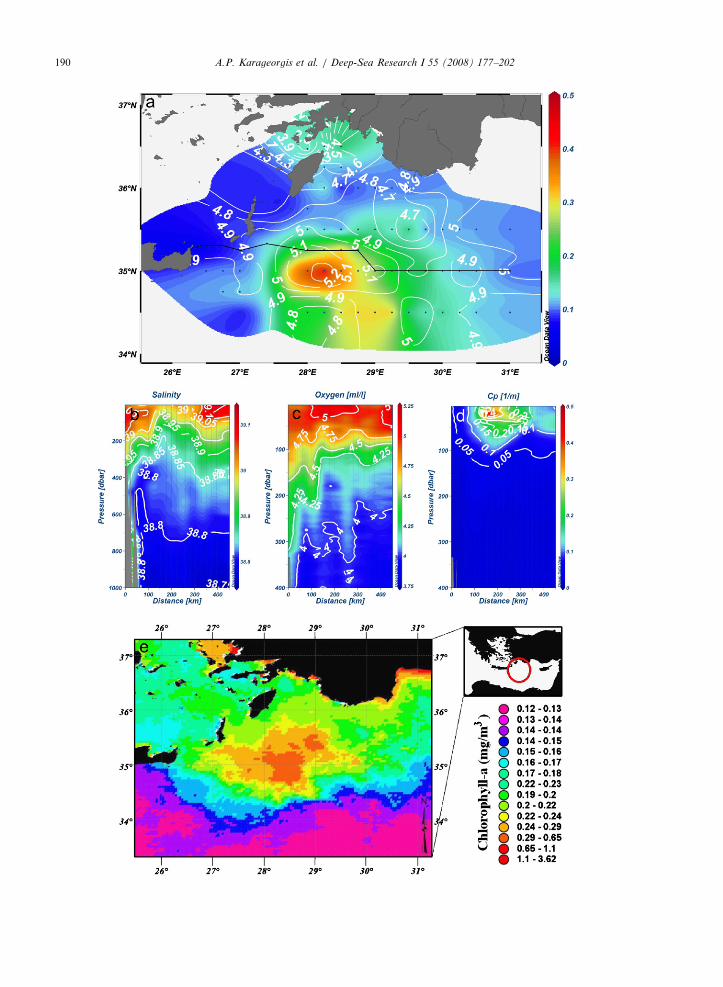
We present data gathered during the LIW-experiment, which was specifically designed tomonitor the dome evolution of the convectivechimney of the Rhodes Gyre during March–April1995 and covered the spreading phase of thephenomenon (The LIWEX Group, 2003). By thistime, the Rhodes Gyre showed considerable recap-ping, as stratification was gradually restored by thesurface warming. The spatial distribution of beamcp was characterized by relatively elevated values(up to 0.5m�1) at the main dome of Rhodes Gyre(Fig. 7a). The recapping was accompanied by anoxygen-rich upper layer, which exhibited higherdissolved oxygen concentrations in the same sector(5.5ml l�1; Fig. 7a, c). The impressive dome ofRhodes Gyre was reflected clearly in the verticaldistribution of salinity (Fig. 7b), which appeared toinfluence the water column down to �750m. Thisfeature was accompanied by a 50–60m layer rich inPM (Fig. 7d). The upwelling of nutrient-rich deepwaters (Siokou-Frangou et al., 1999; Souvermezo-
Fig. 7. (a) Beam cp (m�1) spatial distribution at 5-m depth in the Leva
concentration contours (white color, in ml l�1) and sampling station loca
salinity, (c) oxygen (ml l�1), and (d) beam cp (m�1) along 351N in th
resolution) chlorophyll-a (mgm�3) illustrating the productivity of th
chlorophyll-a usually reaches maximum abundance at the end of Fe
representative of the normal size and intensity of the bloom.
glou and Krasakopoulou, 1999) favors an increasein primary productivity and thus an accumulationof living and non-living particulate organic matterin the euphotic zone of the Rhodes cyclone and itsperipheries. Evidently, elevated cp values in thissector of the Levantine Sea are related to higherprimary productivity and abundance of biogenicparticles in the upper water column. According toEdiger et al. (2005) the upper layer of the RhodesGyre and its peripheries reveal great temporalvariations in both abundance and composition ofbulk POM due to large fluctuations in nutrientinput from intermediate depths, being higher duringlate winter–early spring when it can reach valuescomparable to those of the more productive NWMediterranean basin.
Similar results (not shown here) were also obtainedduring the PELAGOS experiment in March 1994(Theocharis et al., 1999). On the other hand, duringthe POEM-BC experiment in November 1991 (whichappears to be an early stage of dome development)two cyclonic domes were identified. The domes werecharacterized by higher PMCs compared to thecorresponding surrounding anticyclones.
4.2.2. The PELAGOS cyclonic gyres
The extreme hydrological complexity of theCretan Sea and Straits has been demonstrated byBalopoulos et al. (1999) during the MediterraneanTargeted PELAGOS Project, as well as by previousinvestigations in the area (e.g. Georgopoulos et al.,1989; The POEM Group, 1992; Theocharis et al.,1993). In general, a succession of cyclones, antic-yclones, and smaller scale eddies dominate through-out the year. In addition, biomass concentrations,primary production rates, the biogeochemistry ofmajor elements in suspended PM, and fluxes ofsettling particles, confirm that the Cretan Sea is oneof the most oligotrophic areas in the world(Balopoulos et al., 1999; Price et al., 1999). Inaddition, based on productivity and light attenua-tion data, Ignatiades (1998) found that the waters ofthe Cretan Sea belong to Jerlov’s Optical WaterType I (the most transparent), having a deep bluecolor and an average value of spectral attenuationcoefficient at 480 nm of 0.040m�1.
ntine Sea during April 1995. Superimposed are dissolved oxygen
tions (blue dots); black line indicates the west–east transect of (b)
e NW Levantine Basin; (e) Winter composite of MODIS (4 km
e Rhodes Gyre for the period 2002–2007. In the study area,
bruary and beginning of March, thus the winter composite is
ARTICLE IN PRESS
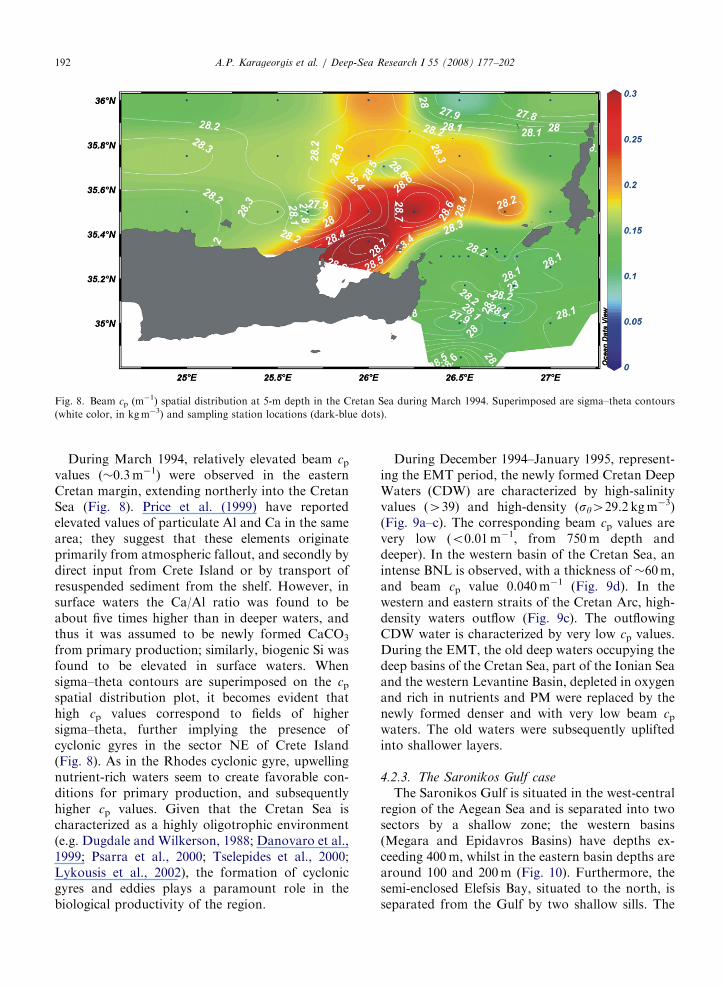
Fig. 8. Beam cp (m�1) spatial distribution at 5-m depth in the Cretan Sea during March 1994. Superimposed are sigma–theta contours
(white color, in kgm�3) and sampling station locations (dark-blue dots).
A.P. Karageorgis et al. / Deep-Sea Research I 55 (2008) 177–202192
During March 1994, relatively elevated beam cpvalues (�0.3m�1) were observed in the easternCretan margin, extending northerly into the CretanSea (Fig. 8). Price et al. (1999) have reportedelevated values of particulate Al and Ca in the samearea; they suggest that these elements originateprimarily from atmospheric fallout, and secondly bydirect input from Crete Island or by transport ofresuspended sediment from the shelf. However, insurface waters the Ca/Al ratio was found to beabout five times higher than in deeper waters, andthus it was assumed to be newly formed CaCO3
from primary production; similarly, biogenic Si wasfound to be elevated in surface waters. Whensigma–theta contours are superimposed on the cpspatial distribution plot, it becomes evident thathigh cp values correspond to fields of highersigma–theta, further implying the presence ofcyclonic gyres in the sector NE of Crete Island(Fig. 8). As in the Rhodes cyclonic gyre, upwellingnutrient-rich waters seem to create favorable con-ditions for primary production, and subsequentlyhigher cp values. Given that the Cretan Sea ischaracterized as a highly oligotrophic environment(e.g. Dugdale and Wilkerson, 1988; Danovaro et al.,1999; Psarra et al., 2000; Tselepides et al., 2000;Lykousis et al., 2002), the formation of cyclonicgyres and eddies plays a paramount role in thebiological productivity of the region.
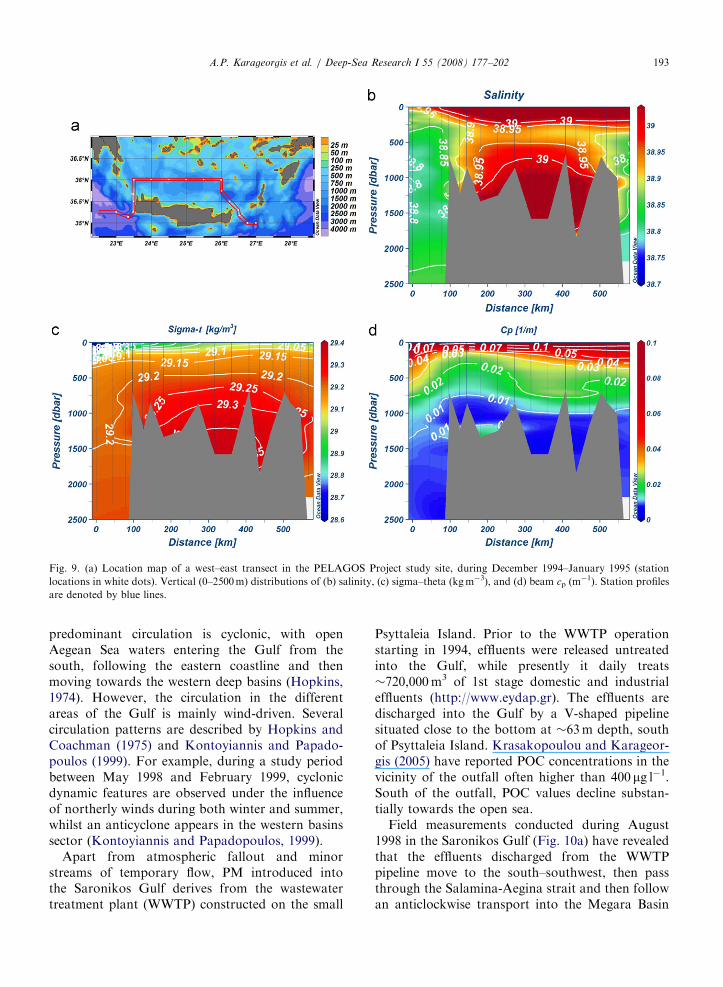
During December 1994–January 1995, represent-ing the EMT period, the newly formed Cretan DeepWaters (CDW) are characterized by high-salinityvalues (439) and high-density (sy429.2 kgm�3)(Fig. 9a–c). The corresponding beam cp values arevery low (o0.01m�1, from 750m depth anddeeper). In the western basin of the Cretan Sea, anintense BNL is observed, with a thickness of �60m,and beam cp value 0.040m�1 (Fig. 9d). In thewestern and eastern straits of the Cretan Arc, high-density waters outflow (Fig. 9c). The outflowingCDW water is characterized by very low cp values.During the EMT, the old deep waters occupying thedeep basins of the Cretan Sea, part of the Ionian Seaand the western Levantine Basin, depleted in oxygenand rich in nutrients and PM were replaced by thenewly formed denser and with very low beam cpwaters. The old waters were subsequently upliftedinto shallower layers.
4.2.3. The Saronikos Gulf case
The Saronikos Gulf is situated in the west-centralregion of the Aegean Sea and is separated into twosectors by a shallow zone; the western basins(Megara and Epidavros Basins) have depths ex-ceeding 400m, whilst in the eastern basin depths arearound 100 and 200m (Fig. 10). Furthermore, thesemi-enclosed Elefsis Bay, situated to the north, isseparated from the Gulf by two shallow sills. The
ARTICLE IN PRESS
Fig. 9. (a) Location map of a west–east transect in the PELAGOS Project study site, during December 1994–January 1995 (station
locations in white dots). Vertical (0–2500m) distributions of (b) salinity, (c) sigma–theta (kgm�3), and (d) beam cp (m�1). Station profiles
are denoted by blue lines.
A.P. Karageorgis et al. / Deep-Sea Research I 55 (2008) 177–202 193
predominant circulation is cyclonic, with openAegean Sea waters entering the Gulf from thesouth, following the eastern coastline and thenmoving towards the western deep basins (Hopkins,1974). However, the circulation in the differentareas of the Gulf is mainly wind-driven. Severalcirculation patterns are described by Hopkins andCoachman (1975) and Kontoyiannis and Papado-poulos (1999). For example, during a study periodbetween May 1998 and February 1999, cyclonicdynamic features are observed under the influenceof northerly winds during both winter and summer,whilst an anticyclone appears in the western basinssector (Kontoyiannis and Papadopoulos, 1999).
Apart from atmospheric fallout and minorstreams of temporary flow, PM introduced intothe Saronikos Gulf derives from the wastewatertreatment plant (WWTP) constructed on the small
Psyttaleia Island. Prior to the WWTP operationstarting in 1994, effluents were released untreatedinto the Gulf, while presently it daily treats�720,000m3 of 1st stage domestic and industrialeffluents (http://www.eydap.gr). The effluents aredischarged into the Gulf by a V-shaped pipelinesituated close to the bottom at �63m depth, southof Psyttaleia Island. Krasakopoulou and Karageor-gis (2005) have reported POC concentrations in thevicinity of the outfall often higher than 400 mg l�1.South of the outfall, POC values decline substan-tially towards the open sea.
Field measurements conducted during August1998 in the Saronikos Gulf (Fig. 10a) have revealedthat the effluents discharged from the WWTPpipeline move to the south–southwest, then passthrough the Salamina-Aegina strait and then followan anticlockwise transport into the Megara Basin
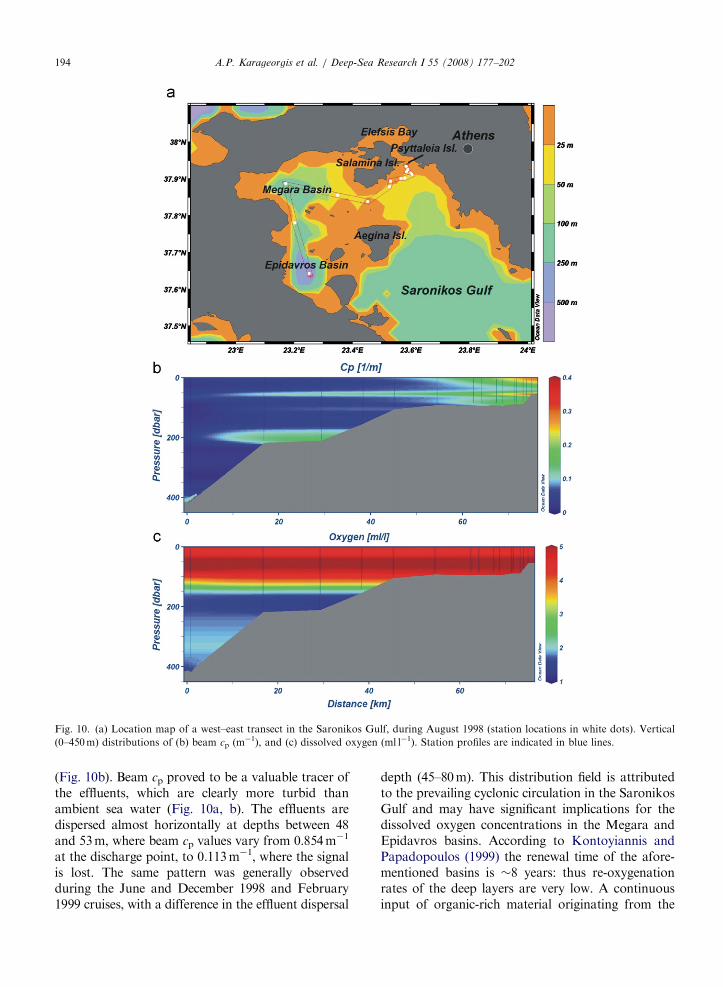
ARTICLE IN PRESS
Fig. 10. (a) Location map of a west–east transect in the Saronikos Gulf, during August 1998 (station locations in white dots). Vertical
(0–450m) distributions of (b) beam cp (m�1), and (c) dissolved oxygen (ml l�1). Station profiles are indicated in blue lines.
A.P. Karageorgis et al. / Deep-Sea Research I 55 (2008) 177–202194
(Fig. 10b). Beam cp proved to be a valuable tracer ofthe effluents, which are clearly more turbid thanambient sea water (Fig. 10a, b). The effluents aredispersed almost horizontally at depths between 48and 53m, where beam cp values vary from 0.854m�1
at the discharge point, to 0.113m�1, where the signalis lost. The same pattern was generally observedduring the June and December 1998 and February1999 cruises, with a difference in the effluent dispersal
depth (45–80m). This distribution field is attributedto the prevailing cyclonic circulation in the SaronikosGulf and may have significant implications for thedissolved oxygen concentrations in the Megara andEpidavros basins. According to Kontoyiannis andPapadopoulos (1999) the renewal time of the afore-mentioned basins is �8 years: thus re-oxygenationrates of the deep layers are very low. A continuousinput of organic-rich material originating from the
ARTICLE IN PRESS
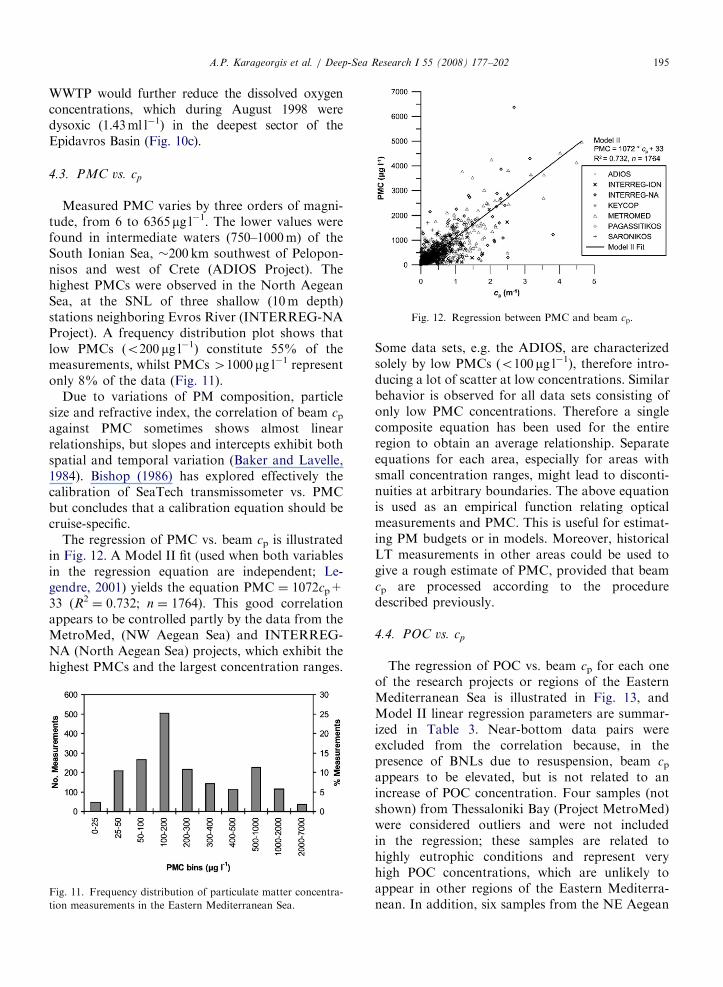
Fig. 12. Regression between PMC and beam cp.
A.P. Karageorgis et al. / Deep-Sea Research I 55 (2008) 177–202 195
WWTP would further reduce the dissolved oxygenconcentrations, which during August 1998 weredysoxic (1.43ml l�1) in the deepest sector of theEpidavros Basin (Fig. 10c).
4.3. PMC vs. cp
Measured PMC varies by three orders of magni-tude, from 6 to 6365 mg l�1. The lower values werefound in intermediate waters (750–1000m) of theSouth Ionian Sea, �200 km southwest of Pelopon-nisos and west of Crete (ADIOS Project). Thehighest PMCs were observed in the North AegeanSea, at the SNL of three shallow (10m depth)stations neighboring Evros River (INTERREG-NAProject). A frequency distribution plot shows thatlow PMCs (o200 mg l�1) constitute 55% of themeasurements, whilst PMCs 41000 mg l�1 representonly 8% of the data (Fig. 11).
Due to variations of PM composition, particlesize and refractive index, the correlation of beam cpagainst PMC sometimes shows almost linearrelationships, but slopes and intercepts exhibit bothspatial and temporal variation (Baker and Lavelle,1984). Bishop (1986) has explored effectively thecalibration of SeaTech transmissometer vs. PMCbut concludes that a calibration equation should becruise-specific.
The regression of PMC vs. beam cp is illustratedin Fig. 12. A Model II fit (used when both variablesin the regression equation are independent; Le-gendre, 2001) yields the equation PMC ¼ 1072cp+33 (R2
¼ 0.732; n ¼ 1764). This good correlationappears to be controlled partly by the data from theMetroMed, (NW Aegean Sea) and INTERREG-NA (North Aegean Sea) projects, which exhibit thehighest PMCs and the largest concentration ranges.
Fig. 11. Frequency distribution of particulate matter concentra-
tion measurements in the Eastern Mediterranean Sea.
Some data sets, e.g. the ADIOS, are characterizedsolely by low PMCs (o100 mg l�1), therefore intro-ducing a lot of scatter at low concentrations. Similarbehavior is observed for all data sets consisting ofonly low PMC concentrations. Therefore a singlecomposite equation has been used for the entireregion to obtain an average relationship. Separateequations for each area, especially for areas withsmall concentration ranges, might lead to disconti-nuities at arbitrary boundaries. The above equationis used as an empirical function relating opticalmeasurements and PMC. This is useful for estimat-ing PM budgets or in models. Moreover, historicalLT measurements in other areas could be used togive a rough estimate of PMC, provided that beamcp are processed according to the proceduredescribed previously.
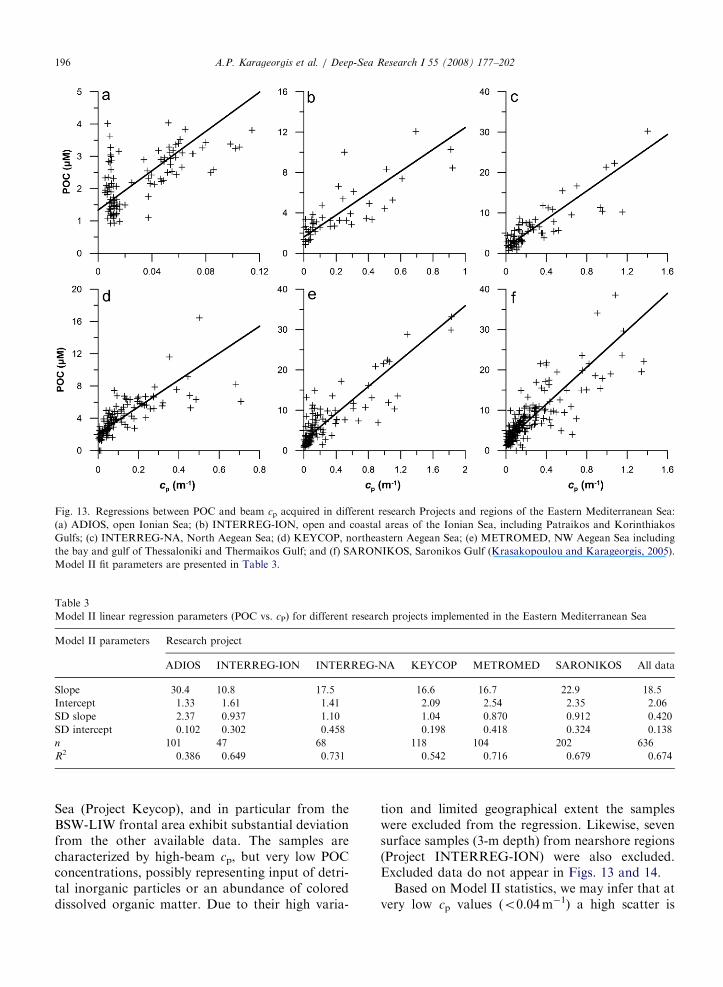
4.4. POC vs. cp
The regression of POC vs. beam cp for each oneof the research projects or regions of the EasternMediterranean Sea is illustrated in Fig. 13, andModel II linear regression parameters are summar-ized in Table 3. Near-bottom data pairs wereexcluded from the correlation because, in thepresence of BNLs due to resuspension, beam cpappears to be elevated, but is not related to anincrease of POC concentration. Four samples (notshown) from Thessaloniki Bay (Project MetroMed)were considered outliers and were not includedin the regression; these samples are related tohighly eutrophic conditions and represent veryhigh POC concentrations, which are unlikely toappear in other regions of the Eastern Mediterra-nean. In addition, six samples from the NE Aegean
ARTICLE IN PRESS
Fig. 13. Regressions between POC and beam cp acquired in different research Projects and regions of the Eastern Mediterranean Sea:
(a) ADIOS, open Ionian Sea; (b) INTERREG-ION, open and coastal areas of the Ionian Sea, including Patraikos and Korinthiakos
Gulfs; (c) INTERREG-NA, North Aegean Sea; (d) KEYCOP, northeastern Aegean Sea; (e) METROMED, NW Aegean Sea including
the bay and gulf of Thessaloniki and Thermaikos Gulf; and (f) SARONIKOS, Saronikos Gulf (Krasakopoulou and Karageorgis, 2005).
Model II fit parameters are presented in Table 3.
Table 3
Model II linear regression parameters (POC vs. cP) for different research projects implemented in the Eastern Mediterranean Sea
Model II parameters Research project
ADIOS INTERREG-ION INTERREG-NA KEYCOP METROMED SARONIKOS All data
Slope 30.4 10.8 17.5 16.6 16.7 22.9 18.5
Intercept 1.33 1.61 1.41 2.09 2.54 2.35 2.06
SD slope 2.37 0.937 1.10 1.04 0.870 0.912 0.420
SD intercept 0.102 0.302 0.458 0.198 0.418 0.324 0.138
n 101 47 68 118 104 202 636
R2 0.386 0.649 0.731 0.542 0.716 0.679 0.674
A.P. Karageorgis et al. / Deep-Sea Research I 55 (2008) 177–202196
Sea (Project Keycop), and in particular from theBSW-LIW frontal area exhibit substantial deviationfrom the other available data. The samples arecharacterized by high-beam cp, but very low POCconcentrations, possibly representing input of detri-tal inorganic particles or an abundance of coloreddissolved organic matter. Due to their high varia-
tion and limited geographical extent the sampleswere excluded from the regression. Likewise, sevensurface samples (3-m depth) from nearshore regions(Project INTERREG-ION) were also excluded.Excluded data do not appear in Figs. 13 and 14.
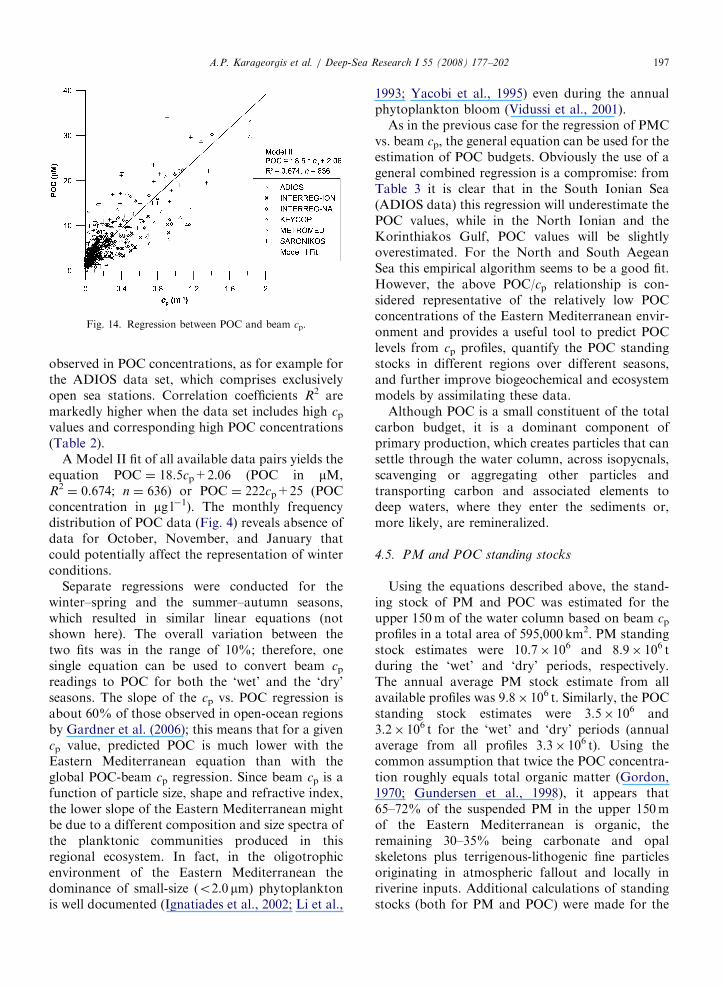
Based on Model II statistics, we may infer that atvery low cp values (o0.04m�1) a high scatter is
ARTICLE IN PRESS
Fig. 14. Regression between POC and beam cp.
A.P. Karageorgis et al. / Deep-Sea Research I 55 (2008) 177–202 197
observed in POC concentrations, as for example forthe ADIOS data set, which comprises exclusivelyopen sea stations. Correlation coefficients R2 aremarkedly higher when the data set includes high cpvalues and corresponding high POC concentrations(Table 2).
A Model II fit of all available data pairs yields theequation POC ¼ 18.5cp+2.06 (POC in mM,R2¼ 0.674; n ¼ 636) or POC ¼ 222cp+25 (POC
concentration in mg l�1). The monthly frequencydistribution of POC data (Fig. 4) reveals absence ofdata for October, November, and January thatcould potentially affect the representation of winterconditions.
Separate regressions were conducted for thewinter–spring and the summer–autumn seasons,which resulted in similar linear equations (notshown here). The overall variation between thetwo fits was in the range of 10%; therefore, onesingle equation can be used to convert beam cpreadings to POC for both the ‘wet’ and the ‘dry’seasons. The slope of the cp vs. POC regression isabout 60% of those observed in open-ocean regionsby Gardner et al. (2006); this means that for a givencp value, predicted POC is much lower with theEastern Mediterranean equation than with theglobal POC-beam cp regression. Since beam cp is afunction of particle size, shape and refractive index,the lower slope of the Eastern Mediterranean mightbe due to a different composition and size spectra ofthe planktonic communities produced in thisregional ecosystem. In fact, in the oligotrophicenvironment of the Eastern Mediterranean thedominance of small-size (o2.0 mm) phytoplanktonis well documented (Ignatiades et al., 2002; Li et al.,
1993; Yacobi et al., 1995) even during the annualphytoplankton bloom (Vidussi et al., 2001).
As in the previous case for the regression of PMCvs. beam cp, the general equation can be used for theestimation of POC budgets. Obviously the use of ageneral combined regression is a compromise: fromTable 3 it is clear that in the South Ionian Sea(ADIOS data) this regression will underestimate thePOC values, while in the North Ionian and theKorinthiakos Gulf, POC values will be slightlyoverestimated. For the North and South AegeanSea this empirical algorithm seems to be a good fit.However, the above POC/cp relationship is con-sidered representative of the relatively low POCconcentrations of the Eastern Mediterranean envir-onment and provides a useful tool to predict POClevels from cp profiles, quantify the POC standingstocks in different regions over different seasons,and further improve biogeochemical and ecosystemmodels by assimilating these data.
Although POC is a small constituent of the totalcarbon budget, it is a dominant component ofprimary production, which creates particles that cansettle through the water column, across isopycnals,scavenging or aggregating other particles andtransporting carbon and associated elements todeep waters, where they enter the sediments or,more likely, are remineralized.
4.5. PM and POC standing stocks
Using the equations described above, the stand-ing stock of PM and POC was estimated for theupper 150m of the water column based on beam cpprofiles in a total area of 595,000 km2. PM standingstock estimates were 10.7� 106 and 8.9� 106 tduring the ‘wet’ and ‘dry’ periods, respectively.The annual average PM stock estimate from allavailable profiles was 9.8� 106 t. Similarly, the POCstanding stock estimates were 3.5� 106 and3.2� 106 t for the ‘wet’ and ‘dry’ periods (annualaverage from all profiles 3.3� 106 t). Using thecommon assumption that twice the POC concentra-tion roughly equals total organic matter (Gordon,1970; Gundersen et al., 1998), it appears that65–72% of the suspended PM in the upper 150mof the Eastern Mediterranean is organic, theremaining 30–35% being carbonate and opalskeletons plus terrigenous-lithogenic fine particlesoriginating in atmospheric fallout and locally inriverine inputs. Additional calculations of standingstocks (both for PM and POC) were made for the
ARTICLE IN PRESSA.P. Karageorgis et al. / Deep-Sea Research I 55 (2008) 177–202198
periods March–August (high primary production)and September–February (low primary produc-tion), but differences were not statistically signifi-cant. However, since there is a much larger numberof profiles per square km in coastal areas, whereconcentrations are higher, the standing stocks areprobably skewed to high concentrations. Profiles inthe open ocean are further apart, but they representlarger areas of low-concentration water.
The standing stock of POC (integrated over0–150m) in the South Ionian Sea (ADIOS site:latitude 341300–351400N, longitude 201090–201470E)in an area of 17.9� 109m2, is about 90� 103 t POC,which corresponds to a mean concentration of33.6 mgC l�1. By definition, the POC flux(mgCm�2 d�1) is the product of the POC concen-tration (mgC l�1) times the corresponding sinkingspeed (md�1) for each assemblage of particleshaving different settling velocities. Settling particleshave sizes ranging from sub-micron colloids topicoplankton (ffi1 mm) to large microplankton(X300 mm) and particle aggregates. Size (or dia-meter) and density are the primary properties ofparticles that affect their settling speeds in the watercolumn, being slower for the small picoplankton(o1md�1) and faster for large particles andaggregates (0.1–100md�1). If we assume the pre-sence of an almost uniform particle population withan average settling velocity of 5md�1, the estimatedPOC flux through 150m is �168mgCm�2 d�1.Comparing this value with the mean annual POCflux (3.97mgCm�2 d�1) measured at a sedimenttrap deployed at 186m in the same area for theperiod May 2001–April 2002 (S. Stavrakakis, pers.comm.), then only �2.5% of the carbon standingcrop at 0–150m needs to reach the trap at 186m toproduce the observed flux. Consequently, about97% of POC would be recycled in the upper 150mor degraded into dissolved organic and inorganicforms. The estimated carbon export from the upperlayer is lower than the values of 5–10% observed inopen ocean (Buesseler, 1998) and suggests thatabout 97% of the primary production is sustainedby internal recycling of organic matter. Integratedprimary production rates from two stations in theSouth Ionian Sea during summer 1996 are some-what higher than the previously estimated POC fluxthrough 150m (255 and 313mgCm�2 d�1), but theexport of carbon was estimated to represent �3.3%of the integrated primary production (Moutin andRaimbault, 2002). Conversely, we could roughlyestimate a range of mean sinking speeds of POC by
assuming that 5–10% of the carbon is exportedfrom the upper layer. Such a calculation suggeststhat the mean settling velocity is only about1.2–2.4md�1 in the upper water column, which ismuch slower than the 100md�1 rate estimated fromtraps near the seafloor (Deuser et al., 1981).
5. Conclusions
The analysis of historical light transmissionmeasurements from the NE Mediterranean Seaprovided useful algorithms and estimates of PMand POC. Data reduction methods were standar-dized, which yielded more accurate and reliablebeam cp data from a great number of differentresearch projects and cruises; thus cp data can nowbe directly interrelated. Plots of beam cp over theentire study area at various depths exhibit distribu-tion patterns typical of other studies (high surfacevalues, low subsurface values with little variationwith depth, and occasional increases near theseafloor) and good fit between different data sets.We were able to differentiate distribution patternsbetween ‘wet’ and ‘dry’ seasons and observedseasonal variability of PM in the NE Mediterra-nean. Regions with abnormally high and low valuesof beam cp were identified and directly related tophysical factors affecting PM distribution in thewater column (e.g. river input or eutrophic waters).
The correlation of PMC and POC concentrationvs. optical measurements is significant and willcontribute to generalized equations for the NEMediterranean. Although there were differences inthe regressions of POC/cp or PM/cp data within thisarea, there was no significant seasonal differencefound in the combined data. The slope of the POCconcentration vs. cp regressions is about 60% ofthose observed in open-ocean regions by Gardner etal. (2006) and could reflect different ecosystems inlow-nutrient waters. These equations will be usefulin future research projects for estimates of PM/POCbudgets and in modeling exercises. Using theseequations, the average PM and POC stocks at theupper part of the water column (0–150m) wereestimated at 9.8� 106 and 3.3� 106 t, respectively.A comparison of the POC standing stock in theSouth Ionian Sea with available sediment trap datasuggested that about 97% of the POC may berecycled in the upper 150m, and only the remainingminor proportion escapes towards deeper depths.
A closer inspection of the data set in differentsectors of the Eastern Mediterranean, influenced by
ARTICLE IN PRESSA.P. Karageorgis et al. / Deep-Sea Research I 55 (2008) 177–202 199
permanent or semi-permanent cyclonic mesoscalefeatures, revealed the close relationships betweenbeam cp and primary productivity; in the RhodesGyre and the eastern Cretan margin, the upwellingof nutrient-rich waters substantially favored pri-mary productivity, a process very important for theextremely oligotrophic Eastern Mediterranean Sea.
In the case of Athens WWTP in the SaronikosGulf, beam cp proved to be a useful tracer ofeffluent dispersal route into the sea, appearing as anintermediate nepheloid layer distinguishable overseveral kilometers from the underwater dischargepoint.
Acknowledgments
We wish to thank the coordinators and chiefscientists of large-scale EU-funded and Hellenicprojects who provided the raw LT, PMC and POCdata, as well as the accompanying CTD data:G. Chronis, E. Balopoulos, A. Theocharis, A.Sioulas, V. Lykousis, I. Siokou, and E. Christou.The help of E. Kaberi, A. Papageorgiou, and E.Kabouri during field and laboratory work is grate-fully acknowledged. We thank D. Raitsos forpreparing the chlorophyll-a composite image andS. Kioroglou for his valuable help in data mining.This work was significantly improved by the insightsand comments from two anonymous reviewers.Finally, the continuous support and assistance ofthe officers and crew of R/V Aegeao is highlyappreciated. Part of this work has been supportedby a Fulbright fellowship granted to A.P. Kara-georgis at Texas A&M University, USA.
References
Abdel-Moati, A.R., 1990. Particulate organic matter in the
subsurface chlorophyll maximum layer in the Southeastern
Mediterranean. Oceanologica Acta 13, 307–315.
Anati, D.A., 1984. A dome of cold water in the Levantine Basin.
Deep-Sea Research 31 (10), 1251–1257.
Baker, E.T., Hickey, B.M., 1986. Contemporary sedimentation
processes in and around an active west coast submarine
canyon. Marine Geology 71, 15–34.
Baker, E.T., Lavelle, J.W., 1984. The effects of particle size on the
light attenuation coefficient of natural suspensions. Journal of
Geophysical Research 89, 8197–8203.
Balopoulos, E., Theocharis, A., Kontoyiannis, H., Varnavas, S.,
Voutsinou-Taliadouri, F., Iona, A., Souvermezoglou, A.,
Ignadiades, L., Gotsis-Scretas, O., Pavlidou, A., 1999. Major
advances in the oceanography of the southern Aegean
Sea–Cretan Straits system (eastern Mediterranean). Progress
in Oceanography 44, 109–130.
Bartz, R.J., Zaneveld, R.V., Pak, H., 1978. A transmissometer for
profiling and moored observations in water. SPIE, Ocean
Optics V, 102–108.
Biscaye, P.E., Eittreim, S.L., 1977. Suspended particulate loads
and transports in the nepheloid layer of the abyssal Atlantic
Ocean. Marine Geology 23, 155–172.
Biscaye, P.E., Flagg, C.N., Falkowski, P.G., 1994. The shelf edge
exchange processes experiment, SEEP-II: an introduction to
hypotheses, results and conclusions. Deep-Sea Research II 41,
231–252.
Bishop, J.K.B., 1986. The correction and suspended particulate
matter calibration of SeaTech transmissometer data. Deep-
Sea Research 33, 121–134.
Bricaud, A., Morel, A., Prieur, L., 1981. Absorption by dissolved
organic matter of the sea (yellow substance) in the UV and
visible domains. Limnology and Oceanography 26 (1), 43–53.
Buesseler, K.O., 1998. The decoupling of production and
particulate export in the surface ocean. Global Biogeochem-
ical Cycles 12 (2), 297–310.
Cacchione, D.A., Drake, D.E., 1986. Nepheloid layers and
internal waves over continental shelves and slopes. Geo-
Marine Letters 6, 147–152.
Castaing, P., Froidefond, J.M., Lazure, P., Weber, O., Prud’-
homme, R., Jouanneau, J.M., 1999. Relationship between
hydrology and seasonal distribution of suspended sediments
on the continental shelf of the Bay of Biscay. Deep-Sea
Research II 46, 1979–2001.
Cutter, G.A., Radford-Knoery, J., 1991. Determination of
carbon, nitrogen, sulfur and inorganic sulfur species in
marine particles. In: Hurd, D.C., Derek, D.W. (Eds.), Marine
Particles: Analysis and Characterization, Geophysical Mono-
graph, vol. 63, pp. 57–63.
Danovaro, R., Dinet, A., Duineveld, G., Tselepides, A., 1999.
Benthic response to particulate fluxes in different trophic
environments: a comparison between the Gulf of Lions–
Catalan Sea western Mediterranean) and the Cretan Sea
(eastern-Mediterranean). Progress in Oceanography 44,
287–312.
De Lazzari, A., Boldrin, A., Rabitti, S., Turchetto, M.M., 1999.
Variability and downward fluxes of particulate matter in the
Otranto Strait area. Journal of Marine Systems 20, 399–413.
Deuser, W.G., Ross, E.H., Anderson, R.F., 1981. Seasonality in
the supply of sediment to the deep Sargasso Sea and
implications for the rapid transfer of matter to the deep
ocean. Deep-Sea Research 28, 495–505.
Drake, D.E., 1971. Suspended sediment and thermal stratifica-
tion in Santa Barbara Channel, California. Deep-Sea
Research 18, 763–769.
Dugdale, R.C., Wilkerson, F.R., 1988. Nutrient sources and
primary production in the Eastern Mediterranean. Oceano-
logica Acta 9, 178–184.
Durand, N., Fiandrino, A., Fraunie, P., Ouillon, S., Forget, P.,
Naudin, J.J., 2002. Suspended matter dispersion in the Ebro
ROFI: an integrated approach. Continental Shelf Research
22, 267–284.
Durrieu de Madron, X., 1994. Hydrography and nepheloid
structures in the Grand-Rhone canyon. Continental Shelf
Research 14, 457–477.
Durrieu de Madron, X., Nyffeler, F., Godet, C.H., 1990.
Hydrographic structure and nepheloid spatial distribution in
the Gulf of Lions continental margin. Continental Shelf
Research 10, 915–929.
ARTICLE IN PRESSA.P. Karageorgis et al. / Deep-Sea Research I 55 (2008) 177–202200
Durrieu de Madron, X., Nyffeler, F., Balopoulos, E.T., Chronis,
G., 1992. Circulation and distribution of suspended matter in
the Sporades Basin (northwestern Aegean Sea). Journal of
Marine Systems 3, 237–248.
Ediger, D., Tugrul, S., Yilmaz, A., 2005. Vertical profiles of
particulate organic matter and its relationship with chlor-
ophyll-a in the upper layer of the NE Mediterranean Sea.
Journal of Marine Systems 55, 311–326.
Eittreim, S., Thorndike, E.M., Sullivan, L., 1976. Turbidity
distribution in the Atlantic Ocean. Deep-Sea Research 23,
1115–1127.
Frignani, M., Courp, T., Cochran, J.K., Hirschberg, D., Vitoria i
Codina, L., 2002. Scavenging rates and particle characteristics
in and near the Lacaze-Duthiers submarine canyon, north-
west Mediterranean. Continental Shelf Research 22,
2175–2190.
Gardner, W.D., 1989a. Baltimore Canyon as a modern
conduit of sediment to the deep sea. Deep-Sea Research 36,
323–358.
Gardner, W.D., 1989b. Periodic resuspension in Baltimore
Canyon by focussing of internal waves. Journal of Geophy-
sical Research 94 (C12), 18,185–18,194.
Gardner, W.D., Biscaye, P.E., Zaneveld, J.R.V., Richardson,
M.J., 1985. Calibration and comparison of the LDGO
nephelometer and the OSU transmissometer on the Nova
Scotian Rise. Marine Geology 66, 323–344.
Gardner, W.D., Walsh, I.D., Richardson, M.J., 1993. Biophysi-
cal forcing of particle production and distribution during a
spring bloom in the North Atlantic. Deep-Sea Research II 40
(1–2), 171–195.
Gardner, W.D., Chung, S.P., Richardson, M.J., Walsh, I.D.,
1995. The oceanic mixed-layer pump. Deep-Sea Research II
42 (2–3), 757–775.
Gardner, W.D., Richardson, M.J., Carlson, C.A., Hansell, D.,
Mishonov, A.V., 2003. Determining true particulate organic
carbon: bottles, pumps and methodologies. Deep-Sea Re-
search II 50 (3–4), 655–674.
Gardner, W.D., Mishonov, A.V., Richardson, M.J., 2006. Global
POC concentrations from in-situ and satellite data. Deep-Sea
Research II 53, 718–740.
Georgopoulos, D., 2002. Water masses, dynamic structure and
circulation in the north Aegean Sea. Ph.D. Thesis, Univ.
Patras, 324pp.
Georgopoulos, D., Theocharis, A., Zodiatis, G., 1989. Inter-
mediate water formation in the Cretan Sea (South Aegean
Sea). Oceanologica Acta 12 (4), 353–359.
Gertman, I.F., Ovchinnikov, I.M., Popov, Y.I., 1994. Deep
convection in the eastern basin of the Mediterranean Sea.
Oceanology 34, 19–25.
Gordon, D.C., 1970. Some studies of the distribution and
composition of particulate organic carbon in the North
Atlantic Ocean. Deep-Sea Research 17, 233–244.
Guerzoni, S., Chester, R., Dulac, F., Herut, B., Loye-Pilot, M.-
D., Measures, C., Migon, C., Molinaroli, E., Moulin, C.,
Rossini, P., Saydam, C., Soudine, A., Ziveri, P., 1999.
The role of atmospheric deposition in the biogeochemistry
of the Mediterranean Sea. Progress in Oceanography 44,
147–190.
Gundersen, J.S., Gardner, W.D., Richardson, M.J., Walsh, I.D.,
1998. Effects of monsoons on the seasonal and spatial
distributions of POC and chlorophyll in the Arabian Sea.
Deep-Sea Research II 45, 2103–2132.
Hickey, B., Baker, E., Kachel, N., 1986. Suspended particle
movement in and around Quinault submarine canyon.
Marine Geology 71, 35–83.
Hopkins, T.S., 1974. A discussion of the marine pollution
problems in the Saronikos Gulf as disclosed by current
research. Unpublished Technical Report IOKAE, 17pp.
Hopkins, T.S., 1978. Physical processes in the Mediterranean
basin. In: Kjerfve, B. (Ed.), Estuarine Transport Processes.
University of South Carolina Press, Columbia, pp. 269–310.
Hopkins, T.S., Coachman, L.K., 1975. Circulation patterns in the
Saronikos Gulf in relation to the winds. Unpublished Interim
Technical Report 1, Environmental Pollution Control Pro-
ject-Athens, Ministry of Public Works, Athens, 66pp.
Ignatiades, L., 1998. The productive and optical status of the
oligotrophic waters of the Southern Aegean Sea (Cretan Sea),
Eastern Mediterranean. Journal of Plankton Research 20 (5),
985–995.
Ignatiades, L., Psarra, S., Zervakis, V., Pagou, K., Souverme-
zoglou, E., Assimakopoulou, G., Gotsis-Skretas, O., 2002.
Phytoplankton size-based dynamics in the Aegean Sea (East-
ern Mediterranean). Journal of Marine Systems 36, 11–28.
IOC, IHO, BODC, 2003. Centenary Edition of the GEBCO
Digital Atlas. Published on CD-ROM on behalf of the
Intergovernmental Oceanographic Commission and the Inter-
national Hydrographic Organization as part of the General
Bathymetric Chart of the Oceans. British Oceanographic
Data Centre, Liverpool.
Jerlov, H.G., 1968. Optical Oceanography. Elsevier Science,
NewYork, 194 p.
Karageorgis, A.P., Anagnostou, Ch.L., 2001. Particulate matter
spatial-temporal distribution and associated surface sediment
properties: Thermaikos Gulf and Sporades Basin, NW
Aegean Sea. Continental Shelf Research 21, 2141–2153.
Karageorgis, A.P., Anagnostou, Ch., 2003. Seasonal variation in
the distribution of suspended particulate matter in the NW
Aegean Sea. Journal of Geophysical Research 108 (C8), 3274.
Karageorgis, A.P., Stavrakakis, S., 2005. Particulate matter
dynamics and fluxes. In: Papathanassiou, E., Zenetos, A.
(Eds.), State of the Hellenic Marine Environment. HCMR
publ., pp. 78–87.
Karageorgis, A.P., Anagnostou, Ch., Georgopoulos, D., Albuis-
son, M., 2000. Distribution of suspended particulate
matter determined by in-situ observations and satellite images
in the NW Aegean Sea (Greece). Geo-Marine Letters 20 (2),
93–100.
Karageorgis, A.P., Kaberi, H.G., Tengberg, A., Zervakis, V.,
Anagnostou, Ch.L., Hall, P., 2003. Comparison of the
particulate matter distribution between a mesotrophic and
an oligotrophic marine area: the Skagerrak Sea and the
northeastern Aegean Sea. Continental Shelf Research 23
(17–19), 1787–1809.
Kawahata, H., 2002. Suspended and settling particles in the
Pacific. Deep-Sea Research II 49, 5647–5664.
Kontoyiannis, H., Papadopoulos, V., 1999. Hydrography and
circulation. In: Siokou-Frangou, I. (Ed.), Monitoring of the
Saronikos Gulf Ecosystem affected by the Psittalia Sea
Outfall. NCMR, October 1999, Final Report, pp. 21–64.
Krasakopoulou, E., Karageorgis, A.P., 2005. Spatial and
temporal distribution patterns of suspended particulate
matter and particulate organic carbon in the Saronikos Gulf
(eastern Mediterranean, Greece). Geo-Marine Letters 25 (6),
343–359.
ARTICLE IN PRESSA.P. Karageorgis et al. / Deep-Sea Research I 55 (2008) 177–202 201
Kubilay, N., Saydam, A.C., 1995. Trace elements in atmospheric
particulates over the Eastern Mediterranean; concentrations,
sources and temporal variability. Atmospheric Environment
29 (17), 2289–2300.
Lacombe, H., Tchernia, P., Benoist, G., 1958. Contribution a l’
etude hydrologique de la Mer Egee en periode d’ ete. Bulletin
d’ Information Cahiers Oceanographique du C.O.E.C. 8,
454–468.
Lapouyade, A., Durrieu De Madron, X., 2001. Seasonal
variability of the advective transport of particulate matter
and organic carbon in the Gulf of Lion (NW Mediterranean).
Oceanologica Acta 24, 295–312.
Legendre, P., 2001. Model II Regression-User’s Guide. Departe-
ment de sciences biologiques, Universite de Montreal, 23p.
/http://www.bio.umontreal.ca/legendre/index.htmlS.
Li, K.W., Zohary, T., Yacobi, Y.Z., Wood, A.M., 1993.
Ultraphytoplankton in the Eastern Mediterranean Sea:
towards deriving phytoplankton biomass from flow cyto-
metric measurements of abundance, fluorescence and light
scatter. Marine Ecology Progress Series 102, 79–87.
Lykousis, V., Chronis, G., Tselepides, A., Price, B., Theocharis,
A., Siokou-Frangou, I., Van Wambeke, F., Danovaro, R.,
Stavrakakis, S., Duineveld, G., Georgopoulos, G., Ignatiades,
L., Souvermezoglou, A., Voutsinou-Taliadouri, F., 2002.
Major outputs of the recent multidisciplinary biogeochemical
researches undertaken in the Aegean Sea. Journal of Marine
Systems 33–34, 313–334.
Lykousis, V., Karageorgis, A.P., Chronis, G.T., 2005. Delta
progradation and sediment fluxes since the last glacial in the
Thermaikos Gulf and the Sporades Basin, NWAegean Sea,
Greece. Marine Geology 222–223, 381–397.
Maillard, C., Balopoulos, E., Giorgetti, A., Fichaut, M., Iona,
A., Larour, M., Latrouite, A., Manca, B., Maudire, G.,
Nicolas, P., Sanchez-Cabeza, J.A., 2002. An integrated system
for managing multidisciplinary oceanographic data collected
in the Mediterranean Sea during the basin-scale research
project EU/MAST-MATER (1996–2000). Journal of Marine
Systems 33-34, 523–538.
Malanotte-Rizzoli, P., Manca, B.B., d’ Alcala, M.R., Theocharis,
A., Bergamasco, A., Bregant, D., Butillon, G., Civitarese, G.,
Georgopoulos, D., Michelato, A., Sansone, E., Scarazzato,
P., Souvermezoglou, E., 1997. A synthesis of the Ionian Sea
hydrography, circulation and water mass pathways during
POEM-Phase I. Progress in Oceanography 39, 153–204.
Malanotte-Rizzoli, P., Manca, B.B., d’Alcala, M.R., Theocharis,
A., Brenner, S., Budillon, G., Ozsoy, E., 1999. The Eastern
Mediterranean in the 80 s and in the 90s: the big transition in
the intermediate and deep circulations. Dynamics of Atmo-
spheres and Oceans 29, 365–395.
Martin, J.M., Elbaz-Poulichet, F., Guieu, C., Loye-Pilot, D., Han,
G., 1989. River versus atmospheric input of material to the
Mediterranean Sea: an overview. Marine Chemistry 28, 159–182.
McCave, I.N., Hall, I.R., 2002. Turbidity of waters over the
Northwest continental margin. Progress in Oceanography 52,
299–313.
McCave, I.N., Hall, I.R., Antia, A.N., Chou, L., Dehairs, F.,
Lampitt, R.S., Thomsen, L., Van Weering, T.C.E., Wollast,
R., 2001. Distribution, composition and flux of particulate
material over the European margin at 47–501N. Deep-Sea
Research II 48, 3107–3139.
Monaco, A., Biscaye, P.E., Soyer, J., Pocklington, R., Heussner,
S., 1990. Particle fluxes and ecosystem response on a
continental margin: the 1985–1988 Mediterranean ECO-
MARGE experiment. Continental Shelf Research 10, 809–839.
Moody, J.A., Butman, B., Bothner, M.H., 1987. Near-bottom
suspended matter concentration on the Continental Shelf
during storms: estimates based on in situ observations of light
transmission and a particle size dependent transmissometer
calibration. Continental Shelf Research 7 (6), 609–628.
Moran, S.B., Charette, M.A., Pike, S.M., Wickland, C.A., 1999.
Differences in seawater particulate organic carbon concentra-
tion in samples collected using small-volume and large-
volume methods: the importance of DOC absorption to the
filter blank. Marine Chemistry 67, 33–42.
Moutin, T., Raimbault, P., 2002. Primary production, carbon
export and nutrients availability in western and Eastern
Mediterranean Sea in early summer 1996 (MINOS cruise).
Journal of Marine Systems 33-34, 273–288.
Nihlen, T., Mattsson, J.O., Rapp, A., Gagaoudaki, C., Kornaros,
G., Papageorgiou, J., 1995. Monitoring of Saharan dust
fallout on Crete and its contribution on soil formation. Tellus
47B, 365–374.
Ovchinnikov, I.M., 1966. Circulation in the surface and intermediate
layers of the Mediterranean Sea. Oceanology 18 (1), 165–168.
Ovchinnikov, I.M., Plakhin, E.A., 1984. Formation of inter-
mediate waters of the Mediterranean Sea in the Rhodes
cyclonic Gyre. Oceanology 23, 960–962.
Ozsoy, E., Hecht, A., Unluata, U., 1989. Circulation and
hydrography of the Levantine Basin. Results of POEM
coordinated experiments 1985–1986. Progress in Oceanogra-
phy 22, 125–170.
Ozsoy, E., Hecht, A., Unluata, U., Brenner, S., Sur, H.I., Bishop,
J., Latif, M.A., Rozentraub, Z., Oguz, T., 1993. A synthesis of
Levantine basin circulation and hydrography 1985–1990.
Deep-Sea Research II 40, 1075–1120.
Palanques, A., Biscaye, P.E., 1992. Patterns and controls of the
suspended matter distribution over the shelf and upper slope
south of New England. Continental Shelf Research 12 (5/6),
577–600.
Park, Y.A., Choi, J.Y., Gao, S., 2001. Spatial variation of
suspended particulate matter in the Yellow Sea. Geo-Marine
Letters 20, 196–200.
Poulos, S.E., 2001. The contribution of near-bed currents to
modern sedimentation processes in the deep waters of the
Hellenic Arc–Trench system, Eastern Mediterranean. Geo-
Marine Letters 20, 201–208.
Poulos, S.E., Chronis, G., 1997. The importance of the river
systems in the evolution of the Greek coastline. In: Briand, F.,
Maldonado, A. (Eds.), Transformations and Evolution of the
Mediterranean Coastline. Bulletin de l’Institut Oceanographi-
que Monaco, CIESM Science Series No. 3, vol. 18, pp. 75–96.
Poulos, S.E., Collins, M.B., 2002. Fluviatile sediment fluxes to
the Mediterranean Sea: a quantitative approach and the
influence of dams. In: Jones, S.J., Frostick, L.E. (Eds.),
Sediment Flux to Basins: Causes, Controls and Conse-
quences, vol. 191. Geological Society, Special Publications,
London, pp. 227–245.
Poulos, S.E., Drakopoulos, P.G., Collins, M.B., 1997. Seasonal
variability in sea surface oceanographic conditions in the
Aegean Sea (Eastern Mediterranean): an overview. Journal of
Marine Systems 13, 225–244.
Price, N.B., Lindsay, F.S., Pates, J.M., 1999. The biogeochem-
istry of major elements of suspended particulate matter of the
Cretan Sea. Progress in Oceanography 44, 677–699.
ARTICLE IN PRESSA.P. Karageorgis et al. / Deep-Sea Research I 55 (2008) 177–202202
Psarra, S., Tselepides, A., Ingnatiades, L., 2000. Primary
productivity in the oligotrophic Aegean Sea (NE Mediterra-
nean): seasonal and interannual variability. Progress in
Oceanography 46 (2–4), 187–204.
Puig, P., Palanques, A., 1998. Nepheloid structure and hydro-
graphic control on the Barcelona continental margin, north-
western Mediterranean. Marine Geology 149, 39–54.
Puig, P., Palanques, A., Guillen, J., El Khatab, M., 2004. Role of
internal waves in the generation of nepheloid layers on the
northwestern Alboran slope: implications for continental
margin shaping. Journal of Geophysical Research 109,
C09011.
Rabitti, S., Bianchi, F., Boldrin, A., Da Ros, L., Socal, G., Totti,
C., 1994. Particulate matter and phytoplankton in the Ionian
Sea. Oceanologica Acta 17, 297–303.
Richardson, M.J., 1987. Particle size, light scattering and
composition of suspended particulate matter in the North
Atlantic. Deep-Sea Research 34, 1301–1329.
Robinson, A.R., Golnaraghi, M., 1994. The physical and
dynamical oceanography of the Mediterranean Sea. In:
Malanotte-Rizzoli, P., Robinson, A.R. (Eds.), Ocean Pro-
cesses in Climate Dynamics: Global and Mediterranean
Examples, NATO ASI Series C, vol. 419. Kluwer Academic
Publishers, Dordrecht, Boston, London, pp. 255–306.
Roether, W., Manca, B.B., Klein, B., Bregant, D., Georgopoulos,
D., Beitzel, V., Kovacevic, V., Luchetta, A., 1996. Recent
changes in the Eastern Mediterranean deep water. Science
271, 333–335.
Sakellariou, D., Lykousis, V., Karageorgis, A.P., Anagnostou,
C., 2005. Geomorphology and tectonic structure. In:
Papathanassiou, E., Zenetos, A. (Eds.), State of the Hellenic
Marine Environment. HCMR publ., pp. 16–20.
Schlitzer, R., 2003. Ocean Data View/http://www.awi-bremerhaven.
de/GEO/ODVS.Schlitzer, R., Roether, W., Oster, H., Junghans, H.-G., Haus-
mann, M., Johannsen, H., Michelato, A., 1991. Chlorofluor-
omethane and oxygen in the Eastern Mediterranean. Deep-
Sea Research 38, 1531–1551.
Siokou-Frangou, I., Gotsis-Skretas, O., Christou, E.D., Pagou,
K., 1999. Plankton characteristics in the Aegean, Ionian and
NW Levantine Seas. In: Malanotte-Rizzoli, P., Eremeev, V.N.
(Eds.), The Eastern Mediterranean as a Laboratory Basin for
the Assessment of Contrasting Ecosystems, vol. 51. NATO
Science Series, vol. 2. Kluwer Academic Publishers, Dor-
drecht, Boston, London, pp. 465–473.
Socal, G., Boldrin, A., Bianchi, F., Civitarese, G., De Lazzari, A.,
Rabitti, S., Totti, C., Turchetto, M.M., 1999. Nutrient,
particulate matter and phytoplankton variability in the photic
layer of the Otranto strait. Journal of Marine Systems 20,
381–398.
Souvermezoglou, E., Krasakopoulou, E., 1999. The effect of
physical processes on the distribution of nutrients and oxygen
in the NW Levantine Sea. In: Malanotte-Rizzoli, P., Eremeev,
V.N. (Eds.), The Eastern Mediterranean as a Laboratory
Basin for the Assessment of Contrasting Ecosystems, vol. 51.
NATO Science Series, vol. 2. Kluwer Academic Publishers,
Dordrecht, Boston, London, pp. 225–240.
Spinrad, R.W., 1986. An optical study of the water masses in
the gulf of Maine. Journal of Geophysical Research 91,
1007–1018.
Spinrad, R.W., Zaneveld, J.R.V., Kitchen, J.C., 1983. A study of
the optical characteristics of the suspended particles in the
benthic boundary layer of the Scotian Rise. Journal of
Geophysical Research 88, 7641–7645.
The LIWEX Group, 2003. The Levantine intermediate water
experiment (LIWEX) group: Levantine basin—a laboratory
for multiple water mass formation processes. Journal of
Geophysical Research 108 (C9), 8101.
The POEM Group, 1992. General circulation of the Eastern
Mediterranean. Earth Science Reviews 32, 285–309.
Theocharis, A., Kontoyiannis, H., 1999. Interannual variability
of the circulation and hydrography in the Eastern Mediterra-
nean (1986–1995). In: Malanotte-Rizzoli, P. (Ed.), The
Eastern Mediterranean as a Laboratory Basin for the
Assessment of Contrasting Ecosystems. Kluwer Academic
Publishers, Norwell, MA, pp. 453–464.
Theocharis, A., Georgopoulos, D., Lascaratos, A., Nittis, K.,
1993. Water masses and circulation in the central region of the
Eastern Mediterranean (E. Ionian, S. Aegean and NW
Levantine). Deep-Sea Research II 40 (6), 1121–1142.
Theocharis, A., Gacic, M., Kontoyiannis, H., 1998. Physical and
dynamical processes in the coastal and shelf areas of the
Mediterranean. In: Robinson, A.R., Brink, K.H. (Eds.), The
Sea, vol. 11. Wiley, New York, pp. 863–887.
Theocharis, A., Balopoulos, E., Kioroglou, S., Kontoyiannis, H.,
Iona, A., 1999. A synthesis of the circulation and hydro-
graphy of the South Aegean Sea and the Straits of the Cretan
Arc (March 1994–January 1995). Progress in Oceanography
44 (4), 469–509.
Tselepides, A., Zervakis, V., Polychronaki, T., Danovaro, R.,
Chronis, G., 2000. Distribution of nutrients and POM in
relation to the prevailing hydrographic features of the Cretan
Sea (NE Mediterranean). Progress in Oceanography 46 (2–4),
113–142.
Unluata, U., Oguz, T., Latif, M.A., Ozsoy, E., 1990. On the
physical oceanography of the Turkich straits. In: Pratt, L.J.
(Ed.), The Physical Oceanography of Sea Straits. Kluwer
Academics Publishers, Norwell, MA, pp. 25–60.
Verardo, D.J., Froelich, P.N., McIntyre, A., 1990. Determination of
organic carbon and nitrogen in marine sediments using the Carlo
Erba NA-1500 analyzer. Deep-Sea Research 37 (1), 157–165.
Vidussi, F., Claustre, H., Manca, B.B., Luchetta, A., Marty, J.C.,
2001. Phytoplankton pigment distribution in relation to upper
thermocline circulation in the eastern Mediterranean. Journal
of Geophysical Research 106 (C9), 19,939–19,956.
Yacobi, Y.Z., Zohary, T., Kress, N., Hecht, A., Robarts, R.D.,
Waiser, M., Wood, A.M., 1995. Chlorophyll distribution
throughout the southeastern Mediterranean in relation to the
physical structure of the water mass. Journal of Marine
Systems 6 (3), 179–190.
Zervakis, V., Georgopoulos, D., 2002. Hydrology and circulation
in the North Aegean (Eastern Mediterranean) throughout
1997 and 1998. Mediterranean Marine Science 3 (1), 5–19.
Zervakis, V., Georgopoulos, D., Drakopoulos, P.G., 2000. The
role of the North Aegean in triggering the recent Eastern
Mediterranean climatic changes. Journal of Geophysical
Research 105 (C11), 26,103–26,116.
Zodiatis, G., 1994. Advection of the Black Sea water in the North
Aegean Sea. The Global Atmosphere and Ocean System 2,
41–60.