Part - World Bank Group
58
Part I
-
Upload
khangminh22 -
Category
Documents
-
view
2 -
download
0
Transcript of Part - World Bank Group

Part I


3
Introduction
Scope and Organization of this Report
1.1. Over the last ten years, public spending grew seventy percent in real terms, and the share of public spending
allocated to the social sectors increased from 59 percent to 63 percent, with spending in education and pensions
growing more rapidly than spending in health and social protection. Costa Rica spends more relative to GDP, and as a
share of public expenditures, on social services overall than other countries in Latin America, and considerably more
than the average for other countries at similar stages of development outside the region. The level of spending, and the
universal focus of many of these programs, mask the true effectiveness of these programs—in terms of reaching the
poor and vulnerable groups living in rural areas and city slums. Despite recent growth in the economy, many of the
poor and vulnerable do not have access to social programs, which in part reflects the inflexible legal framework that
guides social spending budget allocation—distributing resources without considering the changing conditions and
needs of the poor.
1.2. Fortuitous macroeconomic circumstances are unlikely to provide Costa Rica with an easy solution to these
problems. Economic projections do not show signs of the consistent growth that has characterized the past ten years,
and allowed the government to continue increasing investment in the social sectors. Given the country’s tight fiscal
situation and the high level of public debt, there is little room for continued increases in social spending to address the
service gaps and coverage needs. This underscores a key finding of this report: that the social sector challenges will not
be resolved by allocating more resources, but by undertaking reforms that improve management and efficiency, and
eliminate structural obstacles in most sectors. New instruments and approaches will be required that focus on
obtaining value for money in the social programs.
1.3. In order to respond to this situation, this report addresses the challenge of poverty reduction through three key
dimensions. First, who are the poor? Second, what has the impact of social spending been on programs that aim to
improve welfare for the poor? Finally, what improvements are required and how can government spending be used
more effectively to reach the poor, improve social indicators and contribute to reducing headcount poverty.
1.4. The objectives of this report (Part I) are threefold. First, present a poverty profile. Second, review efficiency
and targeting issues of social spending on education, health and nutrition, pensions, so as to identify actions that can
be taken to improve social services and have more impact on indicators of the poor. Third, identify possible options
and alternatives Costa Rican governments have for addressing identified issues, including improving the institutional
policy making and executing framework, and the financing and delivery of social services.
1.5. Part I consists of five chapters. After the Introduction, Chapter 2 contains the poverty profile based on
household survey information from earlier studies, and on the System for Targeting Social Spending (the SIPO system
in Spanish) database for 1999-2000. This latter information source is uniquely rich in that it contains information on
over 207,000 poor families which have been identified as potential beneficiaries of social assistance programs. Chapter
3 contains a summary of key issues in education, health, social security and social assistance programs which affect the
efficiency, equity and effectiveness of these programs in Costa Rica. This review is based on the social spending review
presented in Part II. Chapter 4 discusses the main institutional issues which appear to be affecting the effectiveness of
social spending in improving social indicators of the poor. Finally, Chapter 5 summarizes the main recommendations
of the report.
1.6. Before we present the poverty profile and social spending chapters, this introductory chapter contains a review
of the economic and social context by examining recent trends in main economic variables, social indicators, and social
spending. Social indicators and social spending figures for Costa Rica are compared with those of selected Latin
American and non-LAC countries to assess the relative position of Costa Rica in the region and in other regions of the
world. Also, in this chapter, we make a brief review of main demographic trends of Costa Rica, which will help identify
future needs for social services.
Economic Context
1.7. Costa Rica’s economy has grown at an average of 4.5 percent over the past decade, with a low point in 1996. In
recent years, however, the economy has shown a much slower growth (2.2 percent in 2000 and an estimated 0.3
percent in 2001, Table 1). Growth was strong in 1998-99 (8.3 percent on average), in large part the result of the

COSTA RICA: SOCIAL SPENDING AND THE POOR
4
construction and a major increase in production by two new Intel plants.2 Inflation was about 14.4 percent per year on
average during the last decade. Average minimum real wages increased by about 1.7 percent per year in 1990-99. The
most dynamic sector of the economy has been manufacturing, especially after 1996 with the establishment of Intel and
other industries, now accounting for 23 percent of total production. The growth of tourism has also been impressive
leading the service sector to account for over 19 percent of total production in recent years. By contrast, agriculture
has been loosing ground as a share of total GDP from about 16 percent of GDP in 1990 to about 14 percent in 1999.3
1.8. Open unemployment was 6 percent on average per year during the last decade and employment grew at a rate
of about 3 percent per annum absorbing the rapidly growing labor force born after the 1960s and 1970s. The most
dynamic sectors for employment creation have been manufacturing, trade, services and construction. Agriculture has
shed employment in absolute and relative terms. While in 1976 agriculture accounted for over 35 percent of total
employment, it accounted for only 20 percent in 1999 (GOCR, 2000a).
1.9. The external current account deficit improved to 3.1 percent of GDP in 1999 from 5.3 percent in 1998. The
historical trade deficit has become a surplus due largely to Intel exports (about $2.5 billion in 1999), while profit
remittances have increased substantially. The deficit in the current account was more than covered by net private and
official capital inflows. In 1999, inflows of direct foreign investment were $624 million, equivalent to almost 4 percent
of GDP.
1.10. The persistence of fiscal deficits (including Central Bank losses) is one of the main outstanding problems of the
Costa Rican economy. The fiscal deficit averaged 3.8 percent of GDP over the last decade. Expenditures are highly
inflexible (composed mostly of salaries, other recurrent expenditures and debt service payments), and revenues have
not increased accordingly. Thus, governments have had to recur to foreign and domestic borrowing to cover deficits.
The external debt, for instance, increased from about 6.2 of GDP in 1990 to about 20 percent of GDP in 2000. The
fiscal situation could worsen with the potentially large increments in earmarked expenditures for education due to the
recent upward revision in GDP figures (the Constitution establishes that expenditures in the education sector should
be at least equivalent to 6 percent of GDP). A byproduct of the fiscal pressures is the potential stagnation of social
investment and a weakening of the institutional structures required to meet the challenges facing the social sectors.
TABLE 1.
Key Economic Indicators in Costa Rica, 1990-2000
Indicators 1990 1996 1997 1998 1999 2000
GDP growth (%) 3.5 0.9 5.6 8.4 8.2 2.2
Inflation (%, CPI end-period) 27.2 13.9 11.2 12.4 10.1 11.0
Open Unemployment (%) 4.6 6.2 5.7 5.6 6.0 6.0
Overall public sector balance (% GDP) -2.0 -4.1 -2.6 -2.0 -3.6 -3.7
Current account balance (% GDP) -7.4 -3.8 -4.9 -5.3 -3.1 -3.1
Direct foreign investment (% of GDP) ---- 0.04 0.03 0.04 0.04 0.03
Domestic public debt (% GDP) 18.3 24.5 23.1 21.8 25.1 23.2
External public debt (% GDP) 6.2 24.4 21.8 21.0 20.3 19.9
Sources: BCCR, FMI, Costa Rica, Informe Estado de la Nación, Informe 4.
1.11. Social spending in Costa Rica is much higher than in other LAC countries. Total social spending was 18.2
percent of GDP, as compared to 14.5 percent for selected LAC countries, in 1996, the latest year for which
comparable information has been assembled (Table 2). Adding social welfare expenditures for Costa Rica, social
spending is as high as 20 percent of GDP, that is, over five GDP percentage points higher than in the selected LAC
countries in the Table 24. Thus, within the acute fiscal constraint Costa Rica now faces, continued improvements in
social indicators and poverty reductions will have to rely on better use of expenditures, as the scope for further
increases in social spending are very limited.
2 A wide gap has emerged in Costa Rica between GDP and GNP figures because large foreign investment flows have led to profit
remittances equivalent to 8 percent of GDP. Thus, while GNP rose by 8.7 percent in 1998, it showed no growth in 1999 and 2000
as profit remittances picked up.
3 These figures are from World Bank (2000).
4 The figures for Costa Rica decrease substantially if the new corrected figures for GDP are used. However, aggregate social
spending in Costa Rica continues to be 1-3 percentage points higher than for the rest of LAC countries.

INTRODUCTION
5
TABLE 2.
Public Spending in Social Sectors in Selected Countries, 1996
Education Health Social Security
and Welfare Housing Total
Argentina 3.5 1.8 8.0 0.8 14.1
Bolivia 7.4 2.2 4.5 0.2 14.3
Brazil 3.0 1.7 11.0 0.6 16.2
Chile 3.2 2.5 7.1 1.2 14.0
Colombia 5.4 2.0 4.9 0.7 13.0
Costa Rica 5.1 6.8 6.3 0.1 18.2
Dominican Republic 2.0 1.7 0.7 2.1 6.5
Indonesia 1.3 0.4 1.1 3.0 5.7
Korea 3.7 0.2 2.2 0.5 6.5
Malaysia 5.0 1.4 1.5 1.4 9.3
Mexico 3.8 0.5 3.0 0.5 7.8
Panama 4.6 5.6 5.7 1.2 17.1
Philippines 3.4 0.5 0.5 0.3 4.7
Turkey 3.5 0.7 1.4 0.4 5.1
Uruguay 2.1 1.9 19.4 0.5 23.9
Latin American Average1
4.0 2.7 7.1 0.8 14.5
Far Eastern Average1
3.4 0.6 1.3 1.3 6.6
Overall Average1
3.8 2.0 5.1 0.9 11.8
Note: Percentage of GDP.
1. These averages include only the countries in the table of each group.
Source: World Bank, 2000b, based on Government Finance Statistics Yearbook (1998) of the IMF.

COSTA RICA: SOCIAL SPENDING AND THE POOR
6
Social Indicators
1.12. Costa Rica has achieved great progress in social indicators. Infant mortality at 10.3 per 1,000 live births and
child malnutrition are among the lowest in Latin America (Table 3)5. Access to potable water is nearly universal.
Illiteracy rates for youth, at 2 percent for both males and females, are among the lowest in Latin America. Coverage of
preventive and curative health care is high as 90 percent of the population has access to healthcare through the CCSS.
TABLE 3.
Social Indicators in Selected Latin American, Europe and Far Eastern Countries, 1998
Adult Illiteracy
Rate(15 and over)
Youth Illiteracy
Rate(15-24 yrs. old) Country
Infant Mortality
(per 1,000 live
births)
ChildMal-
nutrition1
1992-98 Male Female Male Female
Net Enrollment
Secondary1997
Argentina 19 2 3 3 2 1 77
Bolivia 60 8 9 22 2 7 40
Brazil 33 6 16 16 10 6 66
Chile 10 1 4 5 2 1 85
Colombia 23 8 9 9 4 3 76
Costa Rica 104 5 5 5 2 2 612
Dominican Rep. 40 6 17 17 10 9 79
Indonesia 43 34 9 20 2 4 56
Korea 9 n/a 1 4 0 0 100
Malaysia 8 20 9 18 3 3 64
México 30 n/a 7 11 3 4 66
Panamá 21 6 8 9 3 4 71
Philippines 32 30 5 5 2 1 78
Turkey 38 10 7 25 2 7 58
Uruguay 16 4 3 2 1 1 84
LAC & Caribbean3
31 8 11 13 7 6 66
Europe & CA3
22 8 2 5 1 2 81
EU4
5 n/a N/a n/a n/a n/a 96
1. Weight for age measure (% of children under five years of age). Data are for the most recent year available.
2. Taken from the 2000 Census.
3. It includes weighted averages of the ratios for all the countries in the group. CA: Central Asia.
4. This figure is for 2001.
Source: World Bank (2000c). The World Development Indicators, 2000.
1.13. In education, Costa Rica has achieved universal enrollment in basic education and 60 percent enrollment in
secondary education. These results lag behind averages for LAC where net enrollment rates in secondary education are
66 percent and, and completion rates of secondary education are nearly 33 percent. In 1995, the latest year for which
information is available for a number of countries, only about 30 percent of Costa Rican males and 35 percent of
females 22-24 years of age, had completed their secondary education, as compared to 36 percent of males and 40
percent of females on average for selected Latin American countries. Moreover, Costa Ricans 22-24 years of age had
significantly lower secondary education completion rates than people of the same age group in a country with similar
per-capita GNP and public expenditures on education, as those of Costa Rica (see in Figure 1 and Figure 2 the
distance between the dots corresponding to Costa Rica and the continuous lines). The completion rates of males and
females in Costa Rica are over 22 percent lower than those of a similar country in per-capita GNP, and about 34
percent for females and 50 percent for males lower than those of a similar country in public expenditures on
education.6
5 The figure for 2001 was 10.8 per 1,000 live births.
6 These figures are calculated from regressions as the percentage difference between the estimated and observed completion rates
for Costa Rica.

INTRODUCTION
7
FIGURE 1.
Secondary Completion and GNP
GNP Per Capita (US$1998, ppp)
120001000080006000400020000
Fem
ale
Seco
nda
ry C
om
ple
tio
n (
%)
65
60
55
50
45
40
35
30
25
20
15
Observed
Logarithmic
Arg.Chile
Mexico
Brazil
Colombia
Venez.
Panama
Paraguay
Peru
El Salvador
Ecuador
Honduras
Bolivia
Nicaragua
Costa Rica
120001000080006000400020000
75
70
65
60
55
50
45
40
35
30
25
20
15
10
Observed
Logarithmic
Arg.
Chile
Mexico
Brazil
Colombia
Costa Rica
Venez.
Panama
Paraguay
Peru
El Salvador
Ecuador
Honduras
Bolivia
Nicaragua
GNP Per Capita (US$1998, ppp)
Ma
le S
eco
nd
ary
Com
ple
tio
n (
%)
Source: Table 3.
FIGURE 2.
Secondary Completion and Public Expenditure in Education
87654321
65
60
55
50
45
40
35
30
25
20
Observed
Logarithmic
Bolivia
Colombia
Costa Rica
Panama
Mexico
Arg.Chile
Brazil
Education Public Expenditure as % GDP, 1996
Fe
ma
le S
eco
nd
ary
Co
mp
letio
n (
%)
Education Public Expenditure as % GDP, 1996
87654321
Male
Secon
da
ry C
om
ple
tion
(%
)
75
70
65
60
55
50
45
40
35
30
25
20
15
Observed
Logarithmic
Bolivia
Colombia
Costa Rica
Panama
Mexico
Arg.
Chile
Brazil
Source: Table 3 and Table 4.
1.14. The rapid increase in the working age population will put great pressures on the economy to insert the
newcomers into the labor market, without great rises in unemployment, and/or falls in relative wages. The rate of
employment creation will have to remain at levels of 2-3 percent per year—a rate similar to that of the 1990s—during
the coming decades for the economy to be able to accommodate the new labor force entrants with the increments in
labor force participation that normally occur with development.
1.15. Taking advantage of the new opportunities created by the increase in labor force and decline in dependency
rates will, thus, critically depend on the fate of the economy. If economic performance continues to be satisfactory,
workers and the government can produce savings to finance the increased expenditures of the aging population. The
number of direct contributors to health and pension regimes will increase producing a reduction in beneficiary-per-
worker ratios and more revenues for those regimes, for a long period of time. Some of these demographic effects have
already started to show up in the health and pension regimes of the CCSS, in the 1990s. The number of family
member per active contributor has declined from 1.88 in 1990 to 1.46, in 1999. This provides an opportunity for
assessing possibilities of lowering already high payroll contribution rates -and, thus, the tax on labor- so as to promote
additional employment, and to continue reforming the pension system to make it fully funded and able to meet the
challenges of the future, as suggested below.

COSTA RICA: SOCIAL SPENDING AND THE POOR
8
TABLE 4.
Forecasted Population by Age Group, 2000-2050
Year of Forecast Period (%) Age Group (Years)
2000 2010 2020 2030 2040 2050
0 – 4 408 440 438 447 447 448
(%) (10.0) (9.0) (8.0) (7.0) (7.0) (7.0)
5 – 19 1,227 1,279 1,326 1,322 1,333 1,336
(%) (31.0) (27.0) (24.0) (22.0) (21.0) (20.0)
20 – 59 2,014 2,625 3,026 3,252 3,408 3,422
(%) (51.0) (55.0) (55.0) (54.0) (53.0) (50.0)
60 y más 291 436 697 1,028 1,292 1,588
(%) (7.0) (9.0) (13.0) (17.0) (20.0) (23.0)
Total 3,943 4,781 5,488 6,050 6,484 6,793
(%) (100.0) (100.0) (100.0) (100.0) (100.0) (100.0)
Dependency ratio (%)1 96.0 82.0 81.0 86.0 90.0 99.0
Note: Figures in Thousands.
1. Calculated as the number of people 0-19 years of age plus the population over 60 years of age divided by the
population 20-59 years of age.
Source: Centro Centroamericano de Población, Universidad de Costa Rica. 2001.
1.16. The demographic impact on poverty reduction is likely to be mixed. On the one hand, the poor, as well as the
non-poor, are likely to have lower dependency rates and lower family consumption and expenditure pressures. On the
other hand, the poor may have great difficulties in successfully competing in the now tighter labor market, given their
highly deficient levels of education and training, in the face of a rapidly changing and modernizing economy. To help
the poor compete and enter into this economy, major and sustained efforts will need to be made to improve their
human potential and skills, as indicated in most of this report.
Do the Poor benefit from Government transfers and programs?
1.17. Interventions designed to improve the education level of the poor, their employment opportunities, and their
access to health, basic infrastructure services and better housing are key to offset the gap in standards of living
between the them and the rest of the country. Since the mid 1990s, there has been a substantial increase in real terms
in funding for the social sectors in Costa Rica as in other countries. In this section, after briefly documenting the
increase in public social spending, we assess with the available data whether the poor benefit more or less than others
from a few Government transfers and programs for which data on targeting are available.
1.18. National and local governments have a fundamental role to play in reducing poverty and improving social
indicators. At the national level, stable and sound macroeconomic and labor policies are one of the most important
contributions that governments can make for the reduction of poverty. A second important contribution comes from
the impact of public spending on the social sectors. According to CEPAL (2001), social public spending per capita in
Latin America increased on average by 50 percent between 1990-91 and 1998-99. The magnitude of the increase
differed between countries, but the increase was generalized. In Colombia, Guatemala, Paraguay, Peru and the
Dominican Republic, spending more than doubled. Increases in social spending tended to be smaller in countries with
higher initial levels of spending (Argentina, Costa Rica, Brazil, and Panama), with increases averaging around 30
percent over the decade. In Costa Rica as in other countries, the increase in spending was made feasible by economic
growth (a higher level of per capita GNP leads to higher spending per capita holding the share of spending in GNP
constant), and a reorientation of fiscal priorities towards the social sectors.

INTRODUCTION
9
1.19. Today, in comparison to many other countries, the level of public social spending in Costa Rica is relatively
high. Table 5 proposes a typology of the countries in terms of their fiscal pressure and their fiscal priorities. Countries
such as Argentina, Brazil, and Uruguay have high levels of social spending as a share of GNP because they combine
high fiscal pressure with an emphasis on the social sectors for expenditures. By contrast, countries such as El Salvador,
the Dominican Republic, and Peru have low levels of social spending as a share of GNP because they combine low
fiscal pressure with low levels of priority for the social sectors.
TABLE 5.
Typology of Latin American countries in terms of social spending, 1998
Fiscal priority:
Share of total public spending going to social sectors Fiscal pressure:
Expenditures as share of GNP
Less than 40% Between 40% and 60% More than 60%
More than 30%
Nicaragua (12.7)
Colombia (15.0)
Panama (19.4)
Costa Rica (16.8)
Argentina (20.5)
Brazil (21.0)
Uruguay (22.8)
Between 20% and 30% Honduras (7.4)
Venezuela (8.6) Bolivia (16.1) Chile (16.0)
Less than 20%
El Salvador (4.3)
Dominican Rep. (6.6)
Peru (6.8)
Guatemala (6.2)
Mexico (9.1)
Paraguay (7.4)
Source: CEPAL (2001). The numbers in parenthesis correspond to the share of social spending in GNP.
1.20. The extent to which the poor benefit from public social spending in Costa Rica depends on the type of
spending considered. While spending for primary education tends to be pro-poor, spending at the upper secondary
and tertiary levels level tends to be pro-rich. At the same time, several categories of spending are targeted to poor areas
and households.
1.21. One simple way to summarize the distribution of public spending is to provide estimates of the Gini Income
Elasticity (GIE) of the various transfers and programs (see Wodon and Yitzhaki, 2002, for a description of the GIE).
A GIE of one means that program benefits or transfers are distributed in the same way as per capita income, so that
an increase in benefits or transfers would not affect the inequality in per capita income. A GIE larger (smaller) than
zero means that per capita income and program benefits are positively correlated, hence the households in the upper
(lower) part of the distribution of income benefit more from the increase in spending. A GIE of zero means that all
households benefit in the same way on a per capita basis from an increase in spending for the program, hence the
increase in spending is progressive since it is distributed more equally than per capita income. A GIE between zero and
one means that the distribution of spending for the program is positively correlated with per capita income, so that the
households who are better off receive a higher share of the benefits on a per capita basis, but the increase in spending
is still progressive because it is not as unequally distributed as per capita income.
1.22. Overall, when comparing programs or categories of transfers, the program or transfer that is most
redistributive is the program with the lowest GIE. While other factors than the GIE should be taken into account
when deciding which programs or transfers to cut or expand, the GIE does provide a good basis for ranking the
redistributive impact of alternative policies.

COSTA RICA: SOCIAL SPENDING AND THE POOR
10
1.23. Table 6 provides estimates of the Gini income elasticity of selected social sector programs. The estimates for
the parameter v=2 correspond to the impact of the program on the standard Gini index of inequality. Estimates for
higher values of v put more weight on the bottom part of the population when assessing the redistributive impact of
transfers but for the sake of this analysis a parameter of v=2 is considered. The results show that school vouchers are
better targeted than school feeding programs (larger negative GIE). Overall, programs from CEN-CINAI are better
targeted than school vouchers or school feeding, and within the CEN-CINAI programs, the milk program appears to
be the best targeted. The targeting performance of non-contributory pensions is similar to that of the school programs,
but lower than that of the CEN-CINAI programs. As far as the housing vouchers are concerned, while they were not
well targeted in the early 1990s, targeting performance has improved since then, even though it remains below that of
other programs. In most cases, the ranking of the programs does not change when the weight placed on the poorer
member of society (the parameter v) increases. But in one case -child care- the redistributive assessment of the
programs is lower with more weight on the poorer members of society.
TABLE 6.
Gini income elasticity for different values νννν
νννν=2 νννν=4 νννν=6 νννν=8
School voucher -0.97 -1.19 -1.27 -1.30
School feeding -0.65 -0.78 -0.83 -0.85
CEN-CINAI
Childcare -0.52 -0.47 -0.41 -0.35
Milk -1.26 -1.80 -2.12 -2.29
Food rations -0.80 -0.98 -1.04 -1.05
Total -1.16 -1.62 -1.88 -2.03
Pensions -0.85 -1.14 -1.32 -1.41
Housing Bonds
86-90 -0.05 0.06 0.15 0.22
90-94 -0.09 0.00 0.04 0.06
94-98 -0.31 -0.23 -0.18 -0.15
98-99 -0.67 -0.78 -0.79 -0.78
Source: Authors’ estimation using 1999 household survey results.
1.24. Beyond targeting performance, the impact of programs on beneficiaries should also be taken into account
when evaluating alternative options. While there are no good estimates of these impacts (such as increased school
attendance, or better nutrition and their impact on productivity at adult age), emphasis can be placed on the type of
considerations that should be taken into account for a more comprehensive assessment of the various programs. More
precisely, in order to take into account long-term impacts, one may use a social welfare function concept, and assess
the impact of programs on social welfare, that is on both the income of households and the inequality in the
distribution of income, taking into account estimates of the income value of the long-term impacts of programs.
Details on the methodology are provided in Wodon et al. (2002), but the basic idea is to argue that the impact of a
program on social welfare is proportional to two factors: a) the program’s income multiplier effect; and b) its
distributional characteristics as measured by one minus the product of the GIE and the Gini for per capita income.
This type of framework is used in Table 7 in order to compare three of the programs mentioned earlier.
1.25. It has been suggested that school vouchers have positive behavioral effects (because they tend to increase
school attendance, and thereby education endowments, with positive long-term impacts on future wages), while food
subsidies may not have such effects, or at least may not have them to the same extent. In the case of housing as well,
general subsidies may have only limited long-term behavioral effects. When programs have long term positive effects,
we may take this into account through the concept of multiplier effects over time, so that for example a transfer of one
colon today may lead to benefits of two or more colons for the beneficiary household. Let us assume for the sake of
the illustration that this multiplier effect is equal to 3 in the case of school vouchers. Assuming no multiplier for the
milk and housing programs, and using as a social welfare function the mean per capita income times one minus the
Gini index of inequality, one gets the ranking presented in Table 7, with school vouchers now clearly being the best
program, followed by milk subsidies and housing transfers.
1.26. The broader message of Table 7 is that the long-term positive effects of social programs may matter as much if
not more for improving social welfare than their immediate distributional characteristics. In order to take this message

INTRODUCTION
11
into account in the design of social programs, it is however necessary to have estimates of the long term impacts of
programs, which are often lacking in Costa Rica, as in other countries, due to the weak monitoring and evaluation
framework for social programs.
TABLE 7.
Illustrative impact on social welfare of four alternative programs, 1999
Growth impact per
dollar spent
(A)
Gini income
elasticity
(B)
Gini index of
inequality
(C)
Overall impact on
social welfare
A*(1-B*C)
School vouchers 3 -0.97 0.5 4.455
Milk 1 -1.26 0.5 1.63
Housing 1 -0.67 0.5 1.335
Source: Authors’ estimation using 1999 household survey results.


13
Poverty Profile: Characteristics of the Poor and
Vulnerable Groups
2.1. This chapter contains a description of recent trends in income poverty and asset accumulation of the Costa
Rican population over the last decade. The analysis includes a profile of the poor based on household surveys and the
SIPO database.7 The profile of the poor can be helpful to identify ways in which social spending can improve social
indicators of the poor and vulnerable groups in Costa Rica.
Trends in Income Poverty and Asset Accumulation by Families in Costa Rica
2.2. Costa Rica has made significant progress in reducing poverty in the last ten years. From 1987 to 2000, the
incidence of poverty, or headcount ratio, declined by over 30 percent (Table 8). Even more impressive has been the
reduction in extreme poverty from about 10 percent in 1987 to about 6.4 percent in 1998.8 Impressive results are
shown in the “poverty gap” that measures how poor are the poor compared to the poverty line. While the average
incomes of the poor were about 11 percent lower than the poverty line in 1987, average incomes were only about 8
percent below the poverty line in 1999. Less impressive declines in poverty rates are shown in poverty rates that use a
different method of calculation, the basic needs index (NBI), from 47 percent in 1989 to 42 percent in 1997 (Trejos,
2000).9 Money incomes have increased more rapidly than access to other basic services included in the NBI Index.
TABLE 8.
Poverty incidence and poverty gaps, 1987–2000
Years
Headcount
(At Poverty
Line)
Poverty Gap
(At Poverty
Line)
Poverty at
US$1 Per-
Capita per Day
Poverty Gap
(At US$1 Per-
Capita)
Poverty at
US$2 Per-
Capita per Day
Poverty Gap
(At US$2 Per-
Capita)
1987
1988
1989
1990
1991
1992
1993
1994
1995
1996
1997
1998
1999
2000
29,0
28,4
28,3
27,1
31,9
29,4
23,2
20,0
20,4
21,5
20,7
19,7
20.6
21.1
11,3
11,3
11,0
10,7
13,0
11,4
8,7
7,4
7,5
8,4
7,4
6,8
8.0
-
-
-
-
-
-
-
-
-
-
9.6
-
-
-
-
-
-
-
-
-
-
-
-
-
3.2
-
-
-
-
-
-
-
-
-
-
-
-
-
26.3
-
-
-
-
-
-
-
-
-
-
-
-
-
10.1
-
-
-
-
Source: Quinto Informe del Estado de la Nación cited in GOCR (2000) and Sauma (2001) for poverty rates and World
Bank (2000a) for international poverty rates at $1 and $2 dollars per-capita per day.
7 See SIPO Annex for description of the SIPO database
8 The number of people below the $1 dollar per-capita per day (which may be considered extreme poverty) has been estimated at
9.6 percent, while the number below the $2 dollar per-capita per day (poverty), at 26.3 percent in 1996 (World Bank, 2000a).
9 The Basic Needs Index (NBI) method is an alternative form of designating a household to be poor. A household is poor if its
housing is made of substandard materials, if it lacks access to safe water or sanitation, if the housing is overcrowded (two or more
members per room), if there is a high dependency rate, or if a child aged 7-11 is not attending school. If any of these needs are not
met the household is considered to be poor. If two or more needs are present, the household is determined to be in extreme
poverty.
COSTA RICA: SOCIAL SPENDING AND THE POOR
14
2.3. The pace of the reduction in income poverty has, however, slowed considerably after 1994 despite strong
economic growth (over 4.5 percent in 1990-2000). Some observers have suggested this is an indication that the recent
economic growth, largely associated with export industries (Intel Corporation), has had weak links with the rest of the
economy, especially the rural economy. Yet, another possible reason may be that many poor Costa Ricans may be
unable to take advantage of employment opportunities and higher incomes offered by the growing economy due to
their poor training and low education.10
2.4. Consistent with the sharp decline in poverty over the last ten years, between 1992 and 1997, Costa Ricans
improved asset accumulation, by increasing housing ownership, improving housing quality and purchasing durables.
Table 9 displays the data for 1992 and 1997, the most recent year for which comparable information on housing
characteristics is available. Three out of four Costa Rican families owned their own home in 1997, as compared to a
little more than one in two in 1992. Nearly four in five families had basic services and possessed high priced comfort
durables, such as color TV, refrigerators and washing machines, in 1997.
2.5. In contrast to rapid increases in physical assets, advances in human capital assets of parents and children have
been modest in the last few years (Table 9). The number of family heads who have completed at least primary
education has remained more or less constant, at about 37-39 percent, from 1992 to 1997. Net enrollment rates of
children 0-5 years old in Early Child Development Programs (ECDP) at 6-8 percent are very low for countries of
income levels similar to those of Costa Rica. Attending these programs is critical for the children to improve their
health, nutrition and early stimulation status. In addition, despite the historically high enrollment rates in primary
education, the number of students who by age 14 complete six or more years of education was only 76 percent in
1999, about the same rate of 1990. The number of children, who by age 20 have completed 11 years of
education -secondary education- or more, is also low at 33 percent in 1999 (27 percent in 1990).
2.6. Education levels are much worse for those in the lower income quartiles. The percentage of people in the
poorest 25 percent of the income distribution who completed primary education was only 62 percent in 1999, about
the same rate of 1990, while the percentage of the richest 25 percent is much higher and has shown some
improvement in recent years. For secondary education, the completion rates of the poorest are less than one fourth of
those in the top 25 percent. Some improvements in the completion rates of the poor have occurred in recent years. In
rural areas, the completion rates of secondary education are much worse than in urban areas, although they show some
improvement from 1990 to 1999. These generally low levels of education attainment of Costa Rica’s children and
youngsters undermine their ability to take advantage of the high growing technology and other modern sectors of the
economy.11
10 Some of the measurement problems of comparing GNP figures, which are calculated from National Accounts, and poverty rate
changes, which are calculated from Household Surveys, are discussed by Deaton (2001) in the context of similar discrepancies
between growth and poverty in India.
11 Net enrollment rates for primary and secondary education for Latin America and many other countries are in World Bank
(2000a).

POVERTY PROFILE: CHARACTERISTICS OF THE POOR AND VULNERABLE GROUPS
15
TABLE 9.
Asset accumulation by families in Costa Rica, 1992–1997
Assets 1992 1997 % Change
Physical Assets
Own a house1 51.7 75.2 45.5
House with basic services 74.6 84.6 13.4
House of good/regular quality 74.8 84.7 13.2
House has comfort durables:
TV
Refrigerator
Washing machine
48.6
60.2
50.7
77.5
82.6
76.3
59.5
37.2
50.5
Human Capital of Head of Household
With some secondary & more 39.4 36.9 -6.4
Human capital of children
ECDP for 0-5 Years Olds2 6.0
Complete primary3
First quartile (25% poorest)
Top quartile (25% richest)
Rural areas (all)
77.4
62.3
90.6
69.1
76.4
62.1
92.4
69.9
-1.3
-0.3
1.9
1.2
Complete secondary3
First quartile (25% poorest)
Top quartile (25% richest)
Rural areas (all)
26.6
11.6
49.6
16.2
32.7
15.0
59.3
20.2
22.9
29.3
19.5
24.7
1. The figures on ownership for 1992 are from the ENISO Survey and correspond to ownership of the “site”, while
those for 1997 correspond to ownership of the house. The poor are more likely to own the house but not the site,
especially in slum areas. However, these cases are not more than 2.5%, according to figures from SIPO.
2. Net enrollment figures include children in CEN-CINAI centers, Hogares Comunitarios, and other public childcare
programs for 1999.
3. Figures for 1990 and 1999 from Trejos, J. (2000).
Source: IMAS, 2000c.
A Profile of The Poor
2.7. This section first presents a poverty profile, based on household surveys and published studies and then
provides greater detail from the population included in the SIPO database
2.8. As in other Latin American countries, poverty in Costa Rica affects more rural than urban residents. Over 65
percent of the poor in Costa Rica reside in rural areas. This is because the proportion of people living in rural areas is
still large in Costa Rica and because there is a higher incidence of poverty in rural than in urban areas (Table 10).
2.9. The incidence of poverty (that is, the percentage of poor in a given income category) is highest in families
where none or only one family member is working.12 These two groups are the most frequent in poor families and
account for almost 80 percent of all income poor people in the country. Furthermore, 16 percent of the income poor
families in Cost a Rica have no income earner in the family (wage earner, pensioner or renter). The incidence of
poverty is high among the unemployed (52.4 percent), although this group is a relatively small percentage (4.0 percent)
of the poor population.
2.10. Poverty incidence is highest in families whose heads are working in agriculture, self-employment, micro
enterprise and in domestic service. This group represents over 60 percent of the total income poor. Agriculture
employment, however, at the aggregate economy level, has been rapidly declining from about 35 percent in 1976 to 20
percent in 1999, while employment in commerce and other services has been growing rapidly (GOCR, 2000a). The
rapid growth rate in non-agricultural sectors has created opportunities to move out of agriculture into more skill
demanding jobs of the modern sectors of the economy.
12 A good description of characteristics of the poor by activity and occupational category is in Trejos (2001).

COSTA RICA: SOCIAL SPENDING AND THE POOR
16
TABLE 10.
Poverty rates and contribution to poverty by group, 1997
Poverty rate
(Incidence)
Contribution to poverty
Survey 1997
Headcount 20.7 --
Region
Urban
Rural
--
16.3
24.1
100.0
34.6
65.4
Persons working, in family
None
1
2
3
4 or more
--
45.6
24.1
11.1
9.5
8.5
100.0
22.9
56.2
15.1
4.2
1.6
Income earners, in family1
None
1
2
3
4 or more
--
73.1
25.8
11.1
8.7
7.5
100.0
16.3
60.7
16.7
4.5
1.7
Head’s activity
Unemployed2
Inactive (not in labor force)
Occupied3
--
52.4
31.2
17.3
100.0
4.0
30.7
65.3
Head’s industry
Agriculture
Non-agriculture
Micro enterprise
Domestic service
Self-employed
--
31.8
12.5
17.1
34.9
19.8
100.0
29.8
35.5
19.8
2.7
13.0
1. Includes employed, pensioners and renters.
2. This is not the open unemployment rate, but the share of unemployed in total number of heads.
3. This is the share of occupied people in the total number of heads.
Source: Trejos, 2001. Household Survey, 1997.
2.11. Poor families are younger, have higher dependency rates and most have none or only one income earner. Poor
families are larger than non-poor families (4.7 family members vs. 3.7 for non-poor) and have a higher number of
people younger than 12 years of age (1.7 vs. 0.9), who demand both more expenditures and time from their parents
(Table 11). Poor families also have a smaller number of people who are active in the labor market (1.2 vs. 1.6), and
have a smaller number of people working per family than non-poor families (1.1 vs. 1.5).
2.12. All labor force participation rates (for heads and non-heads) for the poor are much lower than those of non-
poor families (Table 12). Participation rates of male heads are 7 percent lower and those of non-head males 15 percent
lower than those of the non-poor counterparts. Participation rates for females are even much lower than those of the
non-poor counterparts. For poor female heads, participation rates are 30 percent lower than for the non-poor, and for
non-heads, participation rates are more than 50 percent lower than for the non-poor. There may be many factors
explaining the lower labor force participation of the poor, including the high fertility of poor women, their low
education, and the possible lack of childcare services, among other factors.

POVERTY PROFILE: CHARACTERISTICS OF THE POOR AND VULNERABLE GROUPS
17
TABLE 11.
Characteristics of poor and non-poor, 1997.
National Non-poor1
Poor
Demographics
Persons per Family 4.1 3.7 4.7
Persons in Working Age 3.0 2.8 3.0
Persons Active 1.6 1.6 1.2
Persons < 12 Years of Age 1.1 0.9 1.7
Working People per Family 1.5 1.5 1.1
Dependants per Worker 1.7 1.5 3.4
Characteristics Heads
Percent Women Heads (%) 20.7 19.6 27.1
Head’s Age (Years) 45.9 46.0 48.6
Head’s Education (Years) 6.9 8.3 4.7
1. The characteristics of this group are those of the non-poor according to NBI and income criteria (Trejos, 2001).
This is a smaller and higher income group than the non-poor according to income alone. Thus, the indicators in the
table may be better than those of the income non- poor, and the difference in poor/non-poor may be somewhat
exaggerated.
Source: Trejos (2001) and authors’ calculations. Household survey, 1997.
2.13. Unemployment rates are high for the poor. Poor heads and non-heads face unemployment rates which are
more than three and a half times higher than those faced by their non-poor counterparts. While unemployment rates
for non-poor male and female heads are reasonably low -less than 3 percent- they are significantly higher for the poor
(5 percent for males and 10 percent for females). The situation is far worse for poor non-heads and is similar for males
and females. Almost one in four poor non-heads in the labor market were unemployed as compared to one in fifteen
in non-poor families, in 1997.
TABLE 12.
Labor force participation and unemployment rates of heads and non-heads, 1997.
National Non-Poor1
Poor
Labor Force Participation
Heads
Male
Female
79.6
86.9
51.7
80.3
86.3
55.4
69.3
80.4
39.5
Non Heads
Male
Female
39.8
59.7
29.4
41.6
56.8
34.7
26.4
48.2
16.3
Unemployment rate (total)2
5.7 3.7 13.2
Heads
Male
Female
2.0
1.6
4.4
1.1
0.8
3.1
5.8
5.0
9.9
Non Heads
Male
Female
9.5
10.0
9.0
6.5
7.7
5.6
23.0
22.3
23.9
1. The characteristics of this group are those of to the non-poor according to NBI (Basic Needs
Index) and income criteria calculated by Trejos (2001).
This is a smaller and higher income group than the non-poor according to income alone. Thus, the
indicators in the table may be better than those of the income non- poor, and the difference in
poor/non-poor may be somewhat exaggerated.
2. This is the open unemployment rate.
Source: Trejos (2001) and author’s calculations. Household survey, 1997.
COSTA RICA: SOCIAL SPENDING AND THE POOR
18
2.14. Costa Rican families show some accumulation of assets in 1997, even for the poorest of the poor.13 There are,
however, great disparities by poverty level for both, urban and rural areas (Table 13 and Table 14). While only about 27
percent of the poorest urban families (approximate first quartile of the income distribution), and 55 percent of the
poorest rural families, own their own home, about 79 percent of urban and 85 percent of rural families in the richest
50 percent group do so. Access to basic services is deficient, especially in rural areas for the poorest quartile of
families. Also, the indicator for housing quality is highly deficient in urban and rural areas for the poorest 10 percent of
the population.
2.15. Fewer of the poor complete primary and secondary education. In urban areas, only about 15 percent of the
heads of the poorest income quartile have more than primary education, in contrast to 77 percent of the heads in the
highest 50 percent group. In rural areas, most household heads in all income groups have only primary education.
Regarding children’s human capital, only about 62 of children in the lowest income quartile complete primary
education, while about 82 percent of children belonging to the richest quartile do so. And, while only 15 percent of
youngsters in the lowest quartile complete 11 years of education, 60 percent (still a low number) of children belonging
to the top quartile of the income distribution do so.
TABLE 13.
Investments in assets by poverty level in Costa Rica, urban area, 1997.
Assets 0.4%
Poorest 2.4% 5% 16.2% 25.0%
51.0%
Richest Total
Number of Families 1,176 7,059 14,706 47,647 74,411 149,410 294,115
Physical Assets
Own a house 27.5 40.4 50.3 62.5 74.5 79.1 73.2
House has basic services1 14.3 60.8 83.3 94.4 98.6 99.5 96.0
House good/ regular condition 36.3 35.8 62.1 79.1 92.1 99.0 90.5
House has comfort items:
TV color
Refrigerator
Washing machine
18.4
22.4
19.9
48.9
32.5
36.7
59.2
59.8
57.6
75.5
82.8
75.5
87.0
91.3
84.3
96.2
97.8
93.6
87.3
90.0
84.9
Human Capital of Head
Primary (some and complete) 100 92.8 83.2 75.2 66.0 22.9 47.0
Secondary (some and complete) 0.0 7.2 16.8 23.5 30.8 38.0 32.1
Higher education 0.0 0.0 0.0 1.1 3.2 39.1 20.9
Human Capital Children2
Q1 (poorest quartile) Q2 Q4 Total
Primary and more 62.1 79.9 92.4 81.6
Secondary and more 15.0 18.4 59.3 43.7
1. Water, electricity, sanitation.
2. Figures for national level, 1999. Calculations by quartile made by Trejos (2001) based on household surveys. The third
quartile not included.
Source: IMAS, 2000b.
13 Poverty level is defined according to a point score system developed by IMAS to select people for the different programs of
IMAS. The point score system gives a poverty score to each family in the sample (poor and rich), according to the socioeconomic
characteristics of the families, using principal component analysis. In practice, each characteristic is calculated a weight, and these
weights are added up to arrive at the total point score for the family. The lower the score, the poorer the family is. The technical
aspects of the methodology are presented in Elizondo et al. (2000).

POVERTY PROFILE: CHARACTERISTICS OF THE POOR AND VULNERABLE GROUPS
19
TABLE 14.
Investments in assets by poverty in Costa Rica, rural area, 1997.
Assets 1.8%
Poorest 4.3% 8.7% 9.3% 28%
48.0%
Richest Total
Number of Families 6,777 16,190 32,757 35,016 105,425 180,353 376,519
Physical Assets
Own a house 55.2 51.5 63.7 71.7 72.7 85.9 77.0
House has basic services1 9.5 29.5 48.7 57.7 75.2 90.7 73.2
House good/ regular condition 14.4 35.6 52.4 68.6 82.4 96.1 81.8
House has comfort items:
TV color
Refrigerator
Washing machine
9.9
9.7
3.0
19.2
20.1
20.1
32.3
37
29.6
47.6
60.5
53.9
63.5
75.3
65.0
87.3
92.6
85.9
67.8
75.3
67.8
Human Capital of Head
Primary (some and complete) 100 98.3 96.1 94.7 91.4 62.7 78.9
Secondary (some and complete) 0.0 1.7 3.7 5.3 8.4 26.0 15.8
Higher education 0.0 0.0 0.0 0.0 0.0 11.1 5.3
Human Capital Children2
Primary and more 69.9
Secondary and more 20.2
1. Water, electricity, sanitation.
2. Refers to 1999. Figures from Part II of this report with data calculated by Trejos (2000).
Source: IMAS, 2000b.
2.16. In summary, the income poor have large families to support and low labor market participation rates for both
heads and non-heads. In addition, poor households face much higher unemployment rates than the non-poor. While
unemployment may be discouraging labor force participation, especially of poor non-heads, other factors may be also
present, including the low education, the high fertility of the poor, the lack of child care, among other factors.14 Even
the poorest Costa Rican families have an important level of accumulation of physical assets as indicated by housing
ownership, quality of housing, and purchase of durables. The situation is, however, not the same for human capital
accumulation of the poorest—only about 15 percent of the poorest children complete secondary education, a level
considered as a threshold to break intergenerational poverty cycles in countries of Latin America. In 1999 the majority
of poor (25 percent of the poorest) children 15-17 years of age (45.7 percent, male) were working instead of attending
school and this figure is nearly twice as high for adolescents in rural areas as compared to urban teens.
2.17. The poor are lagging behind in several aspects:
· There are major gaps in education coverage. The problems begin with the youngest children, 0-5 years of
age, where social spending is directed to middle and upper income children.
· There are major differences in education attainment of youth ages 13-18 between the top and bottom
quintiles of the income distribution as a result of high repetition in primary and secondary education and
dropouts. In this age group, only about 15 percent of youth complete secondary education in the bottom
quintile compared to 60 percent for the top quintile.
· The poor participate much less in labor market activities than do the non-poor, especially those who are
not household heads, and when they do participate they have substantially higher unemployment (3 to 4
times higher) than those of the non-poor. This is most likely the result of their low education and skills.
· Poverty appears to be related to the disintegration of the family. Single women head nearly fifty percent of
extreme poor families. This fraction is much larger than poor and near-poor families, at 31 percent and 33
percent, respectively. Over 90 percent of women heads of all poverty groups have no spouse, as compared
to only about 10-20 percent poverty levels for family with male-headed households.
14 Some people have even suggested that the existing great number of social programs for poor families may be having an adverse
effect on labor force participation of women. Unfortunately there are no studies to support or deny this hypothesis.

COSTA RICA: SOCIAL SPENDING AND THE POOR
20
· There are a still large number of elderly poor who have not been covered by non-contributory pensions
despite the fact the Costa Rica spends sufficient resources to reach the elderly population with non-
contributory pensions.
Expanded Poverty Profile using the SIPO Database
2.18. This section presents a more detailed analysis of the family and individual characteristics of the poor and
vulnerable groups and of their main social service needs based on the SIPO database.15 Families are classified in three
groups: (i) the extreme poverty group, includes families whose per-capita income is below the cost of the basic food
basket; (ii) the poor group includes families whose per-capita income is below the cost of a basic consumption basket
(poverty line) and above the cost of the food basket; and (iii) the near-poor group includes all families with per-capita
incomes above the poverty line. About 46 percent of families are classified as extremely poor, another 34 percent as
poor, and another 20 percent as near-poor (Table 15). The near-poor are those with income over the poverty line but
who reside in the areas surveyed by SIPO. This latter group is not a representative sample of the non-poor population.
2.19. While the majority of people in SIPO live in urban areas, the majority of the extremely poor reside in rural
areas. As indicated in the methodological considerations SIPO Annex, however, the urban-rural definition in SIPO is
different from that used in household surveys and it is, thus, not possible to compare these results with those of
household surveys.
2.20. Women heads are a large proportion of the extreme poor population. Women head about 48 percent of all
families in extreme poverty, compared to only 33 percent in near-poor families (Table 15). The family size of the
extreme poor families is much larger than that of poor and near-poor families.
TABLE 15.
Characteristics of families in SIPO data base.
Extreme poverty Poor Near Poor Total
No. Families 95,047
(46%)
70,385
(34%)
42,164
(20%)
207,596
(100%)
No. Persons 395,919
(49%)
284,541
(35%)
128,125
(16%)
808,585
(100%)
Persons / family 4.2 4.0 3.0 3.9
By Area
Urban
Rural
100.0
47.0
53.0
100.0
60.0
40.0
100.0
59.0
41.0
100.0
53.0
47.0
By Gender Total
Male
Female
100.0
46.2
53.8
100.0
49.2
50.8
100.0
51.1
48.9
100.0
48.1
51.9
By Gender Heads
Male
Female
100.0
52.0
48.0
100.0
69.0
31.0
100.0
67.0
33.0
100.0
61.0
39.0
Source: Author’s calculations using SIPO data base.
15 Some methodological issues concerning SIPO’s representation of the population as compared to household surveys and the 2000
population census are presented in Annex 1.

POVERTY PROFILE: CHARACTERISTICS OF THE POOR AND VULNERABLE GROUPS
21
2.21. The poorest families tend to be younger than the near-poor families. Over 65 percent of children of extreme
poor families are younger than 12 years of age, as compared to about 44 percent of children of near-poor families
(Table 16). And while only about 8 percent of children in extreme poor families are older than 19 years of age, about
31 percent of children in near-poor families are in that age group.16 Children of near-poor families stay longer in
school, and stay longer with their families before they migrate or have a new household. As shown below, older
children at home in near-poor families participate more in the labor market and help them move out of income
poverty.
TABLE 16.
Characteristics of families by poverty level.
Extreme poor Poor Near poor Characteristics
Heads Spouse Children Heads Spouse Children Heads Spouse Children
Age Groups
0-5 years - - 23.6 - - 19.6 - - 16.5
6-12 - - 42.1 - -- 38.5 - - 27.5
13-18 2.7 1.5 26.6 0.6 2.5 28.1 0.7 4.2 25.2
19-24 8.3 6.9 5.3 6.5 10.1 9.4 10.0 13.3 17.9
25-30 11.7 17.4 1.0 12.6 17.5 2.1 12.5 13.7 6.6
31-40 30.5 39.0 0.8 31.8 35.3 1.4 22.1 24.3 4.3
40-60 29.6 25.6 0.6 34.0 26.7 0.9 36.6 35.3 1.9
61-plus 17.2 9.5 0.1 14.6 7.9 0.1 18.1 9.2 0.1
Total 100.0 100.0 100.0 100.0 100.0 100.0 100.0 100.0 100.0
Education1
100.0 100.0 100.0 100.0 100.0 100.0 100.0 100.0 100.0
Some primary 50.2 46.5 43.6 39.7 35.7 32.1 35.4 31.5 22.0
Complete primary 34.7 41.1 32.3 38.4 42.4 35.4 35.6 38.9 36.4
Some secondary 11.4 9.5 20.9 15.3 15.7 26.6 15.6 17.5 28.1
Complete secondary 2.5 2.3 1.9 4.6 4.6 3.3 7.2 6.9 6.7
Higher 1.0 0.6 1.2 2.1 1.5 2.5 6.0 5.1 6.6
Activity1
Occupied2 53.3 7.1 12.8 77.5 12.8 26.0 78.2 28.8 48.2
Unemployed3 9.3 10.2 23.9 2.1 3.1 9.8 1.4 1.3 4.5
Inactive:
House wife
Student
41.2
21.4
1.1
92.1
88.6
0.2
83.2
3.7
57.7
20.8
8.1
0.1
86.8
83.8
0.3
71.2
2.8
53.3
20.7
6.4
0.1
70.8
66.6
0.5
49.5
2.3
37.4
Occupied1
Permanent 17.4 1.7 3.4 45.3 5.8 11.2 56.6 19.9 31.9
Temporary4 35.9 5.4 9.4 32.2 7.0 14.8 21.6 8.9 16.3
Occupational Category1
100.0 100.0 100.0 100.0 100.0 100.0 100.0 100.0 100.0
Unpaid worker 0.6 2.2 16.9 0.2 1.2 3.7 0.2 0.7 1.5
PUBLIC EMPLOYEE 1.6 2.3 0.6 6.3 5.3 1.6 12.4 17.2 6.3
Private employee 27.4 26.5 27.2 50.2 41.9 49.1 56.4 51.2 65.0
Self employed 69.8 68.8 54.9 42.5 51.0 44.9 30.2 30.4 26.7
Employer 0.6 0.2 0.4 0.8 0.6 0.5 0.8 0.6 0.6
1. Children are 12 years of age and older. Children refer to code 3 (Hijos) in survey form.
2. This is the share of occupied people in population older than 12 years of age.
3. This is the open unemployment rate.
4. Temporary includes seasonal and occasional.
Source. Author’s calculations with SIPO database.
16 Household surveys provide information only of children living in the household at the time of the survey not of the total number
of children a family has had.
COSTA RICA: SOCIAL SPENDING AND THE POOR
22
2.22. Education attainment of all family members in extreme poor and poor families is very low. Over 85 percent of
heads and spouses of extreme poor families and about 78 percent of heads and spouses of poor families have only
primary education (some and complete), as compared to about 71 percent for heads and spouses in near-poor families
in SIPO data base. The situation of children over 12 years of age is not much better. Only about 24 percent of extreme
poor and 32 percent of poor children have more than primary education, as compared with 41 percent for near-poor
children in SIPO. A strong positive relationship appears to exist between mothers´ and fathers´ education and that of
their children, as has been found in econometric studies for many LAC countries (Castañeda-Aldaz, Moran, 2001).17
2.23. All family members in extreme poor families have low labor force participation rates, including family heads,
spouses and children older than 12 years of age. The participation rate of extreme poor heads is only 58.8 percent as
compared to 79.2 percent for poor heads, and near-poor heads 79.3 percent. The differences in participation rates
between extreme poor, poor and near-poor are even higher for spouses and children. Extremely poor spouses
participate very little (7.9 percent), with poor (13.2 percent) and near-poor spouses (29.2 percent) participating at
considerably higher rates. This may be because poor women have more children younger than 12 years of age than
near-poor women, and because of their lower education levels.
2.24. Employment rates (employed in relation to people 12 years and more) of all family members are significantly
lower for the extreme poor (53 percent) than for the poor and near-poor (77 and 78 percent respectively). The
employment rate of near-poor spouses and children are about four times higher than those of the extreme poor
spouses and children, as near-poor families have a substantially larger proportion of children older than 19 years of age
(in the family) than do the extreme poor and poor.18
2.25. The extreme poor and poor, when occupied, work primarily in temporary activities, while the near-poor work
primarily in permanent activities. Thirty six percent of extreme poor heads, 9 percent of their children older than 12
years of age, and 32 percent of poor heads and 15 percent of their children work in temporary activities. By contrast,
57 percent of heads and 32 percent of children of the near-poor work in permanent activities.
2.26. All family members (heads, spouses and children) tend to work in the same occupation category, but the
occupation categories vary widely by poverty group. All members of extreme poor families work primarily in self-
employment, while poor families work in self-employment and in the private sector. By contrast, near-poor families
work primarily are more diversified, working in the private sector, self-employment and the public sector.19
2.27. Unemployment rates are very high for all family members of extreme poor families. Unemployment rates are
particularly high for spouses and children (non-heads) , as was reported in previous section using the 1997 household
survey. Poverty appears to be related to the disintegration of the family, as single women head nearly fifty percent of
extreme poor families. This fraction is much larger than in poor and near-poor families, at 31 percent and 33 percent,
respectively. (Table 17).
2.28. Families headed by women, especially in extreme poor families, have lower labor force participation rates.
While the labor force participation of male heads is over 75-80 percent for all three groups, the participation rates of
women heads reach only 36 percent. They also have higher unemployment rates than those of male heads in extreme
poor families. The lower participation and higher unemployment rates of female heads are not compensated by higher
participation of other family members.
2.29. Families headed by women have fewer members active and or working in the labor market than do poor and
near-poor families. They are also smaller than those headed by men for all poverty groups, the largest difference being
for the extreme poverty group (4.9 members vs. 3.3 for the near-poor). When female heads and children work, they do
so primarily in temporary jobs and in self–employment. These jobs provide not only less security, but also less benefits
as health insurance, and others. Health insurance rates for female heads are much lower in extreme poor (less than 70
percent) than for near-poor (84 percent) and male headed households are also much more likely to be insured.
17 We do not attempt to test this hypothesis with the SIPO data base because the near-poor in SIPO data base is not a
representative sample of the non-poor population, and thus we will have, most likely, severe sample selection bias.
18 This explains the apparent paradox that the children of the near-poor work more than the children of the poor, when the
opposite result may be expected. The main difference is thus the age structure of children of poor and near-poor families, which
may be a key factor in explaining income poverty. The children of the near-poor are older, more educated and contribute to family
income.
19 Unfortunately, the SIPO data base does not distinguish by sector of activity (agriculture, industry, services, etc.) or by size of
industry, as it is done in household surveys.

POVERTY PROFILE: CHARACTERISTICS OF THE POOR AND VULNERABLE GROUPS
23
TABLE 17.
Characteristics of household heads by gender and poverty level, 2000-2001.
Extreme poor Poor Near poor Total Characteristics
Male Female Male Female Male Female Male Female
Number 49,115 45,932 48,617 21,768 28,170 13,994 125,902 81,694
Heads (%) 52.0 48.0 69.0 31.0 67.0 33.0 61.0 39.0
With spouse (%)1 89.0 8.0 92.0 12.0 80.0 12.0 88.0 10.0
Education (years) 4.3 4.8 5.2 5.3 5.8 6.1 5.0 5.2
Age (years) 44.9 40.2 42.4 43.2 43.3 44.8 43.6 41.8
Persons per family (No.) 4.9 3.3 4.4 3.3 3.3 2.5 4.4 3.2
Children 0-12 (No.) 2.0 1.5 1.5 1.1 0.7 0.5 1.5 1.2
Persons in working age 2.7 1.7 2.7 2.0 2.4 1.8 2.6 1.8
Activity
Occupied (%)2
Permanent (%)
Temporary (%)3
74.0
27.0
47.0
32.0
7.0
25.0
87.0
52.0
35.0
57.0
30.0
27.0
86.0
61.0
25.0
62.0
47.0
15.0
82.0
45.0
37.0
44.0
20.0
24.0
Inactive (%) 8.6 10.8 2.1 2.1 1.5 1.0 4.4 5.6
Workers per family (No.) 19.0 64.0 11.0 42.0 13.0 37.0 14.0 53.0
Persons active per family 0.9 0.4 1.2 1.0 1.4 1.2 1.2 0.7
Personas activas por familia 1.0 0.5 1.2 1.0 1.5 1.2 1.2 0.8
Dependants per worker5 2.3 1.9 1.5 1.2 0.7 0.7 1.6 1.3
Dependants per earner 2.1 1.7 1.4 1.1 0.7 0.6 1.5 1.3
Single with children (%)6 4.0 77.0 4.0 75.0 4.0 65.0 4.0 74.0
Insured (%) 68.7 70.2 75.7 76.0 79.1 84.8 73.7 74.3
1. These are people married or in consensual union.
2. This is the share of occupied people in the total of heads.
3. Includes seasonal and occasional in SIPO occupational categories.
4. This is the open unemployment rate.
5. Dependants are those less than 12 years of age and the older than 60 years of age.
6. Heads who are single, divorced, separated, widows and have children or grandsons.
Source: Author’s calculations using SIPO database.
2.30. Although housing ownership is relatively high, the quality of housing is far from adequate. Very few (9 percent)
of the extreme poor and poor families in SIPO reported having received a housing subsidy (Bono). Regarding quality
of housing, about 107,000 (65 percent) of the houses of the extreme poor and poor have floors made of substandard
materials, 98,000 (59 percent) had leaking roofs made of substandard materials, and 101,000 (61 percent) had walls
made of boards and other similar materials. Also, about 25,000 (15 percent of poor families) have no indoor water
connections. Their water sources are wells, rivers, and rain, among others.
COSTA RICA: SOCIAL SPENDING AND THE POOR
24
2.31. Migrants. About 94.8 percent of people in the SIPO population are Costa Ricans, about 4.9 percent are
Nicaraguans and the rest (0.3 percent) are from other Central American and other countries (Table 18). It may be
expected that the number of migrants may be underestimated if people are fearful of reporting their true nationality, or
if they refuse to be surveyed because they believe they are not eligible for the social programs of IMAS or other social
welfare institutions, or other reasons.
TABLE 18.
Distribution of population in SIPO by nationality and poverty level.
Extreme poor Poor Near poor Total
Costa Ricans 376,515 269,414 120,528 766,457
Men heads 51.2 69.1 66.4 60.4
Women heads 48.8 30.9 33.6 39.6
Education (years) 3.6 4.4 5.4 4.2
Unemployment rate (%) 12.5 4.2 2.4 6.6
Nicaraguans 18,322 14,206 7,069 39,597
Men heads 56.6 68.6 71.7 63.8
Women heads 43.4 31.4 28.3 36.2
Education (years) 3.3 4.4 5.2 4.0
Unemployment rate (%)1 10.6 3.4 1.7 5.6
Other Nationalities 1,067 915 520 2,502
Men heads 58.5 68.0 70.0 64.4
Women heads 41.5 32.0 30.0 35.6
Education (years)2 4.8 6.3 7.1 5.9
Unemployment rate (%)2 8.1 4.9 2.2 5.0
Total 395,904 284,535 128,117 808,556
(100.0)
1. This is the open unemployment rate.
2. These are simple averages of the other nationalities.
Source: Author’s calculations using SIPO database.
2.32. In general, the characteristics of Costa Ricans in the SIPO database appear to be somewhat worse than those
of other nationalities. For instance, the proportion of women heads is higher for Costa Rican families than for other
nationalities, especially for the extreme poverty group. Also, the unemployment rates of all active persons older than
12 years of age are higher for Costa Ricans than for other nationalities, especially for the extreme poor group. Finally,
while the average number of years of education is similar for Costa Ricans and Nicaraguans in all three poverty groups,
they are much lower than those of nationals of other countries, in all three groups.
2.33. These numbers are however only indicative, as they may hide several biases including the possibility that those
accepting to be interviewed for SIPO may be the relatively better off migrants with a legalized status. It is interesting to
note that the proportion of Nicaraguans in SIPO is 4.9 percent, similar to that reported in the Census (5.6 percent of
total Costa Rican population), contradicting the expectation that Nicaraguans could be over-represented in the poor in
Costa Rica.20
Vulnerable Groups in Costa Rica
1. Poor children 0-5 years of age
2.34. According to figures from SIPO, only about 3 percent of extremely poor children and 7 percent of poor
children attend Hogares Comunitarios or CEN-CINAI Centers, the two major programs of this kind for low income
families, as compared to 15 percent of the near-poor children (Table 19).21 This group of children faces several risks,
20 Further investigation of these issues may be done using more detailed information of the 2000 population.
21 Coverage of this group is overestimated because not all children of this group are included.

POVERTY PROFILE: CHARACTERISTICS OF THE POOR AND VULNERABLE GROUPS
25
including lack of early physical and intellectual stimulation and poor motor and social skills. 22 According to
information from SIPO’s database, over 80 percent of extremely poor children 0-5 years of age have mothers with
only primary education (incomplete plus complete), as compared to 54 percent for the near-poor and about one-third
of extremely poor children have mothers who have no health insurance, as compared to only 13 percent for the near-
poor.
2.35. Most mothers of extremely poor and poor children have low labor force participation rates, in part to care for
their small children and probably because of their low education. In addition, when extremely poor women participate
in the labor market, their open unemployment rate of more than 11 percent is much larger than that of the other
groups. Almost 80 percent of mothers of extremely poor and 75 percent of mothers of poor children are inactive, as
compared to about 50 percent of near-poor mothers.
TABLE 19.
Characteristics of children 0-5 years of age.
Characteristics Extreme Poor Poor Near Poor2
Total
Number of children 0-5
Number of children per mother
57,010
1.4
31,262
1.3
9,725
1.2
97,997
1.3
Mother’s Education1
100.0 100.0 100.0 100.0
Incomplete primary 38.7 26.9 16.5 32.6
Complete primary 43.0 44.5 38.6 43.0
Incomplete secondary 14.5 20.8 24.3 17.5
Complete secondary 2.8 5.5 11.2 4.5
Higher education 1.1 2.4 9.4 2.3
Mother’s Activity1
Occupied3 18.3 25.0 49.5 23.5
Unemployed4 11.4 2.4 0.9 6.1
Inactive (mainly housewife) 79.5 74.4 50.1 75.0
Mother’s Health Insurance1
100.0 100.0 100.0 100.0
Insured 67.3 77.3 86.7 72.4
Not Insured 32.7 22.7 13.3 27.6
Attendance ECD Centers 100.0 100.0 100.0 100.0
Hogares Comunitarios 1.7 5.2 13.4 4.0
CEN-CINAI Centres 1.4 1.5 1.4 1.5
Other Centers 1.3 1.8 2.4 1.5
Not Attending 95.5 91.5 82.8 93.0
1. Mother’s characteristics are those of heads or spouses with children 0-5 years of age. Not included are
the characteristics of mothers of those 0-5 years old children who appear as grandsons/daughters of
family head. In SIPO, there were about 1,800 grandsons/daughters 0-5 years of age not covered by ECD
programs.
2. This is not a representative sample of the non-poor.
3. This is the share of occupied people in the total of mothers with children less than 5 years old.
4. This is the open unemployment rate.
Source: Author’s calculations from SIPO’s database.
22 Research on this topic in developed and developing countries has documented significant benefits of ECD programs to
mothers—who may be able to work and or study—older siblings, who can devote more time to studying instead of caring for
younger children, children themselves when they grow older, who achieve greater levels of schooling and earnings, suffer less
unemployment, and to society for lower levels of crime and expenses of the justice system (Karoly et al., 1998).

COSTA RICA: SOCIAL SPENDING AND THE POOR
26
2. Youths, 13-18 years old
2.36. Más del 52% de los jóvenes registrados en la base de datos del SIPO viven en extrema pobreza y
aproximadamente un 36% son pobres (Table 20). Alrededor del 80% de sus madres cuentan únicamente con
educación primaria. Las madres pobres y en extrema pobreza tienen una participación más baja en el mercado laboral
que las madres casi pobres (24% para las madres de los extremadamente pobres vs. 44% de las madres de los casi
pobres).
TABLE 20.
Características de los jóvenes de 13-18 años de edad.
Characteristics Extreme Poor Poor Near Poor Total
Number of young 13-18
Number of children per mother
64,182
1.7
44,650
1.6
14,768
1.4
123,600
1.6
Number of children 0-5
Number of children per mother 100.0 100.0 100.0 100.0
Mother’s Education1 43.6 33.3 28.4 37.9
Incomplete primary 40.8 42.7 40.5 41.4
Complete primary 12.1 16.7 16.5 14.2
Incomplete secondary 2.7 5.4 7.5 4.3
Complete secondary 0.9 2.1 7.1 2.0
Higher education 100.0 100.0 100.0 100.0
Mother’s Activity1 24.3 30.4 43.9 28.8
Occupied3 6.7 1.8 0.7 3.7
Unemployed4 74.0 69.1 55.8 70.1
Inactive (mainly housewife) Males Females Males Females Males Females Total
Mother’s Health Insurance1 76.3 73.3 70.6 64.8 64.0 55.7 70.6
Insured 19.8 23.8 26.7 33.5 33.4 42.1 26.5
Not Insured 0.1 0.2 0.1 0.2 0.2 0.3 0.2
Attendance ECD Centers
Hogares Comunitarios 2.8 0.7 5.2 1.8 10.2 3.4 3.0
CEN-CINAI Centres 8.8 2.1 12.4 3.1 13.3 3.4 6.8
Other Centers 20.4 32.7 9.4 16.1 5.6 9.2 15.2
Not Attending 0.2 5.2 0.2 4.1 0.1 4.3 2.3
Number of children 0-5
Number of children per mother 67.9 68.6 67.6 73.1 64.4 73.8 69.0
Mother’s Education1 17.4 22.0 12.8 16.9 10.6 14.6 17.0
1. These may not all be the biological mothers of these children. These are, however, women household heads or
spouses in families where those children live, and are, thus, responsible for them.
2. This is the share of occupied people in the total of mothers with children 13-18 years old.
3. This is the open unemployment rate.
Source: Author’s calculations from SIPO’s database.
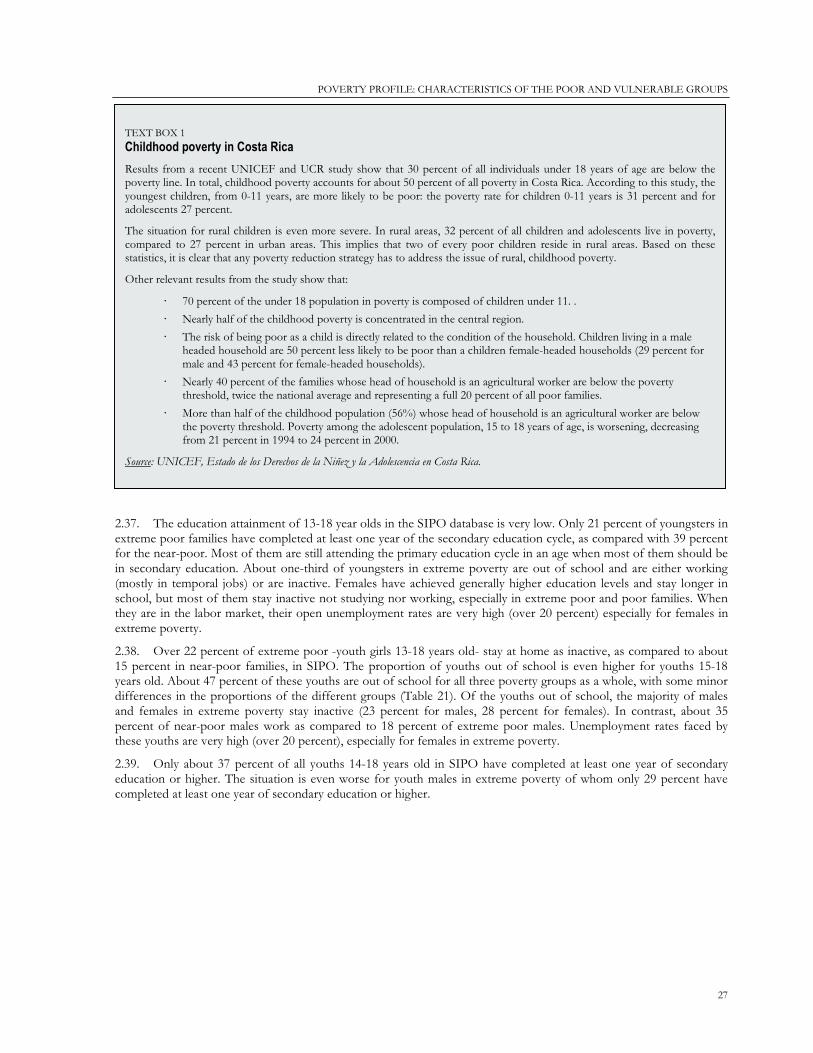
POVERTY PROFILE: CHARACTERISTICS OF THE POOR AND VULNERABLE GROUPS
27
2.37. The education attainment of 13-18 year olds in the SIPO database is very low. Only 21 percent of youngsters in
extreme poor families have completed at least one year of the secondary education cycle, as compared with 39 percent
for the near-poor. Most of them are still attending the primary education cycle in an age when most of them should be
in secondary education. About one-third of youngsters in extreme poverty are out of school and are either working
(mostly in temporal jobs) or are inactive. Females have achieved generally higher education levels and stay longer in
school, but most of them stay inactive not studying nor working, especially in extreme poor and poor families. When
they are in the labor market, their open unemployment rates are very high (over 20 percent) especially for females in
extreme poverty.
2.38. Over 22 percent of extreme poor -youth girls 13-18 years old- stay at home as inactive, as compared to about
15 percent in near-poor families, in SIPO. The proportion of youths out of school is even higher for youths 15-18
years old. About 47 percent of these youths are out of school for all three poverty groups as a whole, with some minor
differences in the proportions of the different groups (Table 21). Of the youths out of school, the majority of males
and females in extreme poverty stay inactive (23 percent for males, 28 percent for females). In contrast, about 35
percent of near-poor males work as compared to 18 percent of extreme poor males. Unemployment rates faced by
these youths are very high (over 20 percent), especially for females in extreme poverty.
2.39. Only about 37 percent of all youths 14-18 years old in SIPO have completed at least one year of secondary
education or higher. The situation is even worse for youth males in extreme poverty of whom only 29 percent have
completed at least one year of secondary education or higher.
TEXT BOX 1
Childhood poverty in Costa Rica
Results from a recent UNICEF and UCR study show that 30 percent of all individuals under 18 years of age are below the
poverty line. In total, childhood poverty accounts for about 50 percent of all poverty in Costa Rica. According to this study, the
youngest children, from 0-11 years, are more likely to be poor: the poverty rate for children 0-11 years is 31 percent and for
adolescents 27 percent.
The situation for rural children is even more severe. In rural areas, 32 percent of all children and adolescents live in poverty,
compared to 27 percent in urban areas. This implies that two of every poor children reside in rural areas. Based on these
statistics, it is clear that any poverty reduction strategy has to address the issue of rural, childhood poverty.
Other relevant results from the study show that:
· 70 percent of the under 18 population in poverty is composed of children under 11. .
· Nearly half of the childhood poverty is concentrated in the central region.
· The risk of being poor as a child is directly related to the condition of the household. Children living in a male
headed household are 50 percent less likely to be poor than a children female-headed households (29 percent for
male and 43 percent for female-headed households).
· Nearly 40 percent of the families whose head of household is an agricultural worker are below the poverty
threshold, twice the national average and representing a full 20 percent of all poor families.
· More than half of the childhood population (56%) whose head of household is an agricultural worker are below
the poverty threshold. Poverty among the adolescent population, 15 to 18 years of age, is worsening, decreasing
from 21 percent in 1994 to 24 percent in 2000.
Source: UNICEF, Estado de los Derechos de la Niñez y la Adolescencia en Costa Rica.

COSTA RICA: SOCIAL SPENDING AND THE POOR
28
TABLE 21.
Characteristics of youth 14-18 years.
Extreme Poor Poor Near Poor Characteristics
Males Females Males Females Males Females Total
Number of people 15-18 20,481 21,613 15,352 14,863 5,955 5,775 84,039
Heads 0.9 10.8 0.9 1.6 2.8 2.3 3.8
Level of education of youth
Primary 66.9 63.8 60.8 54.0 55.9 48.9 60.7
Secondary 29.0 33.2 36.2 44.0 41.1 48.5 36.3
Higher 0.2 0.2 0.2 0.2 0.3 0.3 0.2
Activity of youth
Permanent 4.3 1.0 8.1 2.9 15.3 5.5 4.8
Temporary 13.5 3.5 18.8 4.6 19.3 5.0 10.1
Unemployed1 20.8 31.0 9.2 13.7 5.7 7.5 14.7
House wife 0.3 15.4 0.2 13.0 0.2 20.2 7.8
Student 54.2 50.7 53.7 57.3 50.7 53.3 53.4
Other inactive 22.9 27.5 16.5 20.9 12.4 15.1 21.3
1. This is the open unemployment rate.
Source: Author’s calculations from SIPO’s database.
3. Youths 19-24 years old
2.40. There are important differences by gender in this age group in at least four aspects (Table 22). First, females are
over-represented in the youth in extreme poverty. A large number of females in extreme poverty are household heads
(41 percent), compared to only 18 percent of males that are in extreme poverty. Second, the proportion of youth male
heads increases as families move out of poverty, while the proportion of women heads decreases (from 41 percent for
extreme poor to 17.5 percent for the near-poor).
TABLE 22.
Characteristics of youth 19-24 years.
Extreme Poor Poor Near Poor Characteristics
Males Females Males Females Males Females Total
Number of people 19-24 9,796 14,902 12,909 12,194 10,294 8,160 68,255
Heads 18.4 40.8 22.3 13.7 27.0 17.5 24.4
Level of education of youth
Primary 63.9 62.6 61.8 56.6 57.5 46.9 58.9
Secondary 25.8 29.4 29.8 35.4 34.4 42.1 32.3
Higher 3.5 3.0 4.4 5.0 5.5 9.3 4.9
Activity of youth
Permanent 13.6 3.4 35.8 15.7 58.5 36.2 25.4
Temporary 35.1 10.0 36.1 11.7 25.7 10.1 21.3
Unemployed1 21.9 27.3 7.3 7.6 3.6 2.5 10.0
House wife 0.8 47.3 0.3 41.8 0.2 32.0 21.8
Student 20.9 16.7 15.3 17.5 8.9 14.5 15.8
Other inactive 15.9 17.5 6.8 11.1 3.5 6.0 10.6
1. This is the open unemployment rate.
Source: Author’s calculations from SIPO’s database.
2.41. Third, the extreme poor and poor youths 19-24 years old have very low educational attainment. Only about 29
percent of males and 32 percent of females in extreme poverty have completed at least one year of secondary
education or higher, as compared to the near-poor (40 percent of males and 51 percent of females). A surprising result

POVERTY PROFILE: CHARACTERISTICS OF THE POOR AND VULNERABLE GROUPS
29
is that the proportion of students is higher for youths in extreme poverty than for the near-poor, for both males and
females. This may indicate that the extreme poor may still be completing secondary education at this age, or are
engaged in other non-formal education. The very high unemployment rates for the extreme poor may be related to
their low education levels. Over 8,100 extreme poor and poor youth 19-24 years of age are unemployed and have low
education.
2.42. Fourth, labor force participation rates of the extreme poor are much lower than those of the near-poor for
both males and females (62 percent and 18 percent vs. 87 and 47 for males and females, respectively). This may be
related to the very high unemployment rates for both males and females in extreme poverty (21.9 and 27.3 percent for
the extreme poor), as many of these youths may be discouraged from participating in the labor market. However, as
noted earlier, a high proportion of extreme poor and poor youths are still studying (probably repeating some years of
secondary education) and a high proportion are inactive, as compared to near-poor families. When they work, most of
the extreme poor males and females work in temporary jobs, while most of the near-poor work in permanent jobs.
4. The elderly: sixty five years and older
2.43. Extremely poor elderly people show rates of high malnutrition and poverty risk because of their inability to
work or the lack of job opportunities. Costa Rica has sought to address these risks by the introduction of a non-
contributory pension regime to cover the poor not covered by the formal contributory regime. In the SIPO database
there are about 35,500 people older than 65 years of age, of whom about 48 percent are extremely poor, 32 percent are
poor and 20 percent are near-poor (Table 23). In total, an estimated 17 percent of the people in the SIPO database are
over 65 years of age, compared to around 8 percent for the general population. The following are some of the main
characteristics of this population group.
TABLE 23.
Characteristics of people 65 and more years old.
Characteristics Extreme Poor Poor Near Poor Total
Number of people 17,002 11,302 7,258 35,562
Men 44.3 49.4 49.5 47.0
Women 55.7 50.6 50.5 53.0
Female Heads 45.9 34.7 37.4 40.8
Male Heads 54.1 65.3 62.6 59.2
Health Condition
Permanent limitation 35.9 30.3 25.2 31.9
Temporary limitation 10.4 10.6 9.1 10.2
Good health condition 53.7 59.2 65.6 57.9
Health Insurance
Insured 92.2 94.0 94.5 93.2
Not insured 7.8 6.0 5.5 6.8
Activity 100.0 100.0 100.0 100.0
Permanent Job 2.0 3.6 6.9 3.5
Temporary Job 7.0 9.0 7.2 7.6
Unemployed1 14.5 6.2 3.6 9.0
House wife 24.1 25.2 22.5 24.1
Pensioner
Contributory regime
Non contributory regime
Other
50.3
6.7
42.9
0.7
50.9
25.7
24.3
0.9
52.8
40.0
11.5
1.3
51.0
19.5
30.6
0.9
Other activity 15.0 10.4 10.1 12.6
1. This is open unemployment calculated as the number of unemployed divided by the active population in
group.
Source: Author’s calculations from SIPO´s database.
· First, as expected, a large fraction of this group is women and they are over-represented in the extreme
poor group where a large fraction of them are family heads.

COSTA RICA: SOCIAL SPENDING AND THE POOR
30
· Second, around 40 percent of elderly report a poor, self-assessed health status. Over one third of the elderly
in extreme poverty had a permanent limitation, many report mental health problems and another 10
percent some temporary limitation. Insurance coverage is high, however, with only about 8 percent of the
extremely poor in this group report having no health insurance.
· Third, only about 50 percent of the extreme poor and poor groups receive a pension (contributory or non-
contributory). The percentages covered by non-contributory pension are higher for the extreme poor group
(43 percent) and poor (24 percent) than for the near-poor group (12 percent). However, about 14,000
extreme poor and poor elderly people were still not covered by any pension regime in 200023.
TABLE 24.
Summary of Critical GAPS in Social Services of the Poor and Vulnerable Groups in Costa Rica, 2000-2001.
Population Groups and Services GAP Programs
A. Education and training
Children 0 84,500
Not covered by ECD programs of CEN-CINAI,
Hogares Comunitarios, other. Major efforts are
needed to target above programs to increase
coverage and increase NGO and private sector
cooperation.
Children 13 33,600
Programs to induce children to return to school - and
improve education quality. Scholarships, conditional
transfers, other.
Unemployed young 19 8,100
Youth training programs - financed by public funds
and provided by private enterprises to ensure
relevance of training.
B .Health insurance gap
Men and women heads 28,700 CCSS with state funds. CCSS decentralization of
care and improve information.
Elderly (65 years of age and older) 2,000 CCSS with state funds. CCSS decentralization of
care and improve information.
C. Pension gaps
Elderly (65 years of age and older)
below poverty line 7,000
Non-contributory pensions of the CCSS financed by
FODESAF.
D. Housing and basic services gap
Housing quality (number of houses)
Bad floor1:107,000
Bad roof: 98,000
Bad wall: 101,000
Housing vouchers for housing or housing
improvements financed by FODESAF. Previous
vouchers have not been targeted to poorest. Only
about 25 percent of subsidies have gone to poorest
25 percent of population in the 1990-99 period.
Basic services (potable water)
(number of houses)
25,000 (15% of houses) have no in-
door water connections.
Subsidized connections to basic services provided
by water companies—national, municipal, other.
Note: Figures from SIPO, number of people.
1. Bad refers to the presence of substandard materials in floors, roofs and walls adversely affecting the living conditions of poor
families.
Source: Author’s calculations based on SIPO data base.
2.44. The main service gaps of the poor and vulnerable are as follows (Table 24). First, about 84,000 poor children
who were not covered by public Early Child Development (ECD) programs, such as CEN-CINAI centers, Hogares
Comunitarios or other programs. Most of these children are highly vulnerable because they stayed at home under the
care of poorly educated mothers, older siblings, or relatives who may lack the skills to stimulate little children and help
them develop the motor and social skills they need. Second, about 33,00 children 13-18 years of age who were out of
the school system and were, thus, unable to complete higher levels of education to take advantage of the modernizing
economy, leaving them highly vulnerable to high unemployment and low productivity and incomes. Third, about 7,000
elderly poor who were not covered by any assistance or contributory pension leaving them vulnerable to the effects of
23 Coverage may have improved recently with the increased targeting of existing pensions and the increase in the number of
pensions awarded by the government in 2000-2001, which may not be reflected in the database that includes families surveyed from
1999-until early 2001.

POVERTY PROFILE: CHARACTERISTICS OF THE POOR AND VULNERABLE GROUPS
31
very low incomes. In addition a great number of poor families still lack adequate health care and suffer from highly
inadequate housing conditions and lack of basic services.
2.45. Summary poverty profile using SIPO. In summary, the main characteristics of the income poor and
vulnerable groups (many of which are similar to those of comparable variables from household surveys, as seen in
SIPO Annex), are as follows:
· Children 0-5 years of age are a highly vulnerable population group in Costa Rica. About 84,000 of them (95
percent of the poor group) are extremely poor or poor and are not attending CEN-CINAI or Hogares
Comunitarios centers. Most children stay at home under the care of mothers, older siblings, or relatives.
Over 80 percent of mothers of these children have only primary education and may be unaware or unable
to provide adequate stimulation and the motor and social skills their young children need to start breaking
the poverty cycle. (See sections for strategies and cost estimates to increase coverage on ECD education for
these children, in Part II).
· Extreme poor and poor families show very low education attainment of all family members. About 80
percent of parents have only attained primary education (some and complete). A large number of children
13-18 years of age are out of the school system, although the proportion out school is similar for the
extreme poor, the poor and near-poor in SIPO (about 30 percent). The situation is far worse for children
14-18 years of age, of whom about 47 percent are out of school. Of those not attending school, about half
of them work while the rest stays inactive. A larger proportion of extreme poor females remain inactive in
comparison with males. It has been estimated that about 33,600 youth 13-18 years of age are out of the
school system. These students should be induced to return to school or to receive special training to
upgrade their skills for the modernizing Costa Rican economy.
· Extreme poor and poor families show lower participation rates in the labor market of all family members
than the near-poor. Extreme poor females participate the least in the labor market, as compared with the
near-poor. The lower participation of children over 12 years of age for the extreme poor, as compared to
the poor and near-poor, is somewhat surprising because it is commonly believed that poor children would
leave school early to work and help support their families. Apparently, this is not the case in Costa Rica. In
fact, as indicated by the profiles of the youth 14-18 and 19-25 years old, extremely poor youth participate
much less than the poor and near-poor, and show a higher proportion who are studying.
· Extreme poor and poor families are larger, have more children under 12 years of age, and have fewer
children over 19 years of age than near-poor families. Thus, dependency rates are higher for extreme poor
and poor families than for the near-poor because of the higher number of dependants (children) and lower
number of workers.
· One of the most striking facts of extreme poor families is the extremely high unemployment rate for all
family members. Unemployment rates of extreme poor heads and spouses are 9-10 percent, while those of
children are over 20 percent. The unemployment rates of youth 19-24 years old in extreme poverty are
especially high (21.9 males and 27.3 for females). It has been estimated that about 8,100 extreme poor and
poor youth are unemployed and low-skilled, and are good candidates for youth training programs.
· Women head 48 percent of the families in extreme poverty, compared to 33 percent for near-poor families.
Families headed by women are, however, smaller than those headed by men. Women heads participate
more in the labor market than other women (spouses) but participate much less than do male heads. Most
female heads work in temporary jobs, rather than in permanent jobs that offer job security and health
insurance, among other benefits.
· The elderly over 65 years of age in extreme poverty are also a highly vulnerable group because of their ill
health and low incomes. About 46 percent of extreme poor people older than 65 years of age reported
permanent or temporary physical or mental limitation. About 14,000 elderly in extreme poverty and poor
(about 50 percent of group) are not covered by contributory or assistance pensions. However, recent
government figures for 2000 and 2001 indicate that the number of non-contributory pensions awarded to
the poor has increased considerably and that the number of uncovered elderly may be about 7,000, by the
end of 2001. Most, if not all, of these people can be covered by re-allocation of current pensions from non-
deserving to the deserving poor, as was done in 2000-2001.
· Most of the people in SIPO database (94.8 percent) are Costa Ricans, about 4.9 percent are Nicaraguans,
and the rest are from other countries. The small proportion of other nationals may reflect under reporting,
if they are fearful of being interviewed for SIPO, if they believe that SIPO is only for Costa Ricans or other
reasons. In general, within each group, the characteristics of Costa Ricans appear to be somewhat worse

COSTA RICA: SOCIAL SPENDING AND THE POOR
32
than those of other nationalities in the proportion of women who are household heads and unemployment
rates.
· Although ownership of housing is relatively high, the quality of housing is far from adequate. Regarding
quality of housing, about 107,000 (65 percent) of the houses of the extreme poor and poor have
substandard floors, 98,000 (59 percent) substandard roofs, and 101,000 (61 percent) walls. Also, about
25,000 (15 percent of extreme poor and poor families) do not have in-door water connections. Their water
sources are wells, rivers, and rain, among others. Only about 9 percent of the poor reported having received
a housing voucher (for housing or housing improvement) from the government.

33
Social Spending: Sectoral Issues and
Options24
3.1. Social spending is a key instrument for improving social indicators of the poor and vulnerable groups. Social
spending in Costa Rica is now among the highest of any middle income country, as a share of public spending and as a
share of GDP. Over the past decade, efforts to promote universal programs in health, education, social assistance and
pensions have obtained impressive results in terms of coverage and outcomes and now rival many OECD countries.
These efforts have come at a significant cost and over the past five years results appear to have slowed, particularly in
education. This chapter identifies ways in which social spending can be made more effective for improving social
indicators of the poor and vulnerable groups identified in previous chapter.
3.2. Over the last ten years, public spending grew seventy percent in real terms and the social sectors increased their
relative participation from 59 percent of public spending to 63 percent, with spending in education and pensions
growing more rapidly than spending in health and social assistance. Given the country’s fiscal situation for the next
several years, there is little room for continued increases in social spending to address the service gaps and coverage
needs. Major efforts will be required to improve efficiency, effectiveness and targeting of the current social spending to
achieve improvements in social indicators of the poor and vulnerable groups in the next few years.
3.3. While the decade of the 90’s focused on developing programs that aimed at extending the coverage of
education and health and increasing spending in all aspects of social spending, the 21st Century will have to focus on
improving value for money - or getting better results with the same amount of public resources. These efforts will have
to consider governance issues as related to the social sectors in general, institutional issues related to the design and
management of programs, and finally targeting of social spending. Efforts focused individually on any of these issues
are unlikely to maximize value for money. A multi-dimensional approach will clearly be needed.
3.4. Recent reform efforts have made considerable progress in improving access and efficiency in the social sectors
and in maintaining, or increasing, expenditure levels. The relative performance among sectors and the results on
different income groups is varied and demonstrates the importance of maintaining clear and targeted policies. The
previous section profiling the poor using household surveys and the SIPO database show that important gaps remain
between the rich and poor and improvements in social spending will be required to better target programs to the needs
of the poorest citizens. The following is a summary review of major reforms, the results accomplished so far, and the
major issues remaining for the future. Part II presents the sector analyses and recommendations in greater detail.
24 This Chapter is a summary of Part II.

COSTA RICA: SOCIAL SPENDING AND THE POOR
34
Education
3.5. Costa Rica has made major strides in the education sector, including nearly universal primary coverage and low
illiteracy, and has gone further than most countries in introducing modern technology, mainly at the primary level. In
fact, in the early part of the 90’s important advances were made in reducing inequality for the poorest quintiles,
however, in many cases the results have stagnated or grown more slowly than improvements for the better-off.
Overall, progress has not been maintained in recent years, and there are strong indications of slippage, as reflected in
high repetition and dropout rates, especially in the first grade of primary (16.0 and 6.6 percent) and in the seventh
grade (16.4 percent and 17.1 percent) in 1999, the slow progression from sixth to seventh grade, and low learning
achievement outcomes as measured by standardized annual testing. Table 25 displays the key indicators regarding
coverage for primary and secondary education.
TABLE 25.
Evolution of Key Education Indicators, 1990-1999.
% finish primary1
% finish basic education2
% finish secondary3
Indicators
1990 1995 1999 1990 1995 1999 1990 1995 1999
Total Country 77.4 79.0 76.4 37.3 44.2 44.1 26.6 30.4 32.7
Income level4
Cuartil 1 62.3 73.4 62.1 22.3 34.1 23.5 11.6 13.7 15.0
Cuartil 2 78.7 76.3 79.9 27.6 31.6 37.2 10.7 16.1 18.4
Cuartil 3 89.0 80.3 81.4 42.9 44.1 41.8 27.2 31.6 28.3
Cuartil 4 90.6 93.1 92.4 66.7 74.8 68.9 49.6 42.2 59.3
Region
Metropolitan Area 88.3 85.7 78.2 59.5 54.8 59.4 42.4 41.8 48.6
Urban Central Area 89.8 85.7 87.8 55.8 63.9 69.6 37.1 43.8 48.5
Rural Central Region 81.6 78.2 80.9 24.8 31.4 36.0 21.3 27.6 27.8
Chorotega Region 68.8 79.7 70.3 28.1 43.1 33.2 20.3 30.0 27.6
Central Pacific 71.8 74.1 71.8 30.3 35.9 26.2 15.3 20.1 14.7
Brunca Region 64.9 72.3 64.5 22.7 36.8 26.5 17.7 12.1 19.8
Atlantic Region 59.6 65.2 65.0 17.6 33.7 28.2 10.4 15.0 7.0
North Region 58.0 74.6 66.8 9.5 32.9 37.4 14.7 13.7 10.5
Zone
Urban 86.9 84.6 81.6 55.0 56.1 57.9 37.4 39.9 43.7
Rural 69.1 73.6 69.9 19.6 31.1 29.0 16.2 20.4 20.2
Sex
Male 76.8 75.0 75.4 38.2 42.1 38.3 22.9 25.5 28.0
Female 78.2 83.6 76.5 36.3 46.2 49.4 30.0 35.6 36.1
1. Percentage of the population of 14 years with 6 or more education years approved.
2. Percentage of the population of 18 years with 9 or more education years approved.
3. Percentage of the population of 20 years with 11 or more education years approved.
4. According to per capita domestic income. Cuartil 1 includes the 25% of the families with the lowest per capita
incomes.
Source: JD Trejos, based on the Household Survey of the Statistics National Institute
3.6. Spending per student over the decade has increased substantially for all education levels but the outcomes are
mixed. While the distribution of resources is progressive for primary education, at the secondary and university level a
disproportionate share of resources is allocated to the wealthy. Distributional analysis indicates that 70 percent of the
resources destined to primary education go to meet the needs of the poorest 50 percent of the population; at the
university level, however, 70 percent of the resources are allocated to the wealthiest 30 percent of the population.
3.7. The distributional problems are exacerbated by problems with value for money, as shown in the following
graph, which compares education expenditures with the net enrollment rates for primary and secondary education.
The figures compare the relative performance of Costa Rica with the average for all medium income countries (See
Figure 3). The metric is divided into four segments: those countries with low spending and poor outcome; low
spending and high outcomes; high spending and low outcomes; and high spending and high outcomes. Using this

SOCIAL SPENDING: SECTORAL ISSUES AND OPTIONS
35
measure, it is clear how Costa Rica obtains limited value for money in secondary education. The figures show that in
primary education, Costa Rica ranks above the average for middle-income spending but also spends more than the
average. In secondary education, the outcomes are less favorable. Spending continues to outpace the middle-income
average but outcomes, in terms of net enrollment rates, are considerably below the average. Significant changes are
required to shift to a high outcomes, average spending environment, which would reflect value for money.
FIGURE 3.
Net Enrollment Ratios and Education Expenditure.
2.0 2.5 3.3 3.7 4.1 4.7 5.1 5.4 6.1 7.3
Education Expenditure as a % of GNP
61
78
84
88
92
95
98
Ne
t E
nro
llm
en
t R
ati
o-P
rim
ary
A
A
A
A
A
A
A
A
A
A
A
A
A
A
A
A
A
A
A
A
A
A
A
A
A
A
A
AAA
A
AA
A
A
A
A
A
A
A
AL
ALG
BY
BW
BR
BG
CL
CN
CO
CR
CT
CZ
DO
EC
EG
SV
EE
HN
HU
IR
KR
LV
LB
MD
MY
MX
MC
NAPYPE
PH
PORO
RU
SA
SY
TN
TR
UY
VE
2.0 3.1 3.7 4.2 4.8 5.2 5.5 7.3
Education Expenditure as a % of GNP
18
45
72
99
Ne
t E
nro
llm
en
t R
ati
o-S
ec
on
da
ry
A
A
A
A
A
A
A
A
A
A
A
A
A
A
A
A
AA
AA
AA
A
A
A
A
A
A
A
A
ALG
BW
BR
BG
CL
CO
CR
CT
CZ
DO
EG
SV
EE
HU
IR
KR
LVLT
MDMX
NAPY
PE
PH
PO
RO
SA
SY
TR
VE
3.8. The differential between rich and poor has not been significantly reduced over the decade. While the
educational achievement of the poor improved, the gap between the richest 25 percent and the poorest 25 percent did
not close. At the primary level, the percentage of children finishing primary school remained constant at 62 percent for
the poorest quartile, while the richest 25 percent increased to over 92 percent. Secondary level attainment improved
slightly, increasing over the decade from 11 to 15 percent for the poorest quartile but the richest quartile increased
from 49 percent to 59 percent. Finally, rural students are only half as likely to finish secondary school.
3.9. At the same time, Costa Rica’s economy and future sources of growth are changing dramatically with the
advent of high-tech foreign investment (Intel and associated industries). This presents an opportunity and a challenge
for Costa Rica. It needs not only to rapidly expand access, but at the same time reorient its education system to take
advantage of the opportunities brought about by this sudden infusion of high-tech investment—and this relates not
only to secondary, but to higher education and the education of adults which are working in jobs that are changing, or
will change, with new technology. With a whole new set of service industries at its doorstep, Costa Rica needs to
further develop its human capital in order to maximize opportunities.
3.10. Improving value for money in education will require a multi-planked strategy. The education policies that the
Ministry of Education should consider in order to improve the efficiency, quality and equity of education are: (i)
increasing the coverage and improving the quality of early childhood development programs, especially of poor
children; (ii) strengthening the quality of basic education (grades 1 to 6); (iii) strengthening the quality and increasing
the coverage of secondary education (grades 7-11/12), especially upper secondary for rural people; and (iv) improving
equity through better targeting of subsidies such as the school-based feeding program and scholarships.
1. Increasing coverage of pre-primary education
3.11. Early childhood education has proven worldwide to be a cost-effective intervention to improve children’s
performance in basic education in particular and in society at large. The current pre-primary coverage for poor children
under 5.5 years in Costa Rica at 8.6 percent (2001) is very low for the country’s development and social spending
levels. In addition to the CEN-CINAI and the Hogares Comunitarios programs described below as part of the social
protection network, the Ministry of Education is responsible for pre-primary education covering 5.5 to 6.5 year olds.
The program covers about 70,000 children (82 percent coverage based on figures from Ministry of Education). The

COSTA RICA: SOCIAL SPENDING AND THE POOR
36
Ministry of Education should aim to: (i) increase pre-primary coverage primarily in rural areas; (ii) improve quality by
introducing a pedagogical component; and (iii) increase parental involvement.
2. Improving quality in basic education
3.12. The Ministry of Education urgently needs to establish the reduction in repetition and drop-out rates as a
priority in basic education (grades 1-6), especially in first and sixth grades, increasing learning achievements and
introducing informatics. The data indicate that completion rates among primary school graduates increased from 77
percent in 1990 to only 79 percent in 1999. But this improvement hides the acute differences between income levels.
While 92 percent of all children in the highest income groups completed primary school, only 62 percent in the lowest
income groups finished primary school. To improve completion rates a pilot Program of Excellence was implemented
in 100 urban and rural schools showing alarmingly high repetition and dropout rates, and low learning scores in 2000.
The Program of Excellence includes: (i) strengthening the teaching and learning of reading, writing and math skills in
first and sixth grades; (ii) making a more effective use of learning assessment findings; (iii) improving in-service teacher
training; (iv) establishing informatics laboratories in 45 of these schools; and (v) strengthening community and parental
participation in school-related matters. The Ministry of Education needs to expand the interventions in the Program of
Excellence once they have been evaluated and shown good results. Further, improved targeting to groups with
particularly low outcomes would make more effective use of limited funds.
3. Increasing coverage and improving the quality of secondary education
3.13. Costa Rica’s progress in achieving universal primary education coverage is not matched in lower (grades 7-9)
and upper secondary (10-11/12). Net enrollment rates for secondary education (13-19 years old) are only about 61
percent (below the mean for LAC) and far lower than OECD or Asian economies.25 Moreover, Table 26 shows that
Costa Rica ranks considerably behind other LAC countries in
terms of secondary completion rates -Chile (47%) and
Colombia (43%)- and achieves only one-third of the
performance of leading countries like Hungary (92%) and
Japan (94%). This reflects, to a large extent, high dropout and
repetition rates, especially in grade 7 and extremely low
transition rates from basic to post-basic education (from grade
9 to 10). Enrollment is especially problematic for the poor. For
adolescents between 16 and 18 years, nearly 50 percent are no
longer in school and are not working.
3.14. If improvements in value for money are to be obtained,
structural changes will have to be made in the following
directions: (i) revise existing curriculum; (ii) improve teacher
training; (iii) increase secondary education supply through a
menu of options, including traditional schools, tele-
secundarias, distance learning, open-access education, virtual
schools and vocational training; (iii) promoting the
collaboration of the private sector to strengthen the relevance
of secondary education; and (iv) helping parents and students,
especially of rural areas, to finance part of opportunity costs of
studying through scholarships, conditional transfers, and other
supplemental financing schemes.
4. Improving targeting and equity
3.15. The government needs to improve the targeting and equity of education, in particular of programs directed at
poor students which are run by the Ministry of Education, such as the school feeding, transportation and scholarships.
The school lunch program is not based on targeting and there has been no evaluation of its impact.26 About one-third
25 The figure for Costa Rica is from the 2000 population Census.
26 The government has recently requested the UNDP Office in Costa Rica to undertake a thorough review of all welfare programs
run by the Ministry of Education. This review will include revision of administrative matters, targeting and costs, among others
(UNDP, 2000).
TABLE 26.
Comparative Secondary.
Countries
Secondary
Completion
Rates
GDP per cap-
PPP
Costa Rica 28.3 5,770
France 85.0 21,897
Hungary 91.9 10,479
Japan 94.9 24,041
Spain 73.0 16,730
United States 78.2 30,600
Argentina 41.5 11,324
Chile1 47.4 8,370
Colombia 43.2 5,709
Panama 39.1 5,016
Uruguay 39.4 8,280
1. Datos 1998
Source: Education at a Glance 2001, OECD and
Panorama Social de América Latina 2000-2001, CEPAL
SOCIAL SPENDING: SECTORAL ISSUES AND OPTIONS
37
of users of the transport subsidy do not need it, and other students are not covered. Other programs, such as the
scholarship and school bond programs, appear to be better targeted to the poor in recent years when the SIPO system
started to be used to select beneficiaries (GOCR, 2000a). To better improve targeting, most, if not all, education
welfare programs (including the school lunch program), should consider using SIPO for selecting their beneficiaries.
5. Cost implications of the reforms and priorities suggested in education
3.16. It is important to note that the interventions mentioned above are already included in the plans of the
Education Ministry; for instance, the 2001 figures are part of the initial budget proposals of the Ministry of Education.
In total, it is estimated that the cost increases of the reforms proposed would sum to between 6 and 7 percent of
current expenditures. These increases could be financed by two main sources: (a) improving internal efficiency,
through reduction in repetition rates, for example; and (b) through the constitutional imperative to increase the
Ministry of Education’s budget to 6 percent of GDP. The Ministry of Education budget projections include a roughly
11 percent increase in dollar terms for the budget from the year 2000 to 2001, and the same rate of increase for 2001
to 2002. Careful attention should to be paid to balance the increasing investments with potential benefits.
Improvements in efficiency and quality are likely to free-up resources currently tied up to finance inefficiency, such as
high repetition rates, and poorly targeted programs, which distribute resources to populations that are less needy. As
an example, crude estimates indicate that repetition in primary school costs about $21.2 million per year or about 10
percent of the education budget for primary education, while the costs for secondary education repetition are
equivalent to $14.8 million per year. With a reasonable target of achieving a 50 percent reduction in repetition, total
savings would amount to nearly $20 million, or ten percent of the annual MOE´s budget.
3.17. Reducing repetition would allow the government to redirect spending to the new priorities and further
improvements in coverage. According to priorities listed, more spending needs to be allocated to pre-primary
education to increase coverage and improve quality—providing relatively more resources to school materials rather
than salaries, and improving secondary education. Costa Rica’s education spending is heavily biased towards salaries
(93 percent), as compared with Chile (67 percent), Brazil (82 percent) and OECD countries (80 percent). The
structural inefficiency in this area may have to be resolved by increasing use of the private sector. Efficiency gains
could be obtained by establishing contracts with private schools, or managers that would be able to reduce the overall
percentage of funds allocated to salaries and improve quality.
3.18. But improving the “supply” side of education by spending more in pre-primary, primary and secondary
education may not be enough to reduce repetition and drop-out rates and increase the education level of the
population. Much more will need to be done to improve the “demand” for education, especially by the poor in rural
areas. The demand for education may be low because parental education is low, and working opportunities are
increasing. Thus, parents and youngsters need to be convinced that education is a good investment, leading them to
spend more in education (opportunity costs plus direct costs) relative to alternative investments, and this has to be
done by offering higher quality education and providing information on the returns to schooling. 27 Also, the
government may have to provide direct incentives for poor students and their families, so that they are able to forego
their opportunity costs and provide for direct costs of education. This may include conditional cash transfers—similar
to the education scholarship program introduced by the current government, perhaps increasing the amount and
coverage of such a program.
3.19. In summary, the main challenges for the education sector are: a) increasing coverage of pre-primary education
to reach 100 percent of all school aged children; b) improving quality of primary education—and reducing repetition
and drop-out: and c) improving quality and coverage of secondary education—reducing repetition and drop-outs,
which are costly for society and the Costa Rican economy. Improving quality and coverage of secondary education will
require investments in teacher training, technology and modern methods to reach dispersed populations, as well as
measures to improve the demand for education, including direct subsidies or scholarships to families so that they can
forego the opportunity and direct costs of schooling, especially in rural areas. Net enrollment rates in secondary
education are significantly lower in Costa Rica than in countries with similar per-capita GNP and expenditures in
education. Completion of secondary education appears to be a key threshold to break the poverty cycle in Costa Rica
and other Latin American countries (Castañeda-Aldaz-Moran, 2001).
27 The lack of information on the returns to schooling may be important for parents and children with low education. Regression
analysis indicates that the probability of repetition and drop-outs is much lower for children of more educated parents (Hernandez,
2000b).

COSTA RICA: SOCIAL SPENDING AND THE POOR
38
Health
3.20. By the year 2000, Costa Rica has obtained substantial progress in improving the health of the population. Costa
Rica consistently ranks in the top 40 countries in the world in terms of life expectancy (76.7 years), infant (10.3 per
1,000 in 2001) and maternal mortality and health systems performance (36 by WHO). Table 27 shows a comparison
among countries of key indicators.
TABLE 27.
Comparative Health Status Indicators.
Mortality Rates ( x 1000) Life Expectancy at birth (years) Country Year
< 1 year < 5 years Total Males Females
Costa Rica 2001 10.3 14.8 76.7 74.2 79.3
México 1997 31 38 72.6 69.6 75.6
Chile 1997 11 13 75.4 72.4 78.4
Argentina 1997 22 24 73.3 69.7 76.9
Brazil 1997 34 44 67.2 63.5 71.3
Jamaica 1997 12 14 74.7 72.5 76.9
United States of
America 1997 7 10 76.8 73.5 80.2
United Kingdom 1997 6 7 77.5 75.0 80.0
Source: Costa Rica: Indicadores Básicos 1999, MS
The World Bank: World Development Report 1999/2000
Pan American Health Organization: Health Statistics from the Americas, 1998 edition.
3.21. Although Costa Rica’s health indicators are among the best in the region, and coverage of health services is
nearly universal, the health sector faces important challenges to contain cost, improve efficiency of resource use and
preserve financial solvency in the future. The health sector is starting to feel increasing strain as Costa Rica’s
epidemiological and demographic profile changes and the opportunities to use the private sector to generate efficiency,
quality and competition start to expand. Over the past decade, the Government’s objective has been to maintain
spending, currently at about 5.5 percent of GDP, while allocating resources more efficiently to improve quality of
service, equity and efficiency of service delivery. Costa Rica has high quality outcomes with regard to the expenditures.
Figure 4 compares the expenditure with the outcomes obtained, using life expectancy and infant mortality as proxies
for health status.
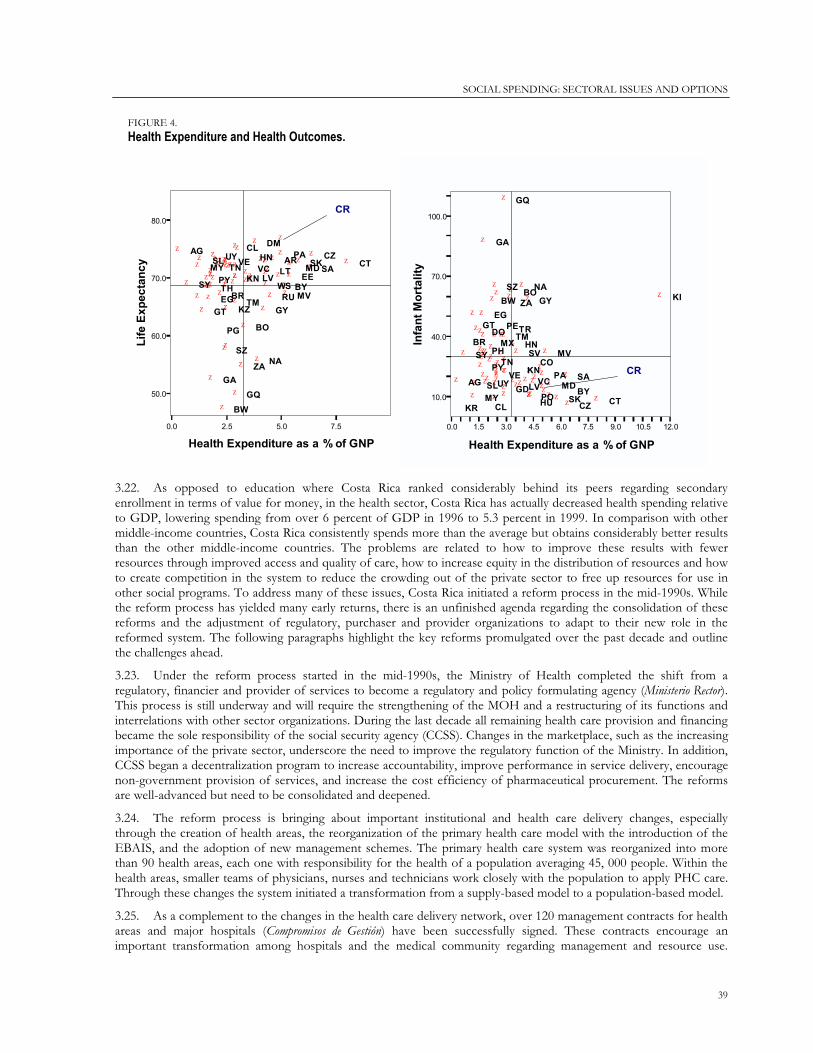
SOCIAL SPENDING: SECTORAL ISSUES AND OPTIONS
39
FIGURE 4.
Health Expenditure and Health Outcomes.
0.0 2.5 5.0 7.5
Health Expenditure as a % of GNP
50.0
60.0
70.0
80.0
Lif
e E
xp
ec
tan
cy Z
Z
Z
Z
Z
Z
Z
Z
Z
Z
Z
Z Z
Z
ZZ
Z
Z
Z
Z
Z
Z
Z
Z
Z
Z
Z Z
ZZZ
Z
Z
Z
ZZZ
ZZ
Z
Z
Z
Z
Z
ZZ
Z
ZZZ
Z
Z
Z
Z
ZZ
Z
Z
Z
ZZ
Z
ZZ
ZZ
Z
Z
ZZ
AG
AR
BY
BO
BW
BR
CL
CR
CTCZ
DM
EG
GQ
EE
GA
GT GY
HN
KZ
LVLT
MDMY
MV
NA
PA
PG
PY
RU
WS
SASK
ZA
SL
KN
VC
SZ
SYTH
TN
TM
UYVE
0.0 1.5 3.0 4.5 6.0 7.5 9.0 10.5 12.0
Health Expenditure as a % of GNP
10.0
40.0
70.0
100.0
Infa
nt
Mo
rta
lity
Z
Z Z
Z
Z
ZZ
Z
Z
Z
Z
Z
Z
Z
ZZ
Z
Z
Z
Z
Z
Z
Z
Z
Z
Z
Z
Z
Z
Z
Z
ZZ
Z
Z
Z
Z
Z
Z
Z
Z
Z
Z
Z
Z
ZZ
Z
Z
Z
Z
Z
Z
Z
ZZ
Z
Z
Z
Z
Z Z
Z
ZZ
Z
Z
ZZ
ZZ
AG
BY
BO
BW
BR
CL
CO
CR
CTCZ
DO
EG
SV
GQ
GA
GD
GT
GY
HN
HU
KI
KR
LV MD
MY
MV
MX
NA
PAPY
PE
PH
PO
SA
SK
ZA
SL
KN
VC
SZ
SYTN
TRTM
UY
VE
3.22. As opposed to education where Costa Rica ranked considerably behind its peers regarding secondary
enrollment in terms of value for money, in the health sector, Costa Rica has actually decreased health spending relative
to GDP, lowering spending from over 6 percent of GDP in 1996 to 5.3 percent in 1999. In comparison with other
middle-income countries, Costa Rica consistently spends more than the average but obtains considerably better results
than the other middle-income countries. The problems are related to how to improve these results with fewer
resources through improved access and quality of care, how to increase equity in the distribution of resources and how
to create competition in the system to reduce the crowding out of the private sector to free up resources for use in
other social programs. To address many of these issues, Costa Rica initiated a reform process in the mid-1990s. While
the reform process has yielded many early returns, there is an unfinished agenda regarding the consolidation of these
reforms and the adjustment of regulatory, purchaser and provider organizations to adapt to their new role in the
reformed system. The following paragraphs highlight the key reforms promulgated over the past decade and outline
the challenges ahead.
3.23. Under the reform process started in the mid-1990s, the Ministry of Health completed the shift from a
regulatory, financier and provider of services to become a regulatory and policy formulating agency (Ministerio Rector).
This process is still underway and will require the strengthening of the MOH and a restructuring of its functions and
interrelations with other sector organizations. During the last decade all remaining health care provision and financing
became the sole responsibility of the social security agency (CCSS). Changes in the marketplace, such as the increasing
importance of the private sector, underscore the need to improve the regulatory function of the Ministry. In addition,
CCSS began a decentralization program to increase accountability, improve performance in service delivery, encourage
non-government provision of services, and increase the cost efficiency of pharmaceutical procurement. The reforms
are well-advanced but need to be consolidated and deepened.
3.24. The reform process is bringing about important institutional and health care delivery changes, especially
through the creation of health areas, the reorganization of the primary health care model with the introduction of the
EBAIS, and the adoption of new management schemes. The primary health care system was reorganized into more
than 90 health areas, each one with responsibility for the health of a population averaging 45, 000 people. Within the
health areas, smaller teams of physicians, nurses and technicians work closely with the population to apply PHC care.
Through these changes the system initiated a transformation from a supply-based model to a population-based model.
3.25. As a complement to the changes in the health care delivery network, over 120 management contracts for health
areas and major hospitals (Compromisos de Gestión) have been successfully signed. These contracts encourage an
important transformation among hospitals and the medical community regarding management and resource use.

COSTA RICA: SOCIAL SPENDING AND THE POOR
40
Management contracts are beginning to generate innovation in hospital management; budgets are starting to be
prepared on the basis of health outcomes, and inputs used to generate results. Over the past several years, average
length of stay has declined from 6.5 to 5.4 days and hospital productivity has increased substantially. In addition,
reductions in hospital infections and process reengineering have led to annual savings in excess of $10 million per year.
More progress can be made in these areas.
3.26. Waiting lists continue to remain a problem in the public sector. With average waiting times over 18 months for
several services, the pressure of a free health system is increasingly evident. Improvements in monitoring of processes
and evaluation of results are becoming an integral part of the health care delivery system. While this represents
welcomed progress, much more needs to be done to consolidate and extend these reforms. The CCSS would need to
consolidate a budget allocation system based entirely on performance outcomes, and design incentive packages for
health workers that can encourage productivity and efficiency.
3.27. The decentralization process, initiated with the introduction of management contracts is greatly enhancing the
institutional autonomy of service providers. The recently approved decentralization law (Ley de Desconcentración) takes
the process further by introducing stronger incentives for institutional autonomy. By the beginning of 2001, 12
hospitals functioned on an autonomous basis and a formal plan has been established to gradually expand the
decentralization to the remaining hospitals. Throughout this process, there will be great challenges related to the
technical, managerial and institutional aspects required to manage such a change and to adapt its own organizational
structure in order to support the decentralization process. Building upon what has already been accomplished and
tailoring the instruments to the changes introduced by the new legislation, it is necessary to improve management in
the hospitals, to strengthen the management contracts so that they become more outcome based, and to develop and
to approve a consistent evaluation framework of those contracts. The main areas that will require continued efforts to
improve value for money include:
1. Improving sector organization: strengthening the stewardship role of the MOH and institutional
changes in the CCSS
3.28. Despite continued efforts to restructure the Ministry of Health, the role of regulation or stewardship is weakly
defined. One of the key roles of the Ministry of Health as a policy making and regulatory body is to establish the rules
that lead the rest of the system to achieve optimal performance. After having devolved all provider, and most
financing, functions to the CCSS, the MOH has yet to establish a clear role in the new system. In this context, the
MOH has an important role in the monitoring and follow up of the sector programs, as well as carrying out economic
evaluation studies of health programs. These types of studies would encourage better expenditures usage and would
increase efficacy, efficiency and effectiveness in the sector’s institutions.
3.29. The MOH’s policymaking capacity is weak due to the lack of definition regarding the scope of responsibility,
the need for strengthening human resources in the areas of health economics, public health and management.
Traditional areas that fall under the purview of the MOH include accreditation of providers, licensing and certification
of personnel, quality control of pharmaceuticals and food products, epidemiological surveillance, technology
assessment, and the development of health policy. Most of these areas are undeveloped in the MOH, with the
exception of a strong program of epidemiological surveillance, and adequate staffing does not exist. In addition, the
MOH will have to develop capacity to carry out ex ante and ex post evaluation of social programs using modern tools
such as cost-effectiveness and cost-benefit analysis. The ongoing changes in the epidemiological profile will require
renewed support to health education programs to initiate changes in lifestyle and behavior among the Costa Rican
population. Strong programs to reduce risk factors, such as alcohol consumption, smoking and unhealthy diets,
complemented with improved control of chronic diseases, including hypertension and diabetes, would have an
important impact on the future incidence of the higher-cost chronic diseases that characterize the new epidemiological
profile. In addition, efforts by MOH to strengthen health education for communicable diseases among the open
population need to be consolidated and extended to the CCSS.
3.30. One of the major accomplishments of the health reform program has been to require CCSS to manage risks
differently, through the separation between the health and pension regimes. Also, within the health insurance branch
the separation between financing and delivery of health services (primary services and hospitals) within the CCSS has
been a key element to generate an internal market among CCSS hospitals to drive efficiency and quality improvements.
CCSS’s institutional structure, however, is not yet fully consistent with this formal separation. For instance, the
Financing Division of the CCSS (health regime) should be in charge of all financing aspects, such as the collection of
contributions, invoicing and evasion control, however, the Administrative Division retains control over key functions.
Another division should be in charge of the purchasing of services from providers (health areas and hospitals). At

SOCIAL SPENDING: SECTORAL ISSUES AND OPTIONS
41
present, most processes are managed by distinct divisions thereby increasing delays and confusion and minimizing the
possibility of improving accountability. This lack of internal organizational clarity is likely to worsen as a result of the
Deconcentration Law, which will require some decentralization of CCSS functions. Clearly, a centralized organizational
structure will not be able to efficiently perform its functions under the new rules. Organizational restructuring is an
imperative to increase efficiency and clarify responsibilities at the different levels. If these changes were not
implemented efficiently, the expected benefits from the reforms already accomplished and those that would arise from
increased autonomy at the service provision level could be seriously compromised.
2. Improving the efficiency, equity and coverage of health care delivery
3.31. Despite the considerable effort to reorient health service provision away from costly inpatient care and more
toward disease prevention and ambulatory care, there is still a need to develop, approve and implement, specific
strategies to replace inpatient with outpatient care where appropriate. In 1999, fewer than 5 percent of all hospital
discharges were resolved in an ambulatory setting. With minor investments in training, equipment and infrastructure
(remodeling), the CCSS could increase ambulatory interventions to nearly 20 percent of all discharges. Benefits would
include cost savings of more than US$12 million per year, improved quality and greater patient satisfaction. In
addition, new, cost-effective service delivery strategies -such as networks for home care and hospice care- are required
to address the challenge of caring for a growing elderly population.
3.32. This is important to increase cost efficiency, patient satisfaction and adapt to the country’s evolving
demographic profile. The latter is rapidly changing which, in combination with population mobility, will require
increased focus on elderly care. Caring for the elderly is starting to move away from the core family responsibilities of
the past and will increasingly need to rely on social programs. At present, there is almost no network to provide home
and hospice care for the elderly. Also, to improve efficiency and promote better quality services, users should be able
to select providers, especially in specialized services.
3. Improving the efficiency and decentralization of pharmaceutical procurement
3.33. Given that pharmaceuticals represent 12 percent of CCSS health expenditures (nearly 0.07 percent of GDP),
and inefficiencies in the present system are apparent, an alternative procurement system could yield large savings and
efficiency gains. Introducing changes in procurement that aim to reduce inventories which average 18 months for key
drugs would yield savings in excess of $9 million per year based on the elimination of unnecessary warehouse space
and reduced financial outlays. Further, there is considerable scope to improve the pharmaceutical procurement system
so that it is more consistent with the changes introduced as part of the health reform process. The adoption of
management contracts, the Decentralization Law, which provides greater autonomy in purchases to service providers,
and the increasing role of public/private partnerships, will require the introduction of new mechanisms to evaluate and
control purchases and to devolve responsibility to providers.
3.34. The Government is moving towards the adoption of a decentralized approach to the purchase and distribution
of pharmaceuticals, based on price/quality bidding processes originating in the health care delivery facilities
themselves, however, considerable work needs to be done before the gains are realized. This will require not only the
design of such a system, but also the reorganization of the personnel at the central level that perform these activities.
The Government will surely obtain important savings and efficiency gains from this alternative procurement system.

COSTA RICA: SOCIAL SPENDING AND THE POOR
42
4. Improving the allocation of resources and financing of health care delivery
3.35. Although the country does not aim to reduce government spending on health, there is consensus among
policymakers about the need to allocate resources more equitably and efficiently as a way of obtaining better healthcare
indicators and limiting future escalation in health spending. Despite nearly universal coverage (above 85 percent of the
population has access), there is room for improvement in assuring that good quality services reach disadvantaged
populations, and that government resources are targeted well. Table 28 shows that there are important disparities in
the per capita allocation of financial resources per region and health area for primary health care. While the national
average is estimated at $48 in 2001, there are still three health regions that lag behind: North Central, South Central
and Brunca. Notoriously, in the Brunca region because of the variation in the per capita allocation among its health
areas, the average reaches only $27. Meanwhile, there are three health regions, Chorotega, Central Pacific and Huetar
that allocate per capita resources for primary care well above average.
3.36. Efforts to improve value for money center on changing
incentives and resource allocation mechanisms so that existing
resource obtain the greatest outcomes possible. The
introduction of a contractual logic based on annual
performance agreements has not been fully supported by the
types of changes in the resource allocation model that would
ensure greater equity and better targeting of resources. In the
first phase of financial reforms, subjective mechanisms to
increase allocation to underserved areas were introduced. The
next step will be to extend the preliminary design to a formula-
based plan for resource allocation, taking into consideration
population size, adjusted for risk and poverty. Updating and
refining the Sistema de Identificación de la Población Objetivo (SIPO)
developed by IMAS, offers an opportunity to improve targeting
of public subsidies; however, implementation of the system will
require the formulation and introduction of regulations, as well
as continuing technical support and the CCSS Board approval.
3.37. At the same time, the mechanisms for reimbursement of hospital providers have not fully made the difficult
transition from a historical budget to a performance-based system, where case-mix adjusted-production and quality
outcomes will determine annual hospital revenues. The first phase of reform provided the tools to make the transition
in the form of a comprehensive and nationwide system of Diagnostic Related Groups (DRGs), whereby the
performance of each hospital is known on a monthly basis. The next phase of reforms would have to gradually adjust
individual hospital financing in terms of outcomes and production of services, using the DRG system to adjust
historical budgets.
3.38. CCSS also needs to continue working on its invoice system in order to make it more efficient and to control
evasion. Evasion results from sub-declaration of salaries and from non-payment of contributions, especially in small
(less than 10 employees) rural enterprises, where only about 25 percent are affiliated to the CCSS, and small (with less
than 10 employees) industrial enterprises, where only about 36 percent are affiliated to the CCSS. It has been estimated
that the cost of evasion for sub-declaration and non-contributions amounts to over 26 percent of revenues of the
CCSS for health care. The recently approved Labor Protection Law will place an increased burden on CCSS to
improve its collection system, which will require strengthening its invoicing system and critical improvements in the
financial information system. This is important for maintaining the financial sustainability of the health plan of the
CCSS over the coming years when population ages and health expenditures will most likely increase more rapidly than
in the past.
5. Encouraging private sector participation and improving the regulatory framework
3.39. Changes in health delivery have been introduced mainly at the primary health care level in rural areas, but an
important agenda remains for urban areas, where private sector participation can play a major role. CCSS is trying
different types of public-private partnerships for health delivery, including diagnostics, treatment and surgical
interventions, which seem to be proving beneficial in efficiency and quality terms. By 1999, over 6 percent of the
population was served by health cooperatives and other private organizations under contracts with the CCSS. Recent
studies show that these models offer important opportunities to increase efficiency, improve quality and reduce the
need for public investment and expenditures. Increasing the role of the private sector, in a thoroughly regulated
TABLE 28.
Territorial Distribution of PHC Spending,
by Health Zone.
Área de Salud-lowest per capita
spending: Pérez Zeledón (in colones) 1,202
Área de Salud-highest per capita
spending: Limón (in colones) 60,154
Average (in colones) 15,791
Standard deviation (in colones) 10,331
% of Areas with expenditure per
capita > 2 s.d. above average 28.6
% of Areas with expenditure per
capita < 2 s.d. below average 71.4
SOCIAL SPENDING: SECTORAL ISSUES AND OPTIONS
43
environment, offers a unique opportunity to leverage public resources and to obtain improved outcomes within the
same resource frontier.
3.40. There is an urgent need to develop a regulatory framework for private participation both under public private
partnerships and in the open private market. According to recent estimates, Costa Ricans spent about 1.9 percent of
GDP in medical consultations, dental care and medicines in 1998. This high private sector health spending is likely to
continue or even increase as the country continues to attract foreign investment and the CCSS is not able to keep pace
with increased demand for specialized services. In fact, Costa Rica may be able to benefit from allowing creation or
expansion of specialized care and health insurance services (now the exclusive monopoly of the Instituto Nacional de
Seguros, INS) in its own territory taking away services which may have been provided outside the country.
6. Cost Implications of health reforms
3.41. While most of the major reforms have already been set in motion and future efforts will focus more on
consolidating the changes and changing culture in the sector, additional investments will be required to invest in
primary care and to consolidate changes in other levels of the system. Estimates provided by the government during
the preparation of the second health modernization project, indicate that the second phase of reforms would have an
estimated cost of roughly $70 million over 5 years. These costs would cover: (a) investments in primary care to
consolidate the primary care model, extending access to 100 percent of the population ($10 million); (b) investments in
personnel, training and information systems to improve the stewardship function of the MOH ($5 million); (c)
investments in upgrading hospital equipment and developing ambulatory solutions ($40 million); (d) implementation
of management reforms and information systems to improve quality and efficiency in the supply chain, hospital
management and purchasing function ($5 million); and (e) continued support to implement nationwide the
improvements in the financial management system and to introduce changes related to the Ley de Protección al Trabajador
($10 million). Over five years, these costs would be equivalent to less than 2 percent of the estimated annual health
budget for the CCSS.
3.42. While the cost burden is easily assumed within the annual increases in the CCSS budget, the implementation of
the reforms highlighted in this section offer important insights into the potential savings that would be introduced as a
result of the reforms. This would continue with the spirit of the first phase reforms that produced annual savings of
more than $10 million which offset many of the capital investments that were made to expand coverage.
3.43. The savings would come from changes in the following areas and produce the following expected savings.
Changes in the supply chain regarding pharmaceutical purchasing and distribution could save $9 million per year
through reduced inventory costs, declines in the rental of warehouse space and reductions in the business process
time. Increasing the share of ambulatory surgeries and strengthening diagnostic capacity would yield annual savings
estimated at over $12 million. Improving the financial management system and supporting efforts to reduce evasion
could potentially reduce expenditures and increase revenues. If evasion were reduced by just 5 percent, the annual
increase in revenue would exceed $7 million (assuming the cost of evasion is $144 million per year). In summary, these
three reforms would produce annual savings in excess of $28 million per year. Over five years, the savings would be
nearly twice the estimated cost of the reforms and allow the CCSS to continue producing more with fewer resources.
While these figures are estimates, they provide guidance on how changes translate into savings thereby allowing the
CCSS to continue to strive for greater value for money.
3.44. In summary, the principal challenges of the health sector over the next few years, include:
· Strengthen the role of the Ministry of Health as a regulatory agency with a strong capacity for policy
development, establishment and enforcement of quality standards and broadened responsibility to promote
health education and public health programs.
· Efforts to expand coverage to rural areas and to metropolitan populations that have limited access to health
services will contribute to increasing equity and to improving the access of the poor to basic services. The
SIPO data shows that nearly 30 percent of the extremely poor do not have health insurance, despite
universal access. Efforts should be made to introduce alternative delivery arrangements for the primary
health care model to be implemented in the metropolitan areas, to ensure adequate funding, to target the
poor with PHC programs, to develop incentives for providers in rural areas and to re-orient the regional
supply of services in function of a national health plan based on the regional health needs of the
population, rather than on the historical regional distribution of services.
· Consolidation of a culture of performance agreements, and shift from a historical based budget to a
performance based budget. Along these lines, the establishment of mechanisms and regulatory changes to

COSTA RICA: SOCIAL SPENDING AND THE POOR
44
allow for the introduction of performance-based incentive payments to personnel constitutes a considerable
challenge to improving work place efficiency and quality.
· Continue promoting changes in the system to increase management and financial autonomy of health
providers in the context of the 1999 Law on Decentralization, including changes in finance, management
and organization.
· Introduce changes in the pharmaceutical procurement system that aim to improve operating efficiency and
adapt the supply chain to recent changes under the Law on Decentralization.
· Target evasion and strengthen efforts to implement the Ley de Protección al Trabajador, including
strengthening the CCSS´ invoicing system and promoting changes in the financial information systems.
· Promote improvements in clinical management in hospitals by professionalizing the management of
information systems, making hospital chiefs of staff accountable for clinical and financial results and
generating a culture of clinical management.
· Improve coordination with universities regarding human resource development for the long-term needs of
the population.
Social Protection
3.45. Pensions. The pension sector also underwent significant reforms in the past decade. The approval of the Ley
de Protección al Trabajador was an important step towards establishing a capitalization based pension system, as a second
pillar (the first being the public system), under the supervision of the recently created Pension Superintendence.
Reforms between 1992 and 1995 reduced the number of special pension schemes and achieved a more unified benefit
framework. At the same time, the reforms reduced the future burden on public expenditure and the state subsidy
necessary to cover pension expenditures.
3.46. By the end of the 90’s, an estimated 56 percent of the economically active population (EAP) was covered by
the National Pension System. This represents an overall decline in coverage from 66 percent of the EAP at the start of
the decade. However, the coverage of informal sector workers has increased to 27 percent. The aging of the
population represents a significant challenge in public policy over the coming years. Coverage of the CCSS public
pension pillar currently covers only 36 percent of the population over 60 years, while an additional 35 percent is
covered under the non-contributive scheme (RNC). The introduction of the complementary schemes should increase
these percentages over the coming years while expanding access to RNC will improve overall coverage of the pension
system.
3.47. The first step in the reform process was the unification and standardization of the special pension regimes in
the public sector. Before the reform process started, there were more than 19 special regimes, which have been
reduced to two (teachers and judicial sector workers). Today, only 5 percent of all pension contributors belong to
special regimes. In addition, the requirements for pensions and benefits of these regimes were brought closer in line
with those of the IVM (Disability, Old Age and Death) of the CCSS. In 1995, a law was approved to regulate a third,
voluntary private pillar.
3.48. The current reform continues this gradual approach by focusing on reforms to the second pillar (the
capitalization based system). The Government prepared the recently-approved pension law based on a wide
consultation process (Foro de Concertación). The reform addresses some of the outstanding issues through a mixed
pension system. The main public pension pillar, administered by the CCSS, will consist of the existing IVM regime
with minor parametric changes to be determined. The second pillar is a new mandatory, fully funded pillar, with
individual accounts managed by pension fund managers.
3.49. The law is rather general, leaving specific aspects of the system to the regulations. The law gives more powers
to the CCSS to increase collection, strengthens penalties for evasion, redirects some labor taxes toward pension
savings (mainly the severance scheme), introduces a supplementary funded pension scheme, extends a means-tested
old age pension scheme, and sets up a single supervisory system for the pension systems. For the introduction of a
funded supplemental pension scheme it redirects labor taxes of about 4.5 percent of salaries progressively over 2 years
toward pension savings. The law does not specify fee structures and requirements for switching between funds.
3.50. Although Costa Rica’s pension reform could be criticized for not going deep enough in reforming the existing
pension system, especially the first pillar, it has the advantage that, compared to other reforms that have been
undertaken, it has a limited fiscal impact. The new funded second pillar does not receive any contributions from a
reduction in size of the first pillar and, therefore, there is no financing gap for the payment of current benefits. Part of

SOCIAL SPENDING: SECTORAL ISSUES AND OPTIONS
45
the fiscal impact of the reform will be the institutional strengthening expenses, including two public information
campaigns, strengthening the Superintendence of Pensions, and establishing the centralized contributions collection
system to be run by CCSS. Government finances will also be affected by the reallocation of the 3 percentage points
from the severance payment scheme to the labor capitalization funds. The severance payment contribution had been
just a book entry, but now the 3 percentage points have to be paid in cash. This impact will also be felt by enterprises
that did not pre-fund the severance payment liabilities. Another fiscal impact could arise from the implementation of
the new rules for the means-tested old age pensions and its final cost. If the revenue for these non-contributive
pensions (lottery, tax on public enterprise profits) does not reach 3 billion colones a year (in real terms) the Treasury
will have to cover the shortfall.
3.51. In summary, the main challenges in the pension sector include:
· Reducing evasion and sub-declaration of salaries.
· Adjusting the calculation of benefits to more accurately reflect earnings capacity, through providing
incentives for contributing a greater share of actual earnings in the earlier years of the earnings cycle.
· Improving access to minimum pensions and improving equity in the distribution of these benefits.
· Improving the level of benefits of the non-contributory pensions to cover levels guaranteed to ensure
welfare of the elderly.
· Consolidating reforms that will guarantee the long-term sustainability of the public pension schemes. As the
population ages sharply over the next 30 years -due to falling fertility rates and rising life expectancy- the
financial imbalance would lead to pension fund insolvency.
3.52. Social Assistance. Costa Rica has a well established social assistance network designed to protect vulnerable
groups and to target them with a host of social programs. There are, however, critical gaps in social assistance of key
vulnerable groups and there is a need to improve targeting, efficiency and monitoring/evaluation of ongoing
programs. There is also a need for continued efforts in institutional strengthening and modernization, to reduce costs
and offer better services and the adoption of new delivery systems involving communities and NGOs to complement
public sector agencies. Among the critical gaps in social assistance is the inadequate coverage of programs for poor
children under five years of age, who lack adequate education and stimulation programs, and assistance for the elderly
poor not covered by the formal pension system.
3.53. Conceptually, social assistance programs are important not only because they can help protect the poor and
vulnerable groups during normal and crisis times, but also because they can be used to improve the utilization and
effectiveness of social programs (such as education and health) by the poor to help them deals with shocks. Thus,
social assistance programs can function as a safety net to cushion the poor and vulnerable groups from the adverse
effects of a shock, or as a coping mechanism, to reduce the chances that people do not have the capacity to deal with
the consequences of shocks, and or to reduce the chances that the adverse shocks occur. By doing this, people can
adopt self-protecting strategies, which reduce the chances that such shocks in income or consumption occur, as when
people get education and training that help them reduce the probabilities of unemployment.28 Also, when ill, poor
people can get health protection from health insurance schemes or government sponsored health care, as in Costa
Rica.
3.54. Costa Rican assistance programs have been, however, designed primarily to serve the first purpose (coping
mechanism), and have placed less attention to the potential benefits that the poor and vulnerable people would get by
protecting their children and their families of future shocks through better education and training. This can be seen in
the large shares of subsidies allocated to transfer programs such as housing, food distribution, and others, and the fact
that most transfers benefit middle income groups who do not need them for improving their education and health
outcomes. In what follows of this section, we identify ways in which assistance programs can be made more pro-poor
and better designed to help the poor insure and self-insure against futures risks.
3.55. Costa Rica’s social assistance network consists of three pillars. The first pillar is the Fondo de Desarrollo Social y
Asignaciones Familiares (FODESAF) which serves as a financing agency for most social assistance programs, nationwide.
FODESAF receives budgetary funds from the Ministry of Finance based on earmarked tax revenues. FODESAF’s
28 For a discussion of the concepts of market insurance and self-protection in the context of social policy see De Ferranti, et al.
2000.

COSTA RICA: SOCIAL SPENDING AND THE POOR
46
resources amounted to about 1.8 percent of GDP in 1998-2000 (an average of 1.7 percent of GDP in 1990-2000).29
The second pillar is the Instituto Mixto de Ayuda Social (IMAS), which manages an array of social programs for poor and
at-risk groups. IMAS enjoys great flexibility in program design and financial arrangements, being able to deal with
social and economic emergencies and provide direct income support to families. The third pillar are line ministries
such as health, which operates nutrition and child care centers (CEN-CINAI), education, which is responsible for
school lunch, scholarship and other social welfare programs for students, and the housing ministry, which is
responsible for the housing voucher program. In addition, there are a great number of private non-profit organizations
and foundations that receive funds from FODESAF and/or IMAS to support social programs for the elderly,
handicapped, abandoned children and other at-risk groups.
3.56. The following are some actions that the government could take to improve the social assistance system.
1. Increasing coverage and targeting of ECD programs for 0-5 year olds
3.57. The coverage of 0-5 year olds with early childhood development (ECD) programs in Costa Rica at about 8.6
percent (2001) is low for its level of development and high social spending About 84,000 poor children 0-5 years of
age have been found in the SIPO database as being not covered by any of the existing Early Child Development
Programs. There are three main public programs financed by FODESAF for this age group. The first is the CEN-
CINAI program operated by the Ministry of Health which covers about 18,200 children 2-5 years old (2001) with
integrated health care, nutrition, early stimulation and pre-school education services. The CEN-CINAI program also
provides powdered milk and food rations to poor pregnant mothers and their families (about 14,000 mothers and
97,000 children). The second is the Hogares Comunitarios program operated by IMAS, which provides community-based
child care services to about 6,600 poor children. The program follows child-care models common in other LAC
countries that provide nutrition and care services to children living in poor neighborhoods, offered by trained
community mothers; qualifying families receive monthly subsidies from IMAS to pay the community mothers, who are
not on the government payroll. The third is the program of the Ministry of Education that covered about 11,000
children. Finally there are a few privately run publicly funded programs attending about 8,700 children in 2001.
3.58. The government of Costa Rica created in the year 2000 the De la Mano program aimed at increasing coverage
and improving the targeting of existing ECD programs. De la Mano is also charged with designing and promoting new
approaches to increasing parental awareness of the benefits of ECD education, improve parental education and make
wide dissemination of ECD teaching materials for patents, school children and communities. The coverage of ECD
programs for poor families increased significantly from about 27,600 (5.5 percent of 0-5 years old) children attended in
the CEN-CINAI, Hogares Comunitarios, the Ministry of Education and other programs in 2000, to about 44,600 (8.6
percent) in 2001 (Table 29). The De la Mano program distributed education materials to parents, teachers and
secondary school children, and financed radio programs and newspaper separates to educate parents and communities
in child development practices. Using SIPO, a study was made to match regional needs with available supply of ECD
education by communities, NGOs, religious and local organizations, and the private sector. Based on this study, a
strategy is being prepared to further increase coverage and the quality of ECD education, which can be a key input for
the next Administration taking office in 2002.
TABLE 29.
Coverage of ECD Programs in Costa Rica, 2000-2001.
ECD Programs 2000 2001-End June 2001-End September
Estimated Population 0-5 years olds 506,000 517,126 520,423
Public Programs 19.054 28.786 35.878
CEN-CINAI 13.831 13.213 18.200
Ministry of Education 1.140 11.100 11.100
Hogares Comunitarios 4.083 4.473 6.578
Other-NGOs 8.548 8.736 8.737
Total attended 27.602 37.522 44.615
% Covered total 5.5% 7.3% 8.6%
Source: Figures from IMAS, De la Mano Program.
29 Government figures reported in GOCR, 2000a. There are some differences in the ratio of expenditures to GDP with other
studies because Costa Rica is currently reviewing national account figures for GDP.

SOCIAL SPENDING: SECTORAL ISSUES AND OPTIONS
47
3.59. Cost of increasing ECD coverage to poor children. The De la Mano program has proposed several alternatives
for increasing coverage of the estimated 84,000 children without coverage, by the end of 2001. One viable alternative
considers a four year expansion plan and two modalities of child care. One modality is the traditional CEN-CINAI
model which includes center-based care including full day care provided by trained child care personnel. The other
modality is the application of an “informal model” in which parents are trained in early childhood education and
stimulation to attend their children at home. Parents receive training in groups by a central group of professionals
organized by De la Mano.
3.60. The per child cost of the informal model is US$65 dollars per year, as compared to that of the CEN-CINAI
model of US$ 590 dollars per year. Assuming a 50-50 percent split between the two care models for the four year
expansion plan (adding 25 percent of children each year), total costs amount to US$26 million in the fourth year when
full coverage of poor 0-5 years old children is attained. Current spending on the CEN-CINAI program amounted to
about US$19 million in 2001, so that only an additional US$11 million would be needed to achieve full coverage in
2002 and following years. This requires, however, that CEN-CINAI stops benefiting non-poor children (about 75-80
percent of current beneficiaries) to concentrate on the poor. These costs can be reduced substantially if the CEN-
CINAI model is rationalized to emphasize early stimulation and development of children decreasing or eliminating the
child nutrition component and leaving the health component to the EBAIS of the CCSS. Currently, malnutrition is
very low in Costa Rica and there is no need for major food and nutrition component of the program. Also, as
indicated in other sections of this report, the CCSS is successfully implementing the local health primary health service
component un the EBAIS system which could well assume all health and child growth monitoring components under
the CEN-CINAI system, avoiding duplication and saving resources.
2. Increasing coverage of non-contributory pensions for the elderly poor (over 65 years of age)
3.61. Despite Costa Rica’s high coverage of the social security system, a large number of elderly poor remain
uncovered and in a state of poverty or extreme poverty. The CCSS, with funds provided by FODESAF, provides a
large number of non-contributory pensions directed at poor elderly people not covered by the contributory system,
and other special groups, such as widows, handicapped persons and people with brain paralysis. The monthly pension
amounted to 12,000 colones in 2001 (or US$37 dollars) representing about 20 percent of the minimum wage or about
the cost of the food basket.30 According to figures from SIPO, about 14,000 people (about 50 percent of elderly below
the poverty line) were uncovered by any pension regime in 2000.
3.62. Some of the reasons for the gap in coverage and high leakage include, the lack of information and outreach of
the poorest prospective beneficiaries, and the fact that social workers granting pensions at the CCSS have verified only
about 60 percent of the applications received.31 However, recent figures from the government indicate that major
increments in coverage and targeting have been achieved in 2000-2001 which have not been reflected in the original
SIPO database. According to these figures, over 10,000 pensions that had been awarded to non-deserving applicants in
the past have been re-directed to the poor in the SIPO and that new pensions have been given to uncovered poor.
These recent figures indicate that only about 7,000 elderly poor may have been without coverage by the end of 2001.
Unfortunately, SIPO has not been updated to include these new figures.
3.63. Cost of increasing coverage of non-contributory pensions. As in many other social assistance programs, Costa
Rica appears to have enough funds dedicated to non-contributory pensions. Thus, the additional 7,000 elderly poor
not covered by the end of 2001 can be covered with re-allocations of pensions currently in the hands of non-deserving
people, continuing what was done in 2000 and 2001, and choosing new applicants with the SIPO system. As seen later
in this section, non-contributory pensions have been badly targeted to the poor and many recipients do not qualify
when the SIPO system is applied.
3. Improving coordination and efficiency of programs by strengthening the role of FODESAF
3.64. Unlike many other LAC countries, Costa Rica has relatively few institutions managing and operating social
assistance programs. There is only one single institution, the FODESAF, charged with financing social assistance
30 The poverty line is calculated by the Institute of Statistics based on the cost of a basic food basket and other necessities. In June
2001, the cost of poverty line was set at c$26,084 urban and c$20,094 rural (US$81 and 62) per capita per month. The cost of the
basic food basket (extreme poverty line) was set at c$11,965 urban and c$10,200 (US$37 and 32) per capita per month (exchange
rate used c$320 per one dollar).
31 Information contained in the document “Evaluación del Programa Regimen No Contributivo de Pensiones Por Monto Básico”,
Draft FODESAF, 2000.

COSTA RICA: SOCIAL SPENDING AND THE POOR
48
programs. FODESAF is, thus, in a unique position to influence institutions and programs to improve efficiency and
coordination by introducing production-based financing mechanisms and promoting program coordination. Some of
these actions have been introduced since 1999, when FODESAF instructed programs and institutions to provide
targets to be achieved and to rate programs and institutions according to the attainment of these targets. These efforts
will need to be, however, consolidated and formalized in the institutional and legal framework of FODESAF to be
effective.
3.65. FODESAF has some structural problems. First, most FODESAF allocations (about 77 percent) are fixed
allocations determined by old laws which also often earmark tax proceeds to certain programs irrespective of the
changing needs of the poor. This makes it impossible for new governments to change budget allocations according to
new priorities or needs of the poor. Old priorities remain in place with no possibility of changing them. For instance,
as observed in Table 30, too much may have been spent on housing (and or contributory pensions) and too little may
have been spent on child care programs (see allocations for Ministry of Health vs. those for BANHVI and CCSS).
Also, and because of this situation, FODESAF has little flexibility to address the needs to the “new” poor in crisis
times. Thus, FODESAF law needs to change to allow flexible allocations of funds to different programs according to
needs and the changing needs of the poor.
3.66. Second, FODESAF has little effective control over the efficiency and impact of programs it finances, especially
allocations mandated by law to programs and institutions. These institutions are not accountable to FODESAF. This
limits the capacity of FODESAF for effective monitoring and evaluation of those programs, and reduces incentive
based financing, and corrective measures, if needed, as a result of such monitoring and evaluation.
3.67. Third and finally, FODESAF has limited ability to plan for resource spending since a large percentage of
budgeted funds are not effectively disbursed by the Treasury during the course of the fiscal year. In fact, only about 63
percent of budgeted funds, on average for 1990-2000, have been disbursed. Disbursements as a share of budgeted
funds have, however, increased to about 66 percent since 1999 (Table 30).32
TABLE 30.
Budget allocations by FODESAF main assistance programs, 1990-2000.
Items 1990 1995 1998 1999 2000
CEN-CINAI, MOH 22.2 11.4 6.0 7.0 6.8
School Feeding, MOE 6.8 11.1 12.6 13.9 13.1
BANHVI-Housing Bond 29.1 26.9 31.7 37.2 32.3
IMAS, Assistance programs 1.7 11.4 9.8 4.1 10.5
Patronato Nacional de la Infancia 4.1 4.5 3.8 5.1 5.1
Assistance pensions, CCSS 19.4 18.6 22.9 21.1 20.7
Other 16.7 16.1 13.2 11.6 11.5
Total 100.0 100.0 100.0 100.0 100.0
% Spent vs. Budgeted 60.2 58.6 62.6 65.9 66.8
Note: Data in percentage.
Source: Figures provided by FODESAF.
3.68. The goal of the government should be to continue streamlining institutions and consolidating programs
financed by FODESAF. Some program consolidation has already taken place since 1999. Some scholarship programs
which were administered by IMAS have been given to FONABE (Fondo Nacional de Becas), under the Ministry of
Education. This has reduced administrative costs, has permitted increments in coverage of subsidies, and has
contributed to better targeting of subsidies.
4. Improving targeting of assistance programs
3.69. As shown in Table 31 below, targeting of some important social assistance programs is highly deficient. This is
the case, for instance, for the child care program (CEN-CINAI), where only 24 percent of beneficiary children
belonged to families in the poorest income quintile in 1999. Also, only about 45 percent of beneficiaries of non-
contributory pension benefits belonged to the elderly poor in the poorest income quintile. For children in school,
32 The fall in the share of CEN-CINAI is mainly due to the reduction in health personnel charged to the program when the MOH
transferred health centers and posts to the CCSS, as a result of the health sector reforms.

SOCIAL SPENDING: SECTORAL ISSUES AND OPTIONS
49
about 62 percent of subsidies of the school lunch program went to the poorest 50 percent of children. The school
voucher program was, however, much better targeted to the poorest students, as 76 percent of benefits went to the
poorest 50 percent of children, indicating that there is the technical capacity to improve targeting if the political will to
do so exists. The improved targeting of the school voucher program has occurred because of the use of SIPO to select
beneficiaries of this program.33
TABLE 31.
Cumulative Distribution of Benefits of Key Social Programs by Income Quintile, 1999.
CEN-CINAI Quintile
School
Voucher
School
Feeding Childcare Milk Food Rations Total
Non-Contributory
Pensions
1 41 34 24 61 37 56 45
2 76 62 58 85 69 81 69
3 92 82 79 95 89 93 84
4 98 94 96 98 93 98 96
5 100 100 100 100 100 100 100
Source: Plan de Solidaridad, based on Encuesta de hogares de Propósitos Múltiples, 1999.
3.70. The housing subsidies were poorly targeted but performance has improved. In fact, by design, the housing
program, which accounted for almost one third of FODESAF resources in 2000, is not targeted to the poorest. People
with less than four minimum wages can apply to the program and, until recently, cooperatives and other intermediary
institutions could apply for benefits for their associates. Household surveys indicate that only about 25 percent of the
subsidies had been received by the poorest 25 percent of the population during the 1990-99 period (Table 32).
Recently, major efforts have been made to improve targeting by giving favored treatment to applicants with less than
two minimum wages and by reviewing applications to ensure that they correspond to the poor and meet eligibility
requirements. Table 32 shows some improvements in targeting over the last few years, as the share of subsidies
received by the poorest 25 percent of the income distribution has increased to about one third of the subsidies, in
1998-1999.
3.71. 3.70 It is doubtful, however, that the current form and spending size in housing subsidies is justified in
Costa Rica. First, as seen above, Costa Ricans have high preferences for investing in their own house and making
improvements with own resources. Housing ownership is among the highest in Latin America even by the poorest
families. Second, most current housing needs are related to improving the quality of the house, improving floors, walls,
roofs and connections to basic services rather than absolute lack of housing. This can be financed with much lower
subsidies than the current US$3,700 dollars on average of the housing vouchers, and for many, with loans that can and
should be recovered. Third, subsidies should not be provided to finance private goods (such as housing), but public
goods or private goods which provide positive externalities for the rest of the population. This is the case of education,
especially of early childhood education, in which Costa Rica presents significant gaps. Thus, of the about US$60
million dollars per year Costa Rica is spending in housing subsidies, over half to one third should be allocated to
programs such as those in education to significantly increase coverage of ECD education for poor children.
TABLE 32.
Cumulative distribution of the bono de vivienda by income quintile.
Quintile 1990-1994 1994-1998 1998-1999
1 14.6 18.8 21.7
2 28.4 20.2 25.1
3 21.2 27.1 27
4 19.6 20.1 17.8
5 16.2 13.8 9.4
Source: GOCR (2000b).
3.72. In general, one of the main problems of targeting social assistance programs has been the use of many different
targeting mechanisms and instruments (even for similar programs). This has led to inequities, favoritism, duplication of
33 However, the SIPO system appears not to have been used for school bond program in 2002, so that targeting has probably
worsened in this year.

COSTA RICA: SOCIAL SPENDING AND THE POOR
50
benefits and, in many cases, exclusion of people who need the benefits the most. The creation of the SIPO system in
1999 addresses some of these problems by proposing to be the single most important targeting instrument for most of
the programs which are to be directed to the poor (means-tested), as seen below. Not all programs, however, can or
should be targeted with SIPO. Some programs, such as nutrition programs for child and mother, would need other
instruments.
3.73. The SIPO system is managed and operated by IMAS at central and regional offices which are in charge of
maintaining the database and of keeping it up to date. By end 2001, the system contained a database of about 207,000
families who are potential beneficiaries of programs.34 A description of SIPO is in SIPO Annex below. Families in
SIPO can be classified according to poverty lines or according to a weighted poverty index (a proxy means test), which
has been constructed on the basis of selected demographic and socioeconomic variables. The main characteristics of
SIPO are as follows:
· Uniform and objective. People in all parts of the country and for specific programs are measured with the
same standard and criteria.
· Easy to administer and apply. The system is simple and people at IMAS local level can administer and
update it.
· Cost effective. The cost of application and administration of the system (that is, to apply the formulary and
enter data into computers) is low (8-10 dollars per family) relative to the amount of the benefits to be
targeted and to cost of similar programs in other countries. It has been estimated that over 240 million
dollars (most of FODESAF and IMAS budget) can be targeted using the SIPO system.35
3.74. The SIPO system can also be used, along with other criteria, to better target subsidies of programs such as the
CEN-CINAI, the De la Mano program, the school lunch program, transportation subsidies, among others. Because the
SIPO system is Web-based and is ready to share information with other government agencies, SIPO can become the
platform of a single national registry of beneficiaries of assistance programs in Costa Rica. This will be critical for
eliminating duplication of beneficiaries and to better coordinate and design social programs. With this, entire families
(and even communities) can be traced along with the benefits they have received. Evaluation studies can be designed
to assess the impact of the programs and to identity the best and most cost-effective interventions.
3.75. There are some critical issues that need to be solved if the SIPO system is going to be used by agencies and
survive in the future. First, there is still not a normative act (Decree, Law) which specifies responsibilities for program
use, updating of the system, and financing of the system. For instance, many agencies are applying the formularies to
their prospective beneficiaries, in some cases, without quality control and supervision of IMAS affecting the quality of
the information. Second, there is still a lack of clarity regarding updating procedures, determination of coverage and
the duties and responsibilities of agencies using the system. For instance, there is still not a definition of when and how
changes in family circumstances will be updated and how to avoid manipulation by people to be eligible for programs.
Also, there is still not a definition of how other agencies update SIPO´s registries when they provide the benefits and if
other than the updating agency has access to records to cross check benefits and beneficiaries. Third, the SIPO system
has been recently used to include some of the people affected by special circumstances, such as the “banana, coffee
and fishing crisis” in some areas, who in normal times would not be included in the data base and whose point scores
are much higher than those of the poor. This affects the credibility of the point score system which has been designed
for the structural poor. IMAS is looking for ways to design a special module to include the “new” poor, but
procedures are still not in place.
3.76. In summary, although Costa Rica has a functioning social assistance institutional network and spends a
considerable amount of resources for the poor and most vulnerable groups, there are still a considerable number of
poor to be attended. The impact of this network has been limited by a series of factors. First, there has been a lack of
strategic planning which determines priorities in groups to be attended, duration of attention and interventions most
34 People are included in the database in a three-step process. First, poor areas are identified using NBI-based poverty maps from
census information and surveys, such as the poverty map developed by the Planning Office. Second, using statistical analysis of
survey data for 1997, the variables most strongly associated with poverty were selected, along with the weights they exhibited in
statistical analysis. Third, the selected variables were placed in a questionnaire that was administered to all households in selected
poor areas, generating the database of potential beneficiaries (poor people who do not live in the selected area can apply for
inclusion in the database). The variables were used to construct a poverty index. Program eligibility begins from the poorest up to a
predetermined cut-off point on the index, established according to the program’s budget and target population.
35 Recently, the Comptrollers Office has issued directives to use SIPO for selecting beneficiaries of a great number of programs,
including some of potable water and sanitation.

SOCIAL SPENDING: SECTORAL ISSUES AND OPTIONS
51
effective. Second, the FODESAF Fund, which finances most assistance programs directed to the poor, has little
flexibility in budget allocations to change expenditure priorities according to changing needs of the poor. Third, there
has been a lack of institutional coordination, both in the design of programs and in the operation of such programs. A
multiplicity of programs result in duplication of efforts and waste of resources. Fourth, there has been a lack of
uniform criteria for selecting beneficiaries for such programs. Recent efforts have been made to address this problem
with the introduction of the SIPO system in 1999, which has started to be used for targeting several programs,
including the school bond, scholarships and non-contributory pensions with notable improvements in targeting. These
targeting efforts need to be continued in the future with appropriate measures taken by IMAS for meeting the complex
challenge of updating and maintaining the SIPO targeting system.
Monitoring and Evaluation Systems
3.77. There is a lack of an effective M&E system for the social sectors and this is an impediment to ensuring value
for money in social spending. Monitoring and evaluation are key to evaluate progress, evaluate impact of programs and
make more efficient decisions on programs to improve social indicators of the poor. For instance, had a good
evaluation program existed in the CEN-CINAI and other child care programs, resources could have been saved by
finding the most cost effective alternative for child care. Different modalities of child care, some including only
parental education, others including center-based stimulation and early child education, among others) could have been
evaluated to determine their impacts and relative costs. The practice of establishing base-lines and measuring the
impact of specific programs should be implemented routinely, in order to draw lessons from experience which can be
used to modify programs and improve their impact. In addition, instruments such as Living Standards and
Measurement Surveys and improved household surveys provide valuable information on key target groups and on the
outcomes of the main social programs, complementing the annual household surveys currently carried out by the
Statistical Institute.
3.78. In 2000, the Government began efforts to monitor progress in meeting targets set for the different social
programs, and started to regularly publish the results to improve accountability of program administrators. It also
contracted with the local UNDP Office the evaluation of major social programs in the education sector including the
school lunch program, scholarship and voucher program, among others. These efforts need to be continued, along
with the introduction of formal scientific evaluation of major social programs to evaluate their impact and cost
effectiveness.

Improving the Effectiveness of
Social Spending
4.1. This section summarizes the recommendations of this report and their associated costs for improving the social
indicators of the poor in Costa Rica by focusing on improving the efficiency and targeting of social spending. The
spending priorities include the increase in coverage of ECD education and early stimulation to poor children,
improvements in education quality to reduce repetition and dropouts in primary and secondary education and increase
coverage of non-contributory pensions to the elderly poor. Most, if not all of these spending needs, can and should be
financed with re-allocations and redistributions of existing social spending, as well as efficiency improvements to
produce value for money rather than with increments in social spending, as will be summarized below.
Increasing coverage of early child education programs for the poor
4.2. In 2000, Early Child Development (ECD) programs, such as CEN-CINAI centers, Hogares Comunitarios, or
other programs failed to reach an estimated 84,000 poor children that require social assistance. Most of these children
stayed at home under the care of poorly educated mothers, older siblings, or relatives who may lack the skills to
adequately stimulate young children for developing their motor and social skills which are critical for success in school
and later in life. Coverage of these children can be increased through several means including expansion of the number
of children in the CEN-CINAI (where excess capacity exists) and Hogares Comunitarios centers and the introduction
of non-formal models that rely on community and parental education in childcare stimulation and early education. The
introduction of effective child care programs will not only benefit children, but also their mothers who can then be
trained and can participate more in the labor market. It has been estimated that covering all uncovered children would
cost about US$ 26 million dollars per year, using a combination of center-based care and non-formal care by parents.
Since costs of CEN-CINAI are already high at about $19 million per year, only an additional $11 million will be
needed to reach full coverage of poor children. This assumes that about 80 percent of current beneficiaries of CEN-
CINAI who are not poor and are dropped from the program to make room for poor children). However, these costs
can be reduced substantially if the existing childcare programs are rationalized to emphasize their education and
stimulation components reducing or eliminating their current nutrition and health care components. Under nutrition is
very low now in Costa Rica and the health component is being provided by the local health services (EBAIS) of the
CCSS. There is also an urgent need to experiment with different modalities of child care and evaluate their cost
effectiveness to determine the best alternative which is affordable for Costa Rica.
Improving completion rates and quality of primary and secondary education
4.3. Despite high spending on education, Costa Rica is lagging in education coverage and attainment relative to
countries of similar income and education expenditures. To improve the quality of primary education - and reduce
repetition and drop-out rates - the government needs to invest more in teacher training, technology in schools, school
materials. To improve access by the poorest, better targeting of the school lunch and other education welfare programs
as well as other programs such as scholarships on conditional cash transfers should be considered in order to ensure
benefits reach those who need the subsidies the most. In secondary education, net enrollment rates of the poor 13-18
years olds are 53 percent (as compared to 61 percent for the national average from the 2000 Census). To Improve
quality and coverage of secondary education - and reducing repetition and drop-outs - the government will require
supply-side investments in teacher training, technology and modern methods to reach dispersed populations in public
schools. The government may need to consider measures to induce more demand for education by providing
subsistence subsidies, stipends, scholarships, to poor students, so that they can forego the opportunity and direct costs
of schooling, especially in rural areas. Some of these programs have already been introduced with success recently
under the Administration of President Rodriguez.
4.4. The increased cost of the proposed reforms is estimated to sum up to between 6 and 7 percent of current
expenditures. These increases could be financed by, (a) improving internal efficiency, through reduction in repetition
rates, for example; (b) the constitutional imperative to increase the Ministry of Education’s budget to 6 percent of
GDP; and (c) improve the distribution of public funds between university, where spending is highly regressive, and
COSTA RICA: SOCIAL SPENDING AND THE POOR
54
primary and secondary education where spending is more pro-poor. Improvements in efficiency and quality are likely
to free-up resources currently tied up to finance inefficiency, such as high repetition rates, and poorly targeted
programs, which distribute resources to populations that are less needy. As an example, crude estimates indicate that
repetition in primary school costs about $21.2 million per year or about 10 percent of the education budget for primary
education, while the costs for secondary education repetition are equivalent to $14.8 million per year.
Improving the quality and health care coverage
4.5. Costa Rica’s health care system has been increasing coverage of health services rapidly over the last few years,
as a result of reforms begun in the mid 1990s. Overall coverage of preventive and curative health services has been
estimated at about 85 percent of the population. Coverage among the poor, however, remains a problem. Major
challenges remain for the health sector to improve value for money as it prepares for the aging population with a more
costly chronic disease based epidemiological profile. In the health sector the government should consider the following
actions:
· First, strengthen the role of the Ministry of Health as a regulatory agency with a strong capacity for policy
development, enforcement of quality standards and promotion of health education and public health
programs.
· Second, in the CCSS, continue expanding coverage to rural areas and to metropolitan populations that have
limited access to health services by introducing alternative delivery arrangements for the primary health
care, ensuring adequate funding.
· Third, consolidation of a culture of performance agreements, and shift from a historical based budget to a
performance based budget.
· Fourth, introduce changes in the pharmaceutical procurement system that aim to improve operating
efficiency and adapt the supply chain to recent changes under the Law on Decentralization.
· Fifth, target evasion and strengthen efforts to implement the Ley de Protección al Trabajador, including
strengthening the CCSS’ invoicing system and promoting changes in the financial information systems.
4.6. Estimates provided by the government indicate that these reforms would have an estimated cost of roughly $70
million over 5 years. These costs would cover, investments in primary care to consolidate the primary care model,
extending access to 100 percent of the population; investments in personnel, training and information systems to
improve the stewardship function of the MOH; investments in upgrading hospital equipment and developing
ambulatory solutions; implementation of management reforms and information systems to improve quality and
efficiency in the supply chain, hospital management and purchasing function; and continued support to implement
nationwide the improvements in the financial management system. Over five years, the costs would be equivalent to
less than 2 percent of the estimated annual health budget for the CCSS. These reforms would produce annual savings
in excess of $28 million per year. This would nearly double the estimated cost of the reforms and allow the CCSS to
continue producing more with fewer resources.
Improving access to old age pensions
4.7. The pension sector underwent significant reforms in the past decade. The majority of the reforms addressed
the most pressing financial problems in terms of diversity of benefits among the pension schemes. Further progress is
needed to increase coverage, currently at 56 percent of the working age population (PEA), and to consolidate the
financial standing of the system. The actions that can be taken include: First, consolidating reforms that will guarantee
the long-term sustainability of the public pension schemes. As the population ages sharply over the next 30 years, the
financial imbalance would lead to pension fund insolvency. Second, adjusting the calculation of benefits to more
accurately reflect earnings capacity, through providing incentives for contributing a greater share of actual earnings in
the earlier years of the earnings cycle. Third, reducing evasion and sub-declaration of salaries. And fourth, improving
access to minimum pensions and improving equity in the distribution of these benefits.
Improving non-contributory pensions for the poor
4.8. In 2000, the SIPO database reported that about 14,000 extreme poor and poor elderly (about 50 percent of
group) had no assistance pension. About 46 percent of extreme poor older than 65 years of age reported permanent or
temporary physical or mental limitation. Recent figures from the government indicate, however, that the number of
non-contributory pensions awarded increased significantly in 2000 and 2001, so that coverage of elderly poor has
considerably increased and that only about 7,000 elderly poor remained to be covered by the end of 2001. It has been
IMPROVING THE EFFECTIVENESS OF SOCIAL SPENDING
55
estimated that covering these remaining poor would cost about US$ 3.1 million per year. Most of this coverage could
be achieved without additional spending if targeting is improved.
Improving relevance and targeting of social assistance programs
4.9. Social assistance priorities should shift towards programs that combine immediate income assistance to meet
the needs of the poor and vulnerable groups, with investments in human capital for the future, and target subsidies to
those who really need them. To achieve these objectives, the government can consider reducing transfers to housing
subsidies and other such transfers and allocate government funds to public goods or private goods with high
externalities, such as education and early child education which are more likely to reach the poorest. Critical for this re-
allocation of spending priorities is the need to change FODESAF´s law, which currently assigns specific percentages
of spending to programs that are of doubtful priority for the current needs of the poor.
4.10. In housing, data shows that housing quality is the main gap for poor families, as reflected in the high numbers
of poor families who have houses with floors made of substandard materials (107,000 or 65 percent), roofs (98,000 or
59 percent) and walls (101,000 or 61 percent). In order to improve effectiveness, the Government should reassess if
the current policy of giving Bonds for new housing is the most appropriate way to meet the current needs of the poor
population. Other options, such as providing loans for housing improvements could be considered.
4.11. One of the sources of ineffective targeting of public resources through social programs has been the lack of
unified criteria for identifying beneficiaries for social programs. While no single system can capture the multiple
characteristics of the poor and their precise needs, a system which characterizes the poor according to a wide number
of characteristics associated to poverty is useful to reduce duplications of benefits, identify poor who are left out of the
benefit system, and to establish targets for social indicators of the poor. Agencies implementing social programs can
work with the same database of potential beneficiaries and record the benefits provided, thus, contributing to produce
a single registry of beneficiaries with a de-facto “accounting” system for beneficiary families.
4.12. Although some improvements have recently been made to targeting social assistance programs to the poor,
more needs to be done. This includes extending the application of the SIPO selection system for most programs that
are means tested, such as CEN-CINAI, non-contributory pensions, and school lunches, among others. The SIPO
system is based on state of the art Internet technology and, by the end of 2001, contained over 207,000 families or
about 808,500 people, representing about 21 percent of the Costa Rican population. To be effective, however, the
SIPO system should be mandated for all institutions managing targeted social programs36 and would need to be kept
up to date and include all of the potential beneficiaries, a task which will be a great challenge for IMAS. The SIPO
database is most useful for describing the main characteristics of the poor, and for the design of programs more
attuned to local needs and conditions.
4.13. Three issues are critical for the maintenance of the SIPO system in the future. First is updating of the system,
which is a common problem of such systems.37 IMAS has already produced updating procedures and has applied them
regularly, but continuous efforts need to be made in the future.38 Second, despite the usefulness of SIPO for many
social programs, many institutions will likely prefer to use their own targeting methods, often subjective and amenable
to manipulation, in the absence of a normative that establishes compulsory uses and procedures for use of the system.
Third, the applicability of SIPO for identifying the “new” poor may be limited. The survey form may be too long and
costly to apply. The point score system based in weights of household characteristics describe better “structural
36 Several countries have systems similar to SIPO to help target social programs directed to the poor. These countries include Chile,
that pioneered such systems with the introduction of the Ficha CAS system in the early 80s, Colombia that introduced the SISBEN
system in the mid-1990s to target social spending particularly health insurance subsidies, Mexico that uses a means-test system for
PROGRESA and Nicaragua for the Red de Protección Social Program.
37 Updating information is not only a technical problem but also a “political” one. Once families realize that the information they
provide is used for determining eligibility for some programs, they may request updating with the aim of manipulating the
information. So, there is a need to clearly establish which information can be updated during a reasonable period of time -say births
and deaths, changes of residence, etc.- and which information can not be changed for a period of time -education, housing
conditions, etc.-. Updating too frequently is also very costly.
38 In the future there will not be a need for massive surveys of poor areas as was done in the past. Most poor families are already in
the system, so that regular updates of key variables is the only thing required. This can be done by IMAS on a regular basis when
people access some of the social services it provides, or on demand when people want to be included in the database to apply for
social programs. This updating strategy will reduce the cost of SIPO significantly in the future.

COSTA RICA: SOCIAL SPENDING AND THE POOR
56
poverty” than the “transient” poor. This, however, can be amended if, in crisis times, a shorter version of the survey
form is applied and larger weights are given to unemployment, under-employment and income variables.
Improving monitoring and evaluation of social programs
4.14. Monitoring and evaluation of social programs have been traditionally weak or non existing in Costa Rica, as
mentioned earlier in the case of ECD programs Monitoring and evaluation are key to evaluate progress, evaluate
impact of programs and make more efficient decisions on programs to improve social indicators of the poor. In
addition, the practice of establishing base-lines and measuring the impact of specific programs should be implemented
more routinely, in order to draw lessons from experience which can be used to modify programs and improve their
impact. Costa Rica is in a good position to implement a Living Standard Measurement Survey (LSMS) every 3-5 years
to gather information on consumption and the status of key risk groups and on the outcomes of the main social
programs, complementing the current annual household surveys carried out by the Statistical Institute (INEC). To
strengthen the capacity of the LSMS to monitor poverty groups and programs, the following information should be
included on a regular basis:
· Consumption of household and household members;
· Nutrition indicators of sub-sample of households;
· Coverage of programs for children in the birth to five years old age cohort;
· Private costs of pre-school education;
· Incidence and coverage of social protection programs, including income support programs, education-
based transfers, community based strategies, labor market programs, feeding programs and low-income
housing programs;
· Demand and supply issues with respect to pre-primary and secondary education; and
· Reasons why children are absent from school.
Improving institutional coordination
4.15. One of the impediments to more effective use of social spending to improve social indicators of the poor in
Costa Rica has been the absence of a unified policy making body capable of setting social policy strategy which details
programs, targets to be reached by programs, beneficiary populations, and the institutional arrangements to carry out
that strategy. Efforts in this direction have been undertaken in recent administrations, but these efforts have been
hampered by institutional rigidities and laws which have undermined coordination efforts and the reform or
elimination of ineffective programs or institutions. The following is a brief discussion of some key institutional issues
and possible ways to address them.
4.16. First, there is not a single unified body or agency which establishes social spending priorities, coordination rules
and procedures for the different agencies, and monitors progress in achieving targets in social indicators. No
functional linkages among institutions or programs have been established which describe their roles and
responsibilities and their complementarities and synergies. This is producing duplication and atomization of efforts by
institutions, and overlapping functions and responsibilities. Also, while in many countries private and NGO agencies
operate many social programs, in Costa Rica most social programs are operated by public agencies under historically
based budget allocations rather than on performance-based indicators.
4.17. Second, there is much rigidity in laws -such as FODESAF’s- in expending priorities, so that social institutions
cannot respond to the changing needs of the poor or to results achieved. Over 77 percent of FODESAF funds are
allocated by law to different programs irrespective of the changing needs of the poor population or the effectiveness
of these programs.
4.18. Third, there has not been a clear definition of which spending or programs are to be targeted to poor or other
special groups, and which spending is to be universal. This has led to generally un-targeted programs, which benefit
middle and upper income groups, and, until recently, little developed targeting instruments. While Costa Ricans have
been understandably reluctant to target most social spending for fears that it weakens social cohesion and alters the
achievement of common social values and culture, it is also undeniable that universal programs are costly. The long
standing practice of spreading expenditure very thinly to attend large numbers of people—such as in the school lunch
program—is not helping the poorest students who need them most, nor the better off students who are getting less

IMPROVING THE EFFECTIVENESS OF SOCIAL SPENDING
57
benefits (calories and proteins) than what they could get with the help of parents.39 This practice leads to ineffective
interventions as the size of the transfers or service may be too little to have any significant impact.
4.19. The institutional arrangements that could mitigate the problems highlighted in this report include the
establishment of a unified policy setting body, with responsibilities for setting social spending priorities, defining
institutional coordination arrangements, defining targets to be achieved by each institution, and monitoring progress,
and assessing the effectiveness of programs and of the operational arrangements and institutions. Different
Administrations have tried alternative arrangements to solve the institutional issues by creating a “social authority”,
often headed by one of the Vice-Presidents, but these efforts have lacked continuity and have changed with changes in
the administrations. This section offers a series of suggestions on how institutional arrangements could be modified to
improve policy making and coordination of the different social sector agencies in Costa Rica.
4.20. In terms of policy making and establishing spending priorities, one of the alternatives that could be considered
is the creation of a Council for Economic and Social Policy (CONPES) composed of ministries from Finance,
Education, Health, Labor, the President of IMAS, among others. This body would be presided by the President of the
Republic and would review and approve social policy strategy and action plans pursued by the government. This
Council would need to have the authority for allocating social budgets and, particularly, for defining expenditure
priorities of FODESAF funds, according to the strategy and action plans. This would give the Council the authority
and budget power to enforce coordination and to hold the line ministries accountable for results. The strategy, actions
plans and financing needs could be prepared by a Technical Secretarial of that Council.
4.21. The Technical Secretariat of CONPES could be composed of high level government officials from the
Ministry of Finance, FODESAF, and the Ministry of the Presidency. 40 The Secretariat would have two main
responsibilities. First, prepare key policy papers and action plans -for example, at the beginning of each
administration- specifying targets, how targets will be achieved and the funds allocated to those purposes. Second,
prepare bi-annual reports -to be reviewed and approved by CONPES- on the progress on achieving specified targets,
the impact of programs achieved so far, and specify adjustment measures and costs, if needed. These reports could be
based on reports made by operating agencies, including government, local agencies and non-government
organizations, and evaluation reports commissioned with academic organizations, communities and others.
4.22. The operating agencies for social programs include ministries, decentralized or deconcentrated government
agencies, local governments, communities and a host of organizations that could be involved in the social strategy and
in government plans. The work of these agencies, the targets to be achieved, the beneficiary populations, and the
financial resources would need to be detailed in a matrix of functions and responsibilities along with the outcome and
intermediate indicators to be achieved. One issue that deserves attention is the public-private mix in service provision
of social services. Currently, most social services including education, child care services and health care are provided
by public agencies. In some other countries such as Chile, Colombia, among others, the private sector and or local
governments and organizations provide education, child care and health care services to the poor, with government
financing through vouchers given to beneficiaries or government transfers. This practice has often reduced costs and
has opened the door to potential cost sharing arrangements with beneficiaries and operating agencies reducing costs
for the government and improving efficiency of programs.
4.23. Allowing greater FODESAF budget flexibility could also these resources to be better targeted and to be used
for economic contingencies affecting the poor and “new” poor, resulting from economic downturns (not only to
achieve long term improvements in social indicators of the poor). FODESAF could then accumulate funds during
times of economic growth, and spend them in times of economic down turns (in employment programs,
unemployment assistance, etc.). FODESAF could then finance and manage a portfolio of carefully designed social
programs to address social problems of the “structural” poor, as well as finance social spending needs during
economic crisis. This will require greater budget flexibility for the FODESAF Fund, so that it can be used to respond
to changing economic conditions. Within FODESAF, programs such as non-contributory pensions, ECD programs,
scholarships, may have some minimum expenditure ceilings, while other expenditures may change every year,
according to identified needs and priorities.
39 Targeting the school lunch program does not mean that better off students do not get school lunch. In fact, all students could get
a good quality meal, the only difference being that poor students would get it free or heavily subsidized while better off students can
pay all or part of the cost of the meals.
40 A similar group named “Budgeting Authority” serves to set expenditure priorities of the whole public sector in Costa Rica.
COSTA RICA: SOCIAL SPENDING AND THE POOR
58
4.24. Budgets would need to be increasingly allocated to institutions on the basis of performance rather than on the
system of historical budget allocations, as started to be done by the administration of President Rodriguez for social
programs, such as scholarships, Schools Bonds, pensions and others. Payments on the basis of people attended by
institutions and other service providers would induce them to provide more and better services to the poor (IADB,
1996). When there are many providers of services, including public and private NGOs or other local institutions,
vouchers are a good alternative in that beneficiaries can choose the provider that offers the best service. Private
agencies and NGOs can be very effective in complementing public services in childcare, health care, education (for
instance, secondary education and youth training) and many other social services.