
ADePT User's Guide - World Bank Group
133
STREAMLINED ANALYSIS WITH ADePT SOFTWARE VERSION 5 ADePT User Guide ADePT User Guide Lokshin, Radyakin, Sajaia, and Creitz Michael Lokshin Sergiy Radyakin Zurab Sajaia William Creitz
-
Upload
khangminh22 -
Category
Documents
-
view
1 -
download
0
Transcript of ADePT User's Guide - World Bank Group

S T R E A M L I N E D A N A L Y S I S W I T H A D e P T S O F T W A R Ewww.worldbank.org/adept
The ADePT Software platform is developed and maintained by the Computational Tools Team of the Research Department of The World Bank. ADePT is free software that enables users to analyze micro-level data and generate print-ready, standardized tables and charts. The software can be used to simulate the impact of economic shocks, cash transfers and other policy instruments on various economic outcomes. The software automates the analysis, helps minimize human errors and encourages development of new methods of economic analysis. The goal of the ADePT project is to develop user-friendly tools to bridge the gap between busy policy makers and cutting-edge economic research.
ADePT Version 5 includes 12 modules for the analysis of Poverty, Inequality, Health, Education, Labor market, Gender, and others. The Food Security module (ADePT FS) was developed in cooperation with UN FAO. A module for the analysis of Labor Market was developed jointly with ILO.
V E R S I O N
5ADePT User GuideADePT User Guide V
ERSION
5Lokshin, Radyakin, Sajaia, and Creitz
Michael LokshinSergiy RadyakinZurab SajaiaWilliam Creitz
Streamlined Analysis with ADePT Software is a new series that provides academics, students, and policy practitioners with a theoretical foundation, practical guidelines, and software tools for applied analysis in various areas of economic research. The series examines such topics as sector performance and inequality in education, the effectiveness of social transfers, labor market conditions, the effects of macroeconomic shocks on income distribution and labor market outcomes, child anthropometrics, and gender inequalities.

ADePT User’s Guide
STREAMLINED ANALYSIS WITH ADePT SOFTWARE
Michael LokshinSergiy RadyakinZurab SajaiaWilliam Creitz

Other Titles in the ADePT Series
Health Equity and Financial Protection (2011) by Adam Wagstaff, Marcel Bilger, Zurab Sajaia, and Michael Lokshin
Assessing Sector Performance and Inequality in Education (2011) by Emilio Porta, Gustavo Arcia, Kevin Macdonald, Sergiy Radyakin, and Michael Lokshin
A Unified Approach to Measuring Poverty and Inequality: Theory and Practice (2013) by James Foster, Suman Seth, Michael Lokshin, and Zurab Sajaia
For more information about Streamlined Analysis with ADePT software and publications, visit www.worldbank.org/adept.

iii
Contents
Chapter 1 Introduction .................................................................................. 1
About ADePT ............................................................................1About this manual ......................................................................2Conventions used in this manual ..................................................3Additional resources ...................................................................3Support ....................................................................................4
Chapter 2 Quick start ................................................................................... 5
Install and launch ADePT ............................................................5Analyze data and generate a report ..............................................6
Chapter 3 Installing ADePT ........................................................................... 7
System requirements ..................................................................7Installing ADePT ........................................................................8
Selecting modules ...............................................................10Registering ADePT ...............................................................11
Setting ADePT options .............................................................12Applications ........................................................................12Modules .............................................................................14Reporting............................................................................15Localization.........................................................................16Other options ......................................................................19
Updating ADePT ......................................................................20

Contents
iv
Chapter 4 Launching ADePT .........................................................................23
About the ADePT main window .................................................24Exiting ADePT .........................................................................26
Chapter 5 Using ADePT: basic operations ......................................................27
Overview of the analysis procedure ............................................271. Specify datasets ..................................................................28
Optional steps .....................................................................312. Map variables ......................................................................31
Methods for mapping variables ..............................................32Optional steps .....................................................................35
3. Select and tables and graphs .................................................36Optional steps .....................................................................38
4. Generate the report ..............................................................38Internal operations ...................................................................40
Chapter 6 Examining the report .....................................................................41
Chapter 7 Working with datasets ..................................................................43
Additional dataset functions ......................................................43Viewing basic information about a dataset’s variables ..................44Viewing a dataset’s data and variable details ...............................47
Data View tab .....................................................................47Variable View tab ................................................................50
Generating numeric dataset variables ..........................................51Replacing numeric dataset variables ...........................................53Expressions for generating and replacing variables .......................53Generating and replacing string dataset variables .........................54 Deleting dataset variables ........................................................55
Chapter 8 Working with input variables ..........................................................57
Variable types .........................................................................57Mapping multiple dataset variables to an input variable .................58Adding a custom category ........................................................59Input variable processing precedence ..........................................59Global Filter .............................................................................60Input variable grids ...................................................................61Defining missing values ............................................................62Using transformations in input variable fields ...............................64

Contents
v
Chapter 9 Setting parameters .......................................................................67
Describing complex survey design in ADePT ................................68
Chapter 10 Working with tables and graphs .....................................................71
Feasible versus infeasible outputs ..............................................71Including original data ...............................................................72Filtering for individual tables and graphs ......................................73
Global Filter or if-condition: Which should you use? ................76Combining the Global Filter and if-conditions ...........................79
Generating tables of frequencies and standard errors ....................80Generating a custom table ........................................................82Using the Table Browser ...........................................................85
Chapter 11 Working with projects ...................................................................87
Local projects ..........................................................................87Web-based projects ..................................................................88Using a project file on a different computer .................................89Replicating results obtained with ADePT .....................................90
Chapter 12 Simulations with ADePT ................................................................91
Tutorial 1: Simulation using a statistical program ........................91A. Create a dataset with simulated data .................................92B. Process the two files ........................................................93
Tutorial 2: Simulation within ADePT ..........................................95A. Create a dataset with simulated data .................................95B. Process the two files ........................................................97
Tutorial 3: Simulation with one dataset and two variables ............98A. Process the original file ....................................................98B. Modify the original file ......................................................99C. Process the modified file ................................................100
Chapter 13 Using ADePT in a batch mode ......................................................103
Batch processing tips .............................................................105
Chapter 14 Troubleshooting .........................................................................107
Installation problems ..............................................................107Debug mode ..........................................................................108

Contents
vi
Appendix A Converting statistical data ...........................................................111
Assigning and using labels .....................................................112
Appendix B Portable ADePT ..........................................................................115
Appendix C Using ADePT in a multiuser environment .......................................119
General information ................................................................119Updating ADePT in a multiuser environment ..............................120
Glossary ....................................................................................121
Index ........................................................................................125
1
Chapter 1
Chapter 1
Introduction
About ADePT
ADePT software enables users to analyze microdata—from sources such as household surveys—and generate print-ready, standardized tables and charts. It can also be used to simulate the impact of economic shocks, farm subsi-dies, cash transfers and other policy instruments on poverty, inequality and labor. The software automates the analysis, helps minimize human errors and encourages development of new economic analysis methods.
ADePT supports datasets in Stata®, SPSS® and tab-delimited text formats. ADePT incorporates Numerics by Stata® (installed with ADePT) as its com-putational engine.
For each run, ADePT produces one output file—containing your selection of tables and graphs, an optional original data summary, and errors and notifi-cations—in Microsoft® Excel® format. Optionally, tables of standard errors and frequencies can be added to a report.
To use ADePT, you must be familiar with general computer operations, in-cluding how to use the mouse, open menus, and open, save and close files.
ADePT User’s Guide
2
About this manual
This manual provides comprehensive instructions for installing and using ADePT software. It is organized in the following chapters:
• Chapter 2, “Quick start,” shows—in two pages—how to analyze a dataset within a few minutes of installing ADePT.
• Chapter 3, “Installing ADePT,” lists system requirements, and shows how to install, register, configure and update the program
• Chapter 4, “Launching ADePT,” shows how to start the program, and describes features of the program’s main window.
• Chapter 5, “Using ADePT: basic operations,” provides instructions for the four main steps in performing an analysis.
• Chapter 6, “Examining the report,” describes what’s in a report gener-ated by ADePT.
• Chapter 7, “Working with datasets,” provides instructions for viewing variables and observations, generating, replacing and deleting variables, and related functions.
• Chapter 8, “Working with input variables,” describes variable types, and explains how to use expressions and transformations, define miss-ing values and work with compound fields.
• Chapter 9, “Setting parameters,” shows how to set ranges, weightings and other module-specific factors that ADePT will apply during its processing
• Chapter 10, “Working with tables and graphs,” shows how to filter observations, generate frequency and standard error tables, and design custom tables.
• Chapter 11, “Working with projects,” shows how to save and open ADePT projects.
• Chapter 12, “Simulations with ADePT,” provides instructions for ana-lyzing a simulated reform or policy intervention.
• Chapter 13, “Using ADePT in a batch mode,” enables you to automate report generation.
• Chapter 14, “Troubleshooting,” provides help if you encounter a prob-lem installing or using ADePT.
• Appendix A, “Converting statistical data,” discusses strategies for con-verting data into formats that ADePT can analyze.

Chapter 1: Introduction
3
• Appendix B, “Portable ADePT,” shows how to install the program on a USB flash drive so you can run it on different computers.
• Appendix C, “Using ADePT in a multiuser environment,” provides information for administrators responsible for deploying ADePT for use throughout a networked organization.
• “Glossary” defines terms used in this manual.
Conventions used in this manual
• Windows, buttons, tabs, dialogs and other features you see on-screen are shown in bold. For example, the Save As dialog has a Save button and a Cancel button.
• Keystrokes are shown in SMALL CAPS. For example, you may be instruct-ed to press the ENTER key.
• Menu commands use a shorthand notation. For example, Project Exit means “open the Project menu and click the Exit command.”
Additional resources
More information is available to help you use ADePT and its modules:
• Video tutorials are available at http://www.worldbank.org/adept Video Tutorials.
• You can download the ADePT Quick Reference from http://www.worldbank.org/adept Documentation.
• ADePT provides local help via the Help Contents command.
• For detailed information about using ADePT to analyze a specific eco-nomic sector, see the appropriate book in the Streamlined Analysis with ADePT Software series, described at http://www.worldbank.org/adept Books.
• Module-specific instructions, and example datasets, projects and re-ports, are available at http://www.worldbank.org/adept Modules.
Information about the Food Security module is available at http://www.fao.org/economic/ess/ess-fs/fs-methods/adept-fsn/en/.
ADePT User’s Guide
4
• Examples of datasets and projects are installed with ADePT. They are located in the \example subfolder in the ADePT program folder. Use the examples with the instructions in this manual to familiarize your-self with ADePT operations.
• To load an example dataset: Click the Add... button.
• To open an example project: Project Open Project... (projects have the .adept extension) or Project Open Example Project.
The example projects are especially helpful in understanding how dataset variables are mapped to input variables (explained further in the “Map variables” section of chapter 5, “Using ADePT: basic operations”).
Support
The ADePT Team is available to help you install and use ADePT. Please con-tact us if you have questions or encounter a problem with ADePT.
You can send a message to us via the Contact Us form at http://www.worldbank.org/adept Site Tools Contact Us.
5
Chapter 2
Chapter 2
Quick start
If you are eager to use ADePT, these abbreviated instructions will get you started. You’ll find detailed instructions in subsequent chapters.
Install and launch ADePT
1. Download ADePT from http://www.worldbank.org/adept Down-loads and install it. ADePT automatically launches when installation is complete.
2. In the Welcome to ADePT! dialog, enter your e-mail address, then click Register >>.
3. In the Select ADePT Module dialog, double-click the name of any module (e.g., Poverty).
For the basic steps shown on the next page, you may want to use the example datasets and projects installed with ADePT. They are located in the \example subfolder in the ADePT program folder.
• To load an example dataset: Click the Add... button (step 1 on the next page).
• To open an example project: Project Open Project... (projects have the .adept extension) or Project Open Example Project.
The example projects are especially helpful in understanding how dataset variables are mapped to input variables (step 2 on the next page).
ADePT User’s Guide
6
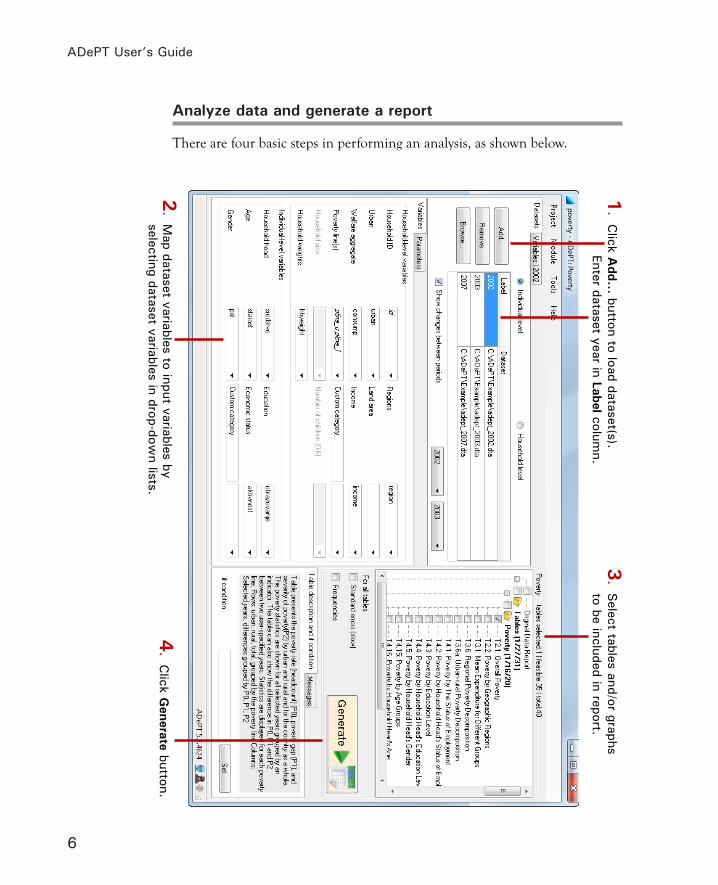
Analyze data and generate a report
There are four basic steps in performing an analysis, as shown below.
4. C
lick Generate button.
2. M
ap dataset variables to input variables by selecting dataset variables in drop-dow
n lists.
3. S
elect tables and/or graphs to be included in report.
1. C
lick Add... button to load dataset(s).
Enter dataset year in Label column.

7
Chapter 3
Chapter 3
Installing ADePT
System requirements
• PC running Microsoft® Windows® XP (SP1 or later), Windows Vista, Windows Server 2003 and later, or Windows 7. ADePT runs in 32- and 64-bit environments.
• .NET 2.0 or later (included with recent Windows installations), and all updates and patches.
• 80MB disk space to install, plus space for temporary dataset copies.
• At least 512MB RAM.
• At least 1024 × 768 screen resolution.
• At least one printer driver must be installed (even if no computer is connected).
• Microsoft® Excel® for Windows® (XP or later), Microsoft® Excel® Viewer or a compatible spreadsheet program is required for viewing reports generated by ADePT.
• A Web browser and Internet access are needed to download ADePT. Internet access is needed to install program updates and to load Web-based datasets into ADePT. Otherwise, ADePT runs without needing Internet access.
ADePT User’s Guide
8
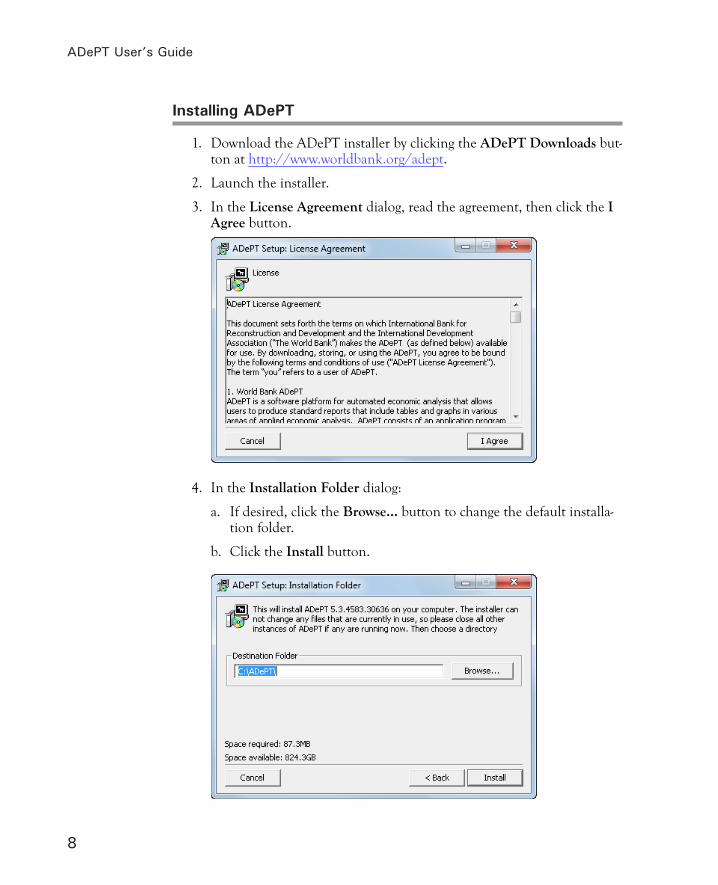
Installing ADePT
1. Download the ADePT installer by clicking the ADePT Downloads but-ton at http://www.worldbank.org/adept.
2. Launch the installer.
3. In the License Agreement dialog, read the agreement, then click the I Agree button.
4. In the Installation Folder dialog:
a. If desired, click the Browse... button to change the default installa-tion folder.
b. Click the Install button.
Chapter 3: Installing ADePT
9
Note: You may see a message that .NET is not installed. If that happens, cancel the ADePT installation, install the latest version of .NET (free download from the Microsoft® Web site), then restart the ADePT installation.
5. Wait while ADePT is installed.
6. In the Setup Completed dialog, click the Close button.
ADePT automatically launches after installation. Continue in the next sec-tion.
ADePT User’s Guide
10
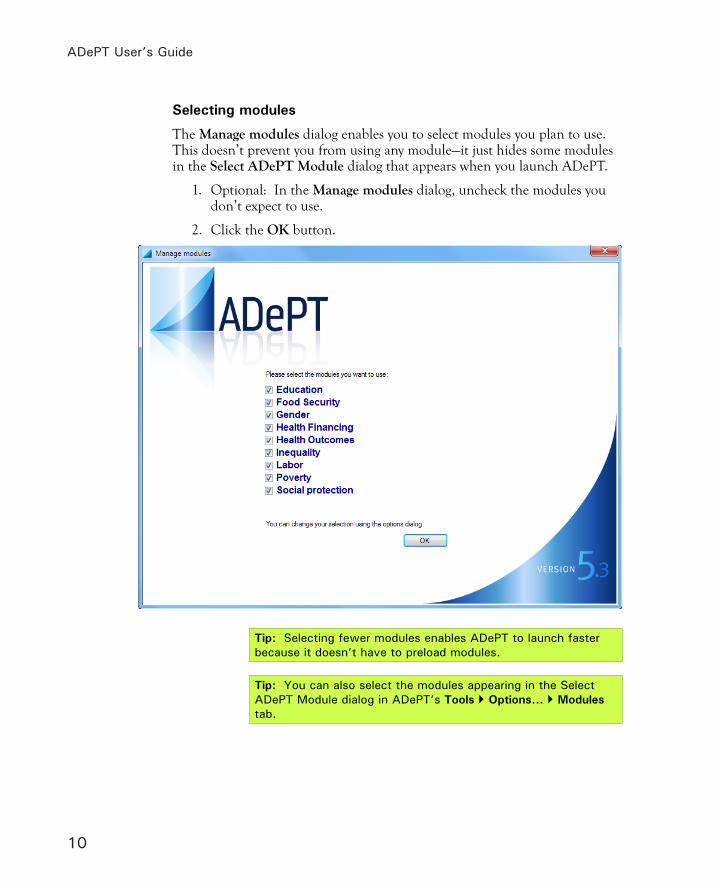
Selecting modules
The Manage modules dialog enables you to select modules you plan to use. This doesn’t prevent you from using any module—it just hides some modules in the Select ADePT Module dialog that appears when you launch ADePT.
1. Optional: In the Manage modules dialog, uncheck the modules you don’t expect to use.
2. Click the OK button.
Tip: Selecting fewer modules enables ADePT to launch faster because it doesn’t have to preload modules.
Tip: You can also select the modules appearing in the Select ADePT Module dialog in ADePT’s Tools Options... Modules tab.

Chapter 3: Installing ADePT
11
Registering ADePT
When installation is complete, you are invited to register as an ADePT user in the Welcome to ADePT! dialog.
1. Select one of the registration options:
• To receive notifications about program updates and new releases:
a. Click the Send this email to the developers... option.
b. Enter your e-mail address.
c. Click the Register >> button.
• To register anonymously:
a. Click the Send an anonymous... option.
b. Click the Register >> button.
If you prefer not to register now, click the Close button in the upper right corner.
ADePT User’s Guide
12
Tip: You can register for notifications later by using the Help Register... command to reopen the Welcome to ADePT! dialog.
2. The Select ADePT Module dialog appears. Double-click the name of the module you want to use.
Setting ADePT options
• To set ADePT options: Tools Options... , then continue in the sec-tions below.
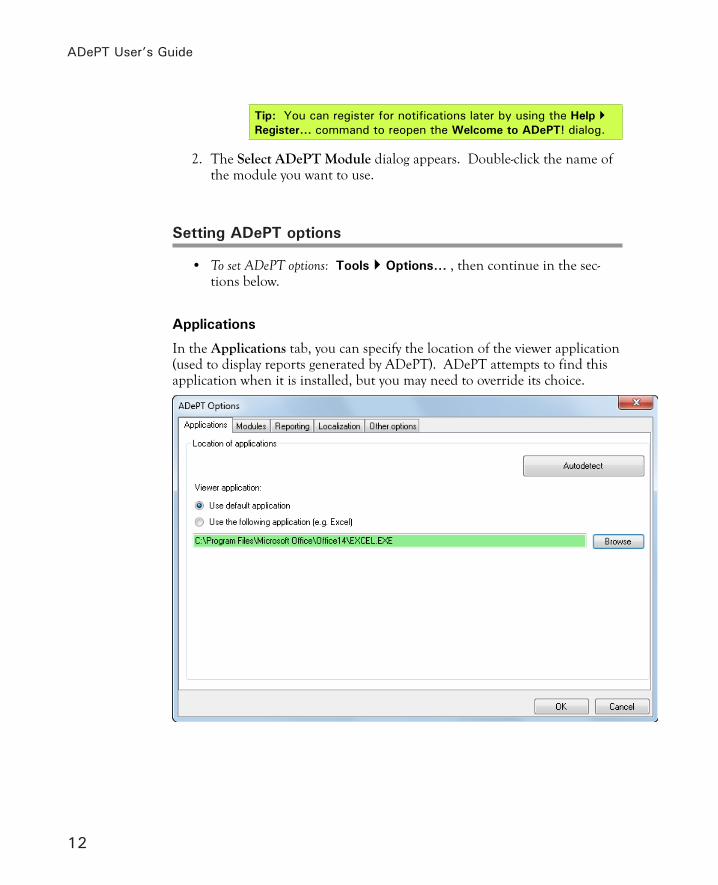
Applications
In the Applications tab, you can specify the location of the viewer application (used to display reports generated by ADePT). ADePT attempts to find this application when it is installed, but you may need to override its choice.

Chapter 3: Installing ADePT
13
The highlighted field indicates that ADePT located the required application during its installation.
• To have ADePT rescan for application locations: Click the Autodetect but-ton. (You might do this if the viewer application was moved or rein-stalled in a different location.)
You need Microsoft® Excel® for Windows® (XP or later), Microsoft® Excel® Viewer or a compatible spreadsheet program to view reports gener-ated by ADePT. Compatible programs include OpenOffice Calc, LibreOffice, Gnumeric and others.
• To use the application associated with the .xls extension: Select the Use default application option.
• To specify a particular viewer application: Select the Use the following application option. Click the Browse... button to locate the viewer application.
If you don’t have Microsoft® Excel®, you can download the free Excel® Viewer from the Microsoft® Web site. Excel® Viewer can open, display and print files generated by ADePT. You can copy data from Excel® Viewer and paste it in other programs. You can’t use Excel® Viewer to modify or save a workbook, or to create a new workbook.
If you are finished setting options, click the OK button. Otherwise, set other options.

ADePT User’s Guide
14
Modules
In the Modules tab, you can select the modules you want to be listed in the Select Modules dialog that appears when you launch ADePT.
• To remove a module from the Select Module dialog: Uncheck the module name.
If you only work with one module, you can suppress the Select Module dialog when ADePT launches by checking only that module in the Modules tab. However, this will prevent you from opening the Module menu to select a dif-ferent module. To be able to select other modules, check them in the Mod-ules tab, then restart ADePT.
If you are finished setting options, click the OK button. Otherwise, set other options.

Chapter 3: Installing ADePT
15
Reporting
In the Reporting tab, you select the level of reporting that appears in the Mes-sages tab (below the Generate button in the ADePT main window).
• Main messages and current status: Shows messages for data checking, data preparation, data analysis, report warnings and errors. This is the default level. We recommend using this level of reporting in your work.
• Detailed messages and progress indication and Service messages (de-bug mode): These levels are for troubleshooting and are rarely used for normal work. (See the “Debug mode” section in chapter 14, “Trouble-shooting,” for more information.)
If you are finished setting options, click the OK button. Otherwise, set other options.
ADePT User’s Guide
16
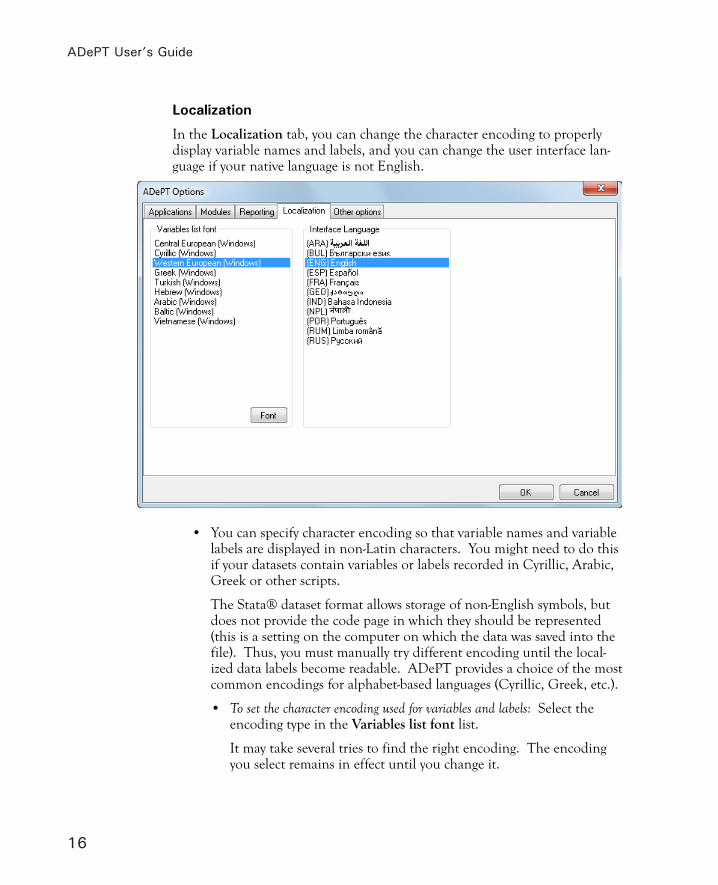
Localization
In the Localization tab, you can change the character encoding to properly display variable names and labels, and you can change the user interface lan-guage if your native language is not English.
• You can specify character encoding so that variable names and variable labels are displayed in non-Latin characters. You might need to do this if your datasets contain variables or labels recorded in Cyrillic, Arabic, Greek or other scripts.
The Stata® dataset format allows storage of non-English symbols, but does not provide the code page in which they should be represented (this is a setting on the computer on which the data was saved into the file). Thus, you must manually try different encoding until the local-ized data labels become readable. ADePT provides a choice of the most common encodings for alphabet-based languages (Cyrillic, Greek, etc.).
• To set the character encoding used for variables and labels: Select the encoding type in the Variables list font list.
It may take several tries to find the right encoding. The encoding you select remains in effect until you change it.

Chapter 3: Installing ADePT
17
Tip: You can also set character encoding in the dataset Vari-ables tab by right-clicking the table header, then clicking Select encoding in the pop-up menu.
Here are the same variable labels in Arabic, Cyrillic, Greek and Hebrew:
• To set the font, style and size used in the dataset Variables tab:
a. Click the Font button.
b. Select the font, style and size, then click the OK button.
ADePT User’s Guide
18
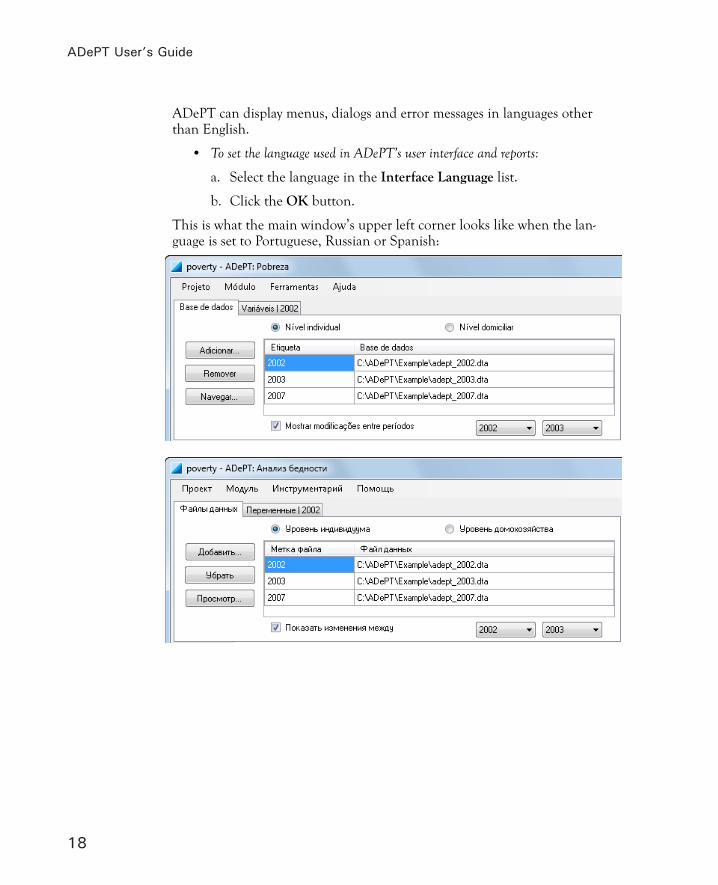
ADePT can display menus, dialogs and error messages in languages other than English.
• To set the language used in ADePT’s user interface and reports:
a. Select the language in the Interface Language list.
b. Click the OK button.
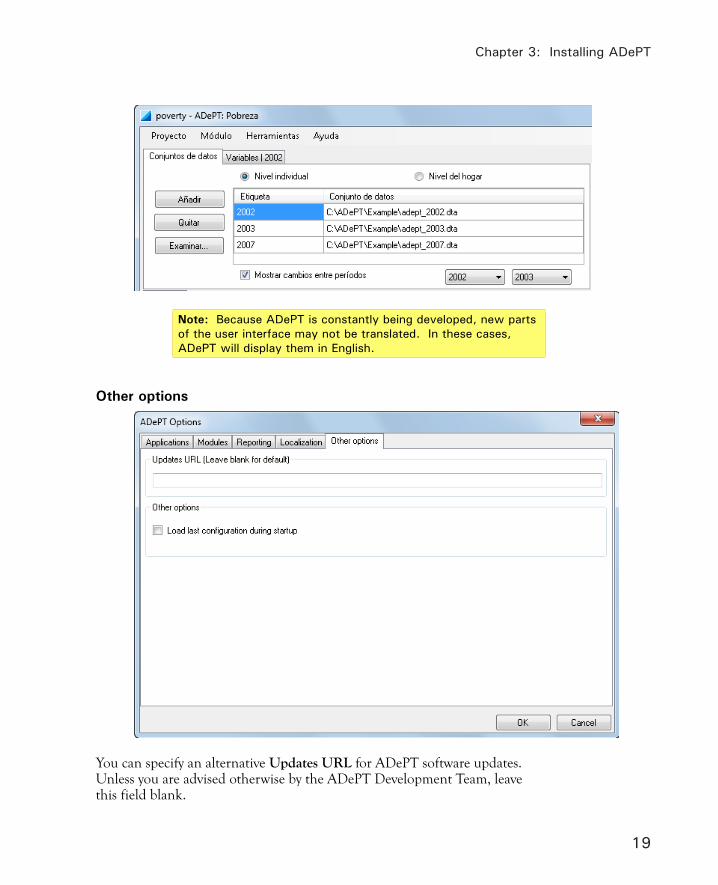
This is what the main window’s upper left corner looks like when the lan-guage is set to Portuguese, Russian or Spanish:
Chapter 3: Installing ADePT
19
Note: Because ADePT is constantly being developed, new parts of the user interface may not be translated. In these cases, ADePT will display them in English.
Other options
You can specify an alternative Updates URL for ADePT software updates. Unless you are advised otherwise by the ADePT Development Team, leave this field blank.

ADePT User’s Guide
20
When it is launched, ADePT automatically loads the last project from the previous session. You can change this behavior:
• To launch ADePT without loading the last project: Uncheck the Load last configuration during startup option.
If you are finished setting options, click the OK button. Otherwise, set other options.
Updating ADePT
The ADePT Team is constantly improving ADePT functionality. It is impor-tant that you keep your copy of ADePT up to date by installing new versions when they become available.
Note: An Internet connection is required to check for and install new versions of ADePT software.
There are three ways to tell if an update is available:
• Update available icon. (Status bar if an update is not available)
• Update version number.
• Help Check for Updates... .
• To update ADePT when a new version is available:a. Click the Update available icon in the status bar, then click Yes
in the message dialog. or Help Check for Updates... .
Note: If an update is available and a project is open in ADePT, you will be prompted to save and close the project before the update starts.
b. Optional: Click the Show details button to view the installed and available program versions.
c. Click the Update button. (If the Update button is disabled, you don’t have an Internet connection.)
Chapter 3: Installing ADePT
21
d. Wait while the new version is installed. Update Complete will ap-pear when the installation is finished.
Note: If you see the message Waiting to close all instances of ADePT, it will disappear as the update proceeds. You don’t need to click the Abort button.
Note: Option settings (in the Options dialog) are preserved across updates.
Another way to update ADePT is to download the newer version and install it over the existing version. You don’t need to formally uninstall ADePT to perform an update (although if you need to uninstall ADePT, use the Start All Programs ADePT Software Uninstall ADePT command, or remove ADePT using the list of installed programs in the Control Panel).
Note: Uninstalling ADePT may delete files you stored in the \ADePT program folder and subfolders.

ADePT User’s Guide
22

23
Chapter 4
Chapter 4
Launching ADePT
1. Click the ADePT icon in the Windows Start menu.
2. In the Select ADePT Module window, double-click the name of the module you want to use (see arrow in the screen shot below).
Note: If only one module is selected in ADePT’s Tools Op-tions... Modules tab, the Select ADePT Module dialog will not appear.

ADePT User’s Guide
24
The Select ADePT Module dialog lists currently available modules. If you work mostly with one module, you can suppress this dialog by activating the Don’t show this window at startup option at the bottom of the dialog. ADePT will then automatically load the last-used module when it’s launched.
• To switch to another module after launching ADePT:
a. Module Select module... to open the Select ADePT Module dialog.
b. Optional: Double-click Health to list health modules.
c. Double-click the name of the module you want to use. or Click the module you want to use, then press ENTER.
3. You now see the ADePT main window. More information is in the next section, “About the ADePT main window.”
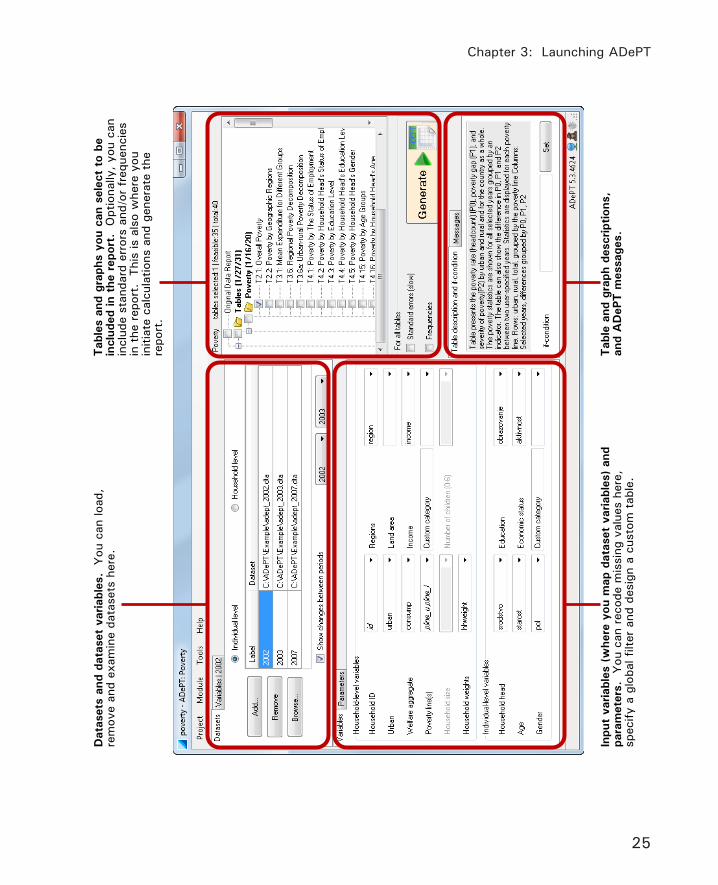
About the ADePT main window
As shown on the next page, ADePT’s main window is divided into four areas that correspond to the four general steps in the analysis process (for details on each of these steps, see chapter 5, “Using ADePT: basic operations”).
Chapter 3: Launching ADePT
25
Dat
aset
s an
d da
tase
t va
riabl
es. Y
ou c
an lo
ad,
rem
ove
and
exam
ine
data
sets
her
e.
Inpu
t va
riabl
es (
whe
re y
ou m
ap d
atas
et v
aria
bles
) an
d pa
ram
eter
s.
You
can
rec
ode
mis
sing
val
ues
here
, sp
ecify
a g
loba
l filt
er a
nd d
esig
n a
cust
om t
able
.
Tab
le a
nd g
raph
des
crip
tions
, an
d A
DeP
T m
essa
ges.
Tab
les
and
grap
hs y
ou c
an s
elec
t to
be
incl
uded
in t
he r
epor
t. O
ptio
nally
, yo
u ca
n in
clud
e st
anda
rd e
rror
s an
d/or
fre
quen
cies
in
the
rep
ort.
Thi
s is
als
o w
here
you
in
itiat
e ca
lcul
atio
ns a
nd g
ener
ate
the
repo
rt.
ADePT User’s Guide
26
Exiting ADePT
You can’t exit ADePT when it is performing computations. If you need to close ADePT during its calculations, click the Stop button (which replaces the Generate button when computations are in progress).
When you relaunch ADePT it will be in the same state as when it was closed, including the last-used module, settings and contents of the input variable fields. However, the content of the input variable fields will be restored only if ADePT successfully generated output tables in the previous session.
You may prefer to start working with a blank project each time you launch ADePT. If so:
• To launch ADePT with a blank project:
a. Tools Options... .
b. Click the Other options tab.
c. Uncheck the Load last configuration during startup option.
d. Click the OK button.

27
Chapter 5
Chapter 5
Overview of the analysis procedure
There are four basic steps in performing an analysis:
1. Specify one or more datasets that you want to analyze.
2. Map dataset variables to ADePT analysis inputs.
3. Select tables and graphs to appear in the report.
4. Generate the report.
The next sections in this chapter provide detailed instructions for the four steps.
Using ADePT: basic operations

ADePT User’s Guide
28
1. Specify datasets
Your first task in performing an analysis is to specify one or more datasets. ADePT can process data in Stata® (.dta), SPSS® (.sav) and tab-delimited text (.txt) formats.
Operations in this section take place in the upper left corner of the ADePT main window, shown here:
1. Add a dataset using any of the following methods:
• To add a locally-stored dataset: Click the Add... button. In the Open dataset dialog, locate and click the dataset you want to analyze, then click the Open button.
• To add a locally-stored dataset: Right-click anywhere in the Datasets tab, then click Add file... in the pop-up menu. In the Open dataset dialog, locate and click the dataset you want to analyze, then click the Open button.
• To add a Web-based dataset:
a. In the Datasets tab, SHIFT-click the Add... button. or Right-click in the Datasets tab, then click Add web file... in the pop-up menu.
b. In the Add Web Dataset dialog, enter the dataset’s URL. or If you previously copied the dataset’s URL to the clipboard, click the Paste from clipboard button .
c. Click the OK button.
Tip: You can also drag and drop dataset files from the desktop, Windows® Explorer and other locations.
Chapter 5: Using ADePT: basic operations
29
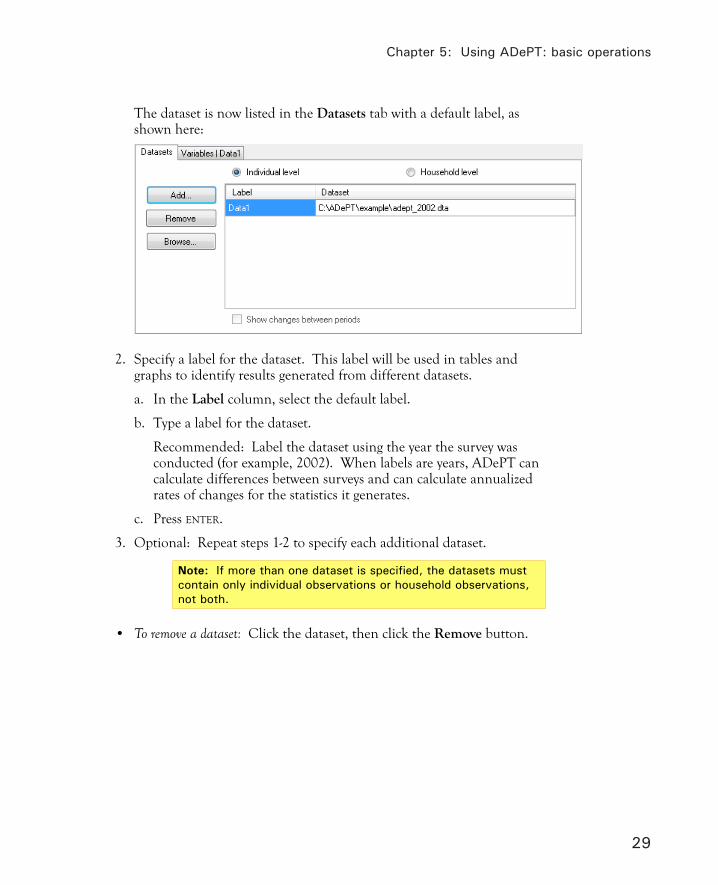
The dataset is now listed in the Datasets tab with a default label, as shown here:
2. Specify a label for the dataset. This label will be used in tables and graphs to identify results generated from different datasets.
a. In the Label column, select the default label.
b. Type a label for the dataset.
Recommended: Label the dataset using the year the survey was conducted (for example, 2002). When labels are years, ADePT can calculate differences between surveys and can calculate annualized rates of changes for the statistics it generates.
c. Press ENTER.
3. Optional: Repeat steps 1-2 to specify each additional dataset.
Note: If more than one dataset is specified, the datasets must contain only individual observations or household observations, not both.
• To remove a dataset: Click the dataset, then click the Remove button.

ADePT User’s Guide
30
Three datasets have been specified in this example.
Note: ADePT does not alter original datasets in any way. It always works with copies of datasets.
4. At the top of the Datasets tab:
• Select Individual level if the datasets contain one observation for each household member.
• Select Household level if the datasets contain one observation for each household.
Note: This is not an arbitrary parameter. It must correspond to the structure of the loaded dataset(s). For example, if you load an individual level dataset, but specify it as a household level dataset, the statistics calculated by ADePT will be incorrect.
The required set of variables may differ depending on which option you select. ADePT can automatically find some of the required information depending on the dataset type.
5. The Show changes between periods option is activated by default when at least two datasets are loaded.
• If you want ADePT to calculate changes between two periods, select the periods to the right of the option.
Note: Selecting the later year in the left list reverses the sign of the changes.

Chapter 5: Using ADePT: basic operations
31
• If you don’t want ADePT to calculate changes between periods, deactivate the Show changes between periods option.
Optional steps
At this point, you may want to:
• View a dataset’s data and variables using the Data Browser (see “View-ing a dataset’s data and variable details” in chapter 7, “Working with datasets”).
• Generate new variables, replace variables or delete variables (see cor-responding sections in chapter 7).
2. Map variables
ADePT needs to know which variables in the dataset(s) correspond to the inputs to its calculations. You must manually map dataset variables to input variables.
If multiple datasets are loaded, ADePT assumes that variables are named con-sistently. For example, if you specified S10_Q12 as an urban indicator, this variable should exist and have this meaning in all loaded datasets. ADePT checks whether this assumption is true and displays a notification if the vari-able is missing in any of the loaded datasets.
Operations described in this section take place in the left side of the ADePT main window. The examples show the Poverty module loaded into ADePT, but the process is similar for the other modules.
ADePT User’s Guide
32
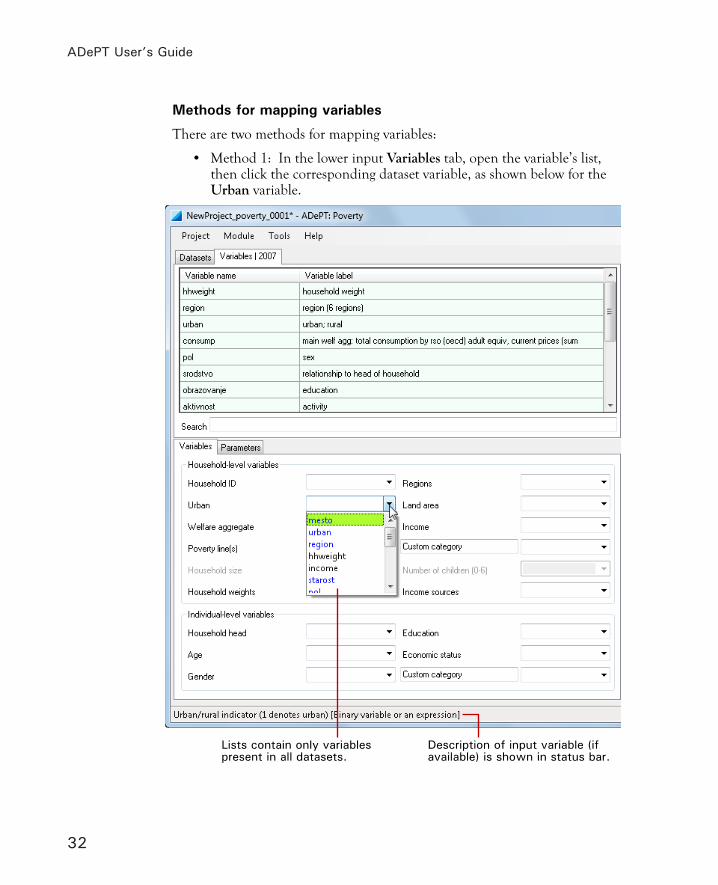
Methods for mapping variables
There are two methods for mapping variables:
• Method 1: In the lower input Variables tab, open the variable’s list, then click the corresponding dataset variable, as shown below for the Urban variable.
Lists contain only variables present in all datasets.
Description of input variable (if available) is shown in status bar.
Chapter 5: Using ADePT: basic operations
33
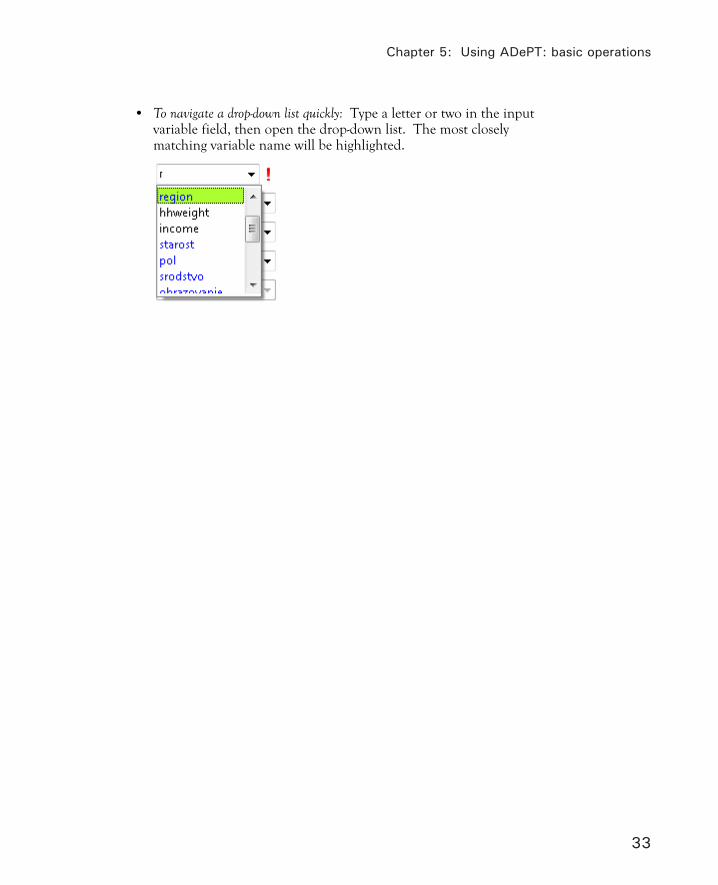
• To navigate a drop-down list quickly: Type a letter or two in the input variable field, then open the drop-down list. The most closely matching variable name will be highlighted.

ADePT User’s Guide
34
• Method 2: In the upper dataset Variables tab, drag the variable name and drop it in the corresponding field in the lower input Variables tab.
This method may be more efficient than Method 1 when datasets have a large number of variables.

Chapter 5: Using ADePT: basic operations
35
Note: You can also type dataset variable names in the input variable fields. The above methods are preferred, however, because typing may introduce errors. A spelling error, syntax er-ror, missing variable or other problem is indicated by an exclama-tion point next to the input variable field. Hover the cursor over the exclamation point to see information about the error.
• To remove a mapping: Select the variable name in the input variable field, then press DELETE.
• To locate a variable in the dataset Variables tab: In the Search field, type a few characters in the variable name or variable label.
Some modules have multiple input variable tabs. The Education module, for example, organizes variables in three tabs, as shown below. Be sure to visit all tabs to map variables relevant to your analysis.
Optional steps
At this point, you may want to:
• Map multiple dataset variables to an input variable (see chapter 8).
• Specify a transformation in an input variable field (see chapter 8).
• Set parameters (see chapter 9).
• Define missing values (see chapter 8).
• Work with input variable grids (see chapter 8).
• Specify a Global Filter to restrict the data to a subset of observations (see chapter 8).
ADePT User’s Guide
36
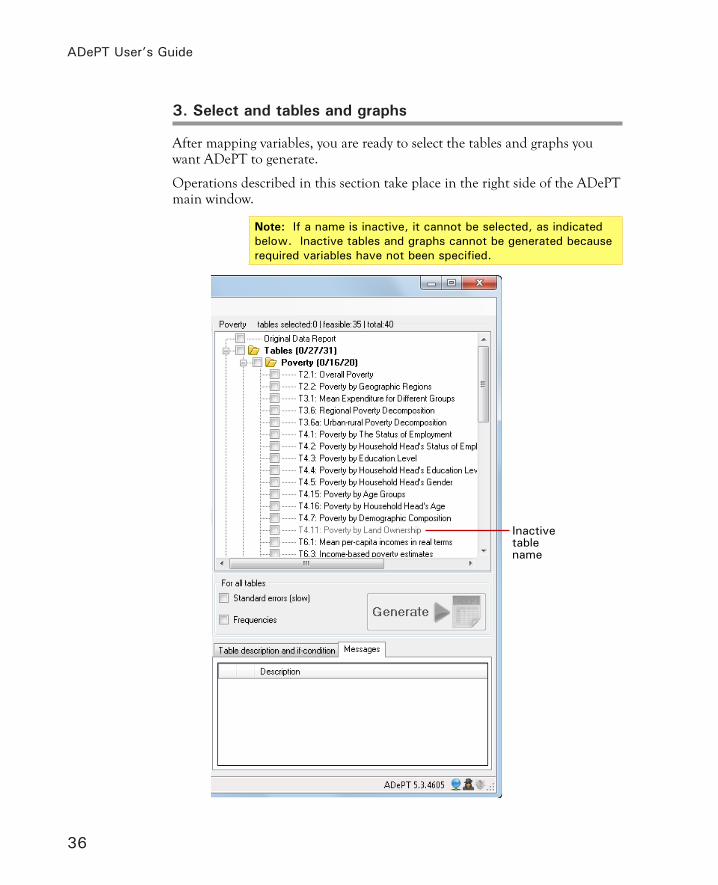
3. Select and tables and graphs
After mapping variables, you are ready to select the tables and graphs you want ADePT to generate.
Operations described in this section take place in the right side of the ADePT main window.
Note: If a name is inactive, it cannot be selected, as indicated below. Inactive tables and graphs cannot be generated because required variables have not been specified.
Inactive table name
Chapter 5: Using ADePT: basic operations
37
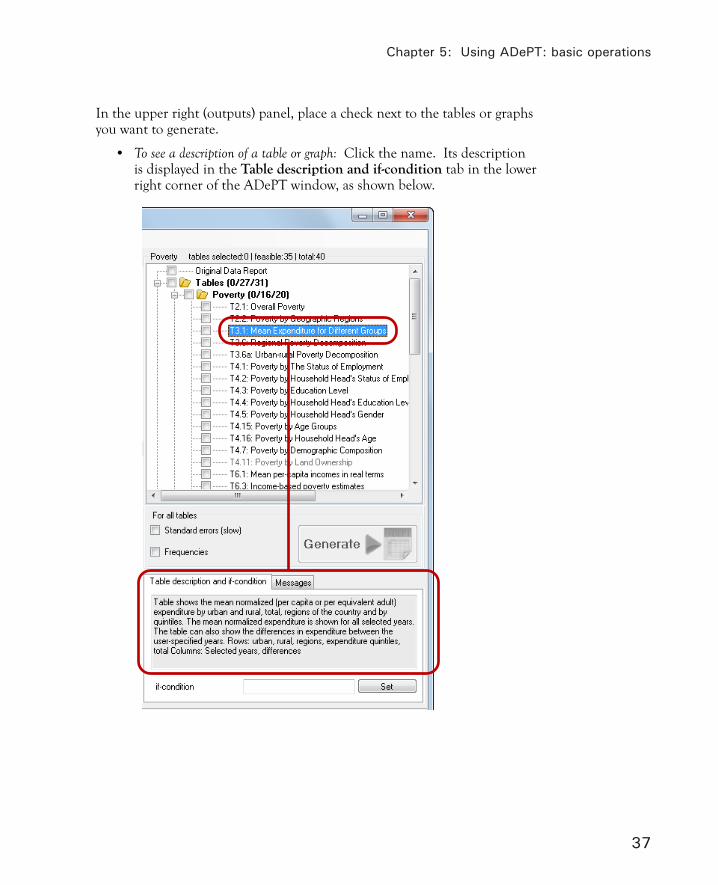
In the upper right (outputs) panel, place a check next to the tables or graphs you want to generate.
• To see a description of a table or graph: Click the name. Its description is displayed in the Table description and if-condition tab in the lower right corner of the ADePT window, as shown below.
ADePT User’s Guide
38
Optional steps
At this point, you may want to:
• Preview table layout, without actual data from your datasets (see chap-ter 10).
• Apply a filter to an individual table or graph (see chapter 10).
• Add standard errors and/or frequency tables to the report (see chapter 10).
• Design a custom table (see chapter 10).
• Understand why you can’t select some tables and graphs (see chapter 10).
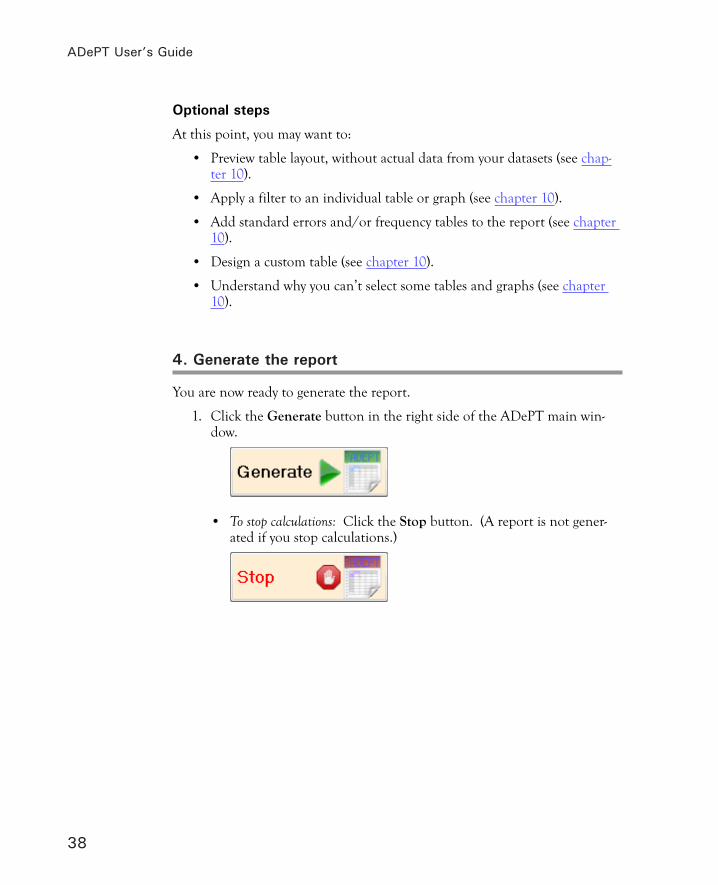
4. Generate the report
You are now ready to generate the report.
1. Click the Generate button in the right side of the ADePT main win-dow.
• To stop calculations: Click the Stop button. (A report is not gener-ated if you stop calculations.)

Chapter 5: Using ADePT: basic operations
39
2. Examine items in the Messages tab. ADePT lists potential problems in this tab.
ADePT can identify three kinds of problems:
Notification provides information that may be of interest to you. Notifications do not affect the content of reports generated by ADePT.
Warning indicates a suspicious situation in the data. Warnings are issued when ADePT cannot determine whether the data poses an impossible situation. Examples include violation of parameters, presence of potential outliers in the data, inconsistent data and inconsistent category definitions. ADePT reports are not affected by warnings.
Error prevents the use of a variable in the analysis. For example, a variable may not exist in a dataset (in this case, ADePT continues its calculations as if the variable was not specified). If ADePT can match the problem to a particular variable field, then that field is highlighted in the input Variables tab.
3. As needed, correct problems, then generate the report again.
Note: Notifications, warnings and errors can negatively affect the results ADePT produces. Carefully review messages, and correct critical problems, before drawing conclusions from tables and graphs.

ADePT User’s Guide
40
Internal operations
This section describes how ADePT processes data. You don’t need to know about this to perform analyses, but it may help you understand error messages and unexpected results in reports.
When you click the Generate button:
1. ADePT checks whether variables correspond to the requirements de-fined for each particular variable.
Specifically, ADePT checks whether variables are of the correct type (e.g. categorical, continuous, dummy) and have a proper number of unique values. ADePT repeats this process for all loaded datasets.
2. In the next stage, ADePT checks the consistency of categories for the variables defined in different files.
For example, ADePT checks whether the variable entered into the region field in the first year file contains the same number of categories as that variable in the second year file. ADePT posts error messages, warnings and notifications for problems it finds with the input data. If a problem is found in a particular variable, an exclamation point is displayed next to the field in the input Variables tab in the lower left corner of the main window.
3. ADePT generates temporary variables required for calculations.
ADePT tries to use information you specify to produce variables that are consistent with each other. For example, ADePT calculates house-hold size and composition variables from the household ID and the age and gender of household members. By doing so, ADePT makes sure that all tables in a particular module are internally consistent (that is, the numbers in one table do not contradict numbers in other tables).
4. ADePT begins producing tables and graphs.
The ADePT computational engine performs calculations and then sends the results of these calculations to the formatting routine that writes every table and graph on a separate worksheet of an Excel® spreadsheet. When all tables and graphs are generated, ADePT instructs the output viewer—Microsoft® Excel®, Microsoft® Excel® Viewer or a compatible spreadsheet program—to open the spreadsheet.

41
Chapter 6
Chapter 6
Examining the report
When the analysis is complete, ADePT automatically opens the results as a spreadsheet in the spreadsheet program or viewer installed on your computer. The results are organized in multiple worksheets, as shown in this example:
• The Contents worksheet lists all the other worksheets, including titles for tables or graphs. Click a link in the contents list to open a work-sheet.
• The Notifications worksheet lists errors, warnings and notifications that ADePT identified during its analysis. This worksheet may be more useful than the Messages tab in the ADePT main window because the problems are organized here by dataset.
• The Table worksheets display tables generated by ADePT.
Tip: ADePT formats table data with a reasonable number of decimal places. Click in a cell to see the data with full resolution in the formula bar.
• The Figure worksheets display graphs generated by ADePT.

ADePT User’s Guide
42

43
Chapter 7
Chapter 7
Working with datasets
Additional dataset functions
Right-click in the Datasets tab of the ADePT main window to open this con-text menu:
Command Description
Add file... Opens the Open Dataset dialog so you can select and load a dataset into ADePT (same as clicking the Add... button).
Add web file... Opens the Add Web Dataset dialog so you can specify the URL for a web-based dataset.
Remove file from list Removes selected file from the Datasets tab (same as clicking the Remove button).
Open containing folder... Opens the folder containing the currently selected dataset.

ADePT User’s Guide
44
Viewing basic information about a dataset’s variables
In the Datasets tab, click the dataset you want to examine.
1. Click the Variables tab.
Note: Variable labels (in the right column) are read from the dataset file. If variable labels are missing, refer to the codebook accompanying the dataset, or contact the data provider.
Tip: The Variables tab displays the label of the dataset contain-ing the listed variables.
• To search for a variable: In the Search field (below the table), type a few characters of the variable name or variable label.
• To view statistics for a variable: Right-click in the variable’s row, then click Display statistics for variable [variable name] in the pop-up menu.
Chapter 7: Working with datasets
45
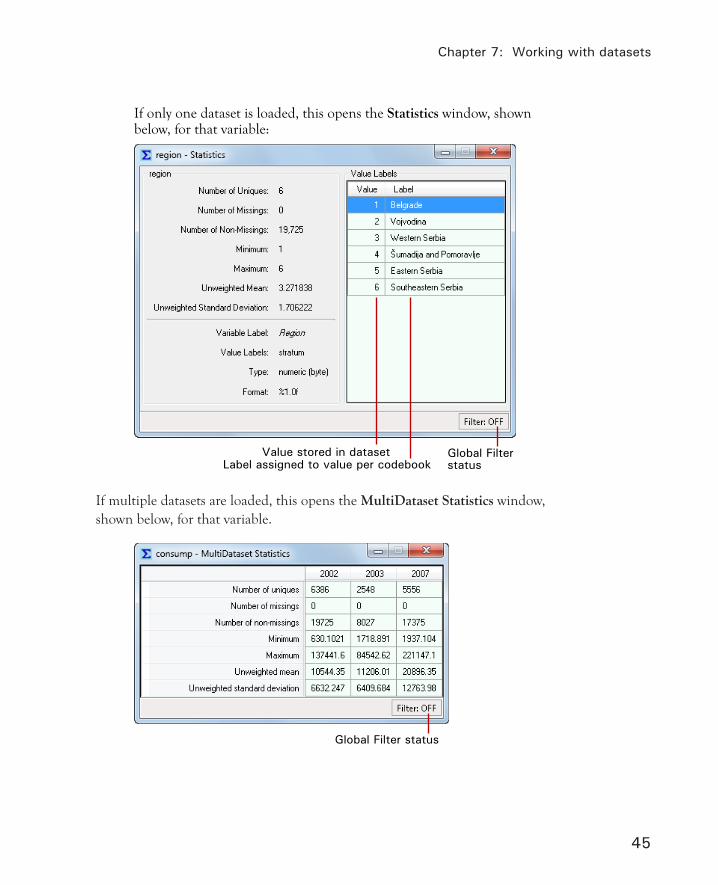
If only one dataset is loaded, this opens the Statistics window, shown below, for that variable:
Value stored in datasetLabel assigned to value per codebook
Global Filter status
If multiple datasets are loaded, this opens the MultiDataset Statistics window, shown below, for that variable.
Global Filter status
ADePT User’s Guide
46
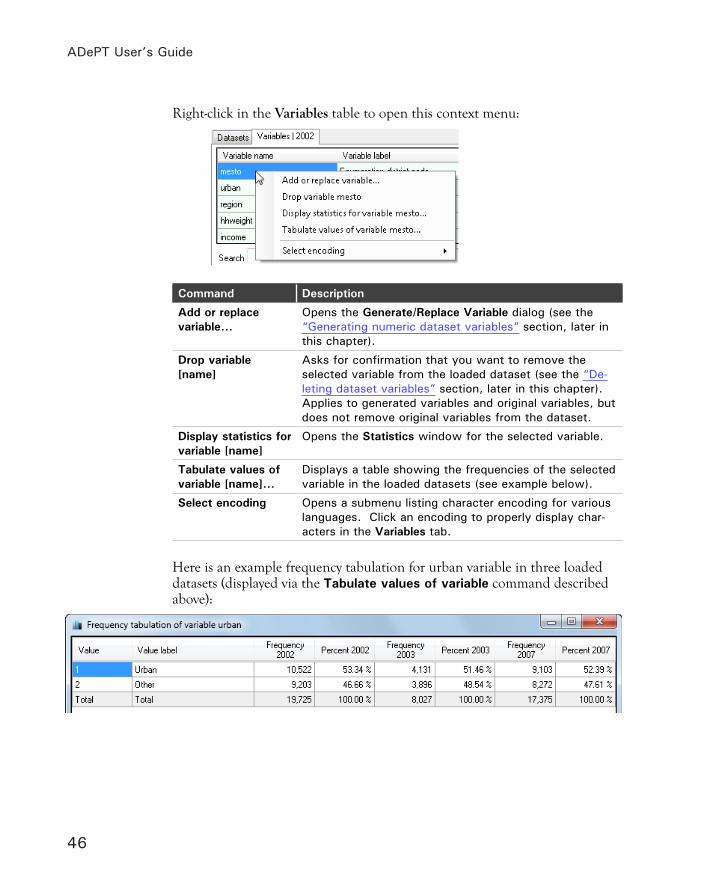
Right-click in the Variables table to open this context menu:
Command Description
Add or replace variable...
Opens the Generate/Replace Variable dialog (see the “Generating numeric dataset variables” section, later in this chapter).
Drop variable [name]
Asks for confirmation that you want to remove the selected variable from the loaded dataset (see the “De-leting dataset variables” section, later in this chapter). Applies to generated variables and original variables, but does not remove original variables from the dataset.
Display statistics for variable [name]
Opens the Statistics window for the selected variable.
Tabulate values of variable [name]...
Displays a table showing the frequencies of the selected variable in the loaded datasets (see example below).
Select encoding Opens a submenu listing character encoding for various languages. Click an encoding to properly display char-acters in the Variables tab.
Here is an example frequency tabulation for urban variable in three loaded datasets (displayed via the Tabulate values of variable command described above):

Chapter 7: Working with datasets
47
Viewing a dataset’s data and variable details
1. In the Datasets tab of the ADePT main window, click the dataset you want to examine.
2. Click the Browse... button. This opens the ADePT Data Browser.
Data View tab
The Data Browser’s Data View tab (shown above) lists observations in rows, and lists variables in columns.
• To navigate to a specific row: Enter the row number in the tool bar (in the field indicated below), then press ENTER.

ADePT User’s Guide
48
• To see underlying data for one data point: Click the cell containing the data point. The underlying data is displayed in the field above the table, as shown in this example:
• To see all underlying data: Click the Hide Value Labels button .
• To see value labels: Click the Show Value Labels button .
• To view a variable’s statistics:
a. Click in the variable’s column.
b. Click the Show Statistics... button .
Note: Statistics shown in the Data Browser are for the dataset open in the Data Browser, even if multiple datasets are loaded.
• To view a variable’s frequency tabulation: Select the variable, then click the Tabulate variable... button . Here is an example frequency tabulation:
• To filter the dataset: Enter an expression in the filter field, as shown below, then click the Filter button .
Note: Applying a filter in the Data Browser does not affect calculations. This filter only reduces the number of observations visible in the Browser to make it easier to examine the dataset. If you would like this filter expression to apply to calculations, copy it and paste it as a Global Filter expression (Global Filtering is described in chapter 8, "Working with input variables").

Chapter 7: Working with datasets
49
Tip: The status bar in the Data Browser and Statistics windows indicates whether the filter is on or off.
• To remove the dataset filter: Click the Filter button .
Right-click in the table to open this context menu:
Command Description
Copy Copies the contents of the selected cell(s) to the clip-board.
Hide Hides the column containing the selected variable. (Un-hide columns in the Data Browser’s Variable View tab.)
Statistics... Opens the Statistics window for the selected variable.
Tabulate variable... Displays a table showing the frequencies of the selected variable in the dataset displayed in the Data Browser.
Encoding Opens a submenu listing character encoding for various languages. Click an encoding to properly display char-acters in the Variables tab.

ADePT User’s Guide
50
Variable View tab
The Data Browser’s Variable View tab, shown below, lists detailed infor-mation about the dataset’s variables. Maximize the window or scroll to see additional columns.
• To hide or show variable columns in the Data View tab: In the Variable View tab, click the checkbox next to the variable name.

Chapter 7: Working with datasets
51
Right-click in the table to open this context menu:
Command Description
Copy Copies the contents of the selected cell(s) to the clipboard.
Hide Hides the column containing the selected variable in the Data Browser’s Data View tab.
Statistics... Opens the Statistics window for the selected variable.
Encoding Opens a submenu listing character encoding for various lan-guages. Click an encoding to properly display characters in the Variables tab.
Generating numeric dataset variables
You can create new numeric variables that are based on variables present in a dataset. This might be useful for simulating the effect of parameter changes on various economic outcomes. For example, in the Poverty module you can model the impact of income transfers on some population groups on the basis of poverty and inequality.
1. In the Datasets tab in the main window, click the dataset that you want to modify
2. Click the Variables | [dataset label] tab.
3. Right-click in the table, then click Add or replace variable... in the pop-up menu.

ADePT User’s Guide
52
4. In the Generate/Replace Variable dialog:
a. In the Expression field, define the new variable using the following syntax:
<new_variable_name> = <expression> [if <filter_expression>]
where
<new_variable_name> is a unique name not already in the dataset(s).
<expression> calculates new data for the variable.
<filter_expression> (optional)filtersobservationsthattakeaccountinthecalculation.
(See later in this chapter, for more information about expressions.)
b. Optional: Activate the Apply to all datasets option.
Note: If you loaded multiple datasets, but do not generate the new variable for all datasets, you will not be able to use the new variable in calculations. However, you may want to generate a new variable differently for each dataset in the project.
c. Click the Generate button.
5. In the Information dialog, click the OK button.
The new variable will be listed in the Variables | [dataset label] tab, and in the Data Browser. If the variable was generated for all loaded datasets, it will appear in the drop-down lists in the input Variables tab.
When you save a project, variable expressions are saved with the project, and the variables are regenerated when you open that project. Generating new variables does not change original datasets.

Chapter 7: Working with datasets
53
Replacing numeric dataset variables
You can replace an existing numeric variable by following the instructions in “Generating numeric dataset variables” (the previous section in this chapter), but in the Generate/Replace Variable dialog (step 4a), specify an existing vari-able name instead of a new variable name.
As with generated variables, these expressions are saved with a project and the variables are regenerated when you open the project. Replacing variables does not change original datasets.
Expressions for generating and replacing variables
The following operators can be used in expressions:
Operator Description+ – * /abs sign
basic mathematical operators
= == equality check operators^ pow sqrt exponent (e.g., x^2 is x squared), power
(e.g., pow(4,2) is 42 = 16) and square rootround truncate shortening operatorsmin maxceiling floor
range operators
exp log log10 exponential and log operators. indicates a missing value
ADePT User’s Guide
54
Variable expressions can include constants, and strings can be used for vari-ables that are of type string.
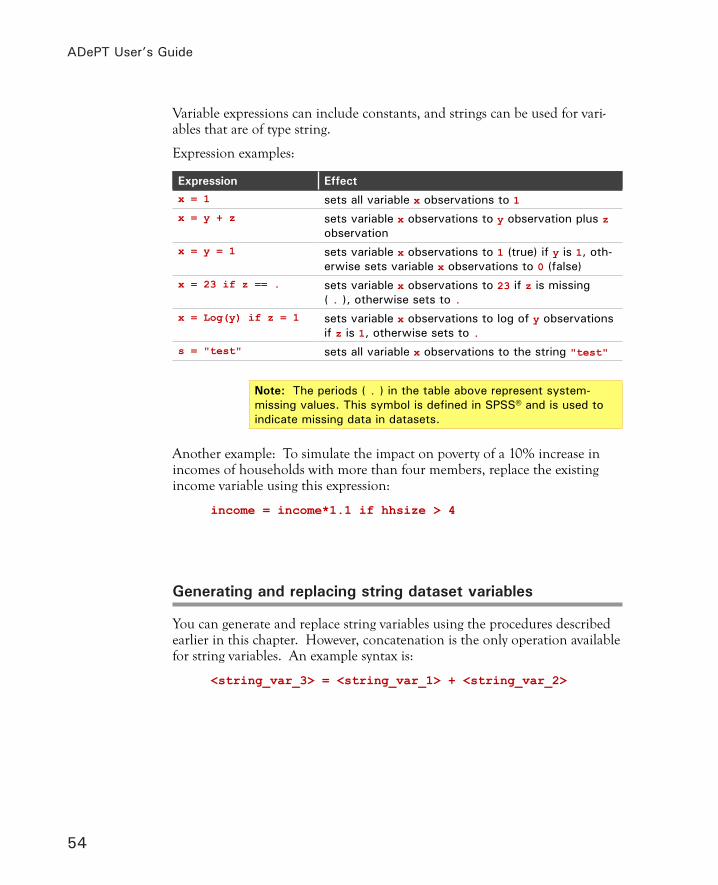
Expression examples:
Expression Effectx = 1 sets all variable x observations to 1x = y + z sets variable x observations to y observation plus z
observationx = y = 1 sets variable x observations to 1 (true) if y is 1, oth-
erwise sets variable x observations to 0 (false)x = 23 if z == . sets variable x observations to 23 if z is missing
( . ), otherwise sets to .x = Log(y) if z = 1 sets variable x observations to log of y observations
if z is 1, otherwise sets to .s = "test" sets all variable x observations to the string "test"
Note: The periods ( . ) in the table above represent system-missing values. This symbol is defined in SPSS® and is used to indicate missing data in datasets.
Another example: To simulate the impact on poverty of a 10% increase in incomes of households with more than four members, replace the existing income variable using this expression:
income = income*1.1 if hhsize > 4
Generating and replacing string dataset variables
You can generate and replace string variables using the procedures described earlier in this chapter. However, concatenation is the only operation available for string variables. An example syntax is:
<string_var_3> = <string_var_1> + <string_var_2>
Chapter 7: Working with datasets
55
Deleting dataset variables
You can remove variables from the working copy of a dataset that ADePT uses for its calculations. This operation does not change the original dataset. Na-tive variables, as well as generated and replaced variables, can be deleted.
1. In the dataset Variables tab, right-click in the row containing the vari-able you want to delete, then click Drop Variable [variable name] in the pop-up menu.
2. In the Confirmation dialog, click the Yes button.

ADePT User’s Guide
56

57
Chapter 8
Chapter 8
Working with input variables
Variable types
ADePT works with several kinds of variables:
• Continuous variables. In ADePT, a variable is considered to be con-tinuous if it has more than 50 distinct numeric values. An example is the Welfare aggregate field in the Poverty module.
• Categorical variables. A categorical variable in ADePT is a numerical or string variable containing fewer than 50 distinct integer values. If a string variable is entered in such a field, ADePT generates a numeri-cal variable with categories corresponding to the distinct values of the string variable. An example is the Sector of employment field in the Labor module.
• Dummy variables. A dummy variable in ADePT is a variable with only two distinct values. Fields requiring dummy variables accept a numeri-cal dummy variable or a logical expression based on an existing variable in the dataset (see “Using transformations in input variable fields,” later in this chapter). An example is the Gender field in Poverty or Labor modules.
• User-defined variables. You can create and replace dataset variables. See, for example, “Generating numeric dataset variables” in chapter 7, “Working with datasets.”
ADePT User’s Guide
58
Besides standard data fields for input variables, ADePT provides these kinds of fields and controls to configure a project:
• Grids enable you to provide additional information for an input vari-able. They contain several controls to define multiple characteristics of a variable. Grids are used, for example, in the Programs tab of the Social Protection module, and in the Missing Values tab (see “Input variable grids,” later in this chapter).
• Other input types are used to set scalar parameters. Check boxes specify binary options (for example, whether missing values should be recoded according to user-specified rules). Spin-edits allow entering numerical parameters, such as Duration of primary schooling in the Education module. (See chapter 9, “Setting parameters.”)
Mapping multiple dataset variables to an input variable
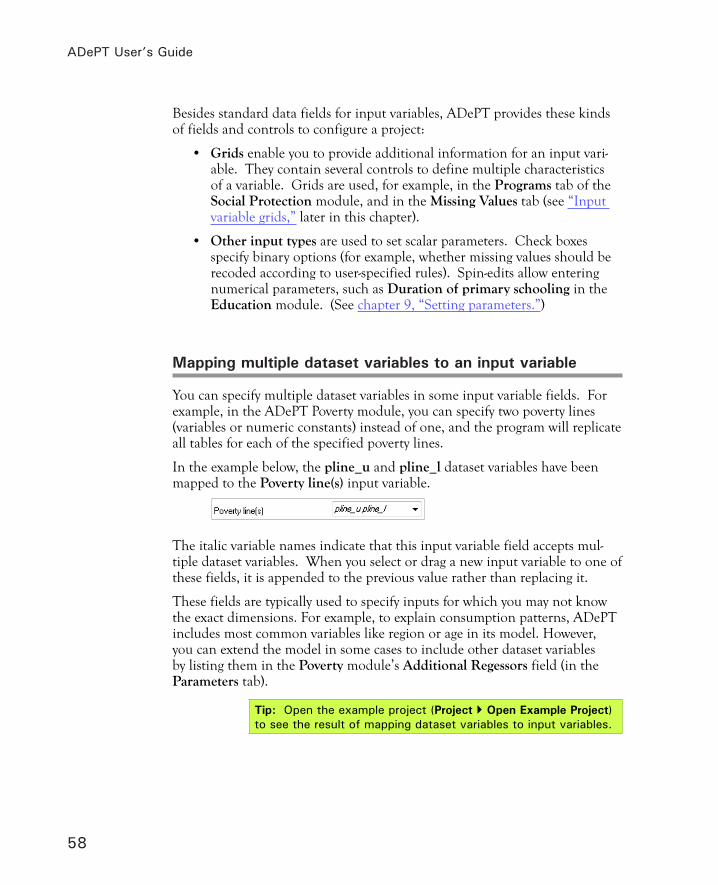
You can specify multiple dataset variables in some input variable fields. For example, in the ADePT Poverty module, you can specify two poverty lines (variables or numeric constants) instead of one, and the program will replicate all tables for each of the specified poverty lines.
In the example below, the pline_u and pline_l dataset variables have been mapped to the Poverty line(s) input variable.
The italic variable names indicate that this input variable field accepts mul-tiple dataset variables. When you select or drag a new input variable to one of these fields, it is appended to the previous value rather than replacing it.
These fields are typically used to specify inputs for which you may not know the exact dimensions. For example, to explain consumption patterns, ADePT includes most common variables like region or age in its model. However, you can extend the model in some cases to include other dataset variables by listing them in the Poverty module’s Additional Regessors field (in the Parameters tab).
Tip: Open the example project (Project Open Example Project) to see the result of mapping dataset variables to input variables.

Chapter 8: Working with input variables
59
Adding a custom category
Several modules allow you to define a custom category (or multiple custom categories in some modules). The custom category fields are in the input variable tabs, in locations that vary by module. In the Poverty module, for example, the custom category fields are in the Variables tab:
• To define a custom category:
a. Replace “Custom category” (first arrow above) with your category name.
b. Assign a variable by selecting it from the list (second arrow above) or dragging it from the dataset Variables tab.
Input variable processing precedence
Input variable processing takes place in the following order:
1. Apply Global Filter.
2. Recode missing values.
3. Calculate transformations.
The remaining sections in this chapter explain how to use these operations.

ADePT User’s Guide
60
Global Filter
The Global Filter limits the analysis to those observations satisfying certain re-quirements. Its effect propagates to all tables and graphs in the active module and it has the highest priority in ADePT calculations. Observations excluded by the Global Filter are not included in any subsequent processing step.
• To display and activate the Global Filter:
a. Tools Show filter tab.
b. In the Filter tab (shown below), activate the Keep observations satisfying the following condition option.
c. Fill in the filter expression.
You can specify any valid Stata® logical expression in the filter field (see “Us-ing transformations in input variable fields” later in this chapter). When an expression for the Global Filter is specified, ADePT keeps only the observa-tions that satisfy this condition. Note that because the Global Filter is applied at an early stage of data processing, using the Global Filter will result in faster calculations compared to applying an if-condition to all tables or graphs (if-conditions are described in the “Filtering for individual tables and graphs” section in Chapter 10).
Example: To generate tables and graphs for respondents under 40 years of age in a particular region of the country, enter age<40 & region=11 in the Global Filter field. ADePT will drop all observations where region is not equal to 11 and age is greater than 40, and will generate tables and graphs only for observations that satisfy the specified conditions.
Tip: The report’s Notifications page states the number of obser-vations excluded from each dataset.
Note: See “Combining the Global Filter and if-conditions” in Chapter 10 for precautions when using these features together.
Chapter 8: Working with input variables
61
Input variable grids
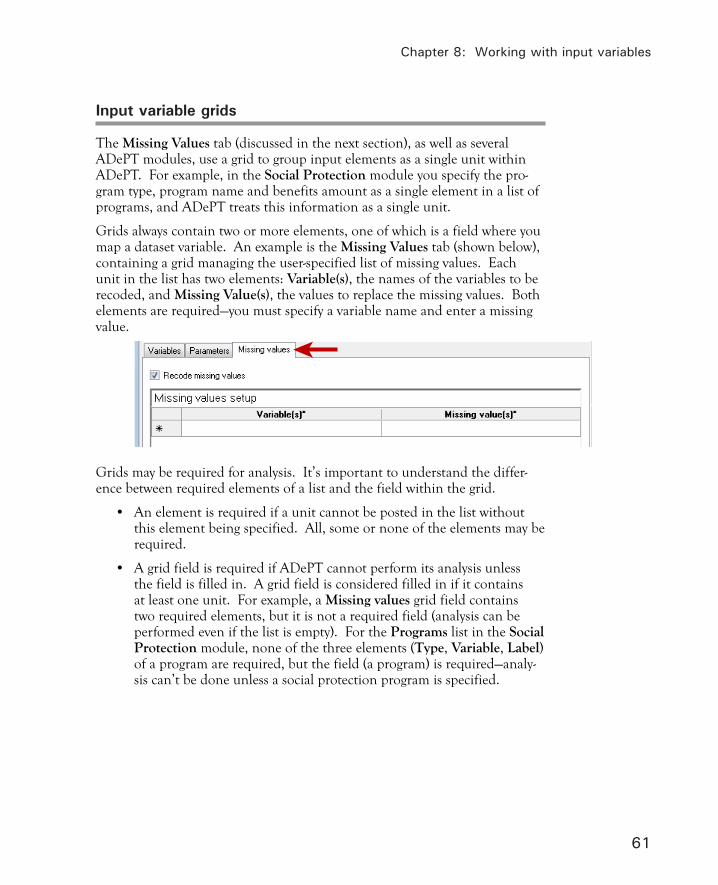
The Missing Values tab (discussed in the next section), as well as several ADePT modules, use a grid to group input elements as a single unit within ADePT. For example, in the Social Protection module you specify the pro-gram type, program name and benefits amount as a single element in a list of programs, and ADePT treats this information as a single unit.
Grids always contain two or more elements, one of which is a field where you map a dataset variable. An example is the Missing Values tab (shown below), containing a grid managing the user-specified list of missing values. Each unit in the list has two elements: Variable(s), the names of the variables to be recoded, and Missing Value(s), the values to replace the missing values. Both elements are required—you must specify a variable name and enter a missing value.
Grids may be required for analysis. It’s important to understand the differ-ence between required elements of a list and the field within the grid.
• An element is required if a unit cannot be posted in the list without this element being specified. All, some or none of the elements may be required.
• A grid field is required if ADePT cannot perform its analysis unless the field is filled in. A grid field is considered filled in if it contains at least one unit. For example, a Missing values grid field contains two required elements, but it is not a required field (analysis can be performed even if the list is empty). For the Programs list in the Social Protection module, none of the three elements (Type, Variable, Label) of a program are required, but the field (a program) is required—analy-sis can’t be done unless a social protection program is specified.

ADePT User’s Guide
62
Defining missing values
ADePT deals with missing values in the second phase of its input variable processing. ADePT does not remove an observation from the sample if any of the variables being used has a missing value in it. Instead, ADePT reacts to missing values intelligently, ignoring the observations with missing values if the missing values are involved in the analysis for a particular table or graph.
Missing values in Stata® and SPSS® datasets are assigned particular codes that ADePT can identify (see, for example, “DHS Guide to Statistics,” page 10, at http://www.measuredhs.com). However, not all data providers use these codes. For various reasons some datasets contain values 9, 97, 98, 99, 997, etc., performing the functions of the missing value code (one variable may use multiple such codes for “refusal,” “don’t know,” “not applicable,” etc.). If this is the case, it is crucial that you tell ADePT about such codes to ensure that they are recoded to missing values before any analysis is under-taken.
ADePT accepts information about missing values as a list of element pairs: variable(s) and missing value code(s). A particular variable can appear in multiple lists of variables and a particular value can appear in multiple lists of missing values. Missing value pairs are entered in a grid (discussed in the previous section).
The information you define for missing values is saved in the project file and will be loaded when the project file is opened. If definitions of missing values were stored in a project file, the Missing Values tab will be shown automati-cally when the project file is loaded.
• To define missing values:
a. Tools Show missing values tab.
The Missing values tab contains the (initially empty) grid of vari-able/value pairs.
b. Activate the Recode missing values option.
c. Click in the first empty row of the Variable(s) column. Open the drop-down list for this cell and click one or more variable names.
Chapter 8: Working with input variables
63
d. Enter one or more values in the corresponding cell in the Missing Value(s) column. Separate values with spaces.
e. As needed, repeat steps c and d for other variables and values.
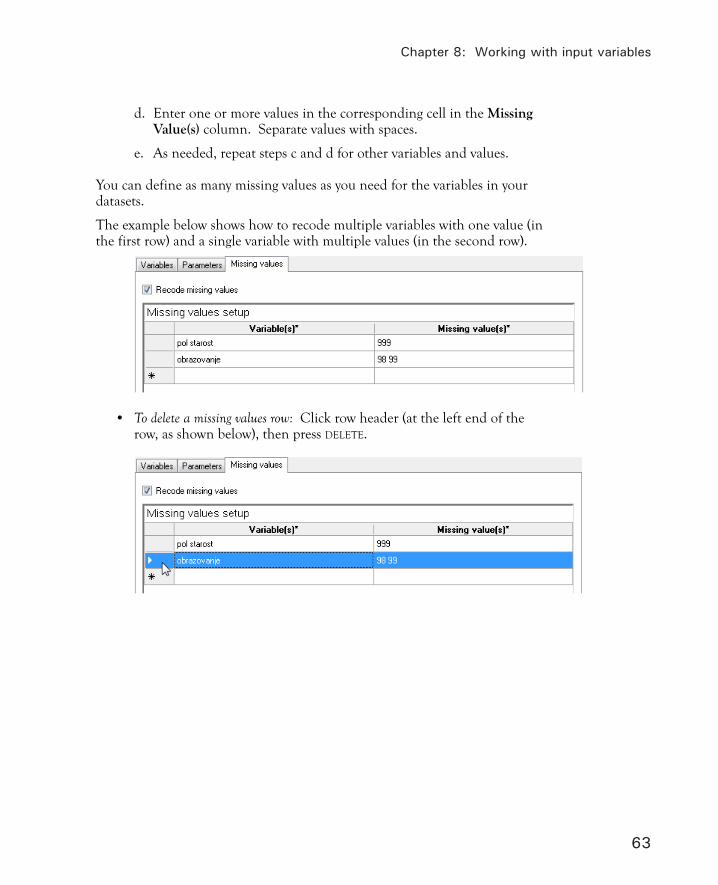
You can define as many missing values as you need for the variables in your datasets.
The example below shows how to recode multiple variables with one value (in the first row) and a single variable with multiple values (in the second row).
• To delete a missing values row: Click row header (at the left end of the row, as shown below), then press DELETE.

ADePT User’s Guide
64
Using transformations in input variable fields
Some variables (e.g., urban and gender) are treated in ADePT as dummy variables and thus must have only two values (if a variable is used). Internally, ADePT assigns specific meaning to particular values of these variables. For example, 1 denotes urban population in the urban variable. However, these variables might be coded differently in your datasets. If this is the case, you can:
• Generate or replace variables (as described in Chapter 7) in the dataset(s) to match ADePT’s expectations (reported as notifications by each module) so that, for example, 1=male, 1=urban and 1=household head, or
• Specify a transformation—instead of a dataset variable name—in an input variable field. In the final phase of its input variable processing, ADePT will evaluate the transformation and use the result as a corre-sponding indicator.
Transformations in input variables are useful when a variable doesn’t exist in the dataset exactly in the way that ADePT expects it, but can be derived from the existing variables. This only applies to dummy variables (because the result of transformation evaluation is binary by its nature), and to categori-cal variables to the extent that a categorical variable is a generalization of a dummy variable.
Consider this example. In the original dataset, variable urban takes values 1 for rural and 2 for urban population. Because there are several datasets (each corresponding to a different year), it may be cumbersome to recode this variable into the format that ADePT expects. It might be easier to specify an input variable transformation like this:
urban==2
ADePT uses this transformation to generate a new variable in each dataset. The variable will take the value 1 whenever urban is equal to 2. For all other values (in this case, 1s), this new variable will take a value of 0. Missing values of urban will remain missing. Here is how this example transformation ap-pears in the input Variables tab:
Chapter 8: Working with input variables
65
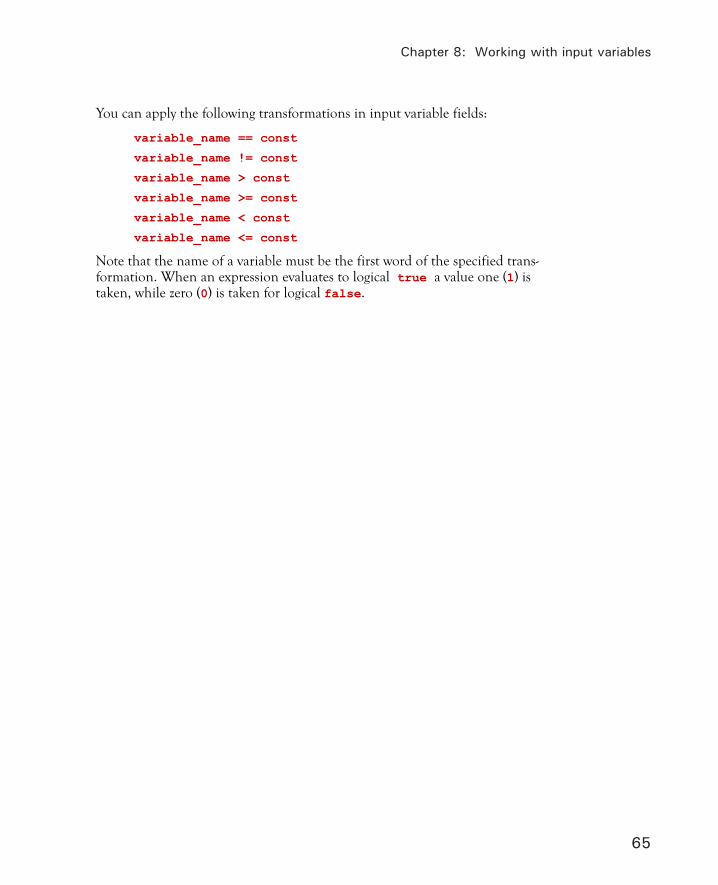
You can apply the following transformations in input variable fields:
variable_name == const
variable_name != const
variable_name > const
variable_name >= const
variable_name < const
variable_name <= const
Note that the name of a variable must be the first word of the specified trans-formation. When an expression evaluates to logical true a value one (1) is taken, while zero (0) is taken for logical false.

ADePT User’s Guide
66
67
Chapter 9
Chapter 9
Setting parameters
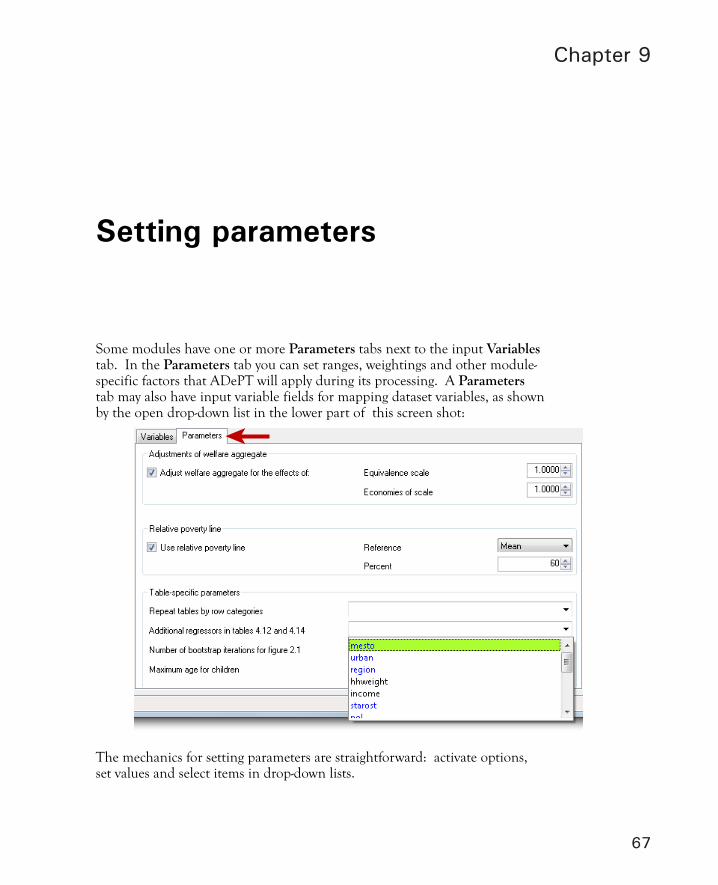
Some modules have one or more Parameters tabs next to the input Variables tab. In the Parameters tab you can set ranges, weightings and other module-specific factors that ADePT will apply during its processing. A Parameters tab may also have input variable fields for mapping dataset variables, as shown by the open drop-down list in the lower part of this screen shot:
The mechanics for setting parameters are straightforward: activate options, set values and select items in drop-down lists.
ADePT User’s Guide
68
The analytical reasons for setting parameters are beyond the scope of this manual. More information is available:
• Module specific instructions and example data files can be downloaded from the Documentation page in the ADePT Web site, http//:www.worldbank.org/adept.
• Streamlined Analysis with ADePT Software is a series of books that provide theoretical foundations and practical guidelines for applied analysis in various areas of economic research. Books in the series can be down-loaded in PDF format, or purchased in paperback form. Details are in the Book Series page in the ADePT Web site.
Describing complex survey design in ADePT
ADePT can account for a complex survey design when it calculates standard errors for the estimates. In particular, you can specify multiple stratification designs, finite population corrections, survey weights and options for comput-ing the standard errors of the estimates.
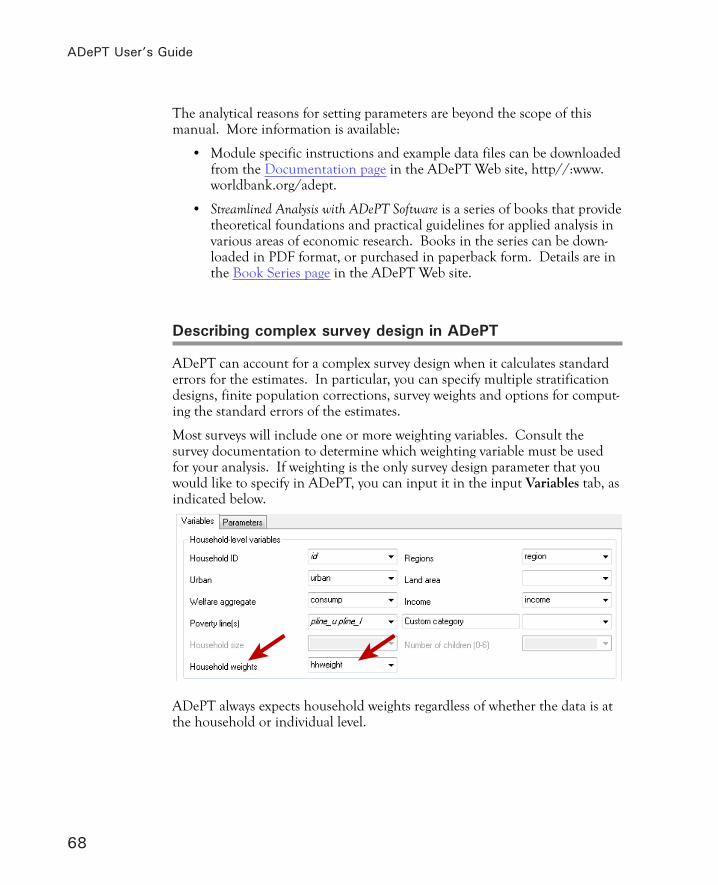
Most surveys will include one or more weighting variables. Consult the survey documentation to determine which weighting variable must be used for your analysis. If weighting is the only survey design parameter that you would like to specify in ADePT, you can input it in the input Variables tab, as indicated below.
ADePT always expects household weights regardless of whether the data is at the household or individual level.
Chapter 9: Setting parameters
69
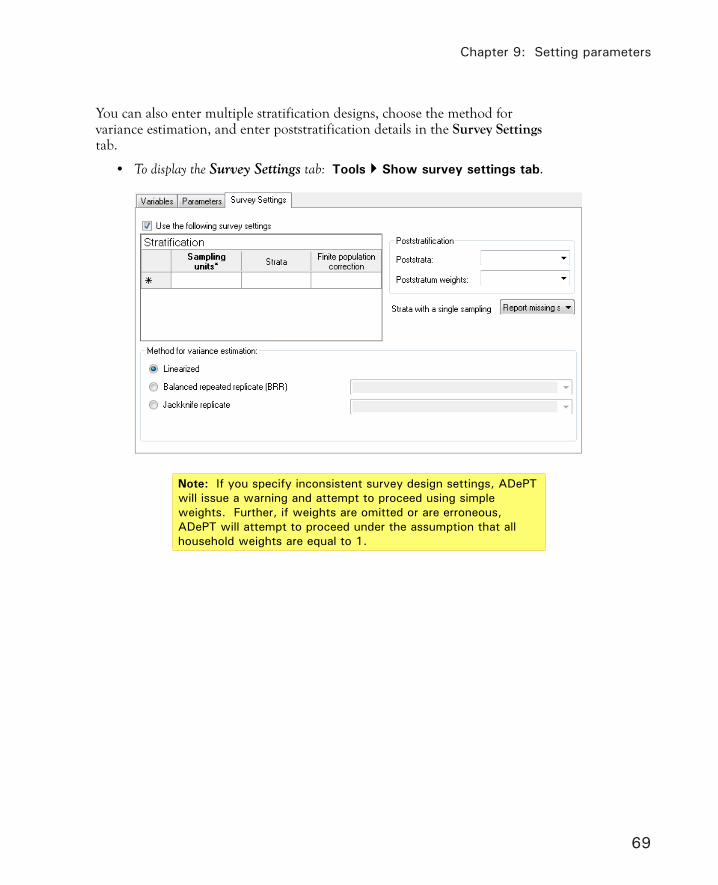
You can also enter multiple stratification designs, choose the method for variance estimation, and enter poststratification details in the Survey Settings tab.
• To display the Survey Settings tab: Tools Show survey settings tab.
Note: If you specify inconsistent survey design settings, ADePT will issue a warning and attempt to proceed using simple weights. Further, if weights are omitted or are erroneous, ADePT will attempt to proceed under the assumption that all household weights are equal to 1.

ADePT User’s Guide
70
71
Chapter 10
Chapter 10
Feasible versus infeasible outputs
Each table or graph in ADePT requires particular variables to be specified and some options to be specified. For example, Table 4.15 in the Poverty module requires age, welfare aggregate and poverty line. If any of these variables is not specified, the table is infeasible and it cannot be created.
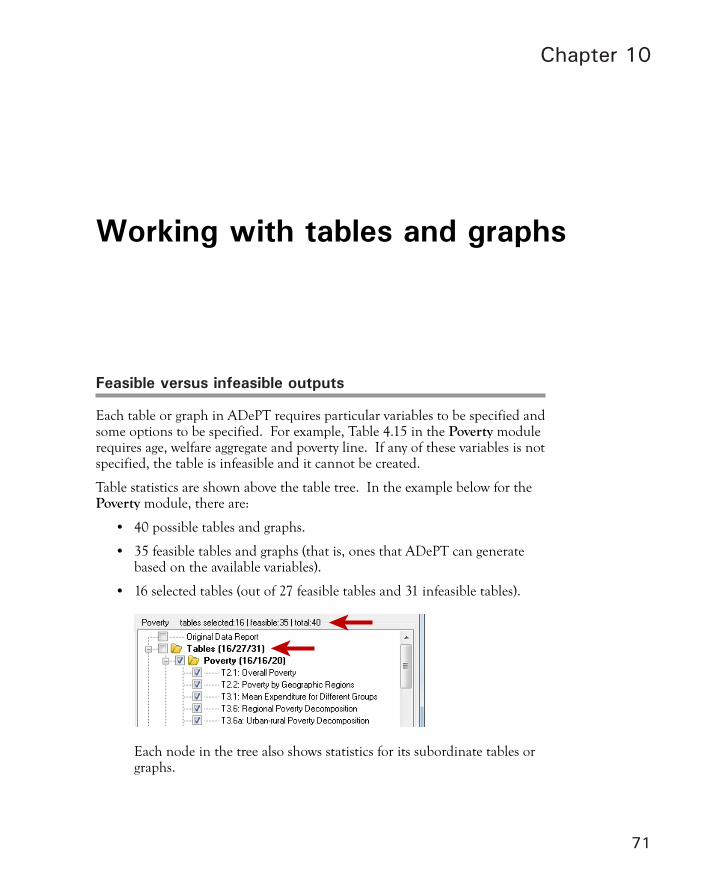
Table statistics are shown above the table tree. In the example below for the Poverty module, there are:
• 40 possible tables and graphs.
• 35 feasible tables and graphs (that is, ones that ADePT can generate based on the available variables).
• 16 selected tables (out of 27 feasible tables and 31 infeasible tables).
Each node in the tree also shows statistics for its subordinate tables or graphs.
Working with tables and graphs

ADePT User’s Guide
72
As shown below, feasible tables are displayed in black, while infeasible tables are inactive and cannot be selected.
Infeasible tables
Including original data
• To include a summary of original datasets in the report: Select Original Data Report at the top of the list of tables.
Here is an example original data table:
Chapter 10: Working with tables and graphs
73
Filtering for individual tables and graphs
While the Global Filter affects all tables and graphs, individual tables and graphs may have their own specific restrictions on observations that are included in the analysis. The individual conditions do not replace, but rather augment, the Global Filter so that only observations satisfying both the Global Filter and the individual if-condition are included in the analysis. Applying an if-condition to a group of tables (graphs) is equivalent to applying the same if-condition to all tables (graphs) in that group.
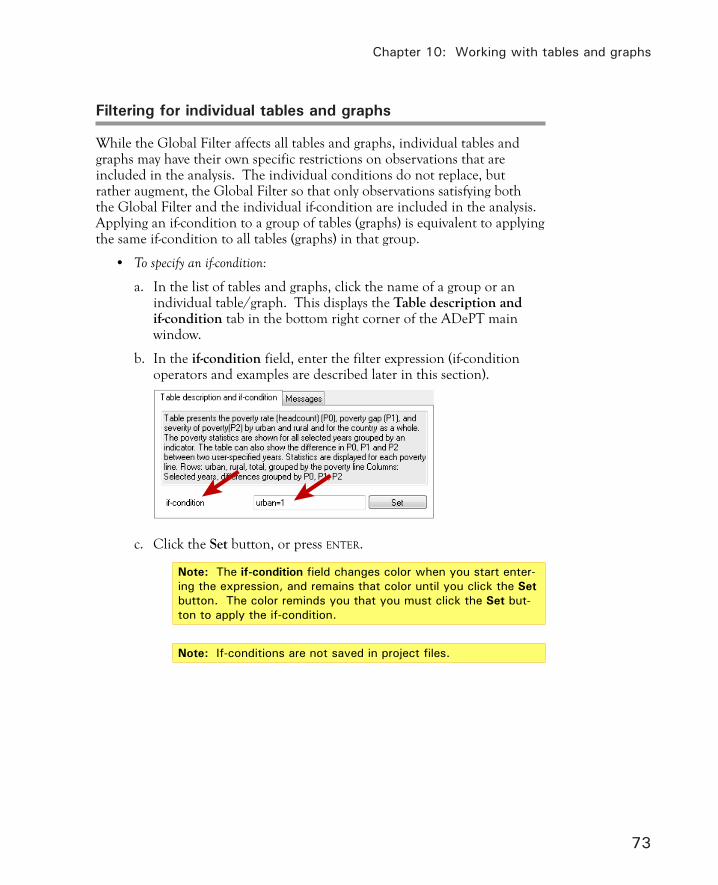
• To specify an if-condition:
a. In the list of tables and graphs, click the name of a group or an individual table/graph. This displays the Table description and if-condition tab in the bottom right corner of the ADePT main window.
b. In the if-condition field, enter the filter expression (if-condition operators and examples are described later in this section).
c. Click the Set button, or press ENTER.
Note: The if-condition field changes color when you start enter-ing the expression, and remains that color until you click the Set button. The color reminds you that you must click the Set but-ton to apply the if-condition.
Note: If-conditions are not saved in project files.

ADePT User’s Guide
74
Tables and graphs that have an if-condition applied to them are highlighted, as shown in this example:
• To remove an if-condition:
a. Click the item in the tables and graphs list.
b. Select the text in the if-condition field.
c. Press DELETE or BACKSPACE. or Right-click, then click Delete in the pop-up menu.
d. Click the Set button.
The purpose of if-conditions is to include observations from a particular sub-group of a population in the analysis. The inclusion condition is formulated as a Boolean expression—a function of the variables existing in the dataset.
If-condition operators include the following:
Operator Description= equal== equal>= greater than or equal<= less than or equal!= not equal& logical AND| logical ORinlist(<variable>,n1,n2,n3,...) include only observations for which
<variable> has values n1, n2, n3, ...inrange(<variable>,n1,n2) include observations for which <vari-
able> is between n1 and n2!missing(<variable>) exclude observations with missing
values in <variable>

Chapter 10: Working with tables and graphs
75
Each particular observation is included in the analysis if it satisfies the inclu-sion condition (the Boolean expression evaluates to value true). In many cas-es, the conditions we use are quite simple. Consider the following examples:
If-condition Interpretationurban=1 Only those observations having the value of variable urban
equal to one will be included in the analysis.region==5 Only observations from the region with code 5 are included
in the analysis.age_yrs>=16 Only those individuals who are 16 years old or older are
included in the analysis.sland!=0 Exclude from analysis those individuals who are not landown-
ers (given that the variable sland denotes the area of the land owned).
Stata® users will note that there is no need to write the word if before if-conditions and that == can be used interchangeably with = .
You can specify narrower groups by restricting several dimensions simultane-ously, as in the following examples:
If-condition Interpretation(urban=1) & (region!=1) Include observations from all urban loca-
tions, exclude the first region (for example, the country capital).
(sland>0) | (rland>0) Include individuals who own or rent land.(edu_yrs>8)|(prof_edu==1) Include skilled individuals only, defining a
skilled person as one who has more than 8 years of education or has received profes-sional education.
Note that in these expressions we use symbols & and | to denote logical AND and logical OR operations. In order for A&B to be true, both A and B must be true. In order for A|B to be true, either A or B must be true.

ADePT User’s Guide
76
Finally, you can specify any of the functions available in Stata® in if-condi-tions. For example:
If-condition Interpretationinlist(region,1,3,5,6) Include only observations from regions
with codes 1, 3, 5, and 6.inrange(age, 15, 65) Include individuals aged between 15
and 65.((male==1)&inrange(age,15,65))|(male==0)&inrange(age, 15, 60))
Include only individuals of working age, which is defined differently for men and women.
!missing(sector) Exclude observations with missing val-ues in variable sector.
When you specify if-conditions, be aware that ADePT follows Stata®’s convention that missing values are considered to be infinitely large numbers. Hence the expression (age>65) evaluates to true not only when the age of the responders is greater than 65 years but also if the value of variable age is missing. Use parentheses to indicate the order of evaluation for complex expressions.
When if-conditions are evaluated, each observation is treated independently. This means, for example, that to exclude all households where the household head was born abroad, we must either be working on the household level (then person-specific characteristics refer to household heads) or we must have a variable place-of-birth-of-household-head defined for each individual in the dataset (and consistent within each household) instead of the place-of-birth variable. If the if-condition is based on the place-of-birth variable, this will not exclude the children living in the households with foreign-born house-hold heads.
You can use any valid Stata® expression to form if-conditions. If-conditions may include any variables from the datasets, not only those that ADePT has requested in the variables specification form. However, you must ensure the validity and consistency of these variables, as ADePT cannot conduct checks on them.
Global Filter or if-condition: Which should you use?
It may seem like the Global Filter and if-conditions are performing the same function in ADePT. They both focus the analysis on a subset of observations satisfying the specified selection criteria. There is, however, an important difference based on when the selection takes place in ADePT’s calculations. The Global Filter precedes data preparation (when some internal variables are created). If-conditions, on the other hand, are applied in the last analysis stage, just before a table or graph is produced.

Chapter 10: Working with tables and graphs
77
Here’s an example. Suppose you limit your sample to the group of individu-als living in a particular region, say, region with code 1. You want to compute poverty rates for that region’s urban, rural and total population based on the relative poverty line, taken as 100% of the median consumption.
If the Global Filter is configured with the condition region==1, ADePT will:
1. Select observations where variable region equals 1 (and ignore other observations).
2. Find the median of the consumption distribution for the selected observations, and designate it as the poverty line.
3. Use that poverty line for subsequent calculations.
4. Generate selected tables/graphs.
On the other hand, if region==1 is entered in a table’s if-condition field, ADePT will:
1. Find the median of the consumption distribution for all observations, and designate it as the poverty line.
2. Use that poverty line for subsequent calculations.
3. Select observations where variable region equals 1 (and ignore other observations).
4. Generate selected tables/graphs.
Since the two consumption distributions are different, the relative poverty lines derived from them are different. Compare these tables (based on an example dataset) generated using the two approaches:
• Table when the Global Filter is region==1:
• Table when the table’s if-condition is region==1:

ADePT User’s Guide
78
The results differ as expected. In the Global Filter case, the median is de-rived from the filtered distribution, so the relative poverty line is 50% (that is, 100% of the median). In the if-condition case, the median is derived from the entire distribution. After excluding other regions, the 42.4% poverty line implies that region 1 has a lower poverty rate than the distribution as a whole.
The differences described here are not always obvious, so use care when speci-fying Global Filters and if-conditions. This precaution applies not only to relative poverty lines (used in the above example), but also to other variables that ADePT produces internally. For example, many ADePT modules auto-matically calculate household size by counting observations identified by the same household identifier in the dataset. Using the Global Filter to exclude people with certain characteristics will thus affect the estimated household size, which in turn will affect per capita consumption.
There is no way to exclude an entire household if there is at least one house-hold member with a given characteristic in an individual level dataset. The Global Filter and if-conditions always work on the observation level, whether it is household, individual or other level.
Both the Global Filter and if-conditions are formulated in terms of the under-lying data (codes), not the visible value labels. In the example above, the con-dition used in both cases is region==1, where 1 is the code, despite labels being present in the dataset. The correspondence between codes and values for a particular variable are listed in the Statistics window for that variable (see “Viewing basic information about a dataset’s variables,” in chapter 7).
Keep in mind that the Global Filter reduces the number of observations, thus the results will be less precise. You must also consider the survey design, in particular to ensure that the data passing through the filter will be representa-tive of the overall survey.
You can specify an identical Global Filter and if-condition, but that would be redundant. The results will be the same as when only the Global Filter is specified, since the sample is already restricted by the Global Filter before the stage in which the if-condition is applied.
Combining the Global Filter and if-conditions
A combination of the Global Filter and individual if-conditions for tables may become too restrictive. You must make sure the conditions do not contradict each other and do not remove all the observations from the sample. For ex-ample, if the Global Filter selects only urban population and an if-condition applied to a particular table selects only rural population, then that table may not be constructed because there will not be a single observation that could satisfy both conditions simultaneously.
Chapter 10: Working with tables and graphs
79
While the contradiction may be obvious in that example, it may not be trans-parent in the population with complex dependencies between, say, the sector of employment, education level and other factors. If the effective condition (the combination of the Global Filter and the individual if-condition) is so restrictive that no observations satisfy it, the table (graph) will not be con-structed, an error message will be added to the list of messages, and the table (graph) will be highlighted in the selection tree.
Note: Even if some observations pass the Global Filter and the if-condition, there may be too few observations to make valid statistical inferences.
While it may look the same when a Global Filter is specified and an if-con-dition is applied to all tables (graphs), there are differences that sometimes become important. These differences occur because the Global Filter has the highest priority and is applied in the data preparation stage before the analysis begins. This has two consequences:
• The Global Filter can be used to remove from the analysis the obser-vations that cause problems with the data checks. Normally, if the problem is caused by a particular value of a certain variable, that value can be recoded to a missing value to exclude that outlier. However, in some cases an outlier would have all the individual variables in order, but a combination of their values would be impossible. For example, we may want to apply the Global Filter to remove all the respondents under age 5 if they report attending a school. If we apply this condi-tion, no warning will be issued, as these observations are completely excluded from the analysis before the checks are conducted. If the same condition was applied to a particular table, the warning that very young children are attending schools would be displayed, even though these observations would later be excluded from that table.
• The Global Filter might affect the values of the variables that ADePT derives from the data. Consider household size as an example. In an individual-level dataset, ADePT constructs a variable for the household size by counting the number of observations with a unique value of the household ID variable(s). If a Global Filter that selects only the working age population is applied, the variable that ADePT creates for the household size will count the number of working age individuals in a household, which could be different from the number of household members.
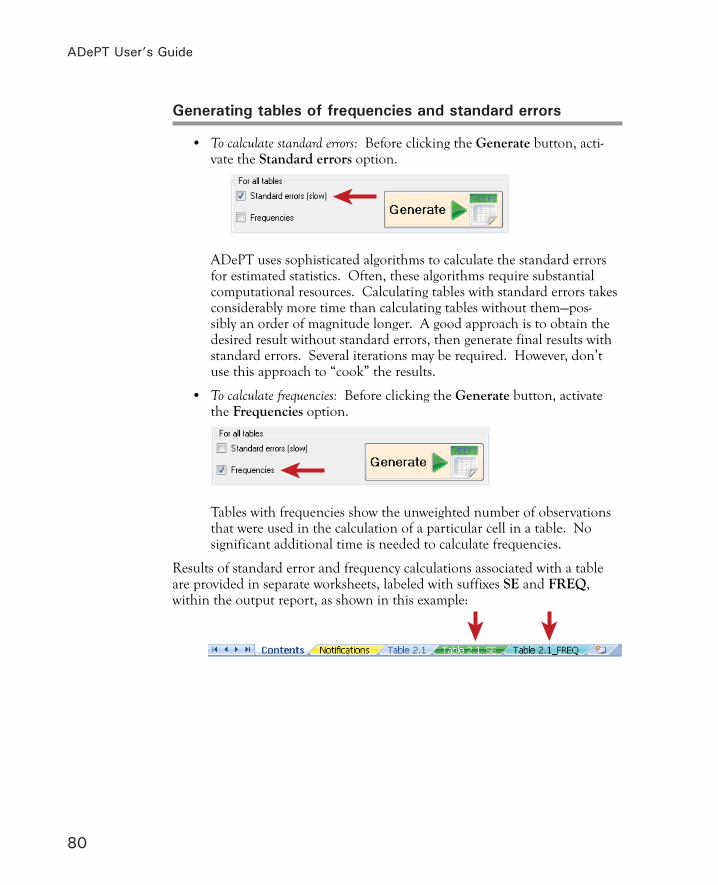
ADePT User’s Guide
80
Generating tables of frequencies and standard errors
• To calculate standard errors: Before clicking the Generate button, acti-vate the Standard errors option.
ADePT uses sophisticated algorithms to calculate the standard errors for estimated statistics. Often, these algorithms require substantial computational resources. Calculating tables with standard errors takes considerably more time than calculating tables without them—pos-sibly an order of magnitude longer. A good approach is to obtain the desired result without standard errors, then generate final results with standard errors. Several iterations may be required. However, don’t use this approach to “cook” the results.
• To calculate frequencies: Before clicking the Generate button, activate the Frequencies option.
Tables with frequencies show the unweighted number of observations that were used in the calculation of a particular cell in a table. No significant additional time is needed to calculate frequencies.
Results of standard error and frequency calculations associated with a table are provided in separate worksheets, labeled with suffixes SE and FREQ, within the output report, as shown in this example:
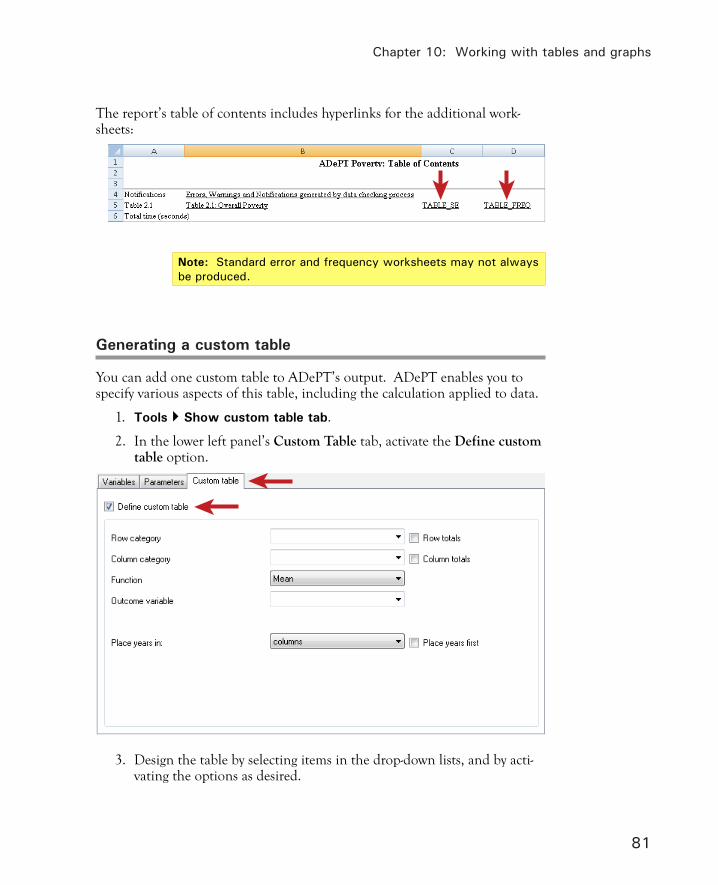
Chapter 10: Working with tables and graphs
81
The report’s table of contents includes hyperlinks for the additional work-sheets:
Note: Standard error and frequency worksheets may not always be produced.
Generating a custom table
You can add one custom table to ADePT’s output. ADePT enables you to specify various aspects of this table, including the calculation applied to data.
1. Tools Show custom table tab.
2. In the lower left panel’s Custom Table tab, activate the Define custom table option.
3. Design the table by selecting items in the drop-down lists, and by acti-vating the options as desired.
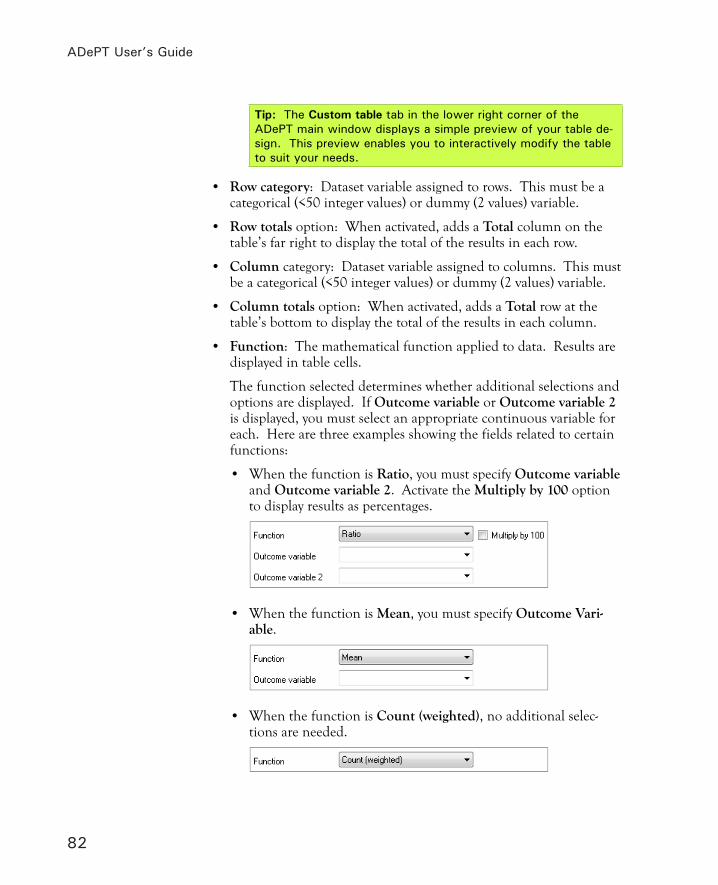
ADePT User’s Guide
82
Tip: The Custom table tab in the lower right corner of the ADePT main window displays a simple preview of your table de-sign. This preview enables you to interactively modify the table to suit your needs.
• Row category: Dataset variable assigned to rows. This must be a categorical (<50 integer values) or dummy (2 values) variable.
• Row totals option: When activated, adds a Total column on the table’s far right to display the total of the results in each row.
• Column category: Dataset variable assigned to columns. This must be a categorical (<50 integer values) or dummy (2 values) variable.
• Column totals option: When activated, adds a Total row at the table’s bottom to display the total of the results in each column.
• Function: The mathematical function applied to data. Results are displayed in table cells.
The function selected determines whether additional selections and options are displayed. If Outcome variable or Outcome variable 2 is displayed, you must select an appropriate continuous variable for each. Here are three examples showing the fields related to certain functions:
• When the function is Ratio, you must specify Outcome variable and Outcome variable 2. Activate the Multiply by 100 option to display results as percentages.
• When the function is Mean, you must specify Outcome Vari-able.
• When the function is Count (weighted), no additional selec-tions are needed.
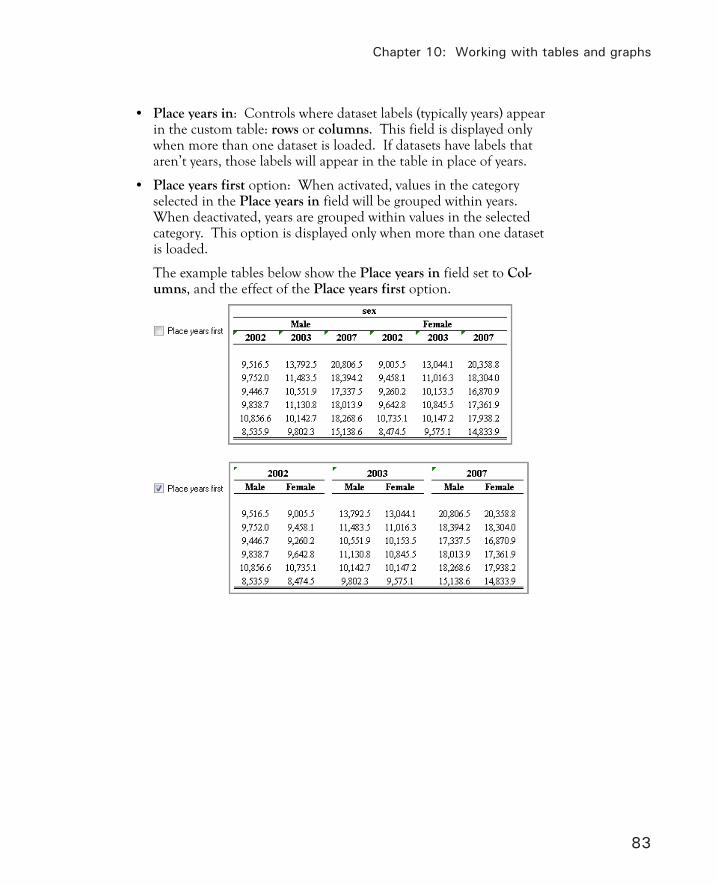
Chapter 10: Working with tables and graphs
83
• Place years in: Controls where dataset labels (typically years) appear in the custom table: rows or columns. This field is displayed only when more than one dataset is loaded. If datasets have labels that aren’t years, those labels will appear in the table in place of years.
• Place years first option: When activated, values in the category selected in the Place years in field will be grouped within years. When deactivated, years are grouped within values in the selected category. This option is displayed only when more than one dataset is loaded.
The example tables below show the Place years in field set to Col-umns, and the effect of the Place years first option.

ADePT User’s Guide
84
4. In the upper right (outputs) panel:
a. Scroll to find the Custom table item.
b. Select Custom table.
The custom table will be included in the report generated by ADePT.
Using the Table Browser
The Table Browser enables you to see how tables generated by ADePT will appear in a spreadsheet program.
Note: Numbers you see in the Table Browser are not from your datasets. They are only examples and should not be used to make any policy decisions.
• To preview table layouts:
a. Tools Table browser... . Read the warning, then click the OK button.
b. Open the tree in the left panel and select a table you want to preview. The preview appears in the right panel, and the table’s description is displayed below that.

Chapter 10: Working with tables and graphs
85
Tip: Maximize the Table Browser window to see more of the table layout.
• To zoom in or zoom out: Click the and buttons in the tool bar.
• To toggle between fit and 100%: Click the button.
• To search for a specific table/graph title or description: Enter a search term in the field at the bottom of the Table Browser (see arrow below), then click the Search button. The tree in the left panel will list matching tables/graphs. If the search term is in a description, it will be highlight-ed, as shown in the example below.

ADePT User’s Guide
86

87
Chapter 11
Chapter 11
Working with projects
A project is an ADePT configuration file that contains:
• Paths for datasets, and URLs for Web-based datasets.
• Dataset transformations: generated, replaced and dropped variables.
• Variable mappings.
• Global and dataset-specific filters.
• Missing variable definitions.
• Expressions used in the Global Filter.
Projects do not retain table and graph selections, corresponding if-conditions, and frequencies and standard errors choices, as these are related to analysis outputs.
Local projects
After specifying datasets, mapping variables and entering other analysis in-puts, you can save the configuration for future use.
• To save a project:
a. Project Save Project or Project Save As... .
b. In the Save As dialog, select a location and name for the project, then click the Save button.

ADePT User’s Guide
88
• To open a saved project:
a. Project Open Project... .
b. In the Open dialog, locate and select the project (projects have the .adept extension), then click the Open button.
• To start a new project: Project Reset. This clears all fields in the main window.
Web-based projects
If you are managing a web site of your own or for your organization, you can create ADePT web projects and make them available to other analysts. This can be done as part of your data dissemination strategy, or to enable other people to replicate you results.
• To create a Web-based project:
a. Be sure there are no legal barriers to making datasets available on the Web.
Depending on the country and type of data, special requirements must be met. These often include restrictions on respondents’ names, addresses, GPS coordinates and any other information that could be used to identify individual respondents. Remember that deleting variables in ADePT does not physically remove them from datasets, but only hides them. To be certain that all privacy require-ments are met, you may need to open datasets in a statistical pack-age and delete variables that cannot be freely distributed.
b. Upload your datasets to your Web site.
This is usually done by transferring the files using FTP or a content management system. Be sure the files are in a directory that can be accessed from the Internet by an HTTP request. The hosting system can usually provide guidance on which directories are acces-sible via HTTP. On Apache Web servers, for example, the default HTTP-accessible directory is public_html.
Note: The project must use only Web-accessible datasets, oth-erwise other users won’t be able to analyze them. Web-acces-sible datasets are listed in ADePT’s Datasets tab with their URLs (http://...) and not local disk paths (for example, C:\...).

Chapter 11: Working with projects
89
c. Create a new project in ADePT and…
i. Add the datasets that you just uploaded to the Web site to the project (see “To add a Web-based dataset” instructions below).
ii. Save the project on your local computer.
a. Upload the project file from your local computer to the Web site.
Provide the project’s URL to anyone you want to access your project (this URL may be different than the FTP address you used to upload the file). Other users can open the project from within ADePT as described here:
• To open a Web-based project:
a. Project Open Web Project... .
b. In the Open web project dialog, enter the project’s URL, then click the OK button.
• To add a Web-based dataset:
a. In the Datasets tab, SHIFT-click the Add... button. or Right-click in the Datasets tab, then click Add web file... in the pop-up menu.
b. In the Add Web Dataset dialog, enter the dataset’s URL. or If you previously copied the dataset’s URL to the clipboard, click the Paste from clipboard button .
c. Click the OK button.
Using a project file on a different computer
You can use saved project files on a different computer. ADePT projects contain absolute (not relative) paths to the data files. ADePT will try to load data files from the locations stored in the project file. If ADePT fails to find the data files on the paths specified in the project file, it will search for these files in the directory where the project file is located. Thus, if you want to use a project file in a situation where the locations of the data files are different from those saved in the project file, place the data files in the directory where the project file is located.

ADePT User’s Guide
90
Replicating results obtained with ADePT
To reproduce results you obtained with ADePT, give the following to the person replicating your work:
• The link to download ADePT: http://www.worldbank.org/adept. They will need to install ADePT.
• Project files with the input specifications used to generate your results.
• Datasets used to generate your results. (Datasets are not stored in proj-ect files. Only links to datasets on your computer are stored in project files.)
Note: Alternatively, if you have created a Web-based project (as described earlier in this chapter) you can give the user the URL for the project.
• A list of if-conditions and the tables and graphs they are applied to. (If-conditions are not saved in project files. The if-conditions for each table and graph are displayed below the tables/graphs in the corre-sponding worksheets in the ADePT report.)
Tip: You can reduce the size of the transfer by packaging the files in a single archive (for example, a .zip file). The recipient will need to unzip the archive to access the files.
When ADePT opens a saved project file, it looks for the datasets in the speci-fied locations. If the person who is using your files is unable or unwilling to re-create your folder structure on their computer, instruct them to place the datasets in the same folder as the project files. If ADePT does not find a da-taset in the location specified in the project file, it checks the folder where the project file itself is located, and if the dataset is found it is loaded from there.
91
Chapter 12
Chapter 12
Simulations with ADePT
This chapter shows how to perform simulation analysis of a reform or a policy intervention with ADePT. Examples of simulations include the impacts of income supplements, unemployment benefits, etc.
There are several ways to perform simulations. Tutorials in this chapter pro-vide step-by-step instructions.
Tutorial 1: Simulation using a statistical program
Suppose we have an individual level data file in which each individual’s consumption is stored in variable consump. We want to investigate how a 10% consumption subsidy1 to rural households will affect aggregate poverty rates. According to the intervention’s description, the affected individuals are those that reside in the rural area and the effect of the reform is a subsidy (an increase in consumption). Rural residence is reflected in the binary variable urban (equal to 2 for rural households).
The process consists of two steps:
1. Create a dataset with simulated data. That dataset is based on the ac-tual data, modified to simulate the effect of the reform or policy. (Note that you can create one or multiple simulated datasets for your own simulations.)
2. Run ADePT on the actual and simulated datasets to obtain the results of a benchmark and a simulation (and changes, if necessary).
1 Note that if you simulate an income subsidy, you will need to make some assumptions about how the income increase converts to consumption increase. For this simulation we will simply assume that all the amount of subsidy will be consumed by the individual.

ADePT User’s Guide
92
A. Create a dataset with simulated data
We have to create a new dataset that would represent the situation after the hypothetical reform has been implemented. To do this:
• Start with the original dataset,
• Identify which persons or households are affected, and
• Modify the characteristics of the affected persons or households reflect-ing the effect of the reform on that unit.
1. In Windows® Explorer:
a. Locate the adept_2002.dta file (it’s in the \example subfolder in the ADePT program folder).
b. Create a copy of the file and name it adept_2002_sim.dta.
We need the file copy because we will be comparing the simulated data with the original data, so the original file must survive intact.
2. Modify the simulated file in Stata®2:
a. Double-click adept_2002_sim.dta to open it in Stata®.
b. Type these commands (refer to Stata® manuals for descriptions of Stata® commands):
replace consump = consump * 1.10 if urban == 2save, replace
2 You can use Stata®, SPSS® or any other data manipulating tool available that can read data from the original file and write an output file compatible with ADePT. Note that if you are using Excel®, you can export your file as a tab-delimited file that ADePT will be able to process.

Chapter 12: Simulations with ADePT
93
This tells Stata® to increase the values of the variable consump by 10%, but only for those observations (individuals) where variable urban takes value 2 (associated with rural residence). The second command tells Stata® to save the modified dataset, replacing the unmodified file.
B. Process the two files
1. Launch ADePT and select the Poverty module.
2. Add the two datasets: adept_2002.dta and adept_2002_sim.dta.
3. Since both files relate to one year, give them the more informative labels Actual and Simulated.
The ADePT Datasets tab now looks like this:
4. Map dataset variables to input variables as shown below to get the changes in aggregate poverty.
5. In the tables list, select table T2.1: Overall Poverty.
6. Click the Generate button.

ADePT User’s Guide
94
ADePT computes the poverty statistics and presents them in the following table:
From the results above you can see that the simulated effect of the consump-tion subsidy was a 3.1 percentage point decrease in poverty headcount rate. This is consistent with our expectations, since increase in consumption should generally lower the poverty rates if the poverty line does not change. Furthermore, note that the results in the actual and simulated columns for the urban sector are identical and the corresponding change is 0.0. This is because all of our affected population is residing within the rural sector by de-sign of the intervention being simulated. The overall change in the poverty is smaller than the change in the rural sector because the total change represents the weighted average of the changes in each individual sector and the urban sector poverty is not changing. The larger (in this case) the rural sector is the closer will be the total change to the change in the rural sector3.
3 You may argue that decreasing poverty in one of the sectors may cause some residents to move from urban to rural sector (indeed, they would enjoy the subsidy, which they are not eligible for in the urban sector). In other words, the subsidy can not only affect the level of well-being of residents within a sector, but it can also induce migration between the sectors. However, this indirect effect is not part of our simulation. If you consider simulating this migration, you need to come up with a simulation rule for the decision to stay or to move depending on the counterfactual consumption and, perhaps, other household characteristics.

Chapter 12: Simulations with ADePT
95
Tutorial 2: Simulation within ADePT
A simple simulation like the one above can be carried out fully in ADePT without the use of a statistical package.
A. Create a dataset with simulated data
1. In Windows® Explorer:
a. Locate the adept_2002.dta file (it’s in the \example subfolder in the ADePT program folder).
b. Create a copy of the file and name it adept_2002_sim.dta.
We need the file copy because we will be comparing the simulated data with the original data, so the original file must survive intact.
2. Launch ADePT and select the Poverty module.
3. Add the two datasets: adept_2002.dta and adept_2002_sim.dta.
4. Since both files relate to one year, give them the more informative labels Actual and Simulated.
5. Click the Simulated row in the Datasets tab.
6. Click the Variables | Simulated tab.
7. Right-click in the Variables table, then click Add or replace variable... in the pop-up menu.
8. In the Generate/Replace Variable dialog:
a. In the Expression field, enter this expression:
consump=consump*1.1 if urban==2
This increases the values of the variable consump by 10%, but only for those observations (individuals) where variable urban takes value 2 (associated with rural residence).

ADePT User’s Guide
96
Note: Don’t activate the Apply to all datasets option. This assures that the expression will be applied only to the dataset selected in step 5 (Simulated), and the other dataset (Actual) will remain unchanged for comparison purposes.
The dialog now looks like this:
b. Click the Generate button.
c. Confirm the replacement.
9. Verify that the consumption variable has been changed:
a. In the Variables table, right-click in the consump row, then click Display statistics for variable consump in the pop-up menu.
b. Close the statistics window.

Chapter 12: Simulations with ADePT
97
B. Process the two files
1. Map dataset variables to input variables as shown below to get the changes in aggregate poverty.
2. In the tables list, select table T2.1: Overall Poverty.
3. Click the Generate button.
ADePT computes the poverty statistics and presents them in the following table, which is identical to the one generated in the previous tutorial:
The first two tutorials showed how to perform a simple simulation analysis using a simple data transformation with the help of a statistical package or ADePT itself. More complex simulations are possible, for example when you change several variables (such as employment status and unemployment benefits). In this case, you need to be sure that the variable names in the simulated dataset are exactly the same as in the original dataset, and that the variables contain different values.
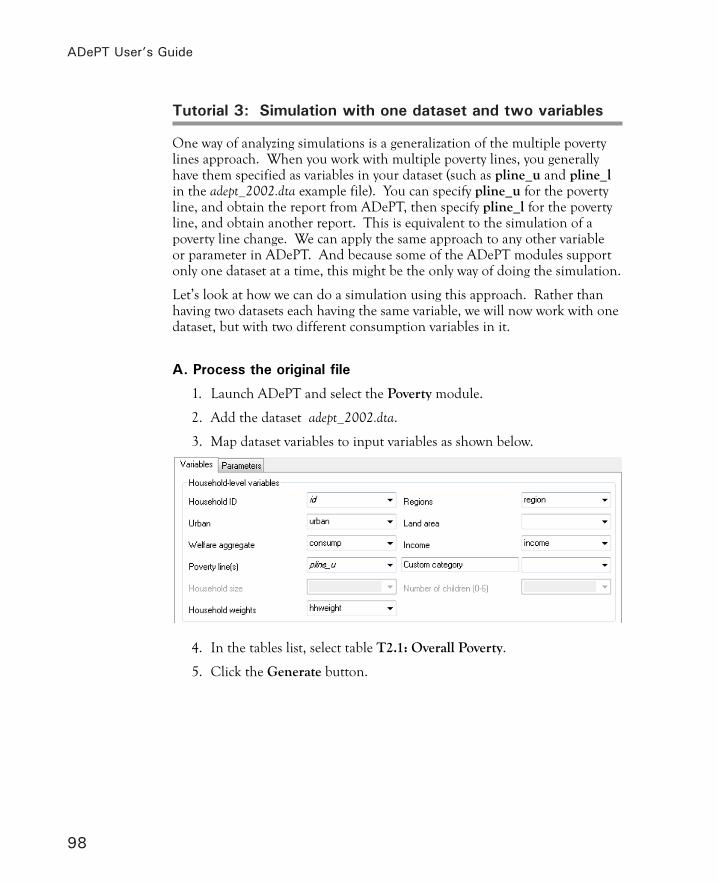
ADePT User’s Guide
98
Tutorial 3: Simulation with one dataset and two variables
One way of analyzing simulations is a generalization of the multiple poverty lines approach. When you work with multiple poverty lines, you generally have them specified as variables in your dataset (such as pline_u and pline_l in the adept_2002.dta example file). You can specify pline_u for the poverty line, and obtain the report from ADePT, then specify pline_l for the poverty line, and obtain another report. This is equivalent to the simulation of a poverty line change. We can apply the same approach to any other variable or parameter in ADePT. And because some of the ADePT modules support only one dataset at a time, this might be the only way of doing the simulation.
Let’s look at how we can do a simulation using this approach. Rather than having two datasets each having the same variable, we will now work with one dataset, but with two different consumption variables in it.
A. Process the original file
1. Launch ADePT and select the Poverty module.
2. Add the dataset adept_2002.dta.
3. Map dataset variables to input variables as shown below.
4. In the tables list, select table T2.1: Overall Poverty.
5. Click the Generate button.
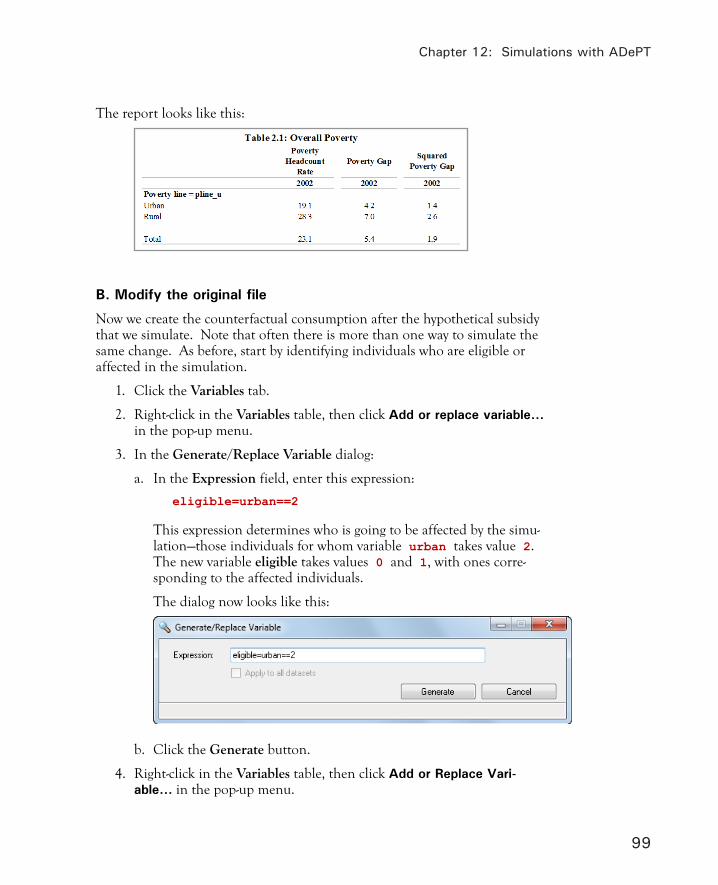
Chapter 12: Simulations with ADePT
99
The report looks like this:
B. Modify the original file
Now we create the counterfactual consumption after the hypothetical subsidy that we simulate. Note that often there is more than one way to simulate the same change. As before, start by identifying individuals who are eligible or affected in the simulation.
1. Click the Variables tab.
2. Right-click in the Variables table, then click Add or replace variable... in the pop-up menu.
3. In the Generate/Replace Variable dialog:
a. In the Expression field, enter this expression:
eligible=urban==2
This expression determines who is going to be affected by the simu-lation—those individuals for whom variable urban takes value 2. The new variable eligible takes values 0 and 1, with ones corre-sponding to the affected individuals.
The dialog now looks like this:
b. Click the Generate button.
4. Right-click in the Variables table, then click Add or Replace Vari-able... in the pop-up menu.

ADePT User’s Guide
100
5. Use the Generate/Replace Variable dialog to create a new variable:
a. In the Expression field, enter this expression:
consump_simu=consump*(1+0.1*eligible)
This expression creates a new variable consump_simu, which is equal to the original variable consump for non-eligible individuals and 10% higher for those ones that are eligible (or in other words everyone’s consumptions are increased, but with a coefficient 1.0 for non-eligible individuals, and a coefficient 1.1 for eligible indi-viduals).
The dialog now looks like this:
b. Click the Generate button.
C. Process the modified file
1. Map dataset variables to input variables, using the newly created vari-able consump_simu instead of the variable consump in the Welfare aggregate field.
2. In the tables list, select table T2.1: Overall Poverty.
3. Click the Generate button.
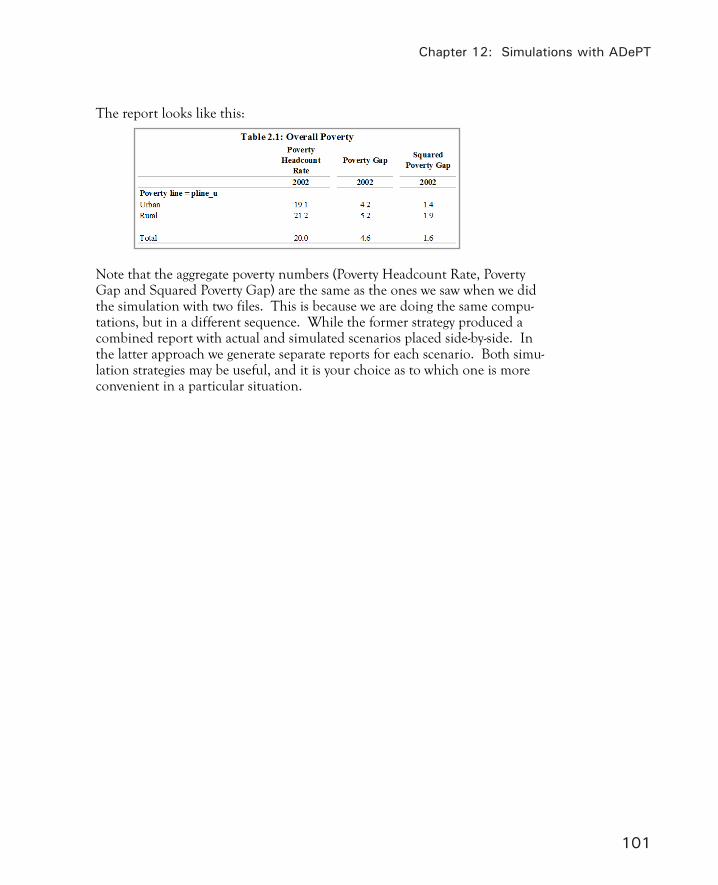
Chapter 12: Simulations with ADePT
101
The report looks like this:
Note that the aggregate poverty numbers (Poverty Headcount Rate, Poverty Gap and Squared Poverty Gap) are the same as the ones we saw when we did the simulation with two files. This is because we are doing the same compu-tations, but in a different sequence. While the former strategy produced a combined report with actual and simulated scenarios placed side-by-side. In the latter approach we generate separate reports for each scenario. Both simu-lation strategies may be useful, and it is your choice as to which one is more convenient in a particular situation.

ADePT User’s Guide
102

103
Chapter 13
Chapter 13
Using ADePT in a batch mode
ADePT supports batch operations. This can be helpful when you need to produce several reports for many countries, or a set of reports with different parameters (e.g., different poverty lines) for the same country. Batch mode minimizes the effort by creating reports automatically based on settings you save in a project file.
Here’s how to set up and run a batch file:
1. For each analysis, prepare a project file in ADePT:
a. Load the dataset(s).
b. Map variables.
c. Set parameters.
d. Save the project (Project Save Project).
Notes• You don’t select tables or graphs when using batch mode.
ADePT automatically determines which tables and graphs can be built based on your inputs. It always creates all feasible tables and graphs during batch processing.
• Since if-conditions are not stored in project files, there is no way to specify filtering in batch mode, but you can still specify a global filter (Tools Show filter tab).

ADePT User’s Guide
104
2. Using a text editor (such as Windows® Notepad):
a. Create a batch file (with extension .bat) containing one line for each analysis. Each line must have the following syntax:
<path>\ADePT.exe <path>\<project_file.adept> <path>\<report_name.xls>
where<path>\ADePT.exe is the full path to the ADePT
program.
<path>\<project_file.adept> is the full path and name for the project file you created in step 1.
<path>\<report_name.xls> is the full path and name for the report file that ADePT will produce.
Example:
C:\ADePT\ADePT.exe C:\Projects\FirstProject.adept C:\Reports\FirstReport.xls
If a path or file name contains one or more spaces, enclose the entire path\name in DOUBLE-QUOTES. For example:
"C:\Program Files\ADePT.exe" "C:\My Projects\First Project.adept" "C:\My Reports\First Report.xls"
b. Save the batch file. Be sure the file has the .bat extension.
3. Run the batch file:
a. Locate the batch file in Windows® Explorer.
b. Double-click the batch file name. You should see ADePT running.
If batch processing takes a long time, you can use Windows® Task Scheduler to run the batch at night or some other time when you are not using the com-puter. On a Windows® 7 computer, Task Scheduler can usually be found in the Start All Programs Accessories System Tools folder.
Chapter 13: Using ADePT in a batch mode
105
Batch processing tips
• Be sure to create your batch files using a text editor (i.e., not Micro-soft® Word), and save them with the .bat extension so that the Win-dows® operating system can recognize them as batch files.
• If you don’t know where ADePT is installed, right-click its icon in the Start menu, then click Properties in the pop-up menu. In the ADePT Properties dialog, copy the text in the Target field, then paste it in your batch file to specify the path to the ADePT program.
• Project files, reports and data can be located in different folders, but it’s a good idea to logically organize these files. For example, store the prepared projects in one folder with data files in subfolders, and gener-ate reports in a special output folder. Good file organization helps you find and back up your files more easily.
• It’s also a good idea to associate the project and its report with a com-mon name. If the project file is First.adept, for example, then name the report First.xls.
• Settings such as language and other settings in the Options dialog apply to ADePT as a whole, and cannot be specified for individual projects. If you need to change any of these settings, launch ADePT and change them before running the batch file.
• You can configure ADePT to run under another account in the back-ground. Be sure to run it at least once interactively to correctly initial-ize all global parameters.

ADePT User’s Guide
106

107
Chapter 14
Chapter 14
Troubleshooting
Installation problems
• Review the hardware and software requirements before installing ADePT.
• Be sure you have the latest version of ADePT by downloading it from the Downloads page on the ADePT web site, http://www.worldbank.org/adept.
• While ADePT does not require administrative privileges to install, the required software does require administrative privileges. If you don’t have the appropriate access rights, contact your system’s administrator.
• If your system meets all the requirements, but you still encounter an installation problem, check the FAQ page in the ADePT web site (it’s listed under Site Tools in the left navigation bar). The FAQ page lists common problems and solutions.
If the information above doesn’t solve the installation problem, please contact the ADePT Team via the Contact Us form on the ADePT web site (there is a link to that page under Site Tools in the left navigation bar). You will need to provide the following information to help diagnose the problem:
• The ADePT version you are trying to install:
• Date that ADePT was downloaded from the ADePT web site (for example, March 1, 2013).
• Installation file size (for example, 31,074,402 bytes).
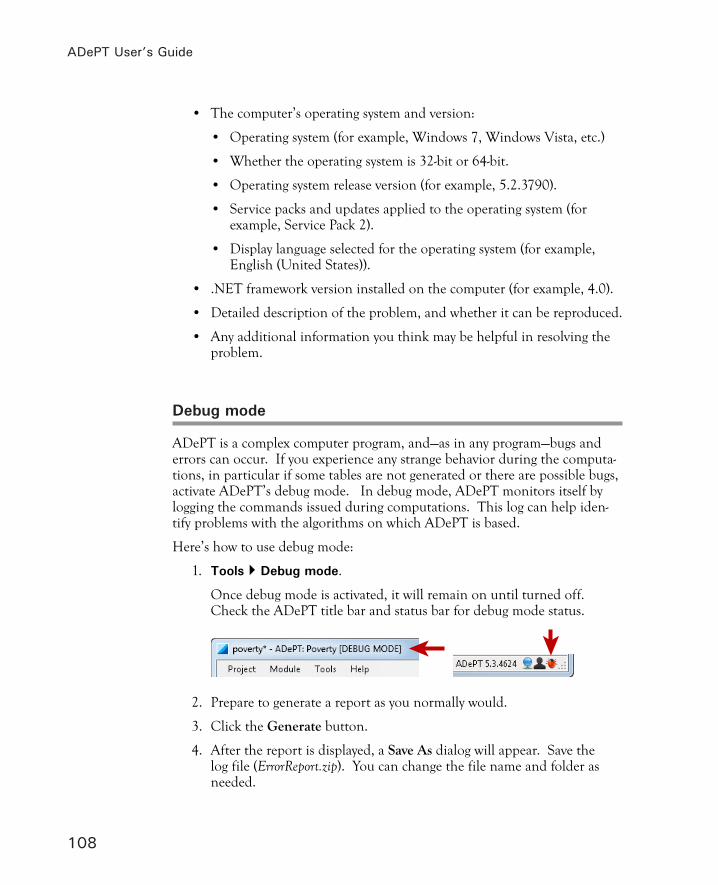
ADePT User’s Guide
108
• The computer’s operating system and version:
• Operating system (for example, Windows 7, Windows Vista, etc.)
• Whether the operating system is 32-bit or 64-bit.
• Operating system release version (for example, 5.2.3790).
• Service packs and updates applied to the operating system (for example, Service Pack 2).
• Display language selected for the operating system (for example, English (United States)).
• .NET framework version installed on the computer (for example, 4.0).
• Detailed description of the problem, and whether it can be reproduced.
• Any additional information you think may be helpful in resolving the problem.
Debug mode
ADePT is a complex computer program, and—as in any program—bugs and errors can occur. If you experience any strange behavior during the computa-tions, in particular if some tables are not generated or there are possible bugs, activate ADePT’s debug mode. In debug mode, ADePT monitors itself by logging the commands issued during computations. This log can help iden-tify problems with the algorithms on which ADePT is based.
Here’s how to use debug mode:
1. Tools Debug mode.
Once debug mode is activated, it will remain on until turned off. Check the ADePT title bar and status bar for debug mode status.
2. Prepare to generate a report as you normally would.
3. Click the Generate button.
4. After the report is displayed, a Save As dialog will appear. Save the log file (ErrorReport.zip). You can change the file name and folder as needed.
Chapter 14: Troubleshooting
109
5. Send the log file for analysis, as an e-mail attachment, to the ADePT Team at [email protected].
The error report file includes the following items:
• Information you entered in the ADePT main window.
• Messages ADePT produced while checking the data and performing calculations.
• Any reports (possibly incomplete) ADePT managed to generate before an error occurred.
• Trace of the commands ADePT executed to transform the data and compute the indicators.
The error report file does not include any unit-record data or user’s datasets, which were used when the error occurred, for confidentiality reasons. How-ever, this information would be useful for the developers in attempting to reproduce the problem. You can check all the information in the error report before sending it to the ADePT Team—just open each file in the zip archive using a text editor.

ADePT User’s Guide
110

111
Appendix A
Appendix A
Converting statistical data
ADePT can work with files in the two popular formats for storing statistical data—the Stata® data file format (file extension .dta) and the SPSS® file for-mat (file extension .sav)—as well as tab-delimited text. In some cases you may find that the datasets are available in different formats that are not directly supported by ADePT. In this case you must convert the data.
There are two main strategies for converting statistical data: using a statistical package that provides extensive import and export facilities (perhaps, but not necessarily, the package that was used to create the dataset in the first place) or using specialized data conversion software.
Most of the modern statistical packages have facilities to import/export data from/to various file formats. For example, R (with installed package “for-eign”) can read-in dBASE® (.dbf) datasets, Minitab® (.mtp) and other file for-mats; PSPP can read-in Gnumeric (.gnm, .gnumeric), Open Document® (.ods) and other files. Most packages will be able to open ASCII/plain text (.txt, .asc) data files and comma-separated (.csv) data files. If Stata® or SPSS® software is available, this may be an obvious choice, at least for the text files.
In contrast to statistical packages, specialized data conversion software focuses solely on data conversion, but usually supports a wider range of file formats. Popular data conversion programs like Stat/Transfer® support output to Stata® and SPSS® files, and can convert statistical, mathematical and spread-sheet packages from dozens of file formats.
• R: http://www.r-project.org
• PSPP: http://www.gnu.org/software/pspp
• Stat/Transfer: http://www.stattransfer.com
ADePT User’s Guide
112
• Please follow instructions very carefully when working with these pack-ages. You may want to double-check that there is no loss of data during the conversion process. Most common points of concern are:
• Are the variable and value labels preserved?
• Are missing values properly converted?
• Have the variable names or storage types changed during conversion?
• Keep in mind that ADePT can be used to examine a dataset. Just load the file into ADePT and use the Data Browser (described in chapter 7).
Assigning and using labels
When ADePT creates a table it uses variable labels defined in the datasets. If labels for a variable used in the table are defined, these labels are shown in the table. If no labels are defined, ADePT outputs the numeric codes. For example, consider a tabulation of poverty by region. If the variable holding region codes is properly labeled, ADePT builds the table with actual region names. Otherwise, the table will contain numerical codes for the regions. When working with multiple datasets, ADePT takes the value labels from the first dataset, adds value labels defined in the second, but not in the first dataset, and so forth.
When ADePT reads the value labels from a dataset, it uses the code page value defined in the options/localization dialog to properly decode the labels. It is thus important to set this code page value correctly; otherwise, the labels may be unreadable.
Many datasets come with predefined variable and value labels. If your data-sets contain no labels, or the labels are lost during data conversion, you can define them yourself using Stata® or SPSS®. For example, use the following commands to define the labels for regions in Stata®:
label define lregion 1 "North" 2 "South" 3 "East" 4 "West"label values region lregion
The first command defines the new system of value labels lregion, and the second command binds these labels to a particular variable region. To cor-rectly define the value labels, the meaning of each code needs to be known. These meanings are usually contained in a separate document called “code-book” and distributed with the data.

Appendix A: Converting statistical data
113
Besides command-line operations, Stata® and SPSS® provide graphical user interfaces that enable you to define and manage labels. In Stata®, for example:
1. In the Variable Properties panel of the Variables Manager:
a. If you want to modify a variable’s value labels, click the variable name.
b. Click the Manage... button.
2. In the Manage Value Labels dialog, click the Create Label or Edit Label button.
3. In the Create Label dialog, define new value labels. or In the Edit Label dialog (shown below), modify existing value labels.

ADePT User’s Guide
114

115
Appendix B
Appendix B
Portable ADePT
By installing ADePT on a USB flash drive, you can use it on different com-puters. This is easy since you don’t need administrative privileges to install or run ADePT.
You can install ADePT directly on a USB flash drive, or you can create a copy from within ADePT as follows:
1. If an ADePT update is available, install it now.
2. If you want your ADePT settings to transfer to the USB drive, exit ADePT, then relaunch it. (ADePT doesn’t update its settings file until it is closed, so you must exit ADePT if you want to use your desktop settings with the portable version.)
3. Insert a flash drive in a USB port on the computer on which ADePT is installed.

ADePT User’s Guide
116
4. In ADePT, Tools Create portable version on USB... . This opens the Create portable version dialog.
5. In the Select drive list, click the USB drive.
6. Click the Copy button.
7. Wait while ADePT is copied to the USB drive.
8. Click the Close button.
9. Remove the USB drive from the computer.
Note: It is recommended that you not a) simply copy the ADePT folder from the host computer to the USB drive, or b) install from the host computer by selecting the USB drive letter.

Appendix B: Portable ADePT
117
Here are some things to consider if you plan to run ADePT from a flash drive:
• The computer where you run ADePT from the USB drive must have:
• The version of .NET Framework described in the “System require-ments” section in Chapter 3.
• Microsoft® Excel®, Microsoft® Excel® Viewer or a compatible spreadsheet program.
Note: The spreadsheet program may not be in the same location as it was on the original computer. After launching ADePT from the USB drive, open the Options dialog, (Tools Options...), then click the Use default application option in the Applications tab.
• If you want to have your projects, datasets, previously generated reports and other files on the USB drive, you must manually copy them.
• The path to the ADePT program may change (the USB drive’s drive letter depends on the presence of other drives and the computer’s configuration). If you plan to use batch processing, you may need to update the paths in the batch files.

ADePT User’s Guide
118
119
Appendix C
Appendix C
Using ADePT in a multiuser environment
General information
ADePT can be installed on a Windows Server® platform to enable multiple users to run ADePT simultaneously via Remote Desktop Connection clients. The system’s administrator normally installs and maintains the ADePT ap-plication, while other users only run the program.
The ADePT installer creates a Start menu shortcut for the active user (typi-cally the server administrator). The administrator can make this shortcut available to other users by moving it to the Default\Start Menu folder. This folder’s location depends on the Windows Server 2003/2008 version and configuration. Its path may be C:\Users\Default\Start Menu, for example. Modifying this folder requires administrative privileges.
Each user’s ADePT settings are stored separately. If one user prefers, for instance, ADePT’s French interface, other users’ language choices will not be affected. The location of temporary files created by ADePT depend on the Windows Server® configuration. By default, they are created in the session folder, so ADePT users are isolated from each other.
Depending on system configuration, some ADePT features (for example, ap-plication updating) may be unavailable to non-administrator users.
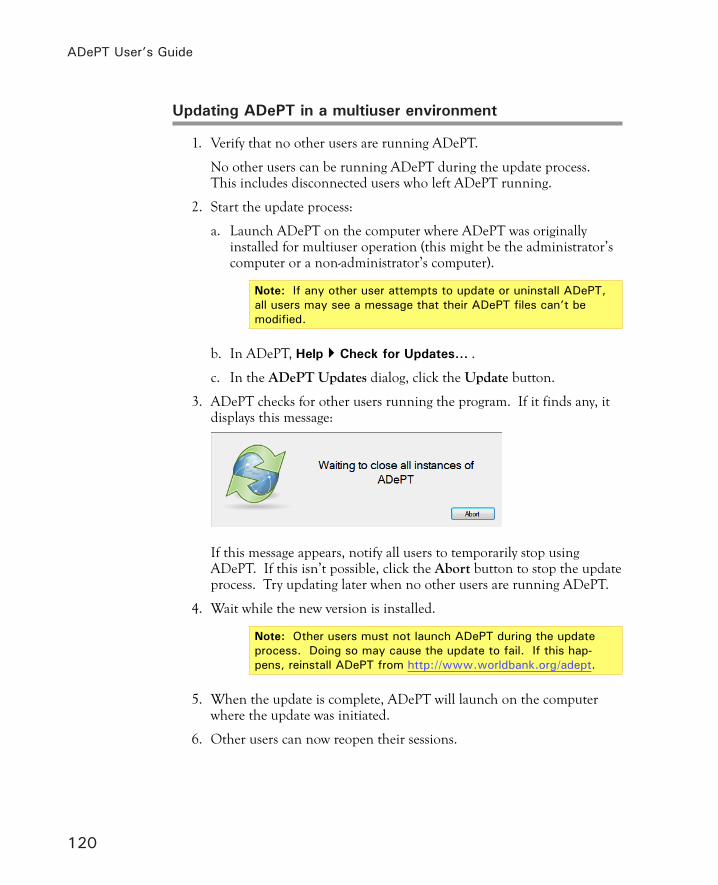
ADePT User’s Guide
120
Updating ADePT in a multiuser environment
1. Verify that no other users are running ADePT.
No other users can be running ADePT during the update process. This includes disconnected users who left ADePT running.
2. Start the update process:
a. Launch ADePT on the computer where ADePT was originally installed for multiuser operation (this might be the administrator’s computer or a non-administrator’s computer).
Note: If any other user attempts to update or uninstall ADePT, all users may see a message that their ADePT files can’t be modified.
b. In ADePT, Help Check for Updates... .
c. In the ADePT Updates dialog, click the Update button.
3. ADePT checks for other users running the program. If it finds any, it displays this message:
If this message appears, notify all users to temporarily stop using ADePT. If this isn’t possible, click the Abort button to stop the update process. Try updating later when no other users are running ADePT.
4. Wait while the new version is installed.
Note: Other users must not launch ADePT during the update process. Doing so may cause the update to fail. If this hap-pens, reinstall ADePT from http://www.worldbank.org/adept.
5. When the update is complete, ADePT will launch on the computer where the update was initiated.
6. Other users can now reopen their sessions.

121
Glossary
batch processing A method for automatically analyzing ADePT projects by a) recording file paths and names in a batch (.bat) file, and b) running the batch file. Batch processing is useful for repeatedly generating reports from multiple projects, as a replacement for manually open-ing and running each project. Batch files can also be launched by the Windows® Task Scheduler to analyze projects at any time.
Boolean expression An expression that results in a value of either TRUE or FALSE.
categorical variable A variable having less than 50 unique integer values. Examples include years of education, number of household members and occupation type (i.e., non-government employee, government employee, self-employed, not working and employer).
codebook A mechanism for assigning human-readable value labels to numerical data stored in a dataset. For a categorical variable, the dataset’s codebook associates a value label (that is, a meaning in plain text) with each unique number stored in that variable. For example, a dataset’s sex variable may store data as 1 and 2. The codebook tells ADePT (and you) that 1 = male and 2 = female. A codebook may be stored within a dataset, or it may be a separate file or document.
continuous variable A variable capable of having more than 50 unique real number values. Examples include age, income and household expenditures.

ADePT User’s Guide
122
data transformation Recoding categorical variables for consistency across datasets. A transformation can be performed by generating or replac-ing a dataset variable, or by specifying the transformation in an input variable field.
dataset A collection of observations. A dataset can be depicted as a table, with observations in rows and variables in columns. ADePT can load data from a local dataset using the dataset’s path and name. ADePT can load data from a Web-based dataset using the dataset’s URL.
dataset variable A column in a dataset, used for storing a specific kind of data. Each variable cell in an observation holds a single value.
dummy variable A variable containing only two distinct values. Examples include sex (that is, male and female) and urban (that is, urban and rural).
exclusion condition A Boolean expression used to omit certain observations from analysis. Observations for which the expression evaluates to TRUE are excluded from the analysis.
expression A combination of numbers, dataset variables and operators that evaluates to a number.
filter An expression used to isolate a subset of observations. A filter can be applied to a dataset in the Data Browser. A filter (in this case called an if-condition) can also be applied to a table, a group of tables, a graph, or a group of graphs.
frequency The number of observations used to calculate the value displayed in one cell of a table. When calculated, frequencies are reported in a table separate from the associated data table.
Global Filter A method for limiting analysis to observations satisfying user-specified requirements. A Global Filter is applied across all loaded datasets.
graph A graphical presentation of ADePT’s analysis. Graphs generated by an ADePT analysis are displayed in separate worksheets within a spreadsheet.
grid A form for grouping multiple input elements into a single unit. Grids are used to define missing values and in mapping to some input variables.

Glossary
123
household level An ADePT option specifying that the loaded dataset(s) contain one observation for each household.
if-condition A filter applied to individual tables/graphs or a group of tables/graphs.
inclusion condition A Boolean expression used to select certain observa-tions for analysis. Observations for which the expression evaluates to TRUE are included in the analysis.
individual level An ADePT option specifying that the loaded dataset(s) con-tain one observation for each household member.
input variable A field provided in an ADePT module. The field’s label indicates the kind of data the module is expecting. Dataset variables are mapped to corresponding input variables.
microdata Data for an individual household or individual person.
missing value A dataset code indicating that data for a variable in an obser-vation is not available.
module A collection of input variables and parameters selected for a specific type of economic analysis within ADePT.
observation A set of data for one household or one person.
parameter Ranges, weightings and other module-specific factors that will be applied during ADePT’s analysis.
project An ADePT configuration file containing paths/URLs for datasets, dataset transformations, variable mappings, global and dataset-specific filters and missing variable definitions.
recode Change inconsistent missing values to consistent missing values.
report A collection of tables and graphs, generated by ADePT organized in a spreadsheet.
standard error A measure of the variability of a statistic. It is an estimate of the standard deviation of a sampling distribution.
stratification The ranking of individuals and groups in a society.
survey A sampling of individuals or households to collect data for statistical analysis.
ADePT User’s Guide
124
table A tabular presentation of ADePT’s analysis. Tables generated by an ADePT analysis are displayed in separate worksheets within a spread-sheet.
value label The text corresponding to a value in a dataset. The dataset’s codebook maps values to their labels.
Web-based dataset A dataset stored on a Web site. ADePT can load data from a Web-based dataset using the dataset’s URL.

125
Index
documentation (additional) 3E
error message 39example
dataset 4project 4
F
filterglobal 60, 76global with if-condition 78individual tables and graphs 73
frequency table 80G
Global Filter 60glossary 121graph, select 36grid 61I
if-condition 73, 76with Global Filter 78
install 7on USB drive 115register 11system requirements 7troubleshoot 107
L
launch ADePT 23localization 16M
main window 24messages 39Microsoft Windows 7missing value 62module
select for display 10, 14select on launch 23
multi-user operation 119N
A
ADePTabout 1exit 26install 7install on USB drive 115internal operations 40launch 23main window 24multi-user 119update 20version 20
analysisgenerate report 38map variables 31overview 27select tables and graphs 36specify dataset 28
B
batch mode 103C
code page 112D
dataassign label 112convert format 111
Data Browser 47dataset 43
code page 112example 4frequency tabulation 46specify 28supported formats 28view data 47Web-based 28
debug mode 108

Index
126
notification message 39Numerics by Stata 1O
observation, view 47options 12
applications 12localization 16modules 14other 19reporting 15
P
parameter 67project 87
example 4local 87replicate results 90use on different computer 89Web-based 88
Q
quick start 5analyze data and generate report 6install and launch 5
R
reportabout 41generate 38
reporting level 15S
simulation 91SPSS 28, 111standard error table 80Stata 28, 111support 4survey design 68system requirements 7T
tabApplications 12Datasets 28, 43Localization 16Messages 39Missing values 62Modules 14Other options 19Parameters 67Reporting 15Table description and if-condition 37Variables (dataset) 44Variables (input) 31
tablecustom 82feasible versus infeasible 71frequency 80original data 72select 36
standard error 80Table Browser 85
Table Browser 85troubleshoot 107
debug mode 108V
valuedefine missing 62view 47
variable, datasetbasic information 44delete 55detailed information 47expression in 53generate 51map 31replace 53statistics 44string 54
variable, input 57custom category 59grid 61hint in status bar 32map multiple dataset variables 58transformation in 64types 57
W
warning message 39