parque arauco - Modyo
321
INTEGRATED REPORT PARQUE ARAUCO
-
Upload
khangminh22 -
Category
Documents
-
view
0 -
download
0
Transcript of parque arauco - Modyo
integrated report
parque arauco
2
PAR
QU
E A
RA
UC
O IN
TE
GR
AT
ED
RE
PO
RT
20
20
GOVERNANCEAND COMMUNITYINTRODUCTION ABOUT US
ECONOMIC PERFORMANCE
ENVIRONMENTAL PERFORMANCE
SOCIAL PERFORMANCE
ADDITIONAL INFORMATION
FINANCIAL INFORMATION
2
PAR
QU
E A
RA
UC
O IN
TE
GR
AT
ED
RE
PO
RT
20
20
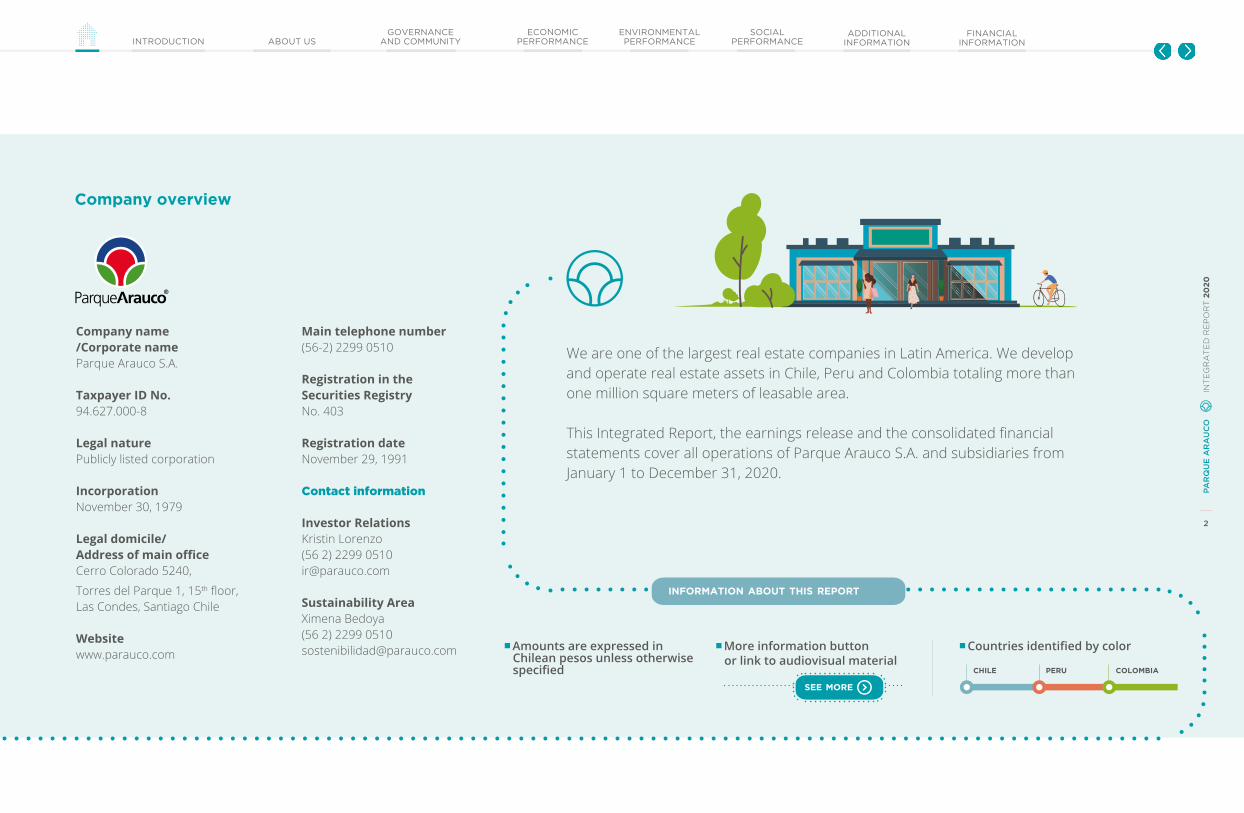
Company name /Corporate nameParque Arauco S.A.
Taxpayer ID No.94.627.000-8
Legal naturePublicly listed corporation
IncorporationNovember 30, 1979
Legal domicile/ Address of main officeCerro Colorado 5240,
Torres del Parque 1, 15th floor,Las Condes, Santiago Chile
Websitewww.parauco.com
Main telephone number(56-2) 2299 0510
Registration in the Securities RegistryNo. 403
Registration dateNovember 29, 1991
Contact information
Investor RelationsKristin Lorenzo(56 2) 2299 [email protected]
Sustainability AreaXimena Bedoya(56 2) 2299 [email protected]
Company overview
We are one of the largest real estate companies in Latin America. We develop and operate real estate assets in Chile, Peru and Colombia totaling more than one million square meters of leasable area.
This Integrated Report, the earnings release and the consolidated financial statements cover all operations of Parque Arauco S.A. and subsidiaries from January 1 to December 31, 2020.
More information button or link to audiovisual material
Amounts are expressed in Chilean pesos unless otherwise specified
Countries identified by color
see more
peruchile colombia
information about this report
3
PAR
QU
E A
RA
UC
O IN
TE
GR
AT
ED
RE
PO
RT
20
20
GOVERNANCEAND COMMUNITYINTRODUCTION ABOUT US
ECONOMIC PERFORMANCE
ENVIRONMENTAL PERFORMANCE
SOCIAL PERFORMANCE
ADDITIONAL INFORMATION
FINANCIAL INFORMATION
Table of Contents
Message from the Chairman
4.1 Scope of environmental indicators
4.4 Climate change management
1.1 Parque Arauco at a glance
1.4 Key figures
5.1 Our contribution to the communities where we operate
3.1 Financial capital
7.1 Earnings release 6.1 2020 by the numbers
5.3 Our suppliers
Message from the Executive Vice President
4.2 Sustainable design and construction
1.2 The principles that move us 3.2 Real estate capital
7.2 Independent auditors’ report 6.2 Corporate information
Highlights in 2020
4.3 Sustainable operations
1.3 Our history
5.2 Our team
2.3 The cornerstones of our work
2.4 Our suppliers
2.5 Sustainability management
2.1 Our corporate governance
2.2 Management structure and performance
3.3 Our customers
7.3 Consolidated financial statements
7.4 Summarized financial statements of subsidiaries
6.3 About this Integrated Report
6.4 GRI content index and General Character Standard No. 30
6.5 External assurance and statement of responsibility
Introduction
I.
Environmental performance
04.
About us
01.
Social performance
05.
Governance and community
02.
Additional information
06.
Economic performance
03.
Financial information
07.

4
PA
RQ
UE
AR
AU
CO
IN
TE
GR
AT
ED
RE
PO
RT
20
20
Message from the Chairman Message from the Executive Vice President Highlights in 2020
GOVERNANCEAND COMMUNITYINTRODUCTION ABOUT US
ECONOMIC PERFORMANCE
ENVIRONMENTAL PERFORMANCE
SOCIAL PERFORMANCE
ADDITIONAL INFORMATION
FINANCIAL INFORMATION
Introduction Message from the Chairman
Message from the Executive Vice President
Highlights in 2020
I.

5
PAR
QU
E A
RA
UC
O IN
TE
GR
AT
ED
RE
PO
RT
20
20
Message from the Chairman Message from the Executive Vice President Highlights in 2020
GOVERNANCEAND COMMUNITYINTRODUCTION ABOUT US
ECONOMIC PERFORMANCE
ENVIRONMENTAL PERFORMANCE
SOCIAL PERFORMANCE
ADDITIONAL INFORMATION
FINANCIAL INFORMATION
Message from the Chairman
We are proud that the market never stopped supporting Parque Arauco even during the toughest parts of 2020.
Dear shareholders and stakeholders:
The year 2020 posed enormous challenges that tested the resilience of the real estate industry. The COVID-19 pandemic forced us to find new ways of doing things. Activity at our shopping centers began to recover as we were able to open our doors to the public. In our case, this result is also a product of the effort, flexibility and commitment of the Parque Arauco team and the support, hard work and steadfastness of our tenants, with whom we worked day in and day out to adapt operations to the conditions imposed by this situation. Thanks to this joint effort, we finished the year with approximately 75% of our GLA open, resulting in tenant sales proportional to those obtained in the final quarter of last year.
We also experienced the passing of my father this year. I am profoundly proud of and grateful for the legacy that he has left us. He dedicated his passion and commitment to creating and launching everything that Parque Arauco is as a company for many years, starting in 1982 by developing Chile’s first shopping center. He then moved us towards internationalization, as Parque Arauco entered Peru and Colombia, forming a company that is now the real estate industry leader in the Andean region. We see his mark on the values that guide us, the way we do things and our commitment to people, aspects that are included in the tribute that we present in Section 1.3 of this report. I would like to take this opportunity to thank everyone who stood with us as we bid him farewell. I am still moved by the influence that my father had on so many people.
In regard to operations, the year was full of ups and downs. The first quarter ended well, with good signs of activity and was only marginally impacted by the arrival of COVID-19 at the end of the period. The second quarter was challenging, as only essential services such as supermarkets, pharmacies and banks could open. We moved towards higher levels of opening and capacity in the third and fourth quarters as the health situation in the communities where we operate improved. As such, we gradually
increased the number of spaces open to the public, foot traffic and sales.
Over the course of the year, we supported Parque Arauco’s stakeholders. We offered significant discounts to our tenants in an efforts to align lease expenses with sales levels they reported each month and kept in constant contact with them. We also adjusted payment terms for our suppliers to support them through greater liquidity, and developed initiatives to support the communities located near our shopping centers. More recently we allowed our Chilean properties to be used as vaccination sites, thus contributing to health officials’ efforts to move back towards normal daily life.
In this context, revenue totaled CLP$125,852 million this year, or 61% of the amount reported for 2019. EBITDA reached CLP$65,591 million, 44% of the total for the previous year. Profit attributable to equity holders of the parent was 2% of the 2019 figure.
We harvested the fruits of having built a solid company over the course of many years that is sustained by prudent financial management and the ability to optimize portfolio management. This was reflected in the market’s confidence, as we were the first Chilean company to issue bonds (UF 2 million) during the most difficult stage
5
PA
RQ
UE
AR
AU
CO
IN
TE
GR
AT
ED
RE
PO
RT
20
20

6
PAR
QU
E A
RA
UC
O IN
TE
GR
AT
ED
RE
PO
RT
20
20
Message from the Chairman Message from the Executive Vice President Highlights in 2020
GOVERNANCEAND COMMUNITYINTRODUCTION ABOUT US
ECONOMIC PERFORMANCE
ENVIRONMENTAL PERFORMANCE
SOCIAL PERFORMANCE
ADDITIONAL INFORMATION
FINANCIAL INFORMATION
Message from the Chairman
of lockdown as the crisis was still worsening. These bonds were subsequently expanded with a second placement of UF 5 million. As of year-end 2020, we had CLP$357,032 million in cash, which indicates a sound liquidity position. We are proud that the market never stopped supporting Parque Arauco even during the toughest parts of 2020.
We are still developing new real estate assets. Over the course of this year, construction actively continued on both the mixed-use projects in Parque Arauco Kennedy and Parque Alegra in Barranquilla. Work was halted on occasion during quarantine periods, and processes were adapted to the health protocols implemented. The company maintains its growth strategy and, thanks to its financial support, we continue to make progress in this area.
In regard to customer experience, we are working with Fundación Chile and Chile Global Ventures to launch the Shopping Evolution challenge. This involves seeking out startups with innovative solutions in our field. We see commerce developing a stronger omnichannel approach, combining different forms of interaction between retailers and customers. Here we believe that flexibility and adapting to new trends is key. As such, we are looking to be active in this area, implementing initiatives that allow us to meet these needs, reaching
agreements with last mile operators including those that we have in place with Rappi in Colombia and Peru, developing solutions like Arauco Pickup, which allows customers to buy and pick up their products from their cars, and offering personal shoppers who can shop remotely in our centers, among other varied initiatives. All of these projects are designed to complement our customers’ experiences and support our tenants’ sales.
As part of our long-term approach, we continue to expand our focus on sustainability. Among other things, we closed 2020 with the incorporation of renewable energy use agreements and encouraged electromobility at our shopping centers. Both of these are very important efforts related to shrinking our carbon footprint. In this context, we are pleased to be included in several international sustainability indexes, including being part of the Dow Jones Sustainability Index in Chile, Latin America, and Emerging Markets for the fifth consecutive year. This comes in addition to other indexes that evaluate ESG aspects such as the FTSE4Good program from the London Stock Exchange, to which we have been admitted for the past three years. Furthermore, we were included in the Sustainability Yearbook 2020 for the second time. This S&P Global publication recognizes companies around the world that have made significant progress on their
sustainability management. There is a long road ahead of us, but we continue to move forward decidedly in this extremely important area.
We are optimistic about the future of the real estate industry in the Andean region. Our strategic focus leads us to seek out innovative ways to continue to develop our current properties in an effort to capture customers through a mix of attractive products and services while offering new forms of interaction. Our work centers around the following dimensions: the customer experience, innovation in the development and use of commercial spaces, iconic concepts for coming together, a focus on sustainability through engagement with our neighboring communities, and care for and protection of both individuals and the environment. We push ourselves to explore new investments and to be flexible in the way that we manage our resources, allocating capital to the properties that contribute most to shareholder returns and the company’s success.
I believe that our team’s talent and professionalism, our tenants’ hard, constant work, the trust we have built with the market and stakeholders and our identity as a company will continue to be pillars that allow us to move forward together towards our goals, which we will continue to pursue.
"...We closed 2020 by incorporating renewable energy use agreements and promoted electromobility at our shopping centers"
salVaDor saiD Chairman of the Board
Parque Arauco
6
PA
RQ
UE
AR
AU
CO
IN
TE
GR
AT
ED
RE
PO
RT
20
20

7
PA
RQ
UE
AR
AU
CO
IN
TE
GR
AT
ED
RE
PO
RT
20
20
Message from the Chairman Message from the Executive Vice President Highlights in 2020
GOVERNANCEAND COMMUNITYINTRODUCTION ABOUT US
ECONOMIC PERFORMANCE
ENVIRONMENTAL PERFORMANCE
SOCIAL PERFORMANCE
ADDITIONAL INFORMATION
FINANCIAL INFORMATION
Message from the Executive Vice President
Dear shareholders and stakeholders:
This year has been riddled with challenges and lessons. The COVID-19 pandemic has had very profound impacts on different aspects of life, including the business and economic environment, and has impacted our relationships and daily life on many levels. It has also revealed our team’s commitment and work to achieve a safe and sustained reopening process.
As a company, we also endured the passing of Mr. José Said ("Don José"), one of our founders, and a man for whom all of the members of the Parque Arauco team have only words of gratitude. Parque Arauco was a key business for Don José, and he had a great deal of affection for it and shared a long history from its inception. For years, Parque Arauco grew physically in square meters, while also growing in profitability and value. We faced some setbacks due to the social uprising and pandemic, and we are facing new challenges that the company will have to navigate. The most visible changes were physical, geographic and financial progress. But even more important was Don José’s leadership. He was serious and austere, and delegated tasks while always maintaining an
interest. He was strong but very conciliatory. He was always friendly and cordial, but he was especially affectionate in recent years, and asked me to relay his support, trust and affection for the Parque Arauco team. I did so, and they very much reciprocated. The entire Parque Arauco team appreciated and valued him enormously, and they conveyed this to me through numerous gestures and messages.
Don José leaves us great memories, but he also reminds us that we are only here for a short time, and that what remains is the mark we leave behind. We are still moving through a difficult period, but Don José's mark lights our way. His hardworking spirit, friendliness, trust, simplicity, enthusiasm and prudence along with his team spirit, human and professional quality are all part of Parque Arauco, where they can guide those of us who are here today and those who lead and form part of this great company in the future.
During 2020, the company faced a particularly difficult situation in which we identified three priority areas on which to concentrate our decisions and align our priorities:
commitment to people
We focus on caring for people: our team, suppliers, tenants and shopping center visitors. We strictly followed public health measures and protected each other at all times with the understanding that this dimension is the most important. As such, we focused our energy and efforts on adopting public health protocols such as social distancing and remote work, providing support and assisting team members who needed it.
During the most difficult months of the pandemic and public health restrictions, we maintained jobs and placed no restrictions on employment and compensation for mid-level and operations positions of the organization. The only salaries that were cut were those of executives in strategic leadership positions.
"...We defined three priority areas for focusing our decisions and aligning our priorities."
7
PA
RQ
UE
AR
AU
CO
I
NT
EG
RA
TE
D R
EP
OR
T 2
02
0
8
PA
RQ
UE
AR
AU
CO
IN
TE
GR
AT
ED
RE
PO
RT
20
20
Message from the Chairman Message from the Executive Vice President Highlights in 2020
GOVERNANCEAND COMMUNITYINTRODUCTION ABOUT US
ECONOMIC PERFORMANCE
ENVIRONMENTAL PERFORMANCE
SOCIAL PERFORMANCE
ADDITIONAL INFORMATION
FINANCIAL INFORMATION
Message from the Executive Vice President
We expanded our proximity to and work with suppliers, tenants and neighboring communities, deploying resources to address the crisis. One example of this was the agile payment system implemented for suppliers in an effort to support their liquidity, shuttles for team members who had to work on site and joint efforts with civic organizations that allowed us to provide humanitarian aid to over 17,000 people who were profoundly impacted by the crisis.
operational continuity
Recovering operational continuity in our shopping centers was one of our main goals. We implemented all necessary protocols and invested in the infrastructure and technology required to ensure that our shopping centers remained ready to reopen once officials and the health situation permitted it. We thus maintained around 60% of our spaces open to the public over the course of the year, finishing the period with a consolidated occupancy rate of 91.6%.
We accelerated projects, sought to provide our tenants with new options during the crisis, used digital solutions to facilitate remote shopping and decrease physical contact in the shopping process. Our initiatives included partnerships with delivery companies, virtual platforms for contactless shopping, personal shoppers to assist customers remotely and other innovations related to the evolution of consumption dynamics and the deployment of omnichannel approaches.
financial strength
We deployed a financing, refinancing and rescheduling strategy for our financial obligations, increasing cash to US$750 million at the most critical point in the pandemic to boost the company’s liquidity. We reopened the public bond market during the pandemic and saw the market reaffirm its trust in Parque Arauco in the placement of two corporate bonds for UF 5 million and UF 2 million. We maintained stable AA risk ratings due to this financial solidity and the quality of our assets.
In regard to 2020 profit, tenant sales totaled US$1,822 million, 66% of the level reported in 2019 and proportional to an average open GLA of 60%. The company’s revenue totaled CLP$125,852 million, 61% of the total reported for the previous year, which also aligns with the GLA open to the public.
The company’s EBITDA was CLP$65,591 million, 44% of the 2019 figure due to the impact of the public health situation, partially offset by cost cutting efforts. This year,
we implemented various plans to reduce expenditures, reducing cost of sales and administrative expenses by 12% prior to the allowance for doubtful accounts, compared to 2019.
The controlling entity’s FFO totaled CLP$29,122 million, or 26% of the amount reported the previous year, while profit attributable to equity holders of the parent closed 2020 at CLP$1,846 million.
The pandemic had a significant impact on the global economy, consumption and our industry in particular. However, we saw our spaces reopen gradually, which allowed us to once again offer our visitors a wide range of products and services in our shopping centers. As the company’s financial statements show, we tried to focus on prudent financial management and active portfolio management, which allowed us to retain the market’s trust and growing activity levels, though these always depended on the evolution of the pandemic and the health crisis.
“We maintained our stable AA risk ratings due to our financial solidity and the quality of our assets.”

9
PA
RQ
UE
AR
AU
CO
IN
TE
GR
AT
ED
RE
PO
RT
20
20
Message from the Chairman Message from the Executive Vice President Highlights in 2020
GOVERNANCEAND COMMUNITYINTRODUCTION ABOUT US
ECONOMIC PERFORMANCE
ENVIRONMENTAL PERFORMANCE
SOCIAL PERFORMANCE
ADDITIONAL INFORMATION
FINANCIAL INFORMATION
Last year pushed us more than ever to create spaces that contribute to improving people's lives. Although it is too early to reach any definitive conclusions, we are motivated by the reactivation signals that we have seen in several countries. We believe in the real estate industry’s role in economic reactivation and social connection, and we trust that the progress made to control the pandemic will help us return to spaces that allow us to come together, which is so necessary and an essential part of our human relationships.
I would like to thank our shareholders, suppliers, tenants, communities and the market in general for their support, especially during a year laden with such exceptional demands and complexities. I would like to especially recognize and show my gratitude for the commitment, work and dedication of our team, who gave the best of themselves during a challenging year that was full of sacrifice in order to overcome the challenges we faced. I believe that we will all continue to build new opportunities for development together, strengthened by the experience and lessons that we have achieved over time.
Message from the Executive Vice President
Juan antonio ÁlVarez
Executive Vice President Parque Arauco

10
PAR
QU
E A
RA
UC
O IN
TE
GR
AT
ED
RE
PO
RT
20
20
Message from the Chairman Message from the Executive Vice President Highlights in 2020
GOVERNANCEAND COMMUNITYINTRODUCTION ABOUT US
ECONOMIC PERFORMANCE
ENVIRONMENTAL PERFORMANCE
SOCIAL PERFORMANCE
ADDITIONAL INFORMATION
FINANCIAL INFORMATION
Highlights in 2020
55real estate assets in total as of year-end.
1,071,500 m2
of Gross Leasable Area (GLA).
US$ 172 millionconsolidated revenue1.
US$ 3,780 milliontotal consolidated assets2.
21organizations that promote local entrepreneurs were supported in Chile, Peru and Colombia.
5
+115community groups worked with us on social initiatives to support communities in Chile, Peru and Colombia.
of our own Click & Collect* programs.
+700,000uses of our apps and digital solutions to facilitate the customer experience in shopping centers in Chile, Peru and Colombia.
88%Internal satisfaction among our team members in Chile, Peru and Colombia.
835entrepreneurs supported through various initiatives in our shopping centers.
1,879tons of waste were recycled or reutilized.
71% of the total energy consumed at our shopping centers comes from renewable resources.
10,316 m3
of water reused or recycled.
Key figures of 2020
Economic management
Ecodesign and environmental management
Supplier managementand support for local enterprise
Managing our team, communities and customers
*These include: Arauco Pickup, Arauco Foodie, Personal Shopper, Compra y Recoge and Delivery Gastronómico. 1. Exchange rate (income statement uses the average rate).
US$ 1 = CLP 731.92.2. Exchange rate (the closing rate is used for the statement of financial position): US$ 1 = CLP 710.95.

11
PAR
QU
E A
RA
UC
O IN
TE
GR
AT
ED
RE
PO
RT
20
20
Message from the Chairman Message from the Executive Vice President Highlights in 2020
GOVERNANCEAND COMMUNITYINTRODUCTION ABOUT US
ECONOMIC PERFORMANCE
ENVIRONMENTAL PERFORMANCE
SOCIAL PERFORMANCE
ADDITIONAL INFORMATION
FINANCIAL INFORMATION
CLP $29,513million
CLP $125,852millionRevenue
CLP $1,360,986millionTotal tenant sales
Payments to our suppliers2
CLP $21,867millionSalary and benefits paid to our team
-CLP $2,042million
CLP $23,742million
Payments to our shareholders
CLP $315million
Contributions and donations to the community
CLP $49,053millionPayments to our creditors3
CLP $16,110million
Payments to the government4
CLP $7,494millionFinancial income
CLP $5,212millionIncome from investments in other companies
Distribution of value in the Parque Arauco ecosystem1
(Amounts in Chilean pesos)
Economic value generated
Economic value retained 212
Los pasivos corrientes aumentaron de Ch$ 190.332 millones al 31 de diciembre 2018 a Ch$ 321.246 millones al término del 2019. Este aumento se explica principalmente por el aumento de la cuenta otros pasivos financieros corrientes, la cual aumentó Ch$ 115.147 millones durante el periodo debido a la reclasificación de deuda de largo plazo a corto plazo.
Los pasivos no corrientes aumentaron de Ch$1.109.740 millones al 31 de diciembre 2018 a Ch$ 1.195.855 millones al 31 de diciembre 2019. Este aumento se debe principalmente a la inclusión de la cuenta pasivos por arrendamiento, no corrientes (por la aplicación de NIIF 16), la cual corresponde a Ch$ 46.503 millones.
El patrimonio total aumentó de Ch$ 1.078.028 millones al 31 de diciembre 2018 a Ch$1.175.257 millones al 31 de diciembre 2019. Este aumento de 9,0% se explica mayormente por el resultado.
Balance - Pasivos y patrimonio 31.12.2019 31.12.2018(MMCh$) (MMCh$)
Pasivos CorrientesOtros pasivos financieros corrientes 235.023 119.876Cntas. por pagar comerciales y otras cuentas por pagar49.464 51.317Cuentas por Pagar a Entidades Relacionadas, corrientes0 0Otras provisiones 1.225 2.261Pasivos por Impuestos corrientes 17.078 4.908Provisiones por beneficios a los empleados, corrientes5.021 4.534Otros pasivos no financieros corrientes 12.448 7.436Pasivos por arrendamiento, corrientes 988 0Total Pasivos Corrientes 321.246 190.332Pasivos No CorrientesOtros pasivos financieros, no corrientes 879.837 876.257Cuentas por pagar a entidades rel., no corrientes 0 3.168Pasivos por Impuestos Diferidos 247.849 214.750Otros pasivos no financieros, no corrientes 21.665 15.565Pasivos por arrendamiento, no corrientes 46.503 0Total Pasivos No corrientes 1.195.855 1.109.740Total Pasivos 1.517.101 1.300.072PatrimonioCapital Emitido 423.575 420.017Resultados Retenidos (Pérdidas Acumuladas)590.004 497.558Primas de Emisión 289 289Otras Reservas 50.580 1.963Patrimonio atrib. a los propietarios de controladora1.064.448 919.826Participaciones no controladoras 110.808 158.201Patrimonio Total 1.175.257 1.078.028Patrimonio Neto Y Pasivos, Total 2.692.358 2.378.100
Pasivos y patrimonio
Análisis de resultados
1. Economic Value Generated and Distributed calculated based on the GRI Guidelines, international standards for sustainability reporting.2. Cost of sales + Administrative expenses - Compensation - Property taxes - Municipal taxes.3. Financial expenses - Accrued stamp taxes.4. Current net tax + Property taxes + Municipal taxes + Stamp taxes paid
Highlights in 2020
Economic value distributed to society
12
PAR
QU
E A
RA
UC
O IN
TE
GR
AT
ED
RE
PO
RT
20
20
Message from the Chairman Message from the Executive Vice President Highlights in 2020
GOVERNANCEAND COMMUNITYINTRODUCTION ABOUT US
ECONOMIC PERFORMANCE
ENVIRONMENTAL PERFORMANCE
SOCIAL PERFORMANCE
ADDITIONAL INFORMATION
FINANCIAL INFORMATION
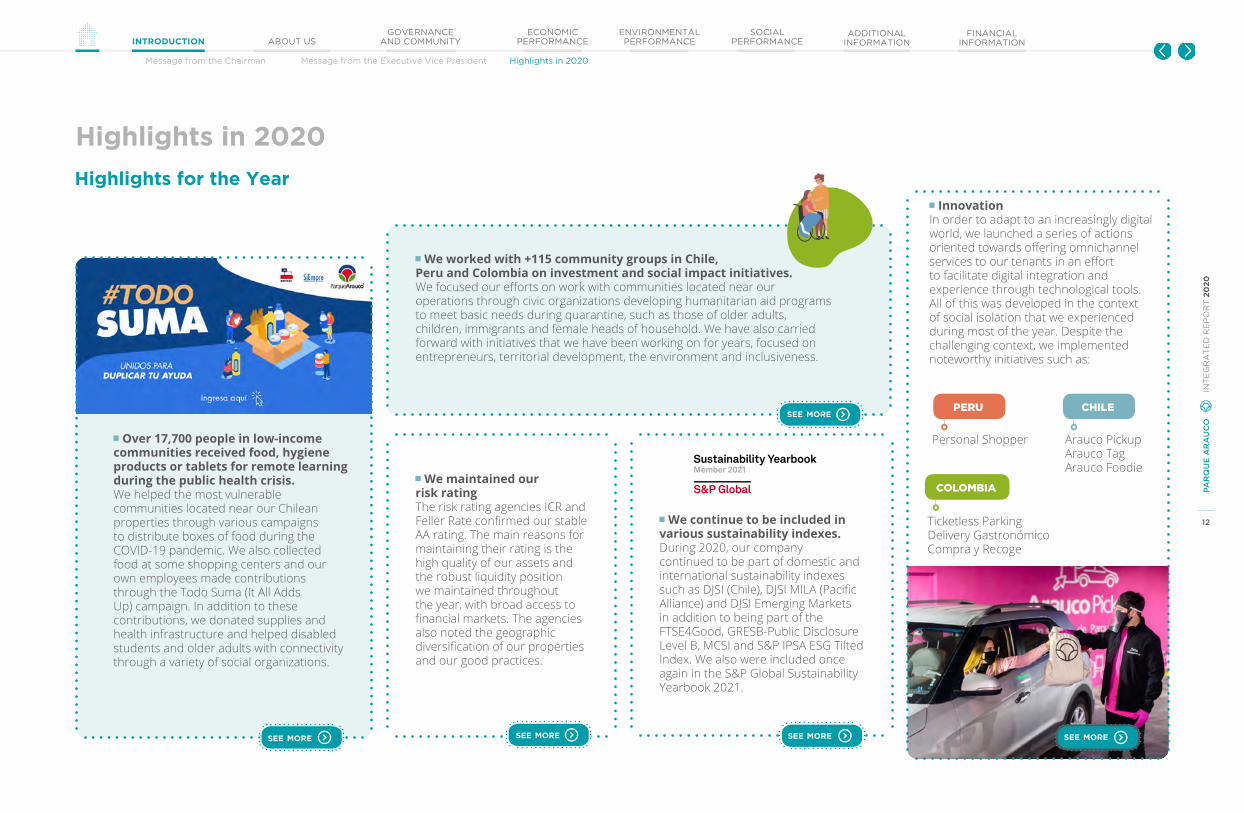
Highlights for the Year
Over 17,700 people in low-income communities received food, hygiene products or tablets for remote learning during the public health crisis.We helped the most vulnerable communities located near our Chilean properties through various campaigns to distribute boxes of food during the COVID-19 pandemic. We also collected food at some shopping centers and our own employees made contributions through the Todo Suma (It All Adds Up) campaign. In addition to these contributions, we donated supplies and health infrastructure and helped disabled students and older adults with connectivity through a variety of social organizations.
see more
We maintained our risk ratingThe risk rating agencies ICR and Feller Rate confirmed our stable AA rating. The main reasons for maintaining their rating is the high quality of our assets and the robust liquidity position we maintained throughout the year, with broad access to financial markets. The agencies also noted the geographic diversification of our properties and our good practices.
see more
Highlights in 2020
We continue to be included in various sustainability indexes.During 2020, our company continued to be part of domestic and international sustainability indexes such as DJSI (Chile), DJSI MILA (Pacific Alliance) and DJSI Emerging Markets in addition to being part of the FTSE4Good, GRESB-Public Disclosure Level B, MCSI and S&P IPSA ESG Tilted Index. We also were included once again in the S&P Global Sustainability Yearbook 2021.
see more
We worked with +115 community groups in Chile, Peru and Colombia on investment and social impact initiatives.We focused our efforts on work with communities located near our operations through civic organizations developing humanitarian aid programs to meet basic needs during quarantine, such as those of older adults, children, immigrants and female heads of household. We have also carried forward with initiatives that we have been working on for years, focused on entrepreneurs, territorial development, the environment and inclusiveness.
see more
Innovation In order to adapt to an increasingly digital world, we launched a series of actions oriented towards offering omnichannel services to our tenants in an effort to facilitate digital integration and experience through technological tools. All of this was developed in the context of social isolation that we experienced during most of the year. Despite the challenging context, we implemented noteworthy initiatives such as:
see more
peru
Personal Shopper
chile
Arauco Pickup Arauco Tag Arauco Foodie
colombia
Ticketless ParkingDelivery GastronómicoCompra y Recoge

13
PAR
QU
E A
RA
UC
O IN
TE
GR
AT
ED
RE
PO
RT
20
20
Message from the Chairman Message from the Executive Vice President Highlights in 2020
GOVERNANCEAND COMMUNITYINTRODUCTION ABOUT US
ECONOMIC PERFORMANCE
ENVIRONMENTAL PERFORMANCE
SOCIAL PERFORMANCE
ADDITIONAL INFORMATION
FINANCIAL INFORMATION
see more
Partnerships for promoting electromobility We joined Enel X a few years ago to install electric car charging stations at Parque Arauco Kennedy. A new agreement will allow us to add eight new chargers during the expansion of this shopping center. We also signed an agreement with Engie Peru for electric vehicle charging through the installation of two charging stations, one in Larcomar and one in Parque Lambramani, thus moving forward to install chargers at key properties.
Agreement to move towards renewable energyWe signed a five-year agreement with Engie to increase renewable energy consumption in our portfolio of assets in Chile. This initiative involves a supply of 120 Gwh/year of certified renewable energy to operate our shopping centers in Santiago and other Chilean cities. It comes in addition to our efforts to boost our renewable energy consumption in Peru and Colombia.
see more
Highlights in 2020
Bonds issuedAs part of our plan to strengthen the company’s financial position, we refinanced our short- and medium-term obligations and issued two series of bonds as part of the new financing. We were the first issuer to place a bond in the Chilean market after the pandemic began. The bond was the X Series, with a five-year term, for UF 2 million, and it was issued at an annual rate of 2.2%. We then issued the AA Series at ten years for UF 5 million with an annual rate of 1.5%.
see more
Highlights for the Year The Shopping Evolution
Together with Fundación Chile and Chile Global Ventures, we launched the Shopping Evolution program to integrate digitally-based enterprises into our business. A total of 121 startups from 14 countries answered our call, submitting innovation initiatives in the “customer experience” and “efficiency and sustainability” categories in order to integrate technological developments into the operation of our shopping centers in Chile, Peru and Colombia,
see more
ISO 14001 certification for Parque La Colina and Parque Arboleda in ColombiaIn 2020, we secured ISO 14001 certification for two of our shopping centers, which is aligned with environmental compliance standards and impact minimization. This recognition was achieved through the implementation of an environmental management system that includes a rainwater capture system, 100% LED light bulb use, comprehensive waste management and a reduced carbon footprint.
see more
see more
We facilitated the liquidity of our value chainWe paid invoices totaling CLP$738 million in advance using reverse factoring provided by the company Cumplo. This streamlined the payment process and strengthened our suppliers’ liquidity during times of crisis. We applied the same discount rates regardless of the type and size of supplier. The effort was launched in November. By the end of 2020, we had shared this option with 783 of our suppliers.

14
PAR
QU
E A
RA
UC
O IN
TE
GR
AT
ED
RE
PO
RT
20
20
Message from the Chairman Message from the Executive Vice President Highlights in 2020
GOVERNANCEAND COMMUNITYINTRODUCTION ABOUT US
ECONOMIC PERFORMANCE
ENVIRONMENTAL PERFORMANCE
SOCIAL PERFORMANCE
ADDITIONAL INFORMATION
FINANCIAL INFORMATION
Highlights in 2020
Addressing COVID-19: Managing the public health crisis
With contractors, we established plans to generate support due to the challenging situation and promoted training, health protocols, infrastructure, technology and self-care.
see more
COMMITMENT TO PEOPLEWe decided to suspend any movement or termination of employees between March and September. We also helped introduce telecommuting when possible and developed strict health and safety protocols for critical operational roles, which were monitored on an ongoing basis.
see more We also made an effort to deepen communication and work with communities around us, and strived to support them during these times of crisis. In that spirit, we developed actions in partnership with civic organizations to provide humanitarian assistance to the most vulnerable individuals. In parallel, we focused on supporting economic reactivation by reinforcing initiatives for emerging entrepreneurs in our shopping centers. While such initiatives had already been in place for several years, efforts intensified during this period.
see more
14
PA
RQ
UE
AR
AU
CO
IN
TE
GR
AT
ED
RE
PO
RT
20
20
15
PAR
QU
E A
RA
UC
O IN
TE
GR
AT
ED
RE
PO
RT
20
20
Message from the Chairman Message from the Executive Vice President Highlights in 2020
GOVERNANCEAND COMMUNITYINTRODUCTION ABOUT US
ECONOMIC PERFORMANCE
ENVIRONMENTAL PERFORMANCE
SOCIAL PERFORMANCE
ADDITIONAL INFORMATION
FINANCIAL INFORMATION
Highlights in 2020
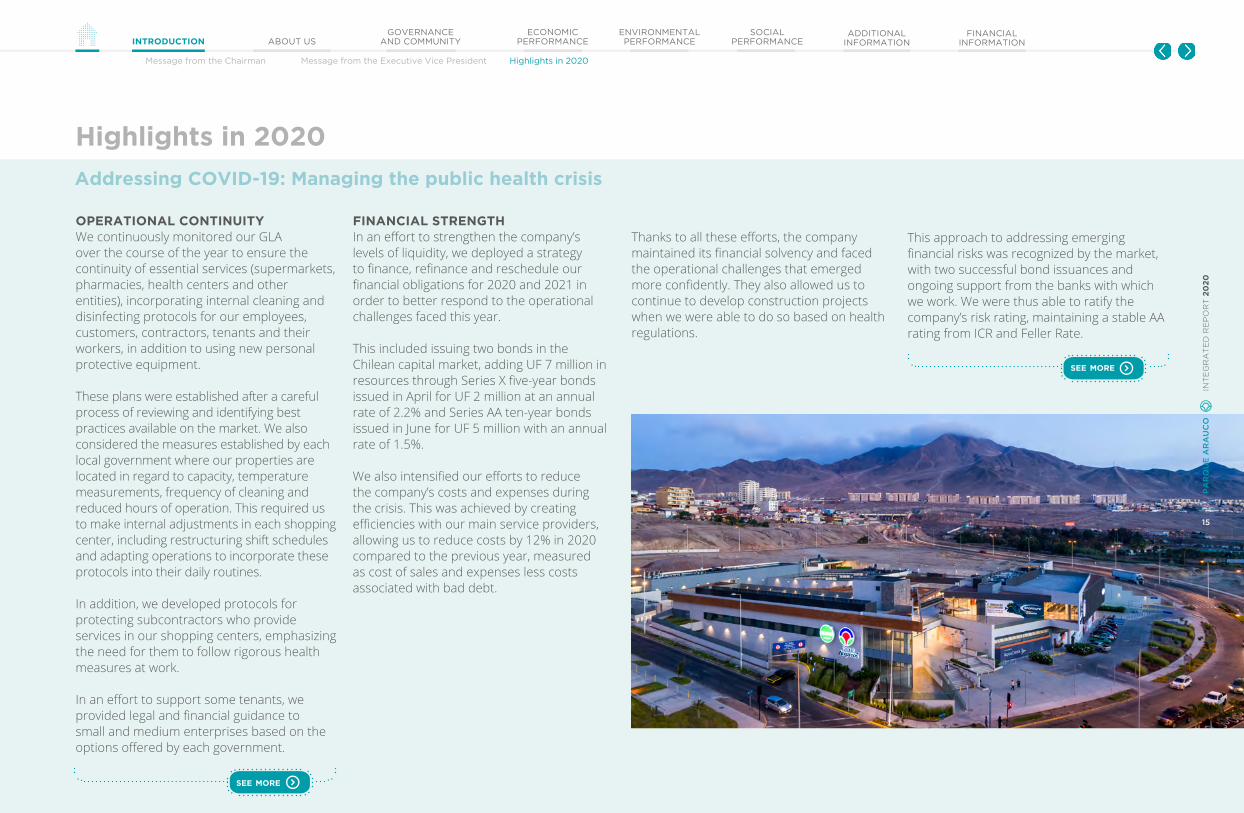
FINANCIAL STRENGTHIn an effort to strengthen the company’s levels of liquidity, we deployed a strategy to finance, refinance and reschedule our financial obligations for 2020 and 2021 in order to better respond to the operational challenges faced this year.
This included issuing two bonds in the Chilean capital market, adding UF 7 million in resources through Series X five-year bonds issued in April for UF 2 million at an annual rate of 2.2% and Series AA ten-year bonds issued in June for UF 5 million with an annual rate of 1.5%.
We also intensified our efforts to reduce the company’s costs and expenses during the crisis. This was achieved by creating efficiencies with our main service providers, allowing us to reduce costs by 12% in 2020 compared to the previous year, measured as cost of sales and expenses less costs associated with bad debt.
OPERATIONAL CONTINUITYWe continuously monitored our GLA over the course of the year to ensure the continuity of essential services (supermarkets, pharmacies, health centers and other entities), incorporating internal cleaning and disinfecting protocols for our employees, customers, contractors, tenants and their workers, in addition to using new personal protective equipment.
These plans were established after a careful process of reviewing and identifying best practices available on the market. We also considered the measures established by each local government where our properties are located in regard to capacity, temperature measurements, frequency of cleaning and reduced hours of operation. This required us to make internal adjustments in each shopping center, including restructuring shift schedules and adapting operations to incorporate these protocols into their daily routines.
In addition, we developed protocols for protecting subcontractors who provide services in our shopping centers, emphasizing the need for them to follow rigorous health measures at work.
In an effort to support some tenants, we provided legal and financial guidance to small and medium enterprises based on the options offered by each government.
This approach to addressing emerging financial risks was recognized by the market, with two successful bond issuances and ongoing support from the banks with which we work. We were thus able to ratify the company’s risk rating, maintaining a stable AA rating from ICR and Feller Rate.
Thanks to all these efforts, the company maintained its financial solvency and faced the operational challenges that emerged more confidently. They also allowed us to continue to develop construction projects when we were able to do so based on health regulations.
Addressing COVID-19: Managing the public health crisis
see more
see more
15
PA
RQ
UE
AR
AU
CO
IN
TE
GR
AT
ED
RE
PO
RT
20
20
16
PAR
QU
E A
RA
UC
O IN
TE
GR
AT
ED
RE
PO
RT
20
20
Message from the Chairman Message from the Executive Vice President Highlights in 2020
GOVERNANCEAND COMMUNITYINTRODUCTION ABOUT US
ECONOMIC PERFORMANCE
ENVIRONMENTAL PERFORMANCE
SOCIAL PERFORMANCE
ADDITIONAL INFORMATION
FINANCIAL INFORMATION
Highlights in 2020
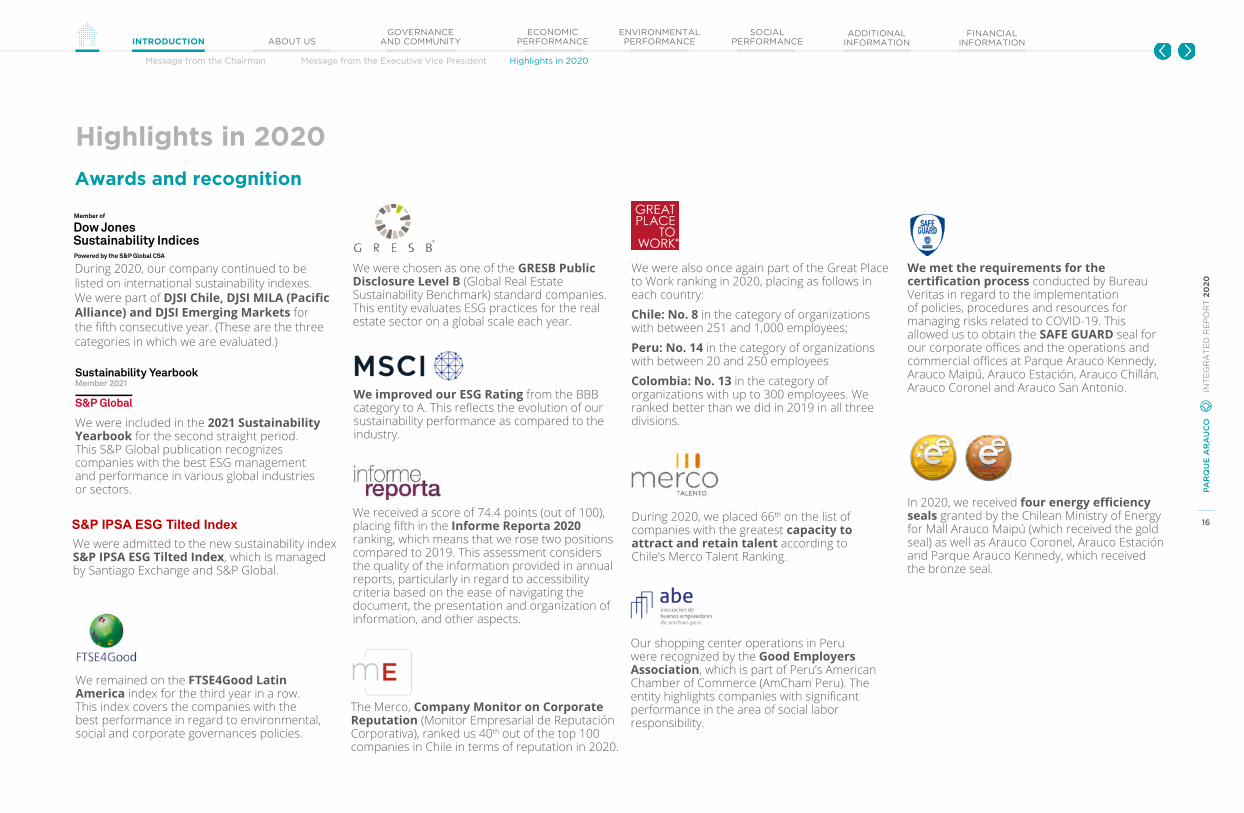
During 2020, our company continued to be listed on international sustainability indexes. We were part of DJSI Chile, DJSI MILA (Pacific Alliance) and DJSI Emerging Markets for the fifth consecutive year. (These are the three categories in which we are evaluated.)
We were included in the 2021 Sustainability Yearbook for the second straight period. This S&P Global publication recognizes companies with the best ESG management and performance in various global industries or sectors.
We remained on the FTSE4Good Latin America index for the third year in a row. This index covers the companies with the best performance in regard to environmental, social and corporate governances policies.
We met the requirements for the certification process conducted by Bureau Veritas in regard to the implementation of policies, procedures and resources for managing risks related to COVID-19. This allowed us to obtain the SAFE GUARD seal for our corporate offices and the operations and commercial offices at Parque Arauco Kennedy, Arauco Maipú, Arauco Estación, Arauco Chillán, Arauco Coronel and Arauco San Antonio.
We were also once again part of the Great Place to Work ranking in 2020, placing as follows in each country:
Chile: No. 8 in the category of organizations with between 251 and 1,000 employees;
Peru: No. 14 in the category of organizations with between 20 and 250 employees
Colombia: No. 13 in the category of organizations with up to 300 employees. We ranked better than we did in 2019 in all three divisions.
During 2020, we placed 66th on the list of companies with the greatest capacity to attract and retain talent according to Chile’s Merco Talent Ranking.
The Merco, Company Monitor on Corporate Reputation (Monitor Empresarial de Reputación Corporativa), ranked us 40th out of the top 100 companies in Chile in terms of reputation in 2020.
In 2020, we received four energy efficiency seals granted by the Chilean Ministry of Energy for Mall Arauco Maipú (which received the gold seal) as well as Arauco Coronel, Arauco Estación and Parque Arauco Kennedy, which received the bronze seal.
S&P IPSA ESG Tilted Index
Awards and recognition
We were admitted to the new sustainability index S&P IPSA ESG Tilted Index, which is managed by Santiago Exchange and S&P Global.
We received a score of 74.4 points (out of 100), placing fifth in the Informe Reporta 2020 ranking, which means that we rose two positions compared to 2019. This assessment considers the quality of the information provided in annual reports, particularly in regard to accessibility criteria based on the ease of navigating the document, the presentation and organization of information, and other aspects.
We improved our ESG Rating from the BBB category to A. This reflects the evolution of our sustainability performance as compared to the industry.
We were chosen as one of the GRESB Public Disclosure Level B (Global Real Estate Sustainability Benchmark) standard companies. This entity evaluates ESG practices for the real estate sector on a global scale each year.
Our shopping center operations in Peru were recognized by the Good Employers Association, which is part of Peru’s American Chamber of Commerce (AmCham Peru). The entity highlights companies with significant performance in the area of social labor responsibility.
17
PAR
QU
E A
RA
UC
O IN
TE
GR
AT
ED
RE
PO
RT
20
20
GOVERNANCEAND COMMUNITYINTRODUCTION ABOUT US
ECONOMIC PERFORMANCE
ENVIRONMENTAL PERFORMANCE
SOCIAL PERFORMANCE
ADDITIONAL INFORMATION
FINANCIAL INFORMATION
Parque Arauco at a glance The principles that move us Our history Key figures
About us 1.1 Parque Arauco at a glance
1.2 The principles that move us
1.3 Our history
1.4 Key figures
01.
18
PAR
QU
E A
RA
UC
O IN
TE
GR
AT
ED
RE
PO
RT
20
20
GOVERNANCEAND COMMUNITYINTRODUCTION ABOUT US
ECONOMIC PERFORMANCE
ENVIRONMENTAL PERFORMANCE
SOCIAL PERFORMANCE
ADDITIONAL INFORMATION
FINANCIAL INFORMATION
Parque Arauco at a glance The principles that move us Our history Key figures
1.1 Parque Arauco at a glance
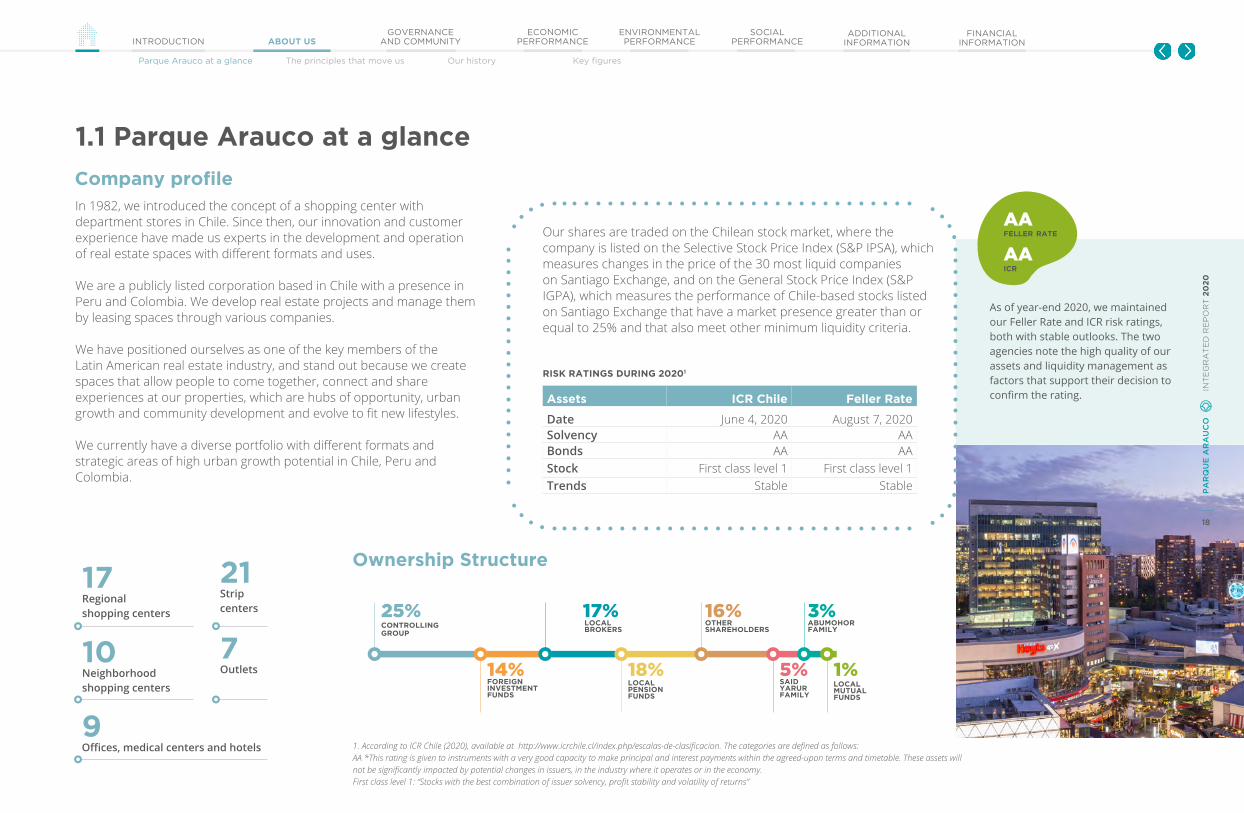
In 1982, we introduced the concept of a shopping center with department stores in Chile. Since then, our innovation and customer experience have made us experts in the development and operation of real estate spaces with different formats and uses.
We are a publicly listed corporation based in Chile with a presence in Peru and Colombia. We develop real estate projects and manage them by leasing spaces through various companies.
We have positioned ourselves as one of the key members of the Latin American real estate industry, and stand out because we create spaces that allow people to come together, connect and share experiences at our properties, which are hubs of opportunity, urban growth and community development and evolve to fit new lifestyles.
We currently have a diverse portfolio with different formats and strategic areas of high urban growth potential in Chile, Peru and Colombia.
Our shares are traded on the Chilean stock market, where the company is listed on the Selective Stock Price Index (S&P IPSA), which measures changes in the price of the 30 most liquid companies on Santiago Exchange, and on the General Stock Price Index (S&P IGPA), which measures the performance of Chile-based stocks listed on Santiago Exchange that have a market presence greater than or equal to 25% and that also meet other minimum liquidity criteria.
17Regionalshopping centers
10Neighborhoodshopping centers
21Strip centers
7Outlets
9Offices, medical centers and hotels
feller rate
icr
AA
AA
As of year-end 2020, we maintained our Feller Rate and ICR risk ratings, both with stable outlooks. The two agencies note the high quality of our assets and liquidity management as factors that support their decision to confirm the rating.
cONTROLLING GROUP
25% 17%
Assets ICR Chile Feller Rate
Date June 4, 2020 August 7, 2020Solvency AA AABonds AA AAStock First class level 1 First class level 1Trends Stable Stable
RISK RATINGS DURING 20201
1. According to ICR Chile (2020), available at http://www.icrchile.cl/index.php/escalas-de-clasificacion. The categories are defined as follows:AA *This rating is given to instruments with a very good capacity to make principal and interest payments within the agreed-upon terms and timetable. These assets will not be significantly impacted by potential changes in issuers, in the industry where it operates or in the economy.First class level 1: “Stocks with the best combination of issuer solvency, profit stability and volatility of returns”
Company profile
Ownership Structure
FOREIGNINVESTMENTFUNDS
14%
LOCAL BROKERS
LOCALPENSIONFUNDS
18%
OTHER SHAREHOLDERS
16%
SAIDYARURFAMILY
5%
ABUMOHORFAMILY
3%
lOCAL MUTUAL FUNDS
1%
18
PA
RQ
UE
AR
AU
CO
IN
TE
GR
AT
ED
RE
PO
RT
20
20

19
PAR
QU
E A
RA
UC
O IN
TE
GR
AT
ED
RE
PO
RT
20
20
GOVERNANCEAND COMMUNITYINTRODUCTION ABOUT US
ECONOMIC PERFORMANCE
ENVIRONMENTAL PERFORMANCE
SOCIAL PERFORMANCE
ADDITIONAL INFORMATION
FINANCIAL INFORMATION
Parque Arauco at a glance The principles that move us Our history Key figures
peru
upper-miDDle
chile
miDDle
colombia
lower-miDDle
28.4%
43%
55.8%
50%
15.8%
7%
country
socio-economic
group
regionalshoppingcenter
81%OUTLET8%
NEIGHBORHOOD SHOPPING CENTER
6%
STRIPCENTERS
5%format
Figures as of December 31, 2020
1.1 Parque Arauco at a glance
Latin America
Public Disclosure
Chile
Chile
S&P IPSAS&P IGPA
sustainability inDexes
market inDexes
DJSI ChileDJSI MILA Latin American Integrated MarketDJSI Emerging Markets Asia, Latin America and other emerging countries
S&P IPSA ESG Tilted Index
MSCI A Rating
Company profile Revenue diversification
S&P IPSA ESG Tilted Index

20
PAR
QU
E A
RA
UC
O IN
TE
GR
AT
ED
RE
PO
RT
20
20
GOVERNANCEAND COMMUNITYINTRODUCTION ABOUT US
ECONOMIC PERFORMANCE
ENVIRONMENTAL PERFORMANCE
SOCIAL PERFORMANCE
ADDITIONAL INFORMATION
FINANCIAL INFORMATION
Parque Arauco at a glance The principles that move us Our history Key figures
512,000 m2 405,500 m2 154,000 m2
10% 14% 8%
31 20 4
95.0% 87.0% 92.5%
GLA GLA GLA
Market share1 Market share1 Market share2
Properties Properties Properties
Occupancy Occupancy Occupancy
1.1 Parque Arauco at a glance
Regional presenceInformation as of December 2020
1. Sources: Chilean Shopping Center Association (CCCh); Peruvian Shopping Center Association (ACCEP).2. Considering fully-owned shopping centers. General market share was 3%. Source: Colombian Shopping Center Association (Acecolombia).
per
u
co
lom
bia
ch
ile

21
PAR
QU
E A
RA
UC
O IN
TE
GR
AT
ED
RE
PO
RT
20
20
GOVERNANCEAND COMMUNITYINTRODUCTION ABOUT US
ECONOMIC PERFORMANCE
ENVIRONMENTAL PERFORMANCE
SOCIAL PERFORMANCE
ADDITIONAL INFORMATION
FINANCIAL INFORMATION
Parque Arauco at a glance The principles that move us Our history Key figures
31Real estate assets
512,000 m2
Total Gross Leasable Area (GLA)
395,400 m2
Company-owned Gross Leasable Area (GLA)
95%Average occupancy
18 yearsAverage age of the properties in our portfolio
1,487Tenants
311Employees
Calama Arauco Express CalamaAntofagasta Arauco Express Antofagasta Parque Angamos Puerto NuevoCoquimbo Arauco Premium Outlet Coquimbo Rosario Arauco ExpressViña del Mar Arauco Express PalmaresValparaíso Arauco Premium Outlet CuraumaSan Antonio Arauco San AntonioSantiago Parque Arauco Kennedy Arauco Maipú Arauco Estación Arauco Quilicura Arauco El Bosque Arauco Premium Outlet Buenaventura Arauco Express:
Las Brujas Colón Irarrázaval El Carmen Pajaritos Manuel Montt Luis Pasteur Boulevard Ciudad Empresarial Recoleta La Reina El Peñón Ciudad Empresarial Chicauma
Chillán Arauco ChillánConcepción Arauco Premium Outlet San PedroCoronel Arauco Coronel
Regional shopping center Neighborhood shopping center Strip center Outlet
1.1 Parque Arauco at a glance
Chile

22
PAR
QU
E A
RA
UC
O IN
TE
GR
AT
ED
RE
PO
RT
20
20
GOVERNANCEAND COMMUNITYINTRODUCTION ABOUT US
ECONOMIC PERFORMANCE
ENVIRONMENTAL PERFORMANCE
SOCIAL PERFORMANCE
ADDITIONAL INFORMATION
FINANCIAL INFORMATION
Parque Arauco at a glance The principles that move us Our history Key figures
20Real estate assets
405,500 m2
Total Gross Leasable Area (GLA)
405,500 m2
Company-owned Gross Leasable Area (GLA)
87.0%Average occupancy
10 yearsAverage age of the properties in our portfolio
908Tenants
133Employees
Regional shopping center Neighborhood shopping center Strip center Outlet
1.1 Parque Arauco at a glance
Peru
MegaPlaza Express Jaén Jaén El Quinde Cajamarca Cajamarca MegaPlaza Chimbote Chimbote MegaPlaza Express Barranca Barranca MegaPlaza Huaral Huaral MegaPlaza Norte Larcomar MegaPlaza Express Villa El Salvador MegaPlaza Villa El Salvador II MegaPlaza Express Villa Chorrillos Lima Inoutlet Faucett Premium Outlet Lurín Viamix Chorrillos Viamix Las Malvinas Viamix Colonial MegaPlaza Cañete Cañete MegaPlaza Express Chincha Chincha MegaPlaza Express Pisco Pisco El Quinde Ica Ica Parque Lambramani Arequipa
23
PAR
QU
E A
RA
UC
O IN
TE
GR
AT
ED
RE
PO
RT
20
20
GOVERNANCEAND COMMUNITYINTRODUCTION ABOUT US
ECONOMIC PERFORMANCE
ENVIRONMENTAL PERFORMANCE
SOCIAL PERFORMANCE
ADDITIONAL INFORMATION
FINANCIAL INFORMATION
Parque Arauco at a glance The principles that move us Our history Key figures
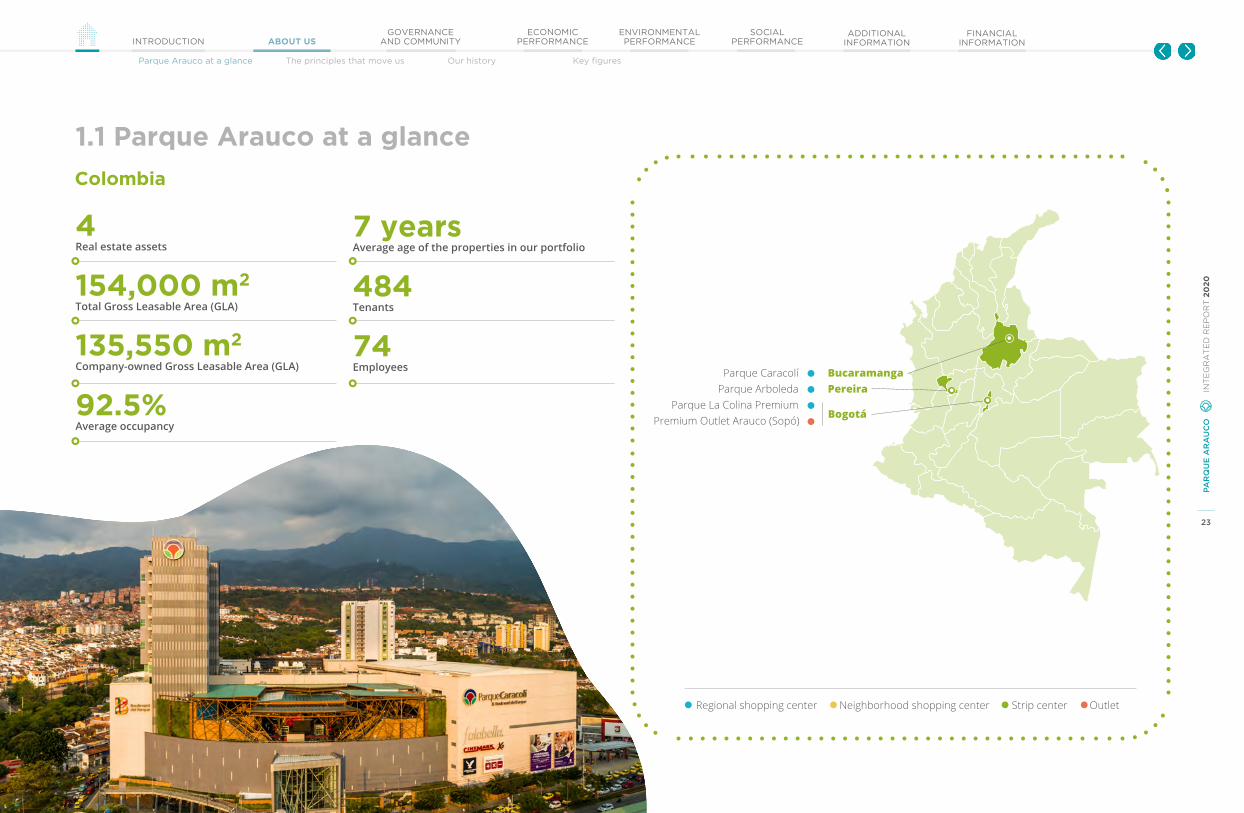
4Real estate assets
154,000 m2
Total Gross Leasable Area (GLA)
135,550 m2
Company-owned Gross Leasable Area (GLA)
92.5%Average occupancy
7 yearsAverage age of the properties in our portfolio
484Tenants
74Employees
Regional shopping center Neighborhood shopping center Strip center Outlet
1.1 Parque Arauco at a glance
Parque Caracolí Bucaramanga Parque Arboleda Pereira Parque La Colina Premium Premium Outlet Arauco (Sopó)
Colombia
Bogotá

24
PAR
QU
E A
RA
UC
O IN
TE
GR
AT
ED
RE
PO
RT
20
20
GOVERNANCEAND COMMUNITYINTRODUCTION ABOUT US
ECONOMIC PERFORMANCE
ENVIRONMENTAL PERFORMANCE
SOCIAL PERFORMANCE
ADDITIONAL INFORMATION
FINANCIAL INFORMATION
Parque Arauco at a glance The principles that move us Our history Key figures
1.2 The principles that move usIn this section, we present some of the principles that move us, the foundations upon which we build the company that we are and wish to be in the future. These are the elements that define our culture and how we do things.
∙ We are responsible in our treatment of and conduct towards all people: employees, tenants, customers and communities.
∙ We value everyone’s contribution without distinction.
∙ We are environmentally responsible.
∙ We follow the rules.∙ We behave ethically and
honestly, even in challenging contexts.
∙ We lead by example.
∙ We all contribute to creating a great place to work.
∙ We establish trust-based relationships.
∙ We do everything with passion.
∙ We seek creative solutions.∙ We (always!) want to surprise
internal and external customers.∙ We are open to learning and
continuous improvement.
∙ We fulfill our commitments.∙ We act with professionalism,
excellence and a sense of urgency.
∙ We mobilize to meet our challenges.
Our values
To create spaces that contribute to improving people’s lives.
our purpose

25
PAR
QU
E A
RA
UC
O IN
TE
GR
AT
ED
RE
PO
RT
20
20
GOVERNANCEAND COMMUNITYINTRODUCTION ABOUT US
ECONOMIC PERFORMANCE
ENVIRONMENTAL PERFORMANCE
SOCIAL PERFORMANCE
ADDITIONAL INFORMATION
FINANCIAL INFORMATION
Parque Arauco at a glance The principles that move us Our history Key figures
1.2 The principles that move us
Our business model
what guiDes us key inputs
organizational founDation
strategic principles
core business actiVities
Our purpose To create spaces that
contribute to improving people's lives
Our mission To be leaders in
developing and operating real estate assets, through profitable and sustainable growth that generates value for our stakeholders.
Our values Corporate governanceand ethical culture
Commitment tosustainable development
Search for strategic locations We get to know cities, which allows us to develop and
conceptualize shopping centers that adapt to the needs and lifestyles of the people in the surrounding area.
Developing spaces We bring life to customized commercial concepts,
transforming spaces to combine the proper size, suitable infrastructure and optimal commercial mix.
Operation and focus on experience Once the project is built and leased to tenants, we
focus on continually improving the experience that we offer our final customers.
Financial capital
Growth Profitability Sustainability
1. In December 2020.2. Percentage of suppliers with 30-day payment terms: Chile 96%, Peru 40% and Colombia 95%.
customers
satisfaction
86%
Real estate assets
Environmental performance
the enVironment
of total energy consumeD at our shopping centers comes from renewable resources.
71%
employees
internal satisfaction
88%
Our team
shareholDers
ebitDa margin
52%
Financial capital
suppliers
of payments are maDe within 30 Days in chile, peru anD colombia.2
68%
Our relationship with our suppliers
community
ciVic anD local organizations were supporteD with proJects or actiVities at our shopping centers.
+115
Social performance
Real estate assets
Social performance
Environmental management
Our team
Our relationship with our suppliers
26
PAR
QU
E A
RA
UC
O IN
TE
GR
AT
ED
RE
PO
RT
20
20
GOVERNANCEAND COMMUNITYINTRODUCTION ABOUT US
ECONOMIC PERFORMANCE
ENVIRONMENTAL PERFORMANCE
SOCIAL PERFORMANCE
ADDITIONAL INFORMATION
FINANCIAL INFORMATION
Parque Arauco at a glance The principles that move us Our history Key figures
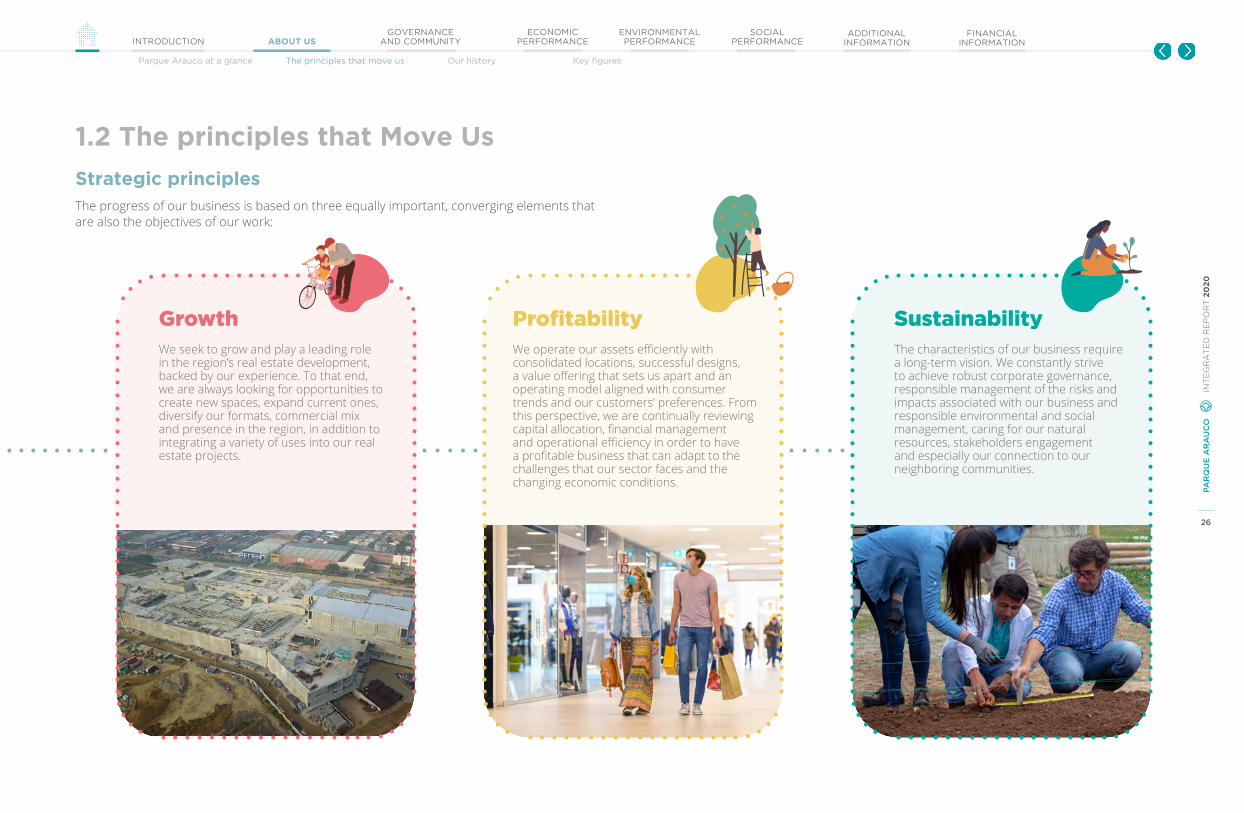
GrowthWe seek to grow and play a leading role in the region’s real estate development, backed by our experience. To that end, we are always looking for opportunities to create new spaces, expand current ones, diversify our formats, commercial mix and presence in the region, in addition to integrating a variety of uses into our real estate projects.
ProfitabilityWe operate our assets efficiently with consolidated locations, successful designs, a value offering that sets us apart and an operating model aligned with consumer trends and our customers’ preferences. From this perspective, we are continually reviewing capital allocation, financial management and operational efficiency in order to have a profitable business that can adapt to the challenges that our sector faces and the changing economic conditions.
SustainabilityThe characteristics of our business require a long-term vision. We constantly strive to achieve robust corporate governance, responsible management of the risks and impacts associated with our business and responsible environmental and social management, caring for our natural resources, stakeholders engagement and especially our connection to our neighboring communities.
1.2 The principles that Move Us
Strategic principlesThe progress of our business is based on three equally important, converging elements that are also the objectives of our work:
27
PAR
QU
E A
RA
UC
O IN
TE
GR
AT
ED
RE
PO
RT
20
20
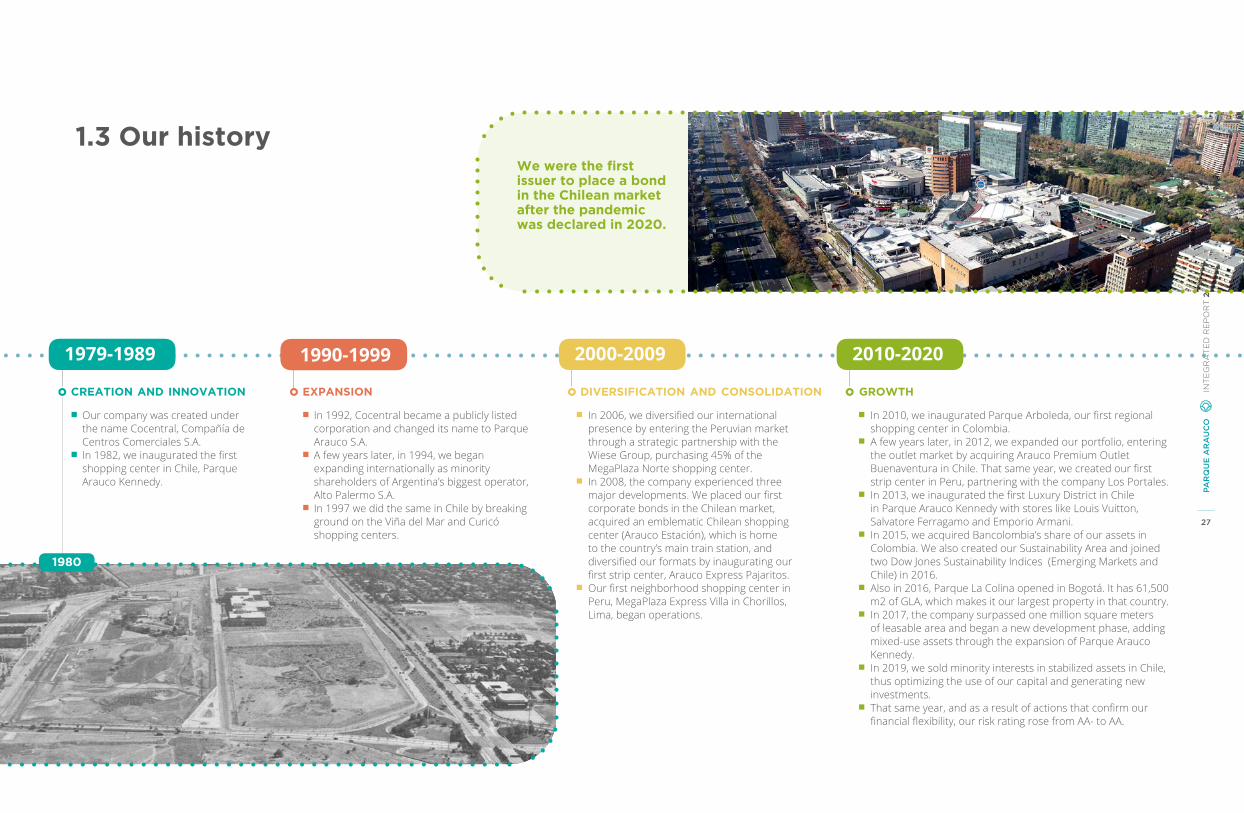
1979-1989
Our company was created under the name Cocentral, Compañía de Centros Comerciales S.A.
In 1982, we inaugurated the first shopping center in Chile, Parque Arauco Kennedy.
creation anD innoVation
1990-1999
In 1992, Cocentral became a publicly listed corporation and changed its name to Parque Arauco S.A.
A few years later, in 1994, we began expanding internationally as minority shareholders of Argentina’s biggest operator, Alto Palermo S.A.
In 1997 we did the same in Chile by breaking ground on the Viña del Mar and Curicó shopping centers.
expansion
In 2010, we inaugurated Parque Arboleda, our first regional shopping center in Colombia.
A few years later, in 2012, we expanded our portfolio, entering the outlet market by acquiring Arauco Premium Outlet Buenaventura in Chile. That same year, we created our first strip center in Peru, partnering with the company Los Portales.
In 2013, we inaugurated the first Luxury District in Chile in Parque Arauco Kennedy with stores like Louis Vuitton, Salvatore Ferragamo and Emporio Armani.
In 2015, we acquired Bancolombia’s share of our assets in Colombia. We also created our Sustainability Area and joined two Dow Jones Sustainability Indices (Emerging Markets and Chile) in 2016.
Also in 2016, Parque La Colina opened in Bogotá. It has 61,500 m2 of GLA, which makes it our largest property in that country.
In 2017, the company surpassed one million square meters of leasable area and began a new development phase, adding mixed-use assets through the expansion of Parque Arauco Kennedy.
In 2019, we sold minority interests in stabilized assets in Chile, thus optimizing the use of our capital and generating new investments.
That same year, and as a result of actions that confirm our financial flexibility, our risk rating rose from AA- to AA.
growth
2010-20202000-2009
In 2006, we diversified our international presence by entering the Peruvian market through a strategic partnership with the Wiese Group, purchasing 45% of the MegaPlaza Norte shopping center.
In 2008, the company experienced three major developments. We placed our first corporate bonds in the Chilean market, acquired an emblematic Chilean shopping center (Arauco Estación), which is home to the country’s main train station, and diversified our formats by inaugurating our first strip center, Arauco Express Pajaritos.
Our first neighborhood shopping center in Peru, MegaPlaza Express Villa in Chorillos, Lima, began operations.
DiVersification anD consoliDation
1980
1.3 Our historyWe were the first issuer to place a bond in the Chilean market after the pandemic was declared in 2020.

28
PAR
QU
E A
RA
UC
O IN
TE
GR
AT
ED
RE
PO
RT
20
20
Tribute to José Said
In July 2020, we lamented the loss of Mr. José Said Saffie at the age of 90. He was the founder and served as the Chairman of Parque Arauco's Board until his passing. His vision and leadership shaped the direction of our company and the achievement of our most important milestones in growth, innovation and national and international consolidation.
The company’s culture and values reflect his way of doing business, his closeness and respect for others, and influenced what we are today as a company.
We are grateful and proud of his legacy. In the paragraphs that follow, we share some of the most important moments of his participation and leadership in Parque Arauco.
1. Peru Retail (2019). Parque Arauco became full owner of MegaPlaza
the origin of parque arauco kenneDyIn 1979, in partnership with his uncle, Domingo Said Kattan, the architects Bendersky y Brunietti and the multinational Paulista CBPI Internacional, José Said and his friends Orlando Sáenz and José Domingo Eluchans created what would be the first shopping center in Chile with a leasing model, a pioneer in urban development and benchmark for innovation in the real estate industry in Chile and the region.
The objective of this new space was not only to expand access to goods and services. From the beginning, the group of founders sought to create an iconic space to contribute to cultural life, interaction and coming together that would evolve and stay current despite the passage of time.
promoting growthJosé Said promoted the company’s expansion based on his constant search for innovation and growth and his desire to create a leading company in the industry both nationally and internationally. The mall concept expanded in Chile and in other countries, and we developed plans for growth in Chile, Peru and Colombia.
The internationalization approach was also one of the goals pursued under his leadership. Another important step was expanding to Peru in 2006 through a partnership with the Wiese Group. This partnership further elucidates José Said’s work style, which involved favoring joint ventures and building relationships of trust. “I wouldn’t do any business without partners, because partnerships are essential” was one of his sayings, and he put it into practice several times over the history of Parque Arauco. He later had the opportunity to expand to Colombia, once again through a partnership with a local stakeholder through Parque Arauco’s investment in Mall Parque Arboleda in the city of Pereira.
DiVersification anD innoVationWith José Said at the helm as Chairman, Parque Arauco developed new concepts in the industry, innovating in operations, service mix and formats. Examples include the investments in Arauco Estación, an emblematic shopping center in our portfolio located in Chile’s main train station, and the diversification towards strip centers, outlets and mixed-use properties in our main locations.
In this same context, in 2013 we inaugurated Chile's first luxury district, a successful format that brings together sophisticated international brands. In 2016, we inaugurated Parque La Colina, an attractive mall with the leasing model that has been a stand-out in Bogotá.
29
PAR
QU
E A
RA
UC
O IN
TE
GR
AT
ED
RE
PO
RT
20
20
GOVERNANCEAND COMMUNITYINTRODUCTION ABOUT US
ECONOMIC PERFORMANCE
ENVIRONMENTAL PERFORMANCE
SOCIAL PERFORMANCE
ADDITIONAL INFORMATION
FINANCIAL INFORMATION
Parque Arauco at a glance The principles that move us Our history Key figures
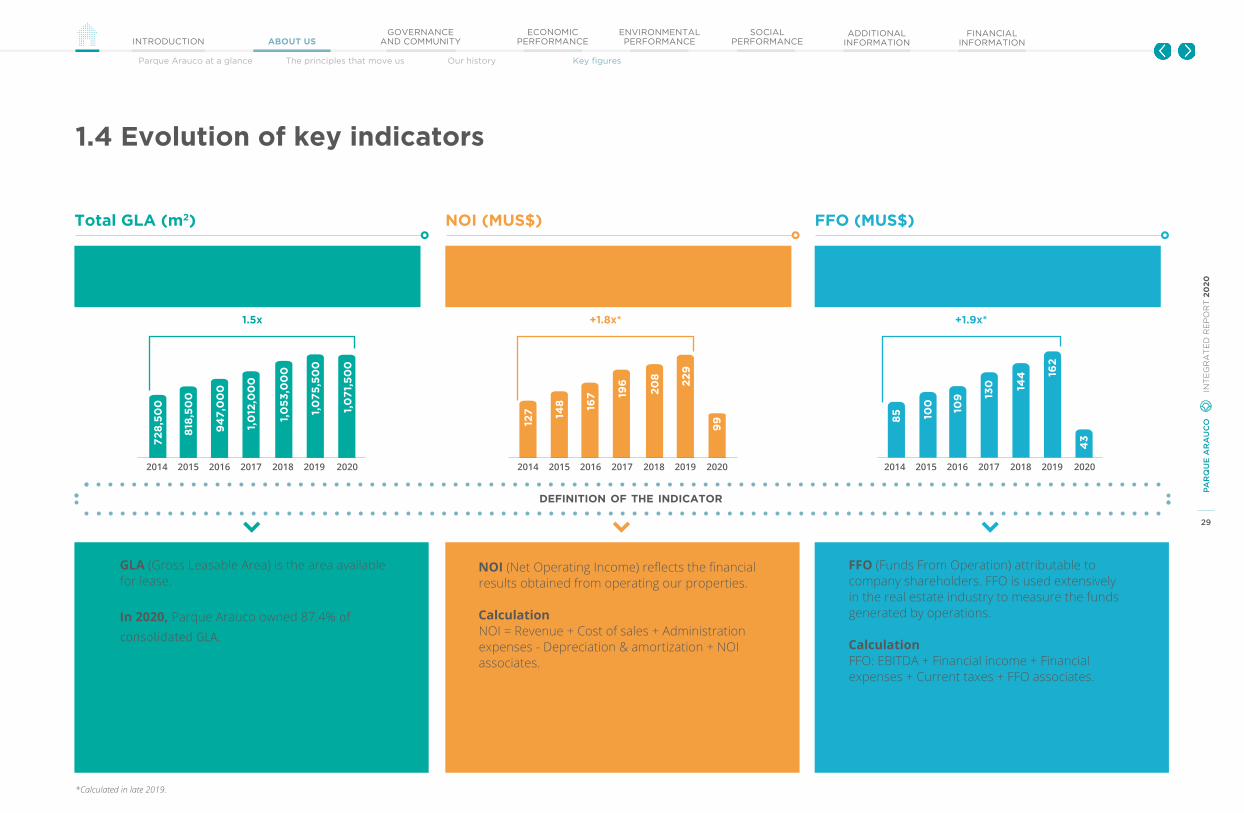
Total GLA (m2) NOI (MUS$) FFO (MUS$)
1,071,500 m2
2020US$ 99 million
2020US$ 43 million
2020
GLA (Gross Leasable Area) is the area available for lease.
In 2020, Parque Arauco owned 87.4% of consolidated GLA.
NOI (Net Operating Income) reflects the financial results obtained from operating our properties.
Calculation NOI = Revenue + Cost of sales + Administration
expenses - Depreciation & amortization + NOI associates.
FFO (Funds From Operation) attributable to company shareholders. FFO is used extensively in the real estate industry to measure the funds generated by operations.
Calculation FFO: EBITDA + Financial income + Financial
expenses + Current taxes + FFO associates.
Definition of the inDicator
2014 2015 2016 2017 2018 2019 2020
72
8,5
00
818
,50
0
94
7,0
00
1,0
12,0
00
1,0
53
,00
0
1,0
75
,50
0
1,0
71,
50
0
2014 2015 2016 2017 2018 2019 2020
127 14
8 167 19
6
20
8
22
9
99 8
5 100
109 13
0 144 16
2
43
2014 2015 2016 2017 2018 2019 2020
+1.9x*+1.8x*1.5x
*Calculated in late 2019.
1.4 Evolution of key indicators
30
PAR
QU
E A
RA
UC
O IN
TE
GR
AT
ED
RE
PO
RT
20
20
GOVERNANCE AND COMMUNITYINTRODUCTION ABOUT US
ECONOMIC PERFORMANCE
ENVIRONMENTAL PERFORMANCE
SOCIAL PERFORMANCE
ADDITIONAL INFORMATION
Our corporate governance Management structure and performance The cornerstones of our work Our business environment Sustainability management
FINANCIAL INFORMATION
02.Governance and community
2.1 Our corporate governance
2.2 Management structure and performance
2.3 The cornerstones of our work
2.4 Our business environment
2.5 Sustainability management
31
PAR
QU
E A
RA
UC
O IN
TE
GR
AT
ED
RE
PO
RT
20
20
GOVERNANCE AND COMMUNITYINTRODUCTION ABOUT US
ECONOMIC PERFORMANCE
ENVIRONMENTAL PERFORMANCE
SOCIAL PERFORMANCE
ADDITIONAL INFORMATION
Our corporate governance Management structure and performance The cornerstones of our work Our business environment Sustainability management
FINANCIAL INFORMATION
2.1 Our corporate governance
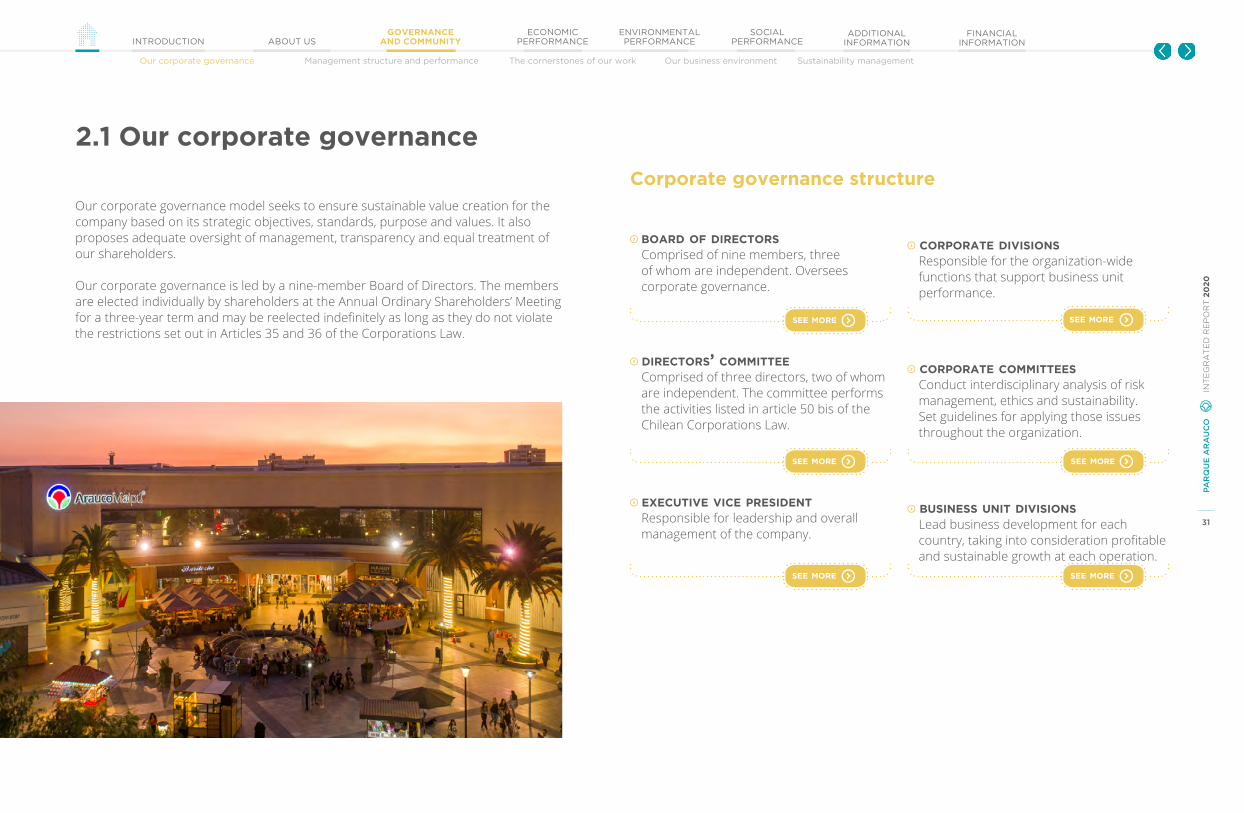
Our corporate governance model seeks to ensure sustainable value creation for the company based on its strategic objectives, standards, purpose and values. It also proposes adequate oversight of management, transparency and equal treatment of our shareholders.
Our corporate governance is led by a nine-member Board of Directors. The members are elected individually by shareholders at the Annual Ordinary Shareholders’ Meeting for a three-year term and may be reelected indefinitely as long as they do not violate the restrictions set out in Articles 35 and 36 of the Corporations Law.
boarD of Directors
Comprised of nine members, three of whom are independent. Oversees corporate governance.
Directors’ committee
Comprised of three directors, two of whom are independent. The committee performs the activities listed in article 50 bis of the Chilean Corporations Law.
executiVe Vice presiDent
Responsible for leadership and overall management of the company.
corporate DiVisions
Responsible for the organization-wide functions that support business unit performance.
corporate committees
Conduct interdisciplinary analysis of risk management, ethics and sustainability. Set guidelines for applying those issues throughout the organization.
business unit DiVisions
Lead business development for each country, taking into consideration profitable and sustainable growth at each operation.
see more
Corporate governance structure
see more
see more see more
see more
see more

32
PAR
QU
E A
RA
UC
O IN
TE
GR
AT
ED
RE
PO
RT
20
20
GOVERNANCE AND COMMUNITYINTRODUCTION ABOUT US
ECONOMIC PERFORMANCE
ENVIRONMENTAL PERFORMANCE
SOCIAL PERFORMANCE
ADDITIONAL INFORMATION
Our corporate governance Management structure and performance The cornerstones of our work Our business environment Sustainability management
FINANCIAL INFORMATION
José saiD saffie
† July 23, 2020 (deceased)
luis hernÁn paúl fresno Independent DirectorTaxpayer ID: 7.289.965-2B.S. in Civil Engineering, Pontificia Universidad Católica de Chile and MBA, Massachusetts Institute of TechnologyDate appointed: 04/26/2019
ana holuigue barros
Independent DirectorTaxpayer ID: 5.717.729-2Bachelor of Economics, PontificiaUniversidad Católica de ChileMaster's in Economics, Pontificia Universidad Católica de ChileDate appointed: 04/26/2019
José Domingoeluchans urenDa
DirectorTaxpayer ID: 6.474.632-4Attorney, Pontificia Universidad Católica de ChileDate appointed: 04/26/2019
guillermo saiD yarur
DirectorTaxpayer ID: 6.191.544-3B.S. in Industrial Engineering,Universidad de Chile Post graduate degree in Finance,Universidad Adolfo IbáñezDate appointed: 04/26/2019
salVaDor saiD somaVía
Chairman As of November 12, 2020Taxpayer ID: 6.379.626-3Bachelor of Business Administration,Universidad Gabriela Mistral de Chile.Date appointed: 04/26/2019
orlanDo sÁenz roJas
DirectorTaxpayer ID: 3.599.669-9B.S. in Civil Engineering, PontificiaUniversidad Católica de ChileDate appointed: 04/26/2019
roDrigo muñoz muñoz
DirectorTaxpayer ID: 7.040.050-2Bachelor of Business Administration, Pontificia Universidad Católica de ChileDate appointed: 04/26/2019
The following directors left the Board on April 26, 2019:
Rafael Aldunate ValdésTaxpayer ID: 5.193.449-0Director Bachelor of Business Administration,Pontificia Universidad Católica de Chile, AMP, Harvard University.Date appointed: 04/15/2016
René Abumohor ToumaTaxpayer ID: 3.065.693-8Director Financial investorDate appointed: 04/15/2016
Juan Carlos Lobos PérezTaxpayer ID: 4.567.869-5Director Attorney, UniversidadCatolica de ValparaísoDate appointed: 04/15/2016
None of the directors hold executive positions at Parque Arauco. Guillermo Said Yarur is the only board member who holds a direct interest in the company, with 0.04% of share capital.
2.1 Our corporate governance
Board of DirectorsThe Chairman of the Board of Parque Arauco, Mr. José Said Saffie, died on July 23 of this year. He was replaced by Mr. Salvador Said Somavia, who was appointed by mutual agreement at a board meeting on November 12, 2020.
fernanDo massu taré
Independent DirectorTaxpayer ID: 6.783.826-2Bachelor of Business Administration,Universidad Adolfo Ibáñez.PMD, Harvard UniversityDate appointed: 04/26/2019
32
PA
RQ
UE
see more
More information on the experience of each board member
Chairman until July 23, 2020.Taxpayer ID: 2.305.902-9Bachelor of LawsUniversidad de ChileDate appointed: 04/26/2019

33
PAR
QU
E A
RA
UC
O IN
TE
GR
AT
ED
RE
PO
RT
20
20
GOVERNANCE AND COMMUNITYINTRODUCTION ABOUT US
ECONOMIC PERFORMANCE
ENVIRONMENTAL PERFORMANCE
SOCIAL PERFORMANCE
ADDITIONAL INFORMATION
Our corporate governance Management structure and performance The cornerstones of our work Our business environment Sustainability management
FINANCIAL INFORMATION
Board responsibilitiesDuring their meetings, the Board defines short-, medium- and long-term objectives for the company, monitors progress related to our strategy, determines the structures and processes necessary to manage risks, and monitors compliance with business ethics and commitments based on the standards and regulations of the countries in which we operate.
The Board meets monthly for ordinary sessions and holds extraordinary sessions when needed. In the latter case, an invitation is extended by the Chairman or an absolute majority of the directors. A quorum of five directors is required to meet and the company’s bylaws do not allow for the existence of alternate directors.
inDepenDent Directors
Chilean regulations set measures that independent directors must comply with, including: Not having a significant connection, interest or economic, professional, credit or business relationship with the company or other companies in the group or its controlling entity or with the senior executives of any of those entities. They may not have served as directors, managers, administrators, senior executives or advisors for any of these entities or have a relationship up to second degree of consanguinity or affinity with anyone in these positions.
Furthermore, they may not have been a director, manager, administrator or senior executive of non-profit organizations that have received significant contributions or donations from the individuals listed in the previous paragraph.
Anyone who has been a partner or shareholder (with ownership or direct or indirect control) of 10% or more of the capital of entities that have provided legal or consulting services for significant amounts or that have conducted an external audit of the individuals listed in the first paragraph, or their main competitors, suppliers or customers. Anyone who has held the position of director, manager, administrator or senior executive of those entities is also ineligible.
The following individuals are independent directors at Parque Arauco: Ana Holuigue Barros; Fernando Massú Taré and Luis Hernán Paul Fresno.
2.1 Our corporate governance
Over the course of last year, all of the members of the Board participated in a self-assessment process. This space allowed us to put the work performed over the course of the year in perspective. The assessment model was developed with external consultants from the firm EY, and their methodology is based on five principles:
business strategy
control enVironment
access to information
equal treatment of shareholDers
sustainability management
12ordinary sessions 1
100%attendance at meetings
2extraordinary sessions during the year
1. During 2020, the Board did not use funds from its budget to hire advising services.

34
PAR
QU
E A
RA
UC
O IN
TE
GR
AT
ED
RE
PO
RT
20
20
GOVERNANCE AND COMMUNITYINTRODUCTION ABOUT US
ECONOMIC PERFORMANCE
ENVIRONMENTAL PERFORMANCE
SOCIAL PERFORMANCE
ADDITIONAL INFORMATION
Our corporate governance Management structure and performance The cornerstones of our work Our business environment Sustainability management
FINANCIAL INFORMATION
Board diversity
Age group
1
000
34
Under 30 years
51 - 60 years
61 - 70 years
Over 70 years
41 - 50 years
30 - 40 years
Gender
71
Male
Female
Nationality
8 Chilean
Years of service
Less than 3 years
9 - 12 years
Over 12 years
6 - 9 years
3 - 6 years
02
13
2
Directors’ Committee
The Directors' Committee is comprised of Ana Holuigue Barros, Guillermo Said Yarur and Luis Hernán Paul Fresno and is governed by current regulations.1
main actiVities
Review and monitor the annual audit plan.
Propose external auditors.
Analyze and approve both quarterly and year-end standalone and consolidated financial statements.
Analyze the remuneration systems and compensation plans for managers and senior executives.
Analyze cases received through the hotline.
Risks and compliance: monitoring the risk model for Chile, Peru and Colombia; monitoring the Crime Prevention Model and Data Protection Law for Peru and Colombia and monitoring implementation of the comprehensive compliance model.
1. Our Board was formed in accordance with Article 50 bis of Law No. 18,046 on Corporations and Memorandum No. 1956 of the former Superintendency of Securities and Insurance, SVS. Both regulations apply to corporations with market capitalization totaling UF 1,500,000 or more and in which less than 12.5% of the shares issued with voting rights are held by shareholders who individually control or own less than 10% of said shares.
see more
See more details about Board compensation.
All of the board members are Chilean.
2.1 Our corporate governance
34

35
PAR
QU
E A
RA
UC
O IN
TE
GR
AT
ED
RE
PO
RT
20
20
GOVERNANCE AND COMMUNITYINTRODUCTION ABOUT US
ECONOMIC PERFORMANCE
ENVIRONMENTAL PERFORMANCE
SOCIAL PERFORMANCE
ADDITIONAL INFORMATION
Our corporate governance Management structure and performance The cornerstones of our work Our business environment Sustainability management
FINANCIAL INFORMATION
Directors’ committee
executiVe Vice presiDent
Corporate Legal Manager
Corporate ChiefFinancial Officer
chief executiVe officer
chile DiVision
Corporate HumanResources Manager
Chief Executive OfficerPeru Division
chief executiVe officer
parque arauco international
Corporate Audit Manager and Controller
Chief Executive Officer Colombia Division
boarD of Directors
Organizational chart
2.1 Our corporate governance
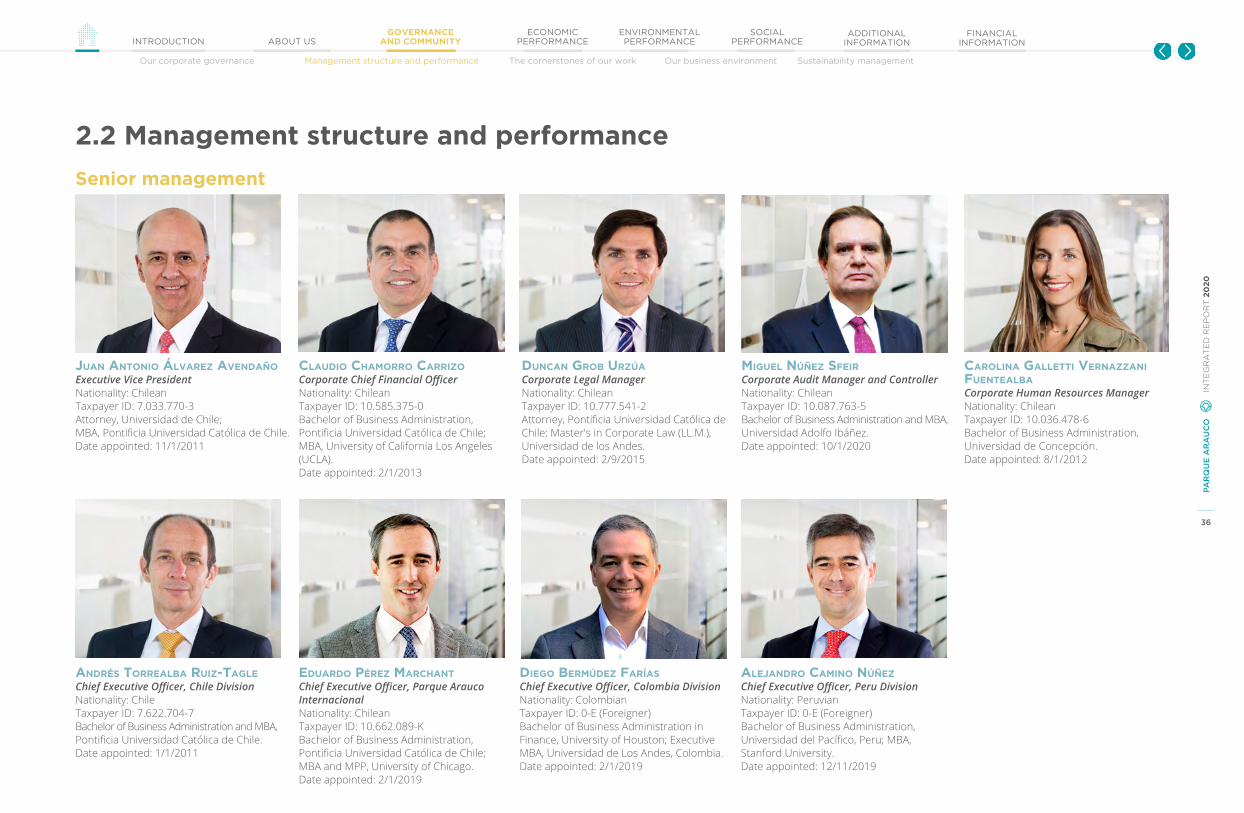
36
PAR
QU
E A
RA
UC
O IN
TE
GR
AT
ED
RE
PO
RT
20
20
GOVERNANCE AND COMMUNITYINTRODUCTION ABOUT US
ECONOMIC PERFORMANCE
ENVIRONMENTAL PERFORMANCE
SOCIAL PERFORMANCE
ADDITIONAL INFORMATION
Our corporate governance Management structure and performance The cornerstones of our work Our business environment Sustainability management
FINANCIAL INFORMATION
Juan antonio ÁlVarez aVenDaño
Executive Vice President Nationality: Chilean Taxpayer ID: 7.033.770-3Attorney, Universidad de Chile; MBA, Pontificia Universidad Católica de Chile.Date appointed: 11/1/2011
anDrés torrealba ruiz-tagle
Chief Executive Officer, Chile DivisionNationality: Chile Taxpayer ID: 7.622.704-7 Bachelor of Business Administration and MBA, Pontificia Universidad Católica de Chile. Date appointed: 1/1/2011
Diego bermúDez farías
Chief Executive Officer, Colombia Division Nationality: ColombianTaxpayer ID: 0-E (Foreigner)Bachelor of Business Administration in Finance, University of Houston; Executive MBA, Universidad de Los Andes, Colombia. Date appointed: 2/1/2019
aleJanDro camino núñez
Chief Executive Officer, Peru Division Nationality: PeruvianTaxpayer ID: 0-E (Foreigner)Bachelor of Business Administration, Universidad del Pacífico, Peru; MBA, Stanford University. Date appointed: 12/11/2019
eDuarDo pérez marchant
Chief Executive Officer, Parque Arauco InternacionalNationality: Chilean Taxpayer ID: 10.662.089-K Bachelor of Business Administration, Pontificia Universidad Católica de Chile; MBA and MPP, University of Chicago. Date appointed: 2/1/2019
clauDio chamorro carrizo Corporate Chief Financial OfficerNationality: Chilean Taxpayer ID: 10.585.375-0Bachelor of Business Administration,Pontificia Universidad Católica de Chile; MBA, University of California Los Angeles (UCLA).Date appointed: 2/1/2013
Duncan grob urzúa Corporate Legal Manager Nationality: Chilean Taxpayer ID: 10.777.541-2Attorney, Pontificia Universidad Católica de Chile; Master's in Corporate Law (LL.M.), Universidad de los Andes.Date appointed: 2/9/2015
miguel núñez sfeir Corporate Audit Manager and Controller Nationality: ChileanTaxpayer ID: 10.087.763-5Bachelor of Business Administration and MBA, Universidad Adolfo Ibáñez. Date appointed: 10/1/2020
carolina galletti Vernazzani
fuentealba Corporate Human Resources Manager Nationality: Chilean Taxpayer ID: 10.036.478-6Bachelor of Business Administration, Universidad de Concepción.Date appointed: 8/1/2012
Senior management
2.2 Management structure and performance

37
PAR
QU
E A
RA
UC
O IN
TE
GR
AT
ED
RE
PO
RT
20
20
GOVERNANCE AND COMMUNITYINTRODUCTION ABOUT US
ECONOMIC PERFORMANCE
ENVIRONMENTAL PERFORMANCE
SOCIAL PERFORMANCE
ADDITIONAL INFORMATION
Our corporate governance Management structure and performance The cornerstones of our work Our business environment Sustainability management
FINANCIAL INFORMATION
2.2 Management structure and performance
Management responsibilities
executiVe Vice presiDent
Leads the executive team and ensures that employees are on track to meet company goals. Directs implementation of the company strategy and achievement of results everywhere our businesses operate. Stewards the long-term management and sustainable success of Parque Arauco.
parque arauco international DiVision
Division created in 2019 to lead business units outside of Chile, which represent over half of Parque Arauco’s leasable surface area. This division is responsible for implementing the company’s strategy internationally and for incorporating best management practices in Peru and Colombia.
parque arauco chile DiVision
Management that leads operations, marketing and sales for properties in Chile, with 31 shopping centers in cities throughout the country. It also develops growth plans, including the acquisition of assets and construction projects.
business unit chief executiVe officers
Includes the CEOs of Colombia and Peru, which together comprise the Parque Arauco International Division. They lead commercial and operational management of the shopping centers in each country. In addition, these units implement the company’s development plans and strategy.
corporate aDministration anD finance DiVision
Manages the company’s short- and long-term financing and relationships with financial institutions, investors and capital markets. Provides shared, centralized financial management services for the entire company. Implements the technological development and sustainability strategy for the administration and increased efficiency of the company and to improve the customer experience. Leads growth opportunities
corporate auDit anD control DiVision
Provides a systematic and independent approach to the company’s risk management and control processes. Ensures regulatory compliance through the Compliance Department. Defines and executes the Annual Auditing Plan and reports on its results and observations to the respective managers. Reports directly to the Directors’ Committee.
corporate legal DiVision
Provides legal guidance to areas and business units. Makes sure company adheres to the regulatory context in which it operates.
corporate human resources DiVision
Defines the practices that improve working conditions for employees and ensures that they meet company objectives. Manages indicators related to employees, talent and professional development.

38
PAR
QU
E A
RA
UC
O IN
TE
GR
AT
ED
RE
PO
RT
20
20
GOVERNANCE AND COMMUNITYINTRODUCTION ABOUT US
ECONOMIC PERFORMANCE
ENVIRONMENTAL PERFORMANCE
SOCIAL PERFORMANCE
ADDITIONAL INFORMATION
Our corporate governance Management structure and performance The cornerstones of our work Our business environment Sustainability management
FINANCIAL INFORMATION
9
Management diversity
Age group
0
00
3
33
Under 30 years
51 - 60 years
61 - 70 years
Over 70 years
41 - 50 years
30 - 40 years
Gender
1 Female
Nationality
8 LocalMale
Years of service
Less than 3 years
9 - 12 years
Over 12 years
6 - 9 years
3 - 6 years1
1
1
3
3
See more details about Executive Team compensation.
see more
2.2 Management structure and performance
Of the executives in this category, 7 are Chilean, 1 is Peruvian and 1 is Colombian.
38
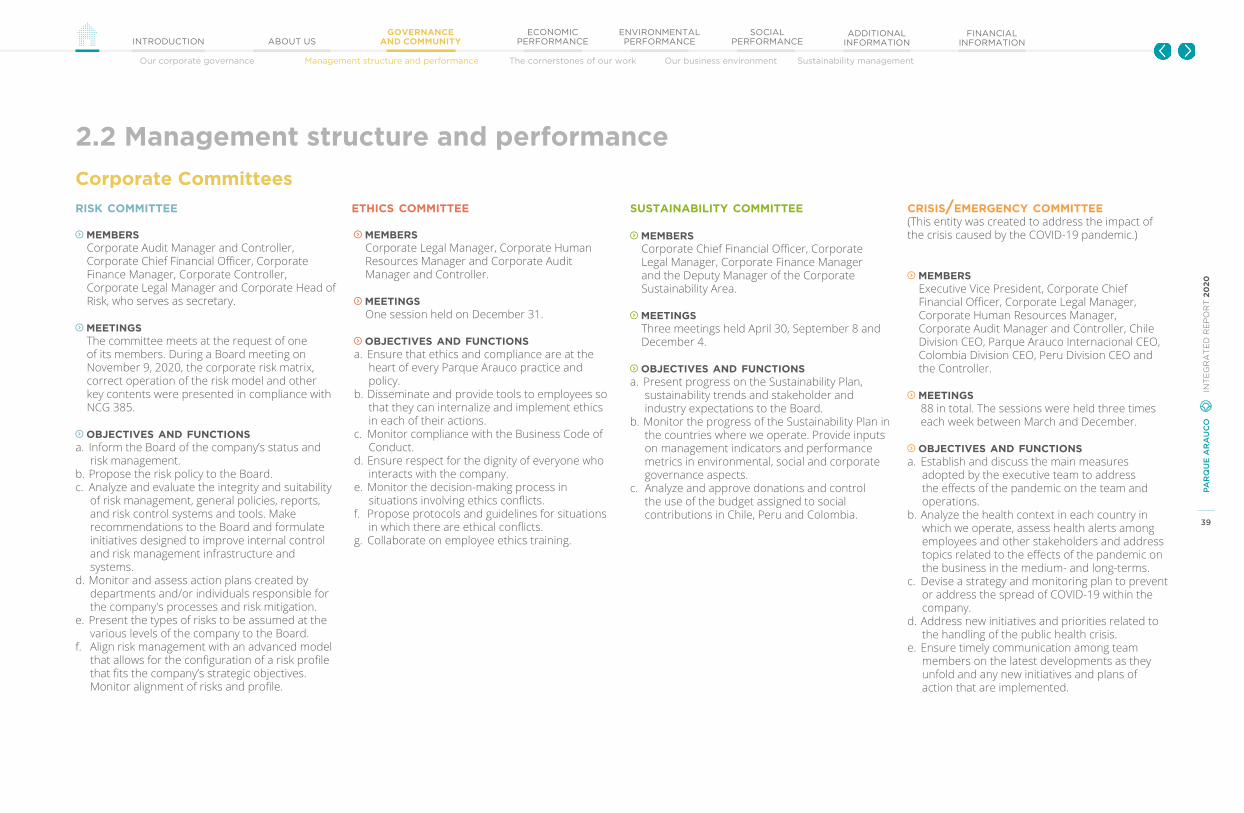
39
PAR
QU
E A
RA
UC
O IN
TE
GR
AT
ED
RE
PO
RT
20
20
GOVERNANCE AND COMMUNITYINTRODUCTION ABOUT US
ECONOMIC PERFORMANCE
ENVIRONMENTAL PERFORMANCE
SOCIAL PERFORMANCE
ADDITIONAL INFORMATION
Our corporate governance Management structure and performance The cornerstones of our work Our business environment Sustainability management
FINANCIAL INFORMATION
Corporate Committees
risk committee sustainability committee crisis/emergency committee (This entity was created to address the impact of the crisis caused by the COVID-19 pandemic.)
ethics committee
membersCorporate Audit Manager and Controller,Corporate Chief Financial Officer, CorporateFinance Manager, Corporate Controller, Corporate Legal Manager and Corporate Head of Risk, who serves as secretary.
meetingsThe committee meets at the request of one of its members. During a Board meeting on November 9, 2020, the corporate risk matrix, correct operation of the risk model and other key contents were presented in compliance with NCG 385.
obJectiVes anD functionsa. Inform the Board of the company’s status and
risk management.b. Propose the risk policy to the Board.c. Analyze and evaluate the integrity and suitability
of risk management, general policies, reports, and risk control systems and tools. Make recommendations to the Board and formulate initiatives designed to improve internal control and risk management infrastructure and systems.
d. Monitor and assess action plans created by departments and/or individuals responsible for the company's processes and risk mitigation.
e. Present the types of risks to be assumed at the various levels of the company to the Board.
f. Align risk management with an advanced model that allows for the configuration of a risk profile that fits the company’s strategic objectives. Monitor alignment of risks and profile.
membersCorporate Chief Financial Officer, Corporate Legal Manager, Corporate Finance Manager and the Deputy Manager of the Corporate Sustainability Area.
meetingsThree meetings held April 30, September 8 and December 4.
obJectiVes anD functionsa. Present progress on the Sustainability Plan,
sustainability trends and stakeholder and industry expectations to the Board.
b. Monitor the progress of the Sustainability Plan in the countries where we operate. Provide inputs on management indicators and performance metrics in environmental, social and corporate governance aspects.
c. Analyze and approve donations and control the use of the budget assigned to social contributions in Chile, Peru and Colombia.
membersExecutive Vice President, Corporate Chief Financial Officer, Corporate Legal Manager, Corporate Human Resources Manager, Corporate Audit Manager and Controller, Chile Division CEO, Parque Arauco Internacional CEO, Colombia Division CEO, Peru Division CEO and the Controller.
meetings 88 in total. The sessions were held three times each week between March and December.
obJectiVes anD functionsa. Establish and discuss the main measures
adopted by the executive team to address the effects of the pandemic on the team and operations.
b. Analyze the health context in each country in which we operate, assess health alerts among employees and other stakeholders and address topics related to the effects of the pandemic on the business in the medium- and long-terms.
c. Devise a strategy and monitoring plan to prevent or address the spread of COVID-19 within the company.
d. Address new initiatives and priorities related to the handling of the public health crisis.
e. Ensure timely communication among team members on the latest developments as they unfold and any new initiatives and plans of action that are implemented.
membersCorporate Legal Manager, Corporate Human Resources Manager and Corporate Audit Manager and Controller.
meetingsOne session held on December 31.
obJectiVes anD functionsa. Ensure that ethics and compliance are at the
heart of every Parque Arauco practice and policy.
b. Disseminate and provide tools to employees so that they can internalize and implement ethics in each of their actions.
c. Monitor compliance with the Business Code of Conduct.
d. Ensure respect for the dignity of everyone who interacts with the company.
e. Monitor the decision-making process in situations involving ethics conflicts.
f. Propose protocols and guidelines for situations in which there are ethical conflicts.
g. Collaborate on employee ethics training.
2.2 Management structure and performance

40
PAR
QU
E A
RA
UC
O IN
TE
GR
AT
ED
RE
PO
RT
20
20
GOVERNANCE AND COMMUNITYINTRODUCTION ABOUT US
ECONOMIC PERFORMANCE
ENVIRONMENTAL PERFORMANCE
SOCIAL PERFORMANCE
ADDITIONAL INFORMATION
Our corporate governance Management structure and performance The cornerstones of our Our business environment Sustainability management
FINANCIAL INFORMATION
2.3 The cornerstones of our work
Ethical culture is one of the pillars of our company. This is based on our values and is disseminated through our policies and procedures to the entire organization. The main elements through which the ethical culture are disseminated are the Business Code of Conduct, Complaint Channel, Crime Prevention Model and Internal Control Management.
business coDe of conDuct
This is the frame of reference for how we engage with our stakeholders and establishes the minimum, non-negotiable and required behaviors of everyone who is part of Parque Arauco and its subsidiaries.1
This document is available on the Intranet and Parque Arauco’s website. It is provided to all employees when they join the organization and is referenced in employment contracts. Employees who have questions or concerns about its contents may address them through their direct supervisors or the Corporate Audit and Control, Legal or Human Resources divisions.
Ethical culture at Parque Arauco
1. Our Business Code of Conduct prohibits political contributions or donations to campaigns. “In an effort to contribute to transparency and equity in access to elected office, Parque Arauco does not allow contributions to political campaigns.”
compliance with laws, stanDarDs anD regulations
asset protectionuse of insiDer information
confiDential information
conflicts of interest
bribery, money launDering anD terrorism financing
antitrust law
frauD anD integrity of information
contents of the business coDe of conDuct
Donations
use of tobacco, alcohol anD illegal Drugs
harassment anD Discrimination
compliancesee more
40
PA
RQ
UE
AR
AU
CO
IN
TE
GR
AT
ED
RE
PO
RT
20
20

41
PAR
QU
E A
RA
UC
O IN
TE
GR
AT
ED
RE
PO
RT
20
20
GOVERNANCE AND COMMUNITYINTRODUCTION ABOUT US
ECONOMIC PERFORMANCE
ENVIRONMENTAL PERFORMANCE
SOCIAL PERFORMANCE
ADDITIONAL INFORMATION
Our corporate governance Management structure and performance The cornerstones of our Our business environment Sustainability management
FINANCIAL INFORMATION
2.3 The cornerstones of our work
complaint channel
We use this tool to identify and manage situations that may go against the ethics and principles set out in our Business Code of Conduct. This platform is called Ethics Point. It is an online platform managed by the company Navex Global Inc., which has secure servers operated by their team. This channel can be accessed through a link on our website and Intranet.
Any employee, supplier, customer or other stakeholder may submit concerns or report suspicions of a possible transgression of the law, Crime Prevention Manual or other documents related to ethical compliance and the company’s rules through this complaint channel. Any information provided is strictly confidential, and users may choose to submit reports anonymously or include their personal information.
Cases filed through the complaint channel are reported to the Directors' Committee, Executive Vice President and Ethics Committee. The latter prepares a report for the Directors' Committee, which must review it within 30 business days of receiving the request.
The status of complaints received through this mechanism are reported monthly to the Directors' Committee. This space is used to analyze the investigation conducted on the basis of the complaint so that decisions can be made regarding each case. All plans of action are guided by the Ethics Committee.
peruchile
colombia
0%95%
5%
complaints by country
complaints by reporting party
inVestigation categories
anonymous
customer serVice
21%
82%
reporting party iDentifieD
ethics
other
79%
16%
2%
We resolved 97% of the complaints received. Some of the actions implemented based on cases generated in 2020 include improvements to purchasing processes, termination of contracts with suppliers, permanent blocking of certain suppliers, the decision to not begin doing business with certain suppliers and customers and the generation of reports on suspicious operations.
see more
PA
RQ
UE
AR
AU
CO
IN
TE
GR
AT
ED
RE
PO
RT
20
20

42
PAR
QU
E A
RA
UC
O IN
TE
GR
AT
ED
RE
PO
RT
20
20
GOVERNANCE AND COMMUNITYINTRODUCTION ABOUT US
ECONOMIC PERFORMANCE
ENVIRONMENTAL PERFORMANCE
SOCIAL PERFORMANCE
ADDITIONAL INFORMATION
Our corporate governance Management structure and performance The cornerstones of our Our business environment Sustainability management
FINANCIAL INFORMATION
2.3 The cornerstones of our work
crime preVention moDel
This system is aligned with each country's regulations and is designed to combat money laundering, terrorism financing, corruption, bribery, handling of stolen property, improper management, inappropriate business dealings, misappropriation, water pollution and influence peddling, among other crimes in our context and relations as a company. Its purpose is to ensure compliance with the regulations that govern the company’s activities. It covers 100% of our operations and is aligned with applicable regulations in each country.
The CPM’s components include: A Crime Prevention Director for Chile and Peru and a Compliance Officer for Chile and Colombia.
A Corporate Crime Prevention Policy that applies to all of the company’s divisions and all of its related economic units.
Guidelines for implementing procedures, manuals and policies. Periodic dissemination and training. Ongoing monitoring and assessment systems. Complaint channel.
The Crime Prevention Model is comprised of three stages: Prevention: Activities that help ensure compliance with required standards, identification of risks and controls for minimizing their impact and likelihood.
Detection: Detects the appearance of a risk, error, omission or deliberate act. Response: Activities that help to constantly improve and streamline processes related to
crime prevention.
In order to provide continuity and ensure progress on the goals set out in the CPM, the following criteria have been established: Parque Arauco employees, tenants and suppliers have a clause or appendix related to the crime prevention model in their contracts (or statement of relationship in the cases of Peru and Colombia).
A crime prevention paragraph is included in purchase and service orders. We conduct due diligence processes with employees, customers and suppliers in regard to these topics.
To strengthen compliance and integration of these principles connected to ethics and crime prevention in the internal culture, we conducted various training programs in 2020 that addressed topics such as: Law 19.913 on the creation of the Financial Analysis Unit and changes to laws on asset laundering (Chile).
Law 20.393 on criminal liability for legal entities (Chile). System of Self-monitoring and Risk Management for Money Laundering and Terrorism Financing (Colombia).
Training on the Crime Prevention Model and Sexual Harassment Prevention Law (Peru).
Evaluating and monitoringcompliance
Actionplans
Trainingand disclosure
Identifying controls
Identifying crimes and risky
activities
manuals, policies anD proceDures relateD to crime preVention
business coDe of conDuct / internal regulations on orDer, hygiene anD safety
crime preVention manual
crime preVention anD compliance officers in chile, colombia anD peru
corporate goVernance
preVention Detection response
Boar
d of
Dir
ecto
rs, E
xecu
tive
s an
d Em
ploy
ees
Com
plai
nt C
hann
elRe
port
s (D
irec
tors
’ Com
mitt
ee)
certification anD monitoring of crime preVention moDel (chile)
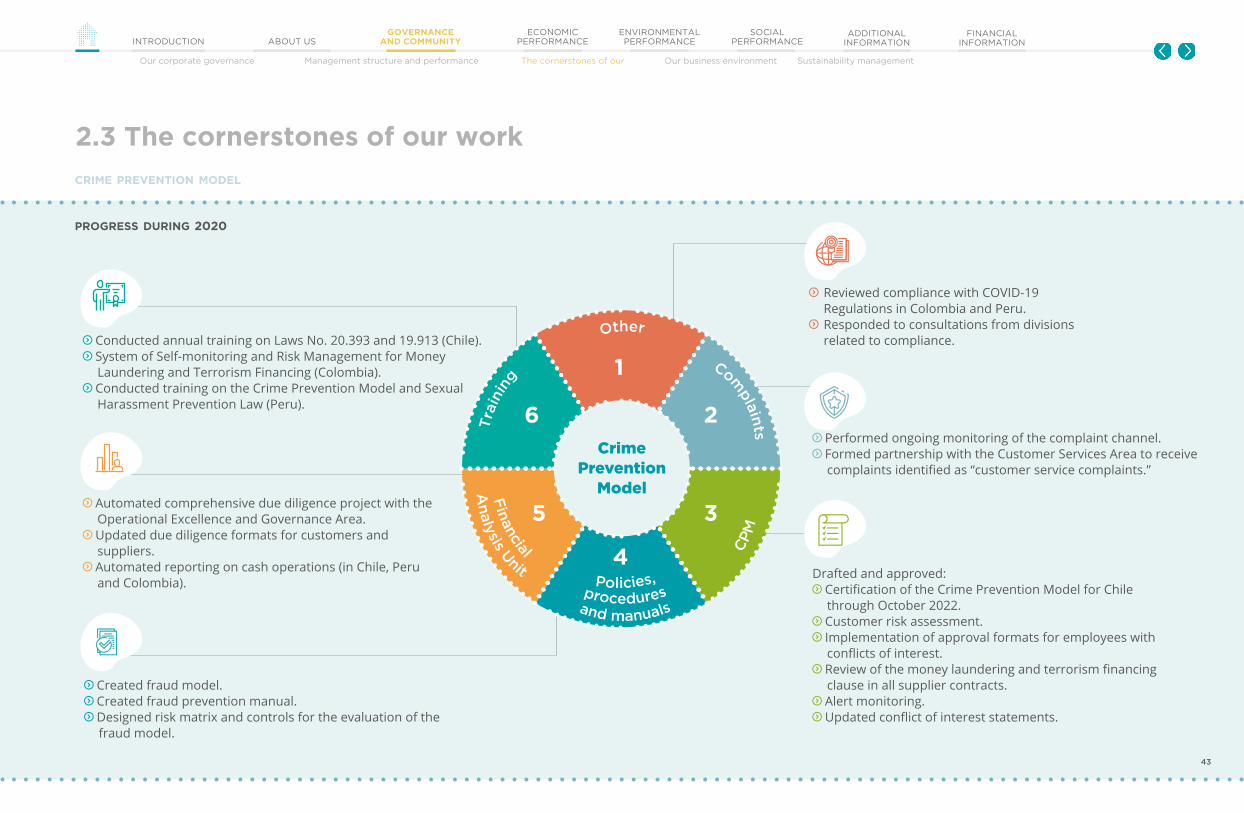
43
PAR
QU
E A
RA
UC
O IN
TE
GR
AT
ED
RE
PO
RT
20
20
GOVERNANCE AND COMMUNITYINTRODUCTION ABOUT US
ECONOMIC PERFORMANCE
ENVIRONMENTAL PERFORMANCE
SOCIAL PERFORMANCE
ADDITIONAL INFORMATION
Our corporate governance Management structure and performance The cornerstones of our Our business environment Sustainability management
FINANCIAL INFORMATION
2.3 The cornerstones of our work
Reviewed compliance with COVID-19 Regulations in Colombia and Peru.
Responded to consultations from divisions related to compliance. Conducted annual training on Laws No. 20.393 and 19.913 (Chile).
System of Self-monitoring and Risk Management for Money Laundering and Terrorism Financing (Colombia).
Conducted training on the Crime Prevention Model and Sexual Harassment Prevention Law (Peru).
Automated comprehensive due diligence project with the Operational Excellence and Governance Area.
Updated due diligence formats for customers and suppliers.
Automated reporting on cash operations (in Chile, Peru and Colombia).
Performed ongoing monitoring of the complaint channel. Formed partnership with the Customer Services Area to receive complaints identified as “customer service complaints.”
Drafted and approved: Certification of the Crime Prevention Model for Chile through October 2022.
Customer risk assessment. Implementation of approval formats for employees with conflicts of interest.
Review of the money laundering and terrorism financing clause in all supplier contracts.
Alert monitoring. Updated conflict of interest statements.
Created fraud model. Created fraud prevention manual. Designed risk matrix and controls for the evaluation of the fraud model.
Tra
inin
g
Other
procedures and manuals
CP
MF
inancial
An
alysis U
nit
Complain
ts
1
2
3
4
5
6Crime
Prevention Model
Policies,
progress During 2020
crime preVention moDel
43

44
PAR
QU
E A
RA
UC
O IN
TE
GR
AT
ED
RE
PO
RT
20
20
GOVERNANCE AND COMMUNITYINTRODUCTION ABOUT US
ECONOMIC PERFORMANCE
ENVIRONMENTAL PERFORMANCE
SOCIAL PERFORMANCE
ADDITIONAL INFORMATION
Our corporate governance Management structure and performance The cornerstones of our Our business environment Sustainability management
FINANCIAL INFORMATION
Another element that is an important part of our ethics management system is the systematic and independent review of the Internal Control environment, which is performed by the Corporate Audit and Control Division. This division is also responsible for regulatory compliance, the various standards and regulations that govern us, efficacy and efficiency in the management of risks and the reliability of the information that we provide to the financial market.
Risk management and regulatory compliance are aligned with the international standards of COSO (the Committee of Sponsoring Organizations of the Treadway Commission), which provides guidelines for the implementation, management and monitoring of the internal control system and ISO 31000 on risk management.
The work of the Corporate Audit and Control Division is supervised by the Directors’ Committee. This entity reviews and approves the annual auditing plan, provides recommendations and analyzes cases identified in ethics reports from the complaint channel.
Several audits were conducted in 2020, including some focused on the business, ongoing monitoring and compliance cycles. This is in addition to an audit on compliance with health regulations in shopping centers in Colombia.
In regard to ongoing audits, in 2020 we incorporated specific monitoring tests for open line items in accounts payable and receivable, which was among our commitments made to our external auditors. Furthermore, we included the database from the SAP audit logs in the ongoing audit system, which allowed system activity to be
analyzed. We also introduced new financial reviews such as the analysis of adjustments and deviations of accounts payable and we established the guidelines for the analysis and monitoring of risk indicators.
The comprehensive Internal Audit, Risk and Compliance system has evolved towards reviews shared by these areas, achieving greater synergy in processes and monitoring of the risks that the company is facing. This effort gives each area more detailed knowledge of the risks and an adequate understanding of them.
internal control
2.3 The cornerstones of our work
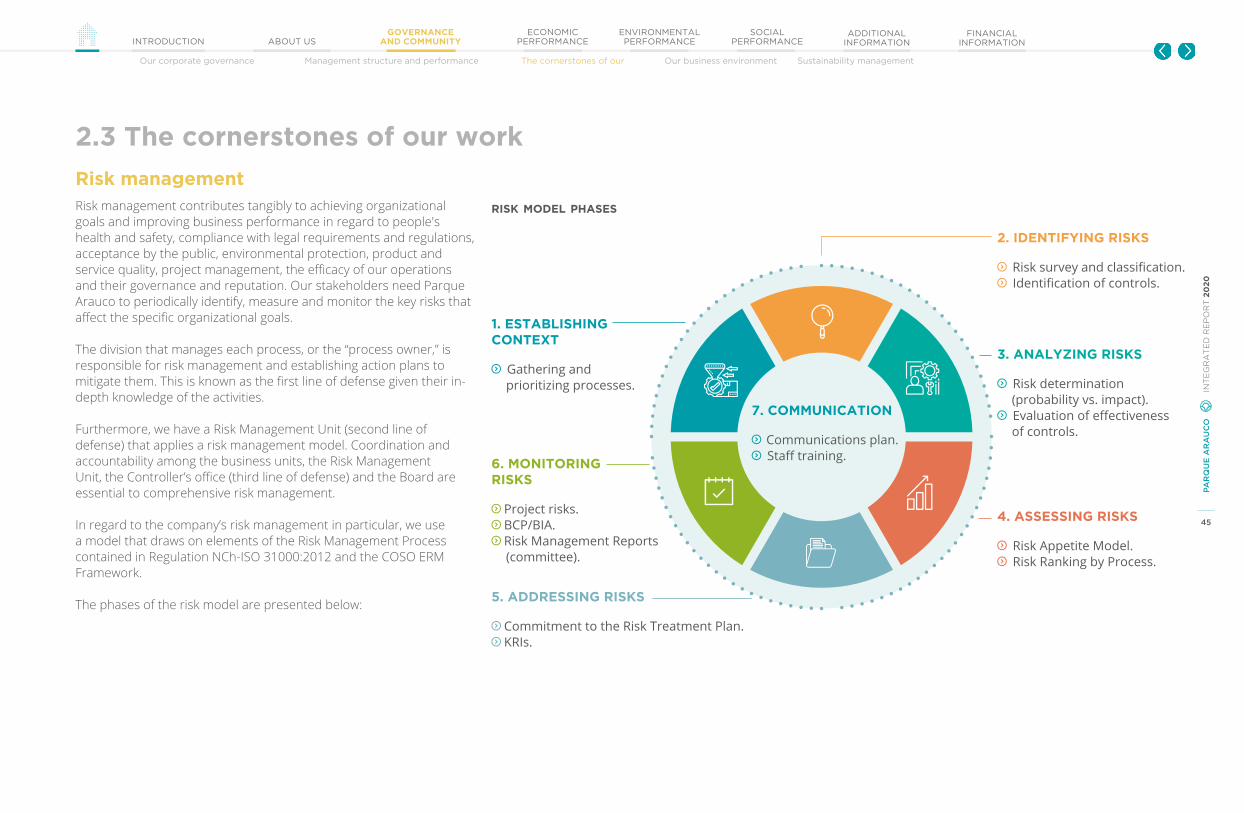
45
PAR
QU
E A
RA
UC
O IN
TE
GR
AT
ED
RE
PO
RT
20
20
GOVERNANCE AND COMMUNITYINTRODUCTION ABOUT US
ECONOMIC PERFORMANCE
ENVIRONMENTAL PERFORMANCE
SOCIAL PERFORMANCE
ADDITIONAL INFORMATION
Our corporate governance Management structure and performance The cornerstones of our Our business environment Sustainability management
FINANCIAL INFORMATION
Risk management contributes tangibly to achieving organizational goals and improving business performance in regard to people's health and safety, compliance with legal requirements and regulations, acceptance by the public, environmental protection, product and service quality, project management, the efficacy of our operations and their governance and reputation. Our stakeholders need Parque Arauco to periodically identify, measure and monitor the key risks that affect the specific organizational goals.
The division that manages each process, or the “process owner,” is responsible for risk management and establishing action plans to mitigate them. This is known as the first line of defense given their in-depth knowledge of the activities.
Furthermore, we have a Risk Management Unit (second line of defense) that applies a risk management model. Coordination and accountability among the business units, the Risk Management Unit, the Controller’s office (third line of defense) and the Board are essential to comprehensive risk management.
In regard to the company’s risk management in particular, we use a model that draws on elements of the Risk Management Process contained in Regulation NCh-ISO 31000:2012 and the COSO ERM Framework.
The phases of the risk model are presented below:
Risk management
2.3 The cornerstones of our work
1. ESTABLISHING CONTEXT
Gathering and prioritizing processes.
6. MONITORINGRISKS
Project risks. BCP/BIA. Risk Management Reports (committee).
5. ADDRESSING RISKS
Commitment to the Risk Treatment Plan. KRIs.
2. IDENTIFYING RISKS
Risk survey and classification. Identification of controls.
3. ANALYZING RISKS
Risk determination (probability vs. impact).
Evaluation of effectiveness of controls.
4. ASSESSING RISKS
Risk Appetite Model. Risk Ranking by Process.
risk moDel phases
7. COMMUNICATION
Communications plan. Staff training.
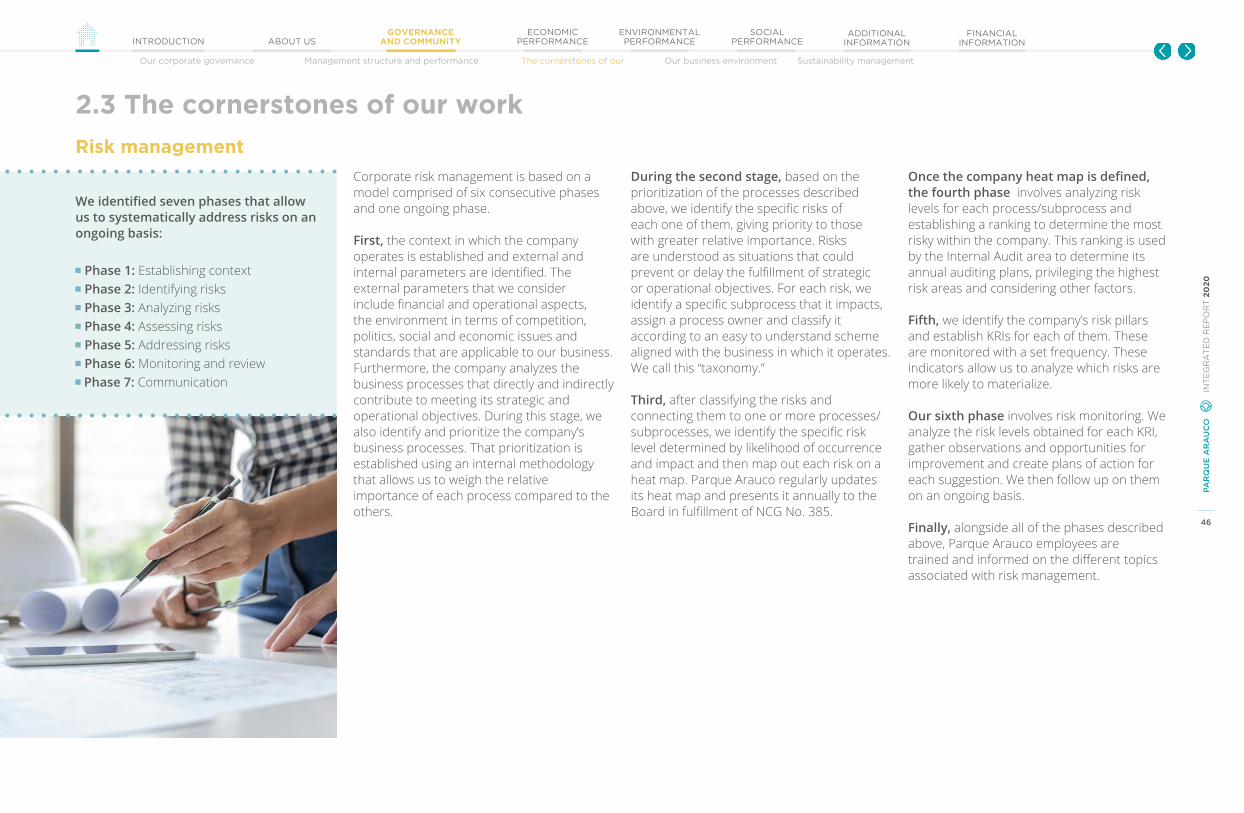
46
PAR
QU
E A
RA
UC
O IN
TE
GR
AT
ED
RE
PO
RT
20
20
GOVERNANCE AND COMMUNITYINTRODUCTION ABOUT US
ECONOMIC PERFORMANCE
ENVIRONMENTAL PERFORMANCE
SOCIAL PERFORMANCE
ADDITIONAL INFORMATION
Our corporate governance Management structure and performance The cornerstones of our Our business environment Sustainability management
FINANCIAL INFORMATION
Corporate risk management is based on a model comprised of six consecutive phases and one ongoing phase.
First, the context in which the company operates is established and external and internal parameters are identified. The external parameters that we consider include financial and operational aspects, the environment in terms of competition, politics, social and economic issues and standards that are applicable to our business. Furthermore, the company analyzes the business processes that directly and indirectly contribute to meeting its strategic and operational objectives. During this stage, we also identify and prioritize the company’s business processes. That prioritization is established using an internal methodology that allows us to weigh the relative importance of each process compared to the others.
During the second stage, based on the prioritization of the processes described above, we identify the specific risks of each one of them, giving priority to those with greater relative importance. Risks are understood as situations that could prevent or delay the fulfillment of strategic or operational objectives. For each risk, we identify a specific subprocess that it impacts, assign a process owner and classify it according to an easy to understand scheme aligned with the business in which it operates. We call this “taxonomy.”
Third, after classifying the risks and connecting them to one or more processes/subprocesses, we identify the specific risk level determined by likelihood of occurrence and impact and then map out each risk on a heat map. Parque Arauco regularly updates its heat map and presents it annually to the Board in fulfillment of NCG No. 385.
Once the company heat map is defined, the fourth phase involves analyzing risk levels for each process/subprocess and establishing a ranking to determine the most risky within the company. This ranking is used by the Internal Audit area to determine its annual auditing plans, privileging the highest risk areas and considering other factors.
Fifth, we identify the company’s risk pillars and establish KRIs for each of them. These are monitored with a set frequency. These indicators allow us to analyze which risks are more likely to materialize.
Our sixth phase involves risk monitoring. We analyze the risk levels obtained for each KRI, gather observations and opportunities for improvement and create plans of action for each suggestion. We then follow up on them on an ongoing basis.
Finally, alongside all of the phases described above, Parque Arauco employees are trained and informed on the different topics associated with risk management.
We identified seven phases that allow us to systematically address risks on an ongoing basis:
Phase 1: Establishing context Phase 2: Identifying risks Phase 3: Analyzing risks Phase 4: Assessing risks Phase 5: Addressing risks Phase 6: Monitoring and review Phase 7: Communication
Risk management
2.3 The cornerstones of our work
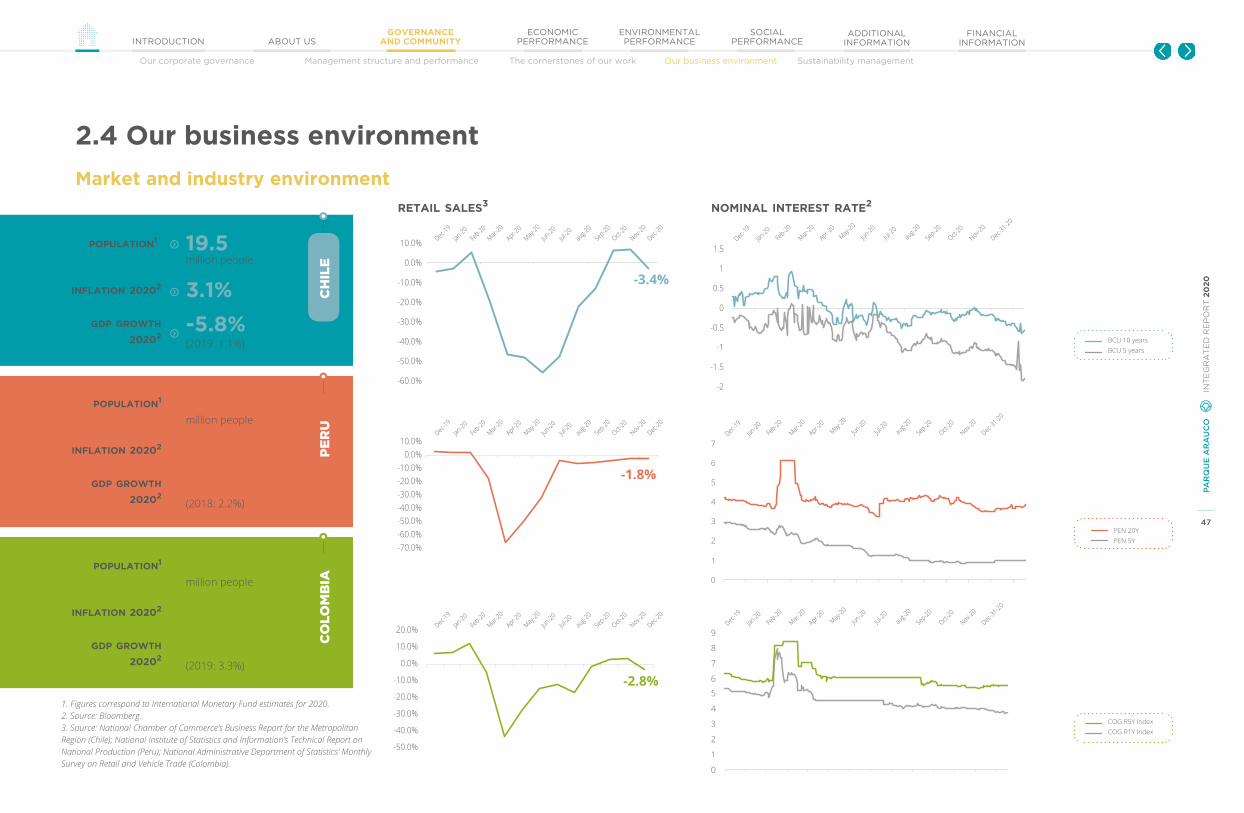
47
PAR
QU
E A
RA
UC
O IN
TE
GR
AT
ED
RE
PO
RT
20
20
GOVERNANCE AND COMMUNITYINTRODUCTION ABOUT US
ECONOMIC PERFORMANCE
ENVIRONMENTAL PERFORMANCE
SOCIAL PERFORMANCE
ADDITIONAL INFORMATION
Our corporate governance Management structure and performance The cornerstones of our work Our business environment Sustainability management
FINANCIAL INFORMATION
2.4 Our business environment
Market and industry environment
BCU 10 yearsBCU 5 years
PEN 20YPEN 5Y
COG R5Y IndexCOG R1Y Index
-2.8%
0
1
2
3
4
5
6
7
0
1
2
3
4
5
6
7
8
9
-3.4%
-1.8%
Dec-19
10.0%
0.0%
-10.0%
-20.0%
-30.0%
-40.0%
-50.0%
-60.0%
Jan-20
Feb-20
Mar-20
Apr-20
May-20
Jun-20Jul-2
0au
g-20
Sep-20
Oct-20
Nov-20
Dec-20
Dec-19
Jan-20
Feb-20
Mar-20
Apr-20
May-20
Jun-20Jul-2
0au
g-20
Sep-20
Oct-20
Nov-20
Dec-31-20
Dec-19
Jan-20
Feb-20
Mar-20
Apr-20
May-20
Jun-20Jul-2
0au
g-20
Sep-20
Oct-20
Nov-20
Dec-31-20
Dec-19
Jan-20
Feb-20
Mar-20
Apr-20
May-20
Jun-20Jul-2
0au
g-20
Sep-20
Oct-20
Nov-20
Dec-20
Dec-19
Jan-20
Feb-20
Mar-20
Apr-20
May-20
Jun-20Jul-2
0au
g-20
Sep-20
Oct-20
Nov-20
Dec-20
Dec-19
Jan-20
Feb-20
Mar-20
Apr-20
May-20
Jun-20Jul-2
0au
g-20
Sep-20
Oct-20
Nov-20
Dec-31-20
10.0%0.0%
-10.0%-20.0%-30.0%-40.0%-50.0%-60.0%-70.0%
20.0%
10.0%
0.0%
-10.0%
-20.0%
-30.0%
-40.0%
-50.0%
19.5 million people
33.5 million people
50.9 million people
-5.8%(2019: 1.1%)
-11.0%(2018: 2.2%)
-6.8%(2019: 3.3%)
3.1%
1.8%
2.5%
1. Figures correspond to International Monetary Fund estimates for 2020.2. Source: Bloomberg.3. Source: National Chamber of Commerce’s Business Report for the Metropolitan Region (Chile); National Institute of Statistics and Information’s Technical Report on National Production (Peru); National Administrative Department of Statistics’ Monthly Survey on Retail and Vehicle Trade (Colombia).
population1
inflation 20202
gDp growth
20202
population1
inflation 20202
gDp growth
20202
population1
inflation 20202
gDp growth
20202
per
uc
hil
ec
olo
mb
ia
retail sales3 nominal interest rate2
1.5
1
0.5
0
-0.5
-1
-1.5
-2

48
PAR
QU
E A
RA
UC
O IN
TE
GR
AT
ED
RE
PO
RT
20
20
GOVERNANCE AND COMMUNITYINTRODUCTION ABOUT US
ECONOMIC PERFORMANCE
ENVIRONMENTAL PERFORMANCE
SOCIAL PERFORMANCE
ADDITIONAL INFORMATION
Our corporate governance Management structure and performance The cornerstones of our work Our business environment Sustainability management
FINANCIAL INFORMATION
It is fundamental for us to have the ability to understand our environment and work in harmony with it. As such, significant changes, even those in addition to the ones inherent to our business, represent opportunities and risks that we seek to manage in order to be better prepared for the future.
Trends, opportunities and risks in the
shopping center industry
2.4 Our business environment
Emerging risks Potential impacts Actions for mitigating or managing these risks
Potential effects of changes in the retail industry and changes in consumer trends on the shopping center format:
Changes or instability in sales and retail consumption. Investments in omnichannel approaches and innovation are prioritized in the short-term.
Strengthening of some retail categories to the detriment of others, which may require adjustments to the use of physical shopping spaces, changes to facilitate logistics and new dynamics that integrate online shopping with in-person activities.
Opportunity to intensify categories based on experiences, culture, entertainment and dining, which will depend on in-person interaction and physical visits to spaces of consumption once the pandemic ends.
The number of square meters in our portfolio that are dedicated to entertainment, culture and dining increased 53% between 2015 and 2020, which demonstrates our approach to diversifying the offering in these categories at our shopping centers.1
In 2020, we implemented various initiatives through digital platforms. We also launched The Shopping Evolution, an innovative platform for identifying and integrating digitally based startups into our operations and the customer experience in our shopping centers.
We made progress on initiatives designed to boost delivery through partnerships with last mile operators and applications that easily and quickly connect demand with tenants of our properties. We implemented a call center for food operators, Arauco Foodie in Chile and Rappi in Colombia.
PA
RQ
UE
AR
AU
CO
IN
TE
GR
AT
ED
RE
PO
RT
20
20
1. The growth in square meters dedicated to entertainment, culture and dining was calculated based on the total number of Parque Arauco properties in 2020, including assets acquired during this period.
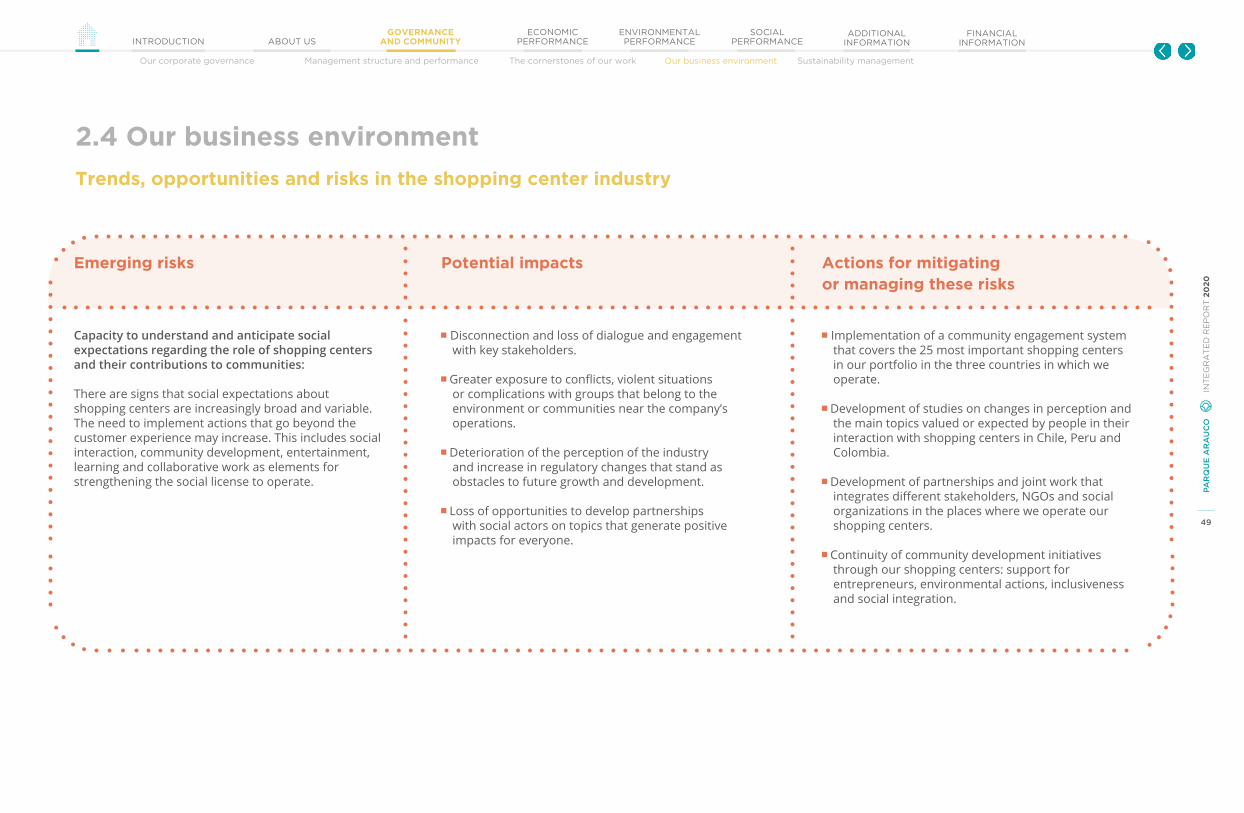
49
PAR
QU
E A
RA
UC
O IN
TE
GR
AT
ED
RE
PO
RT
20
20
GOVERNANCE AND COMMUNITYINTRODUCTION ABOUT US
ECONOMIC PERFORMANCE
ENVIRONMENTAL PERFORMANCE
SOCIAL PERFORMANCE
ADDITIONAL INFORMATION
Our corporate governance Management structure and performance The cornerstones of our work Our business environment Sustainability management
FINANCIAL INFORMATION
Trends, opportunities and risks in the shopping center industry
2.4 Our business environment
Emerging risks Potential impacts Actions for mitigating or managing these risks
Capacity to understand and anticipate social expectations regarding the role of shopping centers and their contributions to communities: There are signs that social expectations about shopping centers are increasingly broad and variable. The need to implement actions that go beyond the customer experience may increase. This includes social interaction, community development, entertainment, learning and collaborative work as elements for strengthening the social license to operate.
Disconnection and loss of dialogue and engagement with key stakeholders.
Greater exposure to conflicts, violent situations or complications with groups that belong to the environment or communities near the company’s operations.
Deterioration of the perception of the industry and increase in regulatory changes that stand as obstacles to future growth and development.
Loss of opportunities to develop partnerships with social actors on topics that generate positive impacts for everyone.
Implementation of a community engagement system that covers the 25 most important shopping centers in our portfolio in the three countries in which we operate.
Development of studies on changes in perception and the main topics valued or expected by people in their interaction with shopping centers in Chile, Peru and Colombia.
Development of partnerships and joint work that integrates different stakeholders, NGOs and social organizations in the places where we operate our shopping centers.
Continuity of community development initiatives through our shopping centers: support for entrepreneurs, environmental actions, inclusiveness and social integration.
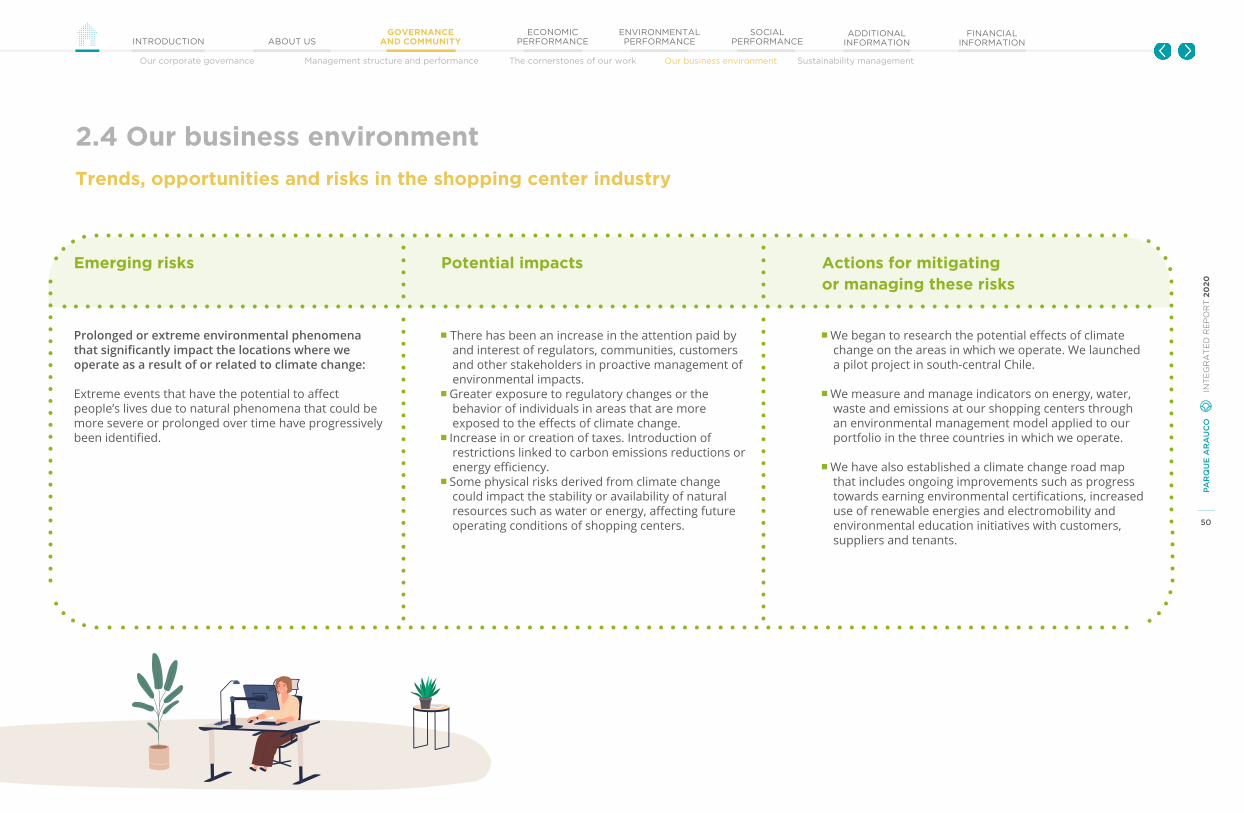
50
PAR
QU
E A
RA
UC
O IN
TE
GR
AT
ED
RE
PO
RT
20
20
GOVERNANCE AND COMMUNITYINTRODUCTION ABOUT US
ECONOMIC PERFORMANCE
ENVIRONMENTAL PERFORMANCE
SOCIAL PERFORMANCE
ADDITIONAL INFORMATION
Our corporate governance Management structure and performance The cornerstones of our work Our business environment Sustainability management
FINANCIAL INFORMATION
Trends, opportunities and risks in the shopping center industry
2.4 Our business environment
Emerging risks Potential impacts Actions for mitigating or managing these risks
Prolonged or extreme environmental phenomena that significantly impact the locations where we operate as a result of or related to climate change: Extreme events that have the potential to affect people’s lives due to natural phenomena that could be more severe or prolonged over time have progressively been identified.
There has been an increase in the attention paid by and interest of regulators, communities, customers and other stakeholders in proactive management of environmental impacts.
Greater exposure to regulatory changes or the behavior of individuals in areas that are more exposed to the effects of climate change.
Increase in or creation of taxes. Introduction of restrictions linked to carbon emissions reductions or energy efficiency.
Some physical risks derived from climate change could impact the stability or availability of natural resources such as water or energy, affecting future operating conditions of shopping centers.
We began to research the potential effects of climate change on the areas in which we operate. We launched a pilot project in south-central Chile.
We measure and manage indicators on energy, water, waste and emissions at our shopping centers through an environmental management model applied to our portfolio in the three countries in which we operate.
We have also established a climate change road map that includes ongoing improvements such as progress towards earning environmental certifications, increased use of renewable energies and electromobility and environmental education initiatives with customers, suppliers and tenants.

51
PA
RQ
UE
AR
AU
CO
IN
TE
GR
AT
ED
RE
PO
RT
20
20
GOVERNANCE AND COMMUNITYINTRODUCTION ABOUT US
ECONOMIC PERFORMANCE
ENVIRONMENTAL PERFORMANCE
SOCIAL PERFORMANCE
ADDITIONAL INFORMATION
Our corporate governance Management structure and performance The cornerstones of our work Our business environment Sustainability management
FINANCIAL INFORMATION
2.5 Sustainability management
We have a sustainability strategy based on consultation and interaction with our stakeholders, analysis of industry best practices and topics that have a greater impact on our business.
We incorporate international standards and indicators that assess our actions annually. This helps us to align our work with the priorities of the UN 2030 Agenda for Sustainable Development and to contribute to meeting the SDGs.
This agenda is led by our Sustainability Area, which reports its progress and management priorities to the Board quarterly. The area is led by a Corporate Sustainability Committee, which is charged with conducting a detailed review of progress on the strategy and industry trends, as well as other issues. In addition, we coordinate with the various areas
and divisions on an ongoing basis to ensure responsible and sustainable management of the entire organization.
In terms of operations, the governance associated with sustainability also includes monthly technical committee meetings in each business area, which is meant to address environmental topics and the work related to them. In addition, we established Community Committees in the three countries in which we operate during 2020. This allows us to identify and implement initiatives that strengthen the relationship with the most immediate community and the groups present in the areas around our properties.
Dim
en
sio
na
re
as o
f w
or
k
our sustainability strategy
Climate change and managing our carbon footprint
Sustainable design and construction
Sustainable operations (efficient use of water and energy and waste management)
Connection to neighboring communities
Support for enterprise Integration, accessibility and promoting an inclusive culture
Sustainable practices in the value chain
Corporate governance practices Sustainability practices in strategic suppliers
Quality of reporting and ESG information for stakeholders
Progress on KPIs and performance of key sustainability indexes
enVironmental socialcorporate
goVernance
see more see more see more
Our sustainability vision
See more details on the prioritization of topics for this 2020 Report (materiality) and the connection to the Sustainable Development Goals (SDG).
see more
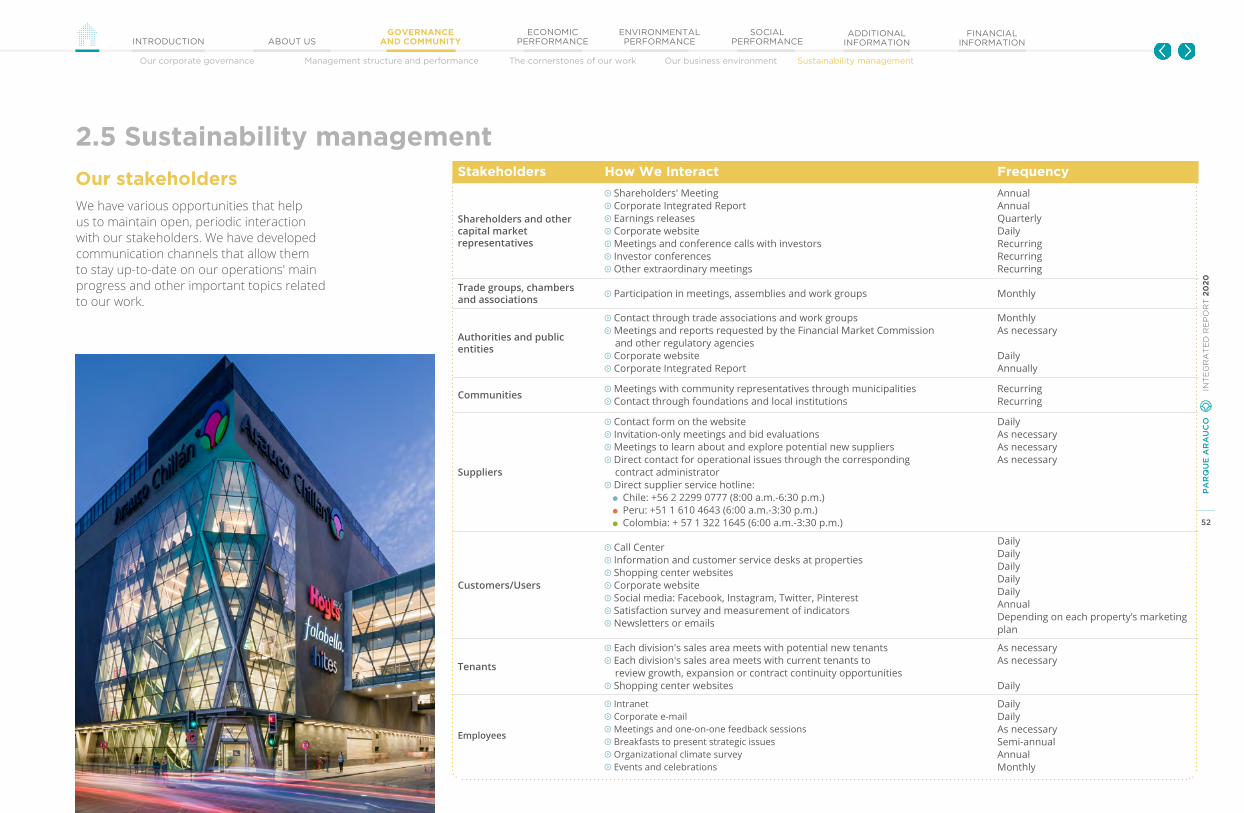
52
PA
RQ
UE
AR
AU
CO
IN
TE
GR
AT
ED
RE
PO
RT
20
20
GOVERNANCE AND COMMUNITYINTRODUCTION ABOUT US
ECONOMIC PERFORMANCE
ENVIRONMENTAL PERFORMANCE
SOCIAL PERFORMANCE
ADDITIONAL INFORMATION
Our corporate governance Management structure and performance The cornerstones of our work Our business environment Sustainability management
FINANCIAL INFORMATION
We have various opportunities that help us to maintain open, periodic interaction with our stakeholders. We have developed communication channels that allow them to stay up-to-date on our operations' main progress and other important topics related to our work.
Our stakeholders
2.5 Sustainability managementStakeholders How We Interact Frequency
Shareholders and other capital market representatives
Shareholders' Meeting Corporate Integrated Report Earnings releases Corporate website Meetings and conference calls with investors Investor conferences Other extraordinary meetings
AnnualAnnualQuarterlyDailyRecurringRecurringRecurring
Trade groups, chambers and associations Participation in meetings, assemblies and work groups Monthly
Authorities and public entities
Contact through trade associations and work groups Meetings and reports requested by the Financial Market Commission
and other regulatory agencies Corporate website Corporate Integrated Report
MonthlyAs necessary
DailyAnnually
Communities Meetings with community representatives through municipalities Contact through foundations and local institutions
RecurringRecurring
Suppliers
Contact form on the website Invitation-only meetings and bid evaluations Meetings to learn about and explore potential new suppliers Direct contact for operational issues through the corresponding
contract administrator Direct supplier service hotline:
Chile: +56 2 2299 0777 (8:00 a.m.-6:30 p.m.) Peru: +51 1 610 4643 (6:00 a.m.-3:30 p.m.) Colombia: + 57 1 322 1645 (6:00 a.m.-3:30 p.m.)
DailyAs necessaryAs necessaryAs necessary
Customers/Users
Call Center Information and customer service desks at properties Shopping center websites Corporate website Social media: Facebook, Instagram, Twitter, Pinterest Satisfaction survey and measurement of indicators Newsletters or emails
DailyDailyDailyDailyDailyAnnualDepending on each property’s marketing plan
Tenants
Each division's sales area meets with potential new tenants Each division's sales area meets with current tenants to
review growth, expansion or contract continuity opportunities Shopping center websites
As necessaryAs necessary
Daily
Employees
Intranet Corporate e-mail Meetings and one-on-one feedback sessions Breakfasts to present strategic issues Organizational climate survey Events and celebrations
DailyDailyAs necessarySemi-annualAnnualMonthly
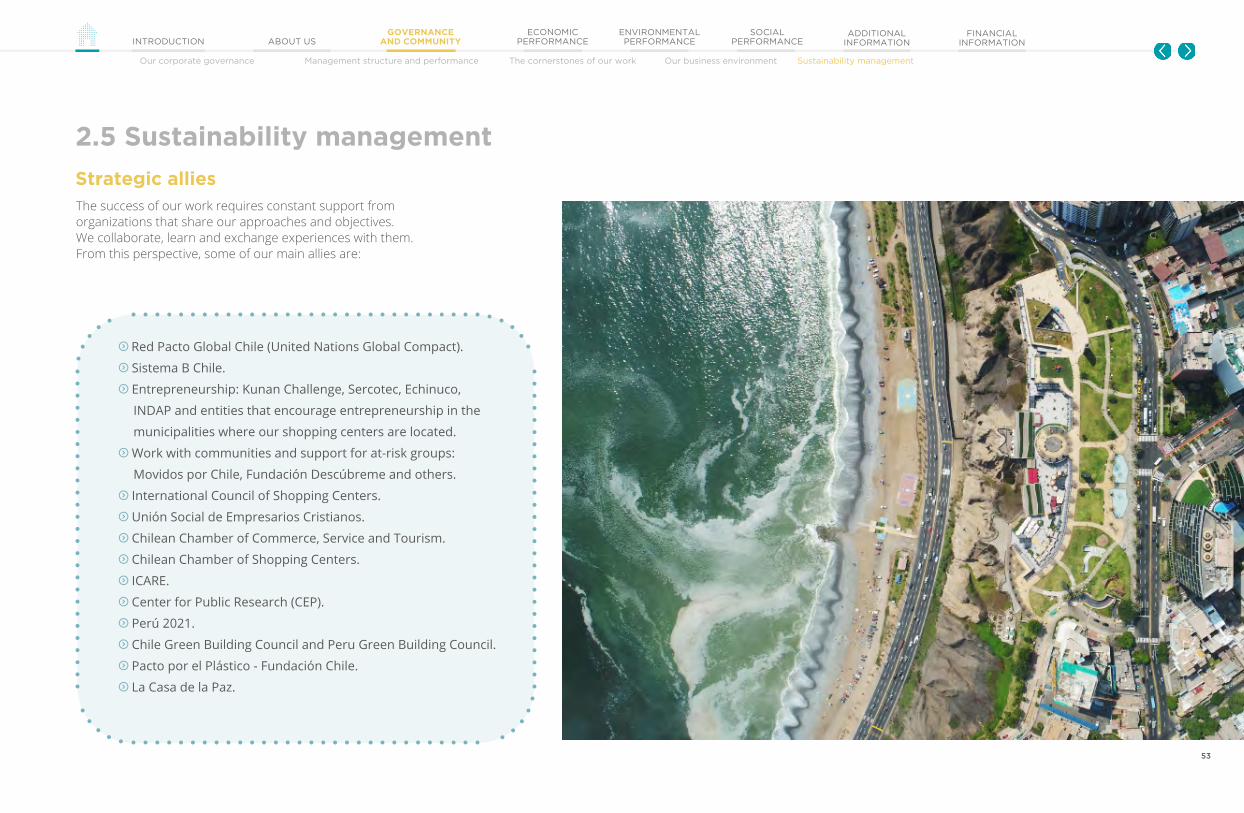
53
PA
RQ
UE
AR
AU
CO
IN
TE
GR
AT
ED
RE
PO
RT
20
20
GOVERNANCE AND COMMUNITYINTRODUCTION ABOUT US
ECONOMIC PERFORMANCE
ENVIRONMENTAL PERFORMANCE
SOCIAL PERFORMANCE
ADDITIONAL INFORMATION
Our corporate governance Management structure and performance The cornerstones of our work Our business environment Sustainability management
FINANCIAL INFORMATION
The success of our work requires constant support from organizations that share our approaches and objectives. We collaborate, learn and exchange experiences with them. From this perspective, some of our main allies are:
Strategic allies
2.5 Sustainability management
Red Pacto Global Chile (United Nations Global Compact).
Sistema B Chile.
Entrepreneurship: Kunan Challenge, Sercotec, Echinuco,
INDAP and entities that encourage entrepreneurship in the
municipalities where our shopping centers are located.
Work with communities and support for at-risk groups:
Movidos por Chile, Fundación Descúbreme and others.
International Council of Shopping Centers.
Unión Social de Empresarios Cristianos.
Chilean Chamber of Commerce, Service and Tourism.
Chilean Chamber of Shopping Centers.
ICARE.
Center for Public Research (CEP).
Perú 2021.
Chile Green Building Council and Peru Green Building Council.
Pacto por el Plástico - Fundación Chile.
La Casa de la Paz.
53

54
PA
RQ
UE
AR
AU
CO
IN
TE
GR
AT
ED
RE
PO
RT
20
20
Financial capital Real estate capital Our customers
GOVERNANCEAND COMMUNITYINTRODUCTION ABOUT US
ECONOMIC PERFORMANCE
ENVIRONMENTAL PERFORMANCE
SOCIAL PERFORMANCE
ADDITIONAL INFORMATION
FINANCIAL INFORMATION
Economic performance
3.1 Financial capital
3.2 Real estate capital
3.3 Our customers
03.
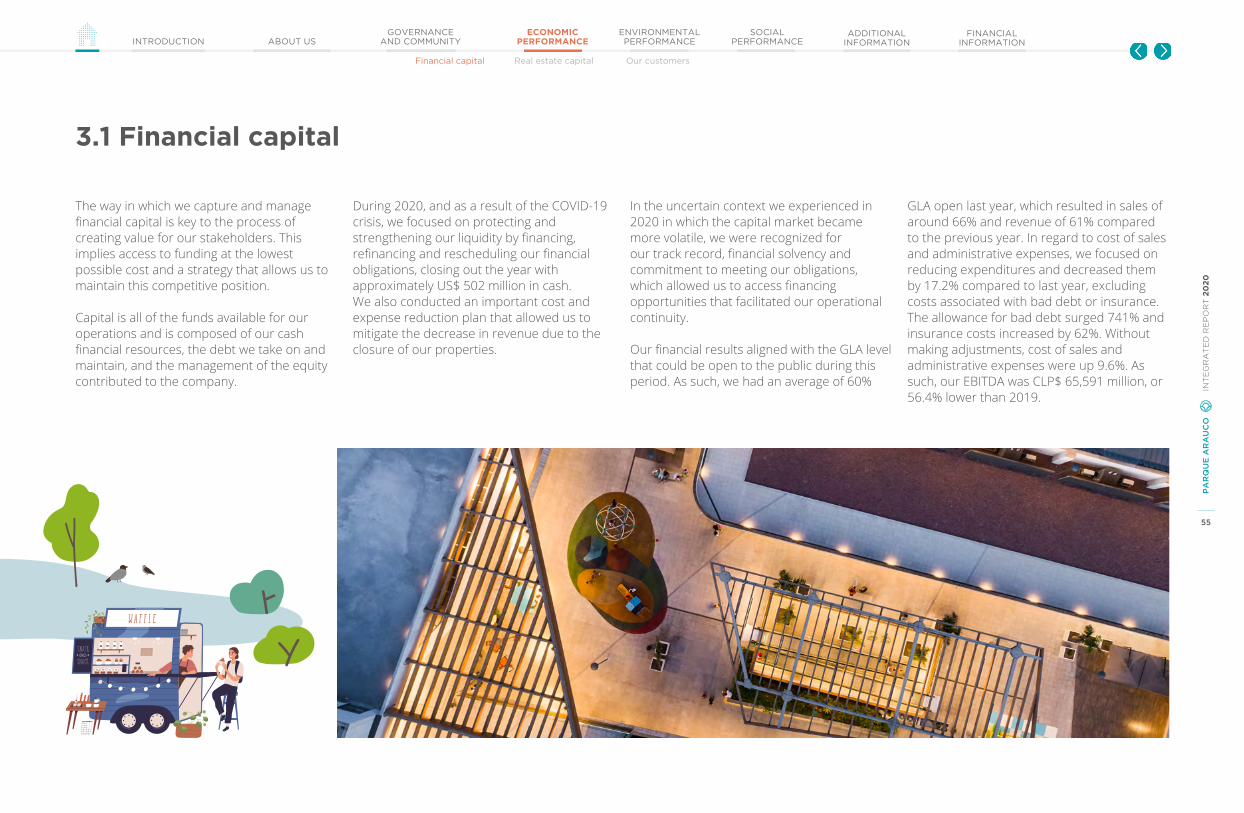
55
PA
RQ
UE
AR
AU
CO
IN
TE
GR
AT
ED
RE
PO
RT
20
20
Financial capital Real estate capital Our customers
GOVERNANCEAND COMMUNITYINTRODUCTION ABOUT US
ECONOMIC PERFORMANCE
ENVIRONMENTAL PERFORMANCE
SOCIAL PERFORMANCE
ADDITIONAL INFORMATION
FINANCIAL INFORMATION
3.1 Financial capital
The way in which we capture and manage financial capital is key to the process of creating value for our stakeholders. This implies access to funding at the lowest possible cost and a strategy that allows us to maintain this competitive position.
Capital is all of the funds available for our operations and is composed of our cash financial resources, the debt we take on and maintain, and the management of the equity contributed to the company.
During 2020, and as a result of the COVID-19 crisis, we focused on protecting and strengthening our liquidity by financing, refinancing and rescheduling our financial obligations, closing out the year with approximately US$ 502 million in cash. We also conducted an important cost and expense reduction plan that allowed us to mitigate the decrease in revenue due to the closure of our properties.
In the uncertain context we experienced in 2020 in which the capital market became more volatile, we were recognized for our track record, financial solvency and commitment to meeting our obligations, which allowed us to access financing opportunities that facilitated our operational continuity.
Our financial results aligned with the GLA level that could be open to the public during this period. As such, we had an average of 60%
GLA open last year, which resulted in sales of around 66% and revenue of 61% compared to the previous year. In regard to cost of sales and administrative expenses, we focused on reducing expenditures and decreased them by 17.2% compared to last year, excluding costs associated with bad debt or insurance. The allowance for bad debt surged 741% and insurance costs increased by 62%. Without making adjustments, cost of sales and administrative expenses were up 9.6%. As such, our EBITDA was CLP$ 65,591 million, or 56.4% lower than 2019.
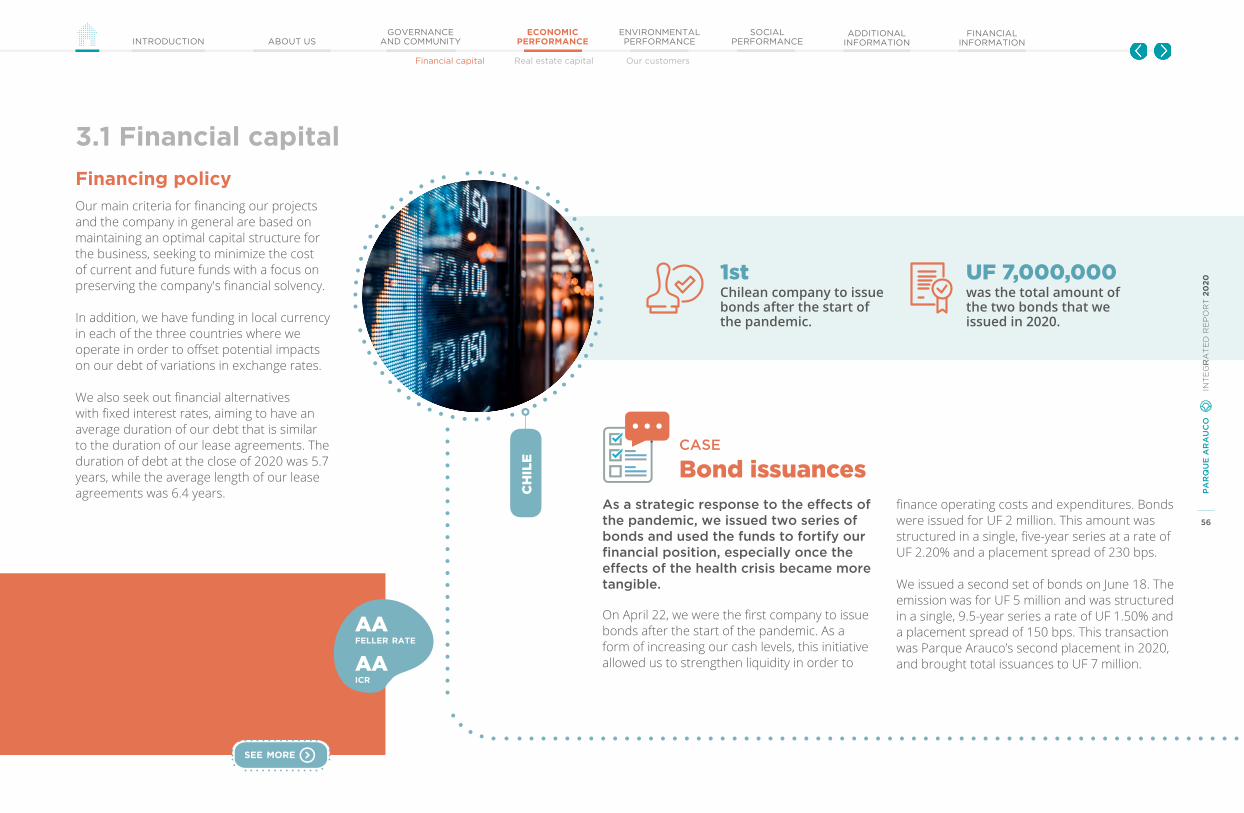
56
PA
RQ
UE
AR
AU
CO
IN
TE
GR
AT
ED
RE
PO
RT
20
20
Financial capital Real estate capital Our customers
GOVERNANCEAND COMMUNITYINTRODUCTION ABOUT US
ECONOMIC PERFORMANCE
ENVIRONMENTAL PERFORMANCE
SOCIAL PERFORMANCE
ADDITIONAL INFORMATION
FINANCIAL INFORMATION
3.1 Financial capital
Our main criteria for financing our projects and the company in general are based on maintaining an optimal capital structure for the business, seeking to minimize the cost of current and future funds with a focus on preserving the company's financial solvency.
In addition, we have funding in local currency in each of the three countries where we operate in order to offset potential impacts on our debt of variations in exchange rates.
We also seek out financial alternatives with fixed interest rates, aiming to have an average duration of our debt that is similar to the duration of our lease agreements. The duration of debt at the close of 2020 was 5.7 years, while the average length of our lease agreements was 6.4 years.
Financing policy
As a strategic response to the effects of the pandemic, we issued two series of bonds and used the funds to fortify our financial position, especially once the effects of the health crisis became more tangible.
On April 22, we were the first company to issue bonds after the start of the pandemic. As a form of increasing our cash levels, this initiative allowed us to strengthen liquidity in order to
finance operating costs and expenditures. Bonds were issued for UF 2 million. This amount was structured in a single, five-year series at a rate of UF 2.20% and a placement spread of 230 bps.
We issued a second set of bonds on June 18. The emission was for UF 5 million and was structured in a single, 9.5-year series a rate of UF 1.50% and a placement spread of 150 bps. This transaction was Parque Arauco’s second placement in 2020, and brought total issuances to UF 7 million.
Bond issuancesCASE
was the total amount of the two bonds that we issued in 2020.
Chilean company to issue bonds after the start of the pandemic.
UF 7,000,0001st
RA
TE
D R
EP
OR
T 2
02
0
During 2020, and despite the uncertainty that the pandemic generated, Feller Rate and ICR rating agencies did not change our company’s rating, with a stable outlook, recognizing our capital management in response to the crisis, the solidity of our real estate assets and the consistency of our global financial strategy.
feller rate
icr
AA
AA
see more
ch
ile

57
PA
RQ
UE
AR
AU
CO
IN
TE
GR
AT
ED
RE
PO
RT
20
20
Financial capital Real estate capital Our customers
GOVERNANCEAND COMMUNITYINTRODUCTION ABOUT US
ECONOMIC PERFORMANCE
ENVIRONMENTAL PERFORMANCE
SOCIAL PERFORMANCE
ADDITIONAL INFORMATION
FINANCIAL INFORMATION
3.1 Financial capital
Consolidated revenue totaled CLP$125,852 million, a 38.8% decrease compared to 2019. This drop is due to the pandemic and limitations on the operation of our shopping centers.
EBITDA in 2020 was CLP$65,591 million, 56.4% lower than in 2019. This is mainly due to the reduced revenue received due to the impact of the COVID-19 pandemic.
Tenant sales in 2020 totaledCLP$1,360,986 million, reaching 66.1% of the value reported in 2019. This decrease in sales is aligned with the percentage of GLA open to the public, which averaged around 60% for 2020. The EBITDA margin fell to 52.1%
in a challenging environment.
20
5,6
13
150
,56
2
2,0
59
,78
5
73
.2%
125
,85
2
65
,59
1
1,3
60
,98
6
52
.1%
2019 2019
2019 2019
2020 2020
2020 2020
-38.8% -56.4%
-33.9% -2,111 bps
reVenue (MCLP$)
ebitDa (MCLP$)
tenant sales
(MCLP$)ebitDa margin
Our economic performance in 2019 and 2020(As of December 31, 2020)
1. Tenant sales in Peru and Colombia expressed in CLP using the following exchange rates: US$ 1 = CLP 773.96; US$ 1 = PEN 3.56; US$ 1 = COP 3,753.4.
see more

58
PA
RQ
UE
AR
AU
CO
IN
TE
GR
AT
ED
RE
PO
RT
20
20
Financial capital Real estate capital Our customers
GOVERNANCEAND COMMUNITYINTRODUCTION ABOUT US
ECONOMIC PERFORMANCE
ENVIRONMENTAL PERFORMANCE
SOCIAL PERFORMANCE
ADDITIONAL INFORMATION
FINANCIAL INFORMATION
3.1 Financial capital
Our economic performance in 2019 and 2020(As of December 31, 2020)
RA
TE
D R
EP
OR
T 2
02
0
Profit attributable to equity holders of the parent was lower than in 2019, totaling CLP$1,846 million in 2020, down 98% from the previous year. This reflects the situation of the pandemic.
93,394
1,846
2019 2020
-98%
profit attributable to equity holDers of the parent (MCLP$)
Parque Arauco's NOI (net operating income) dropped 56.9% to CLP$72,115 million for 2020, mainly due to the partial closure of operations in Chile, Peru and Colombia.
167,490
72,115
2019 2020
-56.9%
consoliDateD noi (MCLP$)
FFO decreased mainly due to the drop in EBITDA and, to a lesser extent, higher financial expenses related to the new debt that we took on during the second quarter, and debt prepayments made in the fourth quarter of 2020.
118,525
31,756
2019 2020
-73.2%
ffo
(MCLP$)1
see more

59
PA
RQ
UE
AR
AU
CO
IN
TE
GR
AT
ED
RE
PO
RT
20
20
Financial capital Real estate capital Our customers
GOVERNANCEAND COMMUNITYINTRODUCTION ABOUT US
ECONOMIC PERFORMANCE
ENVIRONMENTAL PERFORMANCE
SOCIAL PERFORMANCE
ADDITIONAL INFORMATION
FINANCIAL INFORMATION
3.1 Financial capital
liabilities / equity(times)
2014 2015 2016 2017 2018 2019 2020
0.8
1
1.15 1.18 1.2
1
1.2
1
1.3
0 1.4
7
net financial Debt / equity(times)
2014 2015 2016 2017 2018 2019 2020
< 1.50
0.4
7 0.7
6
0.7
2
0.7
7
0.6
6
0.6
6 0.7
9
ebitDa / financial expenses(times)
2014 2015 2016 2017 2018 2019 2020
3.3
1
3.3
3
3.0
4 3.4
2 3.7
6
3.7
6
1.3
2
Financial indicators1
1. As of December of each year.
net financial Debt / ebitDa(times)
2014 2015 2016 2017 2018 2019 2020
4.2
5 5.8
7
5.8
8
5.5
4
5.1
9
5.0
9
13.1
4
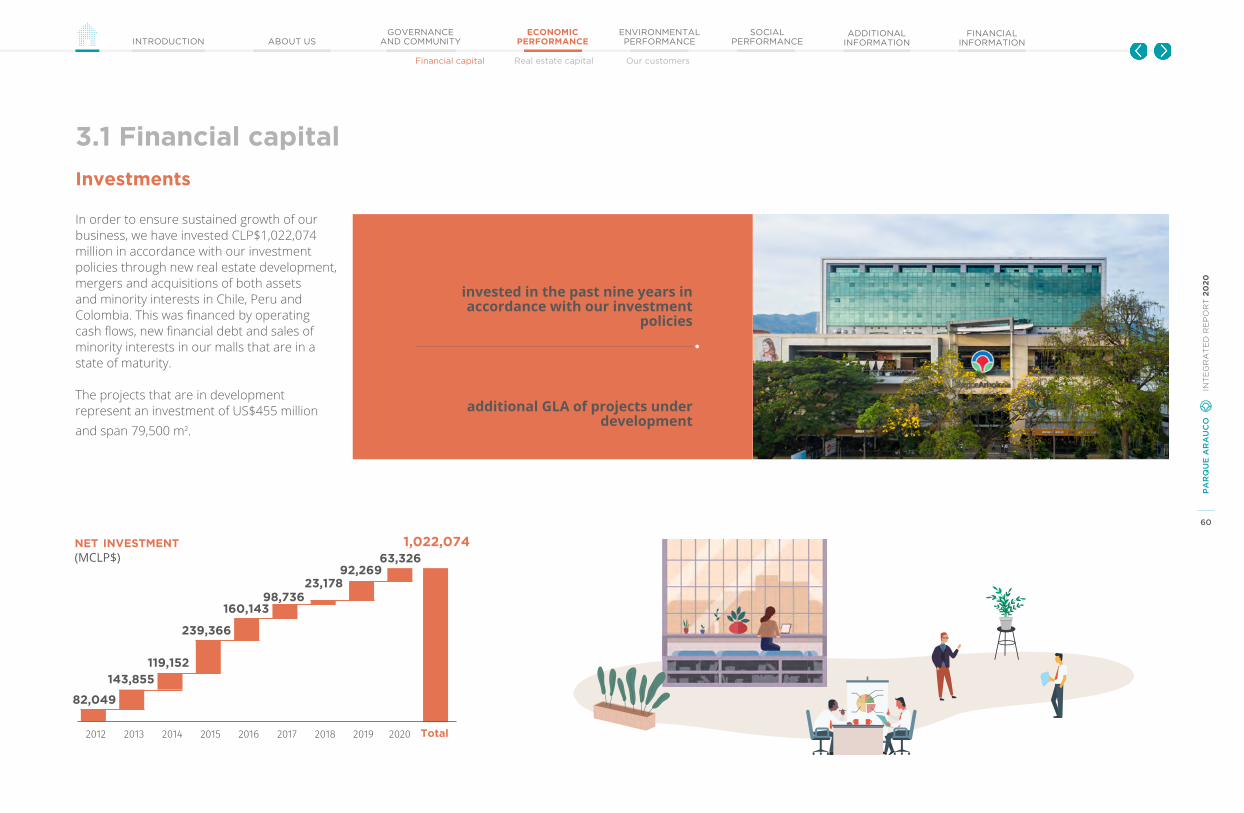
60
PA
RQ
UE
AR
AU
CO
IN
TE
GR
AT
ED
RE
PO
RT
20
20
Financial capital Real estate capital Our customers
GOVERNANCEAND COMMUNITYINTRODUCTION ABOUT US
ECONOMIC PERFORMANCE
ENVIRONMENTAL PERFORMANCE
SOCIAL PERFORMANCE
ADDITIONAL INFORMATION
FINANCIAL INFORMATION
3.1 Financial capital
Investments
net inVestment(MCLP$)
2012 2013 2014 2015 2016 2017 2018 2019 2020
82,049
143,855119,152
239,366
160,14398,736
23,17892,269
63,326
Total
invested in the past nine years in accordance with our investment
policies
additional GLA of projects under development
CLP$1,022,074 million
79,500 m2
In order to ensure sustained growth of our business, we have invested CLP$1,022,074 million in accordance with our investment policies through new real estate development, mergers and acquisitions of both assets and minority interests in Chile, Peru and Colombia. This was financed by operating cash flows, new financial debt and sales of minority interests in our malls that are in a state of maturity.
The projects that are in development represent an investment of US$455 million and span 79,500 m2.
1,022,074

61
PA
RQ
UE
AR
AU
CO
IN
TE
GR
AT
ED
RE
PO
RT
20
20
Financial capital Real estate capital Our customers
GOVERNANCEAND COMMUNITYINTRODUCTION ABOUT US
ECONOMIC PERFORMANCE
ENVIRONMENTAL PERFORMANCE
SOCIAL PERFORMANCE
ADDITIONAL INFORMATION
FINANCIAL INFORMATION
3.1 Financial capital
Debt profile
uf
fixeD
70%
100%
Distribution by currency
Distribution by Debt type
Distribution by interest rate type
cop4%
pen12%
clp14%
bonDs62%
loans37%
leasing1%

62
PA
RQ
UE
AR
AU
CO
IN
TE
GR
AT
ED
RE
PO
RT
20
20
Financial capital Real estate capital Our customers
GOVERNANCEAND COMMUNITYINTRODUCTION ABOUT US
ECONOMIC PERFORMANCE
ENVIRONMENTAL PERFORMANCE
SOCIAL PERFORMANCE
ADDITIONAL INFORMATION
FINANCIAL INFORMATION
3.2 Real estate capital
Our portfolio of assets includes shopping centers that have become icons in the areas in which they are located in Chile, Peru and Colombia.
Parque Arauco Kennedy Date added to portfolio: 1982 Total GLA: 111,000 m2
Parque Arauco’s ownership interest: 100% Occupancy: 98.6%
Arauco Maipú Date added to portfolio: 1993 Total GLA: 69,500 m2
Parque Arauco’s ownership interest: 100% Occupancy: 97.5%
Arauco Estación Date added to portfolio: 2008 Total GLA: 67,500 m2
Parque Arauco’s ownership interest: 83% Occupancy: 95.1%
Larcomar Date added to portfolio: 2010 Total GLA: 26,500 m2
Parque Arauco’s ownership interest: 100% Occupancy: 80.2%
MegaPlaza Norte Date added to portfolio: 2006 Total GLA: 112,000 m2
Parque Arauco’s ownership interest: 100% Occupancy: 87.8%
Parque La Colina Date added to portfolio: 2016 Total GLA: 61,500 m2
Parque Arauco’s ownership interest: 100% Occupancy: 97.9%
Our portfoliosee more
per
u
per
uc
hil
e
ch
ile
ch
ile
co
lom
bia

63
PA
RQ
UE
AR
AU
CO
IN
TE
GR
AT
ED
RE
PO
RT
20
20
Financial capital Real estate capital Our customers
GOVERNANCEAND COMMUNITYINTRODUCTION ABOUT US
ECONOMIC PERFORMANCE
ENVIRONMENTAL PERFORMANCE
SOCIAL PERFORMANCE
ADDITIONAL INFORMATION
FINANCIAL INFORMATION
3.2 Real estate capital
We also have mixed-use assets that combine offices, residences, commercial space and hotels as well as other businesses in one place. This makes them high-value locations in the cities where they are opened and optimize the use of available land. This trend in the real estate industry facilitates the generation of synergies and is a response to new lifestyles that focus on shorter travel times and a better quality of life.
Parque Arauco Kennedy | Development
Health center and mixed use (under development)
MegaPlaza Norte
Health center
Arauco San Antonio
Hotel
Casino
Parque Arboleda
Office tower
Our portfolio
Puerto Nuevo | Development Commercial space in a complex that includes residential, office and hotel space (under development)
Parque Caracolí Office tower
Sonesta Hotel with 104 rooms
see more
ch
ile
per
u
co
lom
bia
ch
ile
ch
ile
co
lom
bia

64
PA
RQ
UE
AR
AU
CO
IN
TE
GR
AT
ED
RE
PO
RT
20
20
Financial capital Real estate capital Our customers
GOVERNANCEAND COMMUNITYINTRODUCTION ABOUT US
ECONOMIC PERFORMANCE
ENVIRONMENTAL PERFORMANCE
SOCIAL PERFORMANCE
ADDITIONAL INFORMATION
FINANCIAL INFORMATION
Assets added Type Country Format Date addedTotal GLA
m2
% Ownership
Owned GLA m2
Total investment
(local currency)1
Total investment
(MUS$)
Arauco Premium Outlet Buenaventura Expansion Chile Outlet January 2020 1,500 100% 1,500 140,000 5.72
Arauco Express Chicauma Development Chile Strip center March 2020 500 100% 500 2,0003 0.08
Parque La Colina- Local Conversion Colombia Regional shopping center December 2020 500 100% 500 2,700 0.79
Additional company-owned GLA in 2020
2,500 m2
3.2 Real estate capital
Our portfolio
1. Projects in UF (Chile), MPEN (Peru) and MCOP (Colombia). 2. Using exchange rates as of December 31, 2020: 29,070.33 CLP/UF, 710.95 CLP/USD, 3,421.00 COP/USD, 3.62 PEN/USD.3. The amount only includes development expenses and costs associated with the purchase option for the land and asset.

65
PA
RQ
UE
AR
AU
CO
IN
TE
GR
AT
ED
RE
PO
RT
20
20
Financial capital Real estate capital Our customers
GOVERNANCEAND COMMUNITYINTRODUCTION ABOUT US
ECONOMIC PERFORMANCE
ENVIRONMENTAL PERFORMANCE
SOCIAL PERFORMANCE
ADDITIONAL INFORMATION
FINANCIAL INFORMATION
progress on mall 4Together with our construction suppliers, we implemented all of the COVID control measures required by the government in order to care for individuals’ wellbeing and achieve sustainable continuity when officials allowed for a progressive return to in-person work.
This project includes the new Falabella store, which will have nearly 25,000 m2 of surface area, and that we hope will be an unprecedented space for this iconic retail brand.
We also completed construction on over 1,000 parking spaces, which will be added to the shopping center. These have an innovative ventilation system that brings in air from the outside at all levels, improving air quality and the user experience.
We also installed a Parking Management System (PMS) that uses the latest technology, high resolution video surveillance and coverage, and a Parking Guiding System (PSG) that allows users to locate their vehicle through license plate recognition if they have forgotten where they parked. We also considered security measures in the new parking area and throughout the shopping center.
Investment
Additional commercial GLA
US$ 310 million
21,000 m2
Arauco Kennedy expansionWe made progress on the development of this expansion project despite the challenges posed by the health crisis, which required us to completely halt work due to the measures implemented by officials to control the pandemic at various points in 2020.
CASE
ch
ile
3.2 Real estate capital
65
PA
RQ
UE
AR
AU
CO
IN
TE
GR
AT
ED
RE
PO
RT
20
20
Our portfolio
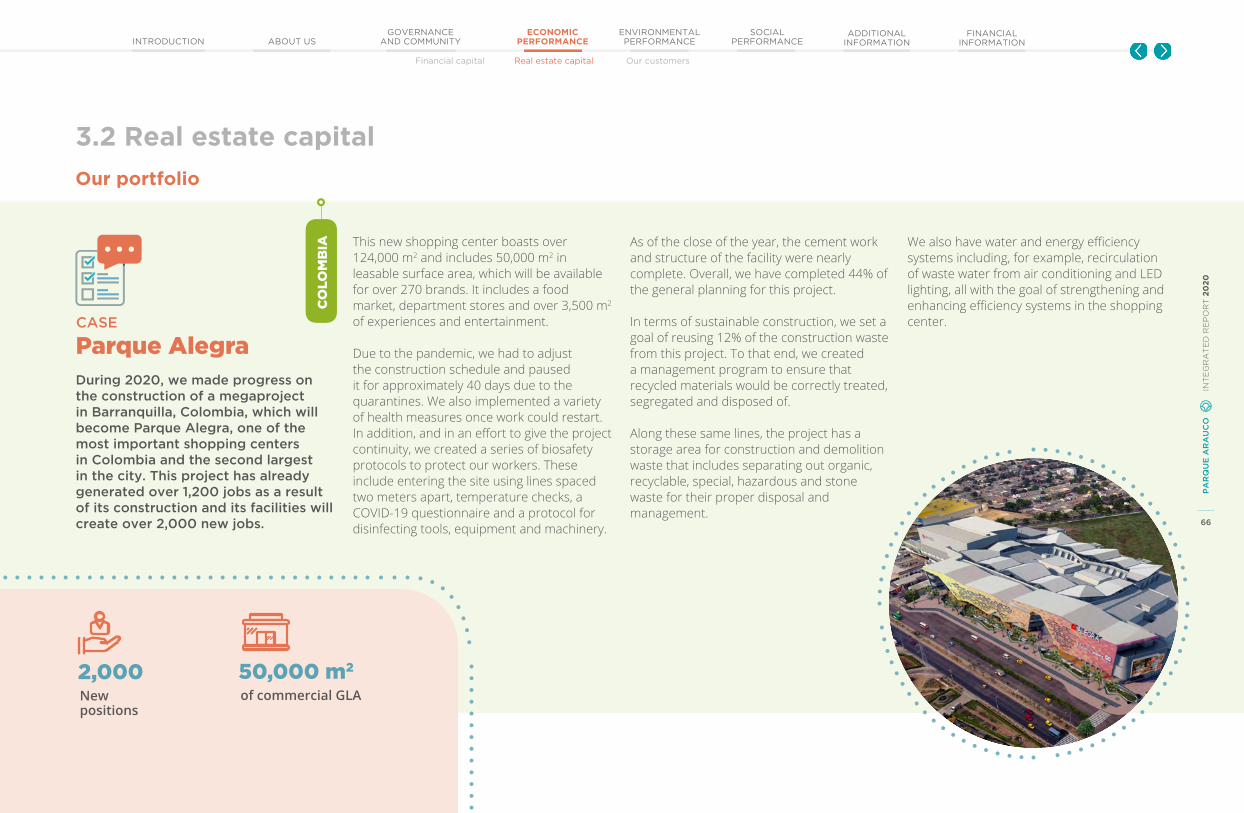
66
PA
RQ
UE
AR
AU
CO
IN
TE
GR
AT
ED
RE
PO
RT
20
20
Financial capital Real estate capital Our customers
GOVERNANCEAND COMMUNITYINTRODUCTION ABOUT US
ECONOMIC PERFORMANCE
ENVIRONMENTAL PERFORMANCE
SOCIAL PERFORMANCE
ADDITIONAL INFORMATION
FINANCIAL INFORMATION
This new shopping center boasts over 124,000 m2 and includes 50,000 m2 in leasable surface area, which will be available for over 270 brands. It includes a food market, department stores and over 3,500 m2 of experiences and entertainment.
Due to the pandemic, we had to adjust the construction schedule and paused it for approximately 40 days due to the quarantines. We also implemented a variety of health measures once work could restart. In addition, and in an effort to give the project continuity, we created a series of biosafety protocols to protect our workers. These include entering the site using lines spaced two meters apart, temperature checks, a COVID-19 questionnaire and a protocol for disinfecting tools, equipment and machinery.
As of the close of the year, the cement work and structure of the facility were nearly complete. Overall, we have completed 44% of the general planning for this project.
In terms of sustainable construction, we set a goal of reusing 12% of the construction waste from this project. To that end, we created a management program to ensure that recycled materials would be correctly treated, segregated and disposed of.
Along these same lines, the project has a storage area for construction and demolition waste that includes separating out organic, recyclable, special, hazardous and stone waste for their proper disposal and management.
We also have water and energy efficiency systems including, for example, recirculation of waste water from air conditioning and LED lighting, all with the goal of strengthening and enhancing efficiency systems in the shopping center.
Parque AlegraDuring 2020, we made progress on the construction of a megaproject in Barranquilla, Colombia, which will become Parque Alegra, one of the most important shopping centers in Colombia and the second largest in the city. This project has already generated over 1,200 jobs as a result of its construction and its facilities will create over 2,000 new jobs.
CASE
New positions
2,000of commercial GLA50,000 m2
66
PA
RQ
UE
AR
AU
CO
IN
TE
GR
AT
ED
RE
PO
RT
20
20
3.2 Real estate capital
co
lom
bia
Our portfolio
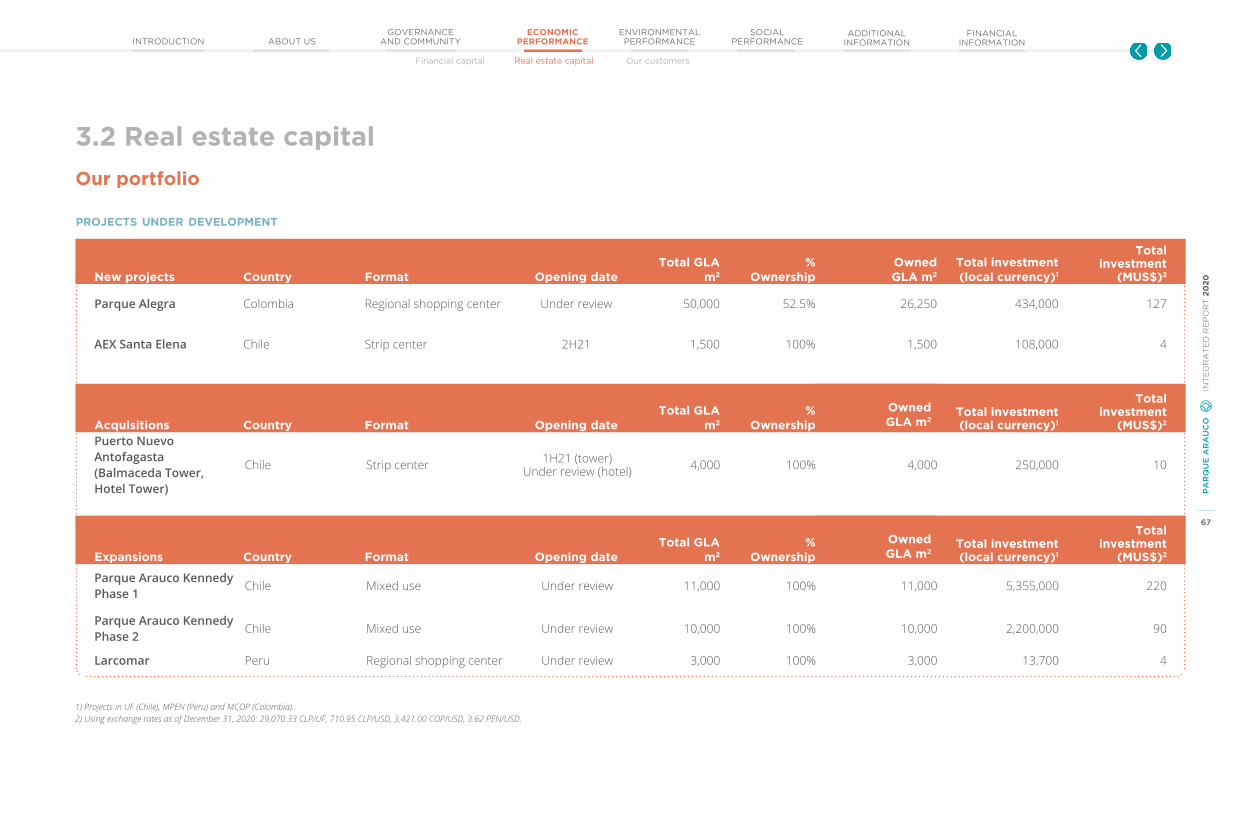
67
PA
RQ
UE
AR
AU
CO
IN
TE
GR
AT
ED
RE
PO
RT
20
20
Financial capital Real estate capital Our customers
GOVERNANCEAND COMMUNITYINTRODUCTION ABOUT US
ECONOMIC PERFORMANCE
ENVIRONMENTAL PERFORMANCE
SOCIAL PERFORMANCE
ADDITIONAL INFORMATION
FINANCIAL INFORMATION
New projects Country Format Opening dateTotal GLA
m2
% Ownership
Owned GLA m2
Total investment (local currency)1
Total investment
(MUS$)2
Parque Alegra Colombia Regional shopping center Under review 50,000 52.5% 26,250 434,000 127
AEX Santa Elena Chile Strip center 2H21 1,500 100% 1,500 108,000 4
Acquisitions Country Format Opening dateTotal GLA
m2
% Ownership
Owned GLA m2
Total investment (local currency)1
Total investment
(MUS$)2
Puerto NuevoAntofagasta (Balmaceda Tower, Hotel Tower)
Chile Strip center 1H21 (tower) Under review (hotel) 4,000 100% 4,000 250,000 10
Expansions Country Format Opening dateTotal GLA
m2
% Ownership
Owned GLA m2
Total investment (local currency)1
Total investment
(MUS$)2
Parque Arauco Kennedy Phase 1
Chile Mixed use Under review 11,000 100% 11,000 5,355,000 220
Parque Arauco Kennedy Phase 2
Chile Mixed use Under review 10,000 100% 10,000 2,200,000 90
Larcomar Peru Regional shopping center Under review 3,000 100% 3,000 13,700 4
3.2 Real estate capital
proJects unDer DeVelopment
1) Projects in UF (Chile), MPEN (Peru) and MCOP (Colombia).2) Using exchange rates as of December 31, 2020: 29,070.33 CLP/UF, 710.95 CLP/USD, 3,421.00 COP/USD, 3.62 PEN/USD.
Our portfolio
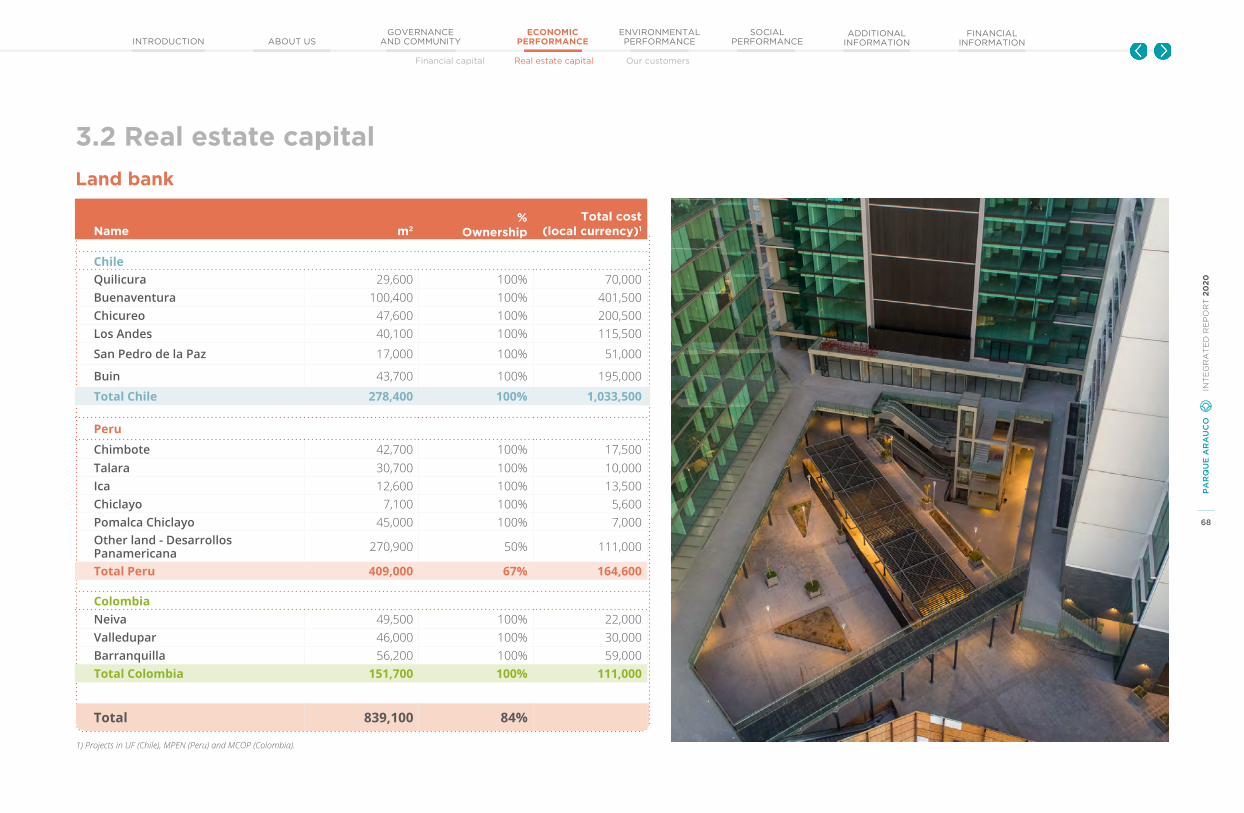
68
PA
RQ
UE
AR
AU
CO
IN
TE
GR
AT
ED
RE
PO
RT
20
20
Financial capital Real estate capital Our customers
GOVERNANCEAND COMMUNITYINTRODUCTION ABOUT US
ECONOMIC PERFORMANCE
ENVIRONMENTAL PERFORMANCE
SOCIAL PERFORMANCE
ADDITIONAL INFORMATION
FINANCIAL INFORMATION
Name m2 %
OwnershipTotal cost
(local currency)1
ChileQuilicura 29,600 100% 70,000Buenaventura 100,400 100% 401,500Chicureo 47,600 100% 200,500Los Andes 40,100 100% 115,500
San Pedro de la Paz 17,000 100% 51,000
Buin 43,700 100% 195,000
Total Chile 278,400 100% 1,033,500
Peru
Chimbote 42,700 100% 17,500Talara 30,700 100% 10,000Ica 12,600 100% 13,500Chiclayo 7,100 100% 5,600Pomalca Chiclayo 45,000 100% 7,000Other land - Desarrollos Panamericana 270,900 50% 111,000
Total Peru 409,000 67% 164,600
ColombiaNeiva 49,500 100% 22,000Valledupar 46,000 100% 30,000Barranquilla 56,200 100% 59,000Total Colombia 151,700 100% 111,000
Total 839,100 84%
Land bank
3.2 Real estate capital
1) Projects in UF (Chile), MPEN (Peru) and MCOP (Colombia).

69
PA
RQ
UE
AR
AU
CO
IN
TE
GR
AT
ED
RE
PO
RT
20
20
Financial capital Real estate capital Our customers
GOVERNANCEAND COMMUNITYINTRODUCTION ABOUT US
ECONOMIC PERFORMANCE
ENVIRONMENTAL PERFORMANCE
SOCIAL PERFORMANCE
ADDITIONAL INFORMATION
FINANCIAL INFORMATION
3.3 Our customers
Customer experience
Our customers are the heart of what we do. We work to manage their experience in a comprehensive way. Several areas within the company monitor this experience, from promoting our shopping centers to developing initiatives and generating data for better decision-making. We all work together to actively listen to our customers and learn about their interests, generating solutions that allow us to meet expectations and
innovate through various initiatives that align with new industry trends.
All of these developments are part of our efforts to better understand our customers, allowing digital and in-person experiences to come together and updating how we engage with them through tools such as our website and service channels, both in person and remote. As part of this approach, we have
expanded our omnichannel tools so that we can be present in the various formats that our customers choose to use.
During 2020, we used data collected to learn about our customers' experiences and segment them based on needs, prioritizing the most critical ones.
We also believe that the best experiences are a result of organized and clear processes on the part of our organization. In view of this, during this year we organized a series of actions to unify the messages that we send to our customers. For example, we organized the various brands present in our assets in Peru in order to align their attributes and actively manage expectations.
We
lis
ten t
o c
us
tomers.
W
e fi nd so
lutio
ns.
We innovate.
How we manage the experience
Knowing our customers is key to generating spaces that are important to them and that provide memorable experiences. To that end, during 2020, we developed a series of initiatives geared towards both tenants and final customers in an effort to improve their experience.
Being places for coming together
This year we once again confirmed that our shopping centers are more than just places where customers shop for the products that our tenants offer. They allow our visitors to meet up with friends and loved ones and promote and strengthen social ties. This is particularly true of our dining offerings. As our restaurants were able to partially reopen after the most critical months of the pandemic and in accordance with health protocols, we saw high demand for this type of space.
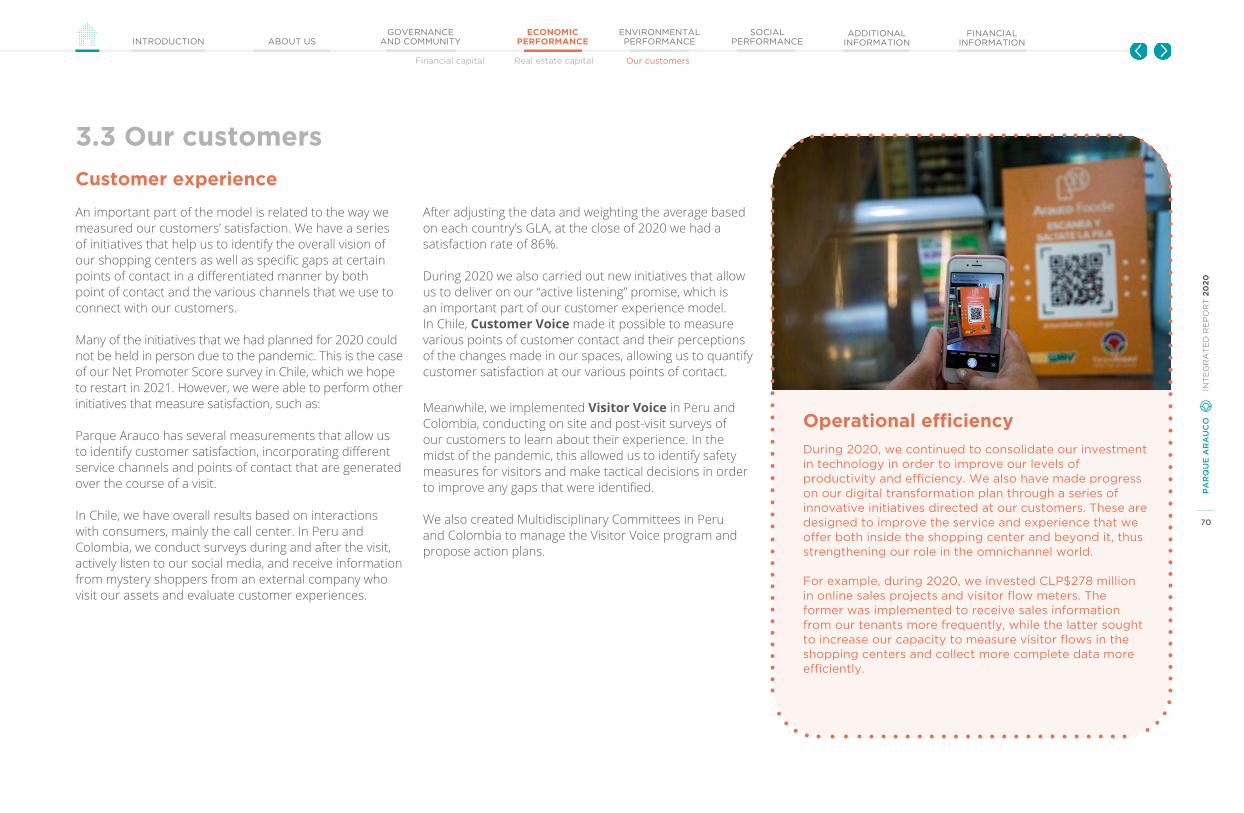
70
PA
RQ
UE
AR
AU
CO
IN
TE
GR
AT
ED
RE
PO
RT
20
20
Financial capital Real estate capital Our customers
GOVERNANCEAND COMMUNITYINTRODUCTION ABOUT US
ECONOMIC PERFORMANCE
ENVIRONMENTAL PERFORMANCE
SOCIAL PERFORMANCE
ADDITIONAL INFORMATION
FINANCIAL INFORMATION
An important part of the model is related to the way we measured our customers’ satisfaction. We have a series of initiatives that help us to identify the overall vision of our shopping centers as well as specific gaps at certain points of contact in a differentiated manner by both point of contact and the various channels that we use to connect with our customers.
Many of the initiatives that we had planned for 2020 could not be held in person due to the pandemic. This is the case of our Net Promoter Score survey in Chile, which we hope to restart in 2021. However, we were able to perform other initiatives that measure satisfaction, such as:
Parque Arauco has several measurements that allow us to identify customer satisfaction, incorporating different service channels and points of contact that are generated over the course of a visit.
In Chile, we have overall results based on interactions with consumers, mainly the call center. In Peru and Colombia, we conduct surveys during and after the visit, actively listen to our social media, and receive information from mystery shoppers from an external company who visit our assets and evaluate customer experiences.
After adjusting the data and weighting the average based on each country’s GLA, at the close of 2020 we had a satisfaction rate of 86%.
During 2020 we also carried out new initiatives that allow us to deliver on our “active listening” promise, which is an important part of our customer experience model. In Chile, Customer Voice made it possible to measure various points of customer contact and their perceptions of the changes made in our spaces, allowing us to quantify customer satisfaction at our various points of contact.
Meanwhile, we implemented Visitor Voice in Peru and Colombia, conducting on site and post-visit surveys of our customers to learn about their experience. In the midst of the pandemic, this allowed us to identify safety measures for visitors and make tactical decisions in order to improve any gaps that were identified.
We also created Multidisciplinary Committees in Peru and Colombia to manage the Visitor Voice program and propose action plans.
3.3 Our customers
Customer experience
During 2020, we continued to consolidate our investment in technology in order to improve our levels of productivity and efficiency. We also have made progress on our digital transformation plan through a series of innovative initiatives directed at our customers. These are designed to improve the service and experience that we offer both inside the shopping center and beyond it, thus strengthening our role in the omnichannel world.
For example, during 2020, we invested CLP$278 million in online sales projects and visitor flow meters. The former was implemented to receive sales information from our tenants more frequently, while the latter sought to increase our capacity to measure visitor flows in the shopping centers and collect more complete data more efficiently.
Operational efficiency
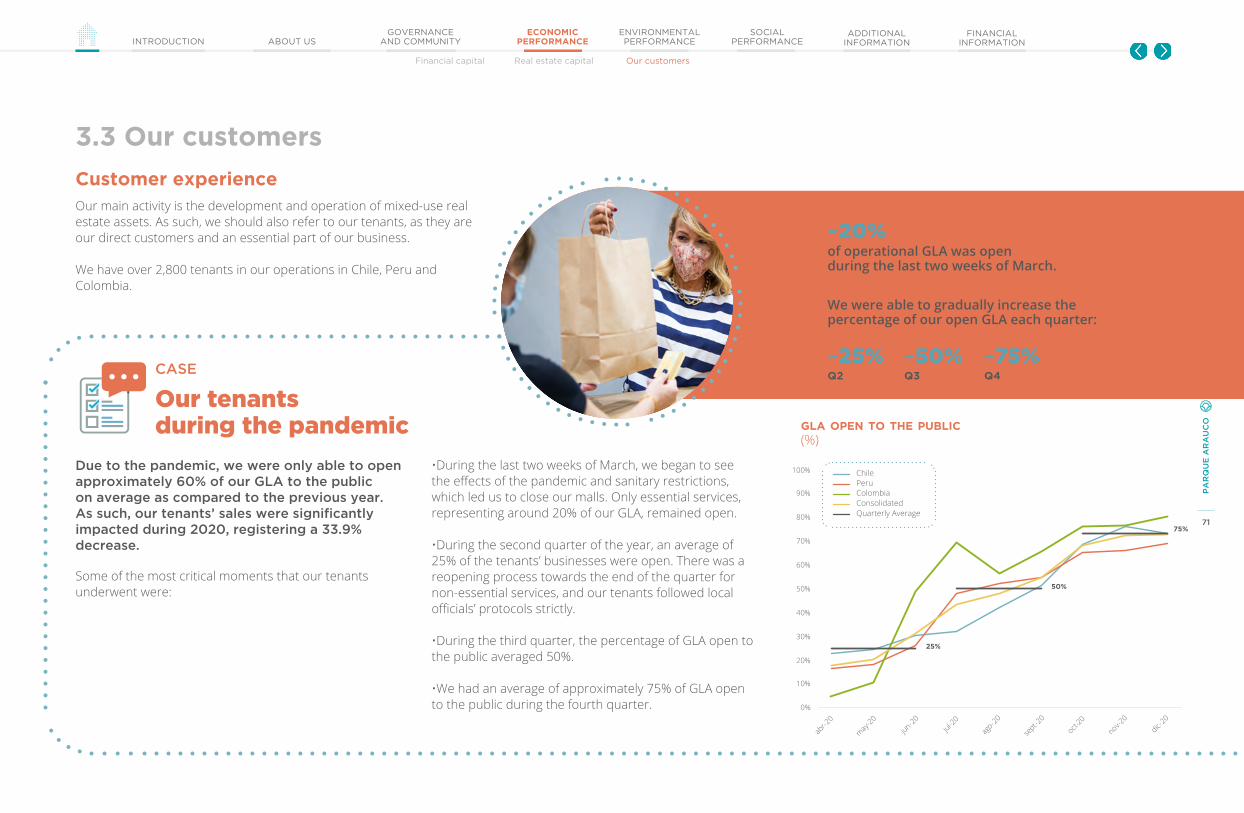
71
PA
RQ
UE
AR
AU
CO
IN
TE
GR
AT
ED
RE
PO
RT
20
20
Financial capital Real estate capital Our customers
GOVERNANCEAND COMMUNITYINTRODUCTION ABOUT US
ECONOMIC PERFORMANCE
ENVIRONMENTAL PERFORMANCE
SOCIAL PERFORMANCE
ADDITIONAL INFORMATION
FINANCIAL INFORMATION
Our main activity is the development and operation of mixed-use real estate assets. As such, we should also refer to our tenants, as they are our direct customers and an essential part of our business.
We have over 2,800 tenants in our operations in Chile, Peru and Colombia.
•During the last two weeks of March, we began to see the effects of the pandemic and sanitary restrictions, which led us to close our malls. Only essential services, representing around 20% of our GLA, remained open.
•During the second quarter of the year, an average of 25% of the tenants’ businesses were open. There was a reopening process towards the end of the quarter for non-essential services, and our tenants followed local officials’ protocols strictly.
•During the third quarter, the percentage of GLA open to the public averaged 50%.
•We had an average of approximately 75% of GLA open to the public during the fourth quarter.
Our tenants during the pandemic
CASE
of operational GLA was open during the last two weeks of March.
We were able to gradually increase the percentage of our open GLA each quarter:
Q2 Q3 Q4
~20%
~25% ~50% ~75%
gla open to the public (%)
25%
50%
75%
Due to the pandemic, we were only able to open approximately 60% of our GLA to the public on average as compared to the previous year. As such, our tenants’ sales were significantly impacted during 2020, registering a 33.9% decrease.
Some of the most critical moments that our tenants underwent were:
3.3 Our customers
Customer experience
0%
10%
20%
30%
40%
50%
60%
70%
80%
90%
100%
abr-2
0
may-20
jun-20
jul-20
ago-2
0
sept-2
0
oct-20
nov-20
dic-20
Chile
ColombiaPeru
ConsolidatedQuarterly Average
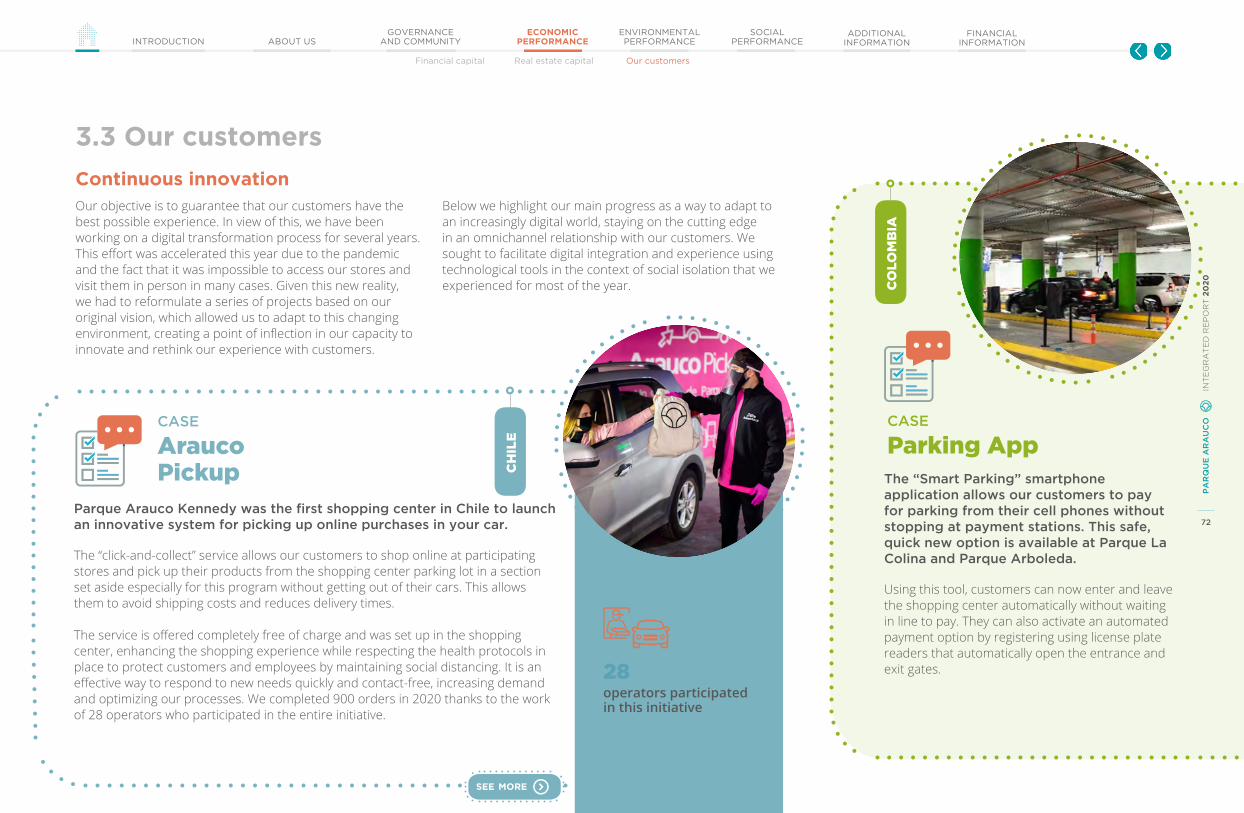
72
PA
RQ
UE
AR
AU
CO
IN
TE
GR
AT
ED
RE
PO
RT
20
20
Financial capital Real estate capital Our customers
GOVERNANCEAND COMMUNITYINTRODUCTION ABOUT US
ECONOMIC PERFORMANCE
ENVIRONMENTAL PERFORMANCE
SOCIAL PERFORMANCE
ADDITIONAL INFORMATION
FINANCIAL INFORMATION
Our objective is to guarantee that our customers have the best possible experience. In view of this, we have been working on a digital transformation process for several years. This effort was accelerated this year due to the pandemic and the fact that it was impossible to access our stores and visit them in person in many cases. Given this new reality, we had to reformulate a series of projects based on our original vision, which allowed us to adapt to this changing environment, creating a point of inflection in our capacity to innovate and rethink our experience with customers.
Below we highlight our main progress as a way to adapt to an increasingly digital world, staying on the cutting edge in an omnichannel relationship with our customers. We sought to facilitate digital integration and experience using technological tools in the context of social isolation that we experienced for most of the year.
3.3 Our customers
Continuous innovation
Parque Arauco Kennedy was the first shopping center in Chile to launch an innovative system for picking up online purchases in your car.
The “click-and-collect” service allows our customers to shop online at participating stores and pick up their products from the shopping center parking lot in a section set aside especially for this program without getting out of their cars. This allows them to avoid shipping costs and reduces delivery times.
The service is offered completely free of charge and was set up in the shopping center, enhancing the shopping experience while respecting the health protocols in place to protect customers and employees by maintaining social distancing. It is an effective way to respond to new needs quickly and contact-free, increasing demand and optimizing our processes. We completed 900 orders in 2020 thanks to the work of 28 operators who participated in the entire initiative.
The “Smart Parking” smartphone application allows our customers to pay for parking from their cell phones without stopping at payment stations. This safe, quick new option is available at Parque La Colina and Parque Arboleda.
Using this tool, customers can now enter and leave the shopping center automatically without waiting in line to pay. They can also activate an automated payment option by registering using license plate readers that automatically open the entrance and exit gates.
Arauco Pickup
Parking App CASE CASE
operators participated in this initiative
28
72
PA
RQ
UE
AR
AU
CO
IN
TE
GR
AT
ED
RE
PO
RT
20
20
see more
ch
ile
co
lom
bia

73
PA
RQ
UE
AR
AU
CO
IN
TE
GR
AT
ED
RE
PO
RT
20
20
Financial capital Real estate capital Our customers
GOVERNANCEAND COMMUNITYINTRODUCTION ABOUT US
ECONOMIC PERFORMANCE
ENVIRONMENTAL PERFORMANCE
SOCIAL PERFORMANCE
ADDITIONAL INFORMATION
FINANCIAL INFORMATION
3.3 Our customers
Thanks to the advice of this “personal shopper,” our customers can buy products that fit their needs with home delivery in Lima or outside of the capital. They can also pick them up at the mall.
This service also includes specific advice, making us a source of logistical support between our tenants and the final customers through a new shopping channel.
If a product is not available in one of the shopping centers, we offer a cross docking service. This allows a Larcomar customer to buy products from Mega Plaza Norte and pick them up at Larcomar or request home delivery.
Personal Shopper
CASE
The restaurants at Parque La Colina, Parque Arboleda and Parque Caracolí created a call center that offers a wide range of prepared dishes. Customers can order from various restaurants in a single call and opt for home delivery. This new service did not generate any costs to our tenants and was a catalyst for more easily participating in e-commerce.
Delivery Gastronómico
CASE
Some brands offer important discounts in our online outlet.
Compra y Recoge
CASE
Compra y Recoge: available at Parque La Colina for the food category. This program allows customers to enter the web page and select the Compra y Recoge option. Customers can access different food options, pay online and receive a notification when their order is ready. Customers save time, avoid waiting in line and minimize contact, offering a unique experience.
Compra y Recoge en tu Carro: We created exclusive parking spaces at Parque Arboleda, Parque Caracolí and Parque La Colina so that customers can pick up their orders without getting out of the car.
Comprar desde casa: The Premium Outlet Arauco Marketplace offers online shopping at steep discounts. Customers enter the Outlet webpage, shop online and receive their products on their doorsteps.
Including various digital initiatives deployed in Parque La Colina, Parque Arboleda, Parque Caracolí and Premium Outlet Arauco through the “Express” umbrella, we implemented a digital platform that integrates online shopping services and in-store pickup in 2020. This includes: Compra y Recoge, Compra y Recoge en tu carro and Marketplace.
Continuous innovation
73
PA
RQ
UE
AR
AU
CO
IN
TE
GR
AT
ED
RE
PO
RT
20
20
co
lom
bia
Revenue generated by the Personal Shopper program in Peruvian soles
131,417
per
u
In Peru, we created a partnership with Scharff for the Larcomar and Mega Plaza Norte stores. This remote shopping service uses WhatsApp to communicate with buyers who are physically in the mall.
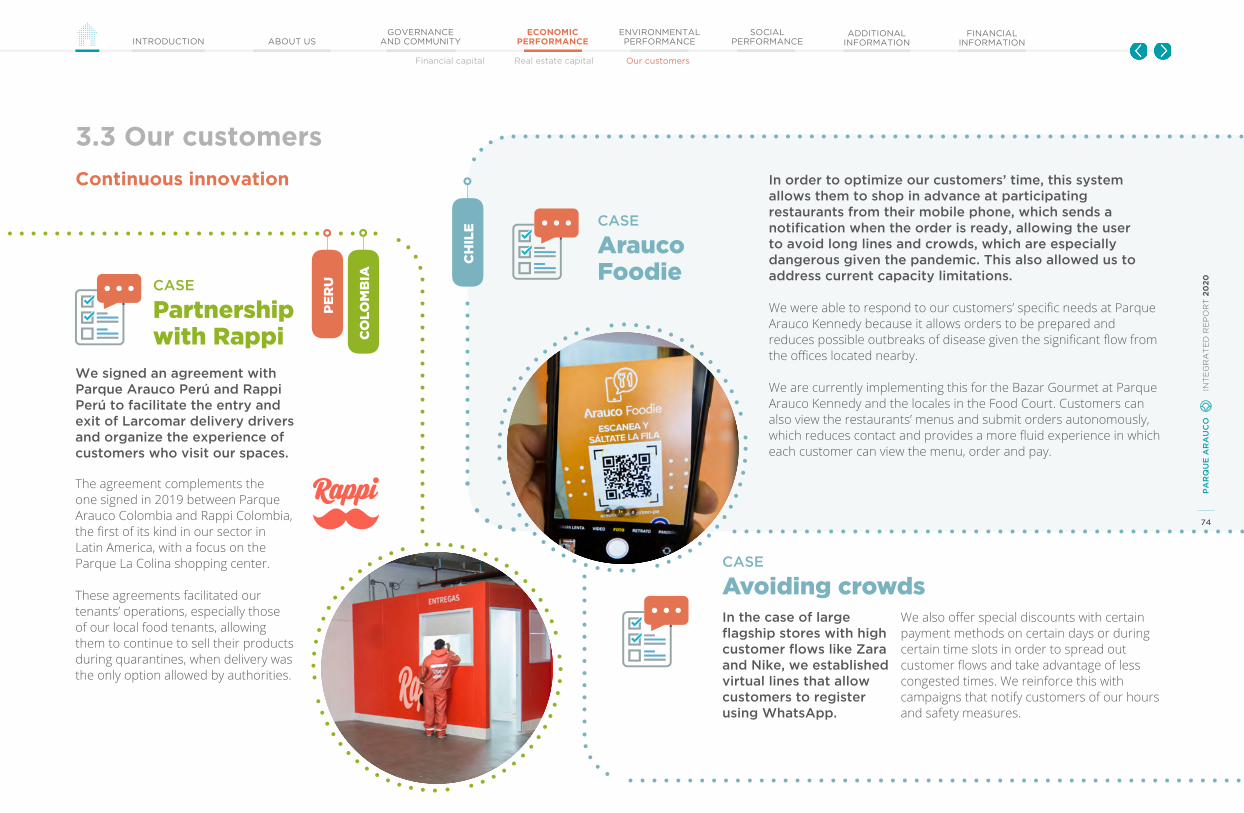
74
PA
RQ
UE
AR
AU
CO
IN
TE
GR
AT
ED
RE
PO
RT
20
20
Financial capital Real estate capital Our customers
GOVERNANCEAND COMMUNITYINTRODUCTION ABOUT US
ECONOMIC PERFORMANCE
ENVIRONMENTAL PERFORMANCE
SOCIAL PERFORMANCE
ADDITIONAL INFORMATION
FINANCIAL INFORMATION
3.3 Our customers
Arauco Foodie
Avoiding crowds
CASE
CASE
In order to optimize our customers’ time, this system allows them to shop in advance at participating restaurants from their mobile phone, which sends a notification when the order is ready, allowing the user to avoid long lines and crowds, which are especially dangerous given the pandemic. This also allowed us to address current capacity limitations.
We were able to respond to our customers’ specific needs at Parque Arauco Kennedy because it allows orders to be prepared and reduces possible outbreaks of disease given the significant flow from the offices located nearby.
We are currently implementing this for the Bazar Gourmet at Parque Arauco Kennedy and the locales in the Food Court. Customers can also view the restaurants’ menus and submit orders autonomously, which reduces contact and provides a more fluid experience in which each customer can view the menu, order and pay.
In the case of large flagship stores with high customer flows like Zara and Nike, we established virtual lines that allow customers to register using WhatsApp.
We also offer special discounts with certain payment methods on certain days or during certain time slots in order to spread out customer flows and take advantage of less congested times. We reinforce this with campaigns that notify customers of our hours and safety measures.
We signed an agreement with Parque Arauco Perú and Rappi Perú to facilitate the entry and exit of Larcomar delivery drivers and organize the experience of customers who visit our spaces.
The agreement complements the one signed in 2019 between Parque Arauco Colombia and Rappi Colombia, the first of its kind in our sector in Latin America, with a focus on the Parque La Colina shopping center.
These agreements facilitated our tenants’ operations, especially those of our local food tenants, allowing them to continue to sell their products during quarantines, when delivery was the only option allowed by authorities.
Partnership with Rappi
CASE
Continuous innovation
74
PA
RQ
UE
AR
AU
CO
IN
TE
GR
AT
ED
RE
PO
RT
20
20
ch
ile
co
lom
bia
per
u

75
PA
RQ
UE
AR
AU
CO
IN
TE
GR
AT
ED
RE
PO
RT
20
20
Financial capital Real estate capital Our customers
GOVERNANCEAND COMMUNITYINTRODUCTION ABOUT US
ECONOMIC PERFORMANCE
ENVIRONMENTAL PERFORMANCE
SOCIAL PERFORMANCE
ADDITIONAL INFORMATION
FINANCIAL INFORMATION
The Shopping Evolution
In partnership with ChileGlobal Ventures (Fundación Chile’s venture capital area) and in an effort to develop technologically-based innovations that can bring the shopping center of the future to the present, we held an open innovation competition focused on new enterprises. The main goals involved addressing two challenges: customer experience and sustainability + efficiency.
In regard to the “customer experience” category, Parque Arauco's Operational Excellence and Business Manager Benjamín Del Sante, stated, “As part of our sustainability strategy, we seek out innovative and disruptive solutions that allow us to improve our visitors’ experience and to develop our shopping centers’ environmental management. That is why we are very excited about the results of this competition.”
This category is a key point for innovation because technology-based solutions can be used to measure customer satisfaction levels and identify the services that they value the most.
The finalists in this category were initiatives oriented towards facilitating customer payment systems (MyPay); analyzing security videos and compliance with COVID-19 health measures (Data Science); and offering a new form of storage and e-commerce order delivery on a collaborative basis (WareClouds).
CASE
RESULTADOS PROGRAMAThe Shopping Evolution
09.2020
see more
75
PA
RQ
UE
AR
AU
CO
IN
TE
GR
AT
ED
RE
PO
RT
20
20
3.3 Our customers
Continuous innovation
ch
ile
co
lom
bia
per
u

76
PA
RQ
UE
AR
AU
CO
IN
TE
GR
AT
ED
RE
PO
RT
20
20
Financial capital Real estate capital Our customers
GOVERNANCEAND COMMUNITYINTRODUCTION ABOUT US
ECONOMIC PERFORMANCE
ENVIRONMENTAL PERFORMANCE
SOCIAL PERFORMANCE
ADDITIONAL INFORMATION
FINANCIAL INFORMATION
see more
3.3 Our customers
Safe spacesSafety in our spaces became a particularly important issue this year, especially in regard to hygiene and disinfecting. While many of our facilities had to remain closed during the most critical months of the pandemic, we had to develop strict protocols for the key team members who had to provide on-site support for partial openings of the shopping centers that are home to essential services.
On the other hand, to the extent that it was possible to allow for partial reopenings and following a broad review of industry best practices, we established strict standards and new cleaning procedures. We also incorporated measures required by local authorities based on each country’s regulations. These included taking temperatures, reducing and controlling capacities, increasing frequency of cleaning and using new cleaning items, providing hand sanitizer and mandating mask use.
These actions were taken to protect our workers, contractor company staff who provided cleaning and security services, customers and our tenants’ employees.
Many of these measures were also implemented in our offices, where staff handled the central management and administration of our operations. Telecommuting was also enhanced for those teams.
In addition, during 2020 we maintained our safety programs throughout our portfolio. 76
76

77
PA
RQ
UE
AR
AU
CO
IN
TE
GR
AT
ED
RE
PO
RT
20
20
Financial capital Real estate capital Our customers
GOVERNANCEAND COMMUNITYINTRODUCTION ABOUT US
ECONOMIC PERFORMANCE
ENVIRONMENTAL PERFORMANCE
SOCIAL PERFORMANCE
ADDITIONAL INFORMATION
FINANCIAL INFORMATION
COVID-related safety initiatives focused on our customers.
We installed hand sanitizer dispensers in our common areas.
Hand sanitizer
3.3 Our customers
Safe spaces
77
PA
RQ
UE
AR
AU
CO
IN
TE
GR
AT
ED
RE
PO
RT
20
20
In order to ensure that no one with a fever enters the properties, we invested in thermal cameras placed at the entrances to our flagship properties in order to improve the customer experience. The cameras allow us to monitor mask use as well.
Thermal cameras
We have staff assigned exclusively to health protocol oversight, particularly at our largest properties.
Exclusive staff
We installed corporate signage on the floors and walls to deliver messages to customers. We also broadcast messages via the loudspeaker at shopping centers.
Signage
We conducted surveys to listen to customers and learn about their perceptions of the measures we were taking.
Surveys
We controlled capacity through staff who counted the number of visitors so that we could manage the numbers online.
Counters
We created barriers to organize lines and ensure that customers engaged in social distancing. This was the case in Megaplaza Independencia, where a circuit was implemented in the parking lot given that over 80% of our customers walk to this mall.
Stanchions
We scheduled regular audits of our tenants to control compliance with protocols. This was complemented with questions about COVID protocols in our mystery shopper tool. These steps were taken in addition to requiring the development of and compliance with protocols prior to reopening.
Tenant auditing
We developed special routines for cleaning all high-contact surfaces (doorknobs, buttons, etc.) every three hours. In some spaces, we installed ozone air cleaning technology. Furthermore,our air conditioning units in Chile and Colombia (given that the majorityof the malls in Peru are open air) have filters designed to clean air as much as possible.
Cleaning
We asked our suppliers/contractors to submit to medical examinations prior to reopening.
COVID-19 tests
78
PA
RQ
UE
AR
AU
CO
IN
TE
GR
AT
ED
RE
PO
RT
20
20
GOVERNANCEAND COMMUNITYINTRODUCTION ABOUT US
ECONOMIC PERFORMANCE
ENVIRONMENTAL PERFORMANCE
SOCIAL PERFORMANCE
ADDITIONAL INFORMATION
FINANCIAL INFORMATION
Scope of environmental indicators Sustainable design and construction Sustainable operations Climate change management
Environmental performance
4.1 Scope of environmental indicators
4.2 Sustainable design and construction
4.3 Sustainable operations
4.4 Climate change management
04.
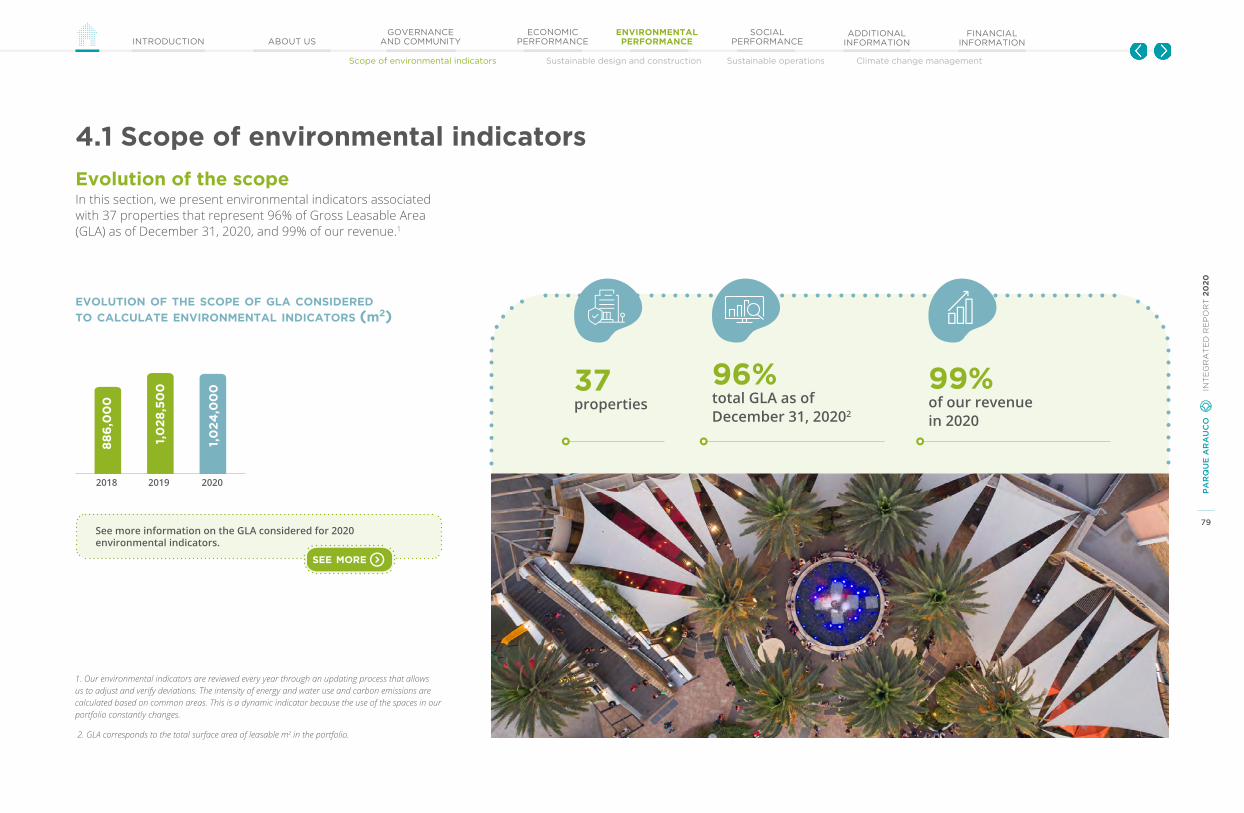
79
PA
RQ
UE
AR
AU
CO
IN
TE
GR
AT
ED
RE
PO
RT
20
20
GOVERNANCEAND COMMUNITYINTRODUCTION ABOUT US
ECONOMIC PERFORMANCE
ENVIRONMENTAL PERFORMANCE
SOCIAL PERFORMANCE
ADDITIONAL INFORMATION
FINANCIAL INFORMATION
Scope of environmental indicators Sustainable design and construction Sustainable operations Climate change management
4.1 Scope of environmental indicators
In this section, we present environmental indicators associated with 37 properties that represent 96% of Gross Leasable Area (GLA) as of December 31, 2020, and 99% of our revenue.1
eVolution of the scope of gla consiDereD to calculate enVironmental inDicators (m2)
37properties
Evolution of the scope
2018
88
6,0
00
2019
1,0
28
,50
0
2020
1,0
24
,00
0
See more information on the GLA considered for 2020 environmental indicators.
see more
96%total GLA as of December 31, 20202
99%of our revenuein 2020
1. Our environmental indicators are reviewed every year through an updating process that allows us to adjust and verify deviations. The intensity of energy and water use and carbon emissions are calculated based on common areas. This is a dynamic indicator because the use of the spaces in our portfolio constantly changes.
2. GLA corresponds to the total surface area of leasable m2 in the portfolio.
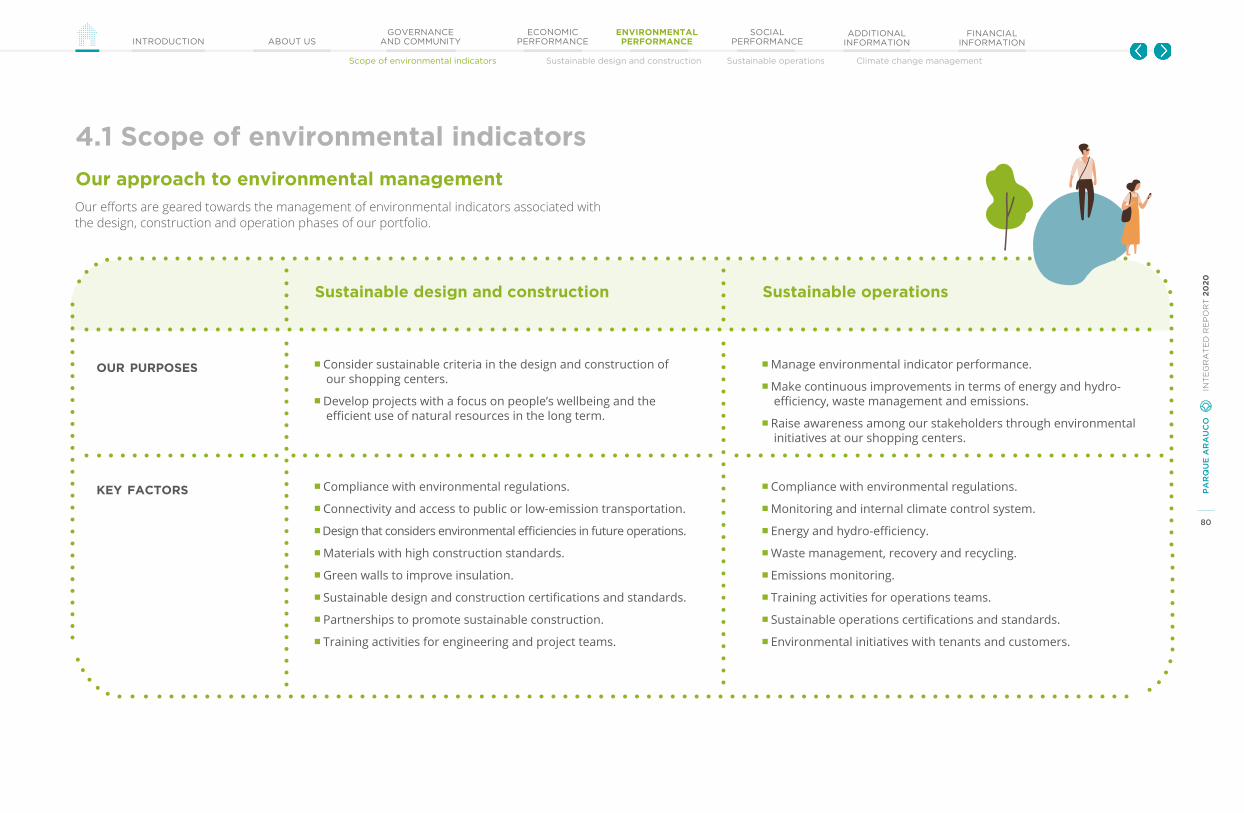
80
PA
RQ
UE
AR
AU
CO
IN
TE
GR
AT
ED
RE
PO
RT
20
20
GOVERNANCEAND COMMUNITYINTRODUCTION ABOUT US
ECONOMIC PERFORMANCE
ENVIRONMENTAL PERFORMANCE
SOCIAL PERFORMANCE
ADDITIONAL INFORMATION
FINANCIAL INFORMATION
Scope of environmental indicators Sustainable design and construction Sustainable operations Climate change management
Sustainable design and construction Sustainable operations
our purposes Consider sustainable criteria in the design and construction of our shopping centers.
Develop projects with a focus on people’s wellbeing and the efficient use of natural resources in the long term.
Manage environmental indicator performance.
Make continuous improvements in terms of energy and hydro-efficiency, waste management and emissions.
Raise awareness among our stakeholders through environmental initiatives at our shopping centers.
key factors Compliance with environmental regulations.
Connectivity and access to public or low-emission transportation.
Design that considers environmental efficiencies in future operations.
Materials with high construction standards.
Green walls to improve insulation.
Sustainable design and construction certifications and standards.
Partnerships to promote sustainable construction.
Training activities for engineering and project teams.
Compliance with environmental regulations.
Monitoring and internal climate control system.
Energy and hydro-efficiency.
Waste management, recovery and recycling.
Emissions monitoring.
Training activities for operations teams.
Sustainable operations certifications and standards.
Environmental initiatives with tenants and customers.
4.1 Scope of environmental indicators
Our approach to environmental management
Our efforts are geared towards the management of environmental indicators associated with the design, construction and operation phases of our portfolio.

81
PA
RQ
UE
AR
AU
CO
IN
TE
GR
AT
ED
RE
PO
RT
20
20
GOVERNANCEAND COMMUNITYINTRODUCTION ABOUT US
ECONOMIC PERFORMANCE
ENVIRONMENTAL PERFORMANCE
SOCIAL PERFORMANCE
ADDITIONAL INFORMATION
FINANCIAL INFORMATION
Scope of environmental indicators Sustainable design and construction Sustainable operations Climate change management
4.2 Sustainable design and construction
Connectivity and low-emission transportation
Location is a key factor for making our assets accessible and frequently visited. This also facilitates the use of public transportation, thus generating a lower impact on emissions.
Most of our current portfolio has quick and close access to public transportation, infrastructure for widespread bicycle use and advances in electromobility with chargers for electric cars.
86%of our assets are located less than 150 meters from public transportation
1,326 bicycle parking spaces
95%of our shopping centers are less than a 10-minute walk from public transportation.
361,225 customers used our bicycle parking spaces at our properties in 2020.
81

82
PA
RQ
UE
AR
AU
CO
IN
TE
GR
AT
ED
RE
PO
RT
20
20
GOVERNANCEAND COMMUNITYINTRODUCTION ABOUT US
ECONOMIC PERFORMANCE
ENVIRONMENTAL PERFORMANCE
SOCIAL PERFORMANCE
ADDITIONAL INFORMATION
FINANCIAL INFORMATION
Scope of environmental indicators Sustainable design and construction Sustainable operations Climate change management
4.2 Sustainable design and construction
The agreement will allow us to encourage sustainable mobility and decrease CO2 emissions generated by users of our properties.
The contract signed with ENGIE led to the installation of a 22 kW charging facility at Larcomar in Lima and a 7.4 kW charging facility at Parque Lambramani in Arequipa.
The charging points will be available to customers of these shopping centers free of charge in the mall parking lots.
Partnership with ENGIE Peru
CASEEnel X and electromobility
CASEc
hil
e
Connectivity and low-emission transportation
per
uTo promote the use of low emission transportation, we have established partnerships with energy generators to add charging stations for electric cars at several of our properties.
We have been pioneers in this area since 2014, when we placed the first electric charging station in Chile at Parque Arauco Kennedy so that we could be an active part of the city’s electromobility route. In 2020, we established agreements to increase the reach of these chargers at that shopping center and reached an agreement with ENGIE in Peru to install this type of charging systems at Larcomar and Parque Lambramani.
We signed an agreement with Enel Xto add eight electric chargers to Parque Arauco Kennedy once its expansion is complete.
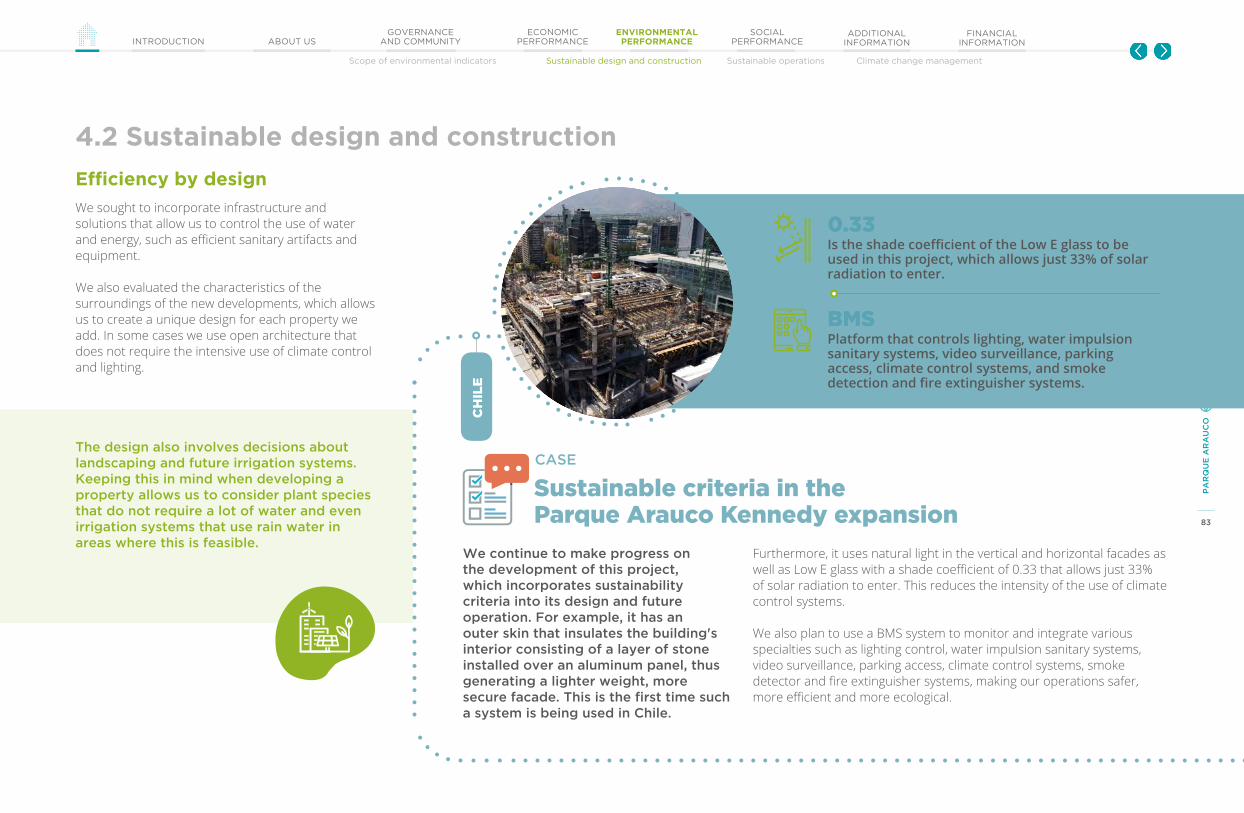
83
PA
RQ
UE
AR
AU
CO
IN
TE
GR
AT
ED
RE
PO
RT
20
20
GOVERNANCEAND COMMUNITYINTRODUCTION ABOUT US
ECONOMIC PERFORMANCE
ENVIRONMENTAL PERFORMANCE
SOCIAL PERFORMANCE
ADDITIONAL INFORMATION
FINANCIAL INFORMATION
Scope of environmental indicators Sustainable design and construction Sustainable operations Climate change management
Efficiency by design
We sought to incorporate infrastructure and solutions that allow us to control the use of water and energy, such as efficient sanitary artifacts and equipment.
We also evaluated the characteristics of the surroundings of the new developments, which allows us to create a unique design for each property we add. In some cases we use open architecture that does not require the intensive use of climate control and lighting.
The design also involves decisions about landscaping and future irrigation systems. Keeping this in mind when developing a property allows us to consider plant species that do not require a lot of water and even irrigation systems that use rain water in areas where this is feasible.
4.2 Sustainable design and construction
Furthermore, it uses natural light in the vertical and horizontal facades as well as Low E glass with a shade coefficient of 0.33 that allows just 33% of solar radiation to enter. This reduces the intensity of the use of climate control systems.
We also plan to use a BMS system to monitor and integrate various specialties such as lighting control, water impulsion sanitary systems, video surveillance, parking access, climate control systems, smoke detector and fire extinguisher systems, making our operations safer, more efficient and more ecological.
Sustainable criteria in theParque Arauco Kennedy expansion
Is the shade coefficient of the Low E glass to be used in this project, which allows just 33% of solar radiation to enter.
Platform that controls lighting, water impulsion sanitary systems, video surveillance, parking access, climate control systems, and smoke detection and fire extinguisher systems.
0.33
BMS
We continue to make progress on the development of this project, which incorporates sustainability criteria into its design and future operation. For example, it has an outer skin that insulates the building's interior consisting of a layer of stone installed over an aluminum panel, thus generating a lighter weight, more secure facade. This is the first time such a system is being used in Chile.
CASEc
hil
e

84
PA
RQ
UE
AR
AU
CO
IN
TE
GR
AT
ED
RE
PO
RT
20
20
GOVERNANCEAND COMMUNITYINTRODUCTION ABOUT US
ECONOMIC PERFORMANCE
ENVIRONMENTAL PERFORMANCE
SOCIAL PERFORMANCE
ADDITIONAL INFORMATION
FINANCIAL INFORMATION
Scope of environmental indicators Sustainable design and construction Sustainable operations Climate change management
High-standard materials and networks
4.2 Sustainable design and construction
Our projects are developed with high quality, durable materials. We prioritize the use of materials provided by local companies or those located close to our projects. In regard to infrastructure, we favor the use of elements with recycled content, such as steel and paints made from recycled materials.
Green walls and areas
We were pioneers in designing and including green walls in our shopping centers. These facilities allow us to block direct solar radiation, operating as a ventilated facade and facilitating climate insulation and the reduction of pollution in urban environments.
In order to optimize water use, green walls include plant species with low water needs, a drip irrigation system and a water recirculation system.
4,661 m2
of green walls installed at our shopping centers in Chile, Peru and Colombia.
We are part of the Green Building Council in Chile and Peru and share their goal of promoting sustainable construction, technological innovation and the efficient use of resources. This allows our Projects, Infrastructure and Operations teams to participate in workshops and training activities and to exchange best practices on an ongoing basis.

85
PA
RQ
UE
AR
AU
CO
IN
TE
GR
AT
ED
RE
PO
RT
20
20
GOVERNANCEAND COMMUNITYINTRODUCTION ABOUT US
ECONOMIC PERFORMANCE
ENVIRONMENTAL PERFORMANCE
SOCIAL PERFORMANCE
ADDITIONAL INFORMATION
FINANCIAL INFORMATION
Scope of environmental indicators Sustainable design and Sustainable operations Climate change management
4.3 Sustainable operations
Our indicators are determined based on international standards and monitoring of best practices in the real estate industry.
We use software that allows the teams responsible for operating our properties in Chile, Peru and Colombia to report their KPIs monthly in order to measure environmental performance and attain traceable, centralized information.
We have conducted energy assessments in various shopping centers that allow us to evaluate behavior in this area and to identify gaps and management opportunities.
The Corporate Sustainability Area and Operations teams periodically monitor reporting of priority environmental KPIs. These are verified by an external firm.
We hold monitoring meetings with the teams responsible for these areas and CEOs in Chile, Peru and Colombia, allowing them to present trends or gaps in the most important indicators.
To make improvements, each year the teams responsible for operations define projects that aim to improve consumption efficiency and environmental management processes.
We are moving towards the integration of environmental management systems that allow us to continually improve our processes:
In the Chile division, we earned ISO 50001 certification for the energy management system in three of our shopping centers: Arauco Maipú, Arauco Quilicura and Arauco Chillán.
In the Colombia Division, Parque Arboleda and Parque La Colina obtained ISO 14001 certification for the environmental management system.
measure compare improve
In 2020, we certified two of our shopping centers in Colombia.
The ISO 14001 standard is related to current environmental legislation and minimization of environmental impacts.
The main environmental characteristics of these shopping centers include the implementation of rain water capture systems, the use of 100% LED lighting, comprehensive waste management that includes a composting and material recycling system and a reduced carbon footprint.
ISO 14001 Certification at Parque La Colina and Parque Arboleda
CASE
co
lom
biaOur management approaches and criteria
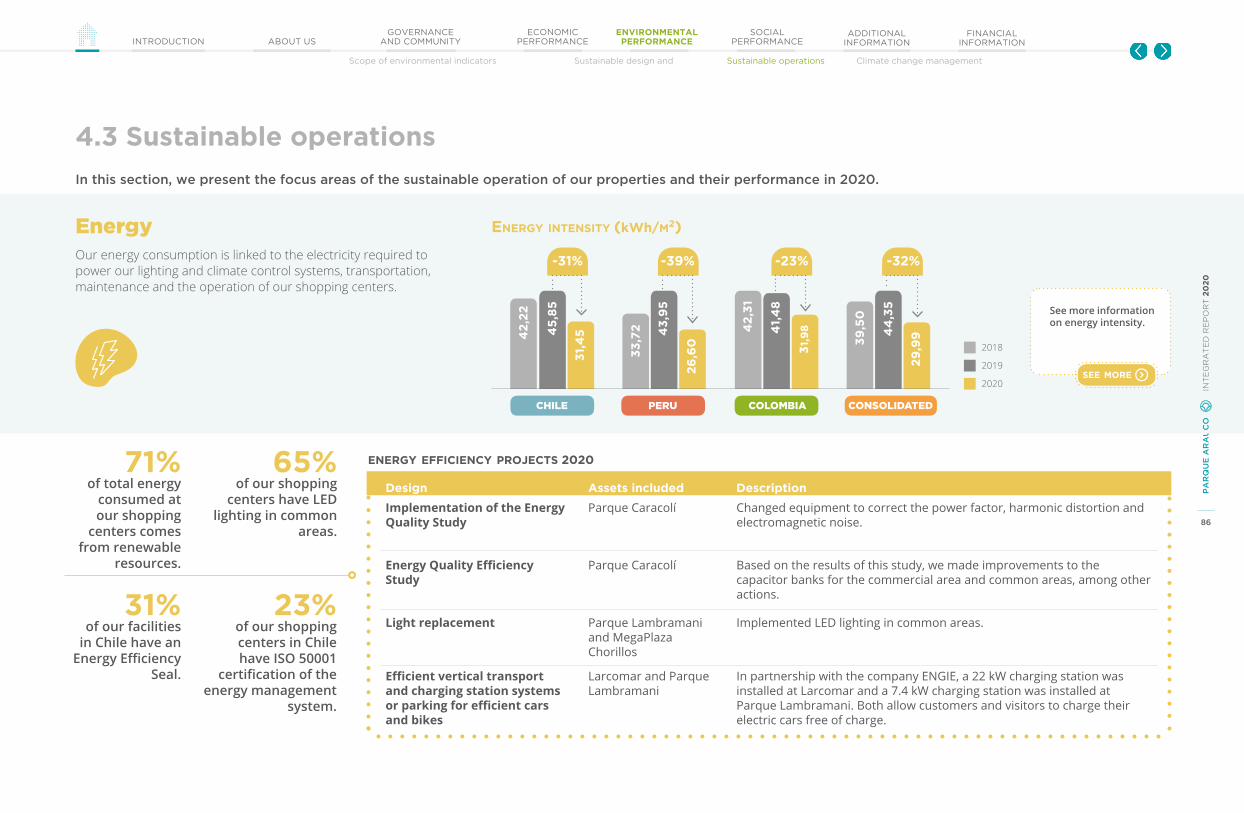
86
PA
RQ
UE
AR
AU
CO
IN
TE
GR
AT
ED
RE
PO
RT
20
20
GOVERNANCEAND COMMUNITYINTRODUCTION ABOUT US
ECONOMIC PERFORMANCE
ENVIRONMENTAL PERFORMANCE
SOCIAL PERFORMANCE
ADDITIONAL INFORMATION
FINANCIAL INFORMATION
Scope of environmental indicators Sustainable design and Sustainable operations Climate change management
4.3 Sustainable operations
EnergyOur energy consumption is linked to the electricity required to power our lighting and climate control systems, transportation, maintenance and the operation of our shopping centers.
71%of total energy
consumed at our shopping
centers comes from renewable
resources.
31%of our facilities
in Chile have an Energy Efficiency
Seal.
23%of our shopping centers in Chile have ISO 50001
certification of the energy management
system.
65%of our shopping
centers have LED lighting in common
areas.
energy intensity (kWh/m2)
energy efficiency proJects 2020
Design Assets included Description
Implementation of the Energy Quality Study
Parque Caracolí Changed equipment to correct the power factor, harmonic distortion and electromagnetic noise.
Energy Quality Efficiency Study
Parque Caracolí Based on the results of this study, we made improvements to the capacitor banks for the commercial area and common areas, among other actions.
Light replacement Parque Lambramani and MegaPlaza Chorillos
Implemented LED lighting in common areas.
Efficient vertical transport and charging station systems or parking for efficient cars and bikes
Larcomar and Parque Lambramani
In partnership with the company ENGIE, a 22 kW charging station was installed at Larcomar and a 7.4 kW charging station was installed at Parque Lambramani. Both allow customers and visitors to charge their electric cars free of charge.
See more information on energy intensity.
see more
42
,22
33
,72 4
2,3
1
39
,50
45
,85
43
,95
31,
45
26
,60 31,
98
29
,99
-31% -39% -23% -32%
chile peru colombia consolidated
2018
2019
2020
41,
48
44
,35
In this section, we present the focus areas of the sustainable operation of our properties and their performance in 2020.
CO
IN
TE
GR
AT
ED
RE
PO
RT
20
20

87
PA
RQ
UE
AR
AU
CO
IN
TE
GR
AT
ED
RE
PO
RT
20
20
GOVERNANCEAND COMMUNITYINTRODUCTION ABOUT US
ECONOMIC PERFORMANCE
ENVIRONMENTAL PERFORMANCE
SOCIAL PERFORMANCE
ADDITIONAL INFORMATION
FINANCIAL INFORMATION
Scope of environmental indicators Sustainable design and Sustainable operations Climate change management
4.3 Sustainable operations
Energy
In order to move forward with the use of non-conventional renewable energies (NCREs) in our portfolio, we signed an agreement with ENGIE Chile to supply us 116 GWh per year of certified renewable energy that covers our operations in Santiago and elsewhere in Chile.
We expect this initiative to reduce CO2 by 53,100 tons thanks to the supply of energy from 100% renewable sources. The agreement began in the second half of 2020 and will last for five years.
It comes in addition to other efforts we have been making to incorporate clean energies into our entire portfolio.
In alliance with Chile Global Ventures, we launched this innovation competition for new business ventures focused on the customer experience and the sustainability and efficiency of our properties.
The winner of the “Efficiency and Sustainability” category was Wenu Work, a digital system that allows users to quickly and easily measure general electricity consumption of real estate assets in real time. This tool facilitates decision-making about maintenance, administration and efficiency, providing evidence about consumption systems in real time. We are already working on a pilot for MegaPlaza Independencia (Peru) and Arauco Estación (Chile).
Use of renewable and certified energies
The Shopping Evolution “Sustainability and Efficiency” Category
CASE CASE
ch
ile
ch
ile
watch ViDeoco
lom
bia
per
u
87
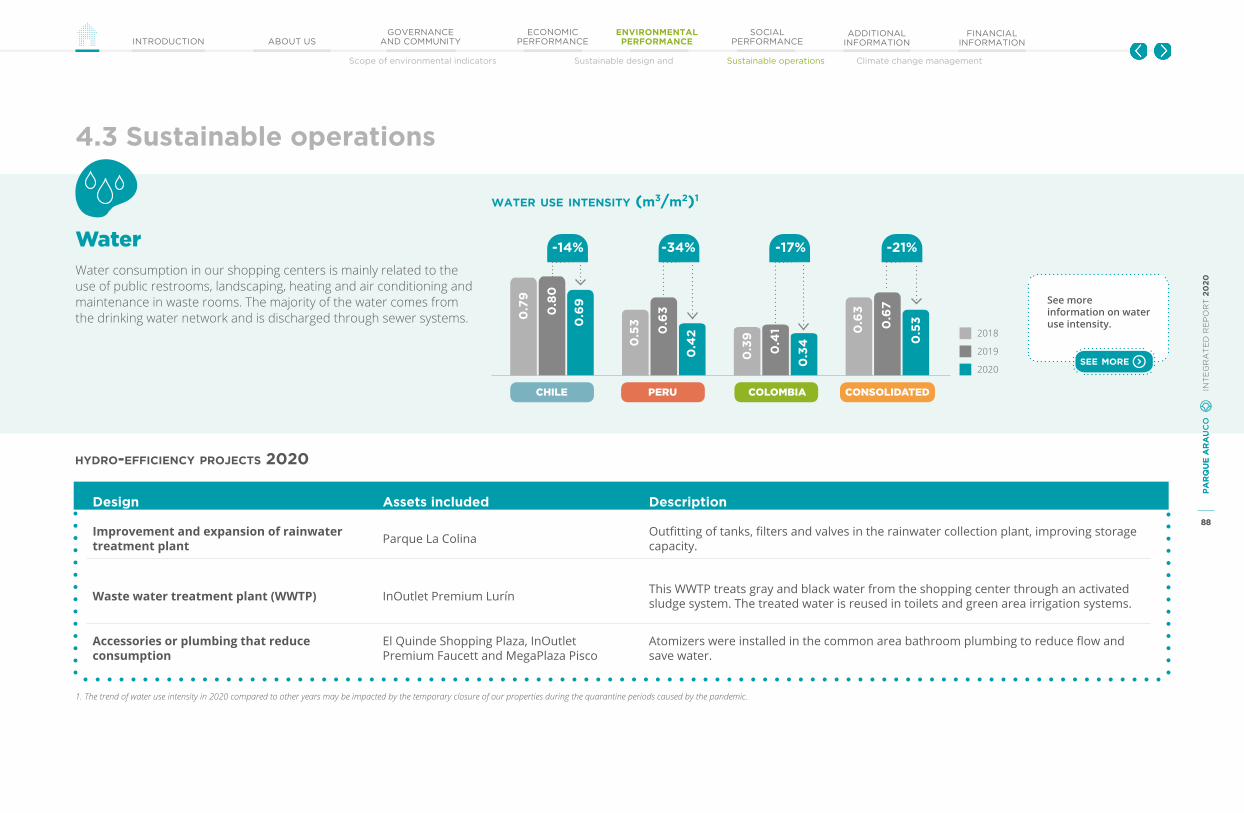
88
PA
RQ
UE
AR
AU
CO
IN
TE
GR
AT
ED
RE
PO
RT
20
20
GOVERNANCEAND COMMUNITYINTRODUCTION ABOUT US
ECONOMIC PERFORMANCE
ENVIRONMENTAL PERFORMANCE
SOCIAL PERFORMANCE
ADDITIONAL INFORMATION
FINANCIAL INFORMATION
Scope of environmental indicators Sustainable design and Sustainable operations Climate change management
4.3 Sustainable operations
WaterWater consumption in our shopping centers is mainly related to the use of public restrooms, landscaping, heating and air conditioning and maintenance in waste rooms. The majority of the water comes from the drinking water network and is discharged through sewer systems.
Design Assets included Description
Improvement and expansion of rainwater treatment plant Parque La Colina Outfitting of tanks, filters and valves in the rainwater collection plant, improving storage
capacity.
Waste water treatment plant (WWTP) InOutlet Premium Lurín This WWTP treats gray and black water from the shopping center through an activated sludge system. The treated water is reused in toilets and green area irrigation systems.
Accessories or plumbing that reduce consumption
El Quinde Shopping Plaza, InOutlet Premium Faucett and MegaPlaza Pisco
Atomizers were installed in the common area bathroom plumbing to reduce flow and save water.
1. The trend of water use intensity in 2020 compared to other years may be impacted by the temporary closure of our properties during the quarantine periods caused by the pandemic.
0.7
9
0.5
3
0.3
9
0.6
30.8
0
0.6
3
0.4
1 0.6
7
0.6
9
0.4
2
0.3
4 0.5
3
water use intensity (m3/m2)1
2018
2019
2020
88
PA
RQ
UE
AR
AU
CO
IN
TE
GR
AT
ED
RE
PO
RT
20
20
hyDro-efficiency proJects 2020
-14% -34% -17% -21%
See more information on water use intensity.
see more
chile peru colombia consolidated

89
PA
RQ
UE
AR
AU
CO
IN
TE
GR
AT
ED
RE
PO
RT
20
20
GOVERNANCEAND COMMUNITYINTRODUCTION ABOUT US
ECONOMIC PERFORMANCE
ENVIRONMENTAL PERFORMANCE
SOCIAL PERFORMANCE
ADDITIONAL INFORMATION
FINANCIAL INFORMATION
Scope of environmental indicators Sustainable design and Sustainable operations Climate change management
CASE
4.3 Sustainable operations
89
PA
RQ
UE
AR
AU
CO
IN
TE
GR
AT
ED
RE
PO
RT
20
20Water
3of our shopping centers have a waste water treatment system.
2of our shopping centers have rainwater storage systems.
10,316 m3
of water was recycled at our operations in 2020.
In an effort to increase the percentage of reused water from operating our shopping centers, during the last quarter of 2020 we began to operate the waste water treatment plant (WWTP) located at InOutlet Premium Lurín in Peru.
This initiative, which allows us to reuse water in toilets and green area irrigation systems at the same property, joins systems of this kind that are already in place at El Quinde Shopping Plaza Ica, which is also in Peru.
Waste water treatment plant at InOutletPremium Lurín
per
u
watch ViDeo
CASE
89
PA
RQ
UE
AR
AU
CO
IN
TE
GR
AT
ED
RE
PO
RT
20
20

90
PA
RQ
UE
AR
AU
CO
IN
TE
GR
AT
ED
RE
PO
RT
20
20
GOVERNANCEAND COMMUNITYINTRODUCTION ABOUT US
ECONOMIC PERFORMANCE
ENVIRONMENTAL PERFORMANCE
SOCIAL PERFORMANCE
ADDITIONAL INFORMATION
FINANCIAL INFORMATION
Scope of environmental indicators Sustainable design and Sustainable operations Climate change management
4.3 Sustainable operations
WasteOur shopping centers generate waste similar to that of households, which come from our tenants, customers or visitors. We are working on a waste management system that will allow us to recycle an important percentage of the material produced in our facilities. In addition, we are also developing new approaches and opportunities for working with social organizations and enterprises on recovery and composting.
1. The proportion of the waste recovered in 2020 compared to other years may be impacted by the temporary closure of our properties during the quarantine periods caused by the pandemic.
proportion of waste recoVereD oVer
total waste generateD by the operation1
18%
13%
19%
20
%
12%
29
%
29
%
20
%
20
%23
%
11%
19%
2018
2019
2020
glass7.8%
plastics4%
paper anD carDboarD65.4%
organic22.3%
CO
IN
TE
GR
AT
ED
RE
PO
RT
20
20
Distribution of total recoVereD waste
chile peru colombia consolidated
See more about the distribution of recovered waste.
see more
1,879 tonsof waste were recovered by our shopping centers in 2020.
20%of all waste generated in 2020 was recycled or recovered.

91
PA
RQ
UE
AR
AU
CO
IN
TE
GR
AT
ED
RE
PO
RT
20
20
GOVERNANCEAND COMMUNITYINTRODUCTION ABOUT US
ECONOMIC PERFORMANCE
ENVIRONMENTAL PERFORMANCE
SOCIAL PERFORMANCE
ADDITIONAL INFORMATION
FINANCIAL INFORMATION
Scope of environmental indicators Sustainable design and Sustainable operations Climate change management
4.3 Sustainable operations
We enhanced our Comprehensive Waste Plan at InOutlet Premium Lurín in Peru, which had allowed for the development of social and farming projects in neighboring communities.
This initiative consists of two types of treatment: recycling and composting. In regard to the former, the waste from customers and tenants is sorted and taken to the recycling room. Once sorted by type of material, it is donated to the organization Ciudad Saludable, which fosters organization and formalization of groups of people who make a living recycling items.
ComprehensiveWaste Plan
CASE
of organic waste was composted and donated to local organizations for the development of bio-gardens.
28.6 tons
Organic waste is taken to the composting area, where it is blended and probiotics are applied to accelerate its decomposition. After seven weeks, this material becomes compost and is donated to Fundación OLI Perú and Lima Compost, which use it in biogardens in neighboring towns. Approximately 28.6 tons of organic waste were donated to these organizations in 2020.
The Chilean Plastics Pact is a working group that brings together key stakeholders in the plastics value chain to implement actions and move towards a circular economy that decreases the negative impacts associated with the use of this material.
We joined this initiative in 2019, and in 2020 we joined the 7Rs of the Plastics Circular Economy campaign, which involves disseminating and promoting messages and information about topics related to the use of plastics among our customers and social media community.
We are members of the Chilean Plastics Pact
CASE
1. Reflect: examine our practices and habits related to the use of this material.2. Reduce: avoid unnecessary use of plastic.3. Redesign: design products considering their environmental impact.4. Recover: use recycled plastic to make products.5. Recycle: transform plastic waste into new resources.6. Reuse: use packages again for their original purpose.7. Repair: fix plastic products to extend their useful life.
WHAT ARE THE 7R'S OF THIS CAMPAIGN?
watch ViDeo
Wastepe
ru
91
PA
RQ
UE
AR
AU
CO
IN
TE
GR
AT
ED
RE
PO
RT
20
20
ch
ile

92
PA
RQ
UE
AR
AU
CO
IN
TE
GR
AT
ED
RE
PO
RT
20
20
GOVERNANCEAND COMMUNITYINTRODUCTION ABOUT US
ECONOMIC PERFORMANCE
ENVIRONMENTAL PERFORMANCE
SOCIAL PERFORMANCE
ADDITIONAL INFORMATION
FINANCIAL INFORMATION
Scope of environmental indicators Sustainable design and Sustainable operations Climate change management
All our shopping centers are located in highly populated urban areas that have enjoyed high expansion and growth potential for several decades.
To date, none of our properties or developing projects generates any type of significant impact on biodiversity or is located in a natural or forest preservation site. As such, no specific impact related to these topics is generated.
Our efforts are thus oriented towards generating impacts or actions that make a positive contribution through reforestation and the participation of volunteers or the communities where we operate.
management approach
Contribute to improving environmental conditions in terms of air quality, reducing heat islands and conserving biodiversity in the cities where we operate.
Generate opportunities for environmental education that promotes change in the habits of our customers and tenants, for example, by promoting recycling.
We have worked with Corporación Cultiva in Chile on a reforestation plan since 2018.
The purpose of this project is to contribute to improving the quality of urban air by planting native species that adapt to local weather conditions, which has an additional impact on the reduction of heat islands in certain urban areas.
Reforestation with native species in areas located near our operations
CASE
watch ViDeo
ch
ile
6.95 hectaresreforested since the initiative was launched.
+300volunteers have participated in the reforestation events organized as part of this initiative.
2,365trees plantedto date.
4.3 Sustainable operations
Urban biodiversity and environmental education
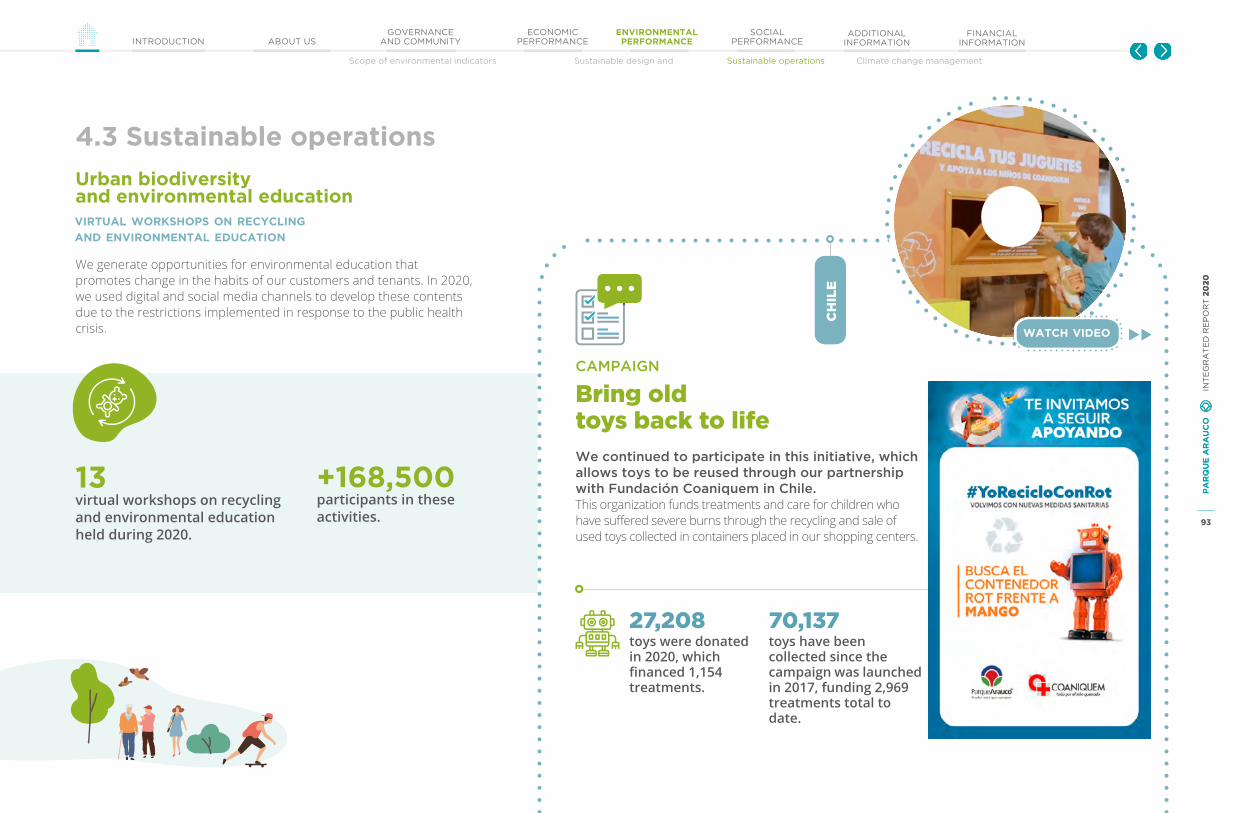
93
PA
RQ
UE
AR
AU
CO
IN
TE
GR
AT
ED
RE
PO
RT
20
20
GOVERNANCEAND COMMUNITYINTRODUCTION ABOUT US
ECONOMIC PERFORMANCE
ENVIRONMENTAL PERFORMANCE
SOCIAL PERFORMANCE
ADDITIONAL INFORMATION
FINANCIAL INFORMATION
Scope of environmental indicators Sustainable design and Sustainable operations Climate change management
Bring oldtoys back to life
We generate opportunities for environmental education that promotes change in the habits of our customers and tenants. In 2020, we used digital and social media channels to develop these contents due to the restrictions implemented in response to the public health crisis.
We continued to participate in this initiative, which allows toys to be reused through our partnership with Fundación Coaniquem in Chile. This organization funds treatments and care for children who have suffered severe burns through the recycling and sale of used toys collected in containers placed in our shopping centers.
Virtual workshops on recycling anD enVironmental eDucation
toys were donated in 2020, which financed 1,154 treatments.
27,208 toys have been collected since the campaign was launched in 2017, funding 2,969 treatments total to date.
70,137
93
PA
RQ
UE
AR
AU
CO
IN
TE
GR
AT
ED
RE
PO
RT
20
20
watch ViDeo
CAMPAIGN
13virtual workshops on recycling and environmental education held during 2020.
4.3 Sustainable operations
ch
ile
+168,500participants in these activities.
Urban biodiversity and environmental education
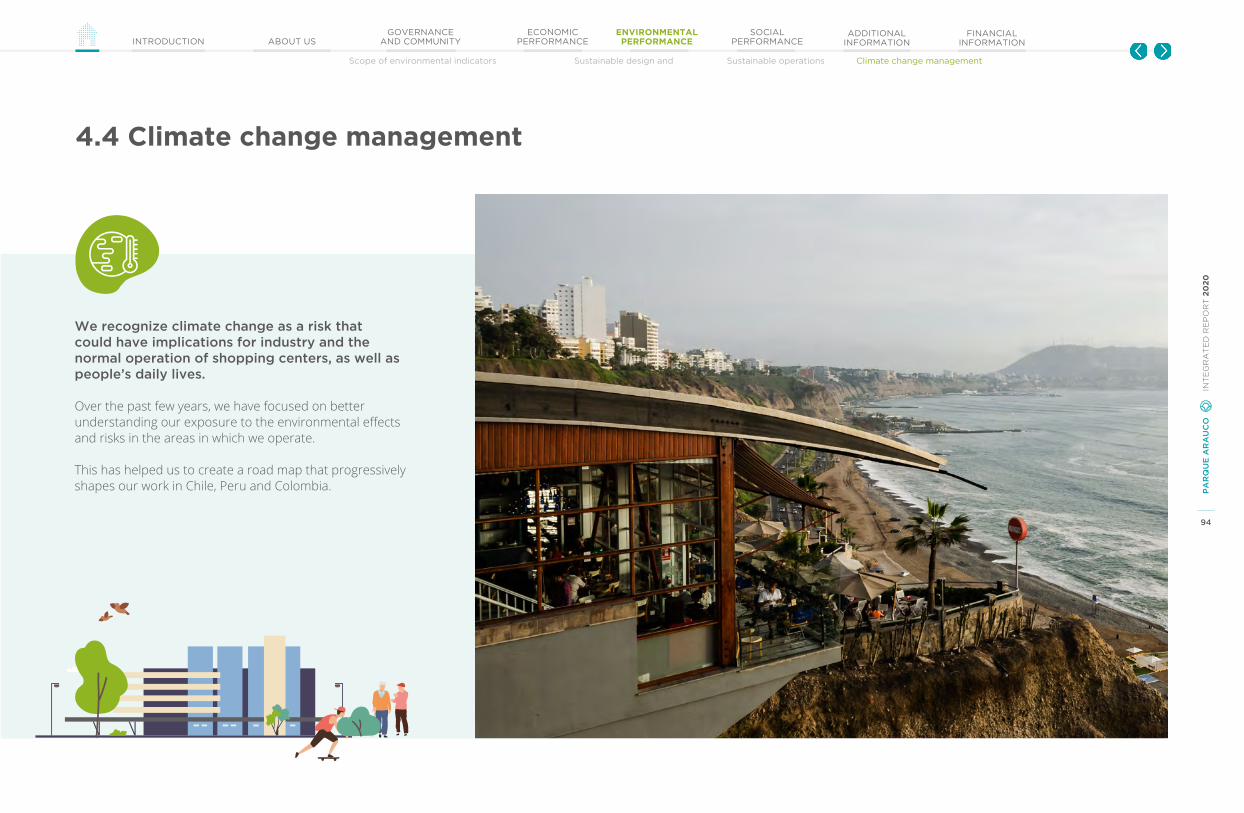
94
PA
RQ
UE
AR
AU
CO
IN
TE
GR
AT
ED
RE
PO
RT
20
20
GOVERNANCEAND COMMUNITYINTRODUCTION ABOUT US
ECONOMIC PERFORMANCE
ENVIRONMENTAL PERFORMANCE
SOCIAL PERFORMANCE
ADDITIONAL INFORMATION
FINANCIAL INFORMATION
Scope of environmental indicators Sustainable design and Sustainable operations Climate change management
4.4 Climate change management
We recognize climate change as a risk that could have implications for industry and the normal operation of shopping centers, as well as people’s daily lives.
Over the past few years, we have focused on better understanding our exposure to the environmental effects and risks in the areas in which we operate.
This has helped us to create a road map that progressively shapes our work in Chile, Peru and Colombia.
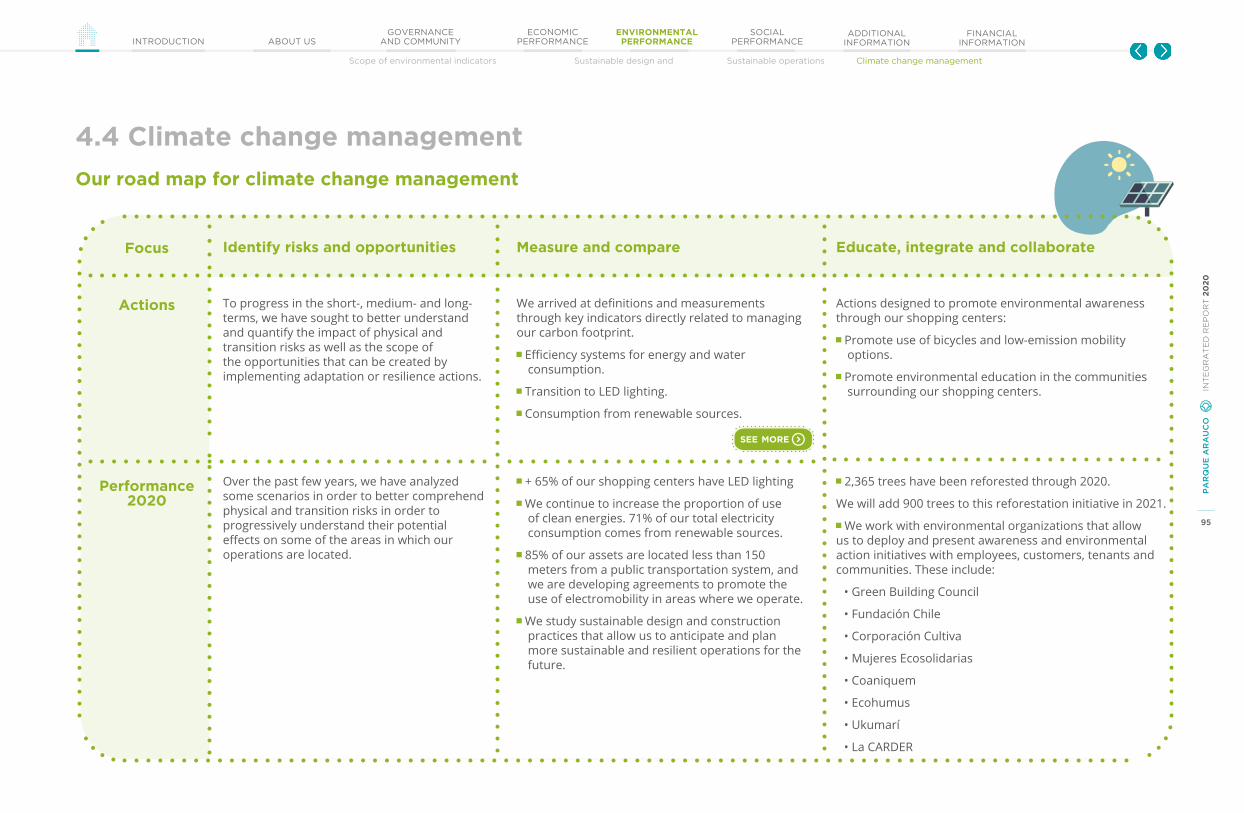
95
PA
RQ
UE
AR
AU
CO
IN
TE
GR
AT
ED
RE
PO
RT
20
20
GOVERNANCEAND COMMUNITYINTRODUCTION ABOUT US
ECONOMIC PERFORMANCE
ENVIRONMENTAL PERFORMANCE
SOCIAL PERFORMANCE
ADDITIONAL INFORMATION
FINANCIAL INFORMATION
Scope of environmental indicators Sustainable design and Sustainable operations Climate change management
4.4 Climate change management
Our road map for climate change management
Actions
Focus
Performance2020
Identify risks and opportunities Measure and compare Educate, integrate and collaborate
To progress in the short-, medium- and long-terms, we have sought to better understand and quantify the impact of physical and transition risks as well as the scope of the opportunities that can be created by implementing adaptation or resilience actions.
We arrived at definitions and measurements through key indicators directly related to managing our carbon footprint.
Efficiency systems for energy and water consumption.
Transition to LED lighting.
Consumption from renewable sources.
Actions designed to promote environmental awareness through our shopping centers:
Promote use of bicycles and low-emission mobility options.
Promote environmental education in the communities surrounding our shopping centers.
Over the past few years, we have analyzed some scenarios in order to better comprehend physical and transition risks in order to progressively understand their potential effects on some of the areas in which our operations are located.
+ 65% of our shopping centers have LED lighting
We continue to increase the proportion of use of clean energies. 71% of our total electricity consumption comes from renewable sources.
85% of our assets are located less than 150 meters from a public transportation system, and we are developing agreements to promote the use of electromobility in areas where we operate.
We study sustainable design and construction practices that allow us to anticipate and plan more sustainable and resilient operations for the future.
2,365 trees have been reforested through 2020.
We will add 900 trees to this reforestation initiative in 2021.
We work with environmental organizations that allow us to deploy and present awareness and environmental action initiatives with employees, customers, tenants and communities. These include:
• Green Building Council
• Fundación Chile
• Corporación Cultiva
• Mujeres Ecosolidarias
• Coaniquem
• Ecohumus
• Ukumarí
• La CARDER
see more

96
PA
RQ
UE
AR
AU
CO
IN
TE
GR
AT
ED
RE
PO
RT
20
20
GOVERNANCEAND COMMUNITYINTRODUCTION ABOUT US
ECONOMIC PERFORMANCE
ENVIRONMENTAL PERFORMANCE
SOCIAL PERFORMANCE
ADDITIONAL INFORMATION
FINANCIAL INFORMATION
Scope of environmental indicators Sustainable design and Sustainable operations Climate change management
3,554 tCO2e
122.71 tCO2e
3,421 tCO2e
9,609 tCO2e
162.5 tCO2e
9,446 tCO2e
2020
2020
2020
2019
2019
2019
scope 2
total emissions
scope 1
Greenhouse gas (GHG) emissions associated with electricity consumption required for the operation.1
This corresponds to greenhouse gases (GHG), which are mainly linked to the consumption of diesel necessary to supply emergency generators in areas with unstable local electricity systems and to operate fire extinguisher systems.
emissions intensity (Kg CO2e/m2)2
Total emissions intensityin 2020.
2.54Kg CO
2 e/m2
1. The market-based method that we use to calculate this indicator includes our power purchase agreements from renewable and non-renewable sources where the emission factors used correspond to the energy source that we use in each case. In Section 6, we present a detailed list of environmental indicators, including the carbon footprint calculation with the market-based method and the location-based method.
1. The trend of the emissions intensity in 2020 compared to other years may be impacted by the temporary closure of properties during the quarantine periods caused by the pandemic.
33.49
6.153.44
9.62
0.24
19.03
12.14
0.27
6.89
2.62 0.31 2.54
-44% -78% +16% -63%
4.4 Climate change management
Carbon footprint and emissions intensity
chile peru colombia consolidated
See more information on the carbon footprint and emissions intensity.
see more
2018
2019
2020
96
63%Reduction in emissions intensity
compared to 2019.
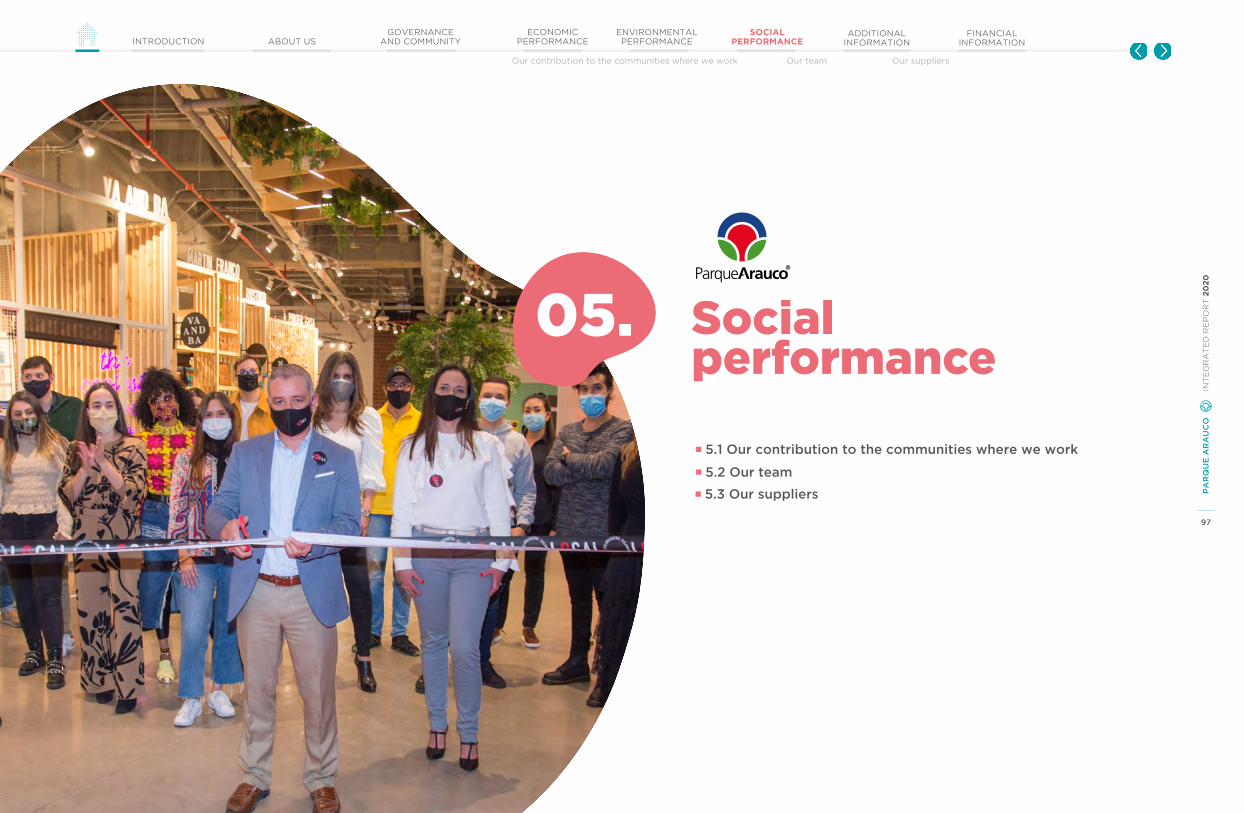
97
PA
RQ
UE
AR
AU
CO
IN
TE
GR
AT
ED
RE
PO
RT
20
20
GOVERNANCEAND COMMUNITYINTRODUCTION ABOUT US
ECONOMIC PERFORMANCE
ENVIRONMENTAL PERFORMANCE
SOCIAL PERFORMANCE
ADDITIONAL INFORMATION
FINANCIAL INFORMATION
Our contribution to the communities where we work Our team Our suppliers
Social performance
5.1 Our contribution to the communities where we work
5.2 Our team
5.3 Our suppliers
05.

98
PA
RQ
UE
AR
AU
CO
IN
TE
GR
AT
ED
RE
PO
RT
20
20
GOVERNANCEAND COMMUNITYINTRODUCTION ABOUT US
ECONOMIC PERFORMANCE
ENVIRONMENTAL PERFORMANCE
SOCIAL PERFORMANCE
ADDITIONAL INFORMATION
FINANCIAL INFORMATION
Our contribution to the communities where we work Our team Our suppliers
Our contributionto the communities where we work
98
PA
RQ
UE
AR
AU
CO
IN
TE
GR
AT
ED
RE
PO
RT
20
20
5.1
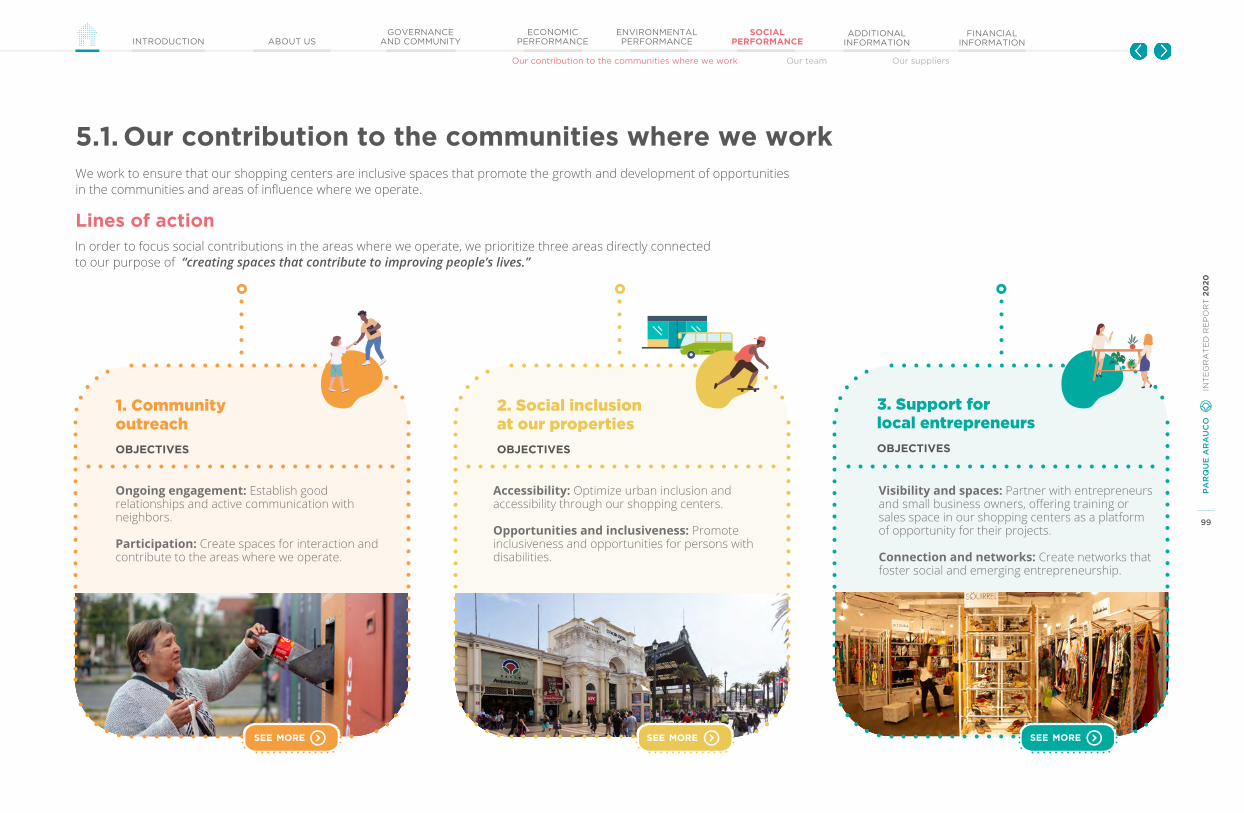
99
PA
RQ
UE
AR
AU
CO
IN
TE
GR
AT
ED
RE
PO
RT
20
20
GOVERNANCEAND COMMUNITYINTRODUCTION ABOUT US
ECONOMIC PERFORMANCE
ENVIRONMENTAL PERFORMANCE
SOCIAL PERFORMANCE
ADDITIONAL INFORMATION
FINANCIAL INFORMATION
Our contribution to the communities where we work Our team Our suppliers
5.1. Our contribution to the communities where we work
Lines of action
We work to ensure that our shopping centers are inclusive spaces that promote the growth and development of opportunities in the communities and areas of influence where we operate.
In order to focus social contributions in the areas where we operate, we prioritize three areas directly connected to our purpose of “creating spaces that contribute to improving people’s lives.”
1. Community outreachobJectiVes
Ongoing engagement: Establish good relationships and active communication with neighbors.
Participation: Create spaces for interaction and contribute to the areas where we operate.
see more
2. Social inclusion at our propertiesobJectiVes
Accessibility: Optimize urban inclusion and accessibility through our shopping centers.
Opportunities and inclusiveness: Promote inclusiveness and opportunities for persons with disabilities.
see more
3. Support for local entrepreneursobJectiVes
Visibility and spaces: Partner with entrepreneurs and small business owners, offering training or sales space in our shopping centers as a platform of opportunity for their projects.
Connection and networks: Create networks that foster social and emerging entrepreneurship.
see more

100
PA
RQ
UE
AR
AU
CO
IN
TE
GR
AT
ED
RE
PO
RT
20
20
GOVERNANCEAND COMMUNITYINTRODUCTION ABOUT US
ECONOMIC PERFORMANCE
ENVIRONMENTAL PERFORMANCE
SOCIAL PERFORMANCE
ADDITIONAL INFORMATION
FINANCIAL INFORMATION
Our contribution to the communities where we work Our team Our suppliers
5.1. Our contribution to the communities where we work
Lines of action
1. Community outreach
The public health emergency spurred the development of humanitarian aid initiatives through solidarity campaigns. Our shopping centers were active spaces for reaching at-risk groups located in the areas of influence of our operations in Chile, Peru and Colombia.
worked with us on activities directly linked to social support and mitigating the pandemic's impact on neighboring communities.
received food, personal protective equipment or support for distance learning through the campaigns carried out in our shopping centers.
was refocused on care initiatives during the pandemic and economic reactivation through support for entrepreneurs in our shopping centers.
were held in person or via social media to connect with our customers and neighbors and help them to pass the time during lockdowns.
organizationssocial people
of the social investment and community support budget free workshops or activities
55 +17,700
50% 424
100
PA
RQ
UE
AR
AU
CO
IN
TE
GR
AT
ED
RE
PO
RT
20
20
Moms to Discover
We partnered with Fundación Descúbreme this year to update our Mother’s Day campaign, inviting people to leave a caring note for the mothers of children with cognitive disabilities who are members of this institution. The greetings became donations of personal protective equipment for the mothers.
Kits donated
Greetings
3,600
1,324
watch ViDeo
ch
ile
Some actions during the pandemic
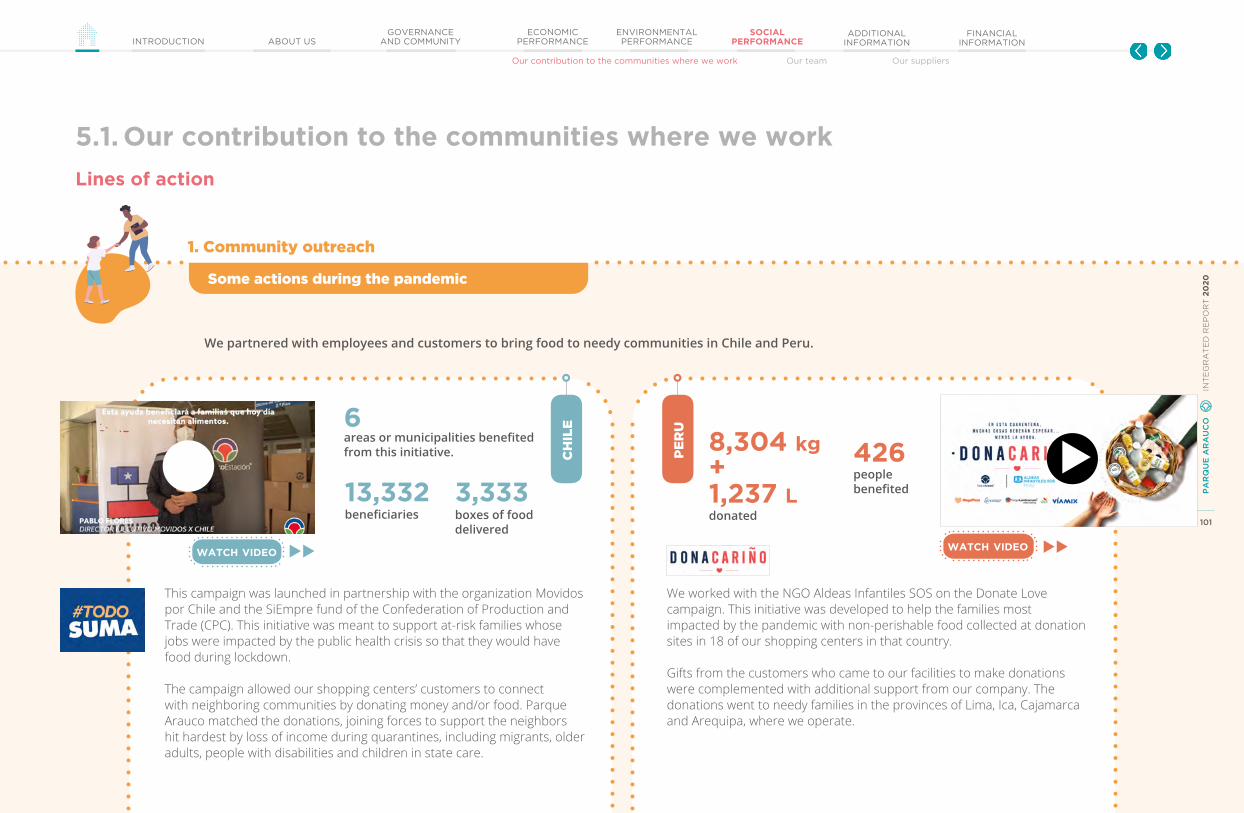
101
PA
RQ
UE
AR
AU
CO
IN
TE
GR
AT
ED
RE
PO
RT
20
20
GOVERNANCEAND COMMUNITYINTRODUCTION ABOUT US
ECONOMIC PERFORMANCE
ENVIRONMENTAL PERFORMANCE
SOCIAL PERFORMANCE
ADDITIONAL INFORMATION
FINANCIAL INFORMATION
Our contribution to the communities where we work Our team Our suppliers
5.1. Our contribution to the communities where we work
Lines of action
We partnered with employees and customers to bring food to needy communities in Chile and Peru.
This campaign was launched in partnership with the organization Movidos por Chile and the SiEmpre fund of the Confederation of Production and Trade (CPC). This initiative was meant to support at-risk families whose jobs were impacted by the public health crisis so that they would have food during lockdown.
The campaign allowed our shopping centers’ customers to connect with neighboring communities by donating money and/or food. Parque Arauco matched the donations, joining forces to support the neighbors hit hardest by loss of income during quarantines, including migrants, older adults, people with disabilities and children in state care.
We worked with the NGO Aldeas Infantiles SOS on the Donate Love campaign. This initiative was developed to help the families most impacted by the pandemic with non-perishable food collected at donation sites in 18 of our shopping centers in that country.
Gifts from the customers who came to our facilities to make donations were complemented with additional support from our company. The donations went to needy families in the provinces of Lima, Ica, Cajamarca and Arequipa, where we operate.
boxes of food delivered
peoplebenefited
areas or municipalities benefited from this initiative.
beneficiaries3,333
4266
13,332
watch ViDeo watch ViDeo
donated1,237 L
8,304 kg+
101
PA
RQ
UE
AR
AU
CO
IN
TE
GR
AT
ED
RE
PO
RT
20
20
ch
ile
per
u
1. Community outreach
Some actions during the pandemic

102
PA
RQ
UE
AR
AU
CO
IN
TE
GR
AT
ED
RE
PO
RT
20
20
GOVERNANCEAND COMMUNITYINTRODUCTION ABOUT US
ECONOMIC PERFORMANCE
ENVIRONMENTAL PERFORMANCE
SOCIAL PERFORMANCE
ADDITIONAL INFORMATION
FINANCIAL INFORMATION
Our contribution to the communities where we work Our team Our suppliers
5.1. Our contribution to the communities where we work
elements that form part of the community engagement system
Alongside the actions developed in the context of the pandemic, we continued to ensure that our shopping centers are places that are connected to their surroundings and that work with the various social groups in the areas of influence where we are located.
In this context, the teams responsible for the shopping centers participate in the Community Engagement System, reviewing the situation of each property, recording the actions to be executed and the counterparts involved in each case, and generating a quarterly analysis of the kind of impact that we are having in each community in which we develop this process.
We identify recurring impacts: Through case studies, analyses of experiences in our industry and consultations or direct interaction with organizations or members of nearby communities.
We manage impacts through self-assessment and analysis of community risks, implementing monitoring and mitigation plans in a series of properties and identifying opportunities for developing local partnerships that benefit the territory. These initiatives are conducted with the periodic support and training of teams responsible for managing our shopping centers.
We focus our community engagement on specific actions to contribute to the wellbeing of the people who form part of our areas of influence.
We hold free activities that are executed with local organizations in many cases.
hours of training on community topics offered to shopping center teams in Chile, Peru and Colombia in 2020.
9
properties with community impact assessments.
25of our shopping centers have an updated self-assessment of community engagement risks and a map of stakeholders and their area of direct influence.
100%
free activities were held at our shopping centers in 2020.
social organizations worked with us on social support programs in communities in Chile, Peru and Colombia.
424 +115
Lines of action
1. Community outreach
our approach:We work with the organization Casa de la Paz in Chile, Peru and Colombia to manage our community engagement system.
102
PA
RQ
UE
AR
AU
CO
INT
EG
RA
TE
D R
EP
OR
T
Ongoing engagement
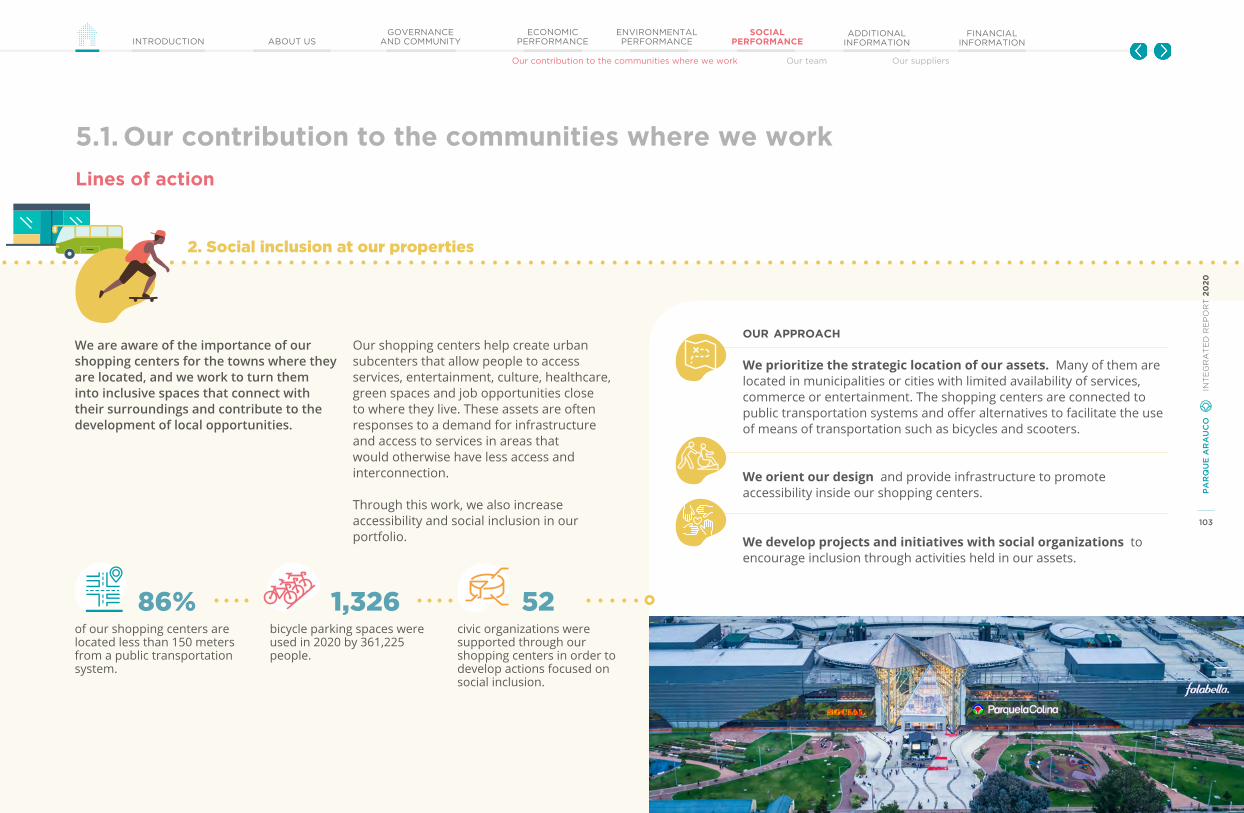
103
PA
RQ
UE
AR
AU
CO
IN
TE
GR
AT
ED
RE
PO
RT
20
20
GOVERNANCEAND COMMUNITYINTRODUCTION ABOUT US
ECONOMIC PERFORMANCE
ENVIRONMENTAL PERFORMANCE
SOCIAL PERFORMANCE
ADDITIONAL INFORMATION
FINANCIAL INFORMATION
Our contribution to the communities where we work Our team Our suppliers
5.1. Our contribution to the communities where we work
of our shopping centers are located less than 150 meters from a public transportation system.
bicycle parking spaces were used in 2020 by 361,225 people.
civic organizations were supported through our shopping centers in order to develop actions focused on social inclusion.
86% 1,326 52
We are aware of the importance of our shopping centers for the towns where they are located, and we work to turn them into inclusive spaces that connect with their surroundings and contribute to the development of local opportunities.
Lines of action
2. Social inclusion at our properties
Our shopping centers help create urban subcenters that allow people to access services, entertainment, culture, healthcare, green spaces and job opportunities close to where they live. These assets are often responses to a demand for infrastructure and access to services in areas that would otherwise have less access and interconnection.
Through this work, we also increase accessibility and social inclusion in our portfolio.
103
PA
RQ
UE
AR
AU
CO
IN
TE
GR
AT
ED
RE
PO
RT
20
20
our approach
We prioritize the strategic location of our assets. Many of them are located in municipalities or cities with limited availability of services, commerce or entertainment. The shopping centers are connected to public transportation systems and offer alternatives to facilitate the use of means of transportation such as bicycles and scooters.
We orient our design and provide infrastructure to promote accessibility inside our shopping centers.
We develop projects and initiatives with social organizations to encourage inclusion through activities held in our assets.

104
PA
RQ
UE
AR
AU
CO
IN
TE
GR
AT
ED
RE
PO
RT
20
20
GOVERNANCEAND COMMUNITYINTRODUCTION ABOUT US
ECONOMIC PERFORMANCE
ENVIRONMENTAL PERFORMANCE
SOCIAL PERFORMANCE
ADDITIONAL INFORMATION
FINANCIAL INFORMATION
Our contribution to the communities where we work Our team Our suppliers
per
u
5.1. Our contribution to the communities where we work
Five years with Fundación Descúbremeand the Christmas with Meaning campaign
Each year, our shopping centers in Chile join the campaign to benefit children and young people with cognitive disabilities at Christmastime.
Due to the COVID-19 pandemic, this initiative was held digitally in 2020. We invited our customers to send Christmas postcards with artistic designs made by beneficiaries of Fundación Descúbreme.
Our customers sent messages to senior citizens.
We prepared a Christmas gift for the residents of Casa Hogar Splendor because they were unable to go out or receive family visits at Christmas due to the pandemic.
We created a special place in our Larcomar and MegaPlaza Norte shopping centers to allow visitors to record a greeting for the Casa Hogar Splendor residents.
All of the greetings were combined and delivered with a big surprise that included food and essential products.
which included food and essential products.
A big surprise
watch ViDeo 104
PA
RQ
UE
AR
AU
CO
IN
TE
GR
AT
ED
RE
PO
RT
20
20
Lines of action
2. Social inclusion at our properties
ch
ile
postcards with Christmas messages of inclusion were shared by customers who joined the Christmas with Meaning campaign.
2,000
watch ViDeo
Inclusion and accessibility initiatives
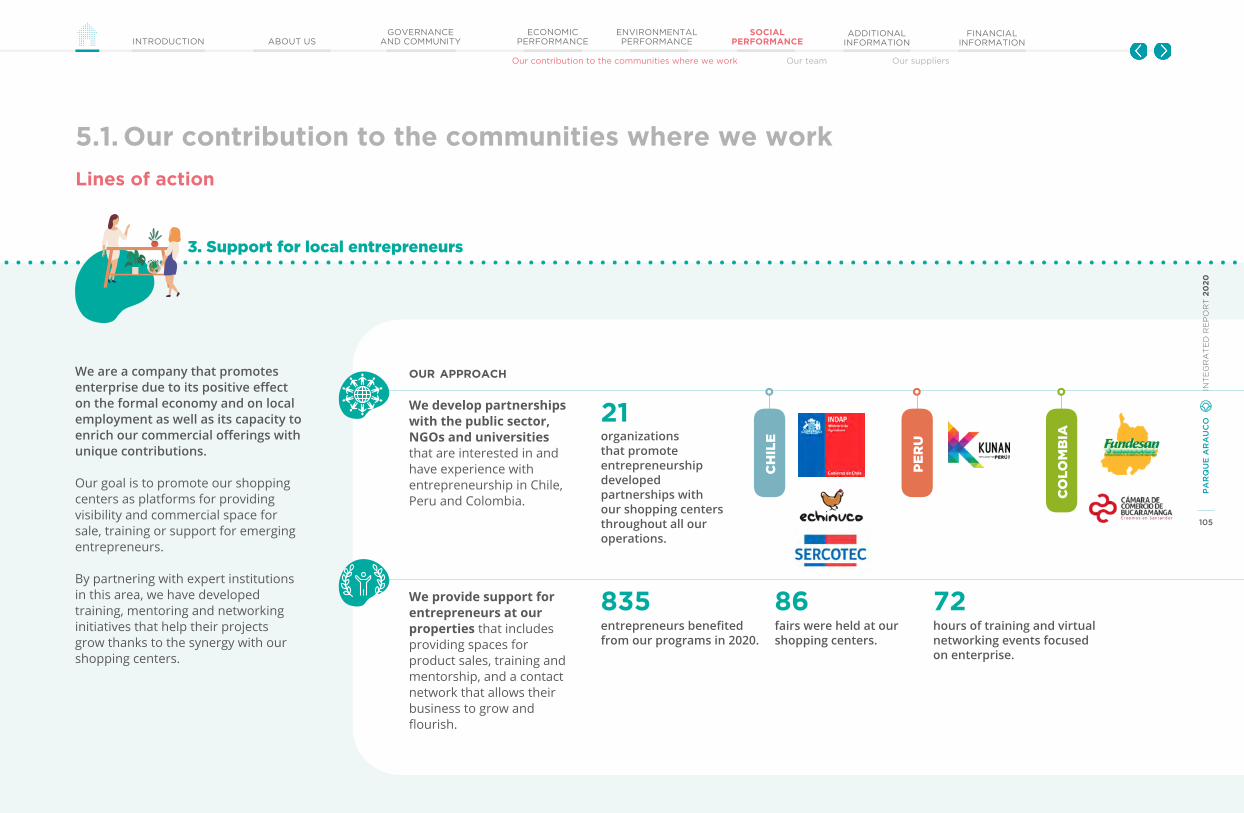
105
PA
RQ
UE
AR
AU
CO
IN
TE
GR
AT
ED
RE
PO
RT
20
20
GOVERNANCEAND COMMUNITYINTRODUCTION ABOUT US
ECONOMIC PERFORMANCE
ENVIRONMENTAL PERFORMANCE
SOCIAL PERFORMANCE
ADDITIONAL INFORMATION
FINANCIAL INFORMATION
Our contribution to the communities where we work Our team Our suppliers
5.1. Our contribution to the communities where we work
Lines of action
3. Support for local entrepreneurs
We are a company that promotes enterprise due to its positive effect on the formal economy and on local employment as well as its capacity to enrich our commercial offerings with unique contributions.
Our goal is to promote our shopping centers as platforms for providing visibility and commercial space for sale, training or support for emerging entrepreneurs.
By partnering with expert institutions in this area, we have developed training, mentoring and networking initiatives that help their projects grow thanks to the synergy with our shopping centers.
our approach
We develop partnerships with the public sector, NGOs and universities that are interested in and have experience with entrepreneurship in Chile, Peru and Colombia.
We provide support for entrepreneurs at our properties that includes providing spaces for product sales, training and mentorship, and a contact network that allows their business to grow and flourish.
organizations that promote entrepreneurship developed partnerships with our shopping centers throughout all our operations.
21
entrepreneurs benefited from our programs in 2020.
835fairs were held at our shopping centers.
86hours of training and virtual networking events focused on enterprise.
72
ch
ile
per
u
co
lom
bia
105
PA
RQ
UE
AR
AU
CO
IN
TE
GR
AT
ED
RE
PO
RT
20
20

106
PA
RQ
UE
AR
AU
CO
IN
TE
GR
AT
ED
RE
PO
RT
20
20
GOVERNANCEAND COMMUNITYINTRODUCTION ABOUT US
ECONOMIC PERFORMANCE
ENVIRONMENTAL PERFORMANCE
SOCIAL PERFORMANCE
ADDITIONAL INFORMATION
FINANCIAL INFORMATION
Our contribution to the communities where we work Our team Our suppliers
5.1. Our contribution to the communities where we work
Lines of action
3. Support for local entrepreneurs
Initiatives to support entrepreneurs during the public health crisis
ch
ileFundación Echinuco
“It is through buying things from the smallest onesthat we become great.”
Pulpería Echinucoin the Luxury District at Parque Arauco KennedyDisplay case for Chilean producers
We have worked with Fundación Echinuco since 2014 to promote the products and talents of Chilean entrepreneurs.
In March 2020, its sales platform, Pulpería Echinuco, joined Parque Arauco Kennedy with a store in the Luxury District. This space is a showcase for Chilean producers. Their products include cheeses, herbal teas, snacks, leather goods, ceramics and jewelry.
The Echinuco store joined the e-commerce challenge during the pandemic. This allowed the entrepreneurs to continue to sell and promote their products without customers having to leave their homes.
per
u
watch ViDeo
The Los Aprendedores podcast
episodesin the entrepreneur podcast
people listened to the audio content
10 +8,000,000
We launched this digital tool in 2020, which allowed us to reach more people who want to be entrepreneurs and learn about the real stories of businesses with impact that have traveled their own pathway to growth, in many cases in partnership with our shopping centers in Peru.
Los Aprendedores is a 10-episode podcast that chronicles the challenges and experiences of people who grew their businesses despite the challenges they faced. Some of these stories feature entrepreneurs that have operations in our shopping centers.
106
PA
RQ
UE
AR
AU
CO
IN
TE
GR
AT
ED
RE
PO
RT
20
20
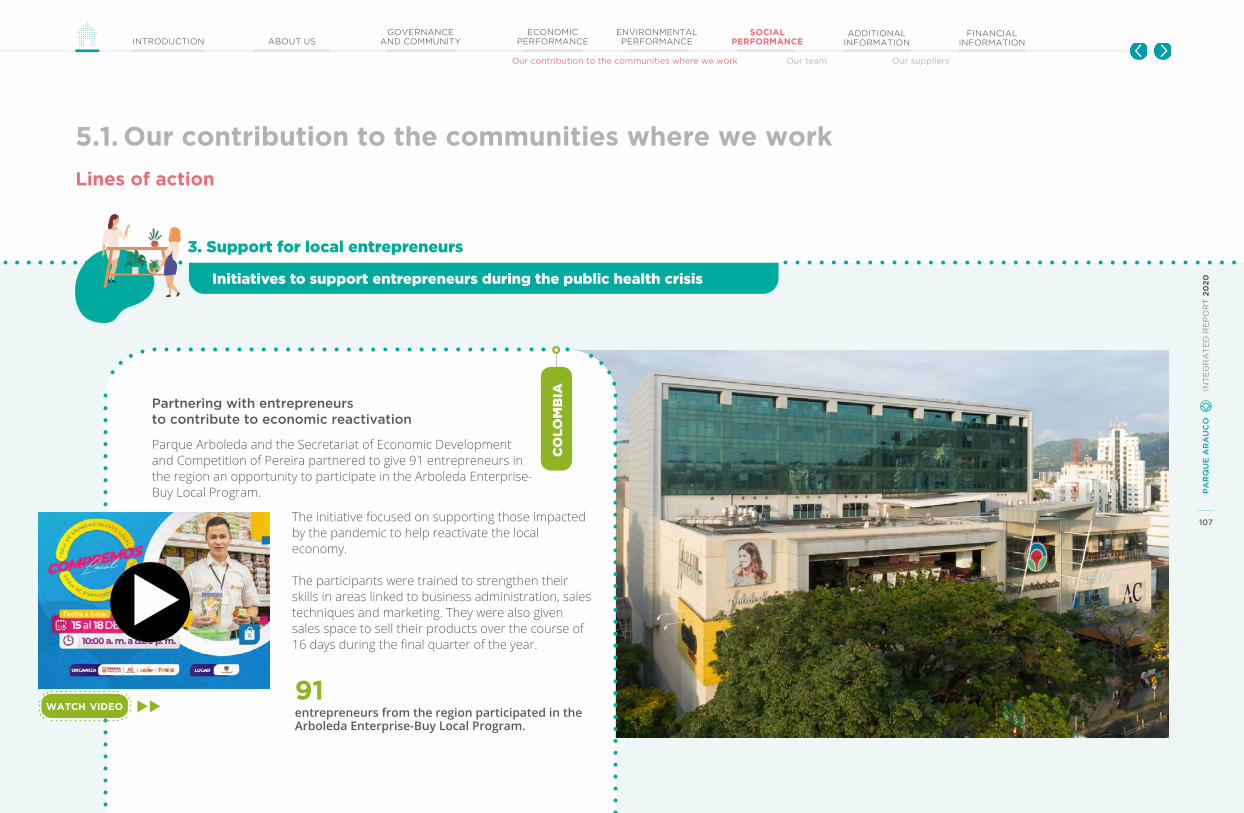
107
PA
RQ
UE
AR
AU
CO
IN
TE
GR
AT
ED
RE
PO
RT
20
20
GOVERNANCEAND COMMUNITYINTRODUCTION ABOUT US
ECONOMIC PERFORMANCE
ENVIRONMENTAL PERFORMANCE
SOCIAL PERFORMANCE
ADDITIONAL INFORMATION
FINANCIAL INFORMATION
Our contribution to the communities where we work Our team Our suppliers
5.1. Our contribution to the communities where we work
Lines of action
3. Support for local entrepreneurs
co
lom
bia
Partnering with entrepreneursto contribute to economic reactivation
Parque Arboleda and the Secretariat of Economic Development and Competition of Pereira partnered to give 91 entrepreneurs in the region an opportunity to participate in the Arboleda Enterprise-Buy Local Program.
watch ViDeo entrepreneurs from the region participated in the Arboleda Enterprise-Buy Local Program.
91
The initiative focused on supporting those impacted by the pandemic to help reactivate the local economy.
The participants were trained to strengthen their skills in areas linked to business administration, sales techniques and marketing. They were also given sales space to sell their products over the course of 16 days during the final quarter of the year.
107
PA
RQ
UE
AR
AU
CO
IN
TE
GR
AT
ED
RE
PO
RT
20
20Initiatives to support entrepreneurs during the public health crisis
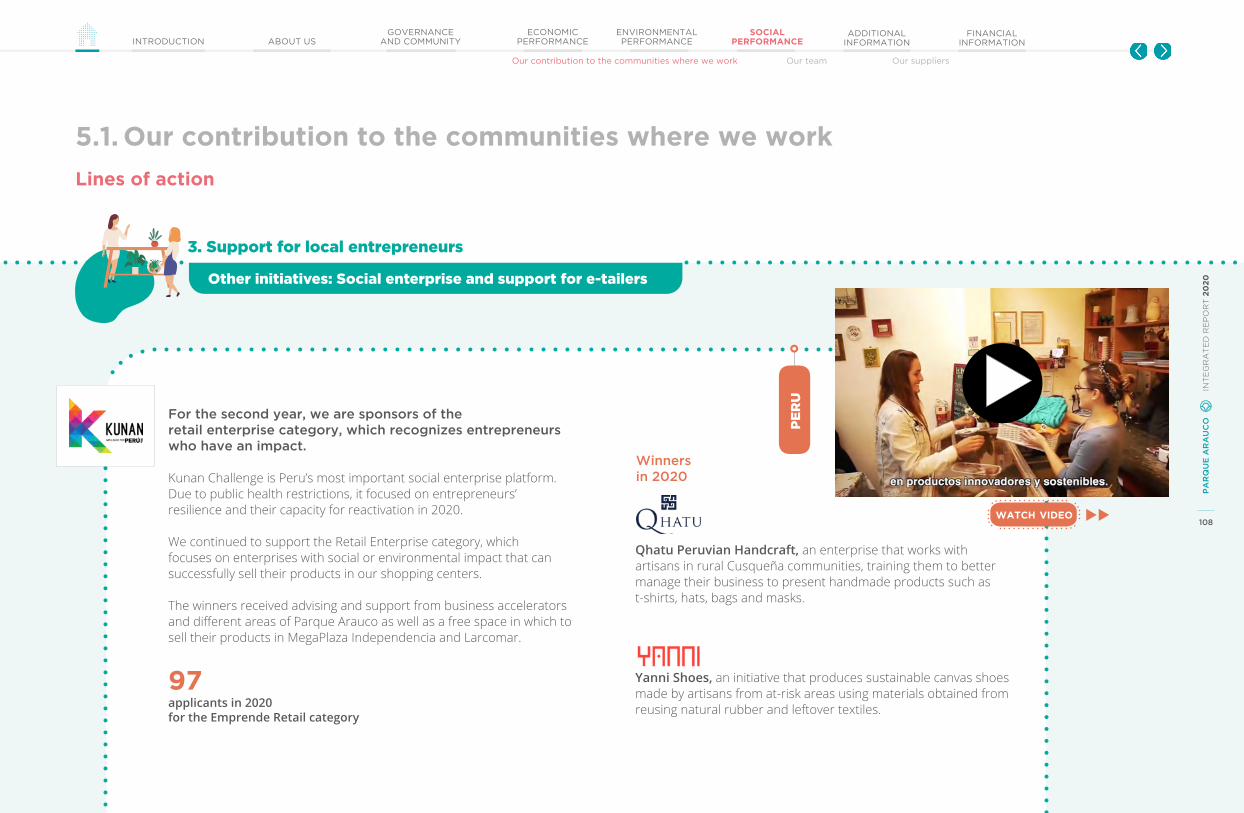
108
PA
RQ
UE
AR
AU
CO
IN
TE
GR
AT
ED
RE
PO
RT
20
20
GOVERNANCEAND COMMUNITYINTRODUCTION ABOUT US
ECONOMIC PERFORMANCE
ENVIRONMENTAL PERFORMANCE
SOCIAL PERFORMANCE
ADDITIONAL INFORMATION
FINANCIAL INFORMATION
Our contribution to the communities where we work Our team Our suppliers
5.1. Our contribution to the communities where we work
For the second year, we are sponsors of the retail enterprise category, which recognizes entrepreneurs who have an impact.
Kunan Challenge is Peru’s most important social enterprise platform. Due to public health restrictions, it focused on entrepreneurs’ resilience and their capacity for reactivation in 2020.
We continued to support the Retail Enterprise category, which focuses on enterprises with social or environmental impact that can successfully sell their products in our shopping centers.
The winners received advising and support from business accelerators and different areas of Parque Arauco as well as a free space in which to sell their products in MegaPlaza Independencia and Larcomar.
Qhatu Peruvian Handcraft, an enterprise that works with artisans in rural Cusqueña communities, training them to better manage their business to present handmade products such as t-shirts, hats, bags and masks.
Yanni Shoes, an initiative that produces sustainable canvas shoes made by artisans from at-risk areas using materials obtained from reusing natural rubber and leftover textiles.applicants in 2020
for the Emprende Retail category
97
watch ViDeo
Lines of action
3. Support for local entrepreneurs
per
u
108
PA
RQ
UE
AR
AU
CO
IN
TE
GR
AT
ED
RE
PO
RT
20
20
Winners in 2020
Other initiatives: Social enterprise and support for e-tailers
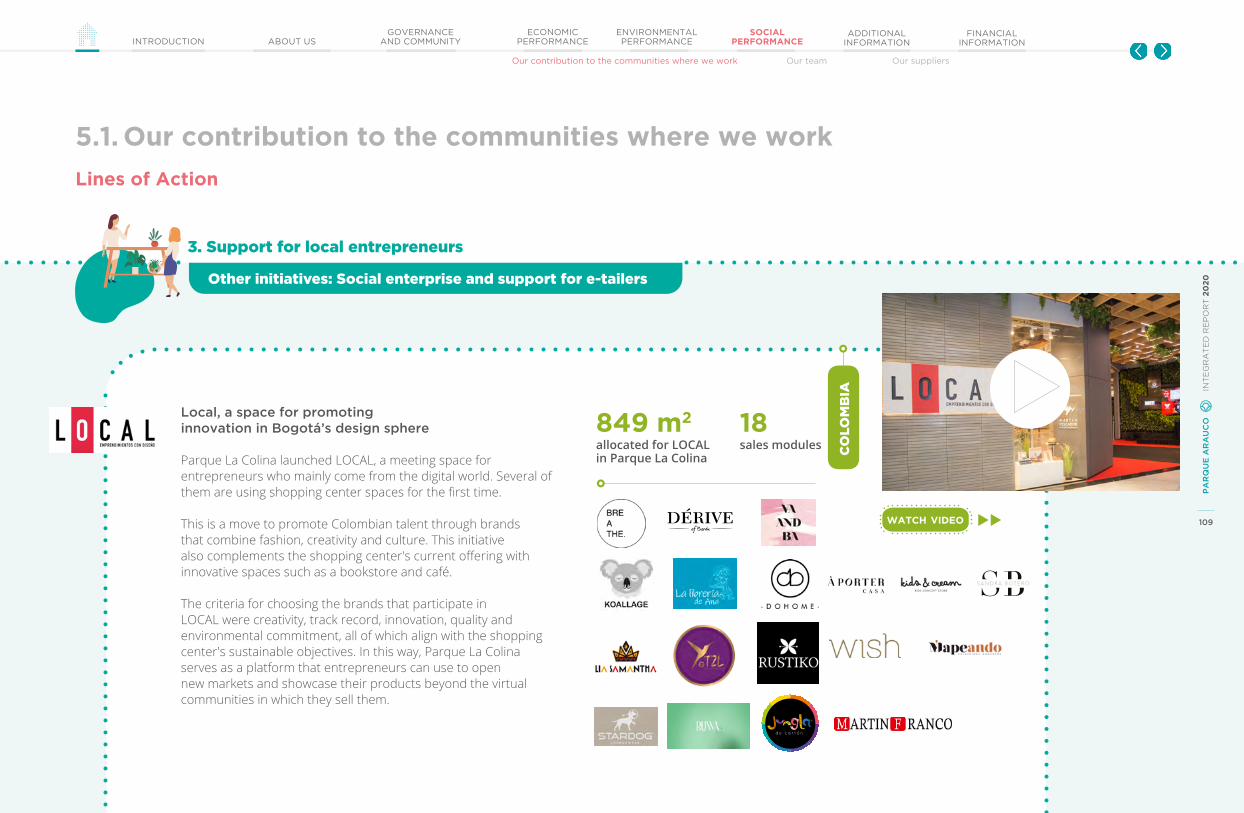
109
PA
RQ
UE
AR
AU
CO
IN
TE
GR
AT
ED
RE
PO
RT
20
20
GOVERNANCEAND COMMUNITYINTRODUCTION ABOUT US
ECONOMIC PERFORMANCE
ENVIRONMENTAL PERFORMANCE
SOCIAL PERFORMANCE
ADDITIONAL INFORMATION
FINANCIAL INFORMATION
Our contribution to the communities where we work Our team Our suppliers
5.1. Our contribution to the communities where we work
Local, a space for promoting innovation in Bogotá’s design sphere
Parque La Colina launched LOCAL, a meeting space for entrepreneurs who mainly come from the digital world. Several of them are using shopping center spaces for the first time.
This is a move to promote Colombian talent through brands that combine fashion, creativity and culture. This initiative also complements the shopping center's current offering with innovative spaces such as a bookstore and café.
The criteria for choosing the brands that participate in LOCAL were creativity, track record, innovation, quality and environmental commitment, all of which align with the shopping center's sustainable objectives. In this way, Parque La Colina serves as a platform that entrepreneurs can use to open new markets and showcase their products beyond the virtual communities in which they sell them.
allocated for LOCAL in Parque La Colina
sales modules849 m2 18
watch ViDeo
Lines of Action
3. Support for local entrepreneurs
co
lom
bia
Other initiatives: Social enterprise and support for e-tailers
S A N D R A B O T E R O
109
PA
RQ
UE
AR
AU
CO
IN
TE
GR
AT
ED
RE
PO
RT
20
20
110
PA
RQ
UE
AR
AU
CO
IN
TE
GR
AT
ED
RE
PO
RT
20
20
GOVERNANCEAND COMMUNITYINTRODUCTION ABOUT US
ECONOMIC PERFORMANCE
ENVIRONMENTAL PERFORMANCE
SOCIAL PERFORMANCE
ADDITIONAL INFORMATION
FINANCIAL INFORMATION
Our contribution to the communities where we work Our team Our suppliers
110
PA
RQ
UE
AR
AU
CO
IN
TE
GR
AT
ED
RE
PO
RT
20
20
5.2 Ourteam
110
PA
RQ
UE
AR
AU
CO
IN
TE
GR
AT
ED
RE
PO
RT
20
20

111
PA
RQ
UE
AR
AU
CO
IN
TE
GR
AT
ED
RE
PO
RT
20
20
GOVERNANCEAND COMMUNITYINTRODUCTION ABOUT US
ECONOMIC PERFORMANCE
ENVIRONMENTAL PERFORMANCE
SOCIAL PERFORMANCE
ADDITIONAL INFORMATION
FINANCIAL INFORMATION
Our contribution to the communities where we work Our team Our suppliers
5.2 Our team
Our organization
At Parque Arauco, we have successfully advanced our business model thanks to our employees’ knowledge and professionalism. We believe that they are one of our main competitive advantages and a key part of our achievements.
Parque Arauco is a company that mobilizes around excellence, endeavoring to attract, select and retain talented professionals who are committed to their work. We focus on achieving challenging goals while upholding the ethics and corporate values that define our culture.
staff Distribution by category1 Chile Peru Colombia TOTAL
Senior executives2020 4 1 1 6
2019 4 1 1 6
Managers2020 72 10 16 98
2019 73 10 14 97
Professionals2020 220 122 57 399
2019 220 135 59 414
Administrative and support personnel2020 15 0 0 15
2019 16 0 0 16
518employees
chile
311
peru
133
colombia
74
Male employees
Female employees
55%45%
Local
Foreign
97%3%
Under 40
Over 40
75%25%
1. These are the changes in criteria that were considered in the workforce data and the comparison between 2019 and 2020.-The criteria for 2019 and 2020 is uniform with respect to employee departures as of December 31. In this regard, a departure on December 31 is counted as a departure during the current year and not the following one.-In 2019, the administrative and support personnel category was considered part of 'professionals' based on the criteria for data reported quarterly to local authorities (financial statements). It is now calculated according to financial statement criteria for 2019 and 2020.-In 2019, an intern with a contract was not considered a hire. Given that the intern did have a work contract, this is corrected for 2019 and 2020.
See more data on our organization.
see more
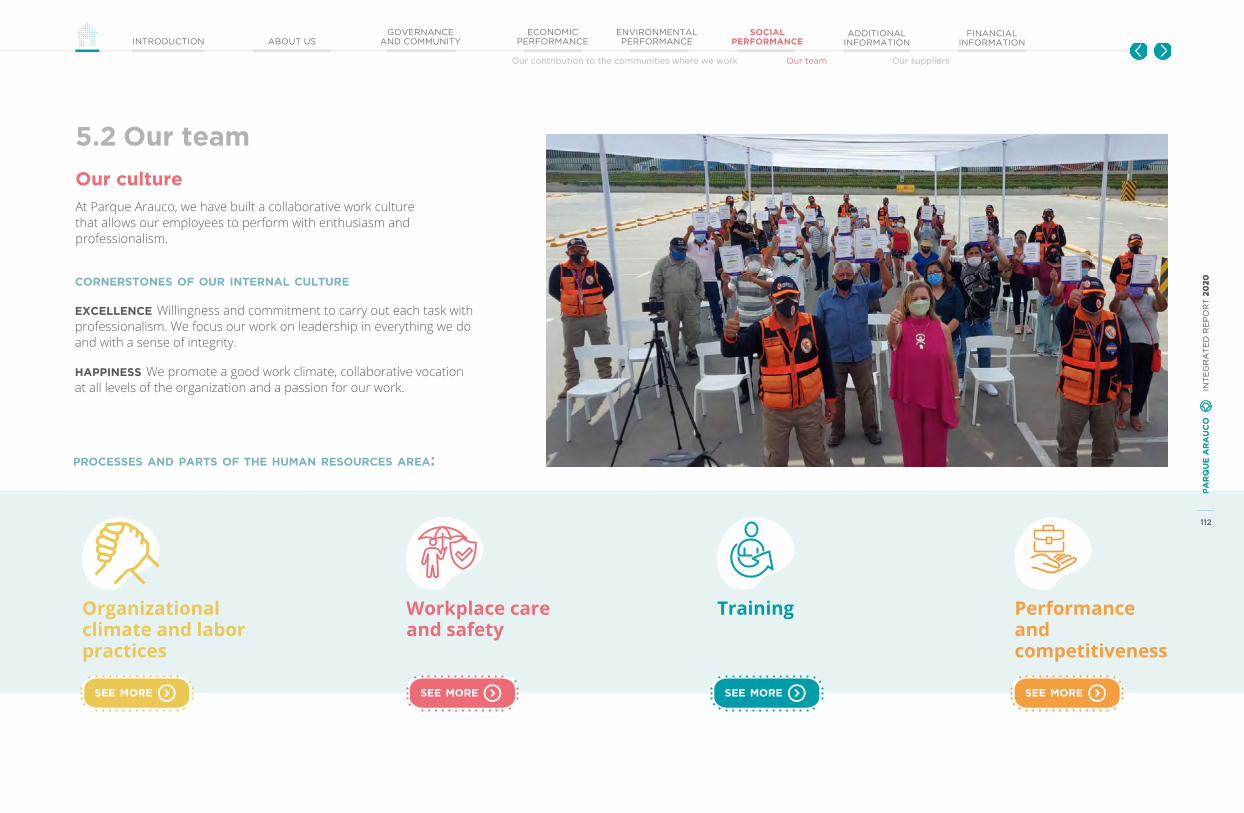
112
PA
RQ
UE
AR
AU
CO
IN
TE
GR
AT
ED
RE
PO
RT
20
20
GOVERNANCEAND COMMUNITYINTRODUCTION ABOUT US
ECONOMIC PERFORMANCE
ENVIRONMENTAL PERFORMANCE
SOCIAL PERFORMANCE
ADDITIONAL INFORMATION
FINANCIAL INFORMATION
Our contribution to the communities where we work Our team Our suppliers
5.2 Our team
At Parque Arauco, we have built a collaborative work culture that allows our employees to perform with enthusiasm and professionalism.
Our culture
cornerstones of our internal culture
excellence Willingness and commitment to carry out each task with professionalism. We focus our work on leadership in everything we do and with a sense of integrity.
happiness We promote a good work climate, collaborative vocation at all levels of the organization and a passion for our work.
see moresee more see more see more
Organizational climate and labor practices
TrainingWorkplace care and safety
Performance and competitiveness
112
PA
RQ
UE
AR
AU
CO
IN
TE
GR
AT
ED
RE
PO
RT
20
20
processes anD parts of the human resources area:

113
PA
RQ
UE
AR
AU
CO
IN
TE
GR
AT
ED
RE
PO
RT
20
20
GOVERNANCEAND COMMUNITYINTRODUCTION ABOUT US
ECONOMIC PERFORMANCE
ENVIRONMENTAL PERFORMANCE
SOCIAL PERFORMANCE
ADDITIONAL INFORMATION
FINANCIAL INFORMATION
Our contribution to the communities where we work Our team Our suppliers
Organizational climate and labor practicesWe use measurement standards that allow us to periodically identify the perception of the actions that we implement for our teams.
The studies that we conduct each year allow us to consult directly and indirectly with our employees in Chile, Peru and Colombia on various aspects of the internal work environment and communication with their supervisors and peers. This allows us to measure our performance and compare ourselves to the industry in this area in order to continue to improve implementation of best labor practices.
The Peru Division has an ABE Certificate that promotes and recognizes social labor responsibility through best practices of Peruvian companies. It is granted by the Association of Good Employers (ABE), an institution that belongs to the American Chamber of Commerce of Peru.
Our employees’ internal satisfaction is the indicator that allows us to understand how teams are evaluating the labor environment and their level of identification with the company more clearly. That number is monitored year to year based on the Great Place to Work methodology.
position of chile, peru anD colombia in stuDies that measure labor practices in comparison with other companies
peru
2020: 14th placeCategory: Companies with between 20 and 250 employees.
Watch the GPTW awards ceremony in Peru.
watch ViDeo
colombia
2020: 13th placeCategory: Companies with up to 300 employees
Watch the GPTW awards ceremony in Colombia.
watch ViDeo
5.2 Our team
Male
Female
Total
internal employee satisfaction %
88% 88% 88%88% 90%88% 88%84%96%
87%80%
98%
chile peru colombia consolidated
CHILE POSITION IN THE 2018, 2019 AND 2020 RANKING:
2020: 8th place
Watch the GPTW awards ceremony in Chile.
watch ViDeo
Category: Companies with between 251 and 1,000 employees
2019: 9th - 2018: 22nd
chile
2020: 66th place2019: 49th place - 2018: 43th place
Position in the 2018, 2019 and 2020 ranking:
Fifteen percent of Parque Arauco employees in Chile are members of a union. Colombia and Peru report no employees having joined a union organization in 2020.

114
PA
RQ
UE
AR
AU
CO
IN
TE
GR
AT
ED
RE
PO
RT
20
20
GOVERNANCEAND COMMUNITYINTRODUCTION ABOUT US
ECONOMIC PERFORMANCE
ENVIRONMENTAL PERFORMANCE
SOCIAL PERFORMANCE
ADDITIONAL INFORMATION
FINANCIAL INFORMATION
Our contribution to the communities where we work Our team Our suppliers
Organizational climate and labor practices
5.2 Our team
Aequales Assessment The consulting firm Aequales measures progress in gender equity in various companies and organizations in Latin America, including ours.
This free, confidential measurement is conducted each year. The results rank companies in relation to other participants and various areas of analysis, allowing them to assess the gaps and opportunities for advancement in terms of gender equity in the organization.
In this context, the Colombia Division conducted virtual training activities focused on empowering women. It addressed eight topics including women's power, women and family, women and politics and women and business.
The training activity lasted for 48 hours, and participants received a certificate of completion. Forty-nine of the 53 women in the Colombia division completed the program, achieving a 92% certification rate.
CASE
female participant certification rate
92%
Promotionsby gender 2020 2019
Male 31 63Female 24 39Total 55 102
New employees 68Female 35 (70 in 2019)Male 33 (91 in 2019)
some of the labor benefits that we proViDe to our teams.
We present academic excellence awards to our employees and their children to support their professional and educational development each year in Chile, Peru and Colombia.
We have discount agreements with gyms and sports facilities and service agreements with dental clinics and ophthalmology services.
We also have measures in place regarding use of work time. These include: a half-day off for birthdays; at least five paid days off each year in addition to legally mandated vacation time; flexible scheduling and summer schedules; and compensation for business trips requiring flights of more than five hours.
We offer additional life insurance and supplementary health coverage to employees in Chile, Peru and Colombia.
In Chile, for women whose salaries exceed the legal limit at which the state covers their maternity leave, Parque Arauco covers the portion not legally covered during leave (up to the first 84 days of leave). This means that their income does not decrease during the pre- and post-natal periods.
internal opportunities
new hires in 20201
see more
Issues related to empowering women were addressed in virtual trainings in Colombia
8
per
u
co
lom
bia
1. These are the changes in criteria that were considered in the workforce data and the comparison between 2019 and 2020.-The criteria for 2019 and 2020 is uniform with respect to employee departures as of December 31. In this regard, a departure on December 31 is counted as a departure during the current year and not the following one.-In 2019, the administrative and support personnel category was considered part of 'professionals' based on the criteria for data reported quarterly to local authorities (financial statements). It is now calculated according to financial statement criteria for 2019 and 2020.-In 2019, an intern with a contract was not considered a hire. Given that the intern did have a work contract, this is corrected for 2019 and 2020.

115
PA
RQ
UE
AR
AU
CO
IN
TE
GR
AT
ED
RE
PO
RT
20
20
GOVERNANCEAND COMMUNITYINTRODUCTION ABOUT US
ECONOMIC PERFORMANCE
ENVIRONMENTAL PERFORMANCE
SOCIAL PERFORMANCE
ADDITIONAL INFORMATION
FINANCIAL INFORMATION
Our contribution to the communities where we work Our team Our suppliers
Workplace care and safety
We strive to reinforce a culture of self-care and safety in our teams. Due to the COVID-19 pandemic, we intensified measures designed to protect our employees and other stakeholders.
We created an Executive Committee comprised of senior management to deploy and monitor measures and actions on a weekly basis to address the health crisis on all fronts, particularly as it relates to caring for people. We developed and coordinated the distribution of our Internal COVID-19 Self-Care Protocol.
5.2 Our team
some of the actions actions taken to care for our teams
At the peak of the pandemic, we implemented telecommuting for all employees’ whose roles do not require them to be physically present at our properties. As health measures imposed by officials were gradually loosened, we created a voluntary return-to-the-office protocol. This includes flexible schedules and hybrid (in-person and distance) working as well as rules and equipment designed to ensure distancing and self-care.
Temporary suspension of all international travel and assessment of exceptional cases of travel within countries.
The decision not to take advantage of furloughing alternatives offered by the Chilean government, which meant that we took responsibility for covering all of the costs of our teams.
Suspension of large-scale events and in-person training for teams.
caring for our team During the health crisis
115
PA
RQ
UE
AR
AU
CO
IN
TE
GR
AT
ED
RE
PO
RT
20
20
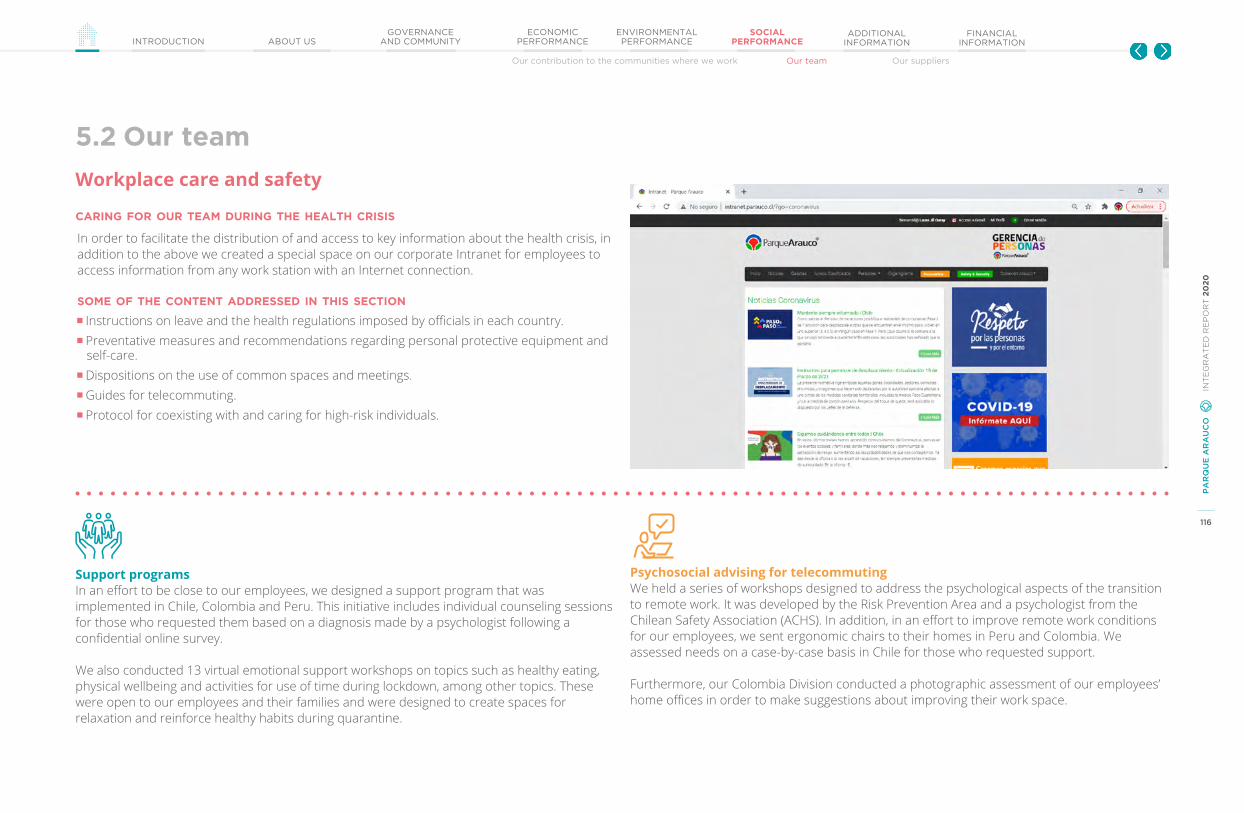
116
PA
RQ
UE
AR
AU
CO
IN
TE
GR
AT
ED
RE
PO
RT
20
20
GOVERNANCEAND COMMUNITYINTRODUCTION ABOUT US
ECONOMIC PERFORMANCE
ENVIRONMENTAL PERFORMANCE
SOCIAL PERFORMANCE
ADDITIONAL INFORMATION
FINANCIAL INFORMATION
Our contribution to the communities where we work Our team Our suppliers
Workplace care and safety
Support programsIn an effort to be close to our employees, we designed a support program that was implemented in Chile, Colombia and Peru. This initiative includes individual counseling sessions for those who requested them based on a diagnosis made by a psychologist following a confidential online survey.
We also conducted 13 virtual emotional support workshops on topics such as healthy eating, physical wellbeing and activities for use of time during lockdown, among other topics. These were open to our employees and their families and were designed to create spaces for relaxation and reinforce healthy habits during quarantine.
Psychosocial advising for telecommutingWe held a series of workshops designed to address the psychological aspects of the transition to remote work. It was developed by the Risk Prevention Area and a psychologist from the Chilean Safety Association (ACHS). In addition, in an effort to improve remote work conditions for our employees, we sent ergonomic chairs to their homes in Peru and Colombia. We assessed needs on a case-by-case basis in Chile for those who requested support.
Furthermore, our Colombia Division conducted a photographic assessment of our employees’ home offices in order to make suggestions about improving their work space.
5.2 Our team
In order to facilitate the distribution of and access to key information about the health crisis, in addition to the above we created a special space on our corporate Intranet for employees to access information from any work station with an Internet connection.
some of the content aDDresseD in this section
Instructions on leave and the health regulations imposed by officials in each country. Preventative measures and recommendations regarding personal protective equipment and self-care.
Dispositions on the use of common spaces and meetings. Guides for telecommuting. Protocol for coexisting with and caring for high-risk individuals.
caring for our team During the health crisis
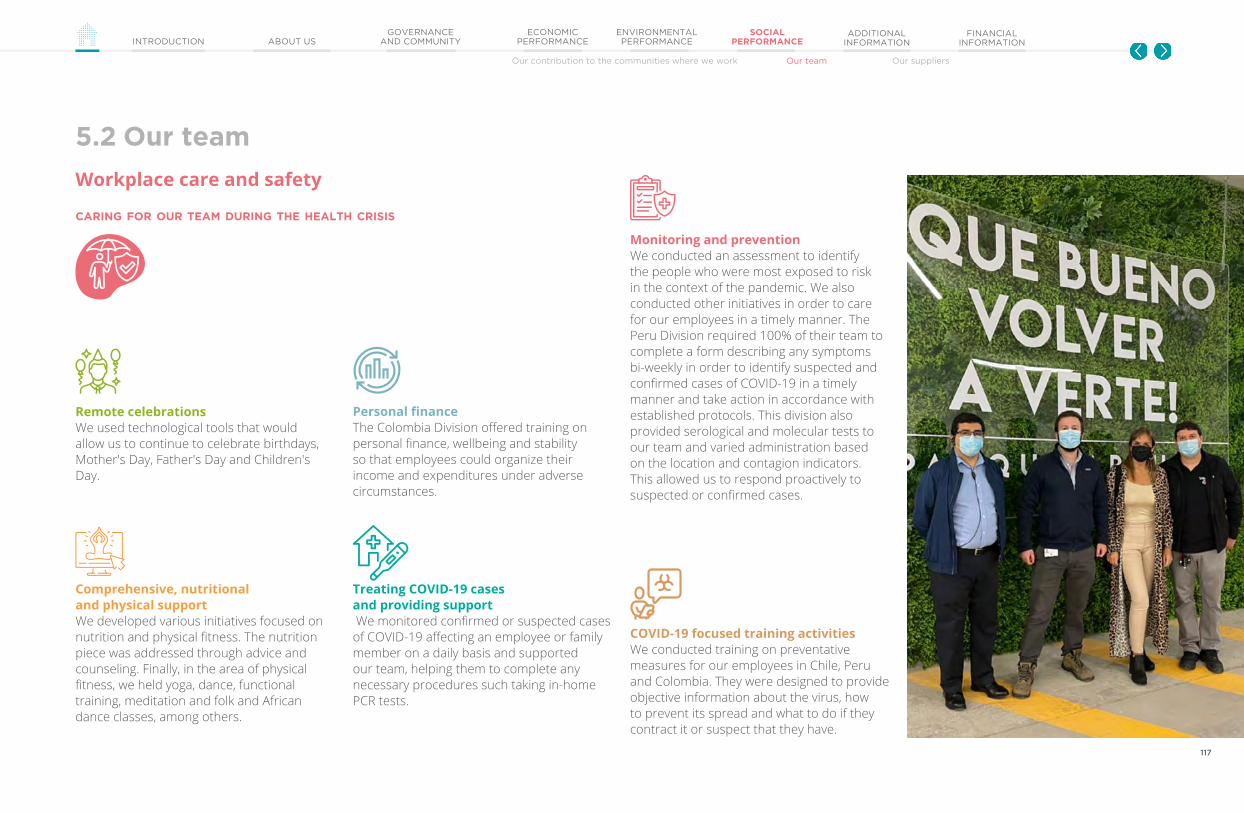
117
PA
RQ
UE
AR
AU
CO
IN
TE
GR
AT
ED
RE
PO
RT
20
20
GOVERNANCEAND COMMUNITYINTRODUCTION ABOUT US
ECONOMIC PERFORMANCE
ENVIRONMENTAL PERFORMANCE
SOCIAL PERFORMANCE
ADDITIONAL INFORMATION
FINANCIAL INFORMATION
Our contribution to the communities where we work Our team Our suppliers
Workplace care and safety
5.2 Our team
Remote celebrationsWe used technological tools that would allow us to continue to celebrate birthdays, Mother's Day, Father's Day and Children's Day.
Personal financeThe Colombia Division offered training on personal finance, wellbeing and stability so that employees could organize their income and expenditures under adverse circumstances.
Monitoring and preventionWe conducted an assessment to identify the people who were most exposed to risk in the context of the pandemic. We also conducted other initiatives in order to care for our employees in a timely manner. The Peru Division required 100% of their team to complete a form describing any symptoms bi-weekly in order to identify suspected and confirmed cases of COVID-19 in a timely manner and take action in accordance with established protocols. This division also provided serological and molecular tests to our team and varied administration based on the location and contagion indicators. This allowed us to respond proactively to suspected or confirmed cases.
Comprehensive, nutritional and physical supportWe developed various initiatives focused on nutrition and physical fitness. The nutrition piece was addressed through advice and counseling. Finally, in the area of physical fitness, we held yoga, dance, functional training, meditation and folk and African dance classes, among others.
Treating COVID-19 cases and providing support We monitored confirmed or suspected cases of COVID-19 affecting an employee or family member on a daily basis and supported our team, helping them to complete any necessary procedures such taking in-home PCR tests.
COVID-19 focused training activitiesWe conducted training on preventative measures for our employees in Chile, Peru and Colombia. They were designed to provide objective information about the virus, how to prevent its spread and what to do if they contract it or suspect that they have.
caring for our team During the health crisis
117

118
PA
RQ
UE
AR
AU
CO
IN
TE
GR
AT
ED
RE
PO
RT
20
20
GOVERNANCEAND COMMUNITYINTRODUCTION ABOUT US
ECONOMIC PERFORMANCE
ENVIRONMENTAL PERFORMANCE
SOCIAL PERFORMANCE
ADDITIONAL INFORMATION
FINANCIAL INFORMATION
Our contribution to the communities where we work Our team Our suppliers
Workplace care and safety
5.2 Our team
colombia
peruchile
The country has three committees for employee participation and consultation, which are divided by facility:
Corporate Joint Committee
Regional Services Joint Committees
Chile Division Joint Committee
The committees meet monthly to identify and evaluate risks related to occupational accidents and illnesses.
This division has two committees available for employee participation and consultation:
The Occupational Health and Safety Committee, which is responsible for overseeing the occupational health and safety plan and its execution and monitoring.
Sexual Harassment Intervention Committee, which is a joint, gender-equal committee. Its goal is to respond to reports or complaints and to issue recommendations on sanctions and additional measures to be taken to avoid new cases.
There are three committees available for employee participation and consultation in this division:
Joint Committee on Occupational Health and Safety (COPASST). This committee ensures compliance with the Occupational Health and Safety Management System and supports activities established in the annual plan. It meets monthly to review indicators, industrial hygiene activities and improvement plans.
Labor Coexistence Committee. This body hears, evaluates and addresses complaints or concerns regarding situations of alleged workplace harassment. It recommends corrective measures designed to rectify such conduct and ensures compliance with the preventative measures that are established. It meets bimonthly.
Equity Committee. The objective of this committee is to promote a cultural change around gender equity in regard to the uses and practices within the company and its projection in society through its relationships with suppliers, contractors and visitors. It establishes the standards and mechanisms necessary for this.
team committees
Caring for our team every day
We comply with legal regulations, considering the provisions applicable to each of our divisions in regard to accident prevention and the protection of the health and safety of our employees in Chile, Peru and Colombia.
Our management system is comprised of safety policies that are applied through specific protocols and procedures. This includes the use of personal protective equipment for all employees based on their exposure to risk and specialized teams for monitoring risk prevention and accidents. These teams ensure that the established provisions are followed.
791Hours of training on health and safety given to employees in 2020.
2020: 1.6%Absenteeism rate among employees 2019: 2.2%
2020: 0Lost time injury frequency rate (LTIFR)2019: 1.9%
118
PA
RQ
UE
AR
AU
CO
IN
TE
GR
AT
ED
RE
PO
RT
20
20

119
PA
RQ
UE
AR
AU
CO
IN
TE
GR
AT
ED
RE
PO
RT
20
20
GOVERNANCEAND COMMUNITYINTRODUCTION ABOUT US
ECONOMIC PERFORMANCE
ENVIRONMENTAL PERFORMANCE
SOCIAL PERFORMANCE
ADDITIONAL INFORMATION
FINANCIAL INFORMATION
Our contribution to the communities where we work Our team Our suppliers
Training
Leadership SchoolThe Peru Division launched a leadership program focused on each employee who has a leadership role or supervises a team. The program, distributed over six modules and two additional team coaching spaces, helped participants develop leadership skills aligned with organizational values.
Teams in each of the countries participated in a feedback and performance process. This includes skills aligned with the company’s strategic values and objectives, among other things. The Human Resources Department in every country keeps a record and files the documentation for follow-up on feedback. They are responsible for quantifying impact and controlling the progress of the initiatives and established priorities.
5.2 Our team 2020 2019
Total hours of training 5,657 17,129Average training hours per employee 10.9 32.0
Average training hours for women 12.7 39.4
Average training hours for men 9.5 26.3
Average training hours for employees under 40 10.6 34.0
Average training hours for employees aged 41 to 50 11.3 33.7
Average training hours for employees over 51 13.7 11.2
We suspended the in-person training activities that had been planned for our team in 2020 due to the health restrictions. We only held trainings that were considered essential to our operations and did so online.
These initiatives included:
Soft skills development Our Colombia and Peru divisions used Ubits, a system implemented through a virtual education platform that considers our employees’ profiles to offer them training that aligns with their interests.
In Peru, 69% of our employees actively participated in courses focused on developing skills for situation management and negotiations, such as managing difficult conversations, consumer experience, accountability, customer-centricity, teamwork and leadership.
In Colombia, 76.7% of employees participated in the virtual training program. They received training in soft skills depending on their management area and the needs of their role. These skills were related to leadership, personal image, communication and context management, as well as other techniques such as negotiation, data analytics, planning and budgeting.
We also developed ESAN seminars thanks to an alliance with the ESAN Graduate School of Business, a prestigious graduate school that offers virtual seminars taught by one of their professors. This gave employees the opportunity to learn about three key topics for business skills and relationships: effective negotiation and persuasion, planning and organization, and working under pressure.
of our employees participated in 202057%
119

120
PA
RQ
UE
AR
AU
CO
IN
TE
GR
AT
ED
RE
PO
RT
20
20
GOVERNANCEAND COMMUNITYINTRODUCTION ABOUT US
ECONOMIC PERFORMANCE
ENVIRONMENTAL PERFORMANCE
SOCIAL PERFORMANCE
ADDITIONAL INFORMATION
FINANCIAL INFORMATION
Our contribution to the communities where we work Our team Our suppliers
Performance and competitiveness
An evaluation process was implemented that considered skills aligned with the company’s strategic values and objectives, among other things. The Human Resources Department in every country keeps a record and files the documentation for follow-up on feedback. They are responsible for quantifying impact and controlling the progress of the initiatives and established priorities.
83%of our employees were part of the performance evaluation process that we conducted in 2020.
chile
73%peru
97%colombia
100%
5.2 Our team
121
PA
RQ
UE
AR
AU
CO
IN
TE
GR
AT
ED
RE
PO
RT
20
20
GOVERNANCEAND COMMUNITYINTRODUCTION ABOUT US
ECONOMIC PERFORMANCE
ENVIRONMENTAL PERFORMANCE
SOCIAL PERFORMANCE
ADDITIONAL INFORMATION
FINANCIAL INFORMATION
Our contribution to the communities where we work Our team Our suppliers
121
PA
RQ
UE
AR
AU
CO
IN
TE
GR
AT
ED
RE
PO
RT
20
20
5.3 Oursuppliers
121
PA
RQ
UE
AR
AU
CO
IN
TE
GR
AT
ED
RE
PO
RT
20
20

122
PA
RQ
UE
AR
AU
CO
IN
TE
GR
AT
ED
RE
PO
RT
20
20
GOVERNANCEAND COMMUNITYINTRODUCTION ABOUT US
ECONOMIC PERFORMANCE
ENVIRONMENTAL PERFORMANCE
SOCIAL PERFORMANCE
ADDITIONAL INFORMATION
FINANCIAL INFORMATION
Our contribution to the communities where we work Our team Our suppliers
5.3 Our suppliers
Our supply chain
Strengthening collaborative work with our suppliers based on continuous improvement and the creation of solid relationships is key to the development of our business. We conducted joint initiatives and measured indicators that help us to move forward with the work that we do with them in order to make them strategic allies of our operations.
In 2020, 429 suppliers joined our value chain. However, the total number of suppliers dropped compared to 2019 due to temporary closures of some of our facilities and decreased frequency of services as a result of the health restrictions imposed due to the COVID-19 pandemic. In addition, we made progress on unifying processes for the properties we added to Megaplaza in Peru. This increased service provider concentration for all operations in that country, allowing us to optimize synergies that had been identified some time ago.
number of suppliers
1,2
94
1,4
55
89
8
3,6
47
1,0
49
90
9
chile peru colombia total
2019
2020
70
0
2,6
58
429new suppliers joined our supply chain in 2020.
96%of new suppliers are based in the countries where we operate
chile
1,049peru
909colombia
700
new suppliers
operations base
34
.8%
37
.3%
25
.5%
2.4
%
2019: 844
37
.3%
27
.7%
chile peru colombia other
2019
2020
31.
7%
3.3
%
2020: 429
122
PA
RQ
UE
AR
AU
CO
IN
TE
GR
AT
ED
RE
PO
RT
20
20
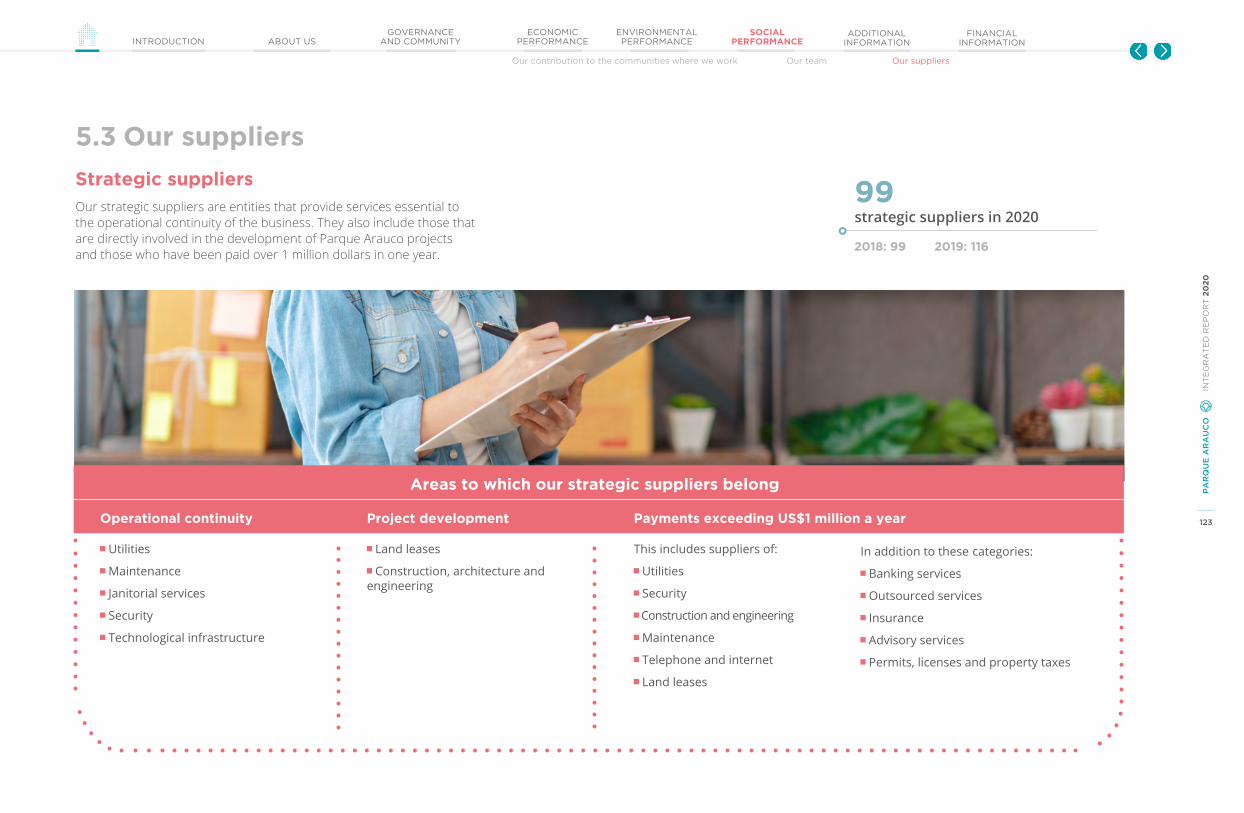
123
PA
RQ
UE
AR
AU
CO
IN
TE
GR
AT
ED
RE
PO
RT
20
20
GOVERNANCEAND COMMUNITYINTRODUCTION ABOUT US
ECONOMIC PERFORMANCE
ENVIRONMENTAL PERFORMANCE
SOCIAL PERFORMANCE
ADDITIONAL INFORMATION
FINANCIAL INFORMATION
Our contribution to the communities where we work Our team Our suppliers
5.3 Our suppliers
Our strategic suppliers are entities that provide services essential to the operational continuity of the business. They also include those that are directly involved in the development of Parque Arauco projects and those who have been paid over 1 million dollars in one year.
Strategic suppliers
2018: 99 2019: 116
99strategic suppliers in 2020
Areas to which our strategic suppliers belong
Operational continuity Project development Payments exceeding US$1 million a year
Utilities
Maintenance
Janitorial services
Security
Technological infrastructure
Land leases
Construction, architecture and engineering
This includes suppliers of:
Utilities
Security
Construction and engineering
Maintenance
Telephone and internet
Land leases
In addition to these categories:
Banking services
Outsourced services
Insurance
Advisory services
Permits, licenses and property taxes
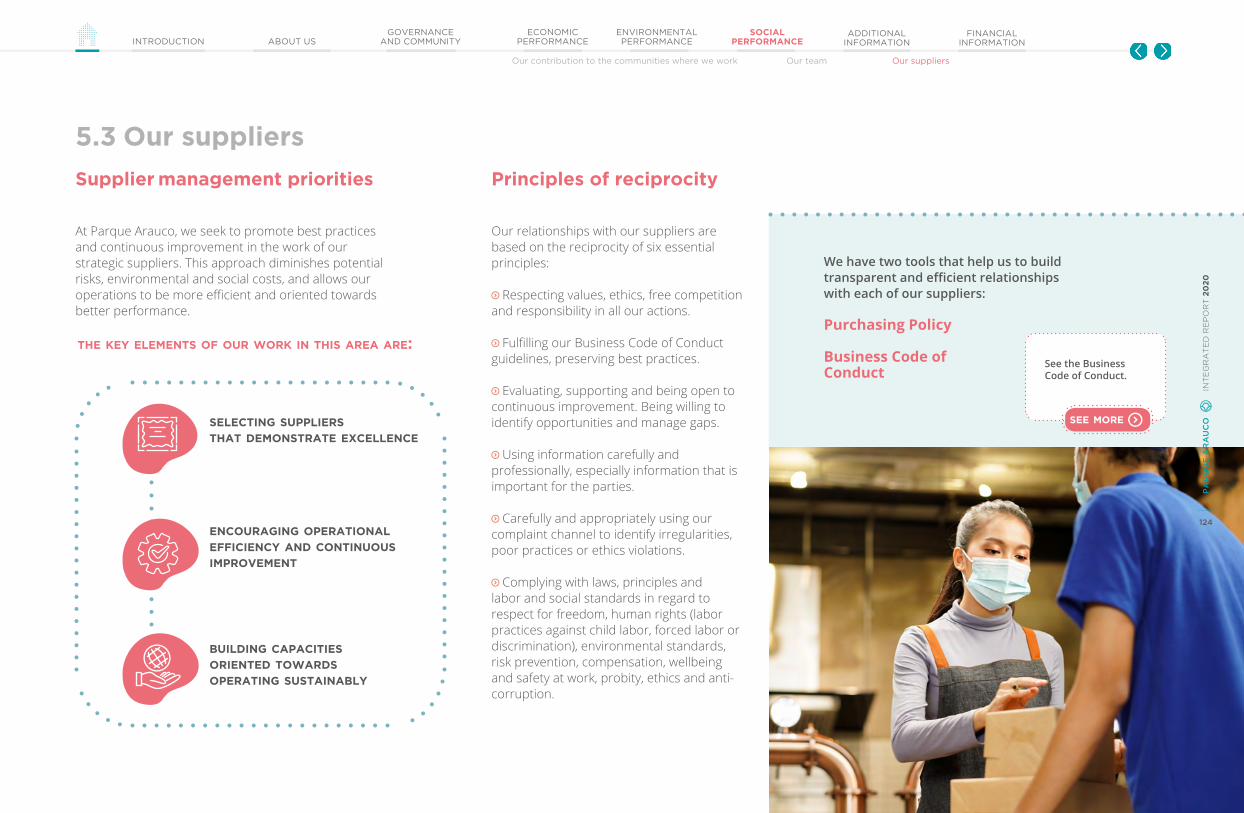
124
PA
RQ
UE
AR
AU
CO
IN
TE
GR
AT
ED
RE
PO
RT
20
20
GOVERNANCEAND COMMUNITYINTRODUCTION ABOUT US
ECONOMIC PERFORMANCE
ENVIRONMENTAL PERFORMANCE
SOCIAL PERFORMANCE
ADDITIONAL INFORMATION
FINANCIAL INFORMATION
Our contribution to the communities where we work Our team Our suppliers
5.3 Our suppliers
At Parque Arauco, we seek to promote best practices and continuous improvement in the work of our strategic suppliers. This approach diminishes potential risks, environmental and social costs, and allows our operations to be more efficient and oriented towards better performance.
Our relationships with our suppliers are based on the reciprocity of six essential principles:
Respecting values, ethics, free competition and responsibility in all our actions.
Fulfilling our Business Code of Conduct guidelines, preserving best practices.
Evaluating, supporting and being open to continuous improvement. Being willing to identify opportunities and manage gaps.
Using information carefully and professionally, especially information that is important for the parties.
Carefully and appropriately using our complaint channel to identify irregularities, poor practices or ethics violations.
Complying with laws, principles and labor and social standards in regard to respect for freedom, human rights (labor practices against child labor, forced labor or discrimination), environmental standards, risk prevention, compensation, wellbeing and safety at work, probity, ethics and anti-corruption.
Supplier management priorities Principles of reciprocity
selecting suppliers that Demonstrate excellence
encouraging operational efficiency anD continuous improVement
builDing capacities orienteD towarDs operating sustainably
We have two tools that help us to build transparent and efficient relationships with each of our suppliers:
Purchasing Policy
Business Code ofConduct
See the Business Code of Conduct.
see more
124
PA
RQ
UE
AR
AU
CO
IN
TE
GR
AT
ED
RE
PO
RT
20
20
the key elements of our work in this area are:

125
PA
RQ
UE
AR
AU
CO
IN
TE
GR
AT
ED
RE
PO
RT
20
20
GOVERNANCEAND COMMUNITYINTRODUCTION ABOUT US
ECONOMIC PERFORMANCE
ENVIRONMENTAL PERFORMANCE
SOCIAL PERFORMANCE
ADDITIONAL INFORMATION
FINANCIAL INFORMATION
Our contribution to the communities where we work Our team Our suppliers
5.3 Our suppliers
Criteria of our supplier relationships
We use information analysis processes to select our suppliers, which allows us to review their profile, experience and the alignment of their business practices with our organizational values and standards.
Our Data Management area, which reports to the Corporate Regional Services Division, reviews the information on and profiles of new suppliers to identify potential risks related to financial and labor non-compliance and conflicts of interest.
In the case of bidding processes for strategic services, we conduct in-depth reviews of the participating suppliers’ information, including criteria related to operations, experience, commercial offerings and sustainability practices.
We have a Crime Prevention Model (CPM) that applies to our stakeholders, including our suppliers. It is designed to prevent conduct that may go against ethics and current law.
The Ethics Point platform allows all suppliers and other stakeholders to file complaints about any occurrence or situation that they believe to be illegal or to go against the organization’s principles and values. These complaints may be anonymous and are handled confidentially by the Ethics Committee.
The company also has control systems for financial transactions, including internal audits of processes related to our supply chain.
Parque Arauco suppliers also have a clause or appendix related to the crime prevention model in their contracts or purchase orders.
2019: 100%
100%of new suppliers underwent the Data Management verification process in 2020.
Crime prevention and reporting irregularities
Information analysis in supplier selection

126
PA
RQ
UE
AR
AU
CO
IN
TE
GR
AT
ED
RE
PO
RT
20
20
GOVERNANCEAND COMMUNITYINTRODUCTION ABOUT US
ECONOMIC PERFORMANCE
ENVIRONMENTAL PERFORMANCE
SOCIAL PERFORMANCE
ADDITIONAL INFORMATION
FINANCIAL INFORMATION
Our contribution to the communities where we work Our team Our suppliers
5.3 Our suppliersCriteria of our supplier relationships
Over the course of this year, we continued to expand automated supplier payment. This process involves various implementation stages. The first involves creating an email address to facilitate communication and then a monitor who is responsible for reviewing the information on the invoices received from suppliers. Finally, we must create an accounting robot that can decrease the number of errors in the accounting processes. This process has begun in Chile, and we achieved 64% automation by the close of 2020.
In order to maintain an agile and efficient relationship with our suppliers, we continued to make progress on our commitment to pay invoices within 30 days. As a result, we have shortened the average period in Colombia and Chile over the past few years, and we continue to move forward with operations in Peru in order to make progress in this area.
20192018 2020
aVerage supplier payment term (in days)
24
25
35
48
2526
25
34
chile peru colombia
24
chile
64%peru
5%colombia
40%
Percentage of automation in supplier payment processes Partnership
with CumploWe formalized a partnership with the company Cumplo in 2020 in order to give suppliers an option to boost liquidity.
Cumplo is Latin America’s largest digital platform for collaborative financing. Its goal is to provide resources to small and medium enterprises through contact with investors and other types of organizations.
One of the tools that it offers is reverse factoring, which allows customer companies (buyers) to manage payments to suppliers, offering the latter the opportunity to receive payments for invoices prior to the due date.
The main benefits for suppliers include the efficiency and speed (as little as two hours) with which they can receive advance payment for their invoices and access to 100% of their value.
Over the course of this year, Parque Arauco offered training workshops and tools to allow suppliers who wanted to learn more about Cumplo and the advantages and management model of this liquidity option.
CASE
Timely payment
126
PA
RQ
UE
AR
AU
CO
IN
TE
GR
AT
ED
RE
PO
RT
20
20
ch
ile
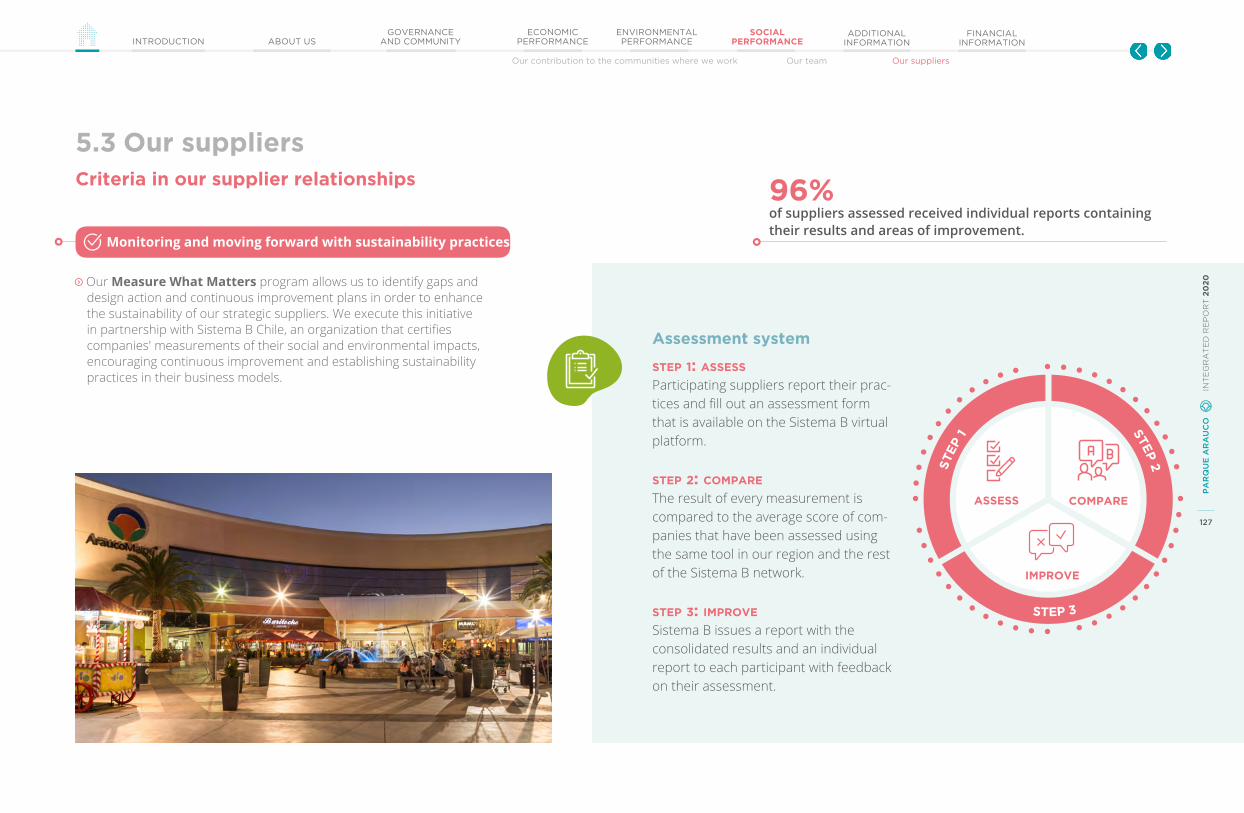
127
PA
RQ
UE
AR
AU
CO
IN
TE
GR
AT
ED
RE
PO
RT
20
20
GOVERNANCEAND COMMUNITYINTRODUCTION ABOUT US
ECONOMIC PERFORMANCE
ENVIRONMENTAL PERFORMANCE
SOCIAL PERFORMANCE
ADDITIONAL INFORMATION
FINANCIAL INFORMATION
Our contribution to the communities where we work Our team Our suppliers
Criteria in our supplier relationships
5.3 Our suppliers
Our Measure What Matters program allows us to identify gaps and design action and continuous improvement plans in order to enhance the sustainability of our strategic suppliers. We execute this initiative in partnership with Sistema B Chile, an organization that certifies companies' measurements of their social and environmental impacts, encouraging continuous improvement and establishing sustainability practices in their business models.
step 1
step 3
step
2
assess compare
improVe
Assessment system
step 1: assess
Participating suppliers report their prac-tices and fill out an assessment form that is available on the Sistema B virtual platform.
step 2: compare
The result of every measurement is compared to the average score of com-panies that have been assessed using the same tool in our region and the rest of the Sistema B network.
step 3: improVe
Sistema B issues a report with the consolidated results and an individual report to each participant with feedback on their assessment.
96%of suppliers assessed received individual reports containing their results and areas of improvement.
127
PA
RQ
UE
AR
AU
CO
IN
TE
GR
AT
ED
RE
PO
RT
20
20
Monitoring and moving forward with sustainability practices
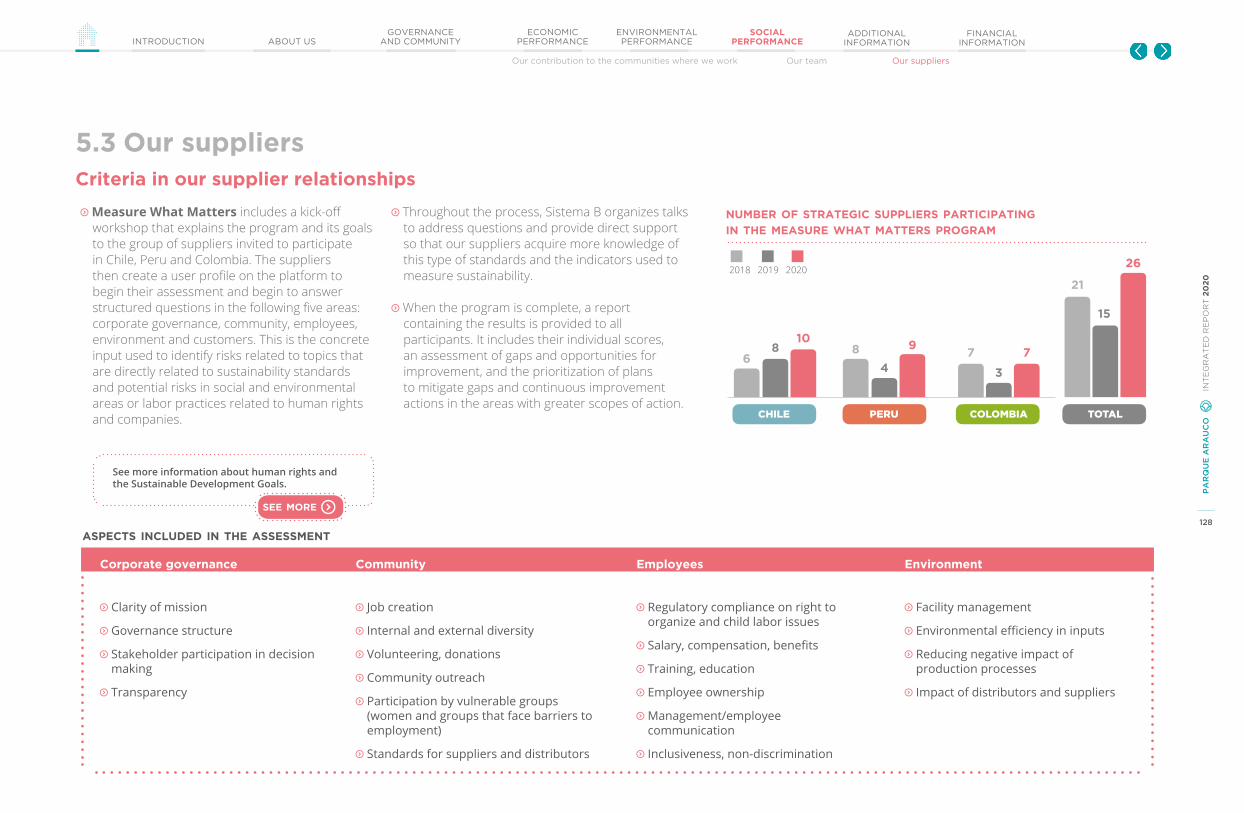
128
PA
RQ
UE
AR
AU
CO
IN
TE
GR
AT
ED
RE
PO
RT
20
20
GOVERNANCEAND COMMUNITYINTRODUCTION ABOUT US
ECONOMIC PERFORMANCE
ENVIRONMENTAL PERFORMANCE
SOCIAL PERFORMANCE
ADDITIONAL INFORMATION
FINANCIAL INFORMATION
Our contribution to the communities where we work Our team Our suppliers
5.3 Our suppliers
Measure What Matters includes a kick-off workshop that explains the program and its goals to the group of suppliers invited to participate in Chile, Peru and Colombia. The suppliers then create a user profile on the platform to begin their assessment and begin to answer structured questions in the following five areas: corporate governance, community, employees, environment and customers. This is the concrete input used to identify risks related to topics that are directly related to sustainability standards and potential risks in social and environmental areas or labor practices related to human rights and companies.
Throughout the process, Sistema B organizes talks to address questions and provide direct support so that our suppliers acquire more knowledge of this type of standards and the indicators used to measure sustainability.
When the program is complete, a report containing the results is provided to all participants. It includes their individual scores, an assessment of gaps and opportunities for improvement, and the prioritization of plans to mitigate gaps and continuous improvement actions in the areas with greater scopes of action.
See more information about human rights and the Sustainable Development Goals.
see more
20192018 2020
number of strategic suppliers participating in the measure what matters program
8
4 3
15
8
21
710
97
26
chile peru colombia total
6
Criteria in our supplier relationships
aspects incluDeD in the assessment
Corporate governance Community Employees Environment
Clarity of mission
Governance structure
Stakeholder participation in decision making
Transparency
Job creation
Internal and external diversity
Volunteering, donations
Community outreach
Participation by vulnerable groups (women and groups that face barriers to employment)
Standards for suppliers and distributors
Regulatory compliance on right to organize and child labor issues
Salary, compensation, benefits
Training, education
Employee ownership
Management/employee communication
Inclusiveness, non-discrimination
Facility management
Environmental efficiency in inputs
Reducing negative impact of production processes
Impact of distributors and suppliers

129
PA
RQ
UE
AR
AU
CO
IN
TE
GR
AT
ED
RE
PO
RT
20
20
GOVERNANCEAND COMMUNITYINTRODUCTION ABOUT US
ECONOMIC PERFORMANCE
ENVIRONMENTAL PERFORMANCE
SOCIAL PERFORMANCE
ADDITIONAL INFORMATION
FINANCIAL INFORMATION
Our contribution to the communities where we work Our team Our suppliers
5.3 Our suppliers
Training, workplace care and safety
The areas covered in training programs for contractor companies that perform strategic work for the operation include:
Training for firefighters on safety issues. Service and courtesy instructions. Information on our internal procedures. Ergonomics and managing and controlling stress. Contractor Manual. First aid. Motivation in the workplace and its impact on risk prevention. Human and organizational factors.
In addition to these training activities, several courses focused on improving care and prevention of COVID-19 were held in Chile, Peru and Colombia. Some of them addressed self-care and protocols for returning to in-person work and the presence of possible cases of COVID-19, among other topics.
4.1 hourswas the average amount of training offered on health and safety topics in Chile, Peru and Colombia.
1,437 participants in 2020
0.1%Rate of absenteeism for contractors2019: 0.1%
5.9%Lost time injury frequency rate for contractors (LTIFR)⁴2019: 16.31%
Actions taken during the public health crisis
CASE
In addition, we created opportunities to raise awareness about coronavirus, symptoms and prevention, the personal protective equipment necessary to avoid spreading the disease and other measures related to the pandemic.
Caring for our suppliers also involved creating spaces for advising, emotional support and monitoring of positive cases of COVID-19 among our employees and suppliers.
Peru had a Health and Safety Committee focused on care and prevention as it relates to our suppliers and coronavirus.
The committee held monthly meetings that included 19 strategic suppliers with one- to three-year contracts in services such as parking, safety, maintenance, landscaping and healthcare (nurses and technicians who provide care to anyone who is injured or has had an accident).
These meetings resulted in prevention actions, awareness campaigns and dissemination of protocols.
129
PA
RQ
UE
AR
AU
CO
IN
TE
GR
AT
ED
RE
PO
RT
20
20
130
PA
RQ
UE
AR
AU
CO
IN
TE
GR
AT
ED
RE
PO
RT
20
20
GOVERNANCEAND COMMUNITYINTRODUCTION ABOUT US
ECONOMIC PERFORMANCE
ENVIRONMENTAL PERFORMANCE
SOCIAL PERFORMANCE
ADDITIONAL INFORMATION
FINANCIAL INFORMATION
2020 by the numbers Corporate information About this integrated report External assurance and statement of responsibilityGRI content index and General Character Standard No. 30
Additional information
6.1 2020 by the numbers
6.3 About this Integrated Report
6.5 External assurance and statement of responsibility
6.2 Corporate information
6.4 GRI content index and General Character Standard No. 30
06.

131
PA
RQ
UE
AR
AU
CO
IN
TE
GR
AT
ED
RE
PO
RT
20
20
GOVERNANCEAND COMMUNITYINTRODUCTION ABOUT US
ECONOMIC PERFORMANCE
ENVIRONMENTAL PERFORMANCE
SOCIAL PERFORMANCE
ADDITIONAL INFORMATION
FINANCIAL INFORMATION
2020 by the numbers Corporate information About this integrated report External assurance and statement of responsibilityGRI content index and General Character Standard No. 30
6.1 2020 by the numbers
Throughout this Integrated Report we present information that has been condensed to make it easier to present and understand, with detailed information on the numbers that provide a more specific vision of the company’s performance. These figures are presented below.
Developing our business allows us to contribute economic value to the various stakeholders that come together through our work. As such, benefits go to our suppliers, team, financiers, the government through tax payments and various social organizations. Finally, our shareholders receive the profits generated.
2020 2019
Economic value generatedRevenue 125,851,928 205,612,761Financial income 7,494,326 11,444,462Dividends received 0 4,850,003Share of profits of associates 5,211,953 7,186,623Total economic value generated 138,558,207 229,093,849
Economic value distributed to societyPayments to our suppliers2 29,513,168 23,022,803Salaries and benefits for our team 21,867,433 24,406,498Payments to our creditors3 49,052,507 39,979,625Payments to our shareholders 23,741,825 40,135,314
Payments to the government4 16,109,927 27,004,731
Community contributions and donations 315,343 296,596
Total economic value distributed to society 140,600,203 154,845,567
Total economic value retainedTotal economic value generated 138,558,207 229,093,849Total economic value distributed to society 140,600,203 154,845,567Total economic value retained -2,041,996 74,248,282
1. Economic Value Generated and Distributed calculated based on the GRI Guidelines, international standards for sustainability reporting.2. Cost of sales + Administrative expenses - Compensation - Property taxes - Municipal taxes.3. Financial expenses - Accrued stamp taxes.4. Current net tax + Property taxes + Municipal taxes + Stamp taxes paid
The social investment that we make as a company is focused on promoting sustainability agenda objectives. This year we focused most of our contributions on initiatives related to the pandemic and to reactivating the economy through support for entrepreneurs. Our corporate donation policy explicitly states that all social contributions must be reviewed by the Executive Sustainability Committee and that campaign contributions will not be approved. In 2020, we supported different organizations with CLP$ 315 million in donations and memberships.
Community investment
economic Value generateD anD DistributeD1 (in thousands of chilean pesos)
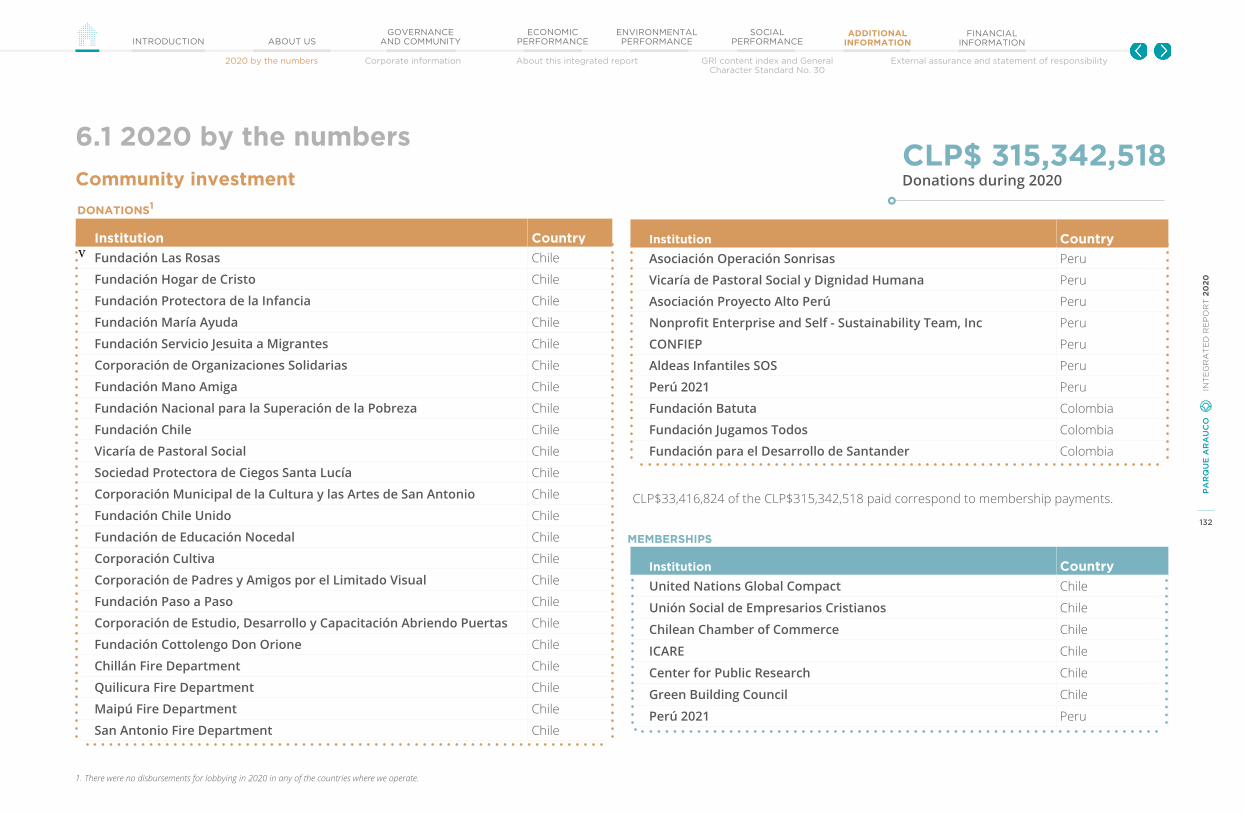
132
PA
RQ
UE
AR
AU
CO
IN
TE
GR
AT
ED
RE
PO
RT
20
20
GOVERNANCEAND COMMUNITYINTRODUCTION ABOUT US
ECONOMIC PERFORMANCE
ENVIRONMENTAL PERFORMANCE
SOCIAL PERFORMANCE
ADDITIONAL INFORMATION
FINANCIAL INFORMATION
2020 by the numbers Corporate information About this integrated report External assurance and statement of responsibilityGRI content index and General Character Standard No. 30
6.1 2020 by the numbers
Community investment
Institution Country
Fundación Las Rosas Chile
Fundación Hogar de Cristo Chile
Fundación Protectora de la Infancia Chile
Fundación María Ayuda Chile
Fundación Servicio Jesuita a Migrantes Chile
Corporación de Organizaciones Solidarias Chile
Fundación Mano Amiga Chile
Fundación Nacional para la Superación de la Pobreza Chile
Fundación Chile Chile
Vicaría de Pastoral Social Chile
Sociedad Protectora de Ciegos Santa Lucía Chile
Corporación Municipal de la Cultura y las Artes de San Antonio Chile
Fundación Chile Unido Chile
Fundación de Educación Nocedal Chile
Corporación Cultiva Chile
Corporación de Padres y Amigos por el Limitado Visual Chile
Fundación Paso a Paso Chile
Corporación de Estudio, Desarrollo y Capacitación Abriendo Puertas Chile
Fundación Cottolengo Don Orione Chile
Chillán Fire Department Chile
Quilicura Fire Department Chile
Maipú Fire Department Chile
San Antonio Fire Department Chile
v
Institution Country
United Nations Global Compact Chile
Unión Social de Empresarios Cristianos Chile
Chilean Chamber of Commerce Chile
ICARE Chile
Center for Public Research Chile
Green Building Council Chile
Perú 2021 Peru
Institution Country
Asociación Operación Sonrisas Peru
Vicaría de Pastoral Social y Dignidad Humana Peru
Asociación Proyecto Alto Perú Peru
Nonprofit Enterprise and Self - Sustainability Team, Inc Peru
CONFIEP Peru
Aldeas Infantiles SOS Peru
Perú 2021 Peru
Fundación Batuta Colombia
Fundación Jugamos Todos Colombia
Fundación para el Desarrollo de Santander Colombia
CLP$ 315,342,518 Donations during 2020
1. There were no disbursements for lobbying in 2020 in any of the countries where we operate.
Donations1
memberships
CLP$33,416,824 of the CLP$315,342,518 paid correspond to membership payments.

133
PA
RQ
UE
AR
AU
CO
IN
TE
GR
AT
ED
RE
PO
RT
20
20
GOVERNANCEAND COMMUNITYINTRODUCTION ABOUT US
ECONOMIC PERFORMANCE
ENVIRONMENTAL PERFORMANCE
SOCIAL PERFORMANCE
ADDITIONAL INFORMATION
FINANCIAL INFORMATION
2020 by the numbers Corporate information About this integrated report External assurance and statement of responsibilityGRI content index and General Character Standard No. 30
6.1 2020 by the numbersEnvironmental performance indicators1
1. The water use intensity, energy intensity, waste intensity and emissions intensity indicators were modified for 2018 and 2019 based on an updated calculation of square meters of common spaces included this year.
Indicator 2018 2019 2020
Indicator Unit Chile Colombia Peru Consolidated Chile Colombia Peru Consolidated Chile Colombia Peru Consolidated
Scope in properties Number 11 4 13 28 13 4 20 37 13 4 20 37
Common area m2 661,346 283,645 450,078 1,395,069 661,346 283,645 450,078 1,395,069 661,346 283,645 450,078 1,395,069
Energy
Total energy consumed MWh 88,405 25,333 47,844 161,582 93,250 25,257 67,514 186,022 58,623 18,133 44,802 121,558
Energy sold MWh 60,487 13,598 32,719 106,804 63,016 13,796 47,923 124,734 37,823 9,063 32,830 79,716 Energy in common areas MWh 27,918 11,735 15,125 54,778 30,235 11,461 19,592 61,287 20,800 9,070 11,972 41,842 Energy consumption from fuels MWh 5 265 52 322 87 306 189 582 - 291 114 405Total energy - company’s own consumption MWh 27,923 12,000 15,177 55,100 30,322 11,767 19,781 61,869 20,800 9,070 11,972 41,842 Energy intensity kWh/m2 42,22 42,31 33,72 39,50 45,85 41,48 43,95 44,35 31,45 31,98 26,60 29,99
Water
Total potable water m3 1,057,849 218,756 505,541 1,782,146 1,070,179 227,889 634,379 1,932,447 741,780 157,106 350,952 1,249,838 Water sold m3 517,340 107,334 267,477 892,151 540,024 111,090 351,820 1,002,934 288,116 59,789 164,204 512,109 Water in common areas m3 524,843 111,422 237,787 874,052 530,155 116,799 281,579 928,532 453,663 97,308 186,860 737,831 Water reused m3 - 7,553 9,025 16,578 11,168 5,088 16,256 - 9,372 945 10,317 Water use intensity m3/m2 0,79 0,39 0,53 0,63 0,80 0,41 0,63 0,67 0,69 0,34 0,42 0,53 Waste management
Total waste t 10,197 2,867 3,371 16,435 10,674 3,661 4,327 18,661 4,743 2,869 1,893 9,505 Waste generated t 8,333 2,046 2,927 13,305 8,487 2,586 3,792 14,864 3,635 2,315 1,677 7,626 Waste intensity kg/m2 12.60 7.21 6.50 9.54 12.83 9.12 8.43 10.65 5.50 8.16 3.73 5.47 Composted, recycled or recovered waste t 1,864 821 444 3,130 2,187 1,075 535 3,797 1,108 554 217 1,879 Proportion of waste recovered % 18.28% 28.65% 13.18% 19.04% 20.49% 29.35% 12.38% 20.35% 23.37% 19.31% 11.44% 20%Carbon footprint
Scope 1 TCO2e 1 67 27 96 22 77 64 163 - 89 34 122.71 Scope 2 - location-based method TCO2e 12,015 1,526 5,392 18,932 11,454 1,483 4,855 17,793 8,122 1,491 2,035 11,649 Total emissions - location-based method TCO2e 12,016 1,593 5,419 19,028 11,476 1,560 4,919 17,956 8,122 1,580 2,069 11,771 Scope 2 - market-based method TCO2e 22,148 - 4,304 26,452 4,047 - 5,399 9,446 2,274 - 1,147 3,421 Total emissions - market-based method TCO2e 22,149 67 4,331 26,548 4,069 77 5,463 9,609 2,274 89 1,181 3,544 Emissions intensity - market-based method KgCO2e /m2 33.49 0.24 9.62 19.03 6.15 0.27 12.14 6.89 3.44 0.31 2.62 2.54 Emissions intensity - location-based method KgCO2e /m2 18.17 5.62 12.04 13.64 17.35 5.50 10.93 12.87 12.28 5.57 4.60 8.44

134
PA
RQ
UE
AR
AU
CO
IN
TE
GR
AT
ED
RE
PO
RT
20
20
GOVERNANCEAND COMMUNITYINTRODUCTION ABOUT US
ECONOMIC PERFORMANCE
ENVIRONMENTAL PERFORMANCE
SOCIAL PERFORMANCE
ADDITIONAL INFORMATION
FINANCIAL INFORMATION
2020 by the numbers Corporate information About this integrated report External assurance and statement of responsibilityGRI content index and General Character Standard No. 30
Number of persons by: Chile Peru Colombia Consolidated
GenderFemale 116 65 54 235Male 195 68 20 283Total 311 133 74 518
NationalityLocal 295 133 72 500Foreign 16 0 2 18Total 311 133 74 518
Age group
Less than 30 years 69 24 19 11230 - 40 166 76 34 27641 - 50 54 23 19 9651 - 60 16 9 1 2661 - 70 4 1 1 6Over 70 years 2 0 0 2Total 311 133 74 518
Years of service
Less than 3 years 147 74 41 2623 - 6 100 30 19 1496 - 9 34 16 10 609 - 12 15 5 4 24Over 12 years 15 8 0 23Total 311 133 74 518
Type of position
Senior executives 4 1 1 6Managers 72 10 16 98Professionals 220 122 57 399Administrative and support personnel 15 0 0 15
Total 311 133 74 518
6.1 2020 by the numbers
Indicators for our team
1. N/A: The chief executive category is comprised exclusively of men. As such, the gender gap is not included in this case.2. The two employees listed as foreigners in Colombia hold Chilean nationality. As such, there are 297 employees with Chilean nationality in the organization.
organizational DiVersity
20192018 2020
salary gap1 Average salary representation for women over average salary for men (%)
Managers
7981
80
Professionals
97
99
88
Administrative and support
personnel
9110
3
95
134

135
PA
RQ
UE
AR
AU
CO
IN
TE
GR
AT
ED
RE
PO
RT
20
20
GOVERNANCEAND COMMUNITYINTRODUCTION ABOUT US
ECONOMIC PERFORMANCE
ENVIRONMENTAL PERFORMANCE
SOCIAL PERFORMANCE
ADDITIONAL INFORMATION
FINANCIAL INFORMATION
2020 by the numbers Corporate information About this integrated report External assurance and statement of responsibilityGRI content index and General Character Standard No. 30
Promotions by gender 2020 2019
No. of vacancies filled by internal candidates 27 98
No. of vacancies filled by female internal candidates 9 35
No. of vacancies filled by male internal candidates 18 63
workforce Distribution by category1 Chile Peru Colombia TOTAL
Senior executives2020 4 1 1 6
2019 4 1 1 6
Managers2020 72 10 16 98
2019 73 10 14 97
Professionals2020 220 122 57 399
2019 220 135 59 414
Administrative and support personnel2020 15 0 0 15
2019 16 0 0 16
New employees 68
Female 35 (70 in 2019)Male 33 (91 in 2019)
Promotions by gender 2020 2019Male 31 63
Female 24 39
Total 55 102
new hires in 20201
internal opportunities
Vacancies filleD by internal canDiDates
6.1 2020 by the numbers
Indicators for our team
1. These are the changes in criteria that were considered in the workforce data and the comparison between 2019 and 2020.-The criteria for 2019 and 2020 is uniform with respect to employee departures as of December 31. In this regard, a departure on December 31 is counted as a departure during the current year and not the following one.-In 2019, the administrative and support personnel category was considered part of 'professionals' based on the criteria for data reported quarterly to local authorities (financial statements). It is now calculated according to financial statement criteria for 2019 and 2020.-In 2019, an intern with a contract was not considered a hire. Given that the intern did have a work contract, this is corrected for 2019 and 2020
Number of persons by: Chile Peru Colombia Consolidated
New employees by gender
Female 13 14 8 35Male 24 7 2 33Total 37 21 10 68
New employees by age
Under 30 19 4 4 2730 - 50 17 17 6 40Over 50 1 0 0 1Total 37 21 10 68
Turnover rate Voluntary resignations 7% 8% 4% 7%Involuntary dismissal 6% 18% 9% 9%Total 13% 26% 14% 16%
new hires anD outgoing employees

136
PA
RQ
UE
AR
AU
CO
IN
TE
GR
AT
ED
RE
PO
RT
20
20
GOVERNANCEAND COMMUNITYINTRODUCTION ABOUT US
ECONOMIC PERFORMANCE
ENVIRONMENTAL PERFORMANCE
SOCIAL PERFORMANCE
ADDITIONAL INFORMATION
FINANCIAL INFORMATION
2020 by the numbers Corporate information About this integrated report External assurance and statement of responsibilityGRI content index and General Character Standard No. 30
6.2 Corporate information
Articles of incorporation Bylaws
Parque Arauco S.A.Date founded November 30, 1979
Articles of incorporation Public instrument
Notary Andrés Rubio Flores
City Santiago
Date amended February 23, 1981
Notary of amendment Andrés Rubio Flores
Licensed to operate bySuperintendency of Securities and Insurance (now the Financial Market Commission)
Resolution 363-S
Date of resolution June 22, 1981
Registration with the Commerce Registry of the Real Estate Registrar
City Santiago
p. 11,408
No. 6,348
Year 1981
Published in the Official Gazette No. 31,003
Date of publication June 30, 1981
The bylaws of Parque Arauco S.A. have been amended several times. The most recent reforms approved at the Extraordinary Shareholders’ Meeting are expressed in the public instruments listed below.
Date
Extract Registered with the Commerce Registry of the Santiago Real Estate Registrar
Publicationin Official Gazette No.
Dateof publication
June 1, 1992 p. 20,648 No. 10,800 1992 34,308 July 6, 1992
July 20, 1992 p. 23,842 No. 12,725 1992 34,333 August 4, 1992
April 7, 1994 p. 8,260 No. 6,805 1994 34,852 April 29, 1994
October 21, 1994 p. 25,747 No. 20,928 1994 35,024 November 24,
1994
May 14, 1997 p. 12,154 No. 9,722 1997 35,773 May 24, 1997
October 13, 2005 p. 38,425 No. 27,337 2005 38,291 October 20,
2005October 3, 2006 p. 40,703 No. 28,935 2006 38,583 October 7, 2006
May 11, 2007 p. 20,217 No. 14,744 2007 38,771 May 25, 2007
April 14, 2011 p. 20,660 No. 15,673 2011 39,942 April 21, 2011
November 6, 2013 p. 56,676 No. 56,768 2013 40,708 November 16,
2013
May 7, 2014 p. 34,602 No. 21,647 2014 40,858 May 16, 2014
November 24, 2015 p. 90,126 No. 52,719 2015 41,320 November 30,
2015

137
PA
RQ
UE
AR
AU
CO
IN
TE
GR
AT
ED
RE
PO
RT
20
20
GOVERNANCEAND COMMUNITYINTRODUCTION ABOUT US
ECONOMIC PERFORMANCE
ENVIRONMENTAL PERFORMANCE
SOCIAL PERFORMANCE
ADDITIONAL INFORMATION
FINANCIAL INFORMATION
2020 by the numbers Corporate information About this integrated report External assurance and statement of responsibilityGRI content index and General Character Standard No. 30
Property
Land surface
area(m2)
Location District/City Country
Arauco Chillán 5,179 Chillán ChileArauco Coronel 66,463 Coronel ChileArauco El Bosque 54,090 El Bosque, Santiago Chile
Arauco Express Antofagasta 13,776 Antofagasta Chile
Arauco Express Calama 3,671 Calama ChileArauco Express Ciudad Empresarial 5,302 Huechuraba, Santiago ChileArauco Express Ciudad Empresarial II 15,310 Huechuraba, Santiago ChileArauco Express Colón 1,480 Las Condes, Santiago ChileArauco Express Coquimbo 10,388 Coquimbo ChileArauco Express El Carmen de Huechuraba 2,027 Huechuraba, Santiago ChileArauco Express Irarrázaval 2,444 Ñuñoa, Santiago ChileArauco Express La Reina 2,986 La Reina, Santiago ChileArauco Express Luis Pasteur 1,662 Vitacura, Santiago ChileArauco Express Manuel Montt 1,646 Providencia, Santiago ChileArauco Express Pajaritos 14,429 Maipú, Santiago ChileArauco Express Palmares 1,627 Viña del Mar ChileArauco Express El Peñón 6,406 Puente Alto, Santiago ChileArauco Express Chicauma 7,540 Lampa, Santiago ChileArauco Maipú 141,413 Maipú, Santiago ChileArauco Premium Outlet Buenaventura 38,272 Quilicura, Santiago ChileArauco Premium Outlet Coquimbo 41,778 Coquimbo ChileArauco Quilicura 54,432 Quilicura, Santiago ChileArauco San Antonio 8,723 San Antonio Chile
Property
Land surface
area(m2)
Location District/City Country
Parque Angamos 14,753 Antofagasta ChileParque Arauco Kennedy 86,767 Las Condes, Santiago ChileEl Quinde Ica 53,152 Ica PeruInOutlet Premium Lurín 56,638 Lurín, Lima PeruPlaza Jesús María 4,707 Jesús María, Lima Peru
MegaPlaza Cañete 27,343 San Vicente de Cañete, Cañete Peru
MegaPlaza Express Barranca 4,601 Barranca PeruMegaPlaza Express Chincha 32,776 Chincha Alta Peru
MegaPlaza Express Jaén 51,577 Jaén Peru
MegaPlaza Express Villa (Chorrillos) 10,230 Chorrillos, Lima PeruMegaPlaza Express Villa El Salvador 8,013 Villa El Salvador, Lima PeruMegaPlaza Huaral 31,228 Huaral PeruMegaPlaza Norte 138,312 Independencia, Lima PeruMegaPlaza Pisco 52,414 Pisco PeruParque Lambramani 21,050 Arequipa PeruViamix Chorrillos 3,224 Chorrillos, Lima PeruViamix Colonial 2,945 Downtown Lima, Lima PeruViamix Malvinas 1,284 Downtown Lima, Lima PeruArauco Premium Outlet Bogotá 137,729 Sopó, Bogotá ColombiaParque Arboleda 15,429 Pereira Colombia
Parque Caracolí 12,459 Bucaramanga Colombia
Parque La Colina 53,700 Suba, Bogotá Colombia
Activities and businesses
6.2 Corporate information
properties anD facilities

138
PA
RQ
UE
AR
AU
CO
IN
TE
GR
AT
ED
RE
PO
RT
20
20
GOVERNANCEAND COMMUNITYINTRODUCTION ABOUT US
ECONOMIC PERFORMANCE
ENVIRONMENTAL PERFORMANCE
SOCIAL PERFORMANCE
ADDITIONAL INFORMATION
FINANCIAL INFORMATION
2020 by the numbers Corporate information About this integrated report External assurance and statement of responsibilityGRI content index and General Character Standard No. 30
Activities and businesses
6.2 Corporate information
leaseD properties
Property
Land surface
area(m2) Location Country End of lease
Arauco Chillán 2,653 Chillán Chile 2042
Arauco Estación 238,860 Estación Central, Santiago Chile 2042
Arauco Express Las Brujas 7,042 La Reina, Santiago Chile 2043Arauco Express Recoleta 5,347 Recoleta, Santiago Chile 2044
Arauco Premium Outlet Curauma 30,943 Curauma, Valparaíso Chile 2043
Arauco Premium Outlet San Pedro 35,003 San Pedro, Concepción Chile 2053El Quinde Cajamarca 38,118 Cajamarca Peru 2061InOutlet Faucett 9,364 Callao, Lima Peru 2050Larcomar 44,675 Miraflores, Lima Peru 2055MegaPlaza Chimbote 40,443 Chimbote Peru 2040
MegaPlaza Villa El Salvador II 40,796 Villa El Salvador, Lima Peru 2055
138

139
PA
RQ
UE
AR
AU
CO
IN
TE
GR
AT
ED
RE
PO
RT
20
20
GOVERNANCEAND COMMUNITYINTRODUCTION ABOUT US
ECONOMIC PERFORMANCE
ENVIRONMENTAL PERFORMANCE
SOCIAL PERFORMANCE
ADDITIONAL INFORMATION
FINANCIAL INFORMATION
2020 by the numbers Corporate information About this integrated report External assurance and statement of responsibilityGRI content index and General Character Standard No. 30
Activities and businesses
6.2 Corporate information
External auditorsParque Arauco periodically rotates external auditors. We also conduct an annual bidding process to select our external auditor. Deloitte has been the company’s external auditor since 2015.
Brands and patentsParque Arauco and related trademarks have been registered with the Chilean National Institute of Industrial Property. Registered trademarks are valid for ten years, renewable indefinitely.
CustomersParque Arauco’s direct customers are primarily the tenants leasing stores. However, its indirect customers—the general public visiting the shopping centers—are also fundamental to its operations. In 2020, no customer individually represented 10% or more of the company’s revenue.
SuppliersNo suppliers individually represented more than 10% of the company’s purchases in 2020.
TenantsOur 10 largest tenants represent just 19% of Parque Arauco's total revenue.
139

140
PA
RQ
UE
AR
AU
CO
IN
TE
GR
AT
ED
RE
PO
RT
20
20
GOVERNANCEAND COMMUNITYINTRODUCTION ABOUT US
ECONOMIC PERFORMANCE
ENVIRONMENTAL PERFORMANCE
SOCIAL PERFORMANCE
ADDITIONAL INFORMATION
FINANCIAL INFORMATION
2020 by the numbers Corporate information About this integrated report External assurance and statement of responsibilityGRI content index and General Character Standard No. 30
Shareholders and stock performance
6.2 Corporate information
twelVe largest shareholDers
As of December 31, 2020, we have 1,111 shareholders.
1. Figures are rounded to the first decimal place.
Name
Number of shares
subscribed
Number of shares
paid%
Ownership Inmobiliaria Atlantis S.A. 230,707,974 230,707,974 25.47%
Santander Corredores De Bolsa Limitada 66,852,005 66,852,005 7.38%
Bolsa de Comercio de Santiago – Bolsa de Valores 60,382,993 60,382,993 6.67%
Banco Santander on behalf of foreign investors 40,667,860 40,667,860 4.49%
Banco de Chile on behalf of State Street 38,519,306 38,519,306 4.25%
Banco de Chile on behalf of non-resident third parties 30,046,055 30,046,055 3.32%
Industrias Combinadas Gaio Peirano S.A. 29,790,000 29,790,000 3.29%
Bolsa Electrónica de Chile – Bolsa de Valores 21,119,752 21,119,752 2.33%
AFP Habitat S.A. for Pension Fund C 20,228,475 20,228,475 2.23%
Inversiones Ranco Uno S.A. 19,424,114 19,424,114 2.14%
BCI Corredores de Bolsa S.A. 13,992,140 13,992,140 1.54%
AFP Cuprum S.A. for Pension Fund C 13,780,383 13,780,3831.52%
140

141
PA
RQ
UE
AR
AU
CO
IN
TE
GR
AT
ED
RE
PO
RT
20
20
GOVERNANCEAND COMMUNITYINTRODUCTION ABOUT US
ECONOMIC PERFORMANCE
ENVIRONMENTAL PERFORMANCE
SOCIAL PERFORMANCE
ADDITIONAL INFORMATION
FINANCIAL INFORMATION
2020 by the numbers Corporate information About this integrated report External assurance and statement of responsibilityGRI content index and General Character Standard No. 30
Shareholders and stock performance
6.2 Corporate information
1. Inversiones Cabildo SpA, which controls and holds 67.15% of Inmobiliaria Atlantis S.A. has, in turn, the following shareholders and final controllers:a. Inversiones Delfín Uno S.A., holder of 2.13% of Inversiones Cabildo SpA, the final controller of which is Mrs. Isabel Somavía Dittborn, Chilean National ID number: 3.221.015-5;b. Inversiones Delfín Dos S.A., holder of 2.13% of Inversiones Cabildo SpA, the final controller of which is the estate of the late Mr. José Said Saffie, Chilean National ID number: 2.305.902-9;c. Inversiones Delfín Tres SpA. holder of 38.30% of Inversiones Cabildo SpA, the final controller of which is Mr. Salvador Said Somavía, Chilean National ID number: 6.379.626-3;d. Inversiones Delfín Cuatro SpA.. holder of 19.15% of Inversiones Cabildo SpA, the final controller of which is Mrs. Isabel Said Somavía, Chilean National ID number: 6.379.627-1;e. Inversiones Delfín Cinco SpA., holder of 19.15% of Inversiones Cabildo SpA, the final controller of which is Mrs. Constanza Said Somavía, Chilean National ID number: 6.379.628-K.f. Inversiones Delfín Seis SpA,. holder of 19.15% interest in Inversiones Cabildo SpA, the final controller of which is Mrs. Loreto Said Somavía, Chilean National ID number: 6.379.629-8.
2. Inversiones Jardines del Bosque Limitada, holder of an 18.187% interest in Inmobiliaria Atlantis S.A. Its majority shareholder is Inversiones Orlí Limitada, which holds 70.003% of rights. Its final controllers are Mr. Orlando Sáenz Rojas, Chilean National ID number: 3.599.669-9, and Mrs. Liliana Rica López, Chilean National ID number: 3.870.985-2.
3. Inversiones Innova S.A., holder of a 5.617% interest in Inmobiliaria Atlantis S.A. The Eluchans Barreda family, represented by Mr. José Domingo Eluchans Urenda, Chilean National ID number: 6.474.632-4, are the shareholders and final controllers.
4. Inversiones E.U. S.A., holder of a 2.636% interest in Inmobiliaria Atlantis S.A. Its shareholders are Mrs. Florencia Eluchans Urenda, Chilean National ID number: 4.695.623-0; Mrs. Celia Eluchans Urenda, Chilean National ID number: 4.727.634-9; Mrs. Marcela Eluchans Urenda, Chilean National ID number: 6.065.798-K; Mrs. Ana María Eluchans Urenda, Chilean National ID number: 6.374.216-3; Mrs. Andrea Eluchans Urenda, Chilean National ID number: 6.374.217-1; Mrs. María Angélica Eluchans Urenda, Chilean National ID number: 6.065.725-4, and Mr. Edmundo Eluchans Urenda, Chilean National ID number: 4.721.073-9.
5. Palmas Lo Curro S.A., holder of a 1.671% interest in Inmobiliaria Atlantis S.A., the final controller of which is the estate of the late Mr. José Said Saffie. 6. Inversiones Carma SpA, holder of a 0.310% interest in Inmobiliaria Atlantis S.A. The Eluchans Aninat family, represented by Mr. José Domingo Eluchans Urenda, Chilean National ID number: 6.474.632-4, are the shareholders.
7. Inversiones Bravo Eluchans Uno Limitada, holder of a 0.521% interest in Inmobiliaria Atlantis S.A. The Bravo Eluchans family, represented by Mr. José Domingo Eluchans Urenda, Chilean National ID number: 6.474.632-4, are the shareholders.
8. Inversiones F.E.U. S.A., holder of a 0.463% interest in Inmobiliaria Atlantis S.A. The Eluchans Urenda family, represented by Mr. José Domingo Eluchans Urenda, Chilean National ID number: 6.474.632-4, are the shareholders.
Shareholders and controllersControlling Group of Parque Arauco S.A. As of December 31, 2020
As of December 31, 2020, Parque Arauco S.A. is controlled by Inmobiliaria Atlantis S.A. (Taxpayer ID number: 76.089.588-1), which holds 25.47% of all Parque Arauco S.A. shares issued with voting rights. The final controller is the estate of the late Mr. José Said Saffie.
There is no shareholder agreement between the shareholders of thecontrolling group.
The shareholders of Inmobiliaria Atlantis S.A. and final controllers of those shareholders are as follows:

142
PA
RQ
UE
AR
AU
CO
IN
TE
GR
AT
ED
RE
PO
RT
20
20
GOVERNANCEAND COMMUNITYINTRODUCTION ABOUT US
ECONOMIC PERFORMANCE
ENVIRONMENTAL PERFORMANCE
SOCIAL PERFORMANCE
ADDITIONAL INFORMATION
FINANCIAL INFORMATION
2020 by the numbers Corporate information About this integrated report External assurance and statement of responsibilityGRI content index and General Character Standard No. 30
Shareholders and stock performance
6.2 Corporate information
9. Inversiones C.E.U. S.A., holder of a 0.509% interest in Inmobiliaria Atlantis S.A. The Eluchans Urenda family, represented by Mr. José Domingo Eluchans Urenda, Chilean National ID number: 6.474.632-4, are the shareholders.
10. Inversiones A.E.U. S.A., holder of a 0.54% interest in Inmobiliaria Atlantis S.A. The Eluchans Urenda family, represented by Mr. José Domingo Eluchans Urenda, Chilean National ID number: 6.474.632-4, are the shareholders.
11. Inversiones M.A.E.U. S.A., holder of a 0.505% interest in Inmobiliaria Atlantis S.A. The Eluchans Urenda family, represented by Mr. José Domingo Eluchans Urenda, Chilean National ID number: 6.474.632-4, are the shareholders.
12. Inversiones Ana María Eluchans Urenda E.I.R.L., holder of a 0.505% interest in Inmobiliaria Atlantis S.A. The Eluchans Urenda family, represented by Mr. José Domingo Eluchans Urenda, Chilean National ID number: 6.474.632-4, are the shareholders.
13 Inversiones Innova Limitada, holder of a 0.00001% interest in Inmobiliaria Atlantis S.A. The Eluchans Urenda family, represented by Mr. José Domingo Eluchans Urenda, Chilean National ID number: 6.474.632-4, are the shareholders.
14. Sociedad de Inversiones E.B. Limitada, holder of a 1.383% interest in Inmobiliaria Atlantis S.A. The Eluchans Barreda family, represented by Mr. José Domingo Eluchans Urenda, Chilean National ID number: 6.474.632-4, are the shareholders.
Equity MCLP$Capital issued 423,575,312
Retained earnings 569,613,458
Share premium 289,355
Other reserves -15,208,644
Non-controlling interest 109,355,009
Total equity 1,087,624,492

143
PA
RQ
UE
AR
AU
CO
IN
TE
GR
AT
ED
RE
PO
RT
20
20
GOVERNANCEAND COMMUNITYINTRODUCTION ABOUT US
ECONOMIC PERFORMANCE
ENVIRONMENTAL PERFORMANCE
SOCIAL PERFORMANCE
ADDITIONAL INFORMATION
FINANCIAL INFORMATION
2020 by the numbers Corporate information About this integrated report External assurance and statement of responsibilityGRI content index and General Character Standard No. 30
Shareholders and stock performance
6.2 Corporate information
Series of sharesParque Arauco S.A. issues single-series shares.
Dividend policyOur dividend policy mandates distribution of at least 30% of distributable net profits each year.
Market informationParque Arauco S.A. shares are listed on Santiago Exchange and the Chilean Electronic Exchange.
Shares
Dividend No.Dividenddistribution date
Amount paid per share CLP$
Charged to year
18 05.06.08 9.5 2007
19 05.12.09 9.5 2008
20 05.05.10 29 2009
21 05.04.11 39 2010
22 05.10.12 27 2011
23 05.10.13 27 2012
24 05.14.14 27 2013
25 05.13.15 30 2014
26 05.10.16 30 2015
27 05.04.17 32 2016
28 04.26.18 35 2017
29 05.15.19 39 2018
30 05.06.20 25 2019
PeriodNumber of shares traded
TotalCLP$
Average price per share CLP$
First quarter 109,096,111 148,081,568,299 1,357
Second quarter 131,344,766 179,405,849,274 1,366
Third quarter 112,145,379 147,233,803,163 1,313
Fourth quarter 127,922,745 135,371,066,407 1,058
PeriodNumber of shares traded
TotalCLP$
Average price per share CLP$
First quarter 1,624,500 2,593,804,122 1,597
Second quarter 2,848,092 4,018,821,242 1,411
Third quarter 1,793,341 2,293,802,130 1,279
Fourth quarter 2,309,024 2,585,839,520 1,120
Ticker: PARAUCOShares outstanding as of year-end 2020: 905,715,882Market capitalization (MCLP$): 1,053,348Closing price per share (CLP$): 1,163
santiago exchange
chilean electronic stock exchange
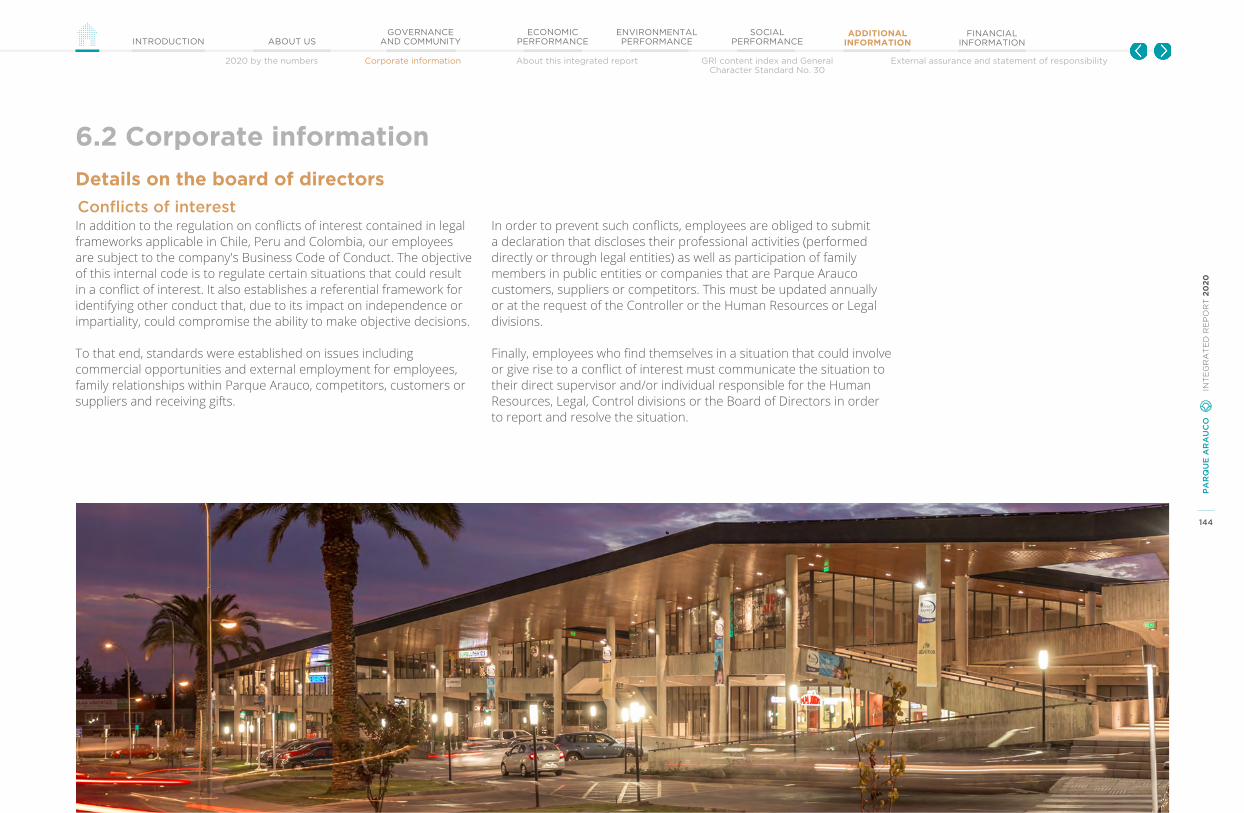
144
PA
RQ
UE
AR
AU
CO
IN
TE
GR
AT
ED
RE
PO
RT
20
20
GOVERNANCEAND COMMUNITYINTRODUCTION ABOUT US
ECONOMIC PERFORMANCE
ENVIRONMENTAL PERFORMANCE
SOCIAL PERFORMANCE
ADDITIONAL INFORMATION
FINANCIAL INFORMATION
2020 by the numbers Corporate information About this integrated report External assurance and statement of responsibilityGRI content index and General Character Standard No. 30
Details on the board of directors
6.2 Corporate information
In addition to the regulation on conflicts of interest contained in legal frameworks applicable in Chile, Peru and Colombia, our employees are subject to the company's Business Code of Conduct. The objective of this internal code is to regulate certain situations that could result in a conflict of interest. It also establishes a referential framework for identifying other conduct that, due to its impact on independence or impartiality, could compromise the ability to make objective decisions.
To that end, standards were established on issues including commercial opportunities and external employment for employees, family relationships within Parque Arauco, competitors, customers or suppliers and receiving gifts.
In order to prevent such conflicts, employees are obliged to submit a declaration that discloses their professional activities (performed directly or through legal entities) as well as participation of family members in public entities or companies that are Parque Arauco customers, suppliers or competitors. This must be updated annually or at the request of the Controller or the Human Resources or Legal divisions.
Finally, employees who find themselves in a situation that could involve or give rise to a conflict of interest must communicate the situation to their direct supervisor and/or individual responsible for the Human Resources, Legal, Control divisions or the Board of Directors in order to report and resolve the situation.
Conflicts of interest

145
PA
RQ
UE
AR
AU
CO
IN
TE
GR
AT
ED
RE
PO
RT
20
20
GOVERNANCEAND COMMUNITYINTRODUCTION ABOUT US
ECONOMIC PERFORMANCE
ENVIRONMENTAL PERFORMANCE
SOCIAL PERFORMANCE
ADDITIONAL INFORMATION
FINANCIAL INFORMATION
2020 by the numbers Corporate information About this integrated report External assurance and statement of responsibilityGRI content index and General Character Standard No. 30
Board compensation
6.2 Corporate information
20193 20203
Name Chilean National ID
Annual stipend
Directors’ Committee
Annual stipend
Directors’ Committee
Guillermo Said Yarur 6.191.544-3 41,761 21,716 43,018 22,369
José Domingo Eluchans Urenda 6.474.632-4 41,761 - 43,018 -
José Said Saffie1 2.305.902-9 83,521 - 50,017 -
Luis Hernán Paúl Fresno 7.289.965-2 41,761 21,716 43,018 22,369
Orlando Sáenz Rojas 3.599.669-9 41,761 - 43,018 -
Fernando Massú Taré 6.783.826-2 27,981 - 43,018 -
Rodrigo Muñoz Muñoz 7.040.050-2 27,981 - 43,018 -
Ana Beatriz Holuigue Barros 5.717.729-2 27,981 14,550 43,018 22,369
Salvador Said Somavía 6.379.626-3 41,761 - 50,017
Juan Carlos Lobos Pérez2 4.567.869-5 13,780 - - -
Rafael Aldunate Valdés2 5.193.449-0 13,780 7,166 - -
René Abumohor Touma2 3.065.693-8 13,780 - - -
Total compensation 417,607 65,147 401,159 67,108
At the Ordinary Shareholders’ Meeting on April 23, 2020, the shareholders agreed to set board compensation at UF 125 per director and UF 250 for the Chairman. An additional stipend of UF 65/month was assigned to members of the Directors' Committee.
1. José Said Saffie was a Parque Arauco Board member until July 23, 2020. May he rest in peace. 2. Juan Carlos Lobos Pérez, Rafael Aldunate Valdés and René Abumohor Touma were members of the Parque Arauco Board of Directors until April 26, 2019.3. In thousands of pesos
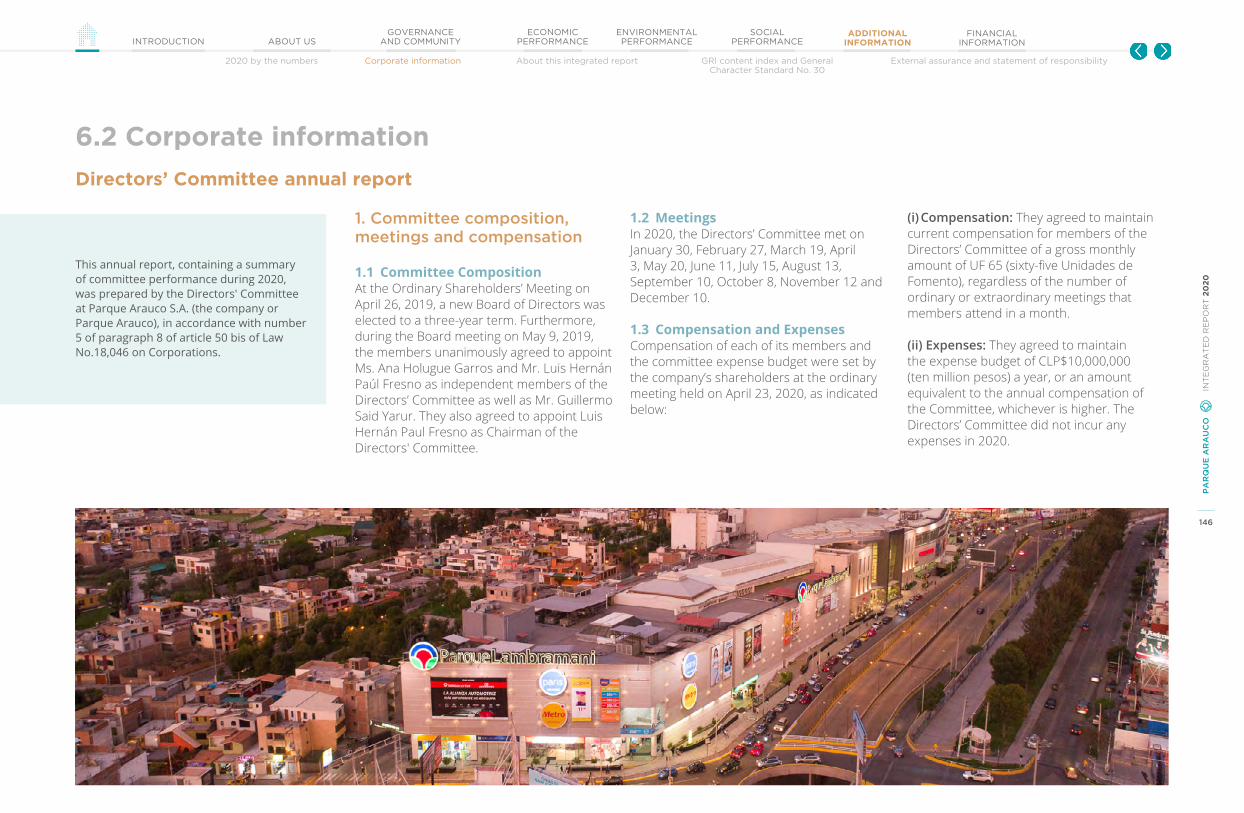
146
PA
RQ
UE
AR
AU
CO
IN
TE
GR
AT
ED
RE
PO
RT
20
20
GOVERNANCEAND COMMUNITYINTRODUCTION ABOUT US
ECONOMIC PERFORMANCE
ENVIRONMENTAL PERFORMANCE
SOCIAL PERFORMANCE
ADDITIONAL INFORMATION
FINANCIAL INFORMATION
2020 by the numbers Corporate information About this integrated report External assurance and statement of responsibilityGRI content index and General Character Standard No. 30
Directors’ Committee annual report
6.2 Corporate information
This annual report, containing a summary of committee performance during 2020, was prepared by the Directors' Committee at Parque Arauco S.A. (the company or Parque Arauco), in accordance with number 5 of paragraph 8 of article 50 bis of Law No.18,046 on Corporations.
1.2 MeetingsIn 2020, the Directors’ Committee met on January 30, February 27, March 19, April 3, May 20, June 11, July 15, August 13, September 10, October 8, November 12 and December 10.
1.3 Compensation and ExpensesCompensation of each of its members and the committee expense budget were set by the company’s shareholders at the ordinary meeting held on April 23, 2020, as indicated below:
(i) Compensation: They agreed to maintain current compensation for members of the Directors’ Committee of a gross monthly amount of UF 65 (sixty-five Unidades de Fomento), regardless of the number of ordinary or extraordinary meetings that members attend in a month.
(ii) Expenses: They agreed to maintain the expense budget of CLP$10,000,000 (ten million pesos) a year, or an amount equivalent to the annual compensation of the Committee, whichever is higher. The Directors’ Committee did not incur any expenses in 2020.
1. Committee composition, meetings and compensation
1.1 Committee CompositionAt the Ordinary Shareholders’ Meeting on April 26, 2019, a new Board of Directors was elected to a three-year term. Furthermore, during the Board meeting on May 9, 2019, the members unanimously agreed to appoint Ms. Ana Holugue Garros and Mr. Luis Hernán Paúl Fresno as independent members of the Directors’ Committee as well as Mr. Guillermo Said Yarur. They also agreed to appoint Luis Hernán Paul Fresno as Chairman of the Directors' Committee.
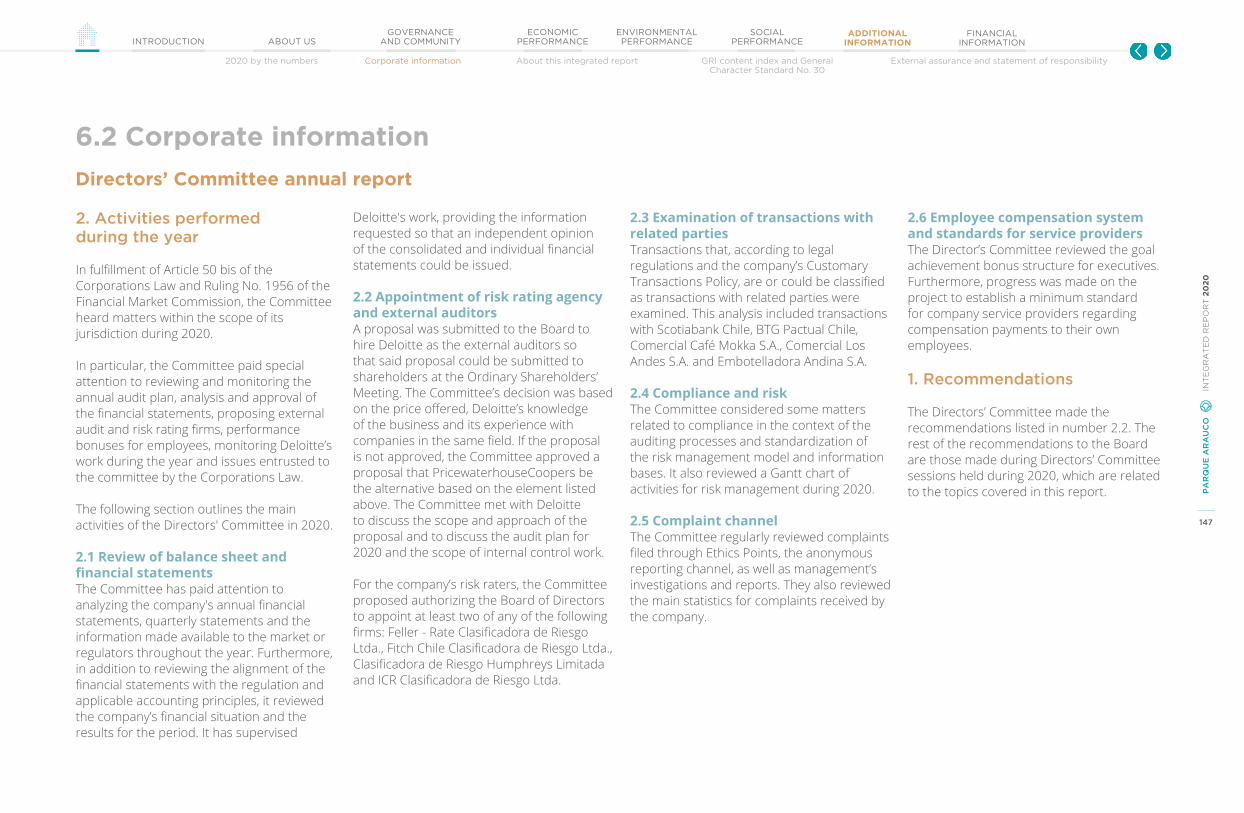
147
PA
RQ
UE
AR
AU
CO
IN
TE
GR
AT
ED
RE
PO
RT
20
20
GOVERNANCEAND COMMUNITYINTRODUCTION ABOUT US
ECONOMIC PERFORMANCE
ENVIRONMENTAL PERFORMANCE
SOCIAL PERFORMANCE
ADDITIONAL INFORMATION
FINANCIAL INFORMATION
2020 by the numbers Corporate information About this integrated report External assurance and statement of responsibilityGRI content index and General Character Standard No. 30
Directors’ Committee annual report
6.2 Corporate information
2. Activities performed during the year
In fulfillment of Article 50 bis of the Corporations Law and Ruling No. 1956 of the Financial Market Commission, the Committee heard matters within the scope of its jurisdiction during 2020.
In particular, the Committee paid special attention to reviewing and monitoring the annual audit plan, analysis and approval of the financial statements, proposing external audit and risk rating firms, performance bonuses for employees, monitoring Deloitte’s work during the year and issues entrusted to the committee by the Corporations Law.
The following section outlines the main activities of the Directors' Committee in 2020.
2.1 Review of balance sheet and financial statementsThe Committee has paid attention to analyzing the company's annual financial statements, quarterly statements and the information made available to the market or regulators throughout the year. Furthermore, in addition to reviewing the alignment of the financial statements with the regulation and applicable accounting principles, it reviewed the company’s financial situation and the results for the period. It has supervised
Deloitte's work, providing the information requested so that an independent opinion of the consolidated and individual financial statements could be issued.
2.2 Appointment of risk rating agency and external auditorsA proposal was submitted to the Board to hire Deloitte as the external auditors so that said proposal could be submitted to shareholders at the Ordinary Shareholders’ Meeting. The Committee’s decision was based on the price offered, Deloitte’s knowledge of the business and its experience with companies in the same field. If the proposal is not approved, the Committee approved a proposal that PricewaterhouseCoopers be the alternative based on the element listed above. The Committee met with Deloitte to discuss the scope and approach of the proposal and to discuss the audit plan for 2020 and the scope of internal control work.
For the company’s risk raters, the Committee proposed authorizing the Board of Directors to appoint at least two of any of the following firms: Feller - Rate Clasificadora de Riesgo Ltda., Fitch Chile Clasificadora de Riesgo Ltda., Clasificadora de Riesgo Humphreys Limitada and ICR Clasificadora de Riesgo Ltda.
2.3 Examination of transactions with related partiesTransactions that, according to legal regulations and the company’s Customary Transactions Policy, are or could be classified as transactions with related parties were examined. This analysis included transactions with Scotiabank Chile, BTG Pactual Chile, Comercial Café Mokka S.A., Comercial Los Andes S.A. and Embotelladora Andina S.A.
2.4 Compliance and riskThe Committee considered some matters related to compliance in the context of the auditing processes and standardization of the risk management model and information bases. It also reviewed a Gantt chart of activities for risk management during 2020.
2.5 Complaint channelThe Committee regularly reviewed complaints filed through Ethics Points, the anonymous reporting channel, as well as management’s investigations and reports. They also reviewed the main statistics for complaints received by the company.
2.6 Employee compensation system and standards for service providersThe Director’s Committee reviewed the goal achievement bonus structure for executives. Furthermore, progress was made on the project to establish a minimum standard for company service providers regarding compensation payments to their own employees.
1. Recommendations
The Directors’ Committee made the recommendations listed in number 2.2. The rest of the recommendations to the Board are those made during Directors’ Committee sessions held during 2020, which are related to the topics covered in this report.

148
PA
RQ
UE
AR
AU
CO
IN
TE
GR
AT
ED
RE
PO
RT
20
20
GOVERNANCEAND COMMUNITYINTRODUCTION ABOUT US
ECONOMIC PERFORMANCE
ENVIRONMENTAL PERFORMANCE
SOCIAL PERFORMANCE
ADDITIONAL INFORMATION
FINANCIAL INFORMATION
2020 by the numbers Corporate information About this integrated report External assurance and statement of responsibilityGRI content index and General Character Standard No. 30
Material events
6.2 Corporate information
April 3, 2020Meeting Notification Annual General MeetingParque Arauco's Board of Directors agreed to convene the shareholders for an Ordinary Shareholder’s Meeting on April 23, 2020, to submit a series of topics for their consideration. Based on the current situation, in response to the COVID-19 pandemic, the Board agreed to implement electronic mechanisms to allow shareholders to attend and participate in shareholders' meetings remotely.
Also, the Board agreed to propose at the aforementioned Ordinary Shareholder’s Meeting, payment of a dividend of CLP$25 per share charged to 2019 earnings.
Finally, the Board of Directors also authorized the Chairman, Executive Vice President and/or the Corporate Legal Manager to perform all the necessary duties related to summons, communications and publications.
April 22, 2020 First Parque Arauco S.A. Bond Issuance of 2020Parque Arauco S.A. placed bonds through Santiago Exchange corresponding to the X Series. The placement agents were Banchile Corredores de Bolsa and Santander Corredores de Bolsa. The Series X bonds were placed for a total of UF 2 million charged to line No. 803. The bond is due at maturity, on February 20, 2025, and has a placement rate of 2.2% per annum. It is not yet possible to quantify the effects of this transaction on the company’s results.
April 23, 2020Ordinary Shareholders’ Meeting AgreementsThe Parque Arauco S.A Annual General Meeting was held with a quorum of 85.53% of the company’s subscribed and paid shareholders. At the Ordinary Shareholders’ Meeting, the shareholders did the following: (1) approved the annual report, balance sheet, financial statements and independent auditors’ report from Deloitte Auditores y Consultores Ltda. for the year ended December 31, 2019; (2) appointed Deloitte Auditores y Consultores Ltda. as the External Auditing Firm; (3) authorized the Board to
appoint at least two Risk Rating Agencies considering a group of firms; (4) heard a presentation on transactions regulated by the Corporations Law Title XVI; (5) heard reports on the activities and expenditures of the Directors’ Committee for 2019 and approved compensation and proposed spending for that entity for 2020; (6) designated “El Diario Financiero” as the newspaper for corporate publications; (7) agreed to distribute profits in the form of a final dividend equivalent to CLP$25 per share; and (8) approved Board compensation for 2020 and Board expenditures for 2019.
June 18, 2020Second Parque Arauco S.A. Bond Issuance of 2020Parque Arauco S.A. placed bonds through Santiago Exchange corresponding to the AA Series. The AA Series bonds were placed for a total of UF 5 million, maturing on December 5, 2029, with a placement rate of 1.5% per annum, charged to line No. 1024. It is not yet possible to quantify the effects of this
transaction on the company’s results.
July 24, 2020Passing of Mr. José Said SaffieThe company communicates the passing of our beloved Chairman of the Board, Mr. José Said Saffie.
November 12, 2020Appointment of Mr. Salvador Said Somavía as ChairmanFollowing the passing of Mr. José Said Saffie, during the Board meeting held on this date, the Parque Arauco S.A. Board unanimously agreed to appoint Mr. Salvador Said Somavía as its Chairman. The appointment took effect on that date.
Extracts of information communicated as material events to the Chilean Financial Market Commission in 2020.

149
PA
RQ
UE
AR
AU
CO
IN
TE
GR
AT
ED
RE
PO
RT
20
20
GOVERNANCEAND COMMUNITYINTRODUCTION ABOUT US
ECONOMIC PERFORMANCE
ENVIRONMENTAL PERFORMANCE
SOCIAL PERFORMANCE
ADDITIONAL INFORMATION
FINANCIAL INFORMATION
2020 by the numbers Corporate information About this integrated report External assurance and statement of responsibilityGRI content index and General Character Standard No. 30
Management compensation
6.2 Corporate information
We have established a proportion of fixed and variable compensation for the Executive Vice President and senior executives.
As such, the total amount of compensation received by senior executives this year was MCLP$3,761,256, of which 30% was variable compensation. In 2019, total compensation was MCLP$4,453,613, of which 37% was variable compensation.
The 2020 amount is lower than the 2019 figure because, as part of our response to the economic impacts of COVID-19, we temporarily adjusted senior executives salaries, reducing their monthly compensation proportionally to their level of responsibility between 5% and 35%.
In order to develop the company’s strategic objectives—growth, profitability and sustainability—we have a compensation and incentive model for our staff. Our compensation policy allows us to stay competitive with the market, while following our strategy of attracting, retaining and motivating the people who work at the company.
Long-termincentives
We have a stock options plan for senior executives, which is described below. The company earmarked 7,800,000 shares issued on the occasion of the capital increase that occurred on November 19, 2015, for executive compensation plans. The exercise price for these options was set at UF 0.0469. Of the shares offered initially to the 28 executives covered by the plan, 3,558,666 were subscribed; the other 4,241,334 remained unsubscribed. The unsubscribed shares were written off in the fourth quarter of 2020.
Policies on investing in shares and use of insider information
The Business Code of Conduct and Market Information Manual regulate ownership of capital interest in other companies as well as handling of insider information, respectively.
As of December 31, 2020, Parque Arauco S.A.’s senior executives do not own any direct interest in the company, except for Juan Antonio Álvarez Avendaño, who owns 2,335,180 shares, equivalent to 0.258% of the company; Nicolás Bennet Nualart, who owns 27,572 shares, equivalent to 0.003% of the company; Duncan Grob Urzúa, who owns 16,400 shares, equivalent to 0.002% of the company; Rodrigo Bravo Toro, who owns 25,203 shares, equivalent to 0.003% of the company and Carolina Galletti Vernazzani Fuente-Alba, who owns 55,688 shares, equivalent to 0.006% of the company.
MCLP$ 3,761,256 Total compensation received by senior executives in 2020

150
PA
RQ
UE
AR
AU
CO
IN
TE
GR
AT
ED
RE
PO
RT
20
20
GOVERNANCEAND COMMUNITYINTRODUCTION ABOUT US
ECONOMIC PERFORMANCE
ENVIRONMENTAL PERFORMANCE
SOCIAL PERFORMANCE
ADDITIONAL INFORMATION
FINANCIAL INFORMATION
2020 by the numbers Corporate information About this integrated report External assurance and statement of responsibilityGRI content index and General Character Standard No. 30
Name Base salary Short-term incentives Long-term incentives
obJectiVe Attracting and retaining the best talent in order to execute the business strategy and create a work environment that motivates an exceptional team.
Annual performance bonus for meeting strategy-aligned business targets.
Aligning management priorities with the company’s long-term objectives and those that generate value for the company’s shareholders.
measurement performance
Responsibility for objectives associated with each position, reporting to the next hierarchical level.
Business indicators associated with each functional area.
Performance evaluations, which are progressively being included throughout the entire company.
Compliance with the company’s financial indicator (EBITDA).
Compliance with the company’s Business Code of Conduct.
Change in the company’s stock price over a set performance evaluation period.
The performance evaluation horizon for the current long-term incentive plan exceeds three and a half years.
scope All company personnel. All company personnel. Executive Vice President and senior executives (individuals down to the organization’s second-tier of leadership).
implementation Competitive base salaries relative to the market in each country.
All company employees are eligible for annual performance bonuses.
Parque Arauco S.A. stock options.
components of compensation at parque arauco
6.2 Corporate information
Management compensation

151
PA
RQ
UE
AR
AU
CO
IN
TE
GR
AT
ED
RE
PO
RT
20
20
GOVERNANCEAND COMMUNITYINTRODUCTION ABOUT US
ECONOMIC PERFORMANCE
ENVIRONMENTAL PERFORMANCE
SOCIAL PERFORMANCE
ADDITIONAL INFORMATION
FINANCIAL INFORMATION
2020 by the numbers Corporate information About this integrated report External assurance and statement of responsibilityGRI content index and General Character Standard No. 30
Chilean National ID Name Category Position Date
appointed
10.087.763-5 Miguel Núñez Sfeir Senior Executive Corporate Audit Manager and Controller 10/1/2020
0-E (Foreigner) Alejandro Camino Nuñez Senior Executive Chief Executive Officer, Peru Division 12/11/ 2019
14.122.847-1 Nicolás Mundi Valdés Senior Executive Commercial Manager, Chile Division 07/1/2019
10.662.089-K Eduardo Pérez Marchant Senior Executive Chief Executive Officer, Parque Arauco Internacional S.A. 02/1/2019
0-E (Foreigner) Diego Bermúdez Farías Senior Executive Chief Executive Officer, Colombia Division 02/1/2019
0-E (Foreigner) Juan Miguel Pinto Andrade Senior Executive Shopping Center Manager, Colombia Division 02/1/2019
0-E (Foreigner) Cesar Morales Guerra Senior Executive Customer Experience Manager, Peru Division 10/1/2018
9.908.134-1 Francisco Javier Moyano Pérez Senior Executive Corporate Finance Manager 02/26/2018
0-E (Foreigner) Carolina Bermúdez Rueda Senior Executive Administration and Finance Manager, Colombia Division 11/20/2017
13.829.061-1 Nicolás Bennett Nualart Senior Executive Shopping Center and Projects Manager, Chile Division 11/1/2016
14.039.604-4 Andrés Neely Erdos Senior Executive Corporate Controller 09/20/2016
10.777.541-2 Duncan Grob Urzúa Senior Executive Corporate Legal Manager 02/09/2015
10.585.375-0 Claudio Chamorro Carrizo Senior Executive Corporate Chief Financial Officer 02/1/2013
10.036.478-6 Carolina Galletti Vernazzani Fuente-Alba Senior Executive Corporate Human Resources Manager 08/1/2012
7.033.770-3 Juan Antonio Álvarez Avendaño Chief Executive Officer Executive Vice President 11/1/2011
7.622.704-7 Andrés Torrealba Ruiz-Tagle Senior Executive Chief Executive Officer, Chile Division 01/1/2011
Corporate and business unit managers
6.2 Corporate information
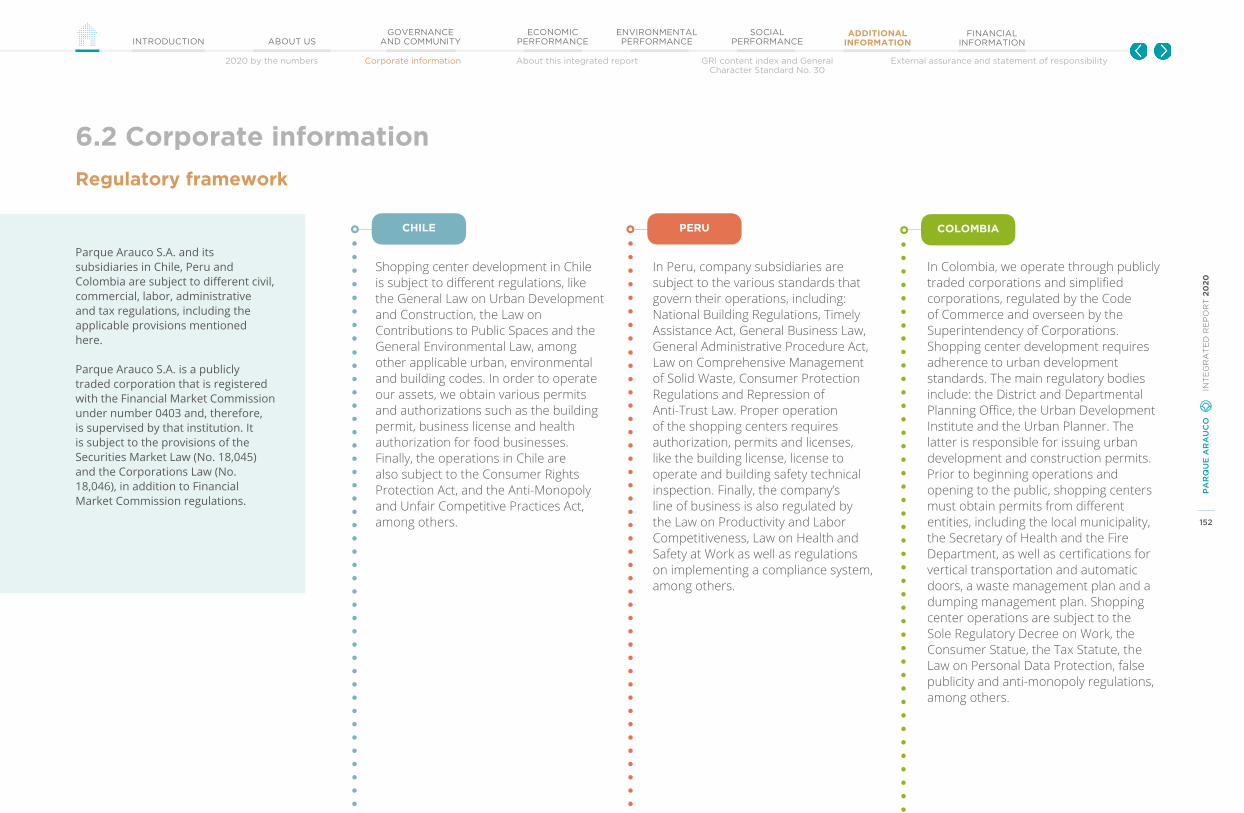
152
PA
RQ
UE
AR
AU
CO
IN
TE
GR
AT
ED
RE
PO
RT
20
20
GOVERNANCEAND COMMUNITYINTRODUCTION ABOUT US
ECONOMIC PERFORMANCE
ENVIRONMENTAL PERFORMANCE
SOCIAL PERFORMANCE
ADDITIONAL INFORMATION
FINANCIAL INFORMATION
2020 by the numbers Corporate information About this integrated report External assurance and statement of responsibilityGRI content index and General Character Standard No. 30
Regulatory framework
6.2 Corporate information
Shopping center development in Chile is subject to different regulations, like the General Law on Urban Development and Construction, the Law on Contributions to Public Spaces and the General Environmental Law, among other applicable urban, environmental and building codes. In order to operate our assets, we obtain various permits and authorizations such as the building permit, business license and health authorization for food businesses. Finally, the operations in Chile are also subject to the Consumer Rights Protection Act, and the Anti-Monopoly and Unfair Competitive Practices Act, among others.
In Peru, company subsidiaries are subject to the various standards that govern their operations, including: National Building Regulations, Timely Assistance Act, General Business Law, General Administrative Procedure Act, Law on Comprehensive Management of Solid Waste, Consumer Protection Regulations and Repression of Anti-Trust Law. Proper operation of the shopping centers requires authorization, permits and licenses, like the building license, license to operate and building safety technical inspection. Finally, the company’s line of business is also regulated by the Law on Productivity and Labor Competitiveness, Law on Health and Safety at Work as well as regulations on implementing a compliance system, among others.
In Colombia, we operate through publicly traded corporations and simplified corporations, regulated by the Code of Commerce and overseen by the Superintendency of Corporations. Shopping center development requires adherence to urban development standards. The main regulatory bodies include: the District and Departmental Planning Office, the Urban Development Institute and the Urban Planner. The latter is responsible for issuing urban development and construction permits. Prior to beginning operations and opening to the public, shopping centers must obtain permits from different entities, including the local municipality, the Secretary of Health and the Fire Department, as well as certifications for vertical transportation and automatic doors, a waste management plan and a dumping management plan. Shopping center operations are subject to the Sole Regulatory Decree on Work, the Consumer Statue, the Tax Statute, the Law on Personal Data Protection, false publicity and anti-monopoly regulations, among others.
Parque Arauco S.A. and its subsidiaries in Chile, Peru and Colombia are subject to different civil, commercial, labor, administrative and tax regulations, including the applicable provisions mentioned here.
Parque Arauco S.A. is a publicly traded corporation that is registered with the Financial Market Commission under number 0403 and, therefore, is supervised by that institution. It is subject to the provisions of the Securities Market Law (No. 18,045) and the Corporations Law (No. 18,046), in addition to Financial Market Commission regulations.
colombiaperuchile
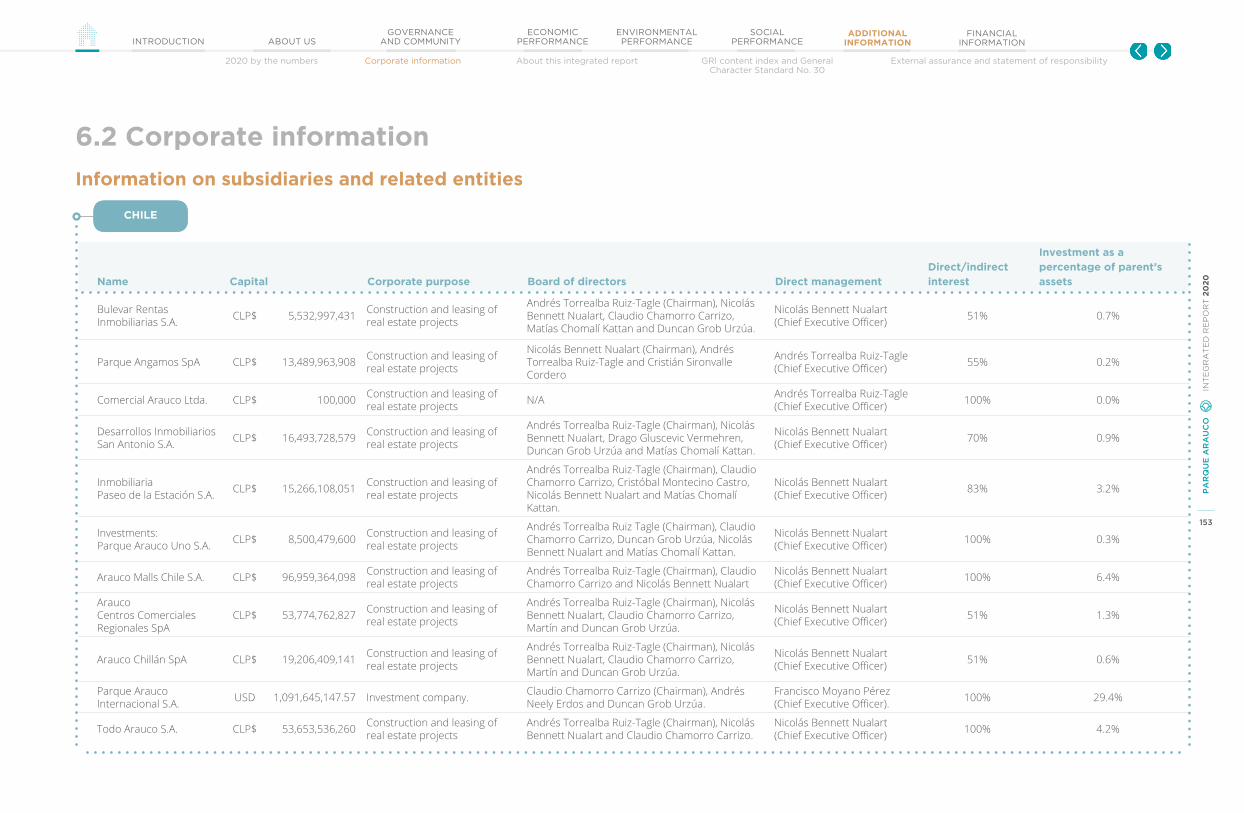
153
PA
RQ
UE
AR
AU
CO
IN
TE
GR
AT
ED
RE
PO
RT
20
20
GOVERNANCEAND COMMUNITYINTRODUCTION ABOUT US
ECONOMIC PERFORMANCE
ENVIRONMENTAL PERFORMANCE
SOCIAL PERFORMANCE
ADDITIONAL INFORMATION
FINANCIAL INFORMATION
2020 by the numbers Corporate information About this integrated report External assurance and statement of responsibilityGRI content index and General Character Standard No. 30
Information on subsidiaries and related entities
6.2 Corporate information
Name Capital Corporate purpose Board of directors Direct managementDirect/indirect interest
Investment as a percentage of parent’s assets
Bulevar Rentas Inmobiliarias S.A. CLP$ 5,532,997,431 Construction and leasing of
real estate projects
Andrés Torrealba Ruiz-Tagle (Chairman), Nicolás Bennett Nualart, Claudio Chamorro Carrizo, Matías Chomalí Kattan and Duncan Grob Urzúa.
Nicolás Bennett Nualart (Chief Executive Officer) 51% 0.7%
Parque Angamos SpA CLP$ 13,489,963,908 Construction and leasing of real estate projects
Nicolás Bennett Nualart (Chairman), Andrés Torrealba Ruiz-Tagle and Cristián Sironvalle Cordero
Andrés Torrealba Ruiz-Tagle (Chief Executive Officer) 55% 0.2%
Comercial Arauco Ltda. CLP$ 100,000 Construction and leasing of real estate projects N/A Andrés Torrealba Ruiz-Tagle
(Chief Executive Officer) 100% 0.0%
Desarrollos Inmobiliarios San Antonio S.A. CLP$ 16,493,728,579 Construction and leasing of
real estate projects
Andrés Torrealba Ruiz-Tagle (Chairman), Nicolás Bennett Nualart, Drago Gluscevic Vermehren, Duncan Grob Urzúa and Matías Chomalí Kattan.
Nicolás Bennett Nualart (Chief Executive Officer) 70% 0.9%
Inmobiliaria Paseo de la Estación S.A. CLP$ 15,266,108,051 Construction and leasing of
real estate projects
Andrés Torrealba Ruiz-Tagle (Chairman), Claudio Chamorro Carrizo, Cristóbal Montecino Castro, Nicolás Bennett Nualart and Matías Chomalí Kattan.
Nicolás Bennett Nualart (Chief Executive Officer) 83% 3.2%
Investments: Parque Arauco Uno S.A. CLP$ 8,500,479,600 Construction and leasing of
real estate projects
Andrés Torrealba Ruiz Tagle (Chairman), Claudio Chamorro Carrizo, Duncan Grob Urzúa, Nicolás Bennett Nualart and Matías Chomalí Kattan.
Nicolás Bennett Nualart (Chief Executive Officer) 100% 0.3%
Arauco Malls Chile S.A. CLP$ 96,959,364,098 Construction and leasing of real estate projects
Andrés Torrealba Ruiz-Tagle (Chairman), Claudio Chamorro Carrizo and Nicolás Bennett Nualart
Nicolás Bennett Nualart (Chief Executive Officer) 100% 6.4%
Arauco Centros Comerciales Regionales SpA
CLP$ 53,774,762,827 Construction and leasing of real estate projects
Andrés Torrealba Ruiz-Tagle (Chairman), Nicolás Bennett Nualart, Claudio Chamorro Carrizo, Martín and Duncan Grob Urzúa.
Nicolás Bennett Nualart (Chief Executive Officer) 51% 1.3%
Arauco Chillán SpA CLP$ 19,206,409,141 Construction and leasing of real estate projects
Andrés Torrealba Ruiz-Tagle (Chairman), Nicolás Bennett Nualart, Claudio Chamorro Carrizo, Martín and Duncan Grob Urzúa.
Nicolás Bennett Nualart (Chief Executive Officer) 51% 0.6%
Parque Arauco Internacional S.A. USD 1,091,645,147.57 Investment company. Claudio Chamorro Carrizo (Chairman), Andrés
Neely Erdos and Duncan Grob Urzúa.Francisco Moyano Pérez (Chief Executive Officer). 100% 29.4%
Todo Arauco S.A. CLP$ 53,653,536,260 Construction and leasing of real estate projects
Andrés Torrealba Ruiz-Tagle (Chairman), Nicolás Bennett Nualart and Claudio Chamorro Carrizo.
Nicolás Bennett Nualart (Chief Executive Officer) 100% 4.2%
chilechile
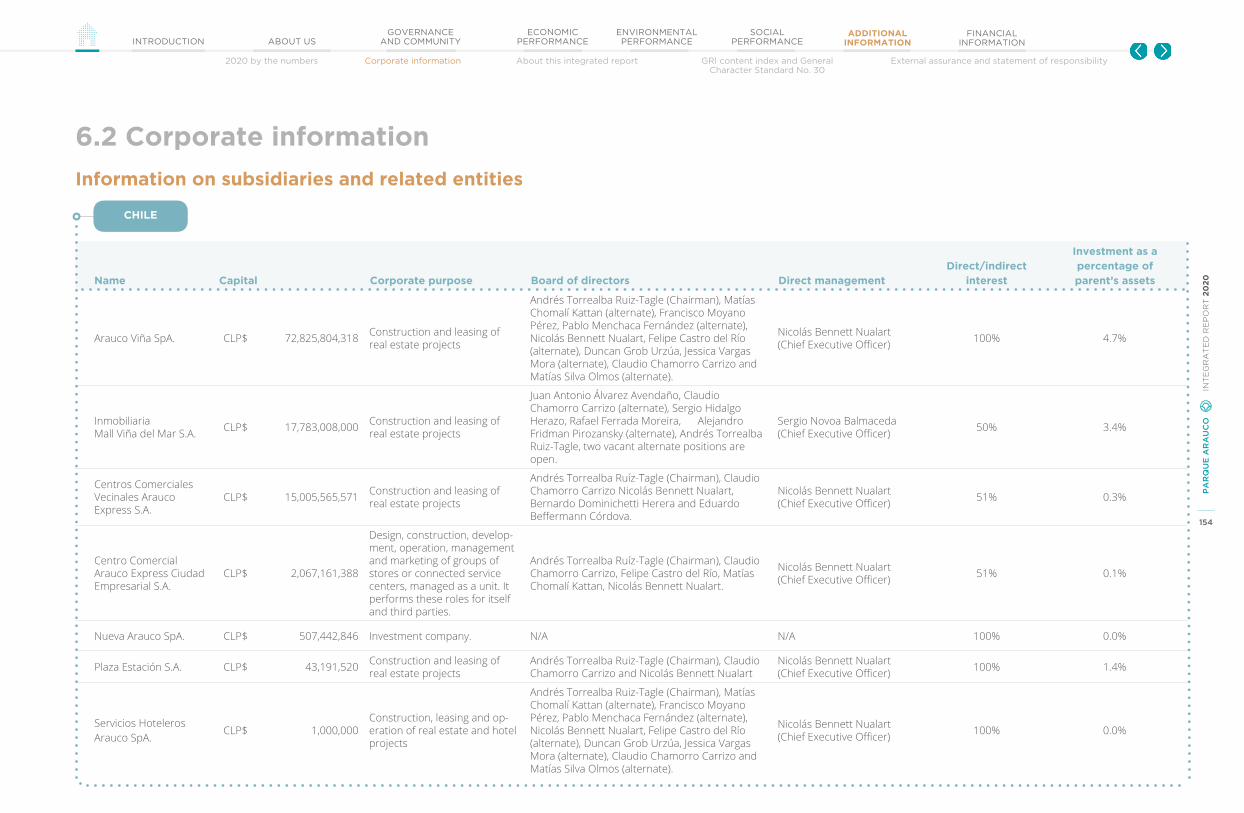
154
PA
RQ
UE
AR
AU
CO
IN
TE
GR
AT
ED
RE
PO
RT
20
20
GOVERNANCEAND COMMUNITYINTRODUCTION ABOUT US
ECONOMIC PERFORMANCE
ENVIRONMENTAL PERFORMANCE
SOCIAL PERFORMANCE
ADDITIONAL INFORMATION
FINANCIAL INFORMATION
2020 by the numbers Corporate information About this integrated report External assurance and statement of responsibilityGRI content index and General Character Standard No. 30
Information on subsidiaries and related entities
6.2 Corporate information
Name Capital Corporate purpose Board of directors Direct managementDirect/indirect
interest
Investment as a percentage of parent’s assets
Arauco Viña SpA. CLP$ 72,825,804,318 Construction and leasing of real estate projects
Andrés Torrealba Ruiz-Tagle (Chairman), Matías Chomalí Kattan (alternate), Francisco Moyano Pérez, Pablo Menchaca Fernández (alternate), Nicolás Bennett Nualart, Felipe Castro del Río (alternate), Duncan Grob Urzúa, Jessica Vargas Mora (alternate), Claudio Chamorro Carrizo and Matías Silva Olmos (alternate).
Nicolás Bennett Nualart (Chief Executive Officer) 100% 4.7%
Inmobiliaria Mall Viña del Mar S.A. CLP$ 17,783,008,000 Construction and leasing of
real estate projects
Juan Antonio Álvarez Avendaño, Claudio Chamorro Carrizo (alternate), Sergio Hidalgo Herazo, Rafael Ferrada Moreira, Alejandro Fridman Pirozansky (alternate), Andrés Torrealba Ruiz-Tagle, two vacant alternate positions are open.
Sergio Novoa Balmaceda (Chief Executive Officer) 50% 3.4%
Centros Comerciales Vecinales Arauco Express S.A.
CLP$ 15,005,565,571 Construction and leasing of real estate projects
Andrés Torrealba Ruíz-Tagle (Chairman), Claudio Chamorro Carrizo Nicolás Bennett Nualart, Bernardo Dominichetti Herera and Eduardo Beffermann Córdova.
Nicolás Bennett Nualart (Chief Executive Officer) 51% 0.3%
Centro Comercial Arauco Express Ciudad Empresarial S.A.
CLP$ 2,067,161,388
Design, construction, develop-ment, operation, management and marketing of groups of stores or connected service centers, managed as a unit. It performs these roles for itself and third parties.
Andrés Torrealba Ruíz-Tagle (Chairman), Claudio Chamorro Carrizo, Felipe Castro del Río, Matías Chomalí Kattan, Nicolás Bennett Nualart.
Nicolás Bennett Nualart (Chief Executive Officer) 51% 0.1%
Nueva Arauco SpA. CLP$ 507,442,846 Investment company. N/A N/A 100% 0.0%
Plaza Estación S.A. CLP$ 43,191,520 Construction and leasing of real estate projects
Andrés Torrealba Ruiz-Tagle (Chairman), Claudio Chamorro Carrizo and Nicolás Bennett Nualart
Nicolás Bennett Nualart (Chief Executive Officer) 100% 1.4%
Servicios Hoteleros Arauco SpA.
CLP$ 1,000,000Construction, leasing and op-eration of real estate and hotel projects
Andrés Torrealba Ruiz-Tagle (Chairman), Matías Chomalí Kattan (alternate), Francisco Moyano Pérez, Pablo Menchaca Fernández (alternate), Nicolás Bennett Nualart, Felipe Castro del Río (alternate), Duncan Grob Urzúa, Jessica Vargas Mora (alternate), Claudio Chamorro Carrizo and Matías Silva Olmos (alternate).
Nicolás Bennett Nualart (Chief Executive Officer) 100% 0.0%
chile
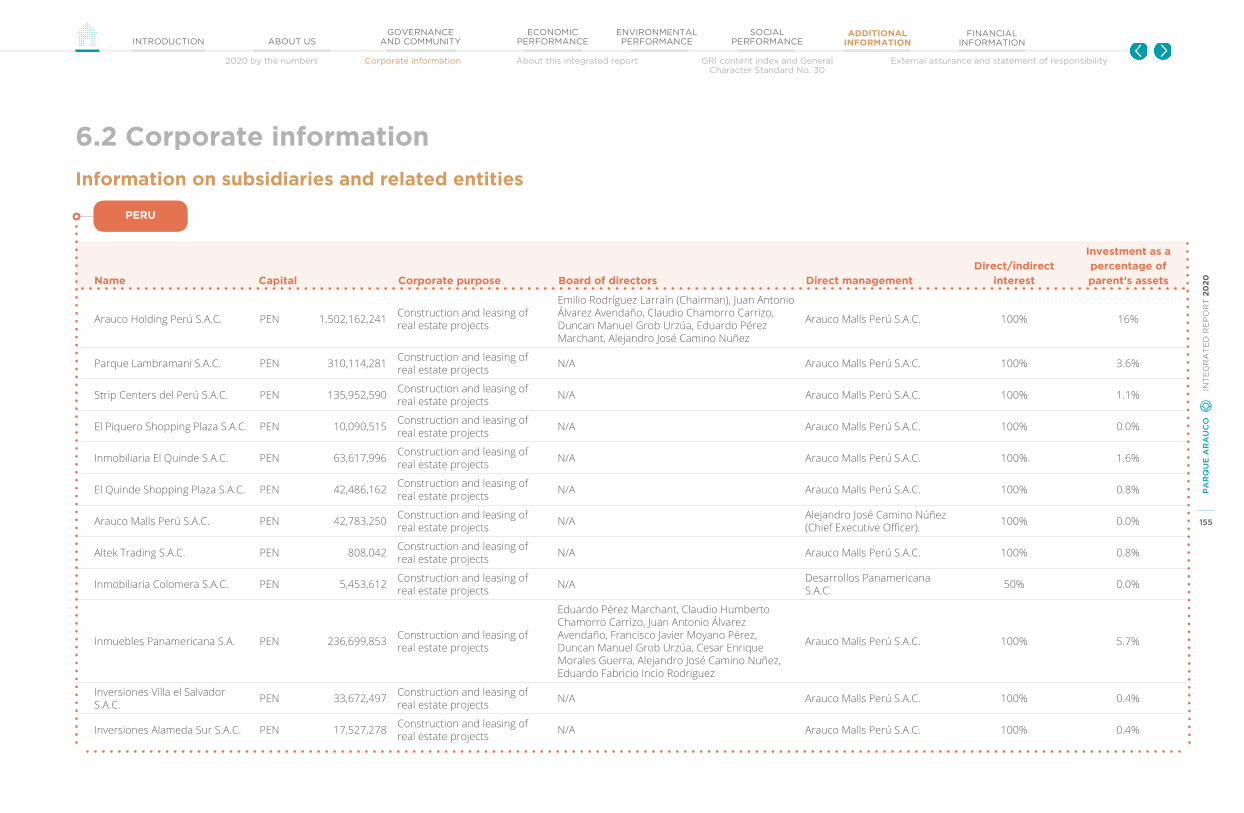
155
PA
RQ
UE
AR
AU
CO
IN
TE
GR
AT
ED
RE
PO
RT
20
20
GOVERNANCEAND COMMUNITYINTRODUCTION ABOUT US
ECONOMIC PERFORMANCE
ENVIRONMENTAL PERFORMANCE
SOCIAL PERFORMANCE
ADDITIONAL INFORMATION
FINANCIAL INFORMATION
2020 by the numbers Corporate information About this integrated report External assurance and statement of responsibilityGRI content index and General Character Standard No. 30
Information on subsidiaries and related entities
6.2 Corporate information
Name Capital Corporate purpose Board of directors Direct managementDirect/indirect
interest
Investment as a percentage of parent’s assets
Arauco Holding Perú S.A.C. PEN 1,502,162,241 Construction and leasing of real estate projects
Emilio Rodríguez Larraín (Chairman), Juan Antonio Álvarez Avendaño, Claudio Chamorro Carrizo, Duncan Manuel Grob Urzúa, Eduardo Pérez Marchant, Alejandro José Camino Nuñez
Arauco Malls Perú S.A.C. 100% 16%
Parque Lambramani S.A.C. PEN 310,114,281 Construction and leasing of real estate projects N/A Arauco Malls Perú S.A.C. 100% 3.6%
Strip Centers del Perú S.A.C. PEN 135,952,590 Construction and leasing of real estate projects N/A Arauco Malls Perú S.A.C. 100% 1.1%
El Piquero Shopping Plaza S.A.C. PEN 10,090,515 Construction and leasing of real estate projects N/A Arauco Malls Perú S.A.C. 100% 0.0%
Inmobiliaria El Quinde S.A.C. PEN 63,617,996 Construction and leasing of real estate projects N/A Arauco Malls Perú S.A.C. 100% 1.6%
El Quinde Shopping Plaza S.A.C. PEN 42,486,162 Construction and leasing of real estate projects N/A Arauco Malls Perú S.A.C. 100% 0.8%
Arauco Malls Perú S.A.C. PEN 42,783,250 Construction and leasing of real estate projects N/A Alejandro José Camino Núñez
(Chief Executive Officer). 100% 0.0%
Altek Trading S.A.C. PEN 808,042 Construction and leasing of real estate projects N/A Arauco Malls Perú S.A.C. 100% 0.8%
Inmobiliaria Colomera S.A.C. PEN 5,453,612 Construction and leasing of real estate projects N/A Desarrollos Panamericana
S.A.C. 50% 0.0%
Inmuebles Panamericana S.A. PEN 236,699,853 Construction and leasing of real estate projects
Eduardo Pérez Marchant, Claudio Humberto Chamorro Carrizo, Juan Antonio Álvarez Avendaño, Francisco Javier Moyano Pérez, Duncan Manuel Grob Urzúa, Cesar Enrique Morales Guerra, Alejandro José Camino Nuñez, Eduardo Fabricio Incio Rodriguez
Arauco Malls Perú S.A.C. 100% 5.7%
Inversiones Villa el Salvador S.A.C. PEN 33,672,497 Construction and leasing of
real estate projects N/A Arauco Malls Perú S.A.C. 100% 0.4%
Inversiones Alameda Sur S.A.C. PEN 17,527,278 Construction and leasing of real estate projects N/A Arauco Malls Perú S.A.C. 100% 0.4%
peru
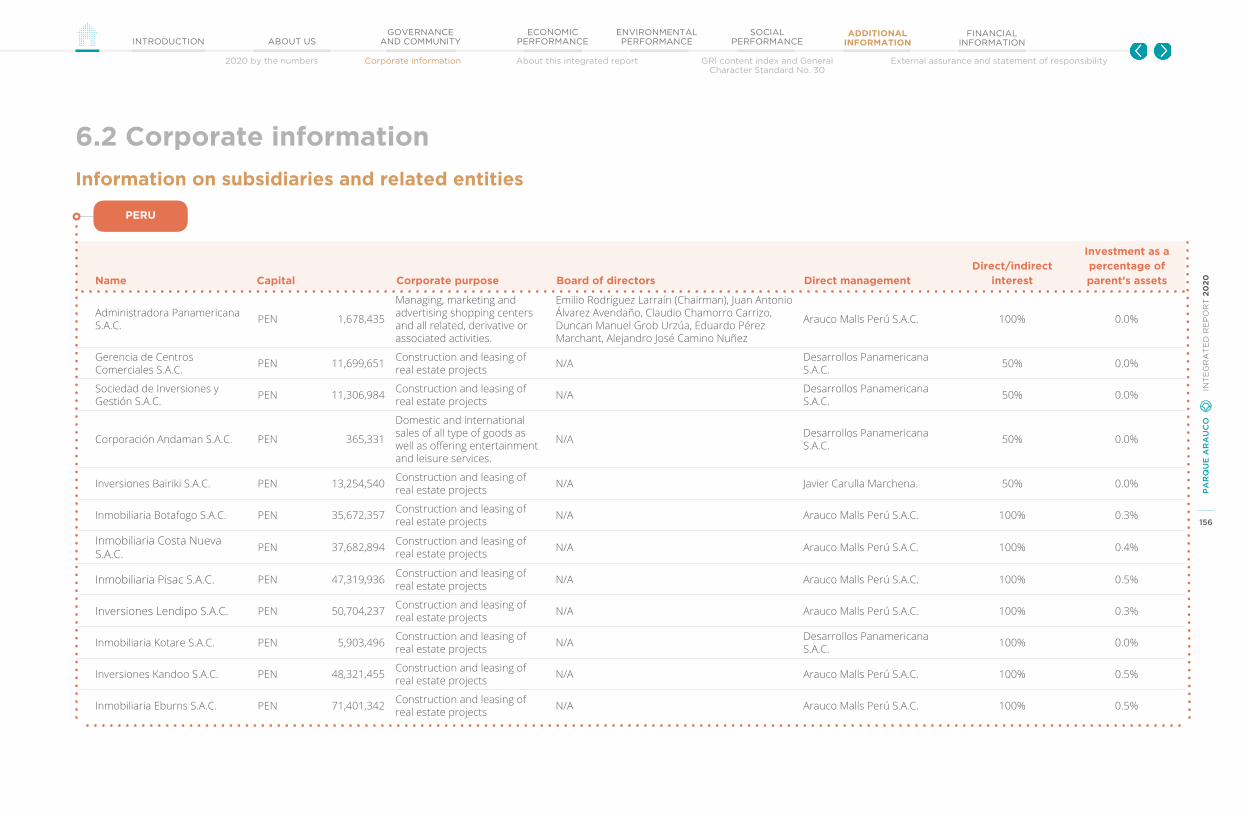
156
PA
RQ
UE
AR
AU
CO
IN
TE
GR
AT
ED
RE
PO
RT
20
20
GOVERNANCEAND COMMUNITYINTRODUCTION ABOUT US
ECONOMIC PERFORMANCE
ENVIRONMENTAL PERFORMANCE
SOCIAL PERFORMANCE
ADDITIONAL INFORMATION
FINANCIAL INFORMATION
2020 by the numbers Corporate information About this integrated report External assurance and statement of responsibilityGRI content index and General Character Standard No. 30
Name Capital Corporate purpose Board of directors Direct managementDirect/indirect
interest
Investment as a percentage of parent’s assets
Administradora Panamericana S.A.C. PEN 1,678,435
Managing, marketing and advertising shopping centers and all related, derivative or associated activities.
Emilio Rodríguez Larraín (Chairman), Juan Antonio Álvarez Avendaño, Claudio Chamorro Carrizo, Duncan Manuel Grob Urzúa, Eduardo Pérez Marchant, Alejandro José Camino Nuñez
Arauco Malls Perú S.A.C. 100% 0.0%
Gerencia de Centros Comerciales S.A.C. PEN 11,699,651 Construction and leasing of
real estate projects N/A Desarrollos Panamericana S.A.C. 50% 0.0%
Sociedad de Inversiones y Gestión S.A.C. PEN 11,306,984 Construction and leasing of
real estate projects N/A Desarrollos Panamericana S.A.C. 50% 0.0%
Corporación Andaman S.A.C. PEN 365,331
Domestic and international sales of all type of goods as well as offering entertainment and leisure services.
N/A Desarrollos Panamericana S.A.C. 50% 0.0%
Inversiones Bairiki S.A.C. PEN 13,254,540 Construction and leasing of real estate projects N/A Javier Carulla Marchena. 50% 0.0%
Inmobiliaria Botafogo S.A.C. PEN 35,672,357 Construction and leasing of real estate projects N/A Arauco Malls Perú S.A.C. 100% 0.3%
Inmobiliaria Costa Nueva S.A.C. PEN 37,682,894 Construction and leasing of
real estate projects N/A Arauco Malls Perú S.A.C. 100% 0.4%
Inmobiliaria Pisac S.A.C. PEN 47,319,936 Construction and leasing of real estate projects N/A Arauco Malls Perú S.A.C. 100% 0.5%
Inversiones Lendipo S.A.C. PEN 50,704,237 Construction and leasing of real estate projects N/A Arauco Malls Perú S.A.C. 100% 0.3%
Inmobiliaria Kotare S.A.C. PEN 5,903,496 Construction and leasing of real estate projects N/A Desarrollos Panamericana
S.A.C. 100% 0.0%
Inversiones Kandoo S.A.C. PEN 48,321,455 Construction and leasing of real estate projects N/A Arauco Malls Perú S.A.C. 100% 0.5%
Inmobiliaria Eburns S.A.C. PEN 71,401,342 Construction and leasing of real estate projects N/A Arauco Malls Perú S.A.C. 100% 0.5%
peru
6.2 Corporate information
Information on subsidiaries and related entities

157
PA
RQ
UE
AR
AU
CO
IN
TE
GR
AT
ED
RE
PO
RT
20
20
GOVERNANCEAND COMMUNITYINTRODUCTION ABOUT US
ECONOMIC PERFORMANCE
ENVIRONMENTAL PERFORMANCE
SOCIAL PERFORMANCE
ADDITIONAL INFORMATION
FINANCIAL INFORMATION
2020 by the numbers Corporate information About this integrated report External assurance and statement of responsibilityGRI content index and General Character Standard No. 30
Name Capital Corporate purpose Board of directors Direct managementDirect/indirect
interest
Investment as a percentage of parent’s assets
Inversiones Diamanda S.A.C. PEN 21,711,353 Construction and leasing of real estate projects N/A Desarrollos Panamericana
S.A.C. 50% 0.0%
Inmobiliaria Nueva Centuria S.A.C. PEN 613,058 Construction and leasing of
real estate projects N/A Desarrollos Panamericana S.A.C. 50% 0.0%
Inversiones Innsmouth S.A.C. PEN 37,814,672 Construction and leasing of real estate projects N/A Desarrollos Panamericana
S.A.C. 50% 0.0%
Inmobiliaria Castell S.A.C. PEN 400 Construction and leasing of real estate projects N/A Desarrollos Panamericana
S.A.C. 50% 0.0%
Inversiones Termasia S.A.C. PEN 15,830,709 Construction and leasing of real estate projects N/A Desarrollos Panamericana
S.A.C. 50% 0.0%
Inversiones Lambore S.A.C. PEN 59,648,775 Construction and leasing of real estate projects N/A Arauco Malls Perú S.A.C. 100% 0.0%
Inversiones Inmobiliarias Puerto Pizarro S.A.C PEN 400 Construction and leasing of
real estate projects N/A Desarrollos Panamericana S.A.C. 50% 0.0%
Holding Plaza S.A. PEN 139,109,273 Financial market management N/A Arauco Malls Perú S.A.C. 100% 3.0%
Nisa Malls S.A. PEN 45,818,167 Financial market management N/A Arauco Malls Perú S.A.C. 98.57% 0.3%
Desarrollos Panamericana S.A.C. PEN 147,882,222 Real estate assets
Marco Renato Aveggio Merello, Juan Antonio Álvarez Avendaño, Gonzalo Antonio De la Puente Wiese, Marilú Clotilde Wiese Moreyra, Cesar Emilio Rodriguez Larraín Salas, Claudio Humberto Chamorro Carrizo.
Percy Vigil Vidal (Chief Executive Officer) 50% 0.0%
Projects Panamericana S.A.C. PEN 1,000 Real estate assets N/A Percy Vigil Vidal (Chief Executive Officer) 50% 0.0%
peru
6.2 Corporate information
Information on subsidiaries and related entities
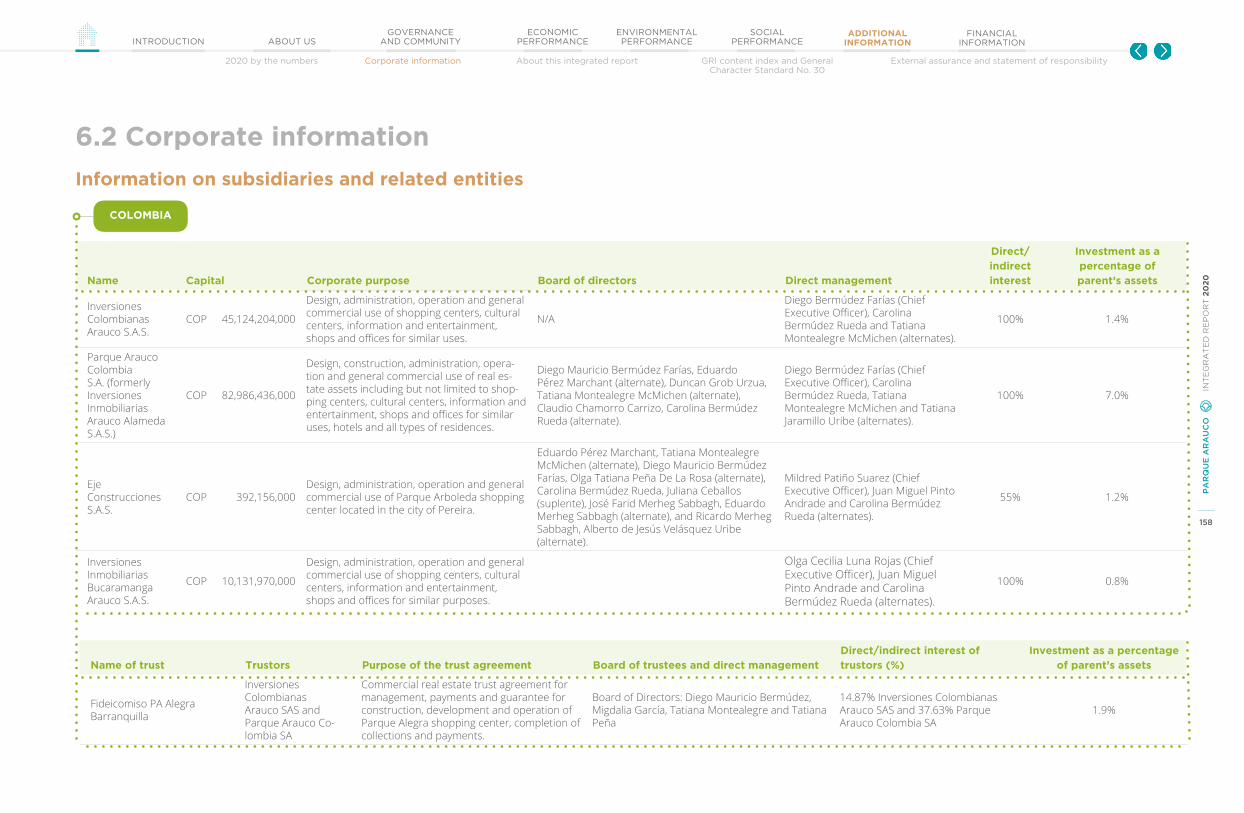
158
PA
RQ
UE
AR
AU
CO
IN
TE
GR
AT
ED
RE
PO
RT
20
20
GOVERNANCEAND COMMUNITYINTRODUCTION ABOUT US
ECONOMIC PERFORMANCE
ENVIRONMENTAL PERFORMANCE
SOCIAL PERFORMANCE
ADDITIONAL INFORMATION
FINANCIAL INFORMATION
2020 by the numbers Corporate information About this integrated report External assurance and statement of responsibilityGRI content index and General Character Standard No. 30
Name Capital Corporate purpose Board of directors Direct management
Direct/indirect interest
Investment as a percentage of parent’s assets
Inversiones Colombianas Arauco S.A.S.
COP 45,124,204,000
Design, administration, operation and general commercial use of shopping centers, cultural centers, information and entertainment, shops and offices for similar uses.
N/A
Diego Bermúdez Farías (Chief Executive Officer), Carolina Bermúdez Rueda and Tatiana Montealegre McMichen (alternates).
100% 1.4%
Parque Arauco Colombia S.A. (formerly Inversiones Inmobiliarias Arauco Alameda S.A.S.)
COP 82,986,436,000
Design, construction, administration, opera-tion and general commercial use of real es-tate assets including but not limited to shop-ping centers, cultural centers, information and entertainment, shops and offices for similar uses, hotels and all types of residences.
Diego Mauricio Bermúdez Farías, Eduardo Pérez Marchant (alternate), Duncan Grob Urzua, Tatiana Montealegre McMichen (alternate), Claudio Chamorro Carrizo, Carolina Bermúdez Rueda (alternate).
Diego Bermúdez Farías (Chief Executive Officer), Carolina Bermúdez Rueda, Tatiana Montealegre McMichen and Tatiana Jaramillo Uribe (alternates).
100% 7.0%
Eje Construcciones S.A.S.
COP 392,156,000Design, administration, operation and general commercial use of Parque Arboleda shopping center located in the city of Pereira.
Eduardo Pérez Marchant, Tatiana Montealegre McMichen (alternate), Diego Mauricio Bermúdez Farías, Olga Tatiana Peña De La Rosa (alternate), Carolina Bermúdez Rueda, Juliana Ceballos (suplente), José Farid Merheg Sabbagh, Eduardo Merheg Sabbagh (alternate), and Ricardo Merheg Sabbagh, Alberto de Jesús Velásquez Uribe (alternate).
Mildred Patiño Suarez (Chief Executive Officer), Juan Miguel Pinto Andrade and Carolina Bermúdez Rueda (alternates).
55% 1.2%
Inversiones Inmobiliarias Bucaramanga Arauco S.A.S.
COP 10,131,970,000
Design, administration, operation and general commercial use of shopping centers, cultural centers, information and entertainment, shops and offices for similar purposes.
Olga Cecilia Luna Rojas (Chief Executive Officer), Juan Miguel Pinto Andrade and Carolina Bermúdez Rueda (alternates).
100% 0.8%
Name of trust Trustors Purpose of the trust agreement Board of trustees and direct managementDirect/indirect interest of trustors (%)
Investment as a percentage of parent’s assets
Fideicomiso PA Alegra Barranquilla
Inversiones Colombianas Arauco SAS and Parque Arauco Co-lombia SA
Commercial real estate trust agreement for management, payments and guarantee for construction, development and operation of Parque Alegra shopping center, completion of collections and payments.
Board of Directors: Diego Mauricio Bermúdez, Migdalia García, Tatiana Montealegre and Tatiana Peña
14.87% Inversiones Colombianas Arauco SAS and 37.63% Parque Arauco Colombia SA
1.9%
6.2 Corporate information
Information on subsidiaries and related entities
colombia
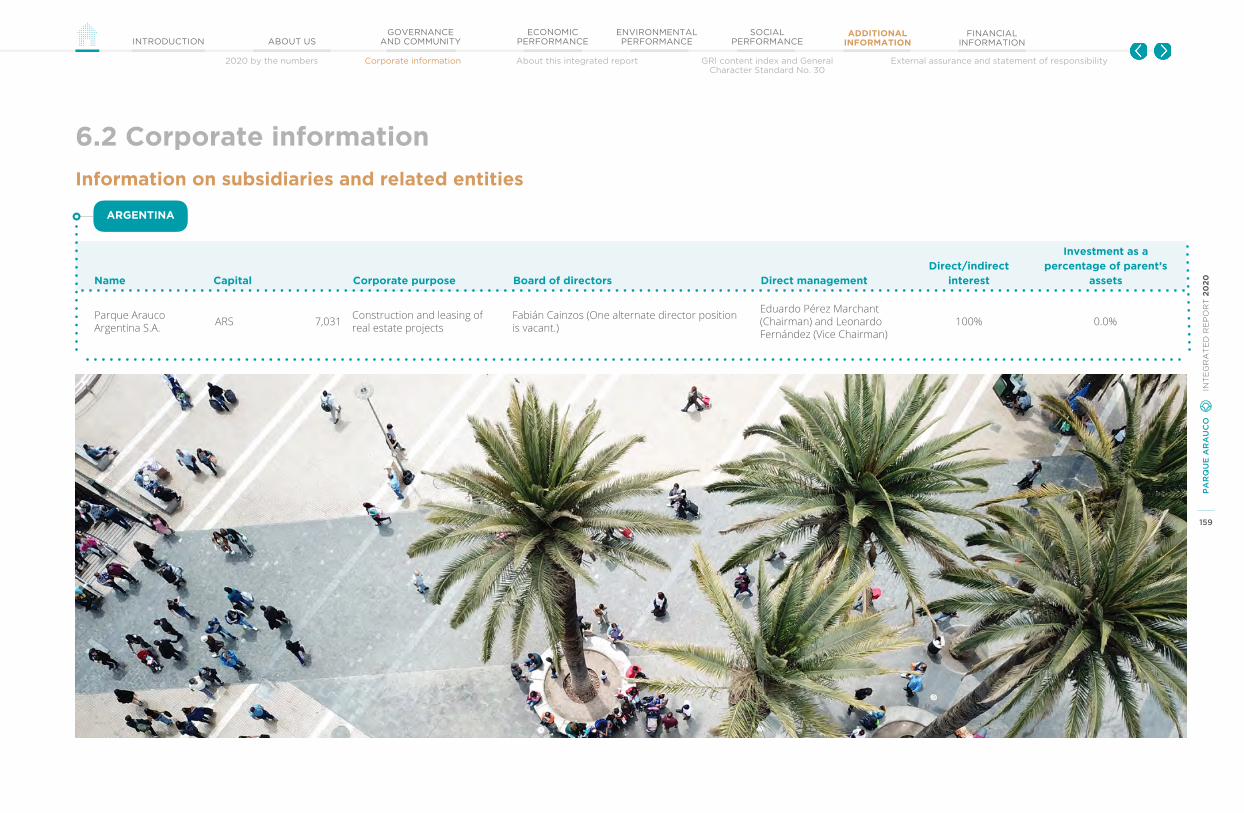
159
PA
RQ
UE
AR
AU
CO
IN
TE
GR
AT
ED
RE
PO
RT
20
20
GOVERNANCEAND COMMUNITYINTRODUCTION ABOUT US
ECONOMIC PERFORMANCE
ENVIRONMENTAL PERFORMANCE
SOCIAL PERFORMANCE
ADDITIONAL INFORMATION
FINANCIAL INFORMATION
2020 by the numbers Corporate information About this integrated report External assurance and statement of responsibilityGRI content index and General Character Standard No. 30
Name Capital Corporate purpose Board of directors Direct managementDirect/indirect
interest
Investment as a percentage of parent’s
assets
Parque Arauco Argentina S.A. ARS 7,031 Construction and leasing of
real estate projectsFabián Cainzos (One alternate director position is vacant.)
Eduardo Pérez Marchant (Chairman) and Leonardo Fernández (Vice Chairman)
100% 0.0%
6.2 Corporate information
Information on subsidiaries and related entities
argentina

160
PA
RQ
UE
AR
AU
CO
IN
TE
GR
AT
ED
RE
PO
RT
20
20
GOVERNANCEAND COMMUNITYINTRODUCTION ABOUT US
ECONOMIC PERFORMANCE
ENVIRONMENTAL PERFORMANCE
SOCIAL PERFORMANCE
ADDITIONAL INFORMATION
FINANCIAL INFORMATION
2020 by the numbers Corporate information About this integrated report External assurance and statement of responsibilityGRI content index and General Character Standard No. 30
Corporate structure 6.2 Corporate information
NUEVA ARAUCO SpA
PARQUE ARAUCO ARGENTINA S.A.
ARAUCO HOLDING PERÚ S.A.C. PARQUE ARAUCO
COLOMBIA S.A.
INVERSIONES COLOMBIANAS ARAUCO S.A.S.
Arauco Malls Chile S.A.
Altek Trading S.A.C.
Parque Lambramani S.A.C.
Strip Centers del Perú S.A.C.
Sociedad de Inversiones y Gestión S.A.C.
Inmobiliaria Castell S.A.C.
Inmobiliaria Nueva Centuria S.A.C.
Inmobiliaria Kotare S.A.C.
Inversiones Bairiki S.A.C.
Inversiones Inmobiliarias Puerto Pizarro S.A.C.
Inversiones Alameda Sur S.A.C.
Inversiones Kandoo S.A.C.
Inversiones Lambore S.A.C.
Inmobiliaria Costa Nueva S.A.C.
Inversiones Lendipo S.A.C.
Inmobiliaria Pisac S.A.C.
AdministradoraPanamericana S.A.C.
CorporaciónAndaman S.A.C.
Inmobiliaria Colomera S.A.C.
Inversiones Termasia S.A.C.
Inversiones Diamanda S.A.C.
Inversiones Innsmouth S.A.C.
InmobiliariaBotafogo S.A.C.
InmobiliariaEburns S.A.C.
Villa El Salvador S.A.C.
Gerencia de CentrosComerciales S.A.C.
Plaza Estación S.A.
Inversiones Parque Arauco
Uno S.A.
Arauco Chillán SpA
Comercial Arauco Ltda.
Arauco Centros Comerciales
Regionales SpA
Bulevar Rentas Inmobiliarias S.A.
Desarrollos Inmobiliarios
San Antonio S.A.
Todo Arauco S.A.
Inmobiliaria Paseo de la Estación S.A.
Inmobiliaria El Quinde S.A.C.
Eje Construcciones S.A.S.
Arauco Malls Perú S.A.C.
Inversiones Inmobiliarias Bucaramanga Arauco S.A.S.
Fideicomiso P.A. Alegra
Barranquilla
Administradora Parque Arauco
S.A.S.
Parque Angamos SpA
Arauco Viña SpA
Inmobiliaria Eccsa S.A.
100%
50%
45%
50%
99.9998752%
99.8195666%
50.9999997%
95%
51.0000002%
99.9998765%
99.3361497%
99.9972340%
69.90%
83%
0.0001248%
0.1804334%
5%
0.0001235%
0.6638503%
2.26%
0.0026760%
0.10%
100%
99.9963976%
0.0036024%
4.8739423%
37.63%
100%
54.9997960%
0.0002550%
44.9999490%
14.87%
100%
97.74%
0.0425796%
99.9574204%
0.0000099%
0.0000024%
0.0000023%99.9999977%
99.9999901%
0.0000016%
99.9999984%
99.9999976%
55%
100%
99.9988967%
Centros Comerciales Vecinales Arauco
Express S.A.
Centro Comercial Arauco Express
Ciudad Empresarial S.A.
Inmobiliaria Mall Viña Del Mar S.A.
Servicios Hoteleros Arauco SpA
Banchile Rentas Inmobiliarias I
Investment Fund
Empresa de los Ferrocarriles
del Estado
Inversiones Doña Olga
II S.A.
Ameris Parauco Investment
Fund
Minority interests
Colvalor Propiedades
Colombianas S.A.S.
Dalai International
Ltd.
Inmobiliaria e Inversiones Newen Dos Mil Veinticinco
Limitada
El Quinde Shopping Plaza
S.A.C.
El Piquero Shopping Plaza
S.A.C.
Nisa Malls S.A. Holding Plaza S.A. InmueblesPanamericana S.A.
DesarrollosPanamericana S.A.C.
ProyectosPanamericana S.A.C.
PARQUE ARAUCO S.A.
PARQUE ARAUCOINTERNACIONAL S.A.
0.3259834%
0.0000012%
0.0000012%
100%
94.7999996%
TODO ARAUCO S.A.
NUEVA ARAUCO SpA
Peruvian solArgentinean pesoChilean pesoColombian pesoUSD External partners
51.9999150%49.0000850%
17%
30%
49.0000003%
48.9999998%
1.1428196%
47.50%
0.0011033%
98.571804%
88.149553%
0.00027%
0.0001238%
99.9983945%0.0016055%
0.0002942%99.9997058%
50%
50% 50%
0.1%
99.8%0.1%
99.9997525%
99.9999886%
99.991722%
99.9993294%
99.9990818%
99.9992111%
99.9991547%
100%
99.9989422%
89.2756988%
99.999997%
99.9914527%
50.0000002%
0.0001238%
0.0000057%
0.0004139%
0.0003353%
0.0004591%
0.0003944%
0.0004227%
99.9997%
0.0036673%
0.0012634%
0.0009212%
0.0005289%
99.9926654%
99.9974733%
99.9981576%
99.9989422%
0.0005607%
0.002801%
5.3427336%
10.7237410%
0.0000057%
0.0004139%
0.003353%
0.0004591%
0.0003944%
0.0004227%
0.0036673%
0.0012634%
0.0009212%
0.0005289%
0.005607%
0.002801%
0.000003%
0.0085387%
11.850447%
49.9999998%
PARQUE ARAUCOINTERNACIONAL S.A.
Marilú Wiese Moreyra
Nisa Retail S.A.
A Y F Wiese S.A.
0.0000085%
49.9971242%
0.0028758%
161
PA
RQ
UE
AR
AU
CO
IN
TE
GR
AT
ED
RE
PO
RT
20
20
GOVERNANCEAND COMMUNITYINTRODUCTION ABOUT US
ECONOMIC PERFORMANCE
ENVIRONMENTAL PERFORMANCE
SOCIAL PERFORMANCE
ADDITIONAL INFORMATION
FINANCIAL INFORMATION
2020 by the numbers Corporate information About this integrated report External assurance and statement of responsibilityGRI content index and General Character Standard No. 30
6.3 About this Integrated Report
General report profile
This report covers the performance of Parque Arauco S.A. and its subsidiaries between January 1 and December 31, 2020.
This document is published annually in accordance with the terms of the Corporations Law. The previous report was published in April 2020 and refers to 2019.
This document covers the requirements set out in General Character Standard No. 30. Its contents are also aligned with the GRI standards for sustainability reporting and the guidelines from the Integrated International Reporting Council (IIRC) Framework. We have also included contents that must be disclosed to the market based on our participation in a series of sustainability indexes.
This report was prepared in accordance with the 'Core' option of the GRI Standards based on the principles regarding content (stakeholder inclusiveness, sustainability context, materiality and completeness) and those related to the quality of information (accuracy, balance, clarity, comparability, reliability and timeliness).
This report also represents a Communication of Progress (CoP), which is based on adherence to the United Nations Global Compact through Red Pacto Global Chile.
This report presents restatements of information from previous reports regarding environmental indicators, indicators for our team and the surface area of some properties:
enVironmental inDicators Changes were made based on the water use, energy, waste and emissions intensity levels from past years. This is due to changes in the calculation of m2 that correspond to the common areas of the properties included in environmental metrics.
employee inDicators Adjustments were made to the dates listed for termination, as well as to reclassify categories and include an internship.
surface area inDicators In reviewing each property’s surface area, the company’s Projects Area identified some minor differences.

162
PA
RQ
UE
AR
AU
CO
IN
TE
GR
AT
ED
RE
PO
RT
20
20
GOVERNANCEAND COMMUNITYINTRODUCTION ABOUT US
ECONOMIC PERFORMANCE
ENVIRONMENTAL PERFORMANCE
SOCIAL PERFORMANCE
ADDITIONAL INFORMATION
FINANCIAL INFORMATION
2020 by the numbers Corporate information About this integrated report External assurance and statement of responsibilityGRI content index and General Character Standard No. 30
Scope of content
The information presented in this report includes Parque Arauco’s corporate offices and all of its properties in Chile, Peru and Colombia with the exception of Chapter 4 on Environmental Performance. In that section, we focus on the properties with the most leasable surface area (GLA) in each country, which also correspond to over 90% of the company’s total revenue in 2020, as outlined in the table below.
Based on this, the indicators for that section were calculated for 37 properties in our portfolio, which represent 96% of our GLA as of December 31, 2020, and 99% of our revenue as of the close of the reporting period.
The list of properties is presented below:1
6.3 About this Integrated Report
Real estate assets GLA (m2)
Parque Lambramani 30,000
Larcomar 26,500
El Quinde Cajamarca 33,000
El Quinde Ica 36,500
InOutlet Faucett 7,500
Viamix Chorrillos 4,000
Viamix Colonial 3,000
Viamix Malvinas 3,000
Premium Outlet Lurín 8,500
MegaPlaza Norte 112,000
MegaPlaza Villa El Salvador I 9,000
MegaPlaza Villa El Salvador II 15,500
MegaPlaza Express Villa 8,000
MegaPlaza Huaral 14,500
MegaPlaza Cañete 16,500
MegaPlaza Express Barranca 10,000
MegaPlaza Pisco 15,000
MegaPlaza Express Jaén 14,500
MegaPlaza Express Chincha 10,500
MegaPlaza Chimbote 28,000
peru
Real estate assets GLA (m2)
Parque Arboleda 41,000
Parque Caracolí 38,500
Parque La Colina 61,500
Arauco Premium Outlet Bogotá 13,000
colombia
Real estate assets GLA (m2)
Parque Arauco Kennedy 111,000
Arauco Maipú 69,500
Arauco Chillán 35,500
Arauco Estación 67,500
Arauco San Antonio 28,500
Arauco Quilicura 31,000
Parque Angamos 10,500
Arauco El Bosque 30,000
Premium Outlet Buenaventura 29,000
Premium Outlet Curauma 7,000
Premium Outlet Concepción 9,000
Premium Outlet Coquimbo 6,000
Mall Arauco Coronel 30,000
chile
1. Coverage in the Consolidated Financial Statements is the same for all data in this Integrated Report, covering 100% of our operations, unless otherwise indicated.
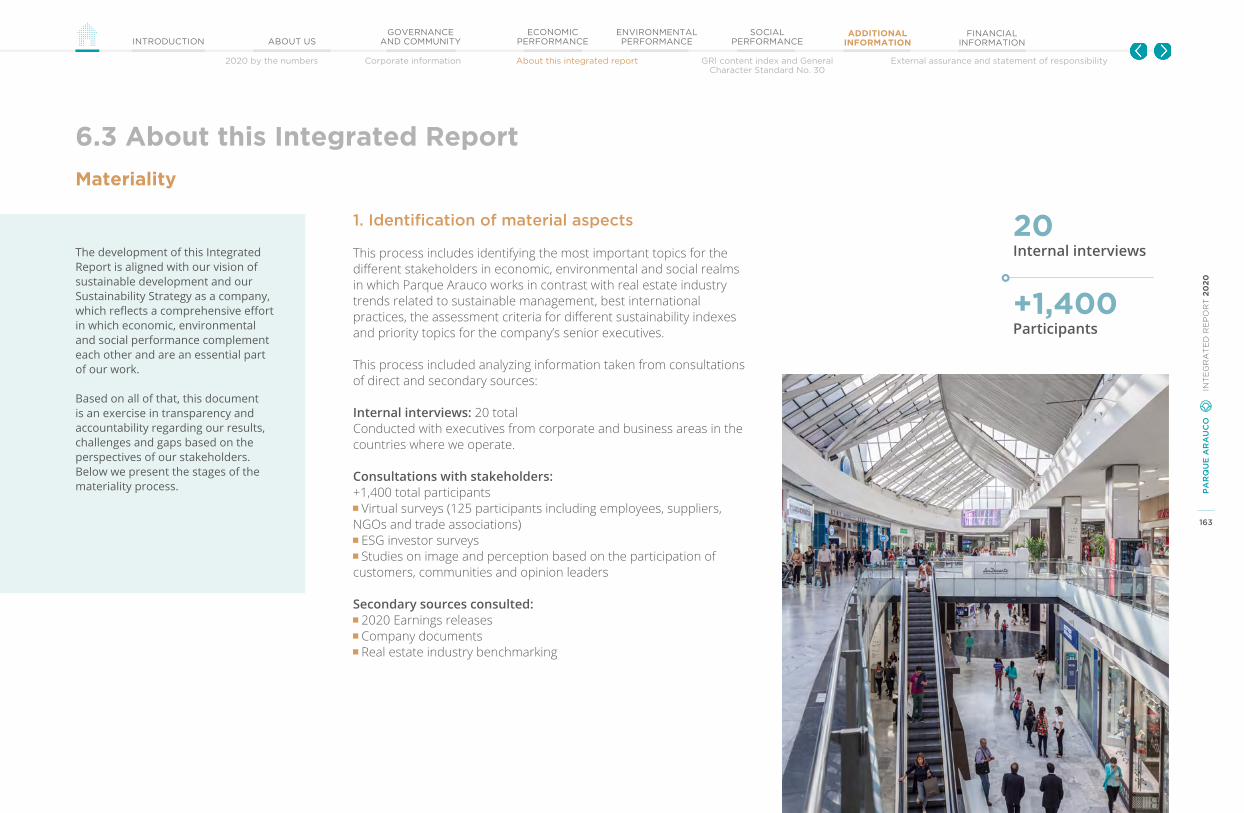
163
PA
RQ
UE
AR
AU
CO
IN
TE
GR
AT
ED
RE
PO
RT
20
20
GOVERNANCEAND COMMUNITYINTRODUCTION ABOUT US
ECONOMIC PERFORMANCE
ENVIRONMENTAL PERFORMANCE
SOCIAL PERFORMANCE
ADDITIONAL INFORMATION
FINANCIAL INFORMATION
2020 by the numbers Corporate information About this integrated report External assurance and statement of responsibilityGRI content index and General Character Standard No. 30
Materiality
6.3 About this Integrated Report
The development of this Integrated Report is aligned with our vision of sustainable development and our Sustainability Strategy as a company, which reflects a comprehensive effort in which economic, environmental and social performance complement each other and are an essential part of our work.
Based on all of that, this document is an exercise in transparency and accountability regarding our results, challenges and gaps based on the perspectives of our stakeholders. Below we present the stages of the materiality process.
1. Identification of material aspects
This process includes identifying the most important topics for the different stakeholders in economic, environmental and social realms in which Parque Arauco works in contrast with real estate industry trends related to sustainable management, best international practices, the assessment criteria for different sustainability indexes and priority topics for the company’s senior executives.
This process included analyzing information taken from consultations of direct and secondary sources:
Internal interviews: 20 totalConducted with executives from corporate and business areas in the countries where we operate.
Consultations with stakeholders: +1,400 total participants Virtual surveys (125 participants including employees, suppliers,
NGOs and trade associations) ESG investor surveys Studies on image and perception based on the participation of
customers, communities and opinion leaders
Secondary sources consulted: 2020 Earnings releases Company documents Real estate industry benchmarking
20 Internal interviews
+1,400 Participants
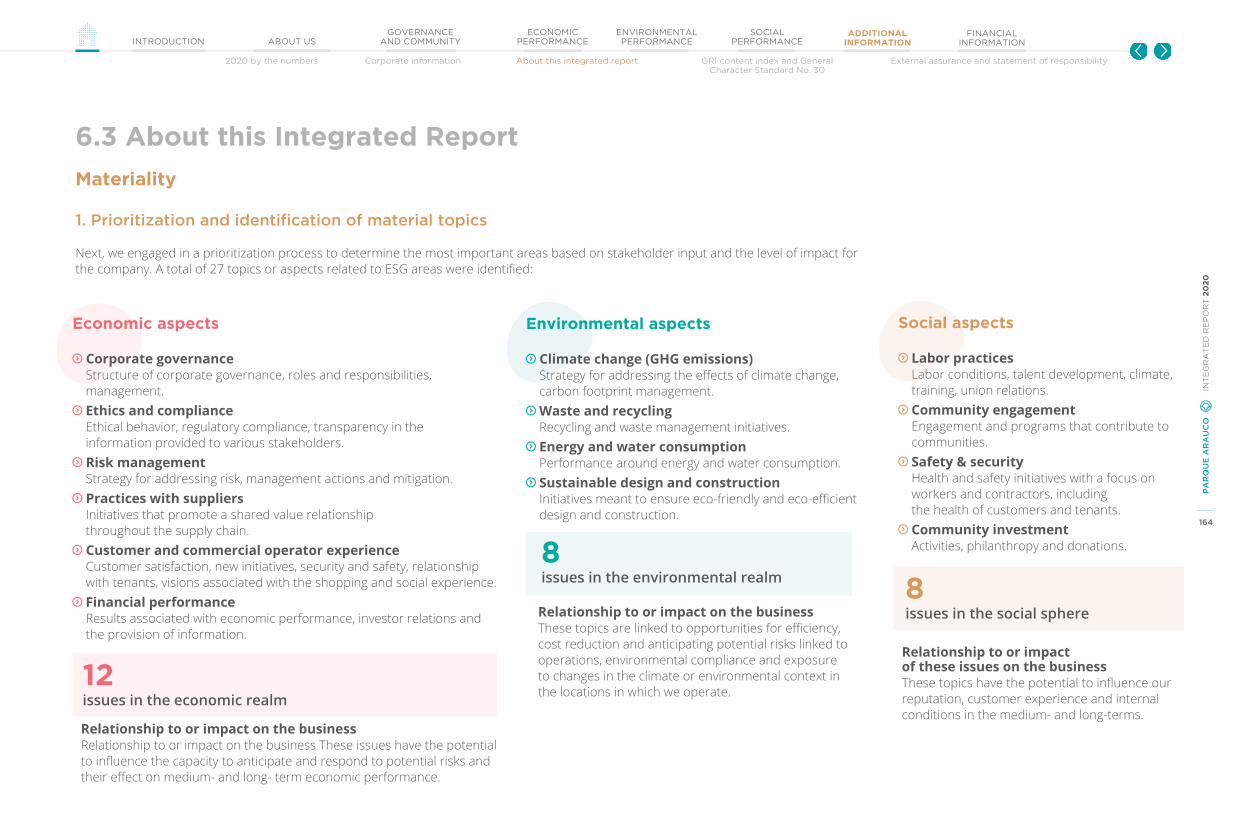
164
PA
RQ
UE
AR
AU
CO
IN
TE
GR
AT
ED
RE
PO
RT
20
20
GOVERNANCEAND COMMUNITYINTRODUCTION ABOUT US
ECONOMIC PERFORMANCE
ENVIRONMENTAL PERFORMANCE
SOCIAL PERFORMANCE
ADDITIONAL INFORMATION
FINANCIAL INFORMATION
2020 by the numbers Corporate information About this integrated report External assurance and statement of responsibilityGRI content index and General Character Standard No. 30
Materiality
6.3 About this Integrated Report
1. Prioritization and identification of material topics
Next, we engaged in a prioritization process to determine the most important areas based on stakeholder input and the level of impact for the company. A total of 27 topics or aspects related to ESG areas were identified:
Environmental aspects
Climate change (GHG emissions) Strategy for addressing the effects of climate change, carbon footprint management.
Waste and recycling Recycling and waste management initiatives.
Energy and water consumption Performance around energy and water consumption.
Sustainable design and construction Initiatives meant to ensure eco-friendly and eco-efficient design and construction.
Social aspects
Labor practices Labor conditions, talent development, climate, training, union relations.
Community engagement Engagement and programs that contribute to communities.
Safety & security Health and safety initiatives with a focus on workers and contractors, including the health of customers and tenants.
Community investment Activities, philanthropy and donations.8
issues in the environmental realm 8issues in the social sphere
Economic aspects
Corporate governance Structure of corporate governance, roles and responsibilities, management.
Ethics and compliance Ethical behavior, regulatory compliance, transparency in the information provided to various stakeholders.
Risk management Strategy for addressing risk, management actions and mitigation.
Practices with suppliers Initiatives that promote a shared value relationship throughout the supply chain.
Customer and commercial operator experience Customer satisfaction, new initiatives, security and safety, relationship with tenants, visions associated with the shopping and social experience.
Financial performance Results associated with economic performance, investor relations and the provision of information.
12issues in the economic realm
Relationship to or impact on the businessRelationship to or impact on the business These issues have the potential to influence the capacity to anticipate and respond to potential risks and their effect on medium- and long- term economic performance.
Relationship to or impact on the businessThese topics are linked to opportunities for efficiency, cost reduction and anticipating potential risks linked to operations, environmental compliance and exposure to changes in the climate or environmental context in the locations in which we operate.
Relationship to or impact of these issues on the businessThese topics have the potential to influence our reputation, customer experience and internal conditions in the medium- and long-terms.

165
PA
RQ
UE
AR
AU
CO
IN
TE
GR
AT
ED
RE
PO
RT
20
20
GOVERNANCEAND COMMUNITYINTRODUCTION ABOUT US
ECONOMIC PERFORMANCE
ENVIRONMENTAL PERFORMANCE
SOCIAL PERFORMANCE
ADDITIONAL INFORMATION
FINANCIAL INFORMATION
2020 by the numbers Corporate information About this integrated report External assurance and statement of responsibilityGRI content index and General Character Standard No. 30
Materiality
6.3 About this Integrated Report
1. Validation, assurance and table of progress
The Corporate Sustainability Area participated in all stages of the process and validated the congruency of the analysis as well as the relevance and balance of the information sources considered. This process also was verified by the external firm PwC Chile as is done with the rest of the contents of this report.
high
customer anD commercial operator experience
financialperformance
corporate goVernance
risk management
community engagement
Financial
Environmental
Social
high
low
re
le
Va
nc
e t
o s
ta
ke
ho
lD
er
s
impact for the company
climate change
energy anD water
safety & security
sustainable Design anD construction ethics anD
compliance
practiceslabor
social inVestment
policies for our suppliers
waste anD recycling
materiality matrix 2020

166
PA
RQ
UE
AR
AU
CO
IN
TE
GR
AT
ED
RE
PO
RT
20
20
GOVERNANCEAND COMMUNITYINTRODUCTION ABOUT US
ECONOMIC PERFORMANCE
ENVIRONMENTAL PERFORMANCE
SOCIAL PERFORMANCE
ADDITIONAL INFORMATION
FINANCIAL INFORMATION
2020 by the numbers Corporate information About this integrated report External assurance and statement of responsibilityGRI content index and General Character Standard No. 30
6.3 About this Integrated Report
Priority topicsDescription and connection to the business Some actions taken in 2020 Progress
climatechangeagenDa
Includes actions, indicators and management approaches to diminish exposure and gaps regarding climate change and carbon emissions intensity.
We have an environmental management system that includes carbon footprint monitoring. We made progress on initiatives that allow us to reduce our direct and indirect emissions and to increase the percentage of renewable energies. We also moved forward with the implementation of infrastructure that promotes transportation that is low in emissions.
71% of our total energy comes from renewable sources. Over 65% of our lighting systems are LED.
enVironmental management of operations
This includes all actions, indicators and management regarding energy and water efficiency, recycling and waste recovery in our shopping centers.
We measure and manage environmental KPIs that cover 96% of our portfolio’s total GLA. We are moving forward with the implementation of environmental management and certification systems in our portfolio.
Energy intensity decreased 32% compared to the previous year. Water use intensity decreased 21% compared to 2019. We recovered/recycled 20% more waste in 2020.
sustainable construction
This is related to practices that consider environmental efficiencies in the early phases of development of new real estate projects.
We participate in networks and associations that promote sustainable construction, which allows us to train and update our teams on these topics. New projects include sustainability elements in the design and development phases.
We are part of the Green Building Council in Chile and Peru. The Parque Arauco Kennedy expansion projects and development of Parque Alegra include sustainability design elements and practices.
enVironmental performance
Materiality
This table presents a summary of the progress made on material areas over the past year and their alignment with the agenda of the Sustainable Development Goals.
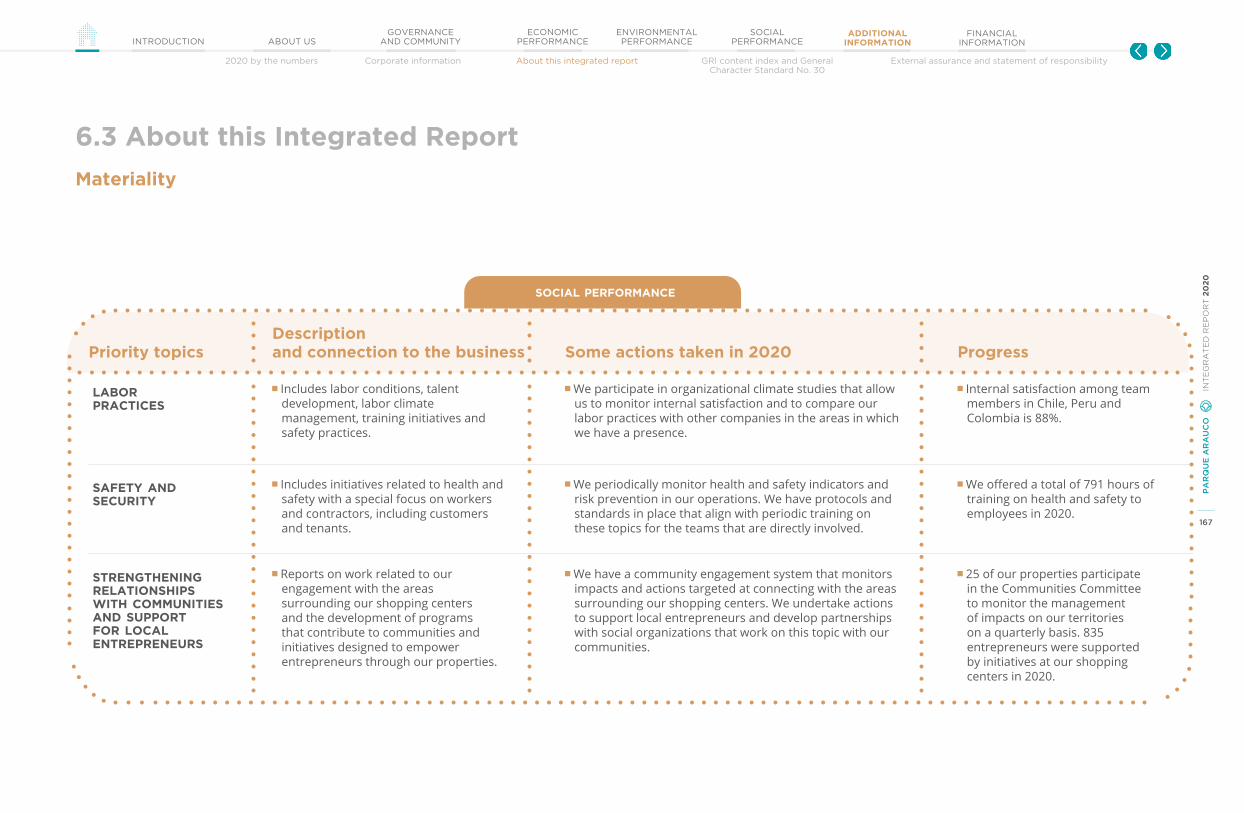
167
PA
RQ
UE
AR
AU
CO
IN
TE
GR
AT
ED
RE
PO
RT
20
20
GOVERNANCEAND COMMUNITYINTRODUCTION ABOUT US
ECONOMIC PERFORMANCE
ENVIRONMENTAL PERFORMANCE
SOCIAL PERFORMANCE
ADDITIONAL INFORMATION
FINANCIAL INFORMATION
2020 by the numbers Corporate information About this integrated report External assurance and statement of responsibilityGRI content index and General Character Standard No. 30
Materiality
6.3 About this Integrated Report
Priority topicsDescription and connection to the business Some actions taken in 2020 Progress
labor practices
Includes labor conditions, talent development, labor climate management, training initiatives and safety practices.
We participate in organizational climate studies that allow us to monitor internal satisfaction and to compare our labor practices with other companies in the areas in which we have a presence.
Internal satisfaction among team members in Chile, Peru and Colombia is 88%.
safety anD security
Includes initiatives related to health and safety with a special focus on workers and contractors, including customers and tenants.
We periodically monitor health and safety indicators and risk prevention in our operations. We have protocols and standards in place that align with periodic training on these topics for the teams that are directly involved.
We offered a total of 791 hours of training on health and safety to employees in 2020.
strengthening relationships with communities anD support for local entrepreneurs
Reports on work related to our engagement with the areas surrounding our shopping centers and the development of programs that contribute to communities and initiatives designed to empower entrepreneurs through our properties.
We have a community engagement system that monitors impacts and actions targeted at connecting with the areas surrounding our shopping centers. We undertake actions to support local entrepreneurs and develop partnerships with social organizations that work on this topic with our communities.
25 of our properties participate in the Communities Committee to monitor the management of impacts on our territories on a quarterly basis. 835 entrepreneurs were supported by initiatives at our shopping centers in 2020.
social performance
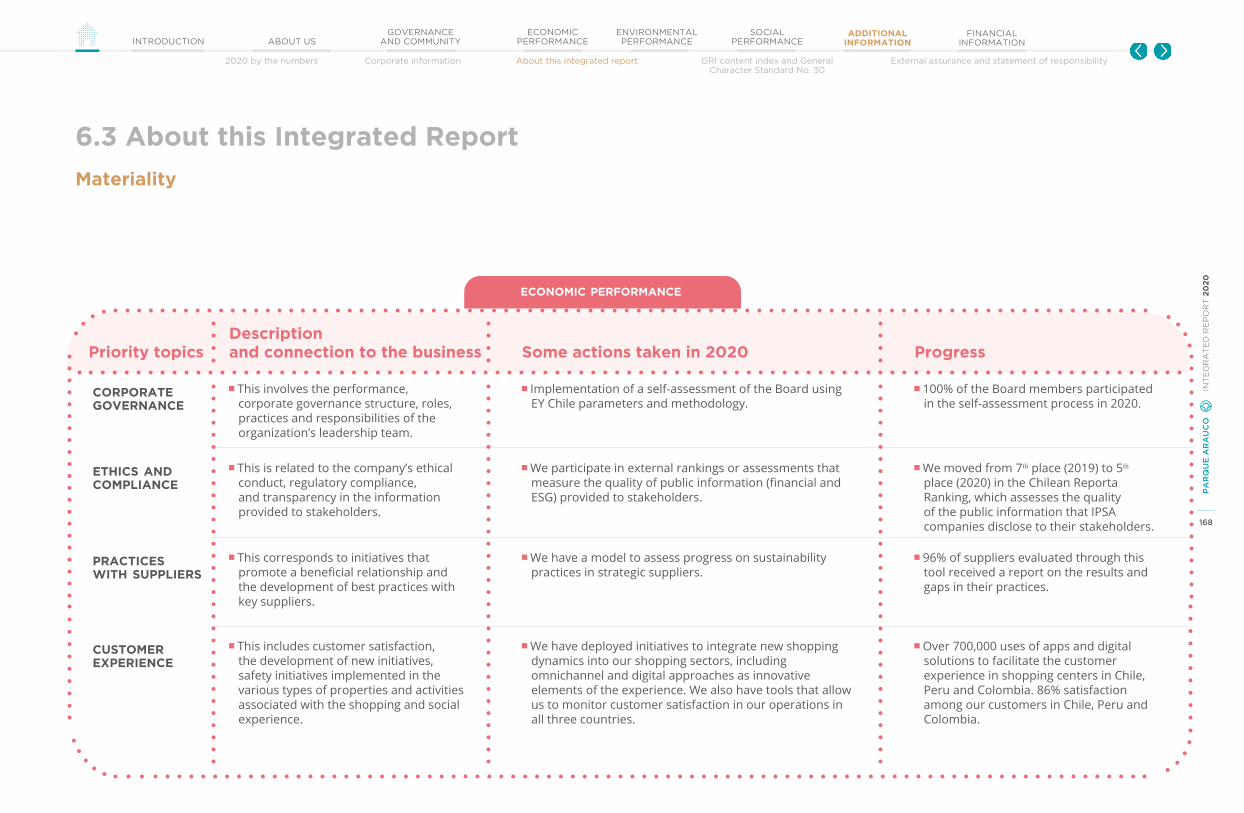
168
PA
RQ
UE
AR
AU
CO
IN
TE
GR
AT
ED
RE
PO
RT
20
20
GOVERNANCEAND COMMUNITYINTRODUCTION ABOUT US
ECONOMIC PERFORMANCE
ENVIRONMENTAL PERFORMANCE
SOCIAL PERFORMANCE
ADDITIONAL INFORMATION
FINANCIAL INFORMATION
2020 by the numbers Corporate information About this integrated report External assurance and statement of responsibilityGRI content index and General Character Standard No. 30
Materiality
6.3 About this Integrated Report
Priority topicsDescription and connection to the business Some actions taken in 2020 Progress
corporate goVernance
This involves the performance, corporate governance structure, roles, practices and responsibilities of the organization’s leadership team.
Implementation of a self-assessment of the Board using EY Chile parameters and methodology.
100% of the Board members participated in the self-assessment process in 2020.
ethics anD compliance
This is related to the company’s ethical conduct, regulatory compliance, and transparency in the information provided to stakeholders.
We participate in external rankings or assessments that measure the quality of public information (financial and ESG) provided to stakeholders.
We moved from 7th place (2019) to 5th place (2020) in the Chilean Reporta Ranking, which assesses the quality of the public information that IPSA companies disclose to their stakeholders.
practices with suppliers
This corresponds to initiatives that promote a beneficial relationship and the development of best practices with key suppliers.
We have a model to assess progress on sustainability practices in strategic suppliers.
96% of suppliers evaluated through this tool received a report on the results and gaps in their practices.
customer experience
This includes customer satisfaction, the development of new initiatives, safety initiatives implemented in the various types of properties and activities associated with the shopping and social experience.
We have deployed initiatives to integrate new shopping dynamics into our shopping sectors, including omnichannel and digital approaches as innovative elements of the experience. We also have tools that allow us to monitor customer satisfaction in our operations in all three countries.
Over 700,000 uses of apps and digital solutions to facilitate the customer experience in shopping centers in Chile, Peru and Colombia. 86% satisfaction among our customers in Chile, Peru and Colombia.
economic performance
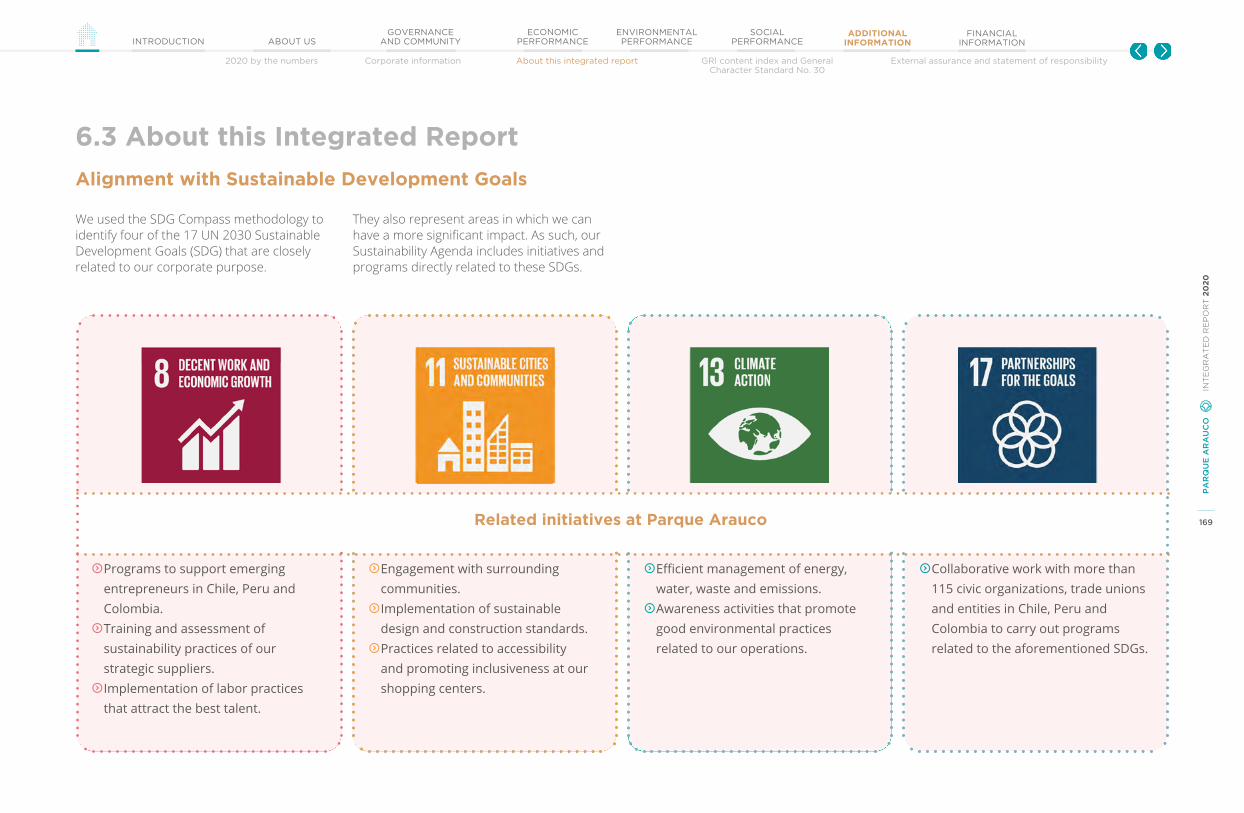
169
PA
RQ
UE
AR
AU
CO
IN
TE
GR
AT
ED
RE
PO
RT
20
20
GOVERNANCEAND COMMUNITYINTRODUCTION ABOUT US
ECONOMIC PERFORMANCE
ENVIRONMENTAL PERFORMANCE
SOCIAL PERFORMANCE
ADDITIONAL INFORMATION
FINANCIAL INFORMATION
2020 by the numbers Corporate information About this integrated report External assurance and statement of responsibilityGRI content index and General Character Standard No. 30
Alignment with Sustainable Development Goals
6.3 About this Integrated Report
We used the SDG Compass methodology to identify four of the 17 UN 2030 Sustainable Development Goals (SDG) that are closely related to our corporate purpose.
They also represent areas in which we can have a more significant impact. As such, our Sustainability Agenda includes initiatives and programs directly related to these SDGs.
Programs to support emerging entrepreneurs in Chile, Peru and Colombia. Training and assessment of sustainability practices of our strategic suppliers. Implementation of labor practices that attract the best talent.
Engagement with surrounding communities. Implementation of sustainable design and construction standards. Practices related to accessibility and promoting inclusiveness at our shopping centers.
Efficient management of energy, water, waste and emissions. Awareness activities that promote good environmental practices related to our operations.
Collaborative work with more than 115 civic organizations, trade unions and entities in Chile, Peru and Colombia to carry out programs related to the aforementioned SDGs.
Related initiatives at Parque Arauco
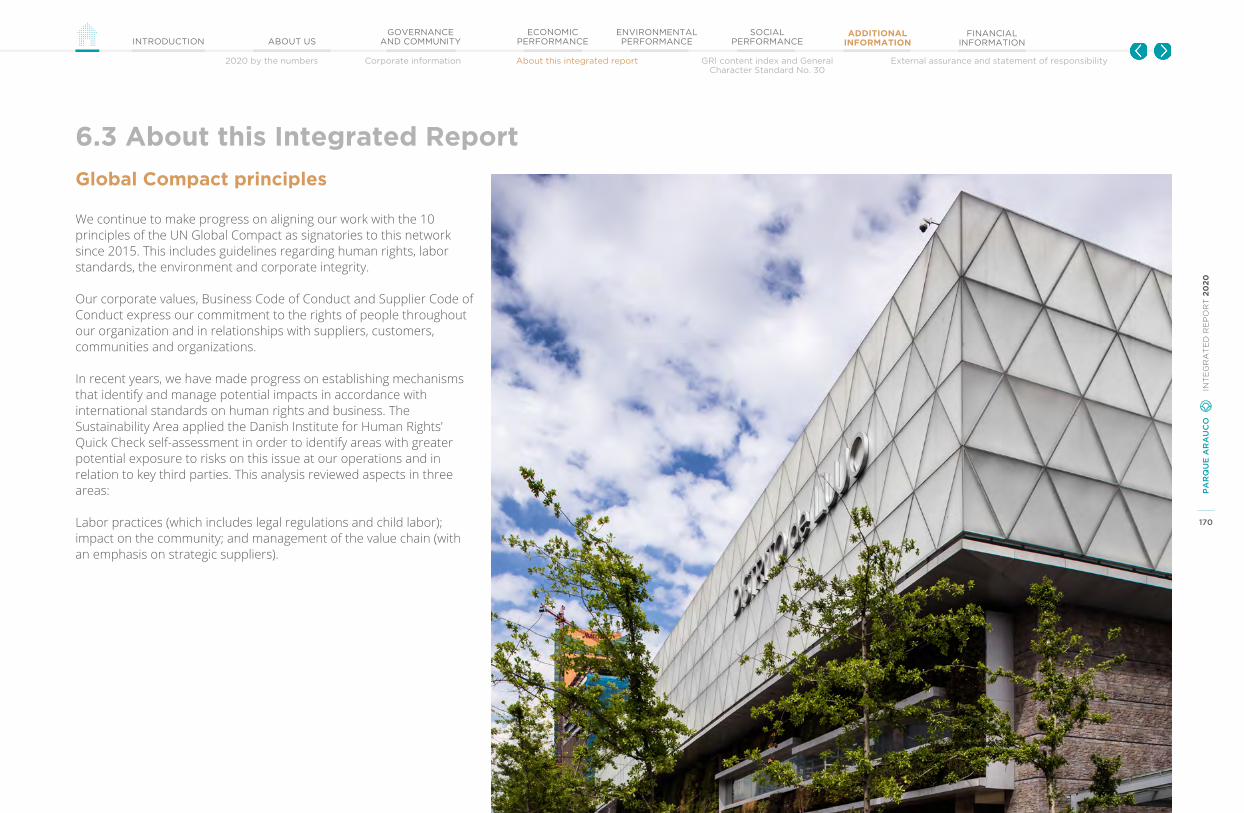
170
PA
RQ
UE
AR
AU
CO
IN
TE
GR
AT
ED
RE
PO
RT
20
20
GOVERNANCEAND COMMUNITYINTRODUCTION ABOUT US
ECONOMIC PERFORMANCE
ENVIRONMENTAL PERFORMANCE
SOCIAL PERFORMANCE
ADDITIONAL INFORMATION
FINANCIAL INFORMATION
2020 by the numbers Corporate information About this integrated report External assurance and statement of responsibilityGRI content index and General Character Standard No. 30
Global Compact principles
6.3 About this Integrated Report
We continue to make progress on aligning our work with the 10 principles of the UN Global Compact as signatories to this network since 2015. This includes guidelines regarding human rights, labor standards, the environment and corporate integrity.
Our corporate values, Business Code of Conduct and Supplier Code of Conduct express our commitment to the rights of people throughout our organization and in relationships with suppliers, customers, communities and organizations.
In recent years, we have made progress on establishing mechanisms that identify and manage potential impacts in accordance with international standards on human rights and business. The Sustainability Area applied the Danish Institute for Human Rights’ Quick Check self-assessment in order to identify areas with greater potential exposure to risks on this issue at our operations and in relation to key third parties. This analysis reviewed aspects in three areas:
Labor practices (which includes legal regulations and child labor); impact on the community; and management of the value chain (with an emphasis on strategic suppliers).
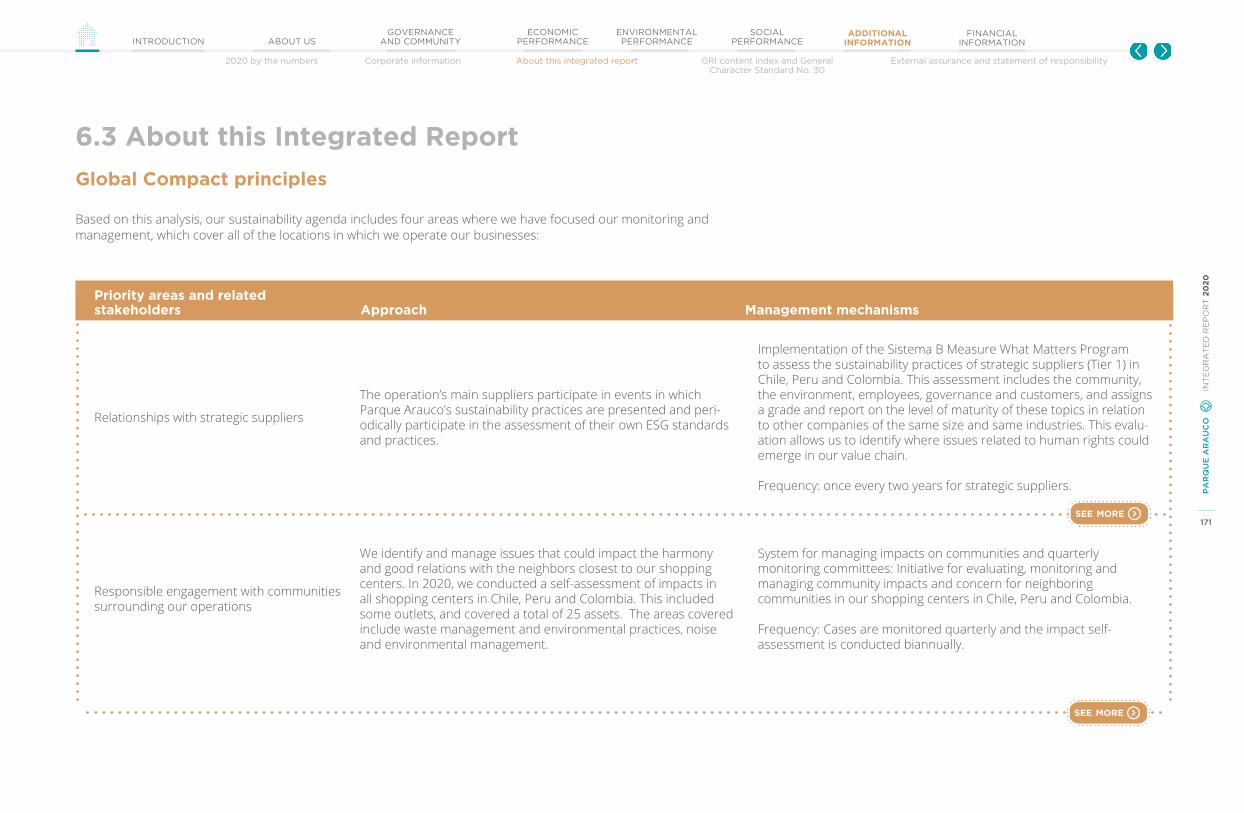
171
PA
RQ
UE
AR
AU
CO
IN
TE
GR
AT
ED
RE
PO
RT
20
20
GOVERNANCEAND COMMUNITYINTRODUCTION ABOUT US
ECONOMIC PERFORMANCE
ENVIRONMENTAL PERFORMANCE
SOCIAL PERFORMANCE
ADDITIONAL INFORMATION
FINANCIAL INFORMATION
2020 by the numbers Corporate information About this integrated report External assurance and statement of responsibilityGRI content index and General Character Standard No. 30
Global Compact principles
6.3 About this Integrated Report
Based on this analysis, our sustainability agenda includes four areas where we have focused our monitoring and management, which cover all of the locations in which we operate our businesses:
Priority areas and related stakeholders Approach Management mechanisms
Relationships with strategic suppliers
The operation’s main suppliers participate in events in which Parque Arauco’s sustainability practices are presented and peri-odically participate in the assessment of their own ESG standards and practices.
Implementation of the Sistema B Measure What Matters Program to assess the sustainability practices of strategic suppliers (Tier 1) in Chile, Peru and Colombia. This assessment includes the community, the environment, employees, governance and customers, and assigns a grade and report on the level of maturity of these topics in relation to other companies of the same size and same industries. This evalu-ation allows us to identify where issues related to human rights could emerge in our value chain.
Frequency: once every two years for strategic suppliers.
Responsible engagement with communities surrounding our operations
We identify and manage issues that could impact the harmony and good relations with the neighbors closest to our shopping centers. In 2020, we conducted a self-assessment of impacts in all shopping centers in Chile, Peru and Colombia. This included some outlets, and covered a total of 25 assets. The areas covered include waste management and environmental practices, noise and environmental management.
System for managing impacts on communities and quarterly monitoring committees: Initiative for evaluating, monitoring and managing community impacts and concern for neighboring communities in our shopping centers in Chile, Peru and Colombia.
Frequency: Cases are monitored quarterly and the impact self-assessment is conducted biannually.
see more
see more
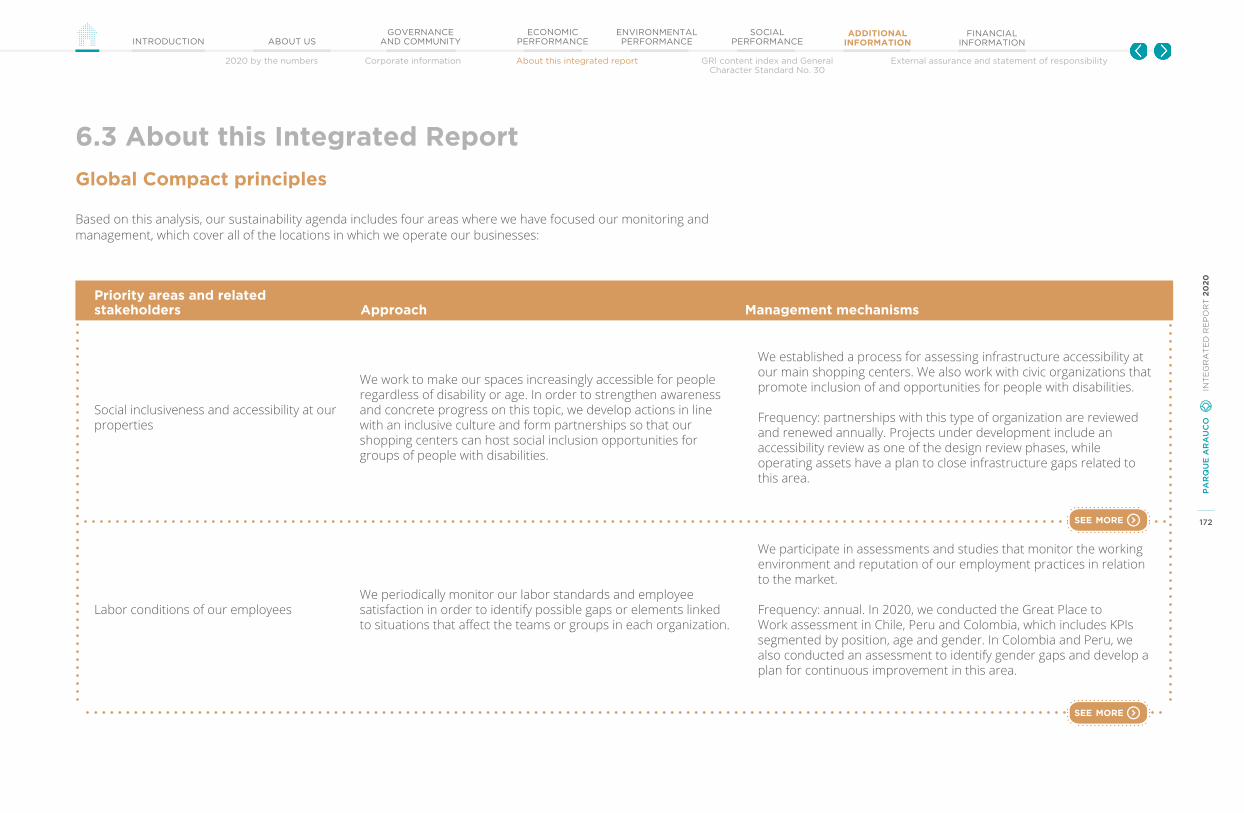
172
PA
RQ
UE
AR
AU
CO
IN
TE
GR
AT
ED
RE
PO
RT
20
20
GOVERNANCEAND COMMUNITYINTRODUCTION ABOUT US
ECONOMIC PERFORMANCE
ENVIRONMENTAL PERFORMANCE
SOCIAL PERFORMANCE
ADDITIONAL INFORMATION
FINANCIAL INFORMATION
2020 by the numbers Corporate information About this integrated report External assurance and statement of responsibilityGRI content index and General Character Standard No. 30
Global Compact principles
6.3 About this Integrated Report
Based on this analysis, our sustainability agenda includes four areas where we have focused our monitoring and management, which cover all of the locations in which we operate our businesses:
Priority areas and related stakeholders Approach Management mechanisms
Social inclusiveness and accessibility at our properties
We work to make our spaces increasingly accessible for people regardless of disability or age. In order to strengthen awareness and concrete progress on this topic, we develop actions in line with an inclusive culture and form partnerships so that our shopping centers can host social inclusion opportunities for groups of people with disabilities.
We established a process for assessing infrastructure accessibility at our main shopping centers. We also work with civic organizations that promote inclusion of and opportunities for people with disabilities.
Frequency: partnerships with this type of organization are reviewed and renewed annually. Projects under development include an accessibility review as one of the design review phases, while operating assets have a plan to close infrastructure gaps related to this area.
Labor conditions of our employeesWe periodically monitor our labor standards and employee satisfaction in order to identify possible gaps or elements linked to situations that affect the teams or groups in each organization.
We participate in assessments and studies that monitor the working environment and reputation of our employment practices in relation to the market.
Frequency: annual. In 2020, we conducted the Great Place to Work assessment in Chile, Peru and Colombia, which includes KPIs segmented by position, age and gender. In Colombia and Peru, we also conducted an assessment to identify gender gaps and develop a plan for continuous improvement in this area.
see more
see more
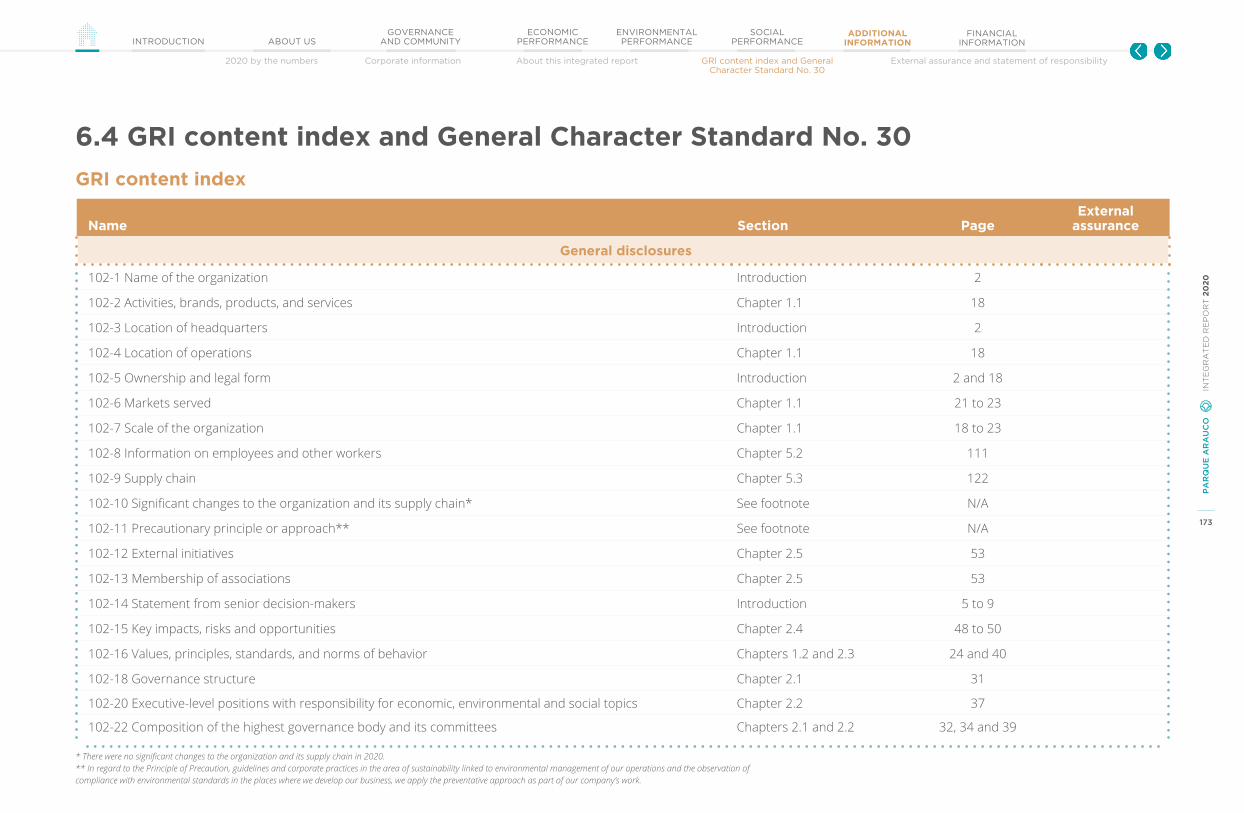
173
PA
RQ
UE
AR
AU
CO
IN
TE
GR
AT
ED
RE
PO
RT
20
20
GOVERNANCEAND COMMUNITYINTRODUCTION ABOUT US
ECONOMIC PERFORMANCE
ENVIRONMENTAL PERFORMANCE
SOCIAL PERFORMANCE
ADDITIONAL INFORMATION
FINANCIAL INFORMATION
2020 by the numbers Corporate information About this integrated report GRI content index and General Character Standard No. 30
External assurance and statement of responsibility
6.4 GRI content index and General Character Standard No. 30
GRI content index
Name Section PageExternal
assurance
General disclosures
102-1 Name of the organization Introduction 2
102-2 Activities, brands, products, and services Chapter 1.1 18
102-3 Location of headquarters Introduction 2
102-4 Location of operations Chapter 1.1 18
102-5 Ownership and legal form Introduction 2 and 18
102-6 Markets served Chapter 1.1 21 to 23
102-7 Scale of the organization Chapter 1.1 18 to 23
102-8 Information on employees and other workers Chapter 5.2 111
102-9 Supply chain Chapter 5.3 122
102-10 Significant changes to the organization and its supply chain* See footnote N/A
102-11 Precautionary principle or approach** See footnote N/A
102-12 External initiatives Chapter 2.5 53
102-13 Membership of associations Chapter 2.5 53
102-14 Statement from senior decision-makers Introduction 5 to 9
102-15 Key impacts, risks and opportunities Chapter 2.4 48 to 50
102-16 Values, principles, standards, and norms of behavior Chapters 1.2 and 2.3 24 and 40
102-18 Governance structure Chapter 2.1 31
102-20 Executive-level positions with responsibility for economic, environmental and social topics Chapter 2.2 37
102-22 Composition of the highest governance body and its committees Chapters 2.1 and 2.2 32, 34 and 39
* There were no significant changes to the organization and its supply chain in 2020. ** In regard to the Principle of Precaution, guidelines and corporate practices in the area of sustainability linked to environmental management of our operations and the observation of compliance with environmental standards in the places where we develop our business, we apply the preventative approach as part of our company’s work.

174
PA
RQ
UE
AR
AU
CO
IN
TE
GR
AT
ED
RE
PO
RT
20
20
GOVERNANCEAND COMMUNITYINTRODUCTION ABOUT US
ECONOMIC PERFORMANCE
ENVIRONMENTAL PERFORMANCE
SOCIAL PERFORMANCE
ADDITIONAL INFORMATION
FINANCIAL INFORMATION
2020 by the numbers Corporate information About this integrated report GRI content index and General Character Standard No. 30
External assurance and statement of responsibility
6.4 GRI content index and General Character Standard No. 30
GRI content index
Name Section PageExternal
assurance
General disclosures
102-23 Chair of the highest governance body Chapter 2.1 32
102-35 Compensation policies Chapter 6.2 149
102-40 List of stakeholder groups Chapter 2.5 52
102-41 Collective bargaining agreements Chapter 5.2 113
102-42 Identifying and selecting stakeholders Chapter 6.3 163
102-43 Approach to stakeholder engagement Chapter 6.3 163
102-44 Key topics and concerns raised Chapter 6.3 164
102-45 Entities included in the consolidated financial statements Chapter 6.3 162
102-46 Defining report content and topic boundaries Chapter 6.3 164
102-47 List of material aspects Chapter 6.3 164
102-48 Restatements of information Chapter 6.3 161
102-49 Changes in reporting Chapter 6.3 161
102-50 Reporting period Chapter 6.3 161
102-51 Date of most recent report Chapter 6.3 161
102-52 Reporting cycle Chapter 6.3 161
102-53 Contact point for questions regarding the report Introduction 2
102-54 Claims of reporting in accordance with the GRI Standards Chapter 6.3 161
102-55 GRI content index Chapter 6.4 173 to 176
102-56 External assurance Chapter 6.5 180
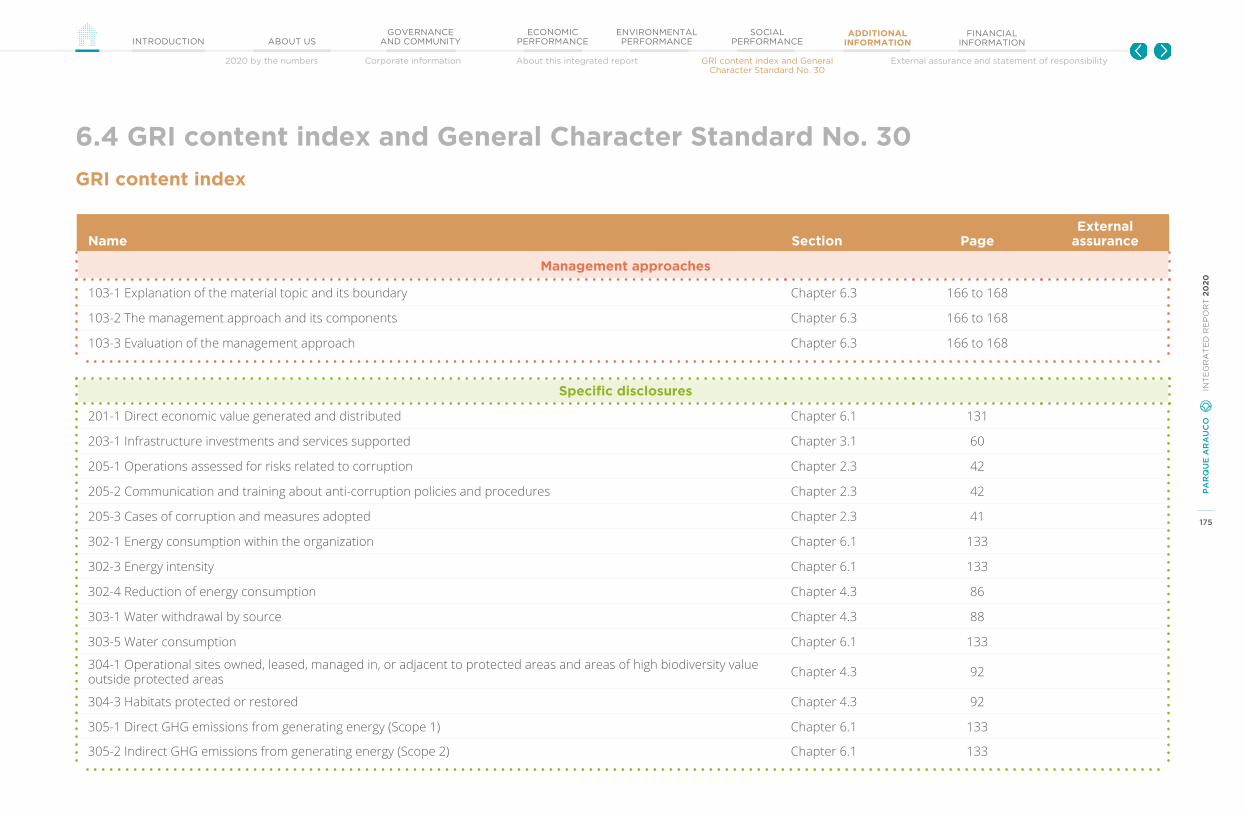
175
PA
RQ
UE
AR
AU
CO
IN
TE
GR
AT
ED
RE
PO
RT
20
20
GOVERNANCEAND COMMUNITYINTRODUCTION ABOUT US
ECONOMIC PERFORMANCE
ENVIRONMENTAL PERFORMANCE
SOCIAL PERFORMANCE
ADDITIONAL INFORMATION
FINANCIAL INFORMATION
2020 by the numbers Corporate information About this integrated report GRI content index and General Character Standard No. 30
External assurance and statement of responsibility
6.4 GRI content index and General Character Standard No. 30
GRI content index
Name Section PageExternal
assurance
Management approaches
103-1 Explanation of the material topic and its boundary Chapter 6.3 166 to 168
103-2 The management approach and its components Chapter 6.3 166 to 168
103-3 Evaluation of the management approach Chapter 6.3 166 to 168
Specific disclosures
201-1 Direct economic value generated and distributed Chapter 6.1 131
203-1 Infrastructure investments and services supported Chapter 3.1 60
205-1 Operations assessed for risks related to corruption Chapter 2.3 42
205-2 Communication and training about anti-corruption policies and procedures Chapter 2.3 42
205-3 Cases of corruption and measures adopted Chapter 2.3 41
302-1 Energy consumption within the organization Chapter 6.1 133
302-3 Energy intensity Chapter 6.1 133
302-4 Reduction of energy consumption Chapter 4.3 86
303-1 Water withdrawal by source Chapter 4.3 88
303-5 Water consumption Chapter 6.1 133
304-1 Operational sites owned, leased, managed in, or adjacent to protected areas and areas of high biodiversity value outside protected areas Chapter 4.3 92
304-3 Habitats protected or restored Chapter 4.3 92
305-1 Direct GHG emissions from generating energy (Scope 1) Chapter 6.1 133
305-2 Indirect GHG emissions from generating energy (Scope 2) Chapter 6.1 133
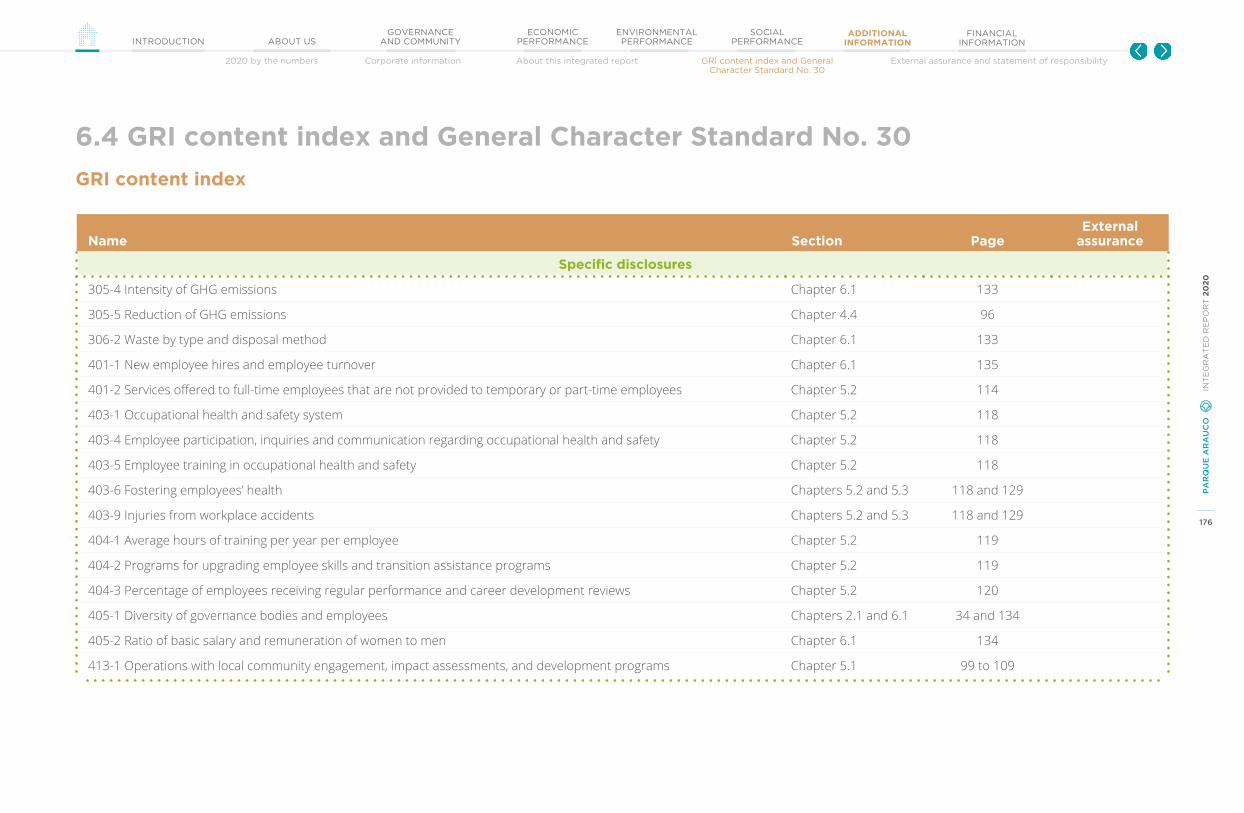
176
PA
RQ
UE
AR
AU
CO
IN
TE
GR
AT
ED
RE
PO
RT
20
20
GOVERNANCEAND COMMUNITYINTRODUCTION ABOUT US
ECONOMIC PERFORMANCE
ENVIRONMENTAL PERFORMANCE
SOCIAL PERFORMANCE
ADDITIONAL INFORMATION
FINANCIAL INFORMATION
2020 by the numbers Corporate information About this integrated report GRI content index and General Character Standard No. 30
External assurance and statement of responsibility
6.4 GRI content index and General Character Standard No. 30
GRI content index
Name Section PageExternal
assurance
Specific disclosures
305-4 Intensity of GHG emissions Chapter 6.1 133
305-5 Reduction of GHG emissions Chapter 4.4 96
306-2 Waste by type and disposal method Chapter 6.1 133
401-1 New employee hires and employee turnover Chapter 6.1 135
401-2 Services offered to full-time employees that are not provided to temporary or part-time employees Chapter 5.2 114
403-1 Occupational health and safety system Chapter 5.2 118
403-4 Employee participation, inquiries and communication regarding occupational health and safety Chapter 5.2 118
403-5 Employee training in occupational health and safety Chapter 5.2 118
403-6 Fostering employees’ health Chapters 5.2 and 5.3 118 and 129
403-9 Injuries from workplace accidents Chapters 5.2 and 5.3 118 and 129
404-1 Average hours of training per year per employee Chapter 5.2 119
404-2 Programs for upgrading employee skills and transition assistance programs Chapter 5.2 119
404-3 Percentage of employees receiving regular performance and career development reviews Chapter 5.2 120
405-1 Diversity of governance bodies and employees Chapters 2.1 and 6.1 34 and 134
405-2 Ratio of basic salary and remuneration of women to men Chapter 6.1 134
413-1 Operations with local community engagement, impact assessments, and development programs Chapter 5.1 99 to 109
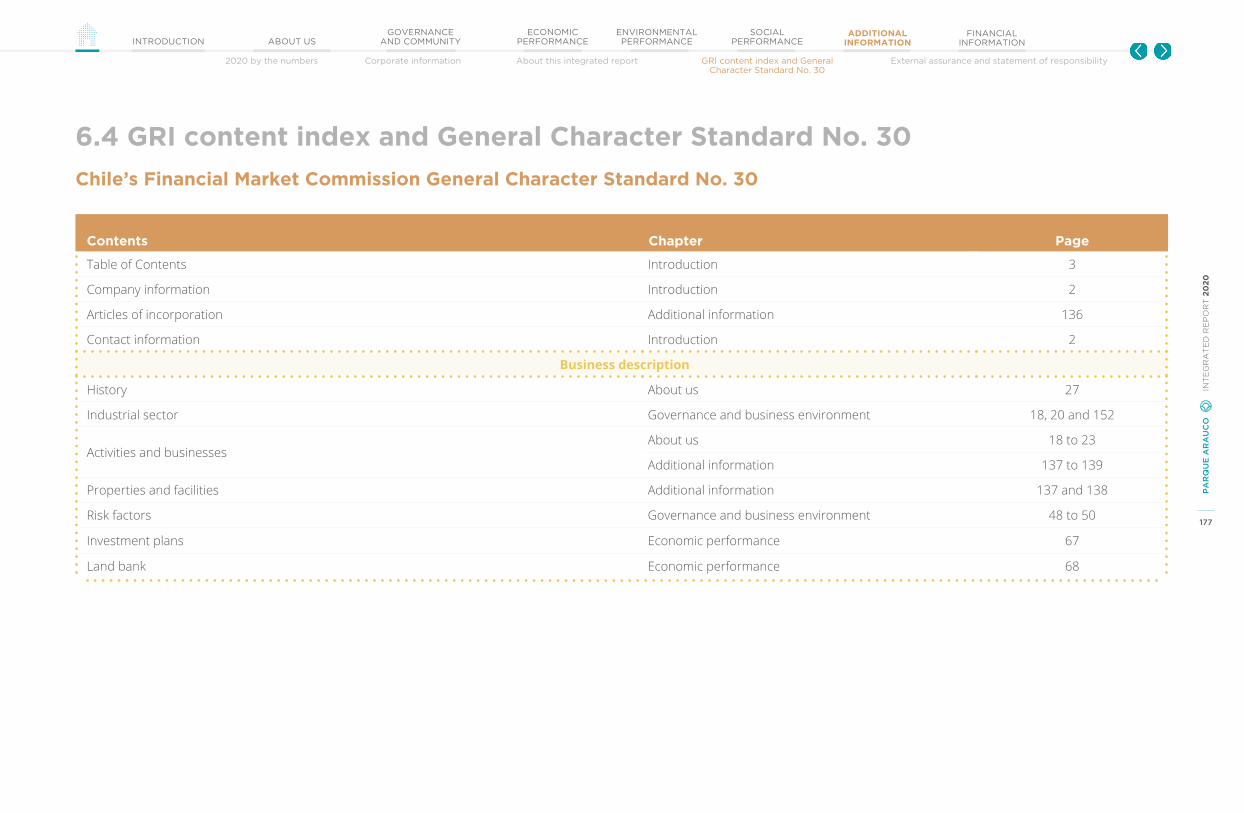
177
PA
RQ
UE
AR
AU
CO
IN
TE
GR
AT
ED
RE
PO
RT
20
20
GOVERNANCEAND COMMUNITYINTRODUCTION ABOUT US
ECONOMIC PERFORMANCE
ENVIRONMENTAL PERFORMANCE
SOCIAL PERFORMANCE
ADDITIONAL INFORMATION
FINANCIAL INFORMATION
2020 by the numbers Corporate information About this integrated report GRI content index and General Character Standard No. 30
External assurance and statement of responsibility
6.4 GRI content index and General Character Standard No. 30
Chile’s Financial Market Commission General Character Standard No. 30
Contents Chapter Page
Table of Contents Introduction 3
Company information Introduction 2
Articles of incorporation Additional information 136
Contact information Introduction 2
Business description
History About us 27
Industrial sector Governance and business environment 18, 20 and 152
Activities and businessesAbout us 18 to 23
Additional information 137 to 139
Properties and facilities Additional information 137 and 138
Risk factors Governance and business environment 48 to 50
Investment plans Economic performance 67
Land bank Economic performance 68
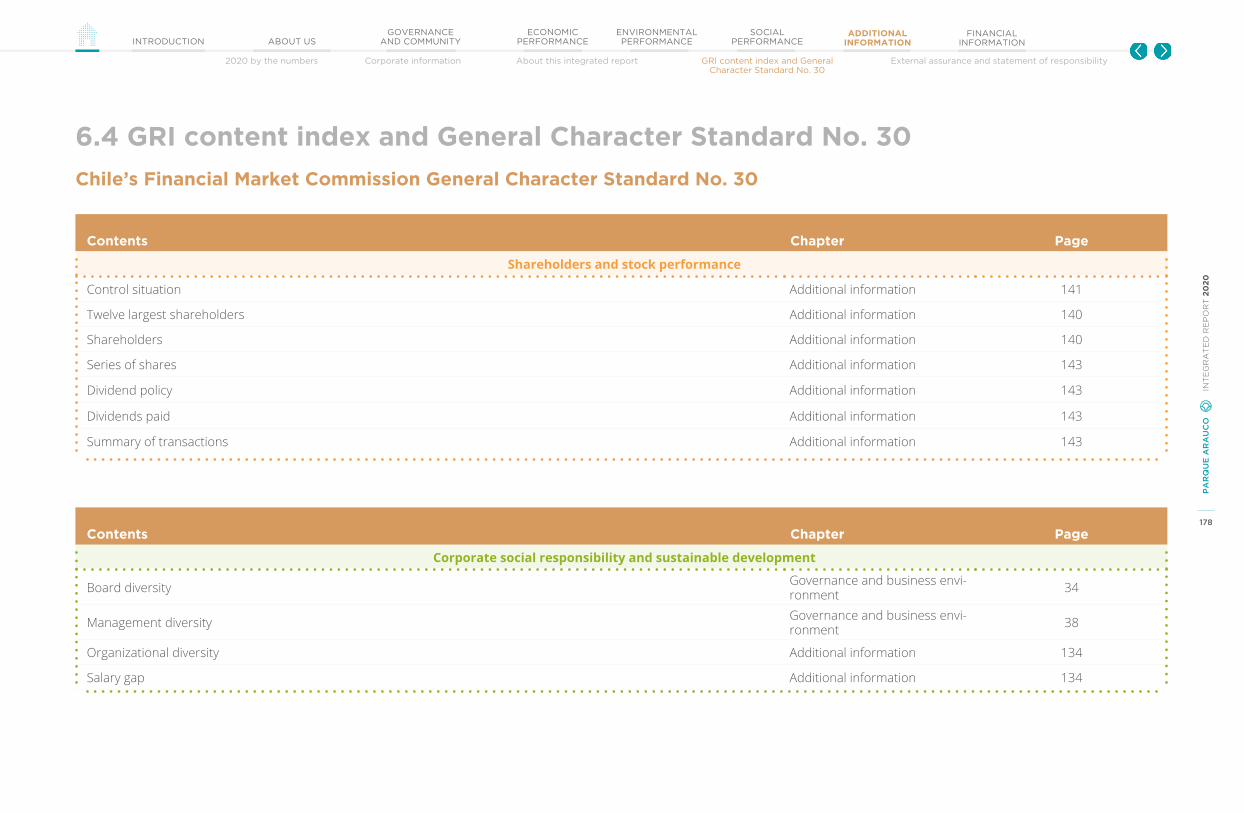
178
PA
RQ
UE
AR
AU
CO
IN
TE
GR
AT
ED
RE
PO
RT
20
20
GOVERNANCEAND COMMUNITYINTRODUCTION ABOUT US
ECONOMIC PERFORMANCE
ENVIRONMENTAL PERFORMANCE
SOCIAL PERFORMANCE
ADDITIONAL INFORMATION
FINANCIAL INFORMATION
2020 by the numbers Corporate information About this integrated report GRI content index and General Character Standard No. 30
External assurance and statement of responsibility
6.4 GRI content index and General Character Standard No. 30
Contents Chapter Page
Shareholders and stock performance
Control situation Additional information 141
Twelve largest shareholders Additional information 140
Shareholders Additional information 140
Series of shares Additional information 143
Dividend policy Additional information 143
Dividends paid Additional information 143
Summary of transactions Additional information 143
Contents Chapter Page
Corporate social responsibility and sustainable development
Board diversity Governance and business envi-ronment 34
Management diversity Governance and business envi-ronment 38
Organizational diversity Additional information 134
Salary gap Additional information 134
Chile’s Financial Market Commission General Character Standard No. 30

179
PA
RQ
UE
AR
AU
CO
IN
TE
GR
AT
ED
RE
PO
RT
20
20
GOVERNANCEAND COMMUNITYINTRODUCTION ABOUT US
ECONOMIC PERFORMANCE
ENVIRONMENTAL PERFORMANCE
SOCIAL PERFORMANCE
ADDITIONAL INFORMATION
FINANCIAL INFORMATION
2020 by the numbers Corporate information About this integrated report GRI content index and General Character Standard No. 30
External assurance and statement of responsibility
6.4 GRI content index and General Character Standard No. 30
Contents Chapter Page
Personnel management
Organizational chart Governance and business environment 35
Board of directorsGovernance and business environment 32 to 34
Additional information 144 and 145
Directors’ CommitteeGovernance and business environment 34
Additional information 135 and 149 to 151
Senior executivesGovernance and business environment 36
Additional information 149 to 151
Contents Chapter Page
Information on subsidiaries and related entities Additional information 153 to 159
Information on material events Additional information 148
Financial information Financial statements 182 to end
Statement of responsibility Additional information 181
Chile’s Financial Market Commission General Character Standard No. 30
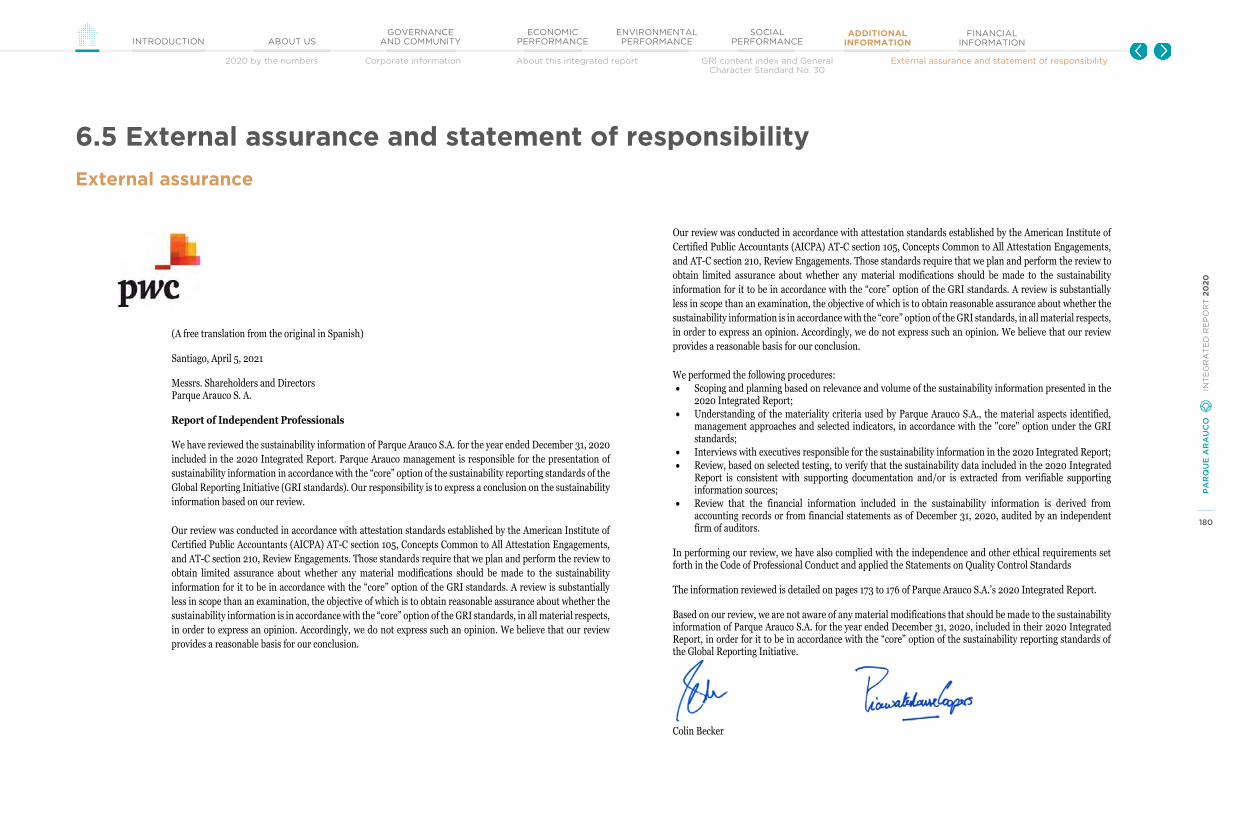
180
PA
RQ
UE
AR
AU
CO
IN
TE
GR
AT
ED
RE
PO
RT
20
20
GOVERNANCEAND COMMUNITYINTRODUCTION ABOUT US
ECONOMIC PERFORMANCE
ENVIRONMENTAL PERFORMANCE
SOCIAL PERFORMANCE
ADDITIONAL INFORMATION
FINANCIAL INFORMATION
2020 by the numbers Corporate information About this integrated report External assurance and statement of responsibilityGRI content index and General Character Standard No. 30
6.5 External assurance and statement of responsibility
External assurance
(A free translation from the original in Spanish) Santiago, April 5, 2021 Messrs. Shareholders and Directors Parque Arauco S. A. Report of Independent Professionals We have reviewed the sustainability information of Parque Arauco S.A. for the year ended December 31, 2020 included in the 2020 Integrated Report. Parque Arauco management is responsible for the presentation of sustainability information in accordance with the “core” option of the sustainability reporting standards of the Global Reporting Initiative (GRI standards). Our responsibility is to express a conclusion on the sustainability information based on our review.
Our review was conducted in accordance with attestation standards established by the American Institute of Certified Public Accountants (AICPA) AT-C section 105, Concepts Common to All Attestation Engagements, and AT-C section 210, Review Engagements. Those standards require that we plan and perform the review to obtain limited assurance about whether any material modifications should be made to the sustainability information for it to be in accordance with the “core” option of the GRI standards. A review is substantially less in scope than an examination, the objective of which is to obtain reasonable assurance about whether the sustainability information is in accordance with the “core” option of the GRI standards, in all material respects, in order to express an opinion. Accordingly, we do not express such an opinion. We believe that our review provides a reasonable basis for our conclusion.
We performed the following procedures: • Scoping and planning based on relevance and volume of the sustainability information presented in the
2020 Integrated Report; • Understanding of the materiality criteria used by Parque Arauco S.A., the material aspects identified,
management approaches and selected indicators, in accordance with the "core" option under the GRI standards;
• Interviews with executives responsible for the sustainability information in the 2020 Integrated Report; • Review, based on selected testing, to verify that the sustainability data included in the 2020 Integrated
Report is consistent with supporting documentation and/or is extracted from verifiable supporting information sources;
• Review that the financial information included in the sustainability information is derived from accounting records or from financial statements as of December 31, 2020, audited by an independent firm of auditors.
In performing our review, we have also complied with the independence and other ethical requirements set forth in the Code of Professional Conduct and applied the Statements on Quality Control Standards The information reviewed is detailed on pages 173 to 176 of Parque Arauco S.A.’s 2020 Integrated Report. Based on our review, we are not aware of any material modifications that should be made to the sustainability information of Parque Arauco S.A. for the year ended December 31, 2020, included in their 2020 Integrated Report, in order for it to be in accordance with the “core” option of the sustainability reporting standards of the Global Reporting Initiative.
Colin Becker

181
PA
RQ
UE
AR
AU
CO
IN
TE
GR
AT
ED
RE
PO
RT
20
20
GOVERNANCEAND COMMUNITYINTRODUCTION ABOUT US
ECONOMIC PERFORMANCE
ENVIRONMENTAL PERFORMANCE
SOCIAL PERFORMANCE
ADDITIONAL INFORMATION
FINANCIAL INFORMATION
2020 by the numbers Corporate information About this integrated report External assurance and statement of responsibilityGRI content index and General Character Standard No. 30
6.5 External assurance and statement of responsibility
Statement of responsibility
In accordance with Financial Market Commission General Character Standard No. 30, the undersigned declare themselves responsible for the veracity of the information contained herein as of December 31, 2020.
salVaDor saiD somaVía
Chairmanana beatriz holuigue barros
Independent DirectorfernanDo massú taré
Independent Director
roDrigo muñoz muñoz
Director
guillermo saiD yarur
Director
Juan antonio ÁlVarez aVenDaño
Executive Vice President
luis hernÁn paúl fresno
Independent DirectorJosé Domingo eluchans urenDa
Director
orlanDo sÁenz roJas
Director

182
PA
RQ
UE
AR
AU
CO
IN
TE
GR
AT
ED
RE
PO
RT
20
20
GOVERNANCEAND COMMUNITYINTRODUCTION ABOUT US
ECONOMIC PERFORMANCE
ENVIRONMENTAL PERFORMANCE
SOCIAL PERFORMANCE
ADDITIONAL INFORMATION
FINANCIAL INFORMATION
Management analysis Independent auditors’ report Consolidated financial statements Summarized financial statements of subsidiaries
Financialinformation
7.1 Earnings release
7.3 Consolidated financial statements
7.2 Independent auditors’ report
7.4 Summarized financial statements of subsidiaries
1.
183
PA
RQ
UE
AR
AU
CO
IN
TE
GR
AT
ED
RE
PO
RT
20
20
GOVERNANCEAND COMMUNITYINTRODUCTION ABOUT US
ECONOMIC PERFORMANCE
ENVIRONMENTAL PERFORMANCE
SOCIAL PERFORMANCE
ADDITIONAL INFORMATION
FINANCIAL INFORMATION
Management analysis Independent auditors’ report Consolidated financial statements Summarized financial statements of subsidiaries
Earnings release
183
PA
RQ
UE
AR
AU
CO
IN
TE
GR
AT
ED
RE
PO
RT
20
20
7.1
184
PA
RQ
UE
AR
AU
CO
IN
TE
GR
AT
ED
RE
PO
RT
20
20
GOVERNANCEAND COMMUNITYINTRODUCTION ABOUT US
ECONOMIC PERFORMANCE
ENVIRONMENTAL PERFORMANCE
SOCIAL PERFORMANCE
ADDITIONAL INFORMATION
FINANCIAL INFORMATION
Management analysis Independent auditors’ report Consolidated financial statements Summarized financial statements of subsidiaries
Disclaimer
This document has been prepared by Parque Arauco forthe purpose of providing general information about thecompany. The Company assumes no responsibility for, ormakes any representation or warranty, express or implied,with respect to the accuracy, adequacy or completeness ofthe information contained herein. The Company expresslydisclaims any liability based on such information, errorstherein or omissions therefrom.
This presentation includes certain statements, estimatesand forecasts provided by the Company with respect toits anticipated future performance and involves significantelements or subjective judgment and analysis that may ormay not prove to be accurate or correct. There can be noassurance that these statements, estimates and forecastswill be attained and actual outcomes and results may differmaterially from what is estimated or forecast herein.
The information contained herein has been prepared toassist interested parties in making their own evaluation ofthe company and does not purport to be all - inclusive orto contain all the information that a potential counterpartymay desire. In all cases, interested parties should conducttheir own independent investigation and analysis of theCompany. Interested parties can only rely on the resultof their own investigation and the representations andwarranties.
3

185
PA
RQ
UE
AR
AU
CO
IN
TE
GR
AT
ED
RE
PO
RT
20
20
GOVERNANCEAND COMMUNITYINTRODUCTION ABOUT US
ECONOMIC PERFORMANCE
ENVIRONMENTAL PERFORMANCE
SOCIAL PERFORMANCE
ADDITIONAL INFORMATION
FINANCIAL INFORMATION
Management analysis Independent auditors’ report Consolidated financial statements Summarized financial statements of subsidiaries
Executive SummaryDuring 2020, we lived the Covid19 pandemic with a day-to-day disruption in our malls, having to partially or totally close assets, which affected our Revenue.
Operationally, our capacity was reduced, averaging, around 60% of GLA open to the public during the year. This directly impacted our operating and financial figures, registering their lowest levels during the second quarter and with sustained increases since then, to end the year with an average GLA open to the public of 75%.
At the same time, we highlight having been the first Company to reopen the public bond market in Chile during the pandemic, while maintaining our risk classification of AA and continuing to promote sustainability initiatives, which have allowed us to remain in the FTSE4Good Emerging Markets Index and the Dow Jones Sustainability index.
Pandemic action plan:
During the year, we executed initiatives of our pandemic action plan under three pillars, with some that persist today:
CCoommmmiittmmeenntt ttoo PPeeooppllee:: We have put a special focus on taking care of our employees, our tenants and visitors, with initiatives to maintain jobs, to ensure availability of buses close to our operators when necessary, to deepen the relationship with nearby communities, to organize special donations and to closely monitor health protocols. In this context, we have been
fortunate to finish the year without having any complex cases of Covid19 in our company.OOppeerraattiioonnaall CCoonnttiinnuuiittyy:: We were active in opening our malls as soon as possible and maximizing operational continuity. In this way, we implemented initiatives to facilitate sales, such as Arauco Pickup, ticketless parking and last mile delivery agreements for different assets, along with a special effort to stay close to our tenants to help them overcome this crisis.
FFiinnaanncciiaall SSttrreennggtthh:: We refinanced 2020 and 2021 maturities and amortizations, increasing the Company's liquidity to a high of US$750 million. As the pandemic situation improved, vaccination expectations increased and we returned to operational levels closer to normal, we have been prepaying debts, reducing cash to a current level of US$ 500 million. We hope to continue this during 2021.
Quarterly results:
On average and in consolidated terms, the GLA open to the public in the period was 75% in the fourth quarter, growing from 25% in the second quarter and 50% in the third. Similar to previous quarters, in the fourth quarter, our financial indicators are in line with GLA open to the public, which was 75%.
Tenant sales were CLP$ 569,129 million, representing a relevant 96.8% of the sales observed in the same quarter of the previous year, driven by Chile. Based on these levels, the same store sales indicator was 8.6% in Chile, 0.7% in Peru and -10.6% in Colombia.
The Company's Revenue register CLP$ 43,460 million, 75.1% of that reported in the fourth quarter of the previous year, in line with the GLA open to the public.
Likewise, collection levels increased in line with the higher billing in the quarter. This being one of the factors that allowed accounts receivable net of provision for bad debts to decrease by 23% compared to the previous year.
Cost of sales and administrative expenses were CLP$ 15,949, a decrease of 5.6%. Net of the value of the provision for bad debts recorded in the quarter for CLP$ 2,080, total costs and expenses decreased 14.4%. In particular, the cost of sales were CLP$ 8,316 million, 20.4% lower than the previous year, while administrative expenses net of provision for bad debts also decreased 3.7%. Considering this provision, administrative expenses were CLP$ 7,633 million, growing 18.3% compared to the previous year.
The Company's EBITDA was CLP$28,789 million, representing 68.1% of the same period of the previous year.
Finally, FFO attributable to shareholders was CLP$21,850 million, 36.2% lower than the previous year, while the net profit attributable to shareholders was CLP$14,926 million.
185
PA
RQ
UE
AR
AU
CO
IN
TE
GR
AT
ED
RE
PO
RT
20
20

186
PA
RQ
UE
AR
AU
CO
IN
TE
GR
AT
ED
RE
PO
RT
20
20
GOVERNANCEAND COMMUNITYINTRODUCTION ABOUT US
ECONOMIC PERFORMANCE
ENVIRONMENTAL PERFORMANCE
SOCIAL PERFORMANCE
ADDITIONAL INFORMATION
FINANCIAL INFORMATION
Management analysis Independent auditors’ report Consolidated financial statements Summarized financial statements of subsidiaries
4Q20 4Q19 Chg.% 2020 2019 Chg.%EBITDA Margin (%) 66.2% 73.0% (676) 52.1% 73.2% (2,111)Net income margin (%) 36.2% 91.8% (5,561) 3.4% 50.9% (4,752)Adjusted FFO margin (%) 52.4% 58.8% (644) 25.2% 57.6% (3,241)Owned mall NOI (Ch$ million)1 35,372 50,656 (30.2%) 90,030 181,277 (50.3%)Owned GLA (m²)2 1,031,700 1,026,540 0.5% 1,031,700 1,026,540 0.5%Controlling FFO (Ch$ million) 3 21,850 34,270 (36.2%) 29,122 112,720 (74.2%)Consolidated NOI (Ch$ million)4 31,037 47,053 (34.0%) 72,115 167,490 (56.9%)Consolidated GLA (m²)5 1,071,500 1,075,500 (0.4%) 1,071,500 1,075,500 (0.4%)Total tenant sales (Ch$ million)6 569,129 588,160 (3.2%) 1,360,986 2,059,785 (33.9%)Weighted average shares basic (million) 905.7 904.2 0.2% 905.7 904.2 0.2%EPS (Ch$)7 16.5 53.8 (69.4%) 2.0 103.4 (98.0%)Dividend yield (Dividend return LTM / last share price) 2.15% 2.05% 10 2.95% 1.92% 104Stock price (Ch$) 1,163 1,850 (37.1%) 1,163 1,850 (37.1%)Market capitalization (Ch$ billion) 1,053 1,673 (37.0%) 1,053 1,673 (37.0%)Daily traded volume (Ch$ million) 2,225 2,684 (17.1%) 2,480 1,689 46.8%
1. The sum of the controlled portion of the NOI of our malls, in addition to the NOI proportional to our participation in the Marina Group. This does not include corporate overhead.
2. GLA of Grupo Marina is included
3. FFO = Net Profit – Depreciation & Amortization – Other Income/expenses – Share of Profit (Loss) of Associates Accounted –Foreign Exchange Differences – Income (Loss) for indexed assets and liabilities – Gains (losses) from the difference betweenthe previous book value and the fair value of financial assets – Deferred tax + Associates accounted Adjusted Ffo.
4. NOI = Revenue + Cost of Sales + Administration Expenses - Depreciation & Amortization + Associatesaccounted NOI.
5. GLA of Grupo Marina not included.
6. Total tenant sales = sales of tenants in our malls.
7. EPS = Net income attributable to the equity holders of the company/weighted average number of shares
Financial and Operational Analysis
Key Performance Indicators

187
PA
RQ
UE
AR
AU
CO
IN
TE
GR
AT
ED
RE
PO
RT
20
20
GOVERNANCEAND COMMUNITYINTRODUCTION ABOUT US
ECONOMIC PERFORMANCE
ENVIRONMENTAL PERFORMANCE
SOCIAL PERFORMANCE
ADDITIONAL INFORMATION
FINANCIAL INFORMATION
Management analysis Independent auditors’ report Consolidated financial statements Summarized financial statements of subsidiariesPARQUE ARAUCO Earnings Results Report 4Q20
Total tenant sales during the fourth quarter reached Ch$ 569,129 million, reaching 96.8% of the value reported in the same period of the previous year.
On average, the GLA open to the public was approximately 75% during the fourth quarter, increasing compared to the second and third quarters, which were approximately 25% and 50% respectively. The fourth quarter began with a GLA open to the public of 66.2% at a consolidated level and closed the period with
76.2%, which drove growth in sales and revenues for the Company.
Same Store Sales (SSS) was positive in Chile and Peru and negative in Colombia, being 8.6% in Chile, 0.7% in Peru, and -10.6% in Colombia. In general, Chile and Peru have performed better relative to Colombia due to a greater presence of anchor stores, which have had better sales levels in supermarkets and home improvement stores.
The SSS indicator was calculated considering only those tenants who were able to sell in person or by delivery for at least one day of the period, which represented 90.8% of sales in the fourth quarter of last year.
Same Store Rent (SSR) was -14.8% in Chile, -19.0% in Peru, and -5.6% in Colombia.
-6.1% -11.1%
-42.8% -43.5%
8.6%0.1%
-14.9%
-52.9%
-16.4%
0.7%12.4%
-6.6%
-83.2%
-41.3%
-10.6%-3.4%
-11.9%
-43.6%
-58.8%
-14.8%
5.3%
-13.3%
-57.0%
-37.7%
-19.0%
10.2%
-5.5%
-69.2%
-46.0%
-5.6%
4Q19 1Q20 2Q20 3Q20 4Q20 4Q19 1Q20 2Q20 3Q20 4Q20 4Q19 1Q20 2Q20 3Q20 4Q20
Same Store Rent Nominal (Chg.%)Same Store Sales Nominal (Chg.%)
Same Store RentNominal (Chg.%)
Same Store Sales Nominal (Chg.%)
Same Store RentNominal (Chg.%)
Same Store Sales Nominal (Chg.%)
2,059,785
1,360,986
2019 2020
588,160569,129
4Q19 4Q20
Financial and Operational Analysis
1
* Tenant sales in Peru and Colombia are expressed in CLPusing the following exchange rates: US$ 1 = CLP 731.92; US$ 1 =PEN 3.60; US$ 1 = COP 3,457.92.
TENANT SALES (MMCh$)
CHILE1 PERU COLOMBIA
-3.2% -33.9%
1) Same Store Sales and Same Store Rent for 4Q19, 1Q20 do not include Arauco Quilicura since the majority of the mall is closed due to incidents related to the social crisis in Chile.2) SSS y SSR in 2Q20, 3Q20 and 4Q20 consider tenants that opened to the public or sold via delivery at least one day during the period. Furthermore, the methodolgy was adjusted from a month to month comparison to one that includes
the sales and m2 with sales of the entire quarter.
Same Store Sales & Same Store Rent
Tenant Sales

188
PA
RQ
UE
AR
AU
CO
IN
TE
GR
AT
ED
RE
PO
RT
20
20
GOVERNANCEAND COMMUNITYINTRODUCTION ABOUT US
ECONOMIC PERFORMANCE
ENVIRONMENTAL PERFORMANCE
SOCIAL PERFORMANCE
ADDITIONAL INFORMATION
FINANCIAL INFORMATION
Management analysis Independent auditors’ report Consolidated financial statements Summarized financial statements of subsidiaries
1. Occupancy cost calculation: (fixed rent + variable rent + common expenses + promotion fund)/ sales
Occupancy Cost is a relevant performance measurement in the real estate industry as it allows the measurement of our tenants’ financial health. This indicator measures the relevance of what tenants pay in rent in relation to their sales. Specifically, it is calculated as the minimum rent, plus variable rent, plus common expenses, plus the promotion fund tenants pay to Parque Araucodivided by the sales of the tenant. Despite the pandemic, we have remained close to our tenants, reaching short term agreements in order to maintain a healthy occupancy cost.
As in the previous quarter, we calculated occupancy cost only for stores that were open to public for at least one day during the period.
For Chile and Peru, when comparing this indicator with the fourth quarter of 2019, the occupancy cost decreased significantly, with indicators of 8.4% and 5.8% respectively. This is due to the higher sales registered in the period, compared to the previous year, and especially for Chile, which had the effects of the social crisis during 2019.
In the case of Colombia, the occupancy cost decreased to 9.4%, which is higher than that of Chile and Peru, mainly because anchor stores represent a lower relative weight in this country.
OCCUPANCY COST1 (%)
CHILE PERU COLOMBIA
Financial and Operational Analysis
Occupancy Cost10.5%
8.4%7.5%
5.8%
9.9% 9.4%
4Q19 4Q20 4Q19 4Q20 4Q19 4Q20

189
PA
RQ
UE
AR
AU
CO
IN
TE
GR
AT
ED
RE
PO
RT
20
20
GOVERNANCEAND COMMUNITYINTRODUCTION ABOUT US
ECONOMIC PERFORMANCE
ENVIRONMENTAL PERFORMANCE
SOCIAL PERFORMANCE
ADDITIONAL INFORMATION
FINANCIAL INFORMATION
Management analysis Independent auditors’ report Consolidated financial statements Summarized financial statements of subsidiaries
24.1%
30.0%
16.9%
15.7%
59.0%
54.3%
Peru Colombia Chile
During the fourth quarter of 2020, Revenue reached CLP$43,460 million, decreasing 24.9% compared to the same quarter of the previous year. As has been mentioned, this drop is due to the pandemic and the limitations it imposes on the operation of our shopping centers, which is in line with GLA open to the public.
During the quarter, GLA open to the public was on average approximately 75% of the company's total GLA. In the quarter, Chile, Peru and Colombia posted significant increases in GLA open to the public compared to the third quarter of the year; some discounts continued to be applied for tenants who have not yet opened their stores and continue to be affected by the pandemic.
We believe revenue adequately reflects the current economic environment of our tenants, taking into consideration the reality of the tenants' situation, the ability to reopen their stores, and the status of the shopping center given where and in what country it is located. In accordance with this objective, collection is quite in line with the revenue reported in the period.
In consolidated terms, the negative impact on revenue for the quarter was also driven by the appreciation of the Chilean peso against the Peruvian sol and the Colombian peso, by 5.9% and 6.1% respectively. In local currency, meanwhile, Revenue decreased 18.3% in Chile, while in Peru and Colombia they decreased 35.0% and 14.0%, respectively.
Occupancy during this quarter reached 91.6% at a consolidated level, slightly below the level shown in the third quarter of this year, which was 93.9%, reflecting the good relationship we maintained with our tenants.
Revenue (MCLP$)
-24.9% -38.8%
Revenue BY COUNTRYREVENUE DIVERSIFICATION
Financial and Operational Analysis
Revenue
57,900
43,460
4Q19 4Q20
205,613
125,852
2019 2020
28.4%
28.1%
15.8%
14.3%
55.8%
57.6%
Peru Colombia Chile
44QQ1199
44QQ2200
22001199
22002200

190
PA
RQ
UE
AR
AU
CO
IN
TE
GR
AT
ED
RE
PO
RT
20
20
GOVERNANCEAND COMMUNITYINTRODUCTION ABOUT US
ECONOMIC PERFORMANCE
ENVIRONMENTAL PERFORMANCE
SOCIAL PERFORMANCE
ADDITIONAL INFORMATION
FINANCIAL INFORMATION
Management analysis Independent auditors’ report Consolidated financial statements Summarized financial statements of subsidiaries
71.0%61.8%
76.5% 71.7% 73.3% 74.0% 73.0%66.2%
4Q19 4Q20 4Q19 4Q20 4Q19 4Q20 4Q19 4Q20
EBITDA for the fourth quarter of 2020 was CLP$28,789 million. This result is mainly due to the lower revenue received due to the Covid-19 pandemic.
The cost of sales decreased 20.4% compared to the fourth quarter of 2019, explained by cost saving efforts made by the Company as part of its pandemic action plan, reducing costs related to cleaning, security, maintenance, energy, remuneration, among others.
In the same way, administrative expenses net of bad debt expense decreased 3.7%; expenses that were reduced within this category included expenses related to marketing and travel. Among these expenses, the cost of insurance stands out as it increased 76% compared to the fourth quarter of the previous year as a result of the social crisis that occurred in Chile at the end of 2019.
The expense related to updating the provision for bad debts reached CLP$2,080 million in the period, increasing by approximately 200% compared to the fourth quarter of the previous year. However, this figure shows a decrease of 61% compared to the third quarter of this year. We continue with efforts to cover accounts receivable for more than 90 days, net of guarantees.
EBITDA (MCLP$)
-31.9% -56.4%
EBITDA MARGIN (%)
Financial and Operational Analysis
Operating Result
CHILE PERU COLOMBIA CONSOLIDATED
42,270
28,789
4Q19 4Q20
150,562
65,591
2019 2020
26.1%
31.4%
18.9%
15.8%
55.1%
52.8%
Peru Colombia Chile
27.3%
28.4%
19.3%
13.6%
53.4%
58.1%
Peru Colombia Chile
EBITDA BY COUNTRYEBITDA DIVERSIFICATION
44QQ1199
44QQ2200
22001199
22002200
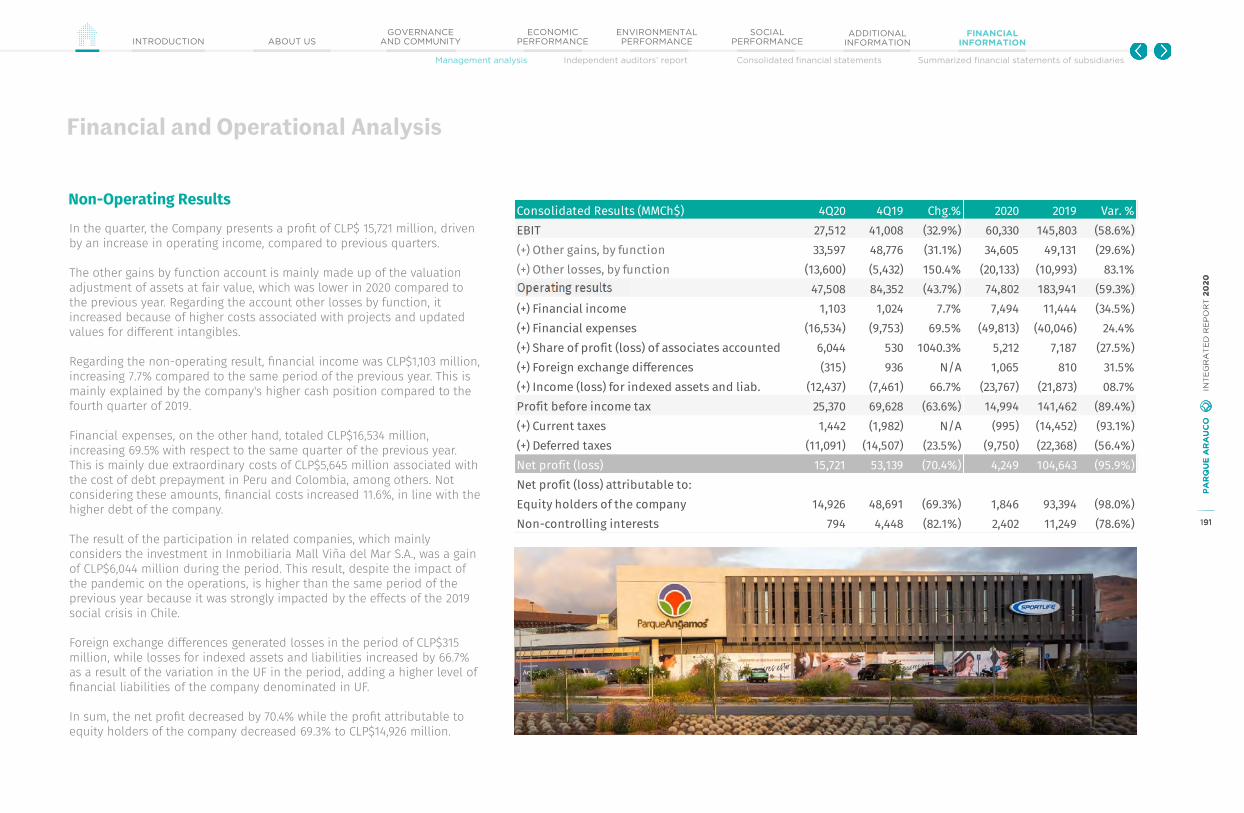
191
PA
RQ
UE
AR
AU
CO
IN
TE
GR
AT
ED
RE
PO
RT
20
20
GOVERNANCEAND COMMUNITYINTRODUCTION ABOUT US
ECONOMIC PERFORMANCE
ENVIRONMENTAL PERFORMANCE
SOCIAL PERFORMANCE
ADDITIONAL INFORMATION
FINANCIAL INFORMATION
Management analysis Independent auditors’ report Consolidated financial statements Summarized financial statements of subsidiaries
In the quarter, the Company presents a profit of CLP$ 15,721 million, driven by an increase in operating income, compared to previous quarters.
The other gains by function account is mainly made up of the valuation adjustment of assets at fair value, which was lower in 2020 compared to the previous year. Regarding the account other losses by function, it increased because of higher costs associated with projects and updated values for different intangibles.
Regarding the non-operating result, financial income was CLP$1,103 million, increasing 7.7% compared to the same period of the previous year. This is mainly explained by the company's higher cash position compared to the fourth quarter of 2019.
Financial expenses, on the other hand, totaled CLP$16,534 million, increasing 69.5% with respect to the same quarter of the previous year. This is mainly due extraordinary costs of CLP$5,645 million associated with the cost of debt prepayment in Peru and Colombia, among others. Not considering these amounts, financial costs increased 11.6%, in line with the higher debt of the company.
The result of the participation in related companies, which mainly considers the investment in Inmobiliaria Mall Viña del Mar S.A., was a gain of CLP$6,044 million during the period. This result, despite the impact of the pandemic on the operations, is higher than the same period of the previous year because it was strongly impacted by the effects of the 2019 social crisis in Chile.
Foreign exchange differences generated losses in the period of CLP$315 million, while losses for indexed assets and liabilities increased by 66.7% as a result of the variation in the UF in the period, adding a higher level of financial liabilities of the company denominated in UF.
In sum, the net profit decreased by 70.4% while the profit attributable to equity holders of the company decreased 69.3% to CLP$14,926 million.
Financial and Operational Analysis
Non-Operating ResultsConsolidated Results (MMCh$) 4Q20 4Q19 Chg.% 2020 2019 Var. %EBIT 27,512 41,008 (32.9%) 60,330 145,803 (58.6%)(+) Other gains, by function 33,597 48,776 (31.1%) 34,605 49,131 (29.6%)(+) Other losses, by function (13,600) (5,432) 150.4% (20,133) (10,993) 83.1%Operational results 47,508 84,352 (43.7%) 74,802 183,941 (59.3%)(+) Financial income 1,103 1,024 7.7% 7,494 11,444 (34.5%)(+) Financial expenses (16,534) (9,753) 69.5% (49,813) (40,046) 24.4%(+) Share of profit (loss) of associates accounted 6,044 530 1040.3% 5,212 7,187 (27.5%)(+) Foreign exchange differences (315) 936 N/A 1,065 810 31.5%(+) Income (loss) for indexed assets and liab. (12,437) (7,461) 66.7% (23,767) (21,873) 08.7%Profit before income tax 25,370 69,628 (63.6%) 14,994 141,462 (89.4%)(+) Current taxes 1,442 (1,982) N/A (995) (14,452) (93.1%)(+) Deferred taxes (11,091) (14,507) (23.5%) (9,750) (22,368) (56.4%)Net profit (loss) 15,721 53,139 (70.4%) 4,249 104,643 (95.9%)Net profit (loss) attributable to:Equity holders of the company 14,926 48,691 (69.3%) 1,846 93,394 (98.0%)Non-controlling interests 794 4,448 (82.1%) 2,402 11,249 (78.6%) 191
PA
RQ
UE
AR
AU
CO
IN
TE
GR
AT
ED
RE
PO
RT
20
20

192
PA
RQ
UE
AR
AU
CO
IN
TE
GR
AT
ED
RE
PO
RT
20
20
GOVERNANCEAND COMMUNITYINTRODUCTION ABOUT US
ECONOMIC PERFORMANCE
ENVIRONMENTAL PERFORMANCE
SOCIAL PERFORMANCE
ADDITIONAL INFORMATION
FINANCIAL INFORMATION
Management analysis Independent auditors’ report Consolidated financial statements Summarized financial statements of subsidiaries
“Share of profit (loss) of associates accounted” mainly reflects our investment in Inmobiliaria Mall Viña del Mar S.A. (“Grupo Marina”) in Chile and Desarrollos Panamericana S.A.C. in Peru. According to International Financial Reporting Standard N°11 (IFRS 11), and International Accounting Standards N°28 (IAS 28), the investments in Inmobiliaria Mall Viña del Mar S.A. and DesarrollosPanamericana S.A.C. are not consolidated in the financial statements of Parque Arauco S.A. These entities are accounted for using the equity method of accounting and are presented in ParqueArauco’s income statement in the line ”Share of profit (loss) of associates accounted” and in the balance sheet under “investments in associates”.
The Chilean entity, controlled equally by Parque Arauco S.A. and Ripley Corp. S.A. is the owner of Mall Marina (89,500 m2 of GLA), Boulevard Marina (10,500 m2 of GLA), Mall Curicó (53,500 m2 of GLA) and Mall del Centro Concepción (37,000 m2 of GLA), the last of which was acquired during the third quarter of 2019. During the fourth quarter of 2020, the proportional Revenue of Mall Viña del Mar S.A. reached CLP$5,677 million, decreasing 29.3%. This decrease is because of the pandemic. The proportional EBITDA for the quarter was CLP$2,280 million and the proportional profit for the quarter shows a gain of CLP$6,088 million.
Regarding the entity Desarrollos Panamericana S.A.C., it is controlled equally by Parque Arauco S.A. and Grupo Wiese, the owner of several pieces of undeveloped land in Peru.
(1) Included in this account: Desarrollos Panamericana S.A.C. and five other companies that control landbank in Peru with the Grupo Wiese.
Financial and Operational Analysis
Share of profit (loss) of associates accounted (MMCh$) 4Q20 4Q19 Chg.% 2020 2019 Chg.%Inm. Viña del Mar S.A. 6,088 1,036 487.7% 5,579 7,792 (28.4%)Desarrollos Panamericana S.A.C.1 (43) (506) (91.5%) (367) (605) (39.4%)Total 6,044 530 1,040.3% 5,212 7,187 (27.5%)
Inm. Viña del Mar (MMCh$) 4Q20 4Q19 Chg.% 2020 2019 Chg.%Proportional revenue 5,677 8,033 (29.3%) 14,636 22,807 (35.8%)Proportional EBITDA 2,280 6,275 (63.7%) 6,916 18,633 (62.9%)Proportional profit 6,088 1,036 487.7% 5,579 7,792 (28.4%)Proportional Net Financial Debt 155,649 151,932 2.4% 155,649 151,932 2.4%
Equity Method Investments“Share of profit (loss) of associates accounted” mainly reflects our investment in Inmobiliaria Mall Viña del Mar S.A. (“Grupo Marina”) in Chile and Desarrollos Panamericana S.A.C. in Peru. According to International Financial Reporting Standard N°11 (IFRS 11), and International Accounting Standards N°28 (IAS 28), the investments in Inmobiliaria Mall Viña del Mar S.A. and DesarrollosPanamericana S.A.C. are not consolidated in the financial statements of Parque Arauco S.A. These entities are accounted for using the equity method of accounting and are presented in ParqueArauco’s income statement in the line ”Share of profit (loss) of associates accounted” and in the balance sheet under “investments in associates”.
The Chilean entity, controlled equally by Parque Arauco S.A. and Ripley Corp. S.A. is the owner of Mall Marina (89,500 m2 of GLA), Boulevard Marina (10,500 m2 of GLA), Mall Curicó (53,500 m2 of GLA) and Mall del Centro Concepción (37,000 m2 of GLA), the last of which was acquired during the third quarter of 2019. During the fourth quarter of 2020, the proportional Revenue of Mall Viña del Mar S.A. reached CLP$5,677 million, decreasing 29.3%. This decrease is because of the pandemic. The proportional EBITDA for the quarter was CLP$2,280 million and the proportional profit for the quarter shows a gain of CLP$6,088 million.
Regarding the entity Desarrollos Panamericana S.A.C., it is controlled equally by Parque Arauco S.A. and Grupo Wiese, the owner of several pieces of undeveloped land in Peru.
(1) Included in this account: Desarrollos Panamericana S.A.C. and five other companies that control landbank in Peru with the Grupo Wiese.
Financial and Operational Analysis
Share of profit (loss) of associates accounted (MMCh$) 4Q20 4Q19 Chg.% 2020 2019 Chg.%Inm. Viña del Mar S.A. 6,088 1,036 487.7% 5,579 7,792 (28.4%)Desarrollos Panamericana S.A.C.1 (43) (506) (91.5%) (367) (605) (39.4%)Total 6,044 530 1,040.3% 5,212 7,187 (27.5%)
Inm. Viña del Mar (MMCh$) 4Q20 4Q19 Chg.% 2020 2019 Chg.%Proportional revenue 5,677 8,033 (29.3%) 14,636 22,807 (35.8%)Proportional EBITDA 2,280 6,275 (63.7%) 6,916 18,633 (62.9%)Proportional profit 6,088 1,036 487.7% 5,579 7,792 (28.4%)Proportional Net Financial Debt 155,649 151,932 2.4% 155,649 151,932 2.4%
Equity Method Investments

193
PA
RQ
UE
AR
AU
CO
IN
TE
GR
AT
ED
RE
PO
RT
20
20
GOVERNANCEAND COMMUNITYINTRODUCTION ABOUT US
ECONOMIC PERFORMANCE
ENVIRONMENTAL PERFORMANCE
SOCIAL PERFORMANCE
ADDITIONAL INFORMATION
FINANCIAL INFORMATION
Management analysis Independent auditors’ report Consolidated financial statements Summarized financial statements of subsidiaries
12
FFiinnaanncciiaall aanndd OOppeerraattiioonnaall AAnnaallyyssiiss
Consolidated Income Statement
Consolidated Income Statement (MMCh$) 4Q20 4Q19 Chg.% 2020 2019 Chg.%Revenues 43,460 57,900 (24.9%) 125,852 205,613 (38.8%)(+) Cost of sales (8,316) (10,441) (20.4%) (31,698) (39,963) (20.7%)Gross Profit 35,145 47,459 (25.9%) 94,154 165,650 (43.2%)(+) Administrative expenses (7,633) (6,451) 18.3% (33,824) (19,847) 70.4%(+) Other gains, by function 33,597 48,776 (31.1%) 34,605 49,131 (29.6%)(+) Other losses, by function (13,600) (5,432) 150.4% (20,133) (10,993) 83.1%Operational results 47,508 84,352 (43.7%) 74,802 183,941 (59.3%)(+) Financial income 1,103 1,024 7.7% 7,494 11,444 (34.5%)(+) Financial expenses (16,534) (9,753) 69.5% (49,813) (40,046) 24.4%(+) Share of profit (loss) of associates accounted 6,044 530 1040.3% 5,212 7,187 (27.5%)(+) Foreign exchange differences (315) 936 N/A 1,065 810 31.5%(+) Income (loss) for indexed assets and liabilities (12,437) (7,461) 66.7% (23,767) (21,873) 8.7%Profit before income tax 25,370 69,628 (63.6%) 14,994 141,462 (89.4%)(+) Current taxes 1,442 (1,982) N/A (995) (14,452) (93.1%)(+) Deferred taxes (11,091) (14,507) (23.5%) (9,750) (22,368) (56.4%)Net profit (loss) 15,721 53,139 (70.4%) 4,249 104,643 (95.9%)Net profit (loss) attributable to:Equity holders of the company 14,926 48,691 (69.3%) 1,846 93,394 (98.0%)Non-controlling interests 794 4,448 (82.1%) 2,402 11,249 (78.6%)
EBITDA 4Q20 4Q19 Chg.% 2020 2019 Chg.%Revenues 43,460 57,900 (24.9%) 125,852 205,613 (38.8%)(+) Cost of sales (8,316) (10,441) (20.4%) (31,698) (39,963) (20.7%)(+) Administrative expenses (7,633) (6,451) 18.3% (33,824) (19,847) 70.4%(-) Amortization and depreciation (1,277) (1,262) 1.2% (5,260) (4,759) 10.5%EBITDA 28,789 42,270 (31.9%) 65,591 150,562 (56.4%)
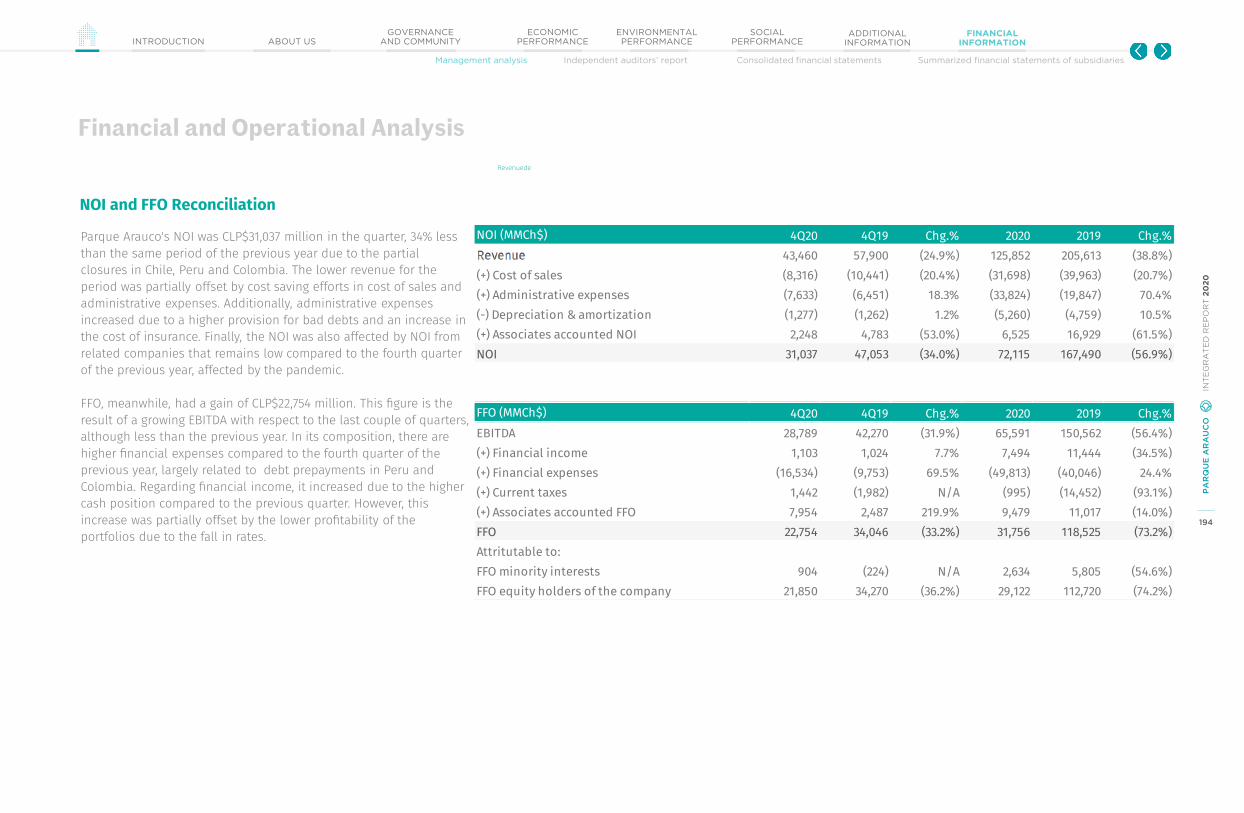
194
PA
RQ
UE
AR
AU
CO
IN
TE
GR
AT
ED
RE
PO
RT
20
20
GOVERNANCEAND COMMUNITYINTRODUCTION ABOUT US
ECONOMIC PERFORMANCE
ENVIRONMENTAL PERFORMANCE
SOCIAL PERFORMANCE
ADDITIONAL INFORMATION
FINANCIAL INFORMATION
Management analysis Independent auditors’ report Consolidated financial statements Summarized financial statements of subsidiaries
Parque Arauco's NOI was CLP$31,037 million in the quarter, 34% less than the same period of the previous year due to the partial closures in Chile, Peru and Colombia. The lower revenue for the period was partially offset by cost saving efforts in cost of sales and administrative expenses. Additionally, administrative expenses increased due to a higher provision for bad debts and an increase in the cost of insurance. Finally, the NOI was also affected by NOI from related companies that remains low compared to the fourth quarter of the previous year, affected by the pandemic.
FFO, meanwhile, had a gain of CLP$22,754 million. This figure is the result of a growing EBITDA with respect to the last couple of quarters, although less than the previous year. In its composition, there are higher financial expenses compared to the fourth quarter of the previous year, largely related to debt prepayments in Peru and Colombia. Regarding financial income, it increased due to the higher cash position compared to the previous quarter. However, this increase was partially offset by the lower profitability of the portfolios due to the fall in rates.
Financial and Operational Analysis
NOI and FFO ReconciliationNOI (MMCh$) 4Q20 4Q19 Chg.% 2020 2019 Chg.%Revenues 43,460 57,900 (24.9%) 125,852 205,613 (38.8%)(+) Cost of sales (8,316) (10,441) (20.4%) (31,698) (39,963) (20.7%)(+) Administrative expenses (7,633) (6,451) 18.3% (33,824) (19,847) 70.4%(-) Depreciation & amortization (1,277) (1,262) 1.2% (5,260) (4,759) 10.5%(+) Associates accounted NOI 2,248 4,783 (53.0%) 6,525 16,929 (61.5%)NOI 31,037 47,053 (34.0%) 72,115 167,490 (56.9%)
FFO (MMCh$) 4Q20 4Q19 Chg.% 2020 2019 Chg.%EBITDA 28,789 42,270 (31.9%) 65,591 150,562 (56.4%)(+) Financial income 1,103 1,024 7.7% 7,494 11,444 (34.5%)(+) Financial expenses (16,534) (9,753) 69.5% (49,813) (40,046) 24.4%(+) Current taxes 1,442 (1,982) N/A (995) (14,452) (93.1%)(+) Associates accounted FFO 7,954 2,487 219.9% 9,479 11,017 (14.0%)FFO 22,754 34,046 (33.2%) 31,756 118,525 (73.2%)Attritutable to:FFO minority interests 904 (224) N/A 2,634 5,805 (54.6%)FFO equity holders of the company 21,850 34,270 (36.2%) 29,122 112,720 (74.2%)
Revenuede

195
PA
RQ
UE
AR
AU
CO
IN
TE
GR
AT
ED
RE
PO
RT
20
20
GOVERNANCEAND COMMUNITYINTRODUCTION ABOUT US
ECONOMIC PERFORMANCE
ENVIRONMENTAL PERFORMANCE
SOCIAL PERFORMANCE
ADDITIONAL INFORMATION
FINANCIAL INFORMATION
Management analysis Independent auditors’ report Consolidated financial statements Summarized financial statements of subsidiaries
Summarized Cash Flow
Cash flow from operating activities was CLP$ 36,472 million, reflecting the growth in collections achieved this quarter compared to the previous periods of 2020, with a growing GLA open to the public and expiring discounts.
Investment activities during the fourth quarter of 2020 present outflows of Ch $ 21,903 million. These mainly include the investment in the Parque Arauco Kennedy expansion project in Chile and the construction of the Parque Alegra project in Colombia.
Finally, outflows from financing activities were CLP$129,658 million, mainly explained by loan payments and obligations.
Financial and Operational Analysis
Summarized Cash Flow (MMCh$) 4Q20 4Q19 Chg.% 2020 2019 Chg.%From operating activities 36,472 38,425 (5.1%) 64,054 147,583 (56.6%)From investment activities (21,903) (33,696) (35.0%) (63,326) (92,269) (31.4%)From financing activities (129,658) 16,498 N/A 55,539 (31,557) N/AEffects of exchange rate on cash and cash equivalents (10,261) 7,294 N/A (14,669) 10,455 N/ANet cash flow during the period (125,350) 28,521 N/A 41,598 34,211 21.6%Cash and cash equivalents at beginning of period 482,382 286,914 68.1% 315,435 281,224 12.2%Cash and cash equivalents at end of period 357,032 315,435 13.2% 357,032 315,435 13.2%

196
PA
RQ
UE
AR
AU
CO
IN
TE
GR
AT
ED
RE
PO
RT
20
20
GOVERNANCEAND COMMUNITYINTRODUCTION ABOUT US
ECONOMIC PERFORMANCE
ENVIRONMENTAL PERFORMANCE
SOCIAL PERFORMANCE
ADDITIONAL INFORMATION
FINANCIAL INFORMATION
Management analysis Independent auditors’ report Consolidated financial statements Summarized financial statements of subsidiaries
12.31.2020 12.31.2019(MMCh$) (MMCh$)
Current assetsCash and cash equivalents 357,032 315,435Other current financial assets 113 3Other current non-financial assets 32,597 49,988Trade accounts receivable and other receivables 27,006 35,041Accounts receivable from related companies 272 234Current tax receivable 9,899 9,222Total current assets 426,920 409,922Non-current assetsOther non-current financial assets 4,388 5,978Other non-current non-financial assets 14,292 21,316Non-current accounts receivable 49 52Non-current accounts receivable to related entities 1,973 2,027Share of profit (loss) of associates accounted 118,540 117,210Intangible assets excluding surplus value 12,984 18,105Surplus value 2,733 3,258Property, plant and equipment 27,088 22,895Investment properties 2,023,100 2,037,106Deferred tax assets 53,531 42,597Right of use assets 2,066 2,801Total non-current assets 2,260,744 2,273,346Total assets 2,687,663 2,683,268
AssetsCurrent assets increased 4.1% from CLP$409,922 million as of December 31, 2019 to CLP$426,920 million as of December 31, 2020. Cash and cash equivalents increased CLP$41,597 million during the period, mainly due to bank loans and two bond issues in Chile, offset by prepayment of debt in Peru and Colombia in the last quarter.
With respect to Trade accounts receivable and other receivables, there was a decrease from CLP$35,041 million to CLP$27,006 million. There was an increase in gross Trade accounts receivable as a result of an increasing level of invoicing compared to previous quarters and more accounts receivable that were reclassified as a bad debt provision. This quarter, the Company maintains its effort to provide 100% provision for all accounts older than 90 days.
Non-current assets decreased during the period by CLP$12,603 million. This decrease is mainly explained by the Other non-current non-financial assets account, which decreased by CLP$7,024 due to lower anticipated expenses, and the Investment properties account, which decreased by CLP$14,007 million during the period due to exchange rate differences in Peru and Colombia.
Balance Sheet - Assets
Summarized Balance Sheet
Trade accounts receivable and other receivables, and Bad debt provisionTrade accounts receivable and other receivables, Gross 41,272 36,738Bad debt provision (14,266) (1,697)Trade accounts receivable and other receivables, Net 27,006 35,041
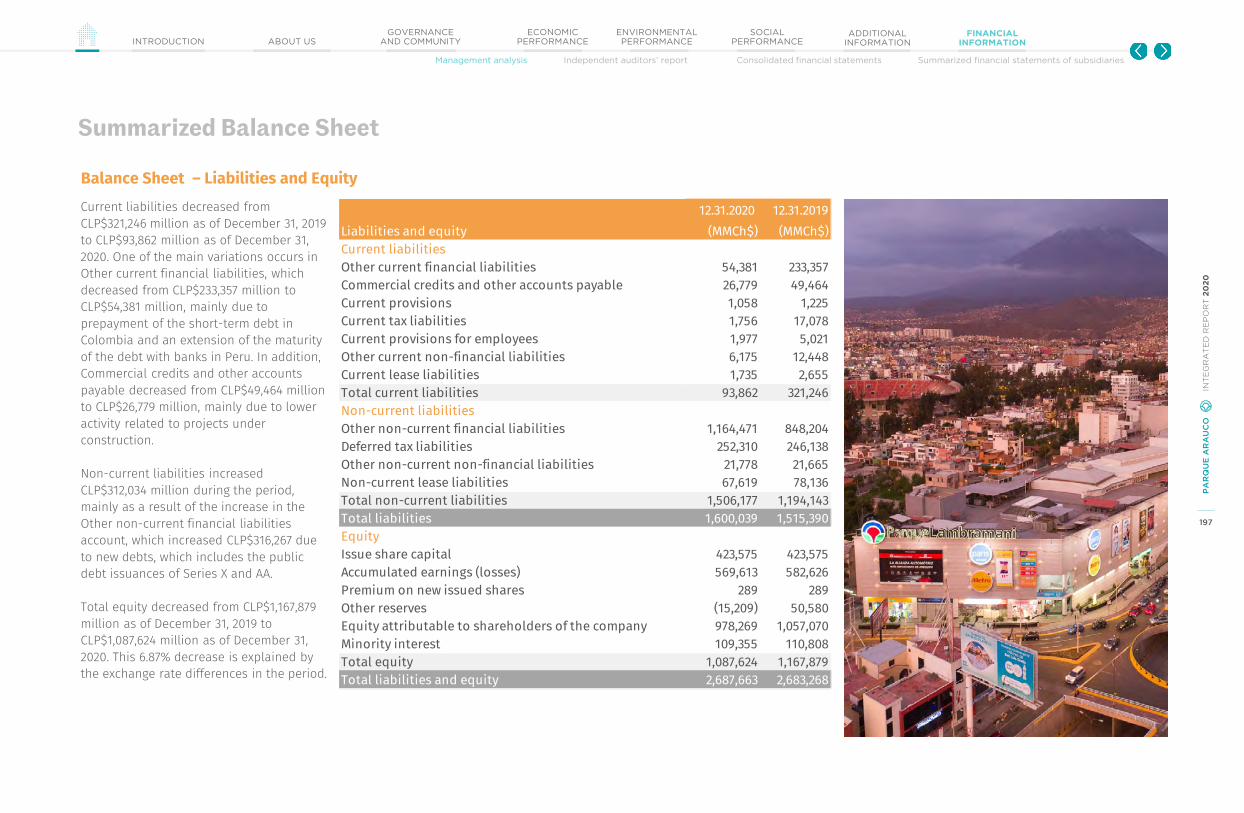
197
PA
RQ
UE
AR
AU
CO
IN
TE
GR
AT
ED
RE
PO
RT
20
20
GOVERNANCEAND COMMUNITYINTRODUCTION ABOUT US
ECONOMIC PERFORMANCE
ENVIRONMENTAL PERFORMANCE
SOCIAL PERFORMANCE
ADDITIONAL INFORMATION
FINANCIAL INFORMATION
Management analysis Independent auditors’ report Consolidated financial statements Summarized financial statements of subsidiaries
12.31.2020 12.31.2019(MMCh$) (MMCh$)
Current liabilitiesOther current financial liabilities 54,381 233,357Commercial credits and other accounts payable 26,779 49,464Current provisions 1,058 1,225Current tax liabilities 1,756 17,078Current provisions for employees 1,977 5,021Other current non-financial liabilities 6,175 12,448Current lease liabilities 1,735 2,655Total current liabilities 93,862 321,246Non-current liabilitiesOther non-current financial liabilities 1,164,471 848,204Deferred tax liabilities 252,310 246,138Other non-current non-financial liabilities 21,778 21,665Non-current lease liabilities 67,619 78,136Total non-current liabilities 1,506,177 1,194,143Total liabilities 1,600,039 1,515,390EquityIssue share capital 423,575 423,575Accumulated earnings (losses) 569,613 582,626Premium on new issued shares 289 289Other reserves (15,209) 50,580Equity attributable to shareholders of the company 978,269 1,057,070Minority interest 109,355 110,808Total equity 1,087,624 1,167,879Total liabilities and equity 2,687,663 2,683,268
Liabilities and equity
Current liabilities decreased from CLP$321,246 million as of December 31, 2019 to CLP$93,862 million as of December 31, 2020. One of the main variations occurs in Other current financial liabilities, which decreased from CLP$233,357 million to CLP$54,381 million, mainly due to prepayment of the short-term debt in Colombia and an extension of the maturity of the debt with banks in Peru. In addition, Commercial credits and other accounts payable decreased from CLP$49,464 million to CLP$26,779 million, mainly due to lower activity related to projects under construction.
Non-current liabilities increased CLP$312,034 million during the period, mainly as a result of the increase in the Other non-current financial liabilities account, which increased CLP$316,267 due to new debts, which includes the public debt issuances of Series X and AA.
Total equity decreased from CLP$1,167,879 million as of December 31, 2019 to CLP$1,087,624 million as of December 31, 2020. This 6.87% decrease is explained by the exchange rate differences in the period.
Balance Sheet – Liabilities and Equity
Summarized Balance Sheet
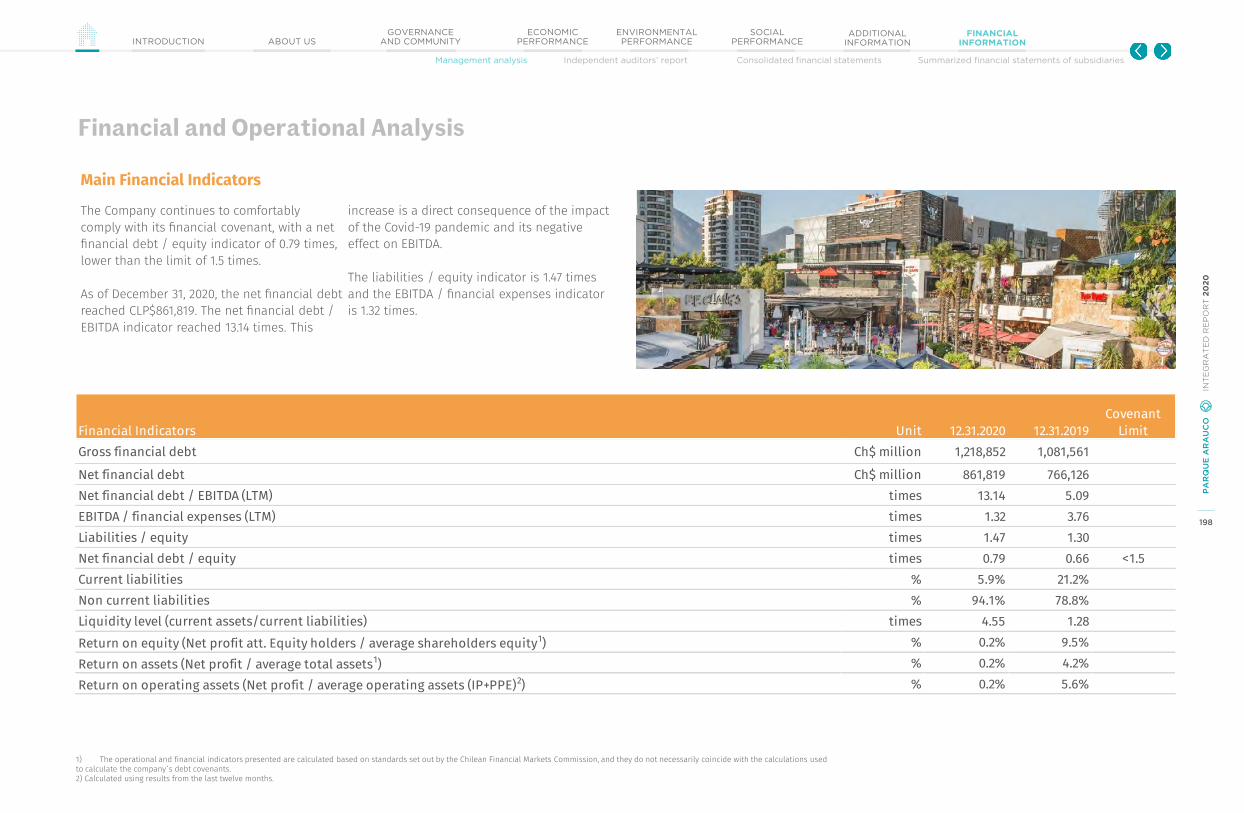
198
PA
RQ
UE
AR
AU
CO
IN
TE
GR
AT
ED
RE
PO
RT
20
20
GOVERNANCEAND COMMUNITYINTRODUCTION ABOUT US
ECONOMIC PERFORMANCE
ENVIRONMENTAL PERFORMANCE
SOCIAL PERFORMANCE
ADDITIONAL INFORMATION
FINANCIAL INFORMATION
Management analysis Independent auditors’ report Consolidated financial statements Summarized financial statements of subsidiaries
The Company continues to comfortably comply with its financial covenant, with a net financial debt / equity indicator of 0.79 times, lower than the limit of 1.5 times.
As of December 31, 2020, the net financial debt reached CLP$861,819. The net financial debt / EBITDA indicator reached 13.14 times. This
increase is a direct consequence of the impact of the Covid-19 pandemic and its negative effect on EBITDA.
The liabilities / equity indicator is 1.47 times and the EBITDA / financial expenses indicator is 1.32 times.
1) The operational and financial indicators presented are calculated based on standards set out by the Chilean Financial Markets Commission, and they do not necessarily coincide with the calculations usedto calculate the company´s debt covenants.2) Calculated using results from the last twelve months.
Financial and Operational Analysis
Main Financial Indicators
Financial Indicators Unit 12.31.2020 12.31.2019Covenant
LimitGross financial debt Ch$ million 1,218,852 1,081,561Net financial debt Ch$ million 861,819 766,126Net financial debt / EBITDA (LTM) times 13.14 5.09EBITDA / financial expenses (LTM) times 1.32 3.76Liabilities / equity times 1.47 1.30Net financial debt / equity times 0.79 0.66 <1.5Current liabilities % 5.9% 21.2%Non current liabilities % 94.1% 78.8%Liquidity level (current assets/current liabilities) times 4.55 1.28Return on equity (Net profit att. Equity holders / average shareholders equity1) % 0.2% 9.5%Return on assets (Net profit / average total assets1) % 0.2% 4.2%Return on operating assets (Net profit / average operating assets (IP+PPE)2) % 0.2% 5.6%

199
PA
RQ
UE
AR
AU
CO
IN
TE
GR
AT
ED
RE
PO
RT
20
20
GOVERNANCEAND COMMUNITYINTRODUCTION ABOUT US
ECONOMIC PERFORMANCE
ENVIRONMENTAL PERFORMANCE
SOCIAL PERFORMANCE
ADDITIONAL INFORMATION
FINANCIAL INFORMATION
Management analysis Independent auditors’ report Consolidated financial statements Summarized financial statements of subsidiaries
Q420Results by property
ch
ile
co
lom
bia
per
u
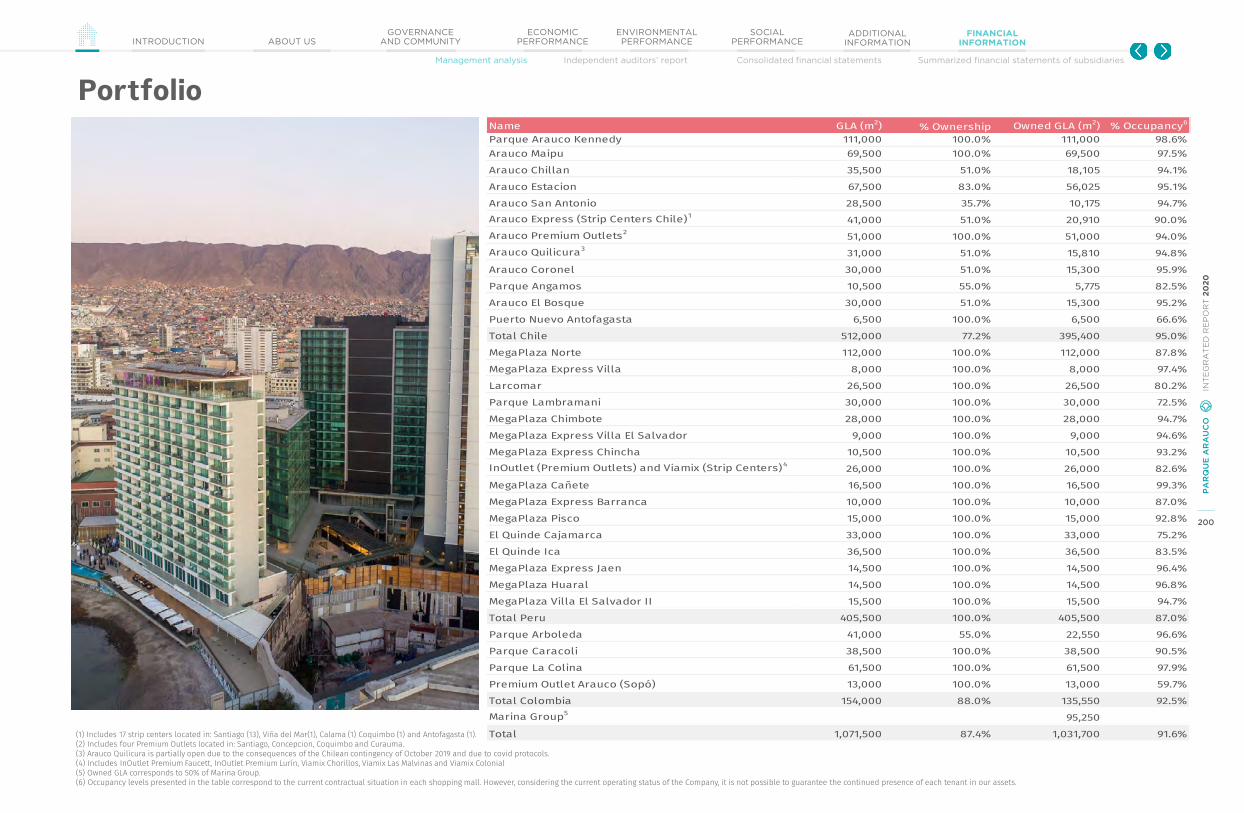
200
PA
RQ
UE
AR
AU
CO
IN
TE
GR
AT
ED
RE
PO
RT
20
20
GOVERNANCEAND COMMUNITYINTRODUCTION ABOUT US
ECONOMIC PERFORMANCE
ENVIRONMENTAL PERFORMANCE
SOCIAL PERFORMANCE
ADDITIONAL INFORMATION
FINANCIAL INFORMATION
Management analysis Independent auditors’ report Consolidated financial statements Summarized financial statements of subsidiaries
Portfolio
(1) Includes 17 strip centers located in: Santiago (13), Viña del Mar(1), Calama (1) Coquimbo (1) and Antofagasta (1).(2) Includes four Premium Outlets located in: Santiago, Concepcion, Coquimbo and Curauma.(3) Arauco Quilicura is partially open due to the consequences of the Chilean contingency of October 2019 and due to covid protocols.(4) Includes InOutlet Premium Faucett, InOutlet Premium Lurín, Viamix Chorillos, Viamix Las Malvinas and Viamix Colonial (5) Owned GLA corresponds to 50% of Marina Group.(6) Occupancy levels presented in the table correspond to the current contractual situation in each shopping mall. However, considering the current operating status of the Company, it is not possible to guarantee the continued presence of each tenant in our assets.
Name GLA (m2) % Ownership Owned GLA (m2) % Occupancy6
Parque Arauco Kennedy 111,000 100.0% 111,000 98.6%Arauco Maipu 69,500 100.0% 69,500 97.5%Arauco Chillan 35,500 51.0% 18,105 94.1%Arauco Estacion 67,500 83.0% 56,025 95.1%Arauco San Antonio 28,500 35.7% 10,175 94.7%Arauco Express (Strip Centers Chile)1 41,000 51.0% 20,910 90.0%Arauco Premium Outlets2 51,000 100.0% 51,000 94.0%Arauco Quilicura3 31,000 51.0% 15,810 94.8%Arauco Coronel 30,000 51.0% 15,300 95.9%Parque Angamos 10,500 55.0% 5,775 82.5%Arauco El Bosque 30,000 51.0% 15,300 95.2%Puerto Nuevo Antofagasta 6,500 100.0% 6,500 66.6%Total Chile 512,000 77.2% 395,400 95.0%MegaPlaza Norte 112,000 100.0% 112,000 87.8%MegaPlaza Express Villa 8,000 100.0% 8,000 97.4%Larcomar 26,500 100.0% 26,500 80.2%Parque Lambramani 30,000 100.0% 30,000 72.5%MegaPlaza Chimbote 28,000 100.0% 28,000 94.7%MegaPlaza Express Villa El Salvador 9,000 100.0% 9,000 94.6%MegaPlaza Express Chincha 10,500 100.0% 10,500 93.2%InOutlet (Premium Outlets) and Viamix (Strip Centers)4 26,000 100.0% 26,000 82.6%MegaPlaza Cañete 16,500 100.0% 16,500 99.3%MegaPlaza Express Barranca 10,000 100.0% 10,000 87.0%MegaPlaza Pisco 15,000 100.0% 15,000 92.8%El Quinde Cajamarca 33,000 100.0% 33,000 75.2%El Quinde Ica 36,500 100.0% 36,500 83.5%MegaPlaza Express Jaen 14,500 100.0% 14,500 96.4%MegaPlaza Huaral 14,500 100.0% 14,500 96.8%MegaPlaza Villa El Salvador II 15,500 100.0% 15,500 94.7%Total Peru 405,500 100.0% 405,500 87.0%Parque Arboleda 41,000 55.0% 22,550 96.6%Parque Caracoli 38,500 100.0% 38,500 90.5%Parque La Colina 61,500 100.0% 61,500 97.9%Premium Outlet Arauco (Sopó) 13,000 100.0% 13,000 59.7%Total Colombia 154,000 88.0% 135,550 92.5%Marina Group5 95,250Total 1,071,500 87.4% 1,031,700 91.6%
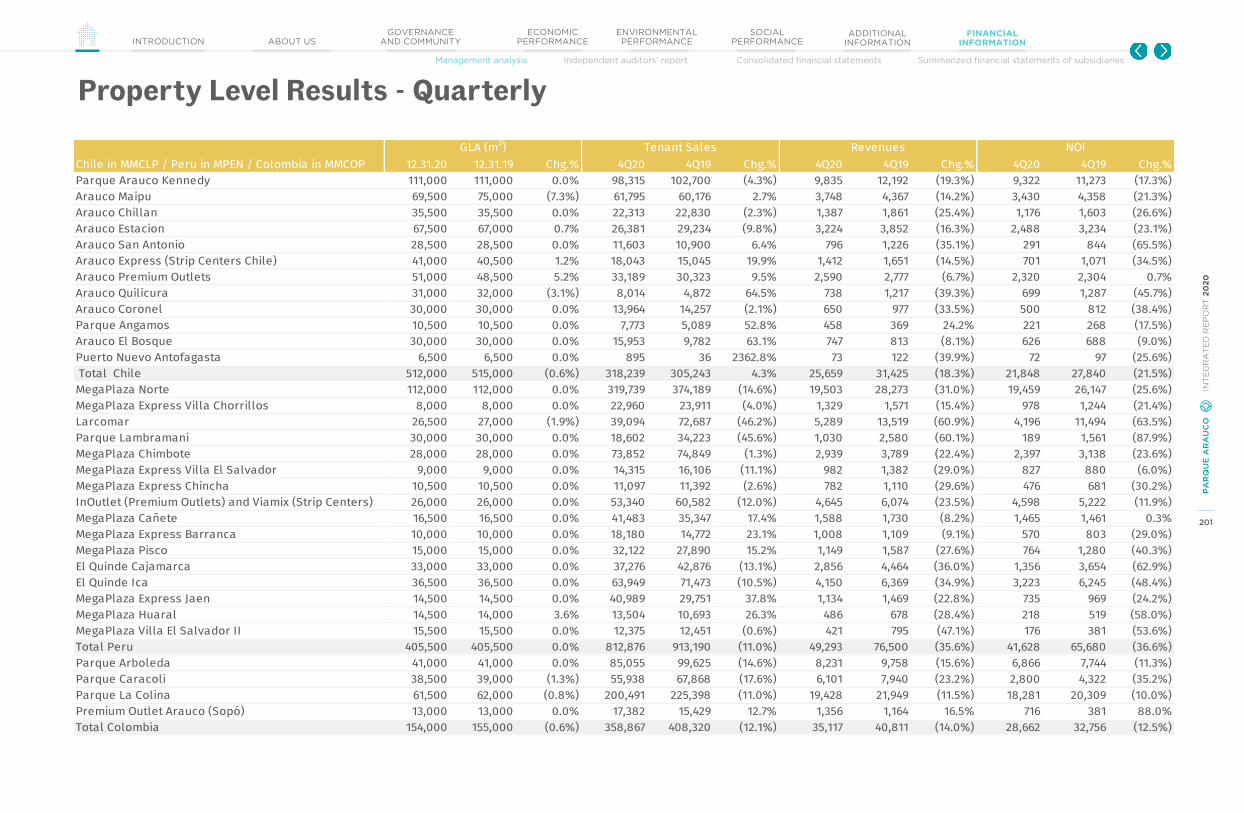
201
PA
RQ
UE
AR
AU
CO
IN
TE
GR
AT
ED
RE
PO
RT
20
20
GOVERNANCEAND COMMUNITYINTRODUCTION ABOUT US
ECONOMIC PERFORMANCE
ENVIRONMENTAL PERFORMANCE
SOCIAL PERFORMANCE
ADDITIONAL INFORMATION
FINANCIAL INFORMATION
Management analysis Independent auditors’ report Consolidated financial statements Summarized financial statements of subsidiaries
Property Level Results - Quarterly
12.31.20 12.31.19 Chg.% 4Q20 4Q19 Chg.% 4Q20 4Q19 Chg.% 4Q20 4Q19 Chg.%Parque Arauco Kennedy 111,000 111,000 0.0% 98,315 102,700 (4.3%) 9,835 12,192 (19.3%) 9,322 11,273 (17.3%)Arauco Maipu 69,500 75,000 (7.3%) 61,795 60,176 2.7% 3,748 4,367 (14.2%) 3,430 4,358 (21.3%)Arauco Chillan 35,500 35,500 0.0% 22,313 22,830 (2.3%) 1,387 1,861 (25.4%) 1,176 1,603 (26.6%)Arauco Estacion 67,500 67,000 0.7% 26,381 29,234 (9.8%) 3,224 3,852 (16.3%) 2,488 3,234 (23.1%)Arauco San Antonio 28,500 28,500 0.0% 11,603 10,900 6.4% 796 1,226 (35.1%) 291 844 (65.5%)Arauco Express (Strip Centers Chile) 41,000 40,500 1.2% 18,043 15,045 19.9% 1,412 1,651 (14.5%) 701 1,071 (34.5%)Arauco Premium Outlets 51,000 48,500 5.2% 33,189 30,323 9.5% 2,590 2,777 (6.7%) 2,320 2,304 0.7%Arauco Quilicura 31,000 32,000 (3.1%) 8,014 4,872 64.5% 738 1,217 (39.3%) 699 1,287 (45.7%)Arauco Coronel 30,000 30,000 0.0% 13,964 14,257 (2.1%) 650 977 (33.5%) 500 812 (38.4%)Parque Angamos 10,500 10,500 0.0% 7,773 5,089 52.8% 458 369 24.2% 221 268 (17.5%)Arauco El Bosque 30,000 30,000 0.0% 15,953 9,782 63.1% 747 813 (8.1%) 626 688 (9.0%)Puerto Nuevo Antofagasta 6,500 6,500 0.0% 895 36 2362.8% 73 122 (39.9%) 72 97 (25.6%) Total Chile 512,000 515,000 (0.6%) 318,239 305,243 4.3% 25,659 31,425 (18.3%) 21,848 27,840 (21.5%)MegaPlaza Norte 112,000 112,000 0.0% 319,739 374,189 (14.6%) 19,503 28,273 (31.0%) 19,459 26,147 (25.6%)MegaPlaza Express Villa Chorrillos 8,000 8,000 0.0% 22,960 23,911 (4.0%) 1,329 1,571 (15.4%) 978 1,244 (21.4%)Larcomar 26,500 27,000 (1.9%) 39,094 72,687 (46.2%) 5,289 13,519 (60.9%) 4,196 11,494 (63.5%)Parque Lambramani 30,000 30,000 0.0% 18,602 34,223 (45.6%) 1,030 2,580 (60.1%) 189 1,561 (87.9%)MegaPlaza Chimbote 28,000 28,000 0.0% 73,852 74,849 (1.3%) 2,939 3,789 (22.4%) 2,397 3,138 (23.6%)MegaPlaza Express Villa El Salvador 9,000 9,000 0.0% 14,315 16,106 (11.1%) 982 1,382 (29.0%) 827 880 (6.0%)MegaPlaza Express Chincha 10,500 10,500 0.0% 11,097 11,392 (2.6%) 782 1,110 (29.6%) 476 681 (30.2%)InOutlet (Premium Outlets) and Viamix (Strip Centers) 26,000 26,000 0.0% 53,340 60,582 (12.0%) 4,645 6,074 (23.5%) 4,598 5,222 (11.9%)MegaPlaza Cañete 16,500 16,500 0.0% 41,483 35,347 17.4% 1,588 1,730 (8.2%) 1,465 1,461 0.3%MegaPlaza Express Barranca 10,000 10,000 0.0% 18,180 14,772 23.1% 1,008 1,109 (9.1%) 570 803 (29.0%)MegaPlaza Pisco 15,000 15,000 0.0% 32,122 27,890 15.2% 1,149 1,587 (27.6%) 764 1,280 (40.3%)El Quinde Cajamarca 33,000 33,000 0.0% 37,276 42,876 (13.1%) 2,856 4,464 (36.0%) 1,356 3,654 (62.9%)El Quinde Ica 36,500 36,500 0.0% 63,949 71,473 (10.5%) 4,150 6,369 (34.9%) 3,223 6,245 (48.4%)MegaPlaza Express Jaen 14,500 14,500 0.0% 40,989 29,751 37.8% 1,134 1,469 (22.8%) 735 969 (24.2%)MegaPlaza Huaral 14,500 14,000 3.6% 13,504 10,693 26.3% 486 678 (28.4%) 218 519 (58.0%)MegaPlaza Villa El Salvador II 15,500 15,500 0.0% 12,375 12,451 (0.6%) 421 795 (47.1%) 176 381 (53.6%)Total Peru 405,500 405,500 0.0% 812,876 913,190 (11.0%) 49,293 76,500 (35.6%) 41,628 65,680 (36.6%)Parque Arboleda 41,000 41,000 0.0% 85,055 99,625 (14.6%) 8,231 9,758 (15.6%) 6,866 7,744 (11.3%)Parque Caracoli 38,500 39,000 (1.3%) 55,938 67,868 (17.6%) 6,101 7,940 (23.2%) 2,800 4,322 (35.2%)Parque La Colina 61,500 62,000 (0.8%) 200,491 225,398 (11.0%) 19,428 21,949 (11.5%) 18,281 20,309 (10.0%)Premium Outlet Arauco (Sopó) 13,000 13,000 0.0% 17,382 15,429 12.7% 1,356 1,164 16.5% 716 381 88.0%Total Colombia 154,000 155,000 (0.6%) 358,867 408,320 (12.1%) 35,117 40,811 (14.0%) 28,662 32,756 (12.5%)
Chile in MMCLP / Peru in MPEN / Colombia in MMCOPGLA (m2) Tenant Sales Revenues NOI

202
PA
RQ
UE
AR
AU
CO
IN
TE
GR
AT
ED
RE
PO
RT
20
20
GOVERNANCEAND COMMUNITYINTRODUCTION ABOUT US
ECONOMIC PERFORMANCE
ENVIRONMENTAL PERFORMANCE
SOCIAL PERFORMANCE
ADDITIONAL INFORMATION
FINANCIAL INFORMATION
Management analysis Independent auditors’ report Consolidated financial statements Summarized financial statements of subsidiaries
Property Level Results - Quarterly
(1) Occupancy levels presented in the table correspond to the current contractual situation in each shopping mall. However, considering the current operating status of the Company, it is not possible to guarantee the continued presence of each tenant in our assets.
12.31.20 12.31.19 Chg. b.p. 4Q20 4Q19 Chg. b.p. 4Q20 4Q19 Chg. % 4Q20 4Q19 Chg. %Parque Arauco Kennedy 98.6% 98.7% (3) 94.8% 92.5% 233 338,261 327,434 3.3% 30,282 37,124 (18.4%)Arauco Maipú 97.5% 99.9% (235) 91.5% 99.8% (827) 337,409 270,963 24.5% 18,401 19,539 (5.8%)Arauco Chillán 94.1% 94.0% 13 84.8% 86.2% (139) 249,822 235,122 6.3% 13,982 18,668 (25.1%)Arauco Estación 95.1% 95.4% (33) 77.2% 83.9% (678) 171,071 167,739 2.0% 19,873 20,046 (0.9%)Arauco San Antonio 94.7% 95.4% (73) 36.6% 68.8% (3,225) 194,169 135,191 43.6% 9,805 14,918 (34.3%)Arauco Express (Strip Centers Chile) 90.0% 90.3% (29) 49.7% 64.9% (1,518) 270,932 182,084 48.8% 13,401 14,857 (9.8%)Arauco Premium Outlets 94.0% 94.7% (73) 89.6% 83.0% 662 262,537 223,925 17.2% 19,098 20,451 (6.6%)Arauco Quilicura 94.8% - N/A 94.6% 105.8% (1,113) 190,969 89,402 113.6% 8,453 13,681 (38.2%)Arauco Coronel 95.9% 97.9% (196) 76.9% 83.1% (617) 205,528 169,921 21.0% 7,643 11,180 (31.6%)Parque Angamos 82.5% 82.2% 32 48.3% 72.7% (2,440) 366,900 224,999 63.1% 17,252 14,474 19.2%Arauco El Bosque 95.2% 99.6% (434) 83.8% 84.6% (80) 191,795 157,637 21.7% 8,670 9,087 (4.6%)Puerto Nuevo Antofagasta 66.6% 75.4% (877) 98.8% 79.7% 1,908 171,864 76,051 126.0% 5,732 8,883 (35.5%)Chile Average 95.0% 96.1% (110) 85.1% 88.6% (344) 267,527 229,619 16.5% 18,198 21,262 (14.4%)MegaPlaza Norte 87.8% 98.1% (1028) 99.8% 92.5% 729 1,353 1,166 16.0% 62 86 (28.3%)MegaPlaza Express Villa Chorrillos 97.4% 96.7% 67 73.6% 79.2% (561) 546 1,213 (55.0%) 58 70 (16.8%)Larcomar 80.2% 85.3% (504) 79.3% 85.0% (568) 1,144 1,578 (27.5%) 84 199 (57.6%)Parque Lambramani 72.5% 92.6% (2010) 18.3% 60.5% (4,222) 552 429 28.6% 14 33 (58.3%)MegaPlaza Chimbote 94.7% 95.8% (106) 81.5% 82.8% (128) 1,089 950 14.6% 37 47 (20.7%)MegaPlaza Express Villa El Salvador 94.6% 97.3% (272) 84.3% 63.6% 2,062 788 666 18.5% 38 52 (26.5%)MegaPlaza Express Chincha 93.2% 95.5% (227) 60.8% 61.4% (53) 544 400 36.0% 27 37 (27.9%)InOutlet (Premium Outlets) y Viamix (Strip Centers) 82.6% 93.0% (1048) 99.0% 86.0% 1,302 1,023 951 7.5% 301 84 257.3%MegaPlaza Cañete 99.3% 99.4% (13) 92.2% 84.4% 780 953 743 28.4% 33 35 (8.0%)MegaPlaza Express Barranca 87.0% 90.2% (319) 56.6% 72.4% (1,582) 926 604 53.4% 40 42 (4.0%)MegaPlaza Pisco 92.8% 92.5% 26 66.5% 80.7% (1,419) 902 678 33.1% 28 38 (26.7%)El Quinde Cajamarca 75.2% 96.9% (2167) 47.5% 81.8% (3,436) 628 481 30.7% 31 47 (34.9%)El Quinde Ica 83.5% 98.7% (1520) 77.7% 98.1% (2,039) 874 702 24.4% 39 59 (33.7%)MegaPlaza Express Jaén 96.4% 97.4% (95) 64.8% 66.0% (123) 1,102 708 55.6% 27 35 (22.0%)MegaPlaza Huaral 96.8% 95.9% 93 44.9% 76.5% (3,162) 529 261 102.6% 14 17 (15.1%)MegaPlaza Villa El Salvador II 94.7% 93.4% 127 41.9% 47.9% (594) 494 275 79.2% 9 18 (47.5%)Peru Average 87.0% 95.6% (863) 84.5% 85.9% (140) 1,020 835 22.2% 45 66 (32.4%)Parque Arboleda 96.6% 98.3% (163) 83.4% 79.4% 404 921,646 998,375 (7.7%) 69,495 81,910 (15.2%)Parque Caracolí 90.5% 89.5% 101 45.9% 54.4% (855) 749,890 831,552 (9.8%) 59,860 77,572 (22.8%)Parque La Colina 97.9% 96.4% 148 94.1% 92.5% 157 1,162,810 1,278,727 (9.1%) 108,353 122,719 (11.7%)Premium Outlet Arauco (Sopó) 59.7% 64.7% (504) 52.8% 32.7% 2,006 758,481 621,333 22.1% 60,408 47,753 26.5%Colombia Average 92.5% 92.5% (2) 81.6% 80.3% 136 990,749 1,067,499 (7.2%) 83,191 96,090 (13.4%)
Chile in CLP / Peru in PEN / Colombia in COPOccupancy1 NOI Margin Monthly Tenant sales per m2 Monthly Revenues per m2
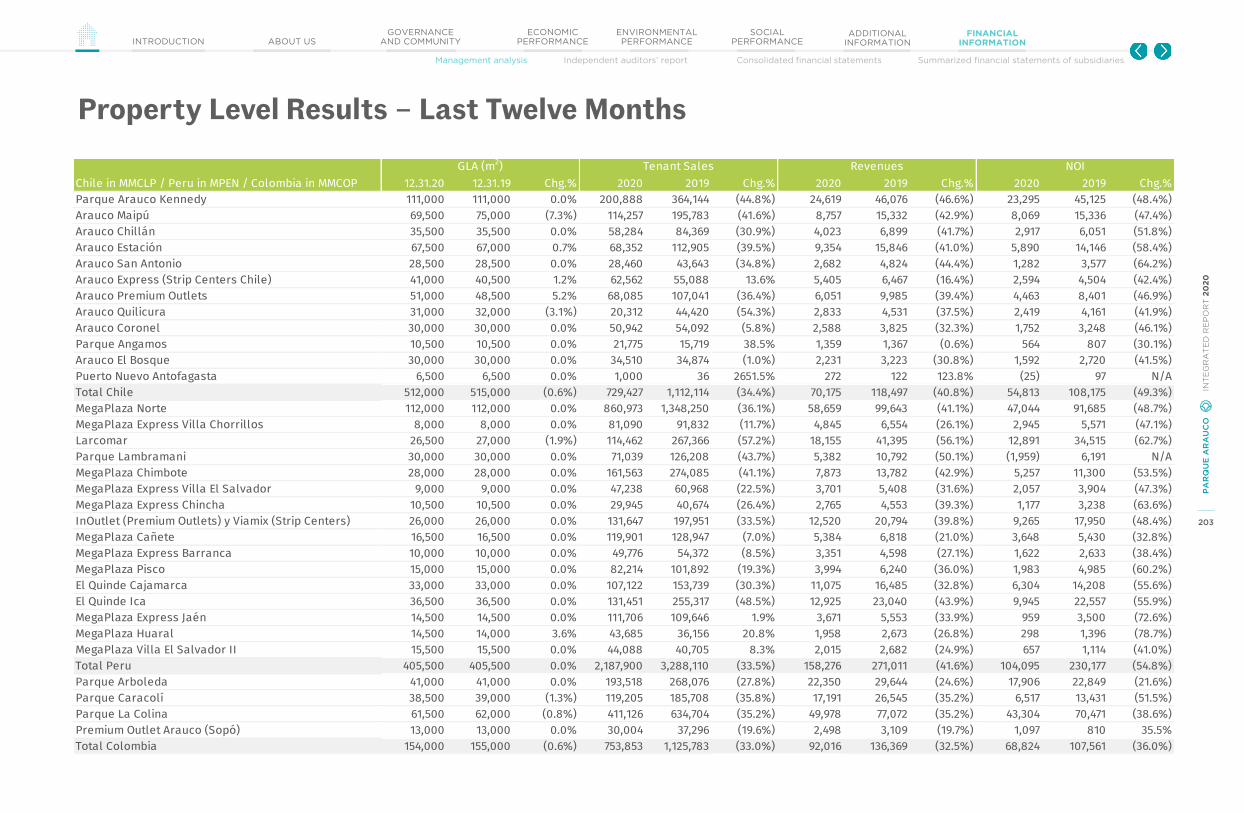
203
PA
RQ
UE
AR
AU
CO
IN
TE
GR
AT
ED
RE
PO
RT
20
20
GOVERNANCEAND COMMUNITYINTRODUCTION ABOUT US
ECONOMIC PERFORMANCE
ENVIRONMENTAL PERFORMANCE
SOCIAL PERFORMANCE
ADDITIONAL INFORMATION
FINANCIAL INFORMATION
Management analysis Independent auditors’ report Consolidated financial statements Summarized financial statements of subsidiaries
Property Level Results – Last Twelve Months
12.31.20 12.31.19 Chg.% 2020 2019 Chg.% 2020 2019 Chg.% 2020 2019 Chg.%Parque Arauco Kennedy 111,000 111,000 0.0% 200,888 364,144 (44.8%) 24,619 46,076 (46.6%) 23,295 45,125 (48.4%)Arauco Maipú 69,500 75,000 (7.3%) 114,257 195,783 (41.6%) 8,757 15,332 (42.9%) 8,069 15,336 (47.4%)Arauco Chillán 35,500 35,500 0.0% 58,284 84,369 (30.9%) 4,023 6,899 (41.7%) 2,917 6,051 (51.8%)Arauco Estación 67,500 67,000 0.7% 68,352 112,905 (39.5%) 9,354 15,846 (41.0%) 5,890 14,146 (58.4%)Arauco San Antonio 28,500 28,500 0.0% 28,460 43,643 (34.8%) 2,682 4,824 (44.4%) 1,282 3,577 (64.2%)Arauco Express (Strip Centers Chile) 41,000 40,500 1.2% 62,562 55,088 13.6% 5,405 6,467 (16.4%) 2,594 4,504 (42.4%)Arauco Premium Outlets 51,000 48,500 5.2% 68,085 107,041 (36.4%) 6,051 9,985 (39.4%) 4,463 8,401 (46.9%)Arauco Quilicura 31,000 32,000 (3.1%) 20,312 44,420 (54.3%) 2,833 4,531 (37.5%) 2,419 4,161 (41.9%)Arauco Coronel 30,000 30,000 0.0% 50,942 54,092 (5.8%) 2,588 3,825 (32.3%) 1,752 3,248 (46.1%)Parque Angamos 10,500 10,500 0.0% 21,775 15,719 38.5% 1,359 1,367 (0.6%) 564 807 (30.1%)Arauco El Bosque 30,000 30,000 0.0% 34,510 34,874 (1.0%) 2,231 3,223 (30.8%) 1,592 2,720 (41.5%)Puerto Nuevo Antofagasta 6,500 6,500 0.0% 1,000 36 2651.5% 272 122 123.8% (25) 97 N/ATotal Chile 512,000 515,000 (0.6%) 729,427 1,112,114 (34.4%) 70,175 118,497 (40.8%) 54,813 108,175 (49.3%)MegaPlaza Norte 112,000 112,000 0.0% 860,973 1,348,250 (36.1%) 58,659 99,643 (41.1%) 47,044 91,685 (48.7%)MegaPlaza Express Villa Chorrillos 8,000 8,000 0.0% 81,090 91,832 (11.7%) 4,845 6,554 (26.1%) 2,945 5,571 (47.1%)Larcomar 26,500 27,000 (1.9%) 114,462 267,366 (57.2%) 18,155 41,395 (56.1%) 12,891 34,515 (62.7%)Parque Lambramani 30,000 30,000 0.0% 71,039 126,208 (43.7%) 5,382 10,792 (50.1%) (1,959) 6,191 N/AMegaPlaza Chimbote 28,000 28,000 0.0% 161,563 274,085 (41.1%) 7,873 13,782 (42.9%) 5,257 11,300 (53.5%)MegaPlaza Express Villa El Salvador 9,000 9,000 0.0% 47,238 60,968 (22.5%) 3,701 5,408 (31.6%) 2,057 3,904 (47.3%)MegaPlaza Express Chincha 10,500 10,500 0.0% 29,945 40,674 (26.4%) 2,765 4,553 (39.3%) 1,177 3,238 (63.6%)InOutlet (Premium Outlets) y Viamix (Strip Centers) 26,000 26,000 0.0% 131,647 197,951 (33.5%) 12,520 20,794 (39.8%) 9,265 17,950 (48.4%)MegaPlaza Cañete 16,500 16,500 0.0% 119,901 128,947 (7.0%) 5,384 6,818 (21.0%) 3,648 5,430 (32.8%)MegaPlaza Express Barranca 10,000 10,000 0.0% 49,776 54,372 (8.5%) 3,351 4,598 (27.1%) 1,622 2,633 (38.4%)MegaPlaza Pisco 15,000 15,000 0.0% 82,214 101,892 (19.3%) 3,994 6,240 (36.0%) 1,983 4,985 (60.2%)El Quinde Cajamarca 33,000 33,000 0.0% 107,122 153,739 (30.3%) 11,075 16,485 (32.8%) 6,304 14,208 (55.6%)El Quinde Ica 36,500 36,500 0.0% 131,451 255,317 (48.5%) 12,925 23,040 (43.9%) 9,945 22,557 (55.9%)MegaPlaza Express Jaén 14,500 14,500 0.0% 111,706 109,646 1.9% 3,671 5,553 (33.9%) 959 3,500 (72.6%)MegaPlaza Huaral 14,500 14,000 3.6% 43,685 36,156 20.8% 1,958 2,673 (26.8%) 298 1,396 (78.7%)MegaPlaza Villa El Salvador II 15,500 15,500 0.0% 44,088 40,705 8.3% 2,015 2,682 (24.9%) 657 1,114 (41.0%)Total Peru 405,500 405,500 0.0% 2,187,900 3,288,110 (33.5%) 158,276 271,011 (41.6%) 104,095 230,177 (54.8%)Parque Arboleda 41,000 41,000 0.0% 193,518 268,076 (27.8%) 22,350 29,644 (24.6%) 17,906 22,849 (21.6%)Parque Caracolí 38,500 39,000 (1.3%) 119,205 185,708 (35.8%) 17,191 26,545 (35.2%) 6,517 13,431 (51.5%)Parque La Colina 61,500 62,000 (0.8%) 411,126 634,704 (35.2%) 49,978 77,072 (35.2%) 43,304 70,471 (38.6%)Premium Outlet Arauco (Sopó) 13,000 13,000 0.0% 30,004 37,296 (19.6%) 2,498 3,109 (19.7%) 1,097 810 35.5%Total Colombia 154,000 155,000 (0.6%) 753,853 1,125,783 (33.0%) 92,016 136,369 (32.5%) 68,824 107,561 (36.0%)
Revenues NOIChile in MMCLP / Peru in MPEN / Colombia in MMCOP
GLA (m2) Tenant Sales

204
PA
RQ
UE
AR
AU
CO
IN
TE
GR
AT
ED
RE
PO
RT
20
20
GOVERNANCEAND COMMUNITYINTRODUCTION ABOUT US
ECONOMIC PERFORMANCE
ENVIRONMENTAL PERFORMANCE
SOCIAL PERFORMANCE
ADDITIONAL INFORMATION
FINANCIAL INFORMATION
Management analysis Independent auditors’ report Consolidated financial statements Summarized financial statements of subsidiaries
Property Level Results – Last Twelve Months
(1) Occupancy levels presented in the table correspond to the current contractual situation in each shopping mall. However, considering the current operating status of the Company, it is not possible to guarantee the continued presence of each tenant in our assets.
12.31.20 12.31.19 Chg. b.p. 2020 2019 Chg. b.p. 2020 2019 Chg. % 2020 2019 Chg. %Parque Arauco Kennedy 98.6% 98.7% (3) 94.6% 97.9% (331) 215,072 290,317 (25.9%) 18,873 35,131 (46.3%)Arauco Maipú 97.5% 99.9% (235) 92.1% 100.0% (788) 185,384 228,978 (19.0%) 10,083 17,709 (43.1%)Arauco Chillán 94.1% 94.0% 13 72.5% 87.7% (1,520) 174,957 217,946 (19.7%) 10,493 17,384 (39.6%)Arauco Estación 95.1% 95.4% (33) 63.0% 89.3% (2,630) 127,838 160,847 (20.5%) 13,435 20,566 (34.7%)Arauco San Antonio 94.7% 95.4% (73) 47.8% 74.2% (2,637) 123,143 135,117 (8.9%) 8,225 14,656 (43.9%)Arauco Express (Strip Centers Chile) 90.0% 90.3% (29) 48.0% 69.6% (2,166) 236,424 172,533 37.0% 12,592 15,178 (17.0%)Arauco Premium Outlets 94.0% 94.7% (73) 73.8% 84.1% (1,038) 198,057 196,945 0.6% 11,305 18,501 (38.9%)Arauco Quilicura 94.8% - N/A 85.4% 91.8% (647) 147,215 135,265 8.8% 8,757 12,161 (28.0%)Arauco Coronel 95.9% 97.9% (196) 67.7% 84.9% (1,726) 180,271 161,117 11.9% 7,520 10,964 (31.4%)Parque Angamos 82.5% 82.2% 32 41.5% 59.0% (1,751) 298,113 188,998 57.7% 12,901 14,740 (12.5%)Arauco El Bosque 95.2% 99.6% (434) 71.4% 84.4% (1,303) 137,962 139,555 (1.1%) 6,477 9,009 (28.1%)Puerto Nuevo Antofagasta 66.6% 75.4% (877) - 79.7% N/A - - N/A 5,640 8,883 (36.5%)Chile Average 95.0% 96.1% (110) 78.1% 91.3% (1,318) 181,748 206,642 (12.0%) 12,292 20,342 (39.6%)MegaPlaza Norte 87.8% 98.1% (1,028) 80.2% 92.0% (1,182) 971 1,044 (7.0%) 46 76 (39.8%)MegaPlaza Express Villa Chorrillos 97.4% 96.7% 67 60.8% 85.0% (2,421) 2,866 1,163 146.4% 53 73 (27.9%)Larcomar 80.2% 85.3% (504) 71.0% 83.4% (1,238) 959 1,443 (33.5%) 75 158 (52.4%)Parque Lambramani 72.5% 92.6% (2,010) - 57.4% N/A 486 399 21.8% 17 34 (50.0%)MegaPlaza Chimbote 94.7% 95.8% (106) 66.8% 82.0% (1,521) 870 875 (0.6%) 25 43 (42.4%)MegaPlaza Express Villa El Salvador 94.6% 97.3% (272) 55.6% 72.2% (1,663) 676 622 8.7% 36 52 (31.6%)MegaPlaza Express Chincha 93.2% 95.5% (227) 42.6% 71.1% (2,854) 442 358 23.5% 23 38 (39.2%)InOutlet (Premium Outlets) y Viamix (Strip Centers) 82.6% 93.0% (1,048) 74.0% 86.3% (1,232) 518 785 (33.9%) 46 77 (40.2%)MegaPlaza Cañete 99.3% 99.4% (13) 67.8% 79.6% (1,189) 772 675 14.4% 28 35 (21.3%)MegaPlaza Express Barranca 87.0% 90.2% (319) 48.4% 57.3% (887) 661 554 19.3% 33 44 (25.6%)MegaPlaza Pisco 92.8% 92.5% 26 49.7% 79.9% (3,023) 664 625 6.2% 24 38 (36.7%)El Quinde Cajamarca 75.2% 96.9% (2,167) 56.9% 86.2% (2,926) 460 438 5.2% 29 44 (33.1%)El Quinde Ica 83.5% 98.7% (1,520) 76.9% 97.9% (2,096) 668 628 6.4% 30 53 (43.4%)MegaPlaza Express Jaén 96.4% 97.4% (95) 26.1% 63.0% (3,689) 799 651 22.8% 22 33 (33.5%)MegaPlaza Huaral 96.8% 95.9% 93 15.2% 52.2% (3,703) 436 230 89.2% 13 17 (27.0%)MegaPlaza Villa El Salvador II 94.7% 93.4% 127 32.6% 41.5% (892) 422 250 68.9% 11 17 (34.9%)Peru Average 87.0% 95.6% (863) 65.8% 84.9% (1,916) 770 750 2.7% 35 59 (41.0%)Parque Arboleda 96.6% 98.3% (163) 80.1% 77.1% 304 599,770 674,894 (11.1%) 48,230 62,214 (22.5%)Parque Caracolí 90.5% 89.5% 101 37.9% 50.6% (1,269) 490,920 568,140 (13.6%) 44,680 64,986 (31.2%)Parque La Colina 97.9% 96.4% 148 86.6% 91.4% (479) 680,840 886,686 (23.2%) 72,353 107,063 (32.4%)Premium Outlet Arauco (Sopó) 59.7% 64.7% (504) 43.9% 26.0% 1,788 402,344 360,869 11.5% 26,986 33,751 (20.0%)Colombia Average 92.5% 92.5% (2) 74.8% 78.9% (408) 606,041 729,490 (16.9%) 56,401 80,362 (29.8%)
Chile in CLP / Peru in PEN / Colombia in COPOccupancy1 NOI Margin Monthly Tenant Sales per m2 Monthly Revenues per m2

205
PA
RQ
UE
AR
AU
CO
IN
TE
GR
AT
ED
RE
PO
RT
20
20
GOVERNANCEAND COMMUNITYINTRODUCTION ABOUT US
ECONOMIC PERFORMANCE
ENVIRONMENTAL PERFORMANCE
SOCIAL PERFORMANCE
ADDITIONAL INFORMATION
FINANCIAL INFORMATION
Management analysis Independent auditors’ report Consolidated financial statements Summarized financial statements of subsidiaries
Future Developments2020 and onwards
1) Projects in Chile in UF, in Peru in ThPEN, in Colombia in MCOP 2) Considering the exchange rate as of December 31, 2020: 29,070.33 CLP/UF, 710.95 CLP/US$, 3,421.00 COP/US$, 3.62 PEN/US$.
New Projects Type Country FormatEstimated
Date Total GLA (m2) % Ownership Owned GLA (m2)Total investment Local Currency1
Total investment US$MM2
Parque Alegra Development Colombia Regional 2H21 50.000 52,5% 26.250 434.000 127AEX Santa Elena Development Chile Strip Center 2H21 1.500 100,0% 1.500 108.000 4Subtotal 51.500 27.750 131
Expansions Type Country Format Estimated Date Total GLA (m2) % Ownership Owned GLA (m2)
Total investment Local Currency1
Total investment US$MM2
Parque Arauco Kennedy - Phase 1 Expansion Chile Mixed Use Under review 11.000 100% 11.000 5.355.000 220Parque Arauco Kennedy - Phase 2 Expansion Chile Mixed Use Under review 10.000 100% 10.000 2.200.000 90Larcomar Reconversion Peru Regional 1H21 3.000 100% 3.000 13.700 4Subtotal 24.000 24.000 314
Acquisitions Type Country Format Estimated Date Total GLA (m2) % Ownership Owned GLA (m2)
Total investment Local Currency1
Total investment US$MM2
Puerto Nuevo Antofagasta (Balmaceda Tower, Hotel Tower) Development Chile Strip center 1H21 (Tower),
Under review 4.000 100% 4.000 250.000 10
Subtotal 4.000 4.000 10
Projects incorporated in 2020 Type Country Format Estimated Date Total GLA (m2) % Ownership Owned GLA (m2)
Total investment Local Currency1
Total investment US$MM2
Arauco Premium Outlet Buenaventura Expansion Chile Outlet jan-20 1.500 100% 1.500 140.000 5Arauco Express Chicauma Development Chile Strip center mar-20 500 100% 500 2.000 0Parque La Colina - Local Reconversion Colombia Regional dec-20 500 100% 500 2.700 1Subtotal 2.500 2.500 6Total 82.000 58.250 461Remaining to invest 288

206
PA
RQ
UE
AR
AU
CO
IN
TE
GR
AT
ED
RE
PO
RT
20
20
GOVERNANCEAND COMMUNITYINTRODUCTION ABOUT US
ECONOMIC PERFORMANCE
ENVIRONMENTAL PERFORMANCE
SOCIAL PERFORMANCE
ADDITIONAL INFORMATION
FINANCIAL INFORMATION
Management analysis Independent auditors’ report Consolidated financial statements Summarized financial statements of subsidiaries
Phase 1
FORMATMixed use
COMMERCIAL GLA11,000 m2
+ HOTEL AND CONVENTION CENTER 43,000 m2
PA ownership100%
TOTAL INVESTMENTUS$ 220 million
CONSTRUCTION START DATE2017
SCHEDULED TO OPENUnder review
This expansion will add 11,000 m2 of commercial GLA at Parque Arauco Kennedy, along with a 5-star Hilton hotel featuring 401 rooms and Santiago’s largest hotel convention center (with capacity for more than 2,800 people and surface area of 3,000 m2). Additionally, there will be two restaurants, three bars, two pools, a gym and an executive lounge as well as 700 additional parking spaces. The project also includes construction of a 25,000 m2 Falabella store, the retail chain’s largest.
Phase 2
FORMATMixed use
COMERCIAL GLA10,000 m2
+ TOWER GLA 15,000 m2
PA ownership100%
TOTAL INVESTMENTUS$ 90 million
CONSTRUCTION START DATEUnder review
SCHEDULED TO OPENUnder review
The second expansion phase at Parque Arauco Kennedy was announced in 2018. It includes a 14-story, 15,000 m2 tower with an additional 10,000 m2 GLA at the base of the tower.
Future Developments
Parque Arauco Kennedy Expansion

207
PA
RQ
UE
AR
AU
CO
IN
TE
GR
AT
ED
RE
PO
RT
20
20
GOVERNANCEAND COMMUNITYINTRODUCTION ABOUT US
ECONOMIC PERFORMANCE
ENVIRONMENTAL PERFORMANCE
SOCIAL PERFORMANCE
ADDITIONAL INFORMATION
FINANCIAL INFORMATION
Management analysis Independent auditors’ report Consolidated financial statements Summarized financial statements of subsidiaries
FORMATRegional mall
LOCATIONBarranquilla, Colombia
ADDITIONAL GLA50,000 m2
PA ownership52.5%
TOTAL INVESTMENTUS$ 127 million
CONSTRUCTION START DATE2019
SCHEDULED TO OPEN2H21
The project is in the initial stage of construction and islocated in the southern part of Barranquilla on Boyacá Avenue, one of the main roads that connects the northern and southern sectors of the city, as well as the Barranquilla Airport. The anchor stores of the project will be a department store (Falabella), a supermarket (Olímpica), a movie theater (CineColombia) and a children’s entertainment area (Playland). The shopping center will have more than 300 stores, a food court, a restaurant area, large common areas and underground parking, and is expected to be the leading shopping center in southern Barranquilla.
Future Developments
Parque Alegra

208
PA
RQ
UE
AR
AU
CO
IN
TE
GR
AT
ED
RE
PO
RT
20
20
GOVERNANCEAND COMMUNITYINTRODUCTION ABOUT US
ECONOMIC PERFORMANCE
ENVIRONMENTAL PERFORMANCE
SOCIAL PERFORMANCE
ADDITIONAL INFORMATION
FINANCIAL INFORMATION
Management analysis Independent auditors’ report Consolidated financial statements Summarized financial statements of subsidiaries
Landbank
838.600 m2is the total surface in ourLandbank
1) Projects in Chile in UF, in Peru in ThPEN, in Colombia in MMCOP 2) Considering the exchange rate as of December 31, 2020: 29,070.33 CLP/UF, 710.95 CLP/US$, 3,421.00 COP/US$, 3.62 PEN/US$.
Name m2 % OwnershipTotal cost
(local currency)1Total cost (US$MM)2
Quilicura 29,600 100% 70,000 3Buenaventura 100,400 100% 401,500 16Chicureo 47,600 100% 200,500 8Los Andes 40,100 100% 115,500 5San Pedro de la Paz 17,000 100% 51,000 2Buin 43,700 100% 195,000 8Total Chile 278,400 100% 1,033,500 42Chimbote 42,700 100% 17,500 5Talara 30,700 100% 10,000 3Ica 12,600 100% 13,500 4Chiclayo 7,100 100% 5,600 2Pomalca Chiclayo 45,000 100% 7,000 2Other Desarrollos Panamericana land developments 270,900 50% 111,000 31
Total Peru 409,000 67% 164,600 47Neiva 49,500 100% 22,000 6Valledupar 46,000 100% 30,000 9Barranquilla 56,200 100% 59,000 17Total Colombia 151,700 100% 111,000 32Total 839,100 84% 121

209
PA
RQ
UE
AR
AU
CO
IN
TE
GR
AT
ED
RE
PO
RT
20
20
GOVERNANCEAND COMMUNITYINTRODUCTION ABOUT US
ECONOMIC PERFORMANCE
ENVIRONMENTAL PERFORMANCE
SOCIAL PERFORMANCE
ADDITIONAL INFORMATION
FINANCIAL INFORMATION
Management analysis Independent auditors’ report Consolidated financial statements Summarized financial statements of subsidiaries
Advances in Sustainability
We highlight main sustainability milestones related to our communities:
For the fifth consecutive year, we supported the Descúbreme Foundation through our "Christmas with Meaning" campaign in all of our Chilean shopping centers.
The challenge in 2020 was different, it was aimed at linking customers in the Christmas celebration by sending Christmas postcards with digital designs created by the children and young people from Fundación Descúbreme, an organization that works together with different communities on inclusion issues and development for people with cognitive disabilities.
Our goal as a company was to have 5,000 of our postcards shared, which contained inclusion messages. In parallel, we committed ourselves to deliver tablets to promote digital education for children and adolescents sponsored by the institution in the areas where our Chilean shopping centers operate: Metropolitan Region, San Pedro de La Paz, Chillán, Coronel and San Antonio.
GATHERING GREETINGS – MEGAPLAZA NORTE Y LARCOMAR
This Christmas, no one deserved to be alone, that is why we decided to prepare a surprise for the senior citizens of the Splendor home, for whom the current situation does not allow them to leave easily or receive visits from their relatives.
We prepared a special space in MegaPlaza Norte and Larcomar so that our visitors would be encouraged to record affectionate greetings for the more than 20 senior citizens of this nursing home. We gather all these greetings in an emotional video which was then delivered together with food and essential products for Christmas.
This action fills us with satisfaction and confirms that, whether it be physically or through a screen, the best Christmas gift will always be to be together.

210
PA
RQ
UE
AR
AU
CO
IN
TE
GR
AT
ED
RE
PO
RT
20
20
GOVERNANCEAND COMMUNITYINTRODUCTION ABOUT US
ECONOMIC PERFORMANCE
ENVIRONMENTAL PERFORMANCE
SOCIAL PERFORMANCE
ADDITIONAL INFORMATION
FINANCIAL INFORMATION
Management analysis Independent auditors’ report Consolidated financial statements Summarized financial statements of subsidiaries
29
Advances in sustainability
We highlight main sustainability milestones related to the environment and communities:
Together with the local Chamber of Commerce and Santander‘sFoundation for Development, this initiative was carried out,which included training spaces, networking, fairs to marketproducts and mentoring with renowned entrepreneurs in thecity.
9900 ttoottaall ttrraaiinniinngg hhoouurrss220055 eennttrreepprreenneeuurrss rreeggiisstteerreedd
Impúlsate Ya!Three years of support for entrepreneursin Bucaramanga
Emprende Arboleda91 local entrepreneurs supported in 2020
In alliance with the Secretary of Competitiveness and theEntrepreneurship Centers of the Mayor's Office of Pereira inColombia, we work to develop entrepreneurship in theshopping center.
The main objective is to open marketing spaces to facilitatethe economic reactivation of this type of business that hasbeen particularly affected by the pandemic.
Additionally, for the third consecutive year we wereconfirmed in the FTSE4Good index of the LondonStock Exchange, which evaluates companies aroundthe world with respect to their sustainability practicesand their integration into their business andmanagement model.
For the fifth consecutive year, we are part of the DowJones Sustainability Index in Chile, MILA Pacific Allianceand Emerging Markets.
We understand this is a result of the transversalmanagement that we have been promoting for years onEnvironmental, Social and Corporate Governance (ESG)issues in the places where we operate as a business.
In 2020 we remained in the InternationalSustainability indices

211
PA
RQ
UE
AR
AU
CO
IN
TE
GR
AT
ED
RE
PO
RT
20
20
GOVERNANCEAND COMMUNITYINTRODUCTION ABOUT US
ECONOMIC PERFORMANCE
ENVIRONMENTAL PERFORMANCE
SOCIAL PERFORMANCE
ADDITIONAL INFORMATION
FINANCIAL INFORMATION
Management analysis Independent auditors’ report Consolidated financial statements Summarized financial statements of subsidiaries
Continuous innovation at Parque AraucoWe continue to strive to make the customer experience at Parque Arauco the best possible. We have been working on many innovative initiatives in particular in regards to the omnichannel shopping experience to improve the service and experience offered to our customers both inside and outside the mall.
ARAUCO FOODIE – PARQUE ARAUCO KENNEDYCustomers in the mall or nearby areas can place orders using their phone and then go pick up their order when it is ready. This will save customers time, not have to wait in line, and there is no shipping charge.
Alternatively, when you are in a restaurant in the mall, this service allows customers the ability to view the menu, order, and pay. This minimizes contact with others and allows for a seamless experience.
COMPRA Y RECOGE – PARQUE LA COLINA
This program is currently available for foodservice, but with the idea of expanding to other purchasing categories.
Customers can access different food options from the mall's website and pay online. Customers will be notified by email or text when their food is ready and can then go to the mall for pick up. This will allow customers to save time, not have to wait in lines, and minimize contact, achieving a unique experience.
LOCAL – PARQUE LA COLINA
An exclusive area of Parque La Colina for digital native entrepreneurs, most of those who started doing business in the online world and now want to try operating in a shopping center. For the entrepreneur, it allows customers to get to know the brand and the products in a physical environment, and helps them expand their business and bring their products closer to the end customers.
OTHER INITIATIVESThese initiatives are in addition to those highlighted in this section in previous reports this year that include:
• Arauco Pickup• Delivery Gastronómico• Personal Shopper
• Alianza Rappi Colombia• Ticketless Parking
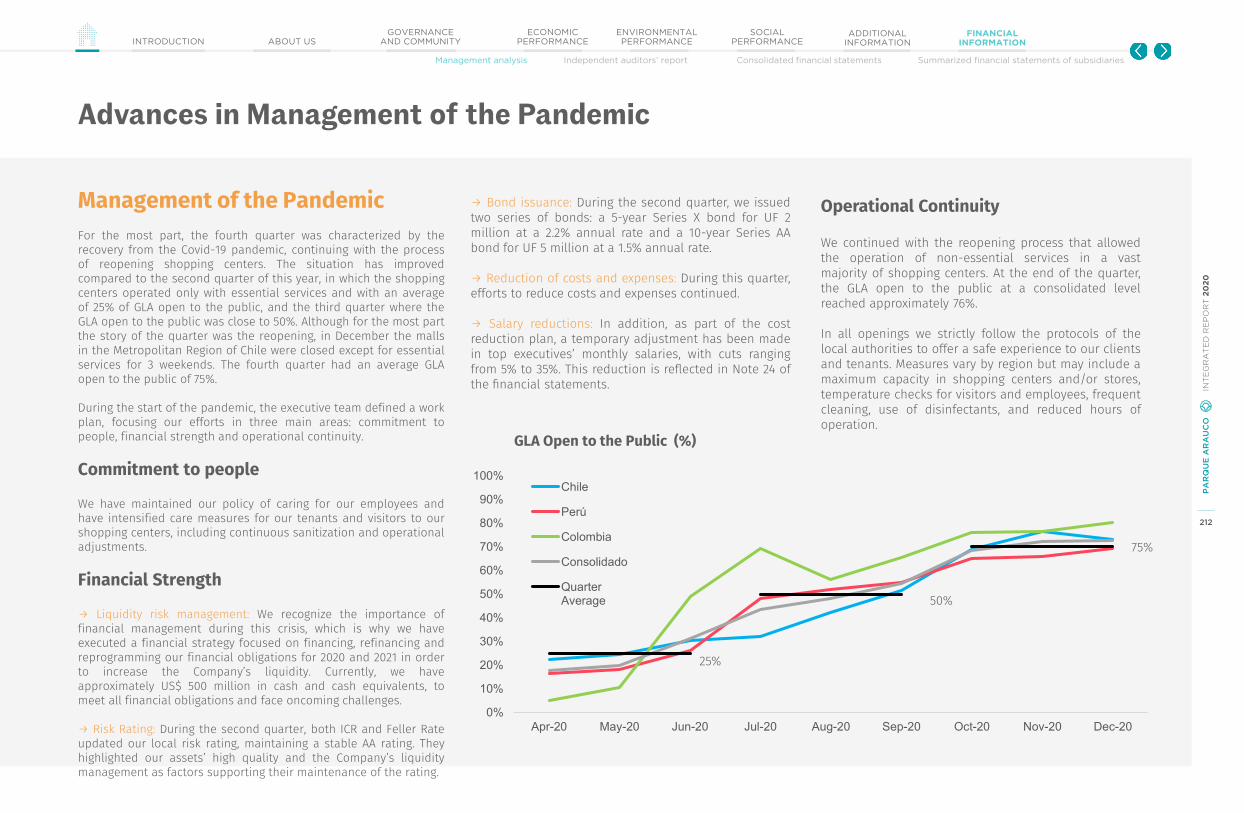
212
PA
RQ
UE
AR
AU
CO
IN
TE
GR
AT
ED
RE
PO
RT
20
20
GOVERNANCEAND COMMUNITYINTRODUCTION ABOUT US
ECONOMIC PERFORMANCE
ENVIRONMENTAL PERFORMANCE
SOCIAL PERFORMANCE
ADDITIONAL INFORMATION
FINANCIAL INFORMATION
Management analysis Independent auditors’ report Consolidated financial statements Summarized financial statements of subsidiaries
→ Bond issuance: During the second quarter, we issuedtwo series of bonds: a 5-year Series X bond for UF 2million at a 2.2% annual rate and a 10-year Series AAbond for UF 5 million at a 1.5% annual rate.
→ Reduction of costs and expenses: During this quarter,efforts to reduce costs and expenses continued.
→ Salary reductions: In addition, as part of the costreduction plan, a temporary adjustment has been madein top executives’ monthly salaries, with cuts rangingfrom 5% to 35%. This reduction is reflected in Note 24 ofthe financial statements.
Operational Continuity
We continued with the reopening process that allowedthe operation of non-essential services in a vastmajority of shopping centers. At the end of the quarter,the GLA open to the public at a consolidated levelreached approximately 76%.
In all openings we strictly follow the protocols of thelocal authorities to offer a safe experience to our clientsand tenants. Measures vary by region but may include amaximum capacity in shopping centers and/or stores,temperature checks for visitors and employees, frequentcleaning, use of disinfectants, and reduced hours ofoperation.
Advances in Management of the Pandemic
Management of the PandemicFor the most part, the fourth quarter was characterized by therecovery from the Covid-19 pandemic, continuing with the processof reopening shopping centers. The situation has improvedcompared to the second quarter of this year, in which the shoppingcenters operated only with essential services and with an averageof 25% of GLA open to the public, and the third quarter where theGLA open to the public was close to 50%. Although for the most partthe story of the quarter was the reopening, in December the mallsin the Metropolitan Region of Chile were closed except for essentialservices for 3 weekends. The fourth quarter had an average GLAopen to the public of 75%.
During the start of the pandemic, the executive team defined a workplan, focusing our efforts in three main areas: commitment topeople, financial strength and operational continuity.
Commitment to peopleWe have maintained our policy of caring for our employees andhave intensified care measures for our tenants and visitors to ourshopping centers, including continuous sanitization and operationaladjustments.
Financial Strength→ Liquidity risk management: We recognize the importance offinancial management during this crisis, which is why we haveexecuted a financial strategy focused on financing, refinancing andreprogramming our financial obligations for 2020 and 2021 in orderto increase the Company’s liquidity. Currently, we haveapproximately US$ 500 million in cash and cash equivalents, tomeet all financial obligations and face oncoming challenges.
→ Risk Rating: During the second quarter, both ICR and Feller Rateupdated our local risk rating, maintaining a stable AA rating. Theyhighlighted our assets’ high quality and the Company’s liquiditymanagement as factors supporting their maintenance of the rating.
GLA Open to the Public (%)
0%
10%
20%
30%
40%
50%
60%
70%
80%
90%
100%
Apr-20 May-20 Jun-20 Jul-20 Aug-20 Sep-20 Oct-20 Nov-20 Dec-20
Chile
Perú
Colombia
Consolidado
QuarterAverage
25%
50%
75%

213
PA
RQ
UE
AR
AU
CO
IN
TE
GR
AT
ED
RE
PO
RT
20
20
GOVERNANCEAND COMMUNITYINTRODUCTION ABOUT US
ECONOMIC PERFORMANCE
ENVIRONMENTAL PERFORMANCE
SOCIAL PERFORMANCE
ADDITIONAL INFORMATION
FINANCIAL INFORMATION
Management analysis Independent auditors’ report Consolidated financial statements Summarized financial statements of subsidiaries
Advances in Management of the Pandemic
Open without restrictions
Open with restrictions2
Only essential services
Operation suspended
1) GLA currently open to the public as of December 31, 2020. 2) GLA open with restrictions can include a maximum capacity in the malls/stores, use of facial masks, limitations regarding the operation of restaurants and entertainment tenants, reduced operating hours or limitations on weekends.
214
PA
RQ
UE
AR
AU
CO
IN
TE
GR
AT
ED
RE
PO
RT
20
20
GOVERNANCEAND COMMUNITYINTRODUCTION ABOUT US
ECONOMIC PERFORMANCE
ENVIRONMENTAL PERFORMANCE
SOCIAL PERFORMANCE
ADDITIONAL INFORMATION
FINANCIAL INFORMATION
Management analysis Independent auditors’ report Consolidated financial statements Summarized financial statements of subsidiaries
Market Risk Analysis
The following are potential risks that the Company may face:
→ Interest rates in the countries where we operate could rise, causing the value of our assets to fall, making our financial liabilities more expensive and increasing our financing cost for new projects, expansions and improvements. Likewise, there are financial risks related to inflation, customer credit risk and liquidity.
→ There is a risk of equity value decreasing, as well as our financial expenses increasing, lowering our results and return on projects. Despite raising capital in the past in order to stay true to our financing policies, it is not possible to assure an increase in financial expenses can be offset by this measure. The Company’s current liquidity and cash position mitigate, although does not eliminate, this risk.
→ Economic and market conditions could adversely impact our operations, causing sales to fall, lowering our results.
→ We operate our shopping centers in a competitive environment, which could lead to an over-supply of shopping centers and, as a result, diminished revenue.
→ Although physical sales still play a key role, online sales are becoming more and more important. There is a risk of shopping center sales falling as a result of e-commerce, which is why we have diversified into different formats, including outlets and new, non-retail projects, although still representing a small portion of our portfolio.
→ The risk from the occurrence of a disease spreading internationally or attacking the majority of individuals in a
locality or region. As the disease has widespread propagation for an extended period of time, and necessarily would reduce people’s mobility and increase social distancing in order to combat it, it could lead to the total or partial closure of shopping establishments and an economic recession. As a result, the Company’s results may be affected by the possible total or partial closure of its assets, the decrease in sales, decrease in occupancy due to the lower activity and/or our tenants’ having financial problems, increase in costs due to preventive measures, increase in financial expenses, financial risk in general and access to capital markets, relevant increase in delinquency and risk of increasing bad debt, in addition to a series of effects resulting from this scenario. On the other hand, these scenarios increase uncertainty, which results in the risk of incorrectly analyzing and evaluating the real situation the Company is facing, as well as our relationships with tenants and providers.
→ Environmental risks, global warming and climate change may result in droughts which affect our energetic and hydric networks, affecting prices of basic resources such as water and electricity. Likewise, such risks could result, in the long-term, in migratory effects which could impact zones where our assets are located. These risks have not been fully dimensioned, as a result it is not possible to quantify its effects, even though its impact is estimated as relevant.
→ Changes in the regulatory, security and/or socio-political conditions in the countries where the Company operates could affect its financial results, as well as the value of its real estate assets and its ability to send or receive funds to or from abroad. States and regulatory entities influence through changes to tax, labor, environmental and urban regulations,
as well as through adjustments to monetary policies, public spending, among other aspects that may affect macroeconomic stability. As a result, the social and security conditions as well as the aforementioned changes could have an impact on operations, profitability of current and future projects, affect savings and cash flows to pay for investments, and extend project development times, among others.
→ Additionally, there are risks of social unrest, natural disasters, such as earthquakes or fires, mutiny, looting, cyber-attacks, interruptions in the supply chains of goods and essential health services, food and/or others, which could generate specific or massive material damage in our portfolio and/or activities.
Recent phenomena such as de Covid-19 pandemic, political and social unrest in some markets where we operate, among others, not only make us think the risk levels of this factors have increased significantly, but in general, because of these or other events that may occur in the future, levels of uncertainty are much higher than what was thought to exist some time ago, which is why investors should be conscious of them and make their own evaluations.

215
PA
RQ
UE
AR
AU
CO
IN
TE
GR
AT
ED
RE
PO
RT
20
20
GOVERNANCEAND COMMUNITYINTRODUCTION ABOUT US
ECONOMIC PERFORMANCE
ENVIRONMENTAL PERFORMANCE
SOCIAL PERFORMANCE
ADDITIONAL INFORMATION
FINANCIAL INFORMATION
Management analysis Independent auditors’ report Consolidated financial statements Summarized financial statements of subsidiaries
Consolidated Financial Statements
Income StatementConsolidated Income Statement (MMCh$) 4Q20 4Q19 Chg.% 2020 2019 Chg.%Revenues 43,460 57,900 (24.9%) 125,852 205,613 (38.8%)(+) Cost of sales (8,316) (10,441) (20.4%) (31,698) (39,963) (20.7%)Gross Profit 35,145 47,459 (25.9%) 94,154 165,650 (43.2%)(+) Administrative expenses (7,633) (6,451) 18.3% (33,824) (19,847) 70.4%(+) Other gains, by function 33,597 48,776 (31.1%) 34,605 49,131 (29.6%)(+) Other losses, by function (13,600) (5,432) 150.4% (20,133) (10,993) 83.1%Operational results 47,508 84,352 (43.7%) 74,802 183,941 (59.3%)(+) Financial income 1,103 1,024 7.7% 7,494 11,444 (34.5%)(+) Financial expenses (16,534) (9,753) 69.5% (49,813) (40,046) 24.4%(+) Share of profit (loss) of associates accounted 6,044 530 1,040.3% 5,212 7,187 (27.5%)(+) Foreign exchange differences (315) 936 N/A 1,065 810 31.5%(+) Income (loss) of associates accounted (12,437) (7,461) 66.7% (23,767) (21,873) 8.7%Profit before income tax 25,370 69,628 (63.6%) 14,994 141,462 (89.4%)(+) Current taxes 1,442 (1,982) N/A (995) (14,452) (93.1%)(+) Deferred taxes (11,091) (14,507) (23.5%) (9,750) (22,368) (56.4%)Net profit (loss) 15,721 53,139 (70.4%) 4,249 104,643 (95.9%)Net profit (loss) attributable to:Equity holders of the company 14,926 48,691 (69.3%) 1,846 93,394 (98.0%)Non-controlling interests 794 4,448 (82.1%) 2,402 11,249 (78.6%)
EBITDA 4Q20 4Q19 Chg.% 2020 2019 Chg.%Revenues 43,460 57,900 (24.9%) 125,852 205,613 (38.8%)(+) Cost of sales (8,316) (10,441) (20.4%) (31,698) (39,963) (20.7%)(+) Administrative expenses (7,633) (6,451) 18.3% (33,824) (19,847) 70.4%(-) Amortization and depreciation (1,277) (1,262) 1.2% (5,260) (4,759) 10.5%EBITDA 28,789 42,270 (31.9%) 65,591 150,562 (56.4%)

216
PA
RQ
UE
AR
AU
CO
IN
TE
GR
AT
ED
RE
PO
RT
20
20
GOVERNANCEAND COMMUNITYINTRODUCTION ABOUT US
ECONOMIC PERFORMANCE
ENVIRONMENTAL PERFORMANCE
SOCIAL PERFORMANCE
ADDITIONAL INFORMATION
FINANCIAL INFORMATION
Management analysis Independent auditors’ report Consolidated financial statements Summarized financial statements of subsidiaries
12.31.2020 12.31.2019(MMCh$) (MMCh$)
Current liabilitiesOther current financial liabilities 54,381 233,357Commercial credits and other accounts payable 26,779 49,464Current provisions 1,058 1,225Current tax liabilities 1,756 17,078Current provisions for employees 1,977 5,021Other current non-financial liabilities 6,175 12,448Current lease liabilities 1,735 2,655Total current liabilities 93,862 321,246Non-current liabilitiesOther non-current financial liabilities 1,164,471 848,204Deferred tax liabilities 252,310 246,138Other non-current non-financial liabilities 21,778 21,665Non-current lease liabilities 67,619 78,136Total non-current liabilities 1,506,177 1,194,143Total liabilities 1,600,039 1,515,390EquityIssue share capital 423,575 423,575Accumulated earnings (losses) 569,613 582,626Premium on new issued shares 289 289Other reserves (15,209) 50,580Equity attributable to shareholders of the company 978,269 1,057,070Minority interest 109,355 110,808Total equity 1,087,624 1,167,879Total liabilities and equity 2,687,663 2,683,268
Liabilities and equity12.31.2020 12.31.2019(MMCh$) (MMCh$)
Current assetsCash and cash equivalents 357,032 315,435Other current financial assets 113 3Other current non-financial assets 32,597 49,988Trade accounts receivable and other receivables 27,006 35,041Accounts receivable from related companies 272 234Current tax receivable 9,899 9,222Total current assets 426,920 409,922Non-current assetsOther non-current financial assets 4,388 5,978Other non-current non-financial assets 14,292 21,316Non-current accounts receivable 49 52Non-current accounts receivable to related entities 1,973 2,027Share of profit (loss) of associates accounted 118,540 117,210Intangible assets excluding surplus value 12,984 18,105Surplus value 2,733 3,258Property, plant and equipment 27,088 22,895Investment properties 2,023,100 2,037,106Deferred tax assets 53,531 42,597Right of use assets 2,066 2,801Total non-current assets 2,260,744 2,273,346Total assets 2,687,663 2,683,268
Assets
Consolidated Financial Statements
Balance Sheet
216
PA
RQ
UE
AR
AU
CO
IN
TE
GR
AT
ED
RE
PO
RT
20
20
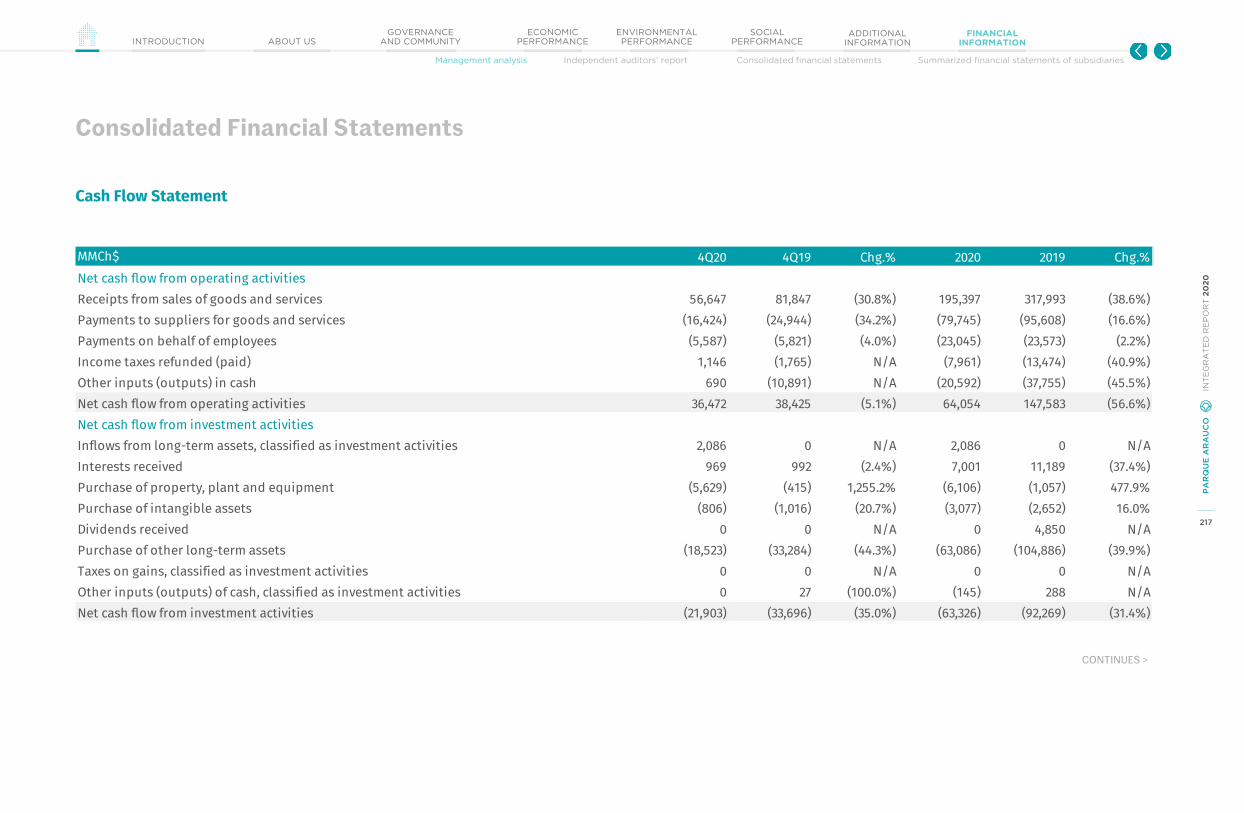
217
PA
RQ
UE
AR
AU
CO
IN
TE
GR
AT
ED
RE
PO
RT
20
20
GOVERNANCEAND COMMUNITYINTRODUCTION ABOUT US
ECONOMIC PERFORMANCE
ENVIRONMENTAL PERFORMANCE
SOCIAL PERFORMANCE
ADDITIONAL INFORMATION
FINANCIAL INFORMATION
Management analysis Independent auditors’ report Consolidated financial statements Summarized financial statements of subsidiaries
MMCh$ 4Q20 4Q19 Chg.% 2020 2019 Chg.%Net cash flow from operating activitiesReceipts from sales of goods and services 56,647 81,847 (30.8%) 195,397 317,993 (38.6%)Payments to suppliers for goods and services (16,424) (24,944) (34.2%) (79,745) (95,608) (16.6%)Payments on behalf of employees (5,587) (5,821) (4.0%) (23,045) (23,573) (2.2%)Income taxes refunded (paid) 1,146 (1,765) N/A (7,961) (13,474) (40.9%)Other inputs (outputs) in cash 690 (10,891) N/A (20,592) (37,755) (45.5%)Net cash flow from operating activities 36,472 38,425 (5.1%) 64,054 147,583 (56.6%)Net cash flow from investment activitiesInflows from long-term assets, classified as investment activities 2,086 0 N/A 2,086 0 N/AInterests received 969 992 (2.4%) 7,001 11,189 (37.4%)Purchase of property, plant and equipment (5,629) (415) 1,255.2% (6,106) (1,057) 477.9%Purchase of intangible assets (806) (1,016) (20.7%) (3,077) (2,652) 16.0%Dividends received 0 0 N/A 0 4,850 N/APurchase of other long-term assets (18,523) (33,284) (44.3%) (63,086) (104,886) (39.9%)Taxes on gains, classified as investment activities 0 0 N/A 0 0 N/AOther inputs (outputs) of cash, classified as investment activities 0 27 (100.0%) (145) 288 N/ANet cash flow from investment activities (21,903) (33,696) (35.0%) (63,326) (92,269) (31.4%)
CONTINUES >
Consolidated Financial Statements
Cash Flow Statement
217
PA
RQ
UE
AR
AU
CO
IN
TE
GR
AT
ED
RE
PO
RT
20
20
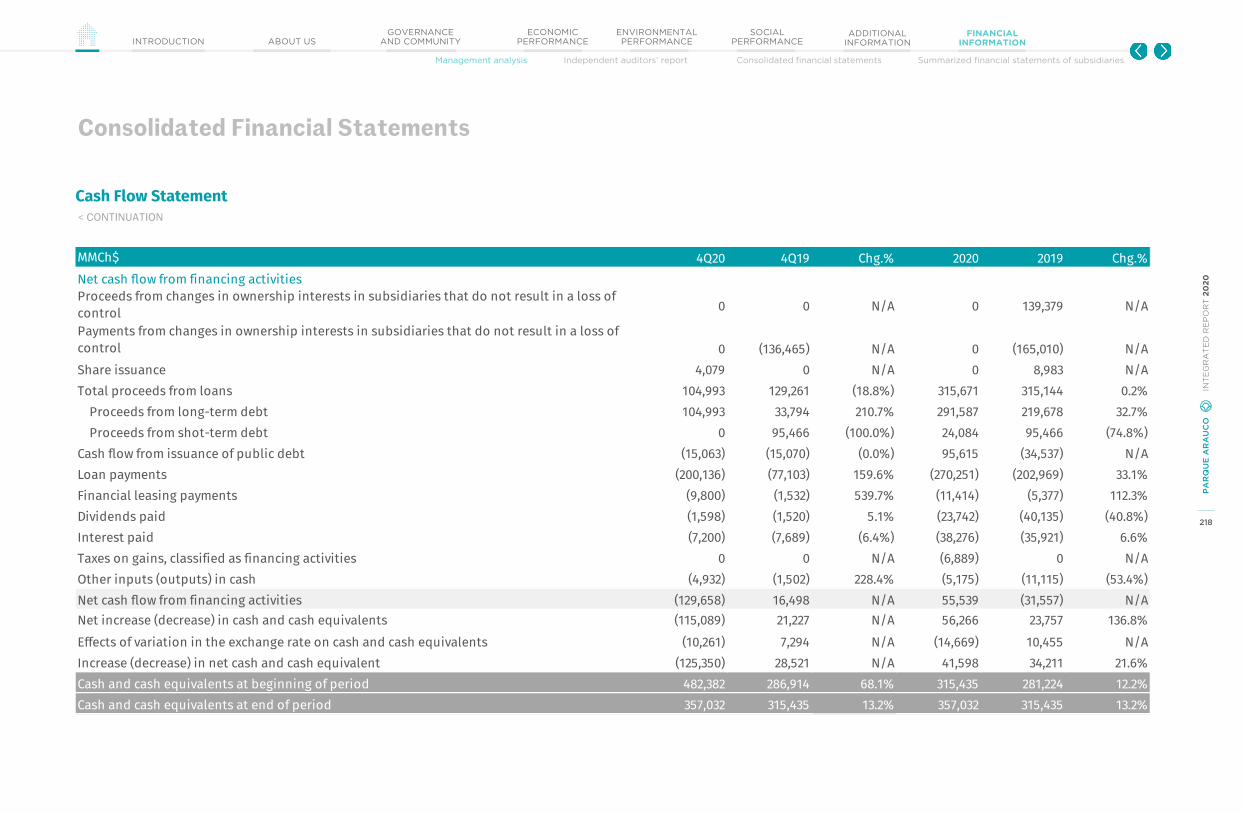
218
PA
RQ
UE
AR
AU
CO
IN
TE
GR
AT
ED
RE
PO
RT
20
20
GOVERNANCEAND COMMUNITYINTRODUCTION ABOUT US
ECONOMIC PERFORMANCE
ENVIRONMENTAL PERFORMANCE
SOCIAL PERFORMANCE
ADDITIONAL INFORMATION
FINANCIAL INFORMATION
Management analysis Independent auditors’ report Consolidated financial statements Summarized financial statements of subsidiaries
Consolidated Financial Statements
< CONTINUATION
MMCh$ 4Q20 4Q19 Chg.% 2020 2019 Chg.%Net cash flow from financing activitiesProceeds from changes in ownership interests in subsidiaries that do not result in a loss of control 0 0 N/A 0 139,379 N/A
Payments from changes in ownership interests in subsidiaries that do not result in a loss of control 0 (136,465) N/A 0 (165,010) N/AShare issuance 4,079 0 N/A 0 8,983 N/ATotal proceeds from loans 104,993 129,261 (18.8%) 315,671 315,144 0.2% Proceeds from long-term debt 104,993 33,794 210.7% 291,587 219,678 32.7% Proceeds from shot-term debt 0 95,466 (100.0%) 24,084 95,466 (74.8%)Cash flow from issuance of public debt (15,063) (15,070) (0.0%) 95,615 (34,537) N/ALoan payments (200,136) (77,103) 159.6% (270,251) (202,969) 33.1%Financial leasing payments (9,800) (1,532) 539.7% (11,414) (5,377) 112.3%Dividends paid (1,598) (1,520) 5.1% (23,742) (40,135) (40.8%)Interest paid (7,200) (7,689) (6.4%) (38,276) (35,921) 6.6%Taxes on gains, classified as financing activities 0 0 N/A (6,889) 0 N/AOther inputs (outputs) in cash (4,932) (1,502) 228.4% (5,175) (11,115) (53.4%)Net cash flow from financing activities (129,658) 16,498 N/A 55,539 (31,557) N/ANet increase (decrease) in cash and cash equivalents (115,089) 21,227 N/A 56,266 23,757 136.8%Effects of variation in the exchange rate on cash and cash equivalents (10,261) 7,294 N/A (14,669) 10,455 N/AIncrease (decrease) in net cash and cash equivalent (125,350) 28,521 N/A 41,598 34,211 21.6%Cash and cash equivalents at beginning of period 482,382 286,914 68.1% 315,435 281,224 12.2%Cash and cash equivalents at end of period 357,032 315,435 13.2% 357,032 315,435 13.2%
Cash Flow Statement

219
PA
RQ
UE
AR
AU
CO
IN
TE
GR
AT
ED
RE
PO
RT
20
20
GOVERNANCEAND COMMUNITYINTRODUCTION ABOUT US
ECONOMIC PERFORMANCE
ENVIRONMENTAL PERFORMANCE
SOCIAL PERFORMANCE
ADDITIONAL INFORMATION
FINANCIAL INFORMATION
Management analysis Independent auditors’ report Consolidated financial statements Summarized financial statements of subsidiaries
Glossary
Adjusted FFO Margin: AFFO / RevenueAFFO: Adjusted Funds From Operations: Net Profit - Depreciation & Amortization - Other Income/expenses - Share of Profit (Loss) of Associates Accounted – Foreign Exchange Differences – Income (Loss) for indexed assets and liabilities - Gains (losses) from the difference between the previous book value and the fair value of financial assets - Deferred tax+ Associates accounted Adjusted FFOControlling Adjusted FFO: AFFO attributable to the shareholders of the companyControlling FFO: FFO attributable to the shareholders of the companyEBITDA: Earnings Before Income Tax Depreciation and Amortization: Revenue + Cost of Sales + Administration Expenses - Depreciation and Amortization EBITDA margin: EBITDA divided by RevenueEPS: Earnings Per Share: Net income attributable to the equity holders of the company/weighted average number of shares outstandingFFO: Funds From Operations: Net Profit - Depreciation & Amortization - Share of Profit (Loss) of Associates Accounted + Associates Accounted FFOGLA – Gross Leasable Area: Equivalent to the sum of the areas available for leaseGreenfield Projects: Organic development of new shopping centersLandbank: Land held by the company for future developmentLTM: Refers to information from the last twelve months
Monthly Revenue/m2: Monthly Revenue divided by revenue-generating GLA during the monthMonthly Sales/m2: Monthly tenant sales divided by sales generating GLA during the monthNeighborhood Mall: IA shopping mall with a GLA between 6,000 and 20,000 m2Net income margin: Net profit divided by Revenue NOI: Net Operating Income: Revenue + Cost of Sales + Administration Expenses - Depreciation & Amortization + Associates accounted NOIOccupancy: GLA paying rent divided by total GLAOccupancy cost: Minimum rent, plus variable rent, plus common expenses, plus a promotion fund that the tenants pay Parque Araucodivided by the sales of the tenantOwned GLA: Total GLA weighted by Parque Arauco’s interest in the mallPipeline: Greenfield and expansion projects under developmentPremium Outler Shopping center located outside of the city offering name brand clothing and goods for a reduced priceRegional Mall: A shopping mall with a GLA over 20,000 m2SSR: Same Store Rent: Percentage change in rent collected from tenants that paid rent in both of the periods comparedSSS: Same Store Sales: Percentage change in sales from tenants that reported sales in both of the periods comparedStrip Center: A shopping center with a GLA less than 6,000 m2Tenant Sales: Tenant sales of the consolidated assetsUF – Unidad de Fomento: A chilean currency unit indexed according to daily inflation
219
PA
RQ
UE
AR
AU
CO
IN
TE
GR
AT
ED
RE
PO
RT
20
20
220
PA
RQ
UE
AR
AU
CO
IN
TE
GR
AT
ED
RE
PO
RT
20
20
GOVERNANCEAND COMMUNITYINTRODUCTION ABOUT US
ECONOMIC PERFORMANCE
ENVIRONMENTAL PERFORMANCE
SOCIAL PERFORMANCE
ADDITIONAL INFORMATION
FINANCIAL INFORMATION
Management analysis Independent auditors’ report Consolidated financial statements Summarized financial statements of subsidiaries
Independent Auditors’Report
220
PA
RQ
UE
AR
AU
CO
IN
TE
GR
AT
ED
RE
PO
RT
20
20
7.2

221
PA
RQ
UE
AR
AU
CO
IN
TE
GR
AT
ED
RE
PO
RT
20
20
GOVERNANCEAND COMMUNITYINTRODUCTION ABOUT US
ECONOMIC PERFORMANCE
ENVIRONMENTAL PERFORMANCE
SOCIAL PERFORMANCE
ADDITIONAL INFORMATION
FINANCIAL INFORMATION
Management analysis Independent auditors’ report Consolidated financial statements Summarized financial statements of subsidiaries
221
PA
RQ
UE
AR
AU
CO
IN
TE
GR
AT
ED
RE
PO
RT
20
20
7.2 Independent Auditors’ Report
INDEPENDENT AUDITOR'S REPORT
To the Shareholders and Directors of Parque Arauco S.A.
We have audited the accompanying consolidated financial statements of Parque Arauco S.A. and its subsidiaries (the "Company"), which comprise the consolidated statement of financial position as of December 31, 2020 and 2019, and the related consolidated statements of comprehensive income, changes in equity and cash flows for the years then ended, and the related notes to the consolidated financial statements.
Management's responsibility for the consolidated financial statements
The Company´s management is responsible for the preparation and fair presentation of these consolidated financial statements in accordance with International Financial Reporting Standards (IFRS) as issued by the International Accounting Standards Board ("IASB"). This responsibility includes the design, implementation, and maintenance of internal control relevant to the preparation and fair presentation of consolidated financial statements that are free from material misstatement, whether due to fraud or error.
Auditor's responsibility
Our responsibility is to express an opinion on these consolidated financial statements based on our audits. We conducted our audits in accordance with auditing standards generally accepted in Chile. Those standards require that we plan and perform the audit to obtain reasonable assurance about whether the consolidated financial statements are free from material misstatement.
An audit involves performing procedures to obtain audit evidence about the amounts and disclosures in the consolidated financial statements. The procedures selected depend on the auditor's judgment, including the assessment of the risks of material misstatement of the consolidated financial statements, whether due to fraud or error. In making those risk assessments, the auditor considers internal control relevant to the entity's preparation and fair presentation of the consolidated financial statements in order to design audit procedures that are appropriate in the circumstances, but not for the purpose of expressing an opinion on the effectiveness of the entity's internal control. Accordingly, we express no such opinion. An audit also includes evaluating the appropriateness of accounting policies used and the reasonableness of significant accounting estimates made by management, as well as evaluating the overall presentation of the consolidated financial statements.
We believe that the audit evidence we have obtained is sufficient and appropriate to provide a basis for our audit opinion.
Deloitte Auditores y Consultores Limitada Rosario Norte 407 Rut: 80.276.200-3 Las Condes, Santiago Chile Fono: (56) 227 297 000 Fax: (56) 223 749 177 [email protected] www.deloitte.cl
Deloitte® se refiere a Deloitte Touche Tohmatsu Limited una compañía privada limitada por garantía, de Reino Unido, y a su red de firmas miembro, cada una de las cuales es una entidad legal separada e independiente. Por favor, vea en www.deloitte.com/cl/acercade la descripción detallada de la estructura legal de Deloitte Touche Tohmatsu Limited y sus firmas miembro.
Deloitte Touche Tohmatsu Limited es una compañía privada limitada por garantía constituida en Inglaterra & Gales bajo el número 07271800, y su domicilio registrado: Hill House, 1 Little New Street, London, EC4A 3TR, Reino Unido.
Opinion In our opinion, the consolidated financial statements referred to above, present fairly, in all material respects, the financial position of Parque Arauco S.A. and its subsidiaries as of December 31, 2020 and 2019, the results of their operations and their cash flows for the years then ended in accordance with International Financial Reporting Standards (IFRS) as issued by the International Accounting Standards Board ("IASB"). Other matter The accompanying consolidated financial statements have been translated into English solely for the convenience of readers outside of Chile January 25, 2021 Santiago, Chile
INDEPENDENT AUDITOR'S REPORT
To the Shareholders and Directors of Parque Arauco S.A.
We have audited the accompanying consolidated financial statements of Parque Arauco S.A. and its subsidiaries (the "Company"), which comprise the consolidated statement of financial position as of December 31, 2020 and 2019, and the related consolidated statements of comprehensive income, changes in equity and cash flows for the years then ended, and the related notes to the consolidated financial statements.
Management's responsibility for the consolidated financial statements
The Company´s management is responsible for the preparation and fair presentation of these consolidated financial statements in accordance with International Financial Reporting Standards (IFRS) as issued by the International Accounting Standards Board ("IASB"). This responsibility includes the design, implementation, and maintenance of internal control relevant to the preparation and fair presentation of consolidated financial statements that are free from material misstatement, whether due to fraud or error.
Auditor's responsibility
Our responsibility is to express an opinion on these consolidated financial statements based on our audits. We conducted our audits in accordance with auditing standards generally accepted in Chile. Those standards require that we plan and perform the audit to obtain reasonable assurance about whether the consolidated financial statements are free from material misstatement.
An audit involves performing procedures to obtain audit evidence about the amounts and disclosures in the consolidated financial statements. The procedures selected depend on the auditor's judgment, including the assessment of the risks of material misstatement of the consolidated financial statements, whether due to fraud or error. In making those risk assessments, the auditor considers internal control relevant to the entity's preparation and fair presentation of the consolidated financial statements in order to design audit procedures that are appropriate in the circumstances, but not for the purpose of expressing an opinion on the effectiveness of the entity's internal control. Accordingly, we express no such opinion. An audit also includes evaluating the appropriateness of accounting policies used and the reasonableness of significant accounting estimates made by management, as well as evaluating the overall presentation of the consolidated financial statements.
We believe that the audit evidence we have obtained is sufficient and appropriate to provide a basis for our audit opinion.
Deloitte Auditores y Consultores Limitada Rosario Norte 407 Rut: 80.276.200-3 Las Condes, Santiago Chile Fono: (56) 227 297 000 Fax: (56) 223 749 177 [email protected] www.deloitte.cl
Deloitte® se refiere a Deloitte Touche Tohmatsu Limited una compañía privada limitada por garantía, de Reino Unido, y a su red de firmas miembro, cada una de las cuales es una entidad legal separada e independiente. Por favor, vea en www.deloitte.com/cl/acercade la descripción detallada de la estructura legal de Deloitte Touche Tohmatsu Limited y sus firmas miembro.
Deloitte Touche Tohmatsu Limited es una compañía privada limitada por garantía constituida en Inglaterra & Gales bajo el número 07271800, y su domicilio registrado: Hill House, 1 Little New Street, London, EC4A 3TR, Reino Unido.

222
PA
RQ
UE
AR
AU
CO
IN
TE
GR
AT
ED
RE
PO
RT
20
20
GOVERNANCEAND COMMUNITYINTRODUCTION ABOUT US
ECONOMIC PERFORMANCE
ENVIRONMENTAL PERFORMANCE
SOCIAL PERFORMANCE
ADDITIONAL INFORMATION
FINANCIAL INFORMATION
Management analysis Independent auditors’ report Consolidated financial statements Summarized financial statements of subsidiaries
Consolidatedfinancial statements Parque Arauco S.A. and subsidiaries
As of and for the years ended December 31, 2019 and 2020Santiago, Chile
222
PA
RQ
UE
AR
AU
CO
IN
TE
GR
AT
ED
RE
PO
RT
20
20
7.3

Consolidated Financial Statements
PARQUE ARAUCO S.A. AND SUBSIDIARIES As of December 31, 2020 and 2019
and for the years ended December 31, 2020 and 2019 Santiago, Chile
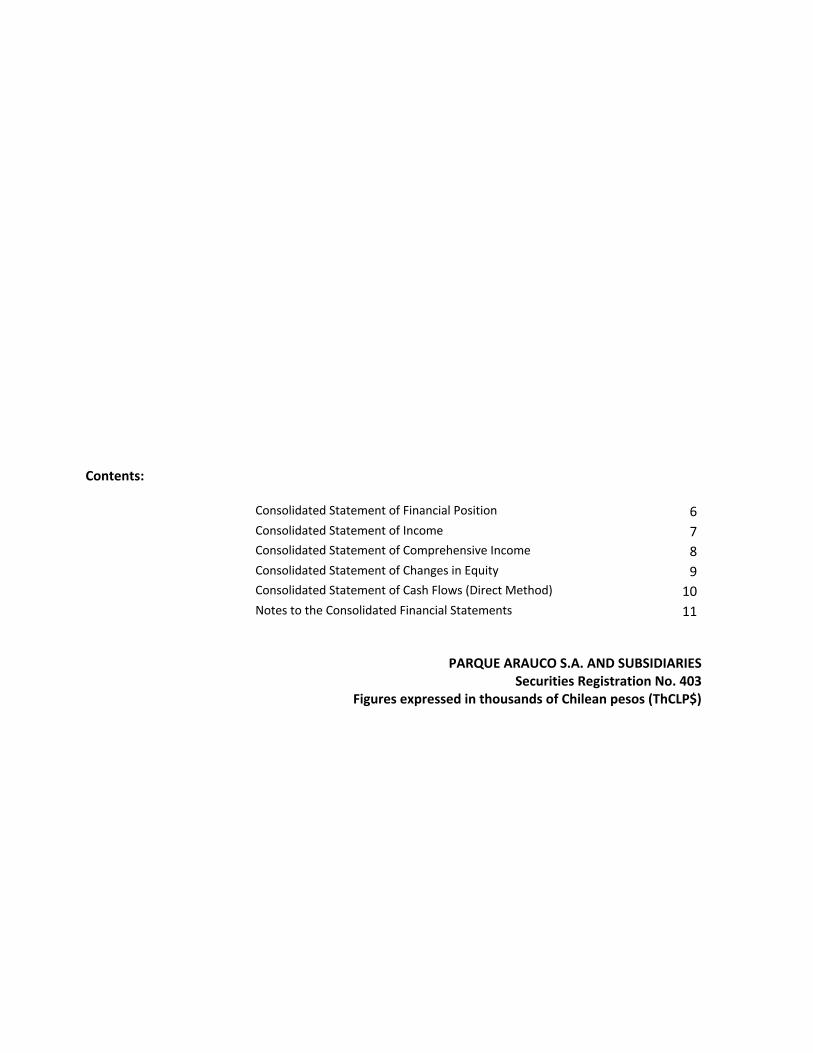
Contents:
Consolidated Statement of Financial Position 6 Consolidated Statement of Income 7 Consolidated Statement of Comprehensive Income 8 Consolidated Statement of Changes in Equity 9 Consolidated Statement of Cash Flows (Direct Method) 10 Notes to the Consolidated Financial Statements 11
PARQUE ARAUCO S.A. AND SUBSIDIARIES Securities Registration No. 403
Figures expressed in thousands of Chilean pesos (ThCLP$)

PARQUE ARAUCO S.A. AND SUBSIDIARIES
Note 1 - General Information ............................................................................................................................... 11 Note 2 - Basis of Presentation .............................................................................................................................. 11 Note 3 - Summary of Significant Accounting Policies ........................................................................................... 18 Note 4 - Accounting Policies and Changes in Accounting Estimates .................................................................... 34 Note 5 - Cash and Cash Equivalents ..................................................................................................................... 35 Note 6 - Other Financial Assets ............................................................................................................................ 35 Note 7 - Other Non-Financial Assets ..................................................................................................................... 35 Note 8 - Current and Non-Current Trade and Other Receivables ......................................................................... 36 Note 9 - Related Parties ........................................................................................................................................ 37 Note 10 - Current Tax Assets and Liabilities ......................................................................................................... 38 Note 11 - Intangible Assets Other than Goodwill ................................................................................................. 39 Note 12 - Goodwill ................................................................................................................................................ 40 Note 13 - Property, Plant and Equipment ............................................................................................................. 41 Note 14 - Investment Properties ........................................................................................................................... 42 Note 15 - Deferred Taxes ...................................................................................................................................... 43 Note 16 - Other Financial Liabilities ...................................................................................................................... 45 Note 17 - Other Provisions .................................................................................................................................... 51 Note 18 - Employee Benefit Provisions ................................................................................................................. 52 Note 19 - Trade and Other Payables .................................................................................................................... 52 Note 20 - Other Non-Financial Liabilities .............................................................................................................. 53 Note 21 - Right of Use and Lease Liabilities .......................................................................................................... 54 Note 22 - Equity .................................................................................................................................................... 57 Note 23 - Earnings (Loss) per Share ...................................................................................................................... 61 Note 24 - Revenue and Operating Expenses ......................................................................................................... 61 Note 25 - Employee Benefits and Expenses .......................................................................................................... 62 Note 26 - Financial Income and Expenses ............................................................................................................ 62 Note 27 - Effect of Exchange Rate Changes ......................................................................................................... 63 Note 28 - Depreciation and Amortization ............................................................................................................. 63 Note 29 - Gain (Loss) on Indexed Assets and Liabilities ........................................................................................ 63 Note 30 - Other Income and Expenses .................................................................................................................. 64 Note 31 - Foreign Currency ................................................................................................................................... 65 Note 32 - Summarized Financial Statements of Main Subsidiaries ...................................................................... 68 Note 33 - Operating Segments ............................................................................................................................. 69 Note 34 - Operating Leases .................................................................................................................................. 71 Note 35 - Financial Risk Management .................................................................................................................. 71 Note 36 - Investments in Associates Accounted for Using the Equity Method ..................................................... 74 Note 37 - Financial Derivative Instruments .......................................................................................................... 76 Note 38 - Business Combination ........................................................................................................................... 76 Note 39 - Fair Value Determination ...................................................................................................................... 77 Note 40 - Environment ......................................................................................................................................... 79 Note 41 - Contingencies, Commitments and Restrictions ..................................................................................... 81 Note 42 - Subsequent Events ................................................................................................................................ 87

PARQUE ARAUCO S.A. AND SUBSIDIARIES CONSOLIDATED STATEMENT OF FINANCIAL POSITION
AS OF DECEMBER 31, 2020 AND 2019
6
ASSETS 12.31.2020 12.31.2019
Note ThCLP$ ThCLP$
Current Assets
Cash and cash equivalents 5 357,032,449 315,434,937 Other financial assets, current 6 112,566 2,501 Other non-financial assets, current 7 32,597,379 49,987,523 Trade and other receivables, current (net) 8 27,006,348 35,040,712 Related party receivables, current 9 272,154 234,289 Current tax assets 10 9,898,825 9,222,077 Total current assets 426,919,721 409,922,039 Non-Current Assets
Other financial assets, non-current 6 4,388,203 5,978,477 Other non-financial assets, non-current 7 14,291,751 21,316,067 Rights receivable, non-current 8 49,379 52,047 Related party receivables, non-current 9 1,972,924 2,027,164 Investments in associates accounted for using the equity method 36 118,540,222 117,209,789 Intangible assets other than goodwill 11 12,983,987 18,105,057 Goodwill 12 2,732,697 3,258,204 Property, plant and equipment, net 13 27,088,483 22,895,004 Investment properties 14 2,023,099,521 2,037,106,033 Deferred tax assets 15 53,530,542 42,597,385 Right-of-use leased assets 21 2,065,819 2,800,864
Total non-current assets 2,260,743,528 2,273,346,091
Total assets 2,687,663,249 2,683,268,130 12.31.2020 12.31.2019
LIABILITIES AND EQUITY Note ThCLP$ ThCh$
Current Liabilities
Other financial liabilities, current 16 54,381,033 233,356,667 Trade and other payables, current 19 26,779,049 49,463,827 Other provisions 17 1,058,155 1,224,669 Current tax liabilities 10 1,756,443 17,077,511 Employee benefit provisions, current 18 1,977,327 5,020,749 Other non-financial liabilities, current 20 6,175,117 12,448,089 Lease liabilities, current 21 1,734,506 2,654,721
Total current liabilities 93,861,631 321,246,234
Non-Current Liabilities
Other financial liabilities, non-current 16 1,164,470,833 848,203,803 Deferred tax liabilities 15 252,309,559 246,138,001 Other non-financial liabilities, non-current 20 21,778,027 21,665,472 Lease liabilities, non-current 21 67,618,707 78,136,034
Total non-current liabilities 1,506,177,126 1,194,143,310
Total liabilities 1,600,038,757 1,515,389,544
Equity 22
Issued capital 423,575,312 423,575,312 Retained earnings 569,613,458 582,625,901 Share premium 289,355 289,355 Other reserves (15,208,644) 50,579,660
Equity attributable to equity holders of the parent 978,269,482 1,057,070,227
Non-controlling interest 22 109,355,009 110,808,359
Total equity 1,087,624,492 1,167,878,587
Total liabilities and net equity 2,687,663,249 2,683,268,130
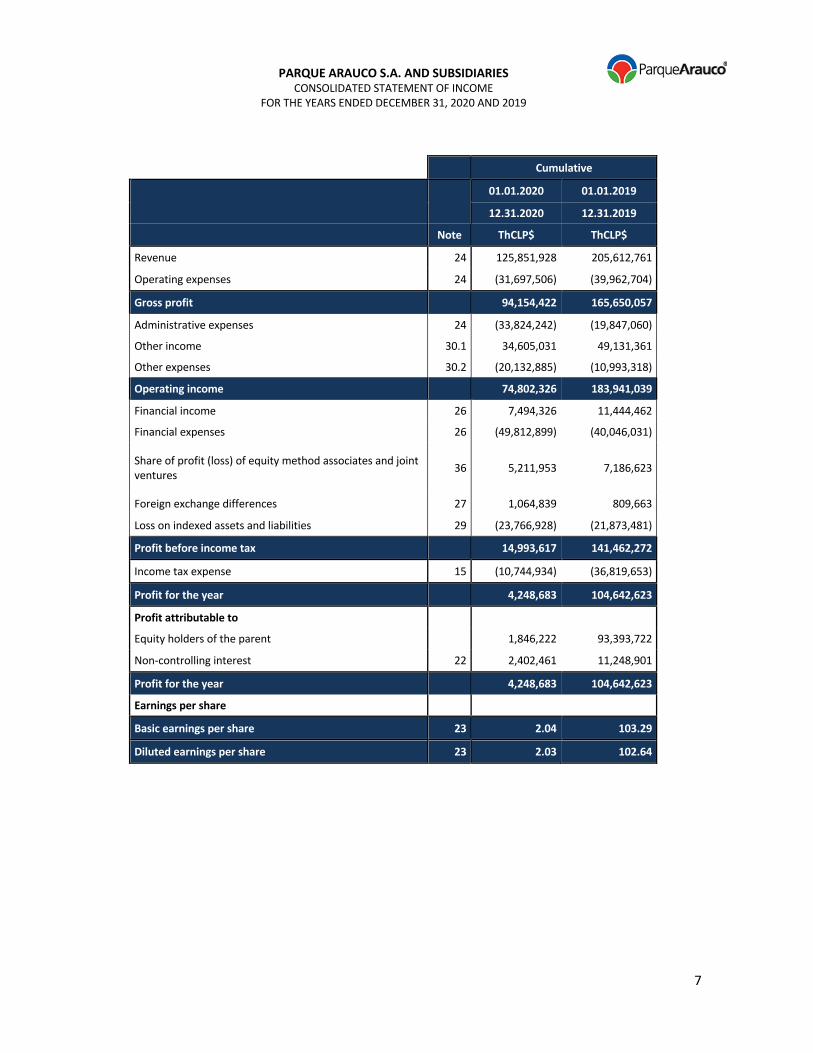
PARQUE ARAUCO S.A. AND SUBSIDIARIES CONSOLIDATED STATEMENT OF INCOME
FOR THE YEARS ENDED DECEMBER 31, 2020 AND 2019
7
Cumulative
01.01.2020 01.01.2019
12.31.2020 12.31.2019
Note ThCLP$ ThCLP$
Revenue 24 125,851,928 205,612,761
Operating expenses 24 (31,697,506) (39,962,704)
Gross profit 94,154,422 165,650,057
Administrative expenses 24 (33,824,242) (19,847,060)
Other income 30.1 34,605,031 49,131,361
Other expenses 30.2 (20,132,885) (10,993,318)
Operating income 74,802,326 183,941,039
Financial income 26 7,494,326 11,444,462
Financial expenses 26 (49,812,899) (40,046,031)
Share of profit (loss) of equity method associates and joint
ventures 36 5,211,953 7,186,623
Foreign exchange differences 27 1,064,839 809,663
Loss on indexed assets and liabilities 29 (23,766,928) (21,873,481)
Profit before income tax 14,993,617 141,462,272
Income tax expense 15 (10,744,934) (36,819,653)
Profit for the year 4,248,683 104,642,623
Profit attributable to
Equity holders of the parent 1,846,222 93,393,722
Non-controlling interest 22 2,402,461 11,248,901
Profit for the year 4,248,683 104,642,623
Earnings per share
Basic earnings per share 23 2.04 103.29
Diluted earnings per share 23 2.03 102.64

PARQUE ARAUCO S.A. AND SUBSIDIARIES CONSOLIDATED STATEMENT OF COMPREHENSIVE INCOME
FOR THE YEARS ENDED DECEMBER 31, 2020 AND 2019
8
Cumulative 01.01.2020 01.01.2019 12.31.2020 12.31.2019 ThCLP$ ThCLP$ Profit for the year 4,248,683 104,642,623 Other comprehensive income (loss) that will be reclassified to profit for the year, before income tax
Foreign exchange differences on translation of foreign operations
Gain (loss) from foreign exchange differences on
translation of foreign operations, before income tax
(71,432,007) 46,947,734
Other comprehensive income (loss), before income tax, foreign exchange differences on translation of foreign operations
(71,432,007) 46,947,734
Cash flow hedges Gain (loss) from cash flow hedges, before income tax (2,558,968) 433,484
Other comprehensive income (loss), before income tax, cash flow hedges
(2,558,968) 433,384
Other components of other comprehensive income (loss), before income tax (73,138,098) 47,381,218
Income tax relating to cash flow hedges 690,921 (117,041)
Income tax relating to other comprehensive income (loss) that will be reclassified to profit for the year
690,921 (117,041)
Other comprehensive income (loss) (73,300,054) 47,264,178
Total comprehensive income (loss) (69,051,371) 151,906,801 Total comprehensive income (loss) attributable to: Equity holders of the parent (71,453,832) 140,657,900
Non-controlling interest 2,402,461 11,248,901
Total comprehensive income (loss) (69,051,371) 151,906,801
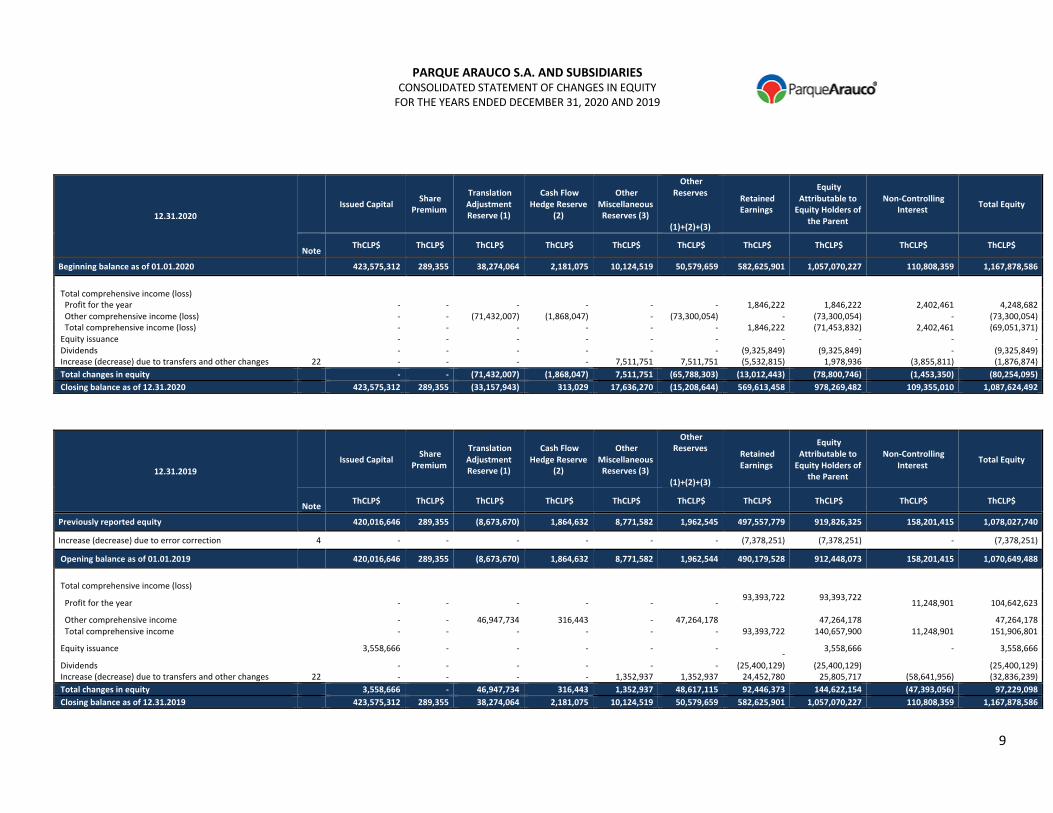
PARQUE ARAUCO S.A. AND SUBSIDIARIES CONSOLIDATED STATEMENT OF CHANGES IN EQUITY
FOR THE YEARS ENDED DECEMBER 31, 2020 AND 2019
9
12.31.2020 Issued Capital Share
Premium
Translation Adjustment Reserve (1)
Cash Flow Hedge Reserve
(2)
Other Miscellaneous Reserves (3)
Other Reserves
(1)+(2)+(3)
Retained Earnings
Equity Attributable to
Equity Holders of the Parent
Non-Controlling Interest Total Equity
Note ThCLP$ ThCLP$ ThCLP$ ThCLP$ ThCLP$ ThCLP$ ThCLP$ ThCLP$ ThCLP$ ThCLP$
Beginning balance as of 01.01.2020 423,575,312 289,355 38,274,064 2,181,075 10,124,519 50,579,659 582,625,901 1,057,070,227 110,808,359 1,167,878,586
Total comprehensive income (loss) Profit for the year - - - - - - 1,846,222 1,846,222 2,402,461 4,248,682 Other comprehensive income (loss) - - (71,432,007) (1,868,047) - (73,300,054) - (73,300,054) - (73,300,054) Total comprehensive income (loss) - - - - - - 1,846,222 (71,453,832) 2,402,461 (69,051,371) Equity issuance - - - - - - - - - - Dividends - - - - - - (9,325,849) (9,325,849) - (9,325,849) Increase (decrease) due to transfers and other changes 22 - - - - 7,511,751 7,511,751 (5,532,815) 1,978,936 (3,855,811) (1,876,874) Total changes in equity - - (71,432,007) (1,868,047) 7,511,751 (65,788,303) (13,012,443) (78,800,746) (1,453,350) (80,254,095) Closing balance as of 12.31.2020 423,575,312 289,355 (33,157,943) 313,029 17,636,270 (15,208,644) 569,613,458 978,269,482 109,355,010 1,087,624,492
12.31.2019 Issued Capital Share
Premium
Translation Adjustment Reserve (1)
Cash Flow Hedge Reserve
(2)
Other Miscellaneous Reserves (3)
Other Reserves
(1)+(2)+(3)
Retained Earnings
Equity Attributable to
Equity Holders of the Parent
Non-Controlling Interest Total Equity
Note ThCLP$ ThCLP$ ThCLP$ ThCLP$ ThCLP$ ThCLP$ ThCLP$ ThCLP$ ThCLP$ ThCLP$
Previously reported equity 420,016,646 289,355 (8,673,670) 1,864,632 8,771,582 1,962,545 497,557,779 919,826,325 158,201,415 1,078,027,740
Increase (decrease) due to error correction 4 - - - - - - (7,378,251) (7,378,251) - (7,378,251)
Opening balance as of 01.01.2019 420,016,646 289,355 (8,673,670) 1,864,632 8,771,582 1,962,544 490,179,528 912,448,073 158,201,415 1,070,649,488
Total comprehensive income (loss)
Profit for the year - - - - - - 93,393,722
93,393,722 11,248,901 104,642,623
Other comprehensive income - - 46,947,734 316,443 - 47,264,178 47,264,178 47,264,178 Total comprehensive income - - - - - - 93,393,722 140,657,900 11,248,901 151,906,801
Equity issuance 3,558,666 - - - - - - 3,558,666 - 3,558,666
Dividends - - - - - - (25,400,129) (25,400,129) (25,400,129) Increase (decrease) due to transfers and other changes 22 - - - - 1,352,937 1,352,937 24,452,780 25,805,717 (58,641,956) (32,836,239) Total changes in equity 3,558,666 - 46,947,734 316,443 1,352,937 48,617,115 92,446,373 144,622,154 (47,393,056) 97,229,098 Closing balance as of 12.31.2019 423,575,312 289,355 38,274,064 2,181,075 10,124,519 50,579,659 582,625,901 1,057,070,227 110,808,359 1,167,878,586

PARQUE ARAUCO S.A. AND SUBSIDIARIES CONSOLIDATED STATEMENT OF CASH FLOWS (DIRECT METHOD)
FOR THE YEARS ENDED DECEMBER 31, 2020 AND 2019
10
12.31.2020
ThCLP$
12.31.2019
ThCLP$
Cash flows provided by (used in) operating activities
Classes of revenue from operating activities
Proceeds from sales of goods and services 195,397,131 317,993,005
Classes of payments
Payments to suppliers for goods and services (79,745,430) (95,607,902)
Payments to and on behalf of employees (23,045,008) (23,573,485)
Income taxes paid (7,961,417) (13,474,061)
Other cash outflows (20,591,595) (37,754,835)
Net cash flows provided by operating activities 64,053,681 147,582,722
Cash flows provided by (used in) investing activities
Proceeds from sale of other long-term assets 2,085,846 -
Interest received 7,000,731 11,188,610
Purchases of property, plant and equipment (6,105,755) (1,056,599)
Purchases of intangible assets (3,076,815) (2,652,417)
Dividends received - 4,850,003
Purchases of other long-term assets (63,085,574) (104,886,150)
Other cash inflows (outflows), classified as investing activities (144,902) 287,728
Net cash flows used in investing activities (63,326,469) (92,268,825)
Cash flow provided by (used in) financing activities
Proceeds from changes in ownership in a subsidiary that do not result in loss of control - 139,379,151
Payments for changes in ownership in a subsidiary that do not result in loss of control - (165,009,778)
Proceeds from share issuance - 8,982,966
Proceeds from long-term loans 291,586,922 219,678,081
Proceeds from short-term loans 24,083,684 95,466,404
Total loan proceeds 315,670,607 315,144,485
Proceeds from issuance of bonds (net) 95,614,975 (34,536,952)
Loan repayments (270,250,857) (202,968,978)
Repayment of finance lease liabilities (11,414,300) (5,376,896)
Dividends paid (23,741,825) (40,135,314)
Interest paid (38,275,570) (35,921,425)
Income taxes paid (refunded), classified as financing activities (6,889,128) -
Other cash outflows, classified as financing activities (5,174,835) (11,114,598)
Net cash flows provided by (used in) financing activities 55,539,066 (31,557,339)
Increase in cash and cash equivalents before effect of exchange rate changes 56,266,278 23,756,506
Effect of changes in exchange rates on cash and cash equivalents
Effect of changes in exchange rates on cash and cash equivalents (14,668,768) 10,454,843
Increase in cash and cash equivalents 41,597,510 34,211,348
Cash and cash equivalents at beginning of period 315,434,937 281,223,589
Cash and cash equivalents at the end of the period 357,032,449 315,434,937
PARQUE ARAUCO S.A. AND SUBSIDIARIES NOTES TO THE CONSOLIDATED FINANCIAL STATEMENTS
AS OF DECEMBER 31, 2020 AND 2019
AND FOR THE YEARS ENDED DECEMBER 31, 2020 AND 2019
11
Note 1 - General Information
1.1 Corporate Information
Parque Arauco S.A. was incorporated by public instrument dated November 30, 1979, granted before Santiago Notary Public
Mr. Andrés Rubio Flores. It was authorized to do business and its bylaws were approved in ruling 363-S dated June 22, 1981,
from the Chilean Financial Market Commission (CMF).
Parque Arauco S.A. (or “the Company”), taxpayer ID No. 94.627.000- 8, is a regional holding with operations in Chile, Peru
and Colombia that owns and manages several real estate assets through different subsidiaries and associates. The Company
is mainly engaged in developing real estate projects and managing those properties through retail store and space lease
agreements with different operators.
The Company is located in Santiago, Chile, at Avenida Presidente Kennedy 5413, Las Condes. Parque Arauco S.A., is a
publicly-traded corporation that is registered in the Securities Registry under number 403 and, therefore, is supervised by
the Chilean Financial Market Commission (CMF).
Note 2 - Basis of Presentation
2.1 Basis of Preparation and Presentation
These consolidated financial statements as of December 31, 2020 and 2019, and for the years ended December 31, 2020
and 2019, have been prepared in accordance with International Financial Reporting Standards ("IFRS") issued by the
International Accounting Standards Board ("IASB").
These consolidated financial statements have been prepared from accounting records maintained by the parent company
and its subsidiaries. Each entity prepares its consolidated financial statements according to the accounting standards and
principles in force in each country. Upon consolidation, adjustments and reclassifications have been made in order to
adapt such standards and principles to International Financial Reporting Standards.
These consolidated financial statements have been prepared on a historical cost basis except for certain financial
instruments and investment properties that are measured at revalued amounts or fair values as of year end, as explained
in the accounting policies below. In general, historical cost is based on the fair value of the consideration provided in
exchange for goods and services.
Fair value is the price that would be received to sell an asset or paid to transfer a liability in an orderly transaction between
market participants at the measurement date, regardless of whether the price is observable or estimated using another
direct valuation technique. In estimating the fair value of an asset or liability, the Company considers characteristics of the
asset or liability that market participants would use in setting the price of the asset or liability as of the measurement date.
Fair value is determined as such for measurement and/or disclosure purposes, with the exception of:
i) Share-based payment transactions that are within the scope of IFRS 2,
ii) Lease transactions that are within the scope of IAS 17, and
iii) Measurements that have some similarities to market value, but are not fair value, such as net realizable value in
IAS 2 or value in use in IAS 36.
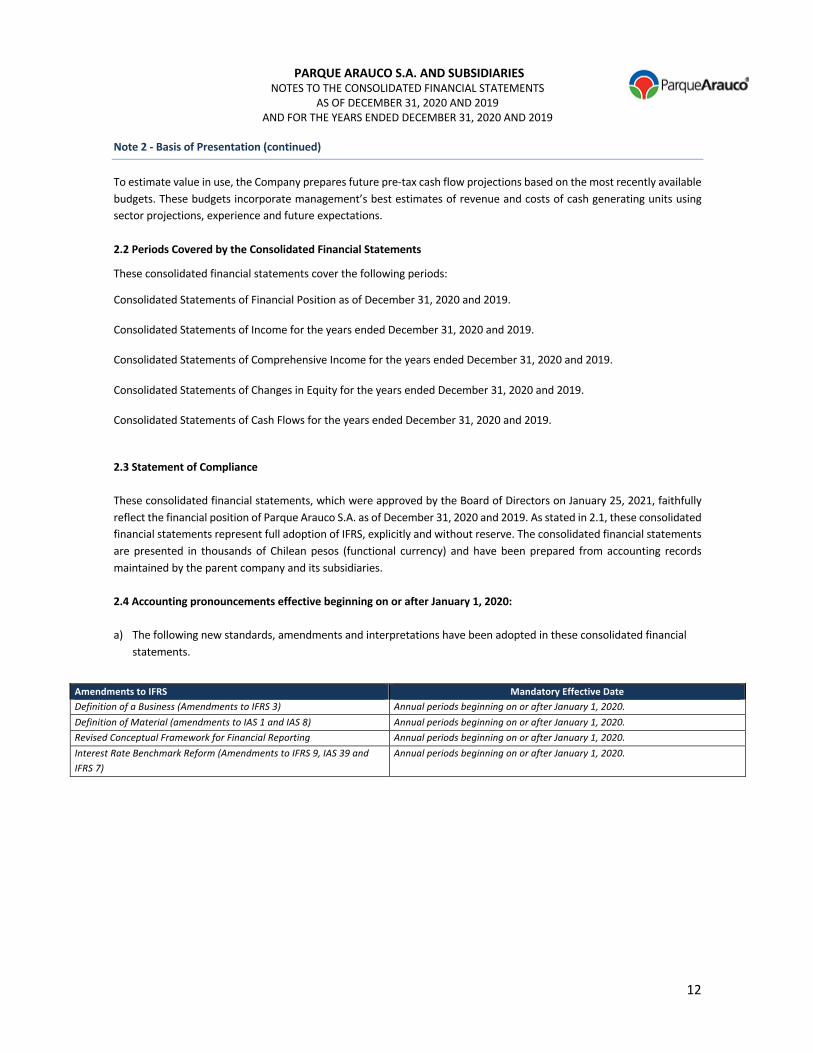
PARQUE ARAUCO S.A. AND SUBSIDIARIES NOTES TO THE CONSOLIDATED FINANCIAL STATEMENTS
AS OF DECEMBER 31, 2020 AND 2019
AND FOR THE YEARS ENDED DECEMBER 31, 2020 AND 2019
12
Note 2 - Basis of Presentation (continued)
To estimate value in use, the Company prepares future pre-tax cash flow projections based on the most recently available
budgets. These budgets incorporate management’s best estimates of revenue and costs of cash generating units using
sector projections, experience and future expectations.
2.2 Periods Covered by the Consolidated Financial Statements
These consolidated financial statements cover the following periods:
Consolidated Statements of Financial Position as of December 31, 2020 and 2019.
Consolidated Statements of Income for the years ended December 31, 2020 and 2019.
Consolidated Statements of Comprehensive Income for the years ended December 31, 2020 and 2019.
Consolidated Statements of Changes in Equity for the years ended December 31, 2020 and 2019.
Consolidated Statements of Cash Flows for the years ended December 31, 2020 and 2019.
2.3 Statement of Compliance
These consolidated financial statements, which were approved by the Board of Directors on January 25, 2021, faithfully
reflect the financial position of Parque Arauco S.A. as of December 31, 2020 and 2019. As stated in 2.1, these consolidated
financial statements represent full adoption of IFRS, explicitly and without reserve. The consolidated financial statements
are presented in thousands of Chilean pesos (functional currency) and have been prepared from accounting records
maintained by the parent company and its subsidiaries.
2.4 Accounting pronouncements effective beginning on or after January 1, 2020:
a) The following new standards, amendments and interpretations have been adopted in these consolidated financial
statements.
Amendments to IFRS Mandatory Effective Date Definition of a Business (Amendments to IFRS 3) Annual periods beginning on or after January 1, 2020. Definition of Material (amendments to IAS 1 and IAS 8) Annual periods beginning on or after January 1, 2020.
Revised Conceptual Framework for Financial Reporting Annual periods beginning on or after January 1, 2020.
Interest Rate Benchmark Reform (Amendments to IFRS 9, IAS 39 and
IFRS 7)
Annual periods beginning on or after January 1, 2020.

PARQUE ARAUCO S.A. AND SUBSIDIARIES NOTES TO THE CONSOLIDATED FINANCIAL STATEMENTS
AS OF DECEMBER 31, 2020 AND 2019
AND FOR THE YEARS ENDED DECEMBER 31, 2020 AND 2019
13
Note 2 - Basis of Presentation (continued)
b) The following standards, amendments and interpretations have been issued but application is not yet mandatory:
New IFRS Mandatory Effective Date IFRS 17, Insurance Contracts Annual periods beginning on or after January 1, 2021.
Amendments to IFRS Mandatory Effective Date Classification of Liabilities as Current or Non-Current (Amendments
to IAS 1)
Annual periods beginning on or after January 1, 2022.
Reference to the Conceptual Framework (Amendments to IFRS 3) Annual periods beginning on or after January 1, 2022
Property, Plant and Equipment — Proceeds before Intended Use
(Amendments to IAS 16)
Annual periods beginning on or after January 1, 2022
Onerous Contracts — Cost of Fulfilling a Contract (Amendments to
IAS 37)
Annual periods beginning on or after January 1, 2022
Annual Improvements to IFRS Standards 2018-2020 (Amendments
to IFRS 1, IFRS 9, IFRS 16 and IAS 41)
Annual periods beginning on or after January 1, 2022
COVID-19-Related Rent Concessions (Amendment to IFRS 16) Annual periods beginning on or after January 1, 2020
The accounting policies adopted in preparing these consolidated financial statements are consistent with those applied in
preparing the Company’s annual consolidated financial statements as of and for the year ended December 31, 2019,
except for the following new standards, interpretations and amendments effective beginning January 1, 2020, which have
not had a significant effect on the amounts reported in these financial statements.
2.5 Basis of Consolidation
The consolidated financial statements include the financial statements of the Company and the entities controlled by the
Company (its subsidiaries). Control is obtained when the Company has:
(a) power over the investee, i.e. existing rights that give it the ability to direct the relevant activities of the investee
(the activities that significantly affect the investee’s returns);
(b) exposure, or rights, to variable returns from its involvement with the investee; and
(c) the ability to use its power over the investee to affect its returns.
When the Company has less than the majority of the voting rights in an investee, it has power over the investee when
these voting rights are sufficient to give it the practical ability to unilaterally direct the investee’s relevant activities. The
Company considers all of the facts and circumstances in evaluating whether the voting rights in an investee are sufficient
to give it power, including:
(a) the size of its holding of voting rights relative to the size and dispersion of holdings of other vote holders;
(b) potential voting rights held by the investor, other vote holders or other parties;
(c) rights from other contractual agreements; and
(d) any additional facts and circumstances that indicate that the investor has, or does not have, the current ability
to direct the relevant activities when decisions need to be made, including voting behavior patterns in prior
shareholder meetings.
The Company will reevaluate whether or not it has control in an investee if the facts and circumstances indicate that there
have been changes in one or more of the elements of control mentioned above.
PARQUE ARAUCO S.A. AND SUBSIDIARIES NOTES TO THE CONSOLIDATED FINANCIAL STATEMENTS
AS OF DECEMBER 31, 2020 AND 2019
AND FOR THE YEARS ENDED DECEMBER 31, 2020 AND 2019
14
Note 2 - Basis of Presentation (continued)
A subsidiary will be consolidated from the date on which the investor obtains control of the investee and consolidation
shall cease when control over the investee is lost. Specifically, the income and expenses of a subsidiary acquired or sold
during the period are included in the consolidated statements of comprehensive income from the date on which the
Company obtains control until the date on which the Company ceases to control the subsidiary.
The gain or loss from each component of other comprehensive income is attributed to the equity holders of the Company
and to non-controlling interests, as appropriate. Total comprehensive income is attributed to the equity holders of the
Company and to non-controlling interests even if this results in the non-controlling interests having a deficit balance.
If a subsidiary uses accounting policies that differ from the consolidated financial statements for transactions and other
similar events in similar circumstances, the appropriate adjustments will be made to the financial statements of the
subsidiaries upon preparation of the consolidated financial statements to ensure uniformity with the accounting policies
of Parque Arauco S.A.
All assets, liabilities, equity, income, expenses and cash flows related to transactions between group entities are
eliminated in full upon consolidation.
Non-controlling interest - A parent company shall present non-controlling interests in the interim consolidated statement
of financial position, within equity, separately from the equity of the equity holders of the parent company.
Changes in Company's interests in current subsidiaries
Changes in a parent's ownership interest in a subsidiary that do not result in a loss of control are equity transactions. Any
difference between the amount by which the minority interest is adjusted and the fair value of the consideration paid or
received is recognized directly in equity and attributed to the equity holders of the parent. No adjustment is made to the
carrying amount of goodwill and gains or losses are not recognized in profit and loss for the year.
When control of a subsidiary is lost, a gain or loss is recognized in profit and loss and is calculated as the difference between
(i) the sum of the fair value of the consideration received and the fair value of any retained interest; and (ii) the previous
carrying amount of the assets (including goodwill), and liabilities of the subsidiary and any non-controlling interest.
When the subsidiary's assets are measured at revalued amounts or at fair value and the corresponding accumulated gain
or loss has been recognized in other comprehensive income and accumulated in equity, amounts previously recognized in
other comprehensive income and accumulated in equity are accounted for as if the Company had directly sold the relevant
assets (i.e. reclassified to profit and loss or transferred directly to retained earnings as specified by the applicable IFRS).
The fair value of any investment retained in the former subsidiary as of the date on which control is lost shall be considered
the fair value at initial recognition for subsequent measurement under IFRS 9 Financial Instruments: Recognition and
Measurement, when appropriate, as the cost at initial recognition for an investment in an associate or joint venture.
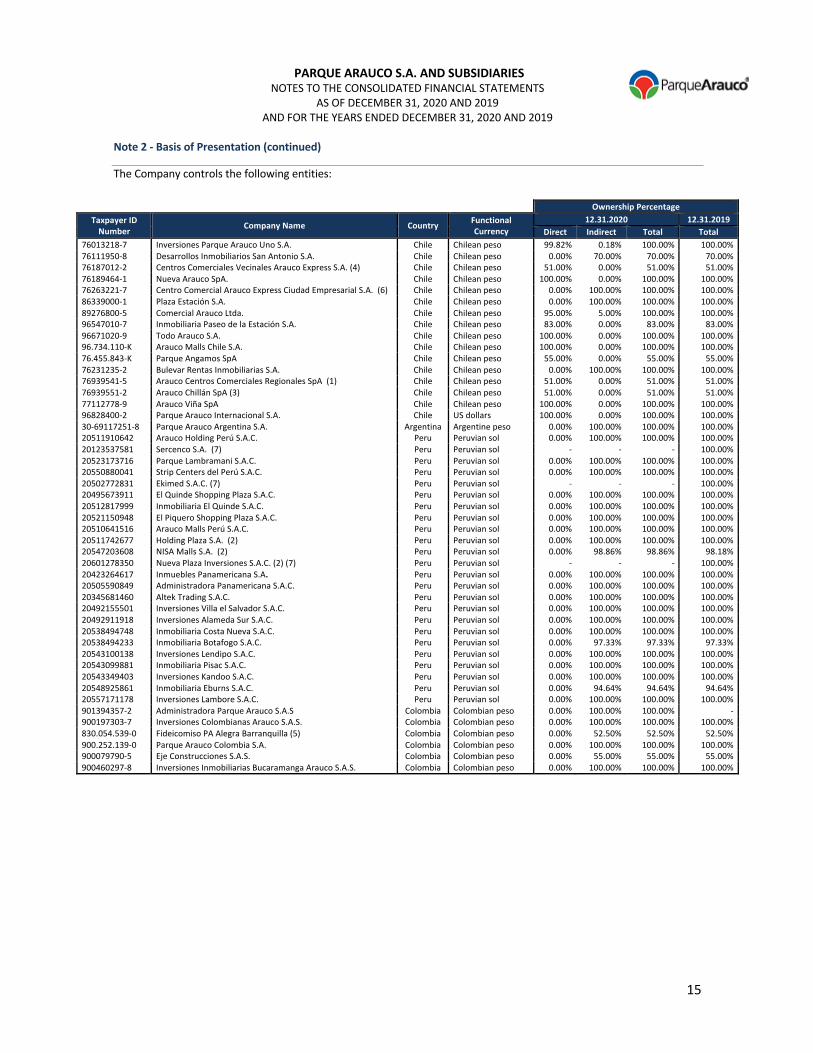
PARQUE ARAUCO S.A. AND SUBSIDIARIES NOTES TO THE CONSOLIDATED FINANCIAL STATEMENTS
AS OF DECEMBER 31, 2020 AND 2019
AND FOR THE YEARS ENDED DECEMBER 31, 2020 AND 2019
15
Note 2 - Basis of Presentation (continued)
The Company controls the following entities:
Ownership Percentage
Taxpayer ID Number Company Name Country Functional
Currency 12.31.2020 12.31.2019
Direct Indirect Total Total 76013218-7 Inversiones Parque Arauco Uno S.A. Chile Chilean peso 99.82% 0.18% 100.00% 100.00% 76111950-8 Desarrollos Inmobiliarios San Antonio S.A. Chile Chilean peso 0.00% 70.00% 70.00% 70.00% 76187012-2 Centros Comerciales Vecinales Arauco Express S.A. (4) Chile Chilean peso 51.00% 0.00% 51.00% 51.00% 76189464-1 Nueva Arauco SpA. Chile Chilean peso 100.00% 0.00% 100.00% 100.00% 76263221-7 Centro Comercial Arauco Express Ciudad Empresarial S.A. (6) Chile Chilean peso 0.00% 100.00% 100.00% 100.00% 86339000-1 Plaza Estación S.A. Chile Chilean peso 0.00% 100.00% 100.00% 100.00% 89276800-5 Comercial Arauco Ltda. Chile Chilean peso 95.00% 5.00% 100.00% 100.00% 96547010-7 Inmobiliaria Paseo de la Estación S.A. Chile Chilean peso 83.00% 0.00% 83.00% 83.00% 96671020-9 Todo Arauco S.A. Chile Chilean peso 100.00% 0.00% 100.00% 100.00% 96.734.110-K Arauco Malls Chile S.A. Chile Chilean peso 100.00% 0.00% 100.00% 100.00% 76.455.843-K Parque Angamos SpA Chile Chilean peso 55.00% 0.00% 55.00% 55.00% 76231235-2 Bulevar Rentas Inmobiliarias S.A. Chile Chilean peso 0.00% 100.00% 100.00% 100.00% 76939541-5 Arauco Centros Comerciales Regionales SpA (1) Chile Chilean peso 51.00% 0.00% 51.00% 51.00% 76939551-2 Arauco Chillán SpA (3) Chile Chilean peso 51.00% 0.00% 51.00% 51.00% 77112778-9 Arauco Viña SpA Chile Chilean peso 100.00% 0.00% 100.00% 100.00% 96828400-2 Parque Arauco Internacional S.A. Chile US dollars 100.00% 0.00% 100.00% 100.00% 30-69117251-8 Parque Arauco Argentina S.A. Argentina Argentine peso 0.00% 100.00% 100.00% 100.00% 20511910642 Arauco Holding Perú S.A.C. Peru Peruvian sol 0.00% 100.00% 100.00% 100.00% 20123537581 Sercenco S.A. (7) Peru Peruvian sol - - - 100.00% 20523173716 Parque Lambramani S.A.C. Peru Peruvian sol 0.00% 100.00% 100.00% 100.00% 20550880041 Strip Centers del Perú S.A.C. Peru Peruvian sol 0.00% 100.00% 100.00% 100.00% 20502772831 Ekimed S.A.C. (7) Peru Peruvian sol - - - 100.00% 20495673911 El Quinde Shopping Plaza S.A.C. Peru Peruvian sol 0.00% 100.00% 100.00% 100.00% 20512817999 Inmobiliaria El Quinde S.A.C. Peru Peruvian sol 0.00% 100.00% 100.00% 100.00% 20521150948 El Piquero Shopping Plaza S.A.C. Peru Peruvian sol 0.00% 100.00% 100.00% 100.00% 20510641516 Arauco Malls Perú S.A.C. Peru Peruvian sol 0.00% 100.00% 100.00% 100.00% 20511742677 Holding Plaza S.A. (2) Peru Peruvian sol 0.00% 100.00% 100.00% 100.00% 20547203608 NISA Malls S.A. (2) Peru Peruvian sol 0.00% 98.86% 98.86% 98.18% 20601278350 Nueva Plaza Inversiones S.A.C. (2) (7) Peru Peruvian sol - - - 100.00% 20423264617 Inmuebles Panamericana S.A. Peru Peruvian sol 0.00% 100.00% 100.00% 100.00% 20505590849 Administradora Panamericana S.A.C. Peru Peruvian sol 0.00% 100.00% 100.00% 100.00% 20345681460 Altek Trading S.A.C. Peru Peruvian sol 0.00% 100.00% 100.00% 100.00% 20492155501 Inversiones Villa el Salvador S.A.C. Peru Peruvian sol 0.00% 100.00% 100.00% 100.00% 20492911918 Inversiones Alameda Sur S.A.C. Peru Peruvian sol 0.00% 100.00% 100.00% 100.00% 20538494748 Inmobiliaria Costa Nueva S.A.C. Peru Peruvian sol 0.00% 100.00% 100.00% 100.00% 20538494233 Inmobiliaria Botafogo S.A.C. Peru Peruvian sol 0.00% 97.33% 97.33% 97.33% 20543100138 Inversiones Lendipo S.A.C. Peru Peruvian sol 0.00% 100.00% 100.00% 100.00% 20543099881 Inmobiliaria Pisac S.A.C. Peru Peruvian sol 0.00% 100.00% 100.00% 100.00% 20543349403 Inversiones Kandoo S.A.C. Peru Peruvian sol 0.00% 100.00% 100.00% 100.00% 20548925861 Inmobiliaria Eburns S.A.C. Peru Peruvian sol 0.00% 94.64% 94.64% 94.64% 20557171178 Inversiones Lambore S.A.C. Peru Peruvian sol 0.00% 100.00% 100.00% 100.00% 901394357-2 Administradora Parque Arauco S.A.S Colombia Colombian peso 0.00% 100.00% 100.00% - 900197303-7 Inversiones Colombianas Arauco S.A.S. Colombia Colombian peso 0.00% 100.00% 100.00% 100.00% 830.054.539-0 Fideicomiso PA Alegra Barranquilla (5) Colombia Colombian peso 0.00% 52.50% 52.50% 52.50% 900.252.139-0 Parque Arauco Colombia S.A. Colombia Colombian peso 0.00% 100.00% 100.00% 100.00% 900079790-5 Eje Construcciones S.A.S. Colombia Colombian peso 0.00% 55.00% 55.00% 55.00% 900460297-8 Inversiones Inmobiliarias Bucaramanga Arauco S.A.S. Colombia Colombian peso 0.00% 100.00% 100.00% 100.00%

PARQUE ARAUCO S.A. AND SUBSIDIARIES NOTES TO THE CONSOLIDATED FINANCIAL STATEMENTS
AS OF DECEMBER 31, 2020 AND 2019
AND FOR THE YEARS ENDED DECEMBER 31, 2020 AND 2019
16
Note 2 - Basis of Presentation (continued)
(1) On January 31, 2019, Parque Arauco S.A., sold 49% of the shares of the subsidiary Arauco Centros Comerciales
Regionales SpA to Ameris Parauco Fondo de Inversión (formerly Ameris Rentas Comerciales I Fondo de Inversión),
represented by Ameris Capital Administradora General de Fondos S.A., and kept the remaining 51% of the shares.
(2) On April 17, 2019, Parque Arauco S.A., confirmed that all conditions for the sale of the Wiese Group’s direct or indirect
interest in Holding Plaza S.A., have been met. As a result of the transaction, Parque Arauco S.A., obtained 100% of the
following malls: MegaPlaza Norte, Chimbote, Cañete, Pisco, Jaén, Huaral, Villa El Salvador I, Villa El Salvador II, Villa
Chorrillos, Chincha and Barranca.
(3) On April 30, 2019, Parque Arauco S.A., signed a sale commitment agreement with Ameris Parauco Fondo de Inversión,
represented by Ameris Capital Administradora General de Fondos S.A., for that entity to acquire 40% of the shares of the
subsidiary Arauco Chillán SpA, with Parque Arauco S.A., retaining 60% of the shares. Subsequently, on June 7th, it signed
an agreement for Ameris to acquire 9% of the shares, with Parque Arauco retaining the remaining 51% of the shares issued
by Arauco Chillán.
(4) On March 20, 2019, Parque Arauco S.A., acquired all shares of the subsidiary Centros Comerciales Vecinales Arauco
Express S.A., held by Fondo de Inversión LV – Patio Renta Inmobiliaria I. Subsequently, on March 28, 2019, Parque Arauco
S.A., sold 49% of its shares in the subsidiary Centros Comerciales Vecinales Arauco Express S.A., to Fondo de Inversión
Banchile Rentas Inmobiliarias I, represented by Banchile Administradora General de Fondos S.A., with Parque Arauco S.A.,
retaining 51% of the shares.
(5) On July 29, 2019, Parque Arauco S.A., announced its acquisition of 52.5% of Fideicomiso Patrimonio Autónomo Alegra
Barranquilla, which owns the project under construction Parque Alegra Centro Comercial.
(6) On September 2, 2019, Centros Comerciales Vecinales Arauco Express S.A., announced its acquisition of 20% of the
shares of AEX Ciudad Empresarial from Gestora de Patrimonios S.A.
(7) On September 1, 2020, Sercenco S.A., was absorbed by Parque Lambramani S.A.C., Ekimed S.A.C., was absorbed by
Arauco Holding Perú S.A.C., and Nueva Plaza Inversiones was absorbed by NISA Malls S.A.

PARQUE ARAUCO S.A. AND SUBSIDIARIES NOTES TO THE CONSOLIDATED FINANCIAL STATEMENTS
AS OF DECEMBER 31, 2020 AND 2019
AND FOR THE YEARS ENDED DECEMBER 31, 2020 AND 2019
17
Note 2 - Basis of Presentation (continued)
2.6 Significant Accounting Judgments, Estimates and Assumptions
Estimates and Assumptions
In preparing the consolidated financial statements under IFRS, the management of Parque Arauco S.A. has made estimates
based on assumptions regarding:
Impairment: The Company's management tests non-current assets for impairment at each reporting date. This requires
an estimate of the recoverable value of the cash generating units to which goodwill is allocated. The estimate of value in
use requires that management makes an estimate of the future cash flows expected from the cash generating unit and,
also, that it determines an appropriate discount rate for calculating the present value of these cash flows.
Useful life: Intangible assets and property, plant and equipment require estimates regarding their useful life and residual
value.
Deferred taxes: Deferred tax assets are recognized for all unused tax losses to the extent that it is likely that there will be
tax profits against which the losses can be used.
Provisions: The Company records a provision when it has a present obligation as a result of a past event, resources will
likely have to be disbursed and a reliable estimate can be made of the obligation amount. Therefore, as of each reporting
period, the Company presents provisions for legal proceedings and reimbursements and other miscellaneous provisions.
Allowance for doubtful accounts: The regional accounting department calculates an allowance for doubtful accounts as
of each month end based on customer debt and guarantee information to determine each customer’s unsecured debt
levels.
Fair value of investment properties: The Company's management determines the fair value of investment properties on
a yearly basis. This requires management to make an estimate for future cash flows expected for each cash generating
unit and, also, to determine an appropriate discount rate to calculate the present value of these cash flows (see Note 3.2).
The estimates made and assumptions used by the Company are based on historical experience, changes in the industry
and information supplied by qualified external sources. However, actual results could differ from these estimates under
certain conditions.
2.7 Functional Currency
The financial statements of Parque Arauco S.A., and subsidiaries are presented in the currency of the economic
environment in which the companies operate (functional currency). For the purposes of the consolidated financial
statements, they are restated in thousands of Chilean pesos, which is the Group's presentation currency.
Currency 12.31.2020 12.31.2019
CLP$ CLP$
UF 29,070.33 28,309.94
US dollar 710.95 748.74
Peruvian sol 196.36 226.14
Colombian peso 0.21 0.23
Argentinean peso 84.02 59.81
PARQUE ARAUCO S.A. AND SUBSIDIARIES NOTES TO THE CONSOLIDATED FINANCIAL STATEMENTS
AS OF DECEMBER 31, 2020 AND 2019
AND FOR THE YEARS ENDED DECEMBER 31, 2020 AND 2019
18
Note 2 - Basis of Presentation (continued)
2.8 Presentation Currency
The consolidated financial statements of Parque Arauco S.A. and subsidiaries are presented in Chilean pesos, in
compliance with IAS 21 The Effects of Changes in Foreign Exchange Rates. Assets and liabilities of foreign operations,
including goodwill and fair value adjustments arising upon acquisition, are translated to Chilean pesos using the exchange
rate at the reporting date. Income and expenses of foreign operations are translated to Chilean pesos using the average
exchange rate.
2.9 Foreign Currency
Foreign Currency Transactions
Transactions in a currency other than a company's functional currency are considered foreign currency transactions and
are accounted for in its functional currency at the exchange rate in effect on the transaction date. As of each year end,
balances of monetary assets and liabilities denominated in foreign currency are translated using the exchange rate of the
functional currency as of that date. Exchange differences that arise from that translation are recorded in foreign exchange
differences in the statement of income for the period in which they are produced, except for exchange differences
resulting from the valuation of investments in companies (equity of subsidiaries) with a different functional currency,
which are recorded in translation adjustment reserves in interim consolidated other comprehensive income. Non-
monetary assets and liabilities measured at fair value are retranslated to the functional currency using the exchange rate
as of the date the fair value was determined. Non-monetary items measured at historical cost in a foreign currency are
not translated.
Indexation Units
Transactions in indexation units are recorded at the unit value as of the date on which the transaction meets the
requirements for initial recognition. As of each year end, monetary assets and liabilities denominated in indexation units
are converted using the exchange rate for the indexation unit and any differences arising are recorded in gain (loss) on
indexed assets and liabilities in the statement of income.
2.10 Degree of Rounding Used in the Financial Statements
All information presented in Chilean pesos has been rounded to the nearest thousand (ThCLP$).
Note 3 - Summary of Significant Accounting Policies
3.1 Borrowing Costs
Borrowing costs include interest paid and accrued, exchange or indexation differences and other costs of loans from banks
and financial institutions and bonds payable that are recorded as financial expenses when incurred, except when those
costs are related to the acquisition and/or construction of qualifying assets (e.g. investment properties), in which case
they must be capitalized as part of the cost of the asset.
3.2 Investment Properties
Investment properties include land, buildings, real estate projects under development and other construction held to earn
rentals. Investment properties are initially accounted for at acquisition cost, which includes mainly their purchase price
and any directly attributable disbursement. After initial recognition, Parque Arauco S.A. has chosen to value its investment
properties

PARQUE ARAUCO S.A. AND SUBSIDIARIES NOTES TO THE CONSOLIDATED FINANCIAL STATEMENTS
AS OF DECEMBER 31, 2020 AND 2019
AND FOR THE YEARS ENDED DECEMBER 31, 2020 AND 2019
19
Note 3 - Summary of Significant Accounting Policies (continued)
at fair value. As of each year end, management calculates variations in fair value using the discounted cash flow method.
Gains or losses resulting from variations in the fair value of investment properties are included in profit or loss for the
period when they occur.
The Company has decided to account for land and real estate projects under development or in the work execution phase
at the cost of the land plus all disbursements necessary to develop and build the project. During the construction phase,
the investment property under construction cannot be remeasured at fair value and only financial expenses and
construction costs are capitalized, provided that the asset qualifies for such accounting and that these costs have been
accrued before the asset is in operable condition. Once that asset has been operating for at least one year, it will begin to
be recorded at fair value. Any difference between the property’s fair value at that date and its previous book value is
recorded in income or loss within other income (expenses). Investment properties are de-recognized upon disposal or
when permanently removed from use and when no future economic benefits are expected from their disposal. Any gain
or loss from retiring or disposing of an investment property is recognized in profit or loss for the period in which it was
retired or disposed of.
Transfers to or from investment property can be made when, and only when, there is evidence of a change in use. A
change in use occurs when property meets, or ceases to meet, the definition of investment property and there is evidence
of change in use. A change in management’s intentions for the use of a property by itself does not constitute evidence of
a change in use. Examples of evidence of a change in use include:
(a) commencement of owner-occupation, or of development with a view to owner-occupation, for a transfer from
investment property to owner-occupied property;
(b) commencement of development with a view to sale, for a transfer from investment property to inventories;
(c) end of owner-occupation, for a transfer from owner-occupied property to investment property; or and
(d) inception of an operating lease to another party, for a transfer from inventories to investment property.
Fair value for investment properties is calculated using future pre-tax cash flow projections based on the most recently
available budgets. These budgets incorporate management’s best estimates of revenue and costs of cash generating units
using sector projections, experience and expectations.
3.2.1 Determination of Discount Rate for Cash Flows
The discount rate is reviewed annually and determined as follows:
1. BETA determination; because there is not a sufficiently large and active market in Chile to properly determine
BETA, the betas of other international real estate, construction and shopping center management companies are
used.
2. Risk-free rate; this input is updated each year and based on the risk-free rate of the 30-year U.S. Treasury Bond
plus a country risk spread for Chile, Peru and Colombia.
3. Risk premium; this input is generated by local management based on information published each year in market
data systems.
4. Leverage ratio; the leverage ratio has been established for modeling purposes at a range of 45% - 55% between
third-party and company funds.

PARQUE ARAUCO S.A. AND SUBSIDIARIES NOTES TO THE CONSOLIDATED FINANCIAL STATEMENTS
AS OF DECEMBER 31, 2020 AND 2019
AND FOR THE YEARS ENDED DECEMBER 31, 2020 AND 2019
20
Note 3 - Summary of Significant Accounting Policies (continued)
The variables exposed at this level are used to calculate cost of capital with the Capital Asset Pricing Model formula.
5. Tax rate; each country's current tax rate for the period in which the cash flows will be discounted must be added
in order to obtain the discount rate before and after taxes.
6. The debt rate is calculated based on the 30-year Treasury Bond, the country risk spread and a credit spread based
on market conditions.
3.2.2 Investment Plan
The Company prepares a detailed investment plan each year for maintaining, repairing and expanding each of its
investment properties. That amount is included in the most recently available budgets. Thus, they are transferred to the
discounted cash flows as Capex for investment properties. For future maintenance expenses, the Company forecasts each
property’s expenses needed to sustain its cash flows.
3.2.3 Revenue Growth Rate
Revenue growth rates are relative for each investment property and are directly related to the conditions or stage of the
life cycle of each asset and, therefore, this variable is reviewed and approved each year.
3.2.4 Cost Growth Rate
Cost growth rates are generally less than the rates for revenue. This occurs because there are fixed costs that do not
increase when revenue increases. In addition, the Company has operational efficiency policies that help control its main
operating costs. Lastly, many of these costs are not directly indexed to inflation, while revenue is. These rates are reviewed
and approved each year. Growth rates are real for Chile but nominal for other cases.
Growth Rate - Costs
Country 2020 2019
Chile 0% - 2% 1% - 5%
Peru 3% - 5% 2% - 7%
Colombia 4% - 6% 2% - 7%
3.2.5 EBITDA Growth Rate
The rate of growth or decline for EBITDA is a result of the effects of the revenue and cost growth rates. Both revenue and
cost projections are prepared using future, pre-tax cash flow projections from the most recently available budgets. These
budgets incorporate management’s best estimates of revenue and costs of cash generating units using sector projections,
experience and expectations.
Growth Rate - Revenue Country 2020 2019
Chile 0% - 8% 0% - 6%
Peru 3% - 14% 2% - 6%
Colombia 4% - 15% 2% - 6%
PARQUE ARAUCO S.A. AND SUBSIDIARIES NOTES TO THE CONSOLIDATED FINANCIAL STATEMENTS
AS OF DECEMBER 31, 2020 AND 2019
AND FOR THE YEARS ENDED DECEMBER 31, 2020 AND 2019
21
Note 3 - Summary of Significant Accounting Policies (continued)
Revenue and costs are projected based on these variables to obtain an estimated EBITDA. Maintenance capex, taxes and
changes in working capital are then discounted. For assets owned by the Company, growing perpetuity or annuity is
applied, as appropriate, starting in the tenth year. For assets not owned by the Company, such as when an asset is under
a lease agreement, growth is applied beginning in the tenth year and ending on the date on which the asset must be
returned.
Since Parque Arauco S.A., has established the policy of valuing investment properties at fair value, the effects of any
impairment on these assets are part of the fair value adjustment and are considered by the valuation model for investment
properties.
3.3 Investments in Associates and Joint Ventures Accounted for Using the Equity Method
3.3.1. Associates and Joint Ventures
An associate is an entity over which the Company exercises significant influence. Significant influence represents the
power to participate in the financial and operating policy decisions of an investment, but does not involve control or joint
control over those policies. Income, expenses, assets and liabilities of associates are incorporated into these Consolidated
Financial Statements using the equity method, except when the investment is classified as held for sale, in which case it is
accounted for according to IFRS 5, Non-Current Assets Held for Sale and Discontinued Operations.
Under the equity method, investments in associates are recorded initially at cost and are subsequently adjusted based on
changes, after the acquisition, in the Company's share of the associate's net assets, less any impairment in the value of
the individual investments.
When the Company's share of the losses of an associate or joint venture exceeds its ownership interest in them, the entity
shall cease to recognize its share of the additional losses. The Company's interest in an associate or joint venture is the
carrying amount of the investment in the associate or joint venture determined using the equity method, together with
any long-term interest that, in essence, forms part of the entity's net investment in the associate or joint venture. A joint
venture is an arrangement where the parties that have joint control of the arrangement have rights to the net assets of
the joint venture. Joint control occurs only when decisions about the relevant activities require the unanimous consent of
the parties sharing control.
An investment will be accounted for using the equity method from the date on which it becomes an associate or joint
venture. When the investment is acquired, any difference between the purchase cost and the entity's share of the net fair
value of the identifiable assets and liabilities of the investee shall be accounted for as goodwill and included in the carrying
amount of the investment. Any difference between the entity's share of the net fair value of the investee's identifiable
assets and liabilities and the purchase cost, after revaluation, shall be immediately recognized in comprehensive income.
An investment in an associate or joint venture is impaired and impairment losses are incurred if, and only if, there is
objective evidence of impairment as a result of one or more events that occurred after the initial recognition of the
investment. In that circumstance, the total carrying amount of the investment (including goodwill) is tested for impairment
in accordance with IAS 36 Impairment of Assets, as one single asset by comparing its recoverable amount (the higher of
its value in use and its fair value less costs to sell) to its carrying amount; any impairment loss recognized forms part of the
investment's carrying amount.
PARQUE ARAUCO S.A. AND SUBSIDIARIES NOTES TO THE CONSOLIDATED FINANCIAL STATEMENTS
AS OF DECEMBER 31, 2020 AND 2019
AND FOR THE YEARS ENDED DECEMBER 31, 2020 AND 2019
22
Note 3 - Summary of Significant Accounting Policies (continued)
investment. Any reversal of that impairment loss recognized in accordance with IAS 36 increases the investment's value
as a function of its recoverable amount.
The Company discontinues the use of the equity method on the date on which the investment ceases to be an associate
or joint venture, or once the investment is classified as held for sale. When the Company retains an interest in the former
associate or joint venture and the interest is a financial asset, the Company measures the retained interest at its current
fair value and the market value is considered its fair value upon initial recognition, in accordance with IFRS 9.
The difference between the carrying amount of the associate or joint venture on the date on which use of the equity
method is suspended and the fair value of any retained interest is included in the gain or loss on the disposal of the
associate or joint venture. In addition, if the entity previously recorded a gain or loss in other comprehensive income
related to that associate or joint venture, that amount must be recorded in the same way as if that associate or joint
venture would have directly sold the related assets or liabilities.
The Company continues to use the equity method when an investment in an associate becomes an investment in a joint
venture or an investment in a joint venture becomes an investment in an associate. Fair value is not remeasured as a result
of these changes in interest.
When the Company reduces its interest in an associate or a joint venture, and continues to use the equity method, any
effects previously recognized in other comprehensive income must be reclassified to profit and loss in proportion to the
decrease in interest in that associate.
When a Group company engages in transactions with an associate or joint venture, gains and losses resulting from
transactions with the associate or joint venture are recognized in the Company's consolidated financial statements only
to the extent of its interest in the associate or joint venture.
Investments in associates and joint ventures accounted for using the equity method are initially recorded at cost. Upon
initial recognition, if the cost of an associate or joint venture
is less than the proportional share of the fair value of the underlying investment, the Company records a gain for the
difference between the cost and the fair value of the underlying investment in profit and loss for the year. If the cost of
an associate or joint venture is greater than the Company's proportional share of the fair value of the underlying
investment, the corresponding goodwill is included in the investment's carrying amount. After initial recognition, the
carrying amount of the Company's interest in an associate or joint venture is adjusted by the Company's share of the
investee's income and distributions. Gains and losses resulting from transactions with an associate or joint venture are
recognized in the consolidated financial statements considering the interests of unrelated investors. The carrying amount
of associates or joint ventures is tested for impairment as of each reporting date. Recognized impairment losses can be
subsequently reversed in profit or loss during the period in which they are identified.
3.4 Business Combination and Goodwill
Acquisitions of businesses are accounted for using the acquisition method. The consideration transferred in a business
combination is measured at fair value, which is calculated as the sum of the acquisition-date fair values of the assets
transferred by the Group, liabilities incurred by the Group to the former owners of the acquiree, and the equity interests
issued by the Group in exchange for control of the acquiree.
PARQUE ARAUCO S.A. AND SUBSIDIARIES NOTES TO THE CONSOLIDATED FINANCIAL STATEMENTS
AS OF DECEMBER 31, 2020 AND 2019
AND FOR THE YEARS ENDED DECEMBER 31, 2020 AND 2019
23
Note 3 - Summary of Significant Accounting Policies (continued)
Acquisition related costs are generally recognized in the consolidated statements of income as incurred. In a business
combination, an independent expert is used to determine the fair value of assets acquired and liabilities assumed including
intangible assets identified. For the estimation of recovery of these intangibles identified in a business combination, cash
flow projections are used based on yield estimates of acquired businesses.
At the acquisition date, the identifiable assets acquired and liabilities assumed are recognized at their fair value, except
for the following:
- Deferred tax assets or liabilities and assets or liabilities related to employee benefit agreements are recognized
and measured in accordance with IAS 12 Income Taxes and IAS 19, respectively;
- Liabilities or equity instruments related to share-based payment agreements of the acquiree or share-based
payment agreements signed by the company to replace the share-based payment agreements of the acquiree
are measured in conformity with IFRS 2 as of the acquisition date; and
- Assets (or disposal groups) classified as held for sale in accordance with IFRS 5 Non-current Assets Held for Sale
and Discontinued Operations are measured using that standard.
Goodwill is measured as the sum of the consideration transferred, the amount of any non-controlling interest in the
acquiree and the fair value of the equity method interest previously held by the acquirer (if any) in the acquiree less the
net amounts of the identifiable assets acquired and the liabilities assumed as of the acquisition date. If, after reassessment,
the net of the acquisition-date fair value amounts of the identifiable assets acquired and liabilities assumed exceeds the
sum of the consideration transferred, the amount of any non-controlling interest in the acquiree and the fair value of the
acquirer’s previously held interest in the acquiree (if any), the excess is recognized immediately in statements of income
as a bargain purchase gain.
Non-controlling interests that are present ownership interests and entitle their holders to a proportionate share of the
entity's net assets in the event of liquidation can be measured initially at either fair value or the present ownership
instruments' proportionate share in the acquiree's recognized amounts of the identifiable net assets. The choice of
measurement basis is made on a transaction-by-transaction basis. Other types of non-controlling interests are measured
at fair value or, when appropriate, using another basis specified in another IFRS.
The contingent consideration resulting from a business combination is measured at fair value as of the acquisition date,
as part of that business combination.
Fair value is determined based on discounted cash flows. The key assumptions take into consideration the possibility of
meeting each financial performance target and the discount factor.
When the consideration transferred by the Company in a business combination includes assets or liabilities resulting from
a contingent consideration agreement, the consideration is measured at fair value as of the acquisition date and included
as part of the consideration transferred in a business combination. Changes in the fair value of a contingent consideration
that qualify as measurement period adjustments are adjusted retrospectively with the corresponding adjustments to
goodwill.
Measurement period adjustments are adjustments that arise from additional information obtained during the
“measurement period” (which cannot exceed one year from the acquisition date) regarding events and circumstances
that existed as of the acquisition date.

PARQUE ARAUCO S.A. AND SUBSIDIARIES NOTES TO THE CONSOLIDATED FINANCIAL STATEMENTS
AS OF DECEMBER 31, 2020 AND 2019
AND FOR THE YEARS ENDED DECEMBER 31, 2020 AND 2019
24
Note 3 - Summary of Significant Accounting Policies (continued)
Subsequent accounting of changes in the fair value of a contingent consideration that do not qualify as measurement
period adjustments will depend on how the contingent consideration is classified. If the contingent consideration is
classified as an equity instrument, it should not be remeasured after the reporting date and its final liquidation should be
recorded in equity. If the contingent consideration is classified as an asset or liability, it should be remeasured after the
reporting date in accordance with IFRS 9 or IAS 37 Provisions, Contingent Liabilities and Contingent Assets, as appropriate,
recognizing the corresponding gain or loss in profit and loss for the year.
When a business combination is achieved in stages, the acquirer's preexisting interest in the acquiree is remeasured at
fair value as of the acquisition date and any resulting gain or loss is recorded in profit and loss. Amounts derived from
interests in the acquiree before the date of acquisition that have been previously recorded in other comprehensive income
are reclassified to profit and loss, provided that the treatment was appropriate in the event that the interest was sold.
If a business combination is accounted for incompletely, at the end of the accounting period in which the combination
takes place the Company should report the provisional amounts of the incomplete items. During the measurement period,
the provisional amounts (see preceding paragraph) are adjusted or additional assets or liabilities that existed as of the
acquisition date are recognized that, had they been known, would have affected the amounts recognized as of that date.
Business Combinations under Common Control
Business combinations under common control are recorded using the pooling-of-interest method. Under this method,
assets and liabilities involved in the transaction are carried over at the same carrying amount at which they were recorded
in the companies of origin and any difference between the assets and liabilities included in consolidation and the
consideration provided is recorded directly in net equity.
3.5 Intangible Assets
These are disbursements for software licenses and intangible assets arising from business combinations, such as rights,
commercial contracts and trademarks. Parque Arauco S.A. and its subsidiaries value these assets at acquisition cost. The
cost of intangible assets acquired in a business combination is their fair value as of the date of acquisition. Gains or losses
that may arise upon de-recognizing an intangible asset are measured as the difference between the net income from the
sale and the asset's carrying amount and will be recognized in the statement of income when the asset is de-recognized.
The useful lives of intangible assets are defined as finite and indefinite.
3.5.1 Intangible Assets with Finite Useful Lives
These intangible assets are amortized on a straight-line basis over their estimated useful lives. They are tested for
impairment each time there is an indication that the intangible asset may be impaired. After initial recognition, they are
recorded at cost less any accumulated amortization and any accumulated impairment loss. The amortization period and
amortization method are reviewed at least every year end.
Expected changes in useful life or the expected consumption pattern for future economic benefits included in assets are
treated as changes in accounting estimates. Amortization for the year is charged
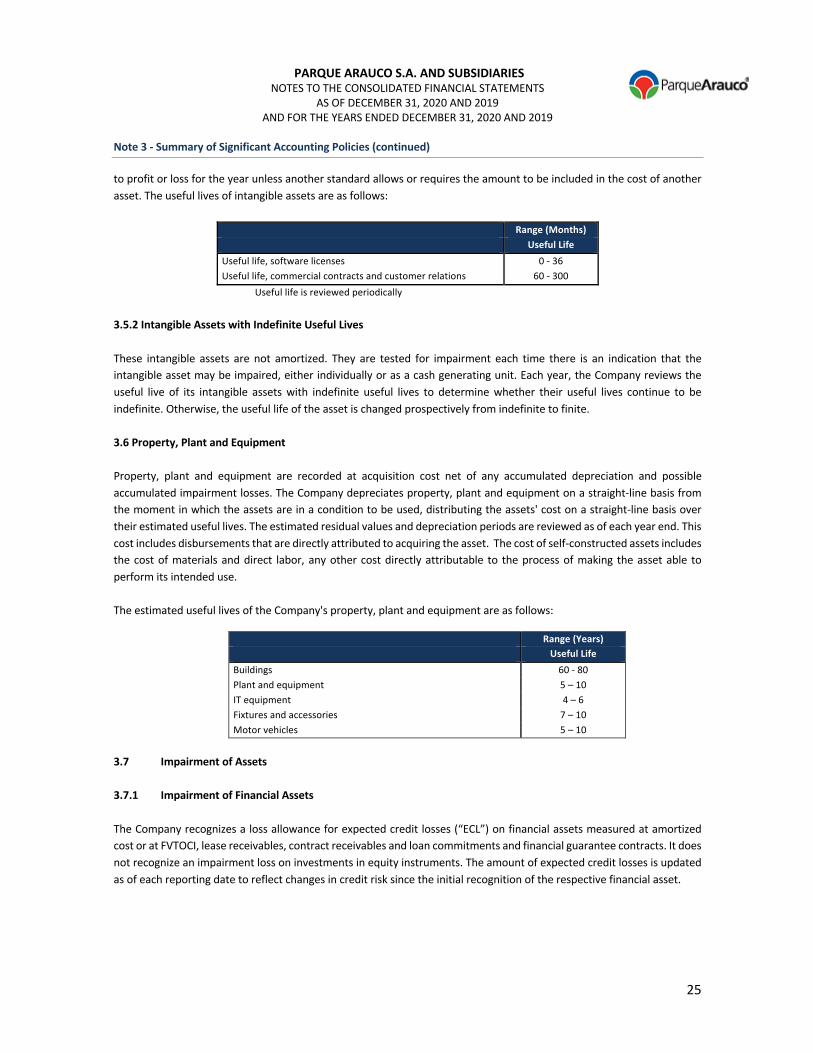
PARQUE ARAUCO S.A. AND SUBSIDIARIES NOTES TO THE CONSOLIDATED FINANCIAL STATEMENTS
AS OF DECEMBER 31, 2020 AND 2019
AND FOR THE YEARS ENDED DECEMBER 31, 2020 AND 2019
25
Note 3 - Summary of Significant Accounting Policies (continued)
to profit or loss for the year unless another standard allows or requires the amount to be included in the cost of another
asset. The useful lives of intangible assets are as follows:
Range (Months) Useful Life Useful life, software licenses 0 - 36
Useful life, commercial contracts and customer relations 60 - 300
Useful life is reviewed periodically
3.5.2 Intangible Assets with Indefinite Useful Lives
These intangible assets are not amortized. They are tested for impairment each time there is an indication that the
intangible asset may be impaired, either individually or as a cash generating unit. Each year, the Company reviews the
useful live of its intangible assets with indefinite useful lives to determine whether their useful lives continue to be
indefinite. Otherwise, the useful life of the asset is changed prospectively from indefinite to finite.
3.6 Property, Plant and Equipment
Property, plant and equipment are recorded at acquisition cost net of any accumulated depreciation and possible
accumulated impairment losses. The Company depreciates property, plant and equipment on a straight-line basis from
the moment in which the assets are in a condition to be used, distributing the assets' cost on a straight-line basis over
their estimated useful lives. The estimated residual values and depreciation periods are reviewed as of each year end. This
cost includes disbursements that are directly attributed to acquiring the asset. The cost of self-constructed assets includes
the cost of materials and direct labor, any other cost directly attributable to the process of making the asset able to
perform its intended use.
The estimated useful lives of the Company's property, plant and equipment are as follows:
3.7 Impairment of Assets
3.7.1 Impairment of Financial Assets
The Company recognizes a loss allowance for expected credit losses (“ECL”) on financial assets measured at amortized
cost or at FVTOCI, lease receivables, contract receivables and loan commitments and financial guarantee contracts. It does
not recognize an impairment loss on investments in equity instruments. The amount of expected credit losses is updated
as of each reporting date to reflect changes in credit risk since the initial recognition of the respective financial asset.
Range (Years) Useful Life Buildings 60 - 80
Plant and equipment 5 – 10
IT equipment 4 – 6
Fixtures and accessories 7 – 10
Motor vehicles 5 – 10

PARQUE ARAUCO S.A. AND SUBSIDIARIES NOTES TO THE CONSOLIDATED FINANCIAL STATEMENTS
AS OF DECEMBER 31, 2020 AND 2019
AND FOR THE YEARS ENDED DECEMBER 31, 2020 AND 2019
26
Note 3 - Summary of Significant Accounting Policies (continued)
The Company always recognizes full lifetime ECLs for trade receivables, contract receivables and lease receivables.
Expected credit losses on those financial assets are estimated using a provisioning matrix based on the Company’s
historical experience with credit losses, adjusted using debtor-specific factors, general economic conditions and an
evaluation of the current and forecasted direction of conditions as of the reporting date, including the time value of money
when appropriate.
For all other financial instruments, the Company recognizes full lifetime ECLs when there has been a significant increase
in credit risk since initial recognition. If, on the other hand, the financial instrument’s credit risk has not increased
significantly since initial recognition, the Company measures a loss allowance for that financial instrument at an amount
equal to the credit losses expected for the next twelve months. The evaluation of whether full lifetime ECLs should be
recognized is based on significant increases in the likelihood or risk of default occurring since initial recognition instead of
using evidence of a financial asset with impaired credit value as of the reporting date or for which default has occurred.
Full lifetime ECLs represent the expected credit losses that result from all possible default events over the life of the
financial instrument. In contrast, 12-month ECLs represent the portion of full lifetime ECLs that are expected to result from
those default events on the financial instrument that are possible within 12 months after the reporting date.
3.7.2 Impairment of Non-Financial Assets
The Company regularly assesses whether there is indication that an asset may be impaired. If such indication exists, or
when there is an annual impairment testing requirement, Parque Arauco S.A. and its subsidiaries estimate the asset's
recoverable amount. An asset’s recoverable amount is the greater between the fair value of an asset or a cash generating
unit, less costs to sell, and its value in use, and is determined for an individual asset unless the asset does not generate
cash inflows that are clearly independent from those of other assets or asset groups. When the carrying amount of an
asset exceeds its recoverable amount, the asset is considered to be impaired and is written down to its recoverable
amount. When appropriate, it is recorded in other income (losses) in the statement of income. When an impairment loss
is subsequently reversed, the carrying amount of the asset or cash generating unit is increased up to the lower of the
revised estimate of its recoverable amount and the carrying amount that would have been recorded if the impairment
loss had not been previously recorded.
3.8 Financial Instruments
(I) Classification
The Company classifies its financial assets into the following categories:
- those measured subsequently at fair value (either through other comprehensive income or through profit or
loss)
- those measured at amortized cost.
Classification depends on the Company's business model for managing financial assets and the instruments’ contractual
cash flow characteristics.
PARQUE ARAUCO S.A. AND SUBSIDIARIES NOTES TO THE CONSOLIDATED FINANCIAL STATEMENTS
AS OF DECEMBER 31, 2020 AND 2019
AND FOR THE YEARS ENDED DECEMBER 31, 2020 AND 2019
27
Note 3 - Summary of Significant Accounting Policies (continued)
For assets measured at fair value, gains and losses are recorded in profit or loss or in other comprehensive income. For
investments in debt instruments, classification will depend on the business model with which the investment is made. For
investments in equity instruments that are not held for trading, classification will depend on whether the Company has
made an irrevocable election at initial recognition to measure the equity instrument at fair value through other
comprehensive income.
a) Financial Assets at Amortized Cost
The Company classifies its financial assets at amortized cost only if they meet the following two criteria:
- the asset is held within a business model whose objective is to hold assets in order to collect contractual cash
flows,
- the contractual terms give rise on specified dates to cash flows that are solely payments of principal and interest
on the principal outstanding.
Financial assets held by the Group that are commonly categorized as such include: investments in time deposits, related
party receivables, trade and other receivables (including lease receivables), cash in bank accounts, among others.
b) Financial Assets at Fair Value Through Profit and Loss
Financial assets that meet the following conditions are subsequently measured at fair value through other comprehensive
income (FVTOCI):
- the financial asset is held within a business model whose objective is achieved by collecting contractual cash
flows and selling financial assets; and
- The contractual terms of the financial asset give rise on specified dates to cash flows that are solely payments
of principal and interest on the principal outstanding.
All other financial assets that do not meet the preceding conditions are subsequently measured at fair value through profit
or loss (FVTPL).
Nevertheless, the Company can make the following irrevocable choices upon initial recognition of the financial asset:
- The Company can irrevocably choose to present subsequent changes in fair value in other comprehensive
income for investments in equity instruments that, otherwise, would be measured at fair value through profit
and loss;
- The Company can irrevocably choose to designate a financial asset that meets the criteria for amortized cost or
fair value through other comprehensive income as measured at fair value through profit and loss if doing so
eliminates or significantly reduces a measurement or recognition inconsistency.
(ii) Measurement
At initial recognition, the Group measures financial assets at fair value plus, in the case of a financial asset not recognized
at fair value through profit or loss, transaction costs that are directly attributable to the acquisition of the financial asset.
Transaction costs of financial assets measured at fair value through profit or loss are expensed when incurred.
Financial assets with embedded derivatives are considered in full when determining whether the cash flows are solely
payments of principal and interest.
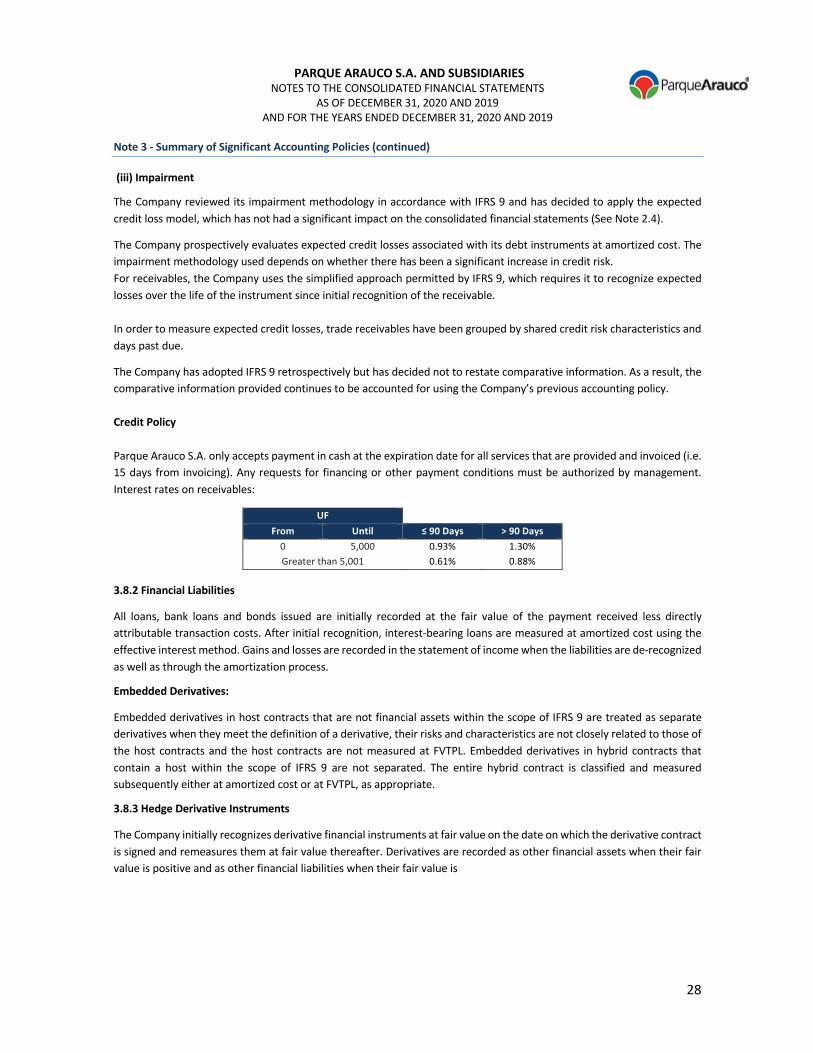
PARQUE ARAUCO S.A. AND SUBSIDIARIES NOTES TO THE CONSOLIDATED FINANCIAL STATEMENTS
AS OF DECEMBER 31, 2020 AND 2019
AND FOR THE YEARS ENDED DECEMBER 31, 2020 AND 2019
28
Note 3 - Summary of Significant Accounting Policies (continued)
(iii) Impairment
The Company reviewed its impairment methodology in accordance with IFRS 9 and has decided to apply the expected
credit loss model, which has not had a significant impact on the consolidated financial statements (See Note 2.4).
The Company prospectively evaluates expected credit losses associated with its debt instruments at amortized cost. The
impairment methodology used depends on whether there has been a significant increase in credit risk.
For receivables, the Company uses the simplified approach permitted by IFRS 9, which requires it to recognize expected
losses over the life of the instrument since initial recognition of the receivable.
In order to measure expected credit losses, trade receivables have been grouped by shared credit risk characteristics and
days past due.
The Company has adopted IFRS 9 retrospectively but has decided not to restate comparative information. As a result, the
comparative information provided continues to be accounted for using the Company’s previous accounting policy.
Credit Policy
Parque Arauco S.A. only accepts payment in cash at the expiration date for all services that are provided and invoiced (i.e.
15 days from invoicing). Any requests for financing or other payment conditions must be authorized by management.
Interest rates on receivables:
3.8.2 Financial Liabilities
All loans, bank loans and bonds issued are initially recorded at the fair value of the payment received less directly
attributable transaction costs. After initial recognition, interest-bearing loans are measured at amortized cost using the
effective interest method. Gains and losses are recorded in the statement of income when the liabilities are de-recognized
as well as through the amortization process.
Embedded Derivatives:
Embedded derivatives in host contracts that are not financial assets within the scope of IFRS 9 are treated as separate
derivatives when they meet the definition of a derivative, their risks and characteristics are not closely related to those of
the host contracts and the host contracts are not measured at FVTPL. Embedded derivatives in hybrid contracts that
contain a host within the scope of IFRS 9 are not separated. The entire hybrid contract is classified and measured
subsequently either at amortized cost or at FVTPL, as appropriate.
3.8.3 Hedge Derivative Instruments
The Company initially recognizes derivative financial instruments at fair value on the date on which the derivative contract
is signed and remeasures them at fair value thereafter. Derivatives are recorded as other financial assets when their fair
value is positive and as other financial liabilities when their fair value is
UF
From Until ≤ 90 Days > 90 Days 0 5,000 0.93% 1.30%
Greater than 5,001 0.61% 0.88%

PARQUE ARAUCO S.A. AND SUBSIDIARIES NOTES TO THE CONSOLIDATED FINANCIAL STATEMENTS
AS OF DECEMBER 31, 2020 AND 2019
AND FOR THE YEARS ENDED DECEMBER 31, 2020 AND 2019
29
Note 3 - Summary of Significant Accounting Policies (continued)
negative. Any gain or loss arising from changes in the fair value of derivative instruments during the period are recorded
in other comprehensive income.
Parque Arauco S.A. has hedge derivatives to hedge risks related to fluctuations in interest and exchange rates. The
Company’s derivatives are described in detail in Note 37 of these financial statements. The Company's objective for
holding these derivatives is to minimize these risks using the
most effective method for eliminating or reducing the impact of these exposures. Derivative instruments are initially
recorded at fair value, which is determined in reference to market values. The effective portion of hedging gains or losses
is directly recorded in equity until the committed or expected transaction occurs, such as when the hedged financial
expense is recognized. At that time, they are reclassified to profit or loss, while any ineffective portion is immediately
recognized in the statement of comprehensive income.
The Company’s financial instruments, classified into different categories as explained above, are as follows:
Financial Assets 12.31.2020 12.31.2019
Note ThCLP$ ThCLP$ Financial assets at amortized cost
Cash and cash equivalents 5 88,436,646 75,945,667
Trade and other receivables, current (net) 8 27,006,348 35,040,712
Related party receivables, current 9 272,154 234,289
Related party receivables, non-current 9 1,972,924 2,027,164
Rights receivable, non-current 8 49,379 52,047
Financial assets at fair value through profit and loss
Other cash and cash equivalents 5 268,595,803 239,489,269
Other financial assets, non-current 6 4,388,203 5,978,477
Total 390,721,457 358,767,625
Financial Liabilities 12.31.2020 12.31.2019
Note ThCLP$ ThCLP$ Financial liabilities at amortized cost
Other financial liabilities, current 16 53,789,338 233,155,867
Other financial liabilities, non-current 16 1,155,431,712 846,684,672
Trade and other payables, current 19 26,779,049 49,463,827
Related party payables, non-current 9 - -
Lease liabilities, current 21 1,734,596 2,654,721
Lease liabilities, non-current 21 67,618,797 78,136,034
Derivative Instruments
Other financial liabilities, current 16 591,691 200,800
Other financial liabilities, non-current 16 9,039,120 1,519,131
Financial liabilities at fair value through profit and loss
Total 1,314,984,303 1,211,815,052
Hedge Accounting
The Company designates certain hedging instruments for exchange or interest rate risk as fair value hedges, cash flow
hedges or hedges of a net investment in a foreign operation, as appropriate. A foreign exchange hedge of a firm
commitment is accounted for as a cash flow hedge.
PARQUE ARAUCO S.A. AND SUBSIDIARIES NOTES TO THE CONSOLIDATED FINANCIAL STATEMENTS
AS OF DECEMBER 31, 2020 AND 2019
AND FOR THE YEARS ENDED DECEMBER 31, 2020 AND 2019
30
Note 3 - Summary of Significant Accounting Policies (continued)
At the inception of the hedge relationship, the Company documents the relationship between the hedging instrument and
the hedged item, as well as the risk management objectives and its strategy for carrying out different hedging transactions.
In addition, at the inception of the hedge and on an ongoing basis, the Company documents whether the hedging
instrument is effective in offsetting changes in the fair value or cash flows of the hedged item attributable to the hedged
risk, which is when the hedge relationship meets the following effectiveness requirements:
- there is an economic relationship between the hedged item and the hedging.
- the effect of credit risk does not dominate the value changes that result from that economic relationship; and
the hedge ratio of the hedging relationship is the same as the quantity of the hedged item actually hedged by
the Company and the quantity of the hedging instrument that the entity actually uses to hedge that quantity of
the hedged item.
3.9 Fair Value
Fair values are based on market values, which are the estimated amount at which the properties could be exchanged at
the valuation date between knowledgeable, willing parties in an arm's length transaction after a proper trade in which
both parties acted voluntarily. Underlying the concept of fair value is the assumption that the entity is a going concern
and that there is no intent or need to liquidate the instruments or carry out a transaction in unfavorable conditions.
Therefore, the fair value is not the amount that an entity would receive or pay in a forced transaction, an involuntary
liquidation or a sale due to financial difficulties.
Fair value measurements are classified into one of three hierarchical levels: Level 1, 2 or 3.
Level 1 - Inputs are quoted (unadjusted) prices in active markets for identical assets and liabilities at the measurement
date.
Level 2 - Inputs (other than the quoted prices included in Level 1) are directly or indirectly observable for the asset or
liability through correlation with market data at the measurement date and based on the foreseen duration of the asset
or liability.
Level 3 - Inputs are not observable and reflect management's best estimate of what market participants would consider
in setting the price of the asset or liability at the measurement date. The risk inherent in the valuation technique and the
risk inherent in the inputs used are considered in determining the estimate.
3.10 Cash and Cash Equivalents
The Company defines cash and cash equivalents as short-term investments performed as part of regular cash surplus
administration and that can be rapidly converted into known cash amounts, that mature within three months or less from
the acquisition date and that have a minimum risk of significant loss in value. Therefore, the Company has included in cash
and cash equivalents balances in cash, time deposits, mutual funds and financial instruments under repo agreements,
among others.

PARQUE ARAUCO S.A. AND SUBSIDIARIES NOTES TO THE CONSOLIDATED FINANCIAL STATEMENTS
AS OF DECEMBER 31, 2020 AND 2019
AND FOR THE YEARS ENDED DECEMBER 31, 2020 AND 2019
31
Note 3 - Summary of Significant Accounting Policies (continued)
3.11 Leases
3.11.1 The Company as Lessor
Lease contracts where the Group acts as lessor are mainly for leases to shopping center tenants. The accounting policies
related to this type of contract are explained in Note 3.12 “Revenue Recognition.”
3.11.2 The Company as Lessee
These leases are recorded as a right-of-use asset and a corresponding liability as of the date on which the leased asset is
available for use by the Group. Each lease payment is allocated between the liability and the financial expense. The
financial expense is charged to profit or loss over the lease period so as to produce a constant periodic rate of interest on
the remaining balance of the liability for each period. The right-of-use asset for offices is depreciated over the shorter of
the asset’s useful life and the lease term on a straight-line basis.
Assets and liabilities derived from a lease contract are initially recorded at present value. Lease liabilities include the net
present value of the payments:
- Fixed payments less lease incentives receivable
- Variable lease payments that depend on an index or rate
- Amounts expected to be payable by the lessee under residual value guarantees
- The exercise price of a purchase option that the lessee is reasonably certain to exercise
- Payments of penalties for terminating the lease, if the lease term reflects the lessee exercising an option to
terminate the lease
Lease payments are discounted using the interest rate implicit in the lease contract, if that rate can be determined, or the
incremental borrowing rate calculated by Parque Arauco.
Right-of-use assets generated by office leases that are presented within property, plant and equipment are recorded at
cost, which includes:
- The initial amount of the lease liability
- Any lease payment made on or before the lease commencement date less any lease incentives received
- Any initial direct cost
- Restoration costs.
Right-of-use assets generated by land leases for certain shopping centers that are presented within investment property
are recorded at fair value.
Payments related to short-term leases and leases of low-value assets are recorded on a straight-line basis within operating
expenses. Short-term leases have a lease term of 12 months or less.
3.12 Revenue Recognition
Revenue comes from invoicing of minimum and percentage rent, utilities and other services provided at each year end.
Revenue is recognized on a straight-line basis

PARQUE ARAUCO S.A. AND SUBSIDIARIES NOTES TO THE CONSOLIDATED FINANCIAL STATEMENTS
AS OF DECEMBER 31, 2020 AND 2019
AND FOR THE YEARS ENDED DECEMBER 31, 2020 AND 2019
32
Note 3 - Summary of Significant Accounting Policies (continued)
to the extent that it is likely that the economic benefits will flow to the Company and it can be reliably measured. It
represents receivables for services provided, less discounts and sales and service taxes. The Company retains substantially
all risks and rewards for its investment properties and, as a result, it records leases with tenants as operating leases.
It begins to recognize revenue from these lease agreements once the tenant has the right to use the leased asset. Rental
income includes percentage rent (variable) and recovery of certain operating expenses. Percentage rent is recognized
when tenants report figures for sales that qualify for this type of rent.
The following specific recognition criteria must also be met in order to recognize revenue.
Lease income: Lease income comes from the leasing of physical spaces, or operating leases of investment properties, and
is recognized based on contract duration and agreed-upon prices.
Deferred income: This account includes turnkey rights held by tenants that are amortized over the life of the agreement
and lease invoices issued in advance to tenants.
3.13 Current and Deferred Income Taxes
Income Taxes
At each year end, the Company has recorded its tax obligations on the basis of net taxable income determined according
to the rules set forth in the Income Tax Law.
To calculate these amounts, the Company uses tax rates and laws enacted as of the date of the statement of financial
position.
Deferred Taxes
The effects of deferred taxes arising from the benefits of tax losses and any differences between the statement of financial
position and the tax balance sheet are recorded for all temporary differences, considering the tax rates that will be in
effect at the estimated date of reversal. Temporary differences may be taxable temporary differences, which result in a
greater tax payment in the future and generally involve recognizing a deferred tax liability; or they may be deductible
temporary differences, which result in a reduced tax payment in the future.
Deferred tax assets and liabilities are offset when a legally enforceable right exists to offset tax assets with tax liabilities
and the deferred tax is levied by the same tax authority on the same entity.
3.14 Share-Based Payments
Compensation plans implemented by granting options to subscribe and pay in shares are recognized in the financial
statements in accordance with IFRS 2 “Share-Based Payments.” The accounting effect is accrued in the income statement
account "compensation" on a straight-line basis from the granting date to the expiration date and its balancing entry is
recorded in the equity account other reserves.

PARQUE ARAUCO S.A. AND SUBSIDIARIES NOTES TO THE CONSOLIDATED FINANCIAL STATEMENTS
AS OF DECEMBER 31, 2020 AND 2019
AND FOR THE YEARS ENDED DECEMBER 31, 2020 AND 2019
33
Note 3 - Summary of Significant Accounting Policies (continued)
3.15 Segment Reporting
Operating segments are components of the group that engage in business activities from which they may earn revenue
and incur expenses, including income and expenses related to the other components of the group. Each segment's
operating results are reviewed regularly by
management to decide about resource allocation for the segment and evaluate its performance; separate financial
reporting is available. Segment results reported to the CEO and the Board of Directors include items directly attributable
to a segment as well as those that can be reasonably allocated. Unallocated items primarily include corporate assets
(mainly the Company's headquarters), headquarters expenses and income tax assets and liabilities.
No single client represents more than 10% of the Company's total consolidated revenue.
3.16 Stock Buyback (Treasury Shares)
When share capital recorded as equity is bought back, the amount paid, including directly attributable costs, net of any
tax effect, is deducted from equity. Shares bought back are classified as treasury shares and deducted from total equity.
When treasury shares are sold or subsequently reissued, the amount received is recognized as an increase to equity and
the gain or loss on the transaction is transferred to retained earnings or accumulated losses.
3.17 Earnings per Share
The Company presents data on basic and diluted earnings per share for its common shares. Basic earnings per share is
calculated by dividing profit attributable to the Company's common shareholders by the weighted average number of
outstanding common shares during the period, adjusted to account for treasury shares. Diluted earnings per share is
calculated by adjusting profit attributable to common shareholders and the weighted average number of outstanding
common shares adjusted to account for treasury shares to incorporate all potential dilutive shares, which include
convertible instruments and stock options granted to employees.
3.18 Dividends
The dividend policy consists of distributing at least 30% of net profit each year. For these purposes, distributable net profits
exclude the following items from profit attributable to the equity holders of the parent determined for the year:
a) Unrealized gains or losses due to variations in the fair value of investment properties. The main fair value
adjustments on investment properties are due to revaluations based on future cash flows. The valuation of these
assets is regulated in IAS 40 Investment Properties. These results will be reintegrated into distributable net
profits once the assets are sold or otherwise disposed of.
b) The effects of deferred taxes derived from adjustments related to the concepts included in point a) above.
As of each year end, the Company records a liability for 30% of distributable net profits, if any, which are recorded against
retained earnings (accumulated losses) presented in the Statement of Changes in Equity.

PARQUE ARAUCO S.A. AND SUBSIDIARIES NOTES TO THE CONSOLIDATED FINANCIAL STATEMENTS
AS OF DECEMBER 31, 2020 AND 2019
AND FOR THE YEARS ENDED DECEMBER 31, 2020 AND 2019
34
Note 3 - Summary of Significant Accounting Policies (continued)
3.19 Non-Current Assets Held for Sale
The Company classifies non-current assets whose carrying amount will be mostly recovered through sale, rather than
through continuing use, as non-current assets held for sale. This condition is only considered to be met when the sale is
highly probable and the asset is available for sale immediately in its current state, and subject only to terms that are usual
and customary for sales of such assets.
The Company is actively trying to sell these assets and expects the sale will occur within less than one year. These assets
are valued at the lesser of their carrying amount and their fair value less costs to sell.
3.20 Employee Benefits
The Group records short-term employee benefits, which include wages, salaries, vacation and other benefits received for
providing services during the period. These benefits are measured on an accrual basis and are expensed as the related
service is provided.
3.21 Reclassifications
The Company has reclassified the following items in order to correctly present leases as required by IFRS 16 as well as
advances to suppliers related to investment properties.
Statement of Financial Position
Reported Balance New Reported Balance Change
12.31.2019 12.31.2019 ThCLP$
ThCLP$ ThCLP$
Property, plant and equipment 40,682,406 22,895,004 (17,787,402)
Investment properties 2,022,119,495 2,037,106,033 14,986,538
Deferred tax assets 44,308,618 42,597,385 (1,711,233)
Right-of-use leased assets 0 2,800,864 2,800,864
Non-current assets 2,107,110,519 2,105,399,286 (1,711,233)
Other financial liabilities, current 235,023,021 233,356,667 (1,666,354)
Lease liabilities, current 988,367 2,654,721 1,666,354
Current liabilities 236,011,388 236,011,388 0
Other financial liabilities, non-current 879,837,313 848,203,803 (31,633,510)
Deferred tax liabilities 247,849,234 246,138,001 (1,711,233)
Lease liabilities, non-current 46,502,524 78,136,034 31,633,510
Non-current liabilities 1,174,189,071 1,172,477,838 (1,711,233)
Note 4 - Accounting Policies and Changes in Accounting Estimates
As of December 31, 2020, the financial statements present accounting policies, changes in accounting estimates and errors
of ThCLP$7,378,251 as a result of recording related party transactions dating back to 2013 that affected investment
properties and retained earnings from prior periods.
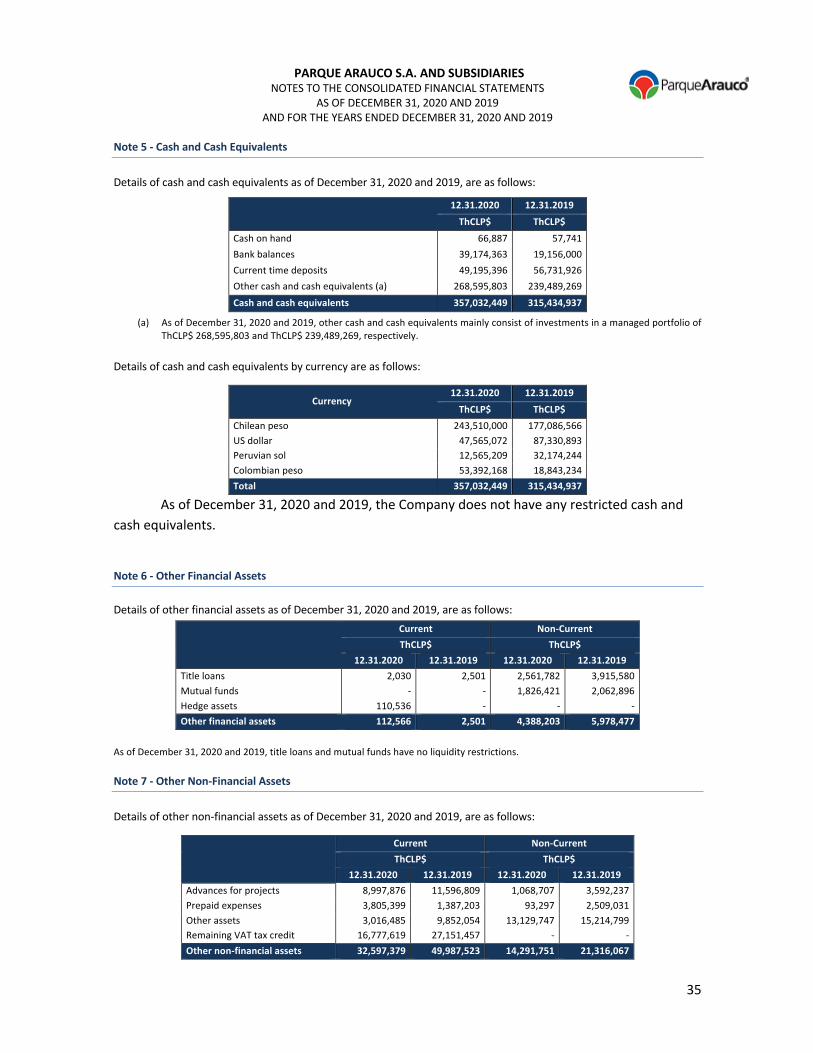
PARQUE ARAUCO S.A. AND SUBSIDIARIES NOTES TO THE CONSOLIDATED FINANCIAL STATEMENTS
AS OF DECEMBER 31, 2020 AND 2019
AND FOR THE YEARS ENDED DECEMBER 31, 2020 AND 2019
35
Note 5 - Cash and Cash Equivalents
Details of cash and cash equivalents as of December 31, 2020 and 2019, are as follows:
12.31.2020 12.31.2019
ThCLP$ ThCLP$ Cash on hand 66,887 57,741
Bank balances 39,174,363 19,156,000
Current time deposits 49,195,396 56,731,926
Other cash and cash equivalents (a) 268,595,803 239,489,269
Cash and cash equivalents 357,032,449 315,434,937
(a) As of December 31, 2020 and 2019, other cash and cash equivalents mainly consist of investments in a managed portfolio of
ThCLP$ 268,595,803 and ThCLP$ 239,489,269, respectively.
Details of cash and cash equivalents by currency are as follows:
Currency 12.31.2020 12.31.2019
ThCLP$ ThCLP$ Chilean peso 243,510,000 177,086,566
US dollar 47,565,072 87,330,893
Peruvian sol 12,565,209 32,174,244
Colombian peso 53,392,168 18,843,234
Total 357,032,449 315,434,937
As of December 31, 2020 and 2019, the Company does not have any restricted cash and cash equivalents.
Note 6 - Other Financial Assets
Details of other financial assets as of December 31, 2020 and 2019, are as follows:
Current Non-Current ThCLP$ ThCLP$
12.31.2020 12.31.2019 12.31.2020 12.31.2019 Title loans 2,030 2,501 2,561,782 3,915,580
Mutual funds - - 1,826,421 2,062,896
Hedge assets 110,536 - - -
Other financial assets 112,566 2,501 4,388,203 5,978,477
As of December 31, 2020 and 2019, title loans and mutual funds have no liquidity restrictions.
Note 7 - Other Non-Financial Assets
Details of other non-financial assets as of December 31, 2020 and 2019, are as follows:
Current Non-Current ThCLP$ ThCLP$
12.31.2020 12.31.2019 12.31.2020 12.31.2019 Advances for projects 8,997,876 11,596,809 1,068,707 3,592,237
Prepaid expenses 3,805,399 1,387,203 93,297 2,509,031
Other assets 3,016,485 9,852,054 13,129,747 15,214,799
Remaining VAT tax credit 16,777,619 27,151,457 - -
Other non-financial assets 32,597,379 49,987,523 14,291,751 21,316,067

PARQUE ARAUCO S.A. AND SUBSIDIARIES NOTES TO THE CONSOLIDATED FINANCIAL STATEMENTS
AS OF DECEMBER 31, 2020 AND 2019
AND FOR THE YEARS ENDED DECEMBER 31, 2020 AND 2019
36
Note 8 - Current and Non-Current Trade and Other Receivables
Trade receivables
This account consists of invoices receivable for leases of retail stores and spaces, maintenance services and other items,
net of allowances for doubtful accounts (impairment).
The Company and its subsidiaries do not have a securitized portfolio.
Notes receivable
This account consists of post-dated checks, installments and promissory notes to pay invoices for retail store leases and
other items, net of provisions for doubtful accounts (impairment). Promissory notes receivable are installments of
guarantee payments for leases in accordance with lease agreements in force, net of allowances for doubtful accounts.
Details of current and non-current trade and other receivables as of December 31, 2020 and 2019, are as follows:
Current
12.31.2020 12.31.2019
Gross Value Allowance for
Doubtful Accounts Net Value
Gross Value
Allowance for Doubtful Accounts
Net Value
ThCLP$ ThCLP$ ThCLP$ ThCLP$ ThCLP$ ThCLP$
Trade receivables and notes receivable (1) 41,752,649 (14,854,810) 26,897,839 39,902,392 (5,432,949) 34,469,444
Miscellaneous receivables 108,509 - 108,509 571,268 - 571,268
Trade and other receivables, current 41,861,158 (14,854,810) 27,006,348 40,473,661 (5,432,949) 35,040,712
(1) As of December 31, 2020 and 2019, gross notes receivable total ThCLP$ 8,256,145 and ThCLP$ 5,435,883, respectively. Miscellaneous receivables
This line item includes mainly concepts such as customer advances, loans to employees, subscriptions receivable, expenses
to be documented and dividends receivable, as well as other minor concepts.
Portfolio Distribution
Current 31-60 61-90 91-120 121-150 151-180 > 180 12.31.2020 Trade receivables
ThCLP$ 20,841,015 3,374,444 1,885,192 1,313,018 875,939 593,947 4,612,950 33,496,504
Current 31-60 61-90 91-120 121-150 151-180 > 180 12.31.2019 Trade receivables
ThCLP$ 25,747,760 3,163,087 2,051,235 1,039,926 688,030 417,823 1,358,649 34,466,510
As of December 31, 2020 and 2019, write-offs totaled ThCLP$ 3,796,906 and ThCLP$ 1,522,146, respectively.
Rights receivable, non-current
This account consists of other receivables for reimbursable payments made to Aguas Cordillera S.A., and Aguas Andinas
S.A.
Non-Current
12.31.2020 12.31.2019 Gross Value
Allowance for Doubtful Accounts
Net Value Gross Value
Allowance for Doubtful Accounts
Net Value
ThCLP$ ThCLP$ ThCLP$ ThCLP$ ThCLP$ ThCLP$ Other receivables 49,379 - 49,379 52,047 - 52,047
Rights receivable, non-current 49,379 - 49,379 52,047 - 52,047
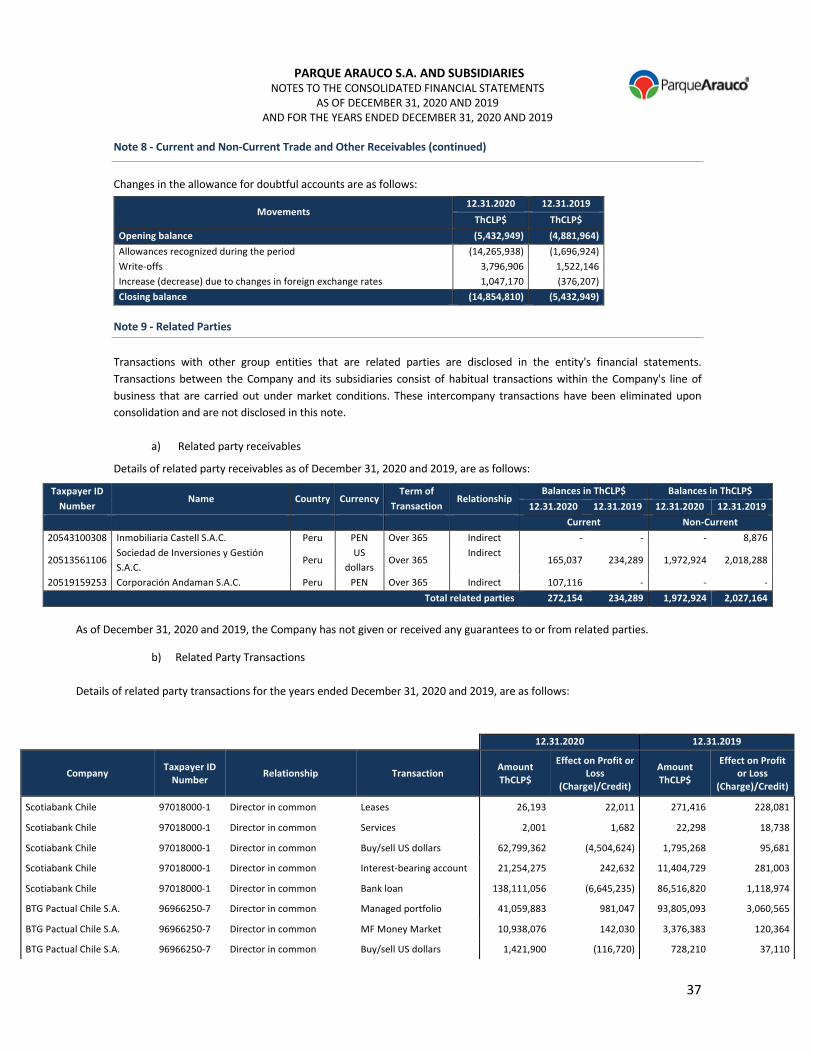
PARQUE ARAUCO S.A. AND SUBSIDIARIES NOTES TO THE CONSOLIDATED FINANCIAL STATEMENTS
AS OF DECEMBER 31, 2020 AND 2019
AND FOR THE YEARS ENDED DECEMBER 31, 2020 AND 2019
37
Note 8 - Current and Non-Current Trade and Other Receivables (continued)
Changes in the allowance for doubtful accounts are as follows:
Movements 12.31.2020 12.31.2019
ThCLP$ ThCLP$ Opening balance (5,432,949) (4,881,964) Allowances recognized during the period (14,265,938) (1,696,924)
Write-offs 3,796,906 1,522,146
Increase (decrease) due to changes in foreign exchange rates 1,047,170 (376,207)
Closing balance (14,854,810) (5,432,949)
Note 9 - Related Parties
Transactions with other group entities that are related parties are disclosed in the entity's financial statements.
Transactions between the Company and its subsidiaries consist of habitual transactions within the Company's line of
business that are carried out under market conditions. These intercompany transactions have been eliminated upon
consolidation and are not disclosed in this note.
a) Related party receivables
Details of related party receivables as of December 31, 2020 and 2019, are as follows:
Taxpayer ID Number
Name Country Currency Term of
Transaction Relationship
Balances in ThCLP$ Balances in ThCLP$ 12.31.2020 12.31.2019 12.31.2020 12.31.2019
Current Non-Current 20543100308 Inmobiliaria Castell S.A.C. Peru PEN Over 365 Indirect - - - 8,876
20513561106 Sociedad de Inversiones y Gestión
S.A.C. Peru
US
dollars Over 365
Indirect 165,037 234,289 1,972,924 2,018,288
20519159253 Corporación Andaman S.A.C. Peru PEN Over 365 Indirect 107,116 - - -
Total related parties 272,154 234,289 1,972,924 2,027,164
As of December 31, 2020 and 2019, the Company has not given or received any guarantees to or from related parties.
b) Related Party Transactions
Details of related party transactions for the years ended December 31, 2020 and 2019, are as follows:
12.31.2020 12.31.2019
Company Taxpayer ID Number
Relationship Transaction Amount ThCLP$
Effect on Profit or Loss
(Charge)/Credit)
Amount ThCLP$
Effect on Profit or Loss
(Charge)/Credit)
Scotiabank Chile 97018000-1 Director in common Leases 26,193 22,011 271,416 228,081
Scotiabank Chile 97018000-1 Director in common Services 2,001 1,682 22,298 18,738
Scotiabank Chile 97018000-1 Director in common Buy/sell US dollars 62,799,362 (4,504,624) 1,795,268 95,681
Scotiabank Chile 97018000-1 Director in common Interest-bearing account 21,254,275 242,632 11,404,729 281,003
Scotiabank Chile 97018000-1 Director in common Bank loan 138,111,056 (6,645,235) 86,516,820 1,118,974
BTG Pactual Chile S.A. 96966250-7 Director in common Managed portfolio 41,059,883 981,047 93,805,093 3,060,565
BTG Pactual Chile S.A. 96966250-7 Director in common MF Money Market 10,938,076 142,030 3,376,383 120,364
BTG Pactual Chile S.A. 96966250-7 Director in common Buy/sell US dollars 1,421,900 (116,720) 728,210 37,110

PARQUE ARAUCO S.A. AND SUBSIDIARIES NOTES TO THE CONSOLIDATED FINANCIAL STATEMENTS
AS OF DECEMBER 31, 2020 AND 2019
AND FOR THE YEARS ENDED DECEMBER 31, 2020 AND 2019
38
12.31.2020 12.31.2019
Company Taxpayer ID Number
Relationship Transaction Amount ThCLP$
Effect on Profit or Loss
(Charge)/Credit)
Amount ThCLP$
Effect on Profit or Loss
(Charge)/Credit)
Comercial Café Mokka S.A. 88665600-9 Director in common Leases 58,904 49,499 150,132 126,161
Comercial Café Mokka S.A. 88665600-9 Director in common Services 6,829 5,738 14,278 11,998
Comercial Café Mokka S.A. 88665600-9 Director in common Purchase of products 3,176 (2,177) 7,226 (6,019)
Comercial Los Andes S.A. 96632770-7 Shareholder in common Leases 41,419 34,806 69,138 58,137
Comercial Los Andes S.A. 96632770-7 Shareholder in common Services - - 1,863 1,566
Embotelladora Andina S.A. 91144000-9 Director in common Leases 161,117 135,392 151,866 127,611
Embotelladora Andina S.A. 91144000-9 Director in common Services 1,764 1,482 441 370
c) Compensation Received by Key Management Personnel by Category
Total compensation received by the Company's main executives, excluding termination benefits, for the years ended
December 31, 2020 and 2019, amounted to ThCLP$ 3,761,256 and ThCLP$ 4,453,613, respectively.
For the years ended December 31, 2020 and 2019, the Company paid the Board of Directors total fees and allowances of
ThCLP$ 468,527 and ThCLP$ 507,237, respectively.
The current members of the Board of Directors as of December 31, 2020, are:
Directors: Guillermo Said Yarur
José Domingo Eluchans Urenda
Orlando Sáenz Rojas
Ana Holuigue Barros
Rodrigo Muñoz Muñoz
Fernando Massú Tare
Luis Hernán Paúl Fresno
Chairman: Executive Vice President: Salvador Said Somavía Juan Antonio Álvarez Avendaño
Note 10 - Current Tax Assets and Liabilities
Details of current tax assets as of December 31, 2020 and 2019, are as follows:
12.31.2020 12.31.2019
ThCLP$ ThCLP$
Provisional tax payments 2,441,136 3,970,067
Other taxes 7,457,689 5,252,010
Current tax assets 9,898,825 9,222,077
Details of current tax liabilities as of December 31, 2020 and 2019, are as follows:
12.31.2020 12.31.2019
ThCLP$ ThCLP$
Income taxes payable 980,199 13,927,479
Other taxes 776,244 3,150,032
Current tax liabilities 1,756,443 17,077,511
12.31.2020 12.31.2019
ThCLP$ ThCLP$ Total compensation paid 2,623,159 2,792,721
Variable wages paid 1,138,097 1,660,892
Termination benefits paid 104,426 17,554
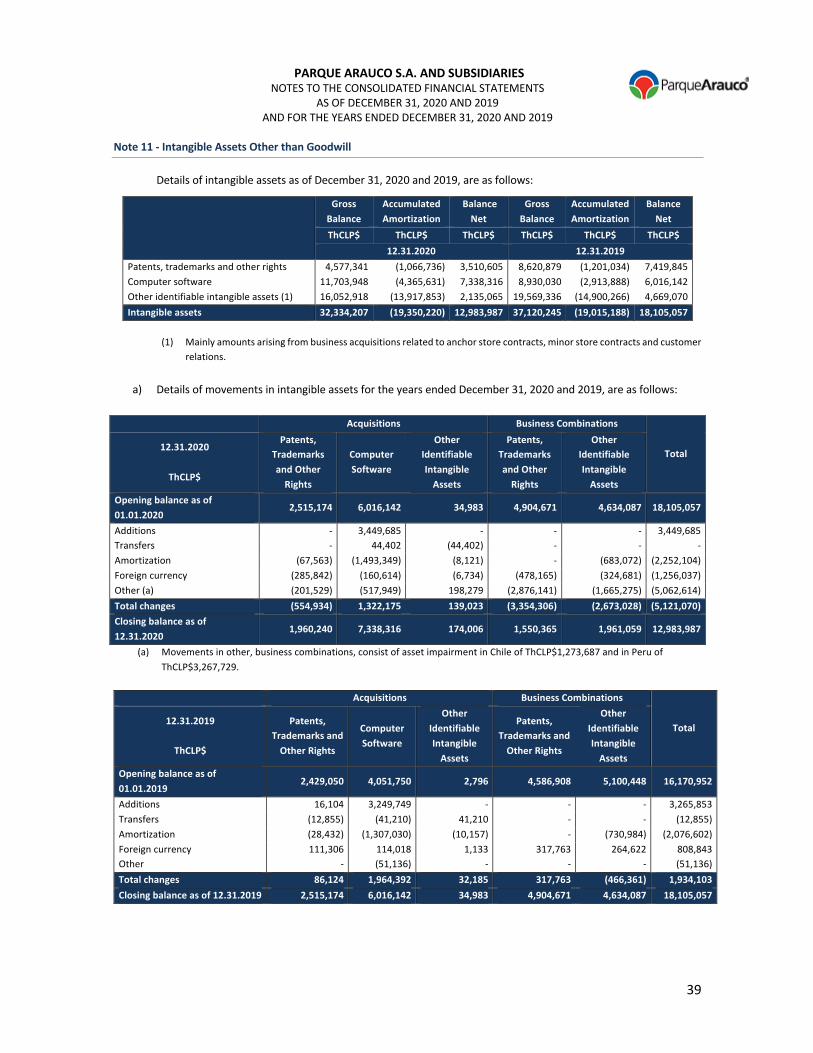
PARQUE ARAUCO S.A. AND SUBSIDIARIES NOTES TO THE CONSOLIDATED FINANCIAL STATEMENTS
AS OF DECEMBER 31, 2020 AND 2019
AND FOR THE YEARS ENDED DECEMBER 31, 2020 AND 2019
39
Note 11 - Intangible Assets Other than Goodwill
Details of intangible assets as of December 31, 2020 and 2019, are as follows:
Gross Balance
Accumulated Amortization
Balance Net
Gross Balance
Accumulated Amortization
Balance Net
ThCLP$ ThCLP$ ThCLP$ ThCLP$ ThCLP$ ThCLP$ 12.31.2020 12.31.2019
Patents, trademarks and other rights 4,577,341 (1,066,736) 3,510,605 8,620,879 (1,201,034) 7,419,845
Computer software 11,703,948 (4,365,631) 7,338,316 8,930,030 (2,913,888) 6,016,142
Other identifiable intangible assets (1) 16,052,918 (13,917,853) 2,135,065 19,569,336 (14,900,266) 4,669,070
Intangible assets 32,334,207 (19,350,220) 12,983,987 37,120,245 (19,015,188) 18,105,057 (1) Mainly amounts arising from business acquisitions related to anchor store contracts, minor store contracts and customer
relations.
a) Details of movements in intangible assets for the years ended December 31, 2020 and 2019, are as follows:
Acquisitions Business Combinations
Total 12.31.2020
ThCLP$
Patents, Trademarks and Other
Rights
Computer Software
Other Identifiable Intangible
Assets
Patents, Trademarks and Other
Rights
Other Identifiable Intangible
Assets Opening balance as of 01.01.2020
2,515,174 6,016,142 34,983 4,904,671 4,634,087 18,105,057
Additions - 3,449,685 - - - 3,449,685
Transfers - 44,402 (44,402) - - -
Amortization (67,563) (1,493,349) (8,121) - (683,072) (2,252,104)
Foreign currency (285,842) (160,614) (6,734) (478,165) (324,681) (1,256,037)
Other (a) (201,529) (517,949) 198,279 (2,876,141) (1,665,275) (5,062,614)
Total changes (554,934) 1,322,175 139,023 (3,354,306) (2,673,028) (5,121,070) Closing balance as of 12.31.2020
1,960,240 7,338,316 174,006 1,550,365 1,961,059 12,983,987
(a) Movements in other, business combinations, consist of asset impairment in Chile of ThCLP$1,273,687 and in Peru of
ThCLP$3,267,729.
Acquisitions Business Combinations
Total 12.31.2019
ThCLP$
Patents, Trademarks and
Other Rights
Computer Software
Other Identifiable Intangible
Assets
Patents, Trademarks and
Other Rights
Other Identifiable Intangible
Assets Opening balance as of 01.01.2019
2,429,050 4,051,750 2,796 4,586,908 5,100,448 16,170,952
Additions 16,104 3,249,749 - - - 3,265,853
Transfers (12,855) (41,210) 41,210 - - (12,855)
Amortization (28,432) (1,307,030) (10,157) - (730,984) (2,076,602)
Foreign currency 111,306 114,018 1,133 317,763 264,622 808,843
Other - (51,136) - - - (51,136)
Total changes 86,124 1,964,392 32,185 317,763 (466,361) 1,934,103 Closing balance as of 12.31.2019 2,515,174 6,016,142 34,983 4,904,671 4,634,087 18,105,057

PARQUE ARAUCO S.A. AND SUBSIDIARIES NOTES TO THE CONSOLIDATED FINANCIAL STATEMENTS
AS OF DECEMBER 31, 2020 AND 2019
AND FOR THE YEARS ENDED DECEMBER 31, 2020 AND 2019
40
Note 12 - Goodwill
Goodwill arises from acquisitions of shares in the companies detailed in the following table as of December 31, 2020 and
2019:
Taxpayer ID No.
Company 12.31.2020 12.31.2019
ThCLP$ ThCLP$
96828400-2
Parque Arauco Internacional S.A. and subsidiaries (1)
969,808 1,495,315
76939541-5 Arauco Centros Comerciales Regionales SpA. 1,762,889 1,762,889
2,732,697 3,258,204
(1) Includes companies in Peru
Details of movements in goodwill for the years ended December 31, 2020 and 2019, are as follows:
Taxpayer ID No.
Company
Opening Balance as of 01.01.2020
Movements During the
Period
Foreign Exchange
Differences
Closing Balance as of
12.31.2020 ThCLP$ ThCLP$ ThCLP$ ThCLP$
20423264617 Inmuebles Panamericana S.A. 1,116,891 - (147,084) 969,808
20502772831 Ekimed S.A.C. (a) 378,424 (328,589) (49,835) -
76231235-2 Bulevar Rentas Inmobiliarias S.A. 1,762,889 - - 1,762,889
Total 3,258,204 (328,589) (196,918) 2,732,697
(a) Movements during the year correspond to goodwill impairment
Taxpayer ID No. Company
Opening Balance as of 01.01.2019
Movements During the
Period
Foreign Exchange
Differences
Closing Balance as of
12.31.2019 ThCLP$ ThCLP$ ThCLP$ ThCLP$
20423264617 Inmuebles Panamericana S.A. 1,019,147 - 97,744 1,116,891
20511910642 Arauco Holding Perú S.A.C. 216,490 (233,307) 16,817 -
20345681460 Altek Trading S.A.C. 969,364 (1,062,333) 92,969 -
20523173716 Parque Lambramani S.A.C. 593,497 (650,418) 56,921 -
20502772831 Ekimed S.A.C. 345,306 - 33,117 378,424
20123537581 Sercenco S.A. 4,033,481 (4,420,320) 386,840 -
76231235-2 Bulevar Rentas Inmobiliarias S.A. 1,762,889 - - 1,762,889
Total 8,940,174 (6,366,378) 684,408 3,258,204

PARQUE ARAUCO S.A. AND SUBSIDIARIES NOTES TO THE CONSOLIDATED FINANCIAL STATEMENTS
AS OF DECEMBER 31, 2020 AND 2019 AND FOR THE YEARS ENDED DECEMBER 31, 2020 AND 2019
41
Note 13 - Property, Plant and Equipment
Balances of property, plant and equipment as of December 31, 2020 and 2019, are as follows:
Gross Balance
Accumulated Depreciation Net Balance Gross Balance
Accumulated Depreciation Net Balance
ThCLP$ ThCLP$ ThCLP$ ThCLP$ ThCLP$ ThCLP$ 12.31.2020 12.31.2019
Buildings 20,443,766 (479,446) 19,964,320 14,778,313 (377,520) 14,400,793
Plant and equipment 2,793,938 (1,708,308) 1,085,630 1,307,655 (1,075,440) 232,215
IT equipment 3,067,505 (1,301,973) 1,765,532 5,362,958 (1,664,591) 3,698,367
Fixtures and accessories 5,204,091 (2,449,476) 2,754,614 4,816,493 (2,115,186) 2,701,307
Motor vehicles 64,100 (56,920) 7,179 68,277 (58,403) 9,874
Other property, plant and equipment 3,465,677 (1,954,469) 1,511,208 3,802,350 (1,924,902) 1,852,448
Property, plant and equipment 35,039,077 (7,950,592) 27,088,483 30,138,046 (7,241,042) 22,895,004
Details of movements in property, plant and equipment for the years ended December 31, 2020 and 2019, respectively, are as follows:
ThCLP$
Buildings Plant and Equipment IT Equipment Fixtures and Accessories Motor Vehicles Other Property, Plant and Equipment
Total Property, Plant and
Equipment Gross Balance Accumulated Depreciation Net Balance Gross
Balance Accumulated Depreciation
Net Balance
Gross Balance
Accumulated Depreciation Net Balance Gross
Balance Accumulated Depreciation
Net Balance
Gross Balance
Accumulated Depreciation
Net Balance Gross Balance Accumulated
Depreciation Net
Balance
Opening balance as of 01.01.2020 14,778,313 (377,521) 14,400,793 1,307,655 (1,075,440) 232,215 5,362,958 (1,664,591) 3,698,367 4,816,493 (2,115,186) 2,701,307 68,277 (58,403) 9,874 3,802,350 (1,949,902) 1,852,448 22,895,004 Additions 6,201,769 - 6,201,769 369,208 - 369,208 587,511 - 587,511 617,441 - 617,441 - - - 128,945 - 128,945 7,904,873 Disposals - - - (834) 834 - - - - - - - - - - 490 - 490 490 Depreciation expense (1) - (138,592) (138,592) - (42,722) (42,722) - (449,254) (449,254) - (418,575) (418,575) - (2,638) (2,638) - (239,219) (239,219) (1,290,999) Increase (decrease) due to changes in exchange rates
(527,794) 36,666 (491,128) (27,408) 14,686 (12,723) (511,597) 245,225 (266,372) (229,843) 84,284 (145,559) (4,177) 4,120 (57) (384,510) 230,246 (154,264) (1,070,101)
Other increases (decreases) (1,350,784) - (1,350,784) - - - - - - - - - (1,350,784) Transfers (8,523) - (8,523) 1,147,410 (607,759) 539,651 (1,020,582) 566,647 (453,935) - - - - - - (81,598) 4,405 (77,193) - Changes in property, plant and equipment, total 5,665,452 (101,926) 5,563,256 1,488,375 (634,962) 853,414 (2,295,453) 362,618 (1,932,835) 387,598 (334,290) 53,307 (4,177) 1,483 (2,695) (336,673) (4,567) (341,240) 4,193,478 Property, plant and equipment 12.31.2020 20,443,766 (479,446) 19,964,320 2,793,938 (1,708,308) 1,085,630 3,067,505 (1,301,973) 1,765,532 5,204,091 (2,449,476) 2,754,614 64,100 (56,920) 7,719 3,465,677 (1,954,469) 1,511,208 27,088,483
ThCLP$
Buildings Plant and Equipment IT Equipment Fixtures and Accessories Motor Vehicles Other Property, Plant and Equipment
Total Property, Plant and
Equipment Gross Balance Accumulated Depreciation Net Balance Gross
Balance Accumulated Depreciation
Net Balance
Gross Balance
Accumulated Depreciation
Net Balance
Gross Balance
Accumulated Depreciation
Net Balance
Gross Balance
Accumulated Depreciation
Net Balance Gross Balance Accumulated
Depreciation Net
Balance
Opening balance as of 01.01.2019 7,065,092 (260,024) 6,805,068 1,533,243 (1,127,581) 405,662 925,894 (753,059) 172,835 5,223,637 (1,729,891) 3,493,746 99,772 (86,643) 13,129 4,691,080 (2,210,563) 2,480,517 13,370,957 Additions 7,726,263 - 7,726,263 54,524 - 54,524 2,806,555 - 2,806,555 564,711 - 564,711 - - - 568,465 - 568,465 11,720,518 Disposals - - - - - - (47,749) 8,240 (39,509) - - - (25,285) 24,178 (1,107) (13,682) 6,976 (6,706) (47,322) Depreciation expense (1) - (106,646) (106,646) - (73,466) (73,466) - (370,836) (370,836) - (430,760) (430,760) - (2,744) (2,744) - (196,541) (196,541) (1,180,993) Increase (decrease) due to changes in exchange rates
392,518 (10,850) 381,668 46,122 (16,095) 30,028 60,921 (46,708) 14,213 258,651 (41,338) 217,313 5,970 (5,960) 10 380,927 (244,386) 136,541 779,773
Other increases (decreases) - - - (321,218) 141,702 (179,516) (533,134) 22,569 (510,565) (303,711) 73,871 (229,840) - - - (830,719) 2,712 (828,012) (1,747,934) Transfers (405,560) - (405,560) (5,016) - (5,016) 2,150,471 (524,797) 1,625,674 (926,795) 12,932 (913,863) (12,180) 12,766 585 (993,721) 691,900 (301,820) - Changes in property, plant and equipment, total 7,713,221 (117,496) 7,595,725 (225,588) 52,141 (173,447) 4,437,064 (911,532) 3,525,532 (407,144) (385,295) (792,439) (31,495) 28,240 (3,255) (888,730) 260,661 (628,069) 9,524,048 Property, plant and equipment 12.31.2019 14,778,313 (377,521) 14,400,793 1,307,655 (1,075,440) 232,215 5,362,958 (1,664,591) 3,698,367 4,816,493 (2,115,186) 2,701,307 68,277 (58,403) 9,874 3,802,350 (1,949,902) 1,852,448 22,895,004
(1) Total depreciation expense is recorded in the statement of income in administrative expenses.
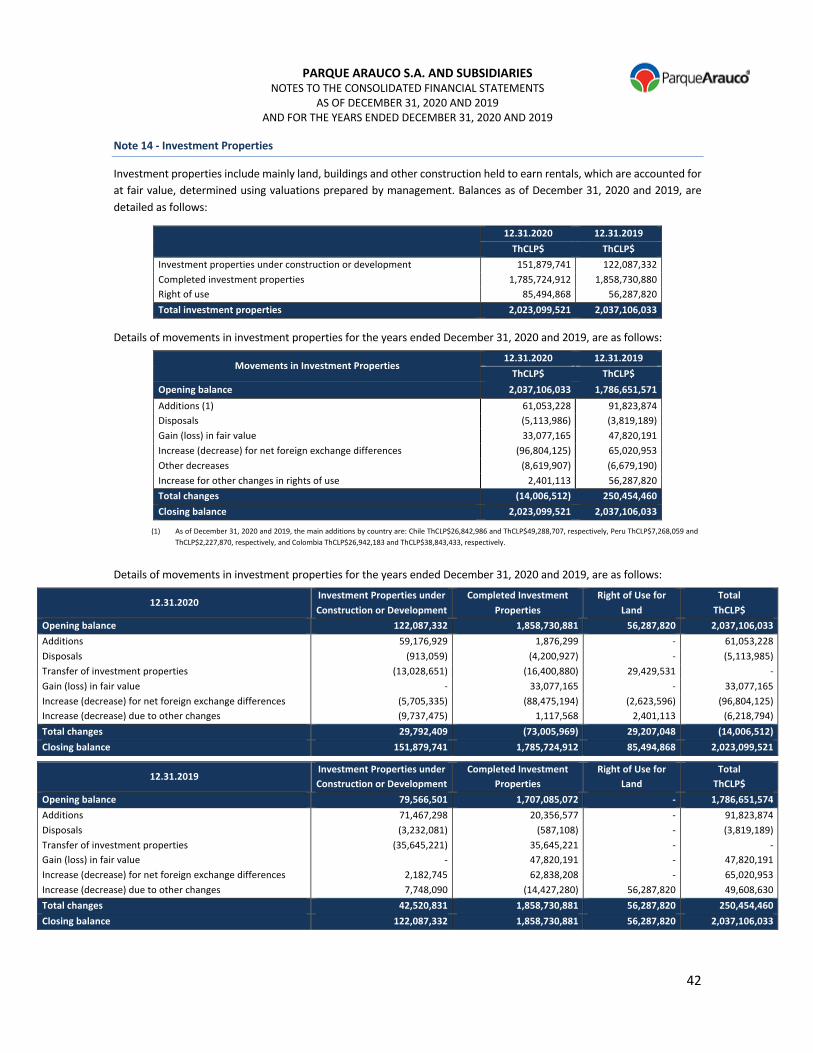
PARQUE ARAUCO S.A. AND SUBSIDIARIES NOTES TO THE CONSOLIDATED FINANCIAL STATEMENTS
AS OF DECEMBER 31, 2020 AND 2019 AND FOR THE YEARS ENDED DECEMBER 31, 2020 AND 2019
42
Note 14 - Investment Properties
Investment properties include mainly land, buildings and other construction held to earn rentals, which are accounted for at fair value, determined using valuations prepared by management. Balances as of December 31, 2020 and 2019, are detailed as follows:
12.31.2020 12.31.2019
ThCLP$ ThCLP$
Investment properties under construction or development 151,879,741 122,087,332 Completed investment properties 1,785,724,912 1,858,730,880 Right of use 85,494,868 56,287,820 Total investment properties 2,023,099,521 2,037,106,033
Details of movements in investment properties for the years ended December 31, 2020 and 2019, are as follows:
Movements in Investment Properties 12.31.2020 12.31.2019
ThCLP$ ThCLP$
Opening balance 2,037,106,033 1,786,651,571 Additions (1) 61,053,228 91,823,874 Disposals (5,113,986) (3,819,189) Gain (loss) in fair value 33,077,165 47,820,191 Increase (decrease) for net foreign exchange differences (96,804,125) 65,020,953 Other decreases (8,619,907) (6,679,190) Increase for other changes in rights of use 2,401,113 56,287,820 Total changes (14,006,512) 250,454,460
Closing balance 2,023,099,521 2,037,106,033
(1) As of December 31, 2020 and 2019, the main additions by country are: Chile ThCLP$26,842,986 and ThCLP$49,288,707, respectively, Peru ThCLP$7,268,059 and
ThCLP$2,227,870, respectively, and Colombia ThCLP$26,942,183 and ThCLP$38,843,433, respectively.
Details of movements in investment properties for the years ended December 31, 2020 and 2019, are as follows:
12.31.2020 Investment Properties under
Construction or Development
Completed Investment
Properties
Right of Use for
Land
Total
ThCLP$ Opening balance 122,087,332 1,858,730,881 56,287,820 2,037,106,033
Additions 59,176,929 1,876,299 - 61,053,228 Disposals (913,059) (4,200,927) - (5,113,985) Transfer of investment properties (13,028,651) (16,400,880) 29,429,531 - Gain (loss) in fair value - 33,077,165 - 33,077,165 Increase (decrease) for net foreign exchange differences (5,705,335) (88,475,194) (2,623,596) (96,804,125) Increase (decrease) due to other changes (9,737,475) 1,117,568 2,401,113 (6,218,794) Total changes 29,792,409 (73,005,969) 29,207,048 (14,006,512)
Closing balance 151,879,741 1,785,724,912 85,494,868 2,023,099,521
12.31.2019 Investment Properties under
Construction or Development
Completed Investment
Properties
Right of Use for
Land
Total
ThCLP$ Opening balance 79,566,501 1,707,085,072 - 1,786,651,574
Additions 71,467,298 20,356,577 - 91,823,874 Disposals (3,232,081) (587,108) - (3,819,189) Transfer of investment properties (35,645,221) 35,645,221 - - Gain (loss) in fair value - 47,820,191 - 47,820,191 Increase (decrease) for net foreign exchange differences 2,182,745 62,838,208 - 65,020,953 Increase (decrease) due to other changes 7,748,090 (14,427,280) 56,287,820 49,608,630 Total changes 42,520,831 1,858,730,881 56,287,820 250,454,460
Closing balance 122,087,332 1,858,730,881 56,287,820 2,037,106,033
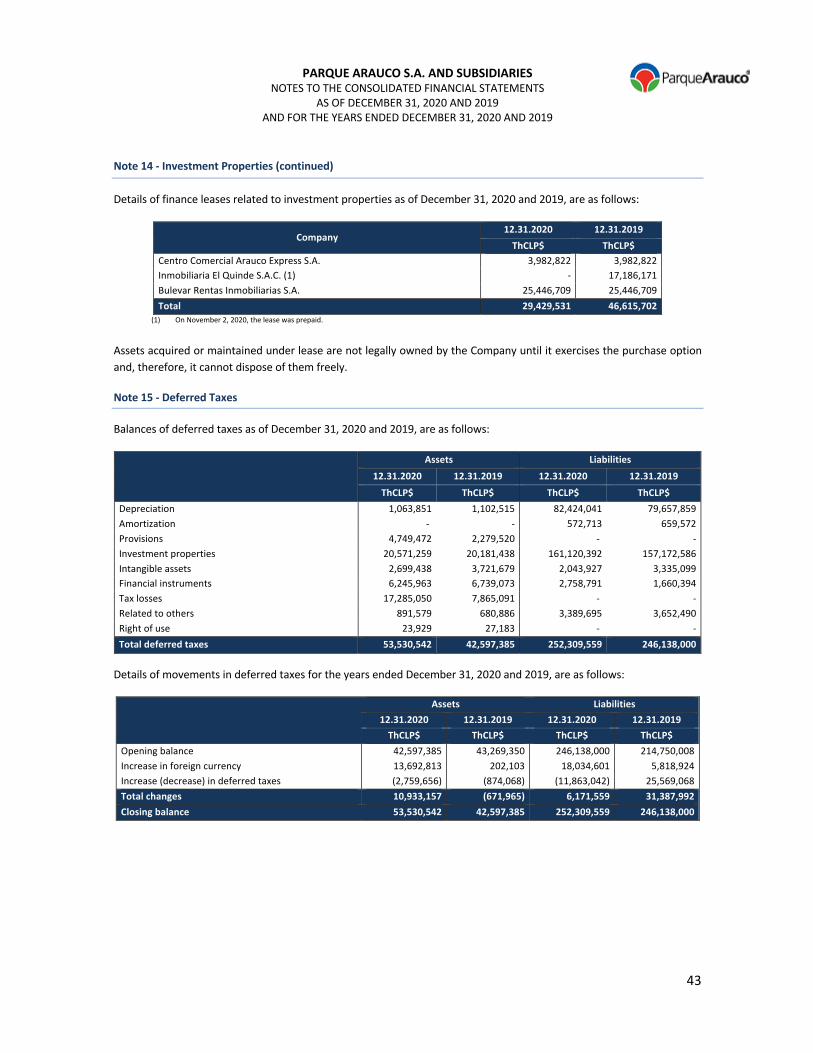
PARQUE ARAUCO S.A. AND SUBSIDIARIES NOTES TO THE CONSOLIDATED FINANCIAL STATEMENTS
AS OF DECEMBER 31, 2020 AND 2019 AND FOR THE YEARS ENDED DECEMBER 31, 2020 AND 2019
43
Note 14 - Investment Properties (continued)
Details of finance leases related to investment properties as of December 31, 2020 and 2019, are as follows:
Company 12.31.2020 12.31.2019
ThCLP$ ThCLP$
Centro Comercial Arauco Express S.A. 3,982,822 3,982,822 Inmobiliaria El Quinde S.A.C. (1) - 17,186,171 Bulevar Rentas Inmobiliarias S.A. 25,446,709 25,446,709 Total 29,429,531 46,615,702
(1) On November 2, 2020, the lease was prepaid.
Assets acquired or maintained under lease are not legally owned by the Company until it exercises the purchase option and, therefore, it cannot dispose of them freely.
Note 15 - Deferred Taxes Balances of deferred taxes as of December 31, 2020 and 2019, are as follows:
Assets Liabilities
12.31.2020 12.31.2019 12.31.2020 12.31.2019
ThCLP$ ThCLP$ ThCLP$ ThCLP$
Depreciation 1,063,851 1,102,515 82,424,041 79,657,859 Amortization - - 572,713 659,572 Provisions 4,749,472 2,279,520 - - Investment properties 20,571,259 20,181,438 161,120,392 157,172,586 Intangible assets 2,699,438 3,721,679 2,043,927 3,335,099 Financial instruments 6,245,963 6,739,073 2,758,791 1,660,394 Tax losses 17,285,050 7,865,091 - - Related to others 891,579 680,886 3,389,695 3,652,490 Right of use 23,929 27,183 - - Total deferred taxes 53,530,542 42,597,385 252,309,559 246,138,000
Details of movements in deferred taxes for the years ended December 31, 2020 and 2019, are as follows:
Assets Liabilities
12.31.2020 12.31.2019 12.31.2020 12.31.2019
ThCLP$ ThCLP$ ThCLP$ ThCLP$
Opening balance 42,597,385 43,269,350 246,138,000 214,750,008 Increase in foreign currency 13,692,813 202,103 18,034,601 5,818,924 Increase (decrease) in deferred taxes (2,759,656) (874,068) (11,863,042) 25,569,068 Total changes 10,933,157 (671,965) 6,171,559 31,387,992
Closing balance 53,530,542 42,597,385 252,309,559 246,138,000
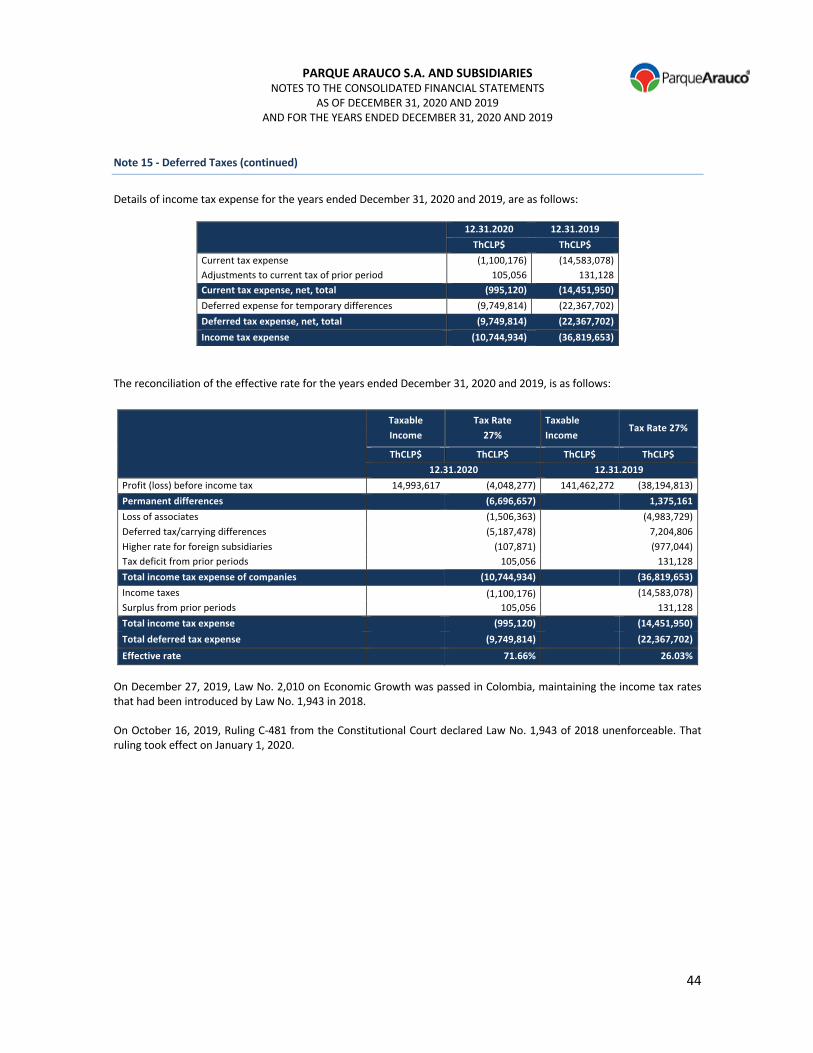
PARQUE ARAUCO S.A. AND SUBSIDIARIES NOTES TO THE CONSOLIDATED FINANCIAL STATEMENTS
AS OF DECEMBER 31, 2020 AND 2019 AND FOR THE YEARS ENDED DECEMBER 31, 2020 AND 2019
44
Note 15 - Deferred Taxes (continued) Details of income tax expense for the years ended December 31, 2020 and 2019, are as follows:
The reconciliation of the effective rate for the years ended December 31, 2020 and 2019, is as follows:
Taxable
Income
Tax Rate
27%
Taxable
Income Tax Rate 27%
ThCLP$ ThCLP$ ThCLP$ ThCLP$
12.31.2020 12.31.2019
Profit (loss) before income tax 14,993,617 (4,048,277) 141,462,272 (38,194,813) Permanent differences (6,696,657) 1,375,161
Loss of associates (1,506,363) (4,983,729) Deferred tax/carrying differences (5,187,478) 7,204,806 Higher rate for foreign subsidiaries (107,871) (977,044) Tax deficit from prior periods 105,056 131,128 Total income tax expense of companies (10,744,934) (36,819,653)
Income taxes (1,100,176) (14,583,078) Surplus from prior periods 105,056 131,128 Total income tax expense (995,120) (14,451,950)
Total deferred tax expense (9,749,814) (22,367,702)
Effective rate 71.66% 26.03%
On December 27, 2019, Law No. 2,010 on Economic Growth was passed in Colombia, maintaining the income tax rates that had been introduced by Law No. 1,943 in 2018. On October 16, 2019, Ruling C-481 from the Constitutional Court declared Law No. 1,943 of 2018 unenforceable. That ruling took effect on January 1, 2020.
12.31.2020 12.31.2019
ThCLP$ ThCLP$
Current tax expense (1,100,176) (14,583,078) Adjustments to current tax of prior period 105,056 131,128 Current tax expense, net, total (995,120) (14,451,950)
Deferred expense for temporary differences (9,749,814) (22,367,702) Deferred tax expense, net, total (9,749,814) (22,367,702)
Income tax expense (10,744,934) (36,819,653)

PARQUE ARAUCO S.A. AND SUBSIDIARIES NOTES TO THE CONSOLIDATED FINANCIAL STATEMENTS
AS OF DECEMBER 31, 2020 AND 2019 AND FOR THE YEARS ENDED DECEMBER 31, 2020 AND 2019
45
Note 16 - Other Financial Liabilities
Details of current and non-current other financial liabilities as of December 31, 2020 and 2019, are as follows:
Current Non-Current ThCLP$ ThCLP$
12.31.2020 12.31.2019 12.31.2020 12.31.2019 Bank loans (a) 23,782,209 147,645,596 428,031,927 280,420,062 Bond issuance (b) 30,007,133 85,510,271 727,399,785 566,264,610 Hedge liabilities (Note 37) 591,691 200,800 9,039,120 1,519,131 Total 54,381,033 233,356,667 1,164,470,833 848,203,803
a) Bank loans
Details of current loans as of December 31, 2020, by currency and maturity, are as follows:
12.31.2020
Debtor
Taxpayer ID
Debtor Name Debtor
Country
Creditor
Taxpayer ID Bank Currency Amortization
Financial
Covenant
Contractual
Rate %
Annual
Effective
Rate %
Balance in
Statement
of Financial
Position
Current
Maturity in ThCLP$ (Undiscounted Cash Flows)
Up to 90 Days Over 90 Days
up to 1 Year
Total Cash Flows
76187012-2 Arauco Express S.A. Chile 97023000-9 ITAU UF Bullet Yes 2.43% 2.68% 132,926 316,179 317,917 634,096 76187012-2 Arauco Express S.A. Chile 97023000-9 ITAU UF Bullet Yes 2.43% 3.24% 29,848 255,227 256,629 511,856 76263221-7 Centro Comercial Arauco Express Ciudad Empresarial S.A. Chile 97.018.000-1 Scotiabank UF Bullet Yes 2.20% 2.52% 638,829 - 653,813 653,813 94627000-8 Parque Arauco S.A. Chile 97030000-7 Estado UF Bullet Yes 3.96% 3.70% - - 1,753,089 1,753,089 94627000-8 Parque Arauco S.A. Chile 97030000-7 Estado UF Bullet Yes 2.44% 3.23% 3,718 - 191,783 191,783 94627000-8 Parque Arauco S.A. Chile 97030000-7 Estado UF(*) Bullet Yes 3.70% 3.85% - 265,102 810,035 1,075,137 94627000-8 Parque Arauco S.A. Chile 97004000-5 Banco de Chile UF(*) Bullet Yes -0.23% -0.02% - 94,027 233,738 327,765 94627000-8 Parque Arauco S.A. Chile 97.080.000-K BICE CLP$ Bullet Yes 3.20% 3.46% 43,891 - 324,444 324,444 94627000-8 Parque Arauco S.A. Chile 76.645.030-K ITAU CLP$ Bullet Yes 4.65% 4.65% 23,250 232,500 710,417 942,917 76111950-8 Desarrollo Inmobiliario S.A. Chile 97030000-7 BICE UF Bullet No 2.14% 2.56% 40,714 1,649,605 1,676,946 3,326,551 86339000-1 Plaza Estación S.A. Chile 97.006.000-K BCI UF(*) Semi-annual Yes 3.98% 4.20% 1,402,245 5,325 1,431,723 1,437,048 76.455.843-K Parque Angamos SpA Chile 97004000-5 Banco de Chile UF Bullet Yes 2.05% 2.32% 10,601,413 - 10,804,985 10,804,985 76939541-5 Arauco Centros Comerciales Regionales SpA Chile 97.018.000-1 Scotiabank CLP(*) Bullet Yes 5.20% 5.26% 487,232 603,235 593,399 1,196,634 76939541-5 Arauco Centros Comerciales Regionales SpA Chile 97.018.000-1 Scotiabank CLP(*) Bullet Yes 5.19% 5.46% 14,555 19,917 19,592 39,509 76939551-2 Arauco Chillán Chile 97.018.000-1 Scotiabank CLP(*) Bullet Yes 4.98% 5.04% 103,279 - 702,116 702,116 96671020-9 Todo Arauco Chile 97.018.000-1 Scotiabank CLP$ Bullet Yes 4.10% 4.23% 288,592 390,700 375,996 766,695 20511910642 Arauco Holding Perú S.A.C. Peru 20100047218 Crédito del Perú PEN Bullet No 2.80% 2.80% 9,971,717 584,601 10,594,718 11,179,319 830.054.539-0
Fideicomiso PA Alegra Barranquilla Colombia 860051705-2 Scotiabank COP Bullet No 5.79% 5.79% - - 2,681,370 2,681,370
Total 23,782,209 4,416,417 34,132,711 38,549,129
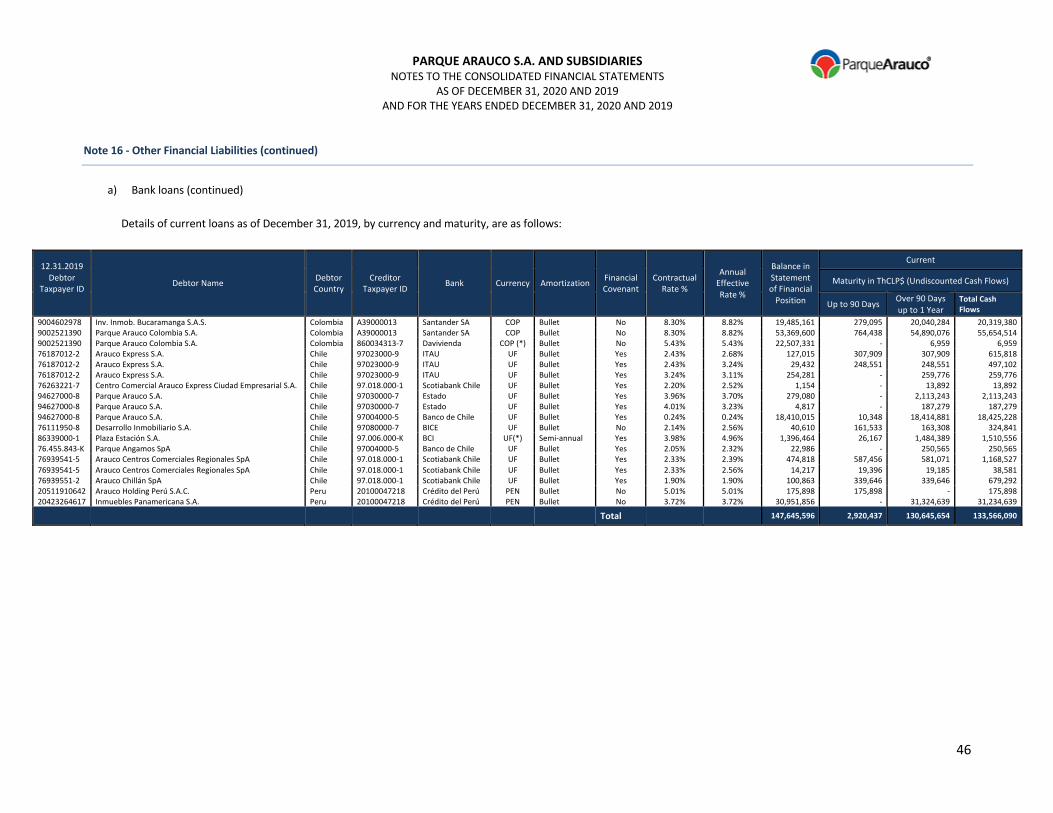
PARQUE ARAUCO S.A. AND SUBSIDIARIES NOTES TO THE CONSOLIDATED FINANCIAL STATEMENTS
AS OF DECEMBER 31, 2020 AND 2019 AND FOR THE YEARS ENDED DECEMBER 31, 2020 AND 2019
46
Note 16 - Other Financial Liabilities (continued)
a) Bank loans (continued)
Details of current loans as of December 31, 2019, by currency and maturity, are as follows:
12.31.2019
Debtor
Taxpayer ID
Debtor Name Debtor
Country
Creditor
Taxpayer ID Bank Currency Amortization
Financial
Covenant
Contractual
Rate %
Annual
Effective
Rate %
Balance in
Statement
of Financial
Position
Current
Maturity in ThCLP$ (Undiscounted Cash Flows)
Up to 90 Days Over 90 Days
up to 1 Year
Total Cash Flows
9004602978 Inv. Inmob. Bucaramanga S.A.S. Colombia A39000013 Santander SA COP Bullet No 8.30% 8.82% 19,485,161 279,095 20,040,284 20,319,380 9002521390 Parque Arauco Colombia S.A. Colombia A39000013 Santander SA COP Bullet No 8.30% 8.82% 53,369,600 764,438 54,890,076 55,654,514 9002521390 Parque Arauco Colombia S.A. Colombia 860034313-7 Davivienda COP (*) Bullet No 5.43% 5.43% 22,507,331 - 6,959 6,959 76187012-2 Arauco Express S.A. Chile 97023000-9 ITAU UF Bullet Yes 2.43% 2.68% 127,015 307,909 307,909 615,818 76187012-2 Arauco Express S.A. Chile 97023000-9 ITAU UF Bullet Yes 2.43% 3.24% 29,432 248,551 248,551 497,102 76187012-2 Arauco Express S.A. Chile 97023000-9 ITAU UF Bullet Yes 3.24% 3.11% 254,281 - 259,776 259,776 76263221-7 Centro Comercial Arauco Express Ciudad Empresarial S.A. Chile 97.018.000-1 Scotiabank Chile UF Bullet Yes 2.20% 2.52% 1,154 - 13,892 13,892 94627000-8 Parque Arauco S.A. Chile 97030000-7 Estado UF Bullet Yes 3.96% 3.70% 279,080 - 2,113,243 2,113,243 94627000-8 Parque Arauco S.A. Chile 97030000-7 Estado UF Bullet Yes 4.01% 3.23% 4,817 - 187,279 187,279 94627000-8 Parque Arauco S.A. Chile 97004000-5 Banco de Chile UF Bullet Yes 0.24% 0.24% 18,410,015 10,348 18,414,881 18,425,228 76111950-8 Desarrollo Inmobiliario S.A. Chile 97080000-7 BICE UF Bullet No 2.14% 2.56% 40,610 161,533 163,308 324,841 86339000-1 Plaza Estación S.A. Chile 97.006.000-K BCI UF(*) Semi-annual Yes 3.98% 4.96% 1,396,464 26,167 1,484,389 1,510,556 76.455.843-K Parque Angamos SpA Chile 97004000-5 Banco de Chile UF Bullet Yes 2.05% 2.32% 22,986 - 250,565 250,565 76939541-5 Arauco Centros Comerciales Regionales SpA Chile 97.018.000-1 Scotiabank Chile UF Bullet Yes 2.33% 2.39% 474,818 587,456 581,071 1,168,527 76939541-5 Arauco Centros Comerciales Regionales SpA Chile 97.018.000-1 Scotiabank Chile UF Bullet Yes 2.33% 2.56% 14,217 19,396 19,185 38,581 76939551-2 Arauco Chillán SpA Chile 97.018.000-1 Scotiabank Chile UF Bullet Yes 1.90% 1.90% 100,863 339,646 339,646 679,292 20511910642 Arauco Holding Perú S.A.C. Peru 20100047218 Crédito del Perú PEN Bullet No 5.01% 5.01% 175,898 175,898 - 175,898 20423264617 Inmuebles Panamericana S.A. Peru 20100047218 Crédito del Perú PEN Bullet No 3.72% 3.72% 30,951,856 - 31,324,639 31,234,639
Total 147,645,596 2,920,437 130,645,654 133,566,090
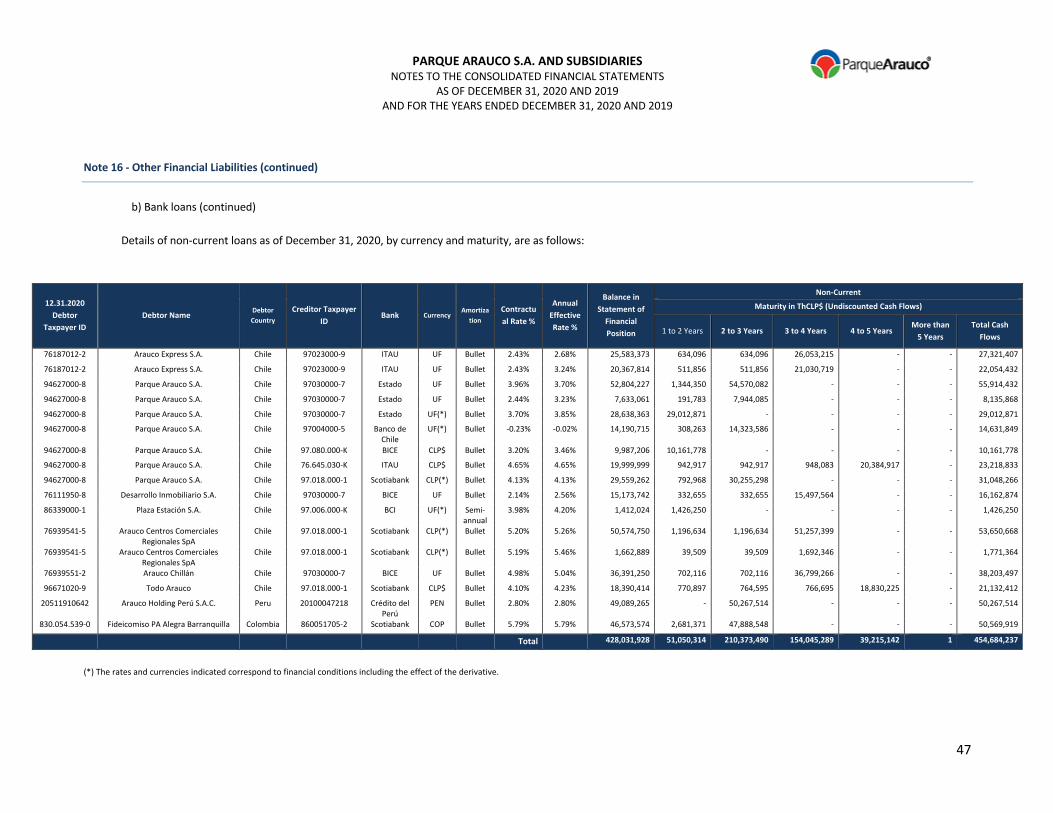
PARQUE ARAUCO S.A. AND SUBSIDIARIES NOTES TO THE CONSOLIDATED FINANCIAL STATEMENTS
AS OF DECEMBER 31, 2020 AND 2019 AND FOR THE YEARS ENDED DECEMBER 31, 2020 AND 2019
47
Note 16 - Other Financial Liabilities (continued)
b) Bank loans (continued)
Details of non-current loans as of December 31, 2020, by currency and maturity, are as follows:
12.31.2020
Debtor
Taxpayer ID
Debtor Name Debtor Country
Creditor Taxpayer
ID Bank Currency
Amortization
Contractu
al Rate %
Annual
Effective
Rate %
Balance in
Statement of
Financial
Position
Non-Current
Maturity in ThCLP$ (Undiscounted Cash Flows)
1 to 2 Years 2 to 3 Years 3 to 4 Years 4 to 5 Years More than
5 Years
Total Cash
Flows
76187012-2 Arauco Express S.A. Chile 97023000-9 ITAU UF Bullet 2.43% 2.68% 25,583,373 634,096 634,096 26,053,215 - - 27,321,407
76187012-2 Arauco Express S.A. Chile 97023000-9 ITAU UF Bullet 2.43% 3.24% 20,367,814 511,856 511,856 21,030,719 - - 22,054,432
94627000-8 Parque Arauco S.A. Chile 97030000-7 Estado UF Bullet 3.96% 3.70% 52,804,227 1,344,350 54,570,082 - - - 55,914,432
94627000-8 Parque Arauco S.A. Chile 97030000-7 Estado UF Bullet 2.44% 3.23% 7,633,061 191,783 7,944,085 - - - 8,135,868
94627000-8 Parque Arauco S.A. Chile 97030000-7 Estado UF(*) Bullet 3.70% 3.85% 28,638,363 29,012,871 - - - - 29,012,871
94627000-8 Parque Arauco S.A. Chile 97004000-5 Banco de Chile
UF(*) Bullet -0.23% -0.02% 14,190,715 308,263 14,323,586 - - - 14,631,849
94627000-8 Parque Arauco S.A. Chile 97.080.000-K BICE CLP$ Bullet 3.20% 3.46% 9,987,206 10,161,778 - - - - 10,161,778
94627000-8 Parque Arauco S.A. Chile 76.645.030-K ITAU CLP$ Bullet 4.65% 4.65% 19,999,999 942,917 942,917 948,083 20,384,917 - 23,218,833
94627000-8 Parque Arauco S.A. Chile 97.018.000-1 Scotiabank CLP(*) Bullet 4.13% 4.13% 29,559,262 792,968 30,255,298 - - - 31,048,266
76111950-8 Desarrollo Inmobiliario S.A. Chile 97030000-7 BICE UF Bullet 2.14% 2.56% 15,173,742 332,655 332,655 15,497,564 - - 16,162,874
86339000-1 Plaza Estación S.A. Chile 97.006.000-K BCI UF(*) Semi-annual
3.98% 4.20% 1,412,024 1,426,250 - - - - 1,426,250
76939541-5 Arauco Centros Comerciales Regionales SpA
Chile 97.018.000-1 Scotiabank CLP(*) Bullet 5.20% 5.26% 50,574,750 1,196,634 1,196,634 51,257,399 - - 53,650,668
76939541-5 Arauco Centros Comerciales Regionales SpA
Chile 97.018.000-1 Scotiabank CLP(*) Bullet 5.19% 5.46% 1,662,889 39,509 39,509 1,692,346 - - 1,771,364
76939551-2 Arauco Chillán Chile 97030000-7 BICE UF Bullet 4.98% 5.04% 36,391,250 702,116 702,116 36,799,266 - - 38,203,497
96671020-9 Todo Arauco Chile 97.018.000-1 Scotiabank CLP$ Bullet 4.10% 4.23% 18,390,414 770,897 764,595 766,695 18,830,225 - 21,132,412
20511910642 Arauco Holding Perú S.A.C. Peru 20100047218 Crédito del Perú
PEN Bullet 2.80% 2.80% 49,089,265 - 50,267,514 - - - 50,267,514
830.054.539-0 Fideicomiso PA Alegra Barranquilla Colombia 860051705-2 Scotiabank COP Bullet 5.79% 5.79% 46,573,574 2,681,371 47,888,548 - - - 50,569,919
Total 428,031,928 51,050,314 210,373,490 154,045,289 39,215,142 1 454,684,237
(*) The rates and currencies indicated correspond to financial conditions including the effect of the derivative.

PARQUE ARAUCO S.A. AND SUBSIDIARIES NOTES TO THE CONSOLIDATED FINANCIAL STATEMENTS
AS OF DECEMBER 31, 2020 AND 2019 AND FOR THE YEARS ENDED DECEMBER 31, 2020 AND 2019
48
Note 16 - Other Financial Liabilities (continued)
b) Bank loans (continued)
Details of non-current loans as of December 31, 2019, by currency and maturity, are as follows:
12.31.2019
Debtor
Taxpayer ID
Debtor Name Debtor Country
Creditor
Taxpayer ID Bank Currency Amortization
Contractu
al Rate %
Annual
Effective
Rate %
Balance in
Statement of
Financial
Position
Non-Current
Maturity in ThCLP$ (Undiscounted Cash Flows)
1 to 2 Years 2 to 3 Years 3 to 4 Years 4 to 5 Years More than
5 Years
Total Cash
Flows
76187012-2 Arauco Express S.A. Chile 97023000-9 ITAU UF Bullet 2.43% 2.68% 24,857,067 617,510 617,510 617,510 25,371,743 - 27,224,274
76187012-2 Arauco Express S.A. Chile 97023000-9 ITAU UF Bullet 2.43% 3.24% 19,685,009 498,468 498,468 498,468 20,480,621 - 21,976,024
76263221-7 Centro Comercial Arauco
Express Ciudad Empresarial S.A. Chile 97.018.000-1
Scotiabank Chile
UF Bullet 2.20% 2.52% 618,963 636,711 - - - - 636,711
94627000-8 Parque Arauco S.A. Chile 97030000-7 Estado UF Bullet 3.96% 3.70% 51,322,860 1,707,234 1,309,186 53,142,698 - - 56,159,117
94627000-8 Parque Arauco S.A. Chile 97030000-7 Estado UF Bullet 4.01% 3.23% 7,378,112 186,767 186,767 7,736,292 - - 8,109,826
76111950-8 Desarrollo Inmobiliario S.A. Chile 97080000-7 BICE UF Bullet 2.14% 2.56% 14,718,009 323,954 323,954 323,954 15,092,196 - 16,064,057
86339000-1 Plaza Estación S.A. Chile 97.006.000-K BCI UF(*) Semi-annual 3.98% 4.96% 2,810,422 1,475,284 1,440,299 - - - 2,915,582
76.455.843-K Parque Angamos SpA Chile 97004000-5 Banco de
Chile UF Bullet 2.05% 2.32% 12,055,379 12,339,597 - - - - 12,339,597
76939541-5 Arauco Centros Comerciales
Regionales SpA Chile 97.018.000-1
Scotiabank Chile
UF Bullet 2.33% 2.39% 49,222,268 1,165,334 1,165,334 1,165,334 49,916,664 - 53,412,666
76939541-5 Arauco Centros Comerciales
Regionales SpA Chile 97.018.000-1
Scotiabank Chile
UF Bullet 2.33% 2.56% 1,615,847 38,475 38,475 38,475 1,648,080 - 1,763,506
76939551-2 Arauco Chillán Chile 97.018.000-1 Scotiabank
Chile UF Bullet 1.90% 1.90% 35,418,311 683,751 683,751 683,751 35,836,711 - 37,887,962
20511910642 Arauco Holding Perú S.A.C. Peru 20100047218 Crédito del
Perú PEN Bullet 5.01% 5.01% 60,717,815 60,932,566 - - - - 60,932,566
Total 280,420,062 80,605,651 6,263,743 64,206,481 148,346,014 - 299,421,889
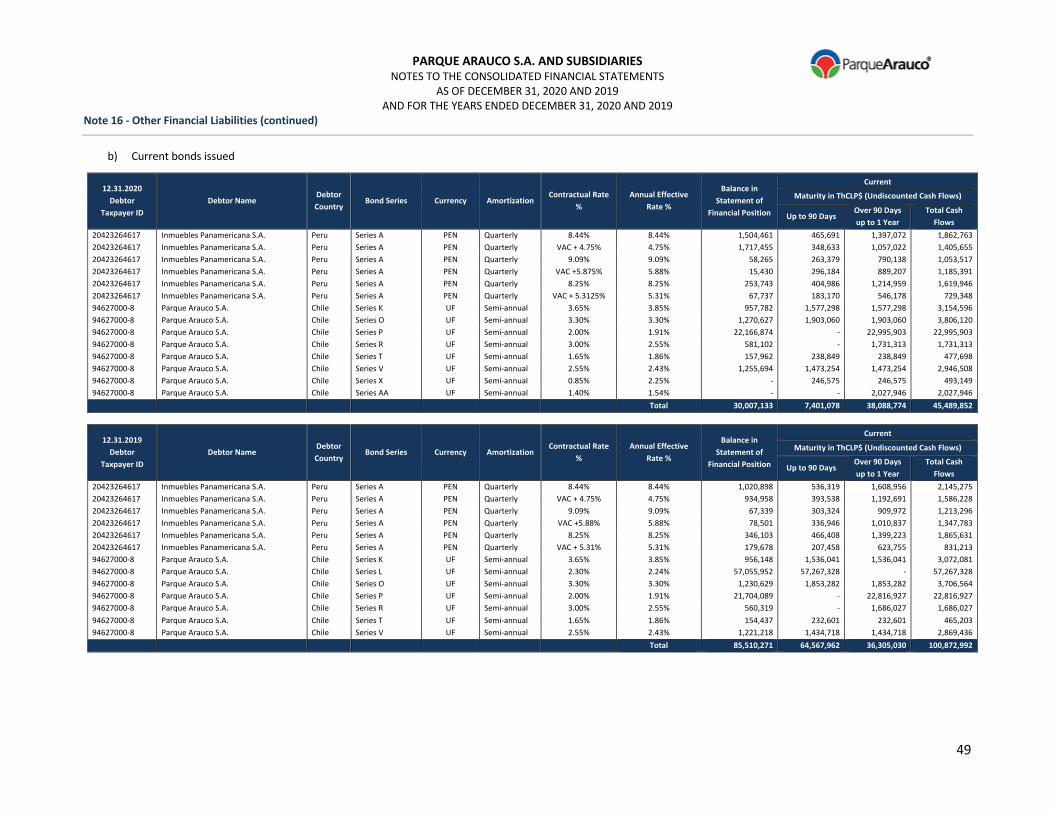
PARQUE ARAUCO S.A. AND SUBSIDIARIES NOTES TO THE CONSOLIDATED FINANCIAL STATEMENTS
AS OF DECEMBER 31, 2020 AND 2019 AND FOR THE YEARS ENDED DECEMBER 31, 2020 AND 2019
49
Note 16 - Other Financial Liabilities (continued)
b) Current bonds issued
12.31.2020
Debtor
Taxpayer ID
Debtor Name Debtor
Country Bond Series Currency Amortization
Contractual Rate
%
Annual Effective
Rate %
Balance in
Statement of
Financial Position
Current
Maturity in ThCLP$ (Undiscounted Cash Flows)
Up to 90 Days Over 90 Days
up to 1 Year
Total Cash
Flows
20423264617 Inmuebles Panamericana S.A. Peru Series A PEN Quarterly 8.44% 8.44% 1,504,461 465,691 1,397,072 1,862,763 20423264617 Inmuebles Panamericana S.A. Peru Series A PEN Quarterly VAC + 4.75% 4.75% 1,717,455 348,633 1,057,022 1,405,655 20423264617 Inmuebles Panamericana S.A. Peru Series A PEN Quarterly 9.09% 9.09% 58,265 263,379 790,138 1,053,517 20423264617 Inmuebles Panamericana S.A. Peru Series A PEN Quarterly VAC +5.875% 5.88% 15,430 296,184 889,207 1,185,391 20423264617 Inmuebles Panamericana S.A. Peru Series A PEN Quarterly 8.25% 8.25% 253,743 404,986 1,214,959 1,619,946 20423264617 Inmuebles Panamericana S.A. Peru Series A PEN Quarterly VAC + 5.3125% 5.31% 67,737 183,170 546,178 729,348 94627000-8 Parque Arauco S.A. Chile Series K UF Semi-annual 3.65% 3.85% 957,782 1,577,298 1,577,298 3,154,596 94627000-8 Parque Arauco S.A. Chile Series O UF Semi-annual 3.30% 3.30% 1,270,627 1,903,060 1,903,060 3,806,120 94627000-8 Parque Arauco S.A. Chile Series P UF Semi-annual 2.00% 1.91% 22,166,874 - 22,995,903 22,995,903 94627000-8 Parque Arauco S.A. Chile Series R UF Semi-annual 3.00% 2.55% 581,102 - 1,731,313 1,731,313 94627000-8 Parque Arauco S.A. Chile Series T UF Semi-annual 1.65% 1.86% 157,962 238,849 238,849 477,698 94627000-8 Parque Arauco S.A. Chile Series V UF Semi-annual 2.55% 2.43% 1,255,694 1,473,254 1,473,254 2,946,508 94627000-8 Parque Arauco S.A. Chile Series X UF Semi-annual 0.85% 2.25% - 246,575 246,575 493,149 94627000-8 Parque Arauco S.A. Chile Series AA UF Semi-annual 1.40% 1.54% - - 2,027,946 2,027,946
Total 30,007,133 7,401,078 38,088,774 45,489,852
12.31.2019
Debtor
Taxpayer ID
Debtor Name Debtor
Country Bond Series Currency Amortization
Contractual Rate
%
Annual Effective
Rate %
Balance in
Statement of
Financial Position
Current
Maturity in ThCLP$ (Undiscounted Cash Flows)
Up to 90 Days Over 90 Days
up to 1 Year
Total Cash
Flows
20423264617 Inmuebles Panamericana S.A. Peru Series A PEN Quarterly 8.44% 8.44% 1,020,898 536,319 1,608,956 2,145,275 20423264617 Inmuebles Panamericana S.A. Peru Series A PEN Quarterly VAC + 4.75% 4.75% 934,958 393,538 1,192,691 1,586,228 20423264617 Inmuebles Panamericana S.A. Peru Series A PEN Quarterly 9.09% 9.09% 67,339 303,324 909,972 1,213,296 20423264617 Inmuebles Panamericana S.A. Peru Series A PEN Quarterly VAC +5.88% 5.88% 78,501 336,946 1,010,837 1,347,783 20423264617 Inmuebles Panamericana S.A. Peru Series A PEN Quarterly 8.25% 8.25% 346,103 466,408 1,399,223 1,865,631 20423264617 Inmuebles Panamericana S.A. Peru Series A PEN Quarterly VAC + 5.31% 5.31% 179,678 207,458 623,755 831,213 94627000-8 Parque Arauco S.A. Chile Series K UF Semi-annual 3.65% 3.85% 956,148 1,536,041 1,536,041 3,072,081 94627000-8 Parque Arauco S.A. Chile Series L UF Semi-annual 2.30% 2.24% 57,055,952 57,267,328 - 57,267,328 94627000-8 Parque Arauco S.A. Chile Series O UF Semi-annual 3.30% 3.30% 1,230,629 1,853,282 1,853,282 3,706,564 94627000-8 Parque Arauco S.A. Chile Series P UF Semi-annual 2.00% 1.91% 21,704,089 - 22,816,927 22,816,927 94627000-8 Parque Arauco S.A. Chile Series R UF Semi-annual 3.00% 2.55% 560,319 - 1,686,027 1,686,027 94627000-8 Parque Arauco S.A. Chile Series T UF Semi-annual 1.65% 1.86% 154,437 232,601 232,601 465,203 94627000-8 Parque Arauco S.A. Chile Series V UF Semi-annual 2.55% 2.43% 1,221,218 1,434,718 1,434,718 2,869,436
Total 85,510,271 64,567,962 36,305,030 100,872,992
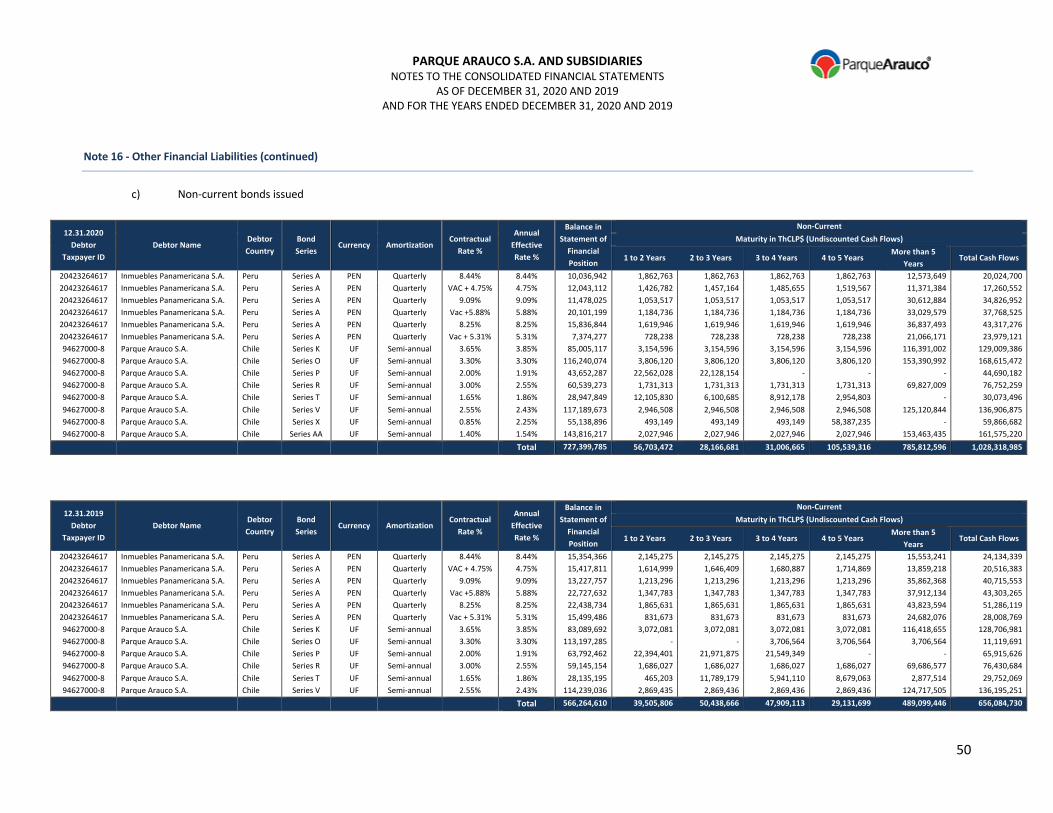
PARQUE ARAUCO S.A. AND SUBSIDIARIES NOTES TO THE CONSOLIDATED FINANCIAL STATEMENTS
AS OF DECEMBER 31, 2020 AND 2019 AND FOR THE YEARS ENDED DECEMBER 31, 2020 AND 2019
50
Note 16 - Other Financial Liabilities (continued)
c) Non-current bonds issued
12.31.2020
Debtor
Taxpayer ID
Debtor Name Debtor
Country
Bond
Series Currency Amortization
Contractual
Rate %
Annual
Effective
Rate %
Balance in
Statement of
Financial
Position
Non-Current
Maturity in ThCLP$ (Undiscounted Cash Flows)
1 to 2 Years 2 to 3 Years 3 to 4 Years 4 to 5 Years More than 5
Years Total Cash Flows
20423264617 Inmuebles Panamericana S.A. Peru Series A PEN Quarterly 8.44% 8.44% 10,036,942 1,862,763 1,862,763 1,862,763 1,862,763 12,573,649 20,024,700 20423264617 Inmuebles Panamericana S.A. Peru Series A PEN Quarterly VAC + 4.75% 4.75% 12,043,112 1,426,782 1,457,164 1,485,655 1,519,567 11,371,384 17,260,552 20423264617 Inmuebles Panamericana S.A. Peru Series A PEN Quarterly 9.09% 9.09% 11,478,025 1,053,517 1,053,517 1,053,517 1,053,517 30,612,884 34,826,952 20423264617 Inmuebles Panamericana S.A. Peru Series A PEN Quarterly Vac +5.88% 5.88% 20,101,199 1,184,736 1,184,736 1,184,736 1,184,736 33,029,579 37,768,525 20423264617 Inmuebles Panamericana S.A. Peru Series A PEN Quarterly 8.25% 8.25% 15,836,844 1,619,946 1,619,946 1,619,946 1,619,946 36,837,493 43,317,276 20423264617 Inmuebles Panamericana S.A. Peru Series A PEN Quarterly Vac + 5.31% 5.31% 7,374,277 728,238 728,238 728,238 728,238 21,066,171 23,979,121 94627000-8 Parque Arauco S.A. Chile Series K UF Semi-annual 3.65% 3.85% 85,005,117 3,154,596 3,154,596 3,154,596 3,154,596 116,391,002 129,009,386 94627000-8 Parque Arauco S.A. Chile Series O UF Semi-annual 3.30% 3.30% 116,240,074 3,806,120 3,806,120 3,806,120 3,806,120 153,390,992 168,615,472 94627000-8 Parque Arauco S.A. Chile Series P UF Semi-annual 2.00% 1.91% 43,652,287 22,562,028 22,128,154 - - - 44,690,182 94627000-8 Parque Arauco S.A. Chile Series R UF Semi-annual 3.00% 2.55% 60,539,273 1,731,313 1,731,313 1,731,313 1,731,313 69,827,009 76,752,259 94627000-8 Parque Arauco S.A. Chile Series T UF Semi-annual 1.65% 1.86% 28,947,849 12,105,830 6,100,685 8,912,178 2,954,803 - 30,073,496 94627000-8 Parque Arauco S.A. Chile Series V UF Semi-annual 2.55% 2.43% 117,189,673 2,946,508 2,946,508 2,946,508 2,946,508 125,120,844 136,906,875 94627000-8 Parque Arauco S.A. Chile Series X UF Semi-annual 0.85% 2.25% 55,138,896 493,149 493,149 493,149 58,387,235 - 59,866,682 94627000-8 Parque Arauco S.A. Chile Series AA UF Semi-annual 1.40% 1.54% 143,816,217 2,027,946 2,027,946 2,027,946 2,027,946 153,463,435 161,575,220
Total 727,399,785 56,703,472 28,166,681 31,006,665 105,539,316 785,812,596 1,028,318,985
12.31.2019
Debtor
Taxpayer ID
Debtor Name Debtor
Country
Bond
Series Currency Amortization
Contractual
Rate %
Annual
Effective
Rate %
Balance in
Statement of
Financial
Position
Non-Current
Maturity in ThCLP$ (Undiscounted Cash Flows)
1 to 2 Years 2 to 3 Years 3 to 4 Years 4 to 5 Years More than 5
Years Total Cash Flows
20423264617 Inmuebles Panamericana S.A. Peru Series A PEN Quarterly 8.44% 8.44% 15,354,366 2,145,275 2,145,275 2,145,275 2,145,275 15,553,241 24,134,339 20423264617 Inmuebles Panamericana S.A. Peru Series A PEN Quarterly VAC + 4.75% 4.75% 15,417,811 1,614,999 1,646,409 1,680,887 1,714,869 13,859,218 20,516,383 20423264617 Inmuebles Panamericana S.A. Peru Series A PEN Quarterly 9.09% 9.09% 13,227,757 1,213,296 1,213,296 1,213,296 1,213,296 35,862,368 40,715,553 20423264617 Inmuebles Panamericana S.A. Peru Series A PEN Quarterly Vac +5.88% 5.88% 22,727,632 1,347,783 1,347,783 1,347,783 1,347,783 37,912,134 43,303,265 20423264617 Inmuebles Panamericana S.A. Peru Series A PEN Quarterly 8.25% 8.25% 22,438,734 1,865,631 1,865,631 1,865,631 1,865,631 43,823,594 51,286,119 20423264617 Inmuebles Panamericana S.A. Peru Series A PEN Quarterly Vac + 5.31% 5.31% 15,499,486 831,673 831,673 831,673 831,673 24,682,076 28,008,769 94627000-8 Parque Arauco S.A. Chile Series K UF Semi-annual 3.65% 3.85% 83,089,692 3,072,081 3,072,081 3,072,081 3,072,081 116,418,655 128,706,981 94627000-8 Parque Arauco S.A. Chile Series O UF Semi-annual 3.30% 3.30% 113,197,285 - - 3,706,564 3,706,564 3,706,564 11,119,691 94627000-8 Parque Arauco S.A. Chile Series P UF Semi-annual 2.00% 1.91% 63,792,462 22,394,401 21,971,875 21,549,349 - - 65,915,626 94627000-8 Parque Arauco S.A. Chile Series R UF Semi-annual 3.00% 2.55% 59,145,154 1,686,027 1,686,027 1,686,027 1,686,027 69,686,577 76,430,684 94627000-8 Parque Arauco S.A. Chile Series T UF Semi-annual 1.65% 1.86% 28,135,195 465,203 11,789,179 5,941,110 8,679,063 2,877,514 29,752,069 94627000-8 Parque Arauco S.A. Chile Series V UF Semi-annual 2.55% 2.43% 114,239,036 2,869,435 2,869,436 2,869,436 2,869,436 124,717,505 136,195,251
Total 566,264,610 39,505,806 50,438,666 47,909,113 29,131,699 489,099,446 656,084,730
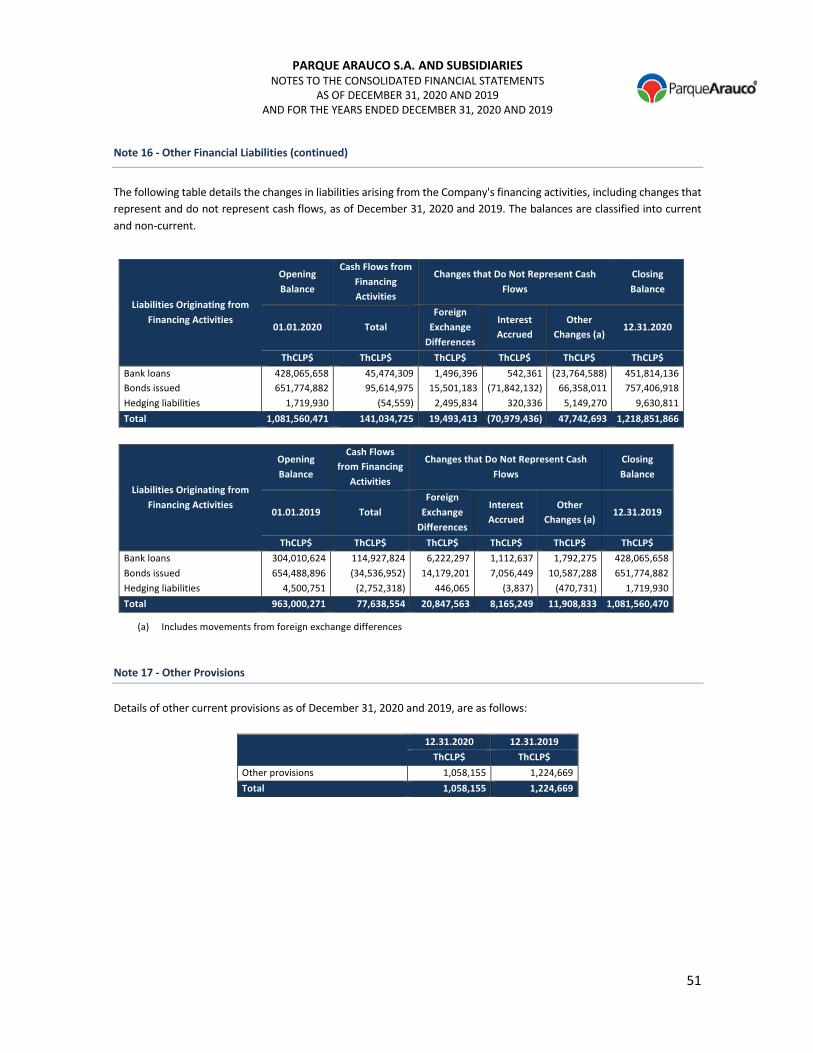
PARQUE ARAUCO S.A. AND SUBSIDIARIES NOTES TO THE CONSOLIDATED FINANCIAL STATEMENTS
AS OF DECEMBER 31, 2020 AND 2019
AND FOR THE YEARS ENDED DECEMBER 31, 2020 AND 2019
51
Note 16 - Other Financial Liabilities (continued)
The following table details the changes in liabilities arising from the Company's financing activities, including changes that
represent and do not represent cash flows, as of December 31, 2020 and 2019. The balances are classified into current
and non-current.
Liabilities Originating from Financing Activities
Opening Balance
Cash Flows from Financing Activities
Changes that Do Not Represent Cash Flows
Closing Balance
01.01.2020 Total Foreign
Exchange Differences
Interest Accrued
Other Changes (a)
12.31.2020
ThCLP$ ThCLP$ ThCLP$ ThCLP$ ThCLP$ ThCLP$ Bank loans 428,065,658 45,474,309 1,496,396 542,361 (23,764,588) 451,814,136 Bonds issued 651,774,882 95,614,975 15,501,183 (71,842,132) 66,358,011 757,406,918 Hedging liabilities 1,719,930 (54,559) 2,495,834 320,336 5,149,270 9,630,811 Total 1,081,560,471 141,034,725 19,493,413 (70,979,436) 47,742,693 1,218,851,866
Liabilities Originating from Financing Activities
Opening Balance
Cash Flows from Financing
Activities
Changes that Do Not Represent Cash Flows
Closing Balance
01.01.2019 Total Foreign
Exchange Differences
Interest Accrued
Other Changes (a)
12.31.2019
ThCLP$ ThCLP$ ThCLP$ ThCLP$ ThCLP$ ThCLP$ Bank loans 304,010,624 114,927,824 6,222,297 1,112,637 1,792,275 428,065,658 Bonds issued 654,488,896 (34,536,952) 14,179,201 7,056,449 10,587,288 651,774,882 Hedging liabilities 4,500,751 (2,752,318) 446,065 (3,837) (470,731) 1,719,930 Total 963,000,271 77,638,554 20,847,563 8,165,249 11,908,833 1,081,560,470
(a) Includes movements from foreign exchange differences Note 17 - Other Provisions
Details of other current provisions as of December 31, 2020 and 2019, are as follows:
12.31.2020 12.31.2019
ThCLP$ ThCLP$ Other provisions 1,058,155 1,224,669 Total 1,058,155 1,224,669
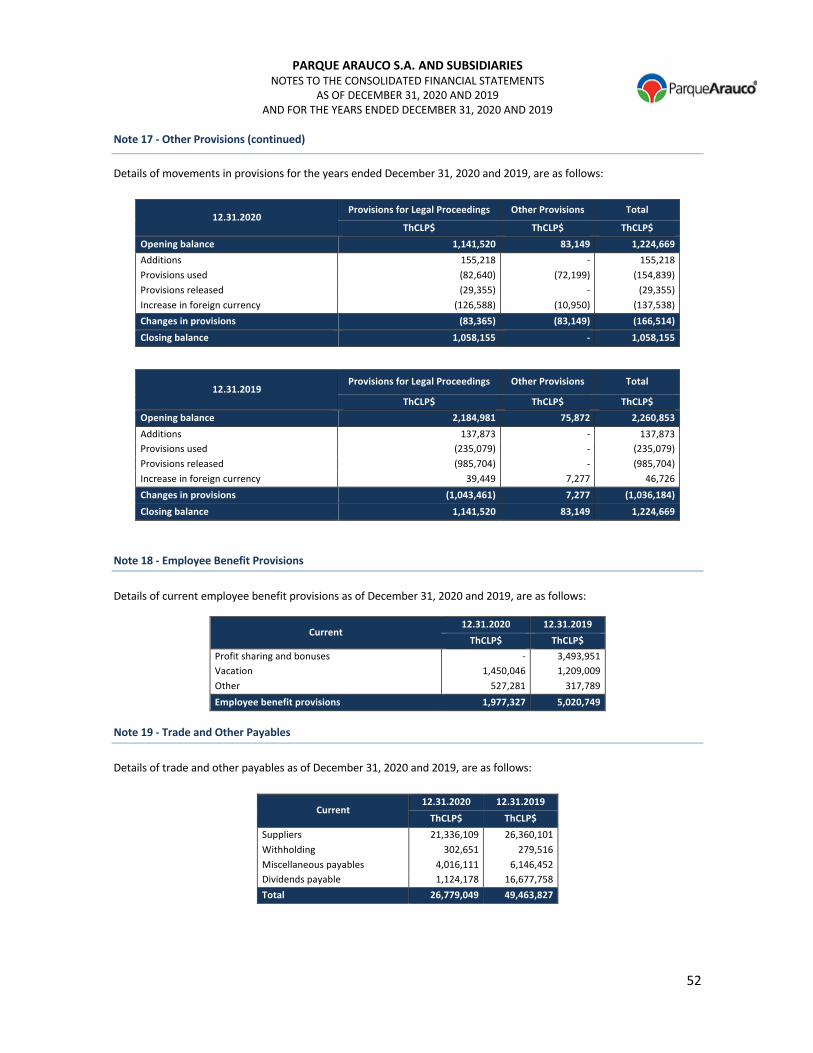
PARQUE ARAUCO S.A. AND SUBSIDIARIES NOTES TO THE CONSOLIDATED FINANCIAL STATEMENTS
AS OF DECEMBER 31, 2020 AND 2019
AND FOR THE YEARS ENDED DECEMBER 31, 2020 AND 2019
52
Note 17 - Other Provisions (continued)
Details of movements in provisions for the years ended December 31, 2020 and 2019, are as follows:
12.31.2020 Provisions for Legal Proceedings Other Provisions Total
ThCLP$ ThCLP$ ThCLP$ Opening balance 1,141,520 83,149 1,224,669 Additions 155,218 - 155,218 Provisions used (82,640) (72,199) (154,839) Provisions released (29,355) - (29,355) Increase in foreign currency (126,588) (10,950) (137,538) Changes in provisions (83,365) (83,149) (166,514) Closing balance 1,058,155 - 1,058,155
12.31.2019 Provisions for Legal Proceedings Other Provisions Total
ThCLP$ ThCLP$ ThCLP$ Opening balance 2,184,981 75,872 2,260,853 Additions 137,873 - 137,873 Provisions used (235,079) - (235,079) Provisions released (985,704) - (985,704) Increase in foreign currency 39,449 7,277 46,726 Changes in provisions (1,043,461) 7,277 (1,036,184) Closing balance 1,141,520 83,149 1,224,669
Note 18 - Employee Benefit Provisions
Details of current employee benefit provisions as of December 31, 2020 and 2019, are as follows:
Current 12.31.2020 12.31.2019
ThCLP$ ThCLP$ Profit sharing and bonuses - 3,493,951 Vacation 1,450,046 1,209,009 Other 527,281 317,789 Employee benefit provisions 1,977,327 5,020,749
Note 19 - Trade and Other Payables
Details of trade and other payables as of December 31, 2020 and 2019, are as follows:
Current 12.31.2020 12.31.2019
ThCLP$ ThCLP$ Suppliers 21,336,109 26,360,101 Withholding 302,651 279,516 Miscellaneous payables 4,016,111 6,146,452 Dividends payable 1,124,178 16,677,758 Total 26,779,049 49,463,827

PARQUE ARAUCO S.A. AND SUBSIDIARIES NOTES TO THE CONSOLIDATED FINANCIAL STATEMENTS
AS OF DECEMBER 31, 2020 AND 2019
AND FOR THE YEARS ENDED DECEMBER 31, 2020 AND 2019
53
Note 19 - Trade and Other Payables (continued)
Up-to-date and past due trade payables as of December 31, 2020 and 2019, are as follows:
a) Up-to-date trade payables
b) Past-due trade payables
Note 20 - Other Non-Financial Liabilities
Details of other non-financial liabilities as of December 31, 2020 and 2019, are as follows:
Current Non-Current ThCLP$ ThCLP$
12.31.2020 12.31.2019 12.31.2020 12.31.2019 Deferred income from leases and
guarantees 568,109 3,400,066 4,652,658 5,094,685
Cash guarantees - - 10,084,600 10,372,362 Other liabilities 5,607,009 9,048,023 7,040,769 6,198,425 Total 6,175,117 12,448,089 21,778,027 21,665,472
Type of Supplier
Amount by Payment
Terms Total ThCLP$
Up to 30 days ThCLP$
12.31.2020
Goods 2,653,476 2,653,476 Services 17,345,673 17,345,673 Total 19,999,148 19,999,148
Type of Supplier
Amount by Payment
Terms Total ThCLP$
Up to 30 days ThCLP$
12.31.2019
Goods 2,554,733 2,554,733 Services 22,816,682 22,816,682 Total 25,371,415 25,371,415
Type of Supplier
Amount by Payment
Terms Total ThCLP$
Up to 30 days ThCLP$
12.31.2020
Goods 44,102 44,102 Services 1,292,859 1,292,859 Total 1,336,961 1,336,961
Type of Supplier
Amount by Payment
Terms Total ThCLP$
Up to 30 days ThCLP$
12.31.2019
Goods 49,906 49,906 Services 938,780 938,780 Total 988,686 988,686

PARQUE ARAUCO S.A. AND SUBSIDIARIES NOTES TO THE CONSOLIDATED FINANCIAL STATEMENTS
AS OF DECEMBER 31, 2020 AND 2019 AND FOR THE YEARS ENDED DECEMBER 31, 2020 AND 2019
54
Note 21 - Right of Use and Lease Liabilities
a) Rights of use other than investment properties related to assets subject to IFRS 16 are detailed as follows:
Opening balance 12.31.2020
ThCLP$ 12.31.2019
ThCLP$ 2,800,864 2,627,679
Additions 77,783 836,678 Amortization for the year (702,124) (731,615) Exchange differences (110,705) 68,122 Closing balance 2,065,819 2,800,864
b) Lease liabilities are detailed as follows:
Current Non-current
ThCLP$ ThCLP$ 12.31.2020 12.31.2019 12.31.2020 12.31.2019
Lease liabilities 1,734,506 2,654,721 67,618,707 78,136,034 Total 1,734,506 2,654,721 67,618,707 78,136,034
Liabilities Originating from
Financing Activities
Balances Cash Flows from Financing Activities Changes that Do Not Represent Cash Flows Balances
01.01.2020
ThCLP$
Payments for Lease Liabilities
ThCLP$
Interest Paid
ThCLP$
Acquisition
ThCLP$
Foreign Exchange
Differences
ThCLP$
Interest
ThCLP$ Other Changes
ThCLP$
12.31.2020
ThCLP$
Lease liabilities 80,790,755 (10,271,334) (4,018,151) - 2,796,594 4,018,151 (3,962,802) 69,353,213 Total 80,790,755 (10,271,334) (4,018,151) - 2,796,594 4,018,151 (3,962,802) 69,353,213
Liabilities Originating from
Financing Activities
Balances Cash Flows from Financing Activities Changes that Do Not Represent Cash Flows Balances
01.01.2019
ThCLP$
Payments for Lease Liabilities
ThCLP$
Interest Paid
ThCLP$
Acquisition
ThCLP$
Foreign Exchange
Differences
ThCLP$
Interest
ThCLP$ Other Changes
ThCLP$
12.31.2019
ThCLP$
Lease liabilities 76,767,149 (6,080,650) (4,173,222) 7,443,480 447,120 4,173,222 2,213,656 80,790,755 Total 76,767,149 (6,080,650) (4,173,222) 7,443,480 447,120 4,173,222 2,213,656 80,790,755

PARQUE ARAUCO S.A. AND SUBSIDIARIES NOTES TO THE CONSOLIDATED FINANCIAL STATEMENTS
AS OF DECEMBER 31, 2020 AND 2019 AND FOR THE YEARS ENDED DECEMBER 31, 2020 AND 2019
55
Note 21 - Right of Use and Lease Liabilities (continued)
Current lease liabilities as of December 31, 2020, are detailed as follows:
12.31.2020 Current Maturity in ThCLP$ (Undiscounted Cash Flows)
Debtor Country Category Nominal Rate %
Effective Rate %
Financial Position Balance ThCLP$ Up to 90 Days Over 90 Days up to 1
Year Total Cash Flows
Chile Land 3.95% 3.95% 363,314 274,118 919,380 1,193,498
Offices 2.45% 2.45% 399,723 107,322 321,966 429,287 Other 3.95% 3.95% 789,432 472,992 1,580,014 2,053,006
Peru Land 6.57% 6.57% - 197,315 495,207 692,522
Offices 4.85% 4.85% 49,741 39,705 51,232 90,937 Other - - - - - -
Colombia Offices 6.83% 6.83% 132,295 39,000 118,169 157,169 Total 1,734,506 1,130,452 3,485,967 4,616,419
Current lease liabilities as of December 31, 2019, are detailed as follows:
12.31.2019 Current Maturity in ThCLP$ (Undiscounted Cash Flows)
Debtor Country Category Nominal Rate %
Effective Rate %
Financial Position Balance ThCLP$ Up to 90 Days Over 90 Days up to 1
Year Total Cash Flows
Chile Land 3.95% 3.95% 365,911 296,330 895,332 1,191,662
Offices 2.45% 2.45% 379,276 104,515 313,561 418,076 Other 4.11% 4.11% 730,461 460,620 1,538,685 1,999,305
Peru Land 6.92% 6.92% - 174,558 523,674 698,232
Offices 4.85% 4.85% 91,633 42,825 130,558 173,382 Other 7.86% 8.02% 958,758 428,671 1,286,012 1,714,683
Colombia Offices 6.83% 6.83% 128,682 41,099 124,531 165,630 Total 2,654,721 1,548,618 4,812,352 6,360,970

PARQUE ARAUCO S.A. AND SUBSIDIARIES NOTES TO THE CONSOLIDATED FINANCIAL STATEMENTS
AS OF DECEMBER 31, 2020 AND 2019 AND FOR THE YEARS ENDED DECEMBER 31, 2020 AND 2019
56
Note 21 - Right of Use and Lease Liabilities (continued)
Non-current lease liabilities as of December 31, 2020, are detailed as follows:
12.31.2020 Non-Current Maturity in Local Currency (Undiscounted Cash Flows)
Debtor Country Category Nominal Rate
%
Annual Effective Rate
%
Financial Position Balance ThCLP$
1 to 2 Years 2 to 3 Years 3 to 4 Years 4 to 5 Years More than 5 Years
Total Cash Flows
Chile Land 3.95% 3.95% 21,727,903 1,234,097 1,247,736 1,273,970 1,331,393 29,532,653 34,619,849
Offices 2.45% 2.45% 971,768 335,421 337,043 337,043 - - 1,009,506 Other 4.11% 4.11% 26,467,125 2,053,006 2,053,006 2,053,006 2,033,165 73,611,973 81,804,156
Peru Land 6.57% 6.57% 17,991,606 1,093,391 1,110,898 1,128,756 1,152,436 47,824,821 52,310,302
Offices 4.85% 4.85% 173,669 68,309 68,309 68,309 - - 204,928 Other - - - - - - - - -
Colombia Offices 6.83% 6.83% 286,636 164,241 141,962 - - - 306,204 Total 67,618,707 4,948,465 4,958,955 4,861,084 4,516,994 150,969,447 170,254,945
Non-current lease liabilities as of December 31, 2019, are detailed as follows:
12.31.2019 Non-Current Maturity in Local Currency (Undiscounted Cash Flows)
Debtor Country Category Nominal Rate
%
Annual Effective Rate
%
Financial Position Balance ThCLP$
1 to 2 Years 2 to 3 Years 3 to 4 Years 4 to 5 Years More than 5 Years
Total Cash Flows
Chile Land 3.95% 3.95% 21,384,026 1,191,662 1,201,817 1,215,099 1,240,647 29,993,040 34,842,265
Offices 2.45% 2.45% 1,335,617 418,059 326,647 328,227 328,227 - 1,401,159 Other 4.11% 4.11% 26,543,611 1,999,306 1,999,306 1,999,306 1,999,306 73,666,494 81,663,717
Peru Land 6.74% 6.74% 18,997,209 1,125,185 1,161,281 1,179,735 1,198,559 51,766,062 56,430,823
Offices 4.85% 4.85% 308,812 102,521 78,669 78,669 78,669 - 338,529 Other 7.86% 8.02% 9,105,407 1,714,688 1,714,681 1,714,681 1,714,681 4,713,913 11,572,644
Colombia Offices 6.83% 6.83% 461,352 173,084 180,873 156,337 - - 510,294 Total 78,136,034 6,724,505 6,663,274 6,672,055 6,560,089 160,139,509 186,759,432

PARQUE ARAUCO S.A. AND SUBSIDIARIES NOTES TO THE CONSOLIDATED FINANCIAL STATEMENTS
AS OF DECEMBER 31, 2020 AND 2019 AND FOR THE YEARS ENDED DECEMBER 31, 2020 AND 2019
57
Note 22 - Equity
Details of equity accounts as shown in the statement of changes in equity are as follows.
i) Capital
The Company invests its unrestricted cash flows in financial instruments such as repo agreements, mutual funds, time deposits, among others, based on which offers the most convenient risk-return ratio and the Company's liquidity needs. The Company's financing policy consists of raising funds from capital markets in order to finance projects that allow the Company to grow, complying with the restrictions (covenants) stipulated in the obligations in force. Financial liabilities mainly consist of bank loans and long-term structured institutional bonds designed to match the maturity of its assets and liabilities. Paid-in capital as of December 31, 2020 and 2019, totals ThCLP$ 423,575,312 and ThCLP$ 423,575,312, respectively.
ii) Capital Management Objectives, Policies and Processes
Investment and Financing Policies
The Company has an investment program designed to maintain its industry leadership and develop profitable projects by incorporating differentiating factors and developing new business areas, while maintaining an appropriate level of working capital and indebtedness levels in line with its cash flows. Dividend Policy Details of the Company's distributable net profits as of each year end are as follows:
Description
12.31.2020 12.31.2019
Profit attributable to equity holders of the parent 1,846,222 93,393,722 Fair value adjustment to investment property (net of deferred taxes) of ThCLP$11,328,228 and ThCLP$15,641,636 in 2020 and 2019, respectively.
(30,315,044) (49,003,564)
Distributable net profits attributable to equity holders of the parent (28,468,822) 44,390,159
At an annual general shareholders’ meeting on April 23, 2020, shareholders agreed to pay a final dividend of CLP$25 per share for a total of ThCLP$22,642,897, or approximately 51% of net distributable profit for 2019. This amount of CLP$25 is comprised of a minimum mandatory dividend of CLP $14.7 and an additional dividend of CLP$10.3.
iii) Movements in Common Shares
Description of Classes of Capital Single Series
12.31.2020 12.31.2019 Opening balance of common shares 905,715,882 902,157,216 Shares issued during the period / year - - Subscribed and paid-in shares - 3,558,666 Closing balance of common shares 905,715,882 905,715,882
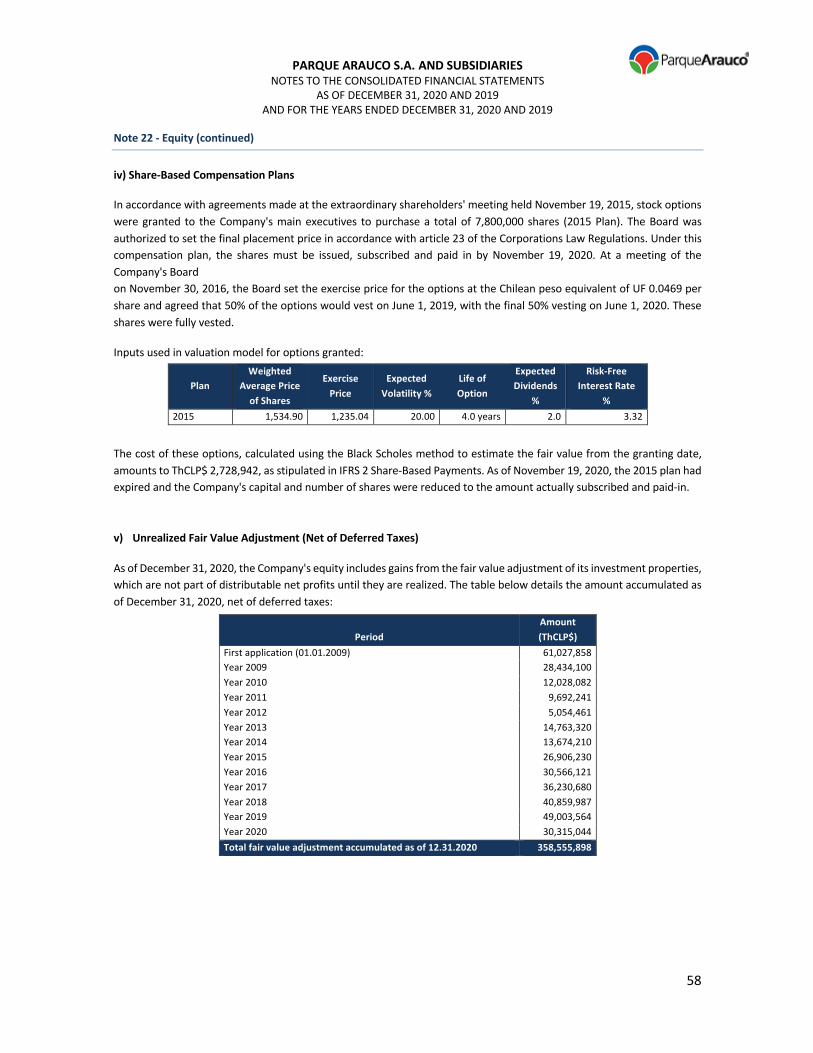
PARQUE ARAUCO S.A. AND SUBSIDIARIES NOTES TO THE CONSOLIDATED FINANCIAL STATEMENTS
AS OF DECEMBER 31, 2020 AND 2019 AND FOR THE YEARS ENDED DECEMBER 31, 2020 AND 2019
58
Note 22 - Equity (continued)
iv) Share-Based Compensation Plans
In accordance with agreements made at the extraordinary shareholders' meeting held November 19, 2015, stock options were granted to the Company's main executives to purchase a total of 7,800,000 shares (2015 Plan). The Board was authorized to set the final placement price in accordance with article 23 of the Corporations Law Regulations. Under this compensation plan, the shares must be issued, subscribed and paid in by November 19, 2020. At a meeting of the Company's Board on November 30, 2016, the Board set the exercise price for the options at the Chilean peso equivalent of UF 0.0469 per share and agreed that 50% of the options would vest on June 1, 2019, with the final 50% vesting on June 1, 2020. These shares were fully vested.
Inputs used in valuation model for options granted:
Plan Weighted
Average Price of Shares
Exercise Price
Expected Volatility %
Life of Option
Expected Dividends
%
Risk-Free Interest Rate
% 2015 1,534.90 1,235.04 20.00 4.0 years 2.0 3.32
The cost of these options, calculated using the Black Scholes method to estimate the fair value from the granting date, amounts to ThCLP$ 2,728,942, as stipulated in IFRS 2 Share-Based Payments. As of November 19, 2020, the 2015 plan had expired and the Company's capital and number of shares were reduced to the amount actually subscribed and paid-in.
v) Unrealized Fair Value Adjustment (Net of Deferred Taxes)
As of December 31, 2020, the Company's equity includes gains from the fair value adjustment of its investment properties, which are not part of distributable net profits until they are realized. The table below details the amount accumulated as of December 31, 2020, net of deferred taxes:
Period Amount (ThCLP$)
First application (01.01.2009) 61,027,858 Year 2009 28,434,100 Year 2010 12,028,082 Year 2011 9,692,241 Year 2012 5,054,461 Year 2013 14,763,320 Year 2014 13,674,210 Year 2015 Year 2016 Year 2017
26,906,230 30,566,121 36,230,680
Year 2018 40,859,987 Year 2019 49,003,564 Year 2020 30,315,044 Total fair value adjustment accumulated as of 12.31.2020 358,555,898

PARQUE ARAUCO S.A. AND SUBSIDIARIES NOTES TO THE CONSOLIDATED FINANCIAL STATEMENTS
AS OF DECEMBER 31, 2020 AND 2019 AND FOR THE YEARS ENDED DECEMBER 31, 2020 AND 2019
59
Note 22 - Equity (continued)
vi) Equity Movements
Other Miscellaneous Reserves 12.31.2020 12.31.2019
ThCLP$ ThCLP$ Opening balance 10,124,519 8,771,582 Interests in Chilean companies 226,335 (21,627) Interests in Peruvian companies 3,735,758 (327,259) Interests in Colombian companies 3,386,556 307 Other 163,102 1,701,517 Movement 7,511,751 1,352,937 Closing balance 17,636,270 10,124,519
Translation Adjustment Reserve 12.31.2020 12.31.2019
ThCLP$ ThCLP$ Opening balance 38,274,065 (8,673,670) Interests in Chilean companies (35,527,870) 42,428,117 Interests in Peruvian companies (28,025,813) 7,149,655 Interests in Colombian companies (7,878,325) (2,630,037) Movement (71,432,007) 46,947,734 Closing balance (33,157,943) 38,274,064
Increase (Decrease) Due to Transfers and Other Changes
12.31.2020 12.31.2019
Other Miscellaneous
Reserves
Retained Earnings
Non-Controlling
Interest
Other Miscellaneous
Reserves
Retained Earnings
Non-Controlling
Interest ThCLP$ ThCLP$ ThCLP$ ThCLP$ ThCLP$ ThCLP$
Interests in Chilean companies 226,335 (5,532,815) (3,855,811) (21,627) 24,452,780 (58,641,956) Interests in Peruvian companies 3,735,758 - - (327,259) - - Interests in Colombian companies 3,386,556 - - 307 - - Other 163,102 - - 1,701,517 - - Movement 7,511,751 (5,532,815) (3,855,811) 1,352,937 24,452,780 (58,641,956)
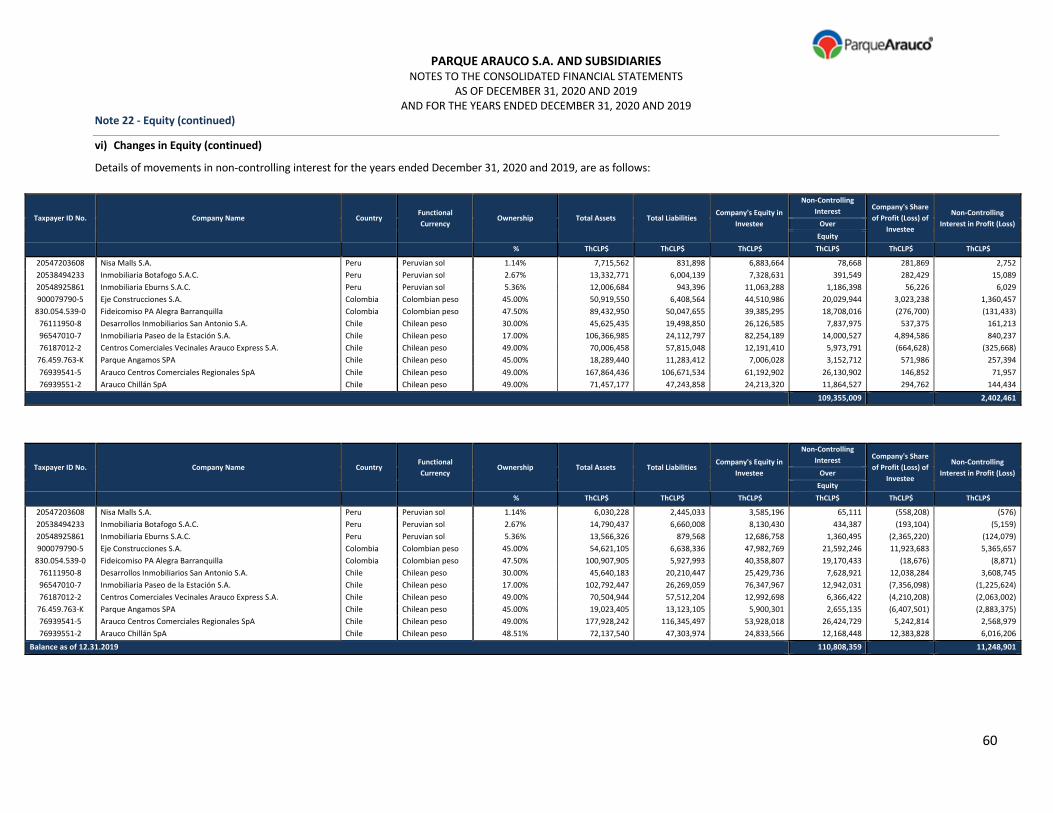
PARQUE ARAUCO S.A. AND SUBSIDIARIES NOTES TO THE CONSOLIDATED FINANCIAL STATEMENTS
AS OF DECEMBER 31, 2020 AND 2019 AND FOR THE YEARS ENDED DECEMBER 31, 2020 AND 2019
60
Note 22 - Equity (continued)
vi) Changes in Equity (continued)
Details of movements in non-controlling interest for the years ended December 31, 2020 and 2019, are as follows:
Taxpayer ID No. Company Name Country Functional Currency
Ownership Total Assets Total Liabilities Company's Equity in
Investee
Non-Controlling Interest Company's Share
of Profit (Loss) of Investee
Non-Controlling Interest in Profit (Loss) Over
Equity % ThCLP$ ThCLP$ ThCLP$ ThCLP$ ThCLP$ ThCLP$
20547203608 Nisa Malls S.A. Peru Peruvian sol 1.14% 7,715,562 831,898 6,883,664 78,668 281,869 2,752 20538494233 Inmobiliaria Botafogo S.A.C. Peru Peruvian sol 2.67% 13,332,771 6,004,139 7,328,631 391,549 282,429 15,089 20548925861 Inmobiliaria Eburns S.A.C. Peru Peruvian sol 5.36% 12,006,684 943,396 11,063,288 1,186,398 56,226 6,029 900079790-5 Eje Construcciones S.A. Colombia Colombian peso 45.00% 50,919,550 6,408,564 44,510,986 20,029,944 3,023,238 1,360,457
830.054.539-0 Fideicomiso PA Alegra Barranquilla Colombia Colombian peso 47.50% 89,432,950 50,047,655 39,385,295 18,708,016 (276,700) (131,433) 76111950-8 Desarrollos Inmobiliarios San Antonio S.A. Chile Chilean peso 30.00% 45,625,435 19,498,850 26,126,585 7,837,975 537,375 161,213 96547010-7 Inmobiliaria Paseo de la Estación S.A. Chile Chilean peso 17.00% 106,366,985 24,112,797 82,254,189 14,000,527 4,894,586 840,237 76187012-2 Centros Comerciales Vecinales Arauco Express S.A. Chile Chilean peso 49.00% 70,006,458 57,815,048 12,191,410 5,973,791 (664,628) (325,668)
76.459.763-K Parque Angamos SPA Chile Chilean peso 45.00% 18,289,440 11,283,412 7,006,028 3,152,712 571,986 257,394 76939541-5 Arauco Centros Comerciales Regionales SpA Chile Chilean peso 49.00% 167,864,436 106,671,534 61,192,902 26,130,902 146,852 71,957 76939551-2 Arauco Chillán SpA Chile Chilean peso 49.00% 71,457,177 47,243,858 24,213,320 11,864,527 294,762 144,434
109,355,009 2,402,461
Taxpayer ID No. Company Name Country Functional Currency
Ownership Total Assets Total Liabilities Company's Equity in
Investee
Non-Controlling Interest Company's Share
of Profit (Loss) of Investee
Non-Controlling Interest in Profit (Loss) Over
Equity % ThCLP$ ThCLP$ ThCLP$ ThCLP$ ThCLP$ ThCLP$
20547203608 Nisa Malls S.A. Peru Peruvian sol 1.14% 6,030,228 2,445,033 3,585,196 65,111 (558,208) (576) 20538494233 Inmobiliaria Botafogo S.A.C. Peru Peruvian sol 2.67% 14,790,437 6,660,008 8,130,430 434,387 (193,104) (5,159) 20548925861 Inmobiliaria Eburns S.A.C. Peru Peruvian sol 5.36% 13,566,326 879,568 12,686,758 1,360,495 (2,365,220) (124,079) 900079790-5 Eje Construcciones S.A. Colombia Colombian peso 45.00% 54,621,105 6,638,336 47,982,769 21,592,246 11,923,683 5,365,657
830.054.539-0 Fideicomiso PA Alegra Barranquilla Colombia Colombian peso 47.50% 100,907,905 5,927,993 40,358,807 19,170,433 (18,676) (8,871) 76111950-8 Desarrollos Inmobiliarios San Antonio S.A. Chile Chilean peso 30.00% 45,640,183 20,210,447 25,429,736 7,628,921 12,038,284 3,608,745 96547010-7 Inmobiliaria Paseo de la Estación S.A. Chile Chilean peso 17.00% 102,792,447 26,269,059 76,347,967 12,942,031 (7,356,098) (1,225,624) 76187012-2 Centros Comerciales Vecinales Arauco Express S.A. Chile Chilean peso 49.00% 70,504,944 57,512,204 12,992,698 6,366,422 (4,210,208) (2,063,002)
76.459.763-K Parque Angamos SPA Chile Chilean peso 45.00% 19,023,405 13,123,105 5,900,301 2,655,135 (6,407,501) (2,883,375) 76939541-5 Arauco Centros Comerciales Regionales SpA Chile Chilean peso 49.00% 177,928,242 116,345,497 53,928,018 26,424,729 5,242,814 2,568,979 76939551-2 Arauco Chillán SpA Chile Chilean peso 48.51% 72,137,540 47,303,974 24,833,566 12,168,448 12,383,828 6,016,206
Balance as of 12.31.2019 110,808,359 11,248,901
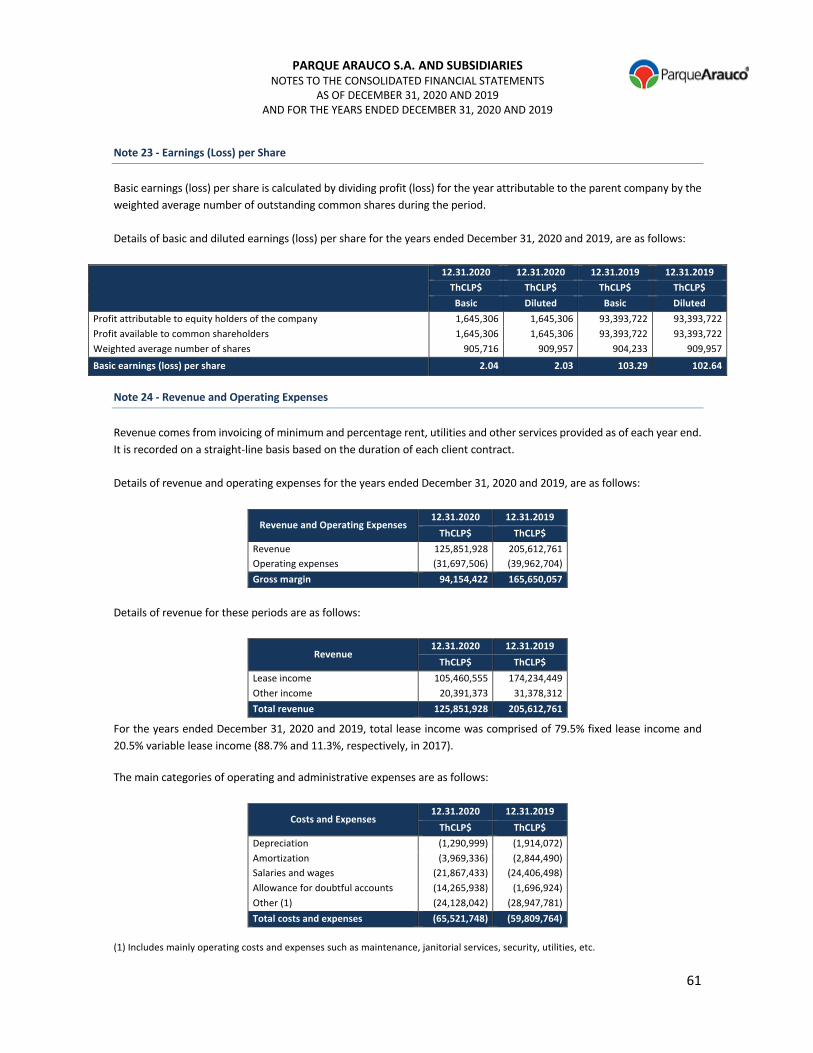
PARQUE ARAUCO S.A. AND SUBSIDIARIES NOTES TO THE CONSOLIDATED FINANCIAL STATEMENTS
AS OF DECEMBER 31, 2020 AND 2019
AND FOR THE YEARS ENDED DECEMBER 31, 2020 AND 2019
61
Note 23 - Earnings (Loss) per Share
Basic earnings (loss) per share is calculated by dividing profit (loss) for the year attributable to the parent company by the
weighted average number of outstanding common shares during the period.
Details of basic and diluted earnings (loss) per share for the years ended December 31, 2020 and 2019, are as follows:
12.31.2020 12.31.2020 12.31.2019 12.31.2019
ThCLP$ ThCLP$ ThCLP$ ThCLP$
Basic Diluted Basic Diluted
Profit attributable to equity holders of the company 1,645,306 1,645,306 93,393,722 93,393,722 Profit available to common shareholders 1,645,306 1,645,306 93,393,722 93,393,722 Weighted average number of shares 905,716 909,957 904,233 909,957 Basic earnings (loss) per share 2.04 2.03 103.29 102.64
Note 24 - Revenue and Operating Expenses
Revenue comes from invoicing of minimum and percentage rent, utilities and other services provided as of each year end.
It is recorded on a straight-line basis based on the duration of each client contract.
Details of revenue and operating expenses for the years ended December 31, 2020 and 2019, are as follows:
Revenue and Operating Expenses 12.31.2020 12.31.2019
ThCLP$ ThCLP$
Revenue 125,851,928 205,612,761 Operating expenses (31,697,506) (39,962,704) Gross margin 94,154,422 165,650,057
Details of revenue for these periods are as follows:
Revenue 12.31.2020 12.31.2019
ThCLP$ ThCLP$
Lease income 105,460,555 174,234,449 Other income 20,391,373 31,378,312 Total revenue 125,851,928 205,612,761
For the years ended December 31, 2020 and 2019, total lease income was comprised of 79.5% fixed lease income and
20.5% variable lease income (88.7% and 11.3%, respectively, in 2017).
The main categories of operating and administrative expenses are as follows:
Costs and Expenses 12.31.2020 12.31.2019
ThCLP$ ThCLP$
Depreciation (1,290,999) (1,914,072) Amortization (3,969,336) (2,844,490) Salaries and wages (21,867,433) (24,406,498) Allowance for doubtful accounts (14,265,938) (1,696,924) Other (1) (24,128,042) (28,947,781) Total costs and expenses (65,521,748) (59,809,764)
(1) Includes mainly operating costs and expenses such as maintenance, janitorial services, security, utilities, etc.
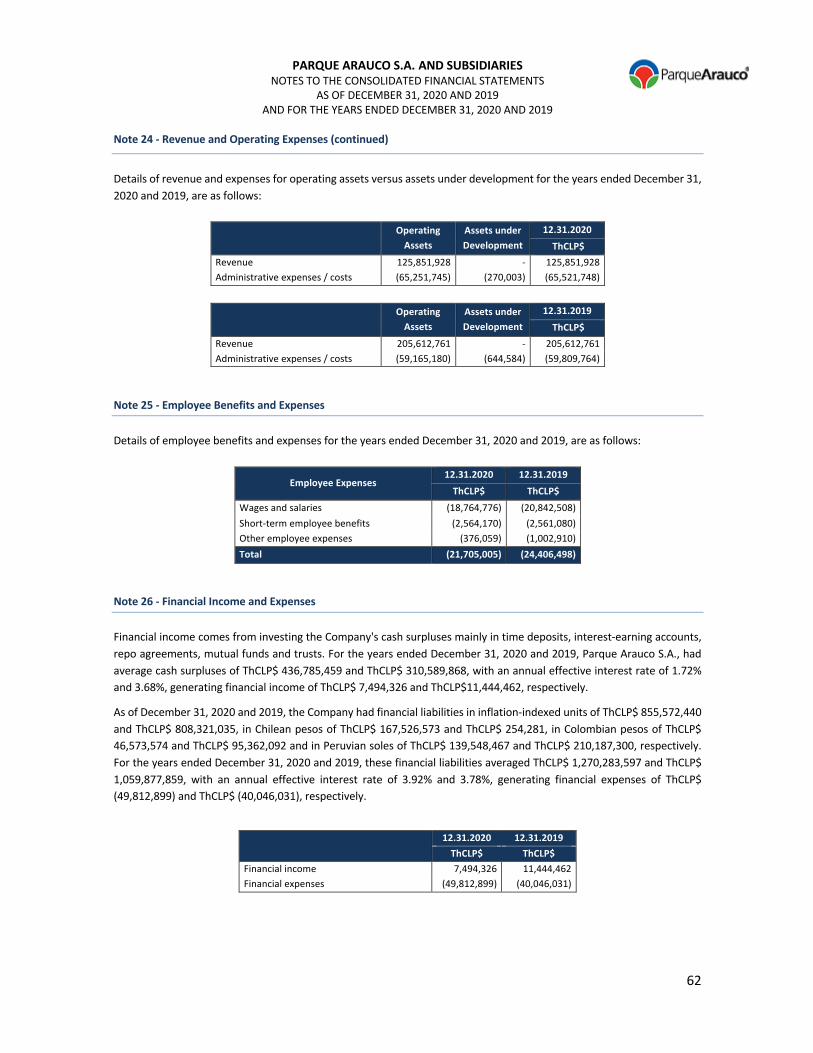
PARQUE ARAUCO S.A. AND SUBSIDIARIES NOTES TO THE CONSOLIDATED FINANCIAL STATEMENTS
AS OF DECEMBER 31, 2020 AND 2019
AND FOR THE YEARS ENDED DECEMBER 31, 2020 AND 2019
62
Note 24 - Revenue and Operating Expenses (continued)
Details of revenue and expenses for operating assets versus assets under development for the years ended December 31,
2020 and 2019, are as follows:
Operating
Assets
Assets under
Development
12.31.2020
ThCLP$
Revenue 125,851,928 - 125,851,928 Administrative expenses / costs (65,251,745) (270,003) (65,521,748)
Operating
Assets
Assets under
Development
12.31.2019
ThCLP$
Revenue 205,612,761 - 205,612,761 Administrative expenses / costs (59,165,180) (644,584) (59,809,764)
Note 25 - Employee Benefits and Expenses
Details of employee benefits and expenses for the years ended December 31, 2020 and 2019, are as follows:
Employee Expenses 12.31.2020 12.31.2019
ThCLP$ ThCLP$
Wages and salaries (18,764,776) (20,842,508) Short-term employee benefits (2,564,170) (2,561,080) Other employee expenses (376,059) (1,002,910) Total (21,705,005) (24,406,498)
Note 26 - Financial Income and Expenses
Financial income comes from investing the Company's cash surpluses mainly in time deposits, interest-earning accounts,
repo agreements, mutual funds and trusts. For the years ended December 31, 2020 and 2019, Parque Arauco S.A., had
average cash surpluses of ThCLP$ 436,785,459 and ThCLP$ 310,589,868, with an annual effective interest rate of 1.72%
and 3.68%, generating financial income of ThCLP$ 7,494,326 and ThCLP$11,444,462, respectively.
As of December 31, 2020 and 2019, the Company had financial liabilities in inflation-indexed units of ThCLP$ 855,572,440
and ThCLP$ 808,321,035, in Chilean pesos of ThCLP$ 167,526,573 and ThCLP$ 254,281, in Colombian pesos of ThCLP$
46,573,574 and ThCLP$ 95,362,092 and in Peruvian soles of ThCLP$ 139,548,467 and ThCLP$ 210,187,300, respectively.
For the years ended December 31, 2020 and 2019, these financial liabilities averaged ThCLP$ 1,270,283,597 and ThCLP$
1,059,877,859, with an annual effective interest rate of 3.92% and 3.78%, generating financial expenses of ThCLP$
(49,812,899) and ThCLP$ (40,046,031), respectively.
12.31.2020 12.31.2019
ThCLP$ ThCLP$
Financial income 7,494,326 11,444,462 Financial expenses (49,812,899) (40,046,031)

PARQUE ARAUCO S.A. AND SUBSIDIARIES NOTES TO THE CONSOLIDATED FINANCIAL STATEMENTS
AS OF DECEMBER 31, 2020 AND 2019
AND FOR THE YEARS ENDED DECEMBER 31, 2020 AND 2019
63
Note 27 - Effect of Exchange Rate Changes
Gain (loss) for foreign exchange differences corresponds to the weighted gain (loss) of asset and liability movements in
foreign currency generated during the period.
12.31.2020 12.31.2019
ThCLP$ ThCLP$
Foreign exchange differences 1,064,839 809,663 Translation adjustment reserve (1) 38,274,065 46,947,734
(1) Movements in the translation adjustment reserve are detailed in Note 22 vi).
Foreign Exchange Differences 12.31.2020 12.31.2019
ThCLP$ ThCLP$
Financial liabilities 5,388,605 708,364 Related party transactions (3,394) 151,830 Other (4,320,372) (50,531) Total 1,064,839 809,663
Note 28 - Depreciation and Amortization
Balances of depreciation and amortization for the years ended December 31, 2020 and 2019, are as follows:
12.31.2020 12.31.2019
ThCLP$ ThCLP$
Depreciation (1,290,999) (1,914,072) Amortization (2,252,104) (2,076,602) Amortization of other rights (1) (1,717,232) (767,888) Total (5,260,335) (4,758,562)
(1) Amortization of other rights considers other contracts and rights of use related to IFRS 16
Note 29 - Gain (Loss) on Indexed Assets and Liabilities
Gain (loss) on indexed assets and liabilities corresponds mainly to bank loans, finance leases and bond issuances in
indexation units detailed in Note 16 Other Financial Liabilities.
Details of the gain (loss) on indexed assets and liabilities for the years ended December 31, 2020 and 2019, are as follows:
12.31.2020 12.31.2019
ThCLP$ ThCLP$
Loss on indexed assets and liabilities (23,766,928) (21,873,481)

PARQUE ARAUCO S.A. AND SUBSIDIARIES NOTES TO THE CONSOLIDATED FINANCIAL STATEMENTS
AS OF DECEMBER 31, 2020 AND 2019
AND FOR THE YEARS ENDED DECEMBER 31, 2020 AND 2019
64
Note 30 - Other Income and Expenses
30.1 Other income for the years ended December 31, 2020 and 2019, is as follows:
12.31.2020 12.31.2019
ThCLP$ ThCLP$
Sale of land related to IP 737,161 - Insurance compensation or refund 17,002 - Gain on reappraisal of IP 33,077,165 47,820,191 Other income 773,703 1,311,169 Total other income, by function 34,605,031 49,131,361
30.2 Other expenses for the years ended December 31, 2020 and 2019, are as follows:
12.31.2020 12.31.2019
ThCLP$ ThCLP$
Extraordinary taxes (2) (1,093,213) (979,058) Research and project expenses (7,270,943) (5,624,279) Asset impairment (9,545,106) (1,776,755) Insurance claim deductible - - Termination benefits and severance expenses
(489,704) (171,257)
Other expenses (1,733,919) (2,441,969)
Total other expenses, by function (20,132,885) (10,993,318)

PARQUE ARAUCO S.A. AND SUBSIDIARIES NOTES TO THE CONSOLIDATED FINANCIAL STATEMENTS
AS OF DECEMBER 31, 2020 AND 2019
AND FOR THE YEARS ENDED DECEMBER 31, 2020 AND 2019
65
Note 31 - Foreign Currency
12.31.2020 12.31.2019
ThCLP$ ThCLP$
Liquid Assets 357,145,015 315,437,439
Non-indexed CLP 243,510,000 177,086,566 US dollar 47,565,072 87,330,893 Peruvian sol 12,567,238 18,843,234 Colombian peso 53,502,705 32,176,745 Cash and cash equivalents 357,032,449 315,434,937
Non-indexed CLP 243,510,000 177,086,566 US dollar 47,565,072 87,330,893 Peruvian sol 12,565,208 18,843,234 Colombian peso 53,392,169 32,174,244 Other financial assets, current 112,566 2,501
Non-indexed CLP - - US dollar - - Peruvian sol 2,030 2,501 Colombian peso 110,536 - Short- and Long-Term Receivables 27,327,881 37,354,211
Indexed CLP$ 43,045 42,485 Non-indexed CLP 18,142,182 22,269,346 US dollar 1,424,024 1,609,125 Peruvian sol 5,639,594 10,996,790 Colombian peso 2,079,036 2,436,465 Trade and other receivables, current 27,006,348 35,040,712
Indexed CLP$ - - Non-indexed CLP 18,135,847 22,259,784 US dollar 1,422,711 1,604,291 Peruvian sol 5,368,753 8,740,171 Colombian peso 2,079,036 2,436,465 Rights receivable, non-current 49,379 52,047
Indexed CLP$ 43,045 42,485 Non-indexed CLP 6,334 9,562 Related party receivables, current 272,154 234,289
US dollar 1,313 1,651 Peruvian sol 270,840 232,638 Colombian peso - Related party receivables, non-current 1,972,924 2,027,164
US dollar - 3,183 Peruvian sol 1,972,924 2,023,981 Colombian peso - - Remaining assets 2,301,217,429 2,330,476,481
Indexed CLP$ 27,304,575 27,302,350 Non-indexed CLP 1,411,589,923 1,361,518,820 US dollar 29,554,347 34,044,182 Peruvian sol 523,009,189 578,098,175 Colombian peso 309,759,394 329,684,324 Total Assets 2,687,663,249 2,683,268,130
Indexed CLP$ 27,347,620 27,344,835 Non-indexed CLP 1,673,242,104 1,560,874,732 US dollar 78,543,444 122,984,200 Peruvian sol 543,188,946 607,938,199 Colombian peso 365,341,135 364,123,663
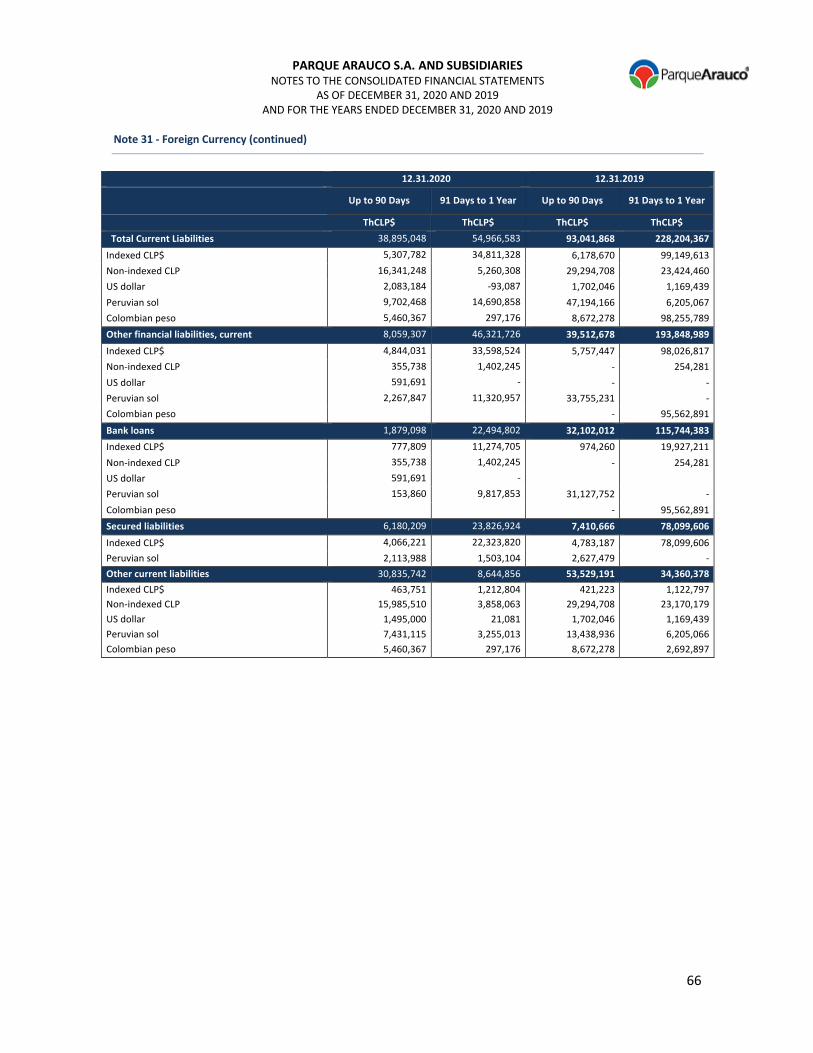
PARQUE ARAUCO S.A. AND SUBSIDIARIES NOTES TO THE CONSOLIDATED FINANCIAL STATEMENTS
AS OF DECEMBER 31, 2020 AND 2019
AND FOR THE YEARS ENDED DECEMBER 31, 2020 AND 2019
66
Note 31 - Foreign Currency (continued)
12.31.2020 12.31.2019
Up to 90 Days 91 Days to 1 Year Up to 90 Days 91 Days to 1 Year
ThCLP$ ThCLP$ ThCLP$ ThCLP$
Total Current Liabilities 38,895,048 54,966,583 93,041,868 228,204,367
Indexed CLP$ 5,307,782 34,811,328 6,178,670 99,149,613 Non-indexed CLP 16,341,248 5,260,308 29,294,708 23,424,460 US dollar 2,083,184 -93,087 1,702,046 1,169,439 Peruvian sol 9,702,468 14,690,858 47,194,166 6,205,067 Colombian peso 5,460,367 297,176 8,672,278 98,255,789 Other financial liabilities, current 8,059,307 46,321,726 39,512,678 193,848,989
Indexed CLP$ 4,844,031 33,598,524 5,757,447 98,026,817 Non-indexed CLP 355,738 1,402,245 - 254,281 US dollar 591,691 - - - Peruvian sol 2,267,847 11,320,957 33,755,231 - Colombian peso - 95,562,891 Bank loans 1,879,098 22,494,802 32,102,012 115,744,383
Indexed CLP$ 777,809 11,274,705 974,260 19,927,211 Non-indexed CLP 355,738 1,402,245 - 254,281 US dollar 591,691 - Peruvian sol 153,860 9,817,853 31,127,752 - Colombian peso - 95,562,891 Secured liabilities 6,180,209 23,826,924 7,410,666 78,099,606
Indexed CLP$ 4,066,221 22,323,820 4,783,187 78,099,606 Peruvian sol 2,113,988 1,503,104 2,627,479 - Other current liabilities 30,835,742 8,644,856 53,529,191 34,360,378
Indexed CLP$ 463,751 1,212,804 421,223 1,122,797 Non-indexed CLP 15,985,510 3,858,063 29,294,708 23,170,179 US dollar 1,495,000 21,081 1,702,046 1,169,439 Peruvian sol 7,431,115 3,255,013 13,438,936 6,205,066 Colombian peso 5,460,367 297,176 8,672,278 2,692,897
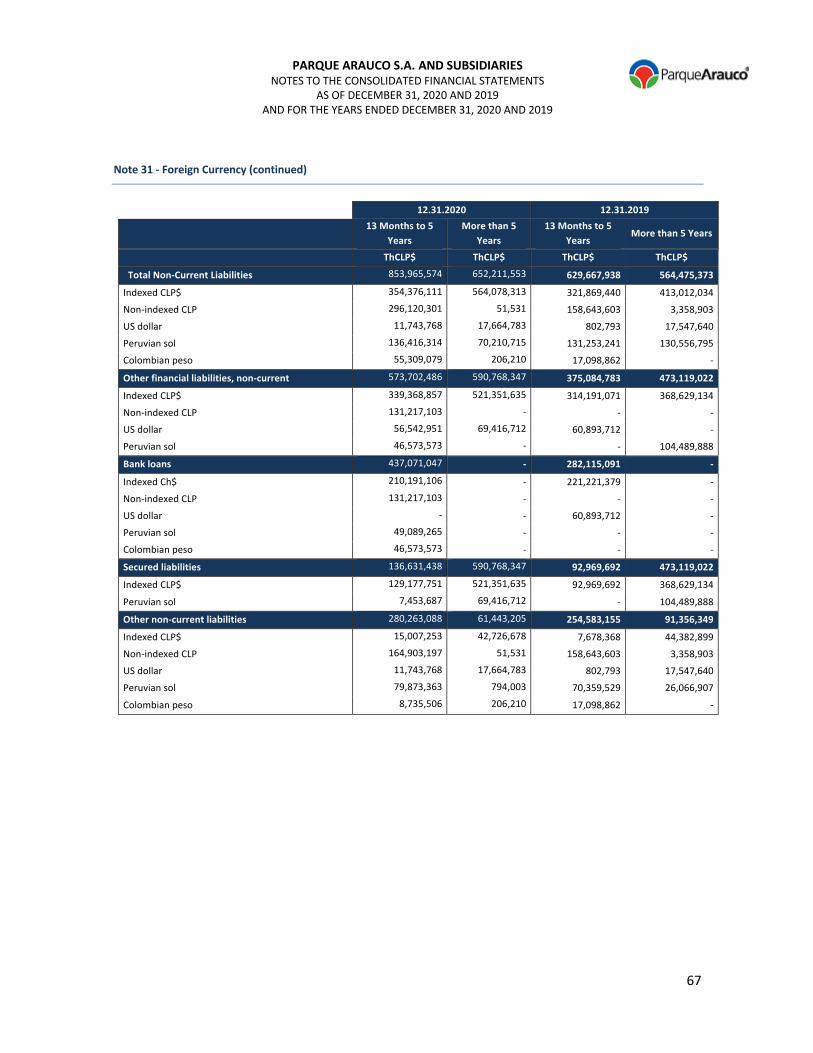
PARQUE ARAUCO S.A. AND SUBSIDIARIES NOTES TO THE CONSOLIDATED FINANCIAL STATEMENTS
AS OF DECEMBER 31, 2020 AND 2019
AND FOR THE YEARS ENDED DECEMBER 31, 2020 AND 2019
67
Note 31 - Foreign Currency (continued)
12.31.2020 12.31.2019
13 Months to 5
Years
More than 5
Years
13 Months to 5
Years More than 5 Years
ThCLP$ ThCLP$ ThCLP$ ThCLP$
Total Non-Current Liabilities 853,965,574 652,211,553 629,667,938 564,475,373
Indexed CLP$ 354,376,111 564,078,313 321,869,440 413,012,034 Non-indexed CLP 296,120,301 51,531 158,643,603 3,358,903 US dollar 11,743,768 17,664,783 802,793 17,547,640 Peruvian sol 136,416,314 70,210,715 131,253,241 130,556,795 Colombian peso 55,309,079 206,210 17,098,862 -
Other financial liabilities, non-current 573,702,486 590,768,347 375,084,783 473,119,022
Indexed CLP$ 339,368,857 521,351,635 314,191,071 368,629,134 Non-indexed CLP 131,217,103 - - - US dollar 56,542,951 69,416,712 60,893,712 - Peruvian sol 46,573,573 - - 104,489,888
Bank loans 437,071,047 - 282,115,091 -
Indexed Ch$ 210,191,106 - 221,221,379 - Non-indexed CLP 131,217,103 - - - US dollar - - 60,893,712 - Peruvian sol 49,089,265 - - - Colombian peso 46,573,573 - - -
Secured liabilities 136,631,438 590,768,347 92,969,692 473,119,022
Indexed CLP$ 129,177,751 521,351,635 92,969,692 368,629,134 Peruvian sol 7,453,687 69,416,712 - 104,489,888
Other non-current liabilities 280,263,088 61,443,205 254,583,155 91,356,349
Indexed CLP$ 15,007,253 42,726,678 7,678,368 44,382,899 Non-indexed CLP 164,903,197 51,531 158,643,603 3,358,903 US dollar 11,743,768 17,664,783 802,793 17,547,640 Peruvian sol 79,873,363 794,003 70,359,529 26,066,907 Colombian peso 8,735,506 206,210 17,098,862 -
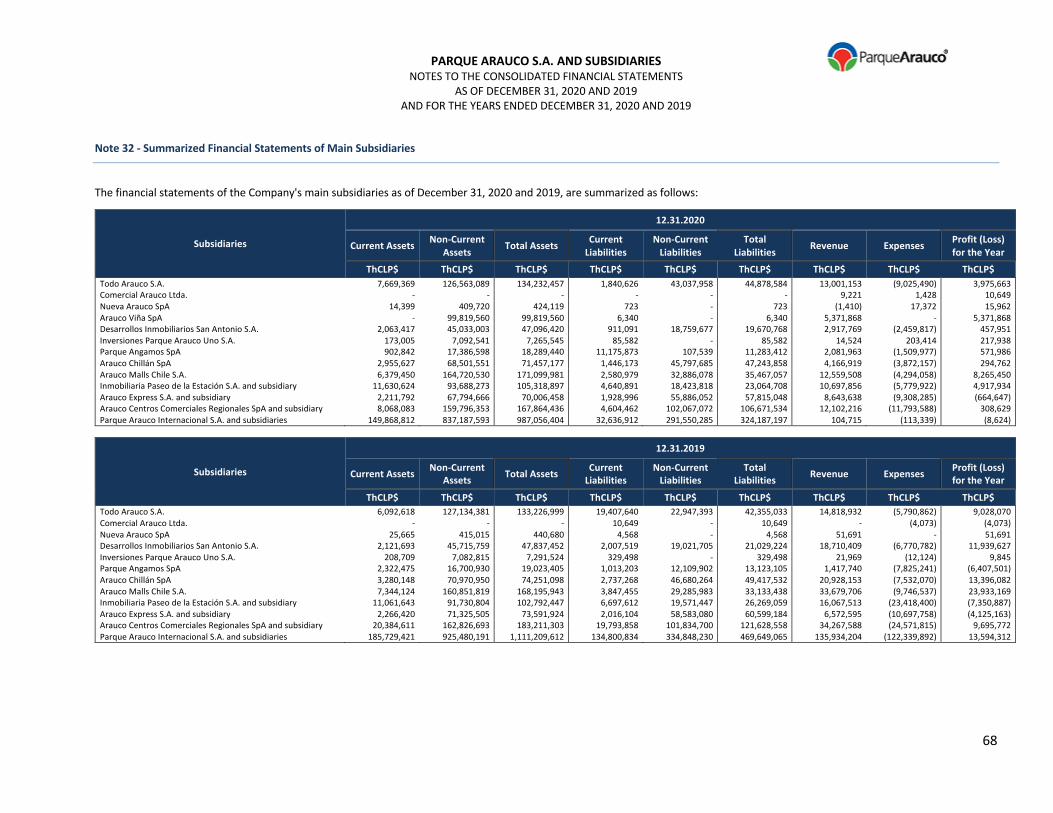
PARQUE ARAUCO S.A. AND SUBSIDIARIES NOTES TO THE CONSOLIDATED FINANCIAL STATEMENTS
AS OF DECEMBER 31, 2020 AND 2019 AND FOR THE YEARS ENDED DECEMBER 31, 2020 AND 2019
68
Note 32 - Summarized Financial Statements of Main Subsidiaries
The financial statements of the Company's main subsidiaries as of December 31, 2020 and 2019, are summarized as follows:
Subsidiaries
12.31.2020
Current Assets Non-Current Assets Total Assets Current
Liabilities Non-Current
Liabilities Total
Liabilities Revenue Expenses Profit (Loss) for the Year
ThCLP$ ThCLP$ ThCLP$ ThCLP$ ThCLP$ ThCLP$ ThCLP$ ThCLP$ ThCLP$ Todo Arauco S.A. 7,669,369 126,563,089 134,232,457 1,840,626 43,037,958 44,878,584 13,001,153 (9,025,490) 3,975,663 Comercial Arauco Ltda. - - - - - - 9,221 1,428 10,649 Nueva Arauco SpA 14,399 409,720 424,119 723 - 723 (1,410) 17,372 15,962 Arauco Viña SpA - 99,819,560 99,819,560 6,340 - 6,340 5,371,868 - 5,371,868 Desarrollos Inmobiliarios San Antonio S.A. 2,063,417 45,033,003 47,096,420 911,091 18,759,677 19,670,768 2,917,769 (2,459,817) 457,951 Inversiones Parque Arauco Uno S.A. 173,005 7,092,541 7,265,545 85,582 - 85,582 14,524 203,414 217,938 Parque Angamos SpA 902,842 17,386,598 18,289,440 11,175,873 107,539 11,283,412 2,081,963 (1,509,977) 571,986 Arauco Chillán SpA 2,955,627 68,501,551 71,457,177 1,446,173 45,797,685 47,243,858 4,166,919 (3,872,157) 294,762 Arauco Malls Chile S.A. 6,379,450 164,720,530 171,099,981 2,580,979 32,886,078 35,467,057 12,559,508 (4,294,058) 8,265,450 Inmobiliaria Paseo de la Estación S.A. and subsidiary 11,630,624 93,688,273 105,318,897 4,640,891 18,423,818 23,064,708 10,697,856 (5,779,922) 4,917,934 Arauco Express S.A. and subsidiary 2,211,792 67,794,666 70,006,458 1,928,996 55,886,052 57,815,048 8,643,638 (9,308,285) (664,647) Arauco Centros Comerciales Regionales SpA and subsidiary 8,068,083 159,796,353 167,864,436 4,604,462 102,067,072 106,671,534 12,102,216 (11,793,588) 308,629 Parque Arauco Internacional S.A. and subsidiaries 149,868,812 837,187,593 987,056,404 32,636,912 291,550,285 324,187,197 104,715 (113,339) (8,624)
Subsidiaries
12.31.2019
Current Assets Non-Current Assets Total Assets Current
Liabilities Non-Current
Liabilities Total
Liabilities Revenue Expenses Profit (Loss) for the Year
ThCLP$ ThCLP$ ThCLP$ ThCLP$ ThCLP$ ThCLP$ ThCLP$ ThCLP$ ThCLP$ Todo Arauco S.A. 6,092,618 127,134,381 133,226,999 19,407,640 22,947,393 42,355,033 14,818,932 (5,790,862) 9,028,070 Comercial Arauco Ltda. - - - 10,649 - 10,649 - (4,073) (4,073) Nueva Arauco SpA 25,665 415,015 440,680 4,568 - 4,568 51,691 - 51,691 Desarrollos Inmobiliarios San Antonio S.A. 2,121,693 45,715,759 47,837,452 2,007,519 19,021,705 21,029,224 18,710,409 (6,770,782) 11,939,627 Inversiones Parque Arauco Uno S.A. 208,709 7,082,815 7,291,524 329,498 - 329,498 21,969 (12,124) 9,845 Parque Angamos SpA 2,322,475 16,700,930 19,023,405 1,013,203 12,109,902 13,123,105 1,417,740 (7,825,241) (6,407,501) Arauco Chillán SpA 3,280,148 70,970,950 74,251,098 2,737,268 46,680,264 49,417,532 20,928,153 (7,532,070) 13,396,082 Arauco Malls Chile S.A. 7,344,124 160,851,819 168,195,943 3,847,455 29,285,983 33,133,438 33,679,706 (9,746,537) 23,933,169 Inmobiliaria Paseo de la Estación S.A. and subsidiary 11,061,643 91,730,804 102,792,447 6,697,612 19,571,447 26,269,059 16,067,513 (23,418,400) (7,350,887) Arauco Express S.A. and subsidiary 2,266,420 71,325,505 73,591,924 2,016,104 58,583,080 60,599,184 6,572,595 (10,697,758) (4,125,163) Arauco Centros Comerciales Regionales SpA and subsidiary 20,384,611 162,826,693 183,211,303 19,793,858 101,834,700 121,628,558 34,267,588 (24,571,815) 9,695,772 Parque Arauco Internacional S.A. and subsidiaries 185,729,421 925,480,191 1,111,209,612 134,800,834 334,848,230 469,649,065 135,934,204 (122,339,892) 13,594,312
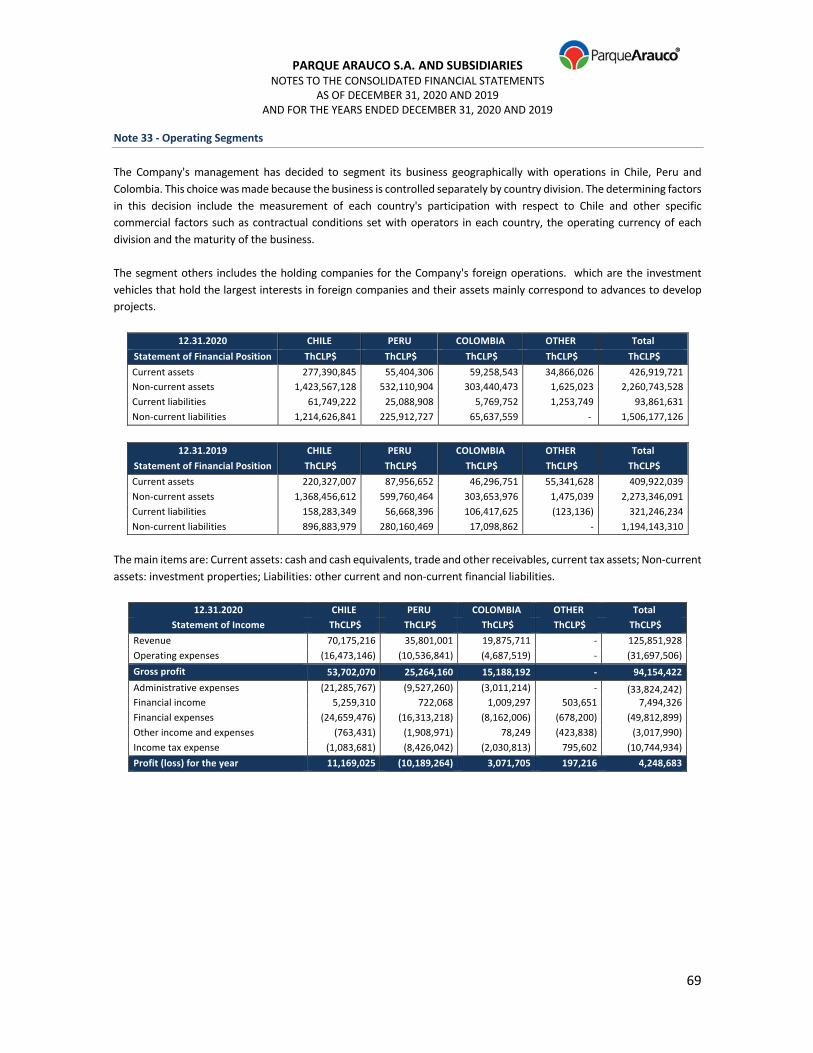
PARQUE ARAUCO S.A. AND SUBSIDIARIES NOTES TO THE CONSOLIDATED FINANCIAL STATEMENTS
AS OF DECEMBER 31, 2020 AND 2019 AND FOR THE YEARS ENDED DECEMBER 31, 2020 AND 2019
69
Note 33 - Operating Segments
The Company's management has decided to segment its business geographically with operations in Chile, Peru and Colombia. This choice was made because the business is controlled separately by country division. The determining factors in this decision include the measurement of each country's participation with respect to Chile and other specific commercial factors such as contractual conditions set with operators in each country, the operating currency of each division and the maturity of the business. The segment others includes the holding companies for the Company's foreign operations. which are the investment vehicles that hold the largest interests in foreign companies and their assets mainly correspond to advances to develop projects.
12.31.2020 CHILE PERU COLOMBIA OTHER Total
Statement of Financial Position ThCLP$ ThCLP$ ThCLP$ ThCLP$ ThCLP$
Current assets 277,390,845 55,404,306 59,258,543 34,866,026 426,919,721 Non-current assets 1,423,567,128 532,110,904 303,440,473 1,625,023 2,260,743,528 Current liabilities 61,749,222 25,088,908 5,769,752 1,253,749 93,861,631 Non-current liabilities 1,214,626,841 225,912,727 65,637,559 - 1,506,177,126
12.31.2019 CHILE PERU COLOMBIA OTHER Total
Statement of Financial Position ThCLP$ ThCLP$ ThCLP$ ThCLP$ ThCLP$
Current assets 220,327,007 87,956,652 46,296,751 55,341,628 409,922,039 Non-current assets 1,368,456,612 599,760,464 303,653,976 1,475,039 2,273,346,091 Current liabilities 158,283,349 56,668,396 106,417,625 (123,136) 321,246,234 Non-current liabilities 896,883,979 280,160,469 17,098,862 - 1,194,143,310
The main items are: Current assets: cash and cash equivalents, trade and other receivables, current tax assets; Non-current assets: investment properties; Liabilities: other current and non-current financial liabilities.
12.31.2020 CHILE PERU COLOMBIA OTHER Total
Statement of Income ThCLP$ ThCLP$ ThCLP$ ThCLP$ ThCLP$
Revenue 70,175,216 35,801,001 19,875,711 - 125,851,928 Operating expenses (16,473,146) (10,536,841) (4,687,519) - (31,697,506)
Gross profit 53,702,070 25,264,160 15,188,192 - 94,154,422
Administrative expenses (21,285,767) (9,527,260) (3,011,214) - (33,824,242) Financial income 5,259,310 722,068 1,009,297 503,651 7,494,326 Financial expenses (24,659,476) (16,313,218) (8,162,006) (678,200) (49,812,899) Other income and expenses (763,431) (1,908,971) 78,249 (423,838) (3,017,990) Income tax expense (1,083,681) (8,426,042) (2,030,813) 795,602 (10,744,934)
Profit (loss) for the year 11,169,025 (10,189,264) 3,071,705 197,216 4,248,683

PARQUE ARAUCO S.A. AND SUBSIDIARIES NOTES TO THE CONSOLIDATED FINANCIAL STATEMENTS
AS OF DECEMBER 31, 2020 AND 2019 AND FOR THE YEARS ENDED DECEMBER 31, 2020 AND 2019
70
Note 33 - Operating Segments (continued)
12.31.2019 CHILE PERU COLOMBIA OTHER Total
Statement of Income ThCLP$ ThCLP$ ThCLP$ ThCLP$ ThCLP$
Revenue 118,496,566 57,767,617 29,348,579 - 205,612,761 Operating expenses (22,406,608) (11,903,499) (5,652,597) - (39,962,704)
Gross profit 96,089,958 45,864,118 23,695,981 - 165,650,057
Administrative expenses (11,015,929) (5,101,550) (3,729,581) - (19,847,060) Financial income 9,026,300 1,912,439 419,571 86,153 11,444,462 Financial expenses (20,728,015) (14,757,455) (4,549,220) (11,340) (40,046,031) Other income and expenses 62,727,114 (36,548,625) 8,347,055 1,062,990 35,588,534 Income tax expense (31,556,061) (271,525) (5,232,693) 240,627 (36,819,653) Profit (loss) for the year 104,543,367 (8,902,599) 18,951,112 1,378,430 115,970,310
Other Items
12.31.2020 CHILE PERU COLOMBIA Total
ThCLP$ ThCLP$ ThCLP$ ThCLP$
Depreciation (443,577) (491,180) (356,242) (1,290,999)
Amortization (2,140,629) (1,688,058) (140,649) (3,969,336)
12.31.2019 CHILE PERU COLOMBIA Total
ThCLP$ ThCLP$ ThCLP$ ThCLP$
Depreciation (767,299) (690,599) (456,174) (1,914,072)
Amortization (1,588,000) (1,253,786) (2,703) (2,844,490)
Statement of Cash Flows by Segment:
12.31.2020 CHILE PERU COLOMBIA Total ThCLP$ ThCLP$ ThCLP$ ThCLP$
Net cash flows provided by operating activities 40,705,484 13,632,629 9,715,568 64,053,681 Net cash flow used in investing activities (28,244,989) (9,294,223) (25,787,287) (63,326,469) Net cash flows provided by (used in) financing activities 40,798,804 (20,993,201) 35,733,463 55,539,066 Increase (decrease) in cash and cash equivalents before effect of exchange rate changes 53,259,329 (16,654,795) 19,661,745 56,266,278
Effect of changes in exchange rates on cash and cash equivalents (11,400,069) (2,133,578) (1,135,119) (14,668,766) Net increase (decrease) in cash and cash equivalents 41,859,260 (18,788,374) 18,526,625 41,597,512 Cash and cash equivalents at beginning of period 228,093,948 51,739,561 35,601,429 315,434,937 Cash and cash equivalents at end of period 269,953,208 32,951,187 54,128,054 357,032,449
12.31.2019 CHILE PERU COLOMBIA Total ThCLP$ ThCLP$ ThCLP$ ThCLP$
Net cash flows provided by operating activities 87,451,912 44,742,439 15,388,320 147,582,670 Net cash flow used in investing activities (57,045,655) (19,953,693) (15,269,477) (92,268,825) Net cash flows provided by (used in) financing activities (5,893,832) (49,724,637) 24,061,130 (31,557,339) Increase (decrease) in cash and cash equivalents before effect of exchange rate changes 24,512,796 (24,935,892) 24,179,972 23,756,506
Effect of changes in exchange rates on cash and cash equivalents 9,986,904 769,634 (301,695) 10,454,843 Net increase (decrease) in cash and cash equivalents 34,499,329 (24,166,258) 23,878,278 34,211,348 Cash and cash equivalents at beginning of period 200,076,613 71,920,709 9,226,267 281,223,589 Cash and cash equivalents at end of period 234,575,942 47,754,451 33,104,544 315,434,937

PARQUE ARAUCO S.A. AND SUBSIDIARIES NOTES TO THE CONSOLIDATED FINANCIAL STATEMENTS
AS OF DECEMBER 31, 2020 AND 2019 AND FOR THE YEARS ENDED DECEMBER 31, 2020 AND 2019
71
Note 34 - Operating Leases
Parque Arauco S.A. and its subsidiaries have operating leases with operators and shopping center tenants. These agreements produce minimum rental income and variable income. Variable income is determined based on sales made by the leased stores. Minimum future payments receivable under non-cancellable operating leases as of December 31, 2020 and 2019, have been estimated as follows:
Minimum Payments
12.31.2020 12.31.2019
ThCLP$ ThCLP$
Less than one year 134,308,516 183,645,155 Between one and five years 705,156,797 771,072,235 More than five years 966,836,151 1,047,207,459
Total 1,806,301,464 2,001,924,850
Note 35 - Financial Risk Management
The Corporate Finance Department is responsible for obtaining financing for each company's activities and managing exchange rate, interest rate, liquidity, inflation and credit risk. These duties are carried out using a framework of policies and procedures reviewed regularly in order to meet the objective of managing financial risks arising from business needs.
Based on the Company's risk management policies, it uses derivative instruments only to hedge exposures to exchange and interest rate risks from the Company's operations and sources of financing.
The Company does not have any derivative instruments for speculative purposes.
Exchange Rate Risks
The Company is exposed to exchange rate risk from: a) its net exposure to assets and liabilities in foreign currency and b) cash flows received from subsidiaries in Peru and Colombia as dividends. Its greatest exposure to exchange rate risk comes from variations in the Chilean peso with respect to the US dollar, Colombian peso and Peruvian sol.
As of December 31, 2020, the Company has financial liabilities of ThCLP$ 139,548,467 in Peruvian soles that represent 12% of its debt, ThCLP$ 855,572,440 in inflation-indexed units that represent 71%, ThCLP$167,526,573 in Chilean pesos that represent 14% and, lastly, ThCLP$ 46,573,574 in Colombian pesos that represent 4%.
The main effects on accounting of a variation in the US dollar with respect to the Chilean peso (1% appreciation) are as follows:
Net Amount (Asset - Liability) ThCLP$ Currency of Origin (Th) ThUS$ 1% Variation + CLP$/US$ (ThCLP$)
US dollars 47,144,796 66,312 66,312 471,448
Peruvian sol 312,168,590 86,217,745 439,087 3,121,686
Colombian peso 304,068,303 88,883 427,393 3,040,683
Total 663,381,688 933,092 6,633,817 The S$/US$, and COL/US$ exchange rates are assumed to remain constant.
The main effects on accounting of a variation in the Peruvian sol and Colombian peso with respect to the dollar (1% increase in exchange rates), are as follows:

PARQUE ARAUCO S.A. AND SUBSIDIARIES NOTES TO THE CONSOLIDATED FINANCIAL STATEMENTS
AS OF DECEMBER 31, 2020 AND 2019 AND FOR THE YEARS ENDED DECEMBER 31, 2020 AND 2019
72
Note 35 - Financial Risk Management (continued)
Net Amount (Asset - Liability) ThCLP$ Currency of Origin
(Th) ThUS$
1% Variation + S$/US$
1% Variation + COL/US$
US dollars 47,144,796 66,312 66,312 NA NA Peruvian sol 312,168,590 86,217,745 439,087 3,121,686 NA Colombian peso 304,068,303 88,883 427,393 NA 3,040,683
Total 663,381,688 933,092 3,121,686 3,040,683
This considers net values in foreign currency as of December 31, 2020, which can vary significantly over time.
Exchange Rate Sensitivity Analysis
A loss of ThCLP$ 1,064,839 was recognized in the consolidated statements of comprehensive income for the year ended December 31, 2020, for foreign exchange differences related to assets and liabilities denominated in foreign currency.
Interest Rate Risk
Interest rate risk comes mainly from the Company's financing sources and its investments in marketable securities. This risk could lead to a decrease in the value of our assets, an increase in the Company’s current financial obligations and a rise in financing costs for new projects, expansions and improvements.
In terms of financial debt, its main exposure to interest rate risk in prior years has been related to interest-bearing liabilities. However, as of December 31, 2020, it has no floating-rate obligations without fixed-rate hedges. As a result, the Company's financing structure as of December 2020, is comprised of 100% fixed-rate debt. A 0.5% rise in interest rates could affect the floating-rate portion of the Company's debt. The estimated annualized effect on profit and loss is approximately (ThCLP$ 0).
The terms and conditions of the Company's obligations as of December 31, 2020, including exchange rates, interest rate, maturities and effective interest rates, are detailed in Other Financial Liabilities.
Inflation Risk
Inflation risk comes mainly from the Company's financing sources. Its main exposure is related to debt denominated in UF with fixed interest rates. As of December 31, 2020, the Company has a total of ThCLP$ 855,572,440 in debt with inflation-indexed interest rates. However, most of the Company's revenue is also indexed to inflation, creating a natural match. The Company does not actively hedge any potential changes in expected cash flows due to variations in inflation.
Credit Risk
The Company is exposed to credit risk primarily from receivables from customers, which, in a worst-case scenario, could be declared fully uncollectible.
Credit risk related to receivables from clients is managed and monitored by the Credit and Collections Committee. The Company has a broad client base that is managed using policies, procedures and controls defined by the Company. Receivables pending payment are monitored regularly. In addition, the Company has established a policy of requiring guarantees from customers, which may not be provided on time or in the right format. Most of these guarantees are in the form of performance bonds.
The Company uses the simplified approach described in IFRS 9 for expected credit losses, which permits the use of an estimate of expected credit losses over the life of the instrument for all trade receivables. To do this, trade receivables have been grouped by shared credit risk characteristics and days past due.
PARQUE ARAUCO S.A. AND SUBSIDIARIES NOTES TO THE CONSOLIDATED FINANCIAL STATEMENTS
AS OF DECEMBER 31, 2020 AND 2019 AND FOR THE YEARS ENDED DECEMBER 31, 2020 AND 2019
73
Note 35 - Financial Risk Management (continued)
Credit Risk from Financial Instruments from Financial Institutions
The Company has policies to limit its exposure to counterparty credit risk from financial institutions. This risk is monitored frequently. As a result, the Company does not have significant concentrations of credit risk with financial institutions as of December 31, 2020. Its maximum exposure to credit risk from these financial assets is the carrying amount of these assets presented in the statement of financial position.
Liquidity Risk
The Company manages liquidity risk on a consolidated level. Its main source of liquidity is cash flows from operating activities, bank loans or the capital market.
In order to manage its short-term liquidity, the Company uses projected cash flows for a rolling period of 36 months. As of December 31, 2020, the Company has cash and cash equivalents of ThCLP$ 357,032,449 to manage its short-term liquidity needs.
There is a risk of its equity value decreasing or its financial expenses increasing, driving results and project returns downward. Although we have raised capital when necessary in the past to adhere to our financing policies, we cannot guarantee that an increase in financial expenses could be offset in this manner. In any case, the Company’s liquidity and current cash position mitigate, but do not eliminate, this.
Business Risk
Economic and market conditions could adversely impact our operations, causing our sales and results to decline.
We operate our shopping centers in a competitive environment that could lead to an over-supply of shopping centers and, as a result, diminished revenue.
While brick-and-mortar sales continue to dominate the market, online sales are taking on an increasingly important role. In-person sales may be at risk of declining as a result of e-commerce. Therefore, we have decided to diversify our business and invest in several types of assets, including outlets and non-retail real estate projects, although these are still a small part of our portfolio.
Pandemic Risk
This risk stems from the occurrence of an illness, pandemic or epidemic that spreads domestically and/or internationally or infects most of the individuals in a given location or region. Serious diseases that expand across the general population over a period of time are combated by restricting mobility and increasing distance between people, among other measures, in order to slow the spread, which could lead to total or partial closure of places of business and economic contraction. Consequently, the Company's results could be strongly impacted by the possible total or partial closure of its shopping centers; a drastic decline in sales; a reduction in occupancy as a result of slow business and/or financial difficulties for our tenants; greater expenditures on prevention measures; increased financial expenses; higher general financial risk and costs to access capital markets; a relevant rise in delinquency and the risk of not collecting on receivables, combined with other repercussions of such a scenario. Furthermore, such circumstances increase uncertainty and there is a risk of inaccurate assessment of the Company’s actual situation and its commercial relations with tenants and suppliers.
PARQUE ARAUCO S.A. AND SUBSIDIARIES NOTES TO THE CONSOLIDATED FINANCIAL STATEMENTS
AS OF DECEMBER 31, 2020 AND 2019 AND FOR THE YEARS ENDED DECEMBER 31, 2020 AND 2019
74
Note 35 - Financial Risk Management (continued)
Environmental Risks
Global warming and climate change can produce droughts that affect our water and energy network, impacting the prices of basic inputs such as water and electricity. Likewise, over the long term these risks may cause migratory effects that may potentially affect areas where some of our shopping centers are located. These risks are expected to have important impacts. However, as they have not been measured, they cannot be quantified at this time.
Regulatory, Socio-political and Other Risks
Changes in regulatory, security and/or socio-political conditions in the countries where the Company operates may affect its financial results, the value of its real estate assets and its capacity to send or receive funds to or from foreign markets. Governments and regulatory entities can exercise influence through changes to constitutional, civil, commercial, tax, labor, environmental, urban planning and other laws as well as through adjustments to monetary policy, public spending and other aspects that can affect macroeconomic stability, economic activity and the business world. Therefore, social and security conditions and the changes listed above can impact operational continuity, returns on existing and future projects and savings and cash flows used to finance investments or can lengthen the time needed to develop projects, among other effects.
There is also the risk of civil unrest, disasters (natural or otherwise) such as earthquakes, fires, riots, looting, cyber-attacks, supply chain interruptions involving essential health and/or food products and services or other issues, any of which could result in limited or large-scale material damage to our portfolio of shopping centers and/or our business.
Recent phenomena such as the COVID-19 pandemic and social and political problems in some of the markets where we operate, among other issues, lead us to believe that risk levels for these factors have risen substantially. In general, because of events like these and others that may occur in the future, we think uncertainty levels are much higher than they seemed not long ago. Investors must be aware of this and conduct their own assessment of the situation accordingly.
Note 36 - Investments in Associates Accounted for Using the Equity Method
As of December 31, 2020 and 2019, in accordance with IFRS 11, the investments under joint control in Inmobiliaria Mall Viña del Mar S.A., and Desarrollos Panamericana S.A.C., are presented as investments in associates accounted for using the equity method (IAS 28). Details are as follows:
Taxpayer ID
No. Associate % Ownership
Balance as of
01.01.2020
Additional
Dividends
Share of Profit
(Loss) Other
Balance as of
12.31.2020
96.863.570-0 Inmob. Mall Viña del Mar S.A. 50% 95,508,917 - 5,579,124 (1,690,166) 99,397,875
20604463174 Desarrollos Panamericana S.A.C 50% 15,842,902 - (340,760) (1,420,810) 14,081,332
20513561106 Soc. de Inv. y Gestión S.A.C. 50% 5,368,988 - (16,894) (706,473) 4,645,621
20543349403 Inmobiliaria Kotare S.A.C. 50% 488,982 - (9,517) (64,072) 415,393
Total 118,540,222
The amount under Inmobiliaria Mall Viña del Mar S.A. (1,690,166) in the other column consists of regularization of the 2019 fair value (1,067,565) and cash flow hedge reserves (622,601).

PARQUE ARAUCO S.A. AND SUBSIDIARIES NOTES TO THE CONSOLIDATED FINANCIAL STATEMENTS
AS OF DECEMBER 31, 2020 AND 2019 AND FOR THE YEARS ENDED DECEMBER 31, 2020 AND 2019
75
Note 36 - Investments in Associates Accounted for Using the Equity Method (continued)
Taxpayer ID
No. Associate % Ownership
Balance as of
01.01.2019
Additional
Dividends
Share of Profit
(Loss) Other
Balance as of
12.31.2019
96.863.570-0 Inmob. Mall Viña del Mar S.A. 50% 89,928,575 (2,211,387) 7,792,029 - 95,508,917
20604463174 Desarrollos Panamericana S.A.C 50% - - (409,900) - 15,842,902
20513561106 Soc. de Inv. y Gestión S.A.C. 50% - - (177,506) - 5,368,988
20543349403 Inmobiliaria Kotare S.A.C. 50% - - (18,000) - 488,982
Total 117,209,789
Taxpayer ID No. Associate Country Currency Ownership
Interest %
Profit (Loss) of
Associate 12.31.2020
ThCLP$ ThCLP$
96.863.570-0 Inmobiliaria Mall Viña del Mar S.A. Chile Chilean peso 50.00% 11,158,248 5,579,124 20604463174 Desarrollos Panamericana S.A.C Peru Peruvian sol 50.00% (681,519) (340,760) 20513561106 Soc. de Inv. y Gestión S.A.C. Peru Peruvian sol 50.00% (33,788) (16,894) 20543349403 Inmobiliaria Kotare S.A.C. Peru Peruvian sol 50.00% (19,034) (9,517)
5,211,953
Taxpayer ID No. Associate Country Currency Ownership
Interest %
Profit (Loss) of
Associate 12.31.2019
ThCLP$ ThCLP$
96.863.570-0 Inmobiliaria Mall Viña del Mar S.A. Chile Chilean peso 50.00% 15,584,058 7,792,029 20604463174 Desarrollos Panamericana S.A.C Peru Peruvian sol 50.00% (819,800) (409,900) 20513561106 Soc. de Inv. y Gestión S.A.C. Peru Peruvian sol 50.00% (355,013) (177,506) 20543349403 Inmobiliaria Kotare S.A.C. Peru Peruvian sol 50.00% (36,001) (18,000)
7,186,623
Summarized financial information for associates as of December 31, 2020 and 2019, is as follows:
Investments in associates Inmobiliaria Viña del Mar S.A. Desarrollos Panamericana
S.A.C. Soc.de Invers.y Gestión
S.A.C. Inmobiliaria Kotare S.A.C
12.31.2020 12.31.2019 12.31.2020 12.31.2019 12.31.2020 12.31.2019 12.31.2020 12.31.2019
Statement of Financial Position ThCLP$ ThCLP$ ThCLP$ ThCLP$ ThCLP$ ThCLP$ ThCLP$ ThCLP$ Total assets 569,936,407 558,392,785 28,972,483 32,155,537 13,734,166 15,756,348 1,151,190 1,333,356
Total liabilities 426,828,620 400,407,544 809,818 471,089 4,442,924 5,018,373 320,404 355,391
Cash and cash equivalents 30,334,611 22,042,874 455,887 99,973 7,483 135,534 5 8,646
Other financial liabilities, current 11,935,564 62,489,979 - - - - - -
Other financial liabilities, non-current 329,696,086 263,416,672 - - - - - -
Investments in associates Inmobiliaria Viña del Mar S.A. Desarrollos Panamericana
S.A.C. and Subsidiaries Soc.de Invers.y Gestión
S.A.C. Inmobiliaria Kotare S.A.C
12.31.2020 12.31.2019 12.31.2020 12.31.2019 12.31.2020 12.31.2019 12.31.2020 12.31.2019 Profit (loss) for the year ThCLP$ ThCLP$ ThCLP$ ThCLP$ ThCLP$ ThCLP$ ThCLP$ ThCLP$
Revenue 29,271,836 45,614,664 - - - - - -
Expenses (16,245,932) (8,793,224) (614,641) - (12,067) (29,598) (18,811) (19,230)
Depreciation and amortization (546,526) (436,477) - - - (8,305) - -
Financial income 239,173 190,261 21,377 - 7,103 381,593 - -
Financial expenses (7,429,060) (6,214,570) (22,204) - (28,576) (225,266) (173) (1,372)
Other income and expenses 10,058,383 1,075,980 (57,111) (819,800) (248) (473,437) (49) (15,399)
Income tax expense (4,736,153) (16,289,045) (8,939) - - - -

PARQUE ARAUCO S.A. AND SUBSIDIARIES NOTES TO THE CONSOLIDATED FINANCIAL STATEMENTS
AS OF DECEMBER 31, 2020 AND 2019 AND FOR THE YEARS ENDED DECEMBER 31, 2020 AND 2019
76
Note 37 - Financial Derivative Instruments
Details of cash flow hedges as of December 31, 2020 and 2019, presented in other financial assets and liabilities, are as follows:
Type of Derivative Company Bank Contract
Value Maturity Item Total
ThCLP$ Total MTM
Cross Currency Swap Plaza Estación S.A. BCI 14,199,789 3Q 2022 Liability (1,094,359) Cross Currency Swap Parque Arauco S.A. Santander 35,785,260 2Q 2023 Liability (6,284,692) Cross Currency Swap Parque Arauco S.A. ITAU 14,246,520 1Q 2021 Liability (135,901) Cross Currency Swap Parque Arauco S.A. Estado 28,653,510 2Q 2022 Liability (770,853) Cross Currency Swap Arauco Centros Comerciales Regionales S.A. BCI 13,090,941 1Q 2024 Liability (34,059) Cross Currency Swap Arauco Centros Comerciales Regionales S.A. Scotiabank 37,599,205 1Q 2024 Liability (391,560) Cross Currency Swap Arauco Centros Comerciales Regionales S.A. Scotiabank 1,673,618 1Q 2024 Liability (13,373) Cross Currency Swap Arauco Chillán S.A. Scotiabank 36,473,136 2Q 2024 Liability (314,325) Cross Currency Swap Parque Arauco Internacional S.A. Santander 18,007,163 3Q 2021 Liability (168,396) Cross Currency Swap Parque Arauco Internacional S.A. Santander 45,264,329 3Q 2021 Liability (423,295) Cross Currency Swap Parque Arauco Colombia S.A. Scotiabank 19,105,872 2Q 2021 Asset 110,536
Balance 12.31.2020 Total liabilities (9,630,811)
Total assets 110,536
Net total (9,520,276)
Type of Derivative Company Bank Contract
Value Maturity Item Total
ThCLP$ Total MTM
Cross Currency Swap Plaza Estación S.A. BCI 14,199,789 3Q 2022 Liability (1,519,131) Cross Currency Swap Parque Arauco Colombia S.A. Davivienda 22,657,535 2Q 2020 Liability (200,800)
Balance 12.31.2019 Total liabilities (1,719,930)
Total assets -
Net total (1,719,930)
Note 38 - Business Combination
As of December 31, 2019, the following business combination took place: On July 29, 2019, Parque Arauco S.A., announced its acquisition of 52.5% of Fideicomiso Patrimonio Autónomo Alegra Barranquilla, which owns the project under construction Parque Alegra Centro Comercial. The project is being developed on a 46,427 M2 plot located south of the city of Barranquilla, Colombia. On October 9, 2019, an agreement was signed confirming the acquisition of 52.5% of the trust. The agreement also establishes options for the parties to buy or sell the non-controlling interest once construction has been completed on the shopping center and a series of requirements and milestones set forth in the agreement have been fulfilled. Taking control of Parque Arauco Colombia S.A. will enable Parque Arauco, through its subsidiaries, to increase its market share in that country and, once construction is completed on the shopping center, to increase the GLA maintained by the Group in Colombia by 50,000 M2. As of the date of acquisition, Patrimonio Autónomo Alegra Barranquilla has not provided the Group's operating results since it is using December 31, 2019, as the date of purchase for financial-accounting purposes.
a) Consideration transferred: This increase in the interest in Patrimonio Autónomo Alegra Barranquilla will involve a total cash disbursement of ThCLP$26,066,925.
b) Costs related to the acquisition, recorded as an expense: The costs related to the acquisition of Patrimonio Autónomo Alegra Barranquilla recorded as an expense totaled ThCLP $235,973. Those costs consist mainly of fees for financial, tax and legal advising and were recorded in the consolidated statement of comprehensive income.
PARQUE ARAUCO S.A. AND SUBSIDIARIES NOTES TO THE CONSOLIDATED FINANCIAL STATEMENTS
AS OF DECEMBER 31, 2020 AND 2019 AND FOR THE YEARS ENDED DECEMBER 31, 2020 AND 2019
77
Note 38 - Business Combination (continued)
c) Identifiable assets acquired and identifiable liabilities assumed: The following table summarizes the amounts
recorded for assets acquired and liabilities assumed as of the date of acquisition (December 31, 2019):
Net identifiable assets and liabilities acquired Fair Value
ThCLP$
Cash and cash equivalents 88,513
Investment property 21,332,669
Other non-financial assets 2,370,824
Total net identifiable assets acquired 19,050,358
Valuation of business combination:
Goodwill ThCLP$
Participation in equity of acquiring company at fair value (a) 21,134,890
Consideration transferred (2) 26,066,925
Preliminary goodwill determined as of the acquisition date = (2) - (1) 4,932,035
Management has preliminarily determined that 100% of the goodwill identified in the business combination corresponds to investment properties.
Note 39 - Fair Value Determination
Several of the Group's accounting policies and disclosures require it to determine the fair value of financial and non-financial assets and liabilities. Fair values have been determined for valuation and/or disclosure purposes using the following methods:
1. Intangible Assets
Intangible assets are measured at fair value upon acquisition. These fair values are reviewed regularly and re-measured if there is any evidence of impairment.
a) Commercial Trademarks:
The fair value of trademarks acquired in a business combination is based on the estimated value that the intangible asset contributes to cash flows. For these purposes, the value of the trademark has been estimated using a combination of two valuation methods. The first determines the incremental value from owning the trademark, comparing discounted cash flows with and without it (the with and without approach). The second method is based on a current estimate of obtaining and/or creating that intangible asset based on the resources that will be consumed or handed over to obtain the asset (the cost method).
b) Client Portfolio:
The fair value of the client portfolio acquired in a business combination is determined using the excess earnings method for several periods. Based on this method, the asset is accounted for after deducting a reasonable rate of return on the assets that are part of the creation of related cash flows.
c) Other Intangible Assets:
The fair value of backlog contracts has been determined based on the revenue generated by current contracts with their respective maturity dates. The Company defined a percentage of credit risk to be applied as cost and the cash flows were discounted at a rate close to a risk-free rate.

PARQUE ARAUCO S.A. AND SUBSIDIARIES NOTES TO THE CONSOLIDATED FINANCIAL STATEMENTS
AS OF DECEMBER 31, 2020 AND 2019 AND FOR THE YEARS ENDED DECEMBER 31, 2020 AND 2019
78
Note 39 - Fair Value Determination (continued)
2. Investment Properties
Fair values are based on market values, which are the estimated amount at which the properties could be exchanged at the valuation date between knowledgeable, willing parties in an arm's length transaction after a proper trade in which both parties acted voluntarily. When there are no current prices in an active market, the valuation is prepared based on the total estimated cash flows that the Company expects to receive from the property lease. In calculating the valuation of the property, the Company uses a rate of return that reflects the specific risks inherent to the net annual cash flows. a) Sensitivity to net cash flows
A reduction in the estimated net cash flows that the Company expects to receive whether because of a decrease in income, a rise in costs, an increase in tax rates or a combination of these effects, would result in a decrease in an asset’s fair value. An increase in the estimated net cash flows that the Company expects to receive would have the opposite effect.
b) Sensitivity to rates of return
An increase in the rate of return that reflects the specific risks inherent to the net cash flows the Company expects to receive, whether because of an increase in risk-free rates, a rise in the risk premium demanded by the market or a combination of both, would result in a decrease in an asset’s fair value. A decrease in the rate of return that reflects the specific risks inherent to the net cash flows it expects to receive would have the opposite effect. The fair value of investment properties is not based on an appraisal from an independent expert. 3. Derivatives
The fair value of foreign currency forwards is based on the quoted market price, if available. The fair value of interest rate swaps is based on broker quotes.
4. Interest Rates Used to Determine Fair Value
Interest rates used to determine estimated cash flows, for valuing both investment properties and intangible assets, are as follows:
Assets/Liabilities Nominal Interest Rate Nominal Interest Rate
12.31.2020 12.31.2019
Investment properties 8.5% - 10.5% 8.5% - 10.5% Intangible assets 8.5% - 10.5% 8.5% - 10.5%
Cash flows used to determine the fair value of assets consider tax effects contemplated in the operations of the shopping centers (the rates presented are after tax).

PARQUE ARAUCO S.A. AND SUBSIDIARIES NOTES TO THE CONSOLIDATED FINANCIAL STATEMENTS
AS OF DECEMBER 31, 2020 AND 2019 AND FOR THE YEARS ENDED DECEMBER 31, 2020 AND 2019
79
Note 39 - Fair Value Determination (continued)
5. Fair Value Hierarchy
For the fair value measurements recorded in the statement of financial position, the entity discloses the level on the fair value hierarchy with which all fair value measurements are classified. Details of financial instruments at fair value by valuation method are as follows:
Assets/Liabilities Level 1 Level 2 Level 3 12.31.2020
ThCLP$ ThCLP$ ThCLP$ ThCLP$
Intangible assets (note 11) - - 12,983,987 12,983,987 Investment properties (note 14) - - 2,023,099,521 2,023,099,521 Derivatives (net liability) (note 37) - (9,630,811) - (9,630,811)
Assets/Liabilities Level 1 Level 2 Level 3 12.31.2019
ThCLP$ ThCLP$ ThCLP$ ThCLP$
Intangible assets (note 11) - - 18,105,057 18,105,057 Investment properties (note 14) - - 2,022,119,495 2,022,119,495 Derivatives (net liability) (note 37) - (1,719,930) - (1,719,930)
Level 1: Quoted (unadjusted) prices in active markets for identical assets and liabilities. Level 2: Inputs other than the quoted prices included in Level 1 that are observable for the asset or liability, either directly or
indirectly (i.e. price derivatives). Level 3: Unobservable inputs for the asset or liability.
Note 40 - Environment
As required by Circular No. 1,901 issued by the Financial Market Commission, Parque Arauco S.A. and its subsidiaries have made the following disbursements between January 1 and December 31, 2020, related to protecting the environment:
Parent Company or Subsidiary
Project Related to Disbursement
Reason for Disbursemen
t Description of Asset or Expense
Amount Disbursed
ThCLP$
Certain or Estimated Date
of Future Disbursement
Project Completed or
Underway
EJE Construcciones S.A.S
Comprehensive waste management
Waste management
Acquiring compacter, containers, shredder and two compost systems and installing ventilation and extraction systems
20,250 - Completed
EJE Construcciones S.A.S.
Infrastructure for green wall
Landscaping Landscape architecture study and assembling infrastructure for 70mt2 green wall
14,750 - Completed
EJE Construcciones S.A.S
Information desk and family parking area
Inclusiveness Parking area for pregnant women and parents with small children
4,584 - Completed
Inv. Inmob. Bucaramanga
Implement reporting, energy quality study
Energy efficiency
Commissioning Chivor to conduct energy quality study to comply with CREG resolution 015
- Jan-21 In Progress

PARQUE ARAUCO S.A. AND SUBSIDIARIES NOTES TO THE CONSOLIDATED FINANCIAL STATEMENTS
AS OF DECEMBER 31, 2020 AND 2019 AND FOR THE YEARS ENDED DECEMBER 31, 2020 AND 2019
80
Note 40 - Environment (continued)
Parent Company or Subsidiary
Project Related to Disbursement
Reason for Disbursemen
t Description of Asset or Expense
Amount Disbursed
ThCLP$
Certain or Estimated Date
of Future Disbursement
Project Completed or
Underway
Parque Arauco Colombia S.A.
Infrastructure for plant greenhouse
Landscaping Building a greenhouse for plants
5,487 - Completed
Parque Arauco Colombia S.A.
Improving and expanding rainwater treatment plan
Water management
Adjusting tanks, filters and valves to increase capacity of rainwater plant
26,973 - Completed
Inv. Colombianas Arauco
Infrastructure for green wall
Landscaping Installing infrastructure for a green wall
- - Completed
Parque Arauco S.A.
Sustainability software
Environmental management
Sustainability software 14,250 - Completed
Altek Trading S.A.C
Making improvements to environmental management
Environmental management
Installing bins and making improvements to waste room, floor, porcelain tile, roofing, drain network, etc.
52,933 - Completed
Inmobiliaria El Quinde S.A.C.
Making improvements to environmental management (carry over)
Environmental management
Installing bins and making improvements to waste room, floor, porcelain tile, roofing, drain network, etc.
50,041 - Completed
Inmuebles Panamericana S.A.C.
Making improvements to environmental management (carry over)
Environmental management
Installing bins and making improvements to waste room, floor, porcelain tile, roofing, drain network, etc.
52,242 - Completed
Parque Lambramani S.A.C.
Implementing waste water treatment plant (carry over)
Water management
Finalizing implementation of 2018 waste water treatment plant project
9,673 Jan-21 In Progress
Altek Trading S.A.C
100% LED Mall Energy efficiency
Replacing 100% of current lighting fixtures with LED technology
53,115 Jan-21 In Progress

PARQUE ARAUCO S.A. AND SUBSIDIARIES NOTES TO THE CONSOLIDATED FINANCIAL STATEMENTS
AS OF DECEMBER 31, 2020 AND 2019 AND FOR THE YEARS ENDED DECEMBER 31, 2020 AND 2019
81
Note 41 - Contingencies, Commitments and Restrictions
1. COVID-19 Contingency
On March 11, 2020, the World Health Organization declared COVID-19 a global pandemic. To date, this has involved a variety of measures to safeguard people's lives and public health in different countries.
As a result, in 2020 Chilean, Peruvian and Colombian authorities mandated quarantines and issued a series of restrictions forcing tenants providing “non-essential” services to close their doors. The first closure of non-essential services occurred in Peru on March 16th, followed by closures in Chile and Colombia on March 19th. Only businesses considered essential (supermarkets, health centers, banks and pharmacies) remained open. Shopping centers began gradually reopening in June 2020 depending on the public health status of each city and country. Authorities have implemented dynamic plans limiting capacity or forcing non-essential businesses to close based on several criteria, including how public health figures evolve.
In light of the initial quarantine in the three countries where we operate and subsequent measures taken by authorities, Parque Arauco has gradually resumed business while complying with all public health measures mandated in each country. Throughout 2020 the Company has experienced a gradual recovery in shopping center activity levels in these three countries.
In that context, the Company has implemented a flexible commercial strategy to take appropriate measures to deal with a variety of scenarios at shopping centers and with tenants.
In parallel, in order to ensure operational continuity in 2020 it negotiated prices with its main service providers to attain cost savings based on the activity level at each shopping center. Furthermore, in 2020 the Company decided not to furlough workers, but did temporarily reduce salaries for upper management.
In order to mitigate financial effects, the Company has followed a conservative financial strategy of maintaining important cash levels to provide flexibility during the crisis.
The Company has assessed all assumptions used in its asset valuation model in light of the current COVID-19 situation and identified no significant variations.
All of the Company’s employees are permitted to work remotely from home, as long as their job allows. For employees whose positions require them to be physically present at work, the Company has provided all safety implements recommended by public health authorities in each country and implemented protocols to safeguard their health.
Although these circumstances have led to a decline in the Company’s revenue and, therefore, its profit, it is still too early to quantify the overall effects of partial shopping center closures and other measures mandated by authorities, given the current uncertainty as to how this crisis will evolve around the world.

PARQUE ARAUCO S.A. AND SUBSIDIARIES NOTES TO THE CONSOLIDATED FINANCIAL STATEMENTS
AS OF DECEMBER 31, 2020 AND 2019 AND FOR THE YEARS ENDED DECEMBER 31, 2020 AND 2019
82
Note 41 - Contingencies, Commitments and Restrictions (continued)
2. Contingent Liabilities
As of December 31, 2020, the consolidated companies are party to pending lawsuits and proceedings related to their normal operations. The Company has recorded provisions for some lawsuits and proceedings that, in the opinion of its legal counsel, may result in a loss. They are presented in note 17.
Matter No. of Cases
Amount
Involved
(ThCLP$)
Civil 2 94,556 Labor 4 - Criminal court
3 -
Other 4 - Total 13 94,556
3.- Fines
As of December 31, 2020, regulators and other administrative authorities have not issued any fines to the Company or its Directors.
PARQUE ARAUCO S.A. AND SUBSIDIARIES NOTES TO THE CONSOLIDATED FINANCIAL STATEMENTS
AS OF DECEMBER 31, 2020 AND 2019 AND FOR THE YEARS ENDED DECEMBER 31, 2020 AND 2019
83
Note 41 - Contingencies, Commitments and Restrictions (continued)
4. Direct Guarantees
Guarantee Creditor Name Relationship Guarantee Type Assets Carrying Amount
Balance Outstanding
as of 12.31.2020
Balance Outstanding
as of 12.31.2019
Davivienda Parque Arauco Colombia S.A. Subsidiary of subsidiary
Trust Parque La Colina shopping center - - 22,507,331
Bondholders Inmuebles Panamericana S.A. Subsidiary of subsidiary
Trust Megaplaza shopping center 180,105,051 56,954,890 73,827,848
Scotiabank Inmuebles Panamericana S.A. Subsidiary of subsidiary
Trust Real estate in Barranca, Pisco, Chincha, Cañete and Chimbote
48,973,697 23,532,601 31,767,086
5. Indirect Guarantees
Details of performance bonds in force as of December 31, 2020, are as follows:
Company Bank Bond Number Origin Term Maturity Rate Currency Amount Estado Payment Beneficiary Taxpayer ID
No. Reason / Reference
Parque Arauco S.A. Chile 000259-9 7/24/2018 1105 8/2/2021 0.40% UF 1,000.00 Current 30-day notice
Municipality of Chillan 69140900-7 To guarantee the correct use and conservation, functioning and maintenance of pedestrian overpasses during concession term. -
Parque Arauco S.A. Chile 500911-4 2/19/2020 348 2/1/2021 0.40% UF 100.00 Current On
demand Municipality of Las
Condes 69070400-5
To guarantee faithful and timely compliance with all obligations imposed by permit no. 591 for installing, managing and operating an elevator on the southern sidewalk along Avenida Presidente Kennedy - Parque Arauco.
Parque Arauco S.A. Chile 504633-6 6/11/2020 420 8/5/2021 0.40% UF 1,000.00 Current On
demand Municipality of Las
Condes 69070400-5
To guarantee faithful and timely fulfillment of each and every obligation in Decree Section 1 No. 5126 from the Municipality of Las Condes dated November 14, 2016
Todo Arauco S.A. Chile 343029-6 08/03/2020 749 8/22/2022 0.40% CLP$ 1,324,849.00 Current On
demand
Ministry of Public Works - Highway
Department - Coquimbo Region
61.202.000-0 To guarantee faithful compliance with MOP decree No. 1,319 of 1977 of 12/7/1977
Parque Arauco S.A. Chile 506705-7 11/24/2020 394 12/23/2021 0.40% UF 9,000.00 Current 30-day notice
Municipality of Las Condes
69070400-5 To guarantee urban development works along Avda. Presidente Kennedy, Boulevard 2 Parque Arauco S.A., P.E. 245/05 and plan S/7321
Parque Arauco S.A. Chile 506704-9 11/24/2020 394 12/23/2021 0.40% UF 9,610.00 Current 30-day notice
Municipality of Las Condes
69070400-5 To guarantee sidewalk pavement, green area and public lighting works on Lot C-5-B on street Cerro Colorado S-7321.

PARQUE ARAUCO S.A. AND SUBSIDIARIES NOTES TO THE CONSOLIDATED FINANCIAL STATEMENTS
AS OF DECEMBER 31, 2020 AND 2019 AND FOR THE YEARS ENDED DECEMBER 31, 2020 AND 2019
84
Note 41 - Contingencies, Commitments and Restrictions (continued)
6. Other Restrictions Details of bonds payable and their associated covenants as of December 31, 2020, are as follows:
Bank Company Start Maturity Covenant / Restriction Limit Current Cushion
Series K bonds Parque Arauco S.A. 9/1/2014 9/1/2039 Net financial debt / equity <= 1.50 0.79 0.71
Series O bonds Parque Arauco S.A. 3/1/2015 3/1/2040 Net financial debt / equity <= 1.50 0.79 0.71
Series P bonds Parque Arauco S.A. 10/1/2016 10/1/2023 Net financial debt / equity <= 1.50 0.79 0.71
Series R bonds Parque Arauco S.A. 10/1/2016 10/1/2037 Net financial debt / equity <= 1.50 0.79 0.71
Series T bonds Parque Arauco S.A. 8/5/2018 8/5/2025 Net financial debt / equity <= 1.50 0.79 0.71
Series V bonds Parque Arauco S.A. 8/5/2018 8/5/2028 Net financial debt / equity <= 1.50 0.79 0.71
Series X bonds Parque Arauco S.A. 2/20/2020 8/5/2025 Net financial debt / equity <= 1.50 0.79 0.71
Series AA bonds Parque Arauco S.A. 6/5/2020 12/5/2029 Net financial debt / equity <= 1.50 0.79 0.71
Estado Parque Arauco S.A. 4/3/2006 4/3/2021 Net financial debt / equity <= 1.50 0.79 0.71
Estado Parque Arauco S.A. 6/12/2007 6/12/2027 Net financial debt / equity <= 1.50 0.79 0.71
Banco de Chile Parque Arauco S.A. 5/13/2019 5/13/2020 Net financial debt / equity <= 1.50 0.79 0.71
Nova Scotia Parque Arauco S.A. 3/31/2020 3/31/2023 Net liabilities / equity <= 1.50 0.91 0.59
Scotiabank Chile Todo Arauco S.A. 2/13/2020 2/13/2025 Net financial debt / equity <= 1.50 0.17 1.33
EBITDA / Financial Expenses >= 2.50 3.92 1.42
Scotiabank Chile Centro Comercial Arauco Express Ciudad Empresarial S.A. 12-01-2017 12/1/2021 Net financial debt / equity <= 1.10 0.29 0.81
Investment Property / Net Financial Debt >= 1.50 4.87 3.37
BCI Plaza Estación S.A. 07-03-2012 7/3/2022 (Ebitda-Dividends)/(FE+Amort. Bank Debt) > 1.20 2.94 1.74
Net Financial Debt/ Ebitda < 4.00 -0.78 4.78
Scotiabank Arauco Centros Comerciales Regionales S.A. 1/30/2019 1/30/2024 Bank Debt/Collateral <= 0.85 0.49 0.36
Scotiabank Arauco Chillán SpA 4/29/2019 4/29/2024 Bank Debt ACCR + ACH/Collateral <= 0.85 0.83 0.02

PARQUE ARAUCO S.A. AND SUBSIDIARIES NOTES TO THE CONSOLIDATED FINANCIAL STATEMENTS
AS OF DECEMBER 31, 2020 AND 2019 AND FOR THE YEARS ENDED DECEMBER 31, 2020 AND 2019
85
Note 41 - Contingencies, Commitments and Restrictions (continued)
Bank Company Start Maturity Covenant / Restriction Limit Current Cushion
Bonds (second issuance) BCP Inmuebles Panamericana S.A. 1/20/2012 1/20/2032 Rental income/debt service >= 2.00 2.88 0.88 Deferred liabilities/equity <= 1.75 1.08 0.67
EBITDA/debt service >= 1.75 1.75 0.00
Bonds (third issuance) BCP Inmuebles Panamericana S.A. 1/20/2012 1/20/2032 Rental income/debt service >= 2.00 2.88 0.88 Deferred liabilities/equity <= 1.75 1.08 0.67
EBITDA/debt service >= 1.75 1.75 0.00
Bonds (fourth issuance) BCP Inmuebles Panamericana S.A. 9/10/2015 9/10/2045 Rental income/debt service >= 2.00 2.88 0.88 Deferred liabilities/equity <= 1.75 1.08 0.67
EBITDA/debt service >= 1.75 1.75 0.00
Bonds (fifth issuance) BCP Inmuebles Panamericana S.A. 9/10/2015 9/10/2040 Rental income/debt service >= 2.00 2.88 0.88 Deferred liabilities/equity <= 1.75 1.08 0.67
EBITDA/debt service >= 1.75 1.75 0.00
Bonds (sixth issuance) Scotiabank
Inmuebles Panamericana S.A. 1/19/2017 1/20/2042 Rental income/debt service >= 2.00 2.65 0.65 Deferred liabilities/equity <= 1.75 1.46 0.29
EBITDA/debt service >= 1.75 1.75 0.00
Bonds (seventh issuance) Scotiabank
Inmuebles Panamericana S.A. 1/19/2017 1/19/2042 Rental income/debt service >= 2.00 2.65 0.65 Deferred liabilities/equity <= 1.75 1.46 0.29
EBITDA/debt service >= 1.75 1.75 0.00

PARQUE ARAUCO S.A. AND SUBSIDIARIES NOTES TO THE CONSOLIDATED FINANCIAL STATEMENTS
AS OF DECEMBER 31, 2020 AND 2019 AND FOR THE YEARS ENDED DECEMBER 31, 2020 AND 2019
86
Note 41 - Contingencies, Commitments and Restrictions (continued)
6. Other Restrictions
Covenants
The covenants in the table above have been met by the different companies restricted by these commitments.
The restriction of GLA greater than 400,000 m2 set for the bond series K, L, O, P, R, T, V, X and AA has also been met.
Details of guarantees in force as of December 31, 2020, are as follows:
- The covenant for Arauco Centros Comerciales Regionales SpA and Arauco Chillán SpA is based on an appraisal dated January 14, 2019, which is valid for two years.
- The properties Mall Arauco Quilicura and Mall Arauco El Bosque are mortgaged in favor of Scotiabank Chile to guarantee all loans taken out by Arauco Centros Comerciales
Regionales SpA and Arauco Chillán SpA with that bank.
- The property Mall Parque Angamos is mortgaged in favor of Banco de Chile to guarantee all loans taken out by Parque Angamos SpA with that bank.
- The loan taken out by Desarrollos Inmobiliarios San Antonio S.A., restricts that company’s debt to 650,000 UF.
- The property Mall Arauco Coronel is financed with a lease.
- The second, third, fourth, fifth, sixth and seventh issuances of bonds by Inmuebles Panamericana S.A., are guaranteed by the trust of the shopping center Megaplaza Norte.
- The property Stripcenter el Peñon is financed with a lease.
- PASA’s loan with Bank of Nova Scotia prohibits the sale of the asset Parque Arauco Kennedy.
- K bond: As of September 2021, if the ratio of EBITDA/Financial expenses < 2.0, one installment will be deposited in a reserve account. If the ratio of EBITDA/Financial expenses
< 1.0, two installments will be deposited in a reserve account.
For calculations:
EBITDA = Revenue – Costs of sale – Administrative expenses + Depreciation + Amortization
Net Financial Debt = Other current financial liabilities + Other non-current financial liabilities – Cash and cash equivalents
Equity = Equity attributable to equity holders of the parent + Non-controlling interest
Total Equity = Total current liabilities + Total non-current liabilities
Net liabilities = Total liabilities – Deferred tax liabilities – Cash and cash equivalents
Debt = (Ebitda - Capex - Income Tax) / (Debt amortization + Debt interest)
Leverage = (Total liabilities - Deferred liabilities - Minority interest - Subordinated debt ) / Equity
Contracted income = Income / (Amortization + Financial expenses)

PARQUE ARAUCO S.A. AND SUBSIDIARIES NOTES TO THE CONSOLIDATED FINANCIAL STATEMENTS
AS OF DECEMBER 31, 2020 AND 2019 AND FOR THE YEARS ENDED DECEMBER 31, 2020 AND 2019
87
Note 42 - Subsequent Events No subsequent events have occurred between January 1, 2021, and the date of issuance of these interim consolidated financial statements that may significantly affect the Company’s and its subsidiaries’ financial situation or results as of December 31, 2020.

223
PA
RQ
UE
AR
AU
CO
IN
TE
GR
AT
ED
RE
PO
RT
20
20
GOVERNANCEAND COMMUNITYINTRODUCTION ABOUT US
ECONOMIC PERFORMANCE
ENVIRONMENTAL PERFORMANCE
SOCIAL PERFORMANCE
ADDITIONAL INFORMATION
FINANCIAL INFORMATION
Management analysis Independent auditors’ report Consolidated financial statements Summarized financial statements of subsidiaries
Summarized financial statements of subsidiaries
223
PA
RQ
UE
AR
AU
CO
IN
TE
GR
AT
ED
RE
PO
RT
20
20
7.4

TODO ARAUCO S.A.
2020 2019 STATEMENT OF FINANCIAL POSITION THCLP$ THCLP$
Assets Current assets 7,669,369 6,106,216 Non-current assets 126,563,089 124,952,276 Total assets 134,232,457 131,058,492 Liabilities and equity Current liabilities 1,840,626 19,421,238 Non-current liabilities 43,037,958 21,331,491 Equity attributable to equity holders of the parent 89,353,873 90,305,763 Non-controlling interest
Total liabilities and equity 134,232,457 131,058,492
2020 2019 SUMMARIZED STATEMENT OF INCOME THCL
P$ THCLP$
Revenue 6,373,376 10,106,686 Operating expenses (601,876) (1,263,786) Gross profit 5,771,500 8,845,900 Administrative expenses (1,587,935) (699,368) Other income 6,625,452 4,675,008 Other expenses (3,720,374) (378,657) Net operating income (loss) 7,088,643 12,439,882 Financial income 2,325 37,238 Financial expenses (1,146,099) (594,792) Foreign exchange differences (6) (1,188) Share of profit (loss) of equity method associates and joint ventures
Gain (loss) on indexed assets and liabilities 19,089 19,241 Income tax benefit (expense) (1,212,667) (2,872,312) Profit (loss) for the year 4,751,284 9,028,070 Profit (loss) attributable to equity holders of the parent 4,751,284 9,028,070 Profit (loss) attributable to non-controlling interest 0 0 Profit (loss) for the year 4,751,284 9,028,070
2020 2019 SUMMARIZED STATEMENT OF CASH FLOWS TH
CLP$
THCLP$
Net cash flows provided by (used in) operating activities 4,811,482 7,238,153 Net cash flows provided by (used in) investing activities (32,281,075) (39,902,420) Net cash flows provided by (used in) financing activities 30,583,050 32,460,561 Net increase (decrease) in cash and cash equivalents, before effect of exchange rate changes
3,113,456
(203,707)
Effect of exchange rate changes on cash and cash equivalents 13,474 10,849 Net increase (decrease) in cash and cash equivalents 3,126,930 (192,858) Cash and cash equivalents at beginning of period 116,531 309,389 Cash and cash equivalents at end of period 3,243,461 116,531

COMERCIAL ARAUCO LIMITADA
2020 2019 STATEMENT OF FINANCIAL POSITION THCLP$ THCLP$
Assets Current assets 0 0 Non-current assets 0 0 Total assets 0 0 Liabilities and equity Current liabilities 0 10,648 Non-current liabilities 0 0 Equity attributable to equity holders of the parent 0 (10,648) Non-controlling interest
Total liabilities and equity 0 0
2020 2019 SUMMARIZED STATEMENT OF INCOME THCLP$ THCLP$
Revenue 0 0 Operating expenses 0 0 Gross profit 0 Administrative expenses (4,073) Other income 9,221 Other expenses 1,428
Net operating income (loss) 10,649 (4,073) Financial income Financial expenses Foreign exchange differences Share of profit (loss) of equity method associates and joint ventures Gain (loss) on indexed assets and liabilities Income tax benefit (expense)
Profit (loss) for the year 10,649 (4,073) Profit (loss) attributable to equity holders of the parent 10,649 (4,073) Profit (loss) attributable to non-controlling interest 0 0 Profit (loss) for the year 10,649 (4,073)
2019 2019 SUMMARIZED STATEMENT OF CASH FLOWS THCLP$ THCLP$
Net cash flows provided by (used in) operating activities 0 0 Net cash flows provided by (used in) investing activities 0 0 Net cash flows provided by (used in) financing activities 0 0 Net increase (decrease) in cash and cash equivalents, before effect of exchange rate changes
0
0
Effect of exchange rate changes on cash and cash equivalents 0 0 Net increase (decrease) in cash and cash equivalents 0 0 Cash and cash equivalents at beginning of period 0 0 Cash and cash equivalents at end of period 0 0

NUEVA ARAUCO SPA
2020 2019 STATEMENT OF FINANCIAL POSITION THCLP$ THCLP$
Assets Current assets 14,399 25,665 Non-current assets 409,720 405,790 Total assets 424,119 431,502 Liabilities and equity Current liabilities 723 4,568 Non-current liabilities 0 0 Equity attributable to equity holders of the parent 423,396 426,934 Non-controlling interest
Total liabilities and equity 424,119 431,502
2020 2019 SUMMARIZED STATEMENT OF INCOME THCLP$ THCLP$
Revenue 0 0 Operating expenses 0 0 Gross profit 0 0 Administrative expenses - - Other income Other expenses 1,410 (4,704) Net operating income (loss) 1,410 (4,704) Financial income
Financial expenses Foreign exchange differences Share of profit (loss) of equity method associates and joint ventures 19,329 63,997 Gain (loss) on indexed assets and liabilities (71) Income tax benefit (expense) (4,707) (7,601) Profit (loss) for the year 15,962 51,691 Profit (loss) attributable to equity holders of the parent 15,962 51,691 Profit (loss) attributable to non-controlling interest 0 0 Profit (loss) for the year 15,962 51,691
2020 2019 SUMMARIZED STATEMENT OF CASH FLOWS THCLP$ THCLP$
Net cash flows provided by (used in) operating activities (5,495) (9,365) Net cash flows provided by (used in) investing activities (155) (500,739) Net cash flows provided by (used in) financing activities 5,495 514,306 Net increase (decrease) in cash and cash equivalents, before effect of exchange rate changes
(155)
4,202
Effect of exchange rate changes on cash and cash equivalents 0 0 Net increase (decrease) in cash and cash equivalents (155) 4,202 Cash and cash equivalents at beginning of period 7,163 2,960 Cash and cash equivalents at end of period 7,008 7,163

ARAUCO MALLS CHILE S.A. AND SUBSIDIARY
2020 2019 STATEMENT OF FINANCIAL POSITION THCLP$ THCLP$
Assets Current assets 5,928,556 7,222,859 Non-current assets 164,720,530 160,851,819 Total assets 170,649,087 168,074,678 Liabilities and equity Current liabilities 2,130,085 3,726,190 Non-current liabilities 32,886,078 29,285,983 Equity attributable to equity holders of the parent 135,632,924 135,062,505 Non-controlling interest
Total liabilities and equity 170,649,087 168,074,678
2020 2019 SUMMARIZED STATEMENT OF INCOME THCL
P$ THCLP$
Revenue 8,814,945 16,023,899 Operating expenses 452,746 (603,258) Gross profit 9,267,692 15,420,641 Administrative expenses (1,771,084) (1,050,809) Other income 3,708,308 18,161,874 Other expenses (384,367) (127,887) Net operating income (loss) 10,820,549 32,403,819 Financial income 36,255 129,727 Financial expenses (29,177) (113) Foreign exchange differences 10 3,399 Share of profit (loss) of equity method associates and joint ventures 0 0 Gain (loss) on indexed assets and liabilities 15,954 61,958 Income tax benefit (expense) (2,578,140) (8,665,622) Profit (loss) for the year 8,265,450 23,933,168 Profit (loss) attributable to equity holders of the parent 8,265,450 23,933,168 Profit (loss) attributable to non-controlling interest 0 0 Profit (loss) for the year 8,265,450 23,933,168
2020 2019 SUMMARIZED STATEMENT OF CASH FLOWS TH
CLP$
THCLP$
Net cash flows provided by (used in) operating activities 6,112,321 12,415,776 Net cash flows provided by (used in) investing activities (23,275,957) (52,906,050) Net cash flows provided by (used in) financing activities 16,539,466 36,136,721 Net increase (decrease) in cash and cash equivalents, before effect of exchange rate changes
(624,170)
(4,353,553)
Effect of exchange rate changes on cash and cash equivalents 37,365 21,917 Net increase (decrease) in cash and cash equivalents (586,805) (4,331,637) Cash and cash equivalents at beginning of period 1,876,578 6,208,215 Cash and cash equivalents at end of period 1,289,773 1,876,578

INMOBILIARIA PASEO DE LA ESTACIÓN S.A. AND SUBSIDIARY
2020 2019 STATEMENT OF FINANCIAL POSITION THCLP$ THCLP$
Assets Current assets 11,630,624 11,061,643 Non-current assets 93,283,840 91,264,540 Total assets 104,914,463 102,326,183 Liabilities and equity Current liabilities 4,640,891 6,697,612 Non-current liabilities 18,386,531 19,517,465 Equity attributable to equity holders of the parent 81,683,496 75,935,685 Non-controlling interest 203,546 175,421 Total liabilities and equity 104,914,463 102,326,183
2020 2019 SUMMARIZED STATEMENT OF INCOME THCL
P$ THCLP$
Revenue 9,354,252 15,846,146 Operating expenses (1,039,110) (1,308,727) Gross profit 8,315,141 14,537,419 Administrative expenses (3,242,006) (1,915,840) Other income 1,199,545 25,855 Other expenses 44,081 (22,822,828) Net operating income (loss) 6,316,761 (10,175,394) Financial income 144,059 195,512 Financial expenses (264,970) (334,081) Foreign exchange differences (303) (185) Share of profit (loss) of equity method associates and joint ventures
Gain (loss) on indexed assets and liabilities (81,473) (164,627) Income tax benefit (expense) (1,151,004) 3,179,761 Profit (loss) for the year 4,963,070 (7,299,014) Profit (loss) attributable to equity holders of the parent 4,939,723 (7,356,098) Profit (loss) attributable to non-controlling interest 23,347 57,084 Profit (loss) for the year 4,963,070 (7,299,014)
2020 2019 SUMMARIZED STATEMENT OF CASH FLOWS THCLP$ THCLP$
Net cash flows provided by (used in) operating activities 5,847,818 10,983,825 Net cash flows provided by (used in) investing activities (23,403,598) (34,212,336) Net cash flows provided by (used in) financing activities 18,685,649 27,486,093 Net increase (decrease) in cash and cash equivalents, before effect of exchange rate changes
1,129,868
4,257,582
Effect of exchange rate changes on cash and cash equivalents 25,169 14,566 Net increase (decrease) in cash and cash equivalents 1,155,038 4,272,147 Cash and cash equivalents at beginning of period 7,333,707 3,061,560 Cash and cash equivalents at end of period 8,488,745 7,333,707
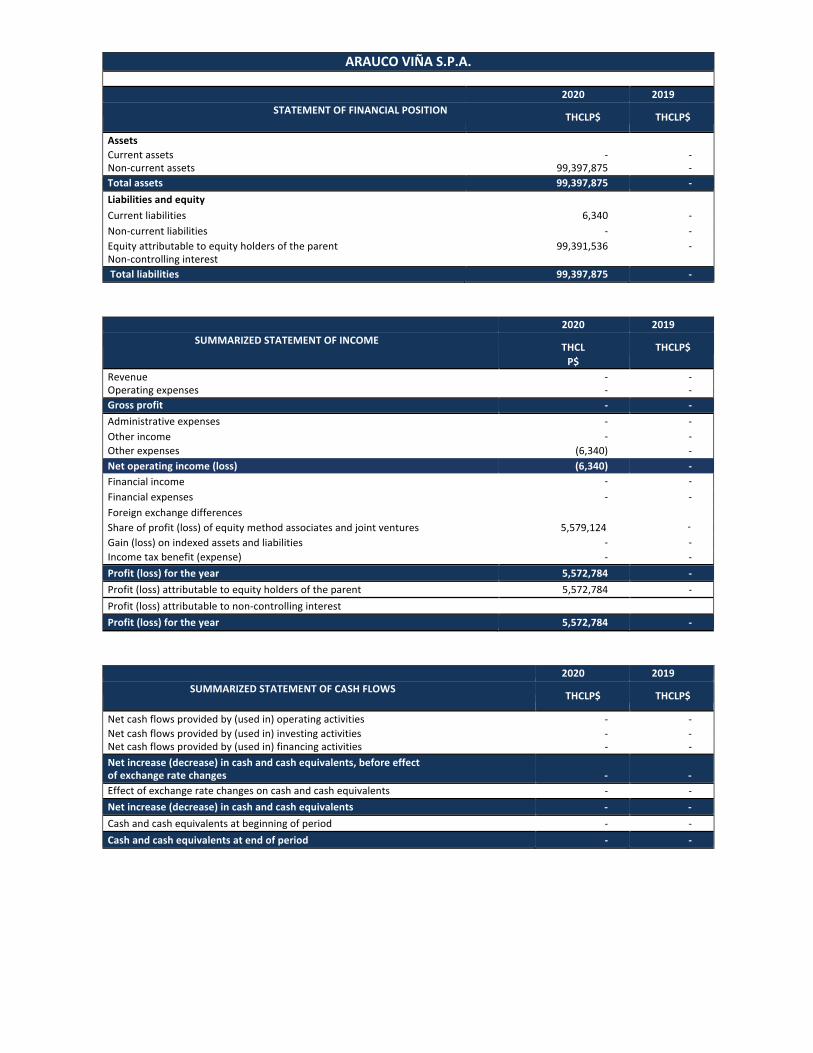
ARAUCO VIÑA S.P.A.
2020 2019 STATEMENT OF FINANCIAL POSITION THCLP$ THCLP$
Assets Current assets - - Non-current assets 99,397,875 - Total assets 99,397,875 - Liabilities and equity Current liabilities 6,340 - Non-current liabilities - - Equity attributable to equity holders of the parent 99,391,536 - Non-controlling interest
Total liabilities 99,397,875 -
2020 2019 SUMMARIZED STATEMENT OF INCOME THCL
P$ THCLP$
Revenue - - Operating expenses - - Gross profit - - Administrative expenses - - Other income - - Other expenses (6,340) - Net operating income (loss) (6,340) - Financial income - - Financial expenses - - Foreign exchange differences Share of profit (loss) of equity method associates and joint ventures 5,579,124 -
Gain (loss) on indexed assets and liabilities - - Income tax benefit (expense) - - Profit (loss) for the year 5,572,784 - Profit (loss) attributable to equity holders of the parent 5,572,784 - Profit (loss) attributable to non-controlling interest Profit (loss) for the year 5,572,784 -
2020 2019 SUMMARIZED STATEMENT OF CASH FLOWS THCLP$ THCLP$
Net cash flows provided by (used in) operating activities - - Net cash flows provided by (used in) investing activities - - Net cash flows provided by (used in) financing activities - - Net increase (decrease) in cash and cash equivalents, before effect of exchange rate changes
-
-
Effect of exchange rate changes on cash and cash equivalents - - Net increase (decrease) in cash and cash equivalents - - Cash and cash equivalents at beginning of period - - Cash and cash equivalents at end of period - -
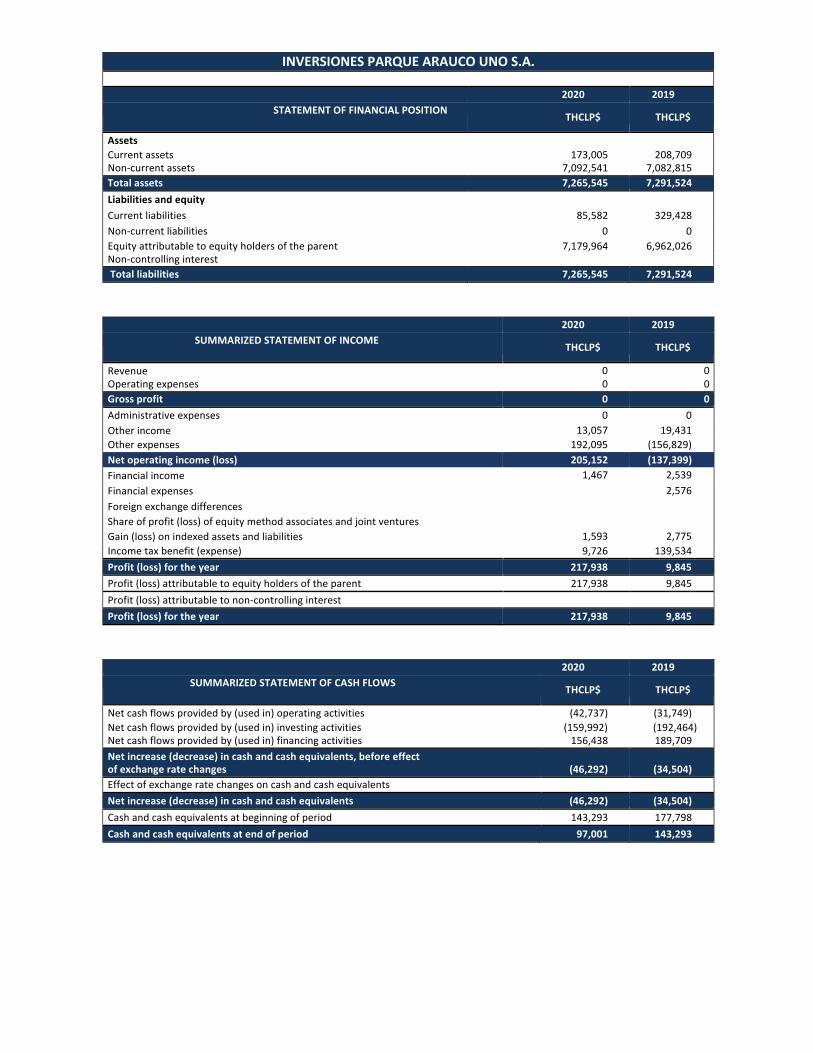
INVERSIONES PARQUE ARAUCO UNO S.A.
2020 2019 STATEMENT OF FINANCIAL POSITION THCLP$ THCLP$
Assets Current assets 173,005 208,709 Non-current assets 7,092,541 7,082,815 Total assets 7,265,545 7,291,524 Liabilities and equity Current liabilities 85,582 329,428 Non-current liabilities 0 0 Equity attributable to equity holders of the parent 7,179,964 6,962,026 Non-controlling interest
Total liabilities 7,265,545 7,291,524
2020 2019 SUMMARIZED STATEMENT OF INCOME THCLP$ THCLP$
Revenue 0 0 Operating expenses 0 0 Gross profit 0 0 Administrative expenses 0 0 Other income 13,057 19,431 Other expenses 192,095 (156,829) Net operating income (loss) 205,152 (137,399) Financial income 1,467 2,539 Financial expenses 2,576 Foreign exchange differences Share of profit (loss) of equity method associates and joint ventures
Gain (loss) on indexed assets and liabilities 1,593 2,775 Income tax benefit (expense) 9,726 139,534 Profit (loss) for the year 217,938 9,845 Profit (loss) attributable to equity holders of the parent 217,938 9,845 Profit (loss) attributable to non-controlling interest Profit (loss) for the year 217,938 9,845
2020 2019 SUMMARIZED STATEMENT OF CASH FLOWS THCLP$ THCLP$
Net cash flows provided by (used in) operating activities (42,737) (31,749) Net cash flows provided by (used in) investing activities (159,992) (192,464) Net cash flows provided by (used in) financing activities 156,438 189,709 Net increase (decrease) in cash and cash equivalents, before effect of exchange rate changes
(46,292)
(34,504)
Effect of exchange rate changes on cash and cash equivalents Net increase (decrease) in cash and cash equivalents (46,292) (34,504) Cash and cash equivalents at beginning of period 143,293 177,798 Cash and cash equivalents at end of period 97,001 143,293

PARQUE ANGAMOS SPA
2020 2019 STATEMENT OF FINANCIAL POSITION THCLP$ THCLP$
Assets Current assets 902,842 2,322,475 Non-current assets 17,386,598 16,700,930 Total assets 18,289,440 19,023,405 Liabilities and equity Current liabilities 11,175,873 414,236 Non-current liabilities 107,539 12,109,902 Equity attributable to equity holders of the parent 7,006,028 6,499,268 Non-controlling interest
Total liabilities and equity 18,289,440 19,023,405
2020 2019 SUMMARIZED STATEMENT OF INCOME THCL
P$ THCLP$
Revenue 1,368,275 1,367,468 Operating expenses (550,246) (500,568) Gross profit 818,029 866,900 Administrative expenses (280,379) (137,433) Other income 688,316 1,286 Other expenses 6,979 (9,608,924) Net operating income (loss) 1,232,945 (8,878,171) Financial income 25,371 48,987 Financial expenses (329,753) (312,148) Foreign exchange differences 1 (18) Share of profit (loss) of equity method associates and joint ventures
Gain (loss) on indexed assets and liabilities (314,974) (304,801) Income tax benefit (expense) (41,605) 3,038,652 Profit (loss) for the year 571,986 (6,407,501) Profit (loss) attributable to equity holders of the parent 571,986 (6,407,501) Profit (loss) attributable to non-controlling interest Profit (loss) for the year 571,986 (6,407,501)
2020 2019 SUMMARIZED STATEMENT OF CASH FLOWS THCLP$ THCLP$
Net cash flows provided by (used in) operating activities 779,956 3,215,525 Net cash flows provided by (used in) investing activities (3,908,449) (5,139,239) Net cash flows provided by (used in) financing activities 1,733,663 3,251,965 Net increase (decrease) in cash and cash equivalents, before effect of exchange rate changes
(1,394,830)
1,328,251
Effect of exchange rate changes on cash and cash equivalents 2,908 1,802 Net increase (decrease) in cash and cash equivalents (1,391,923) 1,330,053 Cash and cash equivalents at beginning of period 1,626,354 296,300 Cash and cash equivalents at end of period 234,431 1,626,354

CENTROS COMERCIALES VECINALES ARAUCO EXPRESS S.A. AND SUBSIDIARY
2019 2019 STATEMENT OF FINANCIAL POSITION THCLP$ THCLP$
Assets Current assets 2,211,792 2,412,939 Non-current assets 67,794,666 68,092,006 Total assets 70,006,458 70,504,944 Liabilities and equity Current liabilities 1,928,996 2,162,622 Non-current liabilities 55,886,052 55,349,582 Equity attributable to equity holders of the parent 12,191,387 12,992,698 Non-controlling interest 24 42 Total liabilities and equity 70,006,458 70,504,944
2020 2019 SUMMARIZED STATEMENT OF INCOME THCL
P$ THCLP$
Revenue 5,407,067 6,467,272 Operating expenses (1,586,073) (1,681,734) Gross profit 3,820,994 4,785,538 Administrative expenses (1,395,327) (523,334) Other income 3,228,008 28,872 Other expenses (3,747,603) (7,260,810) Net operating income (loss) 1,906,071 (2,969,733) Financial income 8,563 76,450 Financial expenses (1,729,549) (1,450,811) Foreign exchange differences - 322 Share of profit (loss) of equity method associates and joint ventures
Gain (loss) on indexed assets and liabilities (1,276,306) (1,222,613) Income tax benefit (expense) 426,574 1,441,221 Profit (loss) for the year (664,647) (4,125,163) Profit (loss) attributable to equity holders of the parent (664,628) (4,210,208) Profit (loss) attributable to non-controlling interest (18) 85,045 Profit (loss) for the year (664,647) (4,125,163)
2020 2019 SUMMARIZED STATEMENT OF CASH FLOWS THCLP$ THCLP$
Net cash flows provided by (used in) operating activities 3,656,538 5,029,479 Net cash flows provided by (used in) investing activities (322,023) (44,379,353) Net cash flows provided by (used in) financing activities (2,533,178) 39,335,180 Net increase (decrease) in cash and cash equivalents, before effect of exchange rate changes
801,336
(14,693)
Effect of exchange rate changes on cash and cash equivalents 11,923 6,973 Net increase (decrease) in cash and cash equivalents 813,260 (7,721) Cash and cash equivalents at beginning of period 655,519 663,239 Cash and cash equivalents at end of period 1,468,778 655,519
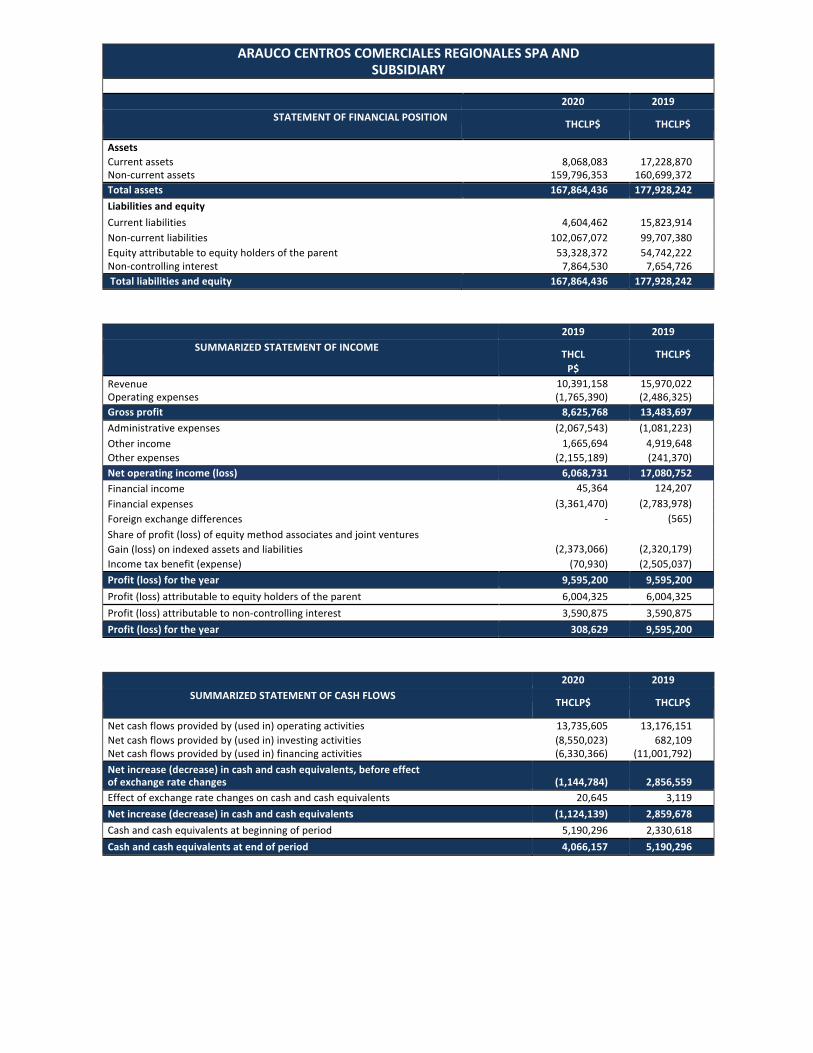
ARAUCO CENTROS COMERCIALES REGIONALES SPA AND
SUBSIDIARY
2020 2019 STATEMENT OF FINANCIAL POSITION THCLP$ THCLP$
Assets Current assets 8,068,083 17,228,870 Non-current assets 159,796,353 160,699,372 Total assets 167,864,436 177,928,242 Liabilities and equity Current liabilities 4,604,462 15,823,914 Non-current liabilities 102,067,072 99,707,380 Equity attributable to equity holders of the parent 53,328,372 54,742,222 Non-controlling interest 7,864,530 7,654,726 Total liabilities and equity 167,864,436 177,928,242
2019 2019 SUMMARIZED STATEMENT OF INCOME THCL
P$ THCLP$
Revenue 10,391,158 15,970,022 Operating expenses (1,765,390) (2,486,325) Gross profit 8,625,768 13,483,697 Administrative expenses (2,067,543) (1,081,223) Other income 1,665,694 4,919,648 Other expenses (2,155,189) (241,370) Net operating income (loss) 6,068,731 17,080,752 Financial income 45,364 124,207 Financial expenses (3,361,470) (2,783,978) Foreign exchange differences - (565) Share of profit (loss) of equity method associates and joint ventures
Gain (loss) on indexed assets and liabilities (2,373,066) (2,320,179) Income tax benefit (expense) (70,930) (2,505,037) Profit (loss) for the year 9,595,200 9,595,200 Profit (loss) attributable to equity holders of the parent 6,004,325 6,004,325 Profit (loss) attributable to non-controlling interest 3,590,875 3,590,875 Profit (loss) for the year 308,629 9,595,200
2020 2019 SUMMARIZED STATEMENT OF CASH FLOWS THCLP$ THCLP$
Net cash flows provided by (used in) operating activities 13,735,605 13,176,151 Net cash flows provided by (used in) investing activities (8,550,023) 682,109 Net cash flows provided by (used in) financing activities (6,330,366) (11,001,792) Net increase (decrease) in cash and cash equivalents, before effect of exchange rate changes
(1,144,784)
2,856,559
Effect of exchange rate changes on cash and cash equivalents 20,645 3,119 Net increase (decrease) in cash and cash equivalents (1,124,139) 2,859,678 Cash and cash equivalents at beginning of period 5,190,296 2,330,618 Cash and cash equivalents at end of period 4,066,157 5,190,296
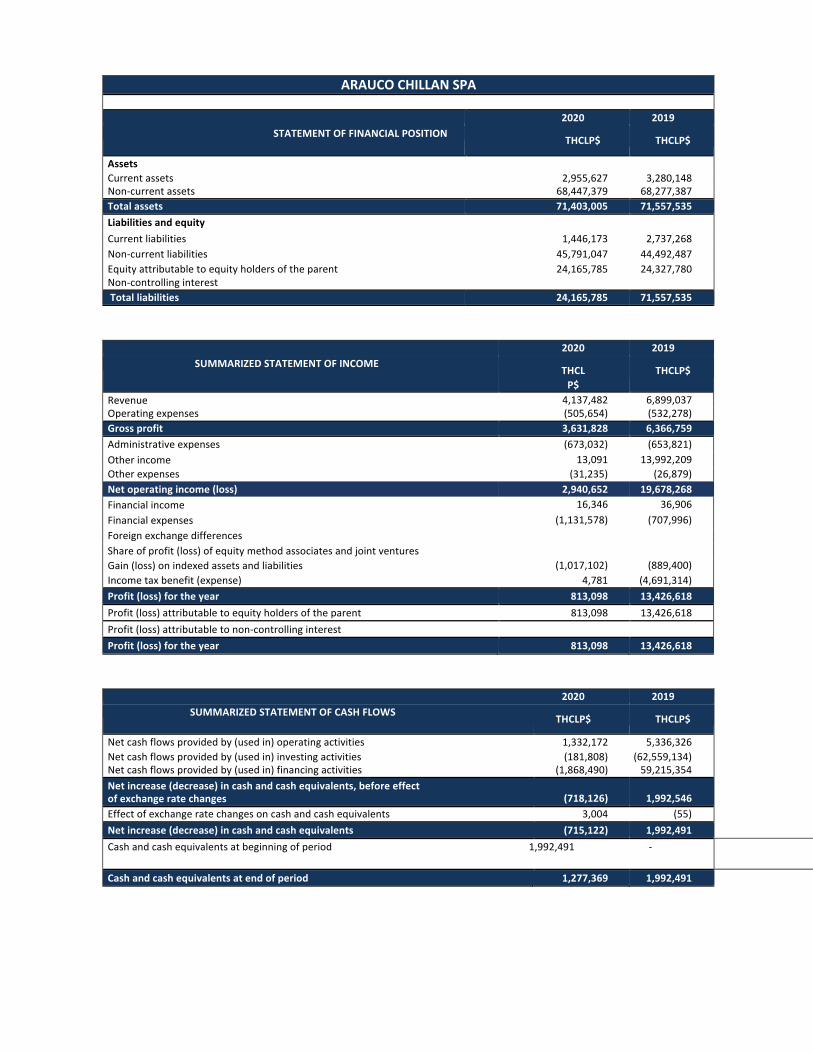
ARAUCO CHILLAN SPA
2020 2019 STATEMENT OF FINANCIAL POSITION THCLP$ THCLP$
Assets Current assets 2,955,627 3,280,148 Non-current assets 68,447,379 68,277,387 Total assets 71,403,005 71,557,535 Liabilities and equity Current liabilities 1,446,173 2,737,268 Non-current liabilities 45,791,047 44,492,487 Equity attributable to equity holders of the parent 24,165,785 24,327,780 Non-controlling interest
Total liabilities 24,165,785 71,557,535
2020 2019 SUMMARIZED STATEMENT OF INCOME THCL
P$ THCLP$
Revenue 4,137,482 6,899,037 Operating expenses (505,654) (532,278) Gross profit 3,631,828 6,366,759 Administrative expenses (673,032) (653,821) Other income 13,091 13,992,209 Other expenses (31,235) (26,879) Net operating income (loss) 2,940,652 19,678,268 Financial income 16,346 36,906 Financial expenses (1,131,578) (707,996) Foreign exchange differences Share of profit (loss) of equity method associates and joint ventures
Gain (loss) on indexed assets and liabilities (1,017,102) (889,400) Income tax benefit (expense) 4,781 (4,691,314) Profit (loss) for the year 813,098 13,426,618 Profit (loss) attributable to equity holders of the parent 813,098 13,426,618 Profit (loss) attributable to non-controlling interest Profit (loss) for the year 813,098 13,426,618
2020 2019 SUMMARIZED STATEMENT OF CASH FLOWS THCLP$ THCLP$
Net cash flows provided by (used in) operating activities 1,332,172 5,336,326 Net cash flows provided by (used in) investing activities (181,808) (62,559,134) Net cash flows provided by (used in) financing activities (1,868,490) 59,215,354 Net increase (decrease) in cash and cash equivalents, before effect of exchange rate changes
(718,126)
1,992,546
Effect of exchange rate changes on cash and cash equivalents 3,004 (55) Net increase (decrease) in cash and cash equivalents (715,122) 1,992,491 Cash and cash equivalents at beginning of period 1,992,491 - Cash and cash equivalents at beginning of period
Cash and cash equivalents at end of period 1,277,369 1,992,491

PARQUE ARAUCO INTERNACIONAL S.A. AND SUBSIDIARY
2020 2019 STATEMENT OF FINANCIAL POSITION US$ US$
Assets Current assets 210,323,032.46 253,426,998.53 Non-current assets 1,177,545,699.30 1,218,632,770.49 Total assets 1,387,868,731.76 1,472,059,769.02 Liabilities and equity Current liabilities 45,412,170.20 217,964,558.61 Non-current liabilities 410,085,498.79 397,241,633.28 Equity attributable to equity holders of the parent 874,641,516.37 798,977,457.44 Non-controlling interest 57,729,546.83 57,876,119.69 Total liabilities 1,387,868,732.20 1,472,059,769.02
2020 2019 SUMMARIZED STATEMENT OF INCOME US$ US$
Revenue 71,132,637.79 123,351,591.45 Operating expenses (19,358,480.16) (25,046,063.06) Gross profit 51,774,157.62 98,305,528.39 Administrative expenses (16,301,866.80) (13,104,864.46) Other income 30,740,423.94 1,504,287.16 Other expenses (32,819,120.00) (36,522,562.64) Net operating income (loss) 33,393,594.76 50,182,388.45 Financial income 2,841,767.80 3,498,217.02 Financial expenses (32,128,514.92) (27,402,901.99) Foreign exchange differences 1,447,133.25 1,001,066.99 Share of profit (loss) of equity method associates and joint ventures (458,867.56) (809,257.11) Gain (loss) on indexed assets and liabilities (1,221,635.57) (1,522,607.83) Income tax benefit (expense) (12,497,763.16) (8,304,000.64) Profit (loss) for the year (8,624,285.39) 16,642,904.89 Profit (loss) attributable to equity holders of the parent (10,275,269.42) 9,574,914.35 Profit (loss) attributable to non-controlling interest 1,650,984.03 7,067,990.54 Profit (loss) for the year (8,624,285.39) 16,642,904.89
2019 2019 SUMMARIZED STATEMENT OF CASH FLOWS US$ US$
Net cash flows provided by (used in) operating activities 32,121,011.20 80,049,809.80 Net cash flows provided by (used in) investing activities (91,174,005.87) (64,881,936.62) Net cash flows provided by (used in) financing activities 37,861,996.55 50,681,527.32 Net increase (decrease) in cash and cash equivalents, before effect of exchange rate changes
(21,190,998.12)
66,049,397.50
Effect of exchange rate changes on cash and cash equivalents 4,047,941.09 1,724,106.33 Net increase (decrease) in cash and cash equivalents (25,238,939.21) 67,773,503.83 Cash and cash equivalents at beginning of period 184,729,956.75 116,956,453.89 Cash and cash equivalents at end of period 159,491,017.54 184,729,956.75

integrated reportparque arauco
teams in charge
Finance & Sustainability
assurance
PwC Chile
Design anD layout
DA
content, Drafting anD content eDiting
Gestión Social


![PARQUE QUEBRADA DE MACUL [LA FLORIDA]](https://static.fdokumen.com/doc/165x107/633a918bc2eee1d8330f7052/parque-quebrada-de-macul-la-florida.jpg)