PARK AVENUE - inCOMMON Community Development
59
NEIGHBORHOOD PLAN PARK AVENUE DRAFT March 2020
-
Upload
khangminh22 -
Category
Documents
-
view
2 -
download
0
Transcript of PARK AVENUE - inCOMMON Community Development
NEIGHBORHOOD PLAN
PARK AVENUE
DRAFT March 2020
Page 2 – Park Avenue Neighborhood Study
Steering CommitteeMonica Zimbelman
Larry Jensen
Addie Gengenback
Mary Wells
Ben Ayers
Fr. Peter Pappas
Jerry Reimer
Rudy Hernandez
Bret Cain
Lily Reyes
Ashley Flater
Janelle Domeyer
Laura Green
Jack Henry
Quentin Lueninghoener
Daisy Lopez
Christian Gray
ACKNOWLEDGMENTS
FundingA special thanks to the Nebraska Invest-ment Finance Authority (NIFA) and the Pe-ter Kiewit Foundation for providing funding to complete this report.

Page 3
TABLE OF CONTENTS
4 Executive Summary
9Background and Engagement
15 Since 2008
29 Themes and Strategies
57 Implementation

Page 4 – Park Avenue Neighborhood Study
The Park Avenue Neighborhood Plan is a result of three years of public engagement involving surveys, workshops, public meetings, and an equity analysis. In 2019 the update to the 2008 Park Avenue Redevelopment Study was launched with the formation of a 17 member steering committee who met monthly to help guide the consultant and ensure the neighborhood values were well represented. The document includes an analysis of the changes since 2008 and identifies goals and strategies that will guide future development organized around eight themes.
Changes Since 2008The Park Avenue Plan update was initiated to assist area residents, businesses, and other stakeholders in developing a guide that cele-brates and capitalizes on the unique assets of the Park Avenue cor-ridor. The final plan is intended to help guide city and neighborhood actions and projects within the neighborhood, but is also intended to provide actionable strategies for residents and local businesses to help improve their own community.
Overall, the analysis of changes from 2008 reflect overall improve-ment. Building conditions have improved with significantly fewer parcels with a poor condition rating and a drastic drop in code viola-tions. Several new local and national register designations have been applied to properties within the neighborhood. Zoning designations have either remained unchanged or been down zoned to a lower density district.
The number of residential units has remained largely unchanged because many units were vacant in 2007 waiting rehab and many new apartments have since been constructed. This has led to a de-cline in ownership rates. Assessed values for both owner and renter occupied units have increased, slightly higher for multi-family units.
The Park Avenue neighborhood has a lower car ownership rate than the city as a whole. Options for transportation in the neighborhood include the B Cycle station at Park Avenue and Woolworth supported by bicycle infrastructure on Park Avenue and several bus routes along Harney, Leavenworth, and Park Avenue.
56115_BC.qxd 8/17/06 8:40 AM Page 1
Prepared for the City of Omaha and Destination MidtownNovember 2008
EXECUTIVE SUMMARY

Park Avenue Neighborhood Study – Page 5
EXECUTIVE SUMMARY
The population has dropped by 16% since 2000 along with the median age of residents, but the neighborhood has remained the most populated in the City of Omaha. The number of households has been declining since 2000 by approximately 200 households per decade. The racial and ethnic makeup of Park Avenue has changed dramatically since 1990. At that time, 81 percent of the residents were white, non-Hispanic. Today, that number is down to only 36%. Employment for the population residing in the study area has dropped with the rise in the unemployment rate by almost 5% since 2007. The median income for the neighborhood increased since 2007, however is marginal compared to the increase for the City of Omaha as a whole.
Crime data has only recently been collected and disseminated for Omaha, however the five years worth of data does reveal a decline in criminal activity in the Park Avenue Neighborhood. While there was a spike between 2015 and 2016, the number of crimes reported within the project area leveled off and dropped in 2018. The education levels for residents in the Park Avenue Neighborhood have increased since 2013 and the teen birth rate has begun to decline.
Themes and StrategiesEight themes were identified through the public engagement: public infrastructure, renter engagement, housing variety, racial diversity, public spaces, jobs and economic development, property upkeep, and safety and security. Within each of these themes a goal, vision, why statement, and more details were created. Each theme has several broad actions to be taken to achieve the goal. Each action has several strategic options for carrying out the action. With several options for achieving each action, community members can start small and build momentum to achieve larger neighborhood improvements. Below is a list of the themes with their goals and actions.
Public InfrastructureGOAL:
» Create a better environment for pedestrians and make parking feel easier through better connections to transit, pedestrian and bicycle connections, and additional parking when properly designed to integrate into the district.
ACTIONS: » Improve streets to accommodate multiple modes of travel » Improve safety through traffic calming measures » Improve the street environment for better pedestrian travel » Identify ways to reduce the stress created by parking
Racial DiversityGOAL:
» Create an environment that is attractive to a wide variety of ethnic and racial groups
ACTIONS: » Create pathways for immigrant, refugee, and minority populations to remain and/or become established in the
neighborhood » Create a welcoming environment in the neighborhood for diverse populations
Property UpkeepGOAL:
» Expand personal ownership in property maintenance to all residents in the neighborhood
ACTIONS: » Improve the appearance of the neighborhood to reflect the pride residents possess » Support continued building upkeep and maintenance

Page 6 – Park Avenue Neighborhood Study
EXECUTIVE SUMMARY
Renter EngagementGOAL:
» Expand participation and a sense of ownership in the neighborhood among area renters.
ACTIONS: » Increase renter participation and attendance at neighborhood activities » Ensure renters feel welcomed and included in the neighborhood
Housing VarietyGOAL:
» Encourage adequate housing variety and stock to meet the needs of all residents
ACTIONS: » Preserve the existing historic character of the neighborhood while providing opportunities for new infill construction » Develop a diverse supply of housing types for both renters and owners » Ensure an adequate supply of affordable housing remains in the neighborhood
Security and SafetyGOAL:
» Increase the sense of security in the neighborhood felt by all residents
ACTIONS: » Physical installations that increase safety in the neighborhood » Reduce the perception that the neighborhood is unsafe
Park Avenue Neighborhood Study – Page 7
EXECUTIVE SUMMARY
Jobs and Commercial DevelopmentGOAL:
» Increased local jobs, economic development, and retail opportunities in the neighborhood by doubling the number of jobs in the area by 2025.
ACTIONS: » Provide development programs and regulations to support new businesses » Provide support for local business start-ups or expansions » Increase shopping in the neighborhood
Public SpacesGOAL:
» Improve access to existing public spaces and fill gaps in amenities
ACTIONS: » Improve the pedestrian experience to make walking to destinations in the neighborhood more desirable » Provide better connections to and activation of the existing parks » Increase the amount of art and public space available to residents in the neighborhood

Page 8 – Park Avenue Neighborhood Study
EXECUTIVE SUMMARY

Park Avenue Neighborhood Study – Page 9
In 2008, the City of Omaha and Destination Midtown commissioned the Park Avenue Redevelopment Study which resulted in a development plan for the Park Avenue study area (Harney Street to Woolworth Avenue, 29th to 33d Streets). Strategies for revitalizing housing and strengthening the commercial base were developed. With 11 years of development and redevelopment completed, it was time to revisit the plan to determine what accomplishments had been made, what work was still unfinished, and identify new goals to advance the neighborhood. The following document includes an analysis of the engagement completed over the past several years, the changes since 2008, and the goals and strategies that will guide future development organized around a set of eight themes.
Plan PurposeThe Park Avenue Plan update was initiated to assist area residents, businesses, and other stakeholders in developing a guide that celebrates and capitalized on the unique assets of the Park Avenue corridor. The final plan is intended to help guide city and neighborhood actions and projects within the neighborhood, but is also intended to provide actionable strategies for residents and local businesses to help improve their own community.
The planning process began with forming the following vision for Park Avenue.
Park Avenue is a lively urban neighborhood that bridges midtown and downtown Omaha, enjoying the best of what both have to offer. We share in a rich and storied history, which has culminated into the vibrant cultural and economic diversity we celebrate today. There’s a place for everyone in Park Avenue.
Once the vision was established, desired outcomes to support the vision were developed. Each of these outcomes included indicators to measure progress and strategies, both city led and neighborhood led, for achieving the out-comes. All of this information has been compiled into this plan for use by residents, business owners, and city staff to
advance Park Avenue in the coming years.
The neighborhood boundaries are highlighted on the following page and consist of Harney Street on the north, Woolworth Avenue on the south, 33rd Street on the West, and 29th Street on the east. These project limits match those of the 2008 Park Avenue Redevelopment Study.
Strategies
The Plan
Vision
Outcomes
Indicators
BACKGROUND

Page 10 – Park Avenue Neighborhood Study
BACKGROUND AND ENGAGEMENT

Park Avenue Neighborhood Study – Page 11
BACKGROUND AND ENGAGEMENT
SurveysIn August of 2016 a 14 question dual language survey was mailed to 939 addresses. A total of 79 individuals responded to the survey. The respondents felt the access and proximity to downtown was the best amenity, followed by racial diversity. Priorities for improvement included safety and security, more parking, bike lanes, sidewalk im-provements, and shopping/retail options.
Neighborhood Visioning MeetingFollowing the survey, a neighborhood vision meeting was held on November 7, 2016 with 70 people in attendance. Residents expressed a desire for infrastructure improvements, better open space options, recreational opportunities, and retail options. Goals that emerged from this workshop were similar to those identified in the 2008 plan with the addition of public transportation and improving economic opportunities. Attendees wanted to make sure the neighborhood stays affordable. Many of the plans and goals from this meeting are already underway including:
1. Pocket Playground created from empty lot by volunteers in June 2017
2. Plan for Soccer Field in Hanscom Park approved by City with $40,000 in private investments March 2018
3. Neighborhood Identity Statement formed November 2016-January 2017 and formalized through resident’s questionnaire June 2017
Equity AnalysisIn March 2018 an equity analysis was conducted by Kansas State University. The report revealed inequality in the Park Avenue neighborhood compared to the City of Omaha as a whole. Based on Department of Health and Human Services data, poverty is higher in Park Avenue than 80% of block groups in the city. The population is becoming less Latino and White and more Asian, but has remained a majority minority neighborhood. Rates of home ownership are declining, and rents are rising. Household at the city median income level find rents in the neighborhood unaffordable and the neighborhood has among the highest density of renters who pay more than 30 percent of their incomes for rent. High levels of poverty in Omaha are concentrated in the Park Avenue neighborhood.
The Park Avenue neighborhood has remained diverse, both in the residents and structures that populate it. This diversity is important to residents who want to see the neighborhood improve, but not at the cost of its current character. The following summarizes the past three years of public engagement efforts in the Park Avenue Neighborhood. The graphic on the following page highlights the chronological process of public engagement.
PUBLIC ENGAGEMENT

Page 12 – Park Avenue Neighborhood Study
BACKGROUND AND ENGAGEMENT
Most residents work outside the Park Avenue neigh-borhood. Fewer than half the residents participate in the labor force. There is a low density of jobs per square mile, despite having the most densely populated census block group in Omaha. As a result, car commuting is high, increasing parking needs as a result. However, the higher densities in the Park Avenue neighborhood suggest interventions will leverage benefits to a greater degree than elsewhere in Omaha.
Steering CommitteeBeginning in May 2019, a steering committee made up of residents, neighborhood association members, devel-opers, local religious institutions and business owners, and property owners held their first meeting for the project. The group continued to meet on a monthly basis to help steer the project and serve as the voice for the neighborhood. The members helped enlist participation and project buy-in from a broad and diverse range of stakeholders.
Open HouseSeveral open houses were held throughout 2019. The first open house had approximately 40 attendees and was held on July 31st. A poster was on display for each of the eight themes with sticky notes available for attendees to add their strategies and ideas for supporting the theme. All material was printed in both English and Spanish, with a translator translating the talk given by the consultant.
A second open house was held on November 20th at inCOMMON to gather feedback on the rough draft. Over 30 attendees were at the meeting and gave comments on the final goals and actions developed from previous engage-ment events.
A final plan celebration was held in January 2020 to promote the document and garner support for implementation of easy to accomplish action items.

Page 13
BACKGROUND AND ENGAGEMENT
Mobile Listening SessionsSimilar to the July open house, posters were developed for each of the eight themes, however images representing different aspects of each theme were added. The project team attended several events and meetings throughout September and October to gather feedback on each of the posters that helped inform strategies for each theme. The following is a list of the locations for the mobile listening sessions:
• Neighbors Night Out
• Leavenworth Neighborhood Association Meeting
• Open houses at local schools

Page 14 – Park Avenue Neighborhood Study
BACKGROUND AND ENGAGEMENT

Page 15
DATA TRENDS
By comparing trends from 2008 to today we can begin to understand how the neighborhood has and continues to change. The following pages show improvement and progress made in the areas of housing occupancy and condition, employment and diversity. A better understanding of the data helped inform the themes and visions outlined in the following section.
Population by Age, 2007-2017
2007 2017 Change 2007-2017
Total Percent Total Percent Total
Age 0-4 416 10.04% 483 12.1% 67Age 5-9 328 7.92% 545 13.7% 217Age 10-14 262 6.32% 190 4.8% -72Age 15-17 72 1.74% 57 1.4% -15Age 18-20 168 4.06% 111 2.8% -57Age 21-24 376 9.08% 530 13.3% 154Age 25-34 985 23.78% 904 22.7% -81Age 35-44 680 16.41% 408 10.3% -272Age 45-49 246 5.94% 172 4.3% -74Age 50-54 204 4.92% 153 3.8% -51Age 55-59 150 3.62% 139 3.5% -11Age 60-64 90 2.17% 106 2.7% 16Age 65-74 103 2.49% 131 3.3% 28Age 75-84 49 1.18% 36 0.9% -13Age 85+ 16 0.39% 13 0.3% -3Total 4,143 3,978 100.0% -165Median Age 29.57 25.9 -3.65Source: U.S. Census Bureau; ESRI, Claritas, Inc. 2007
Population TrendsWithin the Park Avenue study area, the population has been inconsistent since 1990, experiencing periods of both growth and decline. According to the Census estimates for 2017, the three Census Block Groups that encompass the neighborhood declined in population by 16% since 2000. Between 2000 and 2010 that decline was 15%, whereas the Omaha as a whole actually gained population at a rate of 5%.
The age of neighborhood residents is very low when compared to the city as a whole and is continuing to drop. In 2000 the median age in the Park Avenue neighborhood was 26.8, however in 2017 the median age was estimated as 25.9. The 2017 median age in Omaha was 34.5 years. The chart below shows the population change from 2007 to 2017 by age group. The greatest growth occurred in the 21 to 24 age group and the greatest decline occurred among 35 to 44 year olds, an age group that may be looking to purchase housing.
SINCE 2018

Page 16 – Park Avenue Neighborhood Study
DATA TRENDS
33rd
St.
32nd
St.
31st
St.
30th
St.
30th
Ave
.
Park
Ave
.
29th
St.
Harney St.
Turner Blvd.
Jackson St.
Leavenworth St.
Marcy St.
Mason St.
Pacific St.
Harris St.
Poppleton St.
Woolworth Ave
32nd
Ave
.
31st
Ave.
31st
St.
Park
Ave
.
Dewey Ave.
Dewey Ave.29
th St
.
St Marys Ave.
33rd
St.
Stu
dy
Are
a B
ou
nd
ary
NORTH0 FEET150 300
Planning, Architecture, Landscape Architecture and Urban Design900 Farnam Street, Suite 100 Omaha, Nebraska 68102
MAP 3 RESIDENTIAL UNITS
* Source: Douglas County Assessor
21-85
0
11-20
1
2-4
Number of Units
5-10
Residential UnitsUnit counts have remained largely unchanged since 2007, except for several new apartment buildings. In 2007 a large number of those units were vacant, awaiting rehabilitation. This included the units north and south of Leavenworth along Park Avenue. The Kansas State study conducted in 2018 stated ownership rates were declining, however this is likely a result of filling rental units that were vacant in 2007.
33rd
St.
32nd
St.
31st
St.
30th
St.
30th
Ave
.
Park
Ave
.
29th
St.
Harney St.
Turner Blvd.
Jackson St.
Leavenworth St.
Marcy St.
Mason St.
Pacific St.
Harris St.
Poppleton St.
Woolworth Ave
32nd
Ave
.
31st
Ave.
31st
St.
Park
Ave
.
Dewey Ave.
Dewey Ave.
29th
St.
St Marys Ave.
33rd
St.
Stu
dy
Are
a B
ou
nd
ary
NORTH0 FEET150 300
Planning, Architecture, Landscape Architecture and Urban Design900 Farnam Street, Suite 100 Omaha, Nebraska 68102
MAP 3 RESIDENTIAL UNITS
* Source: Douglas County Assessor
21-85
0
11-20
1
2-4
Number of Units
5-10
2007 2019
Source: City of Omaha/Douglas County
Page 17
DATA TRENDS
R8, Multiple-Family (High Density)
R4, Single-Family (High Density)
R7-PK, Parking District
R6, Multiple-Family (Low Density)
R7, Multiple-Family (Medium Density)
DS, Downtown Service
GO, General Office
LC, Limited Commercial
GI, General Industrial
CC, Community Commercial
GC, General Commercial
Residential
Commercial
Office
Industrial
Nonconforming Land Use
Other
33rd
St.
32nd
St.
31st
St.
30th
St.
30th
Ave
.
Park
Ave
.
29th
St.
Harney St.
Turner Blvd.
Jackson St.
Leavenworth St.
Marcy St.
Mason St.
Pacific St.
Harris St.
Poppleton St.
Woolworth Ave
32nd
Ave
.
31st
Ave.
31st
St.
Park
Ave
.
Dewey Ave.
Dewey Ave.29
th St
.
St Marys Ave.
33rd
St.
Stu
dy
Are
a B
ou
nd
ary
NORTH0 FEET150 300
Planning, Architecture, Landscape Architecture and Urban Design900 Farnam Street, Suite 100 Omaha, Nebraska 68102
MAP 4 ZONING
* Source: City of Omaha / Douglas County
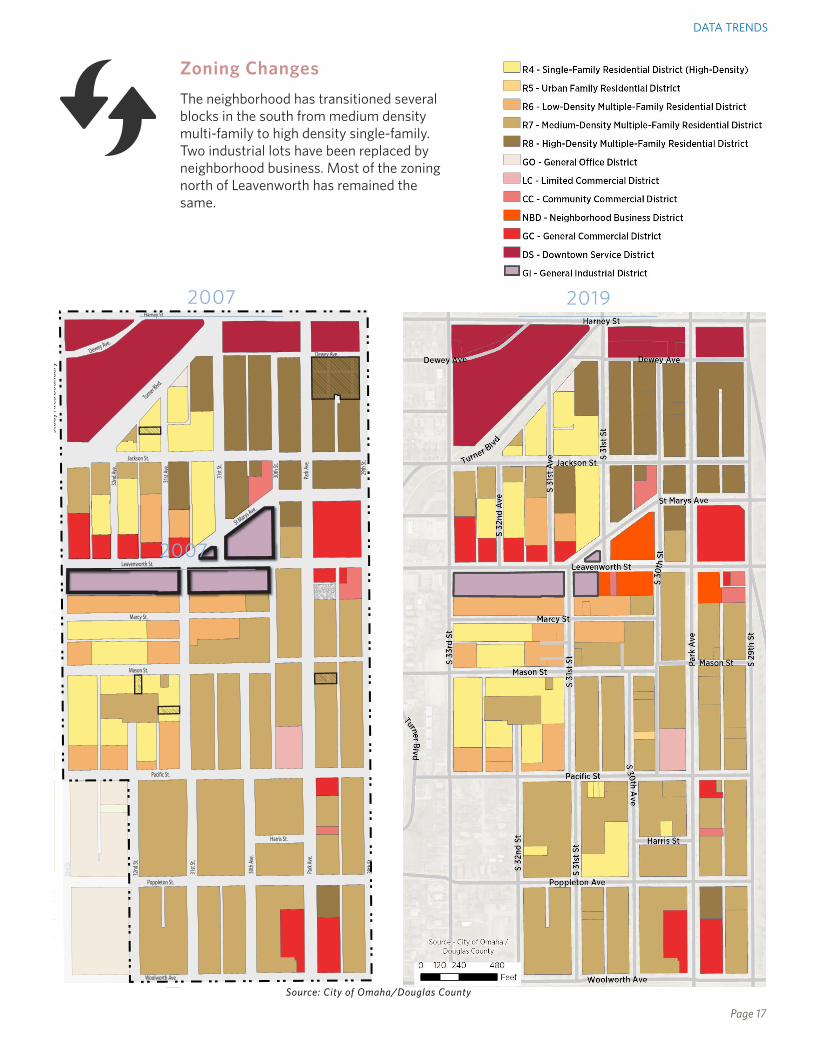
Zoning ChangesThe neighborhood has transitioned several blocks in the south from medium density multi-family to high density single-family. Two industrial lots have been replaced by neighborhood business. Most of the zoning north of Leavenworth has remained the same.
2007
2007 2019
Source: City of Omaha/Douglas County
Page 18 – Park Avenue Neighborhood Study
DATA TRENDS
good
poor
fair
constr.
Not Applicable
Good
Under Renovation
Fair
Poor
33rd
St.
32nd
St.
31st
St.
30th
St.
30th
Ave
.
Park
Ave
.
29th
St.
Harney St.
Turner Blvd.
Jackson St.
Leavenworth St.
Marcy St.
Mason St.
Pacific St.
Harris St.
Poppleton St.
Woolworth Ave
32nd
Ave
.
31st
Ave.
31st
St.
Park
Ave
.
Dewey Ave.
Dewey Ave.29
th St
.
St Marys Ave.
33rd
St.
Stu
dy
Are
a B
ou
nd
ary
NORTH0 FEET150 300
Planning, Architecture, Landscape Architecture and Urban Design900 Farnam Street, Suite 100 Omaha, Nebraska 68102
MAP 5 BUILDING CONDITION
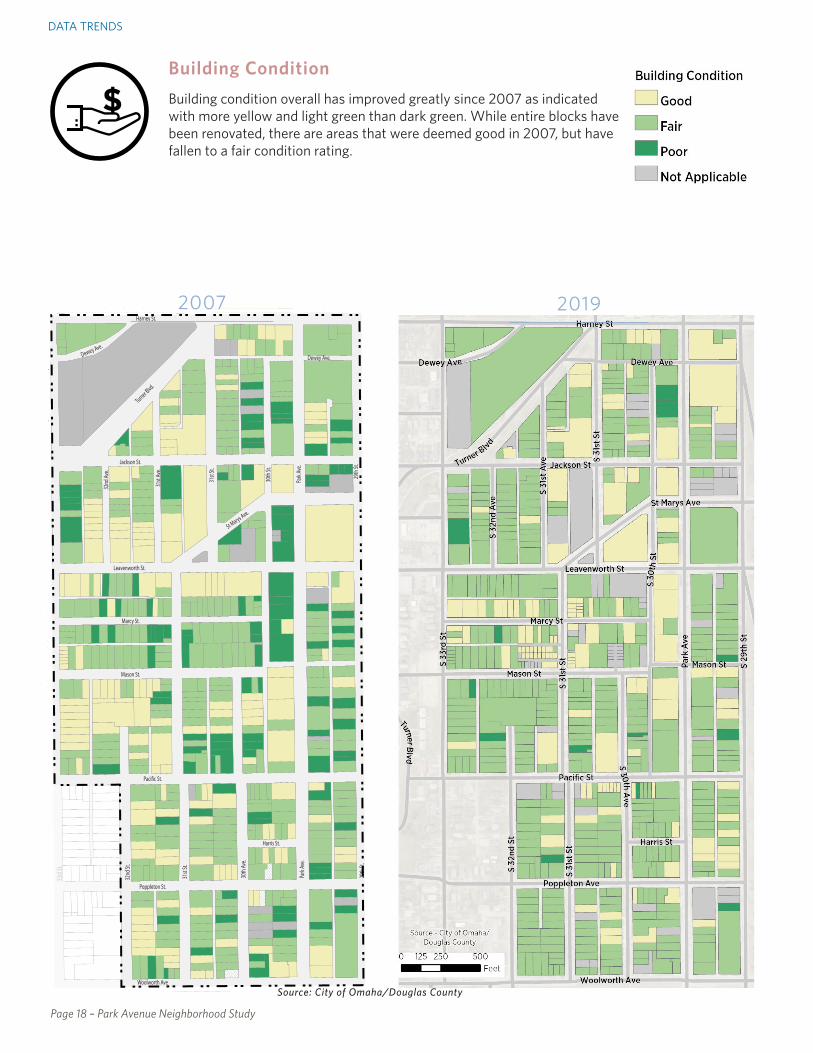
Building ConditionBuilding condition overall has improved greatly since 2007 as indicated with more yellow and light green than dark green. While entire blocks have been renovated, there are areas that were deemed good in 2007, but have fallen to a fair condition rating.
2007 2019
Source: City of Omaha/Douglas County
Page 19
DATA TRENDS
33Park Avenue Redevelopment Study
Demolition Order
Inspected / Pending
Minor
Unfit / Unsafe
Status
33rd
St.
32nd
St.
31st
St.
30th
St.
30th
Ave
.
Park
Ave
.
29th
St.
Harney St.
Turner Blvd.
Jackson St.
Leavenworth St.
Marcy St.
Mason St.
Pacific St.
Harris St.
Poppleton St.
Woolworth Ave
32nd
Ave
.
31st
Ave.
31st
St.
Park
Ave
.
Dewey Ave.
Dewey Ave.29
th St
.
St Marys Ave.
33rd
St.
Stu
dy
Are
a B
ou
nd
ary
NORTH0 FEET150 300
Planning, Architecture, Landscape Architecture and Urban Design900 Farnam Street, Suite 100 Omaha, Nebraska 68102
MAP 6 CODE ENFORCEMENT
* Source: City of Omaha / Douglas County
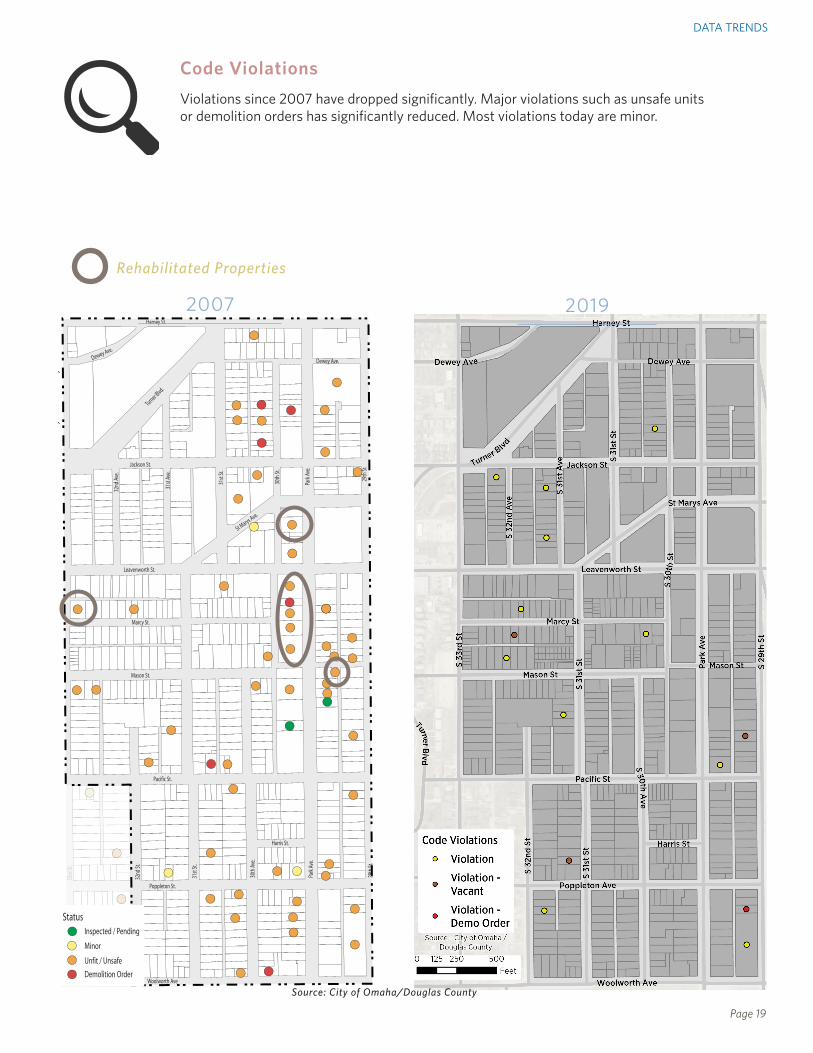
Code ViolationsViolations since 2007 have dropped significantly. Major violations such as unsafe units or demolition orders has significantly reduced. Most violations today are minor.
Rehabilitated Properties
33Park Avenue Redevelopment Study
Demolition Order
Inspected / Pending
Minor
Unfit / Unsafe
Status
33rd
St.
32nd
St.
31st
St.
30th
St.
30th
Ave
.
Park
Ave
.
29th
St.
Harney St.
Turner Blvd.
Jackson St.
Leavenworth St.
Marcy St.
Mason St.
Pacific St.
Harris St.
Poppleton St.
Woolworth Ave
32nd
Ave
.
31st
Ave.
31st
St.
Park
Ave
.
Dewey Ave.
Dewey Ave.
29th
St.
St Marys Ave.
33rd
St.
Stu
dy
Are
a B
ou
nd
ary
NORTH0 FEET150 300
Planning, Architecture, Landscape Architecture and Urban Design900 Farnam Street, Suite 100 Omaha, Nebraska 68102
MAP 6 CODE ENFORCEMENT
* Source: City of Omaha / Douglas County
2007 2019
Source: City of Omaha/Douglas County

Page 20 – Park Avenue Neighborhood Study
DATA TRENDS
Historic SignificanceNew local landmarks added since 2008: Johnston Building (1136 S 32nd St) and Buffet House (1015 S 30th Avenue). New National Register sites since 2008: Selma Terrace, Park Avenue Apartment District, Terrace Court Apartments, and the Hanscom Apartments.
Park School
Normandie ApartmentsHicks House
Mason Terrace &Von Sloster Residence
Slater House
Georgia RowHouse
Park School
Normandie ApartmentsHicks House
Mason Terrace &Von Sloster Residence
Slater House
Georgia RowHouse
1941 - 1960
1855 - 1900
1901 - 1920
1921 - 1940
1961 - 1980
National Register Sites
Landmark Sites (Local Designation)
Not Applicable
1981 - 2005
Year Structure Built
* Source: National Register of Historic Places / City of Omaha’s Landmarks Heritage Preservation Commission
33rd
St.
32nd
St.
31st
St.
30th
St.
30th
Ave
.
Park
Ave
.
29th
St.
Harney St.
Turner Blvd.
Jackson St.
Leavenworth St.
Marcy St.
Mason St.
Pacific St.
Harris St.
Poppleton St.
Woolworth Ave
32nd
Ave
.
31st
Ave.
31st
St.
Park
Ave
.
Dewey Ave.
Dewey Ave.
29th
St.
St Marys Ave.
33rd
St.
Stu
dy
Are
a B
ou
nd
ary
NORTH0
FEET150 300
Planning, Architecture, Landscape Architecture and Urban Design900 Farnam Street, Suite 100 Omaha, Nebraska 68102
MAP 7 HISTORIC SIGNIFICANCE
Other Significant Property (Survey)
Park School
Normandie ApartmentsHicks House
Mason Terrace &Von Sloster Residence
Slater House
Georgia RowHouse
Park School
Normandie ApartmentsHicks House
Mason Terrace &Von Sloster Residence
Slater House
Georgia RowHouse
1941 - 1960
1855 - 1900
1901 - 1920
1921 - 1940
1961 - 1980
National Register Sites
Landmark Sites (Local Designation)
Not Applicable
1981 - 2005
Year Structure Built
* Source: National Register of Historic Places / City of Omaha’s Landmarks Heritage Preservation Commission
33rd
St.
32nd
St.
31st
St.
30th
St.
30th
Ave
.
Park
Ave
.
29th
St.
Harney St.
Turner Blvd.
Jackson St.
Leavenworth St.
Marcy St.
Mason St.
Pacific St.
Harris St.
Poppleton St.
Woolworth Ave
32nd
Ave
.
31st
Ave.
31st
St.
Park
Ave
.
Dewey Ave.
Dewey Ave.
29th
St.
St Marys Ave.
33rd
St.
Stu
dy
Are
a B
ou
nd
ary
NORTH0
FEET150 300
Planning, Architecture, Landscape Architecture and Urban Design900 Farnam Street, Suite 100 Omaha, Nebraska 68102
MAP 7 HISTORIC SIGNIFICANCE
Other Significant Property (Survey)
2007 2019
Source: City of Omaha/Douglas County
Page 21
DATA TRENDS
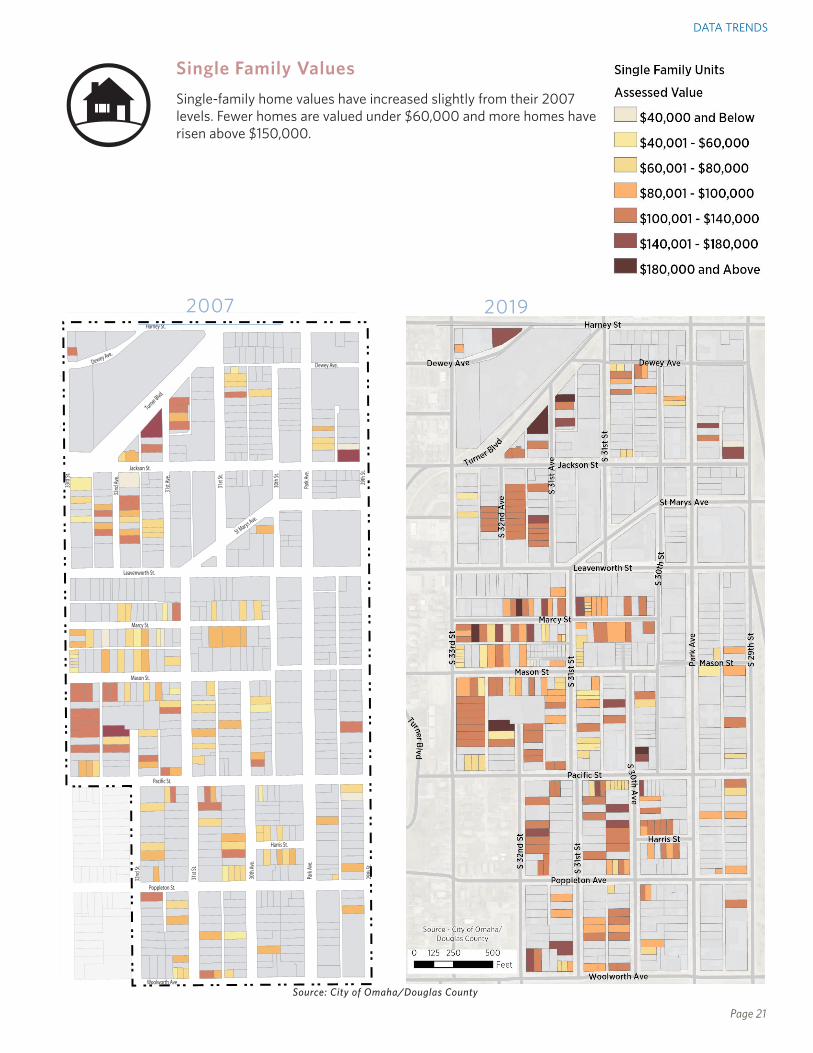
Single Family ValuesSingle-family home values have increased slightly from their 2007 levels. Fewer homes are valued under $60,000 and more homes have risen above $150,000.
35Park Avenue Redevelopment Study
80,001 - 100,000
40,000 and Below
40,001 - 60,000
60,001 - 80,000
100,001 - 140,000
Not Applicable
140,001 and Above
Dollars
Stu
dy
Are
a B
ou
nd
ary
NORTH0 FEET150 300
Planning, Architecture, Landscape Architecture and Urban Design900 Farnam Street, Suite 100 Omaha, Nebraska 68102
MAP 8A ASSESSED VALUE OWNER OCCUPIED UNITS(SINGLE - FAMILY)
* Source: Douglas County Assessor
33rd
St.
32nd
St.
31st
St.
30th
St.
30th
Ave
.
Park
Ave
.
29th
St.
Harney St.
Turner Blvd.
Jackson St.
Leavenworth St.
Marcy St.
Mason St.
Pacific St.
Harris St.
Poppleton St.
Woolworth Ave
32nd
Ave
.
31st
Ave.
31st
St.
Park
Ave
.
Dewey Ave.
Dewey Ave.29
th St
.
St Marys Ave.
Achieve a Unified Vision Be Healthy Strengthen Neighborhoods Keep Businesses Vibrant
Connect the City Embrace the Outdoors Streamline City Services
2007 2019
Source: City of Omaha/Douglas County

Page 22 – Park Avenue Neighborhood Study
DATA TRENDS
Multi-Family ValuesThe values showed in the map are assessed value per unit, not per building. Property values have raised significantly for multi-family buildings, especially for larger redevelopment sites.
36
45,001 - 60,000
15,000 and Below
15,001 - 30,000
30,001 - 45,000
60,001 -75,000
Not Applicable
75,001 and Above
Dollars
Stu
dy
Are
a B
ou
nd
ary
NORTH0 FEET150 300
Planning, Architecture, Landscape Architecture and Urban Design900 Farnam Street, Suite 100 Omaha, Nebraska 68102
MAP 8B ASSESSED VALUEPER UNIT (MULTI-FAMILY)
* Source: Douglas County Assessor
33rd
St.
32nd
St.
31st
St.
30th
St.
30th
Ave
.
Park
Ave
.
29th
St.
Harney St.
Turner Blvd.
Jackson St.
Leavenworth St.
Marcy St.
Mason St.
Pacific St.
Harris St.
Poppleton St.
Woolworth Ave
32nd
Ave
.
31st
Ave.
31st
St.
Park
Ave
.
Dewey Ave.
Dewey Ave.
29th
St.
St Marys Ave.
2007 2019
Source: City of Omaha/Douglas County

Page 23
DATA TRENDS
TransportationThe Park Avenue neighborhood has a lower car ownership rate than the city as a whole. Based on 2017 Census estimates, the ratio of vehicles to people is 0.46 compared to the city rate of 0.78. The 2016 Average Daily Trip counts for several intersections in the study area show higher traffic volumes on Leavenworth Street with slightly lower counts on Harney Street.
Transit ridership mirrors the ADT map with similar high nodes of activity where bus stops are located. While the highest ridership stops are on Leavenworth or St. Mary's Avenue, the stops on Park Avenue are near their levels of ridership at 21-30 riders per stop.
Source: City of Omaha
2016 Average Daily Trips (ADT)
2017 Vehicles per Person
Total Total PopulationPopulation
Total Total VehiclesVehicles
Vehicles toVehicles to PopulationPopulation
Study Area 3,988 1,835 0.46
Nebraska 1,893,921 1,476,532 0.78
U.S. 321,004,407 212,163,959 0.66
Source: U.S. Census Bureau;
Source: Metro Transit
2017 Weekday Bus Ridership

Page 24 – Park Avenue Neighborhood Study
DATA TRENDS
Demographic and Economic Changes
Race and Ethnicity
The racial and ethnic makeup of Park Avenue has changed dramatically since 1990. At that time, 81 percent of the residents were white, non-Hispanic. Today, that number is down to only 36%. Between 1990 and 2000 the Hispanic population rose from 5.5% to 45.5%. Some of this sharp increase is likely due to the change in order of how the race and ethnicity questions were asked on the Census Question-naire, but much of it was likely a result of more Hispanic residents moving to the area since the share of Hispanic residents continued to grow in 2010 to 57.4%. A more recent trend in race is the rise of Asian residents. Between 2010 and 2017 the Census estimates the population grew by 6.2%. When comparing language spoken at home be-tween 2013 and 2017 the number of residents speaking English over Spanish or another language rose at a rapid rate. This is likely due to an increase in second generation Hispanic residents more fluent in both English and Spanish, with some assistance from neighborhood programs which assist residents with learning to speak English. There was a decline of almost 300 residents who did not speak English at all.
Culture
In supplement to race and ethnicity Census demographics, broader cultural indicators are helpful in understanding the “cultural identity” of a neighborhood. Below are themes taken from the “Listening Project,” a community orga-nizing tool utilized by inCOMMON Community Development, highlighting elements of Park Avenue that feel like “home” and/or create a sense of “belonging.” Future years’ data will be used to track cultural shifts and encourage efforts to preserve cultural identity.
What about this neighborhood feels like home? (2016-2019)• Established businesses and organizations (grocery store, bakeries, gas station, inCOMMON, St. Peter’s Church) • Hanscom Park, Dewey Park• Playgrounds (Park Ave & Poppleton) • Field Club Elementary • Latino/Hispanic culture• Porches• Community activities and festivals
Do you feel like you belong here? Responses for those answering yes (2016-2019)• Deep relationships shared between Latino/Hispanic neighbors• School ties and involvement• Church ties and involvement • Community programs/community center/inCOMMON• Sports and physical activities • Proximity to downtown
• Old homes• Diversity
Racial and Ethnic Makeup of Population 1990-2017
Asian Black Hispanic White (non Hispanic)1990 2.2% 5.9% 5.5% 81%
2000 1.3% 7.5% 45.5% 43.2%
2010 1.4% 6.4% 57.4% 31.4%
2017 7.6% 4.6% 45.6% 36.3%
Source: U.S. Census Bureau; ESRI
Page 25
DATA TRENDS
Household Change, 1990-2017
Park Avenue Study Area 1990 2000 2007 2017 2007-2017
Number of Households 1,985 1,985 1,738 1,514 -13%
People Per Household 1.82 2.72 2.37 2.46 4%
Single Male Householders - % of Households 18.1% 26.5% 26.58% 10.2%
Omaha
Number of Households 133,842 156,738 165,172 182,257 10%
People Per Household 2.45 2.42 2.39 2.48 4%
Single Male Householders 12.5% 14.8% 14.38% 7.7%
Source: U.S. Census Bureau; ESRI
A variety of data sources were used to analyze the trends occurring in the Park Avenue
Neighborhood. As a result, tables use different years for comparison depending on what is available.
Household Population
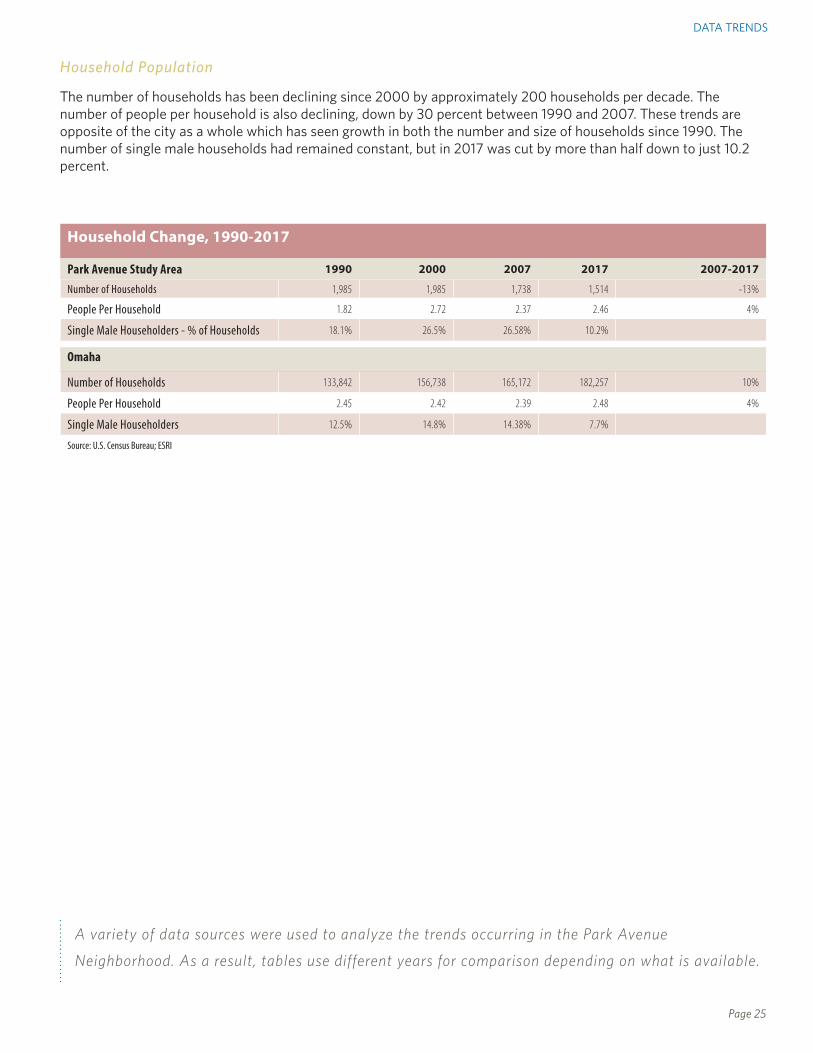
The number of households has been declining since 2000 by approximately 200 households per decade. The number of people per household is also declining, down by 30 percent between 1990 and 2007. These trends are opposite of the city as a whole which has seen growth in both the number and size of households since 1990. The number of single male households had remained constant, but in 2017 was cut by more than half down to just 10.2 percent.

Page 26 – Park Avenue Neighborhood Study
DATA TRENDS
Economic Characteristics of the Population
Median Income % of City Median Unemployment Rate Families Below Poverty Line2007 2017 2007 2017 2007 2017 2007 2017
Park Avenue Study Area $28,750 $30,279 64% 56% 7.1% 11.86% 19.9% 25.3%
Omaha $45,003 $53,789 - - 4.2% 4.8% 7.9% 6.4%Source: U.S. Census Bureau; ESRI
Employment by Occupation
2007 2017
Park Avenue Omaha Park Avenue Omaha
Management, Business and Financial Operations 3.71% 14.33% 6.2% 15.2%
Professional and Related Occupations 7.81% 21.11% 11.6% 17.6%
Service 22.71% 13.98% 18.1% 13.1%
Sales and Office 20.33% 30.14% 13.4% 26%
Farming, Fishing & Forestry 1.57% 0.21% 0 0.3%
Construction, Extraction, & Maintenance 11.48% 7.93% 22.9% 11.4%
Production, Transportation, & Material Moving 32.37% 12.30% 27.8% 10.4%
Source: U.S. Census Bureau; ESRI
Employment
Employment for the population residing in the study area has dropped with the rise in the unemployment rate of almost 5% since 2007. The occupations that saw growth between 2007 and 2017 in the Park Avenue neighborhood include Management, Business, and Financial Operations; Professional and Related Occupations; and Construction, Extraction, & Maintenance.
Income
The median income for the neighborhood has increased since 2007, however is a marginal increase compared to the increase for the City of Omaha as a whole. In 2007, the neighborhood median income was 63% of Omaha, by 2017 it was only 56%. This is further reflected by the percent of residents living below the poverty line. Between 2007 and 2017 this rate went up by over 5 percent for the Park Avenue neighborhood, while it went down by just over a percent for the city as a whole.

Page 27
DATA TRENDS
Crime
Crime data has only recently been collected and disseminated for Omaha, however the five years worth of data does reveal a decline in criminal activity in the Park Avenue Neigh-borhood. While there was a spike between 2015 and 2016, the number of crimes re-ported within the project area leveled off and dropped in 2018. If trends continue through the end of 2019, crime rates will again be lower than the previous year.
0
100
200
300
400
500
600
700
800
2015 2016 2017 2018 2019*
Total Incidents Reported
*Data for 2019 is only through July 2019
Education
The education levels for residents in the Park Avenue Neighborhood have increased since 2013. A 55 percent decline in the number of people over the age of 25 with no formal education occurred and an increase of 127 and 65 percent respectively of those with an associates/bachelors degree or masters degree and higher.
Educational Attainment Change 2013-2017
Educational Attainment None Nursery to
8thHigh School
(No Diploma)
High School Diploma or
GED
Some College (No degree)
Associates/ Bachelors Degree
Masters/ Professional/ Doctorate Degree
Population over 25
-179 -281 -176 -85 -59 268 50
Percent Change
-55.2% -49.5% -45.4% -15.6% -14.3% 127.6% 65.8%
Source: U.S. Census Bureau; ESRI
Page 28 – Park Avenue Neighborhood Study
DATA TRENDS
0
10
20
30
40
50
60
70
80
2013 2014 2015 2016 2017 Five YearAverage
Teen Birth Rates
Rate per 1,000 female population (Omaha)
Rate per 1,000 female population (East Southeast Region)*
Teen Births
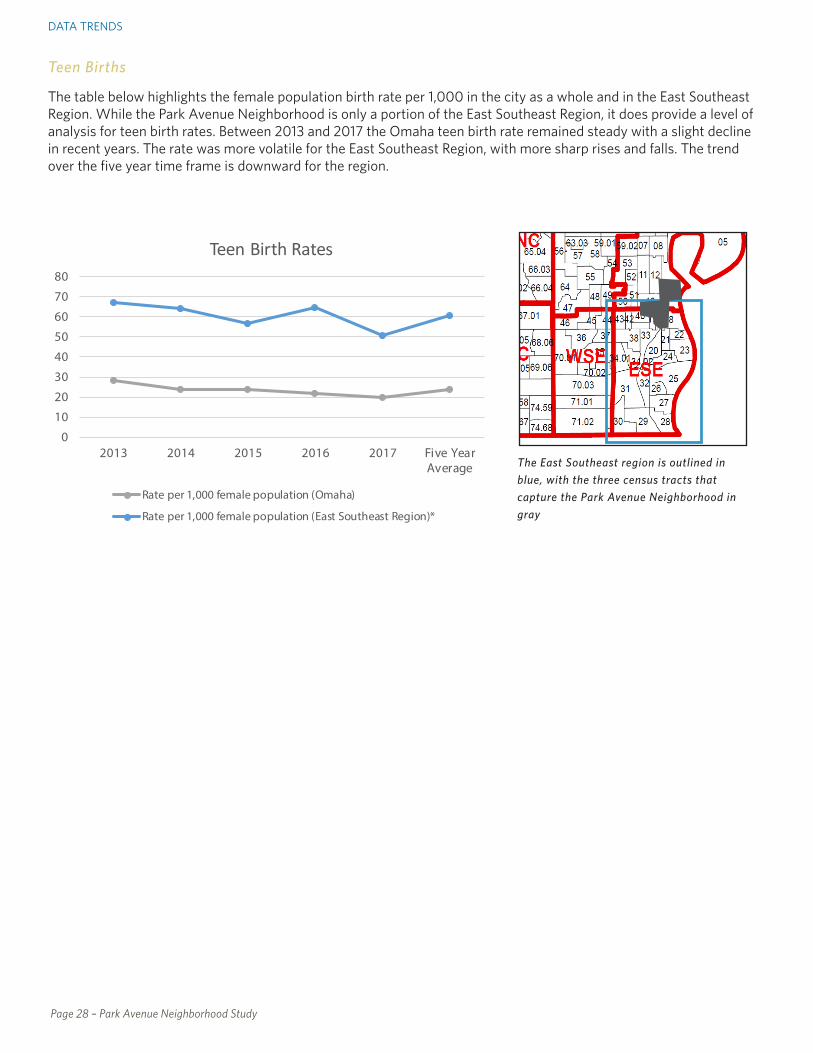
The table below highlights the female population birth rate per 1,000 in the city as a whole and in the East Southeast Region. While the Park Avenue Neighborhood is only a portion of the East Southeast Region, it does provide a level of analysis for teen birth rates. Between 2013 and 2017 the Omaha teen birth rate remained steady with a slight decline in recent years. The rate was more volatile for the East Southeast Region, with more sharp rises and falls. The trend over the five year time frame is downward for the region.
The East Southeast region is outlined in blue, with the three census tracts that capture the Park Avenue Neighborhood in gray

Page 29
This section includes eight themes identified from the three year public engagement effort. Within each theme is a vision, why statement, and more details. City and neighborhood led strategies for reaching the goals and furthering the vision for each theme are identified with actionable and measurable results. Strategies are clustered into broader actions and are intended to be a slate of options. Some may be easier to achieve than others and support or funding may be available for one strategy ahead of another. With several options for achieving each action, community members can start small and build momentum to achieve larger neighborhood improvements.
Themes:1. Public Infrastructure2. Renter Engagement3. Housing Variety4. Racial Diversity5. Public Spaces6. Jobs and Economic Development7. Property Upkeep8. Safety and Security
THEMES AND STRATEGIES
Page 30 – Park Avenue Neighborhood Study
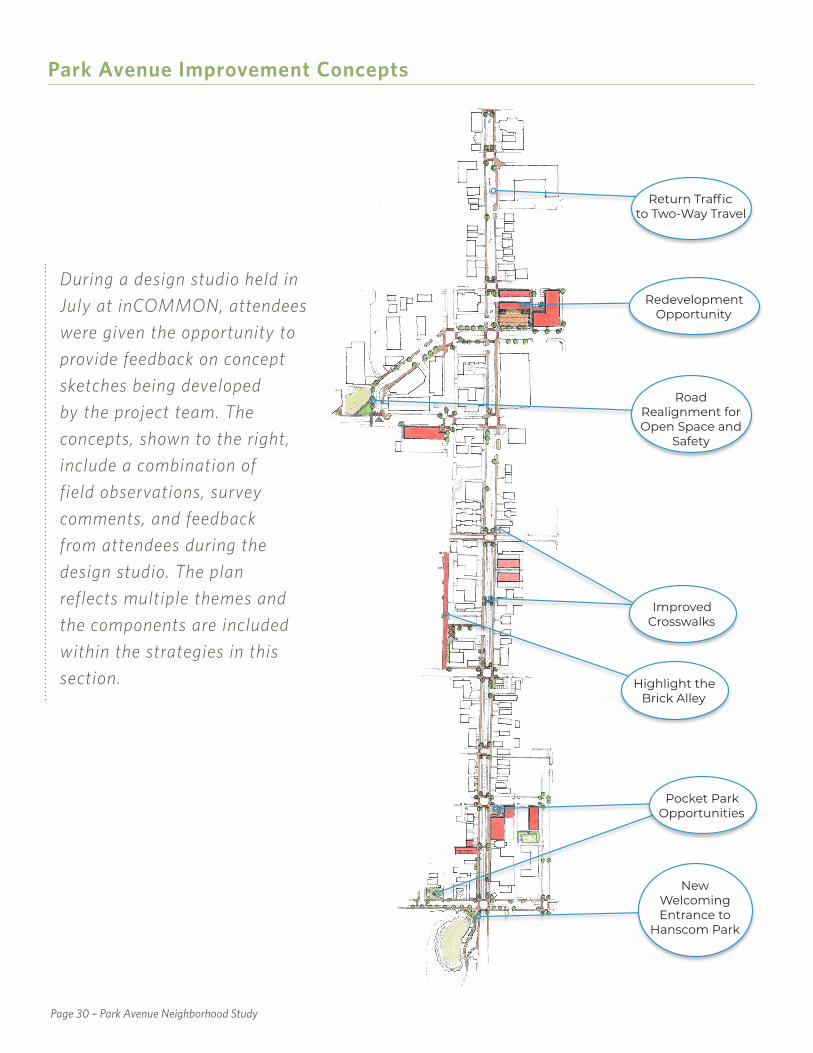
New Welcoming Entrance to
Hanscom Park
Pocket Park Opportunities
Improved Crosswalks
Redevelopment Opportunity
Highlight the Brick Alley
Road Realignment for Open Space and
Safety
Return Traffic to Two-Way Travel
Park Avenue Improvement Concepts
During a design studio held in July at inCOMMON, attendees were given the opportunity to provide feedback on concept sketches being developed by the project team. The concepts, shown to the right, include a combination of field observations, survey comments, and feedback from attendees during the design studio. The plan reflects multiple themes and the components are included within the strategies in this section.

Page 31
THEME 1: PUBLIC INFRASTRUCTURE
Public infrastructure in the neighborhood needs upgrades including welcoming and attractive streets, better parking solutions, and traffic-calming measures.
Infrastructure that create a safer and welcoming environment for pedestrians using transit and connecting to parking. These changes should increase in the share of travelers using transit, walking, and biking.
Most survey respondents felt there was a shortage of parking in the neighborhood. Survey respondents that felt it was a high priority to resolve were generally those living in condos with medium to high incomes. Goals from the public visioning meeting included traffic calming and better transit options, which would reduce the stress created by parking. Tying into this theme is the idea of branding the Park Avenue District through banners, lighting, and landscaping installed with infrastructure projects, an emerging theme during the public visioning meeting.
VISION
WHY
Page 32 – Park Avenue Neighborhood Study
PUBLIC INFRASTRUCTURE STRATEGIESStrategy A: Improve streets to accommodate multiple modes of travel
Option 1: Implement the city's Complete Streets Design Guide within the neighborhoodMeasure: Any new street projects in the neighborhood apply the Design GuideLeader: City
Option2: Review bicycle lane design along Park Avenue to determine if placing on-street parking between the bicycles and vehicle traffic is feasibleMeasure: Complete review by 2021Leader: City
Option 3: Work with bike and pedestrian groups to better educated residents across the city on the bike route signage. Measure: Campaign developed and implemented by fall of 2020Leader: City
Option 4: Review street conditions to identify areas to include in the street improvement program for upgrades instead of patching potholesMeasure: Review of existing streets and street improvement program by end of March 2021Leader: City
Page 33
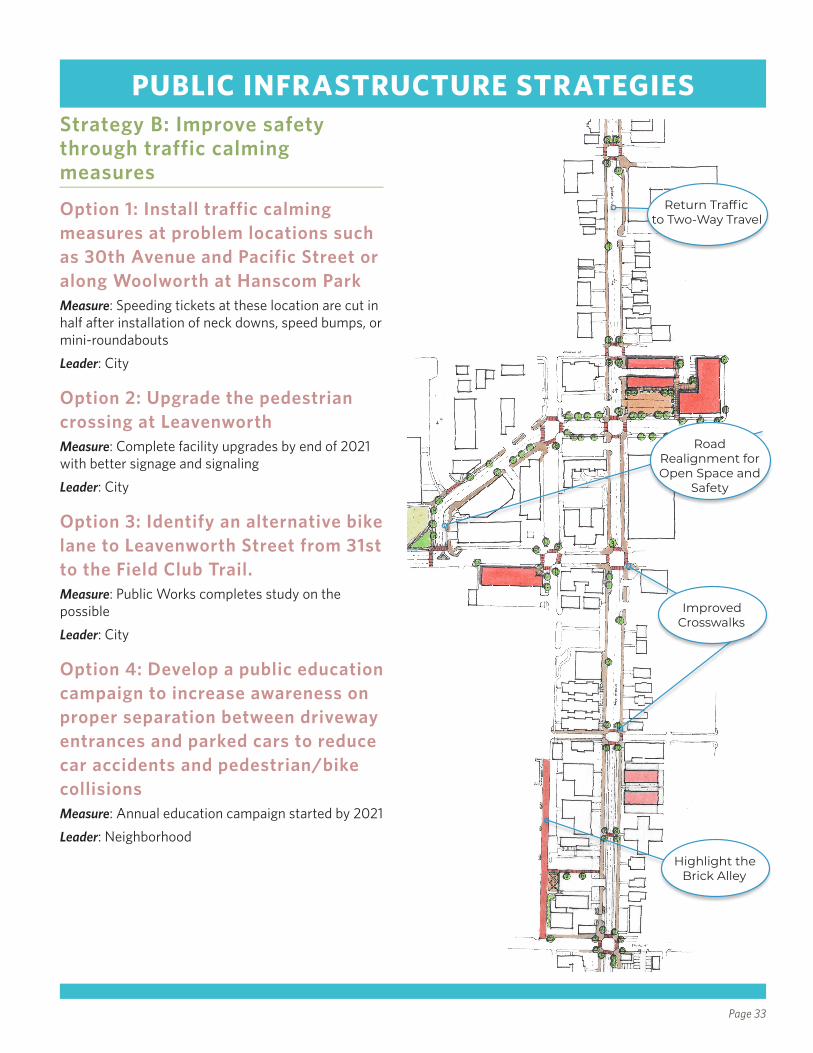
PUBLIC INFRASTRUCTURE STRATEGIESStrategy B: Improve safety through traffic calming measures
Option 1: Install traffic calming measures at problem locations such as 30th Avenue and Pacific Street or along Woolworth at Hanscom ParkMeasure: Speeding tickets at these location are cut in half after installation of neck downs, speed bumps, or mini-roundaboutsLeader: City
Option 2: Upgrade the pedestrian crossing at LeavenworthMeasure: Complete facility upgrades by end of 2021 with better signage and signaling Leader: City
Option 3: Identify an alternative bike lane to Leavenworth Street from 31st to the Field Club Trail. Measure: Public Works completes study on the possibleLeader: City
Option 4: Develop a public education campaign to increase awareness on proper separation between driveway entrances and parked cars to reduce car accidents and pedestrian/bike collisionsMeasure: Annual education campaign started by 2021Leader: Neighborhood
Improved Crosswalks
Highlight the Brick Alley
Road Realignment for Open Space and
Safety
Return Traffic to Two-Way Travel

Page 34 – Park Avenue Neighborhood Study
PUBLIC INFRASTRUCTURE STRATEGIESStrategy C: Improve the street environment for better pedestrian travel
Option 1: Upgrade streets with wider sidewalks, benches, and street lightingMeasure: New lighting, sidewalk upgrades, and seating are included with any street improvements or large scale redevelopmentsLeader: City
Option 2: Plant green space adjacent to the street on residential blocks with native, low growth plants and trees (Partnerships with programs like ReTree Midtown should be explored)Measure: One street per year will be identified for conversion from grass to native plants and partnership developed with property owners to educate and assist with the change in front of their propertyLeader: Neighborhood
Option 3: Install neck downs at key intersections and ensure that crosswalks are properly striped. Measure: Crosswalks on Leavenworth and Park Avenue are properly striped by 2021. Neck-downs are installed on Leavenworth near Jackson Elementary and other key crossings. Leader: City
Option 4: Explore installation of speed table along key locations to slow traffic (similar to Country Club Avenue at Metcalf Park)Measure: Install speed table at mid-block crossings into Hanscom Park. Leader: City

Page 35
PUBLIC INFRASTRUCTURE STRATEGIES
Image from Wauwatosa
Strategy D: Identify ways to reduce the stress created by parking
Option 1: Work with apartment complex management to find ways to address parking shortage by sharing lots with uses that have different peak use times (ex: church lots allow apartment residents to use during the weekdays)Measure: A reduction of one car per 50 unitsLeader: Neighborhood
Option 2: Add parking to 29th Street and improve pedestrian access to that parking. Measure: Diagonal parking added to 29th Street and sidewalk and lighting improvements made to 29th, Pacific and Jackson Street. Leader: City
Page 36 – Park Avenue Neighborhood Study
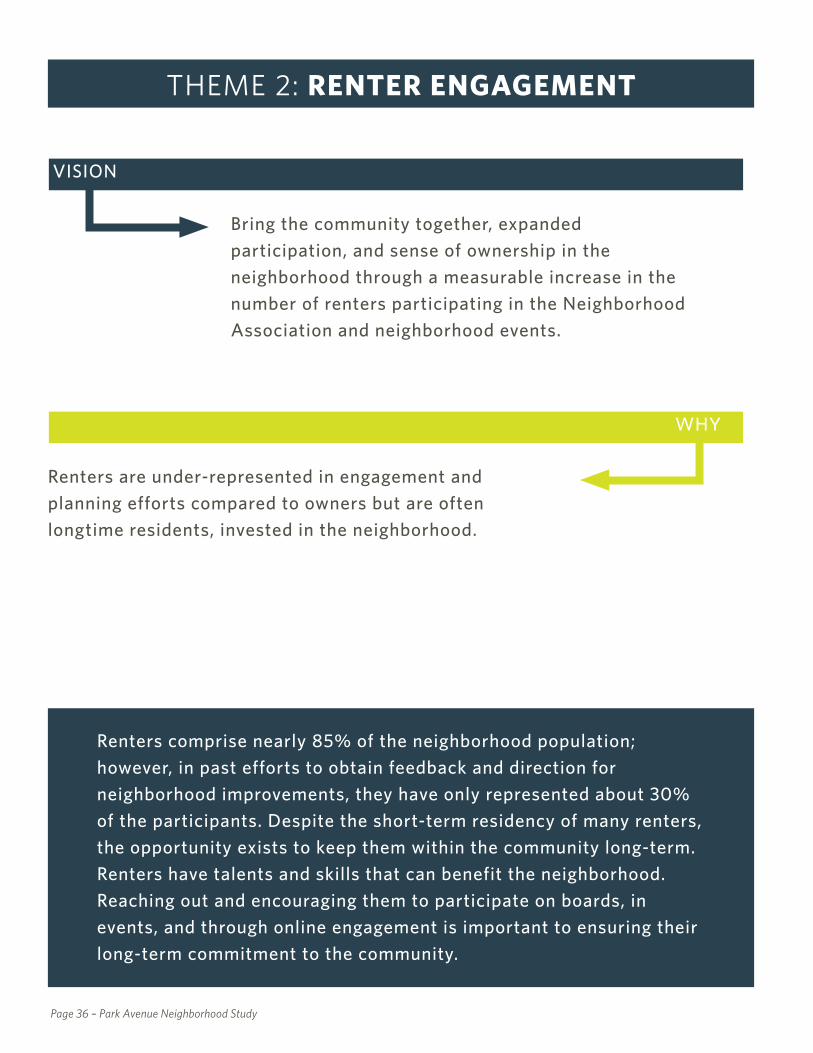
Renters are under-represented in engagement and planning efforts compared to owners but are often longtime residents, invested in the neighborhood.
Bring the community together, expanded participation, and sense of ownership in the neighborhood through a measurable increase in the number of renters participating in the Neighborhood Association and neighborhood events.
Renters comprise nearly 85% of the neighborhood population; however, in past efforts to obtain feedback and direction for neighborhood improvements, they have only represented about 30% of the participants. Despite the short-term residency of many renters, the opportunity exists to keep them within the community long-term. Renters have talents and skills that can benefit the neighborhood. Reaching out and encouraging them to participate on boards, in events, and through online engagement is important to ensuring their long-term commitment to the community.
THEME 2: RENTER ENGAGEMENT
VISION
WHY
Page 37
RENTER ENGAGEMENT STRATEGIESStrategy A: Increase renter participation and attendance at neighborhood activities
Option 1: Support and expand upon the efforts of existing neighborhood groups who have access to renter populationsMeasure: Meetings held with each neighborhood group to identify opportunities to support renter outreachLeader: Neighborhood
Option 2: Develop incentive program to encourage participation in community events such as rent discounts or gift cards to local businessesMeasure: Incentive program is operational by January 2021Leader: Neighborhood
Option 3: Utilize a multi-medium approach to communicate neighborhood events and opportunitiesMeasure: Committee formed by Fall 2020 to regularly gather information about neighborhood and experiment with various communication strategiesLeader: Neighborhood
Option 4: Send out renter survey to determine their needs and motivationsMeasure: Survey reach of at least one-third of renters in the neighborhoodLeader: Neighborhood
Option 5: Offer childcare at neighborhood association meetings and eventsMeasure: Areas established for children to play during all neighborhood association meetings by 2021Leader: Neighborhood
Option 6: Strengthen neighbor-to-neighbor peer outreach as means for sharing neighborhood events and opportunitiesMeasure: Block Connector program is increased 50% by January 2021
Leader: Neighborhood
Page 38 – Park Avenue Neighborhood Study
RENTER ENGAGEMENT STRATEGIES
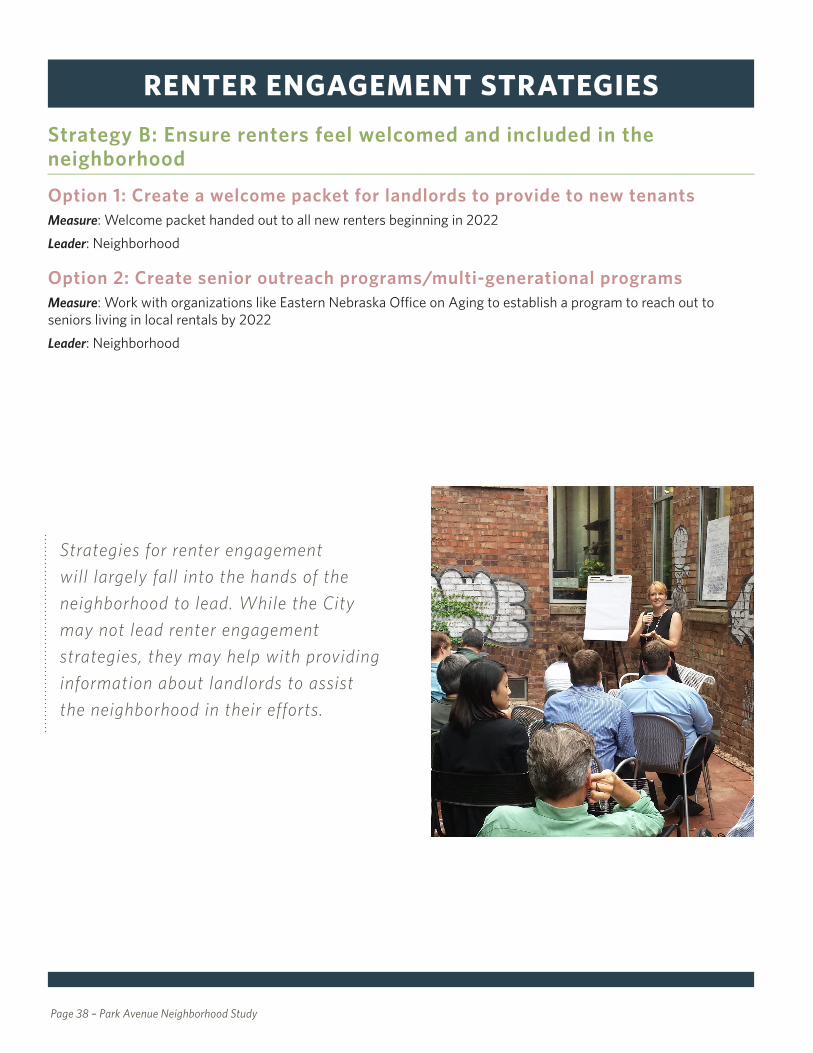
Strategies for renter engagement will largely fall into the hands of the neighborhood to lead. While the City may not lead renter engagement strategies, they may help with providing information about landlords to assist the neighborhood in their efforts.
Strategy B: Ensure renters feel welcomed and included in the neighborhood
Option 1: Create a welcome packet for landlords to provide to new tenantsMeasure: Welcome packet handed out to all new renters beginning in 2022Leader: Neighborhood
Option 2: Create senior outreach programs/multi-generational programsMeasure: Work with organizations like Eastern Nebraska Office on Aging to establish a program to reach out to seniors living in local rentals by 2022Leader: Neighborhood
Page 39
Most residents enjoy the diversity of housing types, prices, and styles in the neighborhood and would like to see it maintained.
Ensure adequate housing variety and stock to offer housing for every stage of life and greater opportunity for ownership.
THEME 3: HOUSING VARIETY
Affordability, a common theme, is defined by a household’s income and therefore the perception of affordability changes from household to household. Economic diversity is one of the hallmarks of the neighborhood, and a mixture of housing types and programs ensures that affordable housing options exist for every state of life and income.
VISION
WHY
Page 40 – Park Avenue Neighborhood Study
HOUSING VARIETY STRATEGIESStrategy A: Preserve the existing historic character of the neighborhood while providing opportunities for new infill construction
Option 1: Develop design standards that require a mix of old and new buildings to maintain aesthetic feeling of an urban neighborhoodMeasure: New design standards are used for any new project or major renovationLeader: Neighborhood
Option 2: Promote restoration and rehabilitation of existing buildings through neighborhood associationsMeasure: All projects brought to the City with demolition component are discussed for potential rehabilitation insteadLeader: Neighborhood
Option 3: Create a partnership with Restore Omaha to create educational material on proper rehabilitationMeasure: Guide for proper rehabilitation complete by 2021Leader: Neighborhood
Strategy B: Develop a diverse supply of housing types for both renters and owners
Option 1: Evaluate the need to establish a policy requiring rental and product type diversity in large scale Tax Increment Financing (TIF) projectsMeasure: TIF Committee completes evluation oto determine use of TIF to support affordable housing. Leader: City
Option 2: Continue to offer programs such as Tax Increment Financing (TIF) that support new development in the neighborhood while prioritizing affordability for both rental and owner-occupied propertiesMeasure: Continued use of TIF in the neighborhoodLeader: City
Option 3: Review the zoning ordinance to find and remove any barriers to developing a variety of housing types often termed "missing middle" housingMeasure: Full review of zoning regulation related to housing barriers complete by planning staff by end of 2021 with recommended changesLeader: City

Page 41
HOUSING VARIETY STRATEGIESOption 4: Fill the gap in funding for affordable housing in the neighborhoodMeasure: Develop a pool of funding with an organization like Omaha 1000 or Spark for filling the gap and sharing the risk with developers willing to build units affordable to households making 80% or less of the Douglas County area median income (AMI)Leader: Neighborhood & City
Strategy C: Ensure an adequate supply of affordable housing remains in the neighborhood
Option 1: Ensure existing homes are maintained in good condition (see more recommendations in Property Upkeep) Measure: Annual decline in the number of citations for building maintenance.Leader: Neighborhood
Option 2: Encourage use of development incentives for affordable housing in new developmentsMeasure: One new project uses Section 55-785 of the City's Zoning code which offers a density bonus for affordable housing. Leader: City
Page 42 – Park Avenue Neighborhood Study
THEME 4: RACIAL DIVERSITY
Residents would not move to or stay in the area if they wanted a mono-culture.
Create an environment that is attractive to a wide variety of ethnic and racial groups, in order to be the most ethnically and racially diverse neighborhoods in the city through a equally balanced split of racial groups in the neighborhood by the 2030 census.
Residents in the 2016 survey noted the area’s racial and ethnic diversity as a feature to be maintained. A mix of cultures and races often brings a unique energy to a neighborhood that will continue to attract new residents and investment. This theme ties closely to many of the other themes, especially housing variety and commercial development, as essential to creating an environment where all feel welcome and a sense of creativity thrives.
VISION
WHY

Page 43
RACIAL DIVERSITY STRATEGIES
Racial diversity is an important aspect of the neighborhood as found through public engagement efforts, however strategies are difficult to quantify. Beyond those listed, a welcoming and supportive environment should be created to ensure continued diversity within the neighborhood.
Strategy A: Create pathways for immigrant, refugee, and minority populations to remain and/or become established in the neighborhood
Option 1: Develop a neighborhood business association that includes a specific focus on supporting entrepreneurs of colorMeasure: Association launched by Fall 2020Leader: Neighborhood
Option 2: Support and expand upon the efforts of existing neighborhood groups who have access to immigrant, refugee, and minority populationsMeasure: Meetings held with each neighborhood group to identify opportunities to support outreach among popula-tions of colorLeader: Neighborhood

Page 44 – Park Avenue Neighborhood Study
RACIAL DIVERSITY STRATEGIESStrategy B: Create a welcoming environment in the neighborhood for diverse populations
Option 1: Support and expand upon efforts of existing neighborhood groups who host cross-cultural eventsMeasure: Meetings held with each neighborhood group to identify opportunities to support and expand upon cross-cultural events Leader: Neighborhood
Option 2: Audit neighborhood communication strategies (see Renter Engagement Strategies) to ensure they support and promote diversityMeasure: Perform annual audit through Communications Committee (see Renter Engagement Strategies), beginning Spring 2021Leader: Neighborhood
Option 3: Engage with city officials and developers to promote the use of the Equity Checklist (see the Implementation section)Measure: At least 3 meetings held in 2020 with developers, city staff, and elected officials to educate and discuss the use of the equity checklistLeader: Neighborhood
Option 4: Utilize “Cultural Identity” tool (inCOMMON) to track demographic shifts in the neighborhoodMeasure: Data analyzed annually, beginning Spring 2020Leader: Neighborhood

Page 45
THEME 5: PUBLIC SPACES
Despite the number of parks and open space in the neighborhood, there is a lack of easy access, recreation types that meet resident preference (ex: soccer instead of tennis), and public spaces for meeting and gathering.
Offer safe places for residents and families to gather and play and connect by adding additional public open spaces and redesigning existing spaces such as Hanscom Park.
Some of this work is already underway such as the resident championed soccer field. More needs to be done to fully address comments from the survey and public visioning meeting. Access to Hanscom Park on the northeast is still a barrier to residents who often do not consider this existing amenity a resource for the neighborhood. More welcoming public spaces are desired for the neighborhood to meet and gather, both indoor and outdoor. Most should be informal spaces, but engagement showed a need for spaces that residents can rent out for personal events. Participants also rank family-friendly environments high on improvements needed, which could be satisfied through improvements to access and amenities in the parks.
VISION
WHY
Page 46 – Park Avenue Neighborhood Study
PUBLIC SPACES STRATEGIES
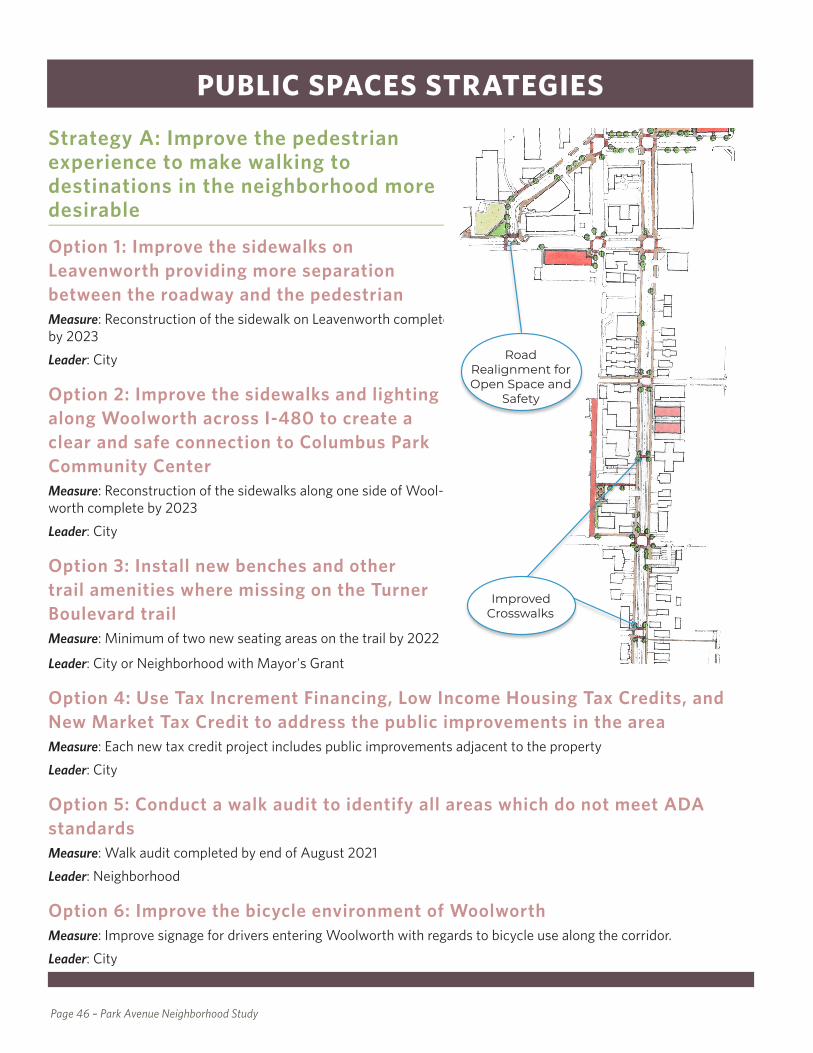
Strategy A: Improve the pedestrian experience to make walking to destinations in the neighborhood more desirable
Option 1: Improve the sidewalks on Leavenworth providing more separation between the roadway and the pedestrianMeasure: Reconstruction of the sidewalk on Leavenworth complete by 2023Leader: City
Option 2: Improve the sidewalks and lighting along Woolworth across I-480 to create a clear and safe connection to Columbus Park Community CenterMeasure: Reconstruction of the sidewalks along one side of Wool-worth complete by 2023Leader: City
Option 3: Install new benches and other trail amenities where missing on the Turner Boulevard trailMeasure: Minimum of two new seating areas on the trail by 2022
Improved Crosswalks
Road Realignment for Open Space and
Safety
Leader: City or Neighborhood with Mayor's Grant
Option 4: Use Tax Increment Financing, Low Income Housing Tax Credits, and New Market Tax Credit to address the public improvements in the areaMeasure: Each new tax credit project includes public improvements adjacent to the propertyLeader: City
Option 5: Conduct a walk audit to identify all areas which do not meet ADA standardsMeasure: Walk audit completed by end of August 2021Leader: Neighborhood
Option 6: Improve the bicycle environment of WoolworthMeasure: Improve signage for drivers entering Woolworth with regards to bicycle use along the corridor. Leader: City
Page 47
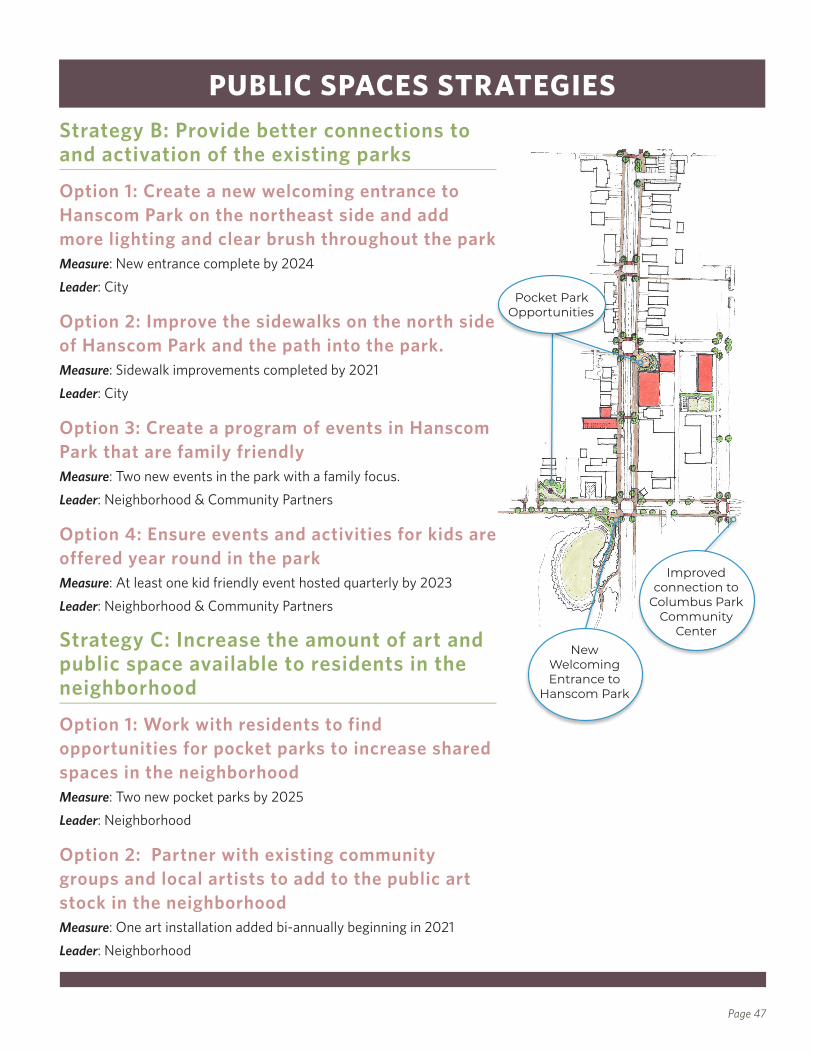
PUBLIC SPACES STRATEGIESStrategy B: Provide better connections to and activation of the existing parks
Option 1: Create a new welcoming entrance to Hanscom Park on the northeast side and add more lighting and clear brush throughout the parkMeasure: New entrance complete by 2024Leader: City
Option 2: Improve the sidewalks on the north side of Hanscom Park and the path into the park. Measure: Sidewalk improvements completed by 2021Leader: City
Option 3: Create a program of events in Hanscom Park that are family friendlyMeasure: Two new events in the park with a family focus.Leader: Neighborhood & Community Partners
Option 4: Ensure events and activities for kids are offered year round in the parkMeasure: At least one kid friendly event hosted quarterly by 2023Leader: Neighborhood & Community Partners
Strategy C: Increase the amount of art and public space available to residents in the neighborhood
Option 1: Work with residents to find opportunities for pocket parks to increase shared spaces in the neighborhoodMeasure: Two new pocket parks by 2025Leader: Neighborhood
Option 2: Partner with existing community groups and local artists to add to the public art stock in the neighborhoodMeasure: One art installation added bi-annually beginning in 2021Leader: Neighborhood
New Welcoming Entrance to
Hanscom Park
Improved connection to
Columbus Park Community
Center
Pocket Park Opportunities

Page 48 – Park Avenue Neighborhood Study
THEME 6: JOBS AND COMMERCIAL DEVELOPMENT
Despite having the highest population density in Omaha, the neighborhood has a very low number of jobs and commercial services to meet daily needs.
Increased local jobs, economic development, and retail opportunities in the neighborhood by doubling the number of jobs in the area by 2025.
Participants of the public engagement efforts did not identify the need to increase jobs in the district, but they overwhelmingly wanted more access to retail and shopping options to meet their daily needs. Local businesses within walking distance were among the favorite aspects of Park Avenue and an ideal community quality for respondents. New businesses have opened on Park Avenue in recent months, helping to provide jobs in the neighborhood, but more start-up business space is needed. Additional jobs in the neighborhood could be filled by residents and would also provide options for residents to walk or bike to work, reducing parking congestion.
VISION
WHY

Page 49
JOBS AND COMMERCE STRATEGIESStrategy A: Provide development programs and regulations to support new businesses
Option 1: Review ordinances to ensure they support mixed-use developments as well as ground floor commercial/retail spaces along Park Avenue and Leavenworth StreetMeasure: Review complete by 2021 with code changes made as necessaryLeader: City
Option 2: Attract commercial real estate developers into neighborhoodMeasure: Two meetings held with developers to express interest in seeing new, redeveloped, or expanded commercial development within neighborhoodLeader: Neighborhood
Strategy B: Provide support for local business start ups or expansions
Option 1: Identify the funding and structure for a program that provides seed capital and marking support to small, local businesses wishing to start up in the neighborhoodMeasure: Two new start ups in the neighborhood as a result of the fundLeader: Neighborhood
Option 2: Support local businesses by promoting shopping within the neighborhood to residentsMeasure: Increase in sales of local businesses of 5% by 2022Leader: Neighborhood
Option 3: Develop a neighborhood business association (see Racial Diversity strategy) Measure: Association launched Fall 2020Leader: Neighborhood
Option 4: Work with local building owners to find and establish a space for coworkingMeasure: Coworking space opened by 2024Leader: Neighborhood
Page 50 – Park Avenue Neighborhood Study
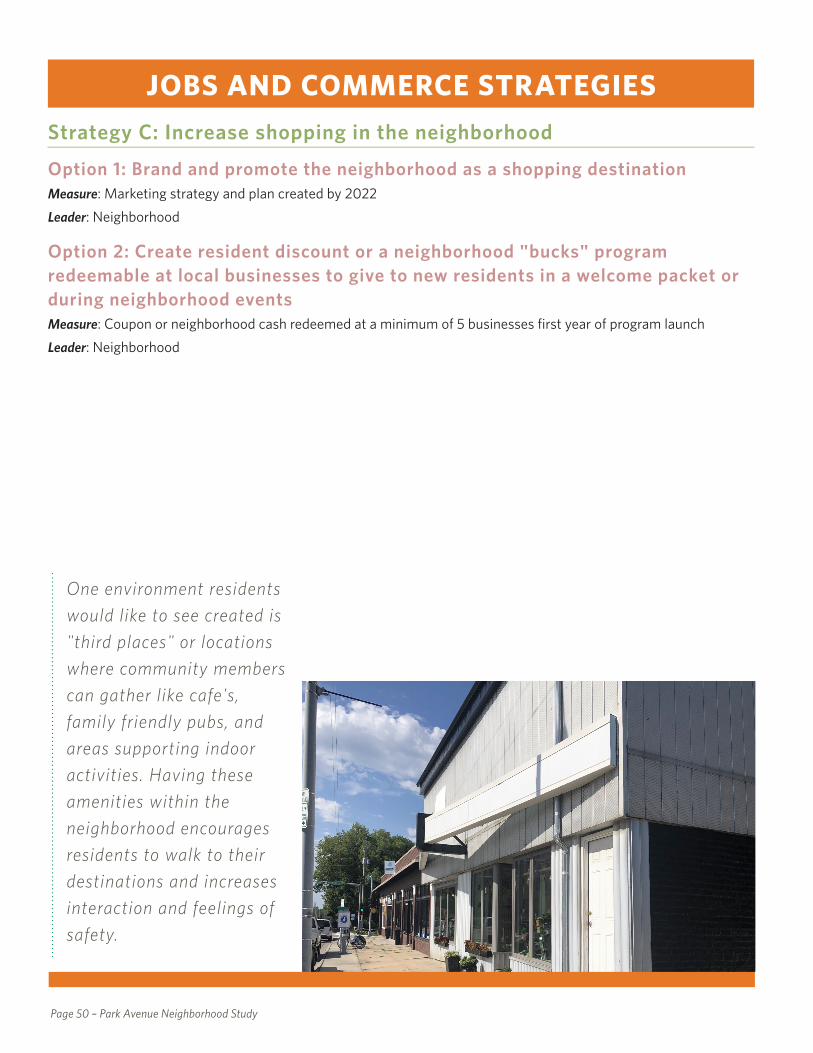
JOBS AND COMMERCE STRATEGIESStrategy C: Increase shopping in the neighborhood
Option 1: Brand and promote the neighborhood as a shopping destinationMeasure: Marketing strategy and plan created by 2022Leader: Neighborhood
Option 2: Create resident discount or a neighborhood "bucks" program redeemable at local businesses to give to new residents in a welcome packet or during neighborhood eventsMeasure: Coupon or neighborhood cash redeemed at a minimum of 5 businesses first year of program launchLeader: Neighborhood
One environment residents would like to see created is "third places" or locations where community members can gather like cafe's, family friendly pubs, and areas supporting indoor activities. Having these amenities within the neighborhood encourages residents to walk to their destinations and increases interaction and feelings of safety.

Page 51
THEME 7: PROPERTY UPKEEP
Property maintenance, building upkeep, and preservation ranked highly but seen as currently lacking in the neighborhood.
Encourage a clean and well-kept neighborhood and expand personal ownership in property maintenance to all residents in the neighborhood through greater participation in neighborhood clean-ups by area renters..
Property maintenance, building upkeep, and preservation were highly ranked and considered lacking in the neighborhood. Proper maintenance shows investment in a community and avoids deterioration of a block when a building starts to decline. When properties are maintained it also sends a message that the neighborhood is not open to criminal activity, helping to reduce concerns cited in other themes. Many respondents felt the historic and older building stock is an important characteristic in the neighborhood and therefore should be preserved and maintained for its ability to provide affordable housing and support diversity - another highly regarded neighborhood characteristic.
VISION
WHY

Page 52 – Park Avenue Neighborhood Study
PROPERTY UPKEEP STRATEGIESStrategy A: Improve the appearance of the neighborhood to reflect the pride residents possess
Option 1: Continue to fund the Graffiti Van and kitsMeasure: Distribute three to five additional Graffiti kits in the neighborhood on an annual basisLeader: City
Option 2: More proactive code enforcement to keep properties clean and in good repairMeasure: The number of properties out of compliance declines by 2 to 3 per yearLeader: City
Option 3: City to set example of good property upkeep by maintaining streets, street lights, and other public infrastructure in good repairMeasure: See individual actions under public infrastructureLeader: City
Option 4: Maintain regular trash clean up days led by neighborhood residents to keep streets and public spaces clean of debrisMeasure: One smaller scale trash clean per quarter with bi-annual larger clean-upsLeader: Neighborhood
Option 5: Work with nonprofits and business owners to provide and maintain trash and recycling bins with lidsMeasure: Five new trash cans on Park Avenue by 2022Leader: Neighborhood
Option 6: Establish improved maintenance program for alleys Measure: Installed lighting in key alleys and regular litter removal program established by 2022Leader: City and Neighborhood
Option 7: Establish a property maintenance expectation Measure: Work with the city to refine property maintenance pamphlet and provide to all new residents, owner and renterLeader: Neighborhood

Page 53
PROPERTY UPKEEP STRATEGIES
While the City will enforce vacant and dilapidated buildings, much of the strategies are focused on proactive measures led by the neighborhood including trash clean up days and forming groups to help maintain dwellings for those that need assistance.
Strategy B: Support continued building upkeep and maintenance
Option 1: Partner with existing community organizations that provide home repair support for low-income and/or elderly homeowners Measure: Meetings held with two community organiza-tions to identify opportunities to support and expand home repair programming within the neighborhoodLeader: Neighborhood
Option 2: Start a tool sharing program to help residents maintain and upgrade their properties at a reduced expense Measure: Enlist at least 10 people as part of the pilot tool sharing programLeader: Neighborhood
Option 3: Develop relationships with landlords to ensure proper upkeep of rental propertiesMeasure: Hold 2 to 3 meetings in 2020 with local landlords Leader: Neighborhood
Option 4: Increase communication and awareness of property issues with landlordsMeasure: Develop contact list of landlords for residents to share issues with propertiesLeader: Neighborhood
Page 54 – Park Avenue Neighborhood Study
THEME 8: SECURITY AND SAFETY
Increase the sense of security in the neighborhood felt by all residents. Ultimately creating a community where residents feel safe walking at any time of day.
Residents who feel safe in their neighborhoods are more likely to take ownership in the neighborhoods quality of life and engage with other residents.
In both the survey responses and the public visioning meeting, respondents highlighted high crime rates and lack of safe environments to walk in the neighborhood. Most concerns were around theft and burglary, especially on Park Avenue and at night.
VISION
WHY
Page 55
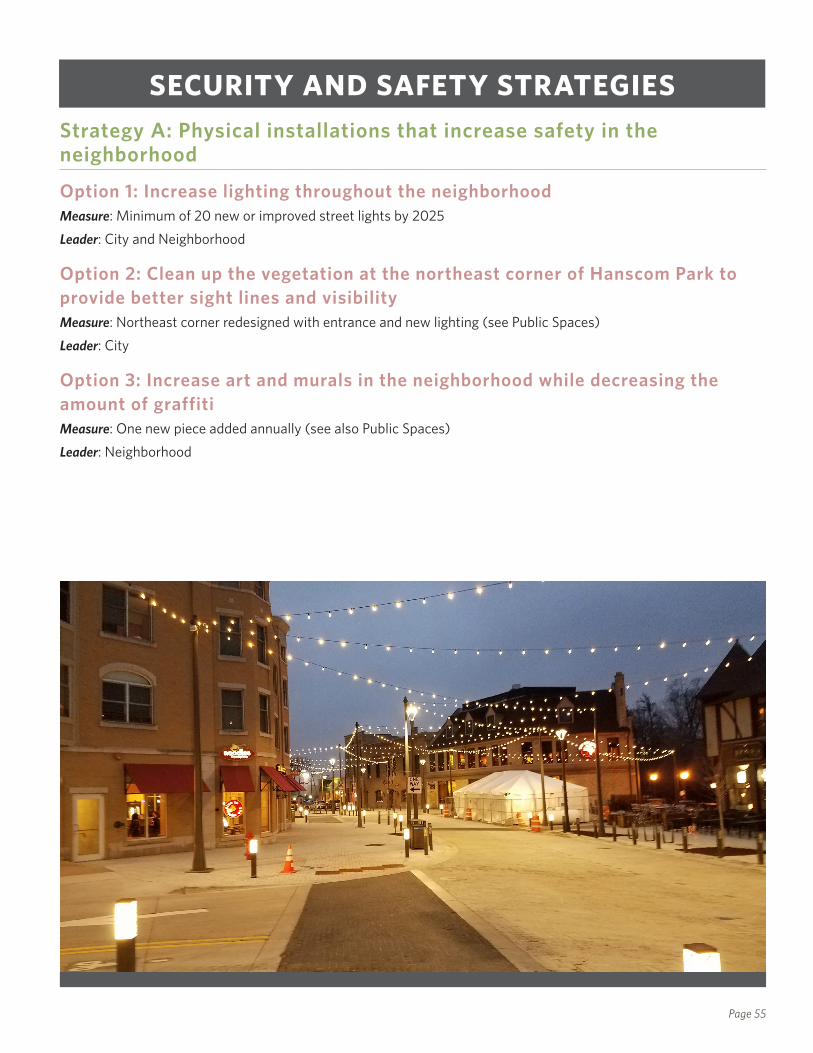
SECURITY AND SAFETY STRATEGIESStrategy A: Physical installations that increase safety in the neighborhood
Option 1: Increase lighting throughout the neighborhoodMeasure: Minimum of 20 new or improved street lights by 2025Leader: City and Neighborhood
Option 2: Clean up the vegetation at the northeast corner of Hanscom Park to provide better sight lines and visibilityMeasure: Northeast corner redesigned with entrance and new lighting (see Public Spaces)Leader: City
Option 3: Increase art and murals in the neighborhood while decreasing the amount of graffitiMeasure: One new piece added annually (see also Public Spaces)Leader: Neighborhood

Page 56 – Park Avenue Neighborhood Study
SECURITY AND SAFETY STRATEGIESStrategy B: Reduce the perception that the neighborhood is unsafe
Option 1: Publicize the crime data to show decline in criminal activity in the neighborhoodMeasure: Annual publication in newsletters or other outlets of current crime dataLeader: Neighborhood
Option 2: Organize support providers, neighborhood groups, and local businesses to help ease tension between neighbors and homeless populationMeasure: At least two new sources of outreach/assistance efforts by local businesses or organizations by the end of 2023Leader: Neighborhood
Option 3: Increase bicycle patrols in the neighborhood in place of vehicle patrols to provide better connection between police and residentsMeasure: Bicycle patrols through the neighborhood at least once a weekLeader: City

Page 57
The following sections identifies the next steps to carry out the recommendations and action items contained in this plan. As the organization of this plan demonstrates, it will take more than one group to see progress and action occur. Neighborhood priorities were developed providing a starting point following the completion of this plan. In addition, an equitable development checklist, modeled after equity scorecards created in other communities, will help decision makers ensure their plans are benefiting the neighborhood as a whole. This is achieved by providing a list of topics to consider when proposing new development or policy changes by community members, government officials, and developers.
Neighborhood PrioritiesThe steering committee developed the following list of priority items within the Park Avenue neighborhood based on feedback gathered throughout the public engagement process. These priorities represent the eight themes identified in this plan and are a direct representation of the needs and desires of the residents of Park Avenue. This list should be revisited on an annual basis to determine progress and changing priorities. The list should be updated based on an analysis of those factors.
1. Lighting» More lighting in all parks and along trails for
decorative and safety aspects» Better pedestrian level lighting» Alley redevelopment with better lighting
2. Sidewalks and Streetscape» Make sidewalks more pedestrian friendly» More trees and streetscaping on Park Avenue» Complete the sidewalks on the north side of
Hanscom Park
3. Traffic» Add traffic calming devices, especially on Turner
Boulevard and Pacific Street» Return Park Avenue to two way traffic north of
St. Mary's
4. Parking » Parking reduced to just one side of Leavenworth» Promote parking on 29th Street with signage
and connections
5. Access» Better access from Park Avenue into Hanscom
Park
6. Development Standards» Limit the height of buildings to 4-over-1 to
assist in meeting affordable housing goals» Allow accessory dwelling units» Implement inclusionary zoning on transit
oriented developments
7. Complete Streets» Repave streets instead of filling potholes» Bike lane connections on Pacific and 32nd
Streets» Parking used to buffer bike lanes
THEMES AND STRATEGIES
Page 58 – Park Avenue Neighborhood Study
IMPLEMENTATION
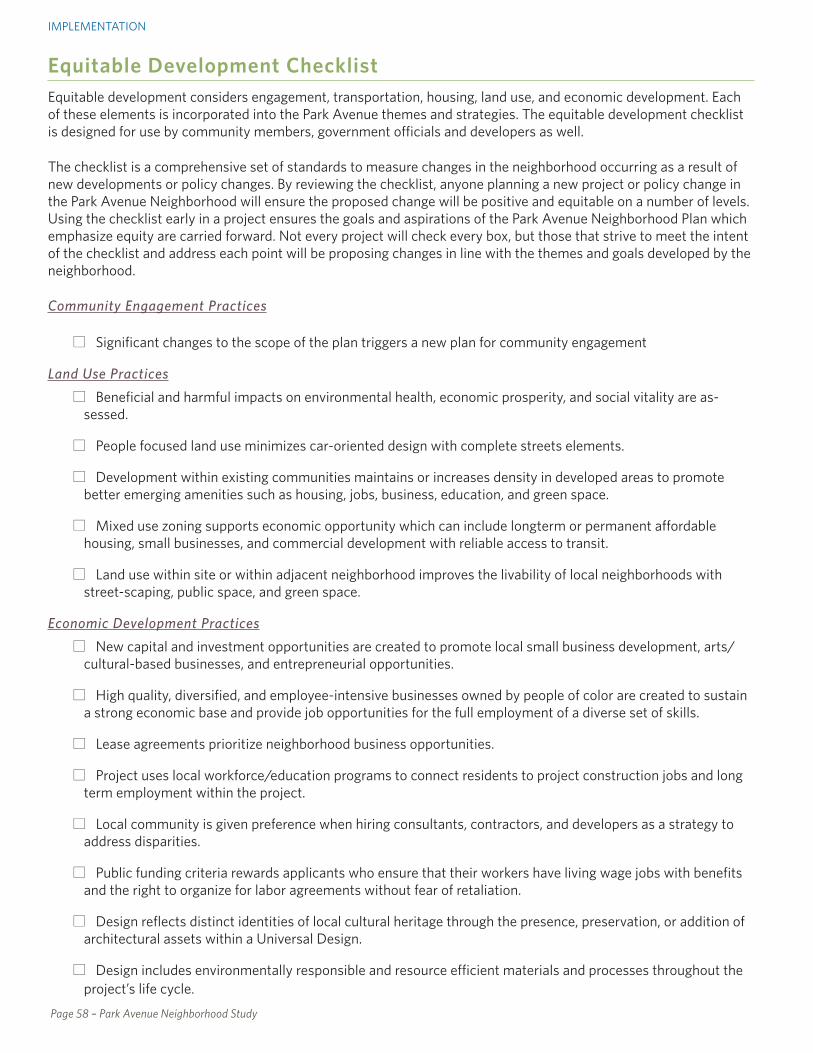
Equitable Development ChecklistEquitable development considers engagement, transportation, housing, land use, and economic development. Each of these elements is incorporated into the Park Avenue themes and strategies. The equitable development checklist is designed for use by community members, government officials and developers as well.
The checklist is a comprehensive set of standards to measure changes in the neighborhood occurring as a result of new developments or policy changes. By reviewing the checklist, anyone planning a new project or policy change in the Park Avenue Neighborhood will ensure the proposed change will be positive and equitable on a number of levels. Using the checklist early in a project ensures the goals and aspirations of the Park Avenue Neighborhood Plan which emphasize equity are carried forward. Not every project will check every box, but those that strive to meet the intent of the checklist and address each point will be proposing changes in line with the themes and goals developed by the neighborhood.
Community Engagement Practices
□ Significant changes to the scope of the plan triggers a new plan for community engagement
Land Use Practices □ Beneficial and harmful impacts on environmental health, economic prosperity, and social vitality are as-sessed.
□ People focused land use minimizes car-oriented design with complete streets elements.
□ Development within existing communities maintains or increases density in developed areas to promote better emerging amenities such as housing, jobs, business, education, and green space.
□ Mixed use zoning supports economic opportunity which can include longterm or permanent affordable housing, small businesses, and commercial development with reliable access to transit.
□ Land use within site or within adjacent neighborhood improves the livability of local neighborhoods with street-scaping, public space, and green space.
Economic Development Practices □ New capital and investment opportunities are created to promote local small business development, arts/cultural-based businesses, and entrepreneurial opportunities.
□ High quality, diversified, and employee-intensive businesses owned by people of color are created to sustain a strong economic base and provide job opportunities for the full employment of a diverse set of skills.
□ Lease agreements prioritize neighborhood business opportunities.
□ Project uses local workforce/education programs to connect residents to project construction jobs and long term employment within the project.
□ Local community is given preference when hiring consultants, contractors, and developers as a strategy to address disparities.
□ Public funding criteria rewards applicants who ensure that their workers have living wage jobs with benefits and the right to organize for labor agreements without fear of retaliation.
□ Design reflects distinct identities of local cultural heritage through the presence, preservation, or addition of architectural assets within a Universal Design.
□ Design includes environmentally responsible and resource efficient materials and processes throughout the project’s life cycle.

Page 59
IMPLEMENTATION
Transportation Practices □ Development infrastructure provides safe, attractive, and convenient access to pedestrian, bicycle, and transit systems.
□ New developments accommodate bicycle storage and good pedestrian circulation.
□ Attractive, comfortable, accessible transit facilities are available or provided.
□ Presence of wayfinding and systems information for pedestrians, bicyclists, and transit users is provided.
□ Development promotes traffic calming and pedestrian safety with the presence of enhanced crosswalks.
□ Accessible to all abilities by the incorporation of Universal Design.
Housing Practices □ Collectively, housing projects are coordinated to ensure that minimally 1/3 of total units throughout the neighborhood are available to families making 80% AMI (Area Median Income) or below that are long term or permanently affordable.
□ All new housing is built with energy efficiency technology to reduce utility bills for the residents and is free from environmental hazards.
□ Zoning codes promote the integration of affordable housing within mixed income neighborhoods.
□ The percentage of housing that accommodates large families with 3 to 4 bedroom units reflects community’s need.
ENDORSED BY