
PLDT Inc. Ramon Cojuangco Building Makati Avenue, Makati ...
35
SEC Number PW-55 File Number PLDT Inc. (Company’s Full Name) Ramon Cojuangco Building Makati Avenue, Makati City (Company’s Address) (632) 816-8556 (Telephone Number) Not Applicable (Fiscal Year Ending) (month & day) SEC Form 17-Q Form Type Not Applicable Amendment Designation (if applicable) September 30, 2018 Period Ended Date Not Applicable (Secondary License Type and File Number)
-
Upload
khangminh22 -
Category
Documents
-
view
4 -
download
0
Transcript of PLDT Inc. Ramon Cojuangco Building Makati Avenue, Makati ...

SEC Number PW-55File Number
PLDT Inc.
(Company’s Full Name)
Ramon Cojuangco Building Makati Avenue, Makati City
(Company’s Address)
(632) 816-8556
(Telephone Number)
Not Applicable
(Fiscal Year Ending) (month & day)
SEC Form 17-Q
Form Type
Not Applicable
Amendment Designation (if applicable)
September 30, 2018
Period Ended Date
Not Applicable
(Secondary License Type and File Number)


COVER SHEET
SEC Registration NumberP W - 5 5
Company Name P L D T I N C .
Principal Office (No./Street/Barangay/City/Town/Province)
R A M O N C O J U A N G C O B U I L D I N G
M A K A T I A V E N U E M A K A T I C I T Y
Form Type Department requiring the report Secondary License Type, If
Applicable 1 7 - Q M S R D
COMPANY INFORMATION
Company’s Email Address Company’s Telephone Number/s Mobile Number [email protected] (02) 816-8534
No. of Stockholders Annual Meeting
Month/DayFiscal Year Month/Day
11,667 as at September 30, 2018
Every 2nd Tuesday in June
December 31
CONTACT PERSON INFORMATION The designated contact person MUST be an Officer of the Corporation
Name of Contact Person Email Address Telephone Number/s Mobile NumberJune Cheryl A. Cabal-Revilla [email protected] (02) 816-8534
Contact Person’s Address
11/F Ramon Cojuangco Bldg. Makati Ave., Makati City
Note: In case of death, resignation or cessation of office of the officer designated as contact person, such incident shall be reported to the Commission within thirty (30) calendar days from the occurrence thereof with information and complete contact details of the new contact person designated.

SECURITIES AND EXCHANGE COMMISSION
SEC FORM 17-Q
QUARTERLY REPORT PURSUANT TO SECTION 17
OF THE SECURITIES REGULATION CODE (“SRC”) AND SRC 17 (2) (b) THEREUNDER
1. For the quarterly period ended
September 30, 2018
2. SEC Identification Number PW-55
3. BIR Tax Identification No. 000-488-793
4. PLDT Inc.
Exact name of registrant as specified in its charter
5. Republic of the Philippines
Province, country or other jurisdiction of incorporation or organization
6. Industry Classification Code: (SEC Use Only)
7. Ramon Cojuangco Building, Makati Avenue, Makati City
0721
Address of registrant’s principal office Postal Code
8. (632) 816-8556
Registrant’s telephone number, including area code
9. Not Applicable
Former name, former address, and former fiscal year, if changed since last report
10. Securities registered pursuant to Sections 8 of the SRC
Title of Each Class
Number of Shares of Common Stock Outstanding
Common Capital Stock, Php5 par value
216,055,775 shares as at September 30, 2018
11. Are any or all of these securities listed on the Philippine Stock Exchange?
Yes [ X ]
No [ ]
12. Check whether the registrant
(a) has filed all reports required to be filed by Section 17 of the Code and SRC Rule 17 thereunder or Section 11 of the RSA and RSA Rule 11(a)-1 thereunder, and Sections 26 and 141 of the Corporation Code of the Philippines, during the preceding 12 months (or for such shorter period the registrant was required to file such reports):
Yes [ X ]
No [ ]
(b) has been subject to such filing requirements for the past 90 days.
Yes [ X ]
No [ ]

TABLE OF CONTENTS
PART I FINANCIAL INFORMATION................................................................................................. 1Item 1. Consolidated Financial Statements............................................................................................ 1Item 2. Management’s Discussion and Analysis of Financial Condition and Results of Operations .. 1
Financial Highlights and Key Performance Indicators ............................................................. 2 Performance Indicators .............................................................................................................. 3 Overview .................................................................................................................................... 4 Management’s Financial Review............................................................................................... 4
Results of Operations ................................................................................................................. 5 Wireless ................................................................................................................................ 9 Revenues ......................................................................................................................... 9 Service Revenues ............................................................................................................ 10 Non-Service Revenues ................................................................................................... 13 Expenses ......................................................................................................................... 13 Other Income (Expenses) ............................................................................................... 14 Provision for Income Tax............................................................................................... 15 Net Income .................................................................................................................... 15 EBITDA .......................................................................................................................... 15 Core Income ................................................................................................................... 15
Fixed Line ............................................................................................................................. 15 Revenues ......................................................................................................................... 15 Service Revenues ............................................................................................................ 15 Non-Service Revenues ................................................................................................... 16
Expenses ......................................................................................................................... 16 Other Income (Expenses) ............................................................................................... 17 Provision for Income Tax............................................................................................... 17 Net Income...................................................................................................................... 18 EBITDA .......................................................................................................................... 18
Core Income ................................................................................................................... 18 Others .................................................................................................................................... 18 Revenues ......................................................................................................................... 18 Expenses ......................................................................................................................... 18 Other Income (Expenses) ............................................................................................... 18
Net Income...................................................................................................................... 19 Core Income ................................................................................................................... 19
Liquidity and Capital Resources................................................................................................ 19 Operating Activities ............................................................................................................. 20
Investing Activities .............................................................................................................. 20 Financing Activities ............................................................................................................. 21
Changes in Financial Conditions ............................................................................................... 22 Off-Balance Sheet Arrangements .............................................................................................. 22 Equity Financing ........................................................................................................................ 23 Contractual Obligations and Commercial Commitments ......................................................... 23 Quantitative and Qualitative Disclosures about Market Risks ................................................. 23 Impact of Inflation and Changing Prices ................................................................................... 24PART II – OTHER INFORMATION ......................................................................................................... 25 Related Party Transactions................................................................................................... 27ANNEX – Aging of Accounts Receivable .................................................................................................. A-1 Financial Soundness Indicators ................................................................................................. A-2 SIGNATURES ........................................................................................................................... S-1

3Q 2018 Fo rm 17 -Q Page 1 o f 27
PART I – FINANCIAL INFORMATION
Item 1. Consolidated Financial Statements
Our consolidated financial statements as at September 30, 2018 (unaudited) and December 31, 2017 (audited) and for the nine months ended September30, 2018 and 2017 (unaudited) and related notes (pages F-1 to F-151) are filed as part of this report on Form 17-Q. Item 2. Management’s Discussion and Analysis of Financial Condition and Results of Operations
In the following discussion and analysis of our financial condition and results of operations, unless the context indicates or otherwise requires, references to “we,” “us,” “our” or “PLDT Group” mean PLDT Inc. and its consolidated subsidiaries, and references to “PLDT” mean PLDT Inc., not including its consolidated subsidiaries (please see Note 2 – Summary of Significant Accounting Policies to the accompanying unaudited consolidated financial statements for the list of these subsidiaries, including a description of their respective principal business activities and PLDT’s direct and/or indirect equity interest).
The following discussion and analysis of our financial condition and results of operations should be read in conjunction with the accompanying unaudited consolidated financial statements and the related notes. Our unaudited consolidated financial statements, and the financial information discussed below, have been prepared in accordance with Philippine Financial Reporting Standards, or PFRS, which is virtually converged with International Financial Reporting Standards as issued by the International Accounting Standards Board. PFRS differs in certain significant respects from generally accepted accounting principles, or GAAP, in the U.S.
The financial information appearing in this report and in the accompanying unaudited consolidated financial statements is stated in Philippine pesos. Unless otherwise indicated, translations of Philippine peso amounts into U.S. dollars in this report and in the accompanying unaudited consolidated financial statements were made based on the exchange rate of Php54.10 to US$1.00, the exchange rate as at September 30, 2018 quoted through the Bankers Association of the Philippines.
Some information in this report may contain forward-looking statements within the meaning of Section 27A of the U.S. Securities Act of 1933, as amended, and Section 21E of the U.S. Securities Exchange Act of 1934, as amended. We have based these forward-looking statements on our current beliefs, expectations and intentions as to facts, actions and events that will or may occur in the future. Such statements generally are identified by forward-looking words such as “believe,” “plan,” “anticipate,” “continue,” “estimate,” “expect,” “may,” “will” or other similar words.
A forward-looking statement may include a statement of the assumptions or bases underlying the forward-looking statement. We have chosen these assumptions or bases in good faith. These forward-looking statements are subject to risks, uncertainties and assumptions, some of which are beyond our control. In addition, these forward-looking statements reflect our current views with respect to future events and are not a guarantee of future performance. Actual results may differ materially from information contained in the forward-looking statements as a result of a number of factors, including, without limitation, the risk factors. When considering forward-looking statements, you should keep in mind the description of risks and other cautionary statements in this report. You should also keep in mind that any forward-looking statement made by us in this report or elsewhere speaks only as at the date on which we made it. New risks and uncertainties come up from time to time, and it is impossible for us to predict these events or how they may affect us. We have no duty to, and do not intend to, update or revise the statements in this report after the date hereof. In light of these risks and uncertainties, you should keep in mind that actual results may differ materially from any forward-looking statement made in this report or elsewhere.
3Q 2018 Fo rm 17 -Q Page 2 o f 27
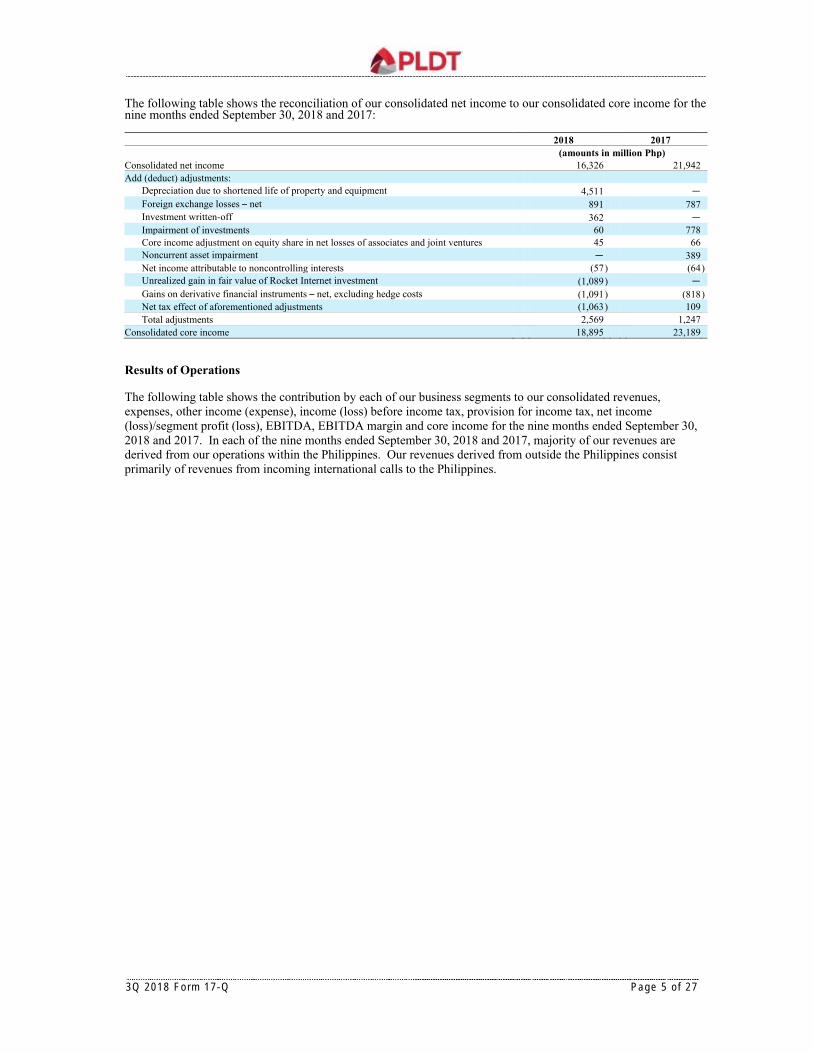
Financial Highlights and Key Performance Indicators
Nine months ended
September 30, Increase (Decrease) 2018 2017 Amount %
(amounts in million Php, except for EBITDA margin, earnings per common share) Consolidated Income Statement Revenues 123,151 119,066 4,085 3Expenses 101,593 96,495 5,098 5Other income (expenses) (309) 5,307 (5,616 ) (106)Income before income tax 21,249 27,878 (6,629 ) (24)Net income 16,326 21,942 (5,616 ) (26)Core income 18,895 23,189 (4,294 ) (19)EBITDA 49,699 49,129 570 1EBITDA margin(1) 43% 43% — —
Reported earnings per common share: Basic 75.09 101.06 (25.97 ) (26)Diluted 75.09 101.06 (25.97 ) (26)
Core earnings per common share(2): Basic 87.25 107.12 (19.87 ) (19)Diluted 87.25 107.12 (19.87 ) (19)
September 30, December 31, Increase (Decrease) 2018 2017 Amount %
(amounts in million Php, except for net debt to equity ratio) Consolidated Statements of Financial Position Total assets 470,841 459,444 11,397 2Property and equipment 194,748 186,907 7,841 4Cash and cash equivalents and short-term investments 50,052 33,979 16,073 47Total equity attributable to equity holders of PLDT 109,478 106,842 2,636 2Long-term debt, including current portion 179,223 172,611 6,612 4Net debt(3) to equity ratio 1.18x 1.30x — —
Nine months ended
September 30, Change 2018 2017 Amount %
(amounts in million Php, except for operational data) Consolidated Statements of Cash Flows Net cash provided by operating activities 42,622 27,355 15,267 56Net cash used in investing activities (17,988) (4,843) (13,145 ) (271)
Payment for purchase of property and equipment, including capitalized interest 40,484 10,993 29,491 268
Net cash used in financing activities (14,038) (36,247) 22,209 61 Operational Data Number of mobile subscribers 58,034,007 58,218,034 (184,027 ) —
Prepaid(4) 55,627,968 55,651,398 (23,430 ) —
Postpaid 2,406,039 2,566,636 (160,597 ) (6)Number of broadband subscribers 2,054,225 1,903,412 150,813 8
Fixed Line broadband 1,859,210 1,651,515 207,695 13Fixed Wireless broadband 195,015 251,897 (56,882 ) (23)
Number of fixed line subscribers 2,778,274 2,614,248 164,026 6Number of employees: 16,978 17,567 (589 ) (3)
Fixed Line 10,264 10,629 (365 ) (3)LEC 8,091 6,803 1,288 19Others 2,173 3,826 (1,653 ) (43)
Wireless 6,014 6,938 (924 ) (13)Others(5) 700 — 700 —
(1) EBITDA margin for the period is measured as EBITDA divided by service revenues. (2) Core earnings per common share, or EPS, for the period is measured as core income divided by the weighted average number of outstanding
common shares for the period. (3) Net debt is derived by deducting cash and cash equivalents and short-term investments from total debt (long-term debt, including current
portion). (4) Beginning 2Q2017, the prepaid subscriber base excludes subscribers who did not reload within 90 days vis-à-vis 120 days previous cut-off. (5) Includes Voyager headcount resulting from the transfer of Voyager Innovations Holdings Pte. Ltd., or VIH, from Smart to PLDT
Communications and Energy Ventures, Inc., or PCEV, in April 2018.

3Q 2018 Fo rm 17 -Q Page 3 o f 27
Exchange Rates – per US$ Month end
rates
Weighted average rates
during the year September 30, 2018 54.10 52.50 December 31, 2017 49.96 50.41 September 30, 2017 50.83 50.24 December 31, 2016 49.77 47.48
Performance Indicators
We use a number of non-GAAP performance indicators to monitor financial performance. These are summarized below and discussed later in this report.
EBITDA
EBITDA for the period is measured as net income excluding depreciation and amortization, amortization of intangible assets, asset impairment on noncurrent assets, financing costs – net, interest income, equity share in net earnings (losses) of associates and joint ventures, foreign exchange gains (losses) – net, gains (losses) on derivative financial instruments – net, provision for (benefit from) income tax and other income – net. EBITDA is monitored by management for each business unit separately for purposes of making decisions about resource allocation and performance assessment. EBITDA is presented also as a supplemental disclosure because our management believes that it is widely used by investors in their analysis of the performance of PLDT and to assist them in their comparison of PLDT’s performance with that of other companies in the technology, media and telecommunications sector. We also present EBITDA because it is used by some investors as a way to measure a company’s ability to incur and service debt, make capital expenditures and meet working capital requirements. Companies in the technology, media and telecommunications sector have historically reported EBITDA as a supplement to financial measures in accordance with PFRS. EBITDA should not be considered as an alternative to net income as an indicator of our performance, as an alternative to cash flows from operating activities, as a measure of liquidity or as an alternative to any other measure determined in accordance with PFRS. Unlike net income, EBITDA does not include depreciation and amortization, and financing costs and, therefore, does not reflect current or future capital expenditures or the cost of capital. We compensate for these limitations by using EBITDA as only one of several comparative tools, together with PFRS-based measurements, to assist in the evaluation of operating performance. Such PFRS-based measurements include income before income tax, net income, cash flows from operations and cash flow data. We have significant uses of cash flows, including capital expenditures, interest payments, debt principal repayments, taxes and other non-recurring charges, which are not reflected in EBITDA. Our calculation of EBITDA may be different from the calculation methods used by other companies and, therefore, comparability may be limited.
Core Income
Core income for the period is measured as net income attributable to equity holders of PLDT (net income less net income attributable to noncontrolling interests), excluding foreign exchange gains (losses) – net, gains (losses) on derivative financial instruments – net (excluding hedge costs), asset impairment on noncurrent assets, other non-recurring gains (losses), net of tax effect of aforementioned adjustments, as applicable, and similar adjustments to equity share in net earnings (losses) of associates and joint ventures. The core income results are monitored by management for each business unit separately for purposes of making decisions about resource allocation and performance assessment. Also, core income is used by management as a basis of determining the level of dividend payouts to shareholders and basis of granting incentives to employees. Core income should not be considered as an alternative to income before income tax or net income determined in accordance with PFRS as an indicator of our performance. Unlike income before income tax, core income does not include foreign exchange gains and losses, gains and losses on derivative financial instruments, asset impairments and other non-recurring gains and losses. We compensate for these limitations by using core income as only one of several comparative tools, together with PFRS-based measurements, to assist in the evaluation of operating performance. Such PFRS-based measurements include income before income tax and net income. Our calculation of core income may be different from the calculation methods used by other companies and, therefore, comparability may be limited.

3Q 2018 Fo rm 17 -Q Page 4 o f 27
Overview
We are the largest and most diversified telecommunications company in the Philippines which delivers data and multimedia services nationwide. We have organized our business into business units based on our products and services and have three reportable operating segments which serve as the bases for management’s decision to allocate resources and evaluate operating performance:
Wireless mobile telecommunications services provided by Smart Communications, Inc., or Smart, and Digitel Mobile Philippines, Inc., or DMPI, our mobile service providers; Smart Broadband, Inc., or SBI, and Primeworld Digital Systems, Inc., or PDSI, our wireless broadband service providers; and certain subsidiaries of PLDT Global Corporation, or PLDT Global, our mobile virtual network operations, or MVNO, provider;
Fixed Line fixed line telecommunications services primarily provided by PLDT. We also provide fixed line services through PLDT’s subsidiaries, namely, PLDT Clark Telecom, Inc., PLDT Subic Telecom, Inc., PLDT-Philcom, Inc. or Philcom, and its subsidiaries, or Philcom Group, PLDT-Maratel, Inc., Bonifacio Communications Corporation, PLDT Global and certain subsidiaries and Digitel, all of which together account for approximately 4% of our consolidated fixed line subscribers; data center, cloud, big data, managed security services, managed IT services and resellership provided by ePLDT, Inc., or ePLDT, IP Converge Data Services, Inc., or IPCDSI, and subsidiary, or IPCDSI Group, ABM Global Solutions, Inc., or AGS, and its subsidiaries, or AGS Group, Curo Teknika, Inc. and ePDS, Inc., or ePDS; business infrastructure and solutions, intelligent data processing and implementation services and data analytics insight generation provided by Talas Data Intelligence, Inc., or Talas; distribution of Filipino channels and content by Pilipinas Global Network Limited and its subsidiaries; and
Others Voyager Innovations, Inc., or Voyager, and certain subsidiaries, our mobile applications and digital platforms developers and mobile financial services provider; PCEV, PLDT Global Investment Holdings, Inc., Mabuhay Investments Corporation, PLDT Global Investments Corporation, or PGIC, PLDT Digital Investments Pte. Ltd., or PLDT Digital, and its subsidiaries, our investment companies.
As at September 30, 2018, our chief operating decision maker, or our Management Committee, views our business activities in three business units: Wireless, Fixed Line and Others.
Management’s Financial Review
In addition to consolidated net income, we use EBITDA and core income to assess our operating performance. The reconciliation of our consolidated net income to our consolidated EBITDA and our consolidated core income for the nine months ended September 30, 2018 and 2017 are set forth below.
The following table shows the reconciliation of our consolidated net income to our consolidated EBITDA for the nine months ended September 30, 2018 and 2017:
2018 2017 (amounts in million Php)
Consolidated net income 16,326 21,942Add (deduct) adjustments:
Depreciation and amortization 27,500 25,547Financing costs – net 5,292 5,628Provision for income tax 4,923 5,936Foreign exchange losses – net 891 787Amortization of intangible assets 641 622Impairment of investments 60 778Noncurrent asset impairment — 389Equity share in net earnings of associates and joint ventures (199 ) (2,734)Gains on derivative financial instruments – net (1,053 ) (650)Interest income (1,396 ) (1,023)Other income – net (3,286 ) (8,093)Total adjustments 33,373 27,187
Consolidated EBITDA 49,699 49,129
3Q 2018 Fo rm 17 -Q Page 5 o f 27
The following table shows the reconciliation of our consolidated net income to our consolidated core income for the nine months ended September 30, 2018 and 2017:
2018 2017 (amounts in million Php)
Consolidated net income 16,326 21,942Add (deduct) adjustments:
Depreciation due to shortened life of property and equipment 4,511 —
Foreign exchange losses – net 891 787Investment written-off 362 —
Impairment of investments 60 778Core income adjustment on equity share in net losses of associates and joint ventures 45 66Noncurrent asset impairment — 389Net income attributable to noncontrolling interests (57 ) (64)Unrealized gain in fair value of Rocket Internet investment (1,089 ) —
Gains on derivative financial instruments – net, excluding hedge costs (1,091 ) (818)Net tax effect of aforementioned adjustments (1,063 ) 109Total adjustments 2,569 1,247
Consolidated core income 18,895 23,189
Results of Operations
The following table shows the contribution by each of our business segments to our consolidated revenues, expenses, other income (expense), income (loss) before income tax, provision for income tax, net income (loss)/segment profit (loss), EBITDA, EBITDA margin and core income for the nine months ended September 30, 2018 and 2017. In each of the nine months ended September 30, 2018 and 2017, majority of our revenues are derived from our operations within the Philippines. Our revenues derived from outside the Philippines consist primarily of revenues from incoming international calls to the Philippines.

3Q 2018 Fo rm 17 -Q Page 6 o f 27
In 2017, we changed the presentation of our expenses by combining certain line items to simplify our reporting while maintaining the same level of information.
Wireless Fixed Line Others
Inter-segment
Transactions Consolidated (amounts in million Php, except for EBITDA margin) For the nine months ended September 30, 2018 Revenues 67,675 63,336 610 (8,470 ) 123,151Expenses 58,558 50,720 1,957 (9,642 ) 101,593Other income (expenses) (586) (960) 2,791 (1,554 ) (309)Income (loss) before income tax 8,531 11,656 1,444 (382 ) 21,249Provision for income tax 2,221 2,483 219 — 4,923Net income (loss)/Segment profit (loss) 6,310 9,173 1,225 (382 ) 16,326EBITDA 25,433 24,320 (1,226) 1,172 49,699EBITDA margin(1) 41% 40% -210% — 43%Core income 9,514 8,982 781 (382 ) 18,895 For the nine months ended September 30, 2017 Revenues 70,271 58,075 8 (9,288 ) 119,066Expenses 61,372 45,550 43 (10,470 ) 96,495Other income (expenses) (1,250) (1,180) 9,158 (1,421 ) 5,307Income (loss) before income tax 7,649 11,345 9,123 (239 ) 27,878Provision for income tax 2,751 3,099 86 — 5,936Net income (loss)/Segment profit (loss) 4,898 8,246 9,037 (239 ) 21,942EBITDA 25,623 22,359 (35) 1,182 49,129EBITDA margin(1) 38% 40% -438% — 43%Core income 5,757 7,810 9,861 (239 ) 23,189 Increase (Decrease) Revenues (2,596) 5,261 602 818 4,085Expenses (2,814) 5,170 1,914 828 5,098Other income (expenses) 664 220 (6,367) (133 ) (5,616)Income (loss) before income tax 882 311 (7,679) (143 ) (6,629)Provision for income tax (530) (616) 133 — (1,013)Net income (loss)/Segment profit (loss) 1,412 927 (7,812) (143 ) (5,616)EBITDA (190) 1,961 (1,191) (10 ) 570Core income 3,757 1,172 (9,080) (143 ) (4,294) (1) EBITDA margin for the period is measured as EBITDA divided by service revenues. In the first quarter of 2018, we adopted PFRS 15 using the modified retrospective approach. i.e. contracts that are not completed by January 1, 2018 are accounted as if they were recognized in accordance with the new standard from the very beginning. The cumulative effect arising from the transition was recognized as an adjustment to the opening balance of the equity. The following is the impact of PFRS 15 adoption in our profit and loss for the nine months ended September 30, 2018:
PFRS 15 Impact PAS 18 Wireless Fixed Line PFRS 15
(amounts in million Php) Service revenues 117,741 (2,547) (318 ) 114,876Non-service revenues 5,995 2,115 165 8,275Other income – interest income 1,088 200 108 1,396Income before tax 21,564 (269) (46 ) 21,249Provision for income tax 5,018 (81) (14 ) 4,923Net income 16,546 (188) (32 ) 16,326EBITDA 50,321 (469) (153 ) 49,699EBITDA margin 43% — — 43%Core income 19,115 (188) (32 ) 18,895

3Q 2018 Fo rm 17 -Q Page 7 o f 27
On a Consolidated Basis
Revenues
We reported consolidated revenues of Php123,151 million for the nine months ended September 30, 2018, an increase of Php4,085 million, or 3%, as compared with Php119,066 million in the same period in 2017, primarily due to higher revenues from data services in our fixed line business, as well as higher non-service revenues from our wireless and fixed line businesses, partially offset by lower revenues from mobile and home broadband services from our wireless business, and lower voice revenues from our fixed line business.
In compliance with Memorandum Circular No. 05-07-2018 issued by the National Telecommunications Commission, or NTC, the interconnection rates for our voice calls were reduced to Php0.50 per minute from Php2.50 per minute, and rates for SMS were down to Php0.05 per message from Php0.15 per message effective September 1, 2018.
The following table shows the breakdown of our consolidated revenues by services for the nine months ended September 30, 2018 and 2017:
Wireless Fixed Line Others
Inter- segment
Transactions Consolidated (amounts in million Php) For the nine months ended September 30, 2018
Service Revenues Wireless 62,269 (2,116 ) 60,153
Mobile 60,518 (923 ) 59,595Home broadband 124 — 124Digital platforms and mobile financial services 301 (4 ) 297MVNO and others 1,326 (1,189 ) 137
Fixed Line 60,491 (6,349 ) 54,142Voice 18,818 (1,680 ) 17,138Data 40,440 (4,160 ) 36,280
Home broadband 19,934 (197 ) 19,737Corporate data and ICT 20,506 (3,963 ) 16,543
Miscellaneous 1,233 (509 ) 724Others 585 (4 ) 581
Total Service Revenues 62,269 60,491 585 (8,469 ) 114,876Non-Service Revenues
Sale of computers, phone units and mobile handsets 5,406 2,434 25 (7 ) 7,858Point-product sales — 411 — 6 417
Total Non-Service Revenues 5,406 2,845 25 (1 ) 8,275Total Revenues 67,675 63,336 610 (8,470 ) 123,151 For the nine months ended September 30, 2017
Service Revenues Wireless 66,837 (966 ) 65,871
Mobile 63,595 (947 ) 62,648Home broadband 1,930 (7 ) 1,923Digital platforms and mobile financial services 968 (10 ) 958MVNO and others 344 (2 ) 342
Fixed Line 55,466 (8,311 ) 47,155Voice 21,468 (2,622 ) 18,846Data 32,570 (5,019 ) 27,551
Home broadband 13,158 (181 ) 12,977Corporate data and ICT 19,412 (4,838 ) 14,574
Miscellaneous 1,428 (670 ) 758Others 8 (5 ) 3
Total Service Revenues 66,837 55,466 8 (9,282 ) 113,029Non-Service Revenues
Sale of computers, phone units and mobile handsets 3,434 1,985 — (11 ) 5,408Point-product sales — 624 — 5 629
Total Non-Service Revenues 3,434 2,609 — (6 ) 6,037Total Revenues 70,271 58,075 8 (9,288 ) 119,066

3Q 2018 Fo rm 17 -Q Page 8 o f 27
The following table shows the breakdown of our consolidated revenues by business segment for the nine months ended September 30, 2018 and 2017:
Change 2018 % 2017 % Amount %
(amounts in million Php) Wireless 67,675 55 70,271 59 (2,596 ) (4)Fixed line 63,336 51 58,075 49 5,261 9Others(1) 610 1 8 — 602 7,525Inter-segment transactions (8,470) (7) (9,288) (8 ) 818 9Consolidated 123,151 100 119,066 100 4,085 3
(1) Other business segment includes revenues from digital platforms and mobile financial services, resulting from the transfer of VIH from Smart to PCEV in April 2018.
Expenses
Consolidated expenses increased by Php5,098 million, or 5%, to Php101,593 million for the nine months ended September 30, 2018 from Php96,495 million in the same period in 2017, primarily due to higher depreciation and amortization, selling, general and administrative expenses, and provisions in our fixed line business, and higher cost of sales and services in our wireless business.
The following table shows the breakdown of our consolidated expenses by business segment for the nine months ended September 30, 2018 and 2017:
Change 2018 % 2017 % Amount %
(amounts in million Php) Wireless 58,558 58 61,372 64 (2,814 ) (5)Fixed line 50,720 50 45,550 47 5,170 11Others 1,957 2 43 — 1,914 4,451Inter-segment transactions (9,642) (10) (10,470) (11 ) 828 8Consolidated 101,593 100 96,495 100 5,098 5
Other Income (Expenses)
Consolidated other expenses amounted to Php309 million for the nine months ended September 30, 2018, a change of Php5,616 million, or 106%, as against other income of Php5,307 million in the same period in 2017, primarily due to gain on sale of Beacon Electric Holdings, Inc., or Beacon, shares in 2017 and lower equity share in net earnings of associates and joint ventures, partially offset by gain in fair value of Rocket Internet investment in 2018.
The following table shows the breakdown of our consolidated other income (expenses) by business segment for the nine months ended September 30, 2018 and 2017:
Change 2018 2017 Amount % (amounts in million Php)
Wireless (586) (1,250) 664 53Fixed line (960) (1,180) 220 19Others 2,791 9,158 (6,367 ) (70)Inter-segment transactions (1,554) (1,421) (133 ) (9)Consolidated (309) 5,307 (5,616 ) (106)
Net Income (Loss)
Consolidated net income decreased by Php5,616 million, or 26%, to Php16,326 million for the nine months ended September 30, 2018, from Php21,942 million in the same period in 2017, primarily due to lower net income from our other business, partly offset by higher net income from our wireless and fixed line businesses. Our consolidated basic and diluted EPS decreased to Php75.09 for the nine months ended September 30, 2018 from Php101.06 in the same period in 2017. Our weighted average number of outstanding common shares was approximately 216.06 million in each of the first nine months of 2018 and 2017.

3Q 2018 Fo rm 17 -Q Page 9 o f 27
The following table shows the breakdown of our consolidated net income by business segment for the nine months ended September 30, 2018 and 2017:
Change 2018 % 2017 % Amount % (amounts in million Php)
Wireless 6,310 39 4,898 22 1,412 29Fixed line 9,173 56 8,246 38 927 11Others 1,225 7 9,037 41 (7,812 ) (86)Inter-segment transactions (382) (2) (239) (1 ) (143 ) (60)Consolidated 16,326 100 21,942 100 (5,616 ) (26)
EBITDA
Our consolidated EBITDA amounted to Php49,699 million for the nine months ended September 30, 2018, an increase of Php570 million, or 1%, as compared with Php49,129 million in the same period in 2017, primarily due to improved EBITDA in our fixed line business, partially offset by lower EBITDA in our wireless and other businesses.
The following table shows the breakdown of our consolidated EBITDA by business segment for the nine months ended September 30, 2018 and 2017:
Change 2018 % 2017 % Amount % (amounts in million Php)
Wireless 25,433 51 25,623 52 (190 ) (1)Fixed line 24,320 49 22,359 46 1,961 9Others (1,226) (2) (35) — (1,191 ) (3,403)Inter-segment transactions 1,172 2 1,182 2 (10 ) (1)Consolidated 49,699 100 49,129 100 570 1
Core Income
Our consolidated core income amounted to Php18,895 million for the nine months ended September 30, 2018, a decrease of Php4,294 million, or 19%, as compared with Php23,189 million in the same period in 2017, primarily due to lower core income from our other business, partly offset by higher core income from our wireless and fixed line segments. Our consolidated basic and diluted core EPS decreased to Php87.25 for the nine months ended September 30, 2018 from Php107.12 in the same period in 2017.
The following table shows the breakdown of our consolidated core income by business segment for the nine months ended September 30, 2018 and 2017:
Change 2018 % 2017 % Amount % (amounts in million Php)
Wireless 9,514 50 5,757 25 3,757 65Fixed line 8,982 48 7,810 34 1,172 15Others 781 4 9,861 42 (9,080 ) (92)Inter-segment transactions (382) (2) (239) (1 ) (143 ) (60)Consolidated 18,895 100 23,189 100 (4,294 ) (19)
On a Business Segment Basis
Wireless
Revenues
We generated revenues of Php67,675 million from our wireless business for the nine months ended September 30, 2018, a decrease of Php2,596 million, or 4%, from Php70,271 million in the same period in 2017.

3Q 2018 Fo rm 17 -Q Page 10 o f 27
The following table summarizes our total revenues by service from our wireless business for the nine months ended September 30, 2018 and 2017:
Increase (Decrease) 2018 % 2017 % Amount % (amounts in million Php)
Service Revenues: Mobile 60,518 89 63,595 91 (3,077 ) (5)Home broadband 124 — 1,930 3 (1,806 ) (94)Digital platforms and mobile financial services(1) 301 1 968 1 (667 ) (69)MVNO and others(2) 1,326 2 344 — 982 285
Total Wireless Service Revenues 62,269 92 66,837 95 (4,568 ) (7)Non-Service Revenues:
Sale of mobile handsets and broadband data modems 5,406 8 3,434 5 1,972 57Total Wireless Revenues 67,675 100 70,271 100 (2,596 ) (4) (1) Starting April 2018, revenues from digital platforms and mobile financial services are reported under other segment resulting from the
transfer of VIH from Smart to PCEV. (2) Includes service revenues generated by MVNOs of PLDT Global subsidiaries and facilities service fees.
Service Revenues
Our wireless service revenues for the nine months ended September 30, 2018 decreased by Php4,568 million, or 7%, to Php62,269 million as compared with Php66,837 million in the same period in 2017, mainly as a result of lower revenues from mobile, home broadband, and digital platforms and mobile financial services, partially offset by higher revenues from MVNO and other services. As a percentage of our total wireless revenues, service revenues accounted for 92% and 95% for the nine months ended September 30, 2018 and 2017, respectively.
Mobile Services
Our mobile service revenues amounted to Php60,518 million for the nine months ended September 30, 2018, a decrease of Php3,077 million, or 5%, from Php63,595 million in the same period in 2017. Mobile service revenues accounted for 97% and 95% of our wireless service revenues for the nine months ended September 30, 2018 and 2017, respectively. In the third quarter of 2018, the revenue split allocation among voice, SMS and data for our mobile bundled plans was revised to reflect the result of a recent network study from our wireless business.
Increase (Decrease) 2018 % 2017 % Amount % (amounts in million Php)
Mobile Services: Voice 21,548 36 23,248 36 (1,700 ) (7)SMS 10,490 17 19,702 31 (9,212 ) (47)Data 27,278 45 19,565 31 7,713 39Inbound roaming and others(1) 1,202 2 1,080 2 122 11
Total 60,518 100 63,595 100 (3,077 ) (5) (1) Refers to other non-subscriber-related revenues consisting primarily of inbound international roaming fees.
Voice Services
Mobile revenues from our voice services, which include all voice traffic, decreased by Php1,700 million, or 7%, to Php21,548 million for the nine months ended September 30, 2018 from Php23,248 million in the same period in 2017, mainly on account of lower international and domestic voice revenues due to subscribers’ shift to digital lifestyle with access to alternative calling options and other over-the-top, or OTT, services, and the impact of adoption of PFRS 15, partly offset by the effect of the revised revenue split allocation. Mobile voice services accounted for 36% of our mobile service revenues in each of the nine months ended September 30, 2018 and 2017.
Domestic voice service revenues decreased by Php140 million, or 1%, to Php17,954 million for the nine months ended September 30, 2018 from Php18,094 million in the same period in 2017, due to lower domestic outbound and inbound voice service revenues.
International voice service revenues decreased by Php1,560 million, or 30%, to Php3,594 million for the nine months ended September 30, 2018 from Php5,154 million in the same period in 2017, primarily due to lower international inbound and outbound voice service revenues as a result of lower international voice traffic, partially offset by the effect of higher weighted average rate of the Philippine peso relative to the U.S. dollar.

3Q 2018 Fo rm 17 -Q Page 11 o f 27
SMS Services
Mobile revenues from our SMS services, which include all SMS-related services, decreased by Php9,212 million, or 47%, to Php10,490 million for the nine months ended September 30, 2018 from Php19,702 million in the same period in 2017 mainly due to declining SMS volumes as a result of alternative text messaging options, such as OTT services and social media, and the impact of the revised revenue split allocation and adoption of PFRS 15. Mobile SMS services accounted for 17% and 31% of our mobile service revenues for the nine months ended September 30, 2018 and 2017, respectively.
Data Services
Mobile revenues from our data services, which include mobile internet, mobile broadband and other data services, increased by Php7,713 million, or 39%, to Php27,278 million for the nine months ended September 30, 2018 from Php19,565 million in the same period in 2017 as a result of continuous network improvement, LTE migration, enhanced data offers and increased mobile internet usage, as well as the impact of the revised revenue split allocation, partially offset by lower revenues from mobile broadband and the impact of adoption of PFRS 15. Data services accounted for 45% and 31% of our mobile service revenues for the nine months ended September 30, 2018 and 2017, respectively.
The following table shows the breakdown of our mobile data service revenues for the nine months ended September 30, 2018 and 2017:
Increase (Decrease) 2018 % 2017 % Amount % (amounts in million Php)
Data Services: Mobile internet(1) 23,434 86 14,762 75 8,672 59Mobile broadband 3,569 13 4,678 24 (1,109 ) (24)Other data(2) 275 1 125 1 150 120
Total 27,278 100 19,565 100 7,713 39 (1) Includes revenues from web-based services, net of discounts and content provider costs. (2) Beginning third quarter of 2018, revenues from other data include value-added services, or VAS.
Mobile Internet
Mobile internet service revenues increased by Php8,672 million, or 59%, to Php23,434 million for the nine months ended September 30, 2018 from Php14,762 million in the same period in 2017 as a result of the increase in smartphone ownership, greater data adoption among our subscriber base with the growth in LTE subscribers, and increased usage of our existing data users, leading to the significant growth of mobile internet browsing and prevalent use of mobile apps, social networking and e-commerce sites, and other OTT services, combined with the impact of the revised revenue split allocation. Mobile internet services accounted for 39% and 23% of our mobile service revenues for the nine months ended September 30, 2018 and 2017, respectively.
Mobile Broadband
Mobile broadband revenues amounted to Php3,569 million for the nine months ended September 30, 2018, a decrease of Php1,109 million, or 24%, from Php4,678 million in the same period in 2017, primarily due to a decrease in the number of subscribers using pocket wifi as they move to using smartphones and fixed DSL/Fiber home broadband. Mobile broadband services accounted for 6% and 7% of our mobile service revenues for the nine months ended September 30, 2018 and 2017, respectively.
Other Data
Revenues from our other data services, which include VAS, domestic leased lines and share in revenue from PLDT WeRoam, increased by Php150 million, or 120%, to Php275 million for the nine months ended September 30, 2018 from Php125 million in the same period in 2017.
Inbound Roaming and Others
Mobile revenues from inbound roaming and other services increased by Php122 million, or 11%, to Php1,202 million for the nine months ended September 30, 2018 from Php1,080 million in the same period in 2017.

3Q 2018 Fo rm 17 -Q Page 12 o f 27
The following table shows the breakdown of our mobile service revenues by service type for the nine months ended September 30, 2018 and 2017:
Increase (Decrease) 2018 2017 Amount % (amounts in million Php)
Mobile service revenues 60,518 63,595 (3,077 ) (5)By service type
Prepaid 44,712 45,007 (295 ) (1)Postpaid 14,604 17,508 (2,904 ) (17)Inbound roaming and others 1,202 1,080 122 11
Prepaid Revenues
Revenues generated from our mobile prepaid services amounted to Php44,712 million for the nine months ended September 30, 2018, a decrease of Php295 million, or 1%, as compared with Php45,007 million in the same period in 2017. Mobile prepaid service revenues accounted for 74% and 71% of mobile service revenues for the nine months ended September 30, 2018 and 2017, respectively. The decrease in revenues from our mobile prepaid services was primarily driven by a lower mobile prepaid subscriber base resulting in lower voice and SMS revenues, partially offset by the sustained growth in mobile internet revenues.
Postpaid Revenues
Revenues generated from mobile postpaid service amounted to Php14,604 million for the nine months ended September 30, 2018, a decrease of Php2,904 million, or 17%, as compared with Php17,508 million in the same period in 2017, and accounted for 24% and 27% of mobile service revenues for the nine months ended September 30, 2018 and 2017, respectively. The decrease in our mobile postpaid service revenues was primarily due to a lower postpaid subscriber base and the impact of adoption of PFRS 15.
Subscriber Base, ARPU and Churn Rates
The following table shows our wireless subscriber base as at September 30, 2018 and 2017:
Increase (Decrease) 2018 2017 Amount %
Mobile subscriber base Smart(1) 20,956,739 21,909,729 (952,990 ) (4)
Prepaid 19,526,064 20,537,068 (1,011,004 ) (5)Postpaid 1,430,675 1,372,661 58,014 4
TNT 30,129,026 28,364,436 1,764,590 6Sun(1) 6,948,242 7,943,869 (995,627 ) (13)
Prepaid 5,972,878 6,749,894 (777,016 ) (12)Postpaid 975,364 1,193,975 (218,611 ) (18)
Total mobile subscribers 58,034,007 58,218,034 (184,027 ) — (1) Includes mobile broadband subscribers.
Our current policy is to recognize a prepaid subscriber as active only when the subscriber activates and uses the SIM card. Beginning the second quarter of 2017, a prepaid mobile subscriber is considered inactive if the subscriber does not reload within 90 days after the full usage or expiry of the last reload, revised from the previous 120 days.
In compliance with Memorandum Circular (MC) No. 05-12-2017 issued jointly by the NTC, Department of Information and Communications Technology, and Department of Trade and Industry, Smart, TNT, and Sun extended the validity of prepaid loads to one year. Beginning January 2018, the one-year validity was implemented particularly on prepaid loads worth Php300 and above. In July 2018, the one-year validity was fully implemented for all prepaid loads, including denominations lower than Php300, regardless of the validity period printed on the physical cards already out in the market.
The average monthly churn rates for Smart Prepaid subscribers were 7.4% and 6.8% for the nine months ended September 30, 2018 and 2017, respectively, while the average monthly churn rates for TNT subscribers were 6.3% and 7.1% for the nine months ended September 30, 2018 and 2017, respectively. The average monthly churn rates

3Q 2018 Fo rm 17 -Q Page 13 o f 27
for Sun Prepaid subscribers were 5.8% and 8.1% for the nine months ended September 30, 2018 and 2017, respectively.
The average monthly churn rates for Smart Postpaid subscribers were 2.1% and 2.4% for the nine months ended September 30, 2018 and 2017, respectively, and 3.3% and 3.6% for the nine months ended September 30, 2018 and 2017, respectively, for Sun Postpaid subscribers.
The following table summarizes our average monthly ARPUs for the nine months ended September 30, 2018 and 2017: Gross(1) Increase (Decrease) Net(2) Increase (Decrease) 2018 2017 Amount % 2018 2017 Amount % (amounts in Php) Prepaid
Smart 128 118 10 8 116 107 9 8TNT 79 80 (1) (1) 72 74 (2 ) (3)Sun 89 87 2 2 81 81 — —
Postpaid Smart 831 1,008 (177) (18) 811 975 (164 ) (17)Sun 399 419 (20) (5) 397 415 (18 ) (4)
(1) Gross monthly ARPU is calculated by dividing gross mobile service revenues for the month, including interconnection income but excluding inbound roaming revenues, gross of discounts, and content provider costs, by the average number of subscribers in the month.
(2) Net monthly ARPU is calculated by dividing gross mobile service revenues for the month, including interconnection income, but excluding inbound roaming revenues, net of discounts and content provider costs, by the average number of subscribers in the month.
Home Broadband
Revenues from our Home Broadband services decreased by Php1,806 million, or 94%, to Php124 million for the nine months ended September 30, 2018 from Php1,930 million in the same period in 2017, mainly due to the transfer of Ultera and WiMAX businesses to PLDT.
Digital Platforms and Mobile Financial Services
Revenues from digital platforms and mobile financial services, as reported by Voyager, decreased by Php667 million, or 69%, to Php301 million for the nine months ended September 30, 2018 from Php968 million in the same period in 2017, mainly due to the transfer of VIH to PCEV.
MVNO and Others
Revenues from our MVNO and other services increased by Php982 million to Php1,326 million for the nine months ended September 30, 2018 from Php344 million in the same period in 2017, primarily due to facility service fees relating to Ultera, WiMAX and Shops.Work Unplugged, or SWUP, in 2018, partially offset by lower revenue contribution from MVNOs of PLDT Global.
Non-Service Revenues
Our wireless non-service revenues consist of sale of mobile handsets, mobile broadband data modems, tablets and accessories. Our wireless non-service revenues increased by Php1,972 million, or 57%, to Php5,406 million for the nine months ended September 30, 2018 from Php3,434 million in the same period in 2017, primarily due to the impact of adoption of PFRS 15.
Expenses
Expenses associated with our wireless business amounted to Php58,558 million for the nine months ended September 30, 2018, a decrease of Php2,814 million, or 5%, from Php61,372 million in the same period in 2017. A significant portion of the decrease was mainly attributable to lower selling, general and administrative expenses, interconnection costs, provisions, and noncurrent asset impairment in 2017, partially offset by higher cost of sales and services. As a percentage of our total wireless revenues, expenses associated with our wireless business accounted for 87% in each of the nine months ended September 30, 2018 and 2017.

3Q 2018 Fo rm 17 -Q Page 14 o f 27
The following table summarizes the breakdown of our total wireless-related expenses for the nine months ended September 30, 2018 and 2017 and the percentage of each expense item in relation to the total:
Increase (Decrease) 2018 % 2017 % Amount % (amounts in million Php)
Selling, general and administrative expenses 29,341 50 32,082 52 (2,741 ) (9)Depreciation and amortization 15,710 27 15,713 26 (3 ) —
Cost of sales and services 7,568 13 6,148 10 1,420 23Interconnection costs 4,017 7 4,835 8 (818 ) (17)Provisions 1,922 3 2,205 3 (283 ) (13)Noncurrent asset impairment — — 389 1 (389 ) (100)
Total 58,558 100 61,372 100 (2,814 ) (5)
Selling, general and administrative expenses decreased by Php2,741 million, or 9%, to Php29,341 million, primarily due to lower expenses related to rent, professional and other contracted services, selling and promotions, taxes and licenses, and compensation and employee benefits, partly offset by higher repairs and maintenance expenses.
Depreciation and amortization charges of Php15,710 million, which include depreciation due to shortened life of certain data network platform and other technology equipment of Php4,511 million resulting from the transformation projects to improve and simplify the network and systems applications, decreased by Php3 million.
Cost of sales and services increased by Php1,420 million, or 23%, to Php7,568 million, primarily due to higher issuances of mobile handsets and cost of SIM packs.
Interconnection costs decreased by Php818 million, or 17%, to Php4,017 million, primarily due to lower interconnection cost on domestic and international voice and SMS services, as well as lower interconnection charges on international data roaming.
Provisions decreased by Php283 million, or 13%, to Php1,922 million, primarily due to lower provision for doubtful accounts and provision for inventory obsolescence.
Other Income (Expenses)
The following table summarizes the breakdown of our total wireless-related other income (expenses) for the nine months ended September 30, 2018 and 2017:
Change 2018 2017 Amount % (amounts in million Php)
Other Income (Expenses): Financing costs – net (1,346) (1,819) 473 26Foreign exchange losses – net (496) (468) (28 ) (6)Equity share in net earnings (losses) of associates and joint ventures 62 (102) 164 161Interest income 436 237 199 84Gain on derivative financial instruments – net 489 326 163 50Other income – net 269 576 (307 ) (53)
Total (586) (1,250) 664 53
Our wireless business’ other expenses amounted to Php586 million for the nine months ended September 30, 2018, a decrease of Php664 million, or 53%, from Php1,250 million in the same period in 2017, primarily due to the combined effects of the following: (i) lower net financing costs by Php473 million mainly due to higher capitalized interest, lower financing charges and lower weighted average loan principal amount; (ii) higher interest income by Php199 million; (iii) equity share in net earnings of associates of Php62 million in the first nine months of 2018 as against equity share in net losses of Php102 million in the same period in 2017; (iv) higher net gains on derivative financial instruments by Php163 million; (v) higher net foreign exchange losses – net by Php28 million; and (vi) lower other income – net by Php307 million mainly due to lower income from consultancy and other miscellaneous income, partly offset by lower impairment on Smart’s investment in AFPI.

3Q 2018 Fo rm 17 -Q Page 15 o f 27
Provision for Income Tax
Provision for income tax amounted to Php2,221 million for the nine months ended September 30, 2018, a decrease of Php530 million, or 19%, from Php2,751 million in the same period in 2017.
Net Income
As a result of the foregoing, our wireless business’ net income increased by Php1,412 million, or 29%, to Php6,310 million for the nine months ended September 30, 2018 from Php4,898 million in the same period in 2017.
EBITDA
Our wireless business’ EBITDA decreased by Php190 million, or 1%, to Php25,433 million for the nine months ended September 30, 2018 from Php25,623 million in the same period in 2017. EBITDA margin increased to 41% for the nine months ended September 30, 2018 from 38% in the same period in 2017.
Core Income
Our wireless business’ core income increased by Php3,757 million, or 65%, to Php9,514 million for the nine months ended September 30, 2018 from Php5,757 million in the same period in 2017 on account of lower depreciation expense and net financing costs, partially offset by higher provision for income tax, and lower EBITDA and other miscellaneous income.
Fixed Line
Revenues
Revenues generated from our fixed line business amounted to Php63,336 million for the nine months ended September 30, 2018, an increase of Php5,261 million, or 9%, from Php58,075 million in the same period in 2017.
The following table summarizes our total revenues by service from our fixed line business for the nine months ended September 30, 2018 and 2017:
Increase (Decrease) 2018 % 2017 % Amount % (amounts in million Php)
Service Revenues: Voice 18,818 30 21,468 37 (2,650 ) (12)Data 40,440 64 32,570 56 7,870 24Miscellaneous 1,233 2 1,428 2 (195 ) (14)
60,491 96 55,466 95 5,025 9Non-Service Revenues: Sale of computers, phone units and point-product sales 2,845 4 2,609 5 236 9Total Fixed Line Revenues 63,336 100 58,075 100 5,261 9
Service Revenues
Our fixed line service revenues increased by Php5,025 million, or 9%, to Php60,491 million for the nine months ended September 30, 2018 from Php55,466 million in the same period in 2017, due to higher revenues from our data services, partially offset by lower voice and miscellaneous service revenues. In the second quarter of 2018, the revenue split allocation between voice and data for our fixed line bundled plans was revised to reflect the result of a recent network usage study from our fixed line business.
Voice Services
Revenues from our voice services decreased by Php2,650 million, or 12%, to Php18,818 million for the nine months ended September 30, 2018 from Php21,468 million in the same period in 2017, primarily due to lower revenues from local exchange, international and domestic services. The decline was partly due to the continued popularity of services such as Skype, Viber, Line, Facebook Messenger, Google Talk and WhatsApp, offering free OTT calling services, and other similar services, as well as the impact of the revised revenue split allocation. The percentage contribution of voice service revenues to our fixed line service revenues accounted for 31% and 39% for the nine months ended September 30, 2018 and 2017, respectively.

3Q 2018 Fo rm 17 -Q Page 16 o f 27
Data Services
The following table shows information of our data service revenues for the nine months ended September 30, 2018 and 2017:
Increase 2018 2017 Amount % (amounts in million Php)
Data service revenues 40,440 32,570 7,870 24Home broadband 19,934 13,158 6,776 51Corporate data and ICT 20,506 19,412 1,094 6
Our data services posted revenues of Php40,440 million for the nine months ended September 30, 2018, an increase of Php7,870 million, or 24%, from Php32,570 million in the same period in 2017, primarily due to higher home broadband revenues from DSL and Fibr, higher corporate data and leased lines, and higher data center and ICT revenues. The percentage contribution of this service segment to our fixed line service revenues accounted for 67% and 59% for the nine months ended September 30, 2018 and 2017, respectively.
Home Broadband
Home broadband data revenues amounted to Php19,934 million for the nine months ended September 30, 2018, an increase of Php6,776 million, or 51%, from Php13,158 million in the same period in 2017. This growth is driven by increasing demand for broadband services which the company is providing through its existing copper network and a nationwide roll-out of its fiber-to-the-home, or FTTH, network, as well as the impact of the revised revenue split allocation. Home broadband revenues accounted for 49% and 40% of total data service revenues in the nine months ended September 30, 2018 and 2017, respectively. In the first nine months of 2018, PLDT’s FTTH nationwide network rollout has passed 5.75 million homes.
Corporate Data and ICT
Corporate data services amounted to Php17,505 million for the nine months ended September 30, 2018, an increase of Php599 million, or 4%, as compared with Php16,906 million in the same period in 2017. Corporate data revenues accounted for 43% and 52% of total data services in the nine months ended September 30, 2018 and 2017, respectively.
ICT revenues increased by Php495 million, or 20%, to Php3,001 million for the nine months ended September 30, 2018 from Php2,506 million in the same period in 2017 mainly due to higher revenues from colocation and managed IT services. The percentage contribution of this service segment to our total data service revenues accounted for 8% in each of the first nine months of 2018 and 2017.
Miscellaneous Services
Miscellaneous service revenues are derived mostly from rentals and management fees. These service revenues decreased by Php195 million, or 14%, to Php1,233 million for the nine months ended September 30, 2018 from Php1,428 million in the same period in 2017 mainly due to lower management fees. The percentage contribution of miscellaneous service revenues to our total fixed line service revenues accounted for 2% in each of the first nine months of 2018 and 2017.
Non-service Revenues
Non-service revenues increased by Php236 million, or 9%, to Php2,845 million for the nine months ended September 30, 2018 from Php2,609 million in the same period in 2017, primarily due to higher sale of computer bundles, Telpad units and Ultera devices, partially offset by lower sale of hardware and software, FabTab for myDSL retention, and TVolution units.
Expenses
Expenses related to our fixed line business totaled Php50,720 million for the nine months ended September 30, 2018, an increase of Php5,170 million, or 11%, as compared with Php45,550 million in the same period in 2017. The increase was primarily due to higher selling, general and administrative expenses, depreciation and amortization, and provisions. As a percentage of our total fixed line revenues, expenses associated with our fixed line business accounted for 80% and 78% for the nine months ended September 30, 2018 and 2017, respectively.

3Q 2018 Fo rm 17 -Q Page 17 o f 27
The following table shows the breakdown of our total fixed line-related expenses for the nine months ended September 30, 2018 and 2017 and the percentage of each expense item in relation to the total:
Increase (Decrease) 2018 % 2017 % Amount % (amounts in million Php)
Selling, general and administrative expenses 29,542 58 27,348 60 2,194 8Depreciation and amortization 11,704 23 9,834 21 1,870 19Cost of sales and services 3,620 7 3,561 8 59 2Interconnection costs 3,612 7 3,596 8 16 —
Provisions 2,242 5 1,211 3 1,031 85Total 50,720 100 45,550 100 5,170 11
Selling, general and administrative expenses increased by Php2,194 million, or 8%, to Php29,542 million primarily due to higher professional and other contracted services, rent, and repairs and maintenance expenses, partly offset by lower compensation and employee benefits, mainly as a result of lower MRP costs.
Depreciation and amortization charges increased by Php1,870 million, or 19%, to Php11,704 million mainly due to a higher depreciable asset base.
Cost of sales and services increased by Php59 million, or 2%, to Php3,620 million, primarily due to higher cost of services, partly offset by lower cost of hardware and software, Fabtab for myDSL retention, and TVolution units.
Interconnection costs increased by Php16 million to Php3,612 million, primarily due to higher international interconnection costs, as a result of an increase in international inbound calls that terminated to other domestic carriers, partly offset by lower data interconnection costs.
Provisions increased by Php1,031 million, or 85%, to Php2,242 million, primarily due to higher provision for doubtful accounts mainly due to lower collection efficiency, and higher provision for inventory obsolescence.
Other Income (Expenses)
The following table summarizes the breakdown of our total fixed line-related other income (expenses) for the nine months ended September 30, 2018 and 2017:
Change 2018 2017 Amount % (amounts in million Php)
Other Income (Expenses): Financing costs – net (3,941) (3,846) (95 ) (2)Foreign exchange losses (36) (76) 40 53Equity share in net earnings of associates 152 145 7 5Gains on derivative financial instruments – net 282 324 (42 ) (13)Interest income 649 535 114 21Other income – net 1,934 1,738 196 11
Total (960) (1,180) 220 19
Our fixed line business’ other expenses amounted to Php960 million for the nine months ended September 30, 2018, a decrease of Php220 million, or 19%, from Php1,180 million in the same period in 2017, mainly due to the combined effects of the following: (i) higher other income – net by Php196 million; (ii) higher interest income by Php114 million; (iii) lower foreign exchange losses by Php40 million; (iv) higher equity share in net earnings of associates by Php7 million; (v) lower net gains on derivative financial instruments by Php42 million; and (vi) higher net financing costs by Php95 million.
Provision for Income Tax
Provision for income tax amounted to Php2,483 million for the nine months ended September 30, 2018, a decrease of Php616 million, or 20%, from Php3,099 million in the same period in 2017.

3Q 2018 Fo rm 17 -Q Page 18 o f 27
Net Income
As a result of the foregoing, our fixed line business registered a net income of Php9,173 million for the nine months ended September 30, 2018, an increase of Php927 million, or 11%, as compared with Php8,246 million in the same period in 2017.
EBITDA
Our fixed line business’ EBITDA increased by Php1,961 million, or 9%, to Php24,320 million for the nine months ended September 30, 2018 from Php22,359 million in the same period in 2017. EBITDA margin remained stable at 40% in the first nine months in 2018 and 2017.
Core Income
Our fixed line business’ core income increased by Php1,172 million, or 15%, to Php8,982 million for the nine months ended September 30, 2018 from Php7,810 million in the same period in 2017, primarily as a result of higher EBITDA and lower provision for income tax, partially offset by higher depreciation expense.
Others
Revenues
Revenues generated from our other business amounted to Php610 million for the nine months ended September 30, 2018, an increase of Php602 million from Php8 million in the same period in 2017, primarily due to the transfer of VIH from Smart to PCEV in April 2018.
Expenses
Expenses related to our other business totaled Php1,957 million for the nine months ended September 30, 2018, an increase of Php1,914 million from Php43 million in the same period in 2017, due to higher selling, general and administrative expenses, as well as depreciation expenses, resulting from the transfer of VIH to PCEV.
Other Income (Expenses)
The following table summarizes the breakdown of other income (expenses) for other business segment for the nine months ended September 30, 2018 and 2017:
Change 2018 2017 Amount % (amounts in million Php)
Other Income (Expenses): Interest income 419 436 (17 ) (4)Gain on derivative financial instruments – net 282 — 282 100Equity share in net earnings (losses) of associates and joint ventures (15) 2,691 (2,706 ) (101)Financing costs – net (113) (148) 35 24Foreign exchange losses – net (359) (243) (116 ) (48)Other income – net 2,577 6,422 (3,845 ) (60)Total 2,791 9,158 (6,367 ) (70)
Our other business’ other income decreased by Php6,367 million, or 70%, to Php2,791 million for the nine months ended September 30, 2018 from Php9,158 million in the same period in 2017, primarily due to the combined effects of the following: (i) lower other income – net by Php3,845 million mainly due to gain on sale of Beacon shares in 2017, partly offset by gain in fair value of Rocket Internet investment in 2018; (ii) equity share in net losses of associates and joint ventures of Php15 million in the first nine months of 2018 as against equity share in net earnings of associates and joint ventures of Php2,691 million in the same period in 2017 mainly due to sale of Beacon shares and SPi Global in 2017; (iii) higher net foreign exchange losses by Php116 million; (iv) lower interest income by Php17 million; and (v) net gains on derivative financial instruments of Php282 million in the first nine months of 2018 as against nil in the same period in 2017.

3Q 2018 Fo rm 17 -Q Page 19 o f 27
Net Income
As a result of the foregoing, our other business segment registered a net income of Php1,225 million for the nine months ended September 30, 2018, a decrease of Php7,812 million, or 86%, from Php9,037 million in the same period in 2017.
Core Income
Our other business segment’s core income amounted to Php781 million for the nine months ended September 30, 2018, a decrease of Php9,080 million, or 92%, as compared with Php9,861 million in the same period in 2017, primaly due to lower other income and equity share in net losses of associates and joint ventures in 2018, as well as lower EBITDA, mainly from VIH.
Liquidity and Capital Resources
The following table shows our consolidated cash flows for the nine months ended September 30, 2018 and 2017, as well as our consolidated capitalization and other consolidated selected financial data as at September 30, 2018 and December 31, 2017:
Nine Months ended September 30, 2018 2017 (amounts in million Php)
Cash Flows Net cash flows provided by operating activities 42,622 27,355Net cash flows used in investing activities (17,988 ) (4,843)
Payment for purchase of property and equipment, including capitalized interest 40,484 10,993Net cash flows used in financing activities (14,038 ) (36,247)Net increase (decrease) in cash and cash equivalents 12,301 (13,354)
September 30, December 31, 2018 2017 (amounts in million Php)
Capitalization Long-term portion of interest-bearing financial liabilities – net of current portion:
Long-term debt 164,965 157,654
Current portion of interest-bearing financial liabilities: Long-term debt maturing within one year 14,258 14,957
Total interest-bearing financial liabilities 179,223 172,611Total equity attributable to equity holders of PLDT 109,478 106,842
288,701 279,453 Other Selected Financial Data
Total assets 470,841 459,444Property and equipment 194,748 186,907Cash and cash equivalents 45,206 32,905Short-term investments 4,846 1,074
Our consolidated cash and cash equivalents and short-term investments totaled Php50,052 million as at September 30, 2018. Principal sources of consolidated cash and cash equivalents for the nine months ended September 30, 2018 were cash flows from operating activities amounting to Php42,622 million, proceeds from availment of long-term debt of Php20,500 million, proceeds from disposal of Rocket Internet shares of Php11,400 million, proceeds from sale of Metro Pacific Investments Corporation, or MPIC, receivables of Php6,976 million, collection of receivables from MPIC of Php4,731 million, proceeds from disposal of Hastings PDRs to PLDT Beneficial Trust Fund, or BTF, of Php1,664 million and interest received of Php904 million. These funds were used principally for: (1) payment for purchase of property and equipment, including capitalized interest, of Php40,484 million; (2) debt principal and interest payments of Php16,458 million and Php4,802 million, respectively; (3) cash dividend payments of Php13,798 million; and (4) net payment for purchase of short-term investments of Php3,450 million.

3Q 2018 Fo rm 17 -Q Page 20 o f 27
Our consolidated cash and cash equivalents and short-term investments totaled Php34,037 million as at September 30, 2017. Principal sources of consolidated cash and cash equivalents in the first nine months of 2017 were cash flows from operating activities amounting to Php27,355 million, proceeds from availment of long-term debt of Php25,255 million, proceeds from disposal of remaining Beacon shares of Php12,000 million, proceeds from issuance of perpetual notes of Php4,200 million, collection of receivable from MPIC of Php2,001 million, proceeds from disposal of investments available-for-sale of Php1,000 million, interest received of Php953 million, dividends received of Php833 million, proceeds from disposal of property and equipment of Php445 million, and proceeds from disposal of investment properties of Php319 million. These funds were used principally for: (1) debt principal and interest payments of Php36,500 million and Php5,402 million, respectively; (2) cash dividend payments of Php16,464 million; (3) capital expenditures, including capitalized interest, of Php10,993 million; (4) net reduction in capital expenditures under long-term financing of Php7,246 million; (5) net payment for purchase of short-term investments of Php5,762 million; and (6) payment for purchase of investment in associates and joint ventures, mainly payment to VTI and Bow Arken of Php5,494 million and Php100 million additional funding to AFPI.
Operating Activities
Our consolidated net cash flows provided by operating activities increased by Php15,267 million, or 56%, to Php42,622 million for the nine months ended September 30, 2018 from Php27,355 million in the same period in 2017, primarily due to lower level of settlement of accounts payable and other liabilities, higher operating income, lower corporate taxes paid and lower pension contribution, partially offset by lower collection of receivables and higher inventories.
Cash flows provided by operating activities of our wireless business increased by Php15,492 million, or 114%, to Php29,131 million for the nine months ended September 30, 2018 from Php13,639 million in the same period in 2017, primarily due to lower level of settlement of accounts payable and other liabilities and lower corporate taxes paid, partially offset by lower operating income. Cash flows provided by operating activities of our fixed line business increased by Php2,677 million, or 19%, to Php16,420 million for the nine months ended September 30, 2018 from Php13,743 million in the same period in 2017, primarily due to lower level of settlement of accounts payable and other liabilities, higher operating income and lower pension contribution, partly offset by lower collection of receivables, higher inventories and higher corporate taxes paid. Cash flows used in operating activities of our other business increased by Php1,777 million to Php2,598 million for the nine months ended September 30, 2018 from Php821 million in the same period in 2017 mainly due to lower collection of receivables and higher operating loss, partly offset by lower level of settlement of accounts payable.
Investing Activities
Consolidated net cash flows used in investing activities amounted to Php17,988 million for the nine months ended September 30, 2018, an increase of Php13,145 million from Php4,843 million in the same period in 2017, primarily due to the combined effects of the following: (1) higher payment for purchase of property and equipment, including capitalized interest, by Php29,491 million; (2) lower proceeds from disposal of investment in associates and joint ventures by Php11,954 million mainly due to proceeds from disposal of the remaining Beacon shares in 2017; (3) proceeds from redemption of Beacon’s Class B Preferred Shares of Php1,000 million in 2017; (4) dividends received of Php833 million in 2017; (5) proceeds from disposal of Hastings PDRs to PLDT BTF of Php1,664 million; (6) lower net payment for purchase of short-term investments by Php2,312 million; (7) higher collection of receivables from MPIC by Php2,730 million; (8) lower payment for purchase of investments in associates and joint ventures by Php5,483 million; (9) proceeds from sale of MPIC receivables of Php6,976 million; and (10) proceeds from sale of Rocket Internet shares of Php11,400 million in 2018.
Our consolidated payment for purchase of property and equipment, including capitalized interest, for the nine months ended September 30, 2018 totaled Php40,484 million, an increase of Php29,491 million as compared with Php10,993 million in the same period in 2017. Smart Group’s capital spending increased by Php21,989 million to Php28,004 million for the nine months ended September 30, 2018 from Php6,015 million in the same period in 2017. Smart Group’s capex spending was primarily focused on expansion of LTE (4G) coverage and capacity. PLDT’s capital spending increased by Php6,914 million to Php11,282 million for the nine months ended September 30, 2018 from Php4,368 million in the same period in 2017. PLDT’s capex spending was used to finance the modernization program and the continuous facility roll-out and expansion of our domestic fiber optic network, as well as expansion of our data center business. The balance represents other subsidiaries’ capital spending.
As part of our growth strategy, we may from time to time, continue to make acquisitions and investments in companies or businesses.

3Q 2018 Fo rm 17 -Q Page 21 o f 27
Financing Activities
On a consolidated basis, cash flows used in financing activities amounted to Php14,038 million for the nine months ended September 30, 2018, a decrease of Php22,209 million, or 61%, from Php36,247 million in the same period in 2017, resulting largely from the combined effects of the following: (1) lower payments of long-term debt and interest by Php20,042 million and Php600 million, respectively; (2) net settlement of capital expenditures under long-term financing of Php7,246 million in 2017; (3) lower cash dividend payments by Php2,666 million; (4) proceeds from issuance of perpetual notes of Php4,200 million in 2017; and (5) lower proceeds from availment of long-term debt by Php4,755 million.
Debt Financing
Proceeds from availment of long-term debt for the nine months ended September 30, 2018 amounted to Php20,500 million, mainly from PLDT’s and Smart’s drawings related to the financing of capital expenditure requirements and refinancing of maturing loan obligations. Payments of principal and interest on our total debt amounted to Php16,458 million and Php4,802 million, respectively, for the nine months ended September 30, 2018.
Our consolidated long-term debt increased by Php6,612 million, or 4%, to Php179,223 million as at September 30, 2018 from Php172,611 million as at December 31, 2017, primarily due to drawings from our long-term facilities and the depreciation of the Philippine peso relative to the U.S. dollar, partly offset by debt amortizations. As at September 30, 2018, the long-term debt level of Smart increased by 9% to Php68,289 million from Php62,388 as at December 31, 2017, and PLDT’s long-term debt level increased by 1% to Php110,934 million from Php110,223 million as at December 31, 2017.
See Note 20 – Interest-bearing Financial Liabilities – Long-term Debt to the accompanying unaudited consolidated financial statements for a more detailed discussion of our long-term debt.
Debt Covenants
Our consolidated debt instruments contain restrictive covenants, including covenants that require us to comply with specified financial ratios and other financial tests, calculated in conformity with PFRS, at relevant measurement dates, principally at the end of each quarterly period. We have complied with all of our maintenance financial ratios as required under our loan covenants and other debt instruments.
As at September 30, 2018 and 2017, we are in compliance with all of our debt covenants.
See Note 20 – Interest-bearing Financial Liabilities – Compliance with Debt Covenants to the accompanying unaudited consolidated financial statements for a more detailed discussion of our debt covenants.
Financing Requirements
We believe that our available cash, including cash flow from operations, will provide sufficient liquidity to fund our projected operating, investment, capital expenditures and debt service requirements for the next 12 months; however, we may finance a portion of these costs from external sources if we consider it prudent to do so.

3Q 2018 Fo rm 17 -Q Page 22 o f 27
The following table shows the dividends declared to shareholders from the earnings for the nine months ended September 30, 2018 and 2017:
Date Amount Earnings Approved(1) Record Payable Per share Total
(in million Php, except per
share amount) 2018
Common Regular Dividend March 27, 2018 April 13, 2018 April 27, 2018 28 6,050 August 9, 2018 August 28, 2018 September 11, 2018 36 7,778
Preferred
Series IV Cumulative Non-convertible Redeemable Preferred Stock(1) January 22, 2018 February 21, 2018 March 15, 2018 — 12 May 10, 2018 May 25, 2018 June 15, 2018 — 12 August 9, 2018 August 28, 2018 September 15, 2018 — 13 November 8, 2018 November 23, 2018 December 15, 2018 — 12
Voting Preferred Stock March 8, 2018 March 28, 2018 April 15, 2018 — 3 June 13, 2018 June 29, 2018 July 15, 2018 — 2 September 25, 2018 October 9, 2018 October 15, 2018 — 2
Charged to Retained Earnings 13,884 2017
Common Regular Dividend March 7, 2017 March 21, 2017 April 6, 2017 28 6,050
August 10, 2017 August 25, 2017 September 8, 2017 48 10,371Preferred
Series IV Cumulative Non-convertible Redeemable Preferred Stock(1) February 7, 2017 February 24, 2017 March 15, 2017 — 12 May 12, 2017 May 26, 2017 June 15, 2017 — 12 August 10, 2017 August 25, 2017 September 15, 2017 — 13 November 9, 2017 November 23, 2017 December 15, 2017 — 12
Voting Preferred Stock March 7, 2017 March 30, 2017 April 15, 2017 — 3 June 13, 2017 June 27, 2017 July 15, 2017 — 2 September 26, 2017 October 10, 2017 Octoberber 15, 2017 — 2Charged to Retained Earnings 16,477 (1) Dividends were declared based on total amount paid up.
See Note 19 – Equity to the accompanying unaudited consolidated financial statements for further details.
Changes in Financial Conditions
Our total assets amounted to Php470,841 million as at September 30, 2018, an increase of Php11,397 million, or 2%, from Php459,444 million as at December 31, 2017, primarily due to higher cash and cash equivalents and short-term investments, property and equipment, and trade and other receivables, partially offset by lower financial assets at fair vale through profit and loss, mainly due to sale of Rocket Internet shares, and lower financial assets at fair value through other comprehensive income, mainly on account of sale of MPIC receivables. Starting 2018, available-for-sale financial investments are presented as financial assets at fair value through profit or loss according to PFRS 9.
Our total liabilities amounted to Php357,065 million as at September 30, 2018, an increase of Php8,804 million, or 3%, from Php348,261 million as at December 31, 2017 significantly due to higher interest-bearing financial liabilities, combined with higher accounts payable, and accrued expenses and other liabilities.
Off-Balance Sheet Arrangements
There are no off-balance sheet arrangements that have or are reasonably likely to have any current or future effect on our financial position, results of operations, cash flows, changes in stockholders’ equity, liquidity, capital expenditures or capital resources that are material to investors.

3Q 2018 Fo rm 17 -Q Page 23 o f 27
Equity Financing
On August 2, 2016, the PLDT Board of Directors approved the amendment of our dividend policy, reducing our dividend payout rate to 60% of our core earnings per share as regular dividends. This was in view of the elevated capital expenditures to support the build-out of a resilient and reliable data network, lower EBITDA primarily due to higher subsidies to grow the data business and defend market share, and the resources required to support the acquisition of SMC’s telecommunications business. In declaring dividends, we take into consideration the interest of our shareholders, as well as our working capital, capital expenditures and debt servicing requirements. The retention of earnings may be necessary to meet the funding requirements of our business expansion and development programs. However, in the event that no investment opportunities arise, we may consider the option of returning additional cash to our shareholders in the form of special dividends of up to the balance of our core earnings or to undertake share buybacks. We were able to pay out approximately 100% of our core earnings for seven consecutive years from 2007 to 2013, approximately 90% of our core earnings for 2014, 75% of our core earnings for 2015 and 60% of our core earnings for 2016 and 2017. The accumulated equity in the net earnings of our subsidiaries, which form part of our retained earnings, are not available for distribution unless realized in the form of dividends from such subsidiaries. Dividends are generally paid in Philippine pesos. In the case of shareholders residing outside the Philippines, PLDT’s transfer agent in Manila, Philippines, as the dividend-disbursing agent, converts the Philippine peso dividends into U.S. dollars at the prevailing exchange rate and remits the dollar dividends abroad, net of any applicable withholding tax.
Our subsidiaries pay dividends subject to the requirements of applicable laws and regulations and availability of unrestricted retained earnings, without any restriction imposed by the terms of contractual agreements. Notwithstanding the foregoing, the subsidiaries of PLDT may, at any time, declare and pay such dividends depending upon the results of operations and future projects and plans, the respective subsidiary’s earnings, cash flow, financial condition, capital investment requirements and other factors.
Consolidated cash dividend payments for the nine months ended September 30, 2018 amounted to Php13,798 million as compared with Php16,464 million paid to shareholders in the same period in 2017.
Contractual Obligations and Commercial Commitments
Contractual Obligations
For a detailed discussion of our consolidated contractual undiscounted obligations as at September 30, 2018 and 2017, see Note 27 – Financial Assets and Liabilities to the accompanying unaudited consolidated financial statements.
Commercial Commitments
Our outstanding consolidated commercial commitments, in the form of letters of credit, amounted to nil and Php88 million as at September 30, 2018 and December 31, 2017, respectively. These commitments will expire within one year.
Quantitative and Qualitative Disclosures about Market Risks
Our operations are exposed to various risks, including liquidity risk, foreign currency exchange risk, interest rate risk, credit risk and capital management risk. The importance of managing these risks has significantly increased in light of considerable change and continuing volatility in both the Philippine and international financial markets. With a view to managing these risks, we have incorporated financial risk management functions in our organization, particularly in our treasury operations, equity issuances and sale of certain assets.
For further discussions of these risks, see Note 27 – Financial Assets and Liabilities to the accompanying unaudited consolidated financial statements.

3Q 2018 Fo rm 17 -Q Page 24 o f 27
The following table sets forth the estimated consolidated fair values of our financial assets and liabilities recognized as at September 30, 2018 and June 30, 2018 other than those whose carrying amounts are reasonable approximations of fair values:
Fair Values September 30, June 30, 2018 2018 (amounts in million Php)
Noncurrent Financial Assets Debt instruments at amortized cost – net of current portion 146 150Financial assets at fair value through other comprehensive income – net of current portion 2,771 2,806Other financial assets – net of current portion 2,009 2,257Total noncurrent financial assets 4,926 5,213Noncurrent Financial Liabilities Interest-bearing financial liabilities 146,719 160,046Customers’ deposits 1,527 1,597Deferred credits and other noncurrent liabilities 1,261 5,056Total noncurrent financial liabilities 149,507 166,699
The following table sets forth the amount of gains (losses) recognized for the financial assets and liabilities for the nine months ended September 30, 2018 and the six months ended June 30, 2018: September 30, June 30, 2018 2018 (amounts in million Php) Profit and Loss
Interest income 1,396 916Gains on derivative financial instruments – net 1,053 1,011Accretion on financial liabilities (108 ) (73)Interest on loans and other related items (6,169 ) (4,013)
Other Comprehensive Income Net fair value losses on cash flow hedges – net of tax (146 ) (136)Net gains (losses) on available-for-sale financial investments – net of tax 10 (4,327)
Impact of Inflation and Changing Prices
Inflation can be a significant factor in the Philippine economy, and we are continually seeking ways to minimize its impact. The average inflation rate in the Philippines for the nine months ended September 30, 2018 and 2017 were 5.0% and 2.8%, respectively. We expect inflation to be high given the outlook of the government of 4.8% to 5.2%.
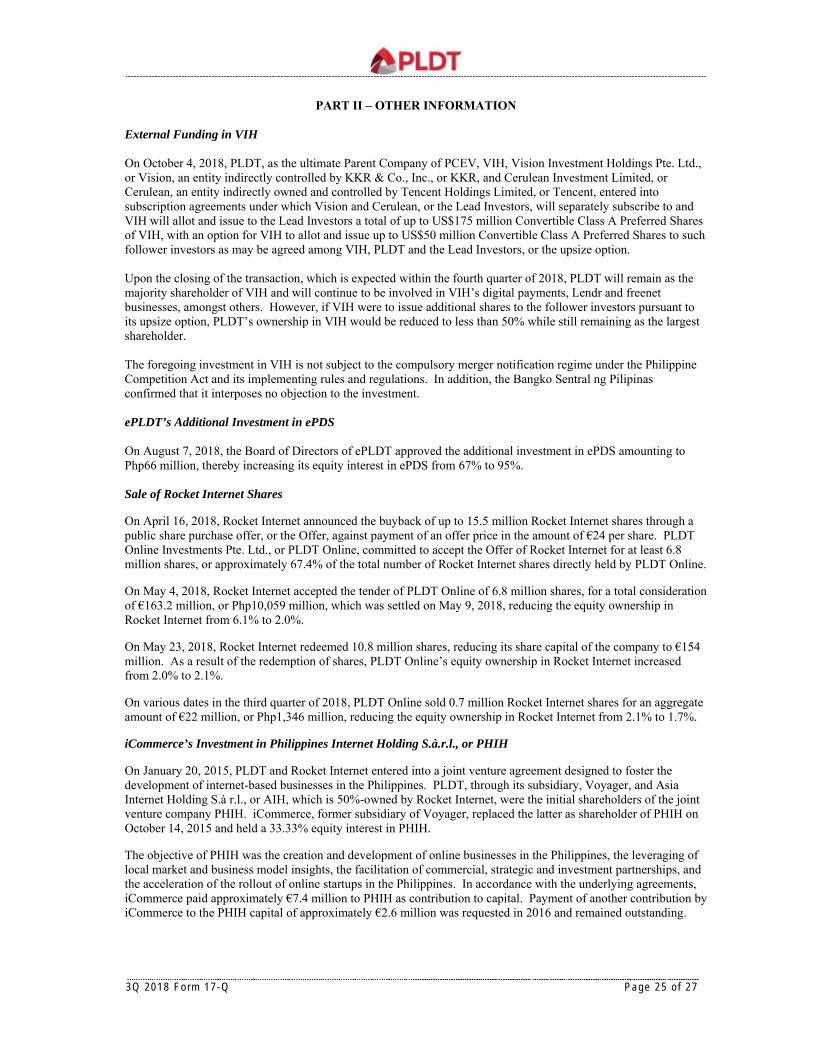
3Q 2018 Fo rm 17 -Q Page 25 o f 27
PART II – OTHER INFORMATION External Funding in VIH On October 4, 2018, PLDT, as the ultimate Parent Company of PCEV, VIH, Vision Investment Holdings Pte. Ltd., or Vision, an entity indirectly controlled by KKR & Co., Inc., or KKR, and Cerulean Investment Limited, or Cerulean, an entity indirectly owned and controlled by Tencent Holdings Limited, or Tencent, entered into subscription agreements under which Vision and Cerulean, or the Lead Investors, will separately subscribe to and VIH will allot and issue to the Lead Investors a total of up to US$175 million Convertible Class A Preferred Shares of VIH, with an option for VIH to allot and issue up to US$50 million Convertible Class A Preferred Shares to such follower investors as may be agreed among VIH, PLDT and the Lead Investors, or the upsize option. Upon the closing of the transaction, which is expected within the fourth quarter of 2018, PLDT will remain as the majority shareholder of VIH and will continue to be involved in VIH’s digital payments, Lendr and freenet businesses, amongst others. However, if VIH were to issue additional shares to the follower investors pursuant to its upsize option, PLDT’s ownership in VIH would be reduced to less than 50% while still remaining as the largest shareholder. The foregoing investment in VIH is not subject to the compulsory merger notification regime under the Philippine Competition Act and its implementing rules and regulations. In addition, the Bangko Sentral ng Pilipinas confirmed that it interposes no objection to the investment. ePLDT’s Additional Investment in ePDS On August 7, 2018, the Board of Directors of ePLDT approved the additional investment in ePDS amounting to Php66 million, thereby increasing its equity interest in ePDS from 67% to 95%. Sale of Rocket Internet Shares
On April 16, 2018, Rocket Internet announced the buyback of up to 15.5 million Rocket Internet shares through a public share purchase offer, or the Offer, against payment of an offer price in the amount of €24 per share. PLDT Online Investments Pte. Ltd., or PLDT Online, committed to accept the Offer of Rocket Internet for at least 6.8 million shares, or approximately 67.4% of the total number of Rocket Internet shares directly held by PLDT Online.
On May 4, 2018, Rocket Internet accepted the tender of PLDT Online of 6.8 million shares, for a total consideration of €163.2 million, or Php10,059 million, which was settled on May 9, 2018, reducing the equity ownership in Rocket Internet from 6.1% to 2.0%.
On May 23, 2018, Rocket Internet redeemed 10.8 million shares, reducing its share capital of the company to €154 million. As a result of the redemption of shares, PLDT Online’s equity ownership in Rocket Internet increased from 2.0% to 2.1%.
On various dates in the third quarter of 2018, PLDT Online sold 0.7 million Rocket Internet shares for an aggregate amount of €22 million, or Php1,346 million, reducing the equity ownership in Rocket Internet from 2.1% to 1.7%.
iCommerce’s Investment in Philippines Internet Holding S.à.r.l., or PHIH
On January 20, 2015, PLDT and Rocket Internet entered into a joint venture agreement designed to foster the development of internet-based businesses in the Philippines. PLDT, through its subsidiary, Voyager, and Asia Internet Holding S.à r.l., or AIH, which is 50%-owned by Rocket Internet, were the initial shareholders of the joint venture company PHIH. iCommerce, former subsidiary of Voyager, replaced the latter as shareholder of PHIH on October 14, 2015 and held a 33.33% equity interest in PHIH.
The objective of PHIH was the creation and development of online businesses in the Philippines, the leveraging of local market and business model insights, the facilitation of commercial, strategic and investment partnerships, and the acceleration of the rollout of online startups in the Philippines. In accordance with the underlying agreements, iCommerce paid approximately €7.4 million to PHIH as contribution to capital. Payment of another contribution by iCommerce to the PHIH capital of approximately €2.6 million was requested in 2016 and remained outstanding.

3Q 2018 Fo rm 17 -Q Page 26 o f 27
On September 5, 2017, AIH initiated arbitral proceedings via the German Arbitration Institute (DIS) against iCommerce for not settling the €2.6 million contribution. AIH required the payment of €2.6 million plus interest and all costs of the arbitral proceedings.
On December 14, 2017, the management and operations of iCommerce was transferred from VIH to PLDT Online. As a result, VIH ceased to have any direct interest in iCommerce and any indirect interest in PHIH. See Note 2 – Summary of Significant Accounting Policies – Transfer of iCommerce to PLDT Online.
On April 19, 2018, iCommerce, together with PLDT and Voyager, executed a Settlement Agreement with AIH to terminate the arbitral proceedings and to settle disputes over rights and obligations in connection with the PHIH agreements. On the same date, iCommerce executed a Share Transfer Agreement with AIH to transfer its PHIH shares to AIH. As a result, iCommerce gave up its 33.33% equity interest for zero value and its claims over the remaining cash of PHIH. iCommerce, AIH and PHIH waived all other claims in connection with PHIH, including any claims against iCommerce.
In separate letters dated April 26, 2018, iCommerce and AIH informed the DIS that both parties have concluded an out-of-court settlement with AIH requesting for the termination of the arbitral proceedings.
On May 7, 2018, iCommerce received the order of the DIS for the termination of the arbitral proceedings and the administrative fees to be paid in relation to the arbitral proceedings. With the foregoing, iCommerce has completed the exit from the joint venture.
Consolidation of the Digital Investments of Smart under PCEV
On February 27, 2018, the Board of Directors of PCEV approved the consolidation of the various digital investments under PCEV.
On March 14, 2018, PCEV entered into a Share Purchase Agreement with Voyager to purchase 53 million ordinary shares of VIH, representing 100% of the issued and outstanding ordinary shares of VIH, for a total consideration of Php465 million. The total consideration was settled on March 15, 2018, while the transfer of shares to PCEV was completed on April 6, 2018.
On March 14, 2018, VIH entered into Share Purchase Agreement with Smart to purchase all of its 170 million common shares of Voyager for a total consideration of Php3,527 million. The total consideration was settled on April 16, 2018.
On April 12, 2018, PCEV entered into a Subscription Agreement with VIH to subscribe to additional 96 million ordinary shares of VIH with a par value of SG$1.00 per ordinary shares, for a total subscription price of SG$96 million, or Php3,806 million, which was settled on April 13, 2018.
PCEV’s Sale of Receivables from MPIC
On March 2, 2018, PCEV entered into a Receivables Purchase Agreement, or RPA, with various financial institutions, or the Purchasers, to sell a portion of its receivables from MPIC due in 2019 to 2021 amounting to Php5,550 million for a total consideration of Php4,852 million, which was settled on March 5, 2018. Under the terms of the RPA, the Purchasers will have exclusive ownership of the purchased receivables and all of its rights, title, and interest.
On March 23, 2018, PCEV entered into another RPA with a financial institution to sell a portion of its receivables from MPIC due in 2019 amounting to Php2,230 million for a total consideration of Php2,124 million, which was settled on April 2, 2018.
Agreement between PLDT and Smart and Amdocs
On January 24, 2018, PLDT and Smart entered into a seven-year, US$300 million Managed Transformation Agreement with Amdocs, a leading provider of software and services to communications and media companies, to upgrade PLDT’s business IT systems and improve its business processes and services, aimed at enhancing consumer satisfaction, reducing costs and generating increased revenues.

3Q 2018 Fo rm 17 -Q Page 27 o f 27
On September 28, 2018, PLDT and Amdocs expanded their strategic partnership under a new six-year service agreement to consolidate, modernize and manage PLDT and Smart’s IT Infrastructure, to further enhance customer experience and engagement. Transfer of Hastings PDRs to PLDT Beneficial Trust Fund On January 22, 2018, ePLDT’s Board of Directors approved the assignment of the Hastings PDRs, representing 70% economic interest in Hastings Holdings, Inc., to the PLDT Beneficial Trust Fund for a total consideration of Php1,664 million. The assignment was completed on February 15, 2018 and ePLDT subsequently ceased to have any economic interest in Hastings.
Divestment of CURE
On October 26, 2011, PLDT received the Order issued by the NTC approving the application jointly filed by PLDT and Digitel for the sale and transfer of approximately 51.6% of the outstanding common stock of Digitel to PLDT. The approval of the application was subject to conditions which included the divestment by PLDT of CURE, in accordance with the Divestment Plan.
In a letter dated July 26, 2012, Smart informed the NTC that it has complied with the terms and conditions of the divestment plan as CURE had rearranged its assets, such that, except for assets necessary to pay off obligations due after June 30, 2012 and certain tax assets, CURE’s only remaining assets as at June 30, 2012 were its congressional franchise, the 10MHz of 3G frequency in the 2100 band and related permits.
In a letter dated September 10, 2012, Smart informed the NTC that the minimum Cost Recovery Amount, or CRA, to enable PLDT to recover its investment in CURE includes, among others, the total cost of equity investments in CURE, advances from Smart for operating requirements, advances from stockholders and associated funding costs. In a letter dated January 21, 2013, the NTC referred the computation of the CRA to the Commissioners of the NTC.
In a letter dated March 5, 2018, PLDT informed the NTC that it is waiving its right to recover any and all costs related to the 10MHz of 3G radio frequency previously assigned to CURE. Accordingly, CURE will not claim any cost associated with it in the event of subsequent assignment by the NTC to another qualified telecommunications company. With the foregoing, PLDT is deemed to have fully complied with its obligation to divest from CURE as a condition to the sale and transfer of DTPI shares to PLDT.
See Note 2 – Summary of Significant Accounting Policies – Divestment of CURE to the accompanying unaudited consolidated financial statements for further details.
For updates on matters relating to the (1) Department of Labor and Employment, or DOLE, Compliance Order to PLDT, see Note 26 – Provisions and Contingencies; (2) Petition against the Philippine Competition Commission, see Note 10 – Investment in Associates and Joint Ventures; and (3) Wilson Gamboa and Jose M. Roy III Petition, see Note 26 – Provisions and Contingencies, to the accompanying unaudited consolidated financial statements.
Related Party Transactions
For a detailed discussion of the related party transactions, see Note 24 – Related Party Transactions to the accompanying unaudited consolidated financial statements.

3Q 2018 Fo rm 17 -Q A -1
ANNEX I – AGING OF ACCOUNTS RECEIVABLE
The following table shows the aging of our consolidated receivables as at September 30, 2018:
Type of Accounts Receivable Total Current 31-60 Days
61-90 Days
Over 91 Days
(amounts in million Php) Retail subscribers 19,692 10,971 1,213 249 7,259Corporate subscribers 9,896 2,551 2,383 885 4,077Foreign administrations 4,428 1,672 268 237 2,251Domestic carriers 378 12 216 27 123Dealers, agents and others 19,959 6,694 1,183 1,351 10,731Total 54,353 21,900 5,263 2,749 24,441Less: Allowance for doubtful accounts 15,394 Total Receivables - net 38,959

3Q 2018 Fo rm 17 -Q A -2
ANNEX II – FINANCIAL SOUNDNESS INDICATORS
The following table shows our financial soundness indicators as at September 30, 2018 and 2017:
2018 2017 Current Ratio(1) 0.66:1.0 0.55:1.0 Net Debt to Equity Ratio(2) 1.18:1.0 1.19:1.0 Net Debt to EBITDA Ratio(3) 1:94:1.0 2.18:1.0 Total Debt to EBITDA Ratio(4) 2.69:1.0 2.71:1.0 Asset to Equity Ratio(5) 4.30:1.0 3.81:1.0 Interest Coverage Ratio(6) 2.09:1.0 4.63:1.0 Profit Margin(7) 14% 18 % Return on Assets(8) 2% 6 % Return on Equity(9) 7% 23 % EBITDA Margin(10) 43% 43 %
(1) Current ratio is measured as current assets divided by current liabilities (including current portion – LTD, unearned revenues and
mandatory tender option liability.) (2) Net Debt to equity ratio is measured as total debt (long-term debt, including current portion) less cash and cash equivalent and short-term
investments divided by total equity attributable to equity holders of PLDT. (3) Net Debt to EBITDA ratio is measured as total debt (long-term debt, including current portion) less cash and cash equivalent and short-
term investments divided by EBITDA for the 12 months average period. (4) Total Debt to EBITDA ratio is measured as total debt (long-term debt, including current portion) divided by EBITDA for the 12 months
average period. (5) Asset to equity ratio is measured as total assets divided by total equity attributable to equity holders of PLDT. (6) Interest coverage ratio is measured by EBIT, or earnings before interest and taxes for the 12 months average period, divided by total
financing cost for the 12 months average period. (7) Profit margin is derived by dividing net income for the period with total revenues for the period. (8) Return on assets is measured as net income for the 12 months average period divided by average total assets. (9) Return on Equity is measured as net income for the 12 months average period divided by average total equity attributable to equity holders
of PLDT. (10) EBITDA margin is measured as EBITDA for the period divided by service revenues for the period.
EBITDA for the period is measured as net income excluding depreciation and amortization, amortization of intangible assets, asset impairment on noncurrent assets, financing cost, interest income, equity share in net earnings (losses) of associates and joint ventures, foreign exchange gains (losses) – net, gains (losses) on derivative financial instruments – net, provision for (benefit from) income tax and other income (expenses) – net for the period.

3Q 2018 Fo rm 17 -Q S -1
SIGNATURES
Pursuant to the requirements of the Securities Regulation Code, the registrant has duly caused this report for the nine months of 2018 to be signed on its behalf by the undersigned thereunto duly authorized.
Date: November 8, 2018