Parental History and Myocardial Infarction Risk Across the WorldThe INTERHEART Study
9
from around the world ● focus on the INTERHEART study Parental History and Myocardial Infarction Risk Across the World The INTERHEART Study Clara K. Chow, MBBS, PHD,*†§ Shofiqul Islam, MSC,* Leonelo Bautista, MD, DRPH, Zvonko Rumboldt, MD, PHD,¶ Afzal Yusufali, MD,# Changchun Xie, PHD,* Sonia S. Anand, MD, PHD,*†‡ James C. Engert, PHD,** Sumathy Rangarajan, MSC,* Salim Yusuf, DPHIL*† * Population Health Research Institute, McMaster University and Hamilton Health Sciences, Hamilton, Ontario, Canada; † Department of Medicine, McMaster University, Hamilton, Ontario, Canada; ‡ Department of Epidemiology, McMaster University, Hamilton, Ontario, Canada; § The George Institute for Global Health, University of Sydney, Sydney, New South Wales, Australia; University of Wisconsin School of Medicine and Public Health, Department of Population Health Sciences, Madison, Wisconsin; ¶ Split University School of Medicine, Split, Croatia; # Cardiology and Cardiothoracic Surgery Centre, Department of Health and Medical Services, Dubai Hospital, Dubai, United Arab Emirates; ** Departments of Medicine and Human Genetics, McGill University, Montreal, Quebec, Canada A parental history (PH) of coronary heart disease (CHD) is consistently associated with a higher risk of the development of CHD in several studies (1–9). It is generally accepted that this associa- tion is explained by a combination of predominantly known risk factors and genetic variants (10). Al- though many studies show that risk factors and ge- netic polymorphisms are significantly associated with myocardial infarction (MI), these studies fail to show how these associations may explain the relationship between PH and the risk of MI (11,12). Some previ- ous studies established the independence of PH from common vascular risk factors (7); however, there are few large international studies that can establish the independence of PH from comprehensive measure- ments of behavioral, biological, psychosocial, and genetic risk factors, as reported in the INTERHEART study. The aims of this analysis were: 1) to examine whether the risk associated with a score of PH of MI (increasing with the number of affected parents and prematurity of PH) is independent of behavioral, biological, psychoso- cial, and genetic factors; and 2) to evaluate whether these findings are consistent across sex, age groups, socioeco- nomic groups, and world regions. See page 628 Methods Participants. INTERHEART was a multinational case-control study that enrolled 15,152 cases present- ing with a first MI and 14,820 controls matched for age and sex between February 1999 and March 2003. Details of selection criteria were reported previously (13). In the principal analysis of the INTERHEART study, cases and controls were excluded if they did not meet inclusion criteria (e.g., previous CHD) or had insufficient data, leaving 12,461 cases and 14,637 controls (13). For the present analysis, participants were also excluded if data on PH of cardiovascular disease (CVD) were incomplete. Therefore, 12,149 cases and 14,467 controls were included in the cur- rent analysis.
Transcript of Parental History and Myocardial Infarction Risk Across the WorldThe INTERHEART Study

from● f
PI
T
CZSS*
H†
‡
§
�
M¶
#
D*
Astktnmhbocfimgs
tw
around the worldocus on the INTERHEART study
arental History and Myocardialnfarction Risk Across the World
he INTERHEART Study
lara K. Chow, MBBS, PHD,*†§ Shofiqul Islam, MSC,* Leonelo Bautista, MD, DRPH,�vonko Rumboldt, MD, PHD,¶ Afzal Yusufali, MD,# Changchun Xie, PHD,*onia S. Anand, MD, PHD,*†‡ James C. Engert, PHD,** Sumathy Rangarajan, MSC,*alim Yusuf, DPHIL*†Population Health Research Institute, McMaster University and Hamilton Health Sciences,amilton, Ontario, Canada;
Department of Medicine, McMaster University, Hamilton, Ontario, Canada;Department of Epidemiology, McMaster University, Hamilton, Ontario, Canada;The George Institute for Global Health, University of Sydney, Sydney, New South Wales, Australia;University of Wisconsin School of Medicine and Public Health, Department of Population Health Sciences,
adison, Wisconsin;Split University School of Medicine, Split, Croatia;Cardiology and Cardiothoracic Surgery Centre, Department of Health and Medical Services,ubai Hospital, Dubai, United Arab Emirates;
*Departments of Medicine and Human Genetics, McGill University, Montreal, Quebec, Canada
Pcfin
M
PciaD(smicwdc
parental history (PH) of coronary heart disease(CHD) is consistently associated with a higher
risk of the development of CHD in severaltudies (1–9). It is generally accepted that this associa-ion is explained by a combination of predominantlynown risk factors and genetic variants (10). Al-hough many studies show that risk factors and ge-etic polymorphisms are significantly associated withyocardial infarction (MI), these studies fail to show
ow these associations may explain the relationshipetween PH and the risk of MI (11,12). Some previ-us studies established the independence of PH fromommon vascular risk factors (7); however, there areew large international studies that can establish thendependence of PH from comprehensive measure-
ents of behavioral, biological, psychosocial, andenetic risk factors, as reported in the INTERHEARTtudy.
The aims of this analysis were: 1) to examine whetherhe risk associated with a score of PH of MI (increasing
ith the number of affected parents and prematurity of rH) is independent of behavioral, biological, psychoso-ial, and genetic factors; and 2) to evaluate whether thesendings are consistent across sex, age groups, socioeco-omic groups, and world regions.
See page 628
ethods
articipants. INTERHEART was a multinationalase-control study that enrolled 15,152 cases present-ng with a first MI and 14,820 controls matched forge and sex between February 1999 and March 2003.etails of selection criteria were reported previously
13). In the principal analysis of the INTERHEARTtudy, cases and controls were excluded if they did noteet inclusion criteria (e.g., previous CHD) or had
nsufficient data, leaving 12,461 cases and 14,637ontrols (13). For the present analysis, participantsere also excluded if data on PH of cardiovascularisease (CVD) were incomplete. Therefore, 12,149ases and 14,467 controls were included in the cur-
ent analysis.
CebbinlPot
scaTato
aai
pip1gicyettrrrra(r(Imae
WtrowgsiatdpTtawa4ctSwMmIatalpbtatrI
nmaaettg
620 Chow et al. JACC Vol. 57, No. 5, 2011Parental History and Myocardial Infarction February 1, 2011:619–627
linical variables. Data on demographic factors, socio-conomic status, biological risk factors (hypertension, dia-etes, lipids, waist-to-hip ratio), behavioral risk factors (to-acco use, alcohol use, physical activity, fruit and vegetablentake), and psychosocial risk factors (depression, perma-ent stress, financial stress, stressful events, and perceived
ocus of control) (14) were obtained for all participants.sychosocial risk factors were combined into a score basedn categories of each of the factors listed previously, andhis was detailed in a previous paper (14).
Hereafter we refer to the 9 risk factors (abnormal lipids,moking, hypertension, diabetes, abdominal obesity, psychoso-ial factors, physical activity, fruit and vegetable consumption,nd alcohol consumption) as the INTERHEART risk factors.he presence or absence of a history of MI in the mother
nd/or father was recorded for each case and control. Par-icipants also reported whether MI occurred before the agef 50 years in each parent.
Details of blood sampling, storage, transportation, andnalyses were published previously (15). The protocol waspproved by the ethics committee at each of the participat-ng centers, and all participants provided informed consent.
Genetic analysis was performed in 8,795 (�32%) partici-ants enrolled in INTERHEART study. This included partic-pants from 5 ethnic groups (Arab, European, Iranian, Ne-alese, and South Asian) who were genotyped using a panel of,536 single nucleotide polymorphisms (SNPs) from 103enes that were chosen based on previous knowledge suggest-ng a relationship with MI or MI risk factors (16). Cases andontrols were matched by ethnicity in addition to age (�5ears) and sex. To develop a genotype score, the relationship ofach of the 1,536 SNPs was examined in models with MI ashe dependent variable including age, sex, and ethnicity. Theop 20 most significant SNPs (p � 0.007) (rs3798221,s2113485, rs6980952, rs11679259, rs2020942, rs7015547,s4520, rs11615630, rs5070, rs9364559, rs2972162,s1293309, rs854548, rs1298295, rs854542, rs4073054,s3760627, rs2239375, rs2645424, rs3813667) were tested inmultiple logistic regression model. From this model, 9 SNPs
rs7412, rs699, rs3798221, rs4420638, rs6511720,s2972162, rs730365, rs4520, rs11679259) from 8 genesAPOE, AGT, LPA, LDLR, PPARG, PON2, APOC3,NSIG2) were found to remain significant (p � 0.05). Theinor allele frequencies of these SNPs for each ethnic group
re described in the Online Appendix. A test for Hardy-Weinberg
quilibrium criteria was performed. All SNPs were in Hardy- aeinberg equilibrium in each ethnicity. The directions of associa-ions were the same for the majority of the 9 SNPs except fors6511720, rs7412, and rs4420638 in Nepalese compared withther ethnic groups and rs6511720 in South Asians comparedith other ethnic groups. The 9 SNPS were used to calculate theenotype score (the number of risk alleles that an individual pos-esses). For each of the 9 significant SNPs, 0 points were allocatedf no risk alleles were carried by an individual, 1 point if 1 riskllele, and 2 points if 2 risk alleles. We defined an allele as protec-ive according to what was derived as protective in the overallataset, and we did not use ethnicity-specific scores. Thus, theotential genotype score for each subject ranged from 0 to 18.he mean scores for controls and cases (11.9 and 12.2, respec-
ively) are �9 because in several cases, the major allele is the riskllele. The methodology that we used to create this genotype scoreas similar to that described by a number of groups seeking to
ggregate genetic information (17–19). A total of 3,372 cases and,032 controls had complete clinical and genetic data, and theharacteristics of those genotyped compared with those not geno-yped are included in the Online Appendix.tatistical methods. Multiple logistic regression modelsere used to quantify the association between the risk ofI and PH of MI. Age, sex, and region were forced in allodels. In more complex models, we adjusted for the 9
NTERHEART risk factors. We tested for significant inter-ctions in risks among groups stratified by sex, age of par-icipant (men 55 years and younger and women 65 yearsnd younger), education, and country-specific economicevel based on World Bank classifications for the relevanteriod 1999 to 2003 (20). We also examined risk stratifiedy overall cardiovascular risk (calculated using a risk equa-ion derived from the Framingham cohort [21]), region,nd ethnicity. In the subset of participants who were geno-yped, the genotype score was included in multiple logisticegression models adjusted for age, sex, region, and the 9NTERHEART risk factors.
We scored PH as follows: Those with no PH were desig-ated as the reference group. The groups in order of least toost severe were: 1) history of disease in 1 parent 50 years of
ge or older; 2) disease in 1 parent younger than 50 years ofge; 3) disease in both parents 50 years of age or older; 4) dis-ase in 1 parent 50 years of age or older and 1 parent youngerhan 50 years of age; and 5) disease in both parents youngerhan 50 years of age. We compared risk factor levels betweenroups using t tests. All statistical tests were 2 sided. Statistical
nalyses and graphics were produced with the SAS system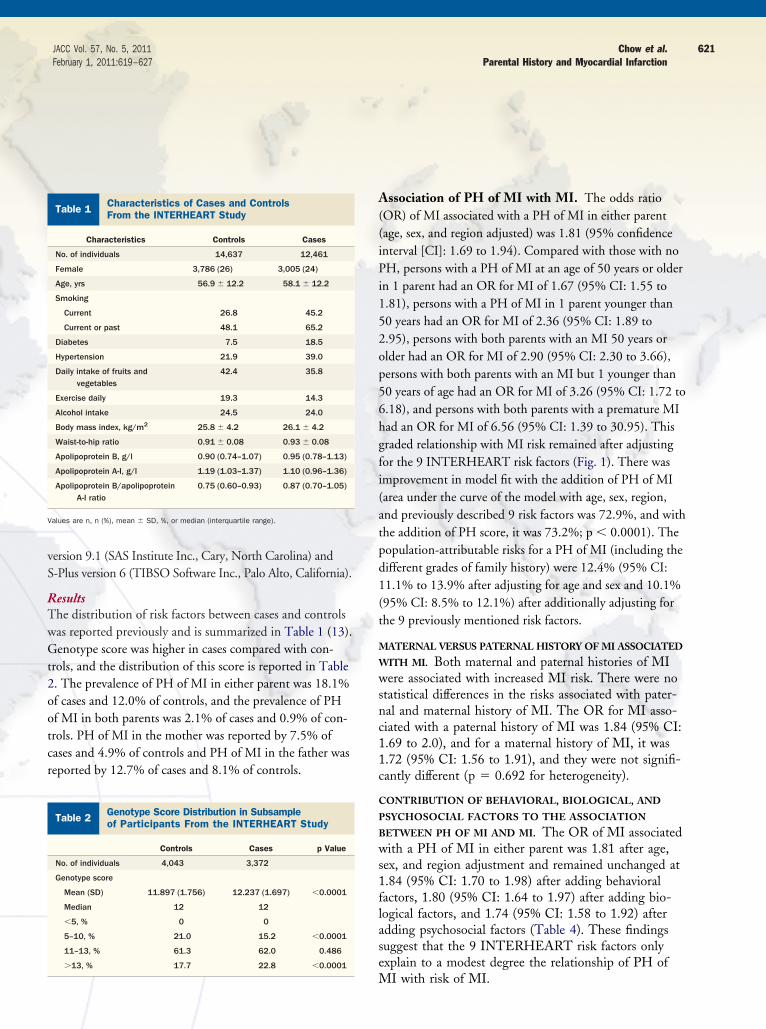
vS
RTwGt2ootcr
A((iPi152op56hgfi(atpd1(t
M
W
wsnc11c
C
P
B
ws1flase
V
621JACC Vol. 57, No. 5, 2011 Chow et al.February 1, 2011:619–627 Parental History and Myocardial Infarction
ersion 9.1 (SAS Institute Inc., Cary, North Carolina) and-Plus version 6 (TIBSO Software Inc., Palo Alto, California).
esultshe distribution of risk factors between cases and controlsas reported previously and is summarized in Table 1 (13).enotype score was higher in cases compared with con-
rols, and the distribution of this score is reported in Table. The prevalence of PH of MI in either parent was 18.1%f cases and 12.0% of controls, and the prevalence of PHf MI in both parents was 2.1% of cases and 0.9% of con-rols. PH of MI in the mother was reported by 7.5% ofases and 4.9% of controls and PH of MI in the father waseported by 12.7% of cases and 8.1% of controls.
Table 1 Characteristics of Cases and ControlsFrom the INTERHEART Study
Characteristics Controls Cases
No. of individuals 14,637 12,461
Female 3,786 (26) 3,005 (24)
Age, yrs 56.9 � 12.2 58.1 � 12.2
Smoking
Current 26.8 45.2
Current or past 48.1 65.2
Diabetes 7.5 18.5
Hypertension 21.9 39.0
Daily intake of fruits andvegetables
42.4 35.8
Exercise daily 19.3 14.3
Alcohol intake 24.5 24.0
Body mass index, kg/m2 25.8 � 4.2 26.1 � 4.2
Waist-to-hip ratio 0.91 � 0.08 0.93 � 0.08
Apolipoprotein B, g/l 0.90 (0.74–1.07) 0.95 (0.78–1.13)
Apolipoprotein A-I, g/l 1.19 (1.03–1.37) 1.10 (0.96–1.36)
Apolipoprotein B/apolipoproteinA-I ratio
0.75 (0.60–0.93) 0.87 (0.70–1.05)
alues are n, n (%), mean � SD, %, or median (interquartile range).
Table 2 Genotype Score Distribution in Subsampleof Participants From the INTERHEART Study
Controls Cases p Value
No. of individuals 4,043 3,372
Genotype score
Mean (SD) 11.897 (1.756) 12.237 (1.697) �0.0001
Median 12 12
�5, % 0 0
5–10, % 21.0 15.2 �0.0001
11–13, % 61.3 62.0 0.486
�13, % 17.7 22.8 �0.0001
M
ssociation of PH of MI with MI. The odds ratioOR) of MI associated with a PH of MI in either parentage, sex, and region adjusted) was 1.81 (95% confidencenterval [CI]: 1.69 to 1.94). Compared with those with noH, persons with a PH of MI at an age of 50 years or older
n 1 parent had an OR for MI of 1.67 (95% CI: 1.55 to.81), persons with a PH of MI in 1 parent younger than0 years had an OR for MI of 2.36 (95% CI: 1.89 to.95), persons with both parents with an MI 50 years orlder had an OR for MI of 2.90 (95% CI: 2.30 to 3.66),ersons with both parents with an MI but 1 younger than0 years of age had an OR for MI of 3.26 (95% CI: 1.72 to.18), and persons with both parents with a premature MIad an OR for MI of 6.56 (95% CI: 1.39 to 30.95). Thisraded relationship with MI risk remained after adjustingor the 9 INTERHEART risk factors (Fig. 1). There wasmprovement in model fit with the addition of PH of MIarea under the curve of the model with age, sex, region,nd previously described 9 risk factors was 72.9%, and withhe addition of PH score, it was 73.2%; p � 0.0001). Theopulation-attributable risks for a PH of MI (including theifferent grades of family history) were 12.4% (95% CI:1.1% to 13.9% after adjusting for age and sex and 10.1%95% CI: 8.5% to 12.1%) after additionally adjusting forhe 9 previously mentioned risk factors.
ATERNAL VERSUS PATERNAL HISTORY OF MI ASSOCIATED
ITH MI. Both maternal and paternal histories of MIere associated with increased MI risk. There were no
tatistical differences in the risks associated with pater-al and maternal history of MI. The OR for MI asso-iated with a paternal history of MI was 1.84 (95% CI:.69 to 2.0), and for a maternal history of MI, it was.72 (95% CI: 1.56 to 1.91), and they were not signifi-antly different (p � 0.692 for heterogeneity).
ONTRIBUTION OF BEHAVIORAL, BIOLOGICAL, AND
SYCHOSOCIAL FACTORS TO THE ASSOCIATION
ETWEEN PH OF MI AND MI. The OR of MI associatedith a PH of MI in either parent was 1.81 after age,
ex, and region adjustment and remained unchanged at.84 (95% CI: 1.70 to 1.98) after adding behavioralactors, 1.80 (95% CI: 1.64 to 1.97) after adding bio-ogical factors, and 1.74 (95% CI: 1.58 to 1.92) afterdding psychosocial factors (Table 4). These findingsuggest that the 9 INTERHEART risk factors onlyxplain to a modest degree the relationship of PH of
I with risk of MI.

C
R
sv6vyaaO2a0
fTancgm
C
B
wa
VLDL �
622 Chow et al. JACC Vol. 57, No. 5, 2011Parental History and Myocardial Infarction February 1, 2011:619–627
ONSISTENCY OF FINDINGS ACROSS SUBGROUPS AND
EGIONS. The age-, sex-, and region-adjusted OR as-ociated with a PH of MI was higher for younger indi-iduals (men 55 years of age and younger and women5 years of age and younger) compared with older indi-iduals. The OR was 2.01 (95% CI: 1.84 to 2.20) forounger ages and 1.54 (95% CI: 1.38 to 1.72) for olderges (p � 0.0002 for heterogeneity). However, afterdjusting for the 9 INTERHEART risk factors, theR for younger people was 1.84 (95% CI: 1.62 to
.08) and for older people 1.60 (95% CI: 1.38 to 1.86),nd the difference in risks became insignificant (p �
Table 3 Characteristics of Case and Control Participants Wi
Control
CharacteristicsNo PH of MI
(n � 12,714)With P(n � 1
Body mass index, kg/m2 26.3 26
Waist-to-hip ratio 0.90 0
Blood pressure, mm Hg
Systolic 129 131
Diastolic 80 80
Cholesterol, mmol/l
Total 5.28 5
LDL 3.25 3
Triglycerides 1.92 2
HDL 1.17 1
Apo B 0.93 0
Apo A-I 1.27 1
Apo B/Apo A-I ratio 0.77 0
HbA1c 5.85 5
Smoking
Current or past 40.6 45
Current 16.8 15
Past 17.2 22
Diabetes 6.6 8
Hypertension 20.2 24
Alcohol consumption 18.7 21
Physical activity 20.3 22
Consume both fruits and vegetables daily 48.0 54
Depression 18.8 21
Stress
Permanent 4.1 5
Several periods 17.7 19
Severe financial stress 9.6 7
Moderate financial stress 34.9 32
2� stressful events 13.4 13
Least control over life 33.1 31
alues are listed as mean or %.Apo � apolipoprotein; HbA1c � glycosylated hemoglobin; HDL � high-density lipoprotein;
.154 for heterogeneity), suggesting that risk factor dif- f
erences explained the initial heterogeneity observed.he results were consistent in fully adjusted models
cross geographic regions, ethnic groups, world eco-omic regions (based on World Bank economic classifi-ation), socioeconomic groups in both sexes and all ageroups and when stratified by cardiovascular risk (Fra-ingham risk score) (Tables 5 and 6).
ONTRIBUTION OF GENETIC RISK FACTORS TO ASSOCIATION
ETWEEN PH OF MI AND MI RISK. In the subset of 7,415ith complete genetic and clinical data, the OR associ-
ted with a PH of MI was unchanged after adjusting
d Without a PH of MI (Adjusted for Age, Sex, and Region)
Cases
Ip Value
No PH of MI(n � 9,935)
With PH of MI(n � 2,214) p Value
0.0001 26.8 27.3 �0.0001
0.0189 0.93 0.93 0.8382
0.0005 122 121 0.0190
0.0017 74 74 0.0531
�0.0001 5.43 5.50 0.0430
�0.0001 3.49 3.52 0.2825
0.0087 1.96 2.04 0.0246
0.0877 1.06 1.07 0.3625
�0.0001 1.00 1.01 0.0811
0.0006 1.15 1.16 0.3367
0.0003 0.91 0.91 0.3926
0.7520 6.16 6.12 0.2979
0.0010 58.6 62.2 0.0103
0.2138 34.9 35.4 0.6772
�0.0001 14.7 16.8 0.0103
0.0248 29.8 22.2 0.0227
0.0001 41.6 45.3 0.0042
0.0180 14.0 15.7 0.0323
0.0199 13.6 14.4 0.3272
�0.0001 38.3 43.6 �0.0001
0.0041 26.2 29.2 0.0124
0.0242 7.2 10.5 �0.0001
0.1459 21.6 21.0 0.5500
0.0085 13.9 13.4 0.5271
0.0717 37.1 34.8 0.0558
0.9353 17.6 20.2 0.0056
0.2924 16.7 19.2 0.0133
low-density lipoprotein; MI � myocardial infarction; PH � parental history.
th an
s
H of M,753)
.7
.89
.57
.49
.02
.19
.98
.30
.80
.86
.2
.7
.5
.1
.6
.2
.9
.3
.8
.2
.2
.8
.6
.4
.7
or genotype score (Table 4).

R
M
PP(pta
fP
4iho1
V
623JACC Vol. 57, No. 5, 2011 Chow et al.February 1, 2011:619–627 Parental History and Myocardial Infarction
ISK FACTORS IN THOSE WITH AND WITHOUT A PH OF
I. Risk factors were compared in participants reporting aH of MI in at least 1 parent and those not reporting aH of MI. Those reporting a PH of MI were younger
55.0 years vs. 57.9 years; p � 0.0001). Biological andsychosocial risk factors were generally more adverse inhose with a PH of MI. Behaviors, however, were gener-lly better in those with a PH of MI. The patterns of dif-
Figure 1 Relationship of Parental History of Myocardial Infar
The 9 risk factors in the models are hypertension, diabetes, lipids, waist-to-hippsychosocial risk factors. One parent older, disease in 1 parent, diagnosed whwhen younger than 50 years of age. Two parents older, disease in both parentboth parents, at least 1 parent diagnosed when younger than 50 years of age.
Table 4 Risk of MI Associated With PH of MI and Adjustmenand Genetic Risk Factors
Odds Ratio Mother
Unadjusted 1.61 (1.45–
Adjusted for age, sex, region 1.73 (1.56–
Adjusted for age, sex, region, behavioral RFs 1.74 (1.55–
Adjusted for age, sex, region, behavioral and biological RFs 1.63 (1.42–
Adjusted for age, sex, region, 9 RFs 1.54 (1.33–
Adjusted for age, sex, region, 9 RFs, genotype score* 1.57 (1.34–
alues are odds ratio (95% confidence interval). *Analysis in 3,269 cases and 4,032 controls. AllRF � risk factor; other abbreviations as in Table 3.
erences in risk factors between those with and without aH of MI are similar for both cases and controls (Table 3).Genotype score was calculated for 3,372 cases and
,043 controls. Although the genotype score was highern cases compared with controls (Table 2), it was notigher in those with a PH versus those without a PHf MI. The mean genotype score was 11.90 (SD �.75) in controls with no PH of MI, 11.84 (SD �
and Risk of Myocardial Infarction
tobacco use, alcohol use, physical activity, fruit and vegetable intake, ander than 50 years of age. One parent younger, disease in 1 parent, diagnosednosed when older than 50 years of age. Two parents younger, disease inno parental history; RF � risk factor.
Behavioral, Biological, Psychosocial,
PH of MI
Father Mother or Father Mother and Father
1.65 (1.53–1.79) 1.62 (1.51–1.73) 2.43 (1.96–3.01)
1.84 (1.69–2.00) 1.81 (1.69–1.94) 2.65 (2.14–3.29)
1.85 (1.69–2.02) 1.84 (1.70–1.98) 2.52 (2.00–3.17)
1.86 (1.67–2.08) 1.80 (1.64–1.97) 2.37 (1.77–3.15)
1.85 (1.65–2.07) 1.74 (1.58–1.92) 2.26 (1.68–3.06)
1.45 (1.25–1.68) 1.50 (1.32–1.70) 2.28 (1.64–3.17)
ction
ratio,en olds, diagNil �
t for
1.78)
1.91)
1.94)
1.86)
1.76)
1.86)
other models include 14,467 controls and 12,149 cases.

1ic
DTo
MaTtgD(ega
aaoiactcifbsoaf
oamMoofwao(scrclmg
Vsbw
624 Chow et al. JACC Vol. 57, No. 5, 2011Parental History and Myocardial Infarction February 1, 2011:619–627
.81) in controls with a PH of MI, 12.26 (SD � 1.71)n cases with no PH of MI, and 12.14 (SD � 1.68) inases with a PH of MI.
iscussionhe findings of this study indicate that a PH of MI scored
Table 5Risk of MI Associated With PH of MIand Comparisons Within Major Subgroups:Analysis of 14,467 Controls and 12,149 Cases
PH of MI Adjustedfor Age, Sex, Region
PH of MI Adjustedfor 9 Risk Factors
Overall 1.81 (1.69–1.94) 1.74 (1.58–1.92)
Sex
Women 1.62 (1.41–1.86) 1.65 (1.36–2.00)
Men 1.88 (1.73–2.04) 1.78 (1.59–1.98)
p value for heterogeneity 0.0694 0.5078
Age
Younger (men �55 yrs,women �65 yrs)
2.01 (1.84–2.20) 1.84 (1.63–2.08)
Older (men �55 yrs,women �65 yrs)
1.54 (1.38–1.72) 1.60 (1.38–1.86)
p value for heterogeneity 0.0002 0.1539
Highest level of educationcompleted
Trade/college/university 1.73 (1.56–1.93) 1.75 (1.51–2.02)
9–12 yrs of education 2.04 (1.79–2.33) 1.97 (1.64–2.37)
�8 yrs of education 2.00 (1.76–2.28) 1.69 (1.42–2.01)
p value for heterogeneity 0.098 0.4415
Household income
Low (lowest 2 quintilesof income)
1.88 (1.64–2.15) 1.76 (1.55–2.00)
Middle (middle quintile) 1.56 (1.26–1.93) 1.78 (1.52–2.09)
High (upper 2 quintiles) 1.73 (1.47–2.06) 1.76 (1.55–2.00)
p value for heterogeneity 0.3380 0.4430
Economic development ofcountry*
Low income 1.69 (1.40–2.04) 1.60 (1.23–2.07)
Middle income 1.98 (1.80–2.19) 1.88 (1.66–2.13)
High income 1.60 (1.41–1.81) 1.53 (1.27–1.86)
p value for heterogeneity 0.0199 0.1699
Cardiovascular risk
Low Framingham risk(1st tertile)
2.06 (1.79–2.37) 1.96 (1.66–2.30)
Medium Framingham risk(2nd tertile)
1.68 (1.47–1.92) 1.57 (1.35–1.83)
High Framingham risk(3rd tertile)
1.82 (1.55–2.13) 1.75 (1.46–2.10)
p value for heterogeneity 0.1210 0.1566
alues are odds ratio (95% confidence interval) unless otherwise indicated. PH of MI iself-reported history of MI in mother or father. *Economic development of each country wasased on World Bank classifications for the relevant period 1999 to 2003 (http://web-orldbank.org).Abbreviations as in Table 3.
n clinical history is an independent predictor of future r
I. The strength of this association is minimally attenu-ted in models adjusted for age, sex, region, and the 9 IN-ERHEART risk factors. The strength of association be-
ween a PH of MI and MI risk is also consistent acrosseographic regions, age, sex, and socioeconomic subgroups.ifferences in crude measures of strength of association
ORs) by world economic region, geographic region, orthnicity is likely due to risk factor differences across re-ions as the difference in ORs became nonsignificant afterdjusting for the previously mentioned 9 risk factors.
Of note is that our findings indicate that the strength ofssociation of parental history of MI and MI risk is similarcross different risk groups. Household income is a measuref socioeconomic status within a country, and our resultsndicate that the risk associated with a PH of MI is similarcross groups of differing socioeconomic status within aountry. Although we note that previous studies indicatehe strength of association of family history with cardiovas-ular outcomes is greater in low-risk groups (22), our find-ngs indicate that the associations are not significantly dif-erent in groups of low, medium, and high risk (as definedy tertiles of Framingham risk score). Thus, the simpleelf-report measure of a PH of MI confers a near doublingf MI risk regardless of background risk factors, country,nd age or whether the history was from the mother orather.
The reason for the association between a PH of MI isften attributed to a combination of shared risk factorsnd genetics (12). Consistent with this hypothesis is thearginal attenuation of the effect of PH on the risk ofI that we observed in this study, which has also been
bserved in other studies (8,9). Consistent with this,ther studies find that more detailed information onamily history (e.g., considering the number of relativesith coronary disease, degree of relationship, lineage,
nd age at diagnosis) also adds to risk prediction basedn risk factors and a single metric of family history23,24). This raises the question of what PH is a mea-ure of. Are there other factors that are unmeasured thatould explain the relationship between PH of MI andisk of MI? Could other factors shared in families be theulprit? For example, early life exposures such as earlyife stress or early life nutrition may affect early develop-
ent of atherosclerosis. Such influences may be trans-enerational and hence could be causing increased MI
isk (25). Home environmental factors such as exposure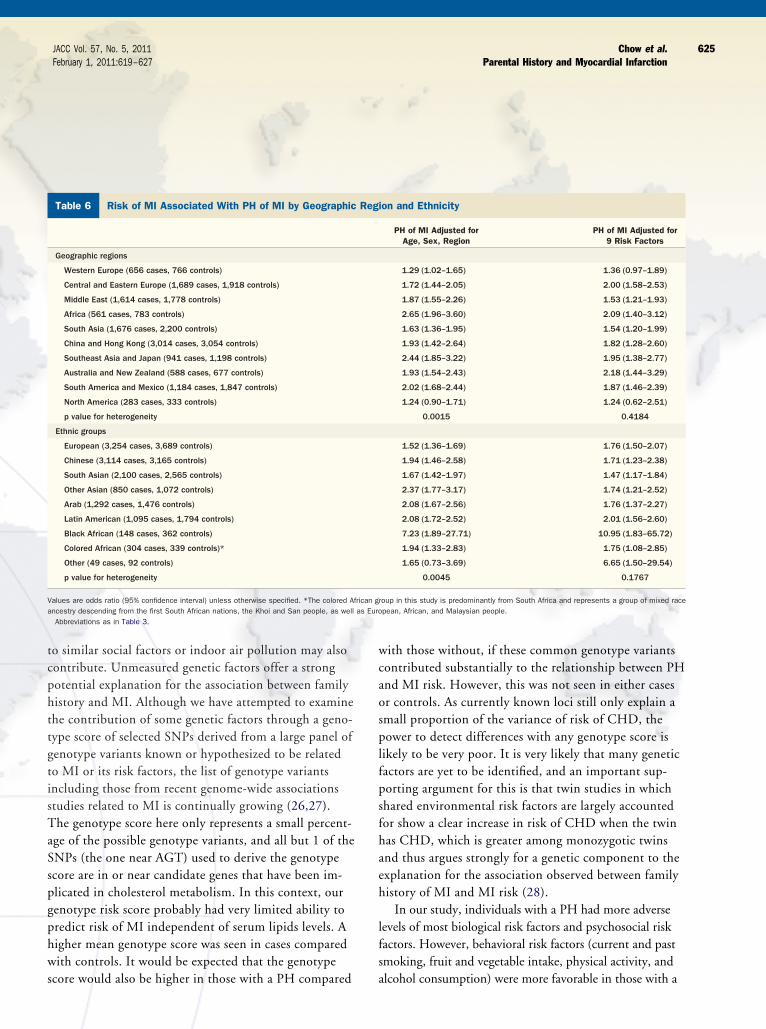
tcphttgtisTaSspgphws
wcaosplfpsfhaeh
lfs
Va as Euro
625JACC Vol. 57, No. 5, 2011 Chow et al.February 1, 2011:619–627 Parental History and Myocardial Infarction
o similar social factors or indoor air pollution may alsoontribute. Unmeasured genetic factors offer a strongotential explanation for the association between familyistory and MI. Although we have attempted to examinehe contribution of some genetic factors through a geno-ype score of selected SNPs derived from a large panel ofenotype variants known or hypothesized to be relatedo MI or its risk factors, the list of genotype variantsncluding those from recent genome-wide associationstudies related to MI is continually growing (26,27).he genotype score here only represents a small percent-
ge of the possible genotype variants, and all but 1 of theNPs (the one near AGT) used to derive the genotypecore are in or near candidate genes that have been im-licated in cholesterol metabolism. In this context, ourenotype risk score probably had very limited ability toredict risk of MI independent of serum lipids levels. Aigher mean genotype score was seen in cases comparedith controls. It would be expected that the genotype
Table 6 Risk of MI Associated With PH of MI by Geographic
Geographic regions
Western Europe (656 cases, 766 controls)
Central and Eastern Europe (1,689 cases, 1,918 controls)
Middle East (1,614 cases, 1,778 controls)
Africa (561 cases, 783 controls)
South Asia (1,676 cases, 2,200 controls)
China and Hong Kong (3,014 cases, 3,054 controls)
Southeast Asia and Japan (941 cases, 1,198 controls)
Australia and New Zealand (588 cases, 677 controls)
South America and Mexico (1,184 cases, 1,847 controls)
North America (283 cases, 333 controls)
p value for heterogeneity
Ethnic groups
European (3,254 cases, 3,689 controls)
Chinese (3,114 cases, 3,165 controls)
South Asian (2,100 cases, 2,565 controls)
Other Asian (850 cases, 1,072 controls)
Arab (1,292 cases, 1,476 controls)
Latin American (1,095 cases, 1,794 controls)
Black African (148 cases, 362 controls)
Colored African (304 cases, 339 controls)*
Other (49 cases, 92 controls)
p value for heterogeneity
alues are odds ratio (95% confidence interval) unless otherwise specified. *The colored Afncestry descending from the first South African nations, the Khoi and San people, as wellAbbreviations as in Table 3.
core would also be higher in those with a PH compared a
ith those without, if these common genotype variantsontributed substantially to the relationship between PHnd MI risk. However, this was not seen in either casesr controls. As currently known loci still only explain amall proportion of the variance of risk of CHD, theower to detect differences with any genotype score is
ikely to be very poor. It is very likely that many geneticactors are yet to be identified, and an important sup-orting argument for this is that twin studies in whichhared environmental risk factors are largely accountedor show a clear increase in risk of CHD when the twinas CHD, which is greater among monozygotic twinsnd thus argues strongly for a genetic component to thexplanation for the association observed between familyistory of MI and MI risk (28).
In our study, individuals with a PH had more adverseevels of most biological risk factors and psychosocial riskactors. However, behavioral risk factors (current and pastmoking, fruit and vegetable intake, physical activity, and
on and Ethnicity
PH of MI Adjusted forAge, Sex, Region
PH of MI Adjusted for9 Risk Factors
1.29 (1.02–1.65) 1.36 (0.97–1.89)
1.72 (1.44–2.05) 2.00 (1.58–2.53)
1.87 (1.55–2.26) 1.53 (1.21–1.93)
2.65 (1.96–3.60) 2.09 (1.40–3.12)
1.63 (1.36–1.95) 1.54 (1.20–1.99)
1.93 (1.42–2.64) 1.82 (1.28–2.60)
2.44 (1.85–3.22) 1.95 (1.38–2.77)
1.93 (1.54–2.43) 2.18 (1.44–3.29)
2.02 (1.68–2.44) 1.87 (1.46–2.39)
1.24 (0.90–1.71) 1.24 (0.62–2.51)
0.0015 0.4184
1.52 (1.36–1.69) 1.76 (1.50–2.07)
1.94 (1.46–2.58) 1.71 (1.23–2.38)
1.67 (1.42–1.97) 1.47 (1.17–1.84)
2.37 (1.77–3.17) 1.74 (1.21–2.52)
2.08 (1.67–2.56) 1.76 (1.37–2.27)
2.08 (1.72–2.52) 2.01 (1.56–2.60)
7.23 (1.89–27.71) 10.95 (1.83–65.72)
1.94 (1.33–2.83) 1.75 (1.08–2.85)
1.65 (0.73–3.69) 6.65 (1.50–29.54)
0.0045 0.1767
oup in this study is predominantly from South Africa and represents a group of mixed racepean, African, and Malaysian people.
Regi
rican gr
lcohol consumption) were more favorable in those with a

Pwhnbrtt
clhtwdtwnmPSirssisorSfrioiCsjoasP(
t
ba
CPcefrIdtpoo
ADRslRtHtsdsRaCcNPPbiTso
AT
626 Chow et al. JACC Vol. 57, No. 5, 2011Parental History and Myocardial Infarction February 1, 2011:619–627
H. The higher rates of protective behaviors in individualsith a PH could be because individuals in this study mayave already changed their lifestyle due to a greater aware-ess of risk, although information bias may also be a possi-le explanation. However, the higher levels of modifiableisk factors including lipids, obesity, and diabetes indicatehat clinicians should aggressively manage risk factors inhose with a PH of CHD (29).
The strengths of this study are its large internationaloverage in ethnically and socioeconomically diverse popu-ations, the large number of cases of MI, and the compre-ensive measurement of risk factors including genetic fac-ors. It thus has wider population implications comparedith previous studies and is able to establish the indepen-ence of the measure of a PH of MI from a long list of po-ential confounders. Further research is required to examinehether other determinants, genetic, early life determi-ants, or common family level influences (e.g., environ-ental exposures) may explain the relationship between aH of MI and MI risk.tudy limitations. First, only data on PH were collected
n this study; data on a history of MI in siblings or otherelatives were not collected. Second, we had limited mea-ures of SNPs in a limited number of individuals from ourtudy population. We did not have adequate numbers ofndividuals to derive our genotype score in a training seteparate from the evaluation set, and this raises the potentialf overfitting. Third, the case-control design of this studyaises the possibility of recall biases influencing our results.tudies have shown that although specificity of self-reportedamily history is high (90% to 100%), the sensitivity of self-eported family history can be low (50% to 70%) (30). Thisnaccuracy could mean our estimations are an underestimationf the risk associated with family history (31). However, stud-es examining the risk of MI associated with a validated PH ofVD (MI/angina/stroke/other vascular disease) report results
imilar to ours (Lloyd-Jones et al. [9] document an age-ad-usted OR for the risk of CVD associated with a validated PHf nonpremature CVD of 1.9 (95% CI: 1.2 to 3.0) in mennd 1.6 (95% CI: 0.9 to 2.9) in women. In comparison in thistudy, the age-adjusted OR for risk of MI associated with aH of MI is 1.88 (95% CI: 1.73 to 2.04) in men and 1.6295% CI: 1.41 to 1.86) in women.
We think that differential recall bias is unlikely be-
ween cases and controls because a PH of MI is likely to se an enduring memory and recalled equally by casesnd controls.
onclusionsH of MI is an easy-to-measure risk factor that is signifi-antly associated with a risk of MI independent of the 9stablished risk factors as well as some common geneticactors, and this relationship is consistent across all worldegions, income, age, and sex groups studied in theNTERHEART study. Further, clinical grading of risketermined by self-reported information from a patient onhe age at onset of disease in parents and whether 1 or botharents are affected provides a simple but robust assessmentf their risk in this population of patients independent ofther measured risk factors.
uthor Disclosuresr. Chow was supported by a Cottrell fellowship from theoyal Australasian College of Physicians and is currently
upported by a Public Health (Sidney Sax) Overseas Fel-owship cofunded by the National Health and Medicalesearch Council and National Heart Foundation of Aus-
ralia. S. Yusuf holds an endowed research chair of theeart and Stroke Foundation of Ontario. Dr. Anand holds
he May Cohen Eli Lilly Chair in Women’s Health Re-earch and Michael G. DeGroote Heart and Stroke Foun-ation Chair in Population Health. The INTERHEARTtudy was funded by the Canadian Institutes of Healthesearch, the Heart and Stroke Foundation of Ontario,nd the International Clinical Epidemiology Network (IN-LEN); by unrestricted grants from several pharmaceutical
ompanies (with major contributions from AstraZeneca,ovartis, Hoechst Marion Roussel [now Aventis], Knollharmaceuticals [now Abbott], Bristol-Myers Squibb, Kingharma, and Sanofi-Sythelabo); and by various nationalodies in different countries (see Online Appendix; http://mage.thelancet.com/extras/04art8001webappendix2.pdf).he funding source had no involvement in the study de-
ign; in the collection, analysis, and interpretation of data;r the writing of the report.
cknowledgmenthe authors thank Michelle Zhang for assistance with
tatistical analyses.

RHOo
R
1
1
1
1
1
1
1
1
1
1
2
2
2
2
2
2
2
2
2
2
3
3
Kp
F
627JACC Vol. 57, No. 5, 2011 Chow et al.February 1, 2011:619–627 Parental History and Myocardial Infarction
eprint request and correspondence: Dr. Clara K. Chow,amilton General Hospital, 237 Barton Street East, Hamilton,ntario L8L 2X2, Canada. E-mail: cchow@georgeinstitute.
rg.au.
EFERENCES
1. Colditz GA, Rimm EB, Giovannucci E, Stampfer MJ, Rosner B,Willett WC. A prospective study of parental history of myocardialinfarction and coronary artery disease in men. Am J Cardiol1991;67:933–8.
2. Hawe E, Talmud PJ, Miller GJ, Humphries SE. Family history isa coronary heart disease risk factor in the Second Northwick ParkHeart Study. Ann Hum Genet 2003;67:97–106.
3. Silberberg JS, Wlodarczyk J, Fryer J, Robertson R, Hensley MJ.Risk associated with various definitions of family history of coronaryheart disease. The Newcastle Family History Study II. Am JEpidemiol 1998;147:1133–9.
4. Leander K, Hallqvist J, Reuterwall C, Ahlbom A, de Faire U.Family history of coronary heart disease, a strong risk factor formyocardial infarction interacting with other cardiovascular riskfactors: results from the Stockholm Heart Epidemiology Program(SHEEP). Epidemiology 2001;12:215–21.
5. Roncaglioni MC, Santoro L, D’Avanzo B, et al. Role of familyhistory in patients with myocardial infarction. An Italian case-control study. GISSI-EFRIM Investigators. Circulation 1992;85:2065–72.
6. Hunt SC, Williams RR, Barlow GK. A comparison of positivefamily history definitions for defining risk of future disease.J Chronic Dis 1986;39:809–21.
7. Sesso HD, Lee IM, Gaziano JM, Rexrode KM, Glynn RJ, BuringJE. Maternal and paternal history of myocardial infarction and riskof cardiovascular disease in men and women. Circulation 2001;104:393–8.
8. Jousilahti P, Puska P, Vartiainen E, Pekkanen J, Tuomilehto J.Parental history of premature coronary heart disease: an indepen-dent risk factor of myocardial infarction. J Clin Epidemiol 1996;49:497–503.
9. Lloyd-Jones DM, Nam BH, D’Agostino RB, Sr., et al. Parentalcardiovascular disease as a risk factor for cardiovascular disease inmiddle-aged adults: a prospective study of parents and offspring.JAMA 2004;291:2204–11.
0. Mayer B, Erdmann J, Schunkert H. Genetics and heritability ofcoronary artery disease and myocardial infarction. Clin Res Cardiol2007;96:1–7.
1. Topol EJ, Smith J, Plow EF, Wang QK. Genetic susceptibility tomyocardial infarction and coronary artery disease. Hum Mol Genet2006;15:R117–23.
2. Scheuner MT. Genetic evaluation for coronary artery disease.Genet Med 2003;5:269–85.
3. Yusuf S, Hawken S, Ounpuu S, et al. Effect of potentiallymodifiable risk factors associated with myocardial infarction in 52countries (the INTERHEART study): case-control study. Lancet2004;364:937–52.
4. Rosengren A, Hawken S, Ounpuu S, et al. Association of psycho-social risk factors with risk of acute myocardial infarction in 11119cases and 13648 controls from 52 countries (the INTERHEARTstudy): case-control study. Lancet 2004;364:953–62.
5. McQueen MJ, Hawken S, Wang X, et al. Lipids, lipoproteins, andapolipoproteins as risk markers of myocardial infarction in 52
countries (the INTERHEART study): a case-control study. Lancet2008;372:224–33.
6. Pare G, Serre D, Brisson D, et al. Genetic analysis of 103 candidate genesfor coronary artery disease and associated phenotypes in a founder popu-lation reveals a new association between endothelin-1 and high-densitylipoprotein cholesterol. Am J Hum Genet 2007;80:673–82.
7. Pastinen T, Perola M, Niini P, et al. Array-based multiplex analysisof candidate genes reveals two independent and additive genetic riskfactors for myocardial infarction in the Finnish population. HumMol Genet 1998;7:1453–62.
8. Alexandrie AK, Sundberg MI, Seidegard J, Tornling G, Rannug A.Genetic susceptibility to lung cancer with special emphasis onCYP1A1 and GSTM1: a study on host factors in relation to age atonset, gender and histological cancer types. Carcinogenesis 1994;15:1785–90.
9. Kathiresan S, Melander O, Anevski D, et al. Polymorphismsassociated with cholesterol and risk of cardiovascular events. N EnglJ Med 2008;358:1240–9.
0. The World Bank. Available at: http://www.worldbank.org. Ac-cessed December 21, 2010.
1. Anderson KM, Odell PM, Wilson PW, Kannel WB. Cardiovas-cular disease risk profiles. Am Heart J 1991;121:293–8.
2. Nasir K, Budoff MJ, Wong ND, et al. Family history of prematurecoronary heart disease and coronary artery calcification: Multi-Ethnic Study of Atherosclerosis (MESA). Circulation 2007;116:619–26.
3. Scheuner MT, Whitworth WC, McGruder H, Yoon PW, KhouryMJ. Expanding the definition of a positive family history forearly-onset coronary heart disease. Genet Med 2006;8:491–501.
4. Scheuner MT, Whitworth WC, McGruder H, Yoon PW, KhouryMJ. Familial risk assessment for early-onset coronary heart disease.Genet Med 2006;8:525–31.
5. Kuzawa CW, Sweet E. Epigenetics and the embodiment of race:developmental origins of US racial disparities in cardiovascularhealth. Am J Hum Biol 2009;21:2–15.
6. Myocardial Infarction Genetics Consortium, Kathiresan S, VoightBF, Purcell S, et al. Genome-wide association of early-onsetmyocardial infarction with single nucleotide polymorphisms andcopy number variants. Nat Genet 2009;41:334–41.
7. Samani NJ, Deloukas P, Erdmann J, et al. Large scale associationanalysis of novel genetic loci for coronary artery disease. ArteriosclerThromb Vasc Biol 2009;29:774–80.
8. Marenberg ME, Risch N, Berkman LF, Floderus B, de Faire U.Genetic susceptibility to death from coronary heart disease in astudy of twins. N Engl J Med 1994;330:1041–6.
9. Chow CK, Pell AC, Walker A, O’Dowd C, Dominiczak AF, Pell JP.Families of patients with premature coronary heart disease: an obviousbut neglected target for primary prevention. BMJ 2007;335:481–5.
0. Murabito JM, Nam BH, D’Agostino RB Sr., Lloyd-Jones DM,O’Donnell CJ, Wilson PW. Accuracy of offspring reports ofparental cardiovascular disease history: the Framingham OffspringStudy. Ann Intern Med 2004;140:434–40.
1. Khoury MJ, Beaty TH, Cohen BH. Genetic Approaches to FamilialAggregation I. Analysis of heritability Fundamentals of GeneticEpidemiology. New York: Oxford University Press; 1993:172–4.
ey Words: family history y genetics y myocardial infarction yarental history.
APPENDIX
or supplemental tables, please see the online version of this article.
doi:10.1016/j.jacc.2010.07.054