Parametric model of a polymeric chemoresistor for use in smart sensor design and simulation
11
Parametric model of a polymeric chemoresistor for use in smart sensor design and simulation Marina Cole a, * , Nicola Ulivieri b , Jesu ´s Garcı ´a-Guzma `n a , Julian W. Gardner a a Smart Sensors and Devices Group, School of Engineering, University of Warwick, Coventry CV4 7AL, UK b Department of Information Engineering, Universita ´ di Siena, Siena, Italy Received 1 December 2002; revised 17 February 2003; accepted 25 February 2003 Abstract A novel parametric model of a polymeric chemoresistor is proposed for application in the design and simulation of smart gas sensors. The model has been implemented using Cadencee software and enables the simulation of both the static and dynamic response of a chemoresistor to a mixture of different gases. It also takes into account parametrically the effects of ambient temperature, humidity and sensor noise. The layout design and a schematic symbol have also been generated in Cadence -thus creating a resistive polymeric cell that can be used in the general design of smart ASIC based systems. The top cell comprises several sub-cells allowing versatility and adaptability in implementation through its modular structure. By changing the values of the simulation parameters and/or the mathematical model of the sub-cell that evaluates the gas sensor response, it is possible to extend its application to the design and simulation of chemoresistors in different configurations and with different gas sensitive materials. Here we illustrate our model in the design and simulation of resistive sensors employing carbon-black polymer composite films as the class of gas sensitive material. q 2003 Elsevier Science Ltd. All rights reserved. Keywords: Resistive gas sensors; Smart sensors; ASICs; Carbon-black polymer composites; Parametric model 1. Introduction Sensors, based on conducting polymer resistors, are very attractive for vapour/odour sensing applications because of the wide range of available polymer combinations and their ease of deposition, their ability to operate at room temperature (i.e. low device power consumption), and sensitivity to a broad range of volatile organic compounds [1–3]. The resistive principle, in which a change in the sensor resistance DR S is monitored while the sensor is exposed to the gas, is the most commonly used principle within the field of vapour/odour sensing [2,4–7,9]. However, there are some disadvantages commonly associ- ated with polymeric chemoresistors, in particular the batch- to-batch variation in baseline resistance and its large temperature and humidity coefficients. There can also be a long-term drift effect, associated especially with conducting polymer resistors, when driven by constant d.c. voltage. A small signal-to-noise ratio, common for most types of gas sensors, is another parameter that cannot be neglected. Different measurement techniques have been used to improve the resistive gas sensor performance. For instance, transient and dynamic sensor responses [1,10 – 13] can be monitored and used to extract information that can improve the gas recognition performance. Also high-frequency a.c. measurements can be employed to improve sensor sensi- tivity [14–16]. However, a fundamental understanding of the response of polymer film sensors to different gas species under different conditions and with different interferences is essential to ameliorate the undesirable features commonly associated with gas sensor signals as mentioned above. Development of parametric models for polymeric chemoresistors can help in the design of new devices with improved characteristics and in the interpretation of experimental data. An absorption/desorption model for d.c. conducting polymer sensors consisting of a thin uniform polymer film deposited on a pair of finite coplanar electrodes supported by an insulating substrate was presented in Ref. [17]. The diffusion and adsorption equations were presented in terms of several fundamental dimensionless parameters describing the underlying 0026-2692/03/$ - see front matter q 2003 Elsevier Science Ltd. All rights reserved. doi:10.1016/S0026-2692(03)00131-9 Microelectronics Journal 34 (2003) 865–875 www.elsevier.com/locate/mejo * Corresponding author. Fax: þ 44-1203-418922. E-mail address: [email protected] (M. Cole).
-
Upload
independent -
Category
Documents
-
view
0 -
download
0
Transcript of Parametric model of a polymeric chemoresistor for use in smart sensor design and simulation
Parametric model of a polymeric chemoresistor for use
in smart sensor design and simulation
Marina Colea,*, Nicola Ulivierib, Jesus Garcıa-Guzmana, Julian W. Gardnera
aSmart Sensors and Devices Group, School of Engineering, University of Warwick, Coventry CV4 7AL, UKbDepartment of Information Engineering, Universita di Siena, Siena, Italy
Received 1 December 2002; revised 17 February 2003; accepted 25 February 2003
Abstract
A novel parametric model of a polymeric chemoresistor is proposed for application in the design and simulation of smart gas sensors. The
model has been implemented using Cadencee software and enables the simulation of both the static and dynamic response of a
chemoresistor to a mixture of different gases. It also takes into account parametrically the effects of ambient temperature, humidity and
sensor noise. The layout design and a schematic symbol have also been generated in Cadence -thus creating a resistive polymeric cell that can
be used in the general design of smart ASIC based systems. The top cell comprises several sub-cells allowing versatility and adaptability in
implementation through its modular structure. By changing the values of the simulation parameters and/or the mathematical model of the
sub-cell that evaluates the gas sensor response, it is possible to extend its application to the design and simulation of chemoresistors in
different configurations and with different gas sensitive materials. Here we illustrate our model in the design and simulation of resistive
sensors employing carbon-black polymer composite films as the class of gas sensitive material.
q 2003 Elsevier Science Ltd. All rights reserved.
Keywords: Resistive gas sensors; Smart sensors; ASICs; Carbon-black polymer composites; Parametric model
1. Introduction
Sensors, based on conducting polymer resistors, are very
attractive for vapour/odour sensing applications because of
the wide range of available polymer combinations and their
ease of deposition, their ability to operate at room
temperature (i.e. low device power consumption), and
sensitivity to a broad range of volatile organic compounds
[1–3]. The resistive principle, in which a change in the
sensor resistance DRS is monitored while the sensor is
exposed to the gas, is the most commonly used principle
within the field of vapour/odour sensing [2,4 – 7,9].
However, there are some disadvantages commonly associ-
ated with polymeric chemoresistors, in particular the batch-
to-batch variation in baseline resistance and its large
temperature and humidity coefficients. There can also be a
long-term drift effect, associated especially with conducting
polymer resistors, when driven by constant d.c. voltage. A
small signal-to-noise ratio, common for most types of gas
sensors, is another parameter that cannot be neglected.
Different measurement techniques have been used to
improve the resistive gas sensor performance. For instance,
transient and dynamic sensor responses [1,10–13] can be
monitored and used to extract information that can improve
the gas recognition performance. Also high-frequency a.c.
measurements can be employed to improve sensor sensi-
tivity [14–16]. However, a fundamental understanding of
the response of polymer film sensors to different gas species
under different conditions and with different interferences is
essential to ameliorate the undesirable features commonly
associated with gas sensor signals as mentioned above.
Development of parametric models for polymeric
chemoresistors can help in the design of new devices with
improved characteristics and in the interpretation of
experimental data. An absorption/desorption model for
d.c. conducting polymer sensors consisting of a thin uniform
polymer film deposited on a pair of finite coplanar
electrodes supported by an insulating substrate was
presented in Ref. [17]. The diffusion and adsorption
equations were presented in terms of several fundamental
dimensionless parameters describing the underlying
0026-2692/03/$ - see front matter q 2003 Elsevier Science Ltd. All rights reserved.
doi:10.1016/S0026-2692(03)00131-9
Microelectronics Journal 34 (2003) 865–875
www.elsevier.com/locate/mejo
* Corresponding author. Fax: þ44-1203-418922.
E-mail address: [email protected] (M. Cole).
chemical and physical properties of the sensor. In another
development electrical equivalent models for resistive gas
and odour sensors have been developed using Pspice [18,
19]. Furthermore, the advances and benefits of the IC
technology can be exploited in the development of
integrated, low-cost, reliable devices capable of addressing
problems associated with discrete chemoresistive sensors.
This could be achieved through the design of smart sensors
capable of self-testing, self-calibration and compensation
within a single chip unit.
In this paper we present a parametric model of a
polymeric chemoresistor developed for use in the design
and simulation of smart gas/odour sensor systems. The
model is implemented in Cadence software together with
associated schematic, symbol and layout design; thus
allowing both the implementation of resistive elements in
smart sensor design and the simulation of the chemical static
response and chemical step response of a polymeric
chemoresistor to a mixture of different gases. The model
takes into account temperature and humidity effects and
simulates the noise present in polymer sensors, such as
Johnson [20] and flicker or 1/f noise [21–23]. The new
model also takes into account sample delivery system (SDS)
parameters, such as the volumetric flow rate and volume of
the sensor chamber that can be customised to specific
experimental set-ups.
Polymer-carbon black composite films are used here as
gas sensitive materials both to demonstrate the practical
application of the new model in the design of polymeric
chemoresistors and to simulate their behaviour. The films,
firstly reported by Lewis at Caltech, consist of conducting
carbon black nanospheres dispersed into a non-conducting
base polymer films [4–7]. When exposed to gases, the
polymer within the composite film absorbs the vapour and
swells reversibly. This swelling causes the distances
between the conductive carbon black particles to increase
and thus, induces a resistance change in the composite film
[4,6]. Carbon black polymer composite film-based sensors
are not selective toward a specific gas but they show
different sensitivities to different gases. However the pattern
response of an array of several sensors made up by different
polymer composite films can be used as a ‘fingerprint’ to
classify different gas or chemical mixture [1,8].
2. Architecture of the standard cell
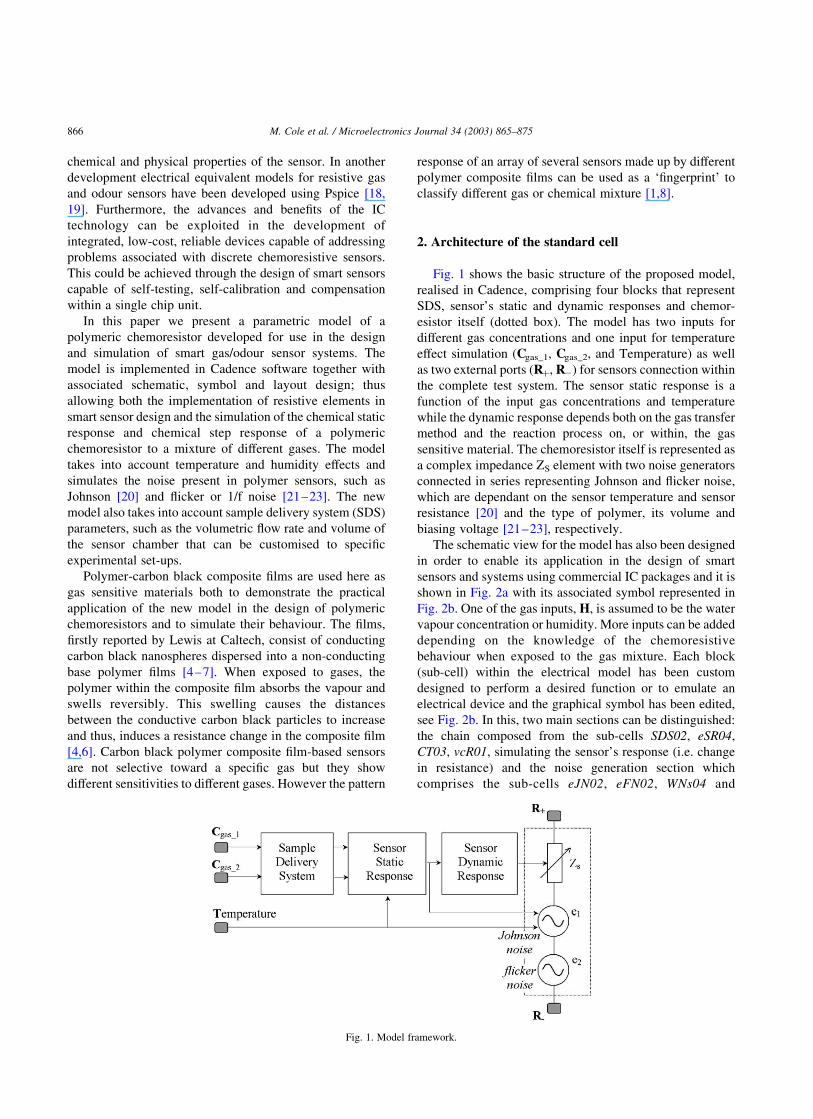
Fig. 1 shows the basic structure of the proposed model,
realised in Cadence, comprising four blocks that represent
SDS, sensor’s static and dynamic responses and chemor-
esistor itself (dotted box). The model has two inputs for
different gas concentrations and one input for temperature
effect simulation (Cgas_1, Cgas_2, and Temperature) as well
as two external ports (Rþ, R2) for sensors connection within
the complete test system. The sensor static response is a
function of the input gas concentrations and temperature
while the dynamic response depends both on the gas transfer
method and the reaction process on, or within, the gas
sensitive material. The chemoresistor itself is represented as
a complex impedance ZS element with two noise generators
connected in series representing Johnson and flicker noise,
which are dependant on the sensor temperature and sensor
resistance [20] and the type of polymer, its volume and
biasing voltage [21–23], respectively.
The schematic view for the model has also been designed
in order to enable its application in the design of smart
sensors and systems using commercial IC packages and it is
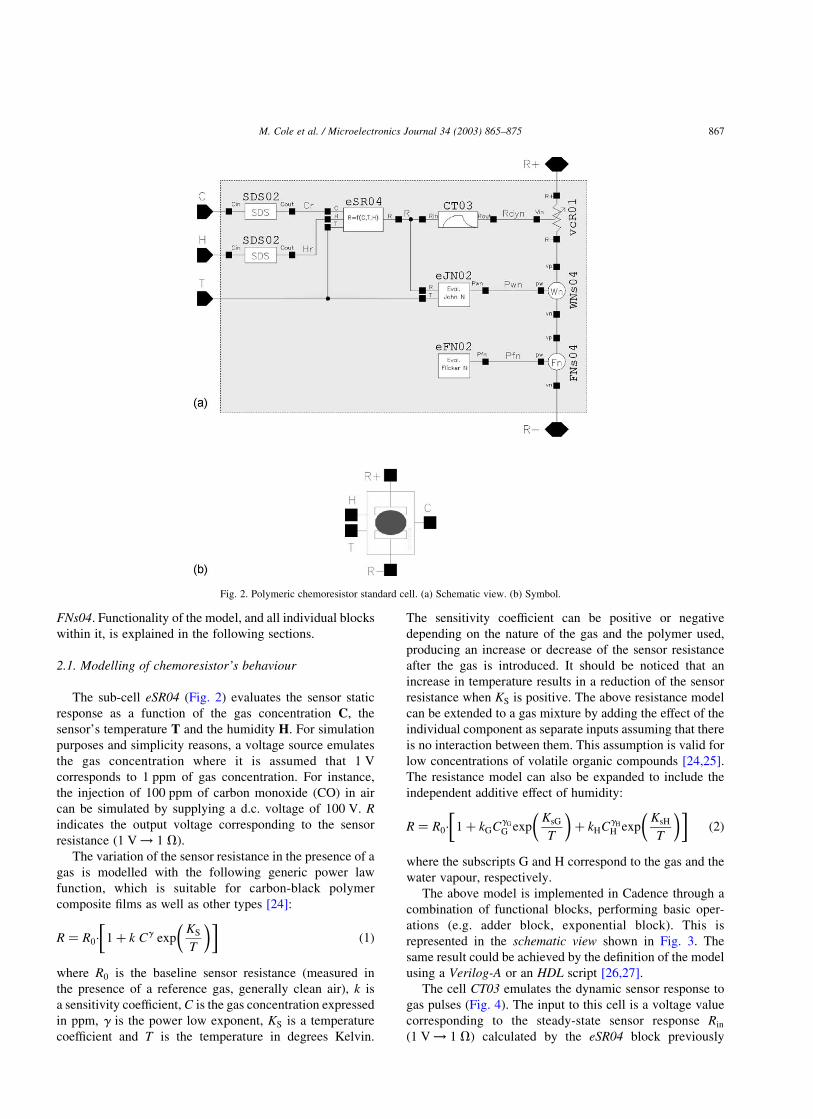
shown in Fig. 2a with its associated symbol represented in
Fig. 2b. One of the gas inputs, H, is assumed to be the water
vapour concentration or humidity. More inputs can be added
depending on the knowledge of the chemoresistive
behaviour when exposed to the gas mixture. Each block
(sub-cell) within the electrical model has been custom
designed to perform a desired function or to emulate an
electrical device and the graphical symbol has been edited,
see Fig. 2b. In this, two main sections can be distinguished:
the chain composed from the sub-cells SDS02, eSR04,
CT03, vcR01, simulating the sensor’s response (i.e. change
in resistance) and the noise generation section which
comprises the sub-cells eJN02, eFN02, WNs04 and
Fig. 1. Model framework.
M. Cole et al. / Microelectronics Journal 34 (2003) 865–875866
FNs04. Functionality of the model, and all individual blocks
within it, is explained in the following sections.
2.1. Modelling of chemoresistor’s behaviour
The sub-cell eSR04 (Fig. 2) evaluates the sensor static
response as a function of the gas concentration C, the
sensor’s temperature T and the humidity H. For simulation
purposes and simplicity reasons, a voltage source emulates
the gas concentration where it is assumed that 1 V
corresponds to 1 ppm of gas concentration. For instance,
the injection of 100 ppm of carbon monoxide (CO) in air
can be simulated by supplying a d.c. voltage of 100 V. R
indicates the output voltage corresponding to the sensor
resistance (1 V ! 1 V).
The variation of the sensor resistance in the presence of a
gas is modelled with the following generic power law
function, which is suitable for carbon-black polymer
composite films as well as other types [24]:
R ¼ R0· 1 þ k Cg expKS
T
� �� �ð1Þ
where R0 is the baseline sensor resistance (measured in
the presence of a reference gas, generally clean air), k is
a sensitivity coefficient, C is the gas concentration expressed
in ppm, g is the power low exponent, KS is a temperature
coefficient and T is the temperature in degrees Kelvin.
The sensitivity coefficient can be positive or negative
depending on the nature of the gas and the polymer used,
producing an increase or decrease of the sensor resistance
after the gas is introduced. It should be noticed that an
increase in temperature results in a reduction of the sensor
resistance when KS is positive. The above resistance model
can be extended to a gas mixture by adding the effect of the
individual component as separate inputs assuming that there
is no interaction between them. This assumption is valid for
low concentrations of volatile organic compounds [24,25].
The resistance model can also be expanded to include the
independent additive effect of humidity:
R ¼ R0· 1 þ kGCgG
G expKsG
T
� �þ kHC
gH
H expKsH
T
� �� �ð2Þ
where the subscripts G and H correspond to the gas and the
water vapour, respectively.
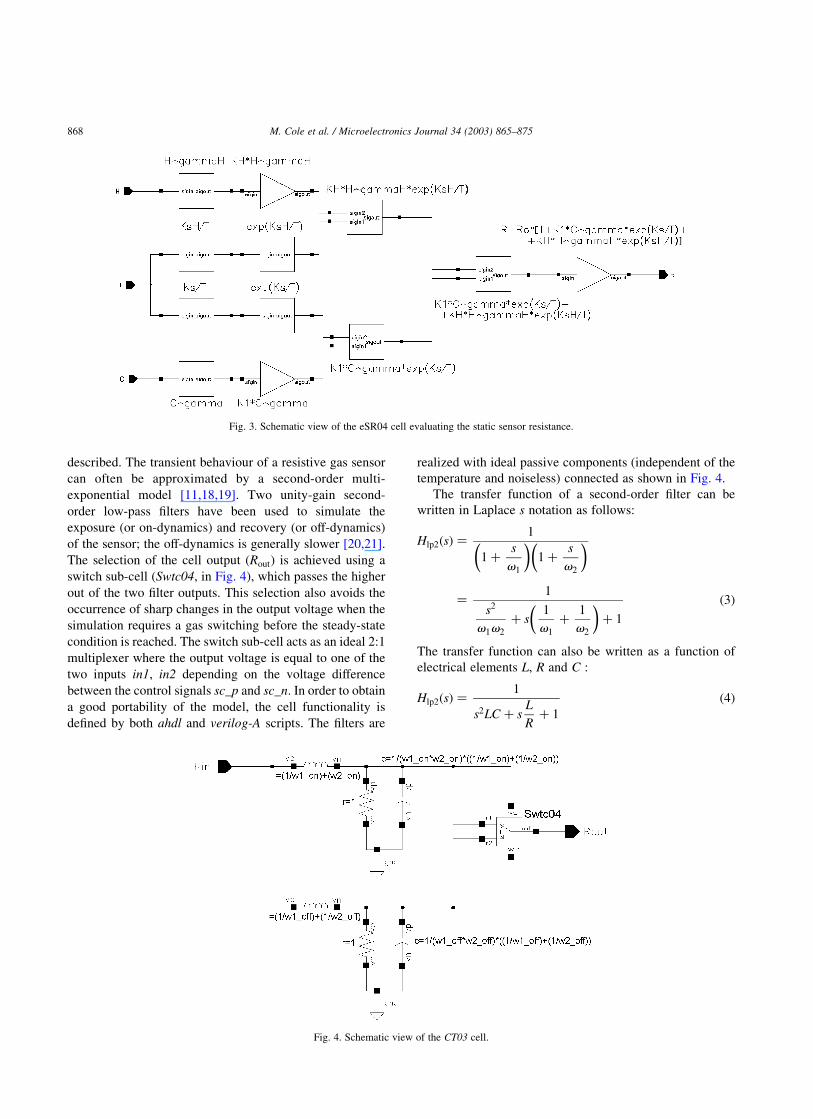
The above model is implemented in Cadence through a
combination of functional blocks, performing basic oper-
ations (e.g. adder block, exponential block). This is
represented in the schematic view shown in Fig. 3. The
same result could be achieved by the definition of the model
using a Verilog-A or an HDL script [26,27].
The cell CT03 emulates the dynamic sensor response to
gas pulses (Fig. 4). The input to this cell is a voltage value
corresponding to the steady-state sensor response Rin
(1 V ! 1 V) calculated by the eSR04 block previously
Fig. 2. Polymeric chemoresistor standard cell. (a) Schematic view. (b) Symbol.
M. Cole et al. / Microelectronics Journal 34 (2003) 865–875 867
described. The transient behaviour of a resistive gas sensor
can often be approximated by a second-order multi-
exponential model [11,18,19]. Two unity-gain second-
order low-pass filters have been used to simulate the
exposure (or on-dynamics) and recovery (or off-dynamics)
of the sensor; the off-dynamics is generally slower [20,21].
The selection of the cell output ðRoutÞ is achieved using a
switch sub-cell (Swtc04, in Fig. 4), which passes the higher
out of the two filter outputs. This selection also avoids the
occurrence of sharp changes in the output voltage when the
simulation requires a gas switching before the steady-state
condition is reached. The switch sub-cell acts as an ideal 2:1
multiplexer where the output voltage is equal to one of the
two inputs in1, in2 depending on the voltage difference
between the control signals sc_p and sc_n. In order to obtain
a good portability of the model, the cell functionality is
defined by both ahdl and verilog-A scripts. The filters are
realized with ideal passive components (independent of the
temperature and noiseless) connected as shown in Fig. 4.
The transfer function of a second-order filter can be
written in Laplace s notation as follows:
Hlp2ðsÞ ¼1
1 þs
v1
� �1 þ
s
v2
� �
¼1
s2
v1v2
þ s1
v1
þ1
v2
� �þ 1
ð3Þ
The transfer function can also be written as a function of
electrical elements L; R and C :
Hlp2ðsÞ ¼1
s2LC þ sL
Rþ 1
ð4Þ
Fig. 4. Schematic view of the CT03 cell.
Fig. 3. Schematic view of the eSR04 cell evaluating the static sensor resistance.
M. Cole et al. / Microelectronics Journal 34 (2003) 865–875868
where
L
R¼
1
v1
þ1
v2
� �; LC ¼
1
v1v2
R ¼ 1V ð5Þ
The cell acts as a functional block with no current flowing
from the input to output terminal. The resistance R can have
a value assigned to, e.g. 1 V, and the filter cut-off frequency
can then be determined calculating the C and L values which
are included in the model using following equations:
L ¼1
v1
þ1
v2
� �; C ¼
1v1v2
1v1
þ 1v2
� � R ¼ 1V ð6Þ
Thus, the cell requires only the values of v1off ; v2off ; v1on;
and v2on where on and off refer to on- and off-dynamics of
the chemoresistor.
The sub-cell vcR01 (Fig. 2) is a voltage-controlled
resistance implemented in the model via the following
formula,
IRþR2¼ ðVRþ 2 VR2Þ=Vin ð7Þ
where Vin is the input voltage corresponding to the
simulated resistance value, IRþR2is the current flowing
from the terminal Rþ to the terminal R2 and VRþ;VR2
are,
respectively the voltages at the terminals Rþ and R2.
Since the dynamic system is composed of the sensor
itself and the SDS, a sub-cell SDS02 (Fig. 2) simulating the
gas transfer behaviour is also included in the model. Gas
transfer methods can be divided into two main categories
called headspace sampling and flow injection, but various
other methods can also be used [1,28]. In the former case the
headspace of an odorant material to be analysed is
physically removed from a sample vessel and injected into
a gas-tight chamber hosting gas sensors using either a
manual or automated procedure. In the case of flow
injection, a carrier gas can be used to carry the odorant
from the sample vessel into the sensor chamber. It can be
approximated that in the case of static headspace sampling
the actual gas flow behaves like the output of a unity-gain
first-order low pass filter where the input is an ideal voltage
pulse. Therefore, the structure of the cell SDS02 is very
similar the one of the cell CT03 where the two 2nd order
filters are replaced by two 1st order filters with different
poles to emulate different on-and off-dynamics. A further
switch sub-cell (Swtc04) and a voltage source are included
to allow the internal bypass of the SDS02 cell by setting the
voltage level to a negative value.
2.2. Noise model
Signals from gas sensors are often weak, noisy, and they
exhibit parametric drift and contain undesirable com-
ponents. The new model takes into account the presence
of noise in terms of both Johnson noise and flicker noise.
The noise factor is very important since the point at which
the signal-to-noise ratio drops below an acceptable level
sets the limit or resolution of an electrical circuit and
therefore the sensor system itself. Thermal (Johnson) noise,
caused by the thermal agitation of charge carriers (electrons
or holes) is present in all passive resistive elements [20].
The Johnson noise is spectrally flat and its root mean
squared (rms) voltage density, VJN; can be expressed as
follows:
VJN ¼ ð4kTRBÞ1=2 ð8Þ
where k is Boltzmann’s constant (1.38 £ 10223 J/K), T is the
absolute temperature in Kelvin (K), R is the resistance of the
conductor in ohms (V) and B is the bandwidth (Hz). The term
4kTR is a voltagepower density having units of V2/Hz. Thermal
noise is a fundamental lower limit on the noise of any device of
resistance R; and its magnitude is independent of the volume or
of other fabrication-dependent properties of the resistor.
In carbon-black polymer composite chemoresistors,
additional noise is observed with a power spectral density
that displays an inverse dependence on frequency of the form
1=f exp where the exponent exp is usually close to the unity but
different slopes have been observed in different materials.
Such noise is called flicker noise or 1=f noise and is associated
with the d.c. bias voltage applied to the resistor [20]. The
power spectral density of the 1=f noise scales with the square
of the bias voltage. Further factors that affect the level of
the 1=f noise in carbon black-polymer composite resistors are
the structure of the carbon black, its volume fraction in the
composite, the type of insulator, the resistivity of the
composite, and the method of resistor preparation [21–23].
The power density of the 1/f noise in carbon-black polymer
films is proportional to the resistor volume when the
correlation length of the resistive particle network is small
compared to the physical length scale of interest [22,23].
The Johnson and 1=f noise effects are included in the
polymeric chemoresistor model presented in this paper via
series of noise sources (WNs04, FNs04 in Fig. 2) created
with both verilog-A and ahdl scripts. The scripts make use
of the noise functions white_noise( pw) and flicker_noi-
se( pf,slope). The created noise sources accept as an input
the voltage power density at 1 Hz ( pw, pf), which is
evaluated by other sub-cells (eJN02 and eFN02). The flicker
noise source has a further parameter, slope, which allows for
the slope definition of the 1=f slope noise. The value of slope is
stored in the FNs04 cell and it depends on the type of
chemoresistor implemented (usually is 1). The noise
functions are active only during small-signal analysis and
return 0 otherwise, and different noise models can be
implemented by changing the verilog-A or ahdl scripts.
3. Layout the design and equivalent circuit
3.1. Layout design
The layout of the chemoresistive sensor, modelled in
Section 2, was designed using the Virtuoso layout editor
M. Cole et al. / Microelectronics Journal 34 (2003) 865–875 869
according to the specifications and layout rules of the
Alcatel 0.7 mm CMOS process. This process was chosen
for possible implementation of our devices in smart sensor
design and low-cost fabrication through the Europractice
scheme. Fig. 5a shows the layout of the sensor electrodes
consisting of two square metal pads, while the cross section
of the carbon black polymer resistor is shown in Fig. 5b.
Minimum size dimensions were chosen for the pads while
the inter-electrode gap was chosen to be about 100 mm in
order to obtain a baseline sensor resistance of approxi-
mately 10 k V, based on the typical sheet resistances of
carbon-black polymers (RA ¼ 1 2 10 k V per sq. depend-
ing on the polymer thickness and the carbon black volume
fraction in the composite). There are two metal layers
available within the Alcatel 0.7 mm CMOS process. Both
of these layers are aluminium, but the ‘METAL 2’ layer
has a lower sheet resistance. It was decided to implement
the metal electrodes using the ‘METAL 2’ layer, which
requires an overlay opening to enable access for the
polymer deposition. This also has the advantage that other
layers can still be routed underneath this layer like a
‘METAL 1’ heater to ensure that the deposited polymer is
at the required temperature. Temperature control can be
achieved using a temperature sensor within the device (i.e.
temperature diode). Chemoresistors can also be constructed
from poly-Si or Pþ electrodes where a contact window
again has to be opened for possible electrochemical
deposition of electroactive polymers.
3.2. Equivalent circuit
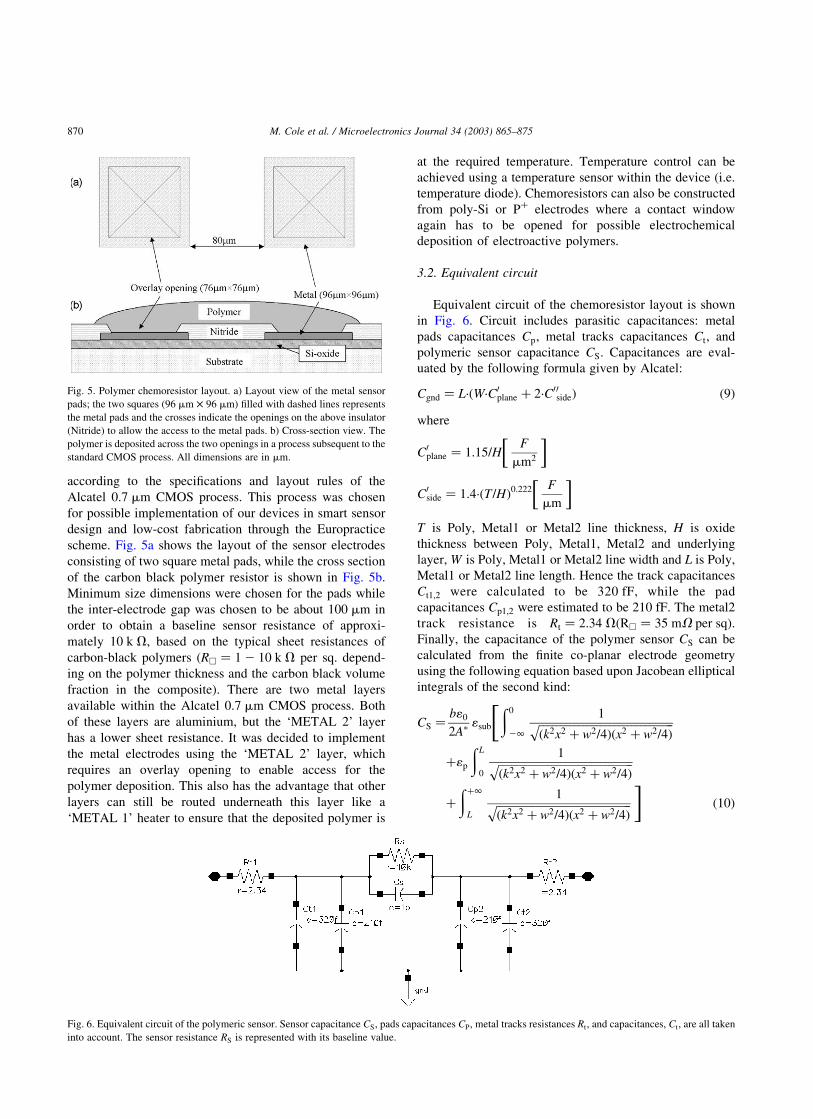
Equivalent circuit of the chemoresistor layout is shown
in Fig. 6. Circuit includes parasitic capacitances: metal
pads capacitances Cp; metal tracks capacitances Ct; and
polymeric sensor capacitance CS: Capacitances are eval-
uated by the following formula given by Alcatel:
Cgnd ¼ L·ðW·C0plane þ 2·C0 0
sideÞ ð9Þ
where
C0plane ¼ 1:15=H
F
mm2
� �
C0side ¼ 1:4·ðT=HÞ0:222 F
mm
� �
T is Poly, Metal1 or Metal2 line thickness, H is oxide
thickness between Poly, Metal1, Metal2 and underlying
layer, W is Poly, Metal1 or Metal2 line width and L is Poly,
Metal1 or Metal2 line length. Hence the track capacitances
Ct1;2 were calculated to be 320 fF, while the pad
capacitances Cp1;2 were estimated to be 210 fF. The metal2
track resistance is Rt ¼ 2:34 VðRA ¼ 35 mV per sqÞ:
Finally, the capacitance of the polymer sensor CS can be
calculated from the finite co-planar electrode geometry
using the following equation based upon Jacobean elliptical
integrals of the second kind:
CS ¼b10
2Ap1sub
ð0
21
1ffiffiffiffiffiffiffiffiffiffiffiffiffiffiffiffiffiffiffiffiffiffiffiffiffiffiffiffiffiffiffiðk2x2 þ w2=4Þðx2 þ w2=4Þ
p"
þ1p
ðL
0
1ffiffiffiffiffiffiffiffiffiffiffiffiffiffiffiffiffiffiffiffiffiffiffiffiffiffiffiffiffiffiffiðk2x2 þ w2=4Þðx2 þ w2=4Þ
pþðþ1
L
1ffiffiffiffiffiffiffiffiffiffiffiffiffiffiffiffiffiffiffiffiffiffiffiffiffiffiffiffiffiffiffiðk2x2 þ w2=4Þðx2 þ w2=4Þ
p#
ð10Þ
Fig. 5. Polymer chemoresistor layout. a) Layout view of the metal sensor
pads; the two squares (96 mm £ 96 mm) filled with dashed lines represents
the metal pads and the crosses indicate the openings on the above insulator
(Nitride) to allow the access to the metal pads. b) Cross-section view. The
polymer is deposited across the two openings in a process subsequent to the
standard CMOS process. All dimensions are in mm.
Fig. 6. Equivalent circuit of the polymeric sensor. Sensor capacitance CS; pads capacitances CP; metal tracks resistances Rt; and capacitances, Ct; are all taken
into account. The sensor resistance RS is represented with its baseline value.
M. Cole et al. / Microelectronics Journal 34 (2003) 865–875870
where b is the breadth of the electrodes, w is the separation
of the electrodes, L is the thickness of the polymer film, 10 is
the dielectric permittivity of free space, 1sub and 1p are the
dielectric constants of the substrate and polymer film, k is
the geometric parameter equal to w=ðw þ 2dÞ where d is the
depth of the electrodes, and finally Ap is another geometric
constant computed from the following complete elliptical
integral:
Ap ¼ðw=2
0
1ffiffiffiffiffiffiffiffiffiffiffiffiffiffiffiffiffiffiffiffiffiffiffiffiffiffiffiffiffiffiffiffiffiffiffiffið2k2x2 þ w2=4Þð2x2 þ w2=4Þ
p dx ð11Þ
The three integrals in Eq. (10) represent the capacitance
associated with the substrate, film and air. The first and third
terms will be largely the pad value provided above for
Metal1; the second term can be simplified when the
electrode separation w is smaller than the electrode depth
d and thus an approximate equation (excluding the pads) is
given by:
CS <b101p
pln
1 þffiffiffiffiffiffiffiffiffiffiffiffiffiffi1 þ w2=4L2
p
w=2L
" #
For, say, an electrode breadth b ¼ 100 mm; width w ¼
100 mm; film thickness L ¼ 10 mm and dielectric constant
1p equal to 10, the capacitance associated with the film is
only 0.70 fF. So the sensor capacitance is dominated by
the parasitic capacitance of the two electrode pads, which is
a total of 420 fF, rather than the inter-electrode capacitance.
4. Simulation results
The model described in the above section was verified
and used to simulate the behaviour of carbon-black polymer
composite sensors when exposed to a single gas or mixture
of gases. The complete cell comprising a chemoresistor
model, schematic representation and a layout design, was
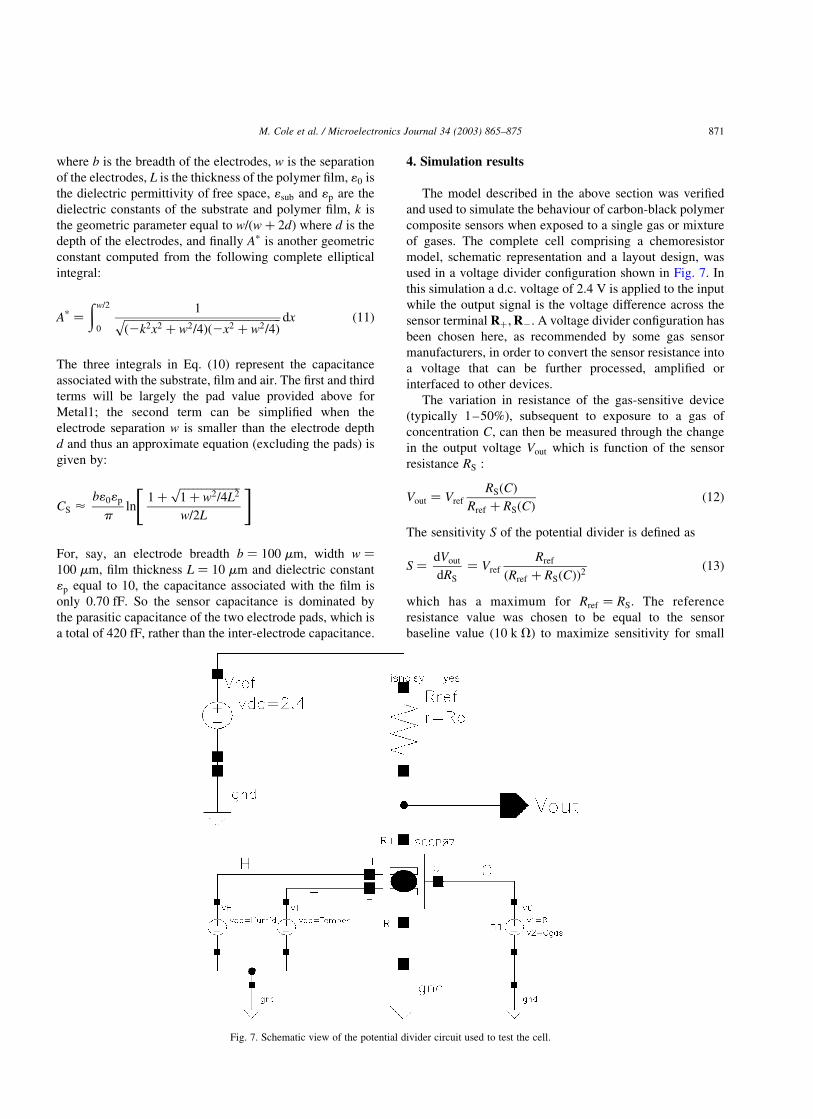
used in a voltage divider configuration shown in Fig. 7. In
this simulation a d.c. voltage of 2.4 V is applied to the input
while the output signal is the voltage difference across the
sensor terminal Rþ;R2: A voltage divider configuration has
been chosen here, as recommended by some gas sensor
manufacturers, in order to convert the sensor resistance into
a voltage that can be further processed, amplified or
interfaced to other devices.
The variation in resistance of the gas-sensitive device
(typically 1–50%), subsequent to exposure to a gas of
concentration C; can then be measured through the change
in the output voltage Vout which is function of the sensor
resistance RS :
Vout ¼ Vref
RSðCÞ
Rref þ RSðCÞð12Þ
The sensitivity S of the potential divider is defined as
S ¼dVout
dRS
¼ Vref
Rref
ðRref þ RSðCÞÞ2ð13Þ
which has a maximum for Rref ¼ RS: The reference
resistance value was chosen to be equal to the sensor
baseline value (10 k V) to maximize sensitivity for small
Fig. 7. Schematic view of the potential divider circuit used to test the cell.
M. Cole et al. / Microelectronics Journal 34 (2003) 865–875 871
changes of RS: Gases injection and sensor temperature are
simulated by voltage sources.
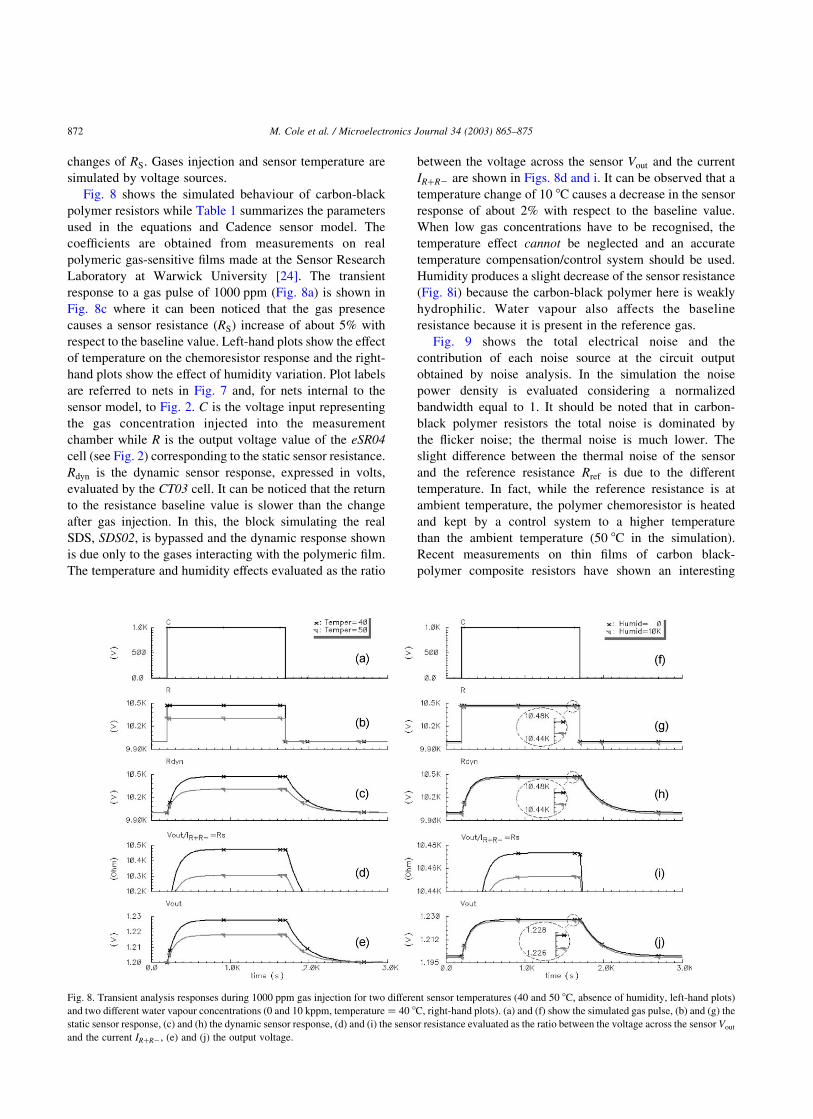
Fig. 8 shows the simulated behaviour of carbon-black
polymer resistors while Table 1 summarizes the parameters
used in the equations and Cadence sensor model. The
coefficients are obtained from measurements on real
polymeric gas-sensitive films made at the Sensor Research
Laboratory at Warwick University [24]. The transient
response to a gas pulse of 1000 ppm (Fig. 8a) is shown in
Fig. 8c where it can been noticed that the gas presence
causes a sensor resistance (RS) increase of about 5% with
respect to the baseline value. Left-hand plots show the effect
of temperature on the chemoresistor response and the right-
hand plots show the effect of humidity variation. Plot labels
are referred to nets in Fig. 7 and, for nets internal to the
sensor model, to Fig. 2. C is the voltage input representing
the gas concentration injected into the measurement
chamber while R is the output voltage value of the eSR04
cell (see Fig. 2) corresponding to the static sensor resistance.
Rdyn is the dynamic sensor response, expressed in volts,
evaluated by the CT03 cell. It can be noticed that the return
to the resistance baseline value is slower than the change
after gas injection. In this, the block simulating the real
SDS, SDS02, is bypassed and the dynamic response shown
is due only to the gases interacting with the polymeric film.
The temperature and humidity effects evaluated as the ratio
between the voltage across the sensor Vout and the current
IRþR2 are shown in Figs. 8d and i. It can be observed that a
temperature change of 10 8C causes a decrease in the sensor
response of about 2% with respect to the baseline value.
When low gas concentrations have to be recognised, the
temperature effect cannot be neglected and an accurate
temperature compensation/control system should be used.
Humidity produces a slight decrease of the sensor resistance
(Fig. 8i) because the carbon-black polymer here is weakly
hydrophilic. Water vapour also affects the baseline
resistance because it is present in the reference gas.
Fig. 9 shows the total electrical noise and the
contribution of each noise source at the circuit output
obtained by noise analysis. In the simulation the noise
power density is evaluated considering a normalized
bandwidth equal to 1. It should be noted that in carbon-
black polymer resistors the total noise is dominated by
the flicker noise; the thermal noise is much lower. The
slight difference between the thermal noise of the sensor
and the reference resistance Rref is due to the different
temperature. In fact, while the reference resistance is at
ambient temperature, the polymer chemoresistor is heated
and kept by a control system to a higher temperature
than the ambient temperature (50 8C in the simulation).
Recent measurements on thin films of carbon black-
polymer composite resistors have shown an interesting
Fig. 8. Transient analysis responses during 1000 ppm gas injection for two different sensor temperatures (40 and 50 8C, absence of humidity, left-hand plots)
and two different water vapour concentrations (0 and 10 kppm, temperature ¼ 40 8C, right-hand plots). (a) and (f) show the simulated gas pulse, (b) and (g) the
static sensor response, (c) and (h) the dynamic sensor response, (d) and (i) the sensor resistance evaluated as the ratio between the voltage across the sensor Vout
and the current IRþR2; (e) and (j) the output voltage.
M. Cole et al. / Microelectronics Journal 34 (2003) 865–875872
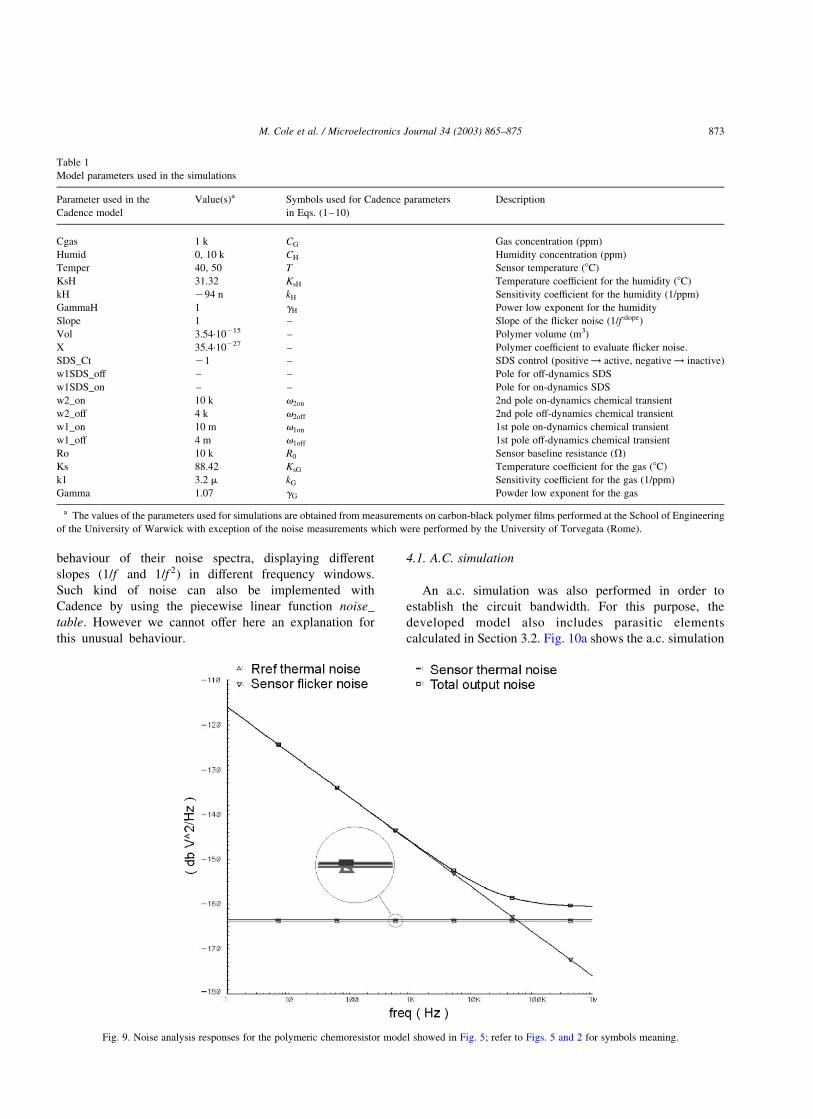
behaviour of their noise spectra, displaying different
slopes (1=f and 1=f 2) in different frequency windows.
Such kind of noise can also be implemented with
Cadence by using the piecewise linear function noise_
table. However we cannot offer here an explanation for
this unusual behaviour.
4.1. A.C. simulation
An a.c. simulation was also performed in order to
establish the circuit bandwidth. For this purpose, the
developed model also includes parasitic elements
calculated in Section 3.2. Fig. 10a shows the a.c. simulation
Fig. 9. Noise analysis responses for the polymeric chemoresistor model showed in Fig. 5; refer to Figs. 5 and 2 for symbols meaning.
Table 1
Model parameters used in the simulations
Parameter used in the
Cadence model
Value(s)a Symbols used for Cadence parameters
in Eqs. (1–10)
Description
Cgas 1 k CG Gas concentration (ppm)
Humid 0, 10 k CH Humidity concentration (ppm)
Temper 40, 50 T Sensor temperature (8C)
KsH 31.32 KsH Temperature coefficient for the humidity (8C)
kH 294 n kH Sensitivity coefficient for the humidity (1/ppm)
GammaH 1 gH Power low exponent for the humidity
Slope 1 – Slope of the flicker noise ð1=f slopeÞ
Vol 3.54·10215 – Polymer volume (m3)
X 35.4·10227 – Polymer coefficient to evaluate flicker noise.
SDS_Ct 21 – SDS control (positive ! active, negative ! inactive)
w1SDS_off – – Pole for off-dynamics SDS
w1SDS_on – – Pole for on-dynamics SDS
w2_on 10 k v2on 2nd pole on-dynamics chemical transient
w2_off 4 k v2off 2nd pole off-dynamics chemical transient
w1_on 10 m v1on 1st pole on-dynamics chemical transient
w1_off 4 m v1off 1st pole off-dynamics chemical transient
Ro 10 k R0 Sensor baseline resistance (V)
Ks 88.42 KsG Temperature coefficient for the gas (8C)
k1 3.2 m kG Sensitivity coefficient for the gas (1/ppm)
Gamma 1.07 gG Powder low exponent for the gas
a The values of the parameters used for simulations are obtained from measurements on carbon-black polymer films performed at the School of Engineering
of the University of Warwick with exception of the noise measurements which were performed by the University of Torvegata (Rome).
M. Cole et al. / Microelectronics Journal 34 (2003) 865–875 873
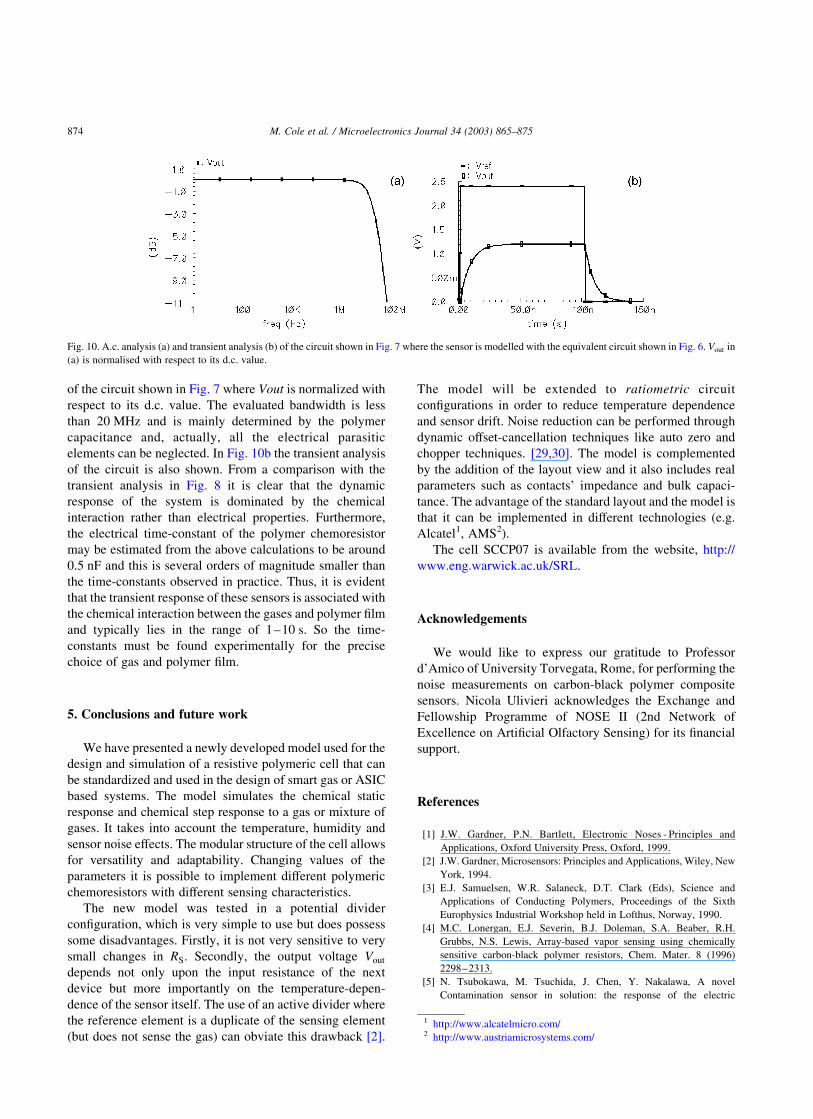
of the circuit shown in Fig. 7 where Vout is normalized with
respect to its d.c. value. The evaluated bandwidth is less
than 20 MHz and is mainly determined by the polymer
capacitance and, actually, all the electrical parasitic
elements can be neglected. In Fig. 10b the transient analysis
of the circuit is also shown. From a comparison with the
transient analysis in Fig. 8 it is clear that the dynamic
response of the system is dominated by the chemical
interaction rather than electrical properties. Furthermore,
the electrical time-constant of the polymer chemoresistor
may be estimated from the above calculations to be around
0.5 nF and this is several orders of magnitude smaller than
the time-constants observed in practice. Thus, it is evident
that the transient response of these sensors is associated with
the chemical interaction between the gases and polymer film
and typically lies in the range of 1–10 s. So the time-
constants must be found experimentally for the precise
choice of gas and polymer film.
5. Conclusions and future work
We have presented a newly developed model used for the
design and simulation of a resistive polymeric cell that can
be standardized and used in the design of smart gas or ASIC
based systems. The model simulates the chemical static
response and chemical step response to a gas or mixture of
gases. It takes into account the temperature, humidity and
sensor noise effects. The modular structure of the cell allows
for versatility and adaptability. Changing values of the
parameters it is possible to implement different polymeric
chemoresistors with different sensing characteristics.
The new model was tested in a potential divider
configuration, which is very simple to use but does possess
some disadvantages. Firstly, it is not very sensitive to very
small changes in RS: Secondly, the output voltage Vout
depends not only upon the input resistance of the next
device but more importantly on the temperature-depen-
dence of the sensor itself. The use of an active divider where
the reference element is a duplicate of the sensing element
(but does not sense the gas) can obviate this drawback [2].
The model will be extended to ratiometric circuit
configurations in order to reduce temperature dependence
and sensor drift. Noise reduction can be performed through
dynamic offset-cancellation techniques like auto zero and
chopper techniques. [29,30]. The model is complemented
by the addition of the layout view and it also includes real
parameters such as contacts’ impedance and bulk capaci-
tance. The advantage of the standard layout and the model is
that it can be implemented in different technologies (e.g.
Alcatel1, AMS2).
The cell SCCP07 is available from the website, http://
www.eng.warwick.ac.uk/SRL.
Acknowledgements
We would like to express our gratitude to Professor
d’Amico of University Torvegata, Rome, for performing the
noise measurements on carbon-black polymer composite
sensors. Nicola Ulivieri acknowledges the Exchange and
Fellowship Programme of NOSE II (2nd Network of
Excellence on Artificial Olfactory Sensing) for its financial
support.
References
[1] J.W. Gardner, P.N. Bartlett, Electronic Noses - Principles and
Applications, Oxford University Press, Oxford, 1999.
[2] J.W. Gardner, Microsensors: Principles and Applications, Wiley, New
York, 1994.
[3] E.J. Samuelsen, W.R. Salaneck, D.T. Clark (Eds), Science and
Applications of Conducting Polymers, Proceedings of the Sixth
Europhysics Industrial Workshop held in Lofthus, Norway, 1990.
[4] M.C. Lonergan, E.J. Severin, B.J. Doleman, S.A. Beaber, R.H.
Grubbs, N.S. Lewis, Array-based vapor sensing using chemically
sensitive carbon-black polymer resistors, Chem. Mater. 8 (1996)
2298–2313.
[5] N. Tsubokawa, M. Tsuchida, J. Chen, Y. Nakalawa, A novel
Contamination sensor in solution: the response of the electric
Fig. 10. A.c. analysis (a) and transient analysis (b) of the circuit shown in Fig. 7 where the sensor is modelled with the equivalent circuit shown in Fig. 6. Vout in
(a) is normalised with respect to its d.c. value.
1 http://www.alcatelmicro.com/2 http://www.austriamicrosystems.com/
M. Cole et al. / Microelectronics Journal 34 (2003) 865–875874
resistance of a composite based on crystalline polymer-grafted
carbon black, Sens. Actuators B 79 (2001) 92–97.
[6] J.A. Dickson, R.M. Goodman, Integrated chemical sensors based on
carbon black and polymer films using a standard CMOS process and
post-processing, Circuits and Systems, Proceedings of ISCAS
Geneva, 2000.
[7] F. Zee, J.W. Judy, Micromachined polymer-based chemical gas
sensor array, Sens. Actuators B. 72 (2001) 120–128.
[8] J.W. Gardner, T.C. Pearce, S. Friel, P.N. Bartlett, N. Blair, A
multisensor system for beer flavour monitoring using an array of
conducting polymers and predictive classifiers, Sens. Actuators B 18
(1994) 240.
[9] F. Zee, J. Judy, MEMS chemical gas sensor, Industry Microelec-
tronics Symposium, 1999.
[10] W. Rosenstiel, M. Schweizer-Berberich, A. Hierlemann, J. Mitrovics,
U. Weimar, W. Gopel, J. Goppert, Application of neural-network
systems to the dynamics response of polymer-based sensor arrays,
Sens. Actuators B: 27 (1–3) (1995) 232–236.
[11] J. Samitier, J.M. Lopez-Villegas, S. Marco, L. Camara, A.
Pardo, O. Ruiz, J.R. Morante, A new method to analyse signal
transients in chemical sensors, Sens. Actuators B 18/19 (1994)
308–312.
[12] X. Vilanova, E. Llobet, X. Correig, R. Alcubilla, J.E. Sueiras,
Analysis of the conductance transient in thick-film tin oxide gas
sensors, Sens. Actuators B, 31 (1996) 175–180.
[13] C. Di Nucci, A. Fort, S. Rocchi, L. Tondi, N. Ulivieri, V. Vignoli, F.
Di Francesco, M.B. Serrano-Santos, Study of the dynamic response of
QCM sensors by means of a fast and accurate all-digital frequency
detector, Proc. 19th IMTC, Anchorage, USA (2002).
[14] F. Musio, M.E.H. Amrani, K.C. Persaud, High-frequency a.c.
investigation of conducting polymer gas sensors, Sens. Actuators B:
23 (2–3) (1995) 223–226.
[15] M.E.H. Amrani, P.A. Payne, Multi-frequency interrogation technique
applied to conducting polymer gas and odour sensors, IEEE Proc.-Sci.
Meas. Technol. 146 (2) (1999) 95–101.
[16] M.E. Hassan Amrani, R.M. Dowdeswell, P.A. Payne, K.C. Persaud,
An intelligent gas sensing system, Sens. Actuators B: 44 (1–3) (1997)
512–516.
[17] J.W. Gardner, P.N. Bartlett, K.F.E. Pratt, Modelling of gas-sensitive
conducting polymer devices, IEE Proc., Circuit Devices Syst. 142 (5)
(1995) 321–333.
[18] J. Gardner, E. Llobet, E.L. Hines, PSPICE model for resistive gas
and odour sensors, IEE Proc., Circuit Devices Syst. 146 (1999)
101–104.
[19] E. Llobet, X. Vilanava, J. Brezmes, D. Lopez, X. Correig, Electrical
equivalent models of semiconductor gas sensor using PSPICE,
Sens. Actuators B, 77 (2001) 275–280.
[20] D.A. Bell, Noise and the Solid State, Pentech Press, London, 1985.
[21] S.M. Briglin, M.S. Freund, P. Tokumaru, N.S. Lewis, Exploitation of
spatio-temporal information and geometric optimisation of signal/
noise performance using arrays of carbon black-polymer composite
vapor detectors, Sens. Actuators B 82 (2002) 54–74.
[22] A. Kolek, A. Dziedzic, Low-frequency noise of polymer thick-film
resistors: analysis of volume and contact effects, Proc. 22nd Intl Conf.
Microelectron. 2 (1999) 531–534.
[23] A. Dziedzic, A. Kolek, 1/f noise in polymer thick-film resistors,
J. Phys. D: Appl. Phys. 31 (1998) 2091–2097.
[24] J.A Covington, CMOS and SOI CMOS FET-based Gas Sensors,
School of Engineering, PhD Thesis, University of Warwick, CV4
7AL, UK, 2001.
[25] P.T. Moseley, A.M. Stoneham, D.E. Williams, Techniques and
Mechanisms in Gas Sensing, The Adam Hilger Series on Sensors,
Bristol, 1991.
[26] Verilog-A reference ManualTM, Cadence Design System, Inc.,
Product Version 4.4.3, Dec., 1998.
[27] Spectrew HDL Reference, Cadence Design System, Inc., Product
Version 4.4.3, Dec. 1998.
[28] P. Mielle, F. Marquis, An alternative way to improve the sensitivity of
electronic olfactometers, Sens. Actuators B: 58 (1–3) (1999)
526–535.
[29] P. Horowitz, W. Hill, The Art of Electronics, second ed., 1989.
Cambridge University Press, Cambridge.
[30] A. Bakker, High-Accuracy CMOS Smart Temperature Sensors,
printed in The Netherlands, 2000.
M. Cole et al. / Microelectronics Journal 34 (2003) 865–875 875