
Effects of bulk particle characteristics on backscattering and optical closure
Upload
independentCategory
view
0download
0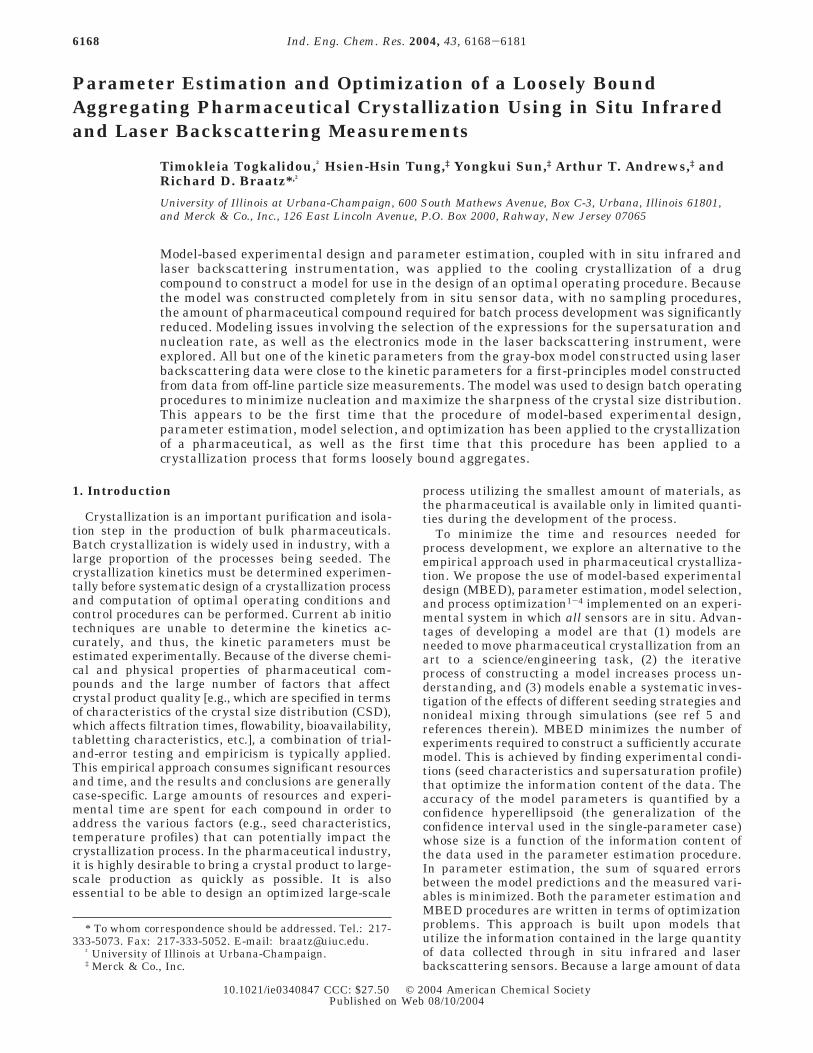
Parameter Estimation and Optimization of a Loosely BoundAggregating Pharmaceutical Crystallization Using in Situ Infraredand Laser Backscattering Measurements
Timokleia Togkalidou,† Hsien-Hsin Tung,‡ Yongkui Sun,‡ Arthur T. Andrews,‡ andRichard D. Braatz*,†
University of Illinois at Urbana-Champaign, 600 South Mathews Avenue, Box C-3, Urbana, Illinois 61801,and Merck & Co., Inc., 126 East Lincoln Avenue, P.O. Box 2000, Rahway, New Jersey 07065
Model-based experimental design and parameter estimation, coupled with in situ infrared andlaser backscattering instrumentation, was applied to the cooling crystallization of a drugcompound to construct a model for use in the design of an optimal operating procedure. Becausethe model was constructed completely from in situ sensor data, with no sampling procedures,the amount of pharmaceutical compound required for batch process development was significantlyreduced. Modeling issues involving the selection of the expressions for the supersaturation andnucleation rate, as well as the electronics mode in the laser backscattering instrument, wereexplored. All but one of the kinetic parameters from the gray-box model constructed using laserbackscattering data were close to the kinetic parameters for a first-principles model constructedfrom data from off-line particle size measurements. The model was used to design batch operatingprocedures to minimize nucleation and maximize the sharpness of the crystal size distribution.This appears to be the first time that the procedure of model-based experimental design,parameter estimation, model selection, and optimization has been applied to the crystallizationof a pharmaceutical, as well as the first time that this procedure has been applied to acrystallization process that forms loosely bound aggregates.
1. Introduction
Crystallization is an important purification and isola-tion step in the production of bulk pharmaceuticals.Batch crystallization is widely used in industry, with alarge proportion of the processes being seeded. Thecrystallization kinetics must be determined experimen-tally before systematic design of a crystallization processand computation of optimal operating conditions andcontrol procedures can be performed. Current ab initiotechniques are unable to determine the kinetics ac-curately, and thus, the kinetic parameters must beestimated experimentally. Because of the diverse chemi-cal and physical properties of pharmaceutical com-pounds and the large number of factors that affectcrystal product quality [e.g., which are specified in termsof characteristics of the crystal size distribution (CSD),which affects filtration times, flowability, bioavailability,tabletting characteristics, etc.], a combination of trial-and-error testing and empiricism is typically applied.This empirical approach consumes significant resourcesand time, and the results and conclusions are generallycase-specific. Large amounts of resources and experi-mental time are spent for each compound in order toaddress the various factors (e.g., seed characteristics,temperature profiles) that can potentially impact thecrystallization process. In the pharmaceutical industry,it is highly desirable to bring a crystal product to large-scale production as quickly as possible. It is alsoessential to be able to design an optimized large-scale
process utilizing the smallest amount of materials, asthe pharmaceutical is available only in limited quanti-ties during the development of the process.
To minimize the time and resources needed forprocess development, we explore an alternative to theempirical approach used in pharmaceutical crystalliza-tion. We propose the use of model-based experimentaldesign (MBED), parameter estimation, model selection,and process optimization1-4 implemented on an experi-mental system in which all sensors are in situ. Advan-tages of developing a model are that (1) models areneeded to move pharmaceutical crystallization from anart to a science/engineering task, (2) the iterativeprocess of constructing a model increases process un-derstanding, and (3) models enable a systematic inves-tigation of the effects of different seeding strategies andnonideal mixing through simulations (see ref 5 andreferences therein). MBED minimizes the number ofexperiments required to construct a sufficiently accuratemodel. This is achieved by finding experimental condi-tions (seed characteristics and supersaturation profile)that optimize the information content of the data. Theaccuracy of the model parameters is quantified by aconfidence hyperellipsoid (the generalization of theconfidence interval used in the single-parameter case)whose size is a function of the information content ofthe data used in the parameter estimation procedure.In parameter estimation, the sum of squared errorsbetween the model predictions and the measured vari-ables is minimized. Both the parameter estimation andMBED procedures are written in terms of optimizationproblems. This approach is built upon models thatutilize the information contained in the large quantityof data collected through in situ infrared and laserbackscattering sensors. Because a large amount of data
* To whom correspondence should be addressed. Tel.: 217-333-5073. Fax: 217-333-5052. E-mail: [email protected].
† University of Illinois at Urbana-Champaign.‡ Merck & Co., Inc.
6168 Ind. Eng. Chem. Res. 2004, 43, 6168-6181
10.1021/ie0340847 CCC: $27.50 © 2004 American Chemical SocietyPublished on Web 08/10/2004
is collected and exploited within each batch experiment,this procedure can estimate a crystallization modelwithin a few experiments. Then, the model can be usedto predict and optimize the desired crystal productquality by manipulating the seed characteristics andsupersaturation profile.
2. Experimental System and OptimizationObjective
As shown in Figure 1, the experimental apparatusconsisted of a 5-L jacketed crystallizer with an externalrecirculation loop and three on-line immersion mea-surement probes. In situ measurements of the infraredspectra were collected using an ASI Applied SystemReactIR 1000 FTIR spectrophotometer with an attenu-ated total reflection (ATR) immersion probe. The FTIRspectra were collected in the range 650-4000 cm-1. Theinfrared spectra were related to the solute concentrationusing robust chemometrics.6 Chord length distribution(CLD) measurements were collected every 2 min using
a Lasentec focused-beam reflectance measurement(FBRM, model D600L) instrument, where the chord ofa particle is defined as the distance across a particle asobserved by optics collecting backscattered light from alaser crossing the particle. In addition, in situ imagesof the slurry were acquired using a Lasentec particlevision microscopy (PVM, model 700L) instrument. Thebatch vessel was equipped with an overhead four-pitched-blade agitator. The temperature was controlledusing a HAAKE C50 water/glycol temperature bath andwas measured using a temperature probe attached tothe FTIR spectrophotometer.
A typical crystallization procedure follows: The crys-tallizer was charged with appropriate amounts oftoluene and a Cox-2-specific inhibitor drug candidate.Both milled and unmilled seeds were available for use.After charging, the batch temperature was raised to 60°C so that all crystals dissolved. The temperature waskept at 60 ° for 1 h to ensure that no crystals werepresent. Then, the temperature was reduced to 50 °C.The crystallizer was seeded with appropriate amountsof milled or unmilled seed. Then, the batch was cooledto 20 °C over a specific amount of time. The experimen-tal conditions and constraints used in the study arelisted in Table 1.
In this study, the objective was to select seed char-acteristics and a temperature profile that optimized acharacteristic property of the product crystals whilesatisfying constraints on the cooling rate, quantity ofseed crystals, duration of crystallization, and yield. Thesubsequent sections describe the crystallization model,sensor technologies, the model-building and optimiza-tion approach, and results and discussion.
3. Crystallization ModelIt was assumed that the crystallizer was well-mixed,
that is, there were no spatial variations of the states ofthe crystallizer (temperature, solute concentration, andcrystal size distribution). It was also assumed that thecrystallization procedure was dominated by nucleationand growth phenomena (an assumption regarding ag-gregation will be discussed later). The growth rate ofcrystals was assumed to be independent of size. Suchassumptions are common in the industrial crystalliza-tion literature.7 The population balance for a batchcrystallizer is8
where f(L,t) is the population density function, G(S;θg)
Figure 1. Experimental setup.
Table 1. Experimental Conditions and Constraints
variable name value units
msolvent mass of solvent 3800 gFc crystal density 1.41 g/cm3
L0 nucleated crystal size 0a µmC0 initial concentration 0.197 g of solute/g of solventCsat saturation concentration 0.0845T2 + 2.3547T + 64.224 g of solute/g of solventkv volumetric shape factor 1.8Tmax maximum T constraint 50 °CTmin minimum T constraint 20 °CRmax maximum temperature gradient 0, 15, 20 °C/hRmin minimum temperature gradient -15, -20 °C/hmseed,max maximum seed mass as a percentage
of the total mass in solution6% g
mseed,min minimum seed mass as a percentageof the total mass in solution
1% g
a Essentially the same results are obtained with L0 set to a realistic nonzero value.
∂f(L,t)∂t
+ G(S;θg)∂f(L,t)
∂L) B(S,f;θb) δ(L - L0) (1)
Ind. Eng. Chem. Res., Vol. 43, No. 19, 2004 6169
is the growth rate of the crystal along the characteristicdimension, B(S,f;θb) is the nucleation rate of crystals,θg and θb are sets of growth and nucleation parameters,L is the characteristic dimension, L0 > 0 is the charac-teristic size for nucleating crystals, S is the supersatu-ration, and δ(‚) is the delta function. The initial condi-tion for the population balance is given by the populationdensity function of the seed crystals f(L,0) ) f0(L).Assuming that there is no mechanism of producingcrystals of size L0 ) 0 and that the initial distributiondoes not have crystals of size L ) 0, the boundarycondition is f(0,t) ) 0, ∀t ∈ [0, ∞).
The two common expressions for supersaturation usedin the literature are the relative supersaturation S )(C - Csat)/Csat and the absolute supersaturation S ) C- Csat. The population balance equation can be con-verted into the following set of differential equations bymultiplying both sides of eq 1 by Lj for j ) 0, 1, 2, ...,and integrating each term from 0 to ∞9
where the jth moment is defined as
and the population density function is in units ofparticle number per unit length per unit solvent mass.The product quality objectives (described in section 5)are computed from µ0 to µ3. The moment µ4 was alsosimulated because it was used to compare model predic-tions to FBRM data.
A separate set of differential equations was solved forthe seed crystals4
where µ′j represents the moments of the seed crystals.Thus, one set of equations (eqs 2) tracks the momentsof all crystals in the slurry (both nucleated and seedcrystals), and the other set (eqs 4) tracks the momentsof the crystals grown from the initial seed crystals. Theseparate set of equations for the seed crystals allowsfor the computation of the ratio of the crystal massgrown from nuclei to the crystal mass grown from seed,which quantifies the total amount of nucleation occur-ring in the crystallizer.3,4 Minimizing the nucleated-to-seed mass ratio is consistent with the commonly useddesign objective of minimizing the total amount ofnucleation that occurs during the batch run.10 Theinitial conditions necessary to solve the set of equationsboth for µj and µ′j are given by the moments of the seedcrystals. The initial moments of the seed crystals arecalculated from the FBRM measurements immediatelyafter seeding. The usual simplification is made that thenucleated crystals are of negligible size (L0 ) 0).7,9
Inserting realistic nonzero values for L0 gives essentiallythe same moments and solute concentration predictions,because the terms that contain L0 in the moment
equations (e.g., in the second line of eqs 2) are manyorders of magnitude smaller than the rest of the termsin the equations. The nucleation term appears in theequation for the zeroth moment (i.e., see the first lineof eqs 2), which affects the rest of the ODEs as they aredirectly or indirectly dependent on the zeroth moment.
The solute mass balance is4
where C is the solute concentration in units of mass ofsolute per unit mass of solvent, Fc is the crystal density,and kv is the volumetric shape factor. The initialcondition for the solute concentration is its value at theseeding point. For the case where the crystals aremodeled as having two independent growth axes, two-dimensional moments of the crystals are used8,11
and the corresponding set of moment equations are
where L01 and L02 are the characteristic width andlength of nucleating crystals and G1 and G2 are thegrowth rates along each of the characteristic dimen-sions.
Various expressions for the growth rate kinetics havebeen proposed.9,12 Most of these mechanisms predictthat the growth rate is independent of crystal size, anidea that is attributed to McCabe and is termed the ∆Llaw. This study assumes a size-independent growth rateG ) kgSg, where kg and g are kinetic parameters to beestimated, as has been observed in a large number ofsystems in the literature.7,9 The parameter g can bebetween the values of 1 and 2 depending on the rate-limiting steps in the crystal growth mechanism.9 Thisstudy also makes the common assumption that thetemperature dependence of the kinetic parameters isnegligible.7,9 The same moments methodology can beemployed for crystal growth rates that depend affinelyon size,8,9 and the same parameter estimation approachapplies to systems with a significant temperaturedependence of the growth rate. For crystallization inwhich there are two independent growth dimensions,the growth rate kinetics are described by G1 ) kg1Sg1
and G2 ) kg2Sg2 along the two characteristic dimensions.In general, nucleation is classified into two categories,
primary or secondary, for nucleation in the absence andin the presence of crystals, respectively. Here, secondarynucleation from crystal surfaces is considered, becauseit is the dominant mechanism in most seeded crystal-lizers. The two most common expressions for the sec-ondary nucleation rate are B ) kbSbµ2 and B ) kbSbµ3,where kb and b are nucleation parameters to be esti-mated.9 The parameter b is usually observed experi-mentally to be between 1 and 3.9 An expression for thenucleation rate for the two-dimensional case is B )kbSbµ2,1, given that L1 is the smallest characteristicdimension.11
dµ0
dt) B
dµj
dt) jGµj-1 + BL0
j , j ) 1, 2, ... (2)
µj ≡ ∫0
∞Ljf(L,t) dL (3)
dµ′0dt
) 0
dµ′jdt
) jGµ′j-1, j ) 1, 2, ... (4)
dCdt
) -Fckv(3Gµ2 + BL03) (5)
µij ≡ ∫0
∞∫0
∞L1
iL2jf(L1,L2,t) dL1 dL2 (6)
dµ00
dt) B
dµij
dt) iG1µ(i-1)j + jG2µi(j-1) + BL01
iL02j, i + j > 0 (7)
6170 Ind. Eng. Chem. Res., Vol. 43, No. 19, 2004
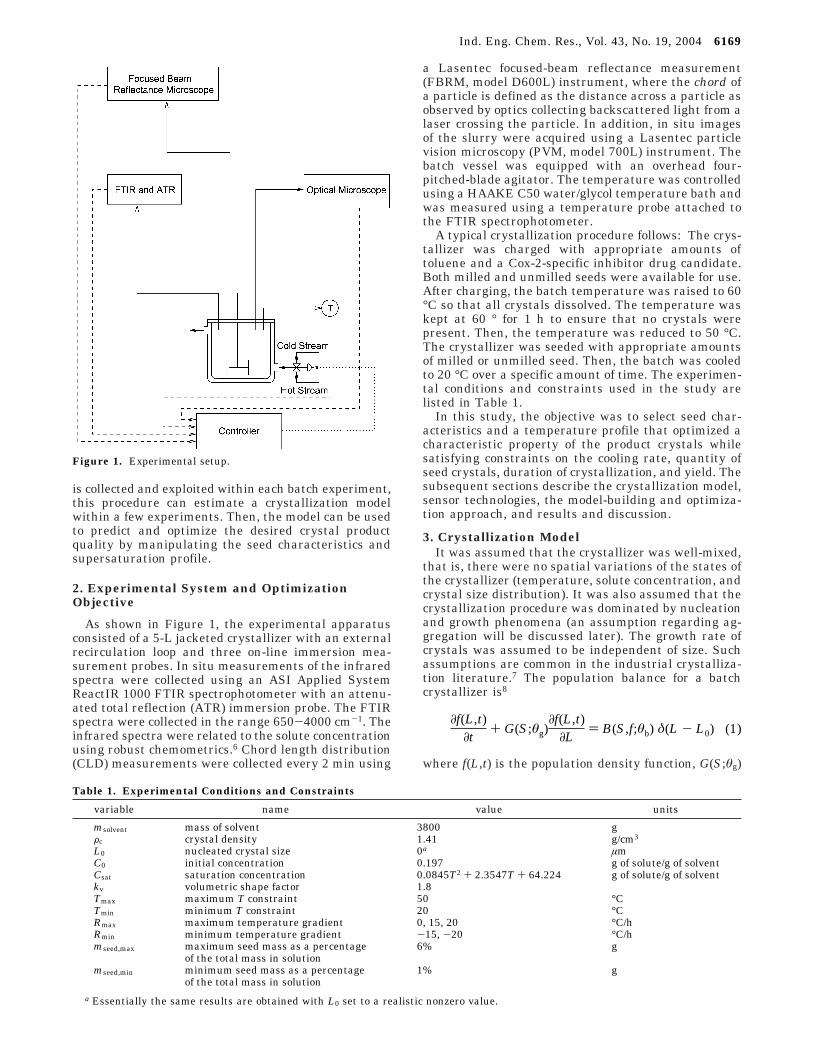
The pharmaceutical under investigation forms looselybound aggregates, as shown in the in situ image takenusing PVM (see Figure 2). According to manufacturerdocumentation from Lasentec,13 for sufficiently looselybound aggregates, the FBRM instrument predominantlymeasures the chords of the individual crystals in theaggregates, rather than chords across the entire ag-gregates. This assertion was supported by the observa-tion that the average size of the individual crystalsmeasured using the FBRM instrument was withinmeasurement variations of the average size of theindividual crystals observed using the PVM instrument.Off-line optical microscopy images also supported thishypothesis. A sample of product slurry was collected atthe end of a batch, filtered, and measured under anoptical microscope. The average and maximum sizes ofthe individual particles in the product aggregates werewithin measurement variations of the average andmaximum chords measured by FBRM. In contrast, theaverage and maximum sizes of the product aggregateswere much larger (approximately a factor of 5) than theaverage and maximum chords measured by FBRM. Amore detailed comparison of the FBRM data with thesize of individual crystals in the aggregates is given insection 6.
The aforementioned equations for the populationdensity function (eq 1) and the moment equations canbe applied to an aggregating system, provided that thepopulation density is defined for the individual crystalsin the aggregates. In contrast, additional integral ag-gregation terms would need to be included in eq 1 ifthe population density function of the aggregates werebeing modeled.9 This focus on the modeling of theindividual crystals greatly simplifies the modeling of thesystem. This simplification is necessary if a model is tobe developed from a small number of experiments usingexisting in situ sensors, as there are no in situ sensorson the market that can measure the number of indi-vidual particles in loosely bound aggregates and ac-curately measure the mass or size of such aggregates.Without this information, it is not possible to identifythe integral terms used to model aggregation (in con-trast, it is possible to identify the aggregation kernelsin a simplified laboratory system if the aggregates/agglomerates are bound tightly enough to be roughlyspherical9). Therefore, the approach taken here providesno information on the number of individual crystals inor the size or mass of the aggregates. Also, this approachshould be considered only for loosely bound aggregates,in which the individual crystals retain most of their
external surface area, without significant surface areabeing “covered up” by adjoining particles.
As in the modeling of any reasonably complex system,various assumptions are made that have various de-grees of accuracy. For example, some crystallizationshave size-dependent growth kinetics and/or growthdispersion.9,14 Some crystals have an inherent growthrate depending on the origin of their nuclei, wherecrystals with a greater number of initial dislocations willgrow faster. The predictive ability of the model and themagnitude of the confidence intervals on the kineticparameters (whose computation is discussed in section5) are used to determine whether the assumed kineticexpressions, as well as other model assumptions, areconsistent with the experimental observations. Largeconfidence intervals on the kinetic parameters, thatpersist after several batch experiments have beenconducted, would suggest that poor assumptions hadbeen made in the model.15
4. Sensor Technologies and Gray-Box Modeling
In situ or “in-process” sensors do not require samplingof the crystal slurry during the crystallization process.This reduces the amount of pharmaceutical needed foreach batch experiment, which is an important consid-eration when a limited amount of pharmaceutical isavailable during the early stages of process develop-ment. The trend in the pharmaceutical industry is tomove to smaller crystallizers for early-stage studies,increasing the effects of sampling on the crystallizer.Also, sampling always affects the sample itself, so thatit is not completely representative of the bulk slurry.
For this study, FTIR spectral data were used to inferthe solute concentration,6 and FBRM data provided sizeinformation throughout the batch. Inferential modelingwas used to construct a calibration curve to relate theFTIR spectra to the solute concentration, using proce-dures described elsewhere.16-18 The calibration curvesare determined off-line, using a small number of samples.
FBRM measures the CLD, which is not the same asthe crystal size distribution (CSD),19 although themoments of the CLD can be correlated to importantdownstream process characteristics. For example, it hasbeen shown that various moments of the CLD arecorrelated with the filtration resistance and the filtra-tion time of the slurry16 and that chord length measure-ments of aggregates in suspension correlate with rheo-logical behavior (the yield stress) of the suspension.20
In a pulp and paper application,21 the FBRM techniquewas used for wet-end optimization at an uncoatedwoodfree paper mill and web break prediction at acorrugated board mill.
The particle size distribution (PSD) can be computedfrom the CLD, under certain assumptions including thatthe particle shape is known.19,22 There are severalmethods for estimating the PSD from the CLD forspherical particles.23,24 The effect of the surface rough-ness can be taken into account, which can be animportant consideration for particles with surface ir-regularities.23 For other systems, the square-weightedchord length was found to be comparable to laserdiffraction, sieving, and electrical sensing zone analysisover the range of 50-400 µm.25
Although the aforementioned methods have success-fully estimated the PSD from the CLD for some systems,the theory behind these methods require many assump-tions, including that the particles perfectly backscatter
Figure 2. PVM image of slurry taken in-process during batchcrystallization.
Ind. Eng. Chem. Res., Vol. 43, No. 19, 2004 6171
light at all angles and that all particles have a knownshape. Although these assumptions are true for manyparticulate systems (such as round polymer beads witha rough surface in water at low-to-moderate solidsdensities23), the assumptions are not accurate for otherparticulate systems (such as droplets that have poorbackscattering properties). For some systems, unmod-eled factors such as the optical properties of solids andsolvents, as well as positioning of the probe in relationto the surrounding flow, can significantly affect theCLD,22 which, in turn, significantly affects the estimatedPSD. The time and the available quantity of pharma-ceutical compound are typically quite limited in theearly-stage design of the batch crystallization process,which limits the ability to carry out the investigativestudies needed to verify the assumptions and to deter-mine the effects of nonideality of the assumptions onthe accuracy of the estimates of the PSD from the CLD.Also, the proper technique for computing the PSD fromthe CLD when the underlying assumptions of themethods do not hold is still an open problem.
An alternative approach applicable in the early-stagedesign of pharmaceutical crystallization processes is touse the low-order moments of the CLD directly, withoutfirst converting the CLD measurement to a PSD esti-mate. This approach replaces the first-principles modelfor the PSD with a gray-box model for the CLD, in whichthe structure of the first-principles model for the low-order moments of the PSD is used to parametrize thelow-order moments for the CLD. Gray-box modeling isin contrast to black-box modeling approaches such asfinite impulse response and dynamic artificial neuralnetwork models, which typically ignore first principlesin their parametrization of the process dynamics. Gray-box models are commonly used in process control, asthey have lower data requirements and some of theimproved extrapolation capability of first-principlesmodels without requiring all of the information neededto construct a first-principles model.26 The reasoningbehind this particular gray-box model is that the map-ping between the CLD and the PSD is static (most ofthe aformentioned mapping methods assume that themapping is actually linear), so the low-order momentsof the CLD should follow the same dynamic trends asthe low-order moments of the PSD. As with any model,its applicability is assessed by quantifying the accuracyof the kinetic parameters and its predictions (as dis-cussed in ref 15 and references therein). If the gray-box model is a poor parametrization of the low-ordermoments of the CSD, then it will be impossible to obtainsmall confidence intervals on the kinetic parametersbecause of model bias errors. If the gray-box model is agood parametrization, then it will be possible to obtainsmall confidence intervals on the kinetic parametersand good predictions (see, for example, eq 5.8.12 of ref15 and the associated discussion).
5. Background on Model Building andOptimization
The overall procedure consists of model-based experi-mental design (MBED),27-29 inferential modeling, pa-rameter estimation,15,30-33 model selection, and optimi-zation as the fundamental tasks. MBED and parameterestimation are repeated until the parameter estimatesare sufficiently accurate. These kinetic parameters areincorporated into a model and used to design a batchoperating procedure that optimizes product quality.
For the design of the first experiment, the userprovides an initial guess of the kinetic parameters. Ifno such parameters are available, the user can followthe existing crystallization procedure as the first experi-ment, provided that this experiment exhibits sufficientdynamic behavior. The kinetic parameters are estimatedfrom the measurements of the solute concentration andmoments by minimizing the differences between themodel predictions and measurements28,34
where θ is the set of the parameters to be estimated,yij
meas represents the measurements, yijmodel represents
the model predictions, Nm is the number of measuredvariables, Nd is the number of sampling instances, andwij is a weighting factor. Under mild assumptions, thebest value for wij is the inverse of an estimate of theerror variance σi
2, where σi is the standard deviationfor the error in the ith measurement. The error vari-ances are typically selected to account for deviations dueto measurement inaccuracies and small levels of modelinadequacy (e.g., see page 181 of ref 15). For the firstparameter estimation, σi is set to the standard deviationof the actual measurement. A set of parameters wasestimated by solving the optimization problem in eq 8,and the standard deviation σi for the error in the ithmeasurement was also estimated for each measure-ment. These new values of standard deviation σi for theerror in the ith measurement were fed to the parameterestimation problem and the optimization problem wassolved again. The iterative procedure was repeated untilno significant difference between the given and esti-mated standard deviations was detected.
Confidence intervals for each parameter were com-puted. Briefly, the approximate 100(1 - R)% confidenceregion is the hyperellipsoid defined by
where Vθ is the parameter covariance matrix, θ is thetrue value of the parameter (unknown), θ* is theestimate of the parameter, øNp
2 is the chi-squareddistribution with Np degrees of freedom, and Np is thenumber of parameters. Estimates of the confidenceintervals are computed from the diagonal elements ofthe parameter covariance matrix.15 Once the param-eters and confidence intervals have been estimated, adecision is made as to whether the accuracy of theparameters is adequate. If the confidence intervals onthe parameters are large, the user proceeds to MBED,which is posed as an optimization problem7,15,35,36
subject to the constraints on the experimental procedure(see Table 1) and the crystallization model described insection 3. This optimization computes experimentalconditions to minimize the volume of the confidenceellipsoid on the parameters, which is inversely propor-tional to the determinant of Vθ
-1.27 The optimizationproblem was solved by sequential quadratic program-ming,37,38 with the temperature profile parametrized bya finite number of linear segments.
minθ
∑i)1
Nm
∑j)1
Nd
wij[yijmeas - yij
model(θ)]2 (8)
(θ - θ*)TVθ-1(θ - θ*) ) øNp
2(R) (9)
min(volume of confidence ellipsoid} )max[det(Vθ
-1)] (10)
6172 Ind. Eng. Chem. Res., Vol. 43, No. 19, 2004

In this study, the experimental design variables werethe temperature profile and seed load, with the seeddistribution modeled by a quadratic function. The lowerbound of seed load of 3% was selected on the basis ofcurrent operations. Very small seed loads lead to opera-tions problems, in which fluctuations in temperature orshifts in the solubility curve can cause all of the seedcrystals to dissolve, leading to uncontrolled nucleationas the crystallizer temperature decreases. An upperbound of 6% for the seed load was selected because ofthe limited availability of the crystals. The constraintsreported in Table 1 are associated with the character-istics of the crystallizer (such as temperature andtemperature gradient constraints) and with the avail-able resources (such as the mass and size distributionof seed crystals and the duration of experiment). Thereader is referred to the refs 3, 7, 35, and 36 for moredetails on the application of MBED to crystallizationprocesses.
This iterative procedure of MBED, batch experimen-tal data collection, and parameter estimation is repeateduntil the parameters are sufficiently accurate. Becausea significant quantity of informative data is collectedand exploited in each batch experiment, a small numberof experiments is typically sufficient for an accuratemodel to be constructed. This model is used to optimizea characteristic property associated with the productquality over the temperature profile and seed mass
subject to the operating constraints of the crystalliza-tion. For this study, the crystal properties that wereoptimized were the coefficient of variation (cov) and thenucleated-to-seed mass ratio. The cov was computed as
xµ2µ0/µ12-1, which gives a measure of the spread of
the distribution about the mean. The nucleated-to-seedmass ratio is defined as the ratio of crystal mass grownfrom nucleated crystals to the crystal mass grown fromseed crystals, which can be computed from the momentsmodel. The operating constraints were associated witheconomics (a lower bound on the yield and an upperbound on the seed mass and duration of crystallization),the characteristics of the crystallizer (upper and lowerbounds on the temperature and temperature gradientand a lower bound on the seed mass), and availablematerials (the seed distributions that were available),with the constraints in this study reported in Table 1.The optimization problem in eq 11 including the modeland operating constraints was solved by applyingsequential quadratic programming to the simulationcode, which was implemented using the sparse solverLSODES.
6. Results and Discussion
The goal of MBED is to improve the effectiveness ofefforts to construct an accurate model from a minimalnumber of experiments. Because no prior knowledge ofthe growth and nucleation parameters was available,the first experiment (experiment 1a in Table 2) followedthe existing procedure. The resulting experimental datawere used to select the supersaturation expression, bycomparing the confidence intervals on the kinetic pa-rameters obtained in the various models. A hardwaremode (coarse vs fine electronics) in the FBRM wasselected by comparing confidence intervals between the
data from experiments 1a and 1b (see Table 2), whichuses the same experimental conditions as experiment1a but a different electronics mode. The data fromexperiment 1a and the associated kinetic parameterestimates from the selected model were used to designthe temperature profile and the seed load in experiment2 using MBED. The data from experiments 1a and 2were used to select the moment order in the nucleationexpression, with the best model having kinetic param-eters with an accuracy of 12%. A fourth independentexperiment (experiment E) was used with off-line opticalmicroscopy to evaluate the accuracy of (i) the FBRMtechnique in measuring the low-order moments of theindividual crystals, (ii) the kinetic parameters obtainedusing the FBRM data, and (iii) the predictions of themodel obtained using the FBRM data. A final experi-ment (experiment 3) was conducted using the operatingprocedure designed to optimize a crystal product prop-erty of interest. Table 2 summarizes the operatingconditions for the experiments. Table 3 lists the initialmoments for each experiment calculated by the FBRMsignal immediately after seeding.
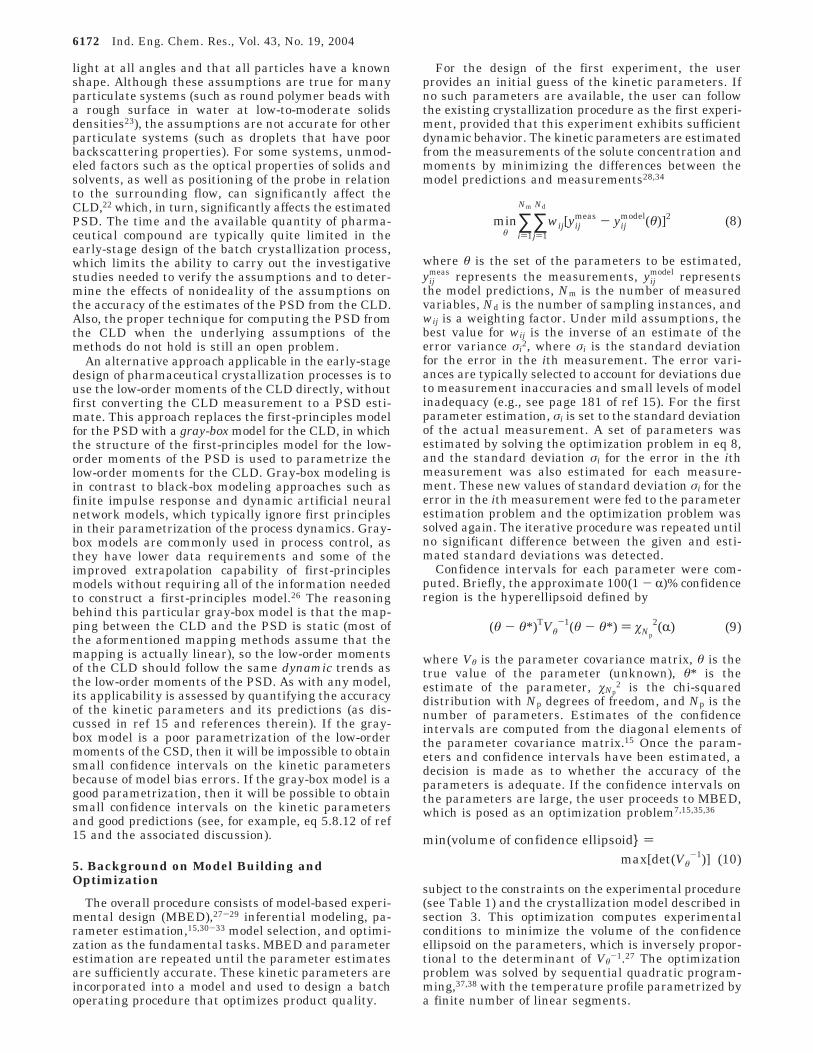
6.1. Hardware Mode. The manufacturer documen-tation for the FBRM instrument indicates that thecoarse electronics mode filters the backscattering lightsignal before measuring chords, whereas the fine modeuses an unfiltered signal that is more likely to measurethe individual crystals within loosely bound aggre-gates.13 Parameters and their confidence intervals forexperiments 1a and 1b (in which fine and coarse modes,respectively, were used) are listed in Table 4. Theconfidence intervals obtained using the fine electronicswere smaller than those obtained using coarse electron-ics. The predicted and measured values for the soluteconcentration and the low-order moments are reportedfor experiment 1a in Figure 3 and for experiment 1b inFigure 4. For experiment 1a, the predicted values agreewell with the measured values for the first, second, andthird moments, whereas poorer agreement is observedfor the solute concentration and the zeroth and fourthmoments. For experiment 1b, fairly good agreement isestablished for the second and third moments, whereaspoor agreement is observed for the solution concentra-tion and the zeroth, first, and fourth moments. The fineelectronics mode was used in subsequent experimentsbecause of its smaller confidence intervals and bettertracking of the variables. Selecting the fine mode as thedevice setting is consistent with the assumption in themodel that the low-order moments of the CLD are forthe individual crystals in the agglomerates. Furtherevaluation of the measurement device is provided insection 6.5.
minseed,temperature
(crystal property) (11)
Table 2. Experiments, Seed Loads, Cooling Profiles, andFBRM Electronics
expt seed level cooling profileLasentec FBRM
electronics
1a milled seed, 3% see Figure 9, expt 1a fine1b milled seed, 3% see Figure 9, expt 1a coarse2 unmilled seed, 3% see Figure 9, expt 2 fineE milled seed, 3% see Figure 7 fine3 milled seed, 6% see Figure 9, expt 3 fine
Table 3. Initial Moments for Experiments 1a, 1b, 2, and 3
expt µ0 µ1 µ2 µ3 µ4
1a 3.35 × 10⁵ 8.64 × 10⁶ 3.51 × 10⁸ 1.92 × 10¹⁰ 1.33 × 10¹²
1b 9.63 × 10⁴ 4.33 × 10⁶ 2.76 × 10⁸ 2.32 × 10¹⁰ 2.42 × 10¹²
2 1.55 × 10⁵ 3.89 × 10⁶ 1.58 × 10⁸ 8.73 × 10⁹ 6.41 × 10¹¹
3 5.70 × 10⁵ 1.19 × 10⁷ 4.07 × 10⁸ 1.91 × 10¹⁰ 1.14 × 10¹²
Ind. Eng. Chem. Res., Vol. 43, No. 19, 2004 6173
6.2. Supersaturation Expression. Results fromcomparing two sets of nucleation and growth expres-sions are presented here. Using the data from experi-ment 1a, the absolute supersaturation gave significantlysmaller prediction intervals than the relative super-saturation (see Table 4). That the growth rate is aquadratic function of the absolute supersaturation sug-gests that diffusion through the liquid phase to thecrystal surface is not the rate-limiting step for growth.39
Although the nucleation exponent is on the small side(the usually observed range for secondary nucleation is1-39), other researchers have reported similarly smallvalues for some crystallization systems.7
6.3. Design of Experiment 2 and ParameterEstimation Results. Once it was decided to use theabsolute supersaturation expression and the fine elec-tronics mode for the FBRM instrument, MBED wasused to design the temperature profile and seed loadfor the next experiment, experiment 2. MBED produceda seed load of minimum size (3%, see Table 2). The sameresult occurred in a parametric study of an inorganicsystem.2 The small seed load leads to a higher super-
saturation over the batch experiment, resulting in anincrease in the nucleation and growth rates, whichproduces data that contain more information about thenucleation and growth kinetics. As shown in Table 5,experiment 2 resulted in a reduction in the confidenceintervals by a factor of 2.
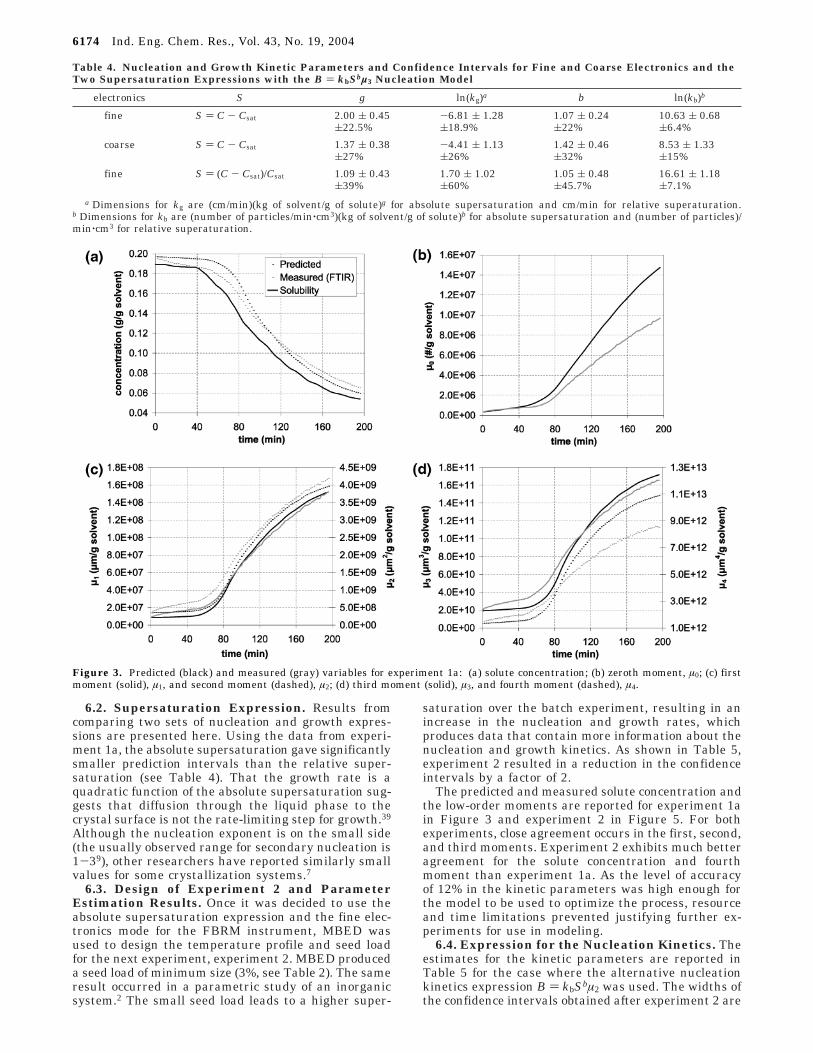
The predicted and measured solute concentration andthe low-order moments are reported for experiment 1ain Figure 3 and experiment 2 in Figure 5. For bothexperiments, close agreement occurs in the first, second,and third moments. Experiment 2 exhibits much betteragreement for the solute concentration and fourthmoment than experiment 1a. As the level of accuracyof 12% in the kinetic parameters was high enough forthe model to be used to optimize the process, resourceand time limitations prevented justifying further ex-periments for use in modeling.
6.4. Expression for the Nucleation Kinetics. Theestimates for the kinetic parameters are reported inTable 5 for the case where the alternative nucleationkinetics expression B ) kbSbµ2 was used. The widths ofthe confidence intervals obtained after experiment 2 are
Table 4. Nucleation and Growth Kinetic Parameters and Confidence Intervals for Fine and Coarse Electronics and theTwo Supersaturation Expressions with the B ) kbSbµ3 Nucleation Model
electronics S g ln(kg)a b ln(kb)b
fine S ) C - Csat 2.00 ( 0.45 -6.81 ( 1.28 1.07 ( 0.24 10.63 ( 0.68(22.5% (18.9% (22% (6.4%
coarse S ) C - Csat 1.37 ( 0.38 -4.41 ( 1.13 1.42 ( 0.46 8.53 ( 1.33(27% (26% (32% (15%
fine S ) (C - Csat)/Csat 1.09 ( 0.43 1.70 ( 1.02 1.05 ( 0.48 16.61 ( 1.18(39% (60% (45.7% (7.1%
a Dimensions for kg are (cm/min)(kg of solvent/g of solute)g for absolute supersaturation and cm/min for relative superaturation.b Dimensions for kb are (number of particles/min‚cm3)(kg of solvent/g of solute)b for absolute supersaturation and (number of particles)/min‚cm3 for relative superaturation.
Figure 3. Predicted (black) and measured (gray) variables for experiment 1a: (a) solute concentration; (b) zeroth moment, µ0; (c) firstmoment (solid), µ1, and second moment (dashed), µ2; (d) third moment (solid), µ3, and fourth moment (dashed), µ4.
6174 Ind. Eng. Chem. Res., Vol. 43, No. 19, 2004

similar to those obtained in the case where the expres-sion B ) kbSbµ3 was used. These results are consistentwith past studies,4,35 which also found that it wasdifficult to distinguish between the two nucleationmodels from a limited number of batch experiments.
6.5. Sensor and Model Evaluation and KineticParameters for the Two-Dimensional Model. Anadditional experiment E was conducted in which fivesamples were removed from the crystallizer during thecrystallization process, to be examined under the mi-croscope. This experiment was used to evaluate thepredictive ability of the kinetic models for an operatingprocedure very different from that used to fit the kineticparameters, as well as to evaluate the level of agree-ment between low-order moments determined by FBRMand by off-line optical microscopy.
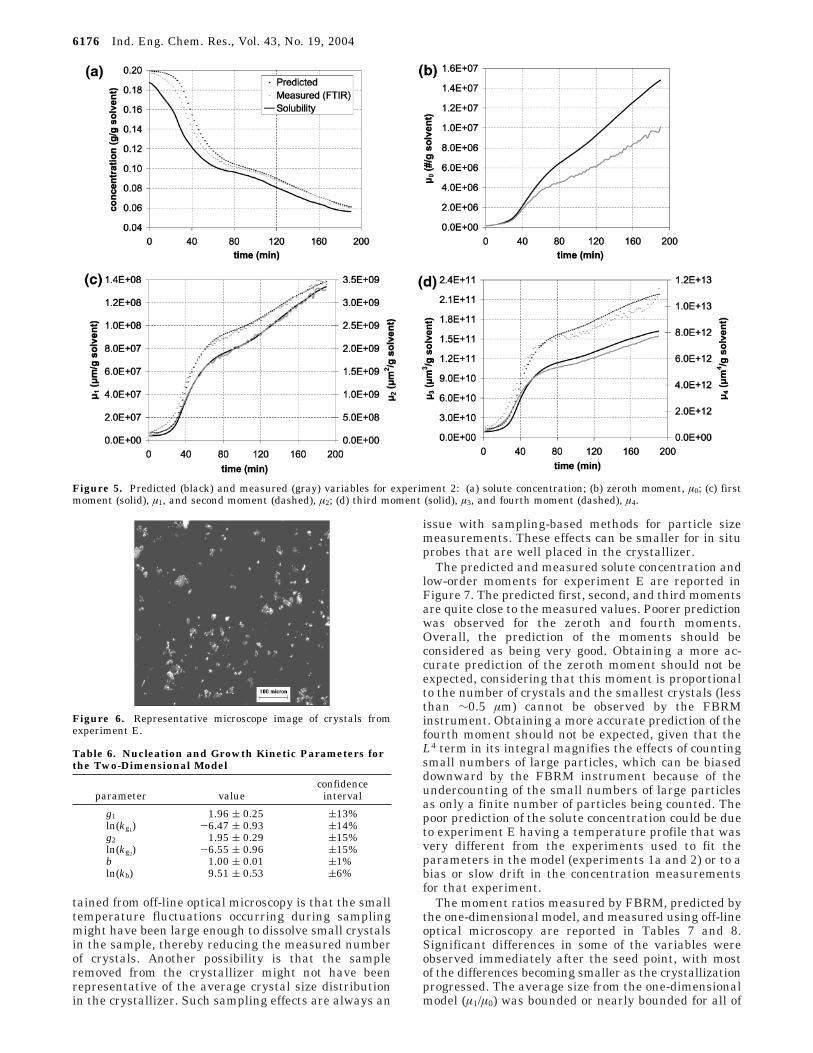
The samples were quickly filtered and sonicated sothat any aggregates were separated into individual
crystals. Images were taken with a camera connectedto an optical microscope (see Figure 6) and analyzedwith image analysis software to extract the sizes of thecrystals. The number of crystals used to build thepopulation density function for each of the samplesranged between 1000 and 3000 crystals. The kineticparameters in the two-dimensional crystallization modelwere fit to the two-dimensional data to estimate thekinetic parameters, which are reported in Table 6. Theconfidence intervals for the two-dimensional model wereestimated using the Monte Carlo method.15
Except for the nucleation preexponential parameter,the gray-box model constructed from low-order momentsfrom the CLD gave kinetic parameters very similar tothose obtained with as the model constructed from two-dimensional moments measured using off-line opticalmicroscopy (compare Table 5 with Table 6). It is notsurprising that a second growth coordinate was un-necessary, as the kinetic growth parameters were notsignificantly different along the length and width direc-tions. This is consistent with direct examination of theexperimental data, where it is observed that the averageaspect ratio varies little during the experiments (1.75for seed crystals, increasing to 1.85 for the productcrystals). What is more interesting is that the kineticparameters determined from low-order moments of theCLD are very similar to the kinetic parameters deter-mined from the CSD measured off-line. As discussed insection 4, the CLD should track the same dynamics asthe CSD, as the theoretical mappings between the twoare static. It is not much of a leap to suggest that thisstatic relationship is why almost all of the kineticparameters obtained from the two methods of particlesize measurement are very similar. A possible cause forthe smaller nucleation preexponential parameter ob-
Figure 4. Predicted (black) and measured (gray) variables for experiment 1b: (a) solute concentration; (b) zeroth moment, µ0; (c) firstmoment (solid), µ1, and second moment (dashed), µ2; (d) third moment (solid), µ3, and fourth moment (dashed), µ4.
Table 5. Nucleation and Growth Kinetic Parameters andPrediction Intervals for Two Experiments for the B )kbSbµ3 and B ) kbSbµ2 Nucleation Models with AbsoluteSupersaturation
expt g ln(kg) B b ln(kb)a
1a 2.00 ( 0.45 -6.81 ( 1.28 B ) kbSbµ3 1.07 ( 0.24 10.63 ( 0.68(22.5% (18.9% (22% (6.4%
2b 2.00 ( 0.18 -6.93 ( 0.59 B ) kbSbµ3 1.00 ( 0.12 11.25 ( 0.36(9% (8.5% (12% (3.2%
1a 2.00 ( 0.60 -6.47 ( 1.64 B ) kbSbµ2 1.21 ( 0.61 14.75 ( 1.56(30% (25.3% (50.4% (11%
2b 2.00 ( 0.22 -6.50 ( 0.67 B ) kbSbµ2 1.21 ( 0.15 14.74 ( 0.42(11% (10.3% (12.4% (3%
a Dimensions for kg in the B ) kbSbµ2 model are (number ofparticles/min‚cm2)(kg of solvent/g of solute)b(104). b The secondexperiment was designed with MBED.
Ind. Eng. Chem. Res., Vol. 43, No. 19, 2004 6175
tained from off-line optical microscopy is that the smalltemperature fluctuations occurring during samplingmight have been large enough to dissolve small crystalsin the sample, thereby reducing the measured numberof crystals. Another possibility is that the sampleremoved from the crystallizer might not have beenrepresentative of the average crystal size distributionin the crystallizer. Such sampling effects are always an
issue with sampling-based methods for particle sizemeasurements. These effects can be smaller for in situprobes that are well placed in the crystallizer.
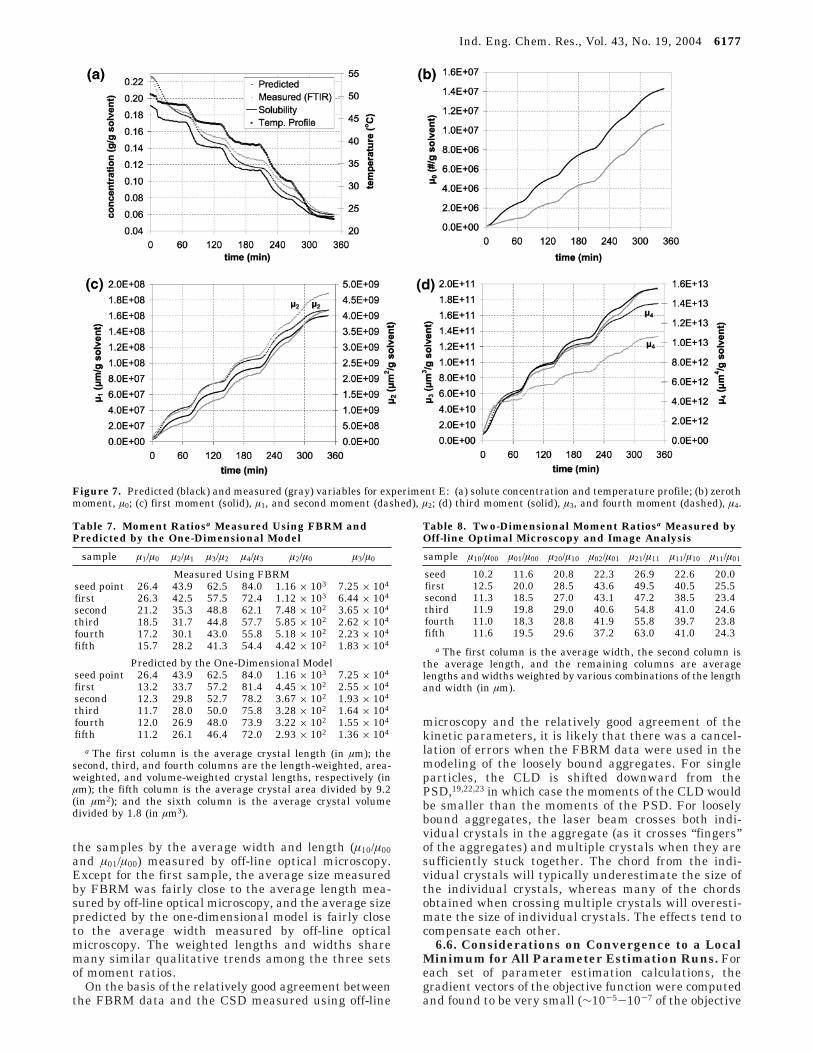
The predicted and measured solute concentration andlow-order moments for experiment E are reported inFigure 7. The predicted first, second, and third momentsare quite close to the measured values. Poorer predictionwas observed for the zeroth and fourth moments.Overall, the prediction of the moments should beconsidered as being very good. Obtaining a more ac-curate prediction of the zeroth moment should not beexpected, considering that this moment is proportionalto the number of crystals and the smallest crystals (lessthan ∼0.5 µm) cannot be observed by the FBRMinstrument. Obtaining a more accurate prediction of thefourth moment should not be expected, given that theL4 term in its integral magnifies the effects of countingsmall numbers of large particles, which can be biaseddownward by the FBRM instrument because of theundercounting of the small numbers of large particlesas only a finite number of particles being counted. Thepoor prediction of the solute concentration could be dueto experiment E having a temperature profile that wasvery different from the experiments used to fit theparameters in the model (experiments 1a and 2) or to abias or slow drift in the concentration measurementsfor that experiment.
The moment ratios measured by FBRM, predicted bythe one-dimensional model, and measured using off-lineoptical microscopy are reported in Tables 7 and 8.Significant differences in some of the variables wereobserved immediately after the seed point, with mostof the differences becoming smaller as the crystallizationprogressed. The average size from the one-dimensionalmodel (µ1/µ0) was bounded or nearly bounded for all of
Figure 5. Predicted (black) and measured (gray) variables for experiment 2: (a) solute concentration; (b) zeroth moment, µ0; (c) firstmoment (solid), µ1, and second moment (dashed), µ2; (d) third moment (solid), µ3, and fourth moment (dashed), µ4.
Figure 6. Representative microscope image of crystals fromexperiment E.
Table 6. Nucleation and Growth Kinetic Parameters forthe Two-Dimensional Model
parameter valueconfidence
interval
g1 1.96 ( 0.25 (13%ln(kg1) -6.47 ( 0.93 (14%g2 1.95 ( 0.29 (15%ln(kg2) -6.55 ( 0.96 (15%b 1.00 ( 0.01 (1%ln(kb) 9.51 ( 0.53 (6%
6176 Ind. Eng. Chem. Res., Vol. 43, No. 19, 2004
the samples by the average width and length (µ10/µ00and µ01/µ00) measured by off-line optical microscopy.Except for the first sample, the average size measuredby FBRM was fairly close to the average length mea-sured by off-line optical microscopy, and the average sizepredicted by the one-dimensional model is fairly closeto the average width measured by off-line opticalmicroscopy. The weighted lengths and widths sharemany similar qualitative trends among the three setsof moment ratios.
On the basis of the relatively good agreement betweenthe FBRM data and the CSD measured using off-line
microscopy and the relatively good agreement of thekinetic parameters, it is likely that there was a cancel-lation of errors when the FBRM data were used in themodeling of the loosely bound aggregates. For singleparticles, the CLD is shifted downward from thePSD,19,22,23 in which case the moments of the CLD wouldbe smaller than the moments of the PSD. For looselybound aggregates, the laser beam crosses both indi-vidual crystals in the aggregate (as it crosses “fingers”of the aggregates) and multiple crystals when they aresufficiently stuck together. The chord from the indi-vidual crystals will typically underestimate the size ofthe individual crystals, whereas many of the chordsobtained when crossing multiple crystals will overesti-mate the size of individual crystals. The effects tend tocompensate each other.
6.6. Considerations on Convergence to a LocalMinimum for All Parameter Estimation Runs. Foreach set of parameter estimation calculations, thegradient vectors of the objective function were computedand found to be very small (∼10-5-10-7 of the objective
Figure 7. Predicted (black) and measured (gray) variables for experiment E: (a) solute concentration and temperature profile; (b) zerothmoment, µ0; (c) first moment (solid), µ1, and second moment (dashed), µ2; (d) third moment (solid), µ3, and fourth moment (dashed), µ4.
Table 7. Moment Ratiosa Measured Using FBRM andPredicted by the One-Dimensional Model
sample µ1/µ0 µ2/µ1 µ3/µ2 µ4/µ3 µ2/µ0 µ3/µ0
Measured Using FBRMseed point 26.4 43.9 62.5 84.0 1.16 × 10³ 7.25 × 10⁴
first 26.3 42.5 57.5 72.4 1.12 × 10³ 6.44 × 10⁴
second 21.2 35.3 48.8 62.1 7.48 × 10² 3.65 × 10⁴
third 18.5 31.7 44.8 57.7 5.85 × 10² 2.62 × 10⁴
fourth 17.2 30.1 43.0 55.8 5.18 × 10² 2.23 × 10⁴
fifth 15.7 28.2 41.3 54.4 4.42 × 10² 1.83 × 10⁴
Predicted by the One-Dimensional Modelseed point 26.4 43.9 62.5 84.0 1.16 × 10³ 7.25 × 10⁴
first 13.2 33.7 57.2 81.4 4.45 × 10² 2.55 × 10⁴
second 12.3 29.8 52.7 78.2 3.67 × 10² 1.93 × 10⁴
third 11.7 28.0 50.0 75.8 3.28 × 10² 1.64 × 10⁴
fourth 12.0 26.9 48.0 73.9 3.22 × 10² 1.55 × 10⁴
fifth 11.2 26.1 46.4 72.0 2.93 × 10² 1.36 × 10⁴
a The first column is the average crystal length (in µm); thesecond, third, and fourth columns are the length-weighted, area-weighted, and volume-weighted crystal lengths, respectively (inµm); the fifth column is the average crystal area divided by 9.2(in µm2); and the sixth column is the average crystal volumedivided by 1.8 (in µm3).
Table 8. Two-Dimensional Moment Ratiosa Measured byOff-line Optimal Microscopy and Image Analysis
sample µ10/µ00 µ01/µ00 µ20/µ10 µ02/µ01 µ21/µ11 µ11/µ10 µ11/µ01
seed 10.2 11.6 20.8 22.3 26.9 22.6 20.0first 12.5 20.0 28.5 43.6 49.5 40.5 25.5second 11.3 18.5 27.0 43.1 47.2 38.5 23.4third 11.9 19.8 29.0 40.6 54.8 41.0 24.6fourth 11.0 18.3 28.8 41.9 55.8 39.7 23.8fifth 11.6 19.5 29.6 37.2 63.0 41.0 24.3
a The first column is the average width, the second column isthe average length, and the remaining columns are averagelengths and widths weighted by various combinations of the lengthand width (in µm).
Ind. Eng. Chem. Res., Vol. 43, No. 19, 2004 6177
function value) except for the growth exponent g, whosegradient was negative for all sets of parameters forwhich the growth exponent was equal to its upper bound(g ) 2). The gradient for the nucleation exponent b wasvery small for all sets of parameters, even at its lowestvalue of b ) 1. This indicates that dropping the lowerconstraint on the nucleation exponent would have a verysmall effect on the computed value for b. Withinnumerical accuracy, these gradients satisfy the first-order necessary conditions for the estimated parametersbeing located at a (local) minimum.40 The Hessians werecomputed for each set of parameters and inserted intothe second-order sufficient conditions,40 which weresatisfied for all sets of parameters.
6.7. Optimization of Crystal Properties. Once thekinetic parameters were estimated to sufficiently highaccuracy and the model verified in the additional batchexperiment, the model was used to compute a temper-ature profile and seed load that minimizes the cov, or aweighted sum of the cov and the nucleated-to-seed massratio. The seed load for the optimized operating proce-dures was at its maximum allowed value (6%, see Table2). This result is consistent with past simulation andexperimental studies that found the maximum seed loadto be optimal for a wide range of operating regimes1 andcrystal-solvent combinations (see ref 10 and referencestherein).
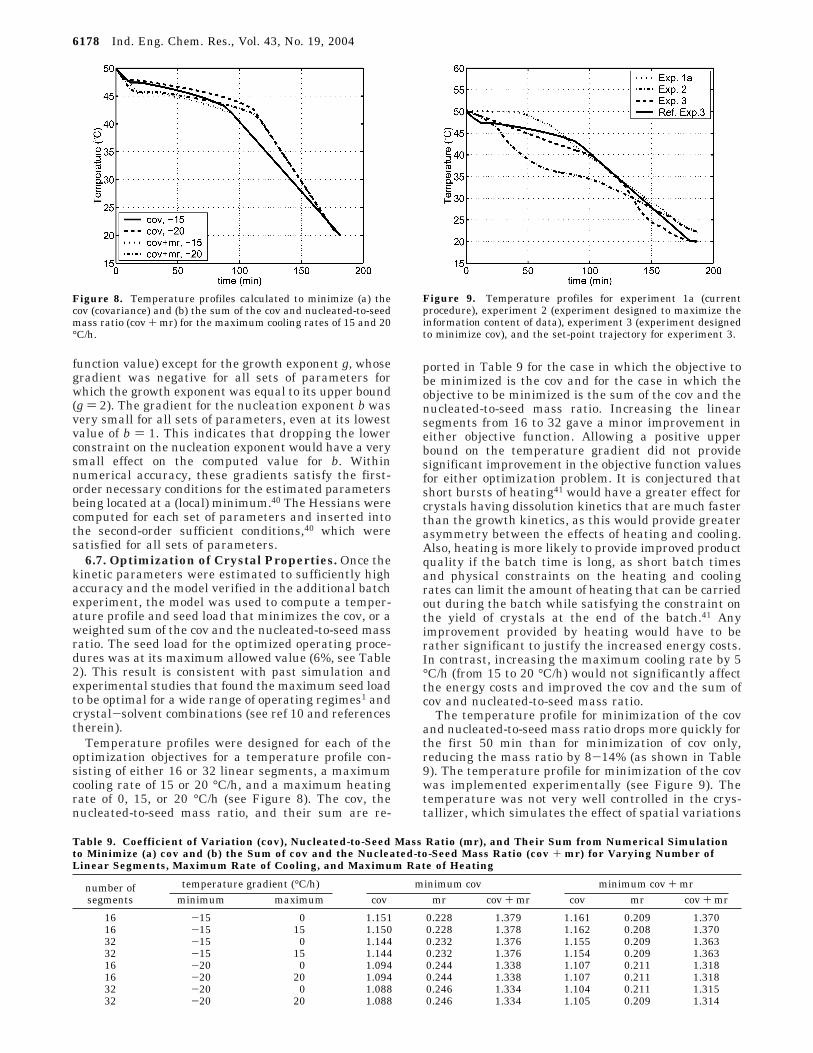
Temperature profiles were designed for each of theoptimization objectives for a temperature profile con-sisting of either 16 or 32 linear segments, a maximumcooling rate of 15 or 20 °C/h, and a maximum heatingrate of 0, 15, or 20 °C/h (see Figure 8). The cov, thenucleated-to-seed mass ratio, and their sum are re-
ported in Table 9 for the case in which the objective tobe minimized is the cov and for the case in which theobjective to be minimized is the sum of the cov and thenucleated-to-seed mass ratio. Increasing the linearsegments from 16 to 32 gave a minor improvement ineither objective function. Allowing a positive upperbound on the temperature gradient did not providesignificant improvement in the objective function valuesfor either optimization problem. It is conjectured thatshort bursts of heating41 would have a greater effect forcrystals having dissolution kinetics that are much fasterthan the growth kinetics, as this would provide greaterasymmetry between the effects of heating and cooling.Also, heating is more likely to provide improved productquality if the batch time is long, as short batch timesand physical constraints on the heating and coolingrates can limit the amount of heating that can be carriedout during the batch while satisfying the constraint onthe yield of crystals at the end of the batch.41 Anyimprovement provided by heating would have to berather significant to justify the increased energy costs.In contrast, increasing the maximum cooling rate by 5°C/h (from 15 to 20 °C/h) would not significantly affectthe energy costs and improved the cov and the sum ofcov and nucleated-to-seed mass ratio.
The temperature profile for minimization of the covand nucleated-to-seed mass ratio drops more quickly forthe first 50 min than for minimization of cov only,reducing the mass ratio by 8-14% (as shown in Table9). The temperature profile for minimization of the covwas implemented experimentally (see Figure 9). Thetemperature was not very well controlled in the crys-tallizer, which simulates the effect of spatial variations
Figure 8. Temperature profiles calculated to minimize (a) thecov (covariance) and (b) the sum of the cov and nucleated-to-seedmass ratio (cov + mr) for the maximum cooling rates of 15 and 20°C/h.
Table 9. Coefficient of Variation (cov), Nucleated-to-Seed Mass Ratio (mr), and Their Sum from Numerical Simulationto Minimize (a) cov and (b) the Sum of cov and the Nucleated-to-Seed Mass Ratio (cov + mr) for Varying Number ofLinear Segments, Maximum Rate of Cooling, and Maximum Rate of Heating
temperature gradient (°C/h) minimum cov minimum cov + mrnumber ofsegments minimum maximum cov mr cov + mr cov mr cov + mr
16 -15 0 1.151 0.228 1.379 1.161 0.209 1.37016 -15 15 1.150 0.228 1.378 1.162 0.208 1.37032 -15 0 1.144 0.232 1.376 1.155 0.209 1.36332 -15 15 1.144 0.232 1.376 1.154 0.209 1.36316 -20 0 1.094 0.244 1.338 1.107 0.211 1.31816 -20 20 1.094 0.244 1.338 1.107 0.211 1.31832 -20 0 1.088 0.246 1.334 1.104 0.211 1.31532 -20 20 1.088 0.246 1.334 1.105 0.209 1.314
Figure 9. Temperature profiles for experiment 1a (currentprocedure), experiment 2 (experiment designed to maximize theinformation content of data), experiment 3 (experiment designedto minimize cov), and the set-point trajectory for experiment 3.
6178 Ind. Eng. Chem. Res., Vol. 43, No. 19, 2004
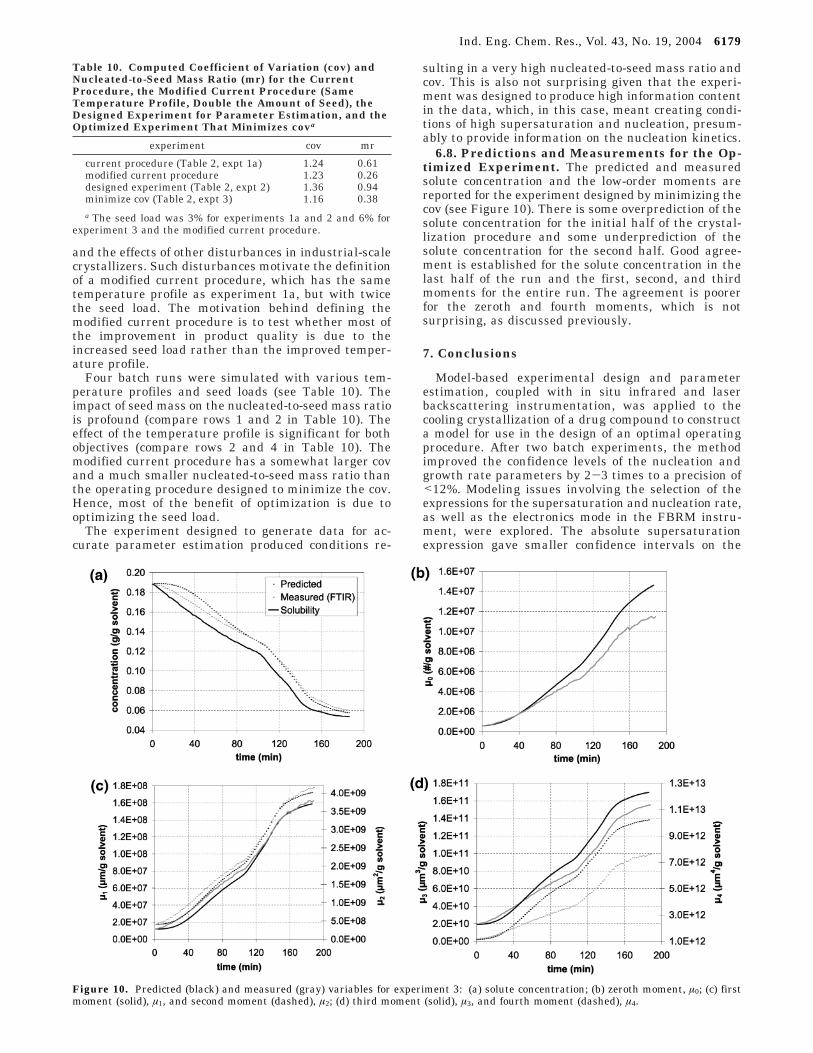
and the effects of other disturbances in industrial-scalecrystallizers. Such disturbances motivate the definitionof a modified current procedure, which has the sametemperature profile as experiment 1a, but with twicethe seed load. The motivation behind defining themodified current procedure is to test whether most ofthe improvement in product quality is due to theincreased seed load rather than the improved temper-ature profile.
Four batch runs were simulated with various tem-perature profiles and seed loads (see Table 10). Theimpact of seed mass on the nucleated-to-seed mass ratiois profound (compare rows 1 and 2 in Table 10). Theeffect of the temperature profile is significant for bothobjectives (compare rows 2 and 4 in Table 10). Themodified current procedure has a somewhat larger covand a much smaller nucleated-to-seed mass ratio thanthe operating procedure designed to minimize the cov.Hence, most of the benefit of optimization is due tooptimizing the seed load.
The experiment designed to generate data for ac-curate parameter estimation produced conditions re-
sulting in a very high nucleated-to-seed mass ratio andcov. This is also not surprising given that the experi-ment was designed to produce high information contentin the data, which, in this case, meant creating condi-tions of high supersaturation and nucleation, presum-ably to provide information on the nucleation kinetics.
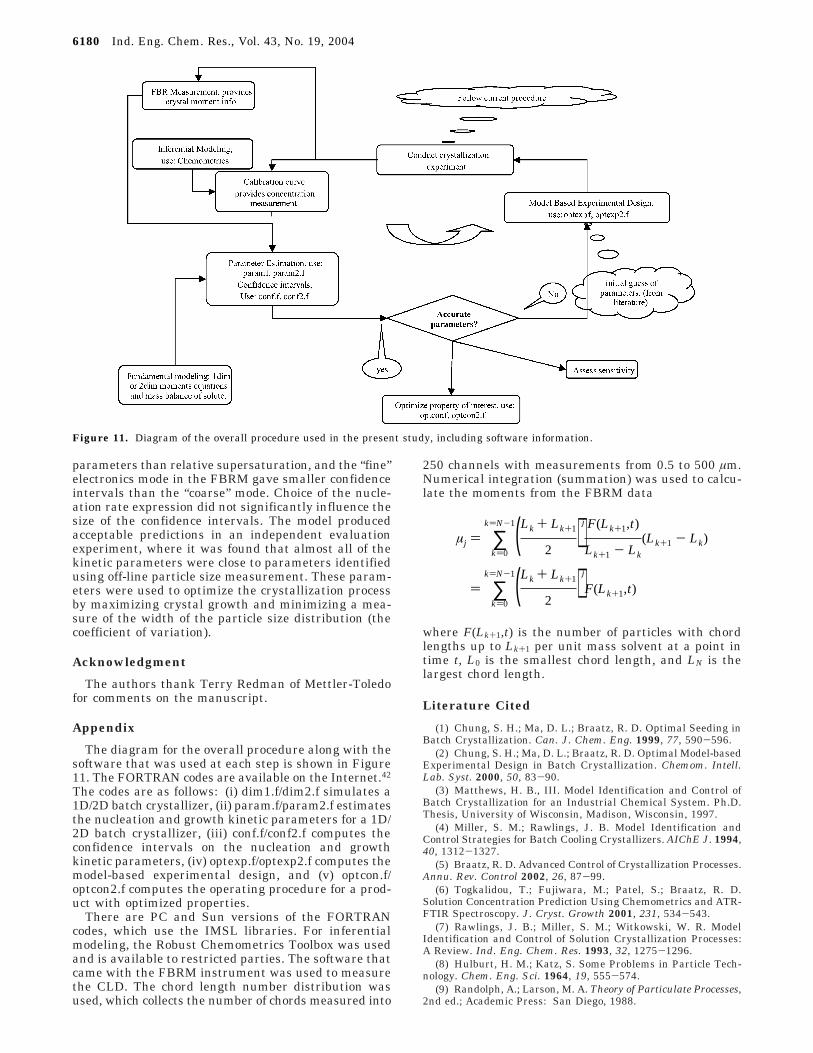
6.8. Predictions and Measurements for the Op-timized Experiment. The predicted and measuredsolute concentration and the low-order moments arereported for the experiment designed by minimizing thecov (see Figure 10). There is some overprediction of thesolute concentration for the initial half of the crystal-lization procedure and some underprediction of thesolute concentration for the second half. Good agree-ment is established for the solute concentration in thelast half of the run and the first, second, and thirdmoments for the entire run. The agreement is poorerfor the zeroth and fourth moments, which is notsurprising, as discussed previously.
7. Conclusions
Model-based experimental design and parameterestimation, coupled with in situ infrared and laserbackscattering instrumentation, was applied to thecooling crystallization of a drug compound to constructa model for use in the design of an optimal operatingprocedure. After two batch experiments, the methodimproved the confidence levels of the nucleation andgrowth rate parameters by 2-3 times to a precision of<12%. Modeling issues involving the selection of theexpressions for the supersaturation and nucleation rate,as well as the electronics mode in the FBRM instru-ment, were explored. The absolute supersaturationexpression gave smaller confidence intervals on the
Table 10. Computed Coefficient of Variation (cov) andNucleated-to-Seed Mass Ratio (mr) for the CurrentProcedure, the Modified Current Procedure (SameTemperature Profile, Double the Amount of Seed), theDesigned Experiment for Parameter Estimation, and theOptimized Experiment That Minimizes cova
experiment cov mr
current procedure (Table 2, expt 1a) 1.24 0.61modified current procedure 1.23 0.26designed experiment (Table 2, expt 2) 1.36 0.94minimize cov (Table 2, expt 3) 1.16 0.38a The seed load was 3% for experiments 1a and 2 and 6% for
experiment 3 and the modified current procedure.
Figure 10. Predicted (black) and measured (gray) variables for experiment 3: (a) solute concentration; (b) zeroth moment, µ0; (c) firstmoment (solid), µ1, and second moment (dashed), µ2; (d) third moment (solid), µ3, and fourth moment (dashed), µ4.
Ind. Eng. Chem. Res., Vol. 43, No. 19, 2004 6179
parameters than relative supersaturation, and the “fine”electronics mode in the FBRM gave smaller confidenceintervals than the “coarse” mode. Choice of the nucle-ation rate expression did not significantly influence thesize of the confidence intervals. The model producedacceptable predictions in an independent evaluationexperiment, where it was found that almost all of thekinetic parameters were close to parameters identifiedusing off-line particle size measurement. These param-eters were used to optimize the crystallization processby maximizing crystal growth and minimizing a mea-sure of the width of the particle size distribution (thecoefficient of variation).
Acknowledgment
The authors thank Terry Redman of Mettler-Toledofor comments on the manuscript.
Appendix
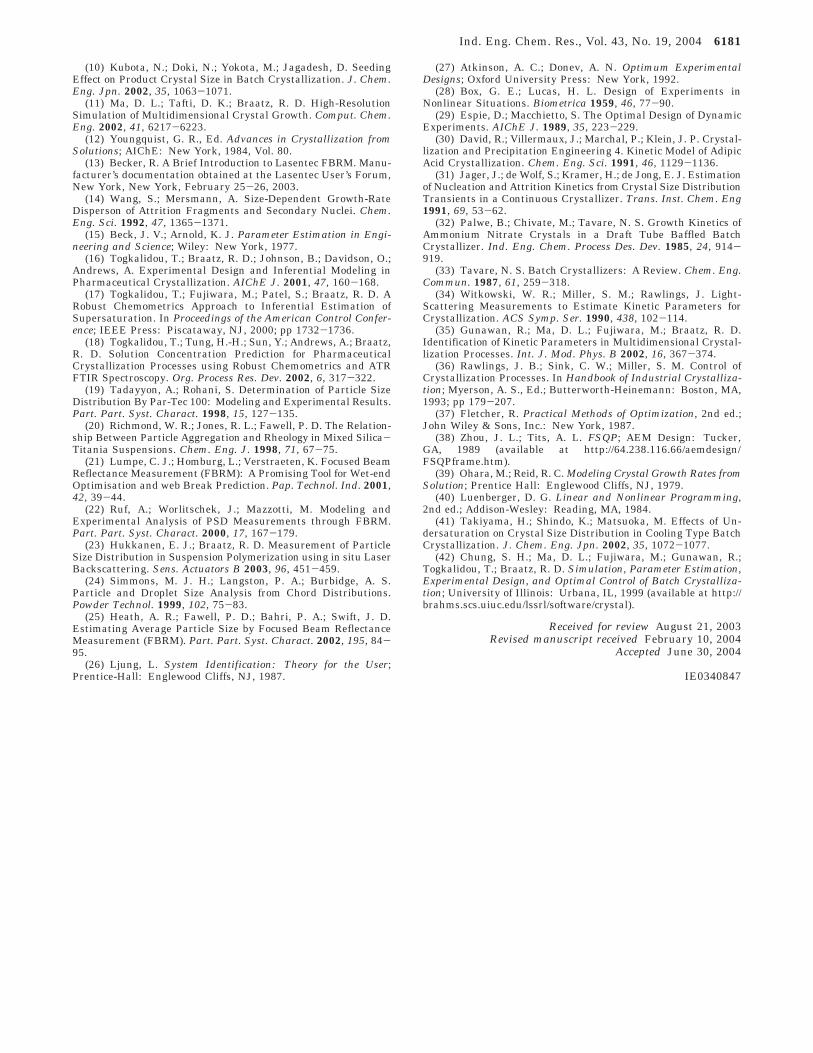
The diagram for the overall procedure along with thesoftware that was used at each step is shown in Figure11. The FORTRAN codes are available on the Internet.42
The codes are as follows: (i) dim1.f/dim2.f simulates a1D/2D batch crystallizer, (ii) param.f/param2.f estimatesthe nucleation and growth kinetic parameters for a 1D/2D batch crystallizer, (iii) conf.f/conf2.f computes theconfidence intervals on the nucleation and growthkinetic parameters, (iv) optexp.f/optexp2.f computes themodel-based experimental design, and (v) optcon.f/optcon2.f computes the operating procedure for a prod-uct with optimized properties.
There are PC and Sun versions of the FORTRANcodes, which use the IMSL libraries. For inferentialmodeling, the Robust Chemometrics Toolbox was usedand is available to restricted parties. The software thatcame with the FBRM instrument was used to measurethe CLD. The chord length number distribution wasused, which collects the number of chords measured into
250 channels with measurements from 0.5 to 500 µm.Numerical integration (summation) was used to calcu-late the moments from the FBRM data
where F(Lk+1,t) is the number of particles with chordlengths up to Lk+1 per unit mass solvent at a point intime t, L0 is the smallest chord length, and LN is thelargest chord length.
Literature Cited
(1) Chung, S. H.; Ma, D. L.; Braatz, R. D. Optimal Seeding inBatch Crystallization. Can. J. Chem. Eng. 1999, 77, 590-596.
(2) Chung, S. H.; Ma, D. L.; Braatz, R. D. Optimal Model-basedExperimental Design in Batch Crystallization. Chemom. Intell.Lab. Syst. 2000, 50, 83-90.
(3) Matthews, H. B., III. Model Identification and Control ofBatch Crystallization for an Industrial Chemical System. Ph.D.Thesis, University of Wisconsin, Madison, Wisconsin, 1997.
(4) Miller, S. M.; Rawlings, J. B. Model Identification andControl Strategies for Batch Cooling Crystallizers. AIChE J. 1994,40, 1312-1327.
(5) Braatz, R. D. Advanced Control of Crystallization Processes.Annu. Rev. Control 2002, 26, 87-99.
(6) Togkalidou, T.; Fujiwara, M.; Patel, S.; Braatz, R. D.Solution Concentration Prediction Using Chemometrics and ATR-FTIR Spectroscopy. J. Cryst. Growth 2001, 231, 534-543.
(7) Rawlings, J. B.; Miller, S. M.; Witkowski, W. R. ModelIdentification and Control of Solution Crystallization Processes:A Review. Ind. Eng. Chem. Res. 1993, 32, 1275-1296.
(8) Hulburt, H. M.; Katz, S. Some Problems in Particle Tech-nology. Chem. Eng. Sci. 1964, 19, 555-574.
(9) Randolph, A.; Larson, M. A. Theory of Particulate Processes,2nd ed.; Academic Press: San Diego, 1988.
Figure 11. Diagram of the overall procedure used in the present study, including software information.
µj ) ∑k)0
k)N-1(Lk + Lk+1
2 )j F(Lk+1,t)
Lk+1 - Lk
(Lk+1 - Lk)
) ∑k)0
k)N-1(Lk + Lk+1
2 )j
F(Lk+1,t)
6180 Ind. Eng. Chem. Res., Vol. 43, No. 19, 2004
(10) Kubota, N.; Doki, N.; Yokota, M.; Jagadesh, D. SeedingEffect on Product Crystal Size in Batch Crystallization. J. Chem.Eng. Jpn. 2002, 35, 1063-1071.
(11) Ma, D. L.; Tafti, D. K.; Braatz, R. D. High-ResolutionSimulation of Multidimensional Crystal Growth. Comput. Chem.Eng. 2002, 41, 6217-6223.
(12) Youngquist, G. R., Ed. Advances in Crystallization fromSolutions; AIChE: New York, 1984, Vol. 80.
(13) Becker, R. A Brief Introduction to Lasentec FBRM. Manu-facturer’s documentation obtained at the Lasentec User’s Forum,New York, New York, February 25-26, 2003.
(14) Wang, S.; Mersmann, A. Size-Dependent Growth-RateDisperson of Attrition Fragments and Secondary Nuclei. Chem.Eng. Sci. 1992, 47, 1365-1371.
(15) Beck, J. V.; Arnold, K. J. Parameter Estimation in Engi-neering and Science; Wiley: New York, 1977.
(16) Togkalidou, T.; Braatz, R. D.; Johnson, B.; Davidson, O.;Andrews, A. Experimental Design and Inferential Modeling inPharmaceutical Crystallization. AIChE J. 2001, 47, 160-168.
(17) Togkalidou, T.; Fujiwara, M.; Patel, S.; Braatz, R. D. ARobust Chemometrics Approach to Inferential Estimation ofSupersaturation. In Proceedings of the American Control Confer-ence; IEEE Press: Piscataway, NJ, 2000; pp 1732-1736.
(18) Togkalidou, T.; Tung, H.-H.; Sun, Y.; Andrews, A.; Braatz,R. D. Solution Concentration Prediction for PharmaceuticalCrystallization Processes using Robust Chemometrics and ATRFTIR Spectroscopy. Org. Process Res. Dev. 2002, 6, 317-322.
(19) Tadayyon, A.; Rohani, S. Determination of Particle SizeDistribution By Par-Tec 100: Modeling and Experimental Results.Part. Part. Syst. Charact. 1998, 15, 127-135.
(20) Richmond, W. R.; Jones, R. L.; Fawell, P. D. The Relation-ship Between Particle Aggregation and Rheology in Mixed Silica-Titania Suspensions. Chem. Eng. J. 1998, 71, 67-75.
(21) Lumpe, C. J.; Homburg, L.; Verstraeten, K. Focused BeamReflectance Measurement (FBRM): A Promising Tool for Wet-endOptimisation and web Break Prediction. Pap. Technol. Ind. 2001,42, 39-44.
(22) Ruf, A.; Worlitschek, J.; Mazzotti, M. Modeling andExperimental Analysis of PSD Measurements through FBRM.Part. Part. Syst. Charact. 2000, 17, 167-179.
(23) Hukkanen, E. J.; Braatz, R. D. Measurement of ParticleSize Distribution in Suspension Polymerization using in situ LaserBackscattering. Sens. Actuators B 2003, 96, 451-459.
(24) Simmons, M. J. H.; Langston, P. A.; Burbidge, A. S.Particle and Droplet Size Analysis from Chord Distributions.Powder Technol. 1999, 102, 75-83.
(25) Heath, A. R.; Fawell, P. D.; Bahri, P. A.; Swift, J. D.Estimating Average Particle Size by Focused Beam ReflectanceMeasurement (FBRM). Part. Part. Syst. Charact. 2002, 195, 84-95.
(26) Ljung, L. System Identification: Theory for the User;Prentice-Hall: Englewood Cliffs, NJ, 1987.
(27) Atkinson, A. C.; Donev, A. N. Optimum ExperimentalDesigns; Oxford University Press: New York, 1992.
(28) Box, G. E.; Lucas, H. L. Design of Experiments inNonlinear Situations. Biometrica 1959, 46, 77-90.
(29) Espie, D.; Macchietto, S. The Optimal Design of DynamicExperiments. AIChE J. 1989, 35, 223-229.
(30) David, R.; Villermaux, J.; Marchal, P.; Klein, J. P. Crystal-lization and Precipitation Engineering 4. Kinetic Model of AdipicAcid Crystallization. Chem. Eng. Sci. 1991, 46, 1129-1136.
(31) Jager, J.; de Wolf, S.; Kramer, H.; de Jong, E. J. Estimationof Nucleation and Attrition Kinetics from Crystal Size DistributionTransients in a Continuous Crystallizer. Trans. Inst. Chem. Eng1991, 69, 53-62.
(32) Palwe, B.; Chivate, M.; Tavare, N. S. Growth Kinetics ofAmmonium Nitrate Crystals in a Draft Tube Baffled BatchCrystallizer. Ind. Eng. Chem. Process Des. Dev. 1985, 24, 914-919.
(33) Tavare, N. S. Batch Crystallizers: A Review. Chem. Eng.Commun. 1987, 61, 259-318.
(34) Witkowski, W. R.; Miller, S. M.; Rawlings, J. Light-Scattering Measurements to Estimate Kinetic Parameters forCrystallization. ACS Symp. Ser. 1990, 438, 102-114.
(35) Gunawan, R.; Ma, D. L.; Fujiwara, M.; Braatz, R. D.Identification of Kinetic Parameters in Multidimensional Crystal-lization Processes. Int. J. Mod. Phys. B 2002, 16, 367-374.
(36) Rawlings, J. B.; Sink, C. W.; Miller, S. M. Control ofCrystallization Processes. In Handbook of Industrial Crystalliza-tion; Myerson, A. S., Ed.; Butterworth-Heinemann: Boston, MA,1993; pp 179-207.
(37) Fletcher, R. Practical Methods of Optimization, 2nd ed.;John Wiley & Sons, Inc.: New York, 1987.
(38) Zhou, J. L.; Tits, A. L. FSQP; AEM Design: Tucker,GA, 1989 (available at http://64.238.116.66/aemdesign/FSQPframe.htm).
(39) Ohara, M.; Reid, R. C. Modeling Crystal Growth Rates fromSolution; Prentice Hall: Englewood Cliffs, NJ, 1979.
(40) Luenberger, D. G. Linear and Nonlinear Programming,2nd ed.; Addison-Wesley: Reading, MA, 1984.
(41) Takiyama, H.; Shindo, K.; Matsuoka, M. Effects of Un-dersaturation on Crystal Size Distribution in Cooling Type BatchCrystallization. J. Chem. Eng. Jpn. 2002, 35, 1072-1077.
(42) Chung, S. H.; Ma, D. L.; Fujiwara, M.; Gunawan, R.;Togkalidou, T.; Braatz, R. D. Simulation, Parameter Estimation,Experimental Design, and Optimal Control of Batch Crystalliza-tion; University of Illinois: Urbana, IL, 1999 (available at http://brahms.scs.uiuc.edu/lssrl/software/crystal).
Received for review August 21, 2003Revised manuscript received February 10, 2004
Accepted June 30, 2004
IE0340847
Ind. Eng. Chem. Res., Vol. 43, No. 19, 2004 6181
Copyright © 2022 FDOKUMEN