Low-coherence enhanced backscattering: review of principles and applications for colon cancer...
10
Low-coherence enhanced backscattering: review of principles and applications for colon cancer screening Young L. Kim Vladimir M. Turzhitsky Yang Liu Northwestern University Biomedical Engineering Department Evanston, Illinois 60208 Hemant K. Roy Ramesh K. Wali Evanston-Northwestern Healthcare Department of Medicine Evanston, Illinois 60201 Hariharan Subramanian Prabhakar Pradhan Northwestern University Biomedical Engineering Department Evanston, Illinois 60208 Vadim Backman Northwestern University Biomedical Engineering Department Evanston, Illinois 60208 and Evanston-Northwestern Healthcare Department of Medicine Evanston, Illinois 60201 Abstract. The phenomenon of enhanced backscattering EBS of light, also known as coherent backscattering CBS of light, has been the object of intensive investigation in nonbiological media over the last two decades. However, there have been only a few attempts to explore EBS for tissue characterization and diagnosis. We have re- cently made progress in the EBS measurements in tissue by taking advantage of low spatial coherence illumination, which has led us to the development of low-coherence enhanced backscattering LEBS spectroscopy. In this work, we review the current state of research on LEBS. After a brief discussion of the basic principle of EBS and LEBS, we present an overview of the unique features of LEBS for tissue char- acterization, and show that LEBS enables depth-selective spectro- scopic assessment of mucosal tissue. Then, we demonstrate the po- tential of LEBS spectroscopy for predicting the risk of colon carcinogenesis and colonoscopy-free screening for colorectal cancer CRC. © 2006 Society of Photo-Optical Instrumentation Engineers. DOI: 10.1117/1.2236292 Keywords: coherent backscattering; enhanced backscattering; low coherence; elas- tic light scattering; spectroscopy; colorectal cancer. Paper 05271SSR received Sep. 22, 2005; revised manuscript received Dec. 1, 2005; accepted for publication Jan. 6, 2006; published online Jul. 24, 2006. 1 Introduction Enhanced backscattering EBS of light, otherwise known as coherent backscattering CBS of light, originates from the constructive interference in elastic light scattering, giving rise to an enhanced scattered intensity in the backward direction. For a plane wave illuminating a semi-infinite random me- dium, every photon scattered from the medium in the back- ward direction has a time-reversed photon traveling along the same path in the opposite direction, i.e., the path formed by exactly opposite sequences of the scattering centers. These photons have the same phase and thus interfere constructively with each other, resulting in an EBS peak sometimes referred to as an EBS cone around the backward direction. Since its first observations in aqueous suspensions, 1–3 the EBS phe- nomenon has been an object of intensive investigation in a variety of different systems such as strong scattering materials, 4 laser-cooled atoms, 5 liquid crystals, 6 photonic crystals, 7 amplifying materials, 8,9 and solar system bodies. 10 The EBS peak profile is further characterized by the distribu- tion of path lengths of backscattered photons. The dependency of the profile of the EBS peak on the distribution of the path length was studied using femtosecond-resolved measurements in time domain. 11,12 EBS measurements were extended to the time-resolved phase-space distributions of the backscattered light, and it was found that for longer light paths the momen- tum distribution of the backscattered light was narrowed. 13 It was also shown that absorption and a finite thickness of samples removed long light paths, which made the top of the EBS peak round off. 14,15 In active random media such as ran- dom lasers, long paths were amplified and the shape of the EBS peak sharpened. 8,9 Moreover, dephasing effects, which destroy interference in the EBS phenomenon in elastic light scattering, were investigated. Faraday rotation by an external magnetic field 16,17 or a phase screw dislocation in the incident field 18 can destroy the time-reversal invariance, resulting in a distorted EBS peak. Indeed, this fascinating phenomenon has opened up a new field in classical optics, and a great amount of theoretical and experimental work already has been done in this area over the last two decades. However, there have been only a few reports of EBS ob- servation in biological media, and no attempt has been made to use EBS for tissue diagnosis. 19–21 Yoo et al. 19,20 first pio- neered EBS in biological tissue. Yoon, Roy, and Straight 21 also used the EBS phenomenon to measure optical properties of tissue such as the transport mean free path. There is an apparent disparity between hundreds of publications dealing 1083-3668/2006/114/041125/10/$22.00 © 2006 SPIE Address all correspondence to Young Kim, Biomedical Engineering Department, Northwestern University, 2145 Sheridan Rd. #E310, Evanston, IL 60208; Tel: 847–491–7167; Fax: 847–491–4928; Email: [email protected] Journal of Biomedical Optics 114, 041125 July/August 2006 Journal of Biomedical Optics July/August 2006 Vol. 114 041125-1
-
Upload
independent -
Category
Documents
-
view
3 -
download
0
Transcript of Low-coherence enhanced backscattering: review of principles and applications for colon cancer...
Journal of Biomedical Optics 11�4�, 041125 �July/August 2006�
Low-coherence enhanced backscattering: review ofprinciples and applications for colon cancer screening
Young L. KimVladimir M. TurzhitskyYang LiuNorthwestern UniversityBiomedical Engineering DepartmentEvanston, Illinois 60208
Hemant K. RoyRamesh K. WaliEvanston-Northwestern HealthcareDepartment of MedicineEvanston, Illinois 60201
Hariharan SubramanianPrabhakar PradhanNorthwestern UniversityBiomedical Engineering DepartmentEvanston, Illinois 60208
Vadim BackmanNorthwestern UniversityBiomedical Engineering DepartmentEvanston, Illinois 60208
andEvanston-Northwestern HealthcareDepartment of Medicine
Abstract. The phenomenon of enhanced backscattering �EBS� oflight, also known as coherent backscattering �CBS� of light, has beenthe object of intensive investigation in nonbiological media over thelast two decades. However, there have been only a few attempts toexplore EBS for tissue characterization and diagnosis. We have re-cently made progress in the EBS measurements in tissue by takingadvantage of low spatial coherence illumination, which has led us tothe development of low-coherence enhanced backscattering �LEBS�spectroscopy. In this work, we review the current state of research onLEBS. After a brief discussion of the basic principle of EBS and LEBS,we present an overview of the unique features of LEBS for tissue char-acterization, and show that LEBS enables depth-selective spectro-scopic assessment of mucosal tissue. Then, we demonstrate the po-tential of LEBS spectroscopy for predicting the risk of coloncarcinogenesis and colonoscopy-free screening for colorectal cancer�CRC�.© 2006 Society of Photo-Optical Instrumentation Engineers. �DOI: 10.1117/1.2236292�
Keywords: coherent backscattering; enhanced backscattering; low coherence; elas-tic light scattering; spectroscopy; colorectal cancer.Paper 05271SSR received Sep. 22, 2005; revised manuscript received Dec. 1, 2005;accepted for publication Jan. 6, 2006; published online Jul. 24, 2006.
Evanston, Illinois 60201
1 Introduction
Enhanced backscattering �EBS� of light, otherwise known ascoherent backscattering �CBS� of light, originates from theconstructive interference in elastic light scattering, giving riseto an enhanced scattered intensity in the backward direction.For a plane wave illuminating a semi-infinite random me-dium, every photon scattered from the medium in the back-ward direction has a time-reversed photon traveling along thesame path in the opposite direction, i.e., the path formed byexactly opposite sequences of the scattering centers. Thesephotons have the same phase and thus interfere constructivelywith each other, resulting in an EBS peak �sometimes referredto as an EBS cone� around the backward direction. Since itsfirst observations in aqueous suspensions,1–3 the EBS phe-nomenon has been an object of intensive investigation in avariety of different systems such as strong scatteringmaterials,4 laser-cooled atoms,5 liquid crystals,6 photoniccrystals,7 amplifying materials,8,9 and solar system bodies.10
The EBS peak profile is further characterized by the distribu-tion of path lengths of backscattered photons. The dependencyof the profile of the EBS peak on the distribution of the pathlength was studied using femtosecond-resolved measurements
Address all correspondence to Young Kim, Biomedical Engineering Department,Northwestern University, 2145 Sheridan Rd. #E310, Evanston, IL 60208; Tel:
847–491–7167; Fax: 847–491–4928; Email: [email protected]Journal of Biomedical Optics 041125-
in time domain.11,12 EBS measurements were extended to thetime-resolved phase-space distributions of the backscatteredlight, and it was found that for longer light paths the momen-tum distribution of the backscattered light was narrowed.13 Itwas also shown that absorption and a finite thickness ofsamples removed long light paths, which made the top of theEBS peak round off.14,15 In active random media such as ran-dom lasers, long paths were amplified and the shape of theEBS peak sharpened.8,9 Moreover, dephasing effects, whichdestroy interference in the EBS phenomenon in elastic lightscattering, were investigated. Faraday rotation by an externalmagnetic field16,17 or a phase screw dislocation in the incidentfield18 can destroy the time-reversal invariance, resulting in adistorted EBS peak. Indeed, this fascinating phenomenon hasopened up a new field in classical optics, and a great amountof theoretical and experimental work already has been done inthis area over the last two decades.
However, there have been only a few reports of EBS ob-servation in biological media, and no attempt has been madeto use EBS for tissue diagnosis.19–21 Yoo et al.19,20 first pio-neered EBS in biological tissue. Yoon, Roy, and Straight21
also used the EBS phenomenon to measure optical propertiesof tissue such as the transport mean free path. There is anapparent disparity between hundreds of publications dealing
1083-3668/2006/11�4�/041125/10/$22.00 © 2006 SPIE
July/August 2006 � Vol. 11�4�1
Kim et al.: Low-coherence enhanced backscattering¼
with EBS in nonbiological media and a small number of re-ports on EBS for tissue characterization. The question whythis fascinating effect has been underutilized in tissue opticsarises, although many other optical phenomena, includingelastic light scattering, fluorescence, Raman scattering, non-linear scattering, etc., have found a plethora of applicationsand have been extensively used for tissue diagnosis.
The reason becomes clear if one considers the limitationsthat have been preventing the utilization of this otherwise re-markable optical phenomenon for biological applications. 1.Applications of conventional EBS in biological media havebeen hampered primarily by an extremely narrow angularwidth of the EBS peak �w�0.001 deg�. Because the angularwidth of an EBS peak is proportional to the ratio of wave-length � of light to the transport mean free path ls
* of light inthe medium �in biological tissue, ls
*�300 to 2000 �m �Ref.22��, the width of the EBS peak in tissue is very narrow,typically w�0.001 deg �w is the angular full width at halfmaximum of an EBS peak�. Experimental observation of sucha narrow EBS peak has only recently been achieved in pio-neering experiments by Sapienza et al.6 For comparison, mostEBS studies conducted to date involved nonbiological mediawith ls
*�10–50 �m �i.e., w�0.05 to 0.3 deg� 2. Such nar-row EBS peaks have been primarily used to measure ls
* ofbulk tissue, typically averaged over several cubic millimeters.However, we point out that other conventional techniques,such as diffuse reflectance measurements,23 transmissionmeasurements,24 and the adding-doubling method,25 can alsodetermine ls
* in random media without using the self-interference effect of the time-reversed paths. 3. ConventionalEBS is masked by speckle. Ensemble averaging over hun-dreds of measurements or mechanical rotation of a sample isnecessary to uncover an EBS peak.21,26,27 4. ConventionalEBS does not provide spectroscopic information. So far, EBSmeasurements have relied on single-wavelength lasers, whichdo not allow spectrally resolved EBS measurements. Aplethora of data has been obtained by a number of investiga-tors showing that spectroscopic measurements of tissue opti-cal properties are exceedingly valuable for tissue diagnosis.Thus, spectrally resolved EBS measurements are highly desir-able. 5. Conventional EBS does not allow depth resolution.Because most biological tissues have multilayered structures,depth-selective measurements are crucial. However, depth-selective EBS measurements have not been achieved in tissue.
We have recently overcome all major limitations of theEBS measurements in tissue by taking advantage of low spa-tial coherence illimination.28–30 The finite spatial coherencelength of illumination dephases the conjugated time-reversedwaves outside its spatial coherence area. As discussed later,such low-coherence EBS �LEBS� significantly simplifies EBSobservation in tissue, offering several critical advantages suchas speckle reduction, dramatic broadening of the EBS peak,sensitivity to low-order scattering, and depth-selective mea-surements of tissue properties. Investigation of LEBS is fur-ther underscored by our demonstration that LEBS spectros-copy can be used to detect early precancerous alterations inthe colon far earlier than is currently feasible by means of anyavailable histological, molecular, and even genetic
28–31
technique.Journal of Biomedical Optics 041125-
In this work, we review recent progress in the understand-ing of the mechanism of the LEBS phenomenon and its ap-plications for colon cancer detection and screening. First, weprovide an overview of basic principles of EBS and LEBS. InSec. 2, we introduce the basic principle of EBS and LEBS. InSec. 3, we present the experimental setup of LEBS spectros-copy and discuss LEBS advantages over conventional EBS.Finally, in Sec. 4, we report animal and pilot human studiesthat demonstrate the potential of LEBS for colon cancer de-tection and screening.
2 Background2.1 Principles of Enhanced BackscatteringFor a plane wave illuminating a semi-infinite random me-dium, every photon scattered from the medium in the back-ward direction has a time-reversed photon traveling along thesame path in the opposite direction, i.e., the paths formed byexactly opposite sequences of scattering centers. The phasedifference between these two waves following the identicalpath in time-reversed order is ��= ��in+�out� · �rin−rout�, asshown in Fig. 1. The phase difference must be sufficientlysmall for constructive interference to occur. For backscatteredlight, �in+�out→0, the phase difference becomes very small,and thus, the two waves following the time-reversed pathsinterfere with each other constructively. This constructive in-terference occurs in the backscattering direction, whereas indirections sufficiently away from the backward direction, theconstructive interference vanishes. In principle, the peak EBSintensity can be twice as high as the incoherent intensity scat-tered outside the EBS peak �in EBS literature, this intensity isfrequently referred to as the “background intensity”�.
The EBS phenomenon can be understood in the context ofYoung’s double pinhole interference experiment. Conceptu-ally, the first and last scatterers in EBS can be considered thedouble pinholes in the Young’s double pinhole experiment. Aplane wave passing the double pinholes produces a sinusoidalfringe pattern in the far field. Its maximum intensity is formedat �=0 deg and its fringe spacing is inversely proportional tothe distance between the pinholes. Similarly, in EBS a planewave passing the first and last scatterers through the time-
Fig. 1 Illustration of the EBS phenomenon. EBS originates from theconstructive interference between pairs of photons propagating alonga scattering light path �solid arrows� and its time-reversed path�dashed arrows� in the case when the photons exit the medium indirections close to the backscattering ��→0 deg�. When both wavesemerge from the medium, they have an identical phase. Thus, theyinterfere constructively with each other, resulting in an enhanced scat-tered intensity in the backward direction.
reversed paths would produce a sinusoidal fringe pattern with
July/August 2006 � Vol. 11�4�2

Kim et al.: Low-coherence enhanced backscattering¼
its maximum intensity in the backward direction. Its fringespacing is inversely proportional to the transverse distancebetween the first and last scatterers. In EBS, all possible trans-verse distances between the first and last scatterers averageout the fringe patterns except the backward direction, result-ing in an enhanced peak. Therefore, the width of the enhancedpeak is primarily dependent on the average distance betweenthe first and last scatterers �i.e., the transport mean free pathls*= ls / �1−g�, where ls is the scattering mean free path and g
is the anisotropy factor�, such that the full width half maxi-mum �FWHM� of the EBS peak in a semi-infinite disorderedmedium w�� / �3�ls
*��0.7/ ��ls*�, where � and � are the
wavelength and wavevector of light, respectively. Thus, inconventional EBS measurements, the profile of the EBS peakis mainly determined by the inverse of the disorder parameter�ls
* �or ls* /��.
2.2 Angular Profile of Enhanced BackscatteringQuantitatively, the angular profile of an EBS peak IEBS��� canbe expressed as a 2-D Fourier transform of the radial intensitydistribution of EBS32,33:
IEBS�q�� =� � P�r�exp�iq� · r�d2r , �1�
where q� is the projection of the wave vector onto the planeorthogonal to the backward direction �q�=2�� /��, back-scattering angle � is measured from the backscattering direc-tion �i.e., �=0 deg corresponds to light reflected from tissuein the direction opposite to the incident light�, and P�r� is theprobability of the radial intensity distribution of EBS photonswith the radial vector r pointing from the first to the lastpoints on a conjugated time-reversed light path �r is perpen-dicular to the incident light�. If a medium is isotropic, the 2-DFourier integral in Eq. �1� becomes:
IEBS��� ��0
rP�r�exp�i2�r�/��dr . �2�
Thus, IEBS��� is the Fourier transform of radial intensity dis-tribution rP�r�. As a result, the width of an EBS peak isinversely related to that of rP�r�. Furthermore, from Eq. �2�one can conclude that in an EBS peak, longer light pathscorrespond to small scattering angles, while shorter lightpaths correspond to larger scattering angles.
2.3 Principles of Low-Coherence EnhancedBackscattering
In EBS, the conjugated time-reversed waves can interferewith each other only when they are spatially coherent, that is,the first and last points on the scattering path must be withinthe coherence area.30,34 Most previous EBS measurementshave been conducted using coherent laser light sources withspatial coherence length Lsc ls
*. Under such spatially coher-ent illumination, essentially any conjugate time-reversedwaves emerging from the surface of the sample are capable ofinterfering with each other. However, if light incident on asample has a finite spatial coherence length, the conjugated
time-reversed waves can interfere constructively with eachJournal of Biomedical Optics 041125-
other only if they are spatially coherent.34 Thus, the angularprofile of an EBS intensity IEBS��� under low spatial coher-ence illumination can be expressed as:
IEBS��� ��0
C�r�rP�r�exp�i2�r�/��dr , �3�
where C�r�= �2J1�r /Lsc� / �r /Lsc�� is the degree of spatial co-herence with J1 as the first-order Bessel function.35 As a re-sult, the width of an LEBS peak is inversely proportional tothat of the product rP�r�C�r�. A finite spatial coherence areaacts as a spatial window rejecting long paths by preventinglong traveling waves from interfering with each other. In otherwords, spatial coherence length limits r contributing to theEBS signal.
Incoherent waves have no correlations in phase and gener-ate only the incoherent background intensity. If Lsc is suffi-ciently short, i.e., Lsc� ls
*, low spatial coherence illuminationallows only low-order scattering to give rise to the EBS peak,which in turn results in a dramatic �e.g., several orders ofmagnitude� broadening of an EBS peak. As discussed later,such an anomalously broad width of EBS could not be ex-plained by simple diffusion-theory-based models of EBS.
3 Low-Coherence Enhanced BackscatteringSpectroscopy
3.1 Low-Coherence Enhanced BackscatteringInstrument
To overcome the limitations in conventional EBS measure-ments in tissue, we have recently developed low-coherenceenhanced backscattering �LEBS� spectroscopy by combiningEBS measurements with low spatial coherence, broadband il-
28,30
Fig. 2 LEBS spectroscopy instrument. C: condenser, L: lenses, A: ap-ertures, P: polarizers, M: mirror, B: beamsplitter, SS: sample stage, andSP: imaging spectrograph. The entrance slit of the imaging spec-trograph is in the focal plane of lens L3. Thus, all scattered light rayswith an identical scattering angle � are focused into the same point onthe entrance slit. The spectrograph disperses this light in the directionperpendicular to the slit according to its wavelengths. Thus, the CCDrecords a matrix of scattered intensities as a function of wavelengthand scattering angle IEBS�� ,��.
lumination, and spectrally resolved detection. Figure 2 il-
July/August 2006 � Vol. 11�4�3

Kim et al.: Low-coherence enhanced backscattering¼
lustrates the design of an LEBS instrument. A beam of broad-band cw light from a 100-W xenon lamp �Spectra-PhysicsOriel Instruments, Stratford, Connecticut� was collimated us-ing a 4-f lens system �divergence angle ranging from�0.04 deg for Lsc=200 �m to �0.30 deg for Lsc=35 �m�,polarized, and delivered onto a sample at �10 deg angle ofincidence to prevent the collection of specular reflection. Bychanging the aperture size in the 4-f lens system, we variedthe spatial coherence length Lsc of the incident light from200 to 35 �m. The spatial coherence length was confirmedby double-slit interference experiments.35 The light backscat-tered by the sample was collected by a sequence of a lens, alinear analyzer �Lambda Research Optics, Incorporated, CostaMesa, California�, and an imaging spectrograph �SpectraPro-150, Acton Research, Acton, Massachusetts�. The spec-trograph was positioned in the focal plane of the lens andcoupled with a charge-coupled device �CCD� camera �Cool-Snap HQ, Princeton Instruments Incorporated, Trenton, NewJersey�. The lens projected the angular distribution of thebackscattered light onto the slit of the spectrograph. Then, theimaging spectrograph dispersed this light according to itswavelength in the directions perpendicular to the slit, and pro-jected it onto the CCD camera. Thus, the CCD camera re-corded a matrix of light-scattering intensities as a function ofwavelength � and backscattering angle �. In each CCD pixel,collected light was integrated within a certain narrow band ofwavelengths around �. The width of this band was determinedby the width of the spectrograph slit. Because the temporalcoherence of light Ltc was related to its spectral composition,finite-spectral band detection resulted in low temporal coher-ence detection. Accordingly, Ltc was dependent on the spectralresolution of the spectrograph, such that Ltc
=�2 ln 2� /� · ��2 /���=30 �m, where ��=9 nm is theFWHM of the detection bandpass. We also used a He-Ne laser�Melles Griot, Carlsbad, California� to compare our measure-ments to the conventional EBS measurements under coherent
Fig. 3 �a� Representative LEBS intensity signal IEBS�� ,�� obtained=110 �m�. �b� Typical LEBS intensity spectrum in the backward direcaccounts for the most spectral variance of the LEBS intensity signal.
illumination.
Journal of Biomedical Optics 041125-
3.2 Characteristics of Low-Coherence EnhancedBackscattering
3.2.1 Spectroscopic measurementsUsing LEBS spectroscopy, EBS profiles can be observed as afunction of wavelength as shown in Fig. 3�a�. The design ofthe LEBS spectroscopy instrument enables simultaneous mea-surement of the spectral ��=400 to 700 nm� and scatteringangle ��=−5 to 5 deg� distributions of backscattered light.Several spectroscopic techniques have been shown to behighly useful for tissue diagnosis and characterization includ-ing reflectance, light scattering, fluorescence, and other typesof spectroscopy. Consequently, the analysis of EBS spectramay be used to provide additional information about tissue.
3.2.2 Speckle reductionThe experimental observation of EBS requires ensemble orconfiguration averaging because of speckle, which arises fromrandom interference effects. For example, rotating the samplemechanically or averaging independent measurements arecommonly used in conventional EBS measurements. Specklebecomes more severe in the absence of Brownian motion,hampering EBS studies in biological tissue.21 However, LEBSovercomes this problem. Figure 4�a� shows the angular distri-bution of the backscattered light obtained from ex vivo humancolon tissue using coherent illumination �i.e., He-Ne laser�.Evidently, the speckle pattern masks an EBS peak. To uncoveran EBS peak from the background of speckle, averaging overthousands of independent measurements is required. On theother hand, Fig. 4�b� shows that in the case of the LEBSsignal recorded from the same tissue site, speckle is negligibleand a cusp of an enhanced backscattering peak can be easilyidentified. Both low spatial coherence illumination and lowtemporal coherence detection result in speckle reduction. Inour LEBS measurements, a single LEBS reading averagesover multiple independent coherence volumes �each coher-
uman colonic tissue using the LEBS spectroscopy instrument �Lsc
BS��=0 deg,��, from �a�. A linear fit to IEBS��� using linear regression
from htion IEence volume generated an independent speckle volume�. For
July/August 2006 � Vol. 11�4�4

Kim et al.: Low-coherence enhanced backscattering¼
example, for Lsc�150 �m, the number of independent co-herence volumes �D /Lsc�2� �l /Ltc��1000, where D is thediameter of illumination area on the sample and l is the aver-age path length. Therefore, LEBS measurements are easilyachieved in random media, even in the absence of Brownianmotion without the need for ensemble or configuration aver-aging.
3.2.3 Anomalous broadening of enhancedbackscattering peaks
Broadening of EBS under low coherence illumination is per-haps the most dramatic feature of the LEBS phenomenon. Italso facilitates experimental observation of LEBS. Since thewidth of a conventional EBS peak in general is inversely pro-portional to ls
*, the width of an EBS peak in tissue and otherrandom media with long ls
* is extremely narrow, typically w�0.001 deg. On the other hand, an LEBS peak is extremelybroad with w�0.5 deg, which is more than 100 times greaterthan the width of a conventional EBS peak expected underspatially coherent illumination. Such a dramatic increase inthe LEBS peak width cannot be explained using conventionaldiffusion-approximation-based models of EBS, because scat-tering angles of photons leaving a tissue are not typicallyconsidered in modeling of conventional EBS in the diffusionregime �Lsc ls
*�. Although simple substitution of P�r� fromthe diffusion approximation into Eq. �3� predicts a broaderLEBS peak, the LEBS peak observed experimentally is stillnearly four times broader than that of the simple predictionfrom a diffusion approximation. This extra broadening ofIEBS��� results from a narrower profile of P�r� than that pre-dicted by the diffusion approximation when r � ls and � isclose to the backward direction.
3.2.4 Depth-selective low-coherence enhancedbackscattering measurements
Depth-selective LEBS spectroscopy of tissue can be achievedby three means: 1. varying coherence length Lsc, 2. analysis ofLEBS spectra IEBS��� at different scattering angles �, and 3.analysis of the probability of the radial intensity distribution
Fig. 4 LEBS enables substantial reduction of speckle. �a� The angulartissue using a coherent illumination �He-Ne laser, �=632 nm�. An EBSintensity from the identical tissue site recorded using the LEBS spectrosobstructed by speckle can be clearly identified.
of LEBS photons P�r�, which can be obtained via the Fourier
Journal of Biomedical Optics 041125-
transform of IEBS���. In brief, Lsc determines the maximumpenetration depth. Then, detailed depth-resolution can be ob-tained by either means 2 or 3.
Control of tissue depth probed with LEBS via coherencelength. Only photons emerging from the tissue surface at dis-tances r �Lsc from their point of entry into the tissue cancontribute to LEBS, which limits the depth of penetration ofLEBS photons to up to �Lsc.
Control of tissue depth probed with LEBS via the analysisof IEBS��� at different �. As discussed before, becauseIEBS��� is the Fourier transform of P�r�, short light paths�small r� mainly give rise to the periphery of an EBS peak�large ��, while longer light paths �r�Lsc� give rise to the top�or center� of the EBS peak ��→0 deg�.29 This property ofLEBS can be used to sample various depths using a singleLEBS measurement by analyzing IEBS��� at different �. Fig-ure 5�a� shows LEBS penetration depth Lp��� for ls=81 �mand ls
*=614 �m. As expected, small � correspond to deeperpenetration depths, whereas large � correspond to shorterdepths. Therefore, different depths can be selectively assessedby probing a corresponding scattering angle. For example, inthe case of colonic mucosa, IEBS��=0.25 deg� enables assess-ment of an epithelial cell layer ��40 �m�, whereas IEBS��=0 deg� allows probing the entire mucosa ��70 �m�.
Control of tissue depth probed with LEBS via the analysisof P�r� at different r. A more precise control of tissue depthprobed with LEBS can be achieved by means of the analysisof P�r�,29 which in turn can be obtained from the Fouriertransform of IEBS���. It is well known that the depth of pen-etration of photons increases with r. As shown in Fig. 5�b�,tissue depths from �40 �m �a single cell layer� to �100 �m�thickness of colonic mucosa� can be selectively assessed bymeans of the analysis of P�r ,�� by choosing appropriate pa-rameter r. We also point out that a direct measurement of P�r�for small r �r 300 �m� is extremely difficult.36
The three means to achieve depth-selective measurements
tion of backscattered intensity obtained from ex vivo human colonicis masked by severe speckle. �b� The angular profile of backscatteredstrument �xenon lamp, Lsc=110 �m, �=647 nm�. A cusp of LEBS not
distribupeak
copy in
of tissue discussed before are complimentary. Thus, LEBS
July/August 2006 � Vol. 11�4�5

Kim et al.: Low-coherence enhanced backscattering¼
spectroscopy opens up the possibility of performing spectro-scopic measurements at any given depth within the maximumpenetration depth determined by Lsc.
The significance of depth-selective spectroscopic measure-ments for tissue characterization and diagnosis is underscoredby the following reasons. 1. The most superficial tissue layer�i.e., the epithelium� is the origin of nearly 90% of humancancers and the epithelial cells are the first affected incarcinogenesis.37 Thus, obtaining diagnostic information frommost superficial tissue is crucial for the early diagnosis ofepithelial precancerous lesions. 2. Hemoglobin absorption inthe blood vessels located underneath the epithelium is a par-ticularly notorious problem, as it obscures the endogenousspectral signatures of epithelial cells. 3. The depth-dependentbiological heterogeneity of the epithelium underscores theneed to selectively assess the epithelial cells at differentdepths. For example, in the colon �the major unit of organi-zation of the mucosa is the crypt�, the epithelial cells at thebase of the crypt ��80 �m below the tissue surface� are ca-pable of proliferation, while the epithelial cells at the top ofthe crypt ��40 �m� undergo apoptosis, as illustrated in Fig.6. In adenomatous colonic mucosa, the apoptotic activity isreduced in the base of the crypt while the proliferative activityis increased in the lumenal surface of the colon.38 The cellsthat are initially involved in neoplastic transformations arelocated in a specific area of the crypt: the base of the crypt isknown as the location for initiation of colon carcinogenesis.39
Fig. 5 �a� LEBS depth of penetration Lp��� as a function of � �ls=81 ��=0 deg corresponds to the direction opposite to that of the incident liof r �ls=81 �m and ls
*=614 �m�. Lp�r� increases with r. Thus, differenEBS peak �see text for details�.
Fig. 6 The crypt: the major unit of the colonic mucosa. The epithelialcells have distinct cell activities at various depths. Typical depth of a
colonic crypt is 70 to 90 �m.Journal of Biomedical Optics 041125-
Similar considerations apply to most other types of epithelia,including stratified squamous epithelium �such as the epithe-lium of uterine cervix, oral cavity, etc.�.
4 Potential Application of Low-CoherenceEnhanced Backscattering Spectroscopyfor Colon Cancer Screening
4.1 Colorectal Cancer
Colorectal cancer �CRC� will be diagnosed in approximately140,000 Americans this year, leading to 50,000 deaths, whichmakes CRC the second leading cause of cancer deaths in theUnited States.40 Given that CRC is curable if diagnosed early,widespread screening has been proposed to reduce CRC fa-talities. For example, colonoscopy has shown to dramaticallyreduce CRC fatalities through both early detection of CRCand cancer prevention. Although colonoscopy is remarkablyeffective in reducing CRC, screening the entire at-risk popu-lation ��60 million Americans over age 50� through colonos-copy is impossible for a variety of reasons, including expense�the cost of detection of a single colon cancer case would be�$1,000,000�, patient reluctance, and complication rate.Therefore, development of novel initial-screening �risk-stratification� techniques is imperative. Many screening tech-niques take advantage of the “field effect” �or field canceriza-tion� in CRC. The field effect refers to the proposition that thegenetic/environmental milieu that results in a neoplastic le-sion in one area of the colon also leads to alterations to tissuecomposition, structure, and function in the entire colon. Ac-cordingly, detection of such changes in an easily accessiblepart of the colon �e.g., the rectum or sigmoid colon� can beused to infer the risk of carcinogenesis in the rest of thecolon.41 Unfortunately, the most widely used initial screeningtechniques such as fecal occult blood tests and flexible sig-moidoscopy �i.e., visual evaluation of the rectal and sigmoidcolonic mucosa, which is the easiest to access� are suffered bylow sensitivity. Thus, development of an alternative mini-mally invasive screening/risk-stratification test that is accu-
ls*=614 �m�. �� is measured from the backscattering direction, i.e.,
p��� decreases with �. �b� LEBS depth of penetration Lp�r� as a functions of penetration can be assessed by probing different � or r within an
m andght.� Lt depth
rate, sensitive, cost effective, easy to perform, and does not
July/August 2006 � Vol. 11�4�6
Kim et al.: Low-coherence enhanced backscattering¼
require the need for colonoscopy and colon preparation isindeed crucial.
4.2 Animal and Human StudiesWe have investigated the potential of depth-selective LEBSspectroscopy for accurate CRC risk stratification in two ani-mal models of experimental CRC and pilot humanstudies.28–31 First, we have performed animal studies with theazoxymethane �AOM�-treated rat model of colon carcinogen-esis. This is one of the most robust and well-tested animalmodels of colon carcinogenesis.28–30 In the AOM-treated rats,colon carcinogenesis progresses through the same steps as inhumans: the earliest detectable marker of colon carcinogen-esis, aberrant crypt foci �ACF� develop 8 to 12 weeks afterthe AOM injection, adenomas are observed in20 to 30 weeks, and carcinomas develop in 40 weeks. 48male Fisher 344 rats �150 to 200 g� �Sigma, Saint Louis,Missouri� were randomized to two weekly intraperitioneal�i.p.� injections with either AOM �15 mg/kg� or saline �in thecase of negative control animals�. Animals were euthanized atspecified time points �2, 4, and 6 weeks after the secondAOM injection�. Colons were removed, opened longitudi-nally, and washed. LEBS measurements were performed onfresh, unfixed colons within one hour of sacrifice. We re-corded LEBS signals from at least 20 tissue sites per animalequally distributed throughout colonic surfaces. Moreover, toensure that our findings are not model specific, we used malemultiple intestinal neoplasia �MIN� �Jackson Laboratory, BarHarbor, Maine� and control C57BL6 mice �wildtype at theadenomatous polyposis coli locus� at 6 to 7 weeks of age�n=18�.31 In the MIN model, adenomatous polyposis coli�APC� truncation leads to spontaneous intestinal tumorigen-esis, thus replicating the human familial adenomatous polypo-sis. The MIN mice develop intestinal adenomas at9 to 10 weeks of age, and most intestinal adenomas occur inthe small intestine. We point out that the time points for whichwe have recorded LEBS signals �i.e., 2 to 6 weeks afterAOM injection in the case of the AOM animal model and6 to 7 week old mice in the case of the MIN mice model�correspond to very early stages of carcinogensis. At theseearly time points, no currently known histologic, molecular,
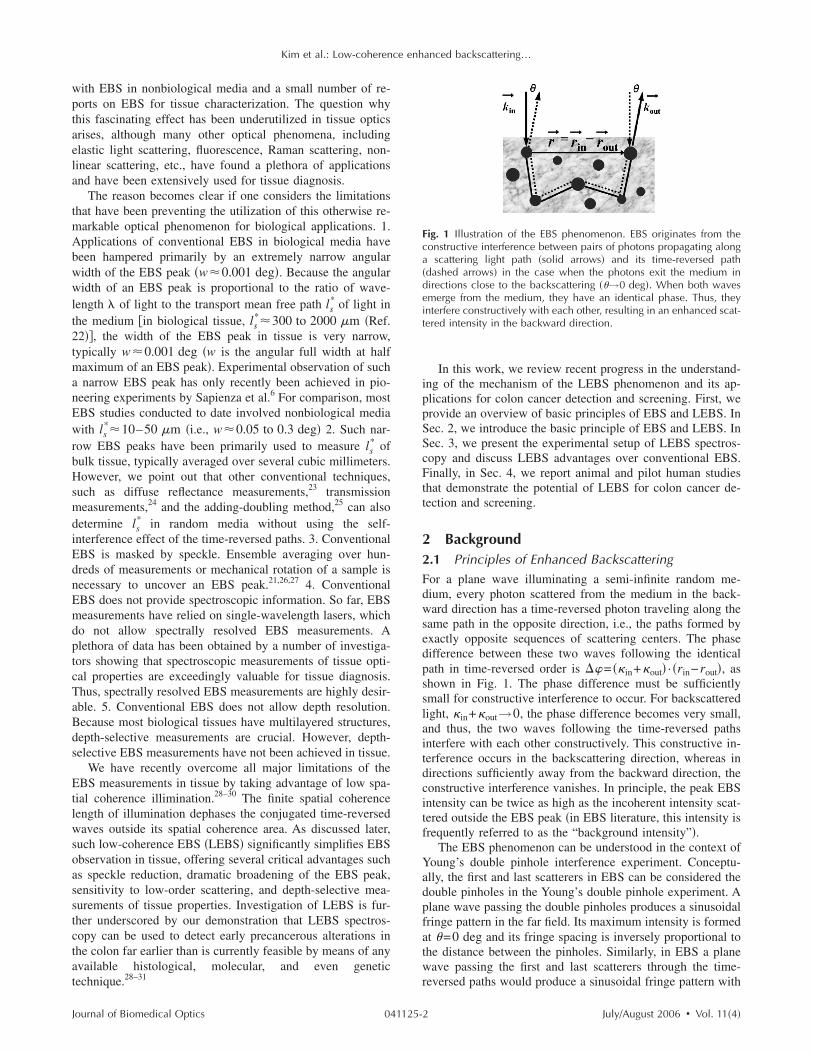
Fig. 7 LEBS spectral slopes obtained from rat colonic tissue 2, 4, ancompared to those obtained from the negative control �i.e., saline-treatcompartment �Lp�40 �m� of the crypts. These changes in LEBS speexpression of currently known histological and molecular biomarkers
or genetic markers have been able to detect preneoplastic
Journal of Biomedical Optics 041125-
transformation. Finally, to investigate whether our findings inthese animal models can be translated into humans, we per-formed human studies of 63 subjects undergoingcolonoscopy.31 We used six biopsies of endoscopically normalmucosa at least 3 cm away from any neoplastic lesion to vali-date whether LEBS spectroscopy can be used to detect thefield effect of CRC. In the human studies, we defined a low-risk group as subjects without personal history of neoplasiaand family history of adenomas or carcinomas, and a high-risk group �n=12� as subject with adenomas on currentcolonoscopy �all adenomas were histologically confirmed�,respectively.
4.3 ResultsWe identified the optimal depth of penetration for whichLEBS markers are the most diagnostic. We assessed LEBSspectra corresponding to 30-, 50-, and 70-�m depths ��=0.4 deg, �=0.2 deg, and �=0 deg, respectively� and foundthat 70-�m penetration depth provides the most diagnosti-cally significant results and enables detection of CRC at theearliest time point �2 weeks after AOM injection�.31 It is ofnotice that this depth approximately corresponds to the depthof colonic mucosa, and several lines of evidence suggest thatthe base of the crypt is the location for initiation of coloncarcinogenesis.
Typically, IEBS��� is a declining function of wavelengthand its steepness depends on the size distribution of submi-cron intraepithelial structures.42 Although LEBS spectra arequite complex with the scale of spectral features as small asonly a few nanometers, a linear fit to IEBS��� using linearregression from 530 to 640 nm accounts for the most spectralvariance. For example, Fig. 3�b� shows a typical IEBS�� ,�=0 deg� recorded from a human colon tissue and its linear fitwith R2�0.6. Thus, to characterize the spectrum of IEBS���as a biomarker, we obtained the value of the slope of the fitover wavelength, which is referred to as the LEBS spectralslope. We found that the LEBS spectral slope showed excel-lent temporal and spatial correlations with the progression ofcarcinogenesis in the animal models and the pilot human stud-ies. Figures 7�a� and 7�b� show alterations of LEBS spectralslope obtained from the AOM-treated rats compared with con-
eks after the initiation of colon carcinogenesis �i.e., AOM injection��. �a� The lower compartment �Lp�70 �m� of the crypt. �b� The uppere observed in the earliest stages of colon carcinogenesis, preceding
d 6 weed ratsctra ar.
trol values in the two different compartments. As shown in
July/August 2006 � Vol. 11�4�7

Kim et al.: Low-coherence enhanced backscattering¼
Fig. 7�a�, spectral slope of the basal compartment is dramati-cally decreased as early as 2 weeks after the AOM adminis-tration, and decreases over the process of carcinogenesis. Onthe other hand, LEBS spectral slope of the lumenal compart-ment remains unchanged at the 2-week time point but insteadchanges dramatically later in the time course of the experi-ment. These results show that the LEBS spectral slope from�70-�m depth provides the earliest sensitivity between thesaline-treated rats and the AOM-treated rats. We also con-firmed this result in the 6-week-old MIN mice. As shown inFig. 8, the LEBS spectral slope is diagnostic for the earlypreadenoma stage of intestinal neoplasia in histologically nor-mal mucosa of MIN mice �P value=0.009�.
Furthermore, we found that the change in the LEBS spec-tral slope is also diagnostic in humans. This is illustrated inFig. 9, which shows a significant decrease in the spectralslope obtained from the colonoscopically normal rectal mu-cosa in patients who harbored adenomas elsewhere in the co-lon when compared to those who were neoplasia free �Pvalue=0.006�. Adenomas were approximately equally distrib-uted between the sigmoid colon/rectum �28% of all ad-enomas�, transverse colon �35%�, and the cecum �38%�. The
Fig. 8 LEBS spectral changes confirmed in the MIN mouse model ofintestinal carcinogenesis. LEBS spectral slope obtained from the mi-croscopically normal appearing �i.e., uninvolved� intestinal mucosa in6-week-old MIN mice is significantly different from one obtainedfrom age-matched control mice �wild type� �Lp�70 �m�.
Fig. 9 Pilot human studies. LEBS spectral changes have the potentialto diagnose colonic neoplasia in humans without the need forcolonoscopy. LEBS spectral slope assessed in the rectum of subjectsundergoing colonoscopy �Lp�70 �m� correlates with presence ofneoplasia elsewhere in the colon �P value=0.006�. High-risk groupsinclude subjects with advanced adenomas anywhere in the colon �ce-cal, colonic, or rectal adenoma �10 mm�, while low-risk groups �i.e.,no dysplasia� include patients without personal or family history of
colonic neoplasia.Journal of Biomedical Optics 041125-
magnitude of decrease in LEBS spectral slope appeared to begreater if the lesion was located in the proximity to the site ofLEBS analysis. However, significant differences were notedfrom LEBS measurements taken at distant sites as well �e.g.,rectal LEBS spectral slope correlates with the presence ofadenomas in the transverse colon�. These results demonstratethat LEBS spectroscopy has the potential to accurately risk-stratify patients for CRC and may be translated into a practi-cal clinical method for colon cancer screening. Translation ofLEBS into clinical practice will require development of fiberoptics LEBS probes that can be used to record LEBS spectrafrom rectal mucosa in vivo and assess LEBS markers withoutthe need for colonoscopy or biopsy. The development of suchLEBS fiber optics probes is currently underway in our re-search group. Rectal LEBS tests can potentially be performedwithout the need for colonoscopy or patients’ colonic prepa-ration. We envision that in the future the LEBS technique mayenable a primary care physician to assess LEBS biomarkersduring a patient’s annual physical exam and thus determinethe risk of CRC and the need for colonoscopy.
5 DiscussionLEBS possess two unique features compared to the majorityof other conventional spectroscopic techniques such as 4-Delastic light scattering fingerprinting42 and polarized lightscattering spectroscopy. 1. LEBS has the capability to probe aspecific depth within the maximal depth determined by thespatial coherence length of illumination. The ability to assessepithelial cells is critical to study human cancers, becausemost human cancers originate from epithelial cells, resultingfrom a series of pathologic changes that transform normalepithelium into invasive carcinoma. One important criterionfor bioassays of carcinogenesis is the use of epithelial cells.The significance of the depth selectivity of LEBS is furtherunderscored by the need to selectively assess epithelial cellsat different tissue depths. For example, colonic epithelial cellshave distinct function, depending on their depth. In particular,epithelial cells at the base of the crypt are capable of prolif-eration, whereas epithelial cells at the top of the crypt undergoapoptosis. As our data demonstrate, selective targeting of spe-cific depths within colonic epithelium provides improved ac-curacy in the diagnosis of epithelial precancers compared tothe spectroscopic analysis of unpolarized or linearly polarizedlight that does not differentiate epithelial and stromal layers.2. LEBS offers a unique contrast for tissue assessment—double scattering—whereas other conventional spectroscopictechniques are based either on single scattering or diffuse re-flectance. Double scattering is the minimal scattering eventsthat are required to generate an EBS peak in discrete randommedia,15,43 because single scattering can only generate the in-coherent baseline backscattering signal but not to EBS. Be-cause biological tissue is a weakly scattering random mediumwith transport mean path length on the order of millimeters�ls
*Lsc�, the small spatial coherence area, which dephasesthe time-reversed paths outside its coherence areas, can iso-late the minimal number of scattering events �i.e., double scat-tering� in EBS.44 Thus, LEBS originates mainly from the con-jugated time-reversed paths of double scattering events inbiological tissue. In other words, the most probable scattering
event of LEBS in biological tissue is double scattering. SuchJuly/August 2006 � Vol. 11�4�8

Kim et al.: Low-coherence enhanced backscattering¼
unique features of LEBS will further facilitate the utilizationof LEBS for tissue characterization and diagnosis amongother currently used optical spectroscopic techniques.
6 ConclusionWe demonstrate that LEBS is an ideal tool to exploit the EBSphenomenon in biological tissue and other random media withlong transport mean free paths. LEBS overcomes all majorhurdles so far preventing the use of EBS in tissue optics. Theuse of low-coherence illumination has several important im-plications on LEBS, including dramatic broadening of the an-gular profile of an LEBS peak and substantial speckle reduc-tion. Moreover, LEBS enables depth-selective spectroscopicassessment of tissue. The LEBS signal originates primarilyfrom double scattering of light in tissue. Thus, LEBS providesunique information about tissue compared to other existingspectroscopic techniques that are based either on single scat-tering or diffuse reflectance. Furthermore, we demonstratethat LEBS spectroscopy has potential applications for tissuediagnosis. Specifically, we show that LEBS may enable de-tection of colon carcinogenesis earlier than other existing his-tological or molecular techniques, and may potentially enablecolon cancer screening without the need for colonoscopy andcolon preparation. We believe that LEBS could potentially beof benefit to clinicians developing effective anticancer strate-gies, to pharmaceutical companies developing or evaluatinganticancer agents, and to biomedical researchers investigatingthe mechanisms of carcinogenesis.
AcknowledgmentsThe study was supported by National Institutes of Health�NIH� grants R01 EB003682 and R01 CA112315, NationalScience Foundation �NSF� grant BES-0238903, and a grantfrom The Wallace H. Coulter Foundation. Y.L. Kim was sup-ported in part by a National Cancer Institute training grantR25 CA100600–01A1.
References1. M. P. van Albada and A. Lagendijk, “Observation of weak localiza-
tion of light in a random medium,” Phys. Rev. Lett. 55�24�, 2692–2695 �1985�.
2. P. E. Wolf and G. Maret, “Weak localization and coherent back-scattering of photons in disordered media,” Phys. Rev. Lett. 55�24�,2696–2699 �1985�.
3. Y. Kuga and A. Ishimaru, “Retroreflectance from a dense distributionof spherical-particles,” J. Opt. Soc. Am. A Opt. Image Sci. Vis 1�8�,831–835 �1984�.
4. D. S. Wiersma, M. P. Vanalbada, B. A. Vantiggelen, and A. La-gendijk, “Experimental-evidence for recurrent multiple-scatteringevents of light in disordered media,” Phys. Rev. Lett. 74�21�, 4193–4196 �1995�.
5. G. Labeyrie, F. de Tomasi, J. C. Bernard, C. A. Muller, C. Miniatura,and R. Kaiser, “Coherent backscattering of light by cold atoms,”Phys. Rev. Lett. 83�25�, 5266–5269 �1999�.
6. R. Sapienza, S. Mujumdar, C. Cheung, A. G. Yodh, and D. Wiersma,“Anisotropic weak localization of light,” Phys. Rev. Lett. 92�3�,033903 �2004�.
7. J. Huang, N. Eradat, M. E. Raikh, Z. V. Vardeny, A. A. Zakhidov,and R. H. Baughman, “Anomalous coherent backscattering of lightfrom opal photonic crystals,” Phys. Rev. Lett. 86�21�, 4815–4818�2001�.
8. D. S. Wiersma, M. P. van Albada, and A. Lagendijk, “Coherent back-scattering of light from amplifying random-media,” Phys. Rev. Lett.
75�9�, 1739–1742 �1995�.Journal of Biomedical Optics 041125-
9. P. C. de Oliveira, A. E. Perkins, and N. M. Lawandy, “Coherentbackscattering from high-gain scattering media,” Opt. Lett. 21�20�,1685–1687 �1996�.
10. M. I. Mishchenko and J. M. Dlugach, “Coherent backscatter and theopposition effect for E-type asteroids,” Planet. Space Sci. 41�3�, 173–181 �1993�.
11. R. Vreeker, M. P. van Albada, R. Sprik, and A. Lagendijk, “Femto-second timeresolved measurements of weak localization of light,”Phys. Lett. A 132�1�, 51–54 �1988�.
12. K. M. Yoo, Y. Takiguchi, and R. R. Alfano, “Weak localization ofphotons: contributions from the different scattering pathlengths,”IEEE Photonics Technol. Lett. 58, 94–96 �1989�.
13. A. Wax, S. Bali, and J. E. Thomas, “Time-resolved phase-space dis-tributions for light backscattered from it disordered medium,” Phys.Rev. Lett. 85�1�, 66–69 �2000�.
14. S. Etemad, R. Thompson, and M. J. Andrejco, “Weak localization ofphotons—Termination of coherent random-walks by absorption andconfined geometry,” Phys. Rev. Lett. 59�13�, 1420–1423 �1987�.
15. M. B. van der Mark, M. P. van Albada, and A. Lagendijk, “Light-scattering in strongly scattering media—Multiple-scattering and weaklocalization,” Phys. Rev. B 37�7�, 3575–3592 �1988�.
16. F. C. Mackintosh and S. John, “Coherent backscattering of light inthe presence of time-reversal-noninvariant and parity-nonconservingmedia,” Phys. Rev. B 37�4�, 1884–1897 �1988�.
17. R. Lenke, R. Lehner, and G. Maret, “Magnetic-field effects on coher-ent backscattering of light in case of Mie spheres,” Europhys. Lett.52�6�, 620–626 �2000�.
18. C. Schwartz and A. Dogariu, “Enhanced backscattering of opticalvortex fields,” Opt. Lett. 30�12�, 1431–1433 �2005�.
19. K. M. Yoo, F. Liu, and R. R. Alfano, “Biological-materials probed bythe temporal and angular profiles of the backscattered ultrafast laser-pulses,” J. Opt. Soc. Am. B 7�8�, 1685–1693 �1990�.
20. K. M. Yoo, G. C. Tang, and R. R. Alfano, “Coherent backscatteringof light from biological tissues,” Appl. Opt. 29�22�, 3237–3239�1990�.
21. G. Yoon, D. N. G. Roy, and R. C. Straight, “Coherent backscatteringin biological media—Measurement and estimation of optical-properties,” Appl. Opt. 32�4�, 580–585 �1993�.
22. J. F. Beek, P. Blokland, P. Posthumus, M. Aalders, J. W. Pickering, H.Sterenborg, and M. J. C. van Gemert, “In vitro double-integrating-sphere optical properties of tissues between 630 and 1064 nm,” Phys.Med. Biol. 42�11�, 2255–2261 �1997�.
23. T. J. Farrell, M. S. Patterson, and B. Wilson, “A diffusion-theorymodel of spatially resolved, steady-state diffuse reflectance for thenoninvasive determination of tissue optical-properties in vivo,” Med.Phys. 19�4�, 879–888 �1992�.
24. A. Z. Genack, “Optical-transmission in disordered media,” Phys. Rev.Lett. 58�20�, 2043–2046 �1987�.
25. S. A. Prahl, M. J. C. Vangemert, and A. J. Welch, “Determining theoptical-properties of turbid media by using the adding-doublingmethod,” Appl. Opt. 32�4�, 559–568 �1993�.
26. S. Etemad, R. Thompson, and M. J. Andrejco, “Weak localization ofphotons—universal fluctuations and ensemble averaging,” Phys. Rev.Lett. 57�5�, 575–578 �1986�.
27. M. Tomita and H. Ikari, “Influence of finite coherence length of in-coming light on enhanced backscattering,” Phys. Rev. B 43�4�, 3716–3719 �1991�.
28. Y. L. Kim, Y. Liu, R. K. Wali, H. K. Roy, and V. Backman, “Low-coherent backscattering spectroscopy for tissue characterization,”Appl. Opt. 44�3�, 366–377 �2005�.
29. Y. L. Kim, Y. Liu, V. M. Turzhitsky, R. K. Wali, H. K. Roy, and V.Backman, “Depth-resolved low-coherence enhanced backscattering,”Opt. Lett. 30�7�, 741–743 �2005�.
30. Y. L. Kim, Y. Liu, V. M. Turzhitsky, H. K. Roy, R. K. Wali, and V.Backman, “Coherent backscattering spectroscopy,” Opt. Lett. 29�16�,1906–1908 �2004�.
31. H. K. Roy, Y. L. Kim, Y. Liu, R. K. Wali, M. J. Goldberg, V. M.Turzhitsky, J. Horwitz, and V. Backman, “Colon carcinogenesis risk-stratification through enhanced backscattering spectroscopy �EBS�analysis of the uninvolved colonic mucosa,” Clin. Cancer Res. 12�3�,961–968 �2006�.
32. P. E. Wolf, G. Maret, E. Akkermans, and R. Maynard, “Optical co-herent backscattering by random-media—an experimental-study,” J.
Phys. (France) 49�1�, 63–75 �1988�.July/August 2006 � Vol. 11�4�9
Kim et al.: Low-coherence enhanced backscattering¼
33. M. Ospeck and S. Fraden, “Influence of Reflecting Boundaries andFinite Interfacial Thickness on the Coherent Backscattering Cone,”Phys. Rev. E 49�5�, 4578–4589 �1994�.
34. T. Okamoto and T. Asakura, “Enhanced backscattering of partiallycoherent light,” Opt. Lett. 21�6�, 369–371 �1996�.
35. M. Born and E. Wolf, Principles of Optics: Electromagnetic Theoryof Propagation, Interference and Diffraction of Light, 7th ed., pp.572–580, Cambridge University Press, Cambridge, New York �1999�.
36. M. Dogariu and T. Asakura, “Reflectance properties of finite-sizeturbid media,” Waves Random Media 4�4�, 429–439 �1994�.
37. K. W. Kinzler and B. Vogelstein, “Colorectal tumors,” in The GeneticBasis of Human Cancer, B. Vogelstein and K. W. Kinzler, Eds., pp.565–587, McGraw-Hill, New York �1998�.
38. A. J. M. Watson, “The role of apoptosis in intestinal disease,” J.Gastroenterol. 32�3�, 414–423 �1997�.
39. M. Brittan and N. A. Wright, “Stem cell in gastrointestinal structure
and neoplastic development,” Gut 53�6�, 899–910 �2004�.Journal of Biomedical Optics 041125-1
40. A. Jemal, R. C. Tiwari, T. Murray, A. Ghafoor, A. Samuels, E. Ward,E. J. Feuer, and M. J. Thun, “Cancer statistics, 2004,” Ca-Cancer J.Clin. 54�1�, 8–29 �2004�.
41. B. J. M. Braakhuis, M. P. Tabor, J. A. Kummer, C. R. Leemans, andR. H. Brakenhoff, “A genetic explanation of Slaughter’s concept offield cancerization: Evidence and clinical implications,” Cancer Res.63�8�, 1727–1730 �2003�.
42. H. K. Roy, Y. Liu, R. K. Wali, Y. L. Kim, A. K. Kromin, M. J.Goldberg, and V. Backman, “Four-dimensional elastic light-scatteringfingerprints as preneoplastic markers in the rat model of colon car-cinogenesis,” Gastroenterology 126, 1071–1081 �2004�.
43. E. Akkermans, P. E. Wolf, R. Maynard, and G. Maret, “Theoretical-study of the coherent backscattering of light by disordered media,” J.Phys. (France) 49�1�, 77–98 �1988�.
44. Y. L. Kim, P. Pradhan, H. Subramanian, Y. Liu, M. H. Kim, and V.Backman, “Origin of low-coherence enhanced backscattering,” Opt.
Lett. 31�10�, 1459–1461 �2006�.July/August 2006 � Vol. 11�4�0