Paleoweathering and depositional conditions in the inter-flow sediment units (bole beds) of Deccan...
20
Paleoweathering and depositional conditions in the inter-flow sediment units (bole beds) of Deccan Volcanic Province, India: A mineral magnetic approach Priyeshu Srivastava a, 1 , S.J. Sangode a, ⁎, D.C. Meshram a , S.S. Gudadhe a , E. Nagaraju b , Anil Kumar b , M. Venkateshwarlu b a Department of Geology, University of Pune, India b National Geophysical Research Institute, Hyderabad, India abstract article info Article history: Received 17 July 2011 Received in revised form 22 January 2012 Accepted 29 January 2012 Available online xxxx Keywords: Deccan Volcanic Province Bole beds Mineral magnetism Paleoweathering A total of 54 samples from thirteen different profiles of interflow sediment units occurring in the Deccan Volcanic Province (DVP, India) are studied using an integrated mineral magnetic and field documentation approach. The oc- currence and distribution of ferri- and antiferromagnetic oxides associated with these sediments infer depositional conditions dominated by various detrital modes and recycling of baked sediments under limited authigenic environ- ments. The baking of underlying sediments is conditioned by aqueous or dry nature of the substrate vis-à-vis the viscosity of the overlying lava flow that can be identified by a combination of brown/red boles and compact/ pahoehoe type flows. The presence of antiferromagnetic superparamagnetic (SP) fraction in the ‘red bole capped brown boles’ indicates the depth of baking to ~20 cm; while the SP fraction also marks infilling, recycling and pig- mentation in other occurrences of the red boles studied here. Overall, the mixed magnetic mineralogy and sediment characters depict frequent recycling and re-deposition by surface run-off, infiltration and ponding as the most common processes of bole bed formation in DVP governed by shallow streams or laterally migrating channels. Infiltration of the baked or unbaked sediments into fragmentary topped basalts is frequently shown by the red and brown boles, while infilling into the interstices and cavities is common with green boles. The red boles are also characteristic of detrital mixing of oxidized/partially oxidized fer- rimagnets, many times coated with pigmentary hematites. The present results envisage a great scope for the rou- tine mineral magnetic studies (integrated with field observations) for rapid characterization of the extensively occurring bole bed horizons in the DVP and their study as analogs of Martian soils and sediments. © 2012 Elsevier B.V. All rights reserved. 1. Introduction The Deccan Volcanic Province extensively exposes several inter- basaltic sediment units (bole beds) as prominent horizons represent- ing interflow intervals or pause in volcanism demarcating the flow units. These bole beds made up of earthy, clayey or silty material were suggested to have formed by surface materials derived from neighboring basalts, admixed with volcanic ash (Widdowson et al., 1997; Wilkins et al., 1994). High concentrations of the immobile ele- ments such as Al and Fe 3+ ions in some red boles allowed Widdowson et al. (1997) to suggest it as incipient forms of paleo- laterites developed during the short periods of weathering following eruption. Several authors have suggested chemical weathering as their origin similar to pedogenesis (e.g., Ghosh et al., 2006 and refer- ences therein). These studies indicate that the red boles differ in chemical composition from modern tropical laterites and the green boles are possible equivalents of andisol (Ghosh et al., 2006). After comparison with modern soils developed over Deccan traps, Sayyed and Hundekari (2006) suggested that the Deccan basalts may not have suffered much intense chemical alteration and/or long-term pe- dogenesis during bole bed formation. Absence of pedogenic carbon- ates in the bole beds is inferred for humid climates during Deccan volcanism with uniformly distributed rainfall conditions and precipi- tation exceeding evaporation (Sayyed and Hundekari, 2006). Gavin et al. (2010) find that the boles comprise Al-rich smectite montmoril- lonite and traces of the Fe-smectite and nontronite. After comparing the Mossbauer spectra of heated smectites, Gavin et al. (2010) further inferred that any pure sample of montmorillonite or nontronite in the Deccan paleosols may have been heated to around 600 °C. Although usually recognized based on red coloration, the bole beds occur in a wide range of colors (shades of red, green and brown), varied depositional geometry (laterally pinching, infilling and infiltration) and also grain size (Srivastava, 2010). The bole beds thus represent unique sedimentary environments and the large variability amongst sediment characters including colors can therefore be utilized for stratigraphic correlation apart from the study of paleo-environmental conditions during post volcanic Geoderma 177–178 (2012) 90–109 ⁎ Corresponding author at: University of Pune, Pune 411 007, India. Fax: +91 20 25695373. E-mail address: [email protected] (S.J. Sangode). 1 Presently: Centre for Glaciology, Wadia Institute of Himalayan Geology, Dehradun. 0016-7061/$ – see front matter © 2012 Elsevier B.V. All rights reserved. doi:10.1016/j.geoderma.2012.01.034 Contents lists available at SciVerse ScienceDirect Geoderma journal homepage: www.elsevier.com/locate/geoderma
-
Upload
independent -
Category
Documents
-
view
3 -
download
0
Transcript of Paleoweathering and depositional conditions in the inter-flow sediment units (bole beds) of Deccan...
Geoderma 177–178 (2012) 90–109
Contents lists available at SciVerse ScienceDirect
Geoderma
j ourna l homepage: www.e lsev ie r .com/ locate /geoderma
Paleoweathering and depositional conditions in the inter-flow sediment units(bole beds) of Deccan Volcanic Province, India: A mineral magnetic approach
Priyeshu Srivastava a,1, S.J. Sangode a,⁎, D.C. Meshram a, S.S. Gudadhe a, E. Nagaraju b,Anil Kumar b, M. Venkateshwarlu b
a Department of Geology, University of Pune, Indiab National Geophysical Research Institute, Hyderabad, India
⁎ Corresponding author at: University of Pune, Pune25695373.
E-mail address: [email protected] (S.J. Sangod1 Presently: Centre for Glaciology, Wadia Institute of H
0016-7061/$ – see front matter © 2012 Elsevier B.V. Alldoi:10.1016/j.geoderma.2012.01.034
a b s t r a c t
a r t i c l e i n f oArticle history:Received 17 July 2011Received in revised form 22 January 2012Accepted 29 January 2012Available online xxxx
Keywords:Deccan Volcanic ProvinceBole bedsMineral magnetismPaleoweathering
A total of 54 samples from thirteen different profiles of interflow sediment units occurring in the Deccan VolcanicProvince (DVP, India) are studied using an integratedmineral magnetic and field documentation approach. The oc-currence and distribution of ferri- and antiferromagnetic oxides associated with these sediments infer depositionalconditions dominatedby various detritalmodes and recycling of baked sediments under limited authigenic environ-ments. The baking of underlying sediments is conditioned by aqueous or dry nature of the substrate vis-à-vis theviscosity of the overlying lava flow that can be identified by a combination of brown/red boles and compact/pahoehoe type flows. The presence of antiferromagnetic superparamagnetic (SP) fraction in the ‘red bole cappedbrown boles’ indicates the depth of baking to ~20 cm; while the SP fraction also marks infilling, recycling and pig-mentation in other occurrences of the red boles studied here.Overall, the mixed magnetic mineralogy and sediment characters depict frequent recycling and re-deposition bysurface run-off, infiltration and ponding as the most common processes of bole bed formation in DVP governedby shallow streams or laterallymigrating channels. Infiltration of the baked or unbaked sediments into fragmentarytopped basalts is frequently shown by the red and brown boles, while infilling into the interstices and cavities iscommon with green boles. The red boles are also characteristic of detrital mixing of oxidized/partially oxidized fer-rimagnets, many times coated with pigmentary hematites. The present results envisage a great scope for the rou-tine mineral magnetic studies (integrated with field observations) for rapid characterization of the extensivelyoccurring bole bed horizons in the DVP and their study as analogs of Martian soils and sediments.
© 2012 Elsevier B.V. All rights reserved.
1. Introduction
The Deccan Volcanic Province extensively exposes several inter-basaltic sediment units (bole beds) as prominent horizons represent-ing interflow intervals or pause in volcanism demarcating the flowunits. These bole beds made up of earthy, clayey or silty materialwere suggested to have formed by surface materials derived fromneighboring basalts, admixed with volcanic ash (Widdowson et al.,1997; Wilkins et al., 1994). High concentrations of the immobile ele-ments such as Al and Fe3+ ions in some red boles allowedWiddowson et al. (1997) to suggest it as incipient forms of paleo-laterites developed during the short periods of weathering followingeruption. Several authors have suggested chemical weathering astheir origin similar to pedogenesis (e.g., Ghosh et al., 2006 and refer-ences therein). These studies indicate that the red boles differ inchemical composition from modern tropical laterites and the green
411 007, India. Fax: +91 20
e).imalayan Geology, Dehradun.
rights reserved.
boles are possible equivalents of andisol (Ghosh et al., 2006). Aftercomparison with modern soils developed over Deccan traps, Sayyedand Hundekari (2006) suggested that the Deccan basalts may nothave suffered much intense chemical alteration and/or long-term pe-dogenesis during bole bed formation. Absence of pedogenic carbon-ates in the bole beds is inferred for humid climates during Deccanvolcanism with uniformly distributed rainfall conditions and precipi-tation exceeding evaporation (Sayyed and Hundekari, 2006). Gavin etal. (2010) find that the boles comprise Al-rich smectite montmoril-lonite and traces of the Fe-smectite and nontronite. After comparingthe Mossbauer spectra of heated smectites, Gavin et al. (2010) furtherinferred that any pure sample of montmorillonite or nontronite in theDeccan paleosols may have been heated to around 600 °C.
Although usually recognized based on red coloration, the bolebeds occur in a wide range of colors (shades of red, green andbrown), varied depositional geometry (laterally pinching, infillingand infiltration) and also grain size (Srivastava, 2010). The bolebeds thus represent unique sedimentary environments and thelarge variability amongst sediment characters including colors cantherefore be utilized for stratigraphic correlation apart from thestudy of paleo-environmental conditions during post volcanic
91P. Srivastava et al. / Geoderma 177–178 (2012) 90–109
periods. The mineral magnetic and chemical composition of Martiansoils/sediments (e.g. Barrón and Torrent, 2002; Kletetschka et al.,2000; Wänke et al., 2001), and its comparison with bole beds ofDVP have suggested that red boles could be possible terrestrial analogwith a great scope for their detailed analysis and characterization(Gavin et al., 2010). Color being the most perspective and fundamen-tal property for these bole beds; the state of iron in the oxide mineralsis anticipated to play an important role in such characterization. It iswell understood that the formation and mobilization of iron oxidesin terrestrial sediments and soils are governed by depositional envi-ronment and weathering conditions (Barrón and Torrent, 2002;Beckmann et al., 1974; Schwertmann, 1988, 1993; Sheldon, 2002;Taylor and Schwertmann, 1978). Mineral magnetism is one of themost widely accepted qualitative and quantitative approaches ofcharacterization of iron oxides in soils and sediments (e.g. Dunlopand Özdemir, 1997; Evans and Heller, 2003; Mullins, 1977; Mullinsand Tite, 1973; Thompson and Oldfield, 1986). Therefore we employmineral magnetism as a suitable approach to analyze different bolebeds in the DVP.
2. Study area and methods
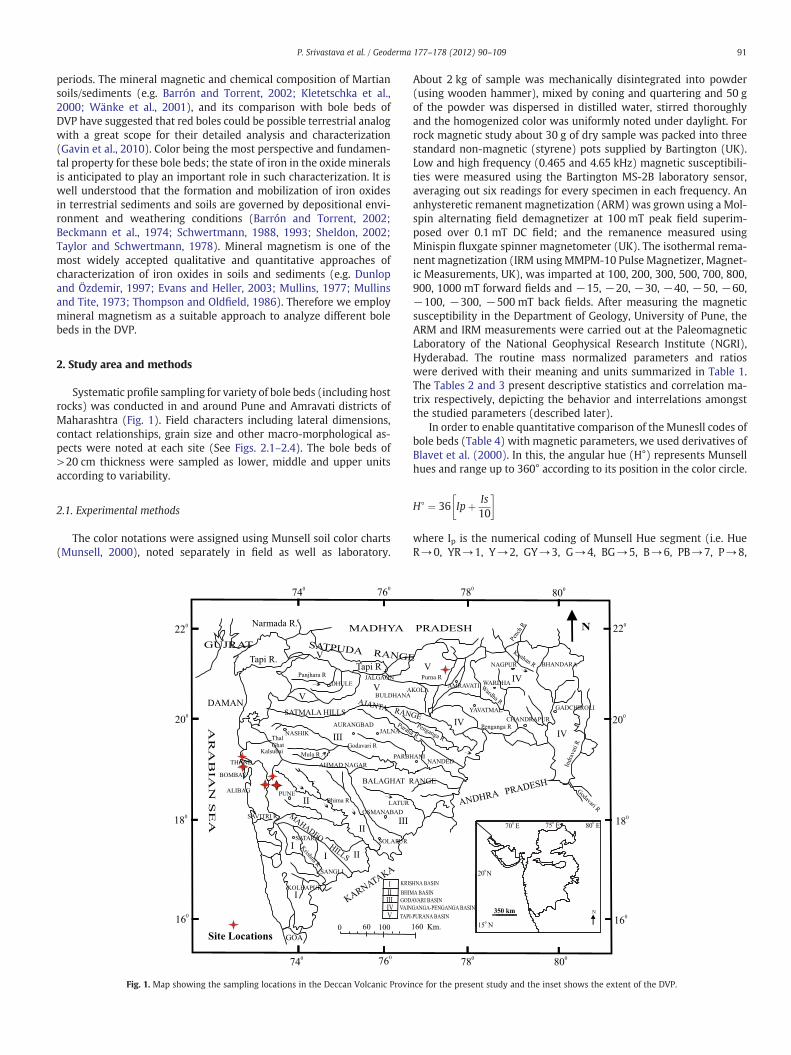
Systematic profile sampling for variety of bole beds (including hostrocks) was conducted in and around Pune and Amravati districts ofMaharashtra (Fig. 1). Field characters including lateral dimensions,contact relationships, grain size and other macro-morphological as-pects were noted at each site (See Figs. 2.1–2.4). The bole beds of>20 cm thickness were sampled as lower, middle and upper unitsaccording to variability.
2.1. Experimental methods
The color notations were assigned using Munsell soil color charts(Munsell, 2000), noted separately in field as well as laboratory.
Fig. 1. Map showing the sampling locations in the Deccan Volcanic Provin
About 2 kg of sample was mechanically disintegrated into powder(using wooden hammer), mixed by coning and quartering and 50 gof the powder was dispersed in distilled water, stirred thoroughlyand the homogenized color was uniformly noted under daylight. Forrock magnetic study about 30 g of dry sample was packed into threestandard non-magnetic (styrene) pots supplied by Bartington (UK).Low and high frequency (0.465 and 4.65 kHz) magnetic susceptibili-ties were measured using the Bartington MS-2B laboratory sensor,averaging out six readings for every specimen in each frequency. Ananhysteretic remanent magnetization (ARM) was grown using a Mol-spin alternating field demagnetizer at 100 mT peak field superim-posed over 0.1 mT DC field; and the remanence measured usingMinispin fluxgate spinner magnetometer (UK). The isothermal rema-nent magnetization (IRM using MMPM-10 Pulse Magnetizer, Magnet-ic Measurements, UK), was imparted at 100, 200, 300, 500, 700, 800,900, 1000 mT forward fields and −15, −20, −30, −40, −50, −60,−100, −300, −500 mT back fields. After measuring the magneticsusceptibility in the Department of Geology, University of Pune, theARM and IRM measurements were carried out at the PaleomagneticLaboratory of the National Geophysical Research Institute (NGRI),Hyderabad. The routine mass normalized parameters and ratioswere derived with their meaning and units summarized in Table 1.The Tables 2 and 3 present descriptive statistics and correlation ma-trix respectively, depicting the behavior and interrelations amongstthe studied parameters (described later).
In order to enable quantitative comparison of the Munesll codes ofbole beds (Table 4) with magnetic parameters, we used derivatives ofBlavet et al. (2000). In this, the angular hue (H°) represents Munsellhues and range up to 360° according to its position in the color circle.
H∘ ¼ 36 Ipþ Is10
� �
where Ip is the numerical coding of Munsell Hue segment (i.e. HueR→0, YR→1, Y→2, GY→3, G→4, BG→5, B→6, PB→7, P→8,
ce for the present study and the inset shows the extent of the DVP.
92 P. Srivastava et al. / Geoderma 177–178 (2012) 90–109
and RP→9), and Is is the number associated with that Hue (i.e. 7.5 for7.5 R; 5 for 5YR, etc.). We further adopted the Redness Rating (asgiven in Blavet et al., 2000 and Thompson and Bell, 1996; Torrent etal., 1980, 1983) using the formula;
Redness Rating RRð Þ ¼ 360−5H∘ð Þ � C18V
where C accounts for the chroma, V is the value, and H° is the angularhue.
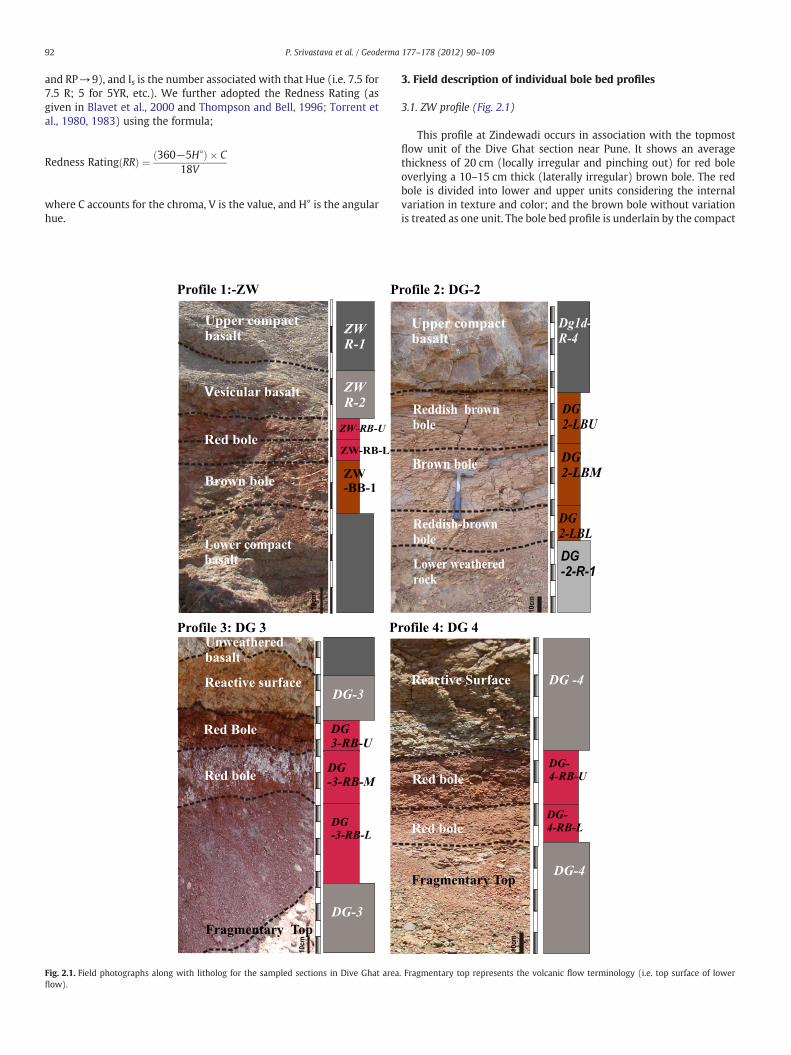
Fig. 2.1. Field photographs along with litholog for the sampled sections in Dive Ghat areaflow).
3. Field description of individual bole bed profiles
3.1. ZW profile (Fig. 2.1)
This profile at Zindewadi occurs in association with the topmostflow unit of the Dive Ghat section near Pune. It shows an averagethickness of 20 cm (locally irregular and pinching out) for red boleoverlying a 10–15 cm thick (laterally irregular) brown bole. The redbole is divided into lower and upper units considering the internalvariation in texture and color; and the brown bole without variationis treated as one unit. The bole bed profile is underlain by the compact
. Fragmentary top represents the volcanic flow terminology (i.e. top surface of lower
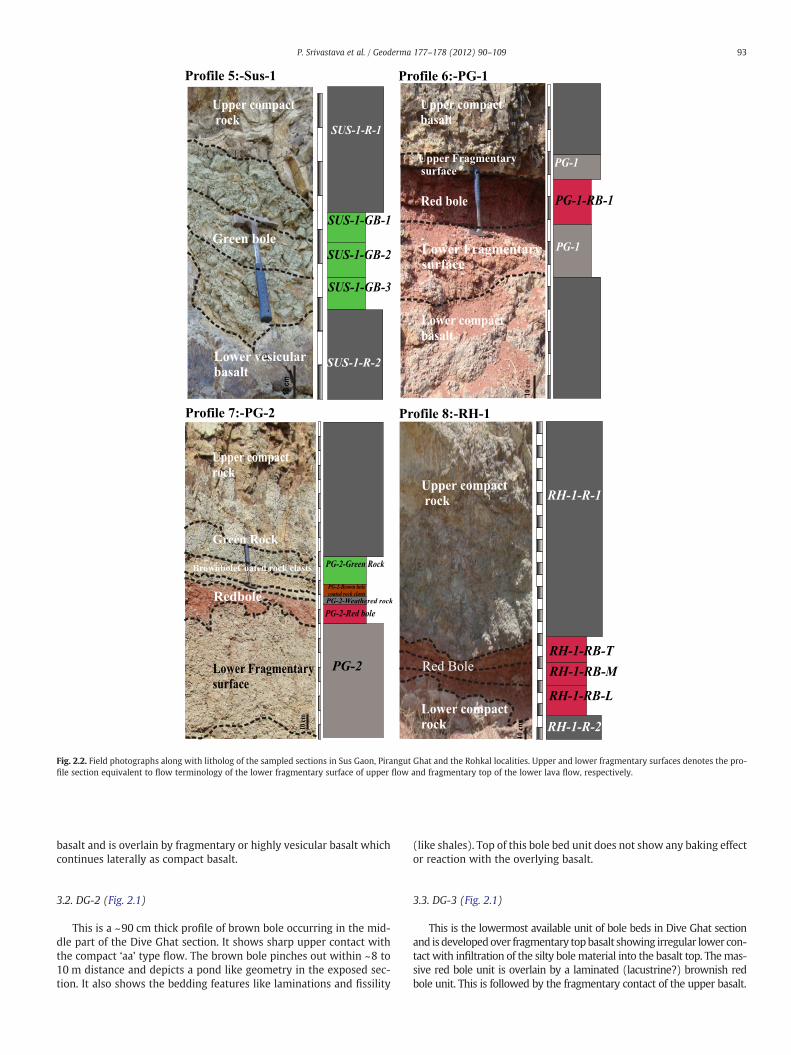
Fig. 2.2. Field photographs along with litholog of the sampled sections in Sus Gaon, Pirangut Ghat and the Rohkal localities. Upper and lower fragmentary surfaces denotes the pro-file section equivalent to flow terminology of the lower fragmentary surface of upper flow and fragmentary top of the lower lava flow, respectively.
93P. Srivastava et al. / Geoderma 177–178 (2012) 90–109
basalt and is overlain by fragmentary or highly vesicular basalt whichcontinues laterally as compact basalt.
3.2. DG-2 (Fig. 2.1)
This is a ~90 cm thick profile of brown bole occurring in the mid-dle part of the Dive Ghat section. It shows sharp upper contact withthe compact ‘aa’ type flow. The brown bole pinches out within ~8 to10 m distance and depicts a pond like geometry in the exposed sec-tion. It also shows the bedding features like laminations and fissility
(like shales). Top of this bole bed unit does not show any baking effector reaction with the overlying basalt.
3.3. DG-3 (Fig. 2.1)
This is the lowermost available unit of bole beds in Dive Ghat sectionand is developedover fragmentary topbasalt showing irregular lower con-tact with infiltration of the silty bolematerial into the basalt top. Themas-sive red bole unit is overlain by a laminated (lacustrine?) brownish redbole unit. This is followed by the fragmentary contact of the upper basalt.
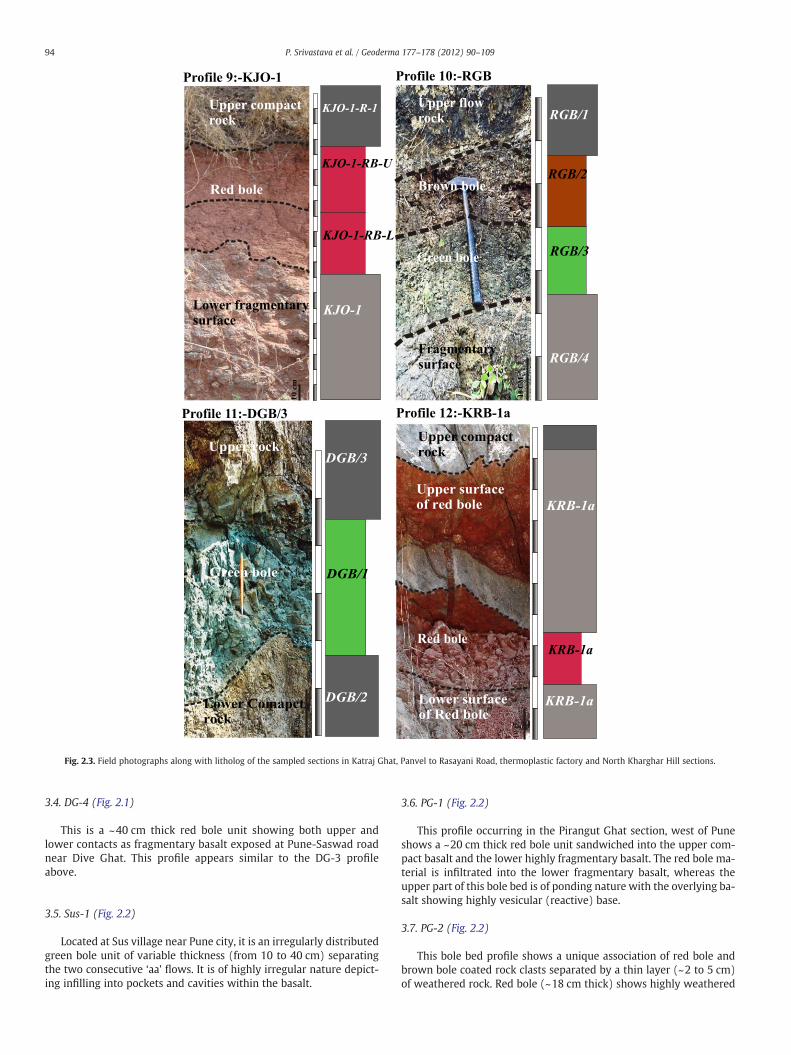
Fig. 2.3. Field photographs along with litholog of the sampled sections in Katraj Ghat, Panvel to Rasayani Road, thermoplastic factory and North Kharghar Hill sections.
94 P. Srivastava et al. / Geoderma 177–178 (2012) 90–109
3.4. DG-4 (Fig. 2.1)
This is a ~40 cm thick red bole unit showing both upper andlower contacts as fragmentary basalt exposed at Pune-Saswad roadnear Dive Ghat. This profile appears similar to the DG-3 profileabove.
3.5. Sus-1 (Fig. 2.2)
Located at Sus village near Pune city, it is an irregularly distributedgreen bole unit of variable thickness (from 10 to 40 cm) separatingthe two consecutive ‘aa’ flows. It is of highly irregular nature depict-ing infilling into pockets and cavities within the basalt.
3.6. PG-1 (Fig. 2.2)
This profile occurring in the Pirangut Ghat section, west of Puneshows a ~20 cm thick red bole unit sandwiched into the upper com-pact basalt and the lower highly fragmentary basalt. The red bole ma-terial is infiltrated into the lower fragmentary basalt, whereas theupper part of this bole bed is of ponding nature with the overlying ba-salt showing highly vesicular (reactive) base.
3.7. PG-2 (Fig. 2.2)
This bole bed profile shows a unique association of red bole andbrown bole coated rock clasts separated by a thin layer (~2 to 5 cm)of weathered rock. Red bole (~18 cm thick) shows highly weathered
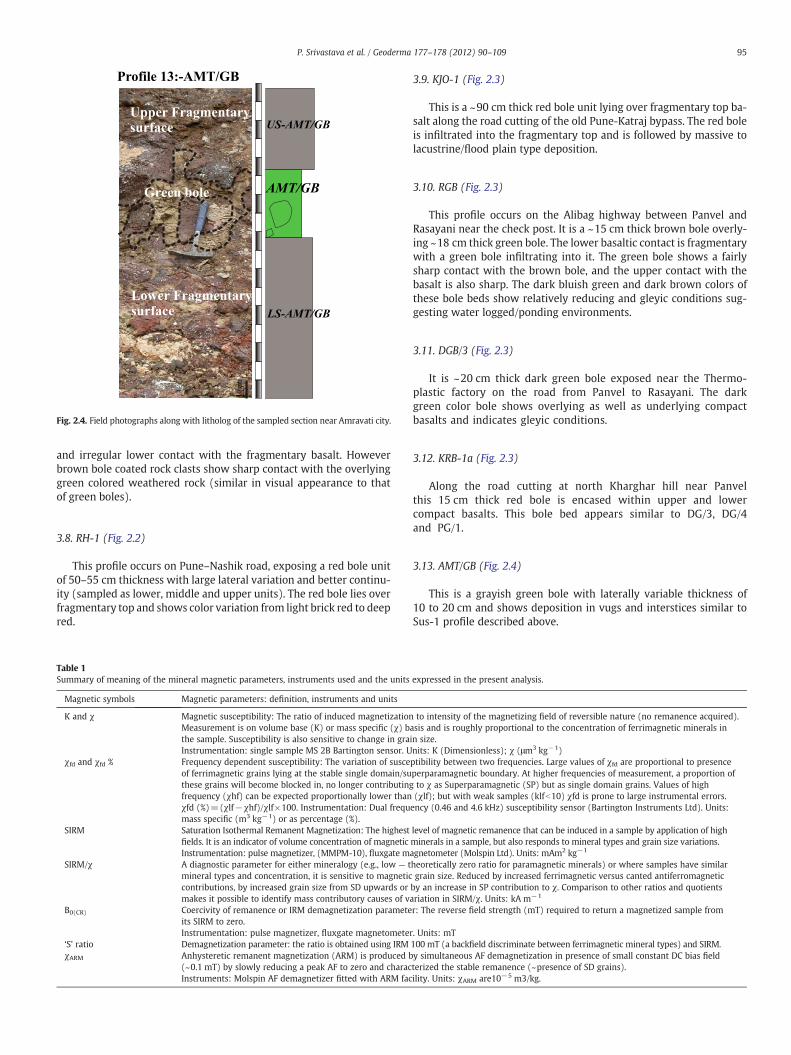
Fig. 2.4. Field photographs along with litholog of the sampled section near Amravati city.
95P. Srivastava et al. / Geoderma 177–178 (2012) 90–109
and irregular lower contact with the fragmentary basalt. Howeverbrown bole coated rock clasts show sharp contact with the overlyinggreen colored weathered rock (similar in visual appearance to thatof green boles).
3.8. RH-1 (Fig. 2.2)
This profile occurs on Pune–Nashik road, exposing a red bole unitof 50–55 cm thickness with large lateral variation and better continu-ity (sampled as lower, middle and upper units). The red bole lies overfragmentary top and shows color variation from light brick red to deepred.
Table 1Summary of meaning of the mineral magnetic parameters, instruments used and the units
Magnetic symbols Magnetic parameters: definition, instruments and units
K and χ Magnetic susceptibility: The ratio of induced magnetizationMeasurement is on volume base (K) or mass specific (χ) bthe sample. Susceptibility is also sensitive to change in graInstrumentation: single sample MS 2B Bartington sensor. U
χfd and χfd % Frequency dependent susceptibility: The variation of susceof ferrimagnetic grains lying at the stable single domain/suthese grains will become blocked in, no longer contributingfrequency (χhf) can be expected proportionally lower thanχfd (%)=(χlf−χhf)/χlf×100. Instrumentation: Dual frequmass specific (m3 kg−1) or as percentage (%).
SIRM Saturation Isothermal Remanent Magnetization: The highestfields. It is an indicator of volume concentration of magneticInstrumentation: pulse magnetizer, (MMPM-10), fluxgate m
SIRM/χ A diagnostic parameter for either mineralogy (e.g., low — tmineral types and concentration, it is sensitive to magneticcontributions, by increased grain size from SD upwards ormakes it possible to identify mass contributory causes of va
B0(CR) Coercivity of remanence or IRM demagnetization parameteits SIRM to zero.Instrumentation: pulse magnetizer, fluxgate magnetometer
‘S’ ratio Demagnetization parameter: the ratio is obtained using IRMχARM Anhysteretic remanent magnetization (ARM) is produced b
(~0.1 mT) by slowly reducing a peak AF to zero and characInstruments: Molspin AF demagnetizer fitted with ARM fac
3.9. KJO-1 (Fig. 2.3)
This is a ~90 cm thick red bole unit lying over fragmentary top ba-salt along the road cutting of the old Pune-Katraj bypass. The red boleis infiltrated into the fragmentary top and is followed by massive tolacustrine/flood plain type deposition.
3.10. RGB (Fig. 2.3)
This profile occurs on the Alibag highway between Panvel andRasayani near the check post. It is a ~15 cm thick brown bole overly-ing ~18 cm thick green bole. The lower basaltic contact is fragmentarywith a green bole infiltrating into it. The green bole shows a fairlysharp contact with the brown bole, and the upper contact with thebasalt is also sharp. The dark bluish green and dark brown colors ofthese bole beds show relatively reducing and gleyic conditions sug-gesting water logged/ponding environments.
3.11. DGB/3 (Fig. 2.3)
It is ~20 cm thick dark green bole exposed near the Thermo-plastic factory on the road from Panvel to Rasayani. The darkgreen color bole shows overlying as well as underlying compactbasalts and indicates gleyic conditions.
3.12. KRB-1a (Fig. 2.3)
Along the road cutting at north Kharghar hill near Panvelthis 15 cm thick red bole is encased within upper and lowercompact basalts. This bole bed appears similar to DG/3, DG/4and PG/1.
3.13. AMT/GB (Fig. 2.4)
This is a grayish green bole with laterally variable thickness of10 to 20 cm and shows deposition in vugs and interstices similar toSus-1 profile described above.
expressed in the present analysis.
to intensity of the magnetizing field of reversible nature (no remanence acquired).asis and is roughly proportional to the concentration of ferrimagnetic minerals inin size.nits: K (Dimensionless); χ (μm3 kg−1)ptibility between two frequencies. Large values of χfd are proportional to presenceperparamagnetic boundary. At higher frequencies of measurement, a proportion ofto χ as Superparamagnetic (SP) but as single domain grains. Values of high(χlf); but with weak samples (klfb10) χfd is prone to large instrumental errors.ency (0.46 and 4.6 kHz) susceptibility sensor (Bartington Instruments Ltd). Units:
level of magnetic remanence that can be induced in a sample by application of highminerals in a sample, but also responds to mineral types and grain size variations.agnetometer (Molspin Ltd). Units: mAm2 kg−1
heoretically zero ratio for paramagnetic minerals) or where samples have similargrain size. Reduced by increased ferrimagnetic versus canted antiferromagnetic
by an increase in SP contribution to χ. Comparison to other ratios and quotientsriation in SIRM/χ. Units: kA m−1
r: The reverse field strength (mT) required to return a magnetized sample from
. Units: mT100 mT (a backfield discriminate between ferrimagnetic mineral types) and SIRM.y simultaneous AF demagnetization in presence of small constant DC bias fieldterized the stable remanence (~presence of SD grains).ility. Units: χARM are10−5 m3/kg.
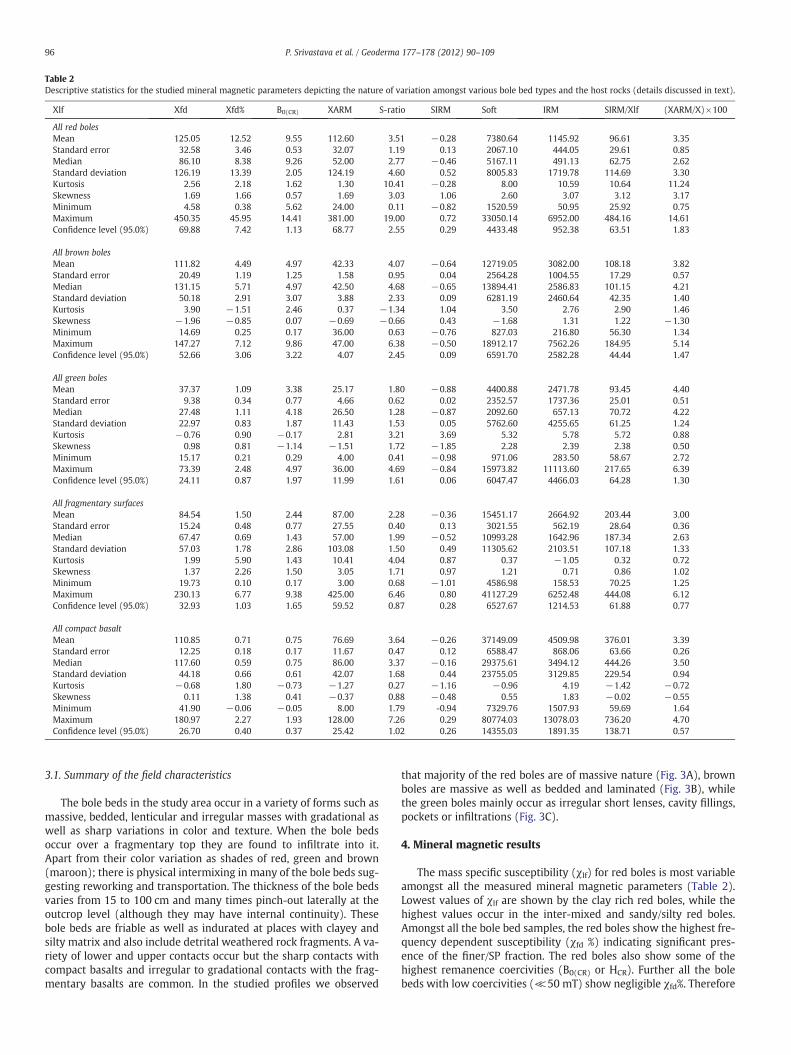
Table 2Descriptive statistics for the studied mineral magnetic parameters depicting the nature of variation amongst various bole bed types and the host rocks (details discussed in text).
Xlf Xfd Xfd% B0(CR) XARM S-ratio SIRM Soft IRM SIRM/Xlf (XARM/X)×100
All red bolesMean 125.05 12.52 9.55 112.60 3.51 −0.28 7380.64 1145.92 96.61 3.35Standard error 32.58 3.46 0.53 32.07 1.19 0.13 2067.10 444.05 29.61 0.85Median 86.10 8.38 9.26 52.00 2.77 −0.46 5167.11 491.13 62.75 2.62Standard deviation 126.19 13.39 2.05 124.19 4.60 0.52 8005.83 1719.78 114.69 3.30Kurtosis 2.56 2.18 1.62 1.30 10.41 −0.28 8.00 10.59 10.64 11.24Skewness 1.69 1.66 0.57 1.69 3.03 1.06 2.60 3.07 3.12 3.17Minimum 4.58 0.38 5.62 24.00 0.11 −0.82 1520.59 50.95 25.92 0.75Maximum 450.35 45.95 14.41 381.00 19.00 0.72 33050.14 6952.00 484.16 14.61Confidence level (95.0%) 69.88 7.42 1.13 68.77 2.55 0.29 4433.48 952.38 63.51 1.83
All brown bolesMean 111.82 4.49 4.97 42.33 4.07 −0.64 12719.05 3082.00 108.18 3.82Standard error 20.49 1.19 1.25 1.58 0.95 0.04 2564.28 1004.55 17.29 0.57Median 131.15 5.71 4.97 42.50 4.68 −0.65 13894.41 2586.83 101.15 4.21Standard deviation 50.18 2.91 3.07 3.88 2.33 0.09 6281.19 2460.64 42.35 1.40Kurtosis 3.90 −1.51 2.46 0.37 −1.34 1.04 3.50 2.76 2.90 1.46Skewness −1.96 −0.85 0.07 −0.69 −0.66 0.43 −1.68 1.31 1.22 −1.30Minimum 14.69 0.25 0.17 36.00 0.63 −0.76 827.03 216.80 56.30 1.34Maximum 147.27 7.12 9.86 47.00 6.38 −0.50 18912.17 7562.26 184.95 5.14Confidence level (95.0%) 52.66 3.06 3.22 4.07 2.45 0.09 6591.70 2582.28 44.44 1.47
All green bolesMean 37.37 1.09 3.38 25.17 1.80 −0.88 4400.88 2471.78 93.45 4.40Standard error 9.38 0.34 0.77 4.66 0.62 0.02 2352.57 1737.36 25.01 0.51Median 27.48 1.11 4.18 26.50 1.28 −0.87 2092.60 657.13 70.72 4.22Standard deviation 22.97 0.83 1.87 11.43 1.53 0.05 5762.60 4255.65 61.25 1.24Kurtosis −0.76 0.90 −0.17 2.81 3.21 3.69 5.32 5.78 5.72 0.88Skewness 0.98 0.81 −1.14 −1.51 1.72 −1.85 2.28 2.39 2.38 0.50Minimum 15.17 0.21 0.29 4.00 0.41 −0.98 971.06 283.50 58.67 2.72Maximum 73.39 2.48 4.97 36.00 4.69 −0.84 15973.82 11113.60 217.65 6.39Confidence level (95.0%) 24.11 0.87 1.97 11.99 1.61 0.06 6047.47 4466.03 64.28 1.30
All fragmentary surfacesMean 84.54 1.50 2.44 87.00 2.28 −0.36 15451.17 2664.92 203.44 3.00Standard error 15.24 0.48 0.77 27.55 0.40 0.13 3021.55 562.19 28.64 0.36Median 67.47 0.69 1.43 57.00 1.99 −0.52 10993.28 1642.96 187.34 2.63Standard deviation 57.03 1.78 2.86 103.08 1.50 0.49 11305.62 2103.51 107.18 1.33Kurtosis 1.99 5.90 1.43 10.41 4.04 0.87 0.37 −1.05 0.32 0.72Skewness 1.37 2.26 1.50 3.05 1.71 0.97 1.21 0.71 0.86 1.02Minimum 19.73 0.10 0.17 3.00 0.68 −1.01 4586.98 158.53 70.25 1.25Maximum 230.13 6.77 9.38 425.00 6.46 0.80 41127.29 6252.48 444.08 6.12Confidence level (95.0%) 32.93 1.03 1.65 59.52 0.87 0.28 6527.67 1214.53 61.88 0.77
All compact basaltMean 110.85 0.71 0.75 76.69 3.64 −0.26 37149.09 4509.98 376.01 3.39Standard error 12.25 0.18 0.17 11.67 0.47 0.12 6588.47 868.06 63.66 0.26Median 117.60 0.59 0.75 86.00 3.37 −0.16 29375.61 3494.12 444.26 3.50Standard deviation 44.18 0.66 0.61 42.07 1.68 0.44 23755.05 3129.85 229.54 0.94Kurtosis −0.68 1.80 −0.73 −1.27 0.27 −1.16 −0.96 4.19 −1.42 −0.72Skewness 0.11 1.38 0.41 −0.37 0.88 −0.48 0.55 1.83 −0.02 −0.55Minimum 41.90 −0.06 −0.05 8.00 1.79 -0.94 7329.76 1507.93 59.69 1.64Maximum 180.97 2.27 1.93 128.00 7.26 0.29 80774.03 13078.03 736.20 4.70Confidence level (95.0%) 26.70 0.40 0.37 25.42 1.02 0.26 14355.03 1891.35 138.71 0.57
96 P. Srivastava et al. / Geoderma 177–178 (2012) 90–109
3.1. Summary of the field characteristics
The bole beds in the study area occur in a variety of forms such asmassive, bedded, lenticular and irregular masses with gradational aswell as sharp variations in color and texture. When the bole bedsoccur over a fragmentary top they are found to infiltrate into it.Apart from their color variation as shades of red, green and brown(maroon); there is physical intermixing in many of the bole beds sug-gesting reworking and transportation. The thickness of the bole bedsvaries from 15 to 100 cm and many times pinch-out laterally at theoutcrop level (although they may have internal continuity). Thesebole beds are friable as well as indurated at places with clayey andsilty matrix and also include detrital weathered rock fragments. A va-riety of lower and upper contacts occur but the sharp contacts withcompact basalts and irregular to gradational contacts with the frag-mentary basalts are common. In the studied profiles we observed
that majority of the red boles are of massive nature (Fig. 3A), brownboles are massive as well as bedded and laminated (Fig. 3B), whilethe green boles mainly occur as irregular short lenses, cavity fillings,pockets or infiltrations (Fig. 3C).
4. Mineral magnetic results
The mass specific susceptibility (χlf) for red boles is most variableamongst all the measured mineral magnetic parameters (Table 2).Lowest values of χlf are shown by the clay rich red boles, while thehighest values occur in the inter-mixed and sandy/silty red boles.Amongst all the bole bed samples, the red boles show the highest fre-quency dependent susceptibility (χfd %) indicating significant pres-ence of the finer/SP fraction. The red boles also show some of thehighest remanence coercivities (B0(CR) or HCR). Further all the bolebeds with low coercivities (≪50 mT) show negligible χfd%. Therefore

Table 3Correlation matrix showing the interrelations amongst various mineral magnetic parameters.
Red bole
Xlf Xfd Xfd% B0(CR) XARM S-ratio SIRM Soft IRM SIRM/Xlf (XARM/X)×100 RR
Xlf 1.00Xfd 0.99 1.00Xfd% 0.24 0.38 1.00B0(CR) −0.52 −0.50 −0.26 1.00XARM 0.89 0.86 0.10 −0.42 1.00S-ratio −0.65 −0.62 −0.20 0.94 −0.53 1.00SIRM 0.82 0.75 −0.13 −0.38 0.96 −0.50 1.00Soft IRM 0.85 0.80 −0.01 −0.39 0.99 −0.51 0.98 1.00SIRM/Xlf −0.35 −0.37 −0.41 0.72 −0.18 0.65 −0.12 −0.16 1.00(XARM/X)×100 −0.18 −0.18 −0.24 0.40 0.00 0.37 0.01 0.00 0.89 1.00RR 0.32 0.31 0.04 0.08 0.36 −0.07 0.39 0.38 −0.21 −0.38 1.00
Brown boleXlf 1.00Xfd 0.44 1.00Xfd% −0.83 0.11 1.00B0(CR) 0.41 −0.04 −0.37 1.00XARM 0.63 0.91 −0.18 −0.18 1.00S-ratio 0.10 −0.70 −0.53 0.46 −0.65 1.00SIRM 0.81 0.52 −0.66 -0.14 0.76 −0.08 1.00Soft IRM 0.33 0.16 −0.41 −0.59 0.41 0.05 0.79 1.00
SIRM/Xlf 0.35 0.40 −0.28 −0.62 0.60 −0.18 0.83 0.97 1.00(XARM/X)×100 −0.34 0.59 0.68 −0.72 0.51 −0.89 0.05 0.19 0.39 1.00RR 0.43 0.15 −0.27 0.83 0.08 0.02 −0.14 −0.67 −0.64 −0.44 1.00
Green boleXlf 1.00Xfd 0.13 1.00Xfd% −0.48 0.72 1.00B0(CR) −0.83 0.25 0.58 1.00XARM 0.94 −0.17 −0.63 −0.90 1.00S-ratio −0.87 0.33 0.81 0.89 −0.93 1.00SIRM 0.87 −0.37 −0.76 −0.92 0.98 −0.96 1.00Soft IRM 0.83 −0.43 −0.78 −0.93 0.96 −0.96 1.00 1.00SIRM/Xlf 0.78 −0.50 −0.79 −0.87 0.93 −0.93 0.98 0.99 1.00(XARM/X)×100 0.66 −0.26 −0.37 −0.71 0.82 −0.62 0.80 0.79 0.82 1.00RR −0.11 −0.65 −0.57 0.13 0.07 −0.10 0.17 0.19 0.27 0.18 1.00
All fragmentary surfacesXlf 1.00Xfd 0.15 1.00Xfd% −0.37 0.60 1.00B0(CR) −0.24 0.19 0.75 1.00XARM 0.58 0.21 −0.28 −0.37 1.00S-ratio −0.08 0.33 0.66 0.88 −0.41 1.00SIRM 0.78 0.27 −0.20 0.00 0.46 0.31 1.00Soft IRM 0.67 −0.31 −0.63 −0.45 0.64 −0.48 0.39 1.00SIRM/Xlf −0.31 0.08 0.30 0.56 −0.31 0.73 0.31 −0.43 1.00(XARM/X)×100 −0.36 −0.03 0.12 −0.08 0.42 −0.35 −0.33 0.13 −0.12 1.00
All compact basaltXlf 1.00Xfd 0.08 1.00Xfd% −0.49 0.80 1.00B0(CR) −0.50 0.19 0.49 1.00XARM 0.70 0.25 −0.24 −0.17 1.00S-ratio −0.46 0.14 0.44 0.99 −0.19 1.00SIRM 0.10 0.09 −0.01 0.71 0.44 0.71 1.00Soft IRM 0.83 0.21 −0.30 −0.64 0.74 −0.64 −0.16 1.00SIRM/Xlf −0.48 0.07 0.35 0.94 −0.01 0.93 0.78 −0.57 1.00(XARM/X)×100 −0.31 0.16 0.28 0.50 0.42 0.46 0.52 −0.11 0.70 1.00
97P. Srivastava et al. / Geoderma 177–178 (2012) 90–109
the SP fraction in the red boles is likely to be of antiferromagnetic (he-matitic) nature. Previously Gavin et al. (2010), from the clay mineralanalysis have inferred that the red boles show a baking effect (heatingto >600 °C), and hence it is inferred that hematite is of secondary or-igin due to baking of the pre-existing finer sediments giving rise tothe SP hematites.
The remanence coercivity [B0(CR)] for the brown boles falls in therange of hard ferrimagnets (40 to 50 mT) while that for the green
boles typically shows softer or multi-domain (MD) nature (majorityof b15 mT with rare in the range of 30 to 40 mT). The harder ferri-magnets suggesting presence of single-domain (SD) magnetites inthe brown boles can be of authigenic (pedogenic/lacustrine) origin.This is further supported by the field occurrence of the brown bolesdepicting ponding/lacustrine conditions (described in Section 3).The green boles representing detrital ferrimagnets (larger/soft MDparticles) are also in accordance with their field characters of infilling,
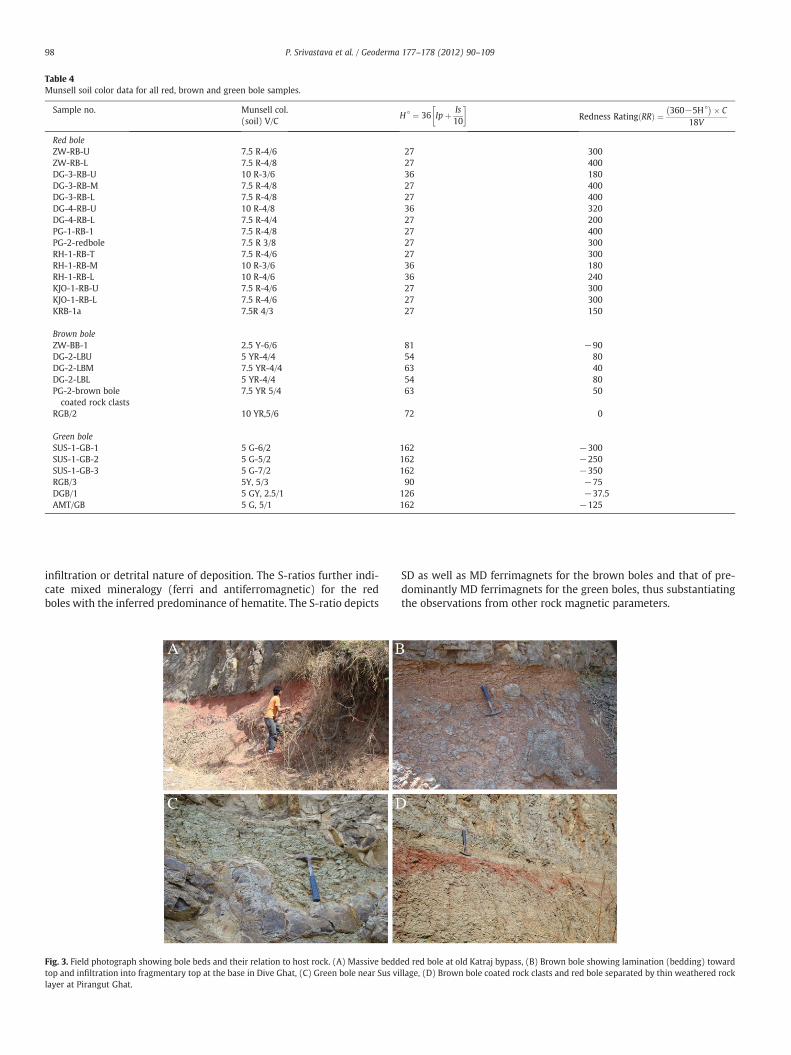
Table 4Munsell soil color data for all red, brown and green bole samples.
Sample no. Munsell col.(soil) V/C
H B ¼ 36 Ipþ Is10
� �Redness RatingðRRÞ ¼ 360−5HB� �� C
18V
Red boleZW-RB-U 7.5 R-4/6 27 300ZW-RB-L 7.5 R-4/8 27 400DG-3-RB-U 10 R-3/6 36 180DG-3-RB-M 7.5 R-4/8 27 400DG-3-RB-L 7.5 R-4/8 27 400DG-4-RB-U 10 R-4/8 36 320DG-4-RB-L 7.5 R-4/4 27 200PG-1-RB-1 7.5 R-4/8 27 400PG-2-redbole 7.5 R 3/8 27 300RH-1-RB-T 7.5 R-4/6 27 300RH-1-RB-M 10 R-3/6 36 180RH-1-RB-L 10 R-4/6 36 240KJO-1-RB-U 7.5 R-4/6 27 300KJO-1-RB-L 7.5 R-4/6 27 300KRB-1a 7.5R 4/3 27 150
Brown boleZW-BB-1 2.5 Y-6/6 81 −90DG-2-LBU 5 YR-4/4 54 80DG-2-LBM 7.5 YR-4/4 63 40DG-2-LBL 5 YR-4/4 54 80PG-2-brown bolecoated rock clasts
7.5 YR 5/4 63 50
RGB/2 10 YR,5/6 72 0
Green boleSUS-1-GB-1 5 G-6/2 162 −300SUS-1-GB-2 5 G-5/2 162 −250SUS-1-GB-3 5 G-7/2 162 −350RGB/3 5Y, 5/3 90 −75DGB/1 5 GY, 2.5/1 126 −37.5AMT/GB 5 G, 5/1 162 −125
98 P. Srivastava et al. / Geoderma 177–178 (2012) 90–109
infiltration or detrital nature of deposition. The S-ratios further indi-cate mixed mineralogy (ferri and antiferromagnetic) for the redboles with the inferred predominance of hematite. The S-ratio depicts
Fig. 3. Field photograph showing bole beds and their relation to host rock. (A) Massive beddtop and infiltration into fragmentary top at the base in Dive Ghat, (C) Green bole near Sus vilayer at Pirangut Ghat.
SD as well as MD ferrimagnets for the brown boles and that of pre-dominantly MD ferrimagnets for the green boles, thus substantiatingthe observations from other rock magnetic parameters.
ed red bole at old Katraj bypass, (B) Brown bole showing lamination (bedding) towardllage, (D) Brown bole coated rock clasts and red bole separated by thin weathered rock
64
210
0050
010
000
5000
1000
0050
000
10
-110
515
050
155
150
50
64
210
0050
060
0020
0010
0000
5000
01
0-1
105
150
506
42
150
50
115
105 95 85 75 65 55 45 35 25 185
165
145
125
105 85 65 45 25
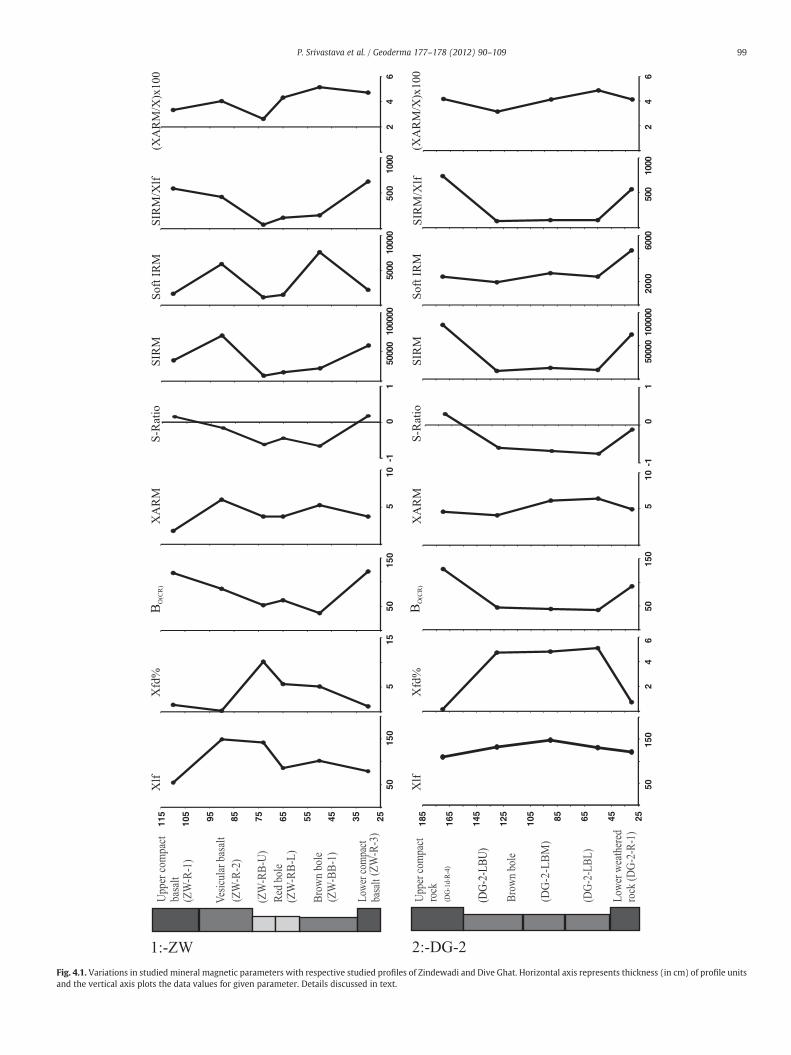
Fig. 4.1. Variations in studied mineral magnetic parameters with respective studied profiles of Zindewadi and Dive Ghat. Horizontal axis represents thickness (in cm) of profile unitsand the vertical axis plots the data values for given parameter. Details discussed in text.
99P. Srivastava et al. / Geoderma 177–178 (2012) 90–109
201060020060002000400002000010-110560020015515050
3140020010000500015000500010-1421505015515050
175
155
135
115
95
75
55
35
15
115
105
95
85
75
65
55
45
35
125
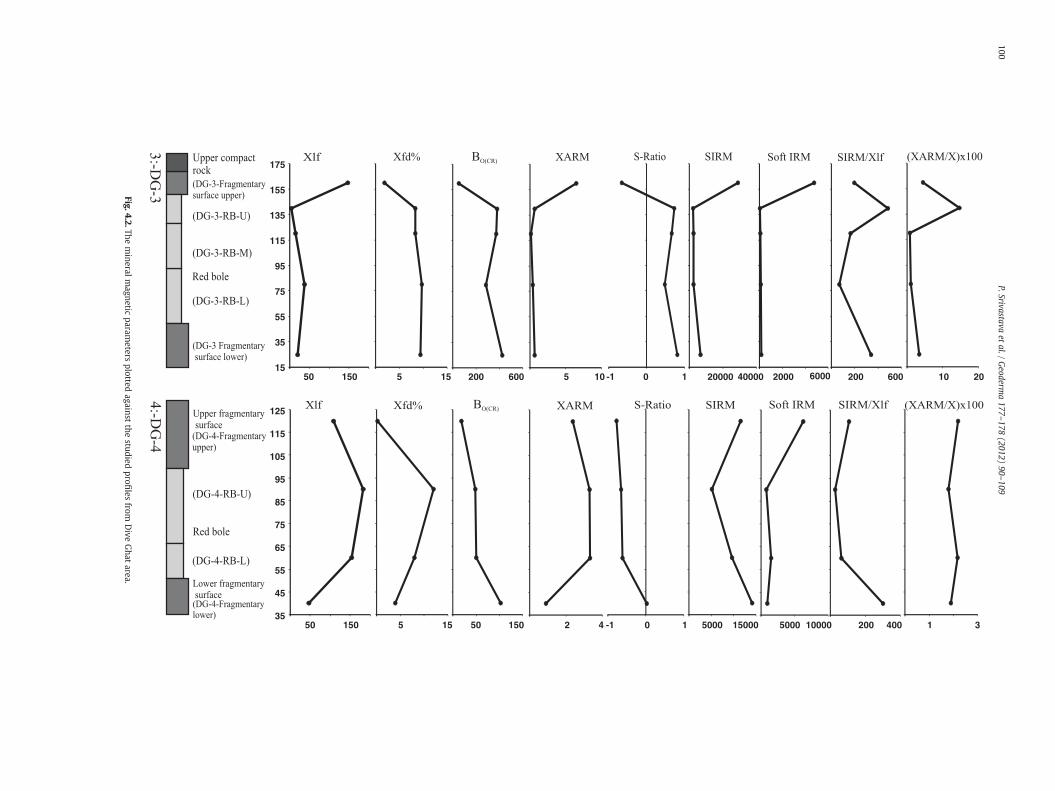
Fig.4.2.Themineralm
agneticparam
etersplotted
againstthe
studiedpro
filesfrom
Dive
Ghat
area.
100P.Srivastava
etal./
Geoderm
a177
–178(2012)
90–109
62
200
015
000
5000
4000
020
000
10
-110
040
04
0-2
200
600
20010
00
515
2060
1020
-10
120
00
4000
50
0010
000
5015
02
6
90 80 70 60 50 3040 20 10 0
115
105 95 85 75 65
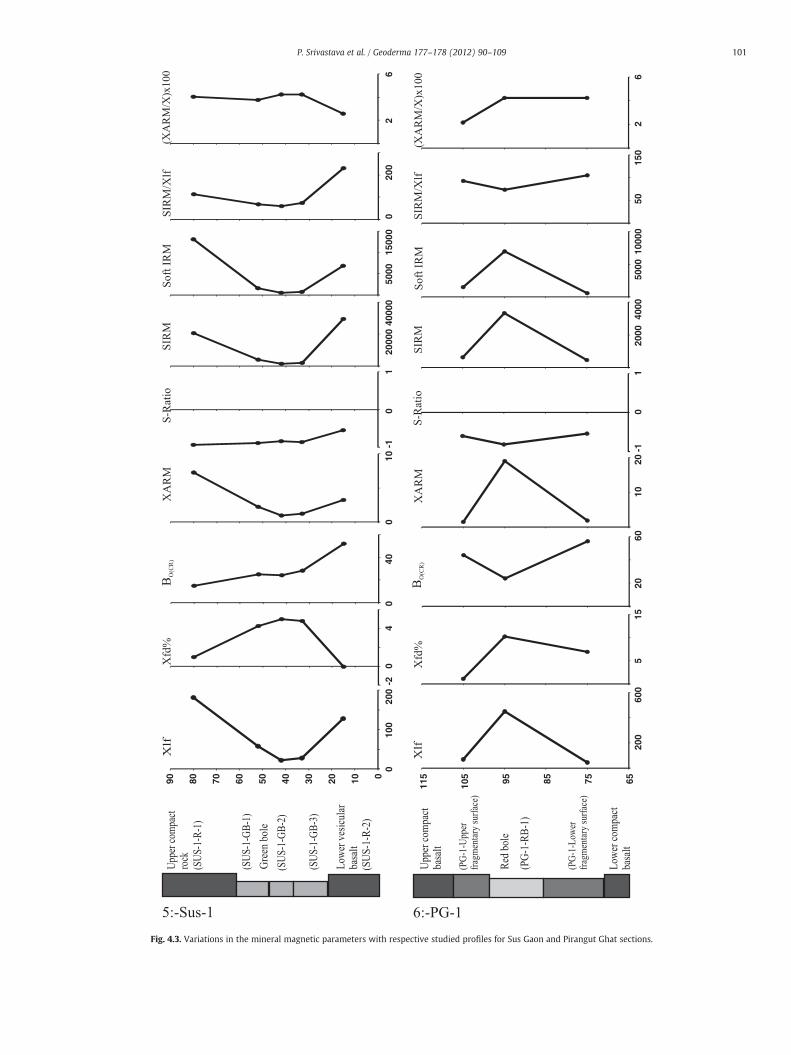
Fig. 4.3. Variations in the mineral magnetic parameters with respective studied profiles for Sus Gaon and Pirangut Ghat sections.
101P. Srivastava et al. / Geoderma 177–178 (2012) 90–109

31
300
100
1000
060
000
2000
050
001
0-1
42
150
5015
525
015
050
62
600
200
1000
060
000
2000
050
001
0-1
42
150
5020
1015
050
115
125
105 95 85 75 65 55 150
130
110 90 70 3050 10
Fig. 4.4. The mineral magnetic parameter with respective studied profiles for Pirangut Ghat and Rohkal sections.
102 P. Srivastava et al. / Geoderma 177–178 (2012) 90–109
42
600
200
3000
1000
4000
020
000
10
-110
515
050
155
300
100
0
62
600
200
3000
1000
3000
010
000
10
-13
115
050
155
150
50
205
195
175
155
135
115 95 75 55 75 70 65 60 55 50 45 40 3035 25
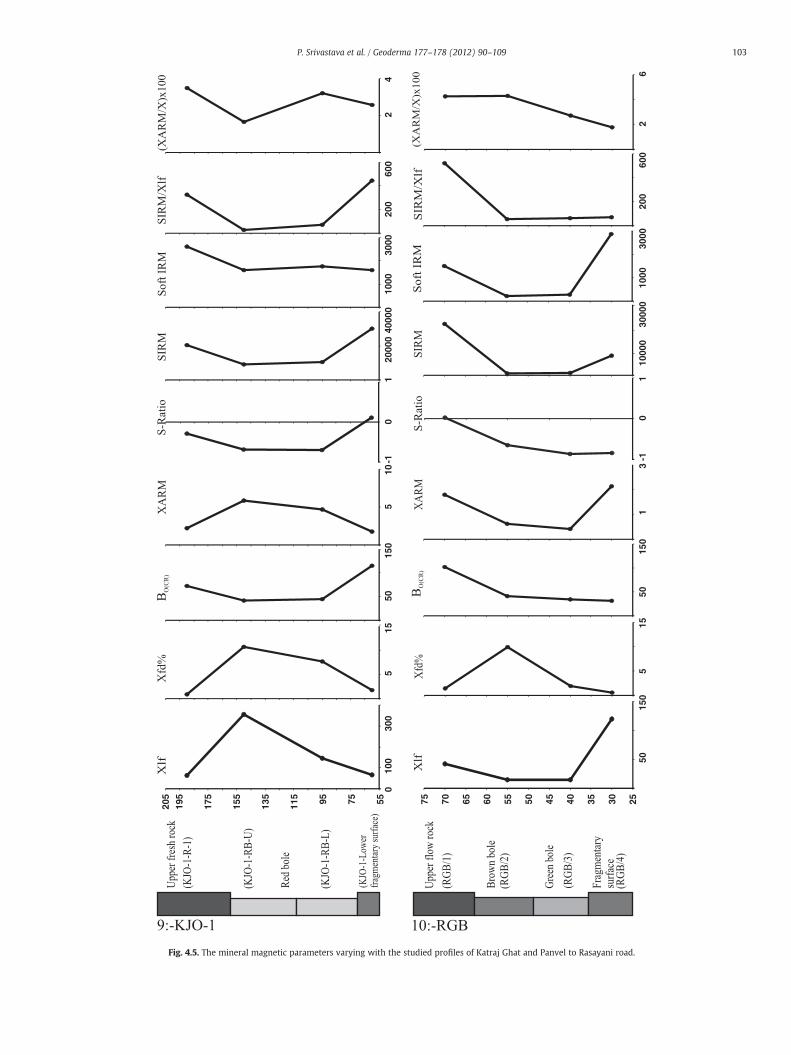
Fig. 4.5. The mineral magnetic parameters varying with the studied profiles of Katraj Ghat and Panvel to Rasayani road.
103P. Srivastava et al. / Geoderma 177–178 (2012) 90–109
62
100
5060
0020
0010
000
5000
21
0-1
-24
240
206
215
050
31
300
100
2000
1000
3000
010
000
20
-14
215
050
105
150
50
70 60 50 40 30 20 10 60 50 40 30 20 10 0
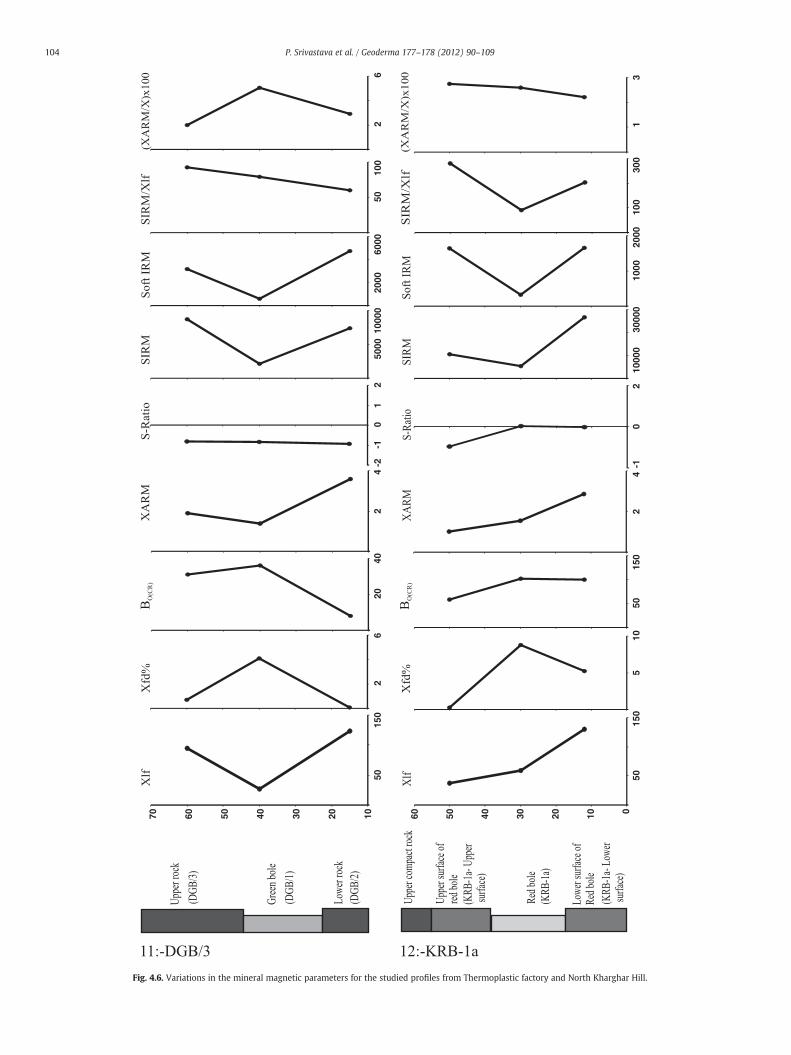
Fig. 4.6. Variations in the mineral magnetic parameters for the studied profiles from Thermoplastic factory and North Kharghar Hill.
104 P. Srivastava et al. / Geoderma 177–178 (2012) 90–109
105
300
100
1500
050
0020
000
1000
02
10
-1-2
64
260
201
0-1
100
50
165
155
145
135
125
115
105 95 85 75 65
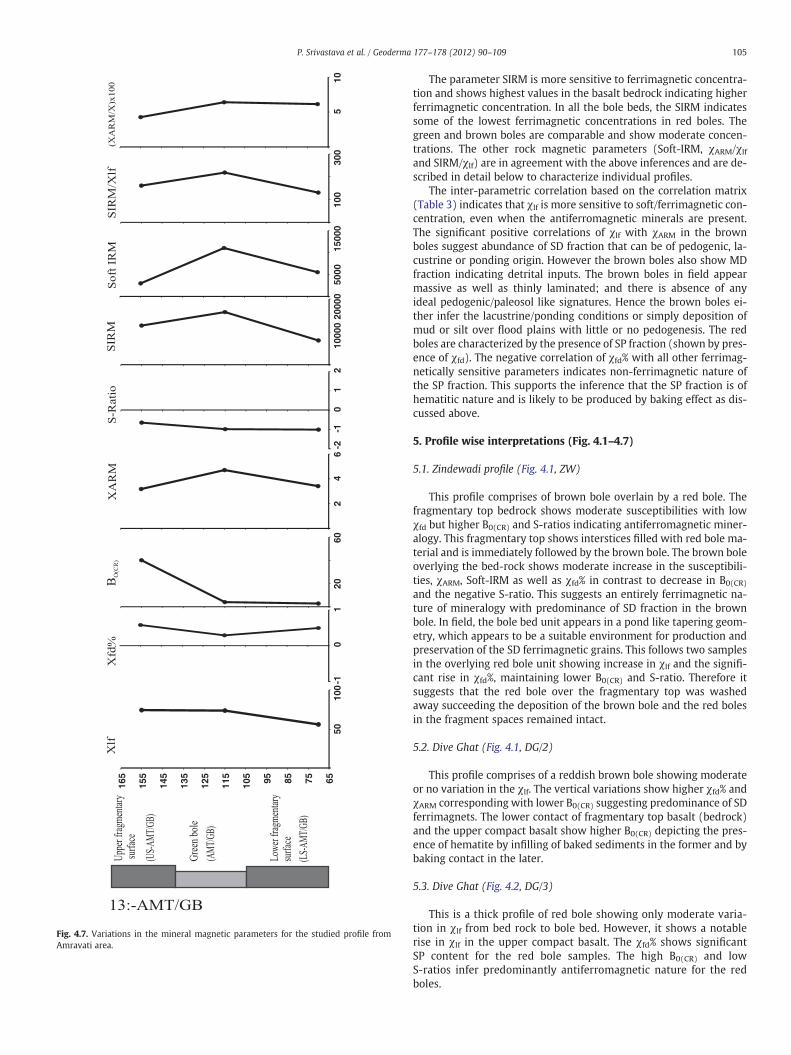
Fig. 4.7. Variations in the mineral magnetic parameters for the studied profile fromAmravati area.
105P. Srivastava et al. / Geoderma 177–178 (2012) 90–109
The parameter SIRM is more sensitive to ferrimagnetic concentra-tion and shows highest values in the basalt bedrock indicating higherferrimagnetic concentration. In all the bole beds, the SIRM indicatessome of the lowest ferrimagnetic concentrations in red boles. Thegreen and brown boles are comparable and show moderate concen-trations. The other rock magnetic parameters (Soft-IRM, χARM/χlfand SIRM/χlf) are in agreement with the above inferences and are de-scribed in detail below to characterize individual profiles.
The inter-parametric correlation based on the correlation matrix(Table 3) indicates that χlf is more sensitive to soft/ferrimagnetic con-centration, even when the antiferromagnetic minerals are present.The significant positive correlations of χlf with χARM in the brownboles suggest abundance of SD fraction that can be of pedogenic, la-custrine or ponding origin. However the brown boles also show MDfraction indicating detrital inputs. The brown boles in field appearmassive as well as thinly laminated; and there is absence of anyideal pedogenic/paleosol like signatures. Hence the brown boles ei-ther infer the lacustrine/ponding conditions or simply deposition ofmud or silt over flood plains with little or no pedogenesis. The redboles are characterized by the presence of SP fraction (shown by pres-ence of χfd). The negative correlation of χfd% with all other ferrimag-netically sensitive parameters indicates non-ferrimagnetic nature ofthe SP fraction. This supports the inference that the SP fraction is ofhematitic nature and is likely to be produced by baking effect as dis-cussed above.
5. Profile wise interpretations (Fig. 4.1–4.7)
5.1. Zindewadi profile (Fig. 4.1, ZW)
This profile comprises of brown bole overlain by a red bole. Thefragmentary top bedrock shows moderate susceptibilities with lowχfd but higher B0(CR) and S-ratios indicating antiferromagnetic miner-alogy. This fragmentary top shows interstices filled with red bole ma-terial and is immediately followed by the brown bole. The brown boleoverlying the bed-rock shows moderate increase in the susceptibili-ties, χARM, Soft-IRM as well as χfd% in contrast to decrease in B0(CR)and the negative S-ratio. This suggests an entirely ferrimagnetic na-ture of mineralogy with predominance of SD fraction in the brownbole. In field, the bole bed unit appears in a pond like tapering geom-etry, which appears to be a suitable environment for production andpreservation of the SD ferrimagnetic grains. This follows two samplesin the overlying red bole unit showing increase in χlf and the signifi-cant rise in χfd%, maintaining lower B0(CR) and S-ratio. Therefore itsuggests that the red bole over the fragmentary top was washedaway succeeding the deposition of the brown bole and the red bolesin the fragment spaces remained intact.
5.2. Dive Ghat (Fig. 4.1, DG/2)
This profile comprises of a reddish brown bole showing moderateor no variation in the χlf. The vertical variations show higher χfd% andχARM corresponding with lower B0(CR) suggesting predominance of SDferrimagnets. The lower contact of fragmentary top basalt (bedrock)and the upper compact basalt show higher B0(CR) depicting the pres-ence of hematite by infilling of baked sediments in the former and bybaking contact in the later.
5.3. Dive Ghat (Fig. 4.2, DG/3)
This is a thick profile of red bole showing only moderate varia-tion in χlf from bed rock to bole bed. However, it shows a notablerise in χlf in the upper compact basalt. The χfd% shows significantSP content for the red bole samples. The high B0(CR) and lowS-ratios infer predominantly antiferromagnetic nature for the redboles.
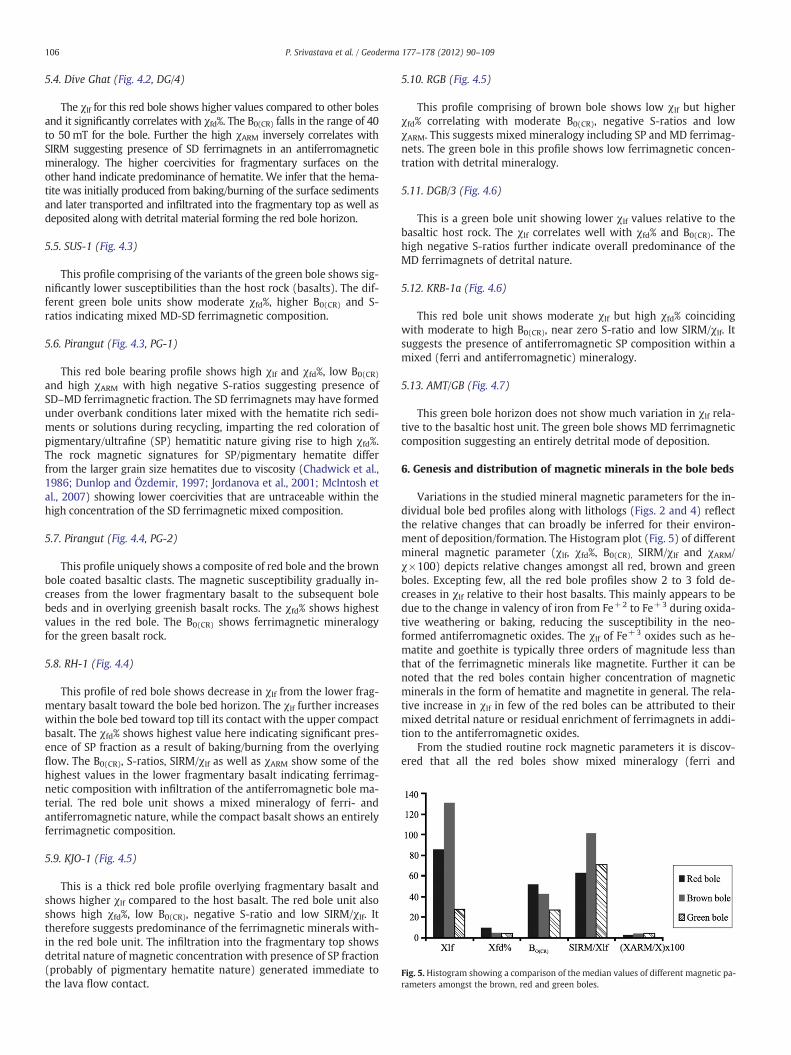
Fig. 5. Histogram showing a comparison of the median values of different magnetic pa-rameters amongst the brown, red and green boles.
106 P. Srivastava et al. / Geoderma 177–178 (2012) 90–109
5.4. Dive Ghat (Fig. 4.2, DG/4)
The χlf for this red bole shows higher values compared to other bolesand it significantly correlates with χfd%. The B0(CR) falls in the range of 40to 50 mT for the bole. Further the high χARM inversely correlates withSIRM suggesting presence of SD ferrimagnets in an antiferromagneticmineralogy. The higher coercivities for fragmentary surfaces on theother hand indicate predominance of hematite. We infer that the hema-tite was initially produced from baking/burning of the surface sedimentsand later transported and infiltrated into the fragmentary top as well asdeposited along with detrital material forming the red bole horizon.
5.5. SUS-1 (Fig. 4.3)
This profile comprising of the variants of the green bole shows sig-nificantly lower susceptibilities than the host rock (basalts). The dif-ferent green bole units show moderate χfd%, higher B0(CR) and S-ratios indicating mixed MD-SD ferrimagnetic composition.
5.6. Pirangut (Fig. 4.3, PG-1)
This red bole bearing profile shows high χlf and χfd%, low B0(CR)and high χARM with high negative S-ratios suggesting presence ofSD–MD ferrimagnetic fraction. The SD ferrimagnets may have formedunder overbank conditions later mixed with the hematite rich sedi-ments or solutions during recycling, imparting the red coloration ofpigmentary/ultrafine (SP) hematitic nature giving rise to high χfd%.The rock magnetic signatures for SP/pigmentary hematite differfrom the larger grain size hematites due to viscosity (Chadwick et al.,1986; Dunlop and Özdemir, 1997; Jordanova et al., 2001; McIntosh etal., 2007) showing lower coercivities that are untraceable within thehigh concentration of the SD ferrimagnetic mixed composition.
5.7. Pirangut (Fig. 4.4, PG-2)
This profile uniquely shows a composite of red bole and the brownbole coated basaltic clasts. The magnetic susceptibility gradually in-creases from the lower fragmentary basalt to the subsequent bolebeds and in overlying greenish basalt rocks. The χfd% shows highestvalues in the red bole. The B0(CR) shows ferrimagnetic mineralogyfor the green basalt rock.
5.8. RH-1 (Fig. 4.4)
This profile of red bole shows decrease in χlf from the lower frag-mentary basalt toward the bole bed horizon. The χlf further increaseswithin the bole bed toward top till its contact with the upper compactbasalt. The χfd% shows highest value here indicating significant pres-ence of SP fraction as a result of baking/burning from the overlyingflow. The B0(CR), S-ratios, SIRM/χlf as well as χARM show some of thehighest values in the lower fragmentary basalt indicating ferrimag-netic composition with infiltration of the antiferromagnetic bole ma-terial. The red bole unit shows a mixed mineralogy of ferri- andantiferromagnetic nature, while the compact basalt shows an entirelyferrimagnetic composition.
5.9. KJO-1 (Fig. 4.5)
This is a thick red bole profile overlying fragmentary basalt andshows higher χlf compared to the host basalt. The red bole unit alsoshows high χfd%, low B0(CR), negative S-ratio and low SIRM/χlf. Ittherefore suggests predominance of the ferrimagnetic minerals with-in the red bole unit. The infiltration into the fragmentary top showsdetrital nature of magnetic concentration with presence of SP fraction(probably of pigmentary hematite nature) generated immediate tothe lava flow contact.
5.10. RGB (Fig. 4.5)
This profile comprising of brown bole shows low χlf but higherχfd% correlating with moderate B0(CR), negative S-ratios and lowχARM. This suggests mixed mineralogy including SP and MD ferrimag-nets. The green bole in this profile shows low ferrimagnetic concen-tration with detrital mineralogy.
5.11. DGB/3 (Fig. 4.6)
This is a green bole unit showing lower χlf values relative to thebasaltic host rock. The χlf correlates well with χfd% and B0(CR). Thehigh negative S-ratios further indicate overall predominance of theMD ferrimagnets of detrital nature.
5.12. KRB-1a (Fig. 4.6)
This red bole unit shows moderate χlf but high χfd% coincidingwith moderate to high B0(CR), near zero S-ratio and low SIRM/χlf. Itsuggests the presence of antiferromagnetic SP composition within amixed (ferri and antiferromagnetic) mineralogy.
5.13. AMT/GB (Fig. 4.7)
This green bole horizon does not show much variation in χlf rela-tive to the basaltic host unit. The green bole shows MD ferrimagneticcomposition suggesting an entirely detrital mode of deposition.
6. Genesis and distribution of magnetic minerals in the bole beds
Variations in the studied mineral magnetic parameters for the in-dividual bole bed profiles along with lithologs (Figs. 2 and 4) reflectthe relative changes that can broadly be inferred for their environ-ment of deposition/formation. The Histogram plot (Fig. 5) of differentmineral magnetic parameter (χlf, χfd%, B0(CR), SIRM/χlf and χARM/χ×100) depicts relative changes amongst all red, brown and greenboles. Excepting few, all the red bole profiles show 2 to 3 fold de-creases in χlf relative to their host basalts. This mainly appears to bedue to the change in valency of iron from Fe+2 to Fe+3 during oxida-tive weathering or baking, reducing the susceptibility in the neo-formed antiferromagnetic oxides. The χlf of Fe+3 oxides such as he-matite and goethite is typically three orders of magnitude less thanthat of the ferrimagnetic minerals like magnetite. Further it can benoted that the red boles contain higher concentration of magneticminerals in the form of hematite and magnetite in general. The rela-tive increase in χlf in few of the red boles can be attributed to theirmixed detrital nature or residual enrichment of ferrimagnets in addi-tion to the antiferromagnetic oxides.
From the studied routine rock magnetic parameters it is discov-ered that all the red boles show mixed mineralogy (ferri and
C) All Green Bole Samples
B) All Brown Bole Samples
A) All Red Bole Samples
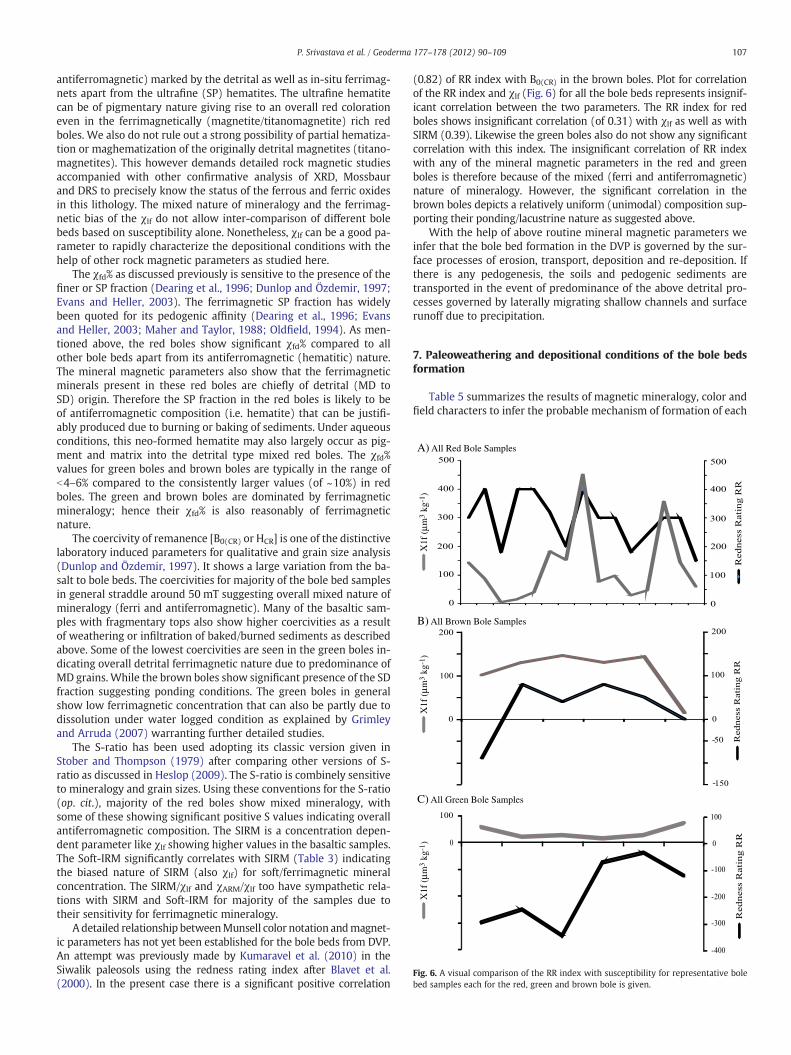
Fig. 6. A visual comparison of the RR index with susceptibility for representative bolebed samples each for the red, green and brown bole is given.
107P. Srivastava et al. / Geoderma 177–178 (2012) 90–109
antiferromagnetic) marked by the detrital as well as in-situ ferrimag-nets apart from the ultrafine (SP) hematites. The ultrafine hematitecan be of pigmentary nature giving rise to an overall red colorationeven in the ferrimagnetically (magnetite/titanomagnetite) rich redboles. We also do not rule out a strong possibility of partial hematiza-tion or maghematization of the originally detrital magnetites (titano-magnetites). This however demands detailed rock magnetic studiesaccompanied with other confirmative analysis of XRD, Mossbaurand DRS to precisely know the status of the ferrous and ferric oxidesin this lithology. The mixed nature of mineralogy and the ferrimag-netic bias of the χlf do not allow inter-comparison of different bolebeds based on susceptibility alone. Nonetheless, χlf can be a good pa-rameter to rapidly characterize the depositional conditions with thehelp of other rock magnetic parameters as studied here.
The χfd% as discussed previously is sensitive to the presence of thefiner or SP fraction (Dearing et al., 1996; Dunlop and Özdemir, 1997;Evans and Heller, 2003). The ferrimagnetic SP fraction has widelybeen quoted for its pedogenic affinity (Dearing et al., 1996; Evansand Heller, 2003; Maher and Taylor, 1988; Oldfield, 1994). As men-tioned above, the red boles show significant χfd% compared to allother bole beds apart from its antiferromagnetic (hematitic) nature.The mineral magnetic parameters also show that the ferrimagneticminerals present in these red boles are chiefly of detrital (MD toSD) origin. Therefore the SP fraction in the red boles is likely to beof antiferromagnetic composition (i.e. hematite) that can be justifi-ably produced due to burning or baking of sediments. Under aqueousconditions, this neo-formed hematite may also largely occur as pig-ment and matrix into the detrital type mixed red boles. The χfd%values for green boles and brown boles are typically in the range ofb4–6% compared to the consistently larger values (of ~10%) in redboles. The green and brown boles are dominated by ferrimagneticmineralogy; hence their χfd% is also reasonably of ferrimagneticnature.
The coercivity of remanence [B0(CR) or HCR] is one of the distinctivelaboratory induced parameters for qualitative and grain size analysis(Dunlop and Özdemir, 1997). It shows a large variation from the ba-salt to bole beds. The coercivities for majority of the bole bed samplesin general straddle around 50 mT suggesting overall mixed nature ofmineralogy (ferri and antiferromagnetic). Many of the basaltic sam-ples with fragmentary tops also show higher coercivities as a resultof weathering or infiltration of baked/burned sediments as describedabove. Some of the lowest coercivities are seen in the green boles in-dicating overall detrital ferrimagnetic nature due to predominance ofMD grains. While the brown boles show significant presence of the SDfraction suggesting ponding conditions. The green boles in generalshow low ferrimagnetic concentration that can also be partly due todissolution under water logged condition as explained by Grimleyand Arruda (2007) warranting further detailed studies.
The S-ratio has been used adopting its classic version given inStober and Thompson (1979) after comparing other versions of S-ratio as discussed in Heslop (2009). The S-ratio is combinely sensitiveto mineralogy and grain sizes. Using these conventions for the S-ratio(op. cit.), majority of the red boles show mixed mineralogy, withsome of these showing significant positive S values indicating overallantiferromagnetic composition. The SIRM is a concentration depen-dent parameter like χlf showing higher values in the basaltic samples.The Soft-IRM significantly correlates with SIRM (Table 3) indicatingthe biased nature of SIRM (also χlf) for soft/ferrimagnetic mineralconcentration. The SIRM/χlf and χARM/χlf too have sympathetic rela-tions with SIRM and Soft-IRM for majority of the samples due totheir sensitivity for ferrimagnetic mineralogy.
A detailed relationship betweenMunsell color notation andmagnet-ic parameters has not yet been established for the bole beds from DVP.An attempt was previously made by Kumaravel et al. (2010) in theSiwalik paleosols using the redness rating index after Blavet et al.(2000). In the present case there is a significant positive correlation
(0.82) of RR index with B0(CR) in the brown boles. Plot for correlationof the RR index and χlf (Fig. 6) for all the bole beds represents insignif-icant correlation between the two parameters. The RR index for redboles shows insignificant correlation (of 0.31) with χlf as well as withSIRM (0.39). Likewise the green boles also do not show any significantcorrelation with this index. The insignificant correlation of RR indexwith any of the mineral magnetic parameters in the red and greenboles is therefore because of the mixed (ferri and antiferromagnetic)nature of mineralogy. However, the significant correlation in thebrown boles depicts a relatively uniform (unimodal) composition sup-porting their ponding/lacustrine nature as suggested above.
With the help of above routine mineral magnetic parameters weinfer that the bole bed formation in the DVP is governed by the sur-face processes of erosion, transport, deposition and re-deposition. Ifthere is any pedogenesis, the soils and pedogenic sediments aretransported in the event of predominance of the above detrital pro-cesses governed by laterally migrating shallow channels and surfacerunoff due to precipitation.
7. Paleoweathering and depositional conditions of the bole bedsformation
Table 5 summarizes the results of magnetic mineralogy, color andfield characters to infer the probable mechanism of formation of each
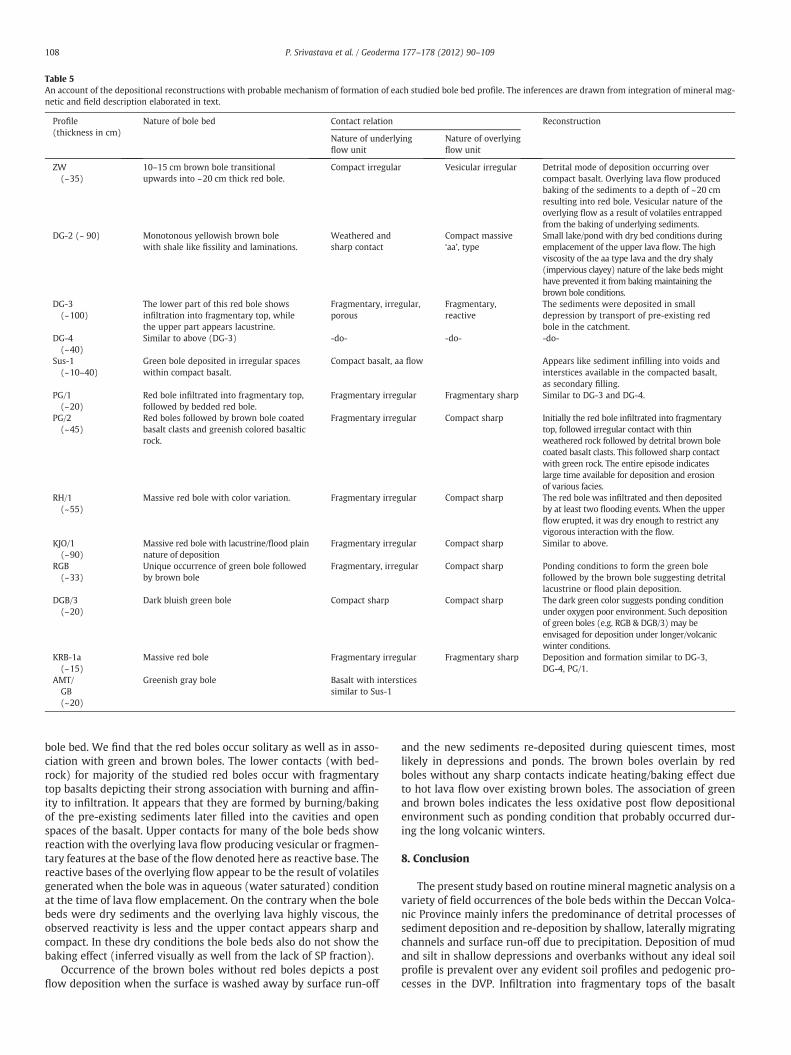
Table 5An account of the depositional reconstructions with probable mechanism of formation of each studied bole bed profile. The inferences are drawn from integration of mineral mag-netic and field description elaborated in text.
Profile(thickness in cm)
Nature of bole bed Contact relation Reconstruction
Nature of underlyingflow unit
Nature of overlyingflow unit
ZW(~35)
10–15 cm brown bole transitionalupwards into ~20 cm thick red bole.
Compact irregular Vesicular irregular Detrital mode of deposition occurring overcompact basalt. Overlying lava flow producedbaking of the sediments to a depth of ~20 cmresulting into red bole. Vesicular nature of theoverlying flow as a result of volatiles entrappedfrom the baking of underlying sediments.
DG-2 (~ 90) Monotonous yellowish brown bolewith shale like fissility and laminations.
Weathered andsharp contact
Compact massive‘aa’, type
Small lake/pond with dry bed conditions duringemplacement of the upper lava flow. The highviscosity of the aa type lava and the dry shaly(impervious clayey) nature of the lake beds mighthave prevented it from baking maintaining thebrown bole conditions.
DG-3(~100)
The lower part of this red bole showsinfiltration into fragmentary top, whilethe upper part appears lacustrine.
Fragmentary, irregular,porous
Fragmentary,reactive
The sediments were deposited in smalldepression by transport of pre-existing redbole in the catchment.
DG-4(~40)
Similar to above (DG-3) -do- -do- -do-
Sus-1(~10–40)
Green bole deposited in irregular spaceswithin compact basalt.
Compact basalt, aa flow Appears like sediment infilling into voids andinterstices available in the compacted basalt,as secondary filling.
PG/1(~20)
Red bole infiltrated into fragmentary top,followed by bedded red bole.
Fragmentary irregular Fragmentary sharp Similar to DG-3 and DG-4.
PG/2(~45)
Red boles followed by brown bole coatedbasalt clasts and greenish colored basalticrock.
Fragmentary irregular Compact sharp Initially the red bole infiltrated into fragmentarytop, followed irregular contact with thinweathered rock followed by detrital brown bolecoated basalt clasts. This followed sharp contactwith green rock. The entire episode indicateslarge time available for deposition and erosionof various facies.
RH/1(~55)
Massive red bole with color variation. Fragmentary irregular Compact sharp The red bole was infiltrated and then depositedby at least two flooding events. When the upperflow erupted, it was dry enough to restrict anyvigorous interaction with the flow.
KJO/1(~90)
Massive red bole with lacustrine/flood plainnature of deposition
Fragmentary irregular Compact sharp Similar to above.
RGB(~33)
Unique occurrence of green bole followedby brown bole
Fragmentary, irregular Compact sharp Ponding conditions to form the green bolefollowed by the brown bole suggesting detritallacustrine or flood plain deposition.
DGB/3(~20)
Dark bluish green bole Compact sharp Compact sharp The dark green color suggests ponding conditionunder oxygen poor environment. Such depositionof green boles (e.g. RGB & DGB/3) may beenvisaged for deposition under longer/volcanicwinter conditions.
KRB-1a(~15)
Massive red bole Fragmentary irregular Fragmentary sharp Deposition and formation similar to DG-3,DG-4, PG/1.
AMT/GB(~20)
Greenish gray bole Basalt with intersticessimilar to Sus-1
108 P. Srivastava et al. / Geoderma 177–178 (2012) 90–109
bole bed. We find that the red boles occur solitary as well as in asso-ciation with green and brown boles. The lower contacts (with bed-rock) for majority of the studied red boles occur with fragmentarytop basalts depicting their strong association with burning and affin-ity to infiltration. It appears that they are formed by burning/bakingof the pre-existing sediments later filled into the cavities and openspaces of the basalt. Upper contacts for many of the bole beds showreaction with the overlying lava flow producing vesicular or fragmen-tary features at the base of the flow denoted here as reactive base. Thereactive bases of the overlying flow appear to be the result of volatilesgenerated when the bole was in aqueous (water saturated) conditionat the time of lava flow emplacement. On the contrary when the bolebeds were dry sediments and the overlying lava highly viscous, theobserved reactivity is less and the upper contact appears sharp andcompact. In these dry conditions the bole beds also do not show thebaking effect (inferred visually as well from the lack of SP fraction).
Occurrence of the brown boles without red boles depicts a postflow deposition when the surface is washed away by surface run-off
and the new sediments re-deposited during quiescent times, mostlikely in depressions and ponds. The brown boles overlain by redboles without any sharp contacts indicate heating/baking effect dueto hot lava flow over existing brown boles. The association of greenand brown boles indicates the less oxidative post flow depositionalenvironment such as ponding condition that probably occurred dur-ing the long volcanic winters.
8. Conclusion
The present study based on routinemineral magnetic analysis on avariety of field occurrences of the bole beds within the Deccan Volca-nic Province mainly infers the predominance of detrital processes ofsediment deposition and re-deposition by shallow, laterally migratingchannels and surface run-off due to precipitation. Deposition of mudand silt in shallow depressions and overbanks without any ideal soilprofile is prevalent over any evident soil profiles and pedogenic pro-cesses in the DVP. Infiltration into fragmentary tops of the basalt
109P. Srivastava et al. / Geoderma 177–178 (2012) 90–109
bedrocks with baked (/unbaked) red and brown bole sediments andthe infilling of vugs and interstices producing green boles are notable.Baking of the underlying sediments by a lava flow is conditioned byaqueous or dry nature of the sediments and the viscosity of lava.The red boles more commonly occur as transportation of the burned(reddened) sediments mixed with un-oxidized or partly oxidized de-trital fragments. The present work thus refutes pedogenesis or later-itization as a significant process for the formation of these bole bedsas inferred previously. This work further demands a detailed fieldand mineral magnetic documentation of individual bole beds for bet-ter understanding of the depositional and paleo-environmental con-ditions during pause in volcanism in the DVP.
Acknowledgments
We acknowledge Head, Department of Geology, University ofPune and the Director NGRI, Hyderabad for encouraging this collabo-ration. Priyeshu Srivastava thanks to the Director, Wadia Institute ofHimalayan Geology and Dr. D. P. Dobhal for their support during thework. Priyeshu Srivastava is grateful to Mr. Bibin Das of NGRI for hisgenerous help during analysis. We also thank the two anonymous re-viewers and Ms. Nikita Kaushal and Mr. Yogesh Kulkarni, Universityof Pune, for their insightful comments and suggestions in improvingthe manuscript. The present work was partly funded by ISRO-UoPproject under the grant GOIA/337B to SJS, DCM and SSG.
References
Barrón, V., Torrent, J., 2002. Evidence for a simple pathway to maghemite in Earth andMars soils. Geochimica et Cosmochimica Acta 66, 2801–2806.
Beckmann, G.G., Thompson, C.H., Hubble, G.D., 1974. Genesis of red and black soils onbasalts on the Darling Downs, Queensland, Australia. European Journal of Soil Sci-ence 25, 265–281.
Blavet, D., Mathe, E., Leprun, J.C., 2000. Relations between soil colour and waterloggingduration in a representative hillside of the West African granite-gneissic bedrock.Catena 39, 187–210.
Chadwick, J.C., Jones, D.H., Thomas, M.F., 1986. Superparamagnetism and the Morintransition in amorphous and crystalline iron oxide systems. Hyperfine Interactions28, 541–544.
Dearing, J.A., Dann, R.J., Hay, K., Lees, J.A., Loveland, P.J., Maher, B.A., O'Grady, K., 1996.Frequency dependent susceptibility measurements of environmental materials.Geophysical Journal International 124 (1), 228–240.
Dunlop, D.J., Özdemir, Ö., 1997. Rock Magnetism: Fundamentals and Frontiers. Univer-sity Press, Cambridge. 488 p.
Evans, M.E., Heller, F., 2003. Environmental Magnetism: Principles and Applications ofEnviromagnetics. International Geophysics Series. Academic Press. 293 pp.
Gavin, P., Chevier, V., Sayyed, M.R.G., Islam, R., 2010. Spectral Analysis of Deccan Paleo-sols. Analog for Phyllosilicates On Mars, India.
Ghosh, P., Sayeed, M.R.G., Islam, R., Hundekari, S.M., 2006. Geochemical and stable isotopestudies of the Maastrichtian Interbasaltic clay (Bole bed) horizons fromDeccan Trapsof India: implications for palaeoweathering and palaeoclimates during DeccanVolcanism. Palaeogeography, Palaeoclimatology, Palaeoecology 242, 90–109.
Grimley, D.A., Arruda, N.K., 2007. Observations of magnetite dissolution inpoorlydrained soils. Soil Science 172, 968–982.
Heslop, D., 2009. On the statistical analysis of the rock magnetic S-ratio. GeophysicalJournal International 178, 159–161.
Jordanova, N., Petrovsky, E., Kovacheva, M., Jordanova, D., 2001. Factors determiningmagnetic enhancement of burnt clay from archaeological sites. Journal of Archae-ological Science 28, 1137–1148. doi:10.1006/jasc.2000.0645.
Kletetschka, G., Wasilewski, P.J., Taylor, P.T., 2000. Mineralogy of the source for mag-netic anomalies on Mars. Meteoritics & Planetary Science 35, 895–899.
Kumaravel, V., Sangode, S.J., Siddaiah, N.S., Kumar, R., 2010. Interrelation of magneticsusceptibility, soil color and elemental mobility in the Pliocene–Pleistocene Siwalikpaleosol sequences of the NW Himalaya, India. Geoderma 154, 267–280.
Maher, B.A., Taylor, R.M., 1988. Formation of ultrafine-grained magnetite in soils. Na-ture 336, 368–371.
McIntosh, G., Kovacheva, M., Catanzariti, G., Osete, M.L., Casas, L., 2007. Widespread oc-currence of a novel high coercivity, thermally stable, low unblocking temperaturemagnetic phase in heated archeological material. Geophysical Research Letters 34,L21302. doi:10.1029/2007GL031168.
Mullins, C.E., 1977. Magnetic susceptibility of the soil and its significance m soil sci-ence: a review. Journal of Soil Science 28, 223–246.
Mullins, C.E., Tite, M.S., 1973. Magnetic viscosity, quadrature susceptibility and fre-quency dependence of susceptibility in single domain assemblies of magnetiteand maghemite. Journal of Geophysical Research 78 (5), 804–809.
Munsell, 2000. Munsell Soil Colour Charts. Gretag Macberth, New York.Oldfield, F., 1994. Towards the discrimination of fine grained ferrimagnets by magnetic
measurements in lake and near-shore marine sediments. Journal of GeophysicalResearch 99 (B5), 9045–9050.
Sayyed, M.R.G., Hundekari, S.M., 2006. Preliminary comparison of ancient bole bedsand modern soils developed upon the Deccan Volcanic Basalts around Pune(India): potential for palaeoenvironmental reconstruction. Quaternary Interna-tional 156–157, 189–199.
Schwertmann, U., 1988. Occurrence and formation of iron oxides in various pedoenvir-onments. In: Stucki, J.W., Goodman, B.A., Schwertmann, U. (Eds.), Iron in Soils andClay Minerals. Reidel Publishing, Dordrecht, pp. 267–308.
Schwertmann, U., 1993. Relations between iron oxides, soil color, and soil formation.Soil Color: Soil Sci. Soc. Am. Spec. Publ., Madison, vol. 31, pp. 51–69.
Sheldon, N.D., 2002. Do “Red beds” indicate deserts or monsoons? Denver annualMeeting, 2002. Session 23, Palaeosols and Phanerozoic Climate: Geochemistry toTrace Fossils.
Srivastava, P., 2010. Mineral Magnetic Characterization of Some Inter-basaltic Sedi-ment Layers from selective Localities in the Deccan Basaltic Province, Maharashtra.Unpublished Dissertation Thesis, University of Pune, India.
Stober, J.C., Thompson, R., 1979. An investigation into the source of magneticminerals in some Finnish lake sediments. Earth and Planetary Science Letters 45,464–474.
Taylor, R.M., Schwertmann, U., 1978. The influence of aluminium on iron oxides. Part I.The influence of A1 on Fe oxide formation from the Fe (II) system. Clays and ClayMinerals 26, 373–383.
Thompson, J.A., Bell, J., 1996. Color index for identifying hydric conditions for seasonal-ly saturated mollisols in Minnesota. Soil Science Society of America Journal 60,1979–1988.
Thompson, R., Oldfield, F., 1986. Environmental Magnetism. Allen and Unwin Press,London. pp 227.
Torrent, J., Schwertmann, U., Fechter, H., Alferez, F., 1983. Quantitative relationshipsbetween soil color and hematite content. Soil Science 136 (6), 354–358.
Torrent, J., Schwertmann, U., Schulze, D.G., 1980. Iron oxide mineralogy of some soils oftwo river terrace sequences in Spain. Geoderma 23, 191–208.
Wänke, H., Brückner, J., Dreibus, G., Rieder, R., Ryabchikov, I., 2001. Chemical composi-tion of rocks and soils at the Pathfinder site. Space Science Reviews 96, 317–330.
Widdowson,M.,Walsh, J.N., Subbarao, K.V., 1997. The geochemistry of Indian bole horizons:palaeoenvironmental implications of Deccan intravolcanic palaeosurfaces. Palaeosur-faces: Recognition, Reconstruction and Palaeoenvironmental Interpretation: In:Widdowson, M. (Ed.), Geological Society Special publication, 120, pp. 269–281.
Wilkins, A., Subbarao, K.B., Ingram, G., Walsh, J.N., 1994. Weathering regimes withinthe Deccan basalts. In: Subbarao, K. (Ed.), Volcanism. Wiley Eastern Ltd., NewDelhi, pp. 217–231.