Source Rock Depositional Processes in Different Marine ...
208
Source Rock Depositional Processes in Different Marine Settings: Examples from North African Basins Von der Fakultät für Georessourcen und Materialtechnik der Rheinisch-Westfälischen Technischen Hochschule Aachen zur Erlangung des akademischen Grades eines Doktors der Naturwissenschaften genehmigte Dissertation vorgelegt von M.Sc. Bandar Ismail Hassan Ghassal aus Makkah, Saudi Arabien Berichter: Univ.-Prof.Dr.rer.nat. Ralf Littke AOR Dr.rer.nat. Sven Sindern Tag der mündlichen Prüfung: 20. Juli 2017 (Ausschließlich für elektronische Veröffentlichung bestimmt): Diese Dissertation ist auf den Internetseiten der Hochschulbibliothek online verfügbar
-
Upload
khangminh22 -
Category
Documents
-
view
2 -
download
0
Transcript of Source Rock Depositional Processes in Different Marine ...

Source Rock Depositional Processes in Different Marine Settings: Examples from
North African Basins
Von der Fakultät für Georessourcen und Materialtechnik
der Rheinisch-Westfälischen Technischen Hochschule Aachen
zur Erlangung des akademischen Grades eines
Doktors der Naturwissenschaften
genehmigte Dissertation
vorgelegt von M.Sc.
Bandar Ismail Hassan Ghassal
aus Makkah, Saudi Arabien
Berichter: Univ.-Prof.Dr.rer.nat. Ralf Littke
AOR Dr.rer.nat. Sven Sindern
Tag der mündlichen Prüfung: 20. Juli 2017
(Ausschließlich für elektronische Veröffentlichung bestimmt):
Diese Dissertation ist auf den Internetseiten der Hochschulbibliothek online verfügbar

I
DECLARATION OF AUTHORSHIP
I certify that the thesis presented here is original and the result of my own investigations, except as acknowledged, and has not been submitted, either in part or whole, for a degree at this or any other University.
Aachen,
Bandar Ismail Ghassal

II
ACKNOWLEDGMENT
From the bottom of my heart, I would like to thank everyone who helped me to reach this
point of my education and career. Thank you very much, my mother, for being the
support and motivation who always drives me to succeed. Every success I reached or
will reach has your fingerprint on it. I would also like to sincerely express my gratitude
to my wife who sacrificed a lot for me to see me succeed and put my needs before hers.
Thank you for those beautiful paints that precedes Chapters 2-4. Thanks to my lovely kids
Jory and Rakan for being the hope especially in tough times. Your smiles and small
dreams made me work hard so you can be proud of your daddy! Big thank you to my
Sister Ghaddah and my brother Bassim who provided me with tremendous support
throughout my life. I hope your pieces of advice and help paid back. Thank you to the
great person who I wish he saw this day; My father who passed away when I was six years
old but left me with a golden reputation, tips and inspirations that paved the way for me
to be passionate to learn new things every day and to keep healthy relationships with
others.
Thank you very much for my employer Saudi Aramco for funding my Ph.D. program and
overcoming every obstacle that could have affected my studies. Special thanks to Mr.
Saleh Al Ammari, Dr. Sami Abdelbagi and Mrs. Aggie Copper from Saudi Aramco. Thank
you is a small expression that describes my appreciation. I would like to thank the person
whom I admire and who polished my academic and management skills, my advisor
Professor Ralf Littke for the fruitful Ph.D. program. It was an extraordinary experience
that went beyond only the thesis work but extended to teach in classes, advising Master
and Bachelor students, supervising the Rock-Eval laboratory and working on various
technical projects. Many thanks to Professor Sven Sindern who provided valuable
consultations in the XRF analyses and for being the second reviewer of this thesis. I am
very grateful to Dr. Bernard Krooß for his support and usual rich scientific discussions. I
learned a great deal from you. I would like to express my gratitude to Professor Jan

III
Schwarzbauer for his great help and valuable discussions in regards of the molecular
geochemistry field during my Ph.D. program. I sincerely appreciate all the support and
help given by my friend and one of my top coauthors Dr. Haytham El Atfy from the
Mansoura University, also for helping in the German abstract and providing the Nile Delta
and Western Desert wells. Many thanks to Dr. Victoria Sachse for the insightful
discussions and great support that helped me a lot during my program. It was a great
pleasure working with a very talented dedicated and professional technical group who I
enjoyed learning from. Thank you to Dipl.-Ing. Chemie Donka Macherey who helped in
preparing the microscopy samples. I extend my gratitude to Mrs. Kerstin Windeck for
making the carbon and sulfur measurements and Dipl.-Ing. Chemie Annette
Schneiderwind for helping in the molecular geochemical analysis. Special thanks to Mr.
Alexander Stock for helping in the sampling of the Tarfaya project core and to Miss Laura
Zeiger for helping in the German abstract. I would like to thank Ms. Diana Marcela Chaves
Saldaña and Mr. Jan Gronewald who assisted in the analysis of the same project. Many
thanks to Mr. Gregor Scholtysik for helping in the GPT-3 geochemical analysis. I thank the
micropaleontology group at the Kiel University very much for providing us with the core
samples from Tarfaya. Many thanks also to all coauthors and Editor in Chiefs who helped
in reviewing the three papers constituting major parts of my thesis.
Thank you God I did it!

IV
ABSTRACT
The current thesis assesses source rock characteristics in various shallow marine
settings using samples from the Nile Delta and Abu Gharadig basins in Egypt and the
Tarfaya Basin in Morocco. The methods include organic and inorganic geochemistry,
organic petrology, basin modeling, and palynology. The thesis comprises three main
studies. First, the Nile Delta Basin source rock potential is determined using organic
geochemistry and petrology as well as 1D basin modeling of two onshore wells. The Abu
Hammad-1 well located in the southeastern Nile Delta Basin hosts fair to good gas prone
source rocks within the Upper Jurassic and Lower Cretaceous section. The molecular
geochemical analyses indicate shallow marine depositional environment and mixed
marine and terrestrial organic matter. The burial and thermal numerical 1D model and
organic petrology results indicate thermally immature section. However, this Mesozoic
section is expected to have better potential and thermal maturity toward the northern
parts of the basin. The middle Miocene to Pleistocene section is examined in the
Matariya-1 well which is located in northeastern onshore Nile Delta Basin. It contains fair
gas prone source rocks in a middle Miocene lowstand wedge. This section has attained
onset oil generation stage. The great thickness of the section and proximity to the
reservoir facies upraise its source rock potential. The study recommends further
exploration in deep targets such as Mesozoic sections, especially in the offshore areas.
The second part of the thesis evaluates the source rock potential and paleoenvironment
of the Cenomanian to Santonian succession of the Bahariya and Abu Roash formations at
the GPT-3 well, Western Desert, Egypt. The study employed organic and inorganic
geochemical and palynological techniques. The results show that the succession
represents variable oxic shelf depositional environments with low organic matter
preservation excluding the Abu Roash “F” Member which shows two source rock facies.
The basal part of this member is rich in carbonate, TOC and marine organic matter. The
kerogen is relatively rich in organic sulfur (Sorg) due to the limited reactive Fe supply
upon deposition leading to excesses S incorporation into organic matter. The middle part
of the Abu Roash “F” Member is lean in organics and very rich in terrestrial elements (e.g.

V
Fe, Ti, Si) and associated with Botryococcus indicating sea regression. This facies overlain
by a suboxic marine oil prone source rock with lower Sorg contents. Both source rocks are
lower in Tmax as compared to the above and below sections implying thermal maturity
retardation possibly due to high liptinite contents, high pressures or lack of catalytic
elements. Moreover, two oil reservoirs were geochemically characterized. These findings
are vital for future hydrocarbon exploration and paleoenvironment reconstructions.
In the Tarfaya Basin, Cenomanian to Turonian source rocks are classified based on their
organic geochemical and petrological properties. The molecular geochemistry suggests
marine anoxic depositional environment with an extreme oxygen depletion attained at
the Cenomanian/Turonian boundary event (CTBE) associated with increased
cyanobacteria activities. The lower Cenomanian is characterized by higher silicate
contents compared to the rest of the section based on major elemental data. All samples
are dominated by submicroscopic organic matter. The lower Cenomanian is poor in
bituminite, whereas, the upper Cenomanian to Turonian samples show variable
bituminite contents. Furthermore, the samples show variable Sorg contents. The change
in organic matter type was controlled by early diagenetic kerogen sulfurization, which
depends on the interplay between S, Fe and organic matter, and upwelling processes. The
source rocks are classified into 1) low Sorg and moderately TOC-rich oil prone source
rocks (lower Cenomanian), 2) moderate Sorg and TOC-rich oil prone source rocks (upper
Cenomanian), 3) high Sorg and TOC-rich oil prone source rocks (Turonian) and 4) very
high Sorg and TOC-rich oil prone source rocks (CTBE). Types 2 to 4 will generate sulfur-
rich petroleum upon maturation or artificial oil shale retorting.

VI
ZUSAMMENFASSUNG
Diese Dissertation behandelt Edölmuttergesteine aus flach-marinen Sedimentfolgen des Nil-
Delta, des Abu-Gharadig Beckens in Ägypten und des Tarfaya Beckens in Marokko und ihre
charakteristischen Eigenschaften. Die Methoden umfassen organische und anorganische
Geochemie, organische Petrologie, Beckenmodellierung und Palynologie. Die Dissertation
umfasst drei Hauptkapitel. Zuerst wird das Muttergesteins-Potential von Proben aus dem
Nil-Delta mit Hilfe organischer Geochemie und Petrologie sowie der 1D-Beckenmodellierung
anhand zweier Onshore-Bohrungen bestimmt. Die Abu Hammad-1-Bohrung aus dem
südöstlichen Nil-Delta enthält mäßiggute bis gute Muttergesteine des Oberen Jura und der
Unterkreide. Die molekular-geochemischen Analysen zeigen ein flach-marines
Ablagerungsmilieu und den gemischten Eintrag von marinem und terrestrischem
organischen Material. Die thermische Reife ist gering. Allerdings wird erwartet, dass diese
Mesozoische Sektion in nördlichen Teilen des Beckens ein größeres Potential und eine
höhere thermische Reife aufweist. Der Abschnitt vom Mittleren Miozän bis zum Pleistozän
wurde anhand der Matariya-1-Bohrung untersucht, die aus dem nordöstlichen Onshore Nil-
Delta Becken stammt. Er enthält mäßiggute Muttergesteine im frühen Ölfenster. Die große
Mächtigkeit des Abschnitts und die Nähe zu geeigneten Reservoir-Gesteinen erhöhen jedoch
das Muttergesteins-Potenzial. Diese Studie empfiehlt eine weitere Exploration tieferer
Einheiten z.B. des Mesozoikums, vor allem in den Offshore-Gebieten.
Der zweite Teil der Dissertation beurteilt das Muttergestein-Potenzial und die
Paläoumweltbedingungen der Cenomanium-Santonium Schichtfolge der Bahariya- und Abu-
Roash Formationen aus der GPT-3-Bohrung aus der libyschen Wüste Ägyptens. Die
Ergebnisse zeigen, dass die Folge überwiegend, mit Ausnahme der Abu-Roash „F“
Subformation, das ein hohes Erdölbildungs-Potenzial besitzt, unter suboxischen bis oxischen
Bedingungenabgelagert wurde. Der Basalteil der Folge ist reich an Karbonat, TOC und
mariner organischer Substanz. Das Kerogen ist aufgrund der begrenzten Menge an reaktivem
Eisen während der Ablagerung relativ reich an organischem Schwefel (Sorg). Der mittlere Teil
des Abu-Roash „F“ Subformation ist arm an organischem Material und sehr reich an
terrestrischen Elementen (z.B. Fe, Ti, Si) und mit Botryococcus-Algen assoziiert, was eine
Regression des Meeres anzeigt. Diese Fazies wird von suboxisch abgelagerten, marinen

VII
Muttergesteinen mit niedrigeren Sorg-Anteilen überlagert. All diese Muttergesteine zeigen im
Vergleich zu den unter- und überlagernden Gesteinen niedrige thermische Reifen auf, was
eine thermische Reifungsverzögerung, möglicherweise aufgrund hoher Liptinitgehalte,
hoher Drücke oder wegen des Mangels an katalytischen Elementen, impliziert. Darüber
hinaus wurden aus dieser Bohrung zwei Öl-Reservoirs geochemisch charakterisiert. Diese
Erkenntnisse sind für zukünftige Kohlenwasserstoff-Explorationen und Paläoumwelt-
Rekonstruktionen von entscheidender Bedeutung.
Im Tarfaya Becken wurden Cenomanische bis Turonische Muttergesteine auf Grundlage
ihrer organischen geochemischen und petrologischen Eigenschaften klassifiziert. Die
Ergebnisse der molekularen Geochemie legen eine marin-anoxische Ablagerung nahe, die an
der Cenomanium/Turonium Grenze (CTBE) mit einer erhöhten Aktivität von
Cyanobakterien assoziiert war. Das Untere Cenomanium zeichnet sich durch höhere Silikat-
Gehalte im Vergleich zum Rest des Abschnitts aus. Alle Proben werden durch
submikroskopisch kleine organische Partikel dominiert. Das Untere Cenomanium ist arm an
Bituminit, während der Abschnitt vom Oberen Cenomanium bis zum Turonium variable
Bituminitgehalte zeigt. Darüber hinaus weisen die Proben variable Sorg-Gehalte auf. Die
Veränderung des Kerogentyps wurde durch eine frühzeitige diagenetische
Kerogenvulkanisation (Schwefel-Einbau) gesteuert, die von den Konzentrationen an S, Fe
und organischer Substanz in Zusammenhang mit Auftriebsprozessen abhängt. Die
Muttergesteine werden dementsprechend aufgrund ihres Kohlenwasserstoff-
Bildungspotenzials (HI-Werte), ihrer TOC-Gehalte und ihres Gehaltes an organischem
Schwefels in 4 Gruppen potentieller Erdölmuttergesteine unterteilt: 1) solche mit niedrigem
Sorg- und mittlerem TOC-Gehalt (Unteres Cenomanium), 2) solche mit moderatem Sorg- und
hohem TOC-Gehalt (Oberes Cenomanium), 3) solche mit gleichfalls hohem Sorg- und TOC-
Gehalt (Turonium) und jene mit sehr hohen Sorg- und hohen TOC-Gehalten (CTBE). Die
Gruppen 2 und 4 werden bei fortgeschrittener Reifung oder durch künstliche Ölextraktion
schwefelreiches Öl produzieren.

VIII
LIST OF ABBREVIATIONS
AOM Amorphous organic matter API American Petroleum Institute Corg Organic carbon CPI Carbon preference index CPPyGCMS Curie Point Pyrolysis Gas Chromatography Mass Spectrometry CTBE Cenomanian Turonian boundary event
GC-FID Gas Chromatography-Flame Ionization Detector GCMS Gas Chromatography-Mass Spectrometry HI Hydrogen Index OAE2 Oceanic anoxic event 2 OEP Odd over even predominance OI Oxygen Index Ph Phytane PI Production Index Pr Pristane S1 First flame ionization detector signal/peak of Rock-Eval 6 S2 Second flame ionization detector signal/peak of Rock-Eval 6 S3 The Infra-Red detector signal/peak of Rock-Eval 6
Sorg Organic sulfur TAR Terrestrial to aquatic ratio TIC Total inorganic carbon Tmax Rock-Eval temperature at maximum S2 yield TOC Total organic carbon TS Total sulfur UOM Unstructured organic matter from organic microscopy VRr Vitrinite reflectance at random orientations

IX
TABLE OF CONTENTS
DECLARATION OF AUTHORSHIP .......................................................................................................... I
ACKNOWLEDGMENT ..................................................................................................................................II
ABSTRACT ..................................................................................................................................................... IV
ZUSAMMENFASSUNG ............................................................................................................................... VI
LIST OF ABBREVIATIONS ................................................................................................................... VIII
TABLE OF CONTENTS .............................................................................................................................. IX
LIST OF TABLES ....................................................................................................................................... XIV
LIST OF FIGURES ....................................................................................................................................... XV
Chapter 1 | Introduction .......................................................................................................................... 1
1.1 Background ........................................................................................................................................ 1
1.2 General Remarks on Source Rock Depositional Settings ........................................... 2
1.3 Geological Setting of North Africa from Jurassic to Recent.................................... 4
1.3.1 Jurassic Period .......................................................................................................................... 5
1.3.2 Cretaceous Period ................................................................................................................... 6
1.3.3 Paleogene Period ..................................................................................................................... 7
1.3.4 Neogene Period ........................................................................................................................ 8
1.4 Source Rock Potential Overview of the Study Areas .................................................... 8
1.4.1 Source rock potential of Egypt .............................................................................................. 8
1.4.2 Source Rock Potential of Tarfaya Basin ............................................................................. 9
1.5 Research Objectives .................................................................................................................... 12
1.6 Thesis Outline ................................................................................................................................ 13
Chapter 2 | Source Rock Potential of the Middle Jurassic to Middle Pliocene, Onshore Nile Delta Basin, Egypt ....................................................................................................... 16

X
2.1 Abstract ............................................................................................................................................. 16
2.2 Introduction .................................................................................................................................... 17
2.3 Geological Setting ......................................................................................................................... 19
2.3.1 Tectonic setting ........................................................................................................................ 19
2.3.2 Stratigraphy ............................................................................................................................... 21
2.4 Samples and Methods .................................................................................................................... 23
2.4.1 Samples ........................................................................................................................................ 23
2.4.2 Elemental analysis .................................................................................................................. 24
2.4.3 Rock-Eval pyrolysis.................................................................................................................. 24
2.4.4 Organic petrography .............................................................................................................. 29
2.4.5 Source rock extraction and liquid chromatography .................................................. 29
2.4.6 GC-FID and GC-MS ................................................................................................................ 30
2.4.7 1D burial and thermal history modeling ........................................................................ 31
2.5 Results ................................................................................................................................................ 32
2.5.1 Elemental analysis .................................................................................................................. 32
2.5.2 Rock-Eval analysis .................................................................................................................. 32
2.5.3 Organic petrography .............................................................................................................. 35
2.5.4 Molecular geochemistry ....................................................................................................... 36
2.5.5 1D burial and thermal history modeling ........................................................................ 39
2.6. Discussion ....................................................................................................................................... 44
2.6.1 Depositional environments ................................................................................................. 44
2.6.2 1D burial and thermal history modeling ........................................................................ 49
2.6.3 Source rock potential ............................................................................................................. 49
2.7 The Mesozoic and Miocene Source Rocks In the Nile Delta-An Overview ..... 52

XI
2.8 Conclusions ..................................................................................................................................... 55
Chapter 3 | Depositional Environment and Source Rock Potential of the Upper Cretaceous Succession, Abu Gharadig Basin, Northern Western Desert, Egypt: An Integrated Geochemical and Palynological Study .................................................................. 58
3.1 Abstract ............................................................................................................................................. 58
3.2 Introduction .................................................................................................................................... 59
3.3 Geologic Setting ............................................................................................................................. 61
3.4 Material and Methods ........................................................................................................... 64
3.4.1 Samples ....................................................................................................................................... 64
3.4.2 Elemental analysis .................................................................................................................. 67
3.4.3 Rock-Eval pyrolysis ................................................................................................................ 68
3.4.4 Organic petrology .................................................................................................................... 68
3.4.5 Molecular organic geochemistry ....................................................................................... 69
3.4.6 Curie Point Pyrolysis-Gas Chromatography-Mass Spectrometry ........................ 69
3.4.7 Molecular geochemical parameters ................................................................................. 70
3.4.8 Palynology and palynofacies ............................................................................................... 71
3.5 Results ................................................................................................................................................ 71
3.5.1 Elemental analysis .................................................................................................................. 71
3.5.2 Rock-Eval pyrolysis ................................................................................................................ 76
3.5.3 Organic petrography .............................................................................................................. 79
3.5.4 Molecular organic geochemistry ....................................................................................... 81
3.5.5 CPPyGCMS .................................................................................................................................. 85
3.5.6 Palynology and palynofacies analysis ............................................................................. 87
3.6 Discussion ........................................................................................................................................ 91
3.6.1 Age assignment ........................................................................................................................ 91

XII
3.6.2 Depositional environments ................................................................................................. 92
3.6.3 Source rock potential ........................................................................................................... 101
3.6.4 Reservoir geochemistry ...................................................................................................... 102
3.7 Conclusions ................................................................................................................................... 103
Chapter 4 | Depositional Environment and Source Rock Potential of Cenomanian and Turonian Sedimentary Rocks of the Tarfaya Basin, Southwest Morocco ...... 107
4.1 Abstract ........................................................................................................................................... 107
4.2 Introduction .................................................................................................................................. 108
4.3 Geological Setting ....................................................................................................................... 112
4.4 Samples and Methods .............................................................................................................. 114
4.4.1 Samples ..................................................................................................................................... 114
4.4.2 Elemental analysis ................................................................................................................ 114
4.4.3 Rock-Eval Pyrolysis .............................................................................................................. 116
4.4.4 Organic petrology .................................................................................................................. 117
4.4.5 Source rock extraction ........................................................................................................ 117
4.4.6 Gas Chromatography and Gas Chromatography-Mass Spectrometry .............. 118
4.4.7 Curie-Point Pyrolysis Gas Chromatography-Mass Spectrometry ....................... 118
4.4.8 Molecular geochemical parameters ............................................................................... 119
4.5 Results .............................................................................................................................................. 119
4.5.1 Elemental Analysis ................................................................................................................ 119
4.5.2 Rock-Eval Pyrolysis .............................................................................................................. 136
4.5.3 Organic Petrology .................................................................................................................. 138
4.5.4 Molecular Geochemistry ..................................................................................................... 142
4.5.5 Curie-Point-Pyrolysis Gas Chromatography-Mass Spectrometry ...................... 144
4.6 Discussion ...................................................................................................................................... 145

XIII
4.6.1 Depositional environment ................................................................................................. 145
4.6.2 Source rock potential and organic matter type ......................................................... 152
4.6.3 Kerogen diagenesis and properties ................................................................................ 154
4.7 Conclusions ................................................................................................................................... 155
Chapter 5 | Thesis General Discussion ........................................................................................ 157
5.1 Introduction .................................................................................................................................. 157
5.2 Studied Parameters .................................................................................................................. 157
5.3.1 Sedimentation systems and organic matter productivities .................................. 159
5.3.3 Bottom water conditions .................................................................................................... 161
5.3.5 Tmax and source rock properties ...................................................................................... 164
5.4 New Geochemical Proxies ...................................................................................................... 165
Chapter 6 | Conclusions ....................................................................................................................... 167
References .................................................................................................................................................. 170
Curriculum Vitae .................................................................................................................................... 187

XIV
LIST OF TABLES
Table 2-1 Rock-Eval 6 and elemental data of the Abu Hammad-1 and Matariya-1 wells. Units:
*(mgHC/gRock), ** (mgCO2/gRock), *** mgHC/gTOC, **** mgCO2/gTOC. ...................... 25
Table 2-2 Gas chromatography data of selected samples from the Abu Hammad-1 and
Matariya-1 wells. .......................................................................................................................................... 38
Table 2-3 Biomarker data of selected samples from the Abu Hammad-1 and Matariya-1 wells. ................................................................................................................................................................. 40
Table 3-1 Carbon, sulfur and Rock-Eval data of the Bahariya and Abu Roash formations, GPT-
3 well, north Western Desert, Egypt. * (mg HC/gRock), ** (mg CO2/gRock), ***
(mgHC/gTOC), **** (mgCO2/gTOC). .................................................................................................. 64
Table 3-2 Elemental data of selected samples using XRF analysis from the Abu Roash “F”, “E” and “G” members, GPT-3 well, north Western Desert, Egypt. ............................................ 74
Table 3-3 Biomarker data of selected samples from the Bahariya and Abu Roash formations, GPT-3 well, north Western Desert, Egypt. ................................................................ 83
Table 3-4 Curie Point Pyrolysis Gas chromatography mass spectrometry data of selected samples from The Abu Roash “F” Member, GPT-3 well, north Western Desert, Egypt. .. 86
Table 3-5 Palynofacies data of selected samples from the Bahariya and Abu Roash formations. AOM: amorphous organic matter. ................................................................................ 87
Table 4-1 Elemental and Rock-Eval 6 data. Units: *mgHC/Rock, **mgCO2/gRock, ***mgHC/gTOC, ****mgCO2/gTOC. T: Turonian, CT: CTBE, UC: Upper Cenomanian, LC: Lower Cenomanian A: Albian ............................................................................................................... 123
Table 4-2 XRF data of selected samples from each stratigraphic units. T: Turonian, CT:
CTBE, UC: Upper Cenomanian, LC: Lower Cenomanian. ........................................................... 135
Table 4-3 Maceral compositional analysis data. *: Calculated, submicroscopic organic matter. T: Turonian, CT: CTBE, UC: Upper Cenomanian, LC: Lower Cenomanian. .......... 140
Table 4-4 Molecular geochemistry data of the aliphatic fractions. ....................................... 143
Table 4-5 Total thiophenes/total benzenes data from CPPyGCMS data used as a proxy of Sorg/Corg ......................................................................................................................................................... 144

XV
LIST OF FIGURES
Fig. 1-1 Schematic diagram of common source rock depositional settings. Pink polygons are anoxic/oxygen minimum zones. ...................................................................................................... 4
Fig. 1-2 Paleogeographic reconstructions modified after Blaeky 2012. The yellow dot is for Morocco and the magenta dot is for Egypt. “Global Paleogeographic Maps © 2012 Colorado Plateau Geosystems Inc., used with permission from Ron Blakey”. ....................... 6
Fig. 1-3 Source rock potential traffic light map of the Tarfaya basin based on published data by Sachse et al., (2011, 2012, 2014), Ghassal et al., (2015) and Wenke (2014)....... 11
Fig. 1-4 Geothermal gradient map of the Tarfaya basin modified after Zarhloule (2003) and Ghassal et al. (2015) .......................................................................................................................... 11
Fig. 2-1 Nile Delta Basin map showing important structures, wells, and gas fields (modified after Abdel Aal et al. 2001; Shaaban et al. 2006). The gray shaded area represents basalt. ........................................................................................................................................ 19
Fig. 2-2 Generalized stratigraphic column of the Nile Delta Basin (modified after El Nady
2007; Guiraud and Bosworth 1999) ........................................................................................................ 22
Fig. 2-3 Depth plotted versus TOC, CaCO3, TS, HI, and Pr/Ph of the Abu Hammad-1 and Matariya-1 wells .......................................................................................................................................... 33
Fig. 2-4 TOC plotted versus TS (a) and CaCO3 (b) of the Abu Hammad-1 and Matariya-1 wells ................................................................................................................................................................. 34
Fig. 2-5 TOC plotted versus S2 of the investigated samples. ...................................................... 35
Fig. 2-6 Gas chromatographs of the saturated hydrocarbon fractions of the a) Kafr El Sheikh Formation, b) Qawasim Formation, c) Upper Sidi Salem Formation, d) Lower Sidi Salem Formation, e) Kharita Formation, f) Upper Alam El Bueib Formation, g) Lower Alam El Bueib Formation, h) Masajid Formation, and i) Khatatba Formation. Note that n-C17 and n-C20 are marked. ..................................................................................................................... 37
Fig. 2-7 Burial/thermal history diagrams of the a) Abu Hammad-1 and b) the Matariya-1 wells in the next page. ............................................................................................................................... 41
Fig. 2-8 Pr/n-C17 versus Ph/n-C18 for selected samples from the Abu Hammad-1 and Matariya-1 wells, in comparison to other published data. ......................................................... 46
Fig. 2-9 a) Cross section demonstrates Oligocene and Miocene stratigraphy at the eastern Nile Delta Basin (modified after Shaaban et al. 2006). B) Cross section shows Nile Delta

XVI
stratigraphy from the onshore to the offshore areas (modified after Abdel Aal et al. 2001). ............................................................................................................................................................................ 50
Fig. 2-10 HI versus OI of the samples from the Abu Hammad-1 and Matariya-1 wells. PFM-1 well data are published in Khaled et al. (2014). .......................................................................... 51
Fig. 2-11 TOC and HI map of the Matariya-1 well and published data of the Sidi Salem Formation source rock. Published data sources: Abu Madi-1, Abu Madi-3, Abadiya-1, Kafer El Shiekh-1, Abu Madi-1, and Abu Madi-3 (El Nady 2007); Sidi Salem-1 (El Nady and Harb 2010); AbuMadi-9 well (Keshta et al. 2012); and S.W. Bilqas-1, Port said-1, Qantara-1, and Port Fouad-1 (Shaaban et al. 2006). ..................................................................... 54
Fig. 3-1 a) A location map of the studied GPT-3 well and the main sedimentary basins in the north Western Desert, Egypt. B) Paleogeographic map at ~94 Ma of North Egypt and the surrounding areas (modified after Phillip, 2003)................................................................... 60
Fig. 3-2 Lithostratigraphic column of the GPT-3 well, north Western Desert, Egypt (after GPC, 1984). The associated biozones are after El Beialy et al. (2010). .................................. 63
Fig. 3-3 Total organic carbon (TOC), CaCO3, Total sulfur (TS) and Rock-Eval data versus depth, Bahariya and Abu Roash formations, GPT-3 well, north Western Desert, Egypt. The Abu Roash “F” source rocks are classified as Transgression phases I and II. * CaCO3 is calculated from total inorganic carbon. ............................................................................................. 72
Fig. 3-4 XRF elemental data of the Abu Roash “F” Member, GPT-3 well, north Western Desert, Egypt. ................................................................................................................................................ 73
Fig. 3-5 K/Al ratio versus (a) Si/Al ratio and (b) CaCO3 of selected samples from the Abu Roash “E”, “F” and “G” members, GPT-3 well, north Western Desert, Egypt showing possible depositional environment, climate and clay mineral composition. ...................... 75
Fig. 3-6 SiO2-5*Al2O3-2*Ca ternary diagram demonstrating lithological differences among the Abu Roash “E”, “F” and “G” samples, GPT-3 well, north Western Desert, Egypt. ........ 75
Fig. 3-7 Total organic carbon-iron-total sulfur ternary diagram of selected samples from Abu Roash “G”, “F” and “E” members, GPT-3 well, north Western Desert, Egypt. ............. 76
Fig. 3-8 CaCO3 versus total organic carbon (TOC), GPT-3 well, showing two distinctive trends. The samples of Abu Roash “F” have a positive trend, whereas samples from other rock units denote a weak negative relation. ..................................................................................... 77
Fig. 3-9 Total sulfur (TS) versus total organic carbon (TOC) showing the difference between the Abu Roash “F” Member and other studied rock units. The samples are classified into three groups which are 1) Abu Roash “F” Member Transgression-1:, 2) Abu Roash “F” Member Transgression-2: and 3) oxic/suboxic shelf: the samples from the rest of the geological units. Value%: CaCO3 calculated from total inorganic carbon. ............... 77

XVII
Fig. 3-10 Pseudo van Krevelen diagram of the studied rock units, GPT-3 well, north Western Desert, Egypt. Note that the high HI readings from the Abu Roash “D” samples are from a reservoir section. .................................................................................................................. 78
Fig. 3-11 Rock-Eval pyrograms and gas chromatograms of the Abu Roash “C” and “D” reservoirs as well as Abu Roash “F” source rock sections, GPT-3 well, north Western Desert, Egypt. ................................................................................................................................................ 79
Fig. 3-12 Organic petrography of the Abu Rash “F” samples under fluorescent light, GPT-3 well, north Western Desert, Egypt.................................................................................................... 80
Fig. 3-13 a) Total organic carbon (TOC) versus terrestrial to aquatic ratio (TAR). b) Pristane/phytane ratio versus steranes/hopanes ratio (str/hop), GPT-3 well, north Western Desert, Egypt. ............................................................................................................................. 82
Fig. 3-14 C27, C28 and C29 steranes ternary diagram of selected samples from the Bahariya and Abu Roash formations, GPT-3 well, north Western Desert, Egypt. ................................. 84
Fig. 3-15 C29 ββ/(αα+ββ) steranes versus C29 ααα20S/(20S+20R) steranes indicating maturity in the studied rock units, GPT-3 well, north Western Desert, Egypt. Please refer to Table 4 for sample assignment. ........................................................................................................ 84
Fig. 3-16 Curie-Point-Pyrolysis Gas Chromatography-Mass Spectrometry Chromatograms of representative samples from the Abu Roash “F” Member indicating a high organic sulfur contents in transgression phase-I, Abu Rash “F” Member, GPT-3 well, north Western Desert, Egypt. ................................................................................................................. 85
Fig. 3-17 Ali-Be-T ternary diagram (alaphitic- hydrocarbonsn-C6 to n-C14-Benzenes-Thiophenes) based on Curie-Point-Pyrolysis-Gas-chromatography-mass-spectrometer data of selected samples from the Abu Roash “F” source rocks, GPT-3 well, north Western Desert, Egypt. ................................................................................................................................................ 86
Fig. 3-18 APP ternary plot (Tyson, 1993) of selected samples from the Bahariya and Abu Roash formations, GPT-3 well, north Western Desert, Egypt. ................................................... 88
Fig. 3-19 Pristane (Pr)/n-C17 versus phytane (Ph)/n-C18 illustrating the organic matter type of selected samples from the studied rock units, GPT-3 well, north Western Desert, Egypt. ............................................................................................................................................................... 93
Fig. 3-20 Generalized depositional model of the Abu Roash “F” Member based on the current geochemical and palynological interpretation. ............................................................... 99
Fig. 4-1 Overview map of the Tarfaya Basin showing the location of the studied well (S-4) and some of the previously studied wells (modified after Michard et al., 2008). ...... 109

XVIII
Fig. 4-2 Cross section showing the extent of the onshore/offshore stratigraphy of the Tarfaya Basin (modified after Wenke, 2014), including Cap Juby well. Surface geology in the small map modified after Saadi et al. (1985). CJ: Cap Juby well. ..................................... 111
Fig. 4-3 Stratigraphic column representing the common lithologies in the Tarfaya Basin from coastal to deep marine areas (modified after Davison, 2005; Sehrt, 2014). ........... 115
Fig. 4-4 Depth plots TS, TOC, CaCO3 and TS/TOC ratio of all stratigraphic units. ........... 121
Fig. 4-5 Cross plots between CaCO3 versus TOC and TS. The correlation of CaCO3 and TOC relationship changes significantly from positive in the Lower Cenomanian to negative in the Turonian. The CaCO3 and TS correlations are always negative with variable regression coefficients. ........................................................................................................................... 133
Fig. 4-6 Elemental data versus depth shows increase in silicate and rutile forming elements with depth. It also shows a strong increase in P2O5 before the CTBE. .............. 134
Fig. 4-7 CaCO3 versus Fe2O3 and TiO2 Cross plots show inverse relationship in all studied intervals. ....................................................................................................................................................... 135
Fig. 4-8 Pseudo van Krevelen diagram of bulk Rock- Eval-6 samples of the various stratigraphic intervals. ............................................................................................................................ 137
Fig. 4-9 Rock-Eval HI, OI and Tmax versus depth plot. It shows the apparent difference between the Cenomanian to Turonian source rocks. On the basis of microscopic observations the Tmax shift is interpreted to be caused by a change in the organic facies rather than thermal maturity. .............................................................................................................. 138
Fig. 4-10 Micrograph of representative samples of each organofacies type and stratigraphic interva ................................................................................................................................ 139
Fig. 4-11 Organic matter volume vs. TOC weight percent. The samples that show very low visible organic matter were assigned as 0.2% for the sake of simplicity. .......................... 141
Fig. 4-12 Pr/C17 vs. Ph/C18 diagram suggests marine and thermally immature organic matter for all sample. The classification method is from Shanmungam (1985). ............. 142
Fig. 4-13 C27-C29 steranes ternary diagram indicates shallow open marine depositional environment. ............................................................................................................................................... 143
Fig. 4-14 TS versus TOC cross-plot shows that the majority of the Cenomanian to Turonian samples are plotted below the normal marine line of Berner (1984) unlike the majority of the Lower Cenomanian samples which plot above the line .............................. 150

XIX
Fig. 4-15 TS versus Fe shows that the majority of the samples from Cenomanian to Turonian are plotted above the Pyrite line indicating that the sulfur in theses samples is present in other forma than pyrite. ................................................................................................... 151
Fig. 4-16 OM-CaCO3-Silicates trinary diagram (modified after Littke, 1993) showing that the best organic preservation is achieved at CaCO3 concentration between 45 to 80%. .......................................................................................................................................................................... 153
Fig. 5-1List of the investigated terrigenous, biogenic and early diagenesis geochemical parameters. ................................................................................................................................................. 158
Fig. 5-2 Al2O3 versus K2O, TiO2, MnO and Fe2O3 cross-plots. Note the positive correlations indicating similar terrigenous origin. ............................................................................................... 158
Fig. 5-3 Geochemical conceptual model summarizing the differences between the three main depositional environments investigated in the current thesis. ................................... 160
Fig. 5-4 Carbonate-original organic matter-silicate diagram of selected samples from the Nile Delta (matariya-1 and Abu hammad-1 wells), The Abu Gharadig Basin (GPT-3 well) and the Tarfaya Basin (SON-4). ........................................................................................................... 161
Fig. 5-5 MnO versus a) oxygen index and b) Pr/Ph plots showing positive correlations of selected samples from the Tarfaya Basin (SON-4) and the Abu Gharadig Basin (GPT-3). .......................................................................................................................................................................... 162
Fig. 5-6 Oxygen Index versus thiophenes/benzenes ratio of selected samples from the Tarfaya Basin (SON-4) and the Abu Gharadig Basin (GPT-3). ................................................. 163
Fig. 5-7 Mn/S ratio versus hydrogen Index relationships illustrating positive correlation for the Abu Gharadig basin samples (GPT-3 well). ...................................................................... 163
Fig. 5-8 TiO2 versus S/Fe ratio relationship used as an example of the inverse relationship between terrigenous elements and S/Fe ratio. ................................................... 164
Fig. 5-9 Tmax versus Thiophenes/Benzenes ratio of selected samples from the Tarfaya (SON-4) and Abu Gharadig basins (GPT-3) showing tow clusters. ....................................... 165
Fig. 5-10 S/Fe versus Al2O3 ratios of selected samples from the Tarfaya and Abu Gharadig basins. ............................................................................................................................................................ 166


1
Chapter 1 | Introduction
1.1 Background
Source rock studies witnessed noteworthy developments after the shale gas/oil booms
in the United States, Europe, and China over the second decade of this Century. The
increased interest in the unconventional resources related to source rocks motivated
academia and industry to refine their assessment methods toward detailed
characterizations that surpass bulk evaluations. Thus, the integration of the variable
geological and petroleum engineering data and methodologies became leading research
trends influencing conventional and unconventional exploration strategies. First, they
enhance the understanding of source rock formation processes at different geological
settings which helps in predicting source rock facies in a regional context and therefore,
identifying and prioritizing new prospects. Moreover, they assist in distinguishing
productive zones and their hydrocarbon generative capabilities in vertical and spatial
distribution. These studies also have a significant influence on regional petroleum
exploration and paleoenvironmental reconstruction studies. The current work integrates
various organic and inorganic geochemical techniques with petrological, palynological
and basin modeling methods.
Many factors play roles in petroleum source rock deposition in marine and lacustrine
environments such as and the sea level changes or tectonic activities. The quality and
composition of the organic matter also depend on the proximity to the shoreline, the
bottom water oxygen contents, the origin and productivity of organic matter and the
interplay between the dissolved elements in the water and the organic matter. In this
chapter, the main marine source rock depositional settings, as well as the major climatic
and tectonic events that occurred in North Africa since the Mesozoic are discussed. This
is followed by a general overview of the common source rocks in Egypt and the Tarfaya
Basin located in Morocco. The chapter ends with the aims and the outline of the thesis.

2
1.2 General Remarks on Source Rock Depositional Settings
Source rocks are fine-grained carbonate or siliciclastics organic-rich sedimentary rocks
that are expected to generate fluid hydrocarbons when attaining elevated thermal
maturity levels (Littke et al., 1997; Tissot and Welte, 1984). The richness and quality of
source rocks are controlled by organic matter productivity, preservation, and
depositional conditions. The organic matter can be transported (allochthonous) or in situ
(autochthonous). The former is usually from a terrestrial origin whereas the latter is
from marine and terrestrial source (e.g. Bustin, 1988; Katz, 2012; Littke et al., 1997).
Extensive studies were carried out to understand the organic matter production,
preservation, and kerogen formation pathways in several depositional environments.
Deltas as terrestrial to marine transitional environments are characterized by mostly
high proportions of higher plant tissue (allochthonous) and smaller proportions of
aquatic algae (autochthonous) (Bustin, 1988; Littke et al., 1997; Tissot and Welte, 1984).
The deltaic environments include three main types which are river-dominated, wave-
dominated, and tide-dominated (Galloway 1975). They differ in their sediment supply
and types which significantly influence the depositional conditions. The typical examples
of prolific petroleum deltaic petroleum systems are 1) the Mississippi, 2) the Niger and
3) Mahakam deltas which represent the river-dominated type (e.g. Peters et al., 2000;
Michele et al., 1999). The Nile Delta, on the other hand, is classified as wave-dominated
type (Coe et al., 2003). The river-dominated system type is well understood compared to
the other types of deltas regarding petroleum potential.
The organic matters in river-dominated delta environments are subjected to many
factors that control their composition and quality. These factors may partially apply on
other types of deltas. Rivers transport terrigenous input that would constitute vitrinite,
inertinite, coal particles and fresh/brackish water algae. Rapid water circulation
increases the oxygen contents of the bottom water and organic matter oxidation. Due to
its low density, the liptinite macerals are attributed to selective transportation (Bustin,
1988). These processes indeed, will modify the Rock-Eval HI and OI values. These

3
characteristics differ outward from the delta front to more marine dominating organic
matter. Moreover, the interplay between fluvial and marine systems due to relative sea
level changes considerably alter the bottom water conditions and consequently the
organic matter types and qualities. Therefore, the Delta petroleum system is considered
one of the challenging systems to investigate. The current work selected the Nile Delta
Basin to address the organic matter richness and quality in wave-dominated delta
environments. Note that this kind of delta does not, commonly, favor source rock
deposition (Allen and Allen 2005). Thus, this thesis aims to explain the high hydrocarbon
potential found in the Nile delta basin in Chapter 2.
Marine source rocks are developed in three main settings which are oxygen minimum
zones along continental shelves, upwelling zones and silled/barred basins (Fig.1-1) (e.g.
Katz, 2012; Littke et al., 1993; Selley, 1998). Oxygen minimum zones are caused due to
oxygen consumption by decay of biomass and lack of circulation and photosynthesis in
deeper, dark water that omits oxygen resupply (Selley, 1998). The position of this zone
is highly dependent on the temperature and salinity of the marine water (Katz, 2012).
Source rock developments within upwelling zones account for almost half of the world
organic rich source rocks (Parrish, 1987). This is basically due to the remarkably high
biological productivity that outpaces the productivity of normal shelves by ~3 times
(Ryther, 1969; Koblentz-Mishke et al., 1970; Katz 2012). When global greenhouse
warming climate prevails, the alongshore winds move the marine coastal warm waters
allowing upwelling nutrient-rich water to replace it (Bakun, 1990) (Fig.1-1).
Consequently, the bioproductivity increases which leads later to high rate of deposition
of organic matter (Bakun, 1990; Parrish, 1987). The high productivity causes the bottom
water oxygen to decrease which creates favorable condition for organic matter
preservation (Parrish, 1987; Katz 2012). Note that the intensity of the upwelling process
lowers during cold climate (Bakun, 1990; Parrish, 1987). Due to wind direction variation
and the Coriolis Effect resulting from Earth rotation, upwelling zones are pronounced
along the western continental margins (e.g. Katz 2012).

4
The source rock development in barred basins occur principally due to density
stratifications where less saline, less dense water overlies the saline, denser water. This
process develops bottom water anoxia. The second mechanism is attributed to thermal
stratification where warm waters rests on cooler waters. The barred basins usually occur
in tropical regions where the wind stress and the change in seasonal temperature are
minimal (Gluyas and Swarbrick, 2013; Katz 2012).
Fig. 1-1 Schematic diagram of common source rock depositional settings. Pink polygons are anoxic/oxygen minimum zones.
1.3 Geological Setting of North Africa from Jurassic to Recent
North Africa acted as part of Gondwana supercontinent and the southern passive margin
of the Neotethys after the break-up of Pangea during the late Triassic Period (Berra and
Angiolini, 2014; Bosworth 1994; Golonka, 2007; Guiraud and Bosworth 1997; Guiraud et
al., 2005; Stampfli and Borel 2002). The northwestern African corner, however, was part
of the south North Atlantic region (e.g. Tarfaya basin). Since the early Jurassic, many
factors controlled the deposition of the Mesozoic to Cenozoic sedimentary sequence in
North Africa. These include global warming/cooling climates, oceanic anoxic events,
pronounced sea level changes, and major tectonic events such as Gondwana break-up,
the opening of the Atlantic Ocean, Jurassic rifting, and the opening of the Red Sea, the

5
Syrian arc event and Messinian Salinity Crisis. Fig.1-2 illustrates the tectonic evolution
from Jurassic to Neogene demonstrating the paleographic reconstruction of three time-
slices. A literature review is provided herein to address the major tectonic and climatic
factors that controlled basin formations. Then in the next chapters, a geological overview
of each basin is provided.
1.3.1 Jurassic Period
Major tectonic events played an important role in the development of North African
basins. Variable settings characterized the Liassic times. In the Eastern Mediterranean
region, active faulting took place in marine/marginal settings coeval with carbonates and
shallow marine sediment deposition. In the Tunisian/Algerian Sahara, marginal marine
settings prevailed and resulted in evaporite deposition. Moreover, active rifting occurred
in the Atlas basins, where some areas remained subaerial (Guiraud et al., 2005). The
extensional regime in North Africa is mainly related to the opening of the Central Atlantic
from the west and the drift of the Turkish-Apulian terrain in the North (Guiraud et al.,
1987). A period of sea transgression and E-W half graben development characterizes the
Middle Jurassic in Egypt. On the other hand, thermal subsidence occurred in the Central
Atlantic margin related to the opening of the Atlantic Ocean (Guiraud et al., 2005).
Moreover, the spreading of the Atlantic Ocean completely detached Africa from North
America (Berra and Angiolini, 2014). Many North African basins witnessed prolific
petroleum source rock deposition during the Middle Jurassic (e.g. Masajid Formation,
Egypt). Higher sea level prevailed during the Late Jurassic and rifting started in some
Western Desert basins such as the Abu Gharadig Basin. However, some of the Jurassic
deposits were eroded later during Upper Cretaceous and Cenozoic inversions (Guiraud
and Bosworth, 1999). Along the southwestern Moroccan Atlantic margin, regression
took place shifting the depositional environment to shallow marine facies (Hafid et al.,
2008). At the Jurassic- Cretaceous boundary major deformation occurred in the North

6
African basins related to the Cimmerian/Berriasian orogenic affecting also southeastern
Europe (Guiraud et al., 2005: Stampfli et al., 2001).
Fig. 1-2 Paleogeographic reconstructions modified after Blaeky 2012. The yellow dot is for Morocco and the magenta dot is for Egypt. “Global Paleogeographic Maps © 2012 Colorado Plateau Geosystems Inc., used with permission from Ron Blakey”.
1.3.2 Cretaceous Period
Active E-W/NW-SE rifting characterizes the Lower Cretaceous in North Africa
contemporaneously with the Arabian-Nubian Block separation from the South American

7
plate (Guiraud et al., 2005). During Aptain, the connection between the NeoTethys Ocean
and Central Atlantic was complete, and the sea level rose (Berra and Angiolini, 2014). The
rifting persisted in most North African basins till Santonian. Warm climate cycles
coexisted with highest recorded Phanerozoic sea transgressions which invaded
northwestern and central African basins during the Middle to Late Cretaceous and which
led to oceanic anoxic events (e.g. OAE2 and OAE3), (Fig.1-2) (Guiraud et al., 2005: Haq et
al, 1987). These periods witnessed intense organic carbon deposition and increased
bottom water anoxia (Jenkyns, 2010). Furthermore, widespread warm bottom waters
characterized the North Atlantic as well as the tropical oceans leading to positive δ13C
isotope excursions (Friedrich et al., 2012). Moreover, northern Egypt and southwestern
Morocco acted as carbonate platforms (Phillip et al., 2013). During Santonian, major
tectonic events took place including the ophiolite obduction in Oman, the change in poles
of rotation of the Atlantic Ocean and the Laramide phase of the Alpine orogeny. The later
were responsible for propagating major fold belts such as the Atlas chain and the Syrian
Arc in the Levant and Northern Egyptian basins (Guiraud and Bosworth 1997: Guiraud
et al., 1987; Tawadros, 2011). These movements caused regional unconformities
throughout the North African basins as will be discussed in the case of Northern Egypt in
the flowing chapters. Rejuvenation and acceleration of rifts spanned the Campanian to
Maastrichtian ages in North Africa with infrequent occurrences of magmatic activities
such as in offshore Libya (Guiraud and Bosworth, 1997, 1999).
1.3.3 Paleogene Period
A new E-W compressional tectonic phase occurred at the Maastrichtian-Paleocene
boundary that was responsible for accentuating the Santonian fold belts in northeastern
Africa (Guiraud and Bosworth, 1997). However, this shortening phase started earlier in
northwestern Africa such as in Algeria (Aris et al, 1998). Consequently, a significant
hiatus unconformity in the Tarfaya Basin occurred from Santonian to Pliocene (Davidson,
2005). A pronounced sea transgression occupied major parts of North Africa during the
Paleocene to Eocene times and deposited shallow marine sediments (Guiraud et al.,
2005). In the Eocene to Oligocene times, a compressional event evolved in North Africa

8
especially in the Maghrebian Atlas in northwestern Africa and the Syrian Arc in the
Eastern Mediterranean region (Guiraud and Bosworth, 1999; Guiraud et al., 2005). The
event was coeval with the opening of the Atlantic and Indian oceans and the movement
of Africa toward southern Eurasia and the gradual closure of NeoTethys (Berra and
Angiolini, 2014). Through the Early Oligocene, North Egypt witnessed high sea level
before maximum tectonic shortening of Syrian Arc that ceased the basin subsidence in
the Western Desert. On the other hand, the Tarfaya Basin area was uplifted due to the
orogeny affecting northwest Africa (see above) and created an erosional surface till the
Miocene (Ruiz et al., 2010; Wenke, 2014).
1.3.4 Neogene Period
The Miocene Epoch witnessed significant extensional and compressional tectonic events
that considerably affected Northeast Africa. These include the initiating of the Red Sea
rifting, the opening of the Gulf of Aqaba, and development of the River Nile (e.g. Bosworth
et al., 2005). Also, it witnessed variable sea level changes with a global sea level
regression leading to thick evaporites in the Messinian (Messinian Crises). The
Quaternary is characterized by widespread fluvial deposits (Guiraud et al., 2005).
1.4 Source Rock Potential Overview of the Study Areas
1.4.1 Source rock potential of Egypt
In Africa, Egypt is the largest non-OPEC oil producer and the second natural gas producer
(US Energy Administration Information, 2015). It comprises three main petroleum
provinces which are the Western Desert, Nile Delta and Gulf of Suze areas. It is worth
noting that the Red Sea and southern Egypt can also have petroleum potential but has
not been fully explored.
The Paleozoic source rocks, in general, are poorly understood, and about 40 wells in the
Western Desert penetrated the Precambrian or Paleozoic (Doloson et al., 2000). The
Silurian and Devonian successions host highly prolific petroleum systems in Libya and
Saudi Arabia (e.g. Macgregor, 1996; Mahmoud et al., 1992). This indicates that Egypt
could have equivalent prolific source rocks or migrated hydrocarbons from Libyan

9
basins. One of the Western Desert wells tested gas condensates in a Carboniferous
section, but no geochemical data was released for this gas (Doloson et al., 2000).
The Jurassic source rocks are better studied in the Western Desert than in the Nile Delta
and Gulf of Suez basins. The Jurassic source rocks in the Western Desert include the
Khatatba, Shaltut, Kharita and Masajid formations (e.g El Nady et al., 2015; Maky and
Saad, 2009; Shalaby et al., 2012). The Cretaceous source rocks in the Western Desert are
found in Alam El Bueib Formation, the “G”, “F” and “E” members of the Abu Roash
Formation as well as occasionally the Bahariya and Khoman formations (e.g. El Nady,
2016; Zobaa et al., 2011). In the Western Desert, the Miocene source rocks are less
common, but they can be found in Dabba and Moghra formations (Maky and Saad, 2009).
In the Nile Delta Basin, limited information is available on the Jurassic and Cretaceous
source rocks (Shaaban et al., 2006). The current work (chapter 2) shed lights on the
Jurassic and Lower Cretaceous potential source rocks. The Middle Miocene Sidi Salem
Formation contains one of the major source rocks of the basin (e.g. El Nady, 2007).
The Gulf of Suez hosts prolific source rocks within the Cretaceous Brown Limestone in
middle and northern areas (e.g. Robison, 1995) and excellent Miocene source rocks
within Rudeis and Kareem formations (e.g. El Atfy et al, 2014,). Along the Red Sea
coastline, organic-rich beds of the upper Cretaceous Dakhla and Duwi formations show
excellent source rock potential (e.g. El Kammar et al., 1990). Good Miocene source rock
qualities are expected along the Red Sea basins such as the source rocks found in Saudi
and Sudanese coastlines (e.g. Cole et al., 1995)
1.4.2 Source Rock Potential of Tarfaya Basin
The Tarfaya basin is considered one of the most important petroleum basins among
Moroccan petroleum provinces. (Dyni, 2006). In the following, the potential source rocks
of the Tarfaya basin are summarized (Fig, 1-3).
Outcrop samples within the Ordovician, Devonian, Carboniferous and Lower Cretaceous
except for the Albian have poor source rock potential. All of the samples are thermally
immature based on microscopic and pyrolysis results (Sachse et al., 2011). The samples

10
from the Ordovician, Devonian, Carboniferous and Lower Cretaceous have TOC values of
less than 0.50%. Geochemical evaluations of three onshore wells and outcrop samples
prove good to excellent petroleum source rock potential within the late Albian, Upper
Cretaceous and Eocene successions (Sachse et al., 2011, 2014). On the other hand, the
Albian source rocks show high quality in the coastal areas, and this diminishes toward
the eastern part of the basin. The difference is explained by changes in the depositional
environment from marine to non-marine to the eastern hinterland.
Cenomanian outcrop samples show variable petroleum source rock potential. Along the
present day coastline, the Cenomanian is rich in marine organic matter with TOC
contents averaging 4 and excellent kerogen quality attested by average HI values of 600
mgHC/g TOC (Sachse et al., 2011). Furthermore, the samples are lean in vitrinite and rich
in liptinite which suggests excellent oil prone source rocks. The overlying Upper
Cenomanian and the lower Turonian witnessed one of the most significant Oceanic
Anoxic Events in the Earth history (OAE 2) (Kolonic et al., 2002). The inland outcrop
samples from the Cenomanian/Turonian boundary are of a terrestrial or lagoonal
environment, whereas the well samples close to the coast represent fully marine
conditions (Sachse et al., 2011). The Coniacian and Santonian intervals partly represent
OAE 3 and are also rich in TOC having high HI values (Sachse et al., 2014). Several outcrop
samples from the Eocene show variable source rock qualities. The TOC ranges from 0.05
to 7.20 %, and HI varies from 89 to 694 mgHC/gTOC (Sachse et al., 2011).
Kinetic experiments on some of the Cretaceous samples indicate a temperature of an
onset of petroleum generation between 101-115 °C (Sachse et al., 2011). Therefore, these
samples if buried at an approximate depth of 4000 m will start to generate oil assuming
a geothermal gradient of 25 to 30 °C/km (Fig.1-4). Therefore, a great oil source potential
for the late Albian to the Eocene especially in the coastal and offshore areas is suggested.
In the coastal regions, maturity is not sufficient for petroleum generation, but the thick
sediments might act as oil shales for retorting. In some offshore areas, sufficient
temperature and maturity might be reached for petroleum generations. Figure. 1-3
summarizes the probability of source rock potential based on research work by Ghassal

11
et al. (2015). Further details on the petroleum systems of the Tarfaya Basin is given in
Chapter 4.
Fig. 1-3 Source rock potential traffic light map of the Tarfaya basin based on published data by Sachse et al., (2011, 2012, 2014), Ghassal et al., (2015) and Wenke (2014).
Fig. 1-4 Geothermal gradient map of the Tarfaya basin modified after Zarhloule (2003) and Ghassal et al. (2015)

12
1.5 Research Objectives
Hydrocarbon exploration strategic planning depends on many factors. From a geological
point of view, understanding the basin formation is essential to predict the source rock
reservoir and seal distributions. In the unconventional shale resources, detailed
characterization of organic matter richness, type and thermal maturity, as well as
porosity and permeability, is the key to determine their prospectivity. Organic
geochemistry is an essential subject that helps in reducing exploration risk from the
industrial perspective and a tool that assists in paleoenvironmental reconstruction
studies on the academic side. The thesis combines both perspectives and focuses on the
source rock characterization using conventional and new methods.
The general aim of the thesis is to provide common source rock characteristics of deltaic
and shallow marine environments and their expected hydrocarbon types using data from
three different basins which are the Nile Delta and Abu Gharadig basins in Egypt and the
Tarfaya Basin in southwestern Morocco. Under this topic, the research work investigates
the consequences of the interactions between organic matters and various elements in
the sea bottom using three different integrated approaches. The studied source rocks
cover a wide time span and variable source rock types. The study of each area was
designed specifically to suit their research goals but with emphasizing the general thesis
theme.
In the last few years, the Nile Delta Basin became a very appealing exploration target for
natural gas, yet it lacks a well-established organic geochemical inventory especially for
the Jurassic and Lower Cretaceous successions. Moreover, distribution of the source
rocks is not well documented. The present study aims to 1) characterize the source rock
potential and depositional environment using organic geochemical methods and 2)
model the burial and thermal history using organic petrography and 1D conceptual
modeling. At the end, a summary of the Nile Delta basin source rock potential will be
provided. This study attempts to highlight the source rock characteristics of a poorly
understood wave-dominated delta type.

13
The source rock characteristics in the Abu Gharadig Basin are also poorly understood.
Here, integrated organic and inorganic geochemical and palynofacies data were used to
determine source rock depositional environment and petroleum potential. The study
will examine the effects of the bottom water chemical composition and the interplay
between some elements and organic matter on the source rock quality. The last goal is to
pinpoint the depositional environment changes within Cenomanian to Santonian times
in the Abu Gharadig Basin.
The Tarfaya Cenomanian to Turonian source rocks in Morocco are famous oil shale
deposits. However, they lack detailed organic petrological and organic sulfur richness
information. The study aims to characterize the potential source rocks, then classify
them based on their microscopic features and organic sulfur contents.
Finally, the data of the three studies that represent different shallow marine
environments will be integrated. This will enable us to draw a broad picture of the
changes of source rock facies versus deposition proximity to shorelines. The data will be
retrieved from three different independent basins which should highlight the general
changes that can be applied to any basin avoiding local effects. The overview of the
variations in the source rock richness and quality from deltaic to outer shelf depositional
environments will help in studying frontier or poorly understood basins and executing
lower risk strategic exploration planning beyond the studied areas.
1.6 Thesis Outline
The current thesis comprises three different integrated studies followed by general
discussion and conclusions. The first study (Chapter 2) assesses the Jurassic, Lower
Cretaceous, and Miocene source rocks in the Nile Delta Basin using state of the art organic
geochemical and petrological methods integrated with 1D basin modeling. The study
provides new information about southern and northeastern Nile Delta Basin thermal and
burial histories as well as regional source rock characteristics. It was published in the
Arabian Journal of Geoscience in 2016.

14
The Second study (Chapter 3) uses an integrated geochemical and palynological
approach to investigate the paleoenvironment and source rock potential in the
Cenomanian to Santonian succession in the Abu Gharadig Basin in Egypt. It elucidates the
source rock properties of the Cenomanian-Turonian boundary section (Abu Rash “F”
Member) and highlights remarkable changes in lithologies and kerogen types within this
short geological period. The study area represents shallow marine/terrigenous shelf. It
was submitted to the International Journal of Coal Geology in 2017.
The last study (Chapter 4) aims to comprehensively characterize Cenomanian to
Turonian organic-rich oil shale deposits in the Tarfaya basin in southwest Morocco and
classifies it based on organic sulfur richness. This result is significant for scientific and
industrial communities as the organic sulfur-rich oil shale requires special treatment
upon retorting. This paper was published in a special issue entitled "Selected
contributions from the XIV ALAGO Congress" in Geologica Acta Journal in 2016.
Chapter 5 integrates data from these studies with other published data to highlight
possibly new parameters/proxies for assessing source rock quality at different
depositional settings. Finally, a general synopsis is provided at the end of the thesis in
Chapter 6.

15
An oil paint of an allochthonous coal particle in a Middle Jurassic Khatatba source rock sample. Artist: Esrraa Abunar

16
Chapter 2 | Source Rock Potential of the Middle Jurassic to Middle Pliocene, Onshore Nile Delta Basin, Egypt1
2.1 Abstract
Organic geochemical characterization of cutting samples from the Abu Hammad-
1 and Matariya-1 wells elucidates the depositional environment and source rock
potential of the Jurassic and Lower Cretaceous successions and the Middle
Miocene to Pleistocene section in the southern and eastern Nile Delta Basin. The
burial and thermal histories of the Mesozoic and Miocene sections were modeled
using 1D basin modeling based on input data from the two wells. This study
reveals fair to good gas-prone source rocks within the Upper Jurassic and Lower
Cretaceous sections with total organic carbon (TOC) averaging 2.7% and
hydrogen index (HI) up to 130 mg HC/g TOC. The pristane/n-C17 versus
phytane/n-C18 correlation suggests mixed marine and terrestrial organic matter
with predominant marine input. Burial and thermal history modeling reveals low
thermal maturity due to low heat flow and thin overburden. These source rocks
can generate gas in the western and northern parts of the basin where they are
situated at deeper settings. In contrast, the thick Middle Miocene shows fair source
rock quality (TOC averaging at 1.4%; HI maximizing at 183 mg HC/g TOC). The
quality decreases towards the younger section where terrestrial organic matter is
abundant. This section is similar to previously studied intervals in the eastern Nile
Delta Basin but differs from equivalents in the central parts where the quality is
1 Ghassal, B. I., El Atfy, H., Sachse, V., & Littke, R. (2016). Source rock potential of the Middle Jurassic to Middle Pliocene, onshore Nile Delta Basin, Egypt. Arabian Journal of Geosciences, 9 (20), 744.
17
better. Based on 1D modeling, the thick Middle Miocene source rocks just reached
the oil generation stage, but microbial gas, however, is possible.
2.2 Introduction
The Nile Delta Basin is considered as one of the most productive petroleum basins
in Egypt and the eastern Mediterranean region especially for gas resources and
constitutes approximately 60,000 km2 equally onshore and offshore (Fig. 2-1;
Barakat 2010). It is triangular in shape and is bounded by the Western Desert with
several subbasins such as Natrun and Abu Gharadig to the west and southwest,
Sinai to the east, and the deep Mediterranean to the north (Fig. 2-1). Petroleum
exploration activities started in the 1940s, which led to several gas and
condensate discoveries (Abdel Halim 1999; Shaaban et al. 2006). The basin even
gained greater interest after the recent super giant gas field discovery, Zohr field,
in offshore Nile Delta Basin in 2015 (Esestime et al. 2016). The majority of the
discovered gas and oil fields are located in the northern onshore and the offshore
areas, whereas in the central and southern onshore areas, there are no commercial
accumulations except for some small oil discoveries in 2006 in Messinian
reservoirs located in the vicinity of Mansoura City, e.g., El Tamad Field (Abdel Aal
et al. 2001; El Nady 2007; Leila M., personal communication). Generally, at least
three petroleum plays were identified, i.e., (i) oils sourced from the Late
Cretaceous/Paleogene found in Miocene/Oligocene reservoirs, (ii) thermogenic
gas in the Miocene sections, and (iii) biogenic gas in the Pliocene intervals (Abdel
Halim 1999; Abdel Aal et al. 2001; El Nady 2007; Khaled et al. 2014). Within the
basin, petroleum systems are not yet fully understood; for example, the Jurassic
and Cretaceous sections encompass key source rocks in the region such as in the
north Western Desert and Gulf of Suez basins, but very limited information is
available for equivalent units in the Nile Delta Basin due to limited penetration of
these sections (Shaaban et al. 2006). The southern areas were geochemically

18
poorly investigated so far compared to the northern areas, and most of the work
was on Miocene sections (Abdel Halim 1999).
The current study aims to investigate source rock potential of the Middle Jurassic
to Upper Cretaceous as well as the Middle Miocene to Middle Pliocene in the
southeastern and eastern Nile Delta Basin using samples from the Abu Hammad-
1 and Matariya-1 wells, respectively (Fig. 2-1). In addition, the organic
geochemical data will be used to investigate the depositional environment of these
intervals. Moreover, 1D basin models were constructed to quantify burial and
temperature history as well as maturation and petroleum generation and to
evaluate thermogenic gas potential of the assessed source rocks. Deltas are one of
the sedimentary settings that favor source rock deposition and classified into
three types: (1) fluvial dominated, (2) tide dominated, and (3) wave dominated
(Galloway 1975). The first two types are characterized by low energy and favor
source rock deposition more than the high-energy wave-dominated type (e.g., Nile
Delta) that lacks optimum source rock deposition and preservation conditions
(Allen and Allen 2005). Nevertheless, numerous gas fields have been discovered
regardless of the many unexplored sections (Fig. 2-1). Therefore, such integrated
study that combines organic geochemistry and burial and thermal history
modeling should provide a means for a better understanding of source rock
distribution and quality as well as maturity, which might help in future
exploration.

19
Fig. 2-1 Nile Delta Basin map showing important structures, wells, and gas fields (modified after Abdel Aal et al. 2001; Shaaban et al. 2006). The gray shaded area represents basalt.
2.3 Geological Setting
2.3.1 Tectonic setting
Northern Egypt is a part of the North African platform which extends from Morocco in
the west to Egypt in the East and was covered by the Neotethys since the Jurassic
(Kerdany and Cherif 1990). The Nile Delta Basin is one of the most important basins in

20
northern Egypt and situated between three major tectonic elements: the Red Sea Rift, the
African-Anatolian plate boundary, and the Syrian Arc. Moreover, the basin history was
altered by several tectonic events since the beginning of the Mesozoic, which influenced
the sediment distribution and facies and controlled the formation of structural elements
such as petroleum traps (Kerdany and Cherif 1990; Said 1990; Meshref 1990; Zaghloul
et al. 1999a). The Nile Delta Basin is subdivided into a southern block located on the
unstable shelf (where the study area is located) and a northern block situated on the
steeply faulted continental shelf (Fig. 2-1; Zaghloul et al. 1999b; Kerdany and Cherif
1990; Meshref 1990).
The opening of the Atlantic in the Early Jurassic resulted in two major sets of tectonic
elements in northern Egypt, which are north-northwest-trending folds with thrust faults
and left lateral east-northeast-trending strike-slip faults (Meshref 1990; Dolson et al.
2000; Abedl Aal et al. 2001). Later, sedimentation was affected by Upper
Cretaceous/Lower Eocene compression (Syrian Arc event: ENE-trending structures)
simultaneously with the closure of the Tethys (Kerdany and Cherif 1990; Zaghloul et al.
1999a) that was responsible for regional erosion. Several tectonic events during the
Tertiary including the Red Sea rifting, the opening of Gulf of Aqaba, the Baltim rift, and
the offshore Mediterranean Rosetta and Temsah faults rejuvenated the older structures
(Abedl Aal et al. 2001; Khaled et al. 2014). Rosetta and Temsah faults were activated
during Upper Cretaceous and Neogene times and resulted in the formation of anticlines
that followed those trends and trapped gas especially in the offshore area (Abedl Aal et
al. 2001; Khaled et al. 2014; Fig. 2-1). A period of NESW faulting occurred after the
Messianian event in the offshore, especially in the eastern area, and intersected the
anticlines (Dolson et al. 2000; Abedl Aal et al. 2001; Khaled et al. 2014). On the other
hand, fault movements were mostly pre-Messinian in the western part of the offshore
area (Abdel Aal et al. 2001). In general, the offshore area appears to be more complex in
terms of structures compared to the onshore area, especially towards the north.

21
2.3.2 Stratigraphy
The earliest known stratigraphic record in the Nile Delta Basin is assigned to the Middle
Triassic (Fig. 2-2). Due to the lack of outcrop or well penetration in the Nile Delta Basin,
the stratigraphy can only be inferred by regional paleogeographic interpretations. The
Triassic in the southern Nile Delta block was interpreted by Kerdany and Cherif (1990)
as a tidal flat deposit, whereas Guiraud and Bosworth (1999) suggest a carbonate
platform depositional environment in the south and deep marine environment in the
north. The Jurassic lithologies are variable, controlled by regional and local tectonic
events as well as eustatic sea-level changes (Keeley andWallis 1991; Shaaban et al. 2006).
Marine carbonate deposition predominates but is modulated by transgressive-regressive
cycles (Kerdany and Cherif 1990; Guiraud and Bosworth 1999). Outcrop and
sedimentological analysis reveals also swamp and lacustrine deposition along the former
coastline from northern Sinai to the Western Desert (Keeley and Wallis 1991). The
Jurassic stratigraphic units are the oldest penetrated sedimentary rocks and were
completely penetrated only in the Abu Hammad-1 well (Zaghloul et al. 1999b; El Nady
2007). Therefore, the lithology of the Jurassic in the Nile Delta Basin is still poorly
understood. The vicinity of the Abu Hammad-1 well area was probably a high in the
Upper Jurassic/Lower Cretaceous, which is represented by an unconformity identified in
seismics (Kerdany and Cherif 1990; Meshref 1990; Said 1990; Harms and Wray 1990).
Various depositional environments were inferred for the Lower Cretaceous that could
range from lagoonal to open shelf (Harms and Wray 1990; Zaghloul et al. 1999b). Crustal
extension in and between Arabia and Africa resulted in E-W-trending rifts in northern
Africa such as the Abu Gharadig Basin. At that time, a shallow marine environment
dominated the Nile Delta Basin (Bayoumi and Lotfy 1989; Guiraud and Maurin 1992;
Guiraud and Bosworth 1999). The depositional environment changed from open marine
in the Aptian to alternating marine and alluvial deposits in the Albian and back to open
marine during the Cenomanian and until the end of the Cretaceous (Said 1990; Guiraud
and Bosworth 1999).
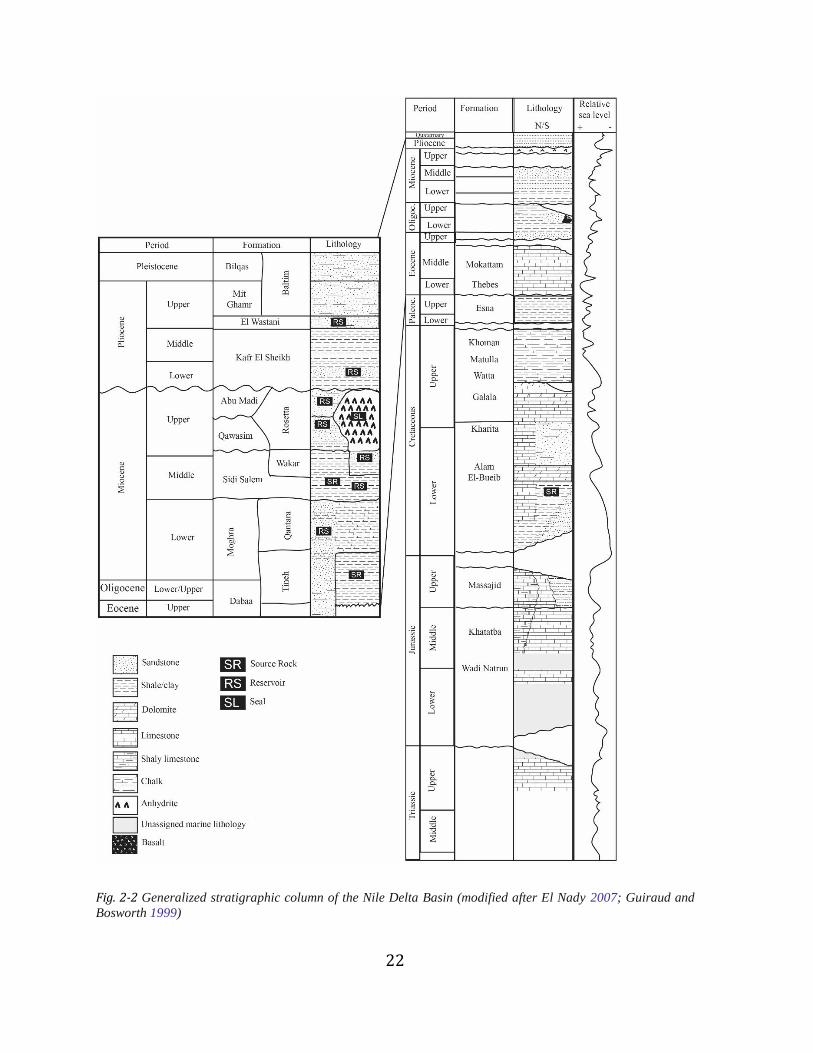
22
Fig. 2-2 Generalized stratigraphic column of the Nile Delta Basin (modified after El Nady 2007; Guiraud and
Bosworth 1999)

23
The Upper Cretaceous to Eocene succession is not present or has not been penetrated in
most of the Nile Delta wells probably due to the Syrian Arc compressional tectonics that
resulted in erosion or non-deposition (Harms and Wray 1990). Thin sediments are
present in the Abu Hammad-1 well. Few wells penetrated the Oligocene, which shows
various lithologies from upper to middle slope deposits, open marine deposits, fluvial
clastics, and basalt (Harms and Wray 1990, Said 1990, Barakat 2010). Basalt occurs in
the subsurface of the southern Nile Delta Basin especially towards the west (Barber
1981; Meneisy 1990) as shown in Fig. 2-1. The Miocene sediments were mainly
controlled by structures related to the opening of the Red Sea and Gulf of Suez (Zaghloul
et al. 1999b). Since the Lower Miocene, the area of the Abu Hammad-1 well location has
been subaerially exposed (Said 1990). The sea level rose more prominently during the
Middle Miocene, and thus, the thicknesses of the Middle Miocene sediments are greater
compared to the Lower Miocene ones (Harms and Wray 1990; Zaghloul et al. 1999b).
Regression took place in the Upper Miocene and especially during the Messinian salinity
crisis (Guiraud and Bosworth 1999). Consequently, deposits of this time are nearly
absent in the southern Nile Delta Basin, and sandy shale lithologies covered the eastern
part of the basin (Said 1990; Zaghloul et al. 1999b). This also left a wide erosional surface
and Grand Canyon scale incised valleys (Barber 1981). Following this event, the Nile
River took its course due to the lowered Mediterranean Sea level (Said 1990). During the
Pliocene, marine transgression occurred and resulted in deposition of marine sediments
that filled the Messianian incised valleys (Ross and Uchupi 1977; Said 1990; Dolson et al.
2001). Then, the depositional system shifted to fluvial and fluviomarine deposits (Said
1990; Zaghloul et al. 1999a). The Pleistocene is mainly of fluvial sandy facies (Zaghloul et
al. 1999b). The common lithologies and the formation names are summarized in Fig. 2-2.
2.4 Samples and Methods
2.4.1 Samples
The study involves two petroleum exploration wells that are located in the eastern and
southern Nile Delta Basin (Fig. 2-1). The first well, Matariya-1, penetrated the

24
sedimentary succession from the Middle Miocene to Middle Pliocene with a total depth
of 4142 m. Twenty-five cutting samples covering an interval from 2284 to 4141m (Table
2-1) were investigated from this well. The second well is named Abu Hammad-1 and has
a total depth of 4283 m. The studied interval ranges from 1212 to 3537 m and is
represented by 16 cutting samples from the Middle Jurassic to Lower/Upper Cretaceous
interval. Each cutting sample represents 3 m of the drilled section, and the interval top
depth is listed in our tables or plotted in figures. All selected samples show a dark color
(usually dark brown).
2.4.2 Elemental analysis
The samples of the Matariya-1 and Abu Hammad-1 wells were analyzed for organic and
inorganic carbon contents using LiquiTOC II (Elementar Analysengeräte GmbH) that uses
IR absorption in a two-step measurement in a single run. In the presence of air, first,
organic and, later, inorganic carbon are converted into CO2. The total organic carbon
(TOC) is measured between 305 and 520 °C and the total inorganic carbon (TIC) is
measured between 520 and 1050 °C. The required amount of powdered sample is 100
mg.
Total sulfur (TS) contents were measured on a LECO S 200 sulfur analyzer (precision is
<5% and detection limit 0.001%) on 10 and 13 samples from the Matariya-1 and Abu
Hammad-1 wells, respectively (Table 2-1).
2.4.3 Rock-Eval pyrolysis
All samples were measured by Rock-Eval 6 for their source rock potential. The method is
described by Espitalié et al. (1985) and Peters (1986). The samples were pulverized to
fine powder that weighed between 45 and 100 mg based on their TOC richness. The
samples were placed in the Rock-Eval 6 instrument and then pyrolyzed at 300 °C for 3
min to generate the S1 peak followed by programmed pyrolysis with a heating rate of 25
°C/min up to 600 °C to generate the S2 peak. Both parameters have the unit of milligram
of hydrocarbons (HC) per gram of rock (mg HC/gRock).

25
Table 2-1 Rock-Eval 6 and elemental data of the Abu Hammad-1 and Matariya-1 wells. Units: *(mgHC/gRock), ** (mgCO2/gRock), *** mgHC/gTOC, ****
mgCO2/gTOC.
Table 2-1 continued
Sample
Number Well Name Depth Formation Age TOC TIC CaCO3 TS TOC/TS S1 S2 S3 Tmax HI OI VR
(m) (%) (%) (%) (%) * * ** °C *** **** (%)
15/190 Matariya-1 2284 Kafr El
Sheikh M. Pliocene
0.51 0.42 3.49 0.06 0.30 1.21
15/191 Matariya-1 2311 Kafr El
Sheikh M. Pliocene
0.29 0.53 4.42 0.07 0.27 1.15
15/192 Matariya-1 2368 Qawasim U. Miocene 0.57 0.37 3.09 0.06 0.36 1.28 416 63 225
15/193 Matariya-1 2479 Qawasim U. Miocene 0.59 0.41 3.42 0.06 0.37 1.27 424 64 215
15/194 atariya-1 2503 Qawasim U. Miocene 0.50 0.24 2.01 0.04 0.33 1.29 412 65 258 0.48
15/195 Matariya-1 2590 Qawasim U. Miocene 0.59 0.28 2.33 0.07 0.39 1.15 428 66 196
15/196 Matariya-1 2629 Qawasim U. Miocene 0.71 0.33 2.73 1.09 0.66 0.10 0.60 1.27 415 84 178
15/197 Matariya-1 2659 Qawasim U. Miocene 0.51 0.22 1.86 0.05 0.33 1.30 425 64 257
15/198 Matariya-1 3113 Qawasim U. Miocene 1.28 1.11 9.28 0.98 1.31 0.15 0.89 1.30 428 69 101
15/199 Matariya-1 3293 Qawasim U. Miocene 1.30 0.23 1.92 0.13 0.83 1.13 428 64 87
15/200 Matariya-1 3362 Sidi Salem M. Miocene 1.06 0.35 2.93 0.86 1.24 0.07 0.55 1.28 434 52 120

26
Table 2-1 continued
Sample
Number Well Name Depth Formation Age TOC TIC CaCO3 TS TOC/TS S1 S2 S3 Tmax HI OI VR
(m) (%) (%) (%) (%) * * ** °C *** **** (%)
14/1354 Matariya-1 3380 Sidi Salem M. Miocene 0.99 0.26 2.16 0.90 1.10 0.06 0.59 1.45 426 60 146
15/202 Matariya-1 3443 Sidi Salem M. Miocene 1.03 0.28 2.32 0.15 0.63 1.22 428 61 119
15/203 Matariya-1 3482 Sidi Salem M. Miocene 1.35 0.36 3.03 0.80 1.68 0.12 1.04 1.13 426 77 84
15/204 Matariya-1 3527 Sidi Salem M. Miocene 1.59 0.42 3.48 0.96 1.66 0.08 0.66 1.27 428 41 80
15/205 Matariya-1 3560 Sidi Salem M. Miocene 1.17 0.29 2.38 0.07 0.61 1.28 429 53 109 0.53
15/206 Matariya-1 3593 Sidi Salem M. Miocene 1.46 0.41 3.45 0.16 1.17 1.27 428 80 87
14/1355 Matariya-1 3626 Sidi Salem M. Miocene 1.32 0.64 5.34 0.09 0.84 1.53 425 64 116
15/208 Matariya-1 3647 Sidi Salem M. Miocene 2.08 1.23 10.25 1.24 1.68 0.31 1.71 1.50 433 82 72
15/209 Matariya-1 3740 Sidi Salem M. Miocene 2.88 1.14 9.52 1.09 2.65 0.77 3.04 1.38 430 105 48
15/210 Matariya-1 3824 Sidi Salem M. Miocene 0.95 0.41 3.39 0.77 1.31 1.44 416 139 152
15/211 Matariya-1 4002 Sidi Salem M. Miocene 1.70 0.88 7.32 0.89 1.91 0.95 2.31 1.11
15/212 Matariya-1 4035 Sidi Salem M. Miocene 1.11 0.71 5.93 1.10 1.01 0.36 1.29 1.13
15/213 Matariya-1 4108 Sidi Salem M. Miocene 1.65 0.76 6.37 0.66 1.76 1.26 420 106 76
15/214 Matariya-1 4141 Sidi Salem M. Miocene 1.38 0.62 5.20 0.92 2.52 1.25 423 183 90 0.66

27
Table 2-1 continued
Sample
Number Well Name Depth Formation Age TOC TIC CaCO3 TS TOC/TS S1 S2 S3 Tmax HI OI VR
(m) (%) (%) (%) (%) * * ** °C *** **** (%)
15/215 Abu
Hammad-1 1212
Kharita U. Cretaceous
0.36 11.56 96.34 0.78 0.47 0.09 0.26 1.21 428 70 331
15/216 Abu
Hammad-1 1242
Kharita U. Cretaceous
0.79 3.02 25.15 0.70 1.13 0.11 0.63 1.25 421 80 159
15/217 Abu
Hammad-1 1362
Kharita U. Cretaceous
0.58 10.95 91.28 0.99 0.59 0.24 0.36 1.09
15/218 Abu
Hammad-1 1461
Alam El-
Bueib L. Cretaceous
1.67 1.94 16.18 0.67 1.74 1.26 427 104 76
14/1350 Abu
Hammad-1 1605
Alam El-
Bueib L. Cretaceous
3.56 0.51 4.23 2.11 1.69 0.49 4.62 1.54 422 130 43 0.42
14/1351 Abu
Hammad-1 1794
Alam El-
Bueib L. Cretaceous
3.46 0.23 1.96 1.26 2.74 0.25 2.65 1.69 426 77 49
15/221 Abu
Hammad-1 1803
Alam El-
Bueib L. Cretaceous
3.88 0.31 2.62 0.98 3.96 0.52 2.78 1.32 429 72 34
15/222 Abu
Hammad-1 1947
Alam El-
Bueib L. Cretaceous
3.18 0.22 1.85 2.23 1.43 0.38 1.45 1.64 423 46 51 0.47
15/223 Abu
Hammad-1 1965 Masajid U. Jurassic
1.74 3.14 26.17 1.18 1.47 2.44 2.22 1.17 428 128 67

28
Table 2-1 continued
Sample
Number Well Name Depth Formation Age TOC TIC CaCO3 TS TOC/TS S1 S2 S3 Tmax HI OI VR
(m) (%) (%) (%) (%) * * ** °C *** **** (%)
15/224 Abu
Hammad-1 2016 Masajid U. Jurassic
1.18 1.26 10.46 1.35 0.87 0.29 1.10 1.32 427 93 112
14/1352 Abu
Hammad-1 2034 Masajid U. Jurassic
0.58 4.78 39.80 1.20 0.48 0.07 0.59 1.48 422 102 256
15/226 Abu
Hammad-1 2379 Khatatba M. Jurassic
0.63 7.44 61.98 0.20 0.71 1.39 432 113 222
15/227 Abu
Hammad-1 2448 Khatatba M. Jurassic
0.66 6.13 51.06 0.92 0.71 0.09 0.58 1.14 429 89 174
14/1353 Abu
Hammad-1 2502 Khatatba M. Jurassic
0.53 3.02 25.14 0.82 0.65 0.07 0.65 1.53 426 121 287 0.63
15/229 Abu
Hammad-1 3306 Khatatba M. Jurassic
0.57 3.99 33.25 0.84 0.68 0.05 0.41 1.29 434 73 228
15/230 Abu
Hammad-1 3537 Khatatba M. Jurassic
0.51 5.27 43.93 0.04 0.33 1.33 433 64 262 0.71

29
During this pyrolysis process, CO2 is also released from kerogen via thermal cracking. An
aliquot of the pyrolysis gas is trapped and released later to quantify CO2 at an IR detector
(S3 peak, mg CO2/g rock). Tmax is another important parameter which represents the
pyrolysis oven temperature of the maximum kerogen conversion. Other essential
parameters are hydrogen index (HI) which is S2 / TOC (mg HC/g TOC), oxygen index (OI)
which is S3 / TOC (mgCO2/g TOC), and production index (PI) which is S1/(S1 + S2). All
pyrograms were checked carefully to ensure the presence of excellent Gaussian-type
peaks that are almost symmetrical to provide meaningful data. Therefore, Tmax values
of 5 bad S2 peaks out of 41 samples were omitted.
2.4.4 Organic petrography
Four samples were selected from each well for organic petrology and vitrinite reflectance
measurements, following the method described by Taylor et al. (1998). The samples
were embedded in a 10:3 mixture of epoxy resin (Araldite®XW396) and hardener
(Araldite® XW397) and dried at 37 °C for at least 12 h. The sample surfaces were then
ground flat and polished as described by Sachse et al. (2012). Vitrinite reflectance
measurements were performed in a dark room using a Zeiss Axio Imager microscope for
incident light equipped with a tungsten-halogen lamp (12 V, 100 W), a ×50/0.85 Epiplan-
Neofluar oil immersion objective, and a 546-nm filter and yttrium-aluminum-garnet
(YAG; 0.889%) as standard. It was attempted to measure reflectance on a minimum of 50
vitrinite particles per sample. The measurements were processed using the DISKUS
Fossil software (Technisches Büro Carl H. Hilgers).
2.4.5 Source rock extraction and liquid chromatography
Six samples from the Matariya-1 well and eight samples from the Abu Hammad-1 well
were selected for molecular organic geochemical analyses. Aliquots of 3–4 g of powdered
source rock samples were extracted, respectively. Fifty milliliters of dichloromethane
(DCM) was added to each sample, and the mixtures were agitated in an ultrasonic bath
for 15 min. Then, each mixture was stirred overnight at room temperature and agitated

30
again in an ultrasonic bath for 15 min. After filtration, activated copper powder was
added to remove elemental sulfur. The raw extracts were separated using a liquid
chromatography on a micro column (Baker, filled with 2 g of silica gel 40 mm).
Fractionation separated the raw extracts into three fractions of increasing polarity using
n-pentane (5 ml), n-pentane/ DCM40/60 v/v (5 ml), and methanol (5 ml), respectively.
The first fraction represents the aliphatic hydrocarbons, whereas the second contained
the aromatic hydrocarbons and the last fraction has more polar compounds.
2.4.6 GC-FID and GC-MS
The aliphatic fractions were analyzed by gas chromatography flame ionization detector
(GC-FID) using a Fisons Instruments GC 8000 series equipped with a flame ionization
detector and a Zebron ZB-1HT Inferno fused silica column (30 m × 0.25-mm internal
diameter (i.d.); film thickness 0.25 μm, Phenomenex®). Each sample was diluted with
approximately 100 ml of DCM, and 1 μl of this solution was injected into a split/splitless
injector at 270 °C and a splitless time of 60 s. Hydrogen was used as a carrier gas with a
velocity of 45 cm/s. The initial temperature was 80 °C and held for 3 min; then, the
temperature increased at a rate of 10 °C/min to reach 300 °C and held for 20 min. The
GC-mass spectrometry (GC-MS) analyses were performed on a Finnigan MAT 95 mass
spectrometer linked to a Hewlett Packard Series II 5890 GC, which was equipped also
with a Zebron ZB-1HT Inferno fused silica column (30 m × 0.25-mm i.d.; film thickness
0.25 μm, Phenomenex®). The carrier gas was He with a velocity of 33 cm/s. The
temperature program started at 80 °C for 3 min; then, the temperature increased at a rate
of 5 °C/min to reach 310 °C. The spectrometer was operated in electron impact ionization
(EI*) mode with an ionization energy of 70 eV and a source temperature of 200 °C. The
scanning range was from m/z 35 to 700 in low-resolution mode.
All biomarker ratios were calculated on the base of peak integration of specific ion
chromatograms. For alkanes, the ion chromatograms of m/z 57 were used. Hopane and
steranes ratios were calculated using m/z 191 and m/z 217 chromatograms,
respectively. All homologue groups were verified by their specific molecular ions.

31
Individual isomers were identified by comparing their elution order with those of
published data (e.g., Peters et al. 2005).
2.4.7 1D burial and thermal history modeling
The PetroMod 1D basin modeling software (version 2014.1, Schlumberger) was used to
construct burial and thermal history models of the Abu Hammad-1 and Matariya-1 wells.
The conceptual models were constrained by present-day information on the geological
setting and basin evolution based, e.g., on the work by Harms and Wray (1990).
Information on lithologies and their depositional ages was adopted from drilling reports.
The paleowater depth (PWD) was estimated based on the biostratigraphic data from
drilling reports. The sediment/water interface temperature (SWIT) was calculated for
latitude 32°, North Africa, based on Wygrala (1988). Borehole temperature and thermal
maturity data served as calibration parameters. The EASY %Ro algorithm (Sweeney and
Burnham 1990) was used for calculation of vitrinite reflectance.
To assess the burial histories of the two well locations, different scenarios were tested in
order to model the thermal regime. As this is highly dependent on the amount of
paleothicknesses (erosion) and assigned basal heat flow values, initially, a basic scenario
was constructed using a current basal heat flow of 38.3 mW/m2 (±7) for the eastern Nile
Delta Basin which was published by Eckstein (1978). This low value is in the expected
range for Precambrian foreland basins. In a next step, further scenarios were created
with heat flow values of 31.3, 38.3, and 45.3 mW/m2. Slightly higher heat flow values
were assigned for the Jurassic. Thereafter, these models were validated using calibration
data (VRr data and borehole temperature data). Three major erosion/hiatus events were
assigned for the Late Jurassic, for the Late Cretaceous to Early Eocene, and for the
Miocene in both wells. The first event was triggered by a major Neotethys sea-level drop
and the tilting of the unstable shelf (Keeley 1994). The second erosion event/hiatus was
caused by compressional tectonics (Syrian Arc Event), which affected the Nile Delta Basin
(Harms and Wray 1990). The latest erosion event was deduced for the end of the Middle
Miocene and the Messinian crisis event (Barber 1981; Harms and Wray 1990. In order to

32
get information on the dynamics of petroleum generation, the source rock kinetics for
kerogen type III (F) published by Pepper and Corvi (1995) was used.
2.5 Results
2.5.1 Elemental analysis
The Middle Jurassic Khatatba Formation has an average carbonate (calculated as CaCO3)
content of 43.1% and shows low TOC and TS contents of 0.6 and 0.9% on average,
respectively (all data and ranges in Table 2-1; Fig. 2-3). In the Masajid Formation, the TOC
and TS values are slightly higher at 1.2%. The formation is relatively low in carbonate
(25.5%). The Lower Cretaceous Alam El Bueib Formation has the highest TOC and TS
contents with values averaging 3.15 and 1.7%, respectively. Carbonate content is low at
5.3%. The uppermost investigated interval is the Albian Kharita Formation that shows
very low TOC and TS averages of 0.6 and 0.8%, respectively, whereas carbonate is high
(average of 70.9%; Table 2-1;Fig.2-4). The Sidi Salem Formation in the Matariya-1 well
shows generally low carbonate contents (average of 4.9%) and moderate TS (0.98%) and
TOC (1.5%). Similar values were measured in the overlying Qawasim Formation (Table
2-1). Only two samples from the Kafr El Sheikh Formation were investigated showing low
carbonate and TOC values (Table 2-1).
2.5.2 Rock-Eval analysis
In the Abu Hammad-1 well, only the uppermost two samples of the Masajid and Alam El
Bueib Formations show source rock quality with S2 and HI averages of 2.37 mg HC/g
rock and 93 mg HC/g TOC, respectively. This interval shows relatively high OI values of
62 mg CO2/g TOC. Tmax is low and averages 426 °C. Apart from this interval, the
investigated section shows poor S2 values, although HI values are partly at values close
to 100 mg HC/g TOC (Table 2-1; Fig. 2-5).
The Matariya-1 well shows variable source rock qualities in the Sidi Salem and the
deepest two samples from the Qawasim Formation. This interval has an average S2 and

33
HI of 1.28 mg HC/g rock and 88 mg HC/g TOC, respectively. The OI values are high
(average of 97 mg CO2/g TOC) and Tmax is low (average of 426 °C; Table 2-1).
Fig. 2-3 Depth plotted versus TOC, CaCO3, TS, HI, and Pr/Ph of the Abu Hammad-1 and Matariya-1 wells

34
Fig. 2-4 TOC plotted versus TS (a) and CaCO3 (b) of the Abu Hammad-1 and Matariya-1 wells

35
Fig. 2-5 TOC plotted versus S2 of the investigated samples.
2.5.3 Organic petrography
All samples from the Abu Hammad-1 well are dominated by vitrinite and inertinite
macerals. The vitrinite reflectance (VR) measurements revealed a wide reflectance range,
but only the lower values were considered, as they present the indigenous particles.
Mean values range between 0.42 and 0.71% (Table 2-1).
The samples from the Khatatba Formation contain small vitrinite particles (usually 5 to
20 μm) as well as inertinite and framboidal pyrite of variable size. Sample 14/1353
(depth 2502 m) contains a larger coal particle that is composed of vitrinite, inertinite,
and streaks of liptinite with weak brownish fluorescence. This coal particle has an
exceptional, high vitrinite reflectance of 1.13%. The Alam El Bueib Formation samples
also show a dominance of vitrinite and inertinite. In total, there are more organic
particles and framboidal pyrites than in the Khatatba Formation. Vitrinites occasionally
contain framboidal or euhedral pyrites. Sample 14/1350 (depth 1605 m) contains a large

36
particle of telovitrinite (VRr 0.37, close to the average of the sample which is 0.42).
Similarly, the samples from the Matariya-1 well are dominated by terrestrial macerals.
Vitrinite reflectance ranges from 0.48 to 0.66%. The vitrinite particles are usually very
small (5 to 10 μm).
Samples from both wells show very small and rare liptinite particles under fluorescent
light. Parts of the (liptinitic) organic matter might be submicroscopic, but due to the low
HI values, we do not expect any large submicroscopic percentages of hydrogen-rich
kerogen.
All samples were carefully checked for drilling fluid contamination and appeared to be
almost clean of contamination by small coal particles from either caving or drilling fluid.
These rare coal particles attributed to caving or contamination have a very low
reflectance (~0.2%). The measured VR values are in principal agreement with Rock-Eval
Tmax values (Table 2-1; Hartkopf-Fröder et al. 2015).
2.5.4 Molecular geochemistry
Only samples that exhibit high TOC contents were used for molecular geochemistry. The
source rock extracts from the Middle Jurassic Khatatba Formation show high abundance
of n-C15 to n-C22 alkanes (Fig. 2-6) and Pr (pristane)/Ph (phytane) ratios of 1.1 on average
(Table 2-2). In contrast, the Upper Jurassic Masajid Formation (one sample only, Table 2-
2) shows maxima both for n-C31 and n-C33 as well as n-C15 to n-C22 alkanes. This sample
has a low Pr/Ph value of 0.76 and a high carbon preference index of 1.76 (Table 2-2).
Three samples of the TOC-rich Lower Cretaceous Alam El Bueib Formation were
analyzed. Alkanes are abundant in the range of n-C15 to n-C22 with long chain alkanes
increasing towards the younger section (Fig. 2-6). The Pr/Ph ratio varies between 0.92
and 1.12. The Alam El Bueib Formation demonstrates very low terrestrial to aquatic ratio
(TAR) ((n-C25 + n-C27 + n-C29 /(n-C15 + n-C17 + n-C19)) that does not exceed 1.11, and CPI
ranges between 0.88 and 1.02 (Table 2-2).

37
Fig. 2-6 Gas chromatographs of the saturated hydrocarbon fractions of the a) Kafr El Sheikh Formation, b) Qawasim Formation, c) Upper Sidi Salem Formation, d) Lower Sidi Salem Formation, e) Kharita Formation, f) Upper Alam El Bueib Formation, g) Lower Alam El Bueib Formation, h) Masajid Formation, and i) Khatatba Formation. Note that n-C17 and n-C20 are marked.

38
Table 2-2 Gas chromatography data of selected samples from the Abu Hammad-1 and Matariya-1 wells.
Sample
Number Well name Depth Formation Age Pr/Ph Pr/n-C17 Ph/n-C18 TAR CPI OEP
(m)
15/190 Matariya-1 2284 Kafer El Sheikh M. Pliocene 2.00 1.80 1.89
15/197 Matariya-1 2659 Qawasim U. Miocene 1.45 1.48 1.57
15/204 Matariya-1 3527 Sidi Salem M. Miocene 4.44 3.24 1.96 0.78 1.10 1.05
14/1355 Matariya-1 3626 Sidi Salem M. Miocene 3.23 5.11 2.05 0.81 0.88
15/212 Matariya-1 4035 Sidi Salem M. Miocene 1.65 2.32 2.27 0.06 0.99 1.03
15/214 Matariya-1 4141 Sidi Salem M. Miocene 1.40 2.04 2.21 1.17 1.16
15/216 Abu Hammad-1 1242 Kharita U. Cretaceous 1.31 1.07 1.03
15/218 Abu Hammad-1 1461 Alam El Bueib L. Cretaceous 1.12 1.13 1.12 0.11 0.88 0.97
15/221 Abu Hammad-1 1803 Alam El Bueib L. Cretaceous 0.92 1.06 1.10 0.04 0.99 0.94
15/222 Abu Hammad-1 1947 Alam El Bueib L. Cretaceous 0.99 0.92 0.83 0.06 1.02 0.94
15/224 Abu Hammad-1 2016 Massajid U. Jurassic 0.76 0.76 0.88 0.80 1.76 1.38
15/226 Abu Hammad-1 2379 Khatatba M. Jurassic 1.23 1.03 0.93
15/227 Abu Hammad-1 2448 Khatatba M. Jurassic 1.02 0.79 0.85
14/1353 Abu Hammad-1 2502 Khatatba M. Jurassic 1.07 0.83 1.01

39
Ts/Tm ranges from 0.51 to 0.73, and the gammacerane index (gammacerane /
(gammacerane + C30 hopane)) decreases from 0.81 to 0.34 towards the younger section.
The 17α-diahopane/18α-hopane (C30*/C29 Ts) is relatively high and ranges from 1.35 to
5.34. The molecular geochemistry characteristics of the Kharita Formation were assessed
based on only one sample due to lean TOC content. The sample shows a high abundance
of n-C14 to n-C22 alkanes. The GC data of four samples from the Middle Miocene Sidi Salem
Formation from the Matariya-1 well show an increase of Pr/Ph ratio from 1.4 to 4.4
towards the younger sections (Table 2-1; Fig. 2-3). The deeper and older samples show
abundant n-C14 to n-C20 alkanes and long chain n-alkanes in very low concentration. On
the other hand, the upper two samples show a bimodal n-alkane distribution (Fig. 2-6).
The samples show a low abundance of gammacerane, whereas oleanane is present (Table
2-3).
The Pr/Ph ratio is low in the Upper Miocene Qawasim Formation, slightly increasing
towards the Middle Pliocene Kafr El Sheikh Formation (Table 2-1; Fig. 2-3). Furthermore,
these samples show abundant short-chain alkanes that range from n-C15 to n-C18.
2.5.5 1D burial and thermal history modeling
Numerical basin modeling was conducted to reconstruct the burial and thermal histories
of both wells using borehole temperature data and measured vitrinite reflectance as
calibration parameters (Fig. 2-7a, b). The analysis revealed that a best fit between the
modeled and measured data is achieved using a recent basal heat flow value of 35 and
38.3 mW/m2 in the Abu Hammad-1 and Matariya-1 wells, respectively, which is close to
the heat flow values reported by Eckstein (1978) for the eastern onshore Nile Delta. The
model used a heat flow of 50 mW/m2 during the Lower Jurassic decreasing gradually to
the present-day value, which was reached at the end of the Jurassic (Fig. 2-7a).

40
Table 2-3 Biomarker data of selected samples from the Abu Hammad-1 and Matariya-1 wells.
Sample
Number Well name Depth Formation
Gam/(Gam+
C30Hop) Ts/Tm Ol/(Ol+C30Hop)
(C29*Ts)/
C29H
C29H/
C30H
C30*/
C29Ts
C31H
22S/(22S+22R)
C33H
22S/(22S+2
2R)
Ts/(Ts+
Tm)
C30M/
C30H
(m)
15/204 Matariya-1 3527 Sidi Salem 0.05 0.68 0.07 0.16 0.92 1.60 0.58 0.58 0.41 0.21
14/1355 Matariya-1 3626 Sidi Salem 0.09 0.75 0.04 0.44 0.37 0.83 0.52 0.54 0.43 0.17
15/212 Matariya-1 4035 Sidi Salem 0.07 0.70 0.10 0.20 0.89 1.46 0.61 0.48 0.41 0.20
15/214 Matariya-1 4141 Sidi Salem 0.19 0.48 0.10 0.18 0.89 1.42 0.55 0.58 0.33 0.25
15/216 Abu Hammad-1 1242 Kharita
15/218 Abu Hammad-1 1461 Alam El
Bueib 0.34 0.60 0.33 0.70
1.35 0.32 0.37 0.68
15/221 Abu Hammad-1 1803 Alam El
Bueib 0.37 0.51 0.14 0.68
5.34 0.49 0.34 0.40
15/222 Abu Hammad-1 1947 Alam El
Bueib 0.81 0.73 0.22 0.70
3.52 0.48 0.42 0.47
15/224 Abu Hammad-1 2016 Massajid 0.36 0.96 0.50 0.78 2.29 0.51 0.49 0.70

41
Fig. 2-7 Burial/thermal history diagrams of the a) Abu Hammad-1 and b) the Matariya-1 wells in the next page.
A)

42
Fig. 2-7 Continued – b) Burial/thermal history diagrams of the Matariya-1 wells.
B)

43
In the area of the Abu Hammad-1 well, a fast deposition of carbonates occurred during
the Lower Jurassic followed by sedimentation of carbonates and clastics until the end of
the Jurassic. An unconformity surface separates the Jurassic from the overlaying layers
with a minor anticipated erosion. This is followed by the deposition of the Alam El Bueib
Formation due to sea level rise. This formation contains eight alternating sandstone and
shale intervals that comprise the source rock sections. These sediments were further
buried, but burial was interrupted in the Late Cretaceous when approx. 500 m was
eroded. Moderate uplift occurred during the Early Paleocene till the Eocene. Deposition
of continental sandstones, interbedded with two thin layers of basalt, started again in the
Oligocene. The sea-level drop favored the rapid deposition of shallow marine clastics of
Lower and Lower-Middle Miocene age, leading to the maximum burial depth of about
4780 m. No further significant burial took place since that time. At present day, the base
of the Alam El Bueib Formation reaches temperatures of 65 °C and a vitrinite reflectance
of 0.47% VRr.
The burial and temperature history for Matariya-1 well is described for the example of
the Sidi Salem Formation, consisting of two source rock intervals interbedded with
sandstone beds. During its first phase of deep burial in the Miocene, the base of the
formation reached temperatures of 48 °C. The deposition of this formation ended with
an erosion event lasting about 2 Ma (Harms and Wray 1990) and created an
unconformity surface. One thousand meters of erosion was assigned to this event. The
erosion was followed by the deposition of the Qawasim Formation that is characterized
by alternating sandstone and shale lithologies with a source rock interval, which
constitutes its base. A thin anhydrite layer rests on the Qawasim Formation representing
the Messinian crisis event and is followed by a short period of erosion. The following
deposition of the very thick siliciclastic rocks of the Kafr El Sheikh Formation
considerably influenced the thermal maturity in this part of the basin. Thinner,
alternating sandstones and shales of the Wastani, Mit Ghamr, and Baltim formations rest
conformably on the Kafr El Sheikh Formation and led to a deepest burial of 4179 m.

44
Maximum temperature of 114 °C is reached at present day for the Sidi Salem Formation.
The calculated vitrinite reflectance for the Sidi Salem source rock is 0.65% at a depth of
2142 m.
2.6. Discussion
2.6.1 Depositional environments
Elemental and biomarker data were used to investigate the depositional environment
during the Middle Jurassic to Lower Cretaceous and Middle Miocene to Middle Pliocene
times.
2.6.1.1 Middle Jurassic to Lower Cretaceous at Abu Hammad-1 well
The Middle Jurassic Khatatba Formation in the Abu Hammad-1 well vicinity was
deposited in pro-delta to shelf environments (Keeley and Massoud 1998; Keeley and
Wallis 1991). According to the well lithology description, the formation is dominated by
carbonate mixed with siliciclastic sediments. The investigated samples have carbonate
(CaCO3) contents in the range of 33 to 66% supporting the lithology descriptions. In the
TOC vs TS diagram, the samples plot above the normal marine line (Berner 1984), which
is usually regarded as indication of oxygen-free bottom waters during deposition (Fig. 2-
4), i.e., reducing conditions. However, this might not be correct here, because organic
matter content is low (less than 4%, less than 2% for most samples) and sulfur content
is quite low as well, if compared to other marine shales. Oxygenated bottom waters are
also indicated by the Rock-Eval data, i.e., low HI and moderate to high OI values. The
occurrence of large pyrite crystals in some samples indicates a late diagenetic
thermochemical sulfate reduction in addition to bacterial sulfate reduction. The Pr/Ph
ratio is used as another indicator of depositional environment that allows to distinguish
oils and source rocks deposited in more or less oxic bottom-water conditions (Brooks et
al. 1969; Didyk et al. 1978; ten Haven et al. 1987; Powell 1987). Pr/Ph values lower than
1.0 indicate anoxic conditions (Didyk et al. 1978). The samples from the Khatatba
Formation show an average Pr/Ph ratio of 1.1 indicating marginally suboxic conditions.

45
In this formation, the most abundant n-alkanes occur between n-C15 and n-C22 indicating
a strong contribution of marine organic matter. On the other hand, the very low
contribution of alginite as compared to vitrinite and inertinite and low HI values indicate
a predominance of terrestrial organic matter or a strong degradation and poor
preservation of marine-derived organic matter. The lack of long-chain n-alkanes, which
are usually typical of terrestrial organic matter, might be due to slightly higher maturity
and cracking of these long-chain hydrocarbons or due to impregnation by oil from a
deeper source. In any case, the presence of large vitrinite particles indicates a nearshore
environment. This conclusion is supported by the interpretation of Ibrahim et al. (1997),
who suggested a continental shelf environment for the Khatatba Formation, which agrees
with the regional geological interpretations. The terrestrial organic matter might be
sourced from deltas or swamps in the south located along the Jurassic shorelines. The
coal particle in the Khatatba sample indicates the presence of coal deposits prior to the
Jurassic that were eroded and transported to the shelf. The relationship between Pr/n-
C17 versus Ph/n-C18 (Fig. 2-8) is also used to determine the depositional environment and
thermal maturity (Peters et al. 2005). The data suggest a suboxic regime for the Middle
Jurassic Khatatba Formation.
The Upper Jurassic Masajid Formation consists of interbedded limestones and shales
deposited during a period of sea-level fall and northward tilting of the unstable shelf,
which influenced the thickness and lithologies (Keeley 1994). TS values and TS/TOC
ratios are high, indicating fully marine depositional conditions. Low–moderate HI values
of about 100 mg HC/g TOC (Fig. 2-3) indicate poor organic matter preservation or
terrestrial organic matter deposition. One sample from the Masajid Formation shows a
high odd/even predominance value of 1.4, pronounced n-C31 and n-C33 abundance, and
bimodal n-alkane distribution (Table 2-2; Fig. 2-6), indicating indeed the presence of a
mixture of terrigenous and marine algal organic matter (Moldowan et al., 1985). The high
C30*/C29 Ts ratio indicates oxic to suboxic bottom-water conditions during deposition
(Peters et al., 2005), supporting the previous conclusion on a poor organic matter
preservation (Fig. 2-8). The Jurassic period witnessed lacustrine and coal swamp

46
conditions on the coastal belt that extends from northern Sinai to the Western Desert
(Kerdany and Cherif 1990; Keeley and Wallis 1991). Therefore, it is reasonable to assume
a nearshore marine facies with terrestrial organic matter input.
Fig. 2-8 Pr/n-C17 versus Ph/n-C18 for selected samples from the Abu Hammad-1 and Matariya-1 wells, in comparison to other published data.
The Lower Cretaceous Alam El Bueib Formation in the Abu Hammad-1 well is dominated
by siliciclastics lithologies with occasional carbonate intervals, deposited at low–
moderate sedimentation rates (Fig. 2-7a). Regional geological studies suggest that the
southern Nile Delta Basin was dominated by carbonate layers, whereas the northern
parts were dominated by siliciclastics during the Lower Cretaceous (Keeley 1994; Keeley
and Massoud 1998; Keeley and Wallis 1991). This does not fully agree with our data
suggesting siliciclastic deposition also in the south at Abu Hammad-1 well location (Figs.
2-1 and 2-3). The Alam El Bueib Formation source rock samples show the highest TOC
values of all formations studied, as well as quite high TS values, but low–moderate HI
values of about 100 mg HC/g TOC. Correlation between S2 and TOC is poor (Fig. 2-5).
These data suggest that the organic matter was deposited in a marine setting, but organic
matter preservation was poor. Terrestrial organic matter is present, but probably to a
0.01 0.10 1.00 10.00
Ph/nC18
0.01
0.10
1.00
10.00
Pr/
nC
17
Oxidising
Reducing
Biodegraded/immature
Early mature
Mature
Terrestrial organic matter
Mixed sources
Marine organic matter
Well Matariya-1 Abu Hammad-1 Abu Madi-1Abu Madi-3Abu Madi-5EG-ND-1EG-ND-2EG-ND-3EG-ND-TNW-5PFM SE-1Sidi Salem-1Temsah-3
FormationEl Wastani FormationKafer El Sheikh FormationAbu Madi FormationQawasim Formation Wakar FormationSidi Salem FormationMoghra ForamtionKharita FormationAlam El-Bueib FormationMasajid ForamtionKhatatba Formation

47
lesser extent than during the Jurassic; this is indicated by low abundance of long-chain n-
alkanes, especially in the lower part of the section (Fig. 2-6). Towards the top, more long-
chain n-alkanes occur, possibly due to higher terrestrial organic matter contribution.
Pr/Ph values of 0.9–1.1 are very close to the typical values of marine shale (Peters et al.
2005). The Pr/n-C17 versus Ph/n-C18 relationship indicates suboxic depositional
conditions (Fig. 2-8), and the high C30*/C29 Ts ratio indicates oxic to suboxic bottom-
water conditions (Table 2-3).
The Kharita Formation shows low TOC values, but the highest CaCO3 contents compared
to the other Mesozoic formations, which is in accordance with lithology descriptions.
High abundance of n-alkane n-C14 to n-C22 and very low abundance of long-chain n-
alkanes indicate that a marine depositional environment and geochemical data suggest
oxic to suboxic bottom-water conditions (Fig. 2-8).
2.6.1.2 Middle Miocene to Middle Pliocene at the Matariya-1 well
The Sidi Salem Formation in the Matariyah-1 well is a low-stand wedge as interpreted in
a seismic line by Shaaban et al. (2006). The formation constitutes shale with interbedded
sandstone intervals (Fig. 2-7b). The samples, which are rich in silicates, plot above the
normal marine line (Berner 1984) with poor correlation. This indicates either anoxic
bottom water or—more likely—diagenetic sulfate delivery intensifying sulfate reduction
and pyrite formation. Moderate positive correlations between CaCO3 and TOC and HI are
observed. This implies an enhanced organic matter preservation during periods of
enhanced carbonate deposition, probably due to the input of more marine organic
matter. A poor correlation coefficient was calculated between TOC and S2 indicating a
non-homogenous source rock interval (Fig. 2-5). Moreover, wide ranges of vitrinite
reflectance for each sample were observed indicating contribution of much
allochthonous organic matter. The section was probably deposited in high-energy
conditions with oxic bottom water facilitating decay of labile, marine organic matter.
Pr/Ph ratios higher than 3 also indicate terrigenous organic matter deposition in an oxic
environment (Peters et al. 2005).

48
The increase in the Pr/Ph ratio from 1.4 to 4.4 towards the younger sections could
indicate a shallowing up delta sequence within the low-stand wedge (Table 2-2; Fig. 2-
3). The n-alkane distribution supports this conclusion as the two bottom samples are
dominated by n-C14 to n-C20 alkanes and have a very low abundance of the high-molecular
weight compounds indicating marine organic matter input. In contrast, the upper two
samples show a bimodal n-alkane distribution in the ranges of n-C14 to n-C18 and from n-
C21 to n-C33 indicating strong contribution from terrigenous organic matter (Fig. 2-6). The
Pr/n-C17 versus Ph/n-C18 diagram (Fig. 2-8) also illustrates a trend from marine to
terrigenous organic matter. Similarly, the HI correlates negatively with the Pr/Ph ratio
supporting the assumption of an increase in oxicity and terrigenous organic matter input
over time. Harms and Wray (1990) suggested a shallowing upward trend during the
Middle Miocene in the vicinity of the Matariya-1 well, which is supported by the
molecular geochemical data. The samples also show relatively high C30*/C29 Ts ratios
indicating oxic to suboxic conditions (Table 2-3). Oleanane is a biomarker most likely
derived from angiosperms that has not been reported widely prior to the Early
Cretaceous (Moldowan et al. 1994; Das and Mahato 1983; Doyle and Hicky 1976),
although we are aware about the presence of angiosperm-like pollen from the Triassic
(e.g., Hochuli and Feist-Burkhardt 2013). Therefore, it is used as biomarker for
angiosperms based on the oleanane index (oleanane/C30 hopane) (Peters et al. 2005).
The samples from the Sidi Salem Formation are characterized by fair presence of
oleanane (Table 2-2).
The Pr/Ph ratio lowers again in the Upper Miocene Qawasim Formation and then slightly
increases in the Middle Pliocene Kafr El Sheikh Formation (Table 2-2; Fig. 2-3).
Furthermore, the samples show strong indication of marine organic matter contribution,
i.e., abundant short-chain alkanes (n-C15 to n-C18). Similarly, the Pr/n-C17 versus Ph/n-C18
relationship indicates presence of marine organic matter (Table 2-2; Fig. 2-7). The
elevated Pr/Ph ratios (1.4 to 2.0) indicate suboxic to oxygenated conditions. Except for
the two bottom samples of the Qawasim Formation, the analyzed section is poor in TOC
and HI, indicating poor preservation of labile marine organic matter.

49
2.6.2 1D burial and thermal history modeling
Limited information is so far available on the burial history of the Mesozoic succession in
the southeastern Nile Delta Basin. Thus, basin modeling of the Abu Hammad-1 well
provides novel information on the thermal and burial histories. The model reveals a low
thermal maturity for the Khatatba source rocks. The main factors responsible for this low
thermal maturity are (1) the very low heat flow in the basin and (2) long periods of non-
deposition or erosion that reduced the thickness of the overburden.
On the other hand, the Matariya-1 well model aims to explain the lack of gas fields in the
eastern offshore Nile Delta. It shows the significant effects of the Middle/Upper Miocene
erosional event that ceased further thermal maturation of the source rocks. It should be
noted that erosional thickness increases to the south (Harms and Wray 1990) and
diminished to the north where more late gas generation can be expected. High
sedimentation rates of the Kafr El Sheikh Formation appear to be restricted to the
northern part of the basin as apparent in the regional cross sections (Fig. 2-9a). No gas
or oil expulsion is expected to occur in the Matariya-1 well source rocks even when using
a high heat-flow history scenario (Fig. 2-7b), which might explain the poor Miocene gas
occurrence in the eastern Nile Delta Basin.
2.6.3 Source rock potential
2.6.3.1 Abu Hammad-1 well
Some samples show moderate to high TOC values (up to 4%) in the interval between
1461 and 2016 m including two samples from the Upper Jurassic Masajid Formation and
five samples from the Lower Cretaceous Alam El Bueib Formation (Table 2-1; Fig. 2-3).
However, these samples show relatively low HI values ranging from 46 to 130 mg HC/g
TOC revealing in view of the low thermal maturity dominance of mixed type III/IV
kerogen without oil generation potential and with poor to moderate gas generation
potential (Fig. 2-10). This conclusion is supported by microscopic data revealing
dominance of vitrinite, inertinite, and coaly particles. The interval is thermally

50
Fig. 2-9 a) Cross section demonstrates Oligocene and Miocene stratigraphy at the eastern Nile Delta Basin (modified after Shaaban et al. 2006). B) Cross section shows Nile Delta stratigraphy from the onshore to the offshore areas (modified after Abdel Aal et al. 2001).
a
b

51
Fig. 2-10 HI versus OI of the samples from the Abu Hammad-1 and Matariya-1 wells. PFM-1 well data are published in Khaled et al. (2014).
immature as indicated by the low vitrinite reflectance (VR) and Tmax values (Table 2-1;
Fig. 2-11). Biomarker maturity parameters indicate variable and partly enhanced
thermal maturity (Table 2-3). In particular, Ts / (Ts + Tm) values are quite uniform and
values are in agreement with an early oil window maturity. Whereas this ratio seems to
work well in the studied sections, other biomarker maturity parameters show a lot of
scatter, being possibly strongly influenced by lithology. Combining the thermal maturity
data with results of Rock-Eval pyrolysis and thickness, the immature source rock interval
might have a moderate gas generation potential due to its thickness of more than 500 m.
However, more samples need to be measured, in particular with respect to TOC within
this sequence to verify this conclusion. Based on well lithology logs (Fig. 2-7a), this
interval includes sandstones that could act as potential reservoirs.
2.6.3.2 Matariya-1 well
Based on TOC and Rock-Eval data, only the section from 3113 to 4141 m in the Middle
Miocene Sidi Salem Formation and lower parts of the Upper Miocene Qawasim Formation
0 100 200 300
OI (mg/gTOC)
0
100
200
300
400
500
600
700
800
900
HI (m
g/g
TO
C)
Type I
Type II
Type III
Type III/IVWell Matariya-1 Abu Hammad-1 Abu Madi-9
Kafer El Sheikh FormationAbu Madi FormationQawasim Formation Sidi Salem FormationKharita FormationAlam El-Bueib FormationMasajid ForamtionKhatatba Formation

52
show a fair to good gas source rock potential with dominance of mixed type III/IV
kerogen (Table 1; Fig. 2-10).
VR and Tmax results suggest low thermal maturity with the lower part reaching the onset
of oil generation thermal maturity stage (Table 1; Fig. 2-7b). Microscopic investigations
reveal a dominance of vitrinite and inertinite assemblages, which supports the Rock-Eval
data (Figs. 2-5 and 2-10). The lack of long-chain n-alkanes may be attributed to very low
maturity here: in this case, the long-chain hydrocarbons are not yet released from fatty
acids. The Sidi Salem Formation and Qawasim Formation have alternating shale and
sandstone lithologies with thicker shale intervals within the Sidi Salem Formation. This
might indicate short migration distances from source to reservoir within this section. A
gas show was reported in one of the sandstone intervals in the Sidi Salem Formation.
Microbial gas generation seems to be more probable than thermogenic gas generation in
view of the temperatures reached.
2.7 The Mesozoic and Miocene Source Rocks In the Nile Delta-An Overview
The current work reveals that the Jurassic and Cretaceous sections can encompass
potential gas-prone source rocks that extend to the north and to the west at deeper
settings (Abdel Aal et al. 2001; Barakat 2010) (e.g., Fig. 2-9b). In the far south, the Jurassic
source rock is expected to be coal bearing or terrestrial dominated, although little
geochemical or petrological data are available. Towards the north, shelf and delta
settings are expected with dominance of transported and more strongly degraded
terrestrial organic matter mixed with aquatic organic matter, which is strongly degraded
due to (partly) oxic depositional conditions. An example of this type is found in the Upper
Jurassic to Lower Cretaceous source rock section in the Abu Hammad-1 well. Further to
the north, better source rock qualities are anticipated similar to the prolific oil-prone
source rocks in the northern Western Desert and North Sinai basins. However, this needs
to be confirmed by drilling. Moreover, mixed oil and gas-prone source rocks were

53
reported in the Khatatba and Alam El Bueib formations with marginal to fair source rock
quality in the Sindy-1, Mit Ghamr-1, and Monaga-1 wells (Fig. 2-1; Hassaan et al. 2012).
Another important element is that the Oligocene basalt covers the southwestern part of
the Nile Delta Basin (Fig. 2-1), which could have influenced the thermal history of this
area and consequently the hydrocarbon generation if present in great thickness and near
source rock intervals. Additionally, the Upper Cretaceous includes key source rocks in
the region especially in the Western Desert Basin (El Diasty and Moldowan 2012; El Nady
et al. 2015). Thus, the Mesozoic could include one of the regional key petroleum source
rocks in the Nile Delta Basin and further investigation is highly recommended.
According to seismic interpretation adopted by Abdel Aal et al. (2001), the Cretaceous
succession in the offshore area can be deeper than 8000 m suggesting advanced thermal
maturity and hydrocarbon generation in relatively recent times (Fig. 2-10). The 1D basin
models suggest that the lithology, the sedimentation rates, and the amount of erosion are
key factors in controlling the basin’s thermal evolution especially since the heat flow
remained low perhaps with exception of regions with basaltic flows. Clearly, areas close
to major tectonic faults or fractures could attain higher thermal maturity than those
observed in this assessment. This would be related to hydrothermal fluids that can locally
affect temperature and maturation. The Oligocene was not investigated in this study, yet
it could contain a prolific gas-prone source both in the northeastern onshore and offshore
Nile Delta Basin (Hassaan et al. 2012). Villinski (2013) found potential source rocks in
Oligocene turbidite deposits that have disseminated terrestrial organic matter with
relatively fair quality (TOC 1–2% and HI of 150–300 mg HC/gTOC) in the offshore Nile
Delta Basin. This observation is somewhat similar to the source rock characteristics of
the Sidi Salem Formation (Fig. 2-3a).
TOC and HI of the Sidi Salem Formation have been mapped (Fig. 2-11) based on data from
this study and other published data. The Miocene source rocks in the Matariya-1 well are
of greater richness and quality compared to the Miocene source rocks evaluated in the
eastern Nile Delta Basin by Shaaban et al. (2006) but showed similar data compared to

54
Upper Miocene samples studied by Keshta et al. (2012) and El Nady (2007) in the central
parts of the basin. On the other hand, the Sidi Salem Formation shows excellent quality
towards the central and west-central Nile Delta Basin with HI exceeding 400 mg HC/g
TOC (El Nady 2007) as shown in Fig. 2-11.
Fig. 2-11 TOC and HI map of the Matariya-1 well and published data of the Sidi Salem Formation source rock. Published data sources: Abu Madi-1, Abu Madi-3, Abadiya-1, Kafer El Shiekh-1, Abu Madi-1, and Abu Madi-3 (El Nady 2007); Sidi Salem-1 (El Nady and Harb 2010); AbuMadi-9 well (Keshta et al. 2012); and S.W. Bilqas-1, Port said-1, Qantara-1, and Port Fouad-1 (Shaaban et al. 2006).
The Pr/Ph ratios of the Sidi Salem Formation in the Matariya-1 well were compared with
the published data in the region to better understand the depositional environment on a
regional scale. The Sidi Salem Formation in the Abu Madi-1 well, located in the
northeastern-central Nile Delta Basin, shows slightly lower Pr/Ph ratios ranging from 0.7
to 2.2 (El Nady and Harb 2010) indicating, on average, more reducing bottom-water
55
conditions. A higher sea level is also assumed and more marine and less terrestrial
organic matter. Figure 8 shows that the Sidi Salem Formation in the Matariya-1 well
differs with respect to Pr/n-C17 versus Ph/n-C18 values from the regional data, which
were collected from northern onshore and offshore areas (Fig. 2-1). This might also
indicate that the eastern Nile Delta contains a different, more terrestrial-influenced
source rock facies. The Sidi Salem Formation gains its importance as source rock due to
its thickness of several hundreds or even up to 1000 m and from being adjacent to
reservoir rocks.
2.8 Conclusions
In the Abu Hammad-1 well, the best source rock section is found in the Lower Cretaceous
Alam El Bueib Formation that is dominated by silicate lithology. It mainly contains
terrestrial and degraded marine organic matter having a significant gas generation
potential but probably almost no oil generation potential. The biomarker and elemental
data suggest a nearshore marine depositional environment with oxic bottom water.
The 1D burial and thermal history models reveal low source rock thermal maturity and
no significant thermal hydrocarbon generation. This is due to thin overburden and low
heat flows. In contrast, significant gas generation from the Mesozoic source rocks is
expected to occur in the northern Nile Delta Basin where they are deeply buried. Limited
previous work has been conducted on this interval, but the current study shows that the
Upper Jurassic and Lower Cretaceous can be an important source rock in the Nile Delta
Basin due to its great thickness and the association with reservoir intervals.
In the Matariya-1 well, the Middle Miocene Sidi Salem and lower part of the Lower
Miocene Qawasim Formation show moderate source rock quality. The source rock
interval is dominated by terrestrial organic matter indicating gas-prone kerogen. The
source rock is immature to very early mature with respect to oil generation. Burial and
thermal history models prove that the maximum temperatures were attained in the
Quaternary.

56
The Miocene data were evaluated in a regional context. The central Nile Delta Basin
appears to have better source rock quality compared to the eastern Nile Delta Basin
where the Matariya-1 well is located. This is perhaps due to shallower water conditions
in the eastern Nile Delta Basin during the Middle Miocene time. The Miocene source rock
interval is very thick and interbedded with sandstones, making it an interesting
petroleum play, e.g., for microbial gas.

57
An oil paint of a Microforaminiferal test lining found in a Cenomanian/Turonian sample, Abu Gharadig Basin, GPT-3, Egypt. Artist: Esrraa Abunar

58
Chapter 3 | Depositional Environment and Source Rock Potential of the Upper Cretaceous Succession, Abu Gharadig Basin, Northern Western Desert, Egypt: An Integrated Geochemical and Palynological Study
3.1 Abstract
The Abu Gharadig Basin in the north Western Desert, Egypt is among the most important
petroleum provinces in Egypt. Here, Cenomanian to Santonian rocks of Bahariya
Formation and Abu Roash A-G members from the GPT-3 well were investigated for their
depositional environment, kerogen quality, petroleum generation potential and thermal
maturity by geochemical, petrological and palynological methods. The sediments of the
Bahariya and Abu Roash formations excluding the Abu Roash "F" Member represent
variable shallow marine environments with poor organic matter preservation, whereas
there is an excellent preservation in the Abu Roash “F” Member. The basal part of this
member is characterized by anoxic, carbonate-rich depositional conditions, high TOC
values up to 7%, high HI up to 700 mgHC/gRock and liptinite dominated organic matters.
Depletion of iron leads to sulfur incorporation into organic matter which is reflected in
their high thiophene/Benzene ratio. Above, sediments are enriched in “terrestrial
elements” Fe, Si, Ti, as well as K and Mn. This pattern and the occurrence of the
fresh/brackish water algae Botryococcus suggests a regression phase during deposition.
The upper part of the Abu Roash "F" Member is again characterized by fully marine,
suboxic conditions and a lower thiophene/Benzene ratio. The source rock section
demonstrates lower thermal maturity compared to the above and below sections based
on all microscopic, pyrolysis and biomarker data. This indicates thermal maturity
retardation/suppression most likely due to liptinite enrichments as indicated by the
geochemical and palynological data. The source rock heterogeneity indicates relatively
shallow marine environment where the changes in bottom water conditions are very
sensitive to sea level fluctuations. Residual oil characterization reveals two reservoir
compartments, which are in the Abu Roash “D” and “C” members.

59
3.2 Introduction
Few attempts were carried out to investigate the depositional environment during the
Cenomanian/Turonian Boundary Event (CTBE) in the Western Desert basins using
integrated geochemical and palynological techniques (e.g. El Beialy et al., 2010; Zobaa et
al., 2011). Moreover, the source rock character and oil origin in the Cretaceous succession
is poorly understood, although several oil fields exist. The Abu Gharadig Basin is located
in the central part of the north Western Desert between the Qattara Depression to the
west, the Qattara High to the north and the Gindi and South Abu Gharadig basins to the
east and south, respectively (Fig. 3-1A). It is one of the oldest producing basins in the
Western Desert, which witnessed the first oil discovery in 1970 at the Khalda field (Awad,
1985; Younes, 2012). Moreover, the basin became more appealing after the recent oil
discovery in the Abu Roash “C” Member in the El Salmiya Field (Beach Energy, 2014). The
basin mainly produces oil and gas from Jurassic and Cretaceous plays (Awad, 1985). The
studied well is located in the GPT field that was discovered in 1983 and commenced
production in 1990 (Abdel-Rahman, 2013).
The proven source, reservoir and seal rocks found in the Abu Gharadig Basin are mainly
within the Jurassic and Cretaceous section (Awad, 1985; Bakr, 2009; El Diasty and
Moldowan 2012; Abdel-Rahman, 2013; El Nady and Harb, 2015; El Nady and El-Naggar,
2016). The Masajid and Khatatba formations are the most common Jurassic source rocks
which, represent mostly marine oil-prone facies with occasional non-marine facies
within the Khatatba Formation (Shalaby et al., 2012). Furthermore, potential marine
source rocks are found in the Lower Cretaceous Alam El Bueib Formation and mixed
marine and terrestrial source rocks within the Bahariya Formation. The best source rock
facies are in the “F” Member of the Abu Roash Formation that was deposited during the
Oceanic Anoxic Event 2 (OAE2; El Beialy et al., 2010; Zobaa et al., 2011), which is a global
phenomenon responsible for world class source rock deposits in several regions around
the world during the Cenomanian/Turonian boundary (Jenkyns, 2010). Other members
show variable source rock qualities within the basin.

60
Fig. 3-1 a) A location map of the studied GPT-3 well and the main sedimentary basins in the north Western Desert, Egypt. B) Paleogeographic map at ~94 Ma of North Egypt and the surrounding areas (modified after Phillip, 2003).
For example, oil-prone source rocks were reported at the base of the Khoman Formation
in different parts of the basin (Shahin et al., 1986). The best reservoir qualities were
encountered in the Bahariya and Abu Roash formations. The main reservoirs in the GPT
field produce gas from the Bahariya and Khoman formations as well as the “B” and “D”
members of the Abu Roash Formation (Abdel Rahman, 2013). Jurassic reservoirs are
poorly studied and understood, but it can be assumed that part of the Khatatba
Formation has good reservoir quality (Ahmed, 2008). The seals in Abu Gharadig Basin

61
are mainly shales and tight carbonates (El Ayouty, 1990). The source rocks for the oil and
gas are still debated and range from non-marine to marine, possibly due to the presence
of mixed sources (El Diasty and Moldowan 2012; El Nady and Harb, 2015; El Nady and
El-Naggar, 2016).
In summary, the Upper Cretaceous Bahariya and Abu Roash formations contain a
complete petroleum system in the basin. Using an integrated approach, the present study
intends to fill research gaps and provide new data on paleoenvironmental conditions and
source rock development during Cenomanian to Santonian times. In addition,
maturation, petroleum generation and the origin of the hydrocarbon accumulations in
the western Abu Gharadig Basin are discussed, based on new data and previous studies.
3.3 Geologic Setting
The Abu Gharadig Basin is a Mesozoic E-W trending elliptical extensional basin where
rifting started during the Upper Jurassic, contemporaneously with the opening of the
Neotethys and deep crustal extensional movements that affected North Egypt (Awad,
1984; Bayoumi and Lofty, 1989). The basin is structurally controlled by two E-W
bounding listric faults located at the southern and northern boundaries, which resulted
in subsidence during the Cretaceous with faster rates in the northern part. The slow
subsidence rate at the southern boundary resulted in an asymmetrical basin shape
(Awad, 1984; Bayoumi and Lotfy, 1989). The maximum subsidence and augmentation of
the basin was attained during the Turonian coeval with high global sea level (Bayoumi
and Lotfy, 1989; Haq et al., 1988). Nevertheless, the Abu Gharadig Basin acted as a
shallow marine to terrigenous shelf during this period (Philip, 2003; Fig. 3-1B). Some
areas remained subaerial such as the major part of the Qattara High that bounds the basin
from the north (Said, 1990; Fig. 3-1B). The extension then ceased due to a compressional
tectonic phase during the Upper Cretaceous, i.e. the Laramide phase during the Alpine
Orogeny and the Syrian Arc tectonic movements (Awad, 1984; Keely, 1994; Guiraud and
Bosworth, 1997; Kerdany and Cherif, 1999; Azab, 2014). This resulted in elevation along
the eastern boundary of the Abu Gharadig Basin (Kattaniya Inversion) that separated the

62
Abu Gharadig from the Faiyum Basin (Awad, 1984; Fig. 3-1A). Moreover, the
compressional stress was responsible for the basin tilting and NE-SW folding (Said,
1990). These asymmetric anticlines are plunging towards the NE and intersected by a
series of NW trending extensional faults (Azab, 2014).
The Bahariya Formation (Fig. 3-2) is early Cenomanian in age and witnessed
considerable changes in its depositional facies toward the younger section from fluvial to
estuarine to lagoonal sediments (Dominik, 1985). With respect to lithology, it varies from
cross-bedded coarse grained sandstone at the base to fossiliferous or sandy dolomite at
the top (Awad, 1984; Hantar, 1990). In the north Western Desert, the formation was
deposited in a nearshore inner shelf environment (Said 1990; Abdel Kireem et al., 1996).
Conversely in the south, the formation was deposited in fluvial to estuarine settings (Said,
1990). In the southern vicinity of the studied GPT-3 well (GPTSW-7 well, Fig. 3-1A), a
shallow marine to fluvio-deltaic setting is suggested (El Beialy et al., 2008). The formation
is dominated by terrestrial palynomorphs that can constitute up to 80 % of the bulk
kerogen (Abdel Kireem et al., 1996; El Beialy et al., 2008; El Atfy, 2011).
The overlying Abu Roash Formation (Fig. 3-2) consists of upper Cenomanian to Coniacian
deposits that rest conformably on the Bahariya Formation (Ahmed, 2008; El Beialy et al.,
2008). It represents periods of marine transgression/regression cycles and comprises
seven members, named “A” to “G” from top to bottom (Said, 1990). The Abu Roash “G”
Member is late Cenomanian in age and was deposited in a shallow marine setting (Abdel-
Kireem et al., 1996) that witnessed fresh water incursions (El Atfy et al., 2017). This
member shows for organic matter a positive δ13C isotope excursion towards the
overlying Abu Roash “F” Member (Zobaa et al., 2011). It constitutes interbedded
carbonate and clastic lithologies (Fig. 3-2). The Abu Roash “F” Member is upper
Cenomanian/lower Turonian in age deposited in a shallow marine setting (Abdel-Kireem
et al., 1996; El Beialy et al., 2010; Zobaa et al., 2011). It is composed mostly of carbonate
interbedded with shale (Abdel-Kireem et al., 1996; Hantar, 1990; El Beialy et al., 2010; El
Atfy, 2011). The basal part is characterized by a positive δ13C isotope excursion reflecting
the OAE2 phenomenon (Zobaa et al., 2011).

63
Fig. 3-2 Lithostratigraphic column of the GPT-3 well, north Western Desert, Egypt (after GPC, 1984). The associated biozones are after El Beialy et al. (2010).

64
The Abu Roash “E” to “B” members are Turonian in age but differ in lithology and
depositional environments. The regressive Abu Roash “E” is dominated by clastic
lithologies and can act as a reservoir (Ahmed, 2008). Previous palynological studies
reported the dominance of the fresh water green algae Pediastrum at the lowermost Abu
Roash “E” Member, which indicates sea level drop and increased influence of terrestrial
organic matter (e.g. Abdel-Kireem et al., 1996; Zobaa et al., 2011). The “D” and “B”
members were deposited in periods of sea transgression marked by carbonates unlike
the “C” Member characterized by clastic facies of a regressive habitat (Hantar, 1990;
Ahmed, 2008). The Abu Roash “A” Member was deposited during the Coniacian when
major sea transgression prevailed (Said, 1990; Ahmed 2008) in a shallow water, clastic
middle shelf environment (Abdel-Kireem et al., 1996).
3.4 Material and Methods
3.4.1 Samples
A total of 88 cuttings and 12 core samples from the Bahariya and Abu Roash formations
were collected from the GPT-3 well (Table 3-1). The well is located in the GPT field in the
southern Abu Gharadig Basin (28° 36’ 41.300” E, 29° 36’ 10.600” N) and reached a total
depth of 2295 m in the Kharita Formation. The investigated section ranges in depth from
1413 to 1986 m.
Table 3-1 Carbon, sulfur and Rock-Eval data of the Bahariya and Abu Roash formations, GPT-3 well, north
Western Desert, Egypt. * (mg HC/gRock), ** (mg CO2/gRock), *** (mgHC/gTOC), **** (mgCO2/gTOC).
Table 3-1 Continued (* (mg HC/gRock), ** (mg CO2/gRock), *** (mgHC/gTOC), **** (mgCO2/gTOC))
Sample No.
Sample type
Depth Rock Unit TOC CaCO3 TS S1 S2 S3 Tmax PI HI OI
(m) (%) (%) (%) * * ** °C *** ****
15/400 Cuttings 1413-1416 Abu Roash "A" 1.30 26.50 1.13 0.12 1.06 3.25 431 0.10 82 249
15/401 Cuttings 1422-1425 Abu Roash "A" 1.25 33.10 0.11 0.85 2.79 430 0.11 68 223
15/402 Cuttings 1431-1434 Abu Roash "A" 1.00 41.20 0.11 0.79 2.72 429 0.12 79 271
15/403 Cuttings 1440-1443 Abu Roash "A" 1.13 37.60 0.13 0.88 2.93 428 0.13 78 260
15/404 Cuttings 1449-1452 Abu Roash "A" 1.07 42.35 1.35 0.11 0.74 2.74 428 0.13 69 256
15/405 Cuttings 1458-1461 Abu Roash "A" 0.89 46.88 0.11 0.64 2.39 428 0.15 72 269
15/406 Cuttings 1467-1470 Abu Roash "A" 0.89 52.25 0.13 0.83 2.81 430 0.14 92 315

65
Table 3-1 Continued (* (mg HC/gRock), ** (mg CO2/gRock), *** (mgHC/gTOC), **** (mgCO2/gTOC))
Sample No.
Sample type
Depth Rock Unit TOC CaCO3 TS S1 S2 S3 Tmax PI HI OI
(m) (%) (%) (%) * * ** °C *** ****
15/407 Cuttings 1476-1479 Abu Roash "A" 0.89 50.97 0.12 0.77 2.37 430 0.13 86 266
15/408 Cuttings 1485-1488 Abu Roash "A" 0.77 71.78 1.06 0.15 0.76 2.28 427 0.17 99 297
15/409 Cuttings 1494-1497 Abu Roash "A" 1.22 34.77 0.13 0.82 2.69 424 0.14 67 220
15/410 Cuttings 1503-1506 Abu Roash "A" 0.90 45.09 0.12 0.69 1.96 427 0.14 76 218
15/411 Cuttings 1512-1515 Abu Roash "A" 0.97 45.36 0.14 0.82 2.18 428 0.15 84 225
15/412 Cuttings 1521-1524 Abu Roash "A" 0.88 55.87 0.13 0.70 2.08 429 0.15 80 236
15/413 Cuttings 1530-1533 Abu Roash "A" 1.19 42.55 0.13 0.73 2.63 425 0.15 61 220
15/414 Cuttings 1539-1542 Abu Roash "A" 1.21 48.71 1.19 0.12 0.81 2.61 426 0.13 67 216
15/415 Cuttings 1548-1551 Abu Roash "B" 0.81 66.55 0.86 0.17 1.06 1.85 432 0.13 131 228
15/416 Cuttings 1557-1560 Abu Roash "B" 0.78 67.38 0.16 0.93 1.94 432 0.15
15/417 Cuttings 1566-1569 Abu Roash "B" 0.78 90.01 0.39 1.62 1.79 430 0.20 209 230
15/418 Cuttings 1575-1578 Abu Roash "B" 0.96 78.78 0.66 0.45 2.12 2.19 430 0.18 222 229
15/419 Cuttings 1587-1590 Abu Roash "B" 0.78 90.30 0.33 1.48 2.04 431 0.18 189 261
15/420 Cuttings 1593-1596 Abu Roash "B" 0.80 92.55 0.36 0.71 2.34 1.94 428 0.23 294 244
15/421 Cuttings 1602-1605 Abu Roash "B" 0.85 74.73 0.17 0.91 2.06 430 0.16 107 244
15/422 Cuttings 1611-1614 Abu Roash "B" 1.06 81.21 0.94 0.20 1.25 2.35 433 0.14 118 222
15/423 Cuttings 1620-1623 Abu Roash "B" 0.79 73.70 0.14 0.90 2.42 431 0.14 114 306
15/424 Cuttings 1629-1632 Abu Roash "B" 0.78 87.08 0.22 0.95 2.53 430 0.19 121 324
15/425 Cuttings 1638-1641 Abu Roash "C" 1.01 50.31 0.13 0.80 2.28 430 0.14 79 226
15/426 Cuttings 1647-1650 Abu Roash "C" 1.36 29.53 1.52 0.15 0.89 2.92 428 0.14 66 214
15/427 Cuttings 1656-1659 Abu Roash "C" 1.24 23.69 1.54 0.13 0.86 2.81 427 0.14 69 226
15/483 Core 1670 Abu Roash "C" 0.37 12.39 0.73 0.45 0.64 0.45 0.41
15/484 Core 1671 Abu Roash "C" 0.27 1.47 0.11 0.34 0.40 426 0.23 129 149
15/428 Cuttings 1674-1675 Abu Roash "C" 1.20 21.62 0.15 0.79 2.50 427 0.16 65 208
15/486 Core 1678 Abu Roash "C" 0.73 0.69 0.21 0.81 0.22 426 0.21 111 31
15/429 Cuttings 1692-1695 Abu Roash "C" 1.75 22.71 0.12 0.87 2.51 428 0.13 50 144
15/430 Cuttings 1701-1704 Abu Roash "D" 0.96 68.63 0.16 0.87 2.00 433 0.15 91 209
15/431 Cuttings 1710-1713 Abu Roash "D" 1.03 52.81 1.01 0.15 1.04 2.05 433 0.13 101 199
15/432 Cuttings 1719-1722 Abu Roash "D" 0.79 59.33 0.13 0.76 1.95 431 0.15 95 246
15/433 Cuttings 1728-1731 Abu Roash "D" 0.89 52.16 0.12 0.72 1.81 432 0.14 81 202
15/434 Cuttings 1737-1740 Abu Roash "D" 0.99 56.51 0.10 0.80 1.95 433 0.12 80 196
15/435 Cuttings 1746-1749 Abu Roash "D" 0.77 60.39 0.12 0.92 1.95 433 0.12 120 254
15/436 Cuttings 1755-1758 Abu Roash "D" 0.74 77.47 0.16 0.94 1.69 434 0.15 127 228
15/437 Cuttings 1764-1767 Abu Roash "D" 0.90 63.49 0.14 0.93 1.90 433 0.13 103 212
15/487 Core 1771 Abu Roash "D" 0.53 1.12 0.06 0.27 0.88 0.35 433 0.24 167 66
15/488 Core 1772 Abu Roash "D" 0.32 96.08 0.12 0.38 0.63 433 0.24 119 198
15/438 Cuttings 1773-1774 Abu Roash "D" 1.21 34.73 1.31 0.15 1.03 1.79 431 0.13 85 148

66
Table 3-1 Continued (* (mg HC/gRock), ** (mg CO2/gRock), *** (mgHC/gTOC), **** (mgCO2/gTOC))
Sample No.
Sample type
Depth Rock Unit TOC CaCO3 TS S1 S2 S3 Tmax PI HI OI
(m) (%) (%) (%) * * ** °C *** ****
15/490 Core 1777 Abu Roash "D" 0.32 112.0
0 0.15 0.50 0.26 432 0.23 157 81
15/491 Core 1781 Abu Roash "D" 1.37 110.5
0 5.94 12.18 0.44 0.33 887 32
15/439 Cuttings 1782-1783 Abu Roash "D" 1.70 20.26 0.09 0.84 1.95 432 0.10 49 114
15/492 Core 1785 Abu Roash "D" 1.19 113.9
9 5.82 5.24 0.33 0.53 442 28
15/493 Core 1787 Abu Roash "D" 1.57 110.3
1 5.82 7.03 0.62 0.45 447 39
15/440 Cuttings 1803-1806 Abu Roash "D" 0.88 39.49 0.09 1.02 2.26 436 0.08 116 255
15/441 Cuttings 1812-1815 Abu Roash "D" 1.06 54.12 0.13 1.21 2.20 433 0.09 115 208
15/442 Cuttings 1821-1824 Abu Roash "E" 1.26 39.23 0.11 1.07 2.36 434 0.09 85 187
15/443 Cuttings 1830-1833 Abu Roash "E" 1.41 27.32 1.75 0.12 1.03 2.81 431 0.11 73 199
15/444 Cuttings 1839-1842 Abu Roash "E" 1.39 14.94 0.09 0.83 2.85 433 0.09
15/445 Cuttings 1848-1851 Abu Roash "E" 1.32 5.74 0.96 0.10 0.91 2.46 435 0.10 69 186
15/446 Cuttings 1857-1860 Abu Roash "E" 1.25 27.55 0.12 0.89 2.13 434 0.12 71 170
15/447 Cuttings 1866-1869 Abu Roash "E" 1.06 25.35 0.09 0.66 2.56 432 0.11
15/448 Cuttings 1875-1878 Abu Roash "E" 1.30 16.24 1.04 0.10 0.79 2.34 434 0.11 60 179
15/449 Cuttings 1884-1887 Abu Roash "E" 1.17 29.91 0.11 0.76 1.84 432 0.13 64 157
15/450 Cuttings 1902-1905 Abu Roash "E" 1.08 32.84 0.87 0.09 0.63 2.13 431 0.12 59 197
15/451 Cuttings 1911-1914 Abu Roash "E" 1.40 11.35 1.34 0.11 0.82 2.90 428 0.12
15/452 Cuttings 1920-1923 Abu Roash "E" 1.46 4.09 1.20 0.17 0.89 2.07 428 0.16 61 142
14/1345 Cuttings 1929-1932 Abu Roash "E" 1.45 6.67 0.13 0.91 2.16 428 0.13 63 149
15/453 Cuttings 1938-1941 Abu Roash "E" 1.54 5.14 1.82 0.11 0.77 2.31 427 0.12 50 150
14/1344 Cuttings 1947-1950 Abu Roash "E" 1.55 9.38 1.65 0.13 1.12 2.44 428 0.10 72 157
15/454 Cuttings 1956-1959 Abu Roash "E" 1.84 18.62 1.44 0.11 0.96 2.27 431 0.10 52 123
15/455 Cuttings 1965-1968 Abu Roash "F" 1.79 30.66 1.26 0.21 2.83 2.27 430 0.07 158 127
15/495 Core 1974 Abu Roash "F" 4.00 100.8
7 0.27 2.43 26.21 1.53 424 0.08 655 38
15/456 Cuttings 1974-1975 Abu Roash "F" 2.82 46.01 1.05 0.36 7.12 2.30 427 0.05 252 81
15/496 Core 1976 Abu Roash "F" 0.32 2.22 0.54 0.10 0.40 0.34 425 127 109
15/497 Core 1977 Abu Roash "F" 0.18 55.87 0.32 0.08 0.33 3.40 166
15/498 Core 1978 Abu Roash "F" 5.87 91.80 1.69 3.11 40.33 1.48 423 0.07 687 25
15/499 Core 1979 Abu Roash "F" 4.37 102.8
2 0.40 2.41 27.13 1.98 421 0.08 621 45
15/457 Cuttings 1983-1986 Abu Roash "F" 3.75 57.65 0.93 1.03 14.33 2.59 421 0.07 382 69
15/458 Cuttings 1995-1998 Abu Roash "G" 1.91 27.00 1.62 0.15 2.25 2.56 428 0.06 118 134
15/459 Cuttings 2004-2007 Abu Roash "G" 1.81 9.55 1.14 0.15 1.87 2.91 431 0.08 103 160
15/460 Cuttings 2015-2018 Abu Roash "G" 1.23 8.20 0.12 0.82 1.89 429 0.13 66 154
15/461 Cuttings 2023-2026 Abu Roash "G" 1.97 9.16 1.38 0.18 1.72 2.71 432 0.09 87 138

67
Table 3-1 Continued (* (mg HC/gRock), ** (mg CO2/gRock), *** (mgHC/gTOC), **** (mgCO2/gTOC))
Sample No.
Sample type
Depth Rock Unit TOC CaCO3 TS S1 S2 S3 Tmax PI HI OI
(m) (%) (%) (%) * * ** °C *** ****
15/462 Cuttings 2043-2047 Abu Roash "G" 1.38 3.21 1.04 0.09 0.89 3.03 430 0.09 65 221
15/463 Cuttings 2061-2063 Abu Roash "G" 1.35 14.21 0.11 0.90 3.10 432 0.11 67 231
15/464 Cuttings 2070-2073 Abu Roash "G" 1.34 28.82 0.36 0.94 2.65 432 0.27 71 199
15/465 Cuttings 2079-2082 Abu Roash "G" 1.07 30.22 0.10 0.83 2.67 432 0.11 78 250
15/466 Cuttings 2088-2091 Abu Roash "G" 1.43 9.88 1.29 0.11 0.88 2.70 429 0.11 61 190
15/467 Cuttings 2097-2100 Abu Roash "G" 1.24 19.62 0.10 0.91 2.60 429 0.10 73 210
15/468 Cuttings 2106-2109 Abu Roash "G" 1.24 26.43 0.11 0.83 2.53 430 0.11 67 205
15/469 Cuttings 2115-2118 Abu Roash "G" 1.28 27.60 0.14 0.85 2.25 430 0.14 66 176
15/470 Cuttings 2124-2127 Abu Roash "G" 1.22 10.95 1.38 0.23 1.99 2.57 432 0.11 164 212
15/471 Cuttings 2133-2136 Abu Roash "G" 1.29 17.07 0.08 0.63 2.34 430 0.11 49 182
15/472 Cuttings 2142-2145 Baharyia 1.63 15.42 0.25 1.38 2.94 431 0.15 85 180
15/473 Cuttings 2151-2154 Baharyia 1.65 9.86 1.12 0.19 1.32 3.14 431 0.13 80 190
15/474 Cuttings 2169-2172 Baharyia 1.35 13.74 0.10 0.82 1.91 428 0.11 61 141
15/475 Cuttings 2178-2181 Baharyia 1.30 8.06 1.32 0.08 0.80 2.18 429 0.10 61 167
15/476 Cuttings 2187-2190 Baharyia 1.18 6.17 0.08 0.89 1.56 436 0.08
15/477 Cuttings 2196-2199 Baharyia 1.95 1.56 0.95 0.23 1.84 2.20 435 0.11
15/478 Cuttings 2205-2208 Baharyia 1.50 1.66 0.17 1.30 1.85 436 0.12 86 123
15/479 Cuttings 2214-2217 Baharyia 1.56 2.69 0.16 1.50 2.61 434 0.09 96 168
15/480 Cuttings 2223-2226 Baharyia 1.22 15.13 1.33 0.16 1.40 2.35 436 0.10 115 193
15/481 Cuttings 2232-2235 Baharyia 1.54 10.42 0.11 1.02 2.30 434 0.10
15/482 Cuttings 2235-2238 Baharyia 1.42 35.27 1.18 0.14 0.99 1.72 434 0.12
3.4.2 Elemental analysis
All samples were assessed for their organic (TOC) and inorganic carbon (TIC) using a
LiquiTOC II (Elementar Analysengeräte GmbH). The method burns the samples in the
presence of oxygen. TOC is recorded at temperatures up to 550 °C and TIC at higher
temperatures up to 1050 °C. CaCO3 in weight percent was calculated utilizing the
equation: CaCO3=TIC*8.333. Note that this calculation could lead to overestimation of
CaCO3 contents (by up to 8%) if dolomite is present instead of calcite which; occurs in
some of the Abu Roash members. One sample (15/497) containing a significant amount
of siderite was treated with hydrochloric acid before analysis. This is because siderite

68
decomposes at lower temperatures than other common carbonate minerals which can
lead to wrong, elevated TOC values.
A total of 42 samples were measured for total sulfur content (TS) using a LECO S200
sulfur analyzer (precision is <5% and detection limit 0.001%). Ten samples were
analyzed for their major elemental composition using energy dispersive x-ray
fluorescence spectrometry (Spectro XLab2000). The analytical technique is described in
Ghassal et al. (2016). The elements Si, Fe, Ti, K, P, Cr were normalized to Al, whereas Mg
and Mn were normalized to Ca and S, respectively.
3.4.3 Rock-Eval pyrolysis
All samples were measured using a Rock-Eval 6 Pyrolyzer. The analytical and
interpretation methods are described in Espitalié et al. (1985) and Peters (1986). For
each sample, an aliquot of 100 mg of pulverized rock was used. In the absence of oxygen,
the samples are heated first to 300°C (held for 3 minutes) and then to 650°C at a heating
rate of 25°C/minute. Released hydrocarbons are detected and quantified at a flame
ionization detector (FID). The first peak (S1, 300 °C) represents the thermovaporized
hydrocarbons whereas the second peak (S2) represents the thermally cracked
hydrocarbons. During the pyrolysis part of the released gas is trapped and later released.
On this gas, carbon dioxide is quantified at an infrared detector (S3). The S1 and S2 peaks
are recorded as mg HC/g rock and the S3 peak as mg CO2/gRock. The temperature at
which the highest S2 yield is reached is called Tmax (temperature of maximum pyrolysis
yield). Other useful parameters are calculated from these parameters. The Hydrogen
Index (HI) is S2/TOC and has the unit of mgHC/gTOC. Conformably Oxygen Index (OI) is
S3/TOC and has the unit of mgCO2/gTOC. Production Index (PI) is S1/(S1+S2). All
pyrograms were carefully checked for contamination and appeared to be clean.
3.4.4 Organic petrology
Four core samples from the Abu Roash “F” Member were examined for vitrinite
reflectance and maceral composition following standard procedures (Taylor et al., 1998).

69
The preparation technique and microscopic equipment used are described in detail in
Sachse et al. (2012).
3.4.5 Molecular organic geochemistry
Solvent extractions of 14 samples were conducted using DIONEX ASE 150 (Thermo
Scientific). The samples were extracted by dichloromethane (DCM). Afterwards, each
extract was fractionated into 6 fractions following the method described by
Schwarzbauer et al. (2000). The fractions roughly represent aliphatic, monoaromatic,
diaromatic, polyaromatic hydrocarbons as well as semi-polars and polar organic
molecules.
A total of 14 aliphatic fractions were analyzed by gas chromatography using a Fisons
Instruments GC 8000 series equipped with a flame ionization detector and with a Zebron
ZB-1 HT Inferno fused silica column (30 m x 0.25 mm i.d.; film thickness 0.25 µm,
Phenomenex®). Each sample was diluted in 50-100 ml of DCM before injection. Only 1 µl
of this solution was injected into a splitless injector at 270 °C and with a splitless time of
60 s. Helium was used as a carrier gas with a gas velocity of 35 cm/s. The temperature
program started at 80 °C, held for 3 minutes; then the temperature increased at a rate of
10 °C/minute to reach 300 °C remaining constant for 20 minutes. The samples were then
analyzed on a Finnigan MAT 95 mass spectrometer connected to a Hewlett Packard
Series II 5890 GC, which was equipped with a similar GC column and carrier gas with a
velocity of 33 cm/s. The GC run started at 80 °C, held for 3 minutes; then the temperature
increased to 310 °C at a rate of 5 °C/minute. The spectrometer was operated in electron
ionization (EI*) mode with an ionization energy of 70 eV and a source temperature of 200
°C. The scanning range was from m/z 35 to 700 in low resolution mode.
3.4.6 Curie Point Pyrolysis-Gas Chromatography-Mass Spectrometry
Six samples from the Abu Roash “F” Member were measured by Curie Point Pyrolysis Gas
Chromatography Mass Spectrometry (CPPyGCMS). An aliquot of approximately 3-10 mg
of powdered rock was collected in hand-made metal crucibles with a Curie Point
temperature of 650 °C. The crucible is inserted in a glass inlet, which is then placed in a

70
CP pyrolyzer (Fischer GSG CPP 1040 PSC) and pyrolyzed at 650 °C for 10s. The pyrolyzer
was coupled to a GC-MS system (Fisons GC 8000; Thermoquest MD 800). It was equipped
with a 30 m non-polar GC capillary column (Zebron ZB-5, 0.25 mm I.D., 0.25 µm film
thickness). The pyrolysis products were trapped behind the injector using a
cryofocussing trap (−70 °C) prior to GC-MS analysis. The GC-MS analyses were conducted
using He as a carrier gas with a velocity of 35 cm/s. The oven temperature started at 40
°C, held for 3 minutes and then increased at a rate of 3 °C/minute to reach 310 °C to be
held for 20 minutes. Molecular masses were scanned from m/z 35 to 550.
3.4.7 Molecular geochemical parameters
All biomarker ratios were calculated on the base of peak area integration above baseline
of specific ion chromatograms. Chromatograms of m/z 57 were used for alkanes, 191 for
hopane compounds and 217 for steranes. The studied homologue groups were validated
by their specific molecular ions whereas individual isomers were recognized by their
elution order compared to published data (e.g. Peters et al., 2005).
The calculated biomarker ratio were:
1) pristane/phytane ratio (Pr/Ph),
2) pristane/n-C17 and phytane/n-C18 ratios,
3) Terrestrial to Aquatic ratio (TAR) = n-C27+ n-C29+ n-C31/ n-C15+ n-C17+ n-C18,
4) 22,29,30-trisnorneohopane (Ts)/ 22,29,30-trisnorhopane (Tm), i.e. (Ts/Tm),
5) 17a(H),21b(H)-30-norhopane/ 17a(H),21b(H)-hopane, i.e. C29/C30 Hop,
6) 17a(H),21b(H)-29-homohopane (22R)/ 17a(H),21b(H)-hopane, i.e. C31R/C30Hop,
7) C29 ββ/(αα+ββ) steranes,
8) C29 ααα20S/(20S+20R) steranes and

71
9) total steranes/total hopanes (str/hop) ratios.
As a proxy for the organic sulfur content, the thiophene/benzene ratio was calculated
from CPPyGCMS results. The thiophene derivatives selected in the equation are:
methylthiophenes (2 isomers, m/z 98), dimethylthiophenes (4 isomers, m/z 112) and
trimethylthiophenes (3 isomers, m/z 126). The benzene derivatives utilized in the
equation consisted of: toluene (m/z 92), xylenes (3 isomers, m/z 106) and
trimethylbenzenes (2 isomers, m/z 120). The ratio was first introduced by Ghassal et al.
(2016).
3.4.8 Palynology and palynofacies
Ten core and 10 cutting samples were investigated palynologically from the Bahariya
Formation (3 cutting samples), Abu Roash “G” (1 cutting sample), Abu Roash “F” (3 core
and 1 cutting samples), Abu Roash “E” (2 cutting samples), Abu Roash “D” (3 core
samples), Abu Roash “C” (4 core samples) and Abu Roash “A” (3 cutting samples). An
aliquot of approximately 15–20 g of each sample was prepared for the analysis following
the standard extraction techniques including HCl–HF treatment (e.g. El Atfy et al., 2014).
3.5 Results
3.5.1 Elemental analysis
The Bahariya Formation shows a low fluctuation in TOC with an average of 1.4 %. It has
low CaCO3 contents not exceeding 10% except for the bottom sample (Fig. 3-3) and is
characterized by a moderate TS average of 1.2 %. The Abu Roash “G” Member nearly
shares the same TOC and TS values, but has partly higher CaCO3 contents that range from
3 to 30 % (Table 3-1; Fig.3-3). The overlying Abu Roash “F” Member is most enriched in
TOC among the studied units with an average value of 3.7 %. It reveals a significant
oscillation in CaCO3 contents that range from 1 to almost 100 %. The samples show TS
average values of 0.8 % with high variability (Fig. 3-3). The XRF analyses cover the Abu
Roash “F” Member and the contacts to the adjacent members (Table 3-2; Fig. 3-4). The
Si/Al, Fe/Al, Ti/Al, K/Al, P/Al and Mg/Ca values are low to moderate at the base of the

72
Abu Roash “F” interval. In particular Si/Al, K/Al and Mg/Ca increase above (regressional
phase in Fig. 3-4) then decreasing above to moderate values.
The Si/Al ratio points to a variation of the silicate (clay, feldspar) to quartz ratio. On the
other hand, K/Al ratio is used to indicate clay mineral composition (Weaver, 1989;
Niebuhr, 2005) where high values denote illite enrichment and consequently an arid and
warm climate and low values indicate kaolinite/smectite assemblages related to a
humid/semi-arid warm climate (Aquit et al., 2016, Niebuhr, 2005). Here, absence of
feldspar minerals are assumed due to the expected negligible contents compared to clay
minerals in the evaluated marine marlstone/shale. However, this can be determined using X-
Ray diffraction or petrographic microscopy methods which have not been conducted in this
study due to the limited sample amount and the small grain size.
Fig. 3-3 Total organic carbon (TOC), CaCO3, Total sulfur (TS) and Rock-Eval data versus depth, Bahariya and Abu Roash formations, GPT-3 well, north Western Desert, Egypt. The Abu Roash “F” source rocks are classified as Transgression phases I and II. * CaCO3 is calculated from total inorganic carbon.
0 1 2 3 4 5 6
TOC (%)
0 1 2 3
TS (%)
0 50 100
CaCO3 (%)*
0 400 800
HI (mgHC/gTOC)
420 430 440
T-max (°C)
0.0 0.5 1.0
PI
1400
1600
1800
2000
2200
Dep
th (
m)
Phase
Reservoir
Transgression phase-II
Regression phase
Transgression phase-I
Rock Unit
Abu Roash "A"
Abu Roash "B"
Abu Roash "C"
Abu Roash "D"
Abu Roash "E"
Abu Roash "F"
Abu Roash "G"
Baharyia

73
Fig. 3-4 XRF elemental data of the Abu Roash “F” Member, GPT-3 well, north Western Desert, Egypt.

74
Table 3-2 Elemental data of selected samples using XRF analysis from the Abu Roash “F”, “E” and “G” members, GPT-3 well, north Western Desert, Egypt.
Sample No. Formation Depositional Phase Si/Al Fe/Al Ti/Al K/Al P/Al Cr/Al Mg/Ca Mn/S
14/1344 Abu Roash "E" 2.34 0.60 0.06 0.10 0.01 0.001 0.13 0.07
15/455 Abu Roash "F" Transgression phase-II 2.52 0.54 0.06 0.14 0.02 0.001 0.04 0.07
15/495 Abu Roash "F" Transgression phase-II 1.43 0.44 0.01 0.00 0.03 0.002 0.00 0.78
15/456 Abu Roash "F" Transgression phase-II 2.48 0.53 0.05 0.09 0.03 0.002 0.03 0.41
15/496 Abu Roash "F" Regression phase 3.08 0.44 0.18 0.11 0.06 0.002 0.26 0.37
15/497 Abu Roash "F" Regression phase 2.19 7.89 0.08 0.08 0.05 0.002 0.87 19.46
15/498 Abu Roash "F" Transgression phase-I 1.23 0.97 0.01 0.00 0.03 0.002 0.00 0.01
15/499 Abu Roash "F" Transgression phase-I 0.56 0.08 0.00 0.00 0.05 0.001 0.00 0.71
15/459 Abu Roash "G" 2.83 0.66 0.06 0.11 0.02 0.002 0.12 0.15
15/460 Abu Roash "G" 2.72 0.52 0.06 0.11 0.01 0.001 0.13 0.04
The K/Al ratio is plotted against Si/Al ratio and CaCO3 (Fig. 3-5). The samples from the
Abu Roash F-G members show generally low K/Al ratio (<0.15) yet two groups were
identified. The first group is rich in CaCO3 and poor in K/Al and Si/Al and the second
group is moderate to poor in CaCO3 and shows higher K/Al and Si/Al ratios.
Figure 3-6 is a ternary diagram of SiO2-Al2O3-CaO utilized to determine shale/marlstone
composition presuming that shale is composed predominantly of quartz, clay minerals
and carbonate (Brumsack, 1988). To separate the data points in the plot, the CaO and
Al2O3 values were multiplied by factors of 2 and 5, respectively. The samples generally
follow the average marine shale trend (Wedepol, 1970) with variable carbonate contents
except for few samples.
The Fe-TOC-TS ternary diagram (Fig. 3-7) is used to interpret the depositional
environment conditions. Samples that plot along the pyrite line (TS/Fe =1.5) indicate that
almost all S is fixed in pyrite. Samples plotting below the line indicate the presence of
other forms of sulfur (e.g. organic sulfur) and samples that plot above the line indicate Fe
bearing minerals in addition to pyrite (Dean and Arthur, 1989). Samples from the basal
part of the Abu Roash “F” plot along the pyrite line unlike the other samples that show
lower TS/Fe ratios.

75
Fig. 3-5 K/Al ratio versus (a) Si/Al ratio and (b) CaCO3 of selected samples from the Abu Roash “E”, “F” and “G” members, GPT-3 well, north Western Desert, Egypt showing possible depositional environment, climate and clay mineral composition.
Fig. 3-6 SiO2-5*Al2O3-2*Ca ternary diagram demonstrating lithological differences among the Abu Roash “E”, “F” and “G” samples, GPT-3 well, north Western Desert, Egypt.
TOC values in the Abu Roash “E” – “A” members are moderate except for a few samples
at the bottom of the “D” Member, which are oil-stained cores (Table 3-1). The TS average
values increase again in the Abu Roash “E” (1.3 %) and similarly in the Abu Roash “C” (1.3
%) and “A” (1.2 %) members while being lower in the Abu Roash “D” (0.8 %) and “B” (0.7
%) members (Table 3-1, Fig. 3-3).

76
Fig. 3-7 Total organic carbon-iron-total sulfur ternary diagram of selected samples from Abu Roash “G”, “F” and “E” members, GPT-3 well, north Western Desert, Egypt.
The carbonate content shows significant fluctuation between almost 0 and almost 100
%, which are most probably related to palaeoenvironmental conditions, i.e. climate
and/or transgressional/regressional cycles with carbonate-rich Abu Roash “D” and “B”
members possibly representing sea level highstands and warm climate.
Interestingly, the Abu Roash “F” Member shows a positive relation between TOC and
carbonate, whereas all other units display generally a decrease in TOC with increasing
carbonate content (Fig. 3-8). Similarly, the Abu Roash “F” Member shows a different
trend as compared to the other rock units with respect to the TS versus TOC relationship
(Fig.3-9).
3.5.2 Rock-Eval pyrolysis
The Abu Roash “F” Member shows the highest S1 and S2 values ranging from 0.08 to 3.11
mgHC/gRock and 0.33 to 40.33 mgHC/gRock, respectively (Table 3-1). This member also
shows high though variable HI values that reach 687 mgHC/gTOC and OI ranges from 25
to 127 mgCO2/gTOC (Fig. 3-10).

77
Fig. 3-8 CaCO3 versus total organic carbon (TOC), GPT-3 well, showing two distinctive trends. The samples of Abu Roash “F” have a positive trend, whereas samples from other rock units denote a weak negative relation.
Fig. 3-9 Total sulfur (TS) versus total organic carbon (TOC) showing the difference between the Abu Roash “F” Member and other studied rock units. The samples are classified into three groups which are 1) Abu Roash “F” Member Transgression-1:, 2) Abu Roash “F” Member Transgression-2: and 3) oxic/suboxic shelf: the samples from the rest of the geological units. Value%: CaCO3 calculated from total inorganic carbon.

78
The Tmax is relatively low and averages 424 °C (Fig. 3-3). This data is indicative of a high
quality petroleum source rock at low thermal maturity level. The quality is much lower
in the other rock units (Fig. 3-10). PI was used to distinguish between reservoir and non-
reservoir samples. Three oil-stained core samples in the Abu Roash “D” Member show PI
values higher than 0.30 (Fig. 3-3), and also other parts of the Abu Roash B-D sequence
show abnormally high PI values (in view of the low thermal maturity) indicating oil
staining. Pyrograms of oil-stained samples (Fig. 3-11) indicate that part of the S2 peak in
these samples is also due to oil staining.
Fig. 3-10 Pseudo van Krevelen diagram of the studied rock units, GPT-3 well, north Western Desert, Egypt. Note that the high HI readings from the Abu Roash “D” samples are from a reservoir section.

79
Fig. 3-11 Rock-Eval pyrograms and gas chromatograms of the Abu Roash “C” and “D” reservoirs as well as Abu Roash “F” source rock sections, GPT-3 well, north Western Desert, Egypt.
3.5.3 Organic petrography
Vitrinite reflectance was measured on three core samples from the Abu Roash “F”
Member; one additional sample contained no vitrinite. The samples show values between
0.42- 0.43% within the depth interval from 1974 to 1979 m (Fig. 3-12). The vitrinite

80
particles are rare and small in size. Under fluorescent light the samples show a
dominance of liptinite in two different forms: Liptodetrinite (granular, often with a
diameter <5 µm) and lamalginite (elongated, often with a diameter >5 µm) with virtual
absence of telalginite (well preserved large algal particles; Taylor et al., 1998; Fig. 3-9).
Furthermore, they show strong yellowish fluorescent background implying presence of
submicroscopic organic matter within the mineral ground mass. The samples also
contain larger foraminifera (~25 µm) in fair abundance. One additional sample
representing a siderite layer (15/497) shows no organic matter (Fig. 3-12).
Fig. 3-12 Organic petrography of the Abu
Rash “F” samples under fluorescent light,
GPT-3 well, north Western Desert, Egypt.

81
3.5.4 Molecular organic geochemistry
The majority of the analyzed samples range in Pr/Ph ratio from 0.8 to 1.1 with few
exceptions (Table 3-3). Representative chromatograms of reservoir and source rock
sections are shown in Fig. 3-11. The Bahariya Formation sample shows a bi-modal n-
alkane distribution whereas the Abu Roash “G” sample shows abundant n-C15 to n-C20
alkanes with fair presence of long-chain n-alkanes up to n-C33. The Abu Roash “F” and “E”
samples show a similar distribution. From the Abu Roash “D” Member three oil-stained
cores and one cutting sample were investigated. The three core samples are believed to
be from a reservoir section as they have high PI values based on Rock-Eval analysis
(Table 1, Fig. 3-3). These samples show low concentrations of n-alkanes < n-C21 with a
gradual increase in long-chained n-alkanes abundance towards the deeper samples. The
cutting sample (sample no. 15/431; depth 1710 m) shows a different distribution with
the most abundant alkanes found between n-C14 and n-C24. One Abu Roash “C” sample
was retrieved from a reservoir section showing a bi-modal n-alkane distribution with
high concentration of long-chain n-alkanes. The second sample is believed to originate
from a non-reservoir section illustrating predominance of n-C16 to n-C20 with fair
presence of long-chained n-alkanes up to n-C30. The Abu Roash “B” and “A” samples show
a predominance of short-chain n-alkanes between n-C16 and n-C20.
The Terrestrial to Aquatic Ratio (TAR) discriminates the Abu Rash “F” Member from the
other samples that show higher values. Similarly, the Abu Rosh “F” samples have a higher
str/hop ratio as compared to the low values of samples from the other members (Fig. 3-
13).
Generally, all samples demonstrate similar C27, C28 and C29 sterane compositions with the
exception of the two samples from the Abu Roash “D” Member and Bahariya Formation.
Both show slightly higher abundance of C27 steranes (Fig. 3-14). Samples from the Abu
Roash “F” Member show low C29 ββ/(αα+ββ) steranes ratios compared to the other rock
units that range from 0.24 to 0.28, whereas the oil-stained core samples from the Abu
Roash “D” Member show the highest values from 0.54 to 0.55.

82
A similar trend is observed for the C29 ααα20S/(20S+20R) steranes ratio with the
exception of the Abu Roash “C” sample that shows a high value (Fig.3-15). The Ts/Tm
ratio varies strongly between 0.24 and 2.16. The Bahariya and Abu Roash “F” source rock
members show lowest values. The C31R/C30 Hop ratio decreases slightly towards the
younger section but the values are always above 0.25 (Table 3-3). The biomarker
maturity parameters support the information derived from the Tmax values that denote
lower values for the Abu Roash “F” samples than the other rock units (Fig.3-3).
Fig. 3-13 a) Total organic carbon (TOC) versus terrestrial to aquatic ratio (TAR). b) Pristane/phytane ratio versus steranes/hopanes ratio (str/hop), GPT-3 well, north Western Desert, Egypt.

83
Table 3-3 Biomarker data of selected samples from the Bahariya and Abu Roash formations, GPT-3 well, north Western Desert, Egypt.
Sample Formation Sample Type Pr/Ph Pr/C17 Ph/C18 TAR Ts/Tm C29/C30 Hop C31R/C30Hop str/hop
15/400 Abu Roash "A" Source Rock 1.10 0.61 0.82 0.15 1.37 0.80 0.40 0.32
15/418 Abu Roash "B" Source Rock 0.98 2.09 1.83 1.29 0.71 0.31 0.33
15/426 Abu Roash "C" Source Rock 0.70 0.71 1.04 0.11 1.73 0.92 0.45 0.22
15/483 Abu Roash "C" Reservoir 1.37 1.66 1.40 0.51 0.76 0.34 0.32
15/431 Abu Roash "D" Source Rock 1.00 1.34 1.26 0.25 0.64 1.05 0.47 0.25
15/491 Abu Roash "D" Reservoir 0.89 1.60 1.78 0.80 1.05 0.26 0.42
15/492 Abu Roash "D" Reservoir 0.82 1.18 0.71 0.53 0.99 0.32 0.27
15/493 Abu Roash "D" Reservoir 1.12 1.56 1.74 1.02 0.79 0.33 0.23
15/445 Abu Roash "E" Source Rock 1.41 1.32 1.50 0.32 0.24 0.86 0.33 0.17
15/495 Abu Roash "F" Source Rock 1.24 1.72 1.38 0.01 0.27 0.96 0.39 0.72
15/498 Abu Roash "F" Source Rock 0.97 1.30 1.35 0.10 0.30 1.04 0.45 0.74
15/499 Abu Roash "F" Source Rock 1.15 1.06 0.97 0.02 0.30 1.07 0.38 1.00
15/462 Abu Roash "G" Source Rock 1.28 1.37 1.48 0.23 2.16 1.13 0.39 0.20
15/480 Baharyia Source Rock 1.79 1.24 1.07 0.14 0.33 1.34 0.29 0.16

84
Fig. 3-14 C27, C28 and C29 steranes ternary diagram of selected samples from the Bahariya and Abu Roash formations, GPT-3 well, north Western Desert, Egypt.
Fig. 3-15 C29 ββ/(αα+ββ) steranes versus C29 ααα20S/(20S+20R) steranes indicating maturity in the studied rock units, GPT-3 well, north Western Desert, Egypt. Please refer to Table 4 for sample assignment.
0
10
20
30
40
50
60
70
80
90
100
C28
ste
ran
es (%
)
0102030405060708090100
C27 steranes (%)
0
10
20
30
40
50
60
70
80
90
100
C29 steran
es (%)
Plankton and algae
Open Marine
Shallow marine or coastal
Deltaic-terrigenous
Tertiary coals
Uncommon
Geological Unites
Abu Roash "A"
Abu Roash "B"
Abu Roash "C"
Abu Roash "D"
Abu Roash "E"
Abu Roash "F"
Abu Roash "G"
Baharyia

85
3.5.5 CPPyGCMS
The samples from the basal Abu Roash “F” Member are characterized by a high
concentration of thiophene and light n-alkane compounds. Conversely, the upper
samples are enriched in n-alkane and benzene compounds and relatively poor in
thiophenes (Fig. 3-16). The thiophene/benzene ratio is highly variable within the Abu
Roash “F” source rocks (Table 3-4). Values are quite high at the base (transgression phase
I) and much lower in the samples above, indicating the presence of more organic sulfur
in the deeper and older samples of this member (Fig. 3-17). These samples are also
characterized by high carbonate contents (Table 3-1).
Fig. 3-16 Curie-Point-Pyrolysis Gas Chromatography-Mass Spectrometry Chromatograms of representative samples from the Abu Roash “F” Member indicating a high organic sulfur contents in transgression phase-I, Abu Rash “F” Member, GPT-3 well, north Western Desert, Egypt.

86
Fig. 3-17 Ali-Be-T ternary diagram (alaphitic- hydrocarbonsn-C6 to n-C14-Benzenes-Thiophenes) based on Curie-Point-Pyrolysis-Gas-chromatography-mass-spectrometer data of selected samples from the Abu Roash “F” source rocks, GPT-3 well, north Western Desert, Egypt.
Table 3-4 Curie Point Pyrolysis Gas chromatography mass spectrometry data of selected samples from The Abu Roash “F” Member, GPT-3 well, north Western Desert, Egypt.
Sample Deposional Phase Depth Thiophenes/Benzenes Thiophenes Benzenes n-C6 to n-C14
(m) (%) (%) (%)
15/455 Transgression phase-II 1965 14.14 24.51 61.34
15/496 Regression phase 1975 0.17 12.52 27.63 59.85
15/497 Regression phase 1977 0.02
15/498 Transgression phase-I 1978 3.58 48.55 5.47 45.98
15/499 Transgression phase-I 1979 1.44 13.51 9.40 77.09
15/457 Transgression phase-I 1983 0.55 48.94 18.65 32.41

87
3.5.6 Palynology and palynofacies analysis
The distribution of palynofacies particles is summarized in Table 3-5 and Figure 3-18.
The Bahariya Formation palynomorphs are mostly terrestrial except for a minor marine
contribution of dinocysts and microforaminiferal linings. The recorded pollen and spore
taxa include Classopollis brasiliensis, Integritetradites porosus, Cretacaeiporites
densimurus, Afropollis jardinus, Afropollis kahramanensis, Crybelosporites pannuceus and
Ephedripites spp. and a single record of the megaspore Ariadnaesporites. Marine
palynomorphs include dinocysts such as Subtilisphaera spp., Florentinia spp.,
Clesitosphaeridium spp., Circulodinium distinctum, Cribroperidinium sp., Dinopterygium
cladoides and Cribroperidinium spp. in addition to microforaminiferal linings. Freshwater
algae are represented by Pediastrum and Botryococcus. A single specimen of scolecodonts
in sample 15/474 was recorded.
Table 3-5 Palynofacies data of selected samples from the Bahariya and Abu Roash formations. AOM: amorphous organic matter.
Sample No.
Rock Unit Depth (m) AOM (%) Phytoclasts (%) Palynomorphs (%)
15/400 Abu Roash "A" 1413 60 30 10
15/409 Abu Roash "A" 1494 95 4 1
15/413 Abu Roash "A" 1530 94 5 1
15/483 Abu Roash "C" 1670 33 77 0
15/484 Abu Roash "C" 1671 30 78 2
15/428 Abu Roash "C" 1672 31 77 2
15/486 Abu Roash "C" 1675 0 90 10
15/487 Abu Roash "D" 1771 8 85 7
15/488 Abu Roash "D" 1772 80 5 15
15/489 Abu Roash "D" 1776 20 75 5
15/443 Abu Roash "E" 1830 45 40 5
15/446 Abu Roash "E" 1956 88 9 3
15/495 Abu Roash "F" 1973 30 60 10
15/496 Abu Roash "F" 1976 5 85 10
15/497 Abu Roash "F" 1977 0 80 20
15/457 Abu Roash "F" 1983 94 4 2
15/465 Abu Roash "G" 2089 0 90 10
15/472 Bahariya 2142 60 45 5
15/474 Bahariya 2169 80 18 2
15/482 Bahariya 2232 79 19 2

88
The Abu Roash “G” Member was palynologically investigated in one sample. Phytoclasts
are mainly lath-shaped woods, tracheids and cuticles. Similar to the Bahariya Formation,
palynomorphs are mostly terrestrial except for a minor marine contribution. The
recorded taxa are dominated by Afropollis and some trilete spores such as Crybelosporites
pannuceus and Cicatricosisporites spp. In addition, taxa like Afropollis jardinus, Afropollis
kahramanensis, Retimonocolpites variplicatus, Retimonocolpites spp., Dichastopollenites
dunveganensis, Monocolpopollenites spp., Inaperturopollenites spp., Ephedripites spp. and
a single record of the megaspore Ariadnaesporites are reported.
Fig. 3-18 APP ternary plot (Tyson, 1993) of selected samples from the Bahariya and Abu Roash formations, GPT-3 well, north Western Desert, Egypt.
The Abu Roash “F” Member was studied palynologically based on 4 samples (Table 3-5).
The sample from the basal part (transgression phase-I) is dominated by amorphous
organic matter (AOM) that is fine granular, yellow to gray marine amorphous masses,

89
presumably of algal or cyanobacterial origin. Phytoclasts are mostly opaques from the
middle part (regression phase-I) with some visible cuticles, wood and tracheid particles.
Palynomorphs are the most diversified group and contain mainly marine elements
diluted in some intervals with non-marine counterparts. Palynomorphs retrieved from
basal part (15/457) are composed exclusively of smooth, baggy-form leiospherids. On
the other hand, the siderite rich sample (15/497) contains miscellaneous palynomorphs
such as microforaminiferal linings, fungal palynomorphs and Cholorophyceaen algae
including Pediastrum and Botryococcus, in addition to Reyrea polymorpha (Incertae
sedis). Spore taxa are represented mainly by trilete spores such as Crybelosporites
pannuceus. Gymnosperm pollens include Araucariacites australis, Inaperturopollenites
spp., Ephedripites jansonii, Ephedripites spp. and Eucommiidites troedsonii. Angiosperms
comprise Droseridites senonicus, Afropollis spp. Foveotricolpites giganteus,
Foveotricolpites gigantoreticulatus, Tetracolpites sp., Tricolpites spp., Proteacidites sp. and
Cretacaeiporites polygonalis. Marine palynomorphs are Michrystridium (acritarchs) and
dinocysts Coronifera albertii, Florentinia spp., Spiniferites ramosus multibrevis,
Spiniferites spp. and some other unidentified forms. The overlying sample (15/496)
contains rare non-marine palynomorphs (trilete spores, gymnosperms such as
Ephedripites spp. and Eucommiidites troedsonii and some angiosperms). Marine elements
are microforaminiferal linings, acritarchs (Michrystridium) and dinocysts assigned to
Circulodinium distinctum, Coronifera albertii, Spiniferites ramosus multibrevis, Spiniferites
spp. and Cribroperidinium spp. In addition, Botryococcus has been also recorded. Finally,
sample 15/495 contains minor non-marine palynomorphs (trilete spores and
Ephedripites spp.). Marine elements are microforaminiferal linings and dinocysts
assigned to Oligosphaeridium pulcherrimum, Spiniferites ramosus multibrevis, Spiniferites
spp., Coronifera albertii, Cribroperidinium spp. and Florentinia spp.
The Abu Roash “E” Member phytoclasts are mainly lath-shaped woods, tracheids and
cuticles. Palynomorphs are mostly terrestrial except for a minor marine dinocysts
contribution. The recorded non-marine taxa are Ephedripites ambiguus, Ephedripites

90
spp., Eucommiidites spp., Retimonocolpites spp. and Dichastopollenites ghazalatensis, in
addition to Botryococcus.
The Abu Roash “D” Member phytoclasts are mainly biodegraded and comprise cuticles,
woods including tracheids. The AOM including resin are sheet-like and of pale gray color
and strongly invaded by pyrite. Palynomorphs are mostly marine except for sample
15/487, which contains some trilete spores (as Leptolepidites psarosus), Araucariacites
australis, Ephedripites spp., Afropollis, triporate pollen and Reyrea polymorpha in addition
to some fungal palynomorphs. Marine elements include mainly microforaminiferal
linings and dinocyst taxa assigned to Cribroperidinium edwardsii, Cribroperidinium spp.,
Trichodinium castanea and Cleistosphaerdium spp.
On the other hand, the Abu Roash “C” Member phytoclasts are composed of cuticles,
woods including tracheids, which are predominantly brown and jellified; some of them
are charred and thus opaque. Sample 15/486 is rich in palynomorphs and contains a
diverse group of taxa. These taxa are mainly non-marine palynomorphs including trilete
spores. Gymnosperms include Araucariacites australis and Ephedripites spp. and
angiosperms Afropollis kahramanensis, Stellatopolis, Cretacaeiporites scabratus and
Integritetradites porosus. Moreover, a single record of Botryococcus and a scolecodont
have been reported. The upper three samples are poor in palynomorphs except for
phytoclasts and AOM. Sample 15/484 and 15/486 contain rare dinocysts and a single
specimen of a scolecodont in sample 15/486. Few specimens of Afropollis, Proteacidites
and Ephedripites pollen and spores containing Crybelosporites pannuceus and
Cicatricosisporites spp. are recorded.
The Abu Roash “A” Member palynomorphs are mostly marine except for a minor
terrestrial contribution of spores and pollen. The recorded dinocysts comprise
Dinogymnium, Chattangiella and Subtilisphaera. Sporomorphs include trilete spores and
pollen taxa assigned to Droseridites senonicus, Foveotricolpites giganteus, Foveotricolpites
gigantoreticulatus, Afropollis spp., Araucariacites australis and Cycadopites spp.
Freshwater algae are represented by a single record of Pediastrum in the sample 15/400.

91
3.6 Discussion
3.6.1 Age assignment
Although the number of Bahariya samples in the studied well is limited, the recorded taxa
(e.g. Afropollis jardinus and Classopollis) are closely similar to previously retrieved
assemblages in the same basin (e.g. GPTSW-7; El Beialy et al., 2010). Hence, the Bahariya
Formation has been palynologically dated as lower to middle Cenomanian (Fig. 3-2).
The Abu Roash Formation shows a low diversity but stratigraphically important taxa are
recorded. These include Droseridites senonicus, which is a key stratigraphic marker taxon
in the Coniacian–Santonian of West Africa (Jardiné and Magloire, 1965; Jan du Chêne et
al., 1978), and Turonian–Santonian of Angola Basin, intertropical Africa and Sudan
(Morgan, 1978; Lawal and Moullade, 1986; Salard-Cheboldaeff, 1990; Kaska, 1989;
Awad, 1994). In southern Egypt, it has been previously reported from the Coniacian–
Santonian of the Aswan area (Sultan, 1985). Subsequently it has been reported from
Turonian–Santonian (Schrank and Ibrahim, 1995; Ibrahim and Abdel-Kireem 1997;
Ibrahim et al., 2009; El Beialy et al., 2010) of the Western Desert, Egypt and from the Gulf
of Suez (El Diasty et al., 2104). Dinogymnium vozzhennikovae was first described from the
Turonian of Siberia (Lentin and Vozzhennikova, 1990). Subsequent records are reported
from the late Turonian of northern and southern hemispheres (Williams et al., 1993;
Schrank and Ibrahim, 1995; El Beialy et al., 2010). In addition, the co/occurrence of
Ephedripites ambiguus–Ephedripites multicostatus–Foveotricolpites giganteus–
Foveotricolpites gigantoreticulatus assemblage zone has been considered as an indication
of early Turonian age as reported from the GPTSW-7 well from the same basin (El Beialy
et al., 2010). Moreover, the presence of A. kahramanensis in the Abu Roash “G” Member
was described for the first time from the early–late Cenomanian of Egypt by Schrank and
Ibrahim (1995) and El Beialy et al. (2010). From the above discussion, it is possible to
date this assemblage from the Abu Roash Formation as middle/upper Cenomanian–
Santonian (Fig. 3-2). The recovered assemblages are closely similar to those described
from the GPTSW-7 well within the same field, and hence follow the zonation scheme of
El Beialy et al. (2010) (Fig. 3-2).

92
3.6.2 Depositional environments
3.6.2.1 Bahariya Formation
The Bahariya Formation shows considerable variation in lithology in the Western Desert
as discussed above. The analyzed section from 2142 to 2238 m has fair TOC, low
carbonate contents and moderate TS values. The relationship between TOC and CaCO3
(Figs. 3-8, 3-9) is typical of shallow marine carbonate-rich environments where organic
carbon content is positively correlated with silicate and negatively with carbonate (Bou
Daher et al., 2015). In such environments, terrestrial-derived nutrients probably enhance
bioproductivity leading to the observed trend. TS/TOC ratios are quite high as compared
to normal marine conditions. This is probably due to migrated and converted
hydrocarbons as can be implied from relatively high PI values for immature source rocks
(>0.1) (Table. 3-1). These TOC versus TS and CaCO3 relationships are similar for all
samples except for the Abu Roash “F” Member that show distinctive trends.
Further information is derived from molecular geochemistry. A representative sample
was selected for biomarker analysis showing a bi-modal n-alkane distribution. Pr/Ph
value is 1.8 indicating suboxic to oxic conditions (Didyk et al. 1978). Moreover, the
relationship between Pr/n-C17 versus Ph/n-C18 can be used to determine the organic
matter type (Peters et al. 2005). Data suggest mixed marine and terrestrial organic
matter in this case (Fig. 3-19). The very low str/hop ratio indicates microbially reworked
terrestrial organic matter (Tissot and Welte, 1984). This is in accordance with
palynological data that emphasize the existence of terrestrial palynomorphs and
fresh/brackish water algae. However, the samples also show high proportions of AOM
relative to phytoclasts and palynomorphs suggesting a somewhat distal setting (Tyson,
1993; Fig. 3-18). This contradicts the geochemical and palynological evidences, although
the AOM is sometimes of terrestrial origin. It is believed that reworked allochthonous
organic matter or degraded marine organic matter can be considered as a source of AOM
and not preserved marine algae. This is possible due to the proximity to the shoreline
and the effect of turbidity currents that can transport terrestrial organic matter and
dilute the autochthonous marine ones. Moreover, the high sedimentation rates and

93
microbial activities at the shallow marine settings increase the oxygen level that
intensifies the organic matter degradation. The low density of the alginite is responsible
for selective transportation (Bustin, 1988). This fits with the elemental and molecular
geochemical interpretation.
The foregoing discussion indicates that the Bahariya Formation was deposited in a
proximal, suboxic to oxic shallow marine to deltaic environment where an admixture of
terrestrial and marine organic matter has occurred. The interpretation agrees with
previously studied sections in the western Abu Gharadig Basin (e.g. El Beialy et al., 2008,
2010; El Atfy, 2011).
Fig. 3-19 Pristane (Pr)/n-C17 versus phytane (Ph)/n-C18 illustrating the organic matter type of selected samples from the studied rock units, GPT-3 well, north Western Desert, Egypt.
3.6.2.2 Abu Roash “G” Member
A period of a regional sea regression characterizes the Abu Roash “G” deposition (Abdel-
Kireem et al., 1996). This explains the enrichment in silicates, the low carbonate contents
and the high content of detrital elements (e.g. Fe, Al, Ti and K) (Fig. 3-4). Variability in
TOC and elemental data are small indicating steady depositional environment conditions.
0.01 0.10 1.00 10.00
Ph/nC18
0.01
0.10
1.00
10.00
Pr/
nC
17
Oxidising
Reducing
Biodegraded/immature
Early mature
Mature
Terrestrial organic matter
Mixed sources
Marine organic matter
TypeReservoirSource Rock
Rock UnitAbu Roash "A"Abu Roash "B"Abu Roash "C"Abu Roash "D"Abu Roash "E"Abu Roash "F"Abu Roash "G"Baharyia

94
The samples are characterized by low to moderate TS and moderate TOC contents, which
follow the oxic/suboxic shelf trend discussed above. The relationships between TOC, Fe
and TS of a representative sample indicate an Fe-enriched environment (Fig. 3-7) of a
shallow marine oxic to suboxic depositional habitat. The sample also has relatively
moderate K/Al indicating an arid warm climate (Fig. 3-5).
One sample was investigated for molecular geochemistry and shows a Pr/Ph ratio of 1.2
indicating suboxic marine conditions (Table 3-3). The moderate TAR value of 0.23
indicates mixed marine and terrestrial organic matter input. Similarly, the Pr/n-C17
versus Ph/n-C18 reveals a mixed marine and terrestrial organic matter origin (Fig. 3-19).
One other sample (15/465) shows a palynofacies assemblage suggesting proximal shelf
deposition as shown in the AAP diagram (Fig. 3-18). No evidence of fresh water incursion
was reported in this well as is the case in the southern part (El Beialy et al., 2010; GPTSW-
7 well; Fig. 3-1a), which would indicate more distal conditions to the north. However,
more samples should be studied to confirm such a regional trend.
3.6.2.3 Abu Roash “F” Member
Due to its importance as source rock, the Abu Roash “F” has been investigated with
additional techniques. First, the member was subdivided based on elemental
composition into three depositional phases which are 1) transgression phase-I (1978-
1986 m), regression phase-I (1976-1977 m) and transgression phase-II (1965-1975 m)
(Fig. 3-4).
Transgression phase-I starts at the bottom of the Abu Roash “F” Member and includes
samples 14/998, 14/499 and 15/457 (8 m thick). This phase, which hosts the CTBE, is
distinguished by high TOC, low TS and detrital elements. Moreover, it is enriched in
carbonate with very low Mg/Ca ratios indicating prevalence of aragonite/calcite. The
studied samples have TOC/TS ratios exceeding 2.8 and are located below the normal
marine line (Berner, 1984; Fig. 9). Moreover, the samples plot along the pyrite line (Fig.
3-7) indicating anoxic conditions and revealing that the system was not rich in surplus
sulfur as the majority of sulfur was apparently fixed in pyrite with fair excess sulfur. Due

95
to the limited Fe availability, excess sulfur was incorporated into kerogen (Fig. 3-17;
Lückge et al., 1996; Ghassal et al., 2016). This is quite common in such carbonate-rich
environments, where the low iron content limits pyrite formation (e.g. Ghassal et al,
2016; Figs. 7, 8). This is in general accordance with the moderate to high
thiophene/benzene ratio implying moderate organic sulfur concentrations (Fig. 17,
Table 4). The sulfur incorporation might destroy the primary morphology of the organic
matter through (vulcanization; Taylor et al., 1998); furthermore conditions for
preservation of otherwise labile (amorphous; unstructured) organic matter were
favorable. The organic petrology data of these samples reveal dominance of marine
alginite kerogen and high proportions of submicroscopic unstructured organic matter
(UOM) indicating good preservation (Fig. 3-12).
This interval also displays low Mn/S ratios indicating anoxic bottom water conditions
(Aquit et al., 2016). The lowest Mn/S ratio within the Abu Roash “F” Member is found at
the top of transgression-I phase indicating most anoxic conditions prior to the advent of
the ensuing regressive phase (Fig. 3-4). On the other hand, P/Al increases strongly
reaching high values in the lower part of this depositional phase. This might indicate
anoxic bottom waters (Calvert et al., 1996). März et al. (2008) suggested that ratios
higher than 0.4 might indicate anoxic, non-sulfidic conditions. Only in the uppermost
sample of the transgression phase-I, the ratio drops to lower values (Fig. 3-4). The
samples show low K/Al and Si/Al ratios inferring dominance of kaolinite and/or smectite
in the silicate mineralogical assemblages associated with the carbonate rich deposits,
which implies a humid warm climate (Fig. 3-5). Similar conclusion can be deduced from
in the SiO2-Al2O3-CaO relationship (Fig. 3-6) indicating variable, partly high carbonate
contents.
Two samples were investigated for biomarker characteristics. Pr/Ph ratios close to 1.0
indicate oxygen-depleted bottom water conditions (Table 3-3). The marine nature of the
samples is supported by the predominance of n-C14 to n-C20 in the extracts indicating
marine organic matter. Moreover, the lower abundance of the longer n-alkane (n-C21+)
might indicate low terrigenous input, which is in accordance with organic petrographic
96
data (Fig. 3-11), although the Pr/n-C17 versus Ph/n-C18 relationship suggests mixed
marine and terrigenous organic matter (Fig. 19). The samples C31R/C30 Hop ratio exceeds
1.0 typical of carbonate lithology, which is obvious from the elemental data. The C27-C29
steranes diagram (Fig. 3-14) indicates an open/shallow marine depositional
environment and palynofacies of one sample at 1983 m confirms a distal suboxic-anoxic
basin (Fig. 3-18; Table 3-5).
A change in the lithology and TOC content is observed for the regression phase (1 m
thick) (Fig. 3-6). The bottom sample is enriched in siderite and shows no visible organic
matter (Fig. 12). The palynofacies investigation reveals dominating opaque phytoclasts
over palynomorphs and no AOM, indicating oxic shelf depositional environment (Fig. 3-
18). This sample contains microforaminiferal linings indicative of a shallow marine
environment in addition to the chlorococcale algae Pediastrum and Botryococcus, which
inhabit fresh/brackish water environments. The sample contains Foveotricolpites
giganteus and Foveotricolpites gigantoreticulatus that have not been evolved prior to the
Turonian. This rather confirms the age assignment and gives some credibility to the
occurrence of a short and rapid sea regressive phase in the Abu Gharadig basin or
probably north Western Desert during the early Turonian. Moreover, the examined
sample (15/497; 1977 m) denotes oxic shelf assemblages based on palynofacies data
(Fig. 3-18). Cyanobacteria rarely outpace identifiable fossilized remains yet they played
a major role during the OAEs (Kuypers et al., 2004). Cyanobacterial blooms can also
promote siderite formation due to riverine input at shallow water (Köhler et al., 2013).
Biotic siderite formation can occur in slightly acidic to neutral (pH ~5-7) and reducing
(Eh<0) conditions, which contradicts earlier interpretations (Sánchez-Román et al.,
2014). Alternatively, siderite might represent a concretion that has formed inside the
sediments during early diagenesis with the iron being sourced from terrigenous input
during regression. More work is needed on other cores from the same stratigraphic
interval to verify these hypotheses, because here only a single sample of this
extraordinary type was present. The overlying sample (15/496; 1976 m) is rich in
detrital elements and of similar palynofacies despite the smaller proportion of AOM. It

97
also contains more marine palynomorphs indicating slight sea level rise yet shallow oxic
water. Both samples show a similar TOC-Fe-TS relationship with Fe-domination
indicating limited sulfate reduction possibly due to freshwater influence and thus limited
sulfate availability (Fig. 3-7). The two samples show relatively high Ti/Al ratio, which
indicate a nearshore environment (Niebuhr, 2005). The K/Al versus Si/Al plot indicates
illite contribution hinting towards a semi-arid to arid warm climate (Aquit et al., 2016,
Niebuhr, 2005).
The last interval in the Abu Roash “F” is transgression phase-II. The TOC increases again
in this interval to reach a maximum at 1974 m, where the carbonate content is close to
100 %. The increase in TOC and CaCO3 is associated with a decrease in the TS values. The
samples show very low thiophenes/benzenes values indicating low sulfur incorporation
into organic matter (Table 4). This reveals a higher contribution of detrital iron (Fig. 3-
7). The more oxic environment as compared to transgression phase-I is reflected in the
lower HI values (Table 1). In addition, samples from transgression phase-II are richer in
phytoclasts than those encountered in phase-I, indicating more oxic conditions. Organic
petrology reveals that the samples are dominated by marine alginite and AOM associated
with foraminifera (Fig. 3-12). The predominance of AOM associated with small
proportions of visible alginite and minor terrestrial organic matter are common
components of upwelling zone sediments (Littke and Sachsenhofer, 1994; Lückge et al.,
1996; Ghassal et al., 2016). A wide range of n-alkanes is present up to n-C33 denoting
mixed marine and terrigenous organic matter. This is supported by the Pr/Ph ratio
reaching up to 1.3. This value is higher than the one observed in samples from
transgression phase-I supporting the above explained differences in bottom water
conditions during deposition.
In summary, Abu Roast F Member represents the best source rock in the study area
which, was deposited during the late Cenomanian and early Turonian. However, as
compared to other CTBE black shales (Kolonic et al. 2002; Ghassal et al., 2016), there is a
significant terrestrial influence and a considerable variability with respect to organic
facies and kerogen characteristics with the best source rocks present at the base. This

98
was probably triggered by a rather shallow marine deposition, where transgressions and
regressions affected lithofacies much stronger than at a deeper setting. Both
transgression phases share the same TOC versus TS and CaCO3 relationship, which are
unique to the Abu Roash “F” Member and completely different from the pattern of all
rocks above and below (Figs. 3-8, 3-9, 3-20).
3.6.2.4 Abu Roash “E” Member
The Abu Roash “E” Member was deposited during a period of sea regression, which was
responsible for shallow marine deposits. In the investigated section, this member is
characterized by relatively low carbonate contents, much silicates and moderate TOC
values. Elemental data reveal presence of illite (based on K/Al ratio) indicating a warm
semi-arid to arid climate upon deposition (Fig. 3-5). Moreover, the samples are relatively
rich in Fe indicating terrestrial input and oxic depositional environment (Fig. 3-7).
A Pr/Ph value of 1.5 indicates a suboxic/oxic environment (Table 3-3) and the C27-C29
steranes and C31R/C30 Hop ratio a marine depositional environment (Table 3: Fig. 3-14).
The C31R/C30 Hop reveals a silicate lithology, which is in agreement with the elemental
analysis. In conclusion, it is evident that the Abu Roash “E” Member was deposited in
shallow suboxic/oxic bottom water conditions.
Four samples were selected for organic geochemistry; three are from an impregnated
reservoir section (PI= 0.3-0.5) (Fig. 3-3). The Pr/n-C17 versus Ph/n-C18 indicates a mixed
marine and terrestrial organic matter (Fig. 3-19). The C31R/C30 Hop of 1.05 also suggests
a carbonate lithology in accordance with elemental data (Table 3-3). The palynological
results suggest shallow marine conditions, based on the occurrence of a mixed marine
and terrestrial palynofacies. Palynofacies is dominated by AOM in carbonates, but
different in the siliciclastics.
3.6.2.6 Abu Roash “C” Member
The Abu Roash “C” Member witnessed a recent oil discovery in the vicinity of the GPT
field but was not reported as a producing reservoir in the study area. The member
includes a sandy section overlain by a more carbonate-rich interval (Fig. 3-2).

99
Fig. 3-20 Generalized depositional model of the Abu Roash “F” Member based on the current geochemical and palynological interpretation.

100
The sandy section shows predominance of terrestrial palynomorphs. The presence of
fresh/brackish water algae Botryococcus and marine scolecodonts indicates a change in
the depositional regime from deeper in the Abu Roash “D” to shallower in the Abu Roash
“C”. In the overlying samples, the palynomorph content decreases with dominant non-
marine phytoclasts associated with fair proportions of AOM. This indicates further
regression and/or increasing terrigenous input. Moreover, the APP ternary diagram
(Tyson, 1993) suggests proximal to marginal shelf settings (Fig. 3-18). The sandy section
is also characterized by low TS and TOC values indicating oxic bottom water conditions.
Biomarker data for the indigenous sample (one other sample contains migrated oil;
PI=0.4) suggests predominance of marine organic matter input (Figs. 3-13a, 3-19) and a
marine depositional environment (Fig. 3-14).
3.6.2.7 Abu Roash “B” Member
High carbonate contents and marginal TOC values characterize the Abu Roash “B”
Member. This member acts as gas reservoir in the GPT field, but there is no information
regarding the reservoir quality in this well. Most samples from this member consist
mainly of carbonate (> 85%) with low TOC and TS giving rise to oxic conditions (Figs. 3-
7, 3-8).
3.6.2.8 Abu Roash “A” Member
The Abu Roash “A” Member was deposited during a transgressive phase (Said, 1990;
Ahmed 2008). It is characterized by fair TOC and CaCO3 contents the latter decreasing
towards the top of the section from 45 % to 26 %. Three samples were opted for
palynofaices assessment. The lower two samples are characterized by distal sub-anoxic
basin palynofacies. This varies in the upper sample to a proximal suboxic-anoxic shelf
assemblage (Fig. 3-18). Furthermore, the upper sample contains freshwater algae
indicating sea regression and an increase of terrigenous input at the end of the Santonian.
This regressive phase could have happened subsequent to the sea transgression that
started earlier during the deposition of the basal part of the Abu Roash “A” Member.

101
Biomarker data indicate mixed terrestrial-marine organic matter and a marine
siliciclastic environment. However, in view of the low TOC values and the tendency of the
members above the Abu Roash “F” source rock to be impregnated by migrated oil,
biomarker data should be treated cautiously.
As noticed, the normal marine ratio defined by Berner (1984) was shifted for all
sediments excluding the Abu Roash “F” Member to higher values (Fig. 3-9). This is
possibly due to migrated hydrocarbons that reacted with pore water sulfate due to
biologically driven sulfate reduction, leading to high sulfide (pyrite) contents. The
migrating hydrocarbons in the section are indicated by continuously elevated PI values,
which are higher than would be expected in thermally immature samples. However, PI
values also depend on type of organic matter.
3.6.3 Source rock potential
Excellent source rocks characterize the Abu Roash “F” Member. Two kerogen types are
distinguished: transgression phase-I is characterized by relatively high
thiophenes/benzenes ratio (1.9-10.8), a maximum TOC of 5.9% and an average HI of 564
mgHC/gTOC indicating type IIS kerogen (Figs. 3-3, 3-10, 3-17). This source rock is
expected to produce high sulfur oil upon expulsion (Fig. 3-17). The second kerogen type
II-III belongs to transgression phase-II which has a low thiophenes/benzenes ratio (0.8),
TOC maximum value of 4.0 % and HI average of 355 mgHC/gTOC. This organofacies is
expected to yield low-sulfur oil (Fig. 3-17). The analyzed source rocks show low thermal
maturity, which is supported by vitrinite reflectance, Tmax values and numerous
biomarker parameters (Fig. 3-3; Table 3). Note that the transgression phase-I has lower
Tmax values compared to the other facies, which is attributed to kerogen type IIS (Pepper
and Corvi, 1995). In general, the source rock section shows thermal maturity retardation
or suppression based on Tmax and other biomarker maturity parameters (Figs. 3-3, 3-
15). The retardation points to lower reaction rates during thermochemical alteration,
possibly due to overpressure effects. Suppression/retardation of specific reactions in
source rocks has been described before and related to high liptinite content or presence

102
of bitumen and hydrogen-rich vitrinite (Carr, 2000). From the data here presented, it is
quite obvious that there is an effect on a variety of different and independent parameters,
leading to lower maturity values, e.g. with respect to Rock-Eval data and various
molecular geochemical parameters that all indicate suppression in the best source rock
interval, the Abu Roash “F” Member, which is characterized by high HI values, high
sterane/hopane ratios and high liptinite contents.
The source rock heterogeneity of the Abu Roash “F” Member makes any oil to source rock
correlation challenging in the Abu Gharadig Basin.
3.6.4 Reservoir geochemistry
Two oil reservoirs are identified in this well, namely the Abu Roash “C” and “D”, which
can be distinguished by PI values above 0.16 (Fig. 3-3). Based on the relationship
between C29 ββ/(αα+ββ) and C29 ααα20S/(20S+20R) steranes (Fig. 3-15), the samples
from the two reservoirs differ in thermal maturity and composition. The Abu Roash “C”
samples have Pr/Ph ratio of 1.3 and C29/C30 Hop value of 0.8 indicating a clastic source
rock. The oil was derived from mixed kerogen Type-II/III based on the Pr/n-C17 versus
Ph/n-C18 (Fig. 3-19).
The Abu Roash “C” residual oil differs from its counterpart in the Abu Roash “D” oil, as
the latter lost its light n-alkanes due to biodegradation or evaporation (Fig. 3-11). The
presence of long-chain n-alkanes increases with depth indicating heavier oil towards the
bottom. The Abu Roash “D” samples have Pr/Ph ranging from 0.8-1.1 indicating a marine
source rock with negligible terrigenous input, i.e. type II kerogen (Table 3-3).
Furthermore, the samples have C29/C30 Hop and C31R/C30 Hop values denoting a marine
siliciclastic source (Table 3-3). These residual oils have a high maturity compared to the
source rocks in the same well (Fig. 3-15), which outlines that they have to come from
deeper lying kitchen areas in central Abu Gharadig Basin of the Western Desert, probably
towards the north (Fig. 3-1).
Two factors make the correlation between the Abu Roash “F” source rock and the studied
residual oils ambiguous. First, the heterogeneity of the source rocks as discussed before

103
and second the biodegradation of the residual oil. Therefore, further detailed
geochemical studies, especially on samples from the more central (deeper) part of the
basin are highly desirable as well as studies on Jurassic source rocks.
3.7 Conclusions
The current study provides new insights on the depositional environmental in the north
Western Desert, Egypt, from the Cenomanian to the Santonian, as well as on the
petroleum source rock potential of the Abu Rash “F” Member and residual oils in the Abu
Rash “C” and “D” members.
Two general bottom water conditions are identified based on TOC, TS and CaCO3
relationships. The samples from the Bahariya and Abu Roash formations with the
exception of the Abu Roash "F" Member have marginal TOC and similar trends in the TOC
versus TS and CaCO3 relationships. Although the samples differ in lithology and
depositional environment, they have been deposited in oxygen-depleted but not anoxic
conditions in rather shallow water. The normal marine ratio defined by Berner (1984)
was shifted for these sediments to higher TS/TOC ratios possibly due to migrated
hydrocarbons that reacted with pore water sulfate due to biologically driven sulfate
reduction, leading to high sulfide (pyrite) contents. The high amount of migrating
hydrocarbons in the section is proven by continuously quite high PI values, which are
much higher than would be expected in view of the low thermal maturity.
In contrast to the rest of the sediments, the Abu Roash “F” Member shows a positive
relation between TOC and CaCO3 as well as TS. It represents a period of anoxic or strongly
oxygen-depleted bottom waters with enhanced preservation of organic matter, which is
reflected in high HI values. Three depositional phases have been identified as follows:
1- Transgression phase-I: It is characterized by anoxic bottom water conditions,
leading to sediments that are rich in TOC, carbonate and S and partly poor in Fe
and other detrital elements. This favored sulfur incorporation into organic matter.
Sediments of this phase appear to be deposited in more humid climate compared
to the other rock units based on illite/smectite ratio.

104
2- Regression phase-I: It witnessed sea level fall and fresh water incursions including
acidification of the waters and heavy mineral deposition as interpreted from the
richness in siderite, rutile, detrital elements and Mn. Moreover the samples
yielded fresh/brackish water algae Botryococcus, but also marine palynomorphs.
This phase contains Foveotricolpites giganteus and Foveotricolpites
gigantoreticulatus that assign it to the early Turonian age.
3- Transgression phase-II: It is rich in TOC, deposited in suboxic conditions and also
shows relatively higher detrital element concentrations as compared to
transgression phase-I which impeded sulfur incorporation into kerogen. The
palynological investigation reveals the occurrence of marine and non-marine
species.
The differences between the two transgressive phases in the depositional environment
resulted in the formation of two source rock types. Both source rocks are immature with
oil generative potential. However, transgression phase-I source rock contains kerogen
type-IIS, which yields high sulfur oil, whereas transgression phase-II contains kerogen
type-II/III which generates sweet oil with minor gas upon expulsion. The strong
influence of sea level fluctuations on the sediments during the late Cenomanian to early
Turonian could be a local phenomenon in the Abu Grading Basin due to low water depth
as compared to other deeper sites.
Interestingly, a variety of independent Rock-Eval and biomarker maturity parameters all
reveal lower thermal maturity for the Abu Roash “F” source rock interval as compared to
sediments above and below. This finding suggests retardation/supersession of
maturation processes in oil-prone source rocks, but could be also due to presence of
migrated bitumen of enhanced maturity, i.e. from deeper source rocks, in all formation except
for the Abu Roash “F” Member.
The residual oils of the Abu Roash “C” and “D” reservoirs reveal two different
compartments. The Abu Roash “D” residual oils are affected either by biodegradation or
evaporation. They also show heavier chemical composition with depth. The Abu Roash

105
“C” residual oil shows a bi-modal n-alkane distribution and lighter chemical composition
relative to the Abu Rash “D” residual oils. Correlations with source rocks are elusive due
to the quality of the residual oil samples and source rock heterogeneity.

106
An oil paint of a bituminite particle found in a Cenomanian/Turonian sample, Tarfaya Sondage-4, Morocco. Artist: Esrraa Abunar

107
Chapter 4 | Depositional Environment and Source Rock Potential of Cenomanian and Turonian Sedimentary Rocks of the Tarfaya Basin, Southwest Morocco 2
4.1 Abstract
Detailed organic and inorganic geochemical analyses were used to assess the
depositional environment and source rock potential of the Cenomanian and Turonian oil
shale deposits in the Tarfaya Basin. This study is based on core samples from the Tarfaya
Sondage-4 well that penetrated over 300m of Mid Cretaceous organic matter-rich
deposits. A total of 242 samples were analyzed for total organic and inorganic carbon and
selected samples for total sulfur and major elements as well as for organic petrology,
Rock-Eval pyrolysis, Curie-Point-pyrolysis-gas chromatography-Mass-Spectrometry and
molecular geochemistry of solvent extracts. Based on major elements the lower
Cenomanian differs from the other intervals by higher silicate and lower carbonate
contents. Moreover, the molecular geochemistry suggests anoxic bottom marine water
conditions during the Cenomanian-Turonian Boundary Event (CTBE; Oceanic Anoxic
Event 2: OAE2). As a proxy for the Sorg/Corg ratio, the ratio total thiophenes/total
benzenes compounds was calculated from pyrolysate compositions. The results suggest
that Sorg/Corg is low in the lower Cenomanian, moderate in the upper Cenomanian, very
high in the CTBE (Cenomanian-Turonian Boundary Event) and high in the Turonian
samples. Rock-Eval data reveal that the lower Cenomanian is a moderately organic
carbon-rich source rock with good potential to generate oil and gas upon thermal
maturation. On the other hand, the samples from the upper Cenomanian to Turonian
2 Ghassal, B. I., Littke, R., Sachse, V., Sindern, S., & Schwarzbauer, J. (2016). Depositional Environment and Source Rock Potential of Upper Albian to Turonian sedimentary rocks of the Tarfaya Basin, Southwest Morocco. Geologica Acta, 14(4), 419-441.

108
exhibit higher organic carbon content and can be classified as oil-prone source rocks.
Based on Tmax data, all rocks are thermally immature.
The microscopic investigations suggest dominance of submicroscopic organic matter in
all samples and different contents of bituminite and alginite. The lower Cenomanian
samples have little visible organic matter and no bituminite. The upper Cenomanian and
CTBE samples are poor in bituminite and have rare visible organic matter, whereas the
Turonian samples change from bituminite-fair to bituminite-rich and to higher
percentages of visible organic matter towards the younger interval. These differences in
the organic matter type are attributed to i) early diagenetic kerogen sulfurization and ii)
the upwelling depositional environment. Moreover, kerogen sulfurization was controlled
by the relationship between carbonate, iron and sulfur as well as the organic matter.
Thus, the organic carbon-rich deposits can be grouped into: i) low Sorg and moderately
organic matter-rich oil prone source rocks, ii) moderate Sorg and organic-carbon-rich oil
prone source rocks, iii) high Sorg and organic carbon-rich oil prone source rocks and iv)
very high Sorg and organic carbon-rich oil prone source rocks, the latter representing the
CTBE interval. Types 2 to 4 will generate sulfur-rich petroleum upon maturation or
artificial oil shale retorting. This integrated organic and inorganic approach sheds light
on the various processes leading to the development of the world-class oil shales
deposited through the Cenomanian to Turonian. In addition, this study shows how the
changes in the depositional environment might have controlled kerogen sulfurization
and organic matter preservation and structure. This detailed approach provides a better
understanding on source rock development during the Cenomanian to Turonian in a
global context, as many of the geochemical features were identified worldwide for
deposits related to OAE2.
4.2 Introduction
The Tarfaya Basin is located in southwest Morocco, south of the Anti-Atlas with the
Reguibat massif in the east, the Mauritanides Mountains in the south and the Atlantic
Ocean abyssal plain in the west (Fig. 4-1). It is considered as one of the main petroleum
basins along the eastern Atlantic coast and belongs to the major oil shale deposits in

109
Morocco (Dyni, 2006). Exploration activities for conventional oil increased during the
1960s and early 1970s when several wells encountered gas and oil shows. This led to an
offshore heavy oil discovery in the Jurassic play (SUBSEAIQ, 2014), ie. the Cap Juby field.
In the 1980s, Shell assessed the Upper Cretaceous (Cenomanian/Turonian) succession in
the onshore part of the basin for open pit oil shale mining; however, the deposits were
regarded as non-commercial at that time (Lüning et al., 2004).
Fig. 4-1 Overview map of the Tarfaya Basin showing the location of the studied well (S-4) and some of the
previously studied wells (modified after Michard et al., 2008).
The estimated total oil shale resource of the Tarfaya Basin is 86 billion tons with an
average thickness of the mineable deposits of 20m (Dyni, 2006) and Total Organic
Carbon content (TOC) of up to 20% for the Cenomanian (Kolonic et al., 2002; Sachse et
al., 2011, 2012, 2014). Based on a well correlation (Michard et al., 2008) and an
interpreted seismic line (Wenke, 2014; Fig. 4-2), the offshore basin differs from the

110
onshore part, as in the offshore area a thick Tertiary succession and Triassic salt domes
were identified (Fig. 4-2). This finding essentially increased the chance of finding more
thermogenic oil and gas accumulations in the offshore area, where sufficient maturation
of source rocks can be expected. In addition, the Canary hotspot is situated in direct
vicinity to the Tarfaya Basin and might have affected heat flow leading to mature
Cretaceous source rocks (see Neumaier et al., 2015), if this rocks are present on the
offshore area.
Several potential reservoirs were discussed in the literature but according to offshore
well data gas and oil are present in the Jurassic and Lower Cretaceous (Morabet et al.,
1998). The single oil discovery, Cap Juby, contains low and high API (American Petroleum
Institute) gravity oil in the Lower and Middle Jurassic, respectively. Source to oil
geochemical correlations suggested carbonate-rich source rocks for these oils (Morabet
et al., 1998). Potential seals are distributed throughout the pre-, syn- and post-rift
sections with shaly and evaporatic lithologies; accordingly sealing capacity is not
regarded as limiting factor for hydrocarbon accumulations. The source rock
characteristics in the Tarfaya Basin were assessed in detail by Kolonic et al. (2002),
Lüning et al. (2004) and Sachse et al. (2011, 2012, and 2014) based on outcrops and
onshore wells (Fig. 4-1). Outcrop samples from the Devonian, Carboniferous, Jurassic and
Lower Cretaceous showed poor source rock potential (Sachse, 2011). However, results
published by Enachescu et al. (2010) indicated that the offshore oil in the Tarfaya Basin
was sourced by Jurassic marly facies with TOC values ranging from 1.47 to 2.49%. On the
other hand, the Upper Cretaceous embraces the highest source rock quality compared to
the other stratigraphic sections in the basin. The Cenomanian and Turonian outcrop
(Sachse et al., 2011) and core samples (Kolonic et al., 2002; Sachse et al., 2012, 2014) are
characterized as excellent immature oil prone source rocks, based on high values of TOC
and Hydrogen Index (HI) and low to moderate values of Tmax and vitrinite reflectance.
They are characterized by high Total Sulfur content (TS) but only moderate TS/TOC ratio
(Kolonic, et al., 2002; Sachse et al., 2011, 2012, 2014).

111
Fig. 4-2 Cross section showing the extent of the onshore/offshore stratigraphy of the Tarfaya Basin (modified after Wenke, 2014), including Cap Juby
well. Surface geology in the small map modified after Saadi et al. (1985). CJ: Cap Juby well.

112
Outcrop samples from the Coniacian, Santonian, Campanian and Eocene show similar
hydrocarbon richness, maturity and generative potential (Sachse et al., 2014).
The first objective of this study is to assess the source rock potential in the Cenomanian
and Turonian using new core samples from SONDAGE-4 well, drilled in 2009 (Fig. 4-1).
In addition, the study intends to determine the depositional environment as well as
associated processes that led to the preservation of organic matter during the
Cenomanian to Turonian times using a variety of organic and inorganic geochemical and
petrographic techniques. In particular the change of organic facies through time is
investigated in detail and visualized by petrographic sections. In addition, the results of
this study are relevant to better understand the extent (time and space) and intensity of
Oceanic Anoxic Event 2 (OAE2), and its relation to source rock deposition. Finally, the
paper classifies the investigated source rocks based on several criteria that could be
useful for both scientific and industrial communities.
4.3 Geological Setting
The Tarfaya Basin is one of the Mid Atlantic rift basins along the northwestern African
margin. Extension started in Late Permian to Early Jurassic times as a sag basin (Wenke
et al., 2011) leading to major faulting and northeast oriented half grabens (Lancelot and
Winterer, 1980; Hafid et al., 2008). The first synrift units of the Triassic were
characterized by terrigenous clastics that were deposited in an alluvial environment
followed by basaltic extrusives and doloritic sills (Lancelot and Winterer, 1980). Triassic
salt was only observed in the northwestern part of the offshore Tarfaya Basin (Lancelot
and Winterer, 1980; Hafid et. al., 2008). In the Early Jurassic, major transgressions
switched the basin to a marine system (Wenke et al., 2011). Carbonates and evaporites
were deposited at the beginning of the Early Jurassic along the Moroccan margin.
Moreover, the Early Jurassic witnessed tectonic instability due to the initiation of
continental drifting (Lancelot andWinterer, 1980). This tectonic setting was responsible
for the development of carbonate ramps in the Early- to Mid-Jurassic followed by
regressive marine siliciclastic environments. Transgression occurred again in the early
Late Jurassic and led to the deposition of open marine carbonates (Wenke et al., 2011;

113
Hafid et al., 2008). The depositional environment changed in the Middle Jurassic giving
rise to carbonate platforms and build-ups (Wenke et al., 2011). Regression took place
again in the Late Jurassic/Early Cretaceous, shifting the depositional environment to
lagoonal and deltaic (Hafid et al., 2008). The basin at this time included two depositional
environments: deltaic facies dominated the northern area and prograded to the NNE,
whereas the northwestern and southern areas encountered outer shelf carbonates to
fine-grained clastic deposits (Wenke et al., 2011). The Lower Cretaceous is composed of
shales, sandstones and shelly limestones with occasional organic matter-rich units and
can reach a thickness of up to 1700m (Einsele and Wiedmann, 1982; Morabet et al.,
1998). The Albian witnessed sea level fluctuations and is characterized by variable
lithologies from open marine carbonates to silty clays and marls (Lancelot and Winterer,
1980; Einsele and Wiedmann, 1982; Wenke et al., 2011). Furthermore, deep sea drilling
penetrated organic rich beds in the northern offshore basin (Einsele and Wiedmann,
1982). Several transgressive-regressive cycles might have occurred in the
Albian/Cenomanian, Cenomanian/Turonian and Santonian/Campanian (Kolonic et al.,
2002). The highest organic carbon content is thought to be associated with these
transgressions (Morabaet et al., 1998). The greatest sea level rise occurred coeval with
the OAE2, the Cenomanian/Turonian Boundary Event (CTBE) (Schlanger and Jenkyns,
1976; Jenkyns, 1980). This major transgression affected North Africa all the way to the
Sahara platform (Lancelot and Winterer, 1980) leading to deposition of organic matter-
rich clays and marls in a nutrient-rich warm water environment (Erbacher et al., 1996;
Kolonic et al., 2002). Sachse et al. (2014) pointed out that the influence of reduced oxygen
content due to lower oxygen solubility in water at high temperature triggered the organic
matter preservation. The uppermost Cenomanian as well as the Turonian succession are
laminated unlike the lower Cenomanian and Lower Cretaceous (Einsele and Wiedmann,
1982).
A major unconformity exists between the late Santonian and the Paleogene (Lancelot and
Winterer, 1980; Hafid et al., 2008; Wenke et al., 2011). The Upper Cretaceous is thin or
missing and unevenly distributed in the shallow water areas as shown in Figure 4-2.

114
Interestingly, most of the Upper Cretaceous sediments are also eroded or undrilled in the
Tarfaya deep water area. Another important transgression occurred in the Eocene
resulting in upwelling and related high surface water productivity leading to deposition
of organic matter-rich units (Sachse et al., 2014). This was followed by a time of non-
deposition during the Early Oligocene (Lancelot and Winterer, 1980). Furthermore, the
uplift of the Canary island volcanic region during the Miocene shifted the depocenter
towards the abyssal part of the basin (Kuhnt et al., 2009). Finally, the latest stratigraphic
section recorded in the Tarfaya is the Miocene Moghrebian Formation (Kolonic et al.,
2002). Figure 4-2 is a cross section representing the distribution of the various
stratigraphic units in the onshore and offshore areas. The most common lithologies are
summarized in a generalized stratigraphic column (Fig. 4-3).
4.4 Samples and Methods
4.4.1 Samples
A total of 242 core samples were collected from Tarfaya Sondage-4. The well was drilled
in 2009, located 40km east of Tarfaya (N27º59’46.4’’, W12º32’40.6’’) as part of a drilling
campaign in order to recover the Miocene to Albian sequences. The borehole has a total
depth of 350.20m with 100% sediment recovery. It penetrated 21.00m of the Miocene
Moghrabien Formation, 79.00m of the Turonian, and 15.06m covering the CTBE interval,
163.04m of the upper Cenomanian and 72.1m of the lower Cenomanian and Albian
section. The CTBE in this well was described in Schönfeld et al. (2015) where C isotope
excursions were discussed. The boundary between the Lower and upper Cenomanian
was tentatively based on changes in geochemical features. Detailed sedimentological and
micropaleontological studies on the same well are currently conducted by the marine
micropaleontology group at Christian-Albrechts University, Kiel, Germany. The two
deepest samples were assigned to the Albian, but they are not discussed in detail due to
their small number.
4.4.2 Elemental analysis
For geochemical analysis, all samples were powdered, whereas small pieces were
preserved for microscopic studies. All samples were analyzed for Total Organic and

115
Inorganic Carbon (TOC and TIC) using a LiquiTOC II (Elementar Analysengeräte GmbH).
The analytical method is described in Bou Daher et al. (2015). The CaCO3 proportion was
calculated using the equation: CaCO3=inorganic carbon x 8.333. This calculation has to be
used with caution as it will result in overestimation of carbonate contents (by up to 8%)
if dolomite is present instead of calcite.
Fig. 4-3 Stratigraphic column representing the common lithologies in the Tarfaya Basin from coastal to deep marine areas (modified after Davison, 2005; Sehrt, 2014).
TS was measured on 162 samples: 15 samples from the lower Cenomanian, 44 from the
upper Cenomanian, 83 from the interval comprising the CTBE and 20 from the Turonian.
TS was measured using a LECO S 200 sulfur analyzer (precision is <5% and detection
limit 0.001%).

116
Based on CaCO3 and TS values as well as pyrolysis data, 20 samples were selected for
determination of major element concentrations: 5 from the lower Cenomanian, 6 from
the upper Cenomanian, 5 from the CTBE and 4 from the Turonian. Approximately 2g of
powdered rock of each sample was put overnight into an oven at 105°C to dry. Then, the
samples were weighed and placed in an oven at 1000°C for 2 hours for loss of ignition
(LOI) process. After that, the samples were left to cool in moisture-free atmosphere and
weighed again to calculate the loss on ignition.
Next, the samples were mixed with a Li-tetraborate/Limetaborate mixture (FX-X65,
Fluxana, Kleve, Germany) with a ratio of 0.5g/5g. The mixture was fused at 1150°C to
create a glass disc to be used for major element analysis by energy dispersive X-ray
fluorescence spectrometry (Spectro XLab2000). The system has a Pd-tube operated at
acceleration voltages between 15 and 40kV and currents between 6 and 12.0mA.
Secondary targets of Co, Ti and Al were used for signal enhancement. A fundamental
parameter procedure was applied for data computation. The precision of major element
determination was <0.9%.
4.4.3 Rock-Eval Pyrolysis
Rock-Eval pyrolysis analyses were conducted on 99 core samples to characterize their
source rock potential using a Rock-Eval 6. The method is described in Espitalié et al.
(1985) and Peters (1986). Samples cover the lower Cenomanian (14), upper Cenomanian
(19), the CTBE interval (38) and Turonian (26). Various parameters were used from
Rock-Eval data. S1 (mgHC/gRock) represents the free hydrocarbons and S2
(mgHC/gRock) represents the non-soluble hydrocarbons with organic solvents (mostly
kerogen). S3 represents the CO2 released from hydrocarbon during pyrolysis
(mgCO2/gRock). Hydrogen Index (HI; S2/TOC; mgHC/gTOC) and Oxygen Index (OI;
S3/TOC; mgCO2/gTOC) were calculated as common parameters to describe the quality
of the source rock with respect to petroleum generation. Finally, the Production Index
(PI) has been calculated as follows: S1/(S1+S2).
All pyrograms were checked carefully for good S2 peak developments for quality control.
Note that none of the Rock-Eval samples have TOC lower than 0.5% or S2 lower than

117
1.5mgHC/gRock. Therefore, values of all parameters including Tmax and HI are believed
to be accurate.
4.4.4 Organic petrology
Maceral counting was performed on 32 samples to investigate the organic petrological
changes through the studied interval. 4 samples were from the lower Cenomanian, 6 from
the upper Cenomanian, 14 from the CTBE and 8 from the Turonian. The petrological
study used the methods described by Taylor et al. (1998). The bulk samples were cut and
embedded pendicular to bedding, in a 10:3 mixture of epoxy resin (Araldite® XW396),
and hardener (Araldite® XW397) and dried at 37°C for at least 12 hours. The sample
surfaces were then grinded and polished as described in detail by Sachse et al. (2012).
On each bulk sample a total of at least 500 maceral counts were performed. Counting was
performed both in incident white light (for vitrinite and inertinite, and also pyrite) and
in a fluorescent light mode (for bituminite, telalginite, lamalginite, and liptodetrinite)
along transects perpendicular to bedding.
The percentage of each category (as OM volume-% of whole rock) was calculated and
finally the percentages of all macerals were determinated. The maceral percentages were
compared with the volume percentage of organic matter based on TOC-content. This
estimation is based on the equation introduced by Littke (1993) which is:
TOC (wt%) = (ρOM/ρrock) x (C%/100) x OM (vol.%)
Where C% is the carbon content of the Organic Matter (OM). The difference between the
calculated OM from the equation and the counting should correspond to the amount of
submicroscopic OM.
4.4.5 Source rock extraction
For a total of 24 source rocks, aliquots of 3 to 7g of powdered samples were extracted. To
each sample, 50mL of dichloromethane (DCM) were added and agitated in an ultrasonic
bath for 15 minutes. Thereafter, the solution was stirred overnight at room temperature.
Then, the solution was agitated again in an ultrasonic bath for 15 minutes.

118
After filtration, copper powder was added to remove elemental sulfur. Using a liquid
chromatography micro column (Baker, filled with 2g of silica gel 40mm), the raw extracts
were separated into 6 fractions of increasing polarity using n-pentane (5ml), n-
pentane/DCM 95/5 v/v (8.5ml), n-pentane/ DCM 90/10 v/v (5ml), n-pentane/DCM
40/60 v/v (5ml), DCM (5ml) and methanol (5ml), respectively. The fractionation method
is described in detail in Schwarzbauer et al. (2000). For Gas Chromatography-Mass
Spectrometry (GC-MS) analyses the first fraction containing the aliphatic hydrocarbons
was used.
4.4.6 Gas Chromatography and Gas Chromatography-Mass Spectrometry
The aliphatic fractions were analyzed by gas chromatography using a Fisons Instruments
GC 8000 series equipped with a flame ionization detector and a Zebron ZB-1 HT Inferno
fused silica column (30m x0.25mm internal diameter (i.d.); film thickness 0.25μm,
Phenomenex®). Each sample was concentrated to approximately 25-50μL prior to
injection. 1μL was injected into a split/splitless injector at 270°C and with a splitless time
of 60s. Helium was utilized as a carrier gas with a gas velocity of 35cm/s. The
temperature program started at 80°C, held for 3 minutes; then the temperature increased
at a rate of 10°C/minute to reach 300°C remaining constant for 20 minutes. The aliphatic
fractions were further analyzed on a Finnigan MAT 95 mass spectrometer connected to
a Hewlett Packard Series II 5890 GC which was equipped with a similar GC column. The
carrier gas was He with a gas velocity of 33cm/s. The GC run started at 80°C, held for 3
minutes; then the temperature increased to 310°C at a rate of 5°C/minute. The
spectrometer was operated in Electron Ionization (EI*) mode with an ionization energy
of 70eV and a source temperature of 200°C. The scanning range was from m/z 35 to 700
in low resolution mode.
4.4.7 Curie-Point Pyrolysis Gas Chromatography-Mass Spectrometry
A total of 18 samples (4 from the lower Cenomanian, 4 from the upper Cenomanian, 4
from the CTBE interval and 6 from the Turonian) were selected for Curie-Point pyrolysis
coupled to a GC-MS system (CP-PyGC-MS), based on TOC and TS contents. Metal crucibles
with Curie Point temperature of 650°C were made in the lab. Then, each crucible was

119
filled with 3 to 10mg of powered sample. The crucible was inserted in a glass inlet which
was then placed in a CP pyrolyzer (Fischer GSG CPP 1040 PSC) and pyrolyzed at 650°C
for 10s. The pyrolyzer was coupled up to a GC-MS system (Fisons GC 8000; Thermoquest
MD 800). It was equipped with a 30m non-polar GC capillary column (Zebron ZB-5,
0.25mm i.d., 0.25μm film thickness). The pyrolysis products were trapped behind the
injector using a cryofocussing trap (-70°C) prior to the GC-MS analyses. The GC-MS
analyses were conducted using He as carrier gas (velocity 35cm/s) and 40°C as starting
oven temperature held for 3 minutes. Then the oven temperature increased at a rate of
3°C/minute to reach 310°C held for 20 minutes. Molecular masses were scanned from
m/z 35 to 550.
4.4.8 Molecular geochemical parameters
All biomarker ratios were calculated on the base of peak integration of specific ion
chromatograms. For alkanes such as n-C17, n-C18, pristane and phytane ion
chromatograms of m/z 57 were used. Hopanes and methylated derivatives were
determined with m/z 191 and 205, respectively. C27, C28 and C29 steranes were measured
at m/z 217 trace but checked with the ion chromatograms of the molecular ions. In
summary, the following biomarker ratios were calculated: pristane/phytane (Pr/Ph),
pristane/n-C17 and phytane/n-C18 ratios, as well as methylated hopanes/total hopanes
and steranes/hopanes ratios. As a proxy for the ratio of organic sulfur to organic carbon
the thiophene/benzene ratio was calculated (thiophenes/benzenes). The thiophene
derivatives considered in the equation were: methylthiophenes (2 isomers, m/z 98),
dimethylthiophenes (4 isomers, m/z 112) and trimethylthiophenes (3 isomers, m/z
126). The benzene derivatives used in the equation were: toluene (m/z 92), xylenes (3
isomers, m/z 106) and trimethylbenzenes (2 isomers, m/z 120).
4.5 Results
4.5.1 Elemental Analysis
Variable TOC content was found throughout the analyzed section (Table 4-1; Fig. 4-4)
ranging from 0.72 to 4.54% in the lower Cenomanian. The upper Cenomanian samples
show higher values increasing towards the CTBE interval with an average of 5.50%. The

120
CTBE interval between 100 and 115m depth shows strong fluctuations between 1.71 and
15.44% with highest values towards the top and an average of 8%. Similarly the Turonian
section is characterized by high TOC values ranging from 1.69 to 15.36% and decreasing
towards the top (Fig. 4-4).
TS content generally increases from the bottom to the top of the analyzed section (Fig. 4-
4). The lower Cenomanian shows the lowest TS content with an average of 0.8% and
values varying between 0.4 and 1.5%, whereas the upper Cenomanian samples average
1.3% and range from slightly less than 1% to 2.2% with highest values towards the CTBE.
The CTBE samples show strong fluctuations in sulfur with highest values towards the top
(4.3%) and average value of 1.5%. The Turonian is also characterized by a high TS
average of 1.9%. The carbonate content oscillates rapidly and appears to have a
relationship with the TOC and TS contents (Table 4-1; Fig. 4-4). The lower Cenomanian
samples have relatively low to moderate CaCO3 content, compared to the younger
intervals, with an average of 41%. The upper Cenomanian samples on the other hand
start with moderate carbonate content which increases toward the CTBE to exceed 60%
on average.
The CTBE and Turonian samples are very rich in carbonate with an average of more than
68%. However, these stratigraphic levels also have five narrow low CaCO3 intervals
(<50%). In general, the samples show an inverse correlation between CaCO3 and TS. The
same holds true for the CaCO3 vs. TOC relationship with the exception of the lower
Cenomanian (Fig. 4-5).
The Fe2O3, SiO2, Al2O3, K2O and TiO2 contents increase with well depth, reaching highest
values within the lower Cenomanian (Table 4-2; Fig. 4-6) whereas CaO, SO3 and LOI
generally decrease with depth. Fe2O3 ranges from 2.8 to 5.1% in the lower Cenomanian
and from 1.0 to 4.8% in the upper Cenomanian. A lower range is found in the samples
representing the CTBE (0.1 to 3.6%). The Turonian has an even narrower range from 0.1
to 1.5%. The Fe2O3 and TiO2 show a negative relationship when they are plotted against
CaCO3 (Fig. 4-7), which is in line with the decrease of CaO with depth. MnO is very low
throughout the well and does not exceed 0.04%. MgO is relatively low but exceeds 3% in

121
three samples (53.52m, 129.04m and 187.92m). The overall high Ca/Mg ratio indicates
that carbonates are mainly present as calcite/aragonite and not as dolomite. Accordingly
the calculation of calcium carbonate content from total inorganic carbon (see elemental
analysis method section) is valid for almost all samples. P2O5 shows high values only at
168.00m (1.5%) and at 220.57m (1.8%). More details are given in Figure 4-6 and Table
4-2.
Fig. 4-4 Depth plots TS, TOC, CaCO3 and TS/TOC ratio of all stratigraphic units.
Tu
ron
ian
T
uro
nia
n
CT
BE

122
Fig. 4-4 continued.
up
per
Cen
om
ania
n
low
er C
eno
man
ian

123
Table 4-1 Elemental and Rock-Eval 6 data. Units: *mgHC/Rock, **mgCO2/gRock, ***mgHC/gTOC, ****mgCO2/gTOC. T: Turonian, CT: CTBE, UC: Upper Cenomanian, LC: Lower Cenomanian A: Albian
Table 4-1 continued
sample Depth Age TOC CaCO3 S TS/TOC Original OM Silicates S1 S2 S3 Tmax HI OI
[m] (%) (%) (%) (%) (%) * * ** (°C) *** ****
14/1047 24.06 T 5.56 78.75
14/1048 24.7 T 4.77 88.25
14/1049 26.22 T 6.50 66.32
14/1050 26.56 T 9.02 68.82
14/1051 27.67 T 6.39 83.31
14/1052 28.6 T 5.30 86.16 1.11 0.21 8.03 5.81 0.73 39.48 1.55 411 745 29
14/1053 29.66 T 8.45 46.53
14/1054 30.7 T 7.22 45.36
14/1055 31.61 T 8.45 70.85
14/1056 32.5 T 8.07 76.18
14/1057 33.42 T 5.62 55.22
14/1058 34.6 T 7.32 62.80
14/1059 35.52 T 7.89 67.89
14/1060 36.81 T 10.68 56.48
14/1061 37.61 T 9.75 56.29
14/1062 38.57 T 2.19 95.66
14/1063 39.71 T 8.18 79.60
14/1064 40.47 T 2.31 87.07
14/1065 41.38 T 1.69 92.22 0.49 0.29 2.72 5.06 0.10 13.36 1.34 409 790 79
14/1066 42.57 T 5.28 78.25
14/1067 43.6 T 8.54 58.47
14/1068 44.75 T 2.49 89.25

124
Table 4-1 continued
sample Depth Age TOC CaCO3 S TS/TOC Original OM Silicates S1 S2 S3 Tmax HI OI
[m] (%) (%) (%) (%) (%) * * ** (°C) *** ****
14/1069 45.53 T 14.19 60.24 2.55 0.18 21.05 18.71 2.72 95.56 3.39 412 673 24
14/1070 46.62 T 4.14 60.59
14/1071 47.63 T 4.89 75.56
14/1072 48.63 T 6.00 76.16
14/1073 49.6 T 10.89 51.98 2.62 0.24 16.89 31.13 1.81 81.34 3.36 410 747 31
14/1074 50.68 T 7.23 54.76
14/1075 51.69 T 8.44 53.80
14/1076 52.8 T 8.49 46.51
14/1077 53.52 T 7.13 56.91 2.41 0.34 11.84 31.24 1.01 48.75 1.65 412 684 23
14/1078 54.73 T 9.84 47.31
14/1079 56.09 T 13.34 41.14 2.73 0.20 20.16 38.70 2.25 92.94 3.48 410 697 26
14/1080 57.07 T 11.54 45.65
14/1081 57.5 T 8.00 73.37 1.75 0.22 12.22 14.41 0.89 54.43 1.61 414 680 20
14/1082 58.04 T 7.92 65.57 1.19 51.92 1.59 413 656 20
14/1083 59.15 T 7.10 56.08 0.92 48.44 1.55 408 682 22
14/1084 60.23 T 3.05 61.71 0.25 20.70 1.58 410 679 52
14/1085 61.4 T 1.85 87.42 0.72 0.39 3.17 9.41 0.14 14.66 1.28 410 792 69
14/1086 62.05 T 7.18 42.18 0.98 50.79 1.49 413 709 21
14/1087 62.86 T 6.40 45.60 0.62 42.40 1.64 413 662 26
14/1088 64.07 T 3.07 91.07 0.41 23.05 1.65 409 751 54
14/1089 65.02 T 9.99 52.79 2.03 0.20 15.08 32.13 1.30 72.51 3.17 410 726 32
14/1090 66.125 T 11.65 67.31
14/1091 67.105 T 3.79 71.19
14/1092 68.13 T 5.27 75.29
14/1093 69.04 T 7.42 64.85 1.72 0.23 11.43 23.72 1.06 51.66 1.56 412 696 21

125
Table 4-1 continued
sample Depth Age TOC CaCO3 S TS/TOC Original OM Silicates S1 S2 S3 Tmax HI OI
[m] (%) (%) (%) (%) (%) * * ** (°C) *** ****
14/1094 70.14 T 7.54 53.97
14/1095 71.02 T 7.55 54.75
14/1096 72.1 T 10.24 49.25
14/1097 73.24 T 9.28 55.47 2.28 0.25 14.45 30.08 1.33 70.10 2.99 410 755 32
14/1098 74.06 T 7.58 47.74
14/1099 75.09 T 9.57 46.09 2.58 0.27 15.15 38.75 1.17 70.79 3.05 410 740 32
14/1100 76.32 T 13.81 52.39
14/1101 77.11 T 8.87 56.45 1.98 0.22 13.60 29.95 1.23 71.49 3.05 410 806 34
14/1102 78.31 T 3.34 85.79
14/1103 79.27 T 14.92 52.26
14/1104 80.04 T 12.27 56.88
14/1105 80.08 T 11.18 60.41 2.03 0.18 16.62 22.97 1.86 86.11 3.09 412 770 28
14/1106 82.26 T 3.02 90.98
14/1107 83.16 T 16.69 67.15
14/1108 84.28 T 17.72 50.71
14/1109 85.15 T 12.61 66.79 1.97 0.16 18.37 14.84 1.96 91.00 3.00 415 722 24
14/1110 85.95 T 9.78 74.79
14/1111 87.13 T 9.47 84.79
14/1112 88.01 T 3.60 93.72
14/1113 88.7 T 2.63 99.86 0.34 0.13 0.29 22.00 1.23 413 836 47
14/1114 89.81 T 11.59 71.99
14/1115 91.32 T 13.06 74.41
14/1116 92.5 T 8.21 84.53
14/1117 93.2 T 7.91 80.33 1.32 0.17 11.62 8.05 1.00 51.41 1.54 412 650 19
14/1118 94.45 T 11.04 52.93 2.68 0.24 17.16 29.91 1.51 82.47 3.02 414 747 27

126
Table 4-1 continued
sample Depth Age TOC CaCO3 S TS/TOC Original OM Silicates S1 S2 S3 Tmax HI OI
[m] (%) (%) (%) (%) (%) * * ** (°C) *** ****
14/1119 95.37 T 18.00 65.22
14/1120 96.41 T 15.97 28.83
14/1121 97.46 T 15.36 69.32 2.50 0.16 22.50 8.18 2.37 101.19 3.15 412 659 21
14/1122 98.545 T 6.71 79.44
14/1123 99.3 T 4.56 90.17
14/1124 99.98 T 12.20 71.24 2.34 0.19 18.26 10.50 1.65 82.99 3.11 408 680 26
14/697 100.09 CT 12.00 70.77 1.86 0.15 17.46 11.77 2.09 82.09 3.04 407 684 25
14/698 100.305 CT 12.79 70.36 2.46 0.19 19.15 10.48
14/699 100.49 CT 18.44 53.86
14/700 100.68 CT 9.73 58.03 2.26 0.23 15.01 26.96 1.13 65.37 2.75 411 672 28
14/695 100.69 CT 12.63 47.58 3.53 0.28 20.14 32.27 1.18 79.32 2.84 412 628 23
14/696 100.91 CT 11.49 63.26 2.40 0.21 17.43 19.31
14/782 100.92 CT 15.44 39.39 4.34 0.28 24.66 35.94 1.88 94.11 3.10 410 609 20
14/701 101.11 CT 12.12 65.34 2.87 0.24 18.76 15.90
14/702 101.3 CT 11.52 61.42 2.54 0.22 17.62 20.95
14/703 101.49 CT 14.13 66.76 2.19 0.16 20.58 12.66
14/783 101.67 CT 12.59 63.63 1.70 0.14 18.05 18.32 2.17 89.47 2.87 412 711 23
14/704 101.7 CT 13.23 62.61
14/705 101.89 CT 14.19 73.82 1.90 0.13 20.33 5.85
14/706 102.09 CT 12.13 76.56
14/707 102.32 CT 8.29 76.61 1.52 0.18 12.34 11.05
14/784 102.44 CT 7.62 70.52 1.22 0.16 11.13 18.35 1.12 53.95 1.50 413 708 20
14/708 102.53 CT 7.45 67.50 1.35 0.18 11.07 21.43 0.62 46.76 1.62 416 627 22
14/709 102.73 CT 6.74 78.45 1.15 0.17 9.93 11.62
14/711 103.21 CT 4.43 85.65 1.20 0.27 7.03 7.32 0.48 31.38 1.45 415 708 33

127
Table 4-1 continued
sample Depth Age TOC CaCO3 S TS/TOC Original OM Silicates S1 S2 S3 Tmax HI OI
[m] (%) (%) (%) (%) (%) * * ** (°C) *** ****
14/712 103.42 CT 4.71 94.69 0.80 0.17
14/713 103.61 CT 5.50 80.02 1.62 0.29 8.86 11.12 0.58 37.61 1.52 413 684 28
14/785 103.66 CT 6.27 79.40 0.91 0.15 9.07 11.53 0.95 46.55 1.53 412 742 24
14/714 103.81 CT 5.86 95.13 0.89 0.15
14/786 103.97 CT 9.29 60.11 1.69 0.18 13.80 26.09 1.59 81.09 2.96 411 873 32
14/715 104.02 CT 11.71 75.38 1.68 0.14 16.89 7.73 1.84 94.67 2.94 413 674 21
14/716 104.21 CT 14.04 68.54 2.87 0.20 21.22 10.24
14/717 104.4 CT 12.71 77.58 1.80 0.14 18.32 4.10
14/718 104.59 CT 8.05 82.63 1.05 0.13 11.50 5.87 1.11 59.82 3.01 414 743 37
14/719 104.78 CT 7.15 86.62 0.73 0.10 9.99 3.39
14/720 104.98 CT 3.56 94.55 0.52 0.15 5.15 0.30 0.44 27.46 1.60 414 771 45
14/721 105.18 CT 1.90 108.28 0.32 0.17
14/722 105.39 CT 5.11 96.35 0.77 0.15
14/723 105.62 CT 8.04 67.61 1.20 0.15 11.66 20.73 1.13 61.59 3.14 411 766 39
14/787 105.62 CT 8.86 71.44 1.14 0.13 12.64 15.93
14/724 105.83 CT 6.83 89.76 1.05 0.15 9.94 0.30
14/725 106.04 CT 2.62 100.10 0.54 0.21
14/726 106.28 CT 6.77 68.43 1.02 0.15 9.82 21.75 0.91 50.00 1.74 415 738 26
14/788 106.43 CT 7.22 58.00 1.31 0.18 10.73 31.27 0.88 50.33 1.51 412 697 21
14/727 106.45 CT 7.88 61.48 2.18 0.28 12.56 25.96
14/728 106.63 CT 10.01 65.34 1.79 0.18 14.85 19.81
14/729 106.83 CT 7.44 65.41 1.47 0.20 11.18 23.41 1.06 53.89 1.75 417 725 24
14/730 107.04 CT 6.68 70.22 1.08 0.16 9.77 20.01
14/731 107.24 CT 6.45 58.18 1.38 0.21 9.81 32.01 0.92 48.51 1.73 416 752 27
14/732 107.47 CT 5.98 63.62 1.88 0.31 9.77 26.60

128
Table 4-1 continued
sample Depth Age TOC CaCO3 S TS/TOC Original OM Silicates S1 S2 S3 Tmax HI OI
[m] (%) (%) (%) (%) (%) * * ** (°C) *** ****
14/789 107.64 CT 5.48 66.07 1.50 0.27 8.71 25.22 0.59 41.41 1.51 413 756 28
14/733 107.67 CT 5.57 67.18 1.56 0.28 8.88 23.93 0.74 43.65 1.72 414 784 31
14/790 107.92 CT 9.22 70.61 1.21 0.13 13.18 16.22
14/734 108.18 CT 5.82 81.87 0.81 0.14 8.37 9.76
14/735 108.38 CT 4.23 83.10 0.67 0.16 6.17 10.73 0.62 35.42 1.70 413 837 40
14/736 108.58 CT 3.20 96.56 0.37 0.12
14/737 108.8 CT 10.41 62.52 1.52 0.15 15.05 22.43 1.85 82.60 3.25 412 794 31
14/738 109 CT 11.37 65.81 1.91 0.17 16.71 17.48
14/791 109.19 CT 8.37 51.27 1.83 0.22 12.78 35.95 1.09 67.46 3.00 412 806 36
14/739 109.22 CT 6.64 52.24 1.93 0.29 10.68 37.09
14/740 109.42 CT 5.72 57.37 1.36 0.24 8.85 33.77 0.60 36.22 1.47 413 634 26
14/741 109.64 CT 3.81 75.65 1.13 0.30 6.15 18.20
14/742 109.85 CT 4.31 68.26 1.07 0.25 6.72 25.02 0.59 36.87 1.78 414 856 41
14/743 109.9 CT 3.81 76.95 0.70 0.18 5.68 17.38
14/744 110.1 CT 9.40 53.24 1.50 0.16 13.73 33.03 1.07 61.34 2.61 419 653 28
14/745 110.31 CT 9.75 64.00 1.96 0.20 14.70 21.30
14/792 110.48 CT 8.71 53.98 1.80 0.21 13.19 32.83 1.09 65.42 2.85 413 751 33
14/746 110.51 CT 7.82 51.01 1.75 0.22 11.99 37.01 1.11 56.35 1.77 416 721 23
14/747 110.68 CT 10.39 61.81 2.00 0.19 15.56 22.63
14/748 110.92 CT 9.09 63.91 1.68 0.18 13.54 22.54 1.69 76.70 3.27 407 844 36
14/749 111.18 CT 7.05 74.87 1.46 0.21 10.68 14.45
14/793 111.34 CT 10.04 62.87 1.45 0.14 14.50 22.63 1.68 78.17 3.14 411 778 31
14/750 111.42 CT 9.34 61.11 1.76 0.19 13.95 24.94 1.12 63.10 2.79 414 676 30
14/751 111.66 CT 8.67 74.44 1.20 0.14 12.46 13.10
14/752 111.88 CT 4.77 88.82 0.81 0.17 7.03 4.14

129
Table 4-1 continued
sample Depth Age TOC CaCO3 S TS/TOC Original OM Silicates S1 S2 S3 Tmax HI OI
[m] (%) (%) (%) (%) (%) * * ** (°C) *** ****
14/753 112.08 CT 4.48 80.79 0.89 0.20 6.74 12.46 0.53 32.54 1.40 414 726 31
14/794 112.19 CT 8.74 61.28 1.31 0.15 12.68 26.05 1.02 67.11 2.88 411 768 33
14/755 112.56 CT 4.63 90.51 0.72 0.15 6.74 2.74
14/756 112.76 CT 4.32 91.43 0.61 0.14 6.22 2.34
14/757 112.95 CT 10.70 41.46 2.28 0.21 16.27 42.27
14/758 113.21 CT 10.14 1.97 0.19 1.30 72.17 2.67 412 712 26
14/759 113.41 CT 9.72 52.39 1.92 0.20 14.61 33.00
14/795 113.51 CT 8.82 62.31 1.43 0.16 12.91 24.79 1.07 68.60 2.99 412 778 34
14/760 113.58 CT 8.84 65.89 1.71 0.19 13.25 20.86
14/761 113.82 CT 8.04 73.92 1.41 0.18 11.89 14.19
14/762 114.02 CT 2.81 93.45 0.43 0.15 4.08 2.46
14/763 114.22 CT 1.71 100.14 0.28 0.17
14/764 114.42 CT 7.00 80.86 1.35 0.19 10.48 8.66
14/765 114.64 CT 12.74 49.60 2.13 0.17 18.73 31.67
14/766 114.82 CT 6.03 1.44 0.24 0.63 43.21 1.48 417 716 25
14/767 115.06 CT 4.93 68.28 1.18 0.24 7.65 24.06
14/584 115.17 UC 4.41 67.67 1.16 0.26 6.95 25.37 0.46 34.32 1.55 415 779 35
14/585 116.11 UC 7.24 64.91 1.58 0.22 11.05 24.03
14/586 117.03 UC 7.47 47.98 1.77 0.24 11.57 40.45 0.90 51.61 1.60 414 691 21
14/587 118.18 UC 8.13 64.40 1.56 0.19 12.17 23.43
14/588 118.9 UC 7.29 47.53 2.17 0.30 11.77 40.70 0.84 48.85 1.86 416 670 26
14/589 120.42 UC 3.04 80.05 0.76 0.25 4.75 15.21
14/590 121.18 UC 6.21 63.31 1.00 0.16 9.08 27.61 0.94 46.25 1.46 416 745 24
14/591 122 UC 4.76 59.46 1.09 0.23 7.32 33.21
14/592 123.25 UC 5.42 65.06 0.95 0.18 8.02 26.92

130
Table 4-1 continued
sample Depth Age TOC CaCO3 S TS/TOC Original OM Silicates S1 S2 S3 Tmax HI OI
[m] (%) (%) (%) (%) (%) * * ** (°C) *** ****
14/593 124.05 UC 8.19 60.63 1.30 0.16 11.96 27.41 1.26 65.12 2.87 415 795 35
14/595 126.155 UC 6.23 55.81 1.04 0.17 9.16 35.04 0.86 46.43 1.47 412 745 24
14/596 127.205 UC 6.84 45.69 1.48 0.22 10.43 43.88
14/598 129.04 UC 4.23 58.23 1.65 0.39 7.26 34.50
14/599 130.28 UC 6.40 56.68 1.92 0.30 10.36 32.96 0.73 44.89 1.50 418 701 23
14/600 131.13 UC 5.24 53.37 1.34 0.26 8.21 38.42
14/601 132.29 UC 5.27 69.61 0.94 0.18 7.82 22.57
14/602 133.36 UC 6.46 43.42 1.92 0.30 10.44 46.14
14/603 134.27 UC 7.55 64.54 1.39 0.18 11.24 24.22
14/604 135.26 UC 6.11 77.37 0.75 0.12 8.67 13.96
14/605 136.17 UC 5.09 56.37 1.17 0.23 7.84 35.79 0.46 36.26 1.46 414 712 29
14/606 137.09 UC 7.81 37.17 1.72 0.22 11.94 50.89
14/607 138.44 UC 2.24 78.56 1.27 0.57 4.30 17.14
14/608 139 UC 5.65 65.77 1.27 0.22 8.67 25.56
14/609 139.96 UC 3.96 85.16 0.62 0.16 5.77 9.07
14/610 141.22 UC 5.71 66.87 1.35 0.24 8.83 24.29
14/611 142.32 UC 8.10 46.28 1.35 0.17 11.90 41.82 1.94 63.80 2.97 417 788 37
14/796 142.7 UC 7.76 56.08 1.63 0.21 11.78 32.14
14/612 143.22 UC 4.13 54.76 1.35 0.33 6.81 38.42
14/613 144.48 UC 7.70 70.92 1.24 0.16 11.26 17.82
14/614 145.46 UC 3.84 77.66 0.77 0.20 5.78 16.56
14/615 146.63 UC 7.03 63.41 1.14 0.16 10.29 26.30
14/616 147.66 UC 5.11 39.77 1.28 0.25 7.98 52.24
14/617 148.43 UC 5.29 43.96 1.37 0.26 8.32 47.72 0.54 35.56 1.49 414 673 28
14/618 149.52 UC 6.07 35.47 1.44 0.24 9.40 55.13

131
Table 4-1 continued
sample Depth Age TOC CaCO3 S TS/TOC Original OM Silicates S1 S2 S3 Tmax HI OI
[m] (%) (%) (%) (%) (%) * * ** (°C) *** ****
14/619 150.23 UC 4.40 79.04 0.75 0.17 6.48 14.48
14/621 154 UC 4.04 78.09 5.19 16.73
14/622 156.33 UC 4.39 74.58 5.63 19.79
14/623 158.11 UC 4.80 63.56 0.87 0.18 7.12 29.32 0.99 35.91 1.47 415 749 31
14/624 160.12 UC 3.64
14/625 162.35 UC 3.73
14/628 168 UC 5.35 45.48 2.01 0.38 9.12 45.40 0.48 35.18 1.62 414 657 30
14/631 174.59 UC 2.56
14/632 176.31 UC 7.88
14/633 178.3 UC 4.78 55.43 1.10 0.23 7.36 37.21 0.54 32.36 1.56 416 677 33
14/638 187.92 UC 2.98 35.01 1.87 0.63 5.92 59.07 0.20 16.19 1.39 427 543 47
14/643 198.69 UC 3.39 25.97 1.06 0.31 5.54 68.49 0.40 22.20 1.54 420 654 46
14/644 200.69 UC 2.68 41.14 3.43 55.43
14/645 202.13 UC 4.10 41.49 5.26 53.25
14/647 206.83 UC 4.99
14/648 208.5 UC 4.91 55.27 0.94 0.19 7.35 37.38 0.40 31.47 1.43 422 641 29
14/649 210.42 UC 5.63
14/653 218.74 UC 5.42 36.64 1.05 0.19 8.12 55.24 0.47 34.04 1.66 418 628 31
14/658 228.07 LS 2.70 56.70 0.67 0.25 4.21 39.09 0.30 18.11 1.58 416 672 59
14/663 238.58 LS 2.36 49.85 0.70 0.29 3.81 46.34 0.21 12.37 1.45 425 524 62
14/668 248.26 LS 1.50 28.84 1.23 0.82 3.30 67.85 0.26 4.44 1.21 424 295 81
14/673 258.24 LS 2.12 51.54 0.55 0.26 3.32 45.13 0.13 9.95 1.53 425 471 72
14/678 268.5 LS 4.36 40.85 0.87 0.20 6.58 52.58 0.28 18.11 1.67 423 415 38
14/684 280.1 LS 1.38 20.82 0.42 0.30 2.24 76.94 0.08 4.41 1.58 427 319 114
14/689 290.23 LS 2.02 17.21 0.95 0.47 3.66 79.14 0.14 7.87 1.52 422 389 75

132
Table 4-1 continued
sample Depth Age TOC CaCO3 S TS/TOC Original OM Silicates S1 S2 S3 Tmax HI OI
[m] (%) (%) (%) (%) (%) * * ** (°C) *** ****
14/694 300.2 LS 1.85 40.04 0.71 0.38 3.17 56.80 0.11 6.43 1.46 423 347 79
14/768 305.3 LS 1.86 50.47 0.53 0.29 2.99 46.55 0.11 7.42 1.19 424 398 64
14/770 315.14 LS 3.04 37.00 3.90 59.11 0.23 21.17 1.39 417 697 46
14/771 320.34 LS 4.54 73.29 0.70 0.15 6.60 20.11 0.47 29.05 1.49 417 640 33
14/772 325.77 LS 2.54 29.22 0.94 0.37 4.31 66.47 0.16 12.71 1.43 423 501 57
14/774 335.33 LS 0.82 37.84 0.55 1.67 60.49 0.06 1.51 1.27 424 208 176
14/776 345.055 LS 3.09 20.05 1.55 0.50 5.70 74.25 0.14 11.22 1.52 424 363 49
14/777 350.03 A 4.19 54.60 0.67 0.16 6.12 39.29 0.31 25.83 1.54 418 617 37
14/778 350.19 A 6.37 53.35 1.07 0.17 9.36 37.29 0.57 40.06 2.01 420 629 31

133
Fig. 4-5 Cross plots between CaCO3 versus TOC and TS. The correlation of CaCO3 and TOC relationship changes significantly from positive in the Lower Cenomanian to negative in the Turonian. The CaCO3 and TS correlations are always negative with variable regression coefficients.

134
Fig. 4-6 Elemental data versus depth shows increase in silicate and rutile forming elements with depth. It also shows a strong increase in P2O5 before the CTBE.

135
Fig. 4-7 CaCO3 versus Fe2O3 and TiO2 Cross plots show inverse relationship in all studied intervals.
Table 4-2 XRF data of selected samples from each stratigraphic units. T: Turonian, CT: CTBE, UC: Upper
Cenomanian, LC: Lower Cenomanian.
Table 4-2 Continued
Sample Depth Age SiO2 Fe2O3 TiO2 Al2O3 MnO MgO CaO Na2O K2O P2O5 Cr2O3
(m) (%) (%) (%) (%) (%) (%) (%) (%) (%) (%) (%)
14/1077 53.52 T 23.25 1.48 0.20 2.95 0.02 4.07 28.45 0.23 0.30 0.01
14/1113 88.70 T 3.78 0.10 0.02 0.01 0.33 52.19
14/1117 93.20 T 5.54 0.31 0.04 0.20 0.01 0.39 46.08
14/1118 94.45 T 19.98 1.55 0.09 2.12 0.01 0.30 33.28 0.24 0.33 0.01
14/782 100.92 CT 14.18 3.64 0.31 4.98 0.02 0.20 27.82 0.36 0.04
14/784 102.44 CT 9.58 0.54 0.06 1.20 0.01 0.25 43.39 0.00
14/794 112.19 CT 19.94 1.07 0.19 3.10 0.01 0.47 34.99 0.17 0.01
14 763 114.22 CT 6.91 0.11 0.02 0.34 0.02 0.55 73.64 0.08 0.01 0.11 0.01
14/766 114.82 CT 27.04 1.42 0.27 3.81 0.02 0.73 31.82 0.46 0.10 0.02
14/587 118.18 UC 13.57 1.20 0.11 2.07 0.01 0.32 39.47 0.06 0.01 0.06 0.01
14/598 129.04 UC 25.04 2.54 0.30 4.22 0.02 3.22 30.04 0.07 0.27 0.44 0.01
14/619 150.23 UC 12.67 0.99 0.12 1.81 0.02 0.94 42.91 0.06 0.01 0.06 0.01
14/628 168.00 UC 20.59 1.83 0.27 4.74 0.02 0.98 34.56 0.23 0.81 1.46 0.02
14/638 187.92 UC 30.10 4.82 0.41 9.12 0.04 4.65 19.07 0.08 3.09 0.20 0.02

136
Table 4-2 Continued
Sample Depth Age SiO2 Fe2O3 TiO2 Al2O3 MnO MgO CaO Na2O K2O P2O5 Cr2O3
(m) (%) (%) (%) (%) (%) (%) (%) (%) (%) (%) (%)
14/654 220.57 LC 27.18 1.38 0.39 4.47 0.02 0.85 45.86 0.08 0.45 1.78 0.02
14/668 248.26 LC 48.34 4.47 0.61 6.82 0.02 2.01 16.07 0.60 1.18 0.31 0.02
14/678 268.50 LC 23.92 3.09 0.40 10.09 0.03 1.48 28.49 0.29 0.65 0.23 0.01
14/768 305.30 LC 25.25 4.15 0.35 7.74 0.04 2.44 27.76 0.06 1.59 0.23 0.01
14/772 325.77 LC 45.55 2.84 0.52 6.93 0.03 1.73 19.34 0.06 2.02 0.17 0.01
14/776 345.06 LC 42.14 5.15 0.52 12.64 0.02 1.92 13.62 1.10 1.97 0.21 0.03
4.5.2 Rock-Eval Pyrolysis
Generally two groups can be distinguished along the analyzed sections (Table 4-1; Fig. 4-
8). The first group includes the majority of the lower Cenomanian samples, which show
moderate to high HI values (208–543mgHC/gTOC) whereas the rest of the samples
compose the second group displaying high to very high HI values of more than
600mgHC/g TOC. The Lower Cenomanian reveals the highest OI compared to the other
stratigraphic intervals, ranging from 32 to 176mgCO2/gTOC and averaging
67mgCO2/gTOC. Tmax is low with an average of 420ºC (Fig. 4-8). Most samples plot
between Kerogen type II and III when using the pseudo van Krevelen diagram (van
Krevelen, 1950; Peters, 1986) (Fig.4-8). The upper Cenomanian samples are
characterized by low S1 values, similar to the lower Cenomanian, but clearly higher S2
values averaging 38.7mgHC/g rock. Moreover, the OI and Tmax average 32mgCO2/gTOC
and 416ºC, respectively. Higher S1 and S2 values are observed in the CTBE samples
(average of 1mgHC/g rock and 55mgHC/g rock, respectively), whereas Tmax values are
low with an average of 412ºC. The thick Turonian section is also composed of sediments
having high HI, S1 and S2 values. S2 decreases toward the younger sediments and Tmax
averages 411ºC (Fig.4-9). Most of the samples plot between Kerogen type I and II in the
pseudo van Krevelen diagram (Fig.4-8)

137
Fig. 4-8 Pseudo van Krevelen diagram of bulk Rock- Eval-6 samples of the various stratigraphic intervals.
0
100
200
300
400
500
600
700
800
900
1000
0 20 40 60 80 100 120 140 160 180 200
Hy
dro
gen
In
dex
[m
g H
C/g
TO
C]
Oxygen Index [mg CO2/g TOC]
Turonian
CTBE
Upper Cenomanian
Lower Cenomanian
Type I
Type II
Type III

138
Fig. 4-9 Rock-Eval HI, OI and Tmax versus depth plot. It shows the apparent difference between the Cenomanian to Turonian source rocks. On the basis of microscopic observations the Tmax shift is interpreted to be caused by a change in the organic facies rather than thermal maturity.
4.5.3 Organic Petrology
The maceral counting reveals at least 4 different organic facies all dominated by marine
organic matter (Table 4-3; Fig. 4-10). All samples show a dominance of submicroscopic
Unstructured Organic Matter (UOM) with alginites/liptodetrinites constituting the
majority of the visible macerals (Figs. 4-10; 4-11). These macerals show strong yellow
fluorescence and are classified based on their morphology: i) litptodetrinite (granular
particle usually of less than 5μm in length), ii) lamalginite (thin elongated particles) and
iii) telalginite (well preserved oval algal particles that originate from large colonial or
thick walled unicellular algae; Hutton 1987, Senftle et al., 1993; Taylor et al., 1998).

139
Fig. 4-10 Micrograph of representative samples of each organofacies type and stratigraphic interval.

140
Table 4-3 Maceral compositional analysis data. *: Calculated, submicroscopic organic matter. T: Turonian, CT: CTBE, UC: Upper Cenomanian, LC: Lower Cenomanian.
Sample Depth Age TOC Liptodetrinite Lamalginite Telalginite Bituminite II UOM *
(m) (wt. %) (vol.%) (vol.%) (vol.%) (vol.%) (vol.%)
14/1052 28.6 T 5.30 1.47 0.47 0.07 3.89 11.30
14/1069 45.53 T 14.19 0.57 1.78 0.09 6.98 36.64
14/1079 56.09 T 13.34 1.37 0.70 0.09 7.88 33.27
14/1089 65.02 T 9.99 0.42 0.80 0.05 7.92 23.24
14/1099 75.09 T 9.57 1.32 0.54 0.04 8.44 20.71
14/1109 85.15 T 12.61 2.22 0.63 0.04 9.16 28.89
14/1121 97.46 T 15.36 3.40 1.43 0.05 1.18 43.83
14/1124 99.98 T 12.20 2.89 1.45 0.13 1.64 33.49
14/782 100.92 CT 15.44 1.36 1.09 0.08 0.42 47.19
14/704 101.7 CT 13.23 0.00 0.00 0.00 0.00 42.95
14/783 101.67 CT 12.59 0.78 0.63 0.00 1.37 38.09
14/784 102.44 CT 7.62 0.69 0.76 0.09 1.40 21.79
14/785 103.66 CT 6.27 0.00 0.00 0.00 0.00 20.37
14/786 103.97 CT 9.29 0.15 0.21 0.05 0.67 29.07
14/787 105.62 CT 8.86 0.00 0.00 0.00 0.00 28.77
14/788 106.43 CT 7.22 0.00 0.00 0.00 0.00 23.45
14/789 107.64 CT 5.48 0.00 0.00 0.00 0.00 17.81
14/790 107.92 CT 9.22 0.00 0.00 0.00 0.00 29.95
14/791 109.19 CT 8.37 0.00 0.00 0.00 0.00 27.17
14/792 110.48 CT 8.71 0.00 0.00 0.00 0.00 28.28
14/793 111.34 CT 10.04 0.00 0.00 0.00 0.00 32.60
14/795 113.51 CT 8.82 0.00 0.00 0.00 0.00 28.62
14/585 116.11 UC 7.24 0.92 0.78 0.09 0.73 20.97
14/590 121.18 UC 6.21 0.00 0.00 0.00 0.00 20.15
14/623 158.11 UC 4.80 0.00 0.00 0.00 0.00 15.57
14/633 178.3 UC 4.78 0.00 0.00 0.00 0.00 15.52
14/648 208.5 UC 4.91 0.00 0.00 0.00 0.00 15.94
14/658 228.07 UC 2.70 0.00 0.00 0.00 0.00 8.75
14/673 258.24 LC 2.12 0.00 0.00 0.00 0.00 6.87
14/689 290.23 LC 2.02 0.00 0.00 0.00 0.00 6.56
14/771 320.34 LC 4.54 0.00 0.00 0.00 0.00 14.73

141
Fig. 4-11 Organic matter volume vs. TOC weight percent. The samples that show very low visible organic matter were assigned as 0.2% for the sake of simplicity.
Bituminite differs from alginite by the lack of recognized shape and reddish to dark
brown fluorescence (Teichmüller and Ottenjann, 1977; Taylor et al., 1998). Bituminite
occurs in form of lenses of irregular shape (bituminite I) and as matrix bituminite which
mergers with the groundmass (bituminite II) both showing a dark, reddish florescence
(Creaney, 1980; Taylor et al., 1998). In this study bituminite II constitutes the major
bituminite maceral. UOM is present to a great extent in a form that cannot be recognized
by incident light microscopy, ie. size is smaller than 1μm. The strong fluorescence of the
groundmass indicates the presence of this submicroscopic organic matter. The lower
Cenomanian differs from the younger samples in the lack of bituminite (Fig. 4-10). It
shows a strong bright yellow fluorescing ground mass. The Turonian samples are
moderate in reddish groundmass and have nearly no visible organic matter. Similar
characteristics are found in the samples representing the CTBE, but with more reddish
groundmass and bituminite. The Turonian samples are enriched in bituminite, with rapid
increase towards younger samples. Similarly the alginite macerals are most abundant in
the younger samples. Vitrinite and inertinite are very rare throughout the investigated
section with a relative increase in the lower Cenomanian samples. But even combined

142
they do not exceed 1vol-%. In summary, the microscopic observation classifies the source
rock into 4 types which are: i) bituminite-free source rock with yellowish fluorescing
submicroscopic OM (characterizes the lower Cenomanian), ii) bituminite-fair source
rock with rare alginite and weak reddish fluorescing submicroscopic OM (characterizes
the upper Cenomanian to lower Turonian), iii) source rock with no visible OM
(characterizes few samples representing the CTBE), and iv) bituminite-rich with fair
visible OM and strong reddish fluorescing submicroscopic OM.
4.5.4 Molecular Geochemistry
Almost all samples analyzed showed pristane and phytane predominance over the
adjacent n-alkanes. The samples representing the CTBE show elevated n-C16 to n-C19 and
low pristane/phytane (Pr/Ph) ratios, lower than in the other intervals (Fig. 4-12). The
samples also show the elevated concentrations of methylated hopanes (C1-Hop) that
coelute with non-methylated hopanes, and a fair percentage of C1-Hop that averages
~20% (of total hopanes) decreasing towards the younger samples (Table 4-5). The C27,
C28 and C29 steranes show similar characteristics and equal proportions for all samples,
plotting within a narrow area (Fig. 4-13). The C28/C29 steranes ratio varies slightly
throughout the section but never exceeds 1.05. All samples show sterane/hopane ratios
greater than 1% except for two samples at the top of the section.
Fig. 4-12 Pr/C17 vs. Ph/C18
diagram suggests marine and thermally immature organic matter for all sample. The classification method is from Shanmungam (1985).

143
Fig. 4-13 C27-C29 steranes ternary diagram indicates shallow open marine depositional environment.
Table 4-4 Molecular geochemistry data of the aliphatic fractions.
Table 4-4 Continued
Sample Depth Age Ster/Hop Pr/Ph C28/C29str Pr/n-C17 Ph/n-C18 M-Hop/total Hop
14/1099 75.09 T 1.06 0.36 0.66 2.82 9.40 0.31
14/1119 95.37 T 1.30 0.55 0.54 4.37 9.05 0.29
14/782 100.92 CT 0.66 0.71 0.72 6.45 8.99 0.23
14/783 101.67 CT 0.90 0.85 0.86 4.55 6.71 0.17
14/784 102.44 CT 1.13 0.66 0.90 9.82 15.27 0.18
14/785 103.66 CT 1.49 0.88 0.84 8.61 7.10 0.21
14/786 103.97 CT 1.61 0.56 0.75 5.54 11.62 0.17
14/787 105.62 CT 1.22 0.63 0.97 6.05 10.60 0.25
14/788 106.43 CT 1.99 0.45 1.05 6.14 12.16 0.22
14/789 107.64 CT 1.70 0.55 0.83 5.75 9.89 0.25
14/790 107.92 CT 1.49 0.39 0.85 4.26 7.75 0.21
14/791 109.19 CT 1.62 0.37 0.93 5.59 9.39 0.25
14/792 110.48 CT 1.26 0.33 0.92 4.34 10.59 0.27
14/794 112.19 CT 1.17 0.37 1.06 4.34 10.10 0.26
14/795 113.51 CT 1.26 0.34 0.84 5.59 10.80 0.29

144
Table 4-4 Continued
Sample Depth Age Ster/Hop Pr/Ph C28/C29str Pr/n-C17 Ph/n-C18 M-Hop/total Hop
14/586 117.03 UC 1.08 0.46 0.80 4.27 10.51 0.27
14/590 121.18 UC 1.41 0.45 0.93 3.80 10.00 0.30
14/593 124.05 UC 1.20 0.54 1.01 7.15 14.26 0.32
14/653 218.74 UC 1.40 0.77 1.08 4.11 8.29 0.32
14/658 228.07 LC 0.66 1.19 3.30 6.90
14/663 238.58 LC 0.98 1.29 0.90 3.82 4.75 0.35
14/673 258.24 LC 0.74 1.20 4.57 6.57
4.5.5 Curie-Point-Pyrolysis Gas Chromatography-Mass Spectrometry
All samples show an elevated abundance of thiophenes (Table 4-5). The
thiophenes/benzenes ratio shows very low values for the lower Cenomanian (0.98) then
it increases to peak during the CTBE (8.06) and decreases slightly throughout the
Turonian with values above 5.00.
Table 4-5 Total thiophenes/total benzenes data from CPPyGCMS data used as a proxy of Sorg/Corg
Sample Depth (m) Age Total thiophenes/Total benzenes
14/1077 53.52 Turonian 5.54
14/1085 61.40 Turonian 4.35
14/1105 80.08 Turonian 8.18
14/1113 88.70 Turonian 5.12
14/1117 93.20 Turonian 6.26
14/1118 94.45 Turonian 7.06
14/782 100.92 CTBE 5.30
14/705 101.89 CTBE 8.06
14/715 104.02 CTBE 5.35
14/598 129.04 upper Cenomanian 3.81
14/619 150.23 upper Cenomanian 3.04
14/628 168.00 upper Cenomanian 3.69
14/638 187.92 upper Cenomanian 1.82
14/673 258.24 lower Cenomanian 3.76
14/678 268.50 lower Cenomanian 2.21
14/768 305.30 lower Cenomanian 0.99
14/776 345.05 lower Cenomanian 0.96

145
4.6 Discussion
4.6.1 Depositional environment
Organic petrology investigation clearly reveals that the samples are dominated by UOM
and liptinite macerals indicating an aquatic, marine environment. The major element
data reveal that the lower Cenomanian is rich in silicate minerals and rutile combined
with elevated Fe2O3, SiO2, Al2O3, K2O and TiO2 concentrations indicating more
terrigenous input as compared to the overlying, younger units which are carbonate-
dominated (Fig. 4-6). All samples, especially those representing the CTBE are poor in
MnO, indicating anoxic bottom water conditions (Calvert and Pedersen, 1993; Aquit et
al., 2013 Moreover, phosphorous deposition decreases during increasing anoxic bottom
water conditions. Simultaneously the increased availability of phosphorus in the upper
water column increases the productivity which further results in declining the bottom
water oxygen (Calvert et al., 1996). Phosphorus usually peaks before the onset of an OAE
and retains to its background values after the end of the event (Mort et al., 2007; Jenkyns,
2010). In this well, phosphorous shows elevated values prior to, very low value within
and slightly elevated values above the CTBE supporting the previously described
hypothesis (Fig. 4-6). Similar observations of elevated P concentrations were found by
Mort (2006) in the Cenomanian of the Mohammed Plage section (Mpl; Fig. 4-1) and by
Nederbragt et al. (2004) in the S13 well. Elevated P concentrations prior to the onset of
the OAE2 are characteristic of equatorial shelves of the Mid-Cretaceous Proto-Atlantic
Ocean as suggested by Kraal et al. (2010). These regional data are in accordance with the
results in the current study.
Molecular geochemistry data provides excellent environmental indicators. Various
different parameters have been used. Pristane (Pr) and phytane (Ph) are two of the most
prominent isoprenoids in petroleum samples that originate partly from the phytol side
chain of chlorophyll a (Brooks et al., 1969; Powell and McKirdy, 1973; Didyk et al., 1978).
Depending on the oxygen availability the diagenesis of phytol leads either to pristane
under more oxic conditions or to phytane under more anoxic conditions (Koopmans et
al., 1999; Peters et al., 2005). Therefore, the Pr/Ph ratio has been widely used to

146
characterize the depositional environment (Brooks et al., 1969; Didyk et al., 1978; ten
Haven et al., 1987; Powell, 1988). Pr/Ph ratios lower than 1.0 usually indicate anoxic,
marine carbonate lithology and values from 1.0 to 1.5 marine shale lithology. Values
higher than 2 indicate deltaic shales or terrestrial environments (Peters et al., 2005).
Furthermore, the correlation between the Pr/n-C17 and Ph/n-C18 is used to indicate in
more detail kerogen types, depositional environments, thermal maturity and
biodegradation (Peters et al., 2005). n-Alkane distribution can also be indicative of
organic matter input. For example, high abundance of n-C15 to n-C21 (at low thermal
maturity) indicates marine algae and high abundance of n-C25- n-C31 indicates vascular
plant inputs (Yunker et al., 2005). Using these molecular indicators the following sample
characterizations can be deduced. The lower Cenomanian samples show Pr/Ph ~1
indicating marine shales and probably more oxic conditions compared to the other
samples in this study (Table 4-4). These samples have a TOC of ~2%, HI values of about
500mgHC/TOC and relatively high OI values. Sample 14/653 from the lower/upper
Cenomanian boundary shows Pr/Ph lower than 1.0 indicating a change in the
depositional environment. All these data suggest that a marine siliclastic depositional
environment dominated in the lower Cenomanian, which later shifted to a more
carbonate-dominated system. This is in agreement with the elemental data discussed
before.
In the upper Cenomanian, Pr/Ph ratios decrease significantly towards the CTBE to
descend below 0.32 within it. Higher values occur at the end of the CTBE but remain
below 0.8, indicating strong anoxic conditions during the CTBE (Table 4-4), which
support the OAE theory (i.e. Jenkyns, 2010; Sachse et al., 2014). The correlation between
Pr/n-C17 and Ph/n-C18 also indicates the presence of marine organic matter as well as
anoxic bottom water conditions (Fig. 4-12). All samples are also characterized by
dominance of n-C16 to n-C19 indicating a major contribution from algae (Cranwell et al.,
1987). Pr and Ph occur at higher concentrations than the n-alkanes, which could indicate
either biodegradation or very low thermal maturity (Fig. 4-12). Biodegradation is
possible as the samples were taken from relatively shallow depth between 24 and 350m.

147
Furthermore, the geothermal gradient in the Tarfaya Basin is 25°C/km (Zarhloule, 2003)
and the average surface temperature is ~19°C implying that the samples are exposed to
temperatures of 19 to 27°C. Additionally, the water table in the basin is presently at a
depth of approximately 30m (Zarhloule, 2003) and could act as a supplier for nutrients.
These conditions favor biodegradation. However, biodegradation is not severe as the n-
alkanes are preserved in relatively high abundance and only a small proportion of
unresolved complex organic material was observed (Hedges et al., 2000). Sachse et al.
(2014) made similar observations of high abundance of Pr and Ph in samples from the
younger OAE3 interval in the Tarfaya Basin. Cenomanian and Turonian outcrop samples
from the current well vicinity is also similar to the samples in this study, but with more
terrigenous characteristics. A reason for this might be the fact that the outcrop samples
represent a more proximal area than the samples in this study. Kolonic et al. (2002) and
Kuypers et al. (2004; S13 well) (Fig. 4-1) briefly discussed the Pr and Ph geochemistry as
well and obtained results similar to those of the CTBE samples in this study. Based on
their conclusions and in combination with the new results presented in this study, a low
thermal maturity is seen as the most probable explanation for the high Pr/n-C17 and
Ph/n-C18 ratios. An alternative is the contribution of N2-fixing cyanobacteria that contain
chlorophyll a (Ohkouchi et al., 2006; Ricci et al., 2014; see below). The last possible
explanation for this phenomenon is that kerogen sulfurization and associated chemical
reactions at early diagenesis led to the elevation of phytane and accordingly the pristane
High ratios of steranes to hopanes indicate marine organic matter predominance (Peters
et al., 2005). The CTBE samples have sterane/hopane ratios greater than 1.0 indicating
dominance of marine algae. This supports the results of the maceral analysis, which show
a dominance of alginite, but it should be noted that the major part of the organic matter
is submicroscopic. C27-C29 steranes provide another useful tool to obtain information on
the depositional environment and source of kerogen (Fig. 4-13). High abundance of C28
usually characterizes marine samples (Peters, et al., 2005). Our data indicate that the
source rocks were deposited in an open to shallow marine/coastal environment and
agrees with results from Sachse et al. (2011) for outcrop samples from the Cenomanian
and Turonian.

148
Methylated hopanes are used as biomarkers for oxygen-producing and N2-fixing
cyanobacteria and thus the methylated hopanes/hopanes ratio is regarded as a good
environmental indicator (Summons et al., 1999; Kuypers et al., 2004b; Peters et al., 2005;
Ricci et al., 2014). The cyanobacteria are a diverse group of prokaryotes and contain
chlorophyll a, generating oxygen by photosynthesis (Ohkouchi et al., 2006; Ricci et al.,
2014). They have no common microscopically identifiable fossils but only molecular ones
(Kuypers et al., 2004b). Many of them have the ability to fix N2 (Ohkouchi et al., 2006).
Moreover, Kuypers et al. (2004b) and Jenkyns (2010) proposed that cyanobacteria
played a major role in the nitrogen cycle and suggested that cyanobacteria were key
players during the Cretaceous. Very low methylated hopanes concentrations (<2.0% of
total hopanes) typify the samples up to the Jurassic with few exceptions. In contrast, the
CTBE samples and the samples from the underlying and overlying Cretaceous units from
well SONDAGE-4 show high ratios of methylated hopanes/hopanes indicating
concentrations up to 20% (Table MG) which are in line with earlier studies on Cretaceous
black shales (Kuypers et al., 2004a).
Translating these ratios into a percentage contribution of cyanobacteria is certainly
difficult and only vague. In view of the sterane/hopane ratios (Table 4-4), n-alkane
pattern, and isoprenoid/n-alkane ratios (Fig. 4-12), and the high HI values of Rock-Eval
pyrolysis we can assume that marine phytoplankton was the major contributor to the
organic matter, but that both bacteria and cyanobacteria provided additional important
pools of the total organic matter, whereas terrigenous contribution was small, which is
also supported by microscopic observations (Fig. 4-10).
Under anoxic depositional environment, sulfate reducing bacteria obtain energy by
oxidizing organic compounds and reducing SO4-2 to yield HS-1, HCO3-1 and remaining non-
metabolizable organic matter (Leventhal, 1982; Schulze and Mooney, 1993). These
organic residues will constitute the preserved organic carbon in the sediments upon
burial (Morse and Berner, 1995). The resulting HS-1 in combination with Fe from pore
water or clay will form pyrite (Leventhal, 1982; Berner and Raiswell, 1983; Berner, 1984;
Raiswell and Berner, 1986; Dean and Arthur 1989; Schulze and Mooney 1993; Morse and

149
Berner, 1995; Leventhal, 1995). The ratio between the preserved organic carbon and
total sulfur (TOC/TS) is used to determine the palaeo-depositional environment (Berner,
1984). Sediments deposited under normal marine conditions (oxic water and typical
ocean water salinity) will have a TOC/TS ratio of about ~2.8. Higher and lower values
characterize lacustrine and euxinic depositional environments, respectively (Berner,
1984), but iron limited carbonate-dominated depositional environments with high
organic carbon percentages can also lead to low TOC/TS ratios (Bou Daher et al., 2014,
2015). However, several factors that control the organic carbon and pyrite formation
need to be taken into considerations before using the methods based on Berner (1984).
These factors are: i) the presence of metabolizable versus nonmetabolizable organic
matter (type of organic matter), ii) the portion of organic matter that metabolizes
through sulfate reduction, iii) the portion of reduced sulfide that is oxidized and not
converted to pyrite, iv) the availability and reactivity of reactive detrital iron minerals
that react with excess hydrogen sulfide in the system to create pyrite, and v) the
sedimentation rate (Leventhal, 1982; Berner and Raiswell, 1983; Berner, 1984; Raiswell
and Berner, 1986; Littke et al., 1991; Schulze and Mooney 1993; Canfield, 1994;
Leventhal, 1995; Morse and Berner, 1995). In highly calcareous sediments the amount of
detrital iron minerals is very limited which results in forming less pyrite than it is
expected under normal marine conditions even at high organic carbon contents (Berner,
1984; Raiswell and Berner, 1986; Dean and Arthur, 1989; Bou Daher et al., 2015).
Moreover, at high sedimentation rates, the bottom water oxygen content has negligible
influence on organic carbon preservation whereas at low rates only euxinic, oxygen-free
bottom water conditions allow for excellent preservation (Canfield, 1994). In the Tarfaya
samples, TS generally correlates positively with TOC (Fig. 4-14). Most of the samples plot
below the normal marine trend line (Berner, 1984) except the samples low in carbonate
content, in particular the lower Cenomanian samples. This is similar to other marine,
carbonate-rich successions, where the detrital iron supply was limited and thus less
pyrite formed (Kolonic et al., 2002; Sachse et al., 2011; Bou Daher et al., 2015).

150
Fig. 4-14 TS versus TOC cross-plot shows that the majority of the Cenomanian to Turonian samples are plotted below the normal marine line of Berner (1984) unlike the majority of the Lower Cenomanian samples which plot above the line
To further explore the relationship between Fe, TS and TOC, the relationship between
sulfur and iron content is displayed in Figure 4-15. The TS to Fe stoichiometric ratio is
1.15 and plotted as “pyrite line” (Worthmann et al., 1999). The samples of the lower
Cenomanian have excess of Fe which holds also true for one of the upper Cenomanian
samples (Fig. 15). All younger samples either plot close to the pyrite line or have excess
of sulfur indicating the presence of other forms of sulfur such as organic sulfur. This
conclusion is supported by the high thiophenes/benzenes ratio derived from the CP-Py-
GC-MS data characterizing in particular the CTBE samples (Table 4-5). All samples from
the CTBE show no visible organic matter (Fig. 4-11) possibly indicating that conversion
of organic matter into sulfur-bearing kerogen went along with a physical degradation and
loss of biogenic morphology of organic particles.
In the process of forming pyrite, 2 moles of organic carbon is required to form one mole
of reduced sulfur (Dean and Arthur, 1989; Littke et al., 1991). This means that the original
organic carbon content was higher before sulfate reduction, which can be easily deduced
from sulfur values versus depth profiles within young, marine sediments: at the
sediment/water interface, TOC/TS is very high reaching a quite stable value close to 2.8
only at the base of the sulfate reduction zone within the sediments (Littke et al., 1997).

151
In order to obtain the original organic carbon (before sulfate reduction) the following
equation was introduced by Littke (1993):
TOCoriginal= TOC+2S *Mc/Ms
Where the Mc and Ms are the molecular weight of carbon and sulfur respectively.
Subsequently the values of original weight percent of organic matter can be determined
using:
OM= TOCorignal * 100/COM
Where COM is the carbon content of organic matter.
Fig. 4-15 TS versus Fe shows that the majority of the samples from Cenomanian to Turonian are plotted above the Pyrite line indicating that the sulfur in theses samples is present in other forma than pyrite.
Using this value along with the carbonate content we can calculate the silicate content by
subtracting the sum of the organic matter and carbonate from 100. Thus the
synsedimentary system of petroleum source rocks can be represented based on the three
major components in a triangular plot (Fig. 4-16). Limitations of this method are
discussed in Littke (1993).
A negative correlation is observed in carbonate-rich samples (CaCO3>70%) between
CaCO3 and TOC (Fig. 4-16; see also Fig. 4-5), especially for the CTBE and Turonian. This
may occur because in a carbonate-dominated environment, enhanced silicate content

152
goes along with enhanced nutrient supply and thus bioproductivity leading to higher
organic matter. In contrast, the low-carbonate lower Cenomanian samples show a
positive correlation between CaCO3 and TOC, similar to younger, Santonian samples from
the Tarfaya Basin (Sachse et al., 2014), indicating that during this episode (lower
Cenomanian), nutrient supply was not a limiting factor for organic matter accumulation
(see Kuhnt et al., 1997).
4.6.2 Source rock potential and organic matter type
Various geochemical techniques were used to evaluate the oil shale and petroleum
source rock potential for the samples from the Cenomanian and Turonian, following
guidelines on usage of Rock-Eval pyrolysis data by Peters (1986). However, based on
Rock-Eval parameters a differentiation between kerogen type II and kerogen type IIS is
not possible. Hence, the CPPyGCMS data provide a useful tool to define the kerogen more
precisely and to assess the kerogen Sorg/Corg ratio. The lower Cenomanian samples show
very good source rock richness and quality yet the least source rock potential and organic
matter quality among the other sections (Figs. 4-4; 4-9). In particular, the section
between 315.0 and 345m shows very good source rock richness and quality with
potential for generating oil at higher maturity. Two samples were analyzed by CP-PY-GC-
MS showing low Sorg/Corg ratios. Moreover, the majority of the investigated samples show
a lack of bituminite, predominance of UOM associated with alginite and rare vitrinite and
inertinite (Fig. 4-10). This indicates along with the Rock-Eval data that these samples
contain kerogen type-II with some of the lower Cenomanian samples containing mixed
types II/III (Fig. 4-8). In addition, the Sorg/Corg are low compared to the younger sections.
All maturity parameters suggest that these source rocks are immature.
The upper Cenomanian source rocks have an even greater source rock potential than the
lower Cenomanian especially toward the CTBE showing higher TOC and HI values (Figs.
4; 9). With respect to mineralogy, the Cenomanian gently shifts from silicate- to
carbonate predominance with highest OM richness occurring when the carbonate
content is between 45% and 80% (Fig. 4-16). The samples evaluated by microscopy show
that the majority of the organic matter is unstructured with rarely visible liptinite

153
macerals (Fig. 4-11). The samples also show a presence of bituminite matrix in fair
abundance (Fig. 4-10C). Pyrolysis data suggest strong presence of thiophenic sulfur
compounds compared to the lower Cenomanian indicating the presence of considerable
amounts of organic sulfur, i.e. kerogen Type IIS. Based on Tmax and molecular
geochemistry these samples are immature.
The Turonian samples are similar to those of the CTBE, but with somewhat lower Sorg.
They also differ from the CTBE in organic matter type especially in the younger interval
(Turonian), where a high amount of bituminite is observed as well as alginite (Fig. 4-
10A).
Fig. 4-16 OM-CaCO3-Silicates trinary diagram (modified after Littke, 1993) showing that the best organic preservation is achieved at CaCO3 concentration between 45 to 80%.
Oil generation potential of the entire sequence is very high, with a tendency of sulfur-rich
oil being generated especially within the CTBE. Sulfur-rich kerogen is known to generate
first petroleum at lower temperatures than sulfur-poor kerogen (Pepper and Corvi,
1995). In comparison with literature data compiled in Wenke (2014) for the on-offshore
Tarfaya Basin, the sample set supports the excellent source rock potential of the Late
Cretaceous. Increasing amounts of OM were measured in the onshore area, whilst very
high amounts have not been reported for the offshore area (Wenke, 2014). TOC values
average 3% and HI values of 140-400mgHC/gRock were published (Wenke, 2014).

154
Moderate-high values of 0.8 to 4% TOC were measured on the shelf (HI 150-
400mgHC/gRock), and up to 6% on the slope (Wenke, 2014). The CTBE source rocks are
globally distributed and studied in great detail in North Africa and Mid-Atlantic regions
(e.g. Herbin et al., 1986; Schlanger et al., 1987; Foster et al., 2004; Lüning et al., 2004;
Jenkyns, 2010). All of the above mentioned studied locations exhibited high TOC values
within wide ranges based on the depositional environmental conditions. Limited
information is available on the kerogen sulfurization during the CTBE, but TS
enrichments were recorded widely during this time.
Two Albian samples show an excellent source rock potential (Table 4-1). Due to the low
number of samples only Rock-Eval and TOC analyses were conducted with no further
geochemical investigation. Nevertheless, the available data support the general idea of
an Albian source rock in the Tarfaya Basin. Wenke (2014) related the increasing source
rock potential during the Albian to the termination of the TanTan Delta. This also matches
with results of Sachse et al. (2011), who identified the Albian source rock further onshore
as being only of marginal quality (low TOC and HI). Thus, a high variation of organic
matter quantity and quality based on the spatial and temporal distribution of the Albian
deposits can be assumed.
4.6.3 Kerogen diagenesis and properties
The formation and preservation of kerogen results from two main pathways which are:
i) the selective preservation and ii) degradation-recondensation pathways (Largeau and
Derenne, 1993). The first pathway is based on the existence of the insoluble and non-
hydrolysable macromolecules in the outer walls of the original species (Derenne et al.,
1992) that is resistant to microbial and chemical alteration at the diagenesis stage. The
second pathway for kerogen formation is a complete restructuring of the organic matter
due to degradation followed by recondensation (Welte, 1972; Tissot and Welte, 1984;
Largeau and Derenne, 1993; Taylor et al., 1998). The lack of resistant macromolecules
will result in the formation of the unstructured organic matter (UOM) (Largeau and
Derenne, 1993). One essential mechanism destroying the morphology of organic matter
is the early diagenetic vulcanization process which is related to sulfur incorporation into

155
the organic matter (Taylor et al., 1998). Moreover, cyanobacteria through selective
preservation pathway could result in UOM (Pacton et al., 2006). The samples from the
upper Turonian to Cenomanian show high Sorg/Corg values and high proportions of
amorphous kerogen with extreme abundance in the samples representing the CTBE.
These samples have high Sorg/Corg values and lower amorphous kerogen abundance in
the upper section, indicating early diagenetic reactions between sulfur and organic
matter. De Leeuw and Sinninghe-Damsté (1990) showed that reaction between H2S or
HSx - with phytolesters or phytol will result in thiol which will react with the
functionalities of other compounds to produce larger materials. This process saves
phytol precursors from degradation in the upper part of the sediments. With increasing
diagenesis the C-S bonds are cleaved and phytane is generated after hydrogenation of
intermediate phytenes and phytadienes.
Littke and Sachsenhofer (1994) showed that source rocks from upwelling areas are
generally characterized by dominance of UOM associated with small particles of alginite
and rare terrestrial organic matter. This hypothesis fits perfectly the studied samples
which are clearly dominated by submicroscopic organic matter.
4.7 Conclusions
Rock-Eval and elemental analysis results reveal excellent source rock potential for the
entire, thick lower Cenomanian to Turonian section. Based on Rock-Eval evaluation,
there are two main groups of source rocks which are i) moderately high in TOC and HI,
comprising the lower Cenomanian and ii) high in TOC and HI from the upper Cenomanian
to Turonian.
Organic matter characterization based on molecular geochemistry shows a marine origin
for the organic matter in the Cenomanian to Turonian samples. This is supported by
microscopic analysis that suggested predominance of UOM associated with alginite and
rare vitrinite and inertinite. The samples show different levels of kerogen sulfurization
depending on the depositional environment. Therefore, the samples are classified based
on the organic sulfur content as i) Sorg-rich (Sorg/Corg =5-8), i.e. the CTBE and Turonian

156
samples, ii) Sorg-moderately rich (Sorg/Corg ~3.5), i.e. the Upper Cenomanian and iii) Sorg-
poor (Sorg/Corg <1), i.e. the lower Cenomanian.
The upper Cenomanian to Turonian are characterized by relatively high carbonate
content and the samples from the lower Cenomanian are characterized by high silicate
content. The highest organic matter content is found when the carbonate content is
between 50 to 80 %. All samples were deposited under anoxic conditions with the highest
oxygen depletion occurring during the CTBE based on biomarker data, coupled with high
sea water temperatures.
Samples younger than the silicate-rich lower Cenomanian interval are expected to
generate sulfur-rich oil. In conclusion, the integrated study elucidates possible processes
leading to the source rock development and kerogen formation within the Cenomanian
and Turonian section. Furthermore, it supports the idea of an Albian source rock
potential in the Tarfaya Basin, which seems, however, relatively local. The study
investigated the relative organic sulfur enrichment which is of great importance, e.g. for
the oil shale retorting. Further quantitative analyses are highly recommended on this
aspect.

157
Chapter 5
Chapter 6 | Thesis General Discussion
5.1 Introduction
The previous three studies elucidated variable source rock types in three different
shallow marine settings. This chapter attempts to combine the data from these studies to
assess the changes in source rock depositional environments from proximal to distal
settings. The investigation is based on three main controlling factors that determine the
source rock characteristics. These factors are terrigenous and biogenic fluxes and
diagenetic processes. The results will be summarized in a conceptual geochemical model.
The second aim of the current investigation is to find new relationships between
elemental data and organic matter types, productivity and preservation which
potentially will lead to a better prediction of source rocks facies in petroleum basins.
5.2 Studied Parameters
The parameters are classified into three types which are terrigenous, biogenic and
diagenetic proxies (Fig. 5-1). To verify the terrigenous origin of the investigated
elements, they were plotted against Al2O3. The elements that positively correlated with
Al2O3 are considered terrigenous and include TiO2, Fe2O3, K2O and MnO (Fig. 5-2). The
biogenic parameters indicate organic fluxes to the ocean bottom. They include TOC, HI,
OI, Tmax, and CaCO3. The SiO2 can be from terrigenous or biogenic inputs. Therefore, it is
excluded from the comparisons. The diagenetic process parameters correspond to ratios
or proxies that indicate reactions that occur due to various bottom water conditions.
They include Pristane/Phytane, thiophenes/benzenes, S/Fe and Mn/S ratios.
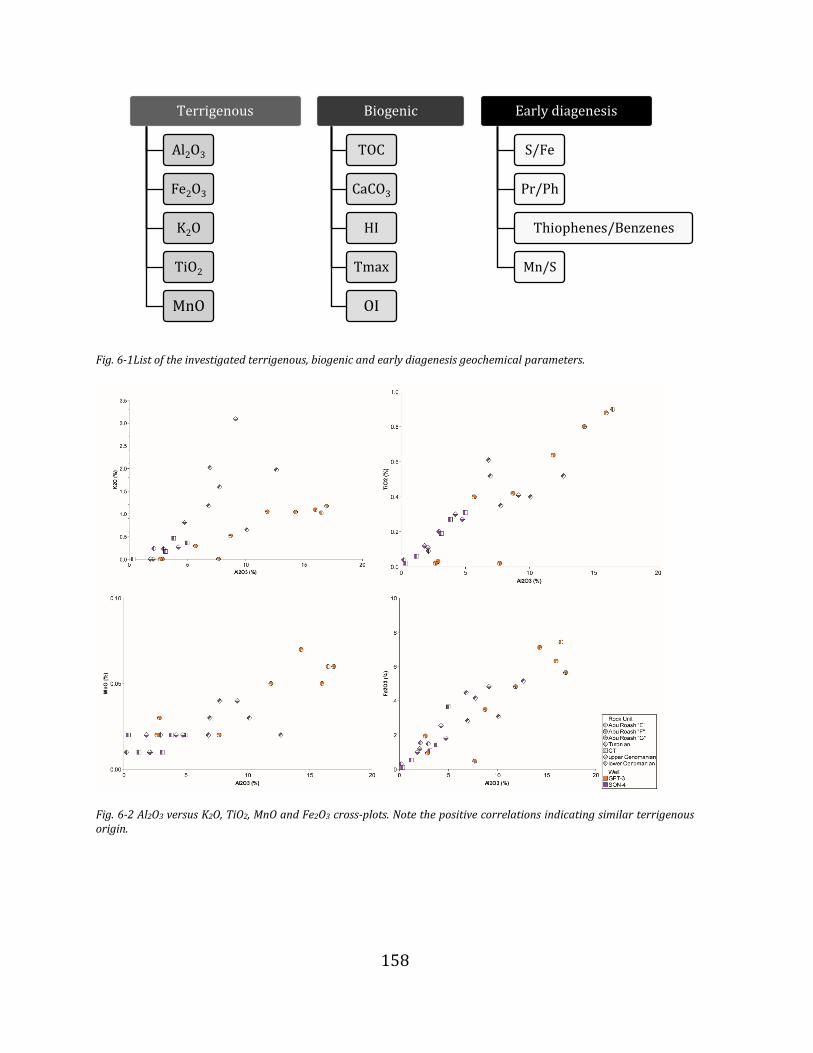
158
Fig. 6-1List of the investigated terrigenous, biogenic and early diagenesis geochemical parameters.
Fig. 6-2 Al2O3 versus K2O, TiO2, MnO and Fe2O3 cross-plots. Note the positive correlations indicating similar terrigenous origin.
Terrigenous
Al2O3
Fe2O3
K2O
TiO2
MnO
Biogenic
TOC
CaCO3
HI
Tmax
OI
Early diagenesis
S/Fe
Pr/Ph
Thiophenes/Benzenes
Mn/S

159
5.3.1 Sedimentation systems and organic matter productivities
The ternary diagram by Littke (1993) (CaCO3-OM-Silicates) is used to indicate the
difference in the organic matter richness at variable carbonate-silicates ratios. A detailed
explanation of the concept is provided in Chapter 4. The Nile Delta samples which
represent a proximal depositional setting (Group-A; Fig. 5-3) show low carbonate
contents as typical of fluvial-deltaic settings. This setting is characterized by TOC values
range from ~ 0.5 to 3.5%. On the other hand, the Abu Gharadig Basin excluding the Abu
Roash “F” Member showed almost constant original organic matter contents with
variable carbonate concentrations. Group-B samples, which represent more distal
marine settings, illustrate an increasing trend of original organic matter proportion
toward the carbonate corner meaning that the silicate sedimentation dilutes the TOC and
carbonate contents. They have TOC values not exceeding 4%. Group-C samples, which
were deposited at more distal setting, witnessed a pronounced organic matter
productivity that characterizes the samples containing CaCO3 from 40-80%. The samples
with CaCO3 higher than 80% represent lower organic matter productivity probably due
to a lack of terrigenous-derived nutrients. The samples from this group usually have TOC
contents higher than 6%.

160
Fig. 6-3 Geochemical conceptual model summarizing the differences between the three main depositional environments investigated in the current thesis.

161
Fig. 6-4 Carbonate-original organic matter-silicate diagram of selected samples from the Nile Delta (matariya-1 and Abu
hammad-1 wells), The Abu Gharadig Basin (GPT-3 well) and the Tarfaya Basin (SON-4).
5.3.3 Bottom water conditions
As discussed previously in Chapter 1, the oxygen contents of the bottom water play an
essential role in organic matter preservation. These contents vary throughout the
continental shelf depending upon bathymetry, sea level, and climate. In the following, the
consequences of the bottom water oxicity variation is attested using various parameters
from the above. Only Groups B-C are included in this analysis.
At the sea bottom, Mn reduction increases the pore water oxygen contents and
consequently dominates the organic matter oxidation (Tribovillard et al., 2006). This
could explain the positive correlation between MnO and OI values (Fig. 5-5a) which
classifies the samples into two groups (Group-B, C; Fig.5-3). Group-C is low in MnO
contents and has OI values under 80 mgCO2/gTOC. Following the same trend, Group-B
0
10
20
30
40
50
60
70
80
90
100
Ori
gin
al O
rgan
ic M
att
er (%
)
0102030405060708090100
Carbonates (%)
0
10
20
30
40
50
60
70
80
90
100
Silicate
s (%)
Well
Matariya-1
Abu Hammad-1
GPT-3
SON-4
Rock Unit
Abu Roash "A"
Abu Roash "B"
Abu Roash "C"
Abu Roash "D"
Abu Roash "E"
Abu Roash "F"
Abu Roash "G"
Baharyia
Sidi Salem Formation
Alam El-Bueib Formation
Masajid Foramtion
Turonian
CT
upper Cenomanian
lower Cenomanian
Albian

162
shows higher MnO contents and OI values. The positive correlation implies that the
increase in OI index is, to a large extent, related to organic matter oxidations. However,
the effect of terrigenous input on elevating the OI values cannot be ruled out. This further
supported by the positive correlation between MnO and Pr/Ph (Fig. 5-5b) and the
negative correlation between the OI and Thiophenes/benzenes ratio (Fig. 5-6) implying
more oxygen containing organic compounds. Group-C has HI values greater than 600
mgHC/gTOC whereas Group-B has lower values denoting better preservation in the
absence of MnO. To conclude, the bottom water oxicity was apparently higher in Group-
B settings compared to the Group-C.
Fig. 6-5 MnO versus a) oxygen index and b) Pr/Ph plots showing positive correlations of selected samples from the Tarfaya Basin (SON-4) and the Abu Gharadig Basin (GPT-3).
In the HI versus Mn/S diagram, differences between the two groups are observed (Fig. 5-
7). Group-C has very low Mn/S ratio values indicating highly anoxic conditions. The Abu
Gharadig Basin samples from Group-B shows a positive correlation. This might represent
a deposition in stratified water column just below the O2-H2S boundary where Mn
concentration is high due to active cycling between the sediment-water interface and the
water column (Tribovillard et al., 2006). The stratification can be related to riverine
inputs that increase the Mn contents and modify the salinity in the upper layer. This
raises a question if the HI versus Mn/S diagram is a potential depositional environment
proxy to indicate marine water stratification.
a
0.00 0.02 0.04
MnO (%)
0.0
0.5
1.0
1.5
Pr/
Ph
WellGPT-3SON-4
Rock UnitAbu Roash "F"CT
0.00 0.02 0.04 0.06 0.08 0.10
MnO (%)
0
50
100
150
200
OI (
mg
CO
2/g
TO
C)
WellGPT-3SON-4
Rock UnitAbu Roash "E"Abu Roash "F"Abu Roash "G"TuronianCTupper Cenomanianlower Cenomanian
b

163
Fig. 6-6 Oxygen Index versus thiophenes/benzenes ratio of selected samples from the Tarfaya Basin (SON-4) and the Abu Gharadig Basin (GPT-3).
Fig. 6-7 Mn/S ratio versus hydrogen Index relationships illustrating positive correlation for the Abu Gharadig basin samples (GPT-3 well).
0 100 200
OI (mgCO2/gTOC)
0
2
4
6
8
10
Th
iop
hen
es/b
en
zen
es
WellGPT-3SON-4
Rock UnitAbu Roash "F"TuronianCTupper Cenomanianlower Cenomanian
0.0 0.2 0.4 0.6 0.8 1.0
Mn/S
0
200
400
600
800
HI (m
gH
C/g
TO
C)
WellGPT-3SON-4
Rock UnitAbu Roash "E"Abu Roash "F"Abu Roash "G"TuronianCTupper Cenomanianlower Cenomanian

164
The bottom water oxicity is also evaluated using the S/Fe ratio. Values higher than 1.15
indicate oxygen-depleted bottom water conditions and lower values point to higher
oxygen concentrations. The samples having S/Fe from 0.86 to 0.57 indicate suboxic
conditions. Lower values are attributed to oxic conditions (Dean and Arthur, 1989). The
S/Fe ratio has similar inverse relationships with TiO2, Al2O3, and MnO contents. The shift
in the trend occurs at S/Fe values of 0.67 (Fig. 5-8). This value is used as the boundary
between the suboxic and anoxic condition. Samples with S/Fe values between 0.67 and
0.57 represents suboxic marine settings with a fair abundance of terrigenous elements
(Group-B; Fig. 5-3). On the other hand, the samples with S/Fe ratio higher than 0.67
represents anoxic settings of Group-C.
Fig. 6-8 TiO2 versus S/Fe ratio relationship used as an example of the inverse relationship between terrigenous elements and S/Fe ratio.
5.3.5 Tmax and source rock properties
The samples in this study are similar in the thermal maturity yet have a broad range of
Tmax values. Therefore, the changes in Tmax values correspond mostly to organic matter
type. The Tmax has an inverse relationship with TOC which can be related to the organic
matter type or/and richness. As discussed previously, the low TOC samples are from
shallower marine settings where oxidation and dilution by terrestrial inputs of organic
0.0 0.5 1.0 1.5 2.0 2.5 3.0
TiO2 (%)
0
1
2
3
4
5
S/F
e
WellGPT-3SON-4
Rock UnitAbu Roash "E"Abu Roash "F"Abu Roash "G"TuronianCTupper Cenomanianlower Cenomanian

165
matter are higher than what is anticipated in deeper settings. Moreover, higher
contribution of terrestrial organic matter is expected in shallow marine deltaic
environments. Kerogen sulfurization takes place in anoxic conditions at deeper settings
only away from the terrestrial reactive Fe. In the thiophenes/benzenes ratio versus Tmax
correlation, two clusters are observed which represent Group-B and C (Fig. 5-9). The
samples from Group-C have thiophenes/benzenes ratio higher than 3 and Tmax values
range from 410 to 415°C. In contrast, the samples from Group-B have lower
thiophenes/benzenes ratios, and range in Tmax from 420 to 430°C. These differences in
Tmax values distinguish immature Type-II from Type-IIS kerogens. From the preceding
discussion, we can conclude that at similar thermal maturity, the Tmax values are
expected to be higher in shallow marine sediments then decrease towards deeper
settings. The results can be used to start rescaling the thermal maturity spectrum both in
kerogen type-II and –IIS.
Fig. 6-9 Tmax versus Thiophenes/Benzenes ratio of selected samples from the Tarfaya (SON-4) and Abu Gharadig basins (GPT-3) showing tow clusters.
5.4 New Geochemical Proxies
The Al2O3/TOC ratio is used as a proxy to indicate terrigenous inputs (Isaksen and Bohacs
2012). High values indicate more proximally setting and higher terrigenous dilution. The
S/Fe ratio has an inverse relationship with TOC/Al2O3 (Fig. 5-10) similar to the S/Fe
405 410 415 420 425 430 435 440
T-max (°C)
0
2
4
6
8
10
12
Th
iop
hen
s/B
en
zen
s
Well
GPT-3
SON-4
Rock Unit
Abu Roash "F"
Turonian
CT
upper Cenomanian
lower Cenomanian

166
versus terrigenous parameters discussed above. This indicates that the organic matter
oxidation becomes rapidly active when the S/Fe is lower than 0.67. Similar relationships
are found between the S/Fe versus MnO/TOC and TiO2/TOC. More work has to be
conducted to confirm these relationships which can be very useful for paleoenvironment
reconstruction. For example, the TOC/Al2O3 can be determined from petrophysical well-
logs. Thus, if the Al2O3/TOC ratio is determined from well-log of tens of wells in a basin,
the paleo-oxygen minimum zone can be mapped. The same holds true for the MnO/TOC
and TiO2/TOC versus S/Fe relationships. More samples need to be included to strengthen
this argument. The results of this study have implications for paleoenvironmental
reconstructions, basin and geological modeling.
Fig. 6-10 S/Fe versus Al2O3 ratios of selected samples from the Tarfaya and Abu Gharadig basins.
Al2O3/TOC

167
Chapter 7 | Conclusions
Source rock characterizations and depositional environment assessments were
conducted on samples from three basins representing variable shallow marine
settings. In the Nile Delta Basin, the Abu Hammad-1 well hosts siliciclastics gas
prone source rocks within the Lower Cretaceous Alam El Bueib Formation. It
encompasses kerogen Type-III with a minor contribution of degraded marine
organic matter. The biomarker and elemental data reveal a nearshore marine
depositional environment with oxic to suboxic bottom water. The 1D burial and
thermal history models indicate low thermal maturity and no significant thermal
hydrocarbon generation due to thin overburden and low heat flow. In contrast,
significant gas generation from the Mesozoic source rocks is expected to occur in
the northern Nile Delta Basin at deeper settings. In the Matariya-1 well, the Middle
Miocene Sidi Salem Formation and the lower part of the lower Miocene Qawasim
Formation illustrate moderate source rock quality. The source rock interval is
dominated by kerogen Type-III indicating gas-prone kerogen. Burial and thermal
history models prove that the maximum temperatures were attained in the
Quaternary where the basal part reached the onset oil maturity stage. The central
Nile Delta Basin appears to have better source rock quality compared to the
eastern part. This is perhaps due to shallower water conditions in the eastern Nile
Delta Basin during the Middle Miocene. The Miocene source rock intervals are
thick and interbedded with reservoir facies, making the migration pathway short
which inhibits hydrocarbon losses due to migration. The Middle Miocene
petroleum play has great potential for microbial and thermogenic gas.

168
The study of the Cenomanian to the Santonian succession at the GPT-3 well located
in the Abu Gharadig Basin identified two general bottom water conditions based
on TOC, TS, and CaCO3 relationships. Apart from the Abu Roash "F" Member, the
Bahariya Formation and the other members of Abu Roash Formation have
marginal TOC and similar trends in the TOC versus TS and CaCO3 relationships.
Geochemical and palynological data suggest that these rock units were deposited
in suboxic conditions in rather shallow water. The normal marine line defined by
Berner (1984) was shifted for these sediments to higher TS/TOC ratios probably
as a result of interactions between migrated hydrocarbons and pore water sulfate
due to biologically driven sulfate reduction, leading to high pyrite contents. The
Abu Roash “F” Member shows a positive relation between TOC and CaCO3 as well
as TS. It represents a period of fluctuating anoxic bottom water conditions and
enhanced preservation of organic matter. It comprises two sea transgression
phases separated by a sea regression. Transgression phase-I sediments were
deposited in anoxic bottom water conditions, leading to sediments rich in TOC,
CaCO3 and S and partly poor in Fe and other detrital elements. On the other hand,
regression phase witnessed sea level fall and fresh water incursions as can be
deduced from high contents of siderite, rutile, detrital elements and Mn. The
sediments contain fresh/brackish water algae Botryococcus, but also marine
palynomorphs. Moreover, transgression phase-II sediments are moderately rich
in TOC and higher in detrital element concentrations compared the sediment from
the first transgression. The sediments were deposited in suboxic conditions
somewhat poor Sorg. The palynological investigation reveals the occurrence of
marine and non-marine species. Transgression phase-I source rock contains
kerogen Type-IIS which yields high sulfur oil, whereas transgression phase-II
contains kerogen Types-II/III which generates sweet oil with minor gas upon
expulsion. Variable independent thermal maturity parameters indicate lower

169
thermal maturity for the Abu Roash “F” source rock interval compared to
sediments above and below. This finding suggests retardation/suppression of
maturation processes in oil-prone source rocks. The residual oils of the Abu Roash
“C” and “D” reservoirs reveal two different compartments. The Abu Roash “D”
residual oils are affected either by biodegradation or evaporation. In contrast, the
Abu Roash “C” residual oil shows a bi-modal n-alkane distribution and more short-
chain copounds. Correlations with source rocks are difficult due to the quality of
the residual oil samples and source rock heterogeneity.
In the Tarfaya Basin, the various organic geochemical analyses disclose excellent
source rock potential for the entire, thick Cenomanian to Turonian section. The
lower Cenomanian source rock is moderately high in TOC and HI and rich in
silicate. In contrary, the upper Cenomanian to Turonian source rocks are high in
TOC, HI and carbonate contents. Molecular geochemical data indicate a marine
origin for the organic matter for all samples. This is supported by microscopic
analysis that suggested a predominance of unstructured organic matter
associated with alginite and rare vitrinite and inertinite. The highest organic
matter content is found when the carbonate content is between 50 to 80 %. All
samples were deposited under anoxic conditions with the highest oxygen
depletion occurring during the CTBE based on biomarker data, coupled with high
sea water temperatures. The sediments show different kerogen sulfurization
levels depending on the depositional environment conditions. They are classified
based on the Sorg content as i) Sorg-rich (Sorg/Corg =5-8), i.e. the CTBE and Turonian
samples, ii) Sorg-moderately rich (Sorg/Corg ~3.5), i.e. the Upper Cenomanian and
iii) Sorg-poor (Sorg/Corg <1), i.e. the lower Cenomanian. Samples younger than the
silicate-rich lower Cenomanian interval is expected to generate sulfur-rich oil. The
study investigated the relative Sorg enrichment which is of great importance, e.g.
for the oil shale retorting.

170
References
Abdel Aal, A., El Barkooky, A., Gerrits, M., Meyer, H.J., Schwander M., Zaki, H. (2001).
Tectonic evolution of the Eastern Mediterranean Basin and its significance for the hydrocarbon
prospectivity of the Nile delta deep-water area. – GeoArabia, (6) 363-384.
Abdel Halim, M. (1999). Future hydrocarbon potential in the Nile Delta region, Egypt. In:
Zaghloul, Z. and El-Gamal, M. (Eds.): Deltas (ancient and modern), Mansoura University,
159-174.
Abdel-Kireem, M. R., Schrank, E., Samir, A. M., Ibrahim, M. I. A. (1996). Cretaceous
palaeoecology, palaeogeography and palaeoclimatology of the northern Western Desert,
Egypt. Journal of African Earth Sciences, 22 (1), 93-112.
Abdel-Rahman, A. Y. A. (2013). Well Log Analysis and Hydrocarbon Potential of the Khoman
Formation, GPT Field, Northern Western Desert, Egypt. World Applied Sciences Journal, 28
(12), 2288-2301.
Ahmed, M. A. A. (2008). Geodynamic evolution and petroleum system of Abu Gharadig
Basin, north Western Desert, Egypt (No. RWTH-CONV-113041). Lehrstuhl für Geologie,
Geochemie und Lagerstätten des Erdöls und der Kohle. P.255
Allen PA, Allen, J. R. (2005). Basin analysis principles and applications. Blackwell Scientific
Publications, Oxford.
Aquit, M., Kuhnt, W., Holbourn, A., Chellai, E. H., Lees, J. A., Kluth, O., Jabour, H. (2017).
Complete archive of late Turonian to early Campanian sedimentary deposition in newly drilled
cores from the Tarfaya Basin, SW Morocco. Geological Society of America Bulletin, 129 (1-
2), 137-151.
Aquit, M., Kuhnt, W., Holbourn, A., Chellai, E. H., Stattegger, K., Kluth, O., Jabour, H.
(2013). Late Cretaceous paleoenvironmental evolution of the Tarfaya Atlantic coastal basin,
SW Morocco. Cretaceous Research, 45, 288-305.
Aris, Y., Coiffait, P.E., Guiraud, M., 1998. Characterization of Mesozoic–Cenozoic
deformations and paleostress fields in the Central Constantinois, northeast Algeria.
Tectonophysics 290, 59–85.
Awad, G., M. (1984). Habitat of Oil in Abu Gharadig and Faiyum Basins, Western Desert,
Egypt. The American Association of Petroleum Geologists Bulletin. 68 (5), 564-57.
Awad GM (1985) A geophysical study on the Abu Gharadig basin, Egypt. Geophysics, 50 (1),
5-15.

171
Awad MZ (1994) Stratigraphic, palynological and paleoecological studies in the East-Central
Sudan (Khartoum and Kosti Basins), Late Jurassic to Mid-Tertiary. Berliner
geowissenschaftliche Abhandlungen, 161, 1–163.
Azab, A. A. (2014). Agnes high, Western Desert, Egypt: A structural study in view of potential
data modelling. Egyptian Journal of Petroleum, 23 (2), 229-245.
Bakr, M. M. Y. (2009). Molecular organic geochemistry of crude oil from Shushan and Abu
Gharadig basins, Western Desert, Egypt. JKAU: Earth Sciences, 20 (2), 97-125.
Bakun, A. (1990). Global climate change and intensification of coastal ocean
upwelling. Science, 247(4939), 198-201.
Barakat, M. K. A. (2010). Modern Geophysical Techniques for Constructing a 3D Geological
Model on the Nile Delta, Egypt, Dissertation, Technical University of Berlin, P 144.
Barber, P. M. (1981). Messinian subaerial erosion of the proto-Nile Delta. Marine Geology, 44
(3-4), 253-272.
Bayoumi, A. I., Lotfy, H. I. (1989) Modes of structural evolution of Abu Gharadig Basin,
Western Desert of Egypt as deduced from seismic data. Journal of African Earth Sciences, 9
(2), 273-287.
Beach Energy, 2014. Monthly drilling report, Ref. #005/14, January 2014. 1-4.
Berner, R. A. (1984). Sedimentary pyrite formation: an update. Geochimica et cosmochimica
Acta, 48 (4), 605-615.
Berner, R.A., Raiswell, R., (1983). Burial of organic carbon and pyrite sulfur in sediments over
Phanerozoic time: a new theory. Geochim. Cosmochimica Acta, 47, 855- 862.
Berra, F., & Angiolini, L. (2014). The evolution of the Tethys region throughout the
Phanerozoic: a brief tectonic reconstruction. AAPG Memoir 106: Petroleum Systems of the
Tethyan Region, 1-27.
Bou Daher, S., Nader, F. H., Müller, C., Littke, R. (2015). Geochemical and petrographic
characterization of Campanian–Lower Maastrichtian calcareous petroleum source rocks of
Hasbayya, South Lebanon. Marine and Petroleum Geology, 64, 304-323.
Bou Daher, S., Nader, F.H., Strauss, H., Littke, R., (2014). Depositional environment and
source-rock characterization of organic-matter rich upper Santonian – upper Campanian
carbonates, Northern Lebanon. Journal of Petroleum Geology, 37, 5-24
Bosworth, W. (1994). A model for the three-dimensional evolution of continental rift basins,
north-east Africa. Geologische Rundschau, 83(4), 671-688.
Bosworth, W., Huchon, P., & McClay, K. (2005). The Red Sea and Gulf of Aden
basins. Journal of African Earth Sciences, 43(1), 334-378.

172
Brooks, J. D., Gould, K., Smith, J. W. (1969). Isoprenoid hydrocarbons in coal and petroleum.
Nature, 222(5190), 257-259.
Bustin, R. M. (1988). Sedimentology and characteristics of dispersed organic matter in Tertiary
Niger Delta: origin of source rocks in a deltaic environment. AAPG Bulletin, 72(3), 277-298.
Calvert, S. E., Bustin, R. M., & Ingall, E. D. (1996). Influence of water column anoxia and
sediment supply on the burial and preservation of organic carbon in marine shales. Geochimica
et Cosmochimica Acta, 60 (9), 1577-1593.
Calvert, S. E., Pedersen, T. F. (1993). Geochemistry of Recent oxic and anoxic marine
sediments: Implications for the geological record. Marine Geology, 113 (1–2), 67–88.
Canfield, D. E. (1994). Factors influencing organic carbon preservation in marine sediments.
Chemical Geology, 114 (3), 315–329.
Carr, A. D. (2000). Suppression and retardation of vitrinite reflectance, Part 1. Formation and
significance for hydrocarbon generation. Journal of Petroleum Geology, 23(3), 313-343.
Coe, A. L. (2003). The sedimentary record of sea-level change. Cambridge University Press.
Cole, G. A., Abu-Ali, M. A., Coiling, E. L., Halpern, H. I., Carrigan, W. J., Savage, G. R., ...
& AI-Sharidi, S. H. (1995). Petroleum geochemistry of the Midyan and Jaizan basins of the
Red Sea, Saudi Arabia. Marine and petroleum geology, 12(6), 597-614.
Cranwell, P. A., Eglinton, G., Robinson, N. (1987). Lipids of aquatic organisms as potential
contributors to lacustrine sediments—II. Organic Geochemistry, 11 (6), 513-527.
Creaney, S. (1980). Petrographic texture and vitrinite reflectance variation on the Alston block,
north-east England. Yorkish. Geol. Soc., 42 (4), 553-580.
Das M. C., Mahato, S. B. (1983). Triterpenoids. Phytochemistry, 22:1071-1095.
Davison, I. (2005). Central Atlantic margin basins of North West Africa: Geology and
hydrocarbon potential (Morocco to Guinea). Journal of African Earth Sciences, 43 (1), 254-
274.
de Leeuw J.W., Sinninghe-Damsté J.S. (1990). Organic sulphur compounds and other
biomarkers as indicators of paleosalinity. In: Orr W. L., White C. M. (eds.) Geochemistry of
Sulfur in Fossil Fuels. 417-443.
Dean, W. E., Arthur, M. A. (1989). Iron-sulfur-carbon relationships in organic-carbon-rich
sequences I: Cretaceous Western Interior Seaway. American Journal of Science, 289 (6), 708-
743.

173
Derenne, S., Largeau, C., Berkaloff, C., Rousseau, B., Wilhelm, C., Hatcher, P.G. (1992). Non-
hydrolysable macromolecular constituents from outer walls of Chlorella fusca and
Nanochlorum eucaryotumm. Phytochemistry, 31 (6), 1923-1929.
Didyk, B.M., Simoneit, B.R.T., Brassell, S.C., Eglinton, G. (1978). Organic geochemical
indicators of palaeoenvironmental conditions of sedimentation. Nature, 272, 216-222.
Dolson, J. C., Shann, M. V., Matbouly, S. I., Hammouda, H., & Rashed, R. M. (2000). Egypt
in the twenty-first century: petroleum potential in offshore trends. GeoArabia 6(2), 211-230.
Dominik, W., (1985). Stratigraphie und Sedimentologie (Geochemie, Schwermineralanalyse)
der Oberkreide von Bahaiya und ihre Korrelation zum Dakhla-Becken (Western Desert,
Ägypten). Berliner geowissenschaftliche Abhandlungen A 62, 173 pp.
Doyle J. A., Hickey L. J. (1976). Pollen and leaves from the mid-Cretaceous Potomac Group
and their bearing on early angiosperm evolution. Original and early evolution of angiosperms
Columbia Univ. Press: New York & London, pp139-206.
Dyni, J. R. (2006). Geology and resources of some world oil-shale deposits: U.S. Geological
Survey Scientific Investigations Report 2005–5294, 42 p.
Eckstein, Y. (1978). Review of heat flow data from the eastern Mediterranean region. Pure
Appl Geophys, 117 (1-2), 150-159.
Einsele, G., Wiedmann, J. (1982). Turonian Black Shales in the Moroccan Coastal Basins:
First Upwelling in the Atlantic Ocean. In: Von Rad, U., Hinz, K., Sarnthein, M., Seibold, E.
(eds.). Geology of the Northwest African Continental Margin. Springer Berlin Heidelberg, pp.
396-414.
El Atfy, H. (2011). Cretaceous Palynology of the GPTSW-7 Well, Western Desert, Egypt.
LAP LAMBERT Academic Publishing GmbH & Co. KG. ISBN 978-3-8465-3295-9.
El Atfy, H., Anan, T., El-Soughier, M. I. (2017). Paleoecologic and stratigraphic significance
of the freshwater algae Pediastrum in the Upper Cretaceous (Turonian) marine deposits, north
Western Desert, Egypt. Paläontologische Zeitschrift. DOI 10.1007/s12542-017-0338-8.
El Atfy, H., Brocke, R., Uhl, D., Ghassal, B., Stock, A. T., & Littke, R. (2014). Source rock
potential and paleoenvironment of the Miocene Rudeis and Kareem formations, Gulf of Suez,
Egypt: An integrated palynofacies and organic geochemical approach. International Journal of
Coal Geology, 131, 326-343.
El Ayouty, M. K. (1990). Petroleum geology. In R. Said (Ed.), The Geology of Egypt. A.A.
Balkema, Rotterdam, Brookfield, p. 567-599.
El Beialy, S.Y., El Atfy, H.S., El Khoriby, E.M., & Abu-Zied, R.H. (2008). Palynostratigraphy,
palynofacies and the source rock evaluation of the Cenomanian Bahariya Formation, GPTSW-

174
7 Well, north Western Desert, Egypt. Journal of Environmental Sciences, Mansoura
University, 36, 63-88.
El Beialy, S. Y., El Atfy, H. S., Zavada, M. S., El Khoriby, E. M., Abu-Zied, R. H. (2010).
Palynological, palynofacies, paleoenvironmental and organic geochemical studies on the
Upper Cretaceous succession of the GPTSW-7 well, North Western Desert, Egypt. Marine and
Petroleum Geology, 27 (2), 370-385.
El Diasty, W.S., Moldowan, J.M. (2012). Application of biological markers in the recognition
of the geochemical characteristics of some crude oils from Abu Gharadig Basin, north Western
Desert–Egypt. Marine and Petroleum Geology, 35(1), 28-40.
El Diasty, W.Sh., El Beialy, S., Abo Ghonaim, A.A., Mostafa, A.R. El Atfy, H. (2014).
Palynology, palynofacies and petroleum potential of the Upper Cretaceous-Eocene Matulla,
Brown Limestone and Thebes formations, Belayim oilfields, central Gulf of Suez, Egypt.
Journal of African Earth Sciences, 95, 155-167.
El Kammar, A. M., & El Kammar Jr, M. M. (1996). Potentiality of chemical weathering under
arid conditions of black shales from Egypt. Journal of Arid Environments, 33(2), 179-199.
El Nady, M. M., Harb, F. M. (2015). Source Rock Quality from Oil Biomarkers of the Abu
Gharadig Basin in the North Western Desert, Egypt, Energy Sources, Part A: Recovery,
Utilization, and Environmental Effects, 37(23), 2514-2523.
El Nady, M. M. (2007). Organic geochemistry of source rocks, condensates, and thermal
geochemical modeling of Miocene sequence of some wells, onshore Nile Delta, Egypt. J.
Petroleum Science and Technology, 25,791-817.
El Nady, M. M. and Harb, F. M. (2010). Source Rocks Evaluation of Sidi Salem-1 Well in the
Onshore Nile Delta, Egypt. J. Petroleum Science and Technology, 28, 1492-1502.
El Nady, M. M., Awad, S. A., Sharaf, L. M. (2015) Source Rock Evaluation of Selected Wells
in the North Western Desert, Egypt, Energy Sources, Part A: Recovery, Utilization, and
Environmental Effects, 37, 2151-2162.
El Nady, M. M., El-Naggar, A. Y. (2016). Petroleum geochemistry of crude oils and oil: source
rock correlation of some wells in the North Western Desert, Egypt. Arabian Journal of
Geosciences, 9(13), 627. DOI: 10.1007/s12517-016-2617-1
Enachescu, M. E., Hogg, J. R., Fowler, M., Brown, D. E., Atkinson, I. (2010). Late Jurassic
Source Rock Super-Highway on Conjugate Margins of the North and Central Atlantic
(offshore East Coast Canada, Ireland, Portugal, Spain and Morocco). Central and North
Atlantic Conjugate Margins conference, Lisbon 2010. (II), 49- 80. ISBN: 978-989-96923-0-5.
Erbacher, J., Thurow, J., Littke, R., (1996). Evolution patterns of radiolaria and organic matter
9 variations: A new approach to identify sea-level changes in Mid-Cretaceous pelagic 10
environments. Geology, 24, 499-502.

175
Esestime P., Hewitt, A., & Hodgson, N. (2016) Zohr: A newborn carbonate play in the
Levantine Basin, East-Mediterranean. First Break, 34, 87-93.
Espitalie, J., Deroo, G., Marquis, F. (1985). Rock-Eval pyrolysis and its applications. Revue
De L Institut Francais Du Petrole, 40(5), 563-579.
Forster, A., Sturt, H., Meyers, P.A., and the Leg 207 Shipboard Scientific Party (2004).
Molecular biogeochemistry of Cretaceous black shales from the Demerara Rise: preliminary
shipboard results from Sites 1257 and 1258, Leg 207. In Erbacher, J., Mosher, D.C., Malone,
M.J., et al., Proc. ODP, Init. Repts., 207, 1–22
Friedrich, O., Norris, R. D., Erbacher, J. (2012). Evolution of middle to Late Cretaceous
oceans—a 55 my record of Earth's temperature and carbon cycle. Geology, 40(2), 107-110.
Galloway, W. E. (1975). Process framework for describing the morphologic and stratigraphic
evolution of deltaic depositional systems. In: Martha Lou Broussard (Ed.), Deltas: Models for
Exploration. Houston Geological Society, pp 87-98.
Ghassal, B. I., Littke, R., Sachse, V., Sindern, S., Schwarzbauer, J. (2016). Depositional
Environment and Source Rock Potential of Upper Albian to Turonian sedimentary rocks of the
Tarfaya Basin, Southwest Morocco. Geologica Acta, 14 (4), 419-441.
Ghassal, B., Sachse, V., Littke, R (2015). Source Rock Potential of the Tarfaya Basin SW
Morocco. In European Regional Conference and Exhibition, AAPG Lisbon, Portugal.
Gluyas, J., Swarbrick, R. (2013). Petroleum geoscience. John Wiley & Sons.
Golonka, J. (2007). Late Triassic and Early Jurassic palaeogeography of the
world. Palaeogeography, Palaeoclimatology, Palaeoecology, 244(1), 297-307.
GPC, 1994. Composite well log and location map of GPTSW-7 Well. General Petroleum
Company.
Guiraud, R., Bellion, Y., Benkhelil, J., & Moreau, C. (1987). Post‐Hercynian tectonics in
Northern and Western Africa. Geological Journal, 22(S2), 433-466.
Guiraud, R., Bosworth, W., Thierry, J., & Delplanque, A. (2005). Phanerozoic geological
evolution of Northern and Central Africa: an overview. Journal of African Earth
Sciences, 43(1), 83-143.
Guiraud, R., Bosworth W. (1999). Phanerozoic geodynamic evolution of northeastern Africa
and the northwestern Arabian platform. Tectonophysics, 315, 73-104.
Guiraud, R., Bosworth, W. (1997). Senonian basin inversion and rejuvenation of rifting in
Africa and Arabia: synthesis and implications to plate-scale tectonics. Tectonophysics, 282(1),
39-82.

176
Guiraud R., Maurin J. C. (1992). Early Cretaceous rifts of Western and Central Africa: an
overview. Tectonophysics, 213, 153-168.
Hafid, M., Tari, G., Bouhadioui, B., El Moussaid, I., Eccharfaoui, H., Aït Salem, A., Nahim,
M., Dakki, M. (2008). Atlantic basins. In: Michard, A., Saddiqi, O., Chalouan, A., Frizon de
Lamotte, D. (eds.). Continental evolution: The Geology of Morocco. Lecture Notes in Earth
Sciences, 116, 303–329.
Hantar, G. (1990). North Western Desert. In R. Said (Ed.), The Geology of Egypt. A.A.
Balkema, Rotterdam, Brookfield, p. 293-319.
Haq, B. U., Hardenbol, J. Vail, P. R. (1988). Mesozoic and Cenozoic chronostratigraphy and
cycles of sea-level changes. In C.K. Wilgus, B.S. Hastings, H.W. Posamentier, J. Van
Wagoner, C.A. Ross, G.St.C. Kendall, (Eds.), Sea-level Changes: An Integrated Approach.
Society of Economic Paleontologists and Mineralogists, Special Publication no. 42, 71-108.
Harms, J. C., Wray, J. L. (1990). Nile Delta. In: R. Said (Ed.), The Geology of Egypt. Balkema,
Rotterdam, Netherlands.
Hartkopf-Fröder, C., Königshof, P., Littke, R., Schwarzbauer, J. (2015). Optical thermal
maturity parameters and organic geochemical alteration at low grade diagenesis to
anchimetamorphism: A review. International Journal of Coal Geology, 150:74-119.
Hassaan, M. G., Rezk, R., Hashem, A., Darwish, M., El Aaraby, A., El Barkooky, A. (2012).
Hydrocarbon Source Rocks Evaluation and Basin Modeling in South East Onshore Nile Delta
Basin, Egypt. GEO 2012 abstracts.
Hedges, J. I., Eglinton, G., Hatcher, P. G., Kirchman, D.L., Arnosti, C., Derenne S., Evershed
R. P., Kögel-Knabner, I., de Leeuw, J.W., Littke, R., Michaelis, W., Rullkötter, J. (2000). The
molecularly-uncharacterized component of nonliving organic matter in natural environments.
Organic Geochemistry, 31 (10), 945-958.
Herbin, J. P., Montadert, L., Müller, C., Gomez, R., Thurow, J. and Wiedmann, J., (1986).
Organic-rich sedimentation at the Cenomanian-Turonian boundary in oceanic and coastal
basins in the North Atlantic and Tethys. Geological Society, London, Special
Publications, 21(1), 389-422.
Hochuli P. A., Feist-Burkhardt S. (2013) Angiosperm-like pollen and Afropollis from the
Middle Triassic (Anisian) of the Germanic Basin (northern Switzerland). Frontiers in plant
science, 4, 344.
Hutton, A. C. (1987). Petrographic classification of oil shales. International Journal of Coal
Geology, 8, 203-231.
Ibrahim M. I. A., Aboul Ela N. M., Kholeif S. E. (1997). Paleoecology, palynofacies, thermal
maturation and hydrocarbon source-rock potential of the Jurassic-Lower Cretaceous sequence

177
in the subsurface of the North Eastern, Desert, Egypt. Qatar University, Science Journal, 17,
153-172.
Ibrahim, M.I., Dilcher, D., Kholeif, S. (2009). Palynomorph succession and paleoenvironment
in the Upper Cretaceous Abu Gharadig oil field, Northwestern Desert, Egypt.
Micropaleontology 55 (6), 525–558.
Ibrahim, M. I. A., Abdel-Kireem, M. R. (1997). Late Cretaceous palynofloras and foraminifera
from Ain El-Wadi area, Farafra Oasis, Egypt. Cretaceous Research, 18, 633-660.
Isaksen, G. H., Bohacs, K. M. (2012). Geological controls of source rock geochemistry through
relative sea level; Triassic, Barents Sea. In Petroleum Source Rocks (pp. 25-50). Springer
Berlin Heidelberg.
Jan du Chêne, R. E., De Klasz, I., Archibong, E. E., (1978). Biostratigraphic study of the
Borehole Ojo-1, SW Nigeria, with special emphasis on the Cretaceous microflora. Rev.
Micropaléontol. 21, 123–139.
Jardiné, S., Magloire, L., (1965). Palynologie et stratigraphie du Crétacé des bassins du Sénégal
et de Côte d’Ivoire. Mémoires Bureau Rec. Géol. Min. 32, 187–245.
Jenkyns, H. C. (2010). Geochemistry of oceanic anoxic events. Geochemistry, Geophysics,
Geosystems, 11 (3), 1-30. doi:10.1029/2009GC002788.
Jenkyns, H. C., 1980. Cretaceous anoxic events: from continents to oceans, J. Geol. Soc.
London, 137, 171–188.
Kaska, H.V., (1989). A spore and pollen zonation of Early Cretaceous to Tertiary nonmarine
sediments of central Sudan. Palynology 13, 79–90.
Katz, B. (Ed.). (2012). Petroleum source rocks. Springer Science & Business Media.
Keeley, M. L. (1994). Phanerozoic evolution of the basins of northern Egypt and adjacent
areas. Geologische Rundschau, 83, 728-742.
Keeley ML, Massoud, MS (1998) Tectonic controls on the petroleum geology of NE
Africa. Geological Society, London, Special Publications,132, 265-281.
Keeley M. L., Wallis R. J. (1991). The Jurassic System in northern Egypt: II. Depositional and
tectonic regimes. ). Journal of Petroleum Geology, 14, 49-64.
Keeley, M. L. (1994). Phanerozoic evolution of the basins of northern Egypt and adjacent
areas. Geologische Rundschau, 83(4), 728-742.
Kerdany, M. T. & Cherif, O. H. (1990) The Mesozoic. In: Said, R. (Ed.): The Geology of
Egypt. Balkema, Rotterdam, 407–438.

178
Keshta S., Metwalli F. J., Al Arabi H. S. (2012). Analysis of Petroleum System for Exploration
and Risk Reduction in Abu Madi/Elqar'a Gas Field, Nile Delta, Egypt. International Journal of
Geophysics, 2012:1-10.
Khaled, K. A., Attia, G. M., Metwalli, F., Fagelnour, M. S. (2014). Subsurface geology and
petroleum system in the eastern offshore area, Nile Delta, Egypt. Journal of Applied Science
Reseasrch, 10: 254-270.
Mishke, O. K., Volkovinsky, V. V., & Kabanova, J. G. (1970). Plankton primary production
of the world ocean.
Köhler, I., Konhauser, K. O., Papineau, D., Bekker, A., & Kappler, A. (2013). Biological
carbon precursor to diagenetic siderite with spherical structures in iron formations. Nature
Communications, 4, 1741.
Kolonic, S., Sinninghe Damsté, J.S., Bottcher, M.E., Kuypers, M.M.M., Kuhnt, W.,
Beckmann, B., Scheeder, G., Wagner, T. (2002). Geochemical Characterization of
Cenomanian/Turonian Black Shales from the Tarfaya Basin (SW Morocco). Journal of
Petroleum Geology, 25, 325-350.
Koopmans, M. P., Irene W., Rijpstra, C., Klapwijk, M. M., de Leeuw, J. W., Lewan, M. D.,
Damste J. S. S. (1999). A thermal and chemical degradation approach to decipher pristane and
phytane precursors in sedimentary organic matter. Organic Geochemistry, 30, 1089-1104.
Kraal, P., Slomp, C. P., Forster, A. and Kuypers, M. M. (2010). Phosphorus cycling from the
margin to abyssal depths in the proto-Atlantic during oceanic anoxic event
2. Palaeogeography, Palaeoclimatology, Palaeoecology, 295 (1), pp.42-54.
Kuhnt, W., Holbourn, A., Gale, A., Chellai, E. A., Kennedy, J., (2009). Cenomanian sequence
stratigraphy and sea-level fluctuations in the Tarfaya Basin (SW Morocco). Geological Society
America Bulletin, 121, 1695-1710.
Kuhnt, W., Nederbragt, A., Leine, L., (1997). Cyclicity of Cenomanian Turonian organic-
carbon-rich sediments in the Tarfaya Atlantic Coastal Basin (Morocco). Cretaceous Research.
18, 587–601.
Kuypers, M. M., van Breugel, Y., Schouten, S., Erba, E., & Damsté, J. S. S. (2004). N2-fixing
cyanobacteria supplied nutrient N for Cretaceous oceanic anoxic events. Geology, 32(10), 853-
856.
Kuypers, M. M. M., Lourens, L. J., Rijpstra, W., Pancost, R., Nijenhuis, I.A., Sinninghe
Damsté, J. S. (2004). Orbital forcing of organic carbon burial in the proto-North Atlantic during
oceanic anoxic event 2. Earth Planet. Sci. Lett., 228, 465–482.
Lancelot Y., Winterer E. L., (1980). Evolution of the Moroccan oceanic basin and adjacent
continental margin; a synthesis. Initial Reports of the Deep Sea Drilling Project 50 Publisher:

179
Texas A & M University, Ocean Drilling Program, College Station, TX, United States, 801-
821.
Largeau, C., Derenne, S. (1993). Relative efficiency of the selective preservation and
degradation recondesation pathways in kerogen formation. Source and environment influence
on their contributions to type I and II kerogens. Organic Geochemistry, 20, 611-616.
Lawal, O., Moullade, M. (1986). Palynological biostratigraphy of Cretaceous sediments in the
upper Benue Basin, NE Nigeria. Rev. Micropaléontol. 29 (1), 61–83.
Lentin, J. K., Vozzhennikova, T. F., (1990). Fossil dinoflagellates from the Jurassic,
Cretaceous and Paleogene deposits of the USSR. A restudy. In: American Association of
Stratigraphic Palynologists, Contribution Series 23, 1–221.
Leventhal, J. S., (1982). An interpretation of carbon and sulfur relationships in Black Sea
sediments as indicators of environments of deposition. Geochim. Cosmochim. Acta, 47, 133-
137.
Leventhal, J. S., (1995). Carbon-sulfur plots to show diagenetic and epigenetic sulfidation in
sediments. Geochimica et Cosmochimica Acta, 59, 1207–1211.
Littke, R., & Sachsenhofer, R. F. (1994). Organic petrology of deep sea sediments: a
compilation of results from the Ocean Drilling Program and the Deep Sea Drilling Project.
Energy & fuels, 8(6), 1498-1512.
Littke, R. (1993). Deposition, Diagenesis and Weathering of Organic Matter-Rich Sediments.
Lecture Notes in Earth Sciences. Springer Verlag, Berlin. 216 pp.
Littke, R., Baker, D.R., Leythaeuser, D., Rullkötter, J. (1991). Keys to the depositional history
of the Posidonia Shale (Toarcian) in the Hils syncline, Northern Germany. In: Tyson, R.V.,
Pearson, T. (eds.). Modern and ancient continental shelf anoxia. Geol. Soc. Spec. Publ., 58,
311-334.
Littke, R., Baker, D. R., & Rullkötter, J. (1997). Deposition of petroleum source rocks.
In Petroleum and Basin Evolution (pp. 271-333). Springer Berlin Heidelberg.
Littke, R., Lückge, A., Welte, D. H., (1997). Quantification of organic matter degradation by
microbial sulphate reduction for Quaternary sediments from the northern Arabian Sea.
Naturwissenschaften, 84, 312-315.
Littke, R., Sachsenhofer, R.F. (1994). Organic petrology of deep sea sediments: a compilation
of results from the Ocean Drilling Program and the Deep Sea Drilling Project. Energy and
Fuels, 8, 1498–1512.
Lückge, A., Boussafir, M., Lallier-Vergès, E., & Littke, R. (1996). Comparative study of
organic matter preservation in immature sediments along the continental margins of Peru and

180
Oman. Part I: Results of petrographical and bulk geochemical data. Organic
Geochemistry, 24(4), 437-451.
Lüning, S., Kolonic, S., Belhadj, E. M., Belhadj, Z., Cota, L., Barić, G., & Wagner, T. (2004).
Integrated depositional model for the Cenomanian–Turonian organic-rich strata in North
Africa. Earth-Science Reviews, 64(1), 51-117.
Macgregor, D. S. (1996). The hydrocarbon systems of North Africa. Marine and petroleum
geology, 13(3), 329-340.
Mahmoud, M. D., Vaslet, D., & Husseini, M. I. (1992). The Lower Silurian Qalibah Formation
of Saudi Arabia: An Important Hydrocarbon Source Rock (1). AAPG Bulletin, 76(10), 1491-
1506.
Maky, A. F., & Saad, S. A. (2009). Kerogen Composition and Hydrocarbon Potentiality of
Some Cretaceous to Middle Eocene Rock Units and Their Depositional Environments at abu
El-gharadig basin Western Desert, Egypt. Australian Journal of Basic and Applied
Sciences, 3(4), 4675-4692.
März, C., Poulton, S. W., Beckmann, B., Küster, K., Wagner, T., Kasten, S. (2008). Redox
sensitivity of P cycling during marine black shale formation: Dynamics of sulfidic and anoxic,
non-sulfidic bottom waters. Geochimica et Cosmochimica Acta, 72(15), 3703-3717.
Meneisy M. Y. (1990) Vulcanicity. In: R. Said (Ed.), The Geology of Egypt. Balkema,
Rotterdam, pp 157-172.
Meshref, W. M. 1990. Tectonic framework. In: R. Said (Ed.), The Geology of Egypt. Balkema,
Roterdam-Brookfield, pp 113-155.
Michard, A., Saddiqi, O., Chalouan, A., Frizon de Lamotte, D. (eds.), 2008. Continental
Evolution: The Geology of Morocco. Structure, Stratigraphy, and Tectonics of the Africa–
Atlantic–Mediterranean Triple Junction. Lecture Notes in Earth Sciences, Berlin, Heidelberg,
Springer-Verlag, 424pp.
Moldowan J. M., Dahl J., Huizinga B. J., Fago, F. J., Hickey L. J., Peakman TM, Taylor D.
W. (1994). The molecular fossil record of oleanane and its relation to angiosperms. Science-
New York Then Washington, 768-768.
Moldowan, J. M., Seifert, W. K., Gallegos, E. J. (1985). Relationship between petroleum
composition and depositional environment of petroleum source rocks. AAPG Bulletin, 69 (8),
1255-1268.
Morabet, A. M., Bouchta, R., Jabour, H., (1998). An overview of the petroleum systems of
Morocco. In: Mac-Gregor, D.S., Moody, R.T.J., Clark-Lowes, D.D. (eds.). Petroleum Geology
of North Africa. Geological Society, London, Special Publication, 132, 283-296.

181
Morgan, R., (1978). Albian to Senonian palynology of Site 364, Angola Basin. Initial Reports
DSDP 40, 915–951.
Morse, J. W., & Emeis, K. C. (1992). Carbon/sulphur/iron relationships in upwelling
sediments. Geological Society, London, Special Publications, 64(1), 247-255.
Morse, J. W., Berner R. A., (1995). What determines sedimentary C/S ratios?. Geochimica et
Cosmochimica Acta, 59, 1073–1077.
Mort, H. P., Adatte, T., Föllmi, K. B., Keller, G., Steinmann, P., Matera, V., Berner, Z., Stüben,
D. (2007). Phosphorus and the roles of productivity and nutrient recycling during Oceanic
Anoxic Event 2. Geology, 35, 483– 486.
Mort, H. P., Adatte, T., Keller, G., Bartels, D., Föllmi, K.B., Steinmann, P., Berner, Z., Chellai,
E. H. (2008). Organic carbon deposition and phosphorus accumulation during Oceanic Anoxic
Event 2 in Tarfaya, Morocco, Cretaceous Research, 29 (5–6), 1008-1023. ISSN 0195-6671.
Nederbragt, A. J., Thurow, J., Vonhof, H., Brumsack, H. J. (2004). Modelling oceanic carbon
and phosphorus fluxes: implications for the cause of the late Cenomanian Oceanic Anoxic
Event (OAE2). Journal of the Geological Society, 721-728.
Neumaier, M., Back, S., Littke, R., Kukla, P.A., Schnabel, M., Reichert, C. (2015). Late
Cretaceous to Cenozoic geodynamic evolution of the Atlantic margin offshore Essaouira
(Morocco). Basin Research, doi: 10.1111/bre.12127.
Niebuhr, B. (2005). Geochemistry and time-series analyses of orbitally forced Upper
Cretaceous marl–limestone rhythmites (Lehrte West Syncline, northern Germany). Geological
Magazine, 142 (01), 31-55.
Ohkouchi, N., Kashiyama, Y., Kuroda, J., Ogawa, N. O., Kitazato, H. (2006). An importance
of cyanobacteria as a primary producer during Cretaceous Oceanic Anoxic Event 2.
Biogeosciences, 3, 575– 605.
Pacton M., Fiet N., Gorin G (2006). Revisiting amorphous organic matter in Kimmeridgian
laminites: what is the role of the vulcanization process in the amorphization of organic matter?
Terra Nova 18, 380–387
Parrish, J. T. (1987). Palaeo-upwelling and the distribution of organic-rich rocks. Geological
Society, London, Special Publications, 26(1), 199-205.
Pepper A., S., Corvi, P., J. (1995). Simple kinetic models of petroleum formation. Part I: oil
and gas generation from kerogen, Marine and Petroleum Geology, 12 (3), 291-319, ISSN 0264-
8172.
Peters K. E. (1986). Guidelines for evaluating petroleum source using programmed pyrolysis.
AAPG Bull 70,318–329.

182
Peters K. E., Walters C. C., Moldowan J. M. (2005). The biomarker guide (Vol. 2). Cambridge
University Press.
Peters, K. E., Walters, C. C., & Moldowan, J. M. (2005). The biomarker guide (Vol. 2).
Cambridge University Press. 1155 pp.
Philip, J. (2003). Peri-Tethyan neritic carbonate areas: distribution through time and driving
factors. Palaeogeography, Palaeoclimatology, Palaeoecology, 196 (1), 19-37.
Powell, T.G. (1987). 4 Depositional Controls on Source Rock Character and Crude Oil
Composition. In 12th World Petroleum Congress. World Petroleum Congress.
Powell, T. G., 1987. Pristane/phytane ratio as environmental indicator, Nature, 333, 604.
Powell, T.G., McKirdy, D. M., (1973). Relationship between ratio of pristane to phytane, crude
oil composition and geological environment in Australia: Nature, 243, 37–39.
Raiswell, R., Berner, R.A., 1986. Pyrite and organic-matter in Phanerozoic normal marine
shales. Geochimica Cosmochimica Acta, 50 (9), 1967–1976.
Ricci, J.N., Coleman, M.L., Welander, P.V., Sessions, A.L., Summons, R.E., Spear, J.R.,
Newman, D.K. (2014). Diverse capacity for 2-methylhopanoid production correlates with a
specific ecological niche. ISME Journal, doi:10.1038/ismej.2013.191.
Ricken, W. (1993). Sedimentation as a three-component system. Lecture Notes in Earth
Sciences, 51, 1 – 211.
Robison, V. D. (1995). Source rock characterization of the late cretaceous brown limestone of
Egypt. In Petroleum source rocks. Springer Berlin Heidelberg, 265-281.
Ross, D. A., Uchupi E. (1977). Structure and sedimentary history of southeastern
Mediterranean Sea-Nile Cone area. AAPG Bulletin, 61, 872-902.
Ryther, J. H. (1969). Photosynthesis and fish production in the sea. The production of organic
matter and its conversion to higher forms of life vary throughout the world ocean. Science
(Washington), 166, 72-76.
Saadi, M., Hital, E. A., Bensaïd, M., Boudda, A., Dahmani, M. (1985). Carte Géologique du
Maroc. Éditions du Service Géologique du Maroc- Notes et Mémoires, 260.
Sachse, V. F., Littke, R., Jabour, H., Schümann, T., Kluth, O. (2012). Late Cretaceous (late
Turonian, Coniacian and Santonian) petroleum source rocks as part of an OAE, Tarfaya Basin,
Morocco. Marine and Petroleum Geology, 29(1), 35-49.
Sachse, V. F., Heim, S., Jabour, H., Kluth, O., Schümann, T., Aquit, M., Littke, R. (2014).
Organic geochemical characterization of Santonian to Early Campanian organic matter-rich

183
marls (Sondage No 1 cores) as related to OAE3 from the Tarfaya Basin, Morocco. Marine and
Petroleum Geology, 56, 290-304.
Sachse, V. F., Littke, R., Heim, S., Kluth, O., Schober, J., Boutib, L., Jabour, H., Perssen, F.,
Sindern, S., (2011). Petroleum source rocks of the Tarfaya Basin and adjacent areas, Morocco.
Organic Geochemistry, 42, 209-227.
Said, R. (1990). The Geology of Egypt: AA Balkema. Roterdam. Brookfield. 729 pp
Salard-Cheboldaeff, M., 1990. Intertropical African palynostratigraphy from Cretaceous to
Late Quaternary times. Journal of African Earth Sciences, 11, 1–24.
Sánchez-Román, M., Fernández-Remolar, D., Amils, R., Sánchez-Navas, A., Schmid, T., San
Martin-Uriz, P., Rodríguez, N. McKenzie J. A., & Vasconcelos, C. (2014). Microbial mediated
formation of Fe-carbonate minerals under extreme acidic conditions. Scientific reports, 4,
4767.
Schlanger, S. O., Arthur, M. A., Jenkyns, H. C. and Scholle, P. A. (1987). The Cenomanian-
Turonian Oceanic Anoxic Event, I. Stratigraphy and distribution of organic carbon-rich beds
and the marine δ13C excursion. Geological Society, London, Special Publications, 26 (1), 371-
399.
Schlanger, S. O., Jenkyns, H. C. (1976). Cretaceous anoxic events: Causes and consequences.
Geol. Mijnbow, 55, 179- 184.
Schönfeld, J., Kuhnt, W., Erdem, Z., Flögel, S., Glock, N., Aquit, M., Frank, M. and Holbourn,
A. (2015). Records of past mid-depth ventilation: Cretaceous ocean anoxic event 2 vs. Recent
oxygen minimum zones. Biogeosciences, 12 (4), pp.1169-1189.
Schrank, E., Ibrahim, M. I. A. (1995). Cretaceous (Aptian–Maastrichtian) palynology of
foraminifera-dated wells (KRM-1, AG-18) in northwestern Egypt. Berliner
geowissenschaftliche Abhandlungen A 177, 1–44.
Schulze E., Mooney, H. A., (1993). Biodiversity and ecosystem function. Berlin, Springer-
Verlag, 521.
Schwarzbauer, J., Littke, R., & Weigelt, V. (2000). Identification of specific organic
contaminants for estimating the contribution of the Elbe river to the pollution of the German
Bight. Organic Geochemistry, 31(12), 1713-1731.
Sehrt, M. (2014). Variscan to Neogene long-term landscape evolution at the Moroccan passive
continental margin (Tarfaya Basin and western Anti-Atlas). Doctoral Thesis. Ruprecht-Karls-
Universität Heidelberg. urn:nbn:de:bsz:16-heidok-174636.
Selley, R. C. (1998). Elements of petroleum geology (2ed). Academic Press.

184
Senftle, J. T., Landis, C. R., McLaughlin, R. L. (1993). Organic petrographic approach to
kerogen characterisation. In: Engel, M.H., Macko, S.A. (eds.). Organic Geochemistry.
Principles and Applications. Plenum Press, New York, 355-374.
Shaaban, F., Lutz, R., Littke, R., Bueker, C, Odisho, K. (2006) source‐rock evaluation and
basin modelling in ne Egypt (NE Nile delta and northern Sinai). J Petrol Geol, 29:103-124.
Shahin, A. N., Shehab, M. M., Mansour, H. F. (1986). Quantitative assessment and timing of
petroleum generation in Abu Garadig basin, Western Desert, Egypt. Proceedings of 8th
Petroleum Exploration and Production Conference, The Egyptian General Petroleum
Corporation, EGPC, Cairo.
Shalaby, M. R., Hakimi, M. H., & Abdullah, W. H. (2012). Organic geochemical
characteristics and interpreted depositional environment of the Khatatba Formation, northern
Western Desert, Egypt. AAPG bulletin, 96 (11), 2019-2036. Sultan, I.Z., 1985. Palynological
studies in the Nubia Sandstone Formation, east of Aswan, southern Egypt. Neues Jahrbuch
fuer Geologie und Palaöntologie Monatshefte 10, 605–617.
Shanmungam G., 1985. Significance of coniferous rain forests and related organic matter in
generating commercial quantities of oil, Gippsland Basin, Australia. The American
Association of Petroleum Geologists Bulletin, 69, 1241-1254.
Stampfli, G. M., Borel, G. D. (2002). A plate tectonic model for the Paleozoic and Mesozoic
constrained by dynamic plate boundaries and restored synthetic oceanic isochrons. Earth and
Planetary Science Letters, 196(1), 17-33.
Stampfli, G. M., Mosar, J., Favre, P., Pillevuit, A., Vannay, J. C. (2001). Permo-Mesozoic
evolution of the western Tethys realm: The Neo-Tethys east Mediterranean basin
connection. Mémoires du Muséum national d'histoire naturelle, 186, 51-108.
SubseaIQ, 2014 (http://www.subseaiq.com/data/Project.aspx?project_id=1742#history)
Summons R. E., Jahnke L. L., Hope J. M., Logan G. A. (1999). 2-Methylhopanoids as
biomarkers for cyanobacterial oxygenic photosynthesis. Nature, 400, 554–57
Sweeney J. J., Burnham A.K. (1990) Evaluation of a simple model of vitrinite reflectance
based on chemical kinetics. APPG Bull 74, 1559–1570.
Taylor, G. H., Teichmüller, M., Davis, A., Diessel, C.F.K., Littke, R., Robert, P. (1998).
Organic Petrology. Stuttgart, Borntraeger, P 704.
Tawadros, E. (2011). Geology of North Africa. CRC Press.
Teichmüller, M., Ottenjann, K., (1977). Art und Diagenese von Liptiniten und lipoiden Stoffen
in einem Erdölmuttergestein auf Grund fluoreszenzmikroskopischer Untersuchungen. Erdöl
und Kohle, 30, 387-398.

185
ten Haven, H.L., de Leeuw, J.W., Rullkötter, J., & Sinninghe Damste, J.S. (1987). Restricted
utility of the pristane/phytane ratio as a paleoenvironmental indicator. Nature, 330, 641-643.
Tissot, B., Welte, D. H. (1984). Petroleum Formation and Occurrence. New York, Springer-
Verlag, P 699.
van Krevelen, D. W. (1950). Graphical-statistical method for the study of structure and reaction
processes of coal. Fuel, 29, 269-84.
Villinski, J. (2013). Unusual but effective petroleum systems—disseminated terrestrial organic
matter of the upper Oligocene as the primary source rock, offshore Nile delta, Egypt. AAPG
Search and Discovery Article, 90161, 2013.
Weaver, C. E. (1989). Clays, muds, and shales (Vol. 44). Elsevier. P 819
Wedepohl, K. H. (1971). Environmental influences on the chemical composition of shales and
clays. Physics and Chemistry of the Earth, 8, 307-333.
Welte, D. H., 1972. Petroleum exploration and organic geochemistry. J. Geochemical
Exploration, 1, 117-136.
Wenke, A., Zühlke, R., Jabour, H., Kluth, O. (2011). High-resolution sequence stratigraphy in
basin reconnaissance: example from the Tarfaya Basin, Morocco. First break, 29, 85-96.
Wenke, A. A. O. (2014). Sequence stratigraphy and basin analysis of the Meso- to Cenozoic
Tarfaya- Laâyoune Basins, on- and offshore Morocco. Doctoral Thesis. Ruprecht-Karls-
Universität, Heidelberg. P 191. urn:nbn:de:bsz:16-heidok-179058.
Williams, G.L., Stover, L.E., & Kidson, E.J. (1993). Morphology and stratigraphic ranges of
selected Mesozoic–Cenozoic dinofalgellate taxa in the Northern Hemisphere. Geological
Survey of Canada 92-10, 1–137.
Wortmann, U.G., Hesse, R., Zacher, W., (1999). Major-element analysis of cyclic black shales:
paleoceanographic implications for the Early Cretaceous deep western Tethys.
Paleoceanography, 14, 525-541.
Wygrala, B. P. (1988). Integrated computer-aided basin modeling applied to analysis of
hydrocarbon generation history in a northern Italian oil field, in L. Matavelli and L. Novelli,
eds., Advances in organic geochemistry: Org Geochem, 13: 187–197.
Younes, M. A. (2012). Hydrocarbon Potentials in the Northern Western Desert of Egypt.
INTECH Open Access Publisher, 23-46.
Yunker, M. B., Belicka, L. L., Harvey, H. R., Macdonald, R. W. (2005). Tracing the inputs
and fate of marine and terrigenous organic matter in Arctic Ocean sediments: A multivariate
analysis of lipid biomarkers. Deep-Sea Research II, 52, 3478-3508.
186
Zaghloul, M. Z., Shaaban, F. F., Yousef, A. F. (1999b). Mesozoic and Cenozoic Sedimentary
Basins, Nile Delta, Egypt. In: Zaghloul, Z. and El-Gamal, M. (Eds.): Deltas (ancient and
modern), Mansoura University. P 21-33.
Zaghloul, Z. M., Elgamal M. M., Shaaban, F. F., Yossef A. F. A (1999a) Plates interactions
and petroleum potentials in the Nile Delta. In: Zaghloul, Z. and El-Gamal, M. (Eds.), Deltas
(ancient and modern) Mansoura University, pp 41-53.
Zarhloule, Y., (2003). Overview of Geothermal Activities in Morocco. Proceedings of the
International Geothermal Conference 2003, S10, P9.
Zobaa, M. K., Oboh-Ikuenobe, F. E., Ibrahim, M. I. (2011). The Cenomanian/Turonian oceanic
anoxic event in the Razzak Field, north Western Desert, Egypt: source rock potential and
paleoenvironmental association. Marine and Petroleum Geology, 28(8), 1475-1482.

187
Curriculum Vitae
Bandar Ismail Ghassal
Email: [email protected]
Date of birth: 13.June.1982
Marital status; married
Work Experience
2005-Present Petroleum geochemist at Saudi Aramco EXPEC Advanced Research Center
June 2004-May 2005 Assistant Geologist at Petro-Hunt Middle East Ltd., Saudi Arabia
June –August 2003 Mine geologist trainee at Maaden, Mahed Ad Dahab Gold Mine, Saudi Arabia
Education Since 2013 PhD student at RWTH Aachen University, Germany
2008-2010 MSc from University of Utah, United states of America
2000-2004 BSc from King Abdulaziz University, Saudi Arabia
Volunteering experience 2011 2011 SPE YP SAS organizing committee member
2009-2010 Secretary of Society of Economic geologist, University of Utah student chapter
2009-2010 University of Utah international ambassador
2008-2010 Cultural activity coordinator of the Saudi Student Club at the University of Utah
Publications
El Atfy, H., Brocke, R., Uhl, D., Ghassal, B., Stock, A. T., & Littke, R. (2014). Source rock potential and paleoenvironment of the Miocene Rudeis and Kareem formations, Gulf of Suez, Egypt: An integrated palynofacies and organic geochemical approach. International Journal of Coal Geology, 131, 326-343. Ghassal, B. I., Littke, R., Sachse, V., Sindern, S., & Schwarzbauer, J. (2016). Depositional Environment and Source Rock Potential of Upper Albian to Turonian sedimentary rocks of the Tarfaya Basin, Southwest Morocco. Geologica Acta, 14(4), 419-441. Ghassal, B. I., El Atfy, H., Sachse, V., & Littke, R. (2016). Source rock potential of the Middle Jurassic to Middle Pliocene, onshore Nile Delta Basin, Egypt. Arabian Journal of Geosciences, 9(20), 744.