Koya C.F (2014). Transforming Learning, Teaching and Teacher Education in the Pacific Islands
Upload
khangminh22Category
view
3download
0
Pacific Islands Climate Change Monitor: 2021
Source: NOAA
FINAL (preprint version)
April 18, 2022
PICCM 2021
i
Pacific Islands Climate Change Monitor: 2021 Report at a Glance This report describes variability and change in Pacific Island climates, drawing on the latest meteorological and oceanographic data, information, and analyses. The report primarily focuses on observed changes across the Pacific Islands region in general. It includes some country-specific information. It also includes some information about projections and the social, environmental, and economic impacts of rapid climate change. This information is intended to facilitate communication among, and inform decisions of, a broad spectrum of public and private sector stakeholders. Historical observations and climate modeling paint a consistent picture of ongoing human-forced climate change interacting with underlying natural variability. Where are we now? Discernible trends are found in measures of atmospheric greenhouse gases, surface air temperatures, sea level, sea surface temperature, and ocean acidification. Most areas are experiencing increased, positive rates of change in all these parameters, while ocean chlorophyll concentration in surface waters is decreasing.
• Over the last 60 years, the concentration of carbon dioxide (CO2) in the atmosphere measured at NOAA’s Mauna Loa Observatory has increased by more than 100 ppm (parts per million), to an annual average value over 414 ppm in 2020.
• The combined impact of the greenhouse gases carbon dioxide, methane (CH4), nitrous oxide (N2O), and halogenated compounds (mainly CFCs) in December 2020 is equivalent to a CO2 concentration of 504 ppm.
• The Pacific Islands mean temperature over land has increased by 1.1°C (2°F) since 1951. • Since the start of the satellite record in 1993, mean sea level has risen approximately 10–15 cm
(4–6 in) in much of the western tropical Pacific and approximately 5–10 cm (2–4 in) in much of the central tropical Pacific.
• Rising mean sea levels have already resulted in (some case dramatic) increases in the frequency of minor flooding.
• Over the past few decades mean sea surface temperature across most of the Pacific has warmed by a few tenths of a degree per decade, with an overall warming of approximately 0.90C (1.6°F) since 1982.
• From the 1980s to 2000s the duration of marine heatwaves tended to be 5-16-days. This increased significantly in the 2010s over most of the Pacific to 8-20 days or longer.
• Over the period 1981 to 2018 subsurface oceanic heat content increased in most locations in the Western Warm Pool (WWP) region and in the northern and southern sub-tropics.
• Oceanic pH measurements since 1988 at Station ALOHA near Hawaiʻi show that the ocean became 12% more acidic over this time.
PICCM 2021
ii
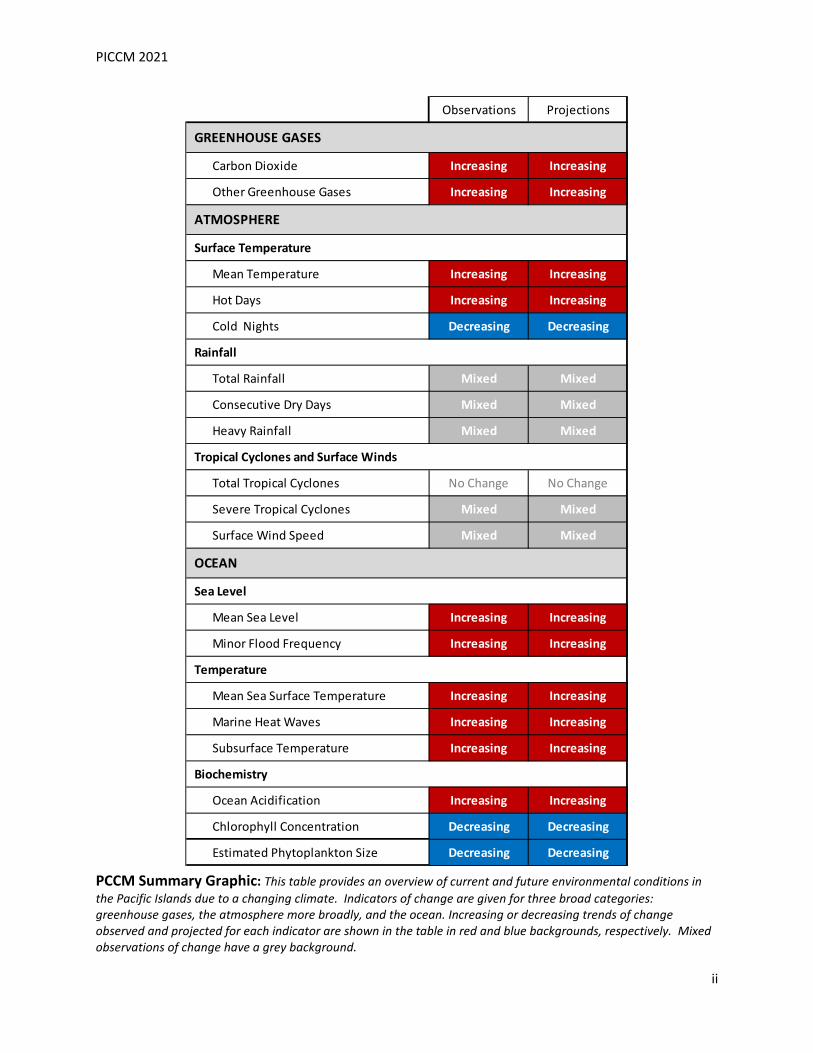
PCCM Summary Graphic: This table provides an overview of current and future environmental conditions in the Pacific Islands due to a changing climate. Indicators of change are given for three broad categories: greenhouse gases, the atmosphere more broadly, and the ocean. Increasing or decreasing trends of change observed and projected for each indicator are shown in the table in red and blue backgrounds, respectively. Mixed observations of change have a grey background.
Observations Projections
Increasing Increasing
Increasing Increasing
Increasing Increasing
Increasing Increasing
Decreasing Decreasing
Mixed Mixed
Mixed Mixed
Mixed Mixed
No Change No Change
Mixed Mixed
Mixed Mixed
Increasing Increasing
Increasing Increasing
Increasing Increasing
Increasing Increasing
Increasing Increasing
Increasing Increasing
Decreasing Decreasing
Decreasing DecreasingEstimated Phytoplankton Size
Subsurface Temperature
OCEAN
Other Greenhouse Gases
Mean Temperature
Hot Days
Cold Nights
Total Tropical Cyclones
Severe Tropical Cyclones
Surface Wind Speed
Tropical Cyclones and Surface Winds
Heavy Rainfall
GREENHOUSE GASES
ATMOSPHERE
Rainfall
Surface Temperature
Chlorophyll Concentration
Biochemistry
Temperature
Mean Sea Level
Minor Flood Frequency
Mean Sea Surface Temperature
Marine Heat Waves
Ocean Acidification
Total Rainfall
Consecutive Dry Days
Sea Level
Carbon Dioxide
PICCM 2021
iii
• Significant declines in phytoplankton size since 1998 are detectable across major portions of the Pacific Islands region.
Natural variability in rainfall, tropical cyclone (TC) properties and surface winds is high, and no statistically significant trends are apparent.
• Over the last 70 years, there has been little change in annual total rainfall and annual consecutive dry days at most of the Pacific Islands observation sites. Evidence for change in heavy rainfall across the Pacific Islands is mixed.
• No robust trends in the frequency or magnitude of TCs since the 1980s are evident. The lack of high quality, long-term observational records, particularly with respect to in-situ stations, contributes to difficulties in discerning trends. To maintain and enhance our ability to assess environmental change, attention needs to be given to robust and sustained monitoring. What does the future hold? • Global surface temperature will continue to rise, and regional climate will continue to change until
at least mid-century under any plausible emissions pathway the world follows. • Warmer air temperatures with more heat extremes, • Warmer sea surface temperatures with more marine heatwaves. • Increasing ocean acidification and decreasing oceanic oxygen. • An increase in frequency and intensity of heavy precipitation events and riverine flooding. • A greater proportion of TCs in the more intense categories. • Continuously rising sea level rise, that is significantly lower and slower under low emissions
pathways, resulting in increased coastal flooding. • Natural climate drivers and internal climate variability in the Pacific mean that there is a range of
possibilities for any particular year, and short-term trends may go against the long-term (multi-decadal) projected trend due to climate change.
• Future net global greenhouse gas emissions will heavily influence what happens in the Pacific after midcentury.
There is a need for more analysis of climate models on the regional scale, as well as higher resolution models that will support downscaling. Why should we care about climate change? • Agriculture and Food Security – Increasing air temperature will have negative impacts on
agroforestry and crops, and increase invasive species, pests, and diseases. Rising sea level will increase saltwater intrusion and thin freshwater lenses, impacting local food production and security.
• Disaster Risk Management – tropical cyclones are projected to cause more extreme rainfall and flooding, coastal erosion, wave inundation, freshwater contamination, and risks to human safety.
PICCM 2021
iv
• Energy – Increasing air temperatures will lead to increasing demand. Increasing TC intensity and rising sea levels will result in increased impacts to electrical infrastructure.
• Health – Increases in air temperature, TC intensity, and rising sea levels among other changes will lead to increased incidence of heat-related illness and vector-borne disease, and threats to physical safety. This will contribute to increases in mental health-related illness.
• Water – Decreasing rainfall, in some areas, will reduce the quantity of freshwater resources. Increasing sea level will lead to increasing saltwater intrusion/thinning freshwater and reduction in water quality. Increases in heavy rainfall leading to increased land-based pollution in ground and surface waters will all adversely affect water quality. Increasing severity of TCs and rising sea levels will adversely affect water and wastewater infrastructure.
• Fisheries and Aquaculture – Increasing surface and sea surface temperatures, increasing acidification, and decreasing chlorophyll concentration will reduce commercial and subsistence catches due to shifting fisheries, reduction in fish size, and degradation of coral reefs.
• Tourism – Increasing TC intensity and rising sea levels will increase land-based pollution and beach erosion. The degradation of coral reef and open-ocean fishing habitats will adversely impact tourism and recreation-based activities.
PICCM 2021
v
Pacific Islands Climate Change Monitor: 2021
FINAL (preprint version) April18, 2022
Coordinating Authors: John J. Marra, NOAA NESDIS NCEI; Geoff Gooley, CSIRO; Mari-Vaughn Johnson, USGS PI-CASC, Victoria Keener, Pacific RISA; Michael Kruk, NOAA NESDIS NCEI; Simon McGree, COSPPac BoM; James T. Potemra, UH APDRC; Olivia Warrick, COSPPac Contributing Authors: Laura Brewington, Pacific RISA; Savin Chand, CSIRO; Elise Chandler, COSPPac BoM; Arieta Daphne, FMS; Howard Diamond, NOAA OAR ARL; Nicolas Fauchereau, NIWA; Ayesha Genz, NOAA NESDIS NCEI; Zena Grecni , Pacific RISA; Michael Grose, CSIRO; Antonio Hermosa, SPC; Vanessa Hernaman, CSIRO; Scott Heron, JCU; Elinor Lutu-McMoore, NOAA NWS WFO Pago Pago; Keitapu Maamaatuaiahutapu, UPF; Philip Malsale, COSPPac SPREP; Grant Smith, COSPPac BoM; Tile Tofaeono, RoK PI-CLIPS SPREP; Laurent Victoire, Météo-France; Leanne Webb, CSIRO; Matthew J. Widlansky, UHSLC; Phoebe Woodworth-Jefcoats, NOAA NMFS PIFSC; Olivia Yu, Météo-France How to cite this report Pacific Climate Change Monitor: 2021. Marra, J.J., Gooley, G., Johnson, M-V, Keener, V., Kruk, M.K., McGree, S., Potemra, J.T., and Warrick, O., 2021. Pacific Islands - Regional Climate Centre Network (PI-RCC) Report to the Pacific Islands Climate Service (PICS) Panel and Pacific Meteorological Council (PMC). April 18, 2022.
PICCM 2021
vi
Table of Contents
Report at a Glance ......................................................................................................................................... i
FIGURES ....................................................................................................................................................... vii
TABLES ........................................................................................................................................................ viii
The Pacific Islands ......................................................................................................................................... 1
About this Report .......................................................................................................................................... 2
Purpose ..................................................................................................................................................... 2
Background ............................................................................................................................................... 3
Greenhouse Gases ........................................................................................................................................ 6
Indicator: Atmospheric Concentration of Carbon Dioxide (CO2) .......................................................... 6
Indicator: Other Greenhouse Gasses .................................................................................................... 9
Atmosphere ................................................................................................................................................ 10
Surface Temperature .............................................................................................................................. 10
Indicator: Regional and Local Mean Surface Temperature ................................................................ 10
Indicator: Amount of Hot Days ........................................................................................................... 12
Indicator: Amount of Cold Nights ....................................................................................................... 14
Rainfall .................................................................................................................................................... 16
Indicator: Total wet-day Rainfall ......................................................................................................... 16
Indicator: Consecutive Dry Days ......................................................................................................... 18
Indicator: Heavy Rainfall ..................................................................................................................... 19
Tropical Cyclones and Surface Winds ..................................................................................................... 21
Indicator: Total number of TCs by basin ............................................................................................. 21
Indicator: Number of severe of tropical cyclones by sub-region. ....................................................... 23
Indicator: Surface wind speed ............................................................................................................ 23
Ocean .......................................................................................................................................................... 25
Sea Level ................................................................................................................................................. 25
Indicator: Regional and Local Sea Level .............................................................................................. 26
Indicator: Minor Flood Frequency ...................................................................................................... 27
Temperature ........................................................................................................................................... 29
Indicator: Mean Sea Surface Temperature ......................................................................................... 29
Indicator: Marine Heat Waves ............................................................................................................ 31
Indicator: Subsurface Temperature .................................................................................................... 33
PICCM 2021
vii
Biochemistry ........................................................................................................................................... 34
Indicator: Ocean Acidification ............................................................................................................. 34
Indicator: Chlorophyll Concentration ................................................................................................. 35
Indicator: Estimated Phytoplankton Size ............................................................................................ 36
Future Climate ............................................................................................................................................ 38
Observed and Expected Impacts on Key Sectors ........................................................................................ 46
Acknowledgements ..................................................................................................................................... 52
Appendix: Traceable Accounts .................................................................................................................... 53
FIGURES Figure 1. The Pacific Islands. Figure 2. WMO-Global Atmosphere (GAW) Global Network. Figure 3. Monthly Mean Concentration of Atmospheric CO2 at Mauna Loa since 1959. Figure 4. Monthly mean baseline greenhouse gas concentrations measured at the Cape Grim Baseline. Figure 5. Annual (blue bars) and decadal (red horizontal lines) growth rates of greenhouse gases in the atmosphere. Figure 6. Radiative forcing, relative to 1750, of all the long-lived greenhouse gases and a set of 15 minor long-lived halogenated gases. Figure 7: Regional annual mean temperature anomalies relative to 1961-1990 climatology. Figure 8: Change in annual mean daily mean temperature from 1951-2020 as observed in in-situ station data from locations across the tropical/subtropical Pacific. Figure 9: Trend in annual amount of hot days over 1951-2020. Figure 10: Trend in annual amount of cold nights over 1951-2020. Figure 11: Regional amount of hot days (TX90p) and cold nights (TN10p) anomalies relative to the 1961-1990 climatology. Figure 12: Trends in annual total rainfall on wet days over 1951-2020. Figure 13: Trend in annual consecutive dry days over 1951-2020. Figure 14: Trend in annual heavy rainfall over 1951-2020. Figure 15. Tropical cyclone (TC) activity since 1980. Figure 16. The percentage of wind occurrences greater than or equal to 34 knots since 1980 in the three sub-basins. Figure 17. Regional Sea Level Trends from Satellite Altimetry and Tide Gauges. Figure 18. Minor flood frequency from selected tide gauges in the tropical Pacific. Figure 19. Sea Surface Temperature Trends. Figure 20. Seasonal Sea Surface Temperature Anomalies . Figure 21. Marine Heat Wave Summaries. Figure 22. Heat content trends over the Pacific from January 1981 to December 2018 using monthly data was from the ACCESS-S initial conditions reanalysis (Hudson et al. 2017). Figure 23. Measured and calculated trends in surface (0–10 meter) pH at Station ALOHA, collected by the Hawaiʻi Ocean Time-series (HOT).

PICCM 2021
viii
Figure 24. Time series of monthly estimated chlorophyll-a concentration (mg m-3) as derived from satellite remotely sensed ocean color data. Figure 25. Time series of monthly estimated median phytoplankton size (in um equivalent spherical diameter, ESD) as derived from satellite remotely sensed sea surface temperature and ocean color. Figure 26. Observed and projected global average CO2 concentration from the SSPs. Figure 27. Projected Surface Temperature Change relative to 1850-1900. Figure 28. Range of rainfall change (%) in 2030, 2050 and 2090 relative to 1995-2014. Figure 29: TC activity projection for a 2°C global warming. Figure 30. Projected sea level rise. Figure 31. Projected increase in the mean number of marine heatwave days per year. Figure 32. Projected multimodel mean change in surface ocean pH and oxygen concentration averaged over 100-600 m depth.
TABLES TABLE 1. INDICATORS OF CLIMATE CHANGE IN THE PACIFIC ISLANDS TABLE 2. SUBREGION MEAN RAINFALL INDICATOR TRENDS.
PICCM 2021
1
Pacific Climate Change Monitor: 2021
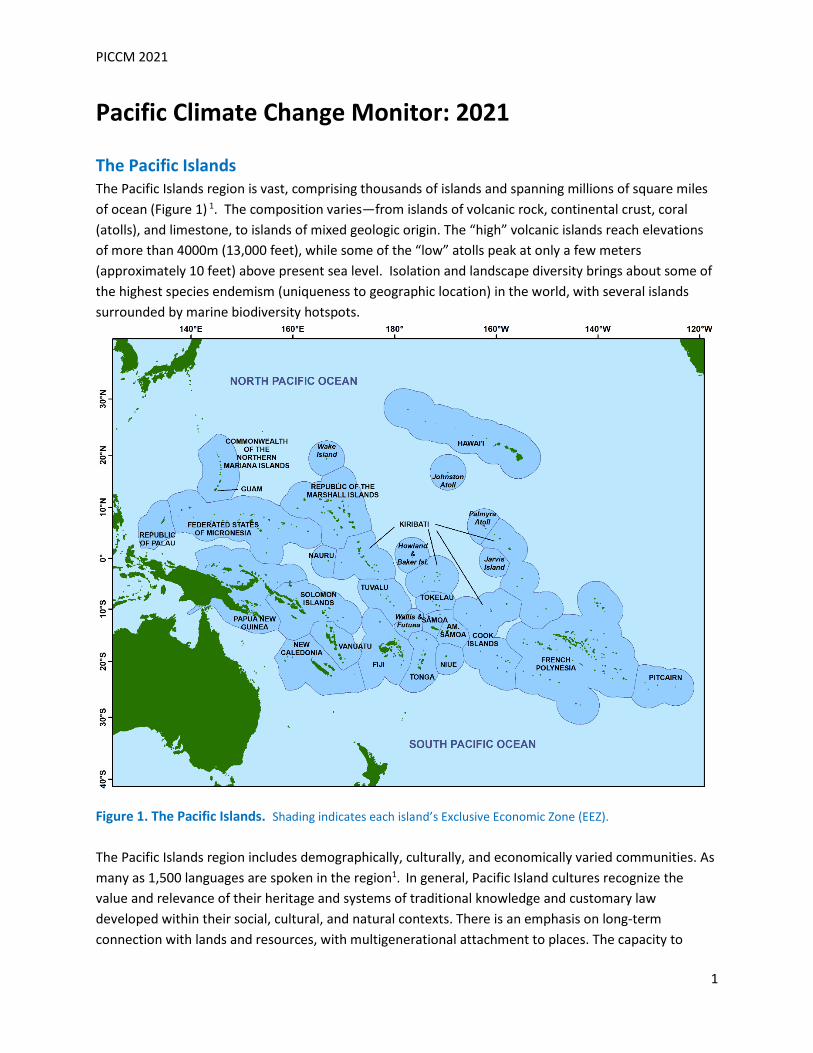
The Pacific Islands The Pacific Islands region is vast, comprising thousands of islands and spanning millions of square miles of ocean (Figure 1) 1. The composition varies—from islands of volcanic rock, continental crust, coral (atolls), and limestone, to islands of mixed geologic origin. The “high” volcanic islands reach elevations of more than 4000m (13,000 feet), while some of the “low” atolls peak at only a few meters (approximately 10 feet) above present sea level. Isolation and landscape diversity brings about some of the highest species endemism (uniqueness to geographic location) in the world, with several islands surrounded by marine biodiversity hotspots.
Figure 1. The Pacific Islands. Shading indicates each island’s Exclusive Economic Zone (EEZ). The Pacific Islands region includes demographically, culturally, and economically varied communities. As many as 1,500 languages are spoken in the region1. In general, Pacific Island cultures recognize the value and relevance of their heritage and systems of traditional knowledge and customary law developed within their social, cultural, and natural contexts. There is an emphasis on long-term connection with lands and resources, with multigenerational attachment to places. The capacity to
PICCM 2021
2
adapt to climate change in the region varies with the availability of socioeconomic and institutional resources2. Typically, high islands support larger populations and infrastructure, which in turn attracts industry and allows the growth of different types of institutions2. The Pacific Islands are exposed to climate changes that affect every aspect of life2,3,4. Ocean and island ecosystems are changing with warming air and ocean temperatures, an increase in the proportion of more intense TCs, rising sea levels, and increasing ocean acidification. Fresh water supplies for natural systems, as well as communities and businesses, are at risk. Food security is threatened through impacts on both agriculture and fisheries. Communities on low-lying atolls are particularly at risk, and the built environment on all islands is at risk from coastal flooding and erosion. Loss of habitat and other changes to ecosystems threaten the regions’ biodiversity.
About this Report
Purpose
This report draws on the latest meteorological and oceanographic data and information to describe historical change in Pacific Island climate. There is significant demand at regional, national and local community levels within the Pacific Islands for science-based climate data and information to inform decision-making; including high-quality monitoring, analysis, and communication of observed and future climate change. At the 15th Pacific Islands Forum in Funafuti, Tuvalu in 2019, leaders called on “the international community to immediately increase support and assistance for Pacific-led science-based initiatives intended to improve our understanding of risk and vulnerability, as well as build capacity for evidence-based decision-making and project development”. Members of the 4th Pacific Meteorological Council (PMC), in Honiara in 2017, welcomed the renewed focus on climate change science, especially underpinning meteorology and climate services. This report has been produced by the WMO RA V Pacific Regional Climate Center (RCC) Network https://www.pacificmet.net/rcc, specifically members of the Nodes on Climate Monitoring and Climate Change Projections. The WMO RA V Pacific RCC Network is a virtual centre of excellence for supporting national meteorological services with up-to-date regional long-range climate forecasts, climate monitoring products, climate change projections, climate data services, and information on regional training activities. The RCC Network was endorsed by PMC-4 and is currently in a demonstration phase. The Node on Climate Monitoring is co-led by NOAA and the University of Hawaiʻi, while the Node on Climate Change Projections is led by CSIRO. Consortium members include the Australian Bureau of Meteorology, SPREP and SPC. Author invitations were extended to the PMC member countries. The regional indicators described here are intended to provide:
PICCM 2021
3
• meaningful regionally and locally relevant information about the status and trends of key physical, biological, and chemical variables in light of a rapidly changing climate; and
• information in a form that is accessible and useful to a wide variety of stakeholders in the public and private sectors, as well as the education and scientific communities. This will assist communication and inform decisions on management, research, and education.
Background
We examine temperature, rainfall, and sea level, as well as biological and chemical observations that are indicative of current, past, and possible future states of the climate system (Table 1) 1-5. Sources for information about climate variables are typically measurements obtained from in situ stations, satellites, or climate models. These observing systems and climate models provide information that can be used to characterize long term trends in mean and extreme states on regional to local scales. The Pacific Islands region is the scale of focus in this report, both with respect to geography and physical processes. In some cases, information is presented at a sub-regional scale. In general, the subregions represent loosely defined geographic areas in the Pacific Basin with quasi-unique combinations of atmospheric and/or oceanic conditions. While not necessarily reflective of change at the local or national scale, they provide a rational basis for a more granular characterization of observed and predicted change throughout the region. This report also includes some country-specific information. Attention is given to three broad categories of indicators: greenhouse gases, the atmosphere, and the ocean, each in separate sections of this document. Each section contains the common elements:
• Highlights – summarizing and emphasizing important information in the section; • Background – briefly noting why a given indicator is important to assessing environmental
conditions and impacts under a changing climate; and • Indicators – what a given indicator shows using multiple measures, reflecting different data
sources and/or different ways to characterize the data. The individual indicator sections are followed by sections on:
• Future Climate – what changes in the indicator are expected over time; and • Observed and Expected Impacts– what are the socio-economic and bio-cultural impacts
attributable to observed and expected indicator change over time. Information on impacts is considered in the context of sectors.
Sources of information and methods are outlined in the Appendix: Traceable Accounts.
PICCM 2021
4
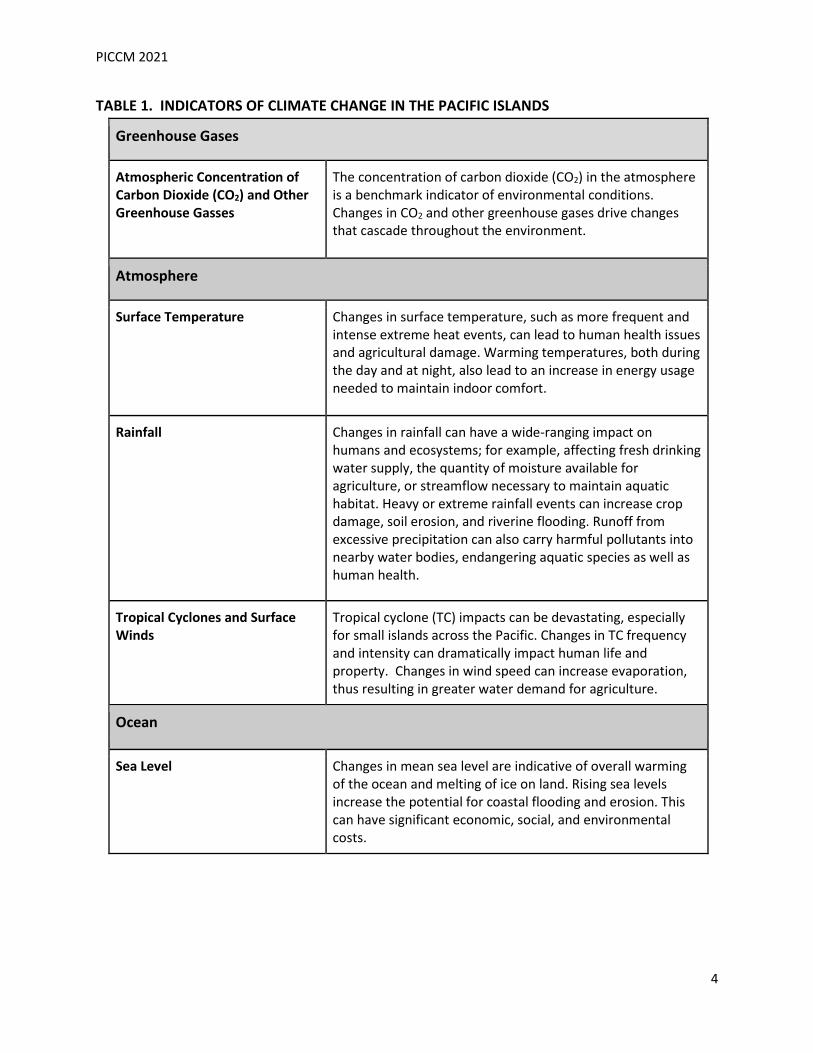
TABLE 1. INDICATORS OF CLIMATE CHANGE IN THE PACIFIC ISLANDS
Greenhouse Gases
Atmospheric Concentration of Carbon Dioxide (CO2) and Other Greenhouse Gasses
The concentration of carbon dioxide (CO2) in the atmosphere is a benchmark indicator of environmental conditions. Changes in CO2 and other greenhouse gases drive changes that cascade throughout the environment.
Atmosphere
Surface Temperature Changes in surface temperature, such as more frequent and intense extreme heat events, can lead to human health issues and agricultural damage. Warming temperatures, both during the day and at night, also lead to an increase in energy usage needed to maintain indoor comfort.
Rainfall Changes in rainfall can have a wide-ranging impact on humans and ecosystems; for example, affecting fresh drinking water supply, the quantity of moisture available for agriculture, or streamflow necessary to maintain aquatic habitat. Heavy or extreme rainfall events can increase crop damage, soil erosion, and riverine flooding. Runoff from excessive precipitation can also carry harmful pollutants into nearby water bodies, endangering aquatic species as well as human health.
Tropical Cyclones and Surface Winds
Tropical cyclone (TC) impacts can be devastating, especially for small islands across the Pacific. Changes in TC frequency and intensity can dramatically impact human life and property. Changes in wind speed can increase evaporation, thus resulting in greater water demand for agriculture.
Ocean
Sea Level Changes in mean sea level are indicative of overall warming of the ocean and melting of ice on land. Rising sea levels increase the potential for coastal flooding and erosion. This can have significant economic, social, and environmental costs.
PICCM 2021
5
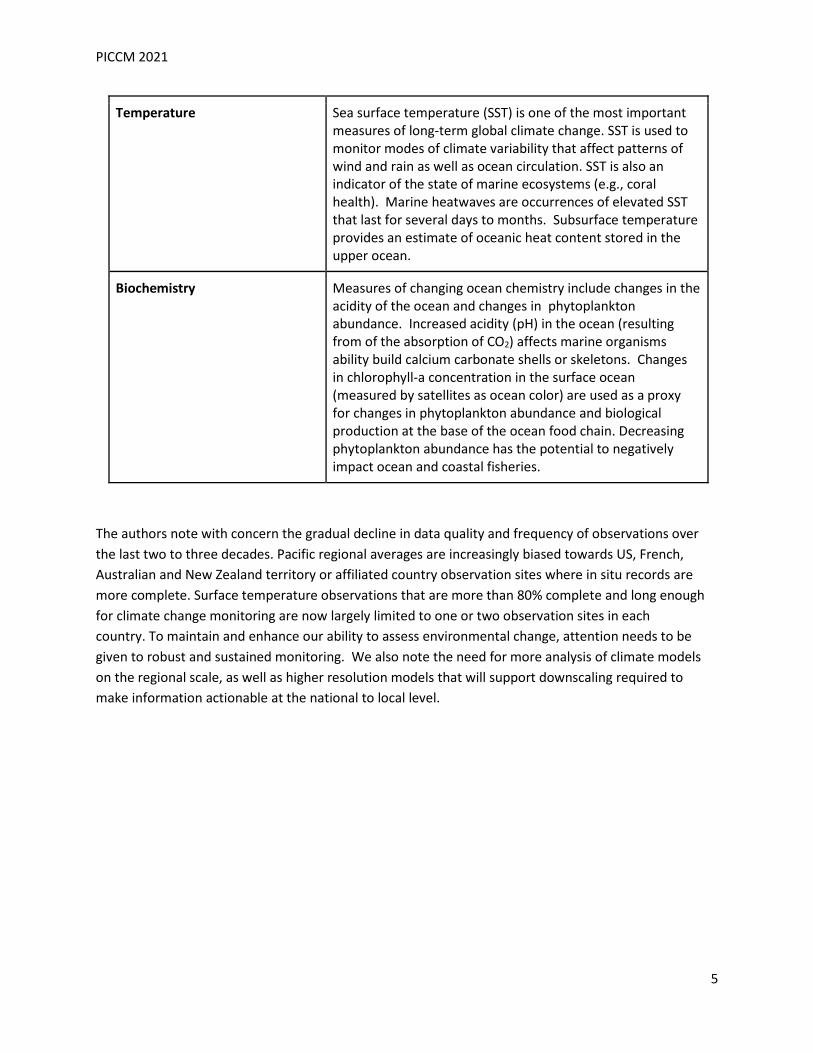
Temperature Sea surface temperature (SST) is one of the most important measures of long-term global climate change. SST is used to monitor modes of climate variability that affect patterns of wind and rain as well as ocean circulation. SST is also an indicator of the state of marine ecosystems (e.g., coral health). Marine heatwaves are occurrences of elevated SST that last for several days to months. Subsurface temperature provides an estimate of oceanic heat content stored in the upper ocean.
Biochemistry Measures of changing ocean chemistry include changes in the acidity of the ocean and changes in phytoplankton abundance. Increased acidity (pH) in the ocean (resulting from of the absorption of CO2) affects marine organisms ability build calcium carbonate shells or skeletons. Changes in chlorophyll-a concentration in the surface ocean (measured by satellites as ocean color) are used as a proxy for changes in phytoplankton abundance and biological production at the base of the ocean food chain. Decreasing phytoplankton abundance has the potential to negatively impact ocean and coastal fisheries.
The authors note with concern the gradual decline in data quality and frequency of observations over the last two to three decades. Pacific regional averages are increasingly biased towards US, French, Australian and New Zealand territory or affiliated country observation sites where in situ records are more complete. Surface temperature observations that are more than 80% complete and long enough for climate change monitoring are now largely limited to one or two observation sites in each country. To maintain and enhance our ability to assess environmental change, attention needs to be given to robust and sustained monitoring. We also note the need for more analysis of climate models on the regional scale, as well as higher resolution models that will support downscaling required to make information actionable at the national to local level.
PICCM 2021
6
Greenhouse Gases
Highlights • Over the last 60 years, the concentration of carbon dioxide (CO2) in the atmosphere measured at
NOAA’s Mauna Loa Observatory has increased by more than 100 ppm (parts per million), to an annual average value over 414 ppm in 2020.
• The annual average rate of increase in CO2 since the 1960s at Mauna Loa is +1.6 ppm per year. Over the last decade, the annual mean rate of growth of CO2 was almost +2.5 ppm.
• The annual average rate of increase in CO2 since at the BOM and CSIRO’s CO2 monitoring station at CO2 at Cape Grim in Tasmania since 1979 is +1.85 ppm per year. The growth rate increased to +2.4 ppm per year during the last decade.
• The combined impact of the greenhouse gases carbon dioxide, methane, nitrous oxide, and halogenated compounds in December 2020 is equivalent to a CO2 concentration of 504 ppm.
Background Rising concentrations of CO2 and other “greenhouse gases” (e.g., methane-CH4, nitrous oxide-N2O, halogenated compounds-mainly fluorinated gases) contribute to increased global warming. They drive changes that cascade throughout the climate system and are reflected in other climate change indicators considered here. Once they enter the atmosphere, greenhouse gases can persist for 10’s to as much as thousands of years1. The rise in the concentration of CO2 and other greenhouse gases can be attributed primarily to human activity, with emissions increasing primarily in response to the burning of fossil fuels and changes in land use1,2. In the Pacific Islands climate is strongly influenced by natural phenomena such as El Niño and La Niña, and the Pacific Decadal Oscillation/Interdecadal Pacific Oscillation3,4. This results in significant year- to year and decade-to-decade variability. The presence of this natural climate variability can make it difficult to discern long-term changes in climate due to increasing greenhouse gases.
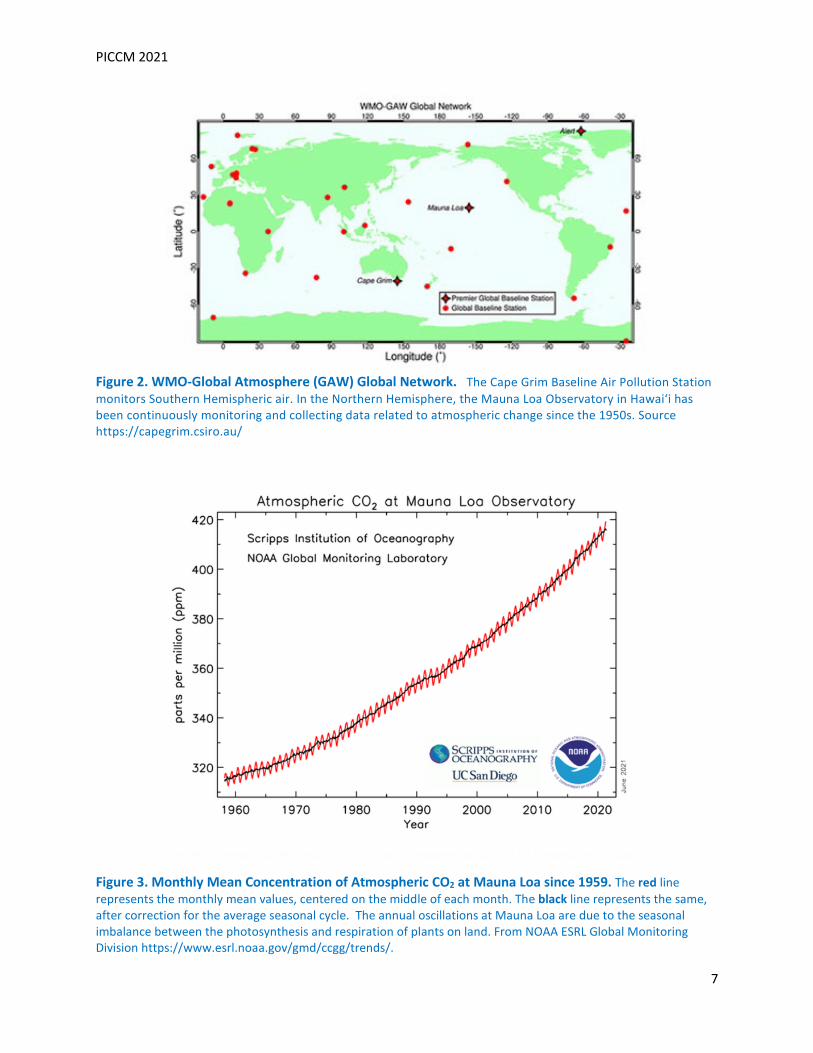
Indicator: Atmospheric Concentration of Carbon Dioxide (CO2) NOAA’s Mauna Loa Observatory in Hawaiʻi and BOM/CSIRO’s monitoring station at Cape Grim in Tasmania are two out of the three Premier Global Baseline Stations in the WMO-Global Atmosphere (GAW) Global Network (Figure 2). The annual mean concentration of CO2, at Mauna Loa in 1959, the onset year of observations, was 315.97 ppm (Figure 3) 5. It passed 350 ppm in 1988 and 400 ppm in 2015. The annual mean concentration of CO2 at Mauna Loa in 2020 was 414.24 ppm. That corresponds to an increase of almost 100 ppm over the last 60 years, or more than +1.6 ppm per year. The rate over the last 25 years, since the early 1990s, is higher (about +2.0 ppm per year). Over the last decade, the annual mean rate of growth of CO2 was even higher (almost +2.5 ppm per year). The monthly high during the period of record ending in December 2020 was 417.31, a record value reached in May of that year.
PICCM 2021
7
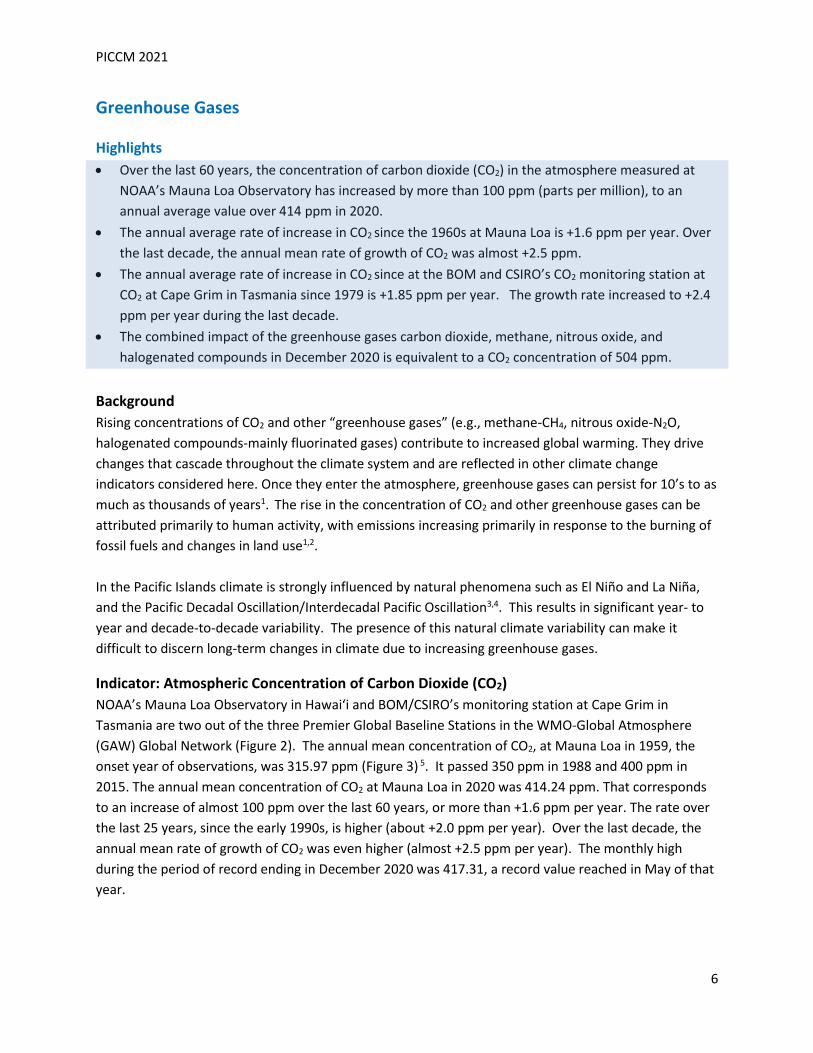
Figure 2. WMO-Global Atmosphere (GAW) Global Network. The Cape Grim Baseline Air Pollution Station monitors Southern Hemispheric air. In the Northern Hemisphere, the Mauna Loa Observatory in Hawaiʻi has been continuously monitoring and collecting data related to atmospheric change since the 1950s. Source https://capegrim.csiro.au/
Figure 3. Monthly Mean Concentration of Atmospheric CO2 at Mauna Loa since 1959. The red line represents the monthly mean values, centered on the middle of each month. The black line represents the same, after correction for the average seasonal cycle. The annual oscillations at Mauna Loa are due to the seasonal imbalance between the photosynthesis and respiration of plants on land. From NOAA ESRL Global Monitoring Division https://www.esrl.noaa.gov/gmd/ccgg/trends/.
PICCM 2021
8
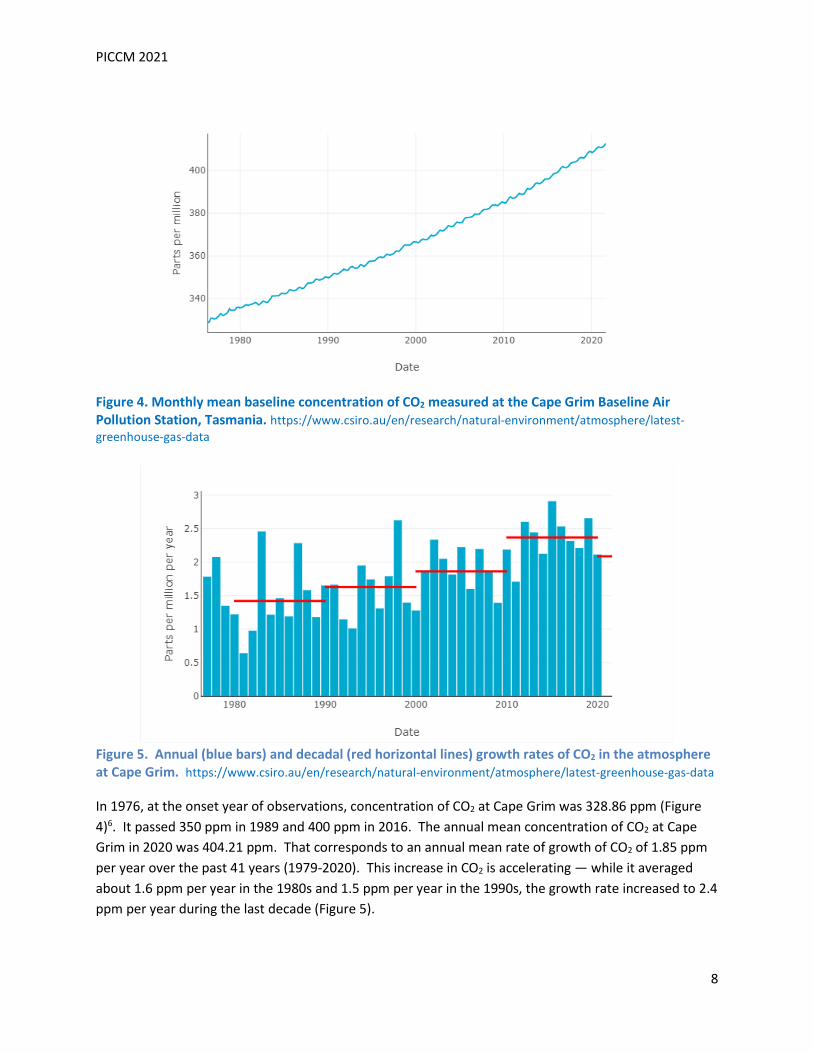
Figure 4. Monthly mean baseline concentration of CO2 measured at the Cape Grim Baseline Air Pollution Station, Tasmania. https://www.csiro.au/en/research/natural-environment/atmosphere/latest-greenhouse-gas-data
Figure 5. Annual (blue bars) and decadal (red horizontal lines) growth rates of CO2 in the atmosphere at Cape Grim. https://www.csiro.au/en/research/natural-environment/atmosphere/latest-greenhouse-gas-data In 1976, at the onset year of observations, concentration of CO2 at Cape Grim was 328.86 ppm (Figure 4)6. It passed 350 ppm in 1989 and 400 ppm in 2016. The annual mean concentration of CO2 at Cape Grim in 2020 was 404.21 ppm. That corresponds to an annual mean rate of growth of CO2 of 1.85 ppm per year over the past 41 years (1979-2020). This increase in CO2 is accelerating — while it averaged about 1.6 ppm per year in the 1980s and 1.5 ppm per year in the 1990s, the growth rate increased to 2.4 ppm per year during the last decade (Figure 5).
PICCM 2021
9
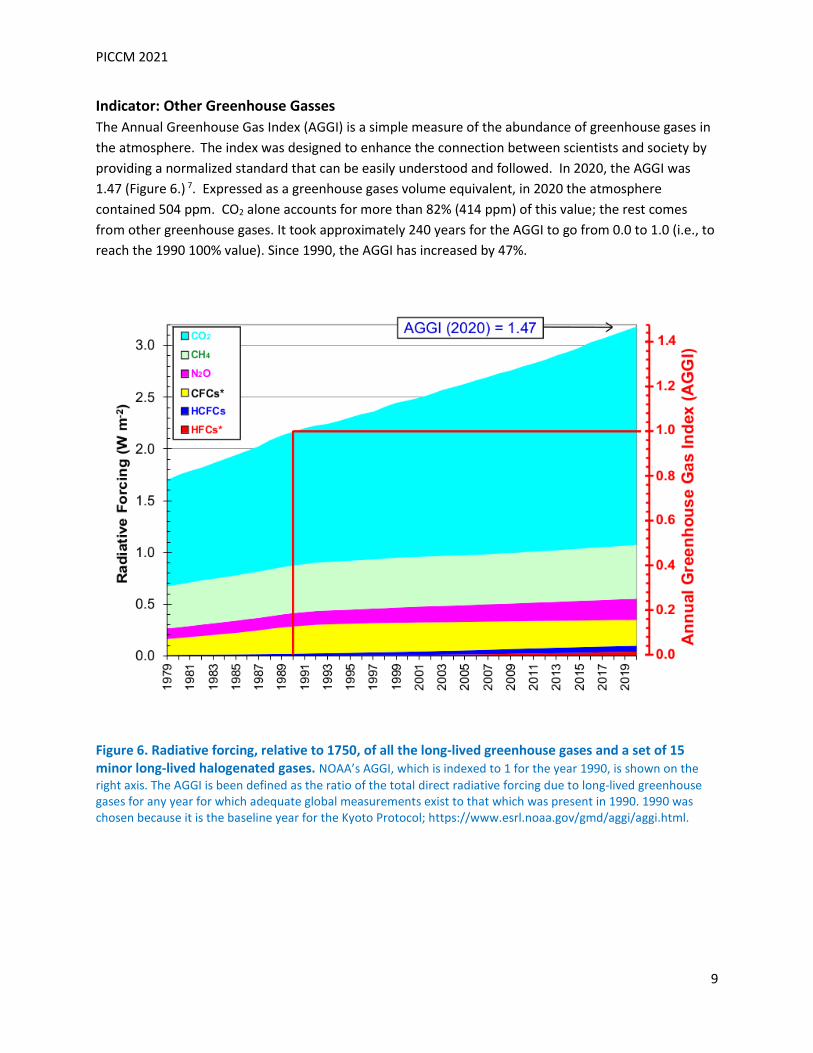
Indicator: Other Greenhouse Gasses The Annual Greenhouse Gas Index (AGGI) is a simple measure of the abundance of greenhouse gases in the atmosphere. The index was designed to enhance the connection between scientists and society by providing a normalized standard that can be easily understood and followed. In 2020, the AGGI was 1.47 (Figure 6.) 7. Expressed as a greenhouse gases volume equivalent, in 2020 the atmosphere contained 504 ppm. CO2 alone accounts for more than 82% (414 ppm) of this value; the rest comes from other greenhouse gases. It took approximately 240 years for the AGGI to go from 0.0 to 1.0 (i.e., to reach the 1990 100% value). Since 1990, the AGGI has increased by 47%.
Figure 6. Radiative forcing, relative to 1750, of all the long-lived greenhouse gases and a set of 15 minor long-lived halogenated gases. NOAA’s AGGI, which is indexed to 1 for the year 1990, is shown on the right axis. The AGGI is been defined as the ratio of the total direct radiative forcing due to long-lived greenhouse gases for any year for which adequate global measurements exist to that which was present in 1990. 1990 was chosen because it is the baseline year for the Kyoto Protocol; https://www.esrl.noaa.gov/gmd/aggi/aggi.html.
PICCM 2021
10
Atmosphere
Surface Temperature
Highlights • The Pacific Islands mean temperature over land has increased by 1.1°C (2°F) since 1951. • Seven of the warmest eight years on record have occurred since 2007. Every year since 1983 has
been above the 1961-1990 average. • The average magnitude of change in hot days at the indicator stations was 3.1%/decade with most
within the range of 0.7 to 5.5%/decade. • The average magnitude of change in cold nights at the indicator stations was -1.2%/decade with
most within the range of -1.9 to -0.6%/decade. • On a regional scale, the increase in hot days is much stronger than the decrease in cold nights.
Background Surface temperature is an important indicator of climate change and variability. Higher temperatures mean more frequent and intense heat events are likely to happen. This can lead to human health issues, agricultural damage, and other changes to plants and animals. Warming temperatures, both during the day and at night, also lead to an increase in energy usage to maintain indoor comfort. When combined with clear skies and only a light breeze, warming temperatures can exacerbate coral bleaching and result in even warmer sea surface temperatures. Interpretation of historical temperature records across the Pacific Islands is difficult. Changes of station location, physical changes at the sites, and even instrumentation changes have had large impacts on the record1,2,3.
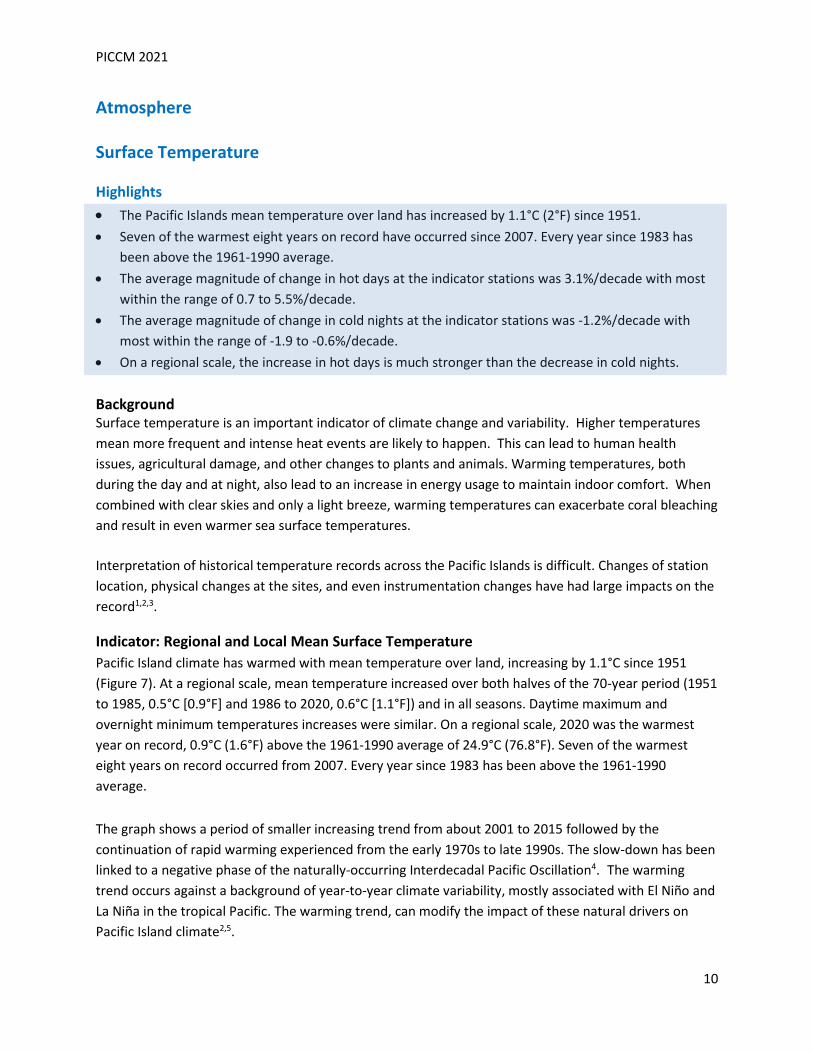
Indicator: Regional and Local Mean Surface Temperature Pacific Island climate has warmed with mean temperature over land, increasing by 1.1°C since 1951 (Figure 7). At a regional scale, mean temperature increased over both halves of the 70-year period (1951 to 1985, 0.5°C [0.9°F] and 1986 to 2020, 0.6°C [1.1°F]) and in all seasons. Daytime maximum and overnight minimum temperatures increases were similar. On a regional scale, 2020 was the warmest year on record, 0.9°C (1.6°F) above the 1961-1990 average of 24.9°C (76.8°F). Seven of the warmest eight years on record occurred from 2007. Every year since 1983 has been above the 1961-1990 average. The graph shows a period of smaller increasing trend from about 2001 to 2015 followed by the continuation of rapid warming experienced from the early 1970s to late 1990s. The slow-down has been linked to a negative phase of the naturally-occurring Interdecadal Pacific Oscillation4. The warming trend occurs against a background of year-to-year climate variability, mostly associated with El Niño and La Niña in the tropical Pacific. The warming trend, can modify the impact of these natural drivers on Pacific Island climate2,5.
PICCM 2021
11
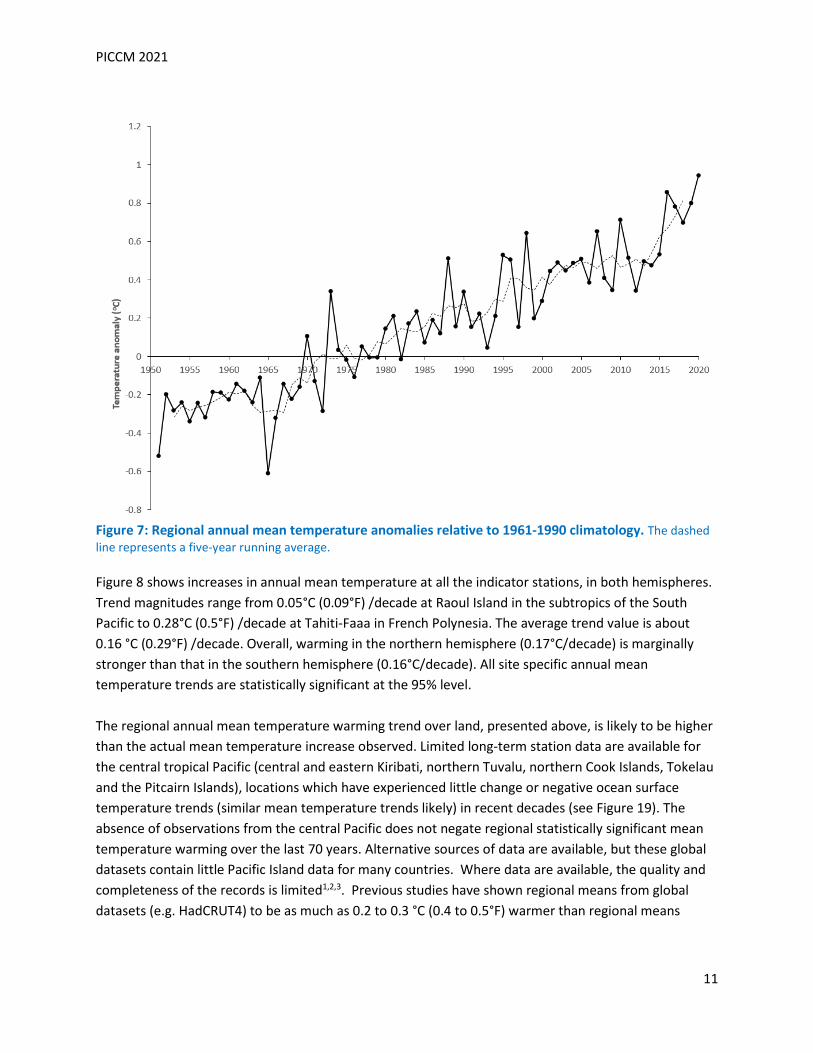
Figure 7: Regional annual mean temperature anomalies relative to 1961-1990 climatology. The dashed line represents a five-year running average. Figure 8 shows increases in annual mean temperature at all the indicator stations, in both hemispheres. Trend magnitudes range from 0.05°C (0.09°F) /decade at Raoul Island in the subtropics of the South Pacific to 0.28°C (0.5°F) /decade at Tahiti-Faaa in French Polynesia. The average trend value is about 0.16 °C (0.29°F) /decade. Overall, warming in the northern hemisphere (0.17°C/decade) is marginally stronger than that in the southern hemisphere (0.16°C/decade). All site specific annual mean temperature trends are statistically significant at the 95% level. The regional annual mean temperature warming trend over land, presented above, is likely to be higher than the actual mean temperature increase observed. Limited long-term station data are available for the central tropical Pacific (central and eastern Kiribati, northern Tuvalu, northern Cook Islands, Tokelau and the Pitcairn Islands), locations which have experienced little change or negative ocean surface temperature trends (similar mean temperature trends likely) in recent decades (see Figure 19). The absence of observations from the central Pacific does not negate regional statistically significant mean temperature warming over the last 70 years. Alternative sources of data are available, but these global datasets contain little Pacific Island data for many countries. Where data are available, the quality and completeness of the records is limited1,2,3. Previous studies have shown regional means from global datasets (e.g. HadCRUT4) to be as much as 0.2 to 0.3 °C (0.4 to 0.5°F) warmer than regional means
PICCM 2021
12
calculated from locally sourced station records for the 1940s to mid-1960s. There is better agreement between the two datasets in recent decades1.
Figure 8: Change in annual mean daily mean temperature from 1951-2020 as observed in in-situ station data from locations across the tropical/subtropical Pacific. Trends are presented in the form of a circle over the station location. The colour of the circle is proportional to the magnitude of the trend: the deeper the shading, the greater the observed warming. For air temperature the positive change is presented with red shading and negative change with blue shading. In practice, all trends are positive and so all circles are shaded red. Circles with an 'X' are significant at the 95% level.
Indicator: Amount of Hot Days According to the IPCC AR6 WG1 report, it is virtually certain that there has been an increase in the number of warm days and nights and a decrease in the number of cold days and nights on the global scale since 19506. Both the coldest extremes and hottest extremes display increasing temperatures. It is also very likely that these changes also occurred in regions neighboring the Pacific, namely Australasia, Asia, and North America.
PICCM 2021
13
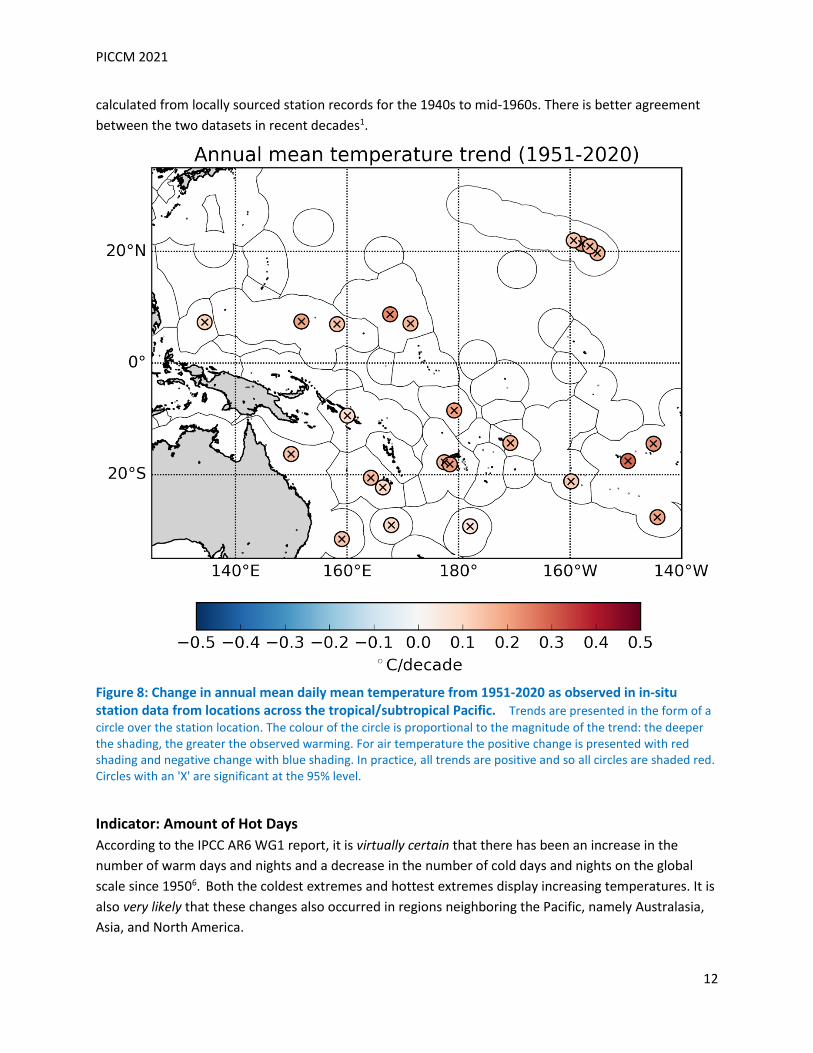
The shift to a warmer climate in the Pacific is accompanied by more extreme daily heat events. These extreme temperature events are also increasing in frequency. Figure 9 shows that the annual percentage of hot days has increased at most of the indicator stations. A hot day is defined as a day when the highest temperature is within the highest 10% of observations (for the respective location) between 1961 and 1990. The regional average change in hot days was 3.1%/decade. At the station level about 70% of the trend magnitudes were within the 0.7 to 5.5%/decade range. For Kwajalein in the Marshall Islands, the increase in hot days is highly significant with an average of 73% of days defined as 'hot' during 2011-2020, compared to 3% of days during 1951-1960.
Figure 9: Trend in the annual amount of hot days over 1951-2020. Circles with 'x' represent trends statistically significant at the 95% level.
PICCM 2021
14
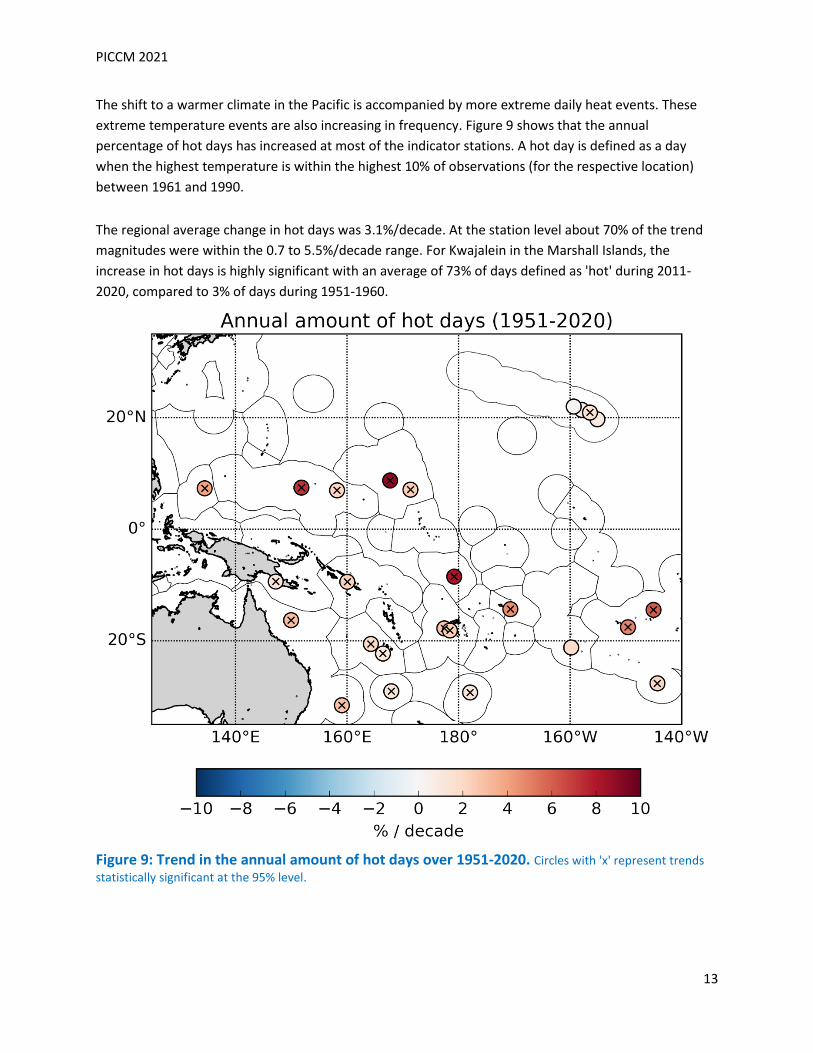
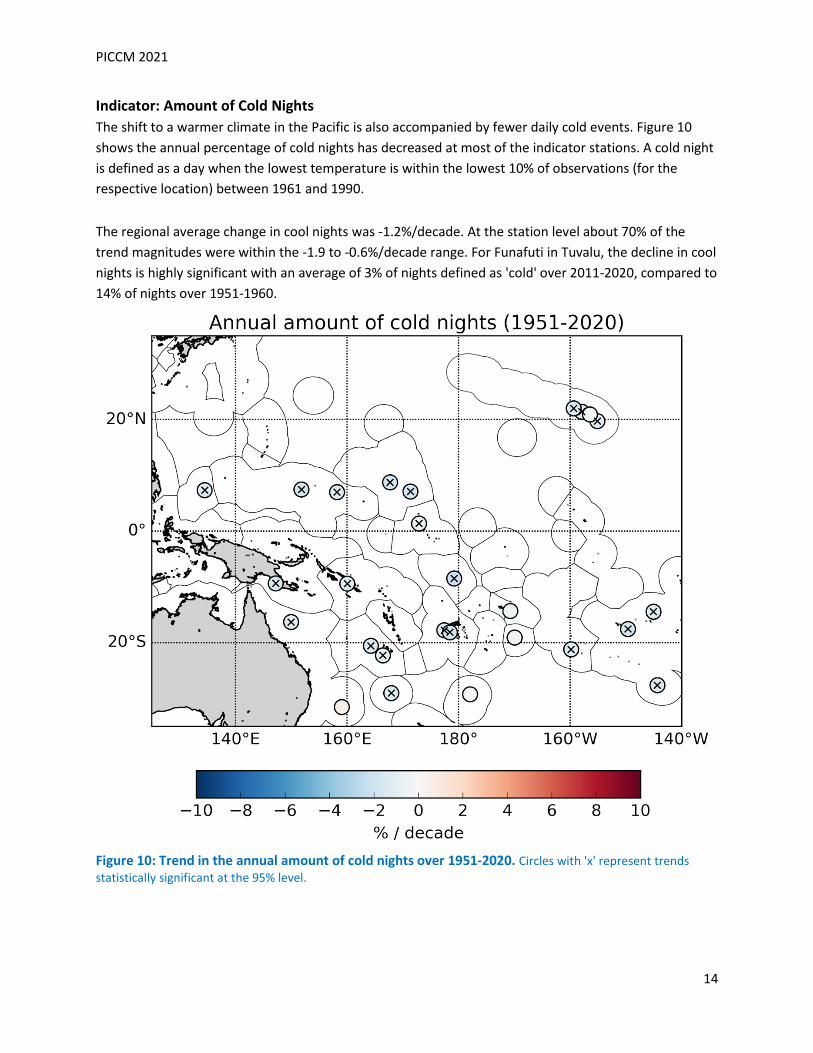
Indicator: Amount of Cold Nights The shift to a warmer climate in the Pacific is also accompanied by fewer daily cold events. Figure 10 shows the annual percentage of cold nights has decreased at most of the indicator stations. A cold night is defined as a day when the lowest temperature is within the lowest 10% of observations (for the respective location) between 1961 and 1990. The regional average change in cool nights was -1.2%/decade. At the station level about 70% of the trend magnitudes were within the -1.9 to -0.6%/decade range. For Funafuti in Tuvalu, the decline in cool nights is highly significant with an average of 3% of nights defined as 'cold' over 2011-2020, compared to 14% of nights over 1951-1960.
Figure 10: Trend in the annual amount of cold nights over 1951-2020. Circles with 'x' represent trends statistically significant at the 95% level.
PICCM 2021
15
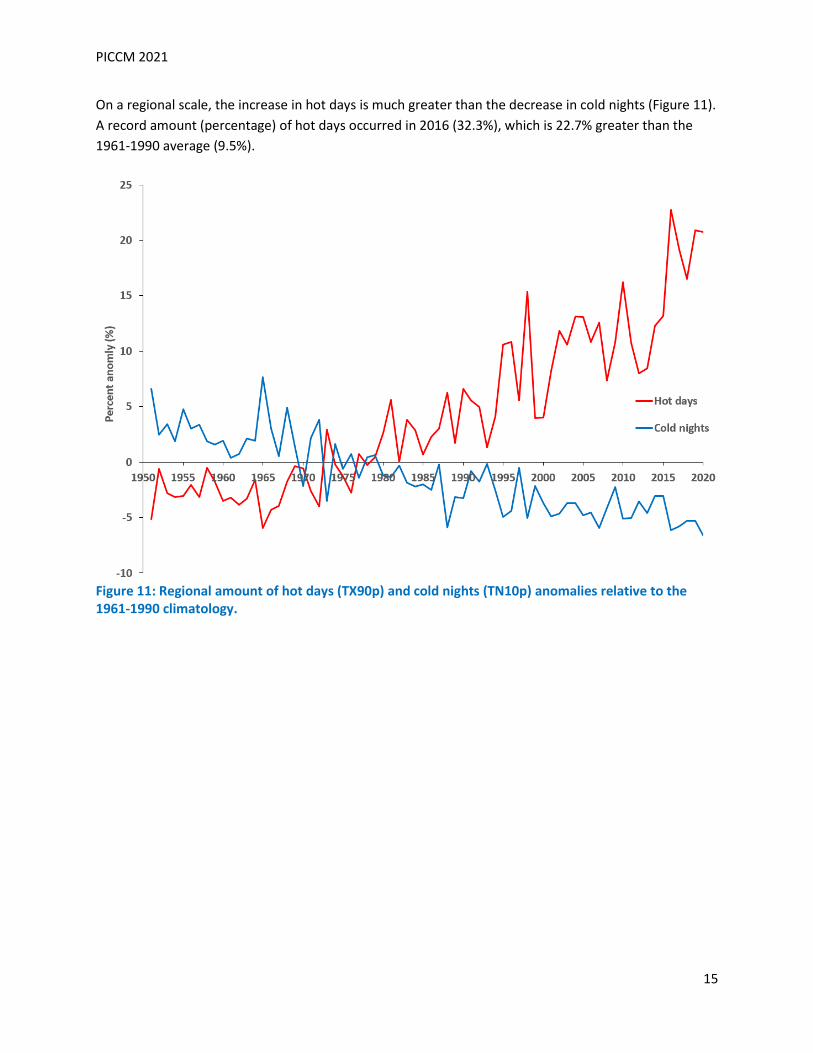
On a regional scale, the increase in hot days is much greater than the decrease in cold nights (Figure 11). A record amount (percentage) of hot days occurred in 2016 (32.3%), which is 22.7% greater than the 1961-1990 average (9.5%).
Figure 11: Regional amount of hot days (TX90p) and cold nights (TN10p) anomalies relative to the 1961-1990 climatology.
PICCM 2021
16
Rainfall
Highlights • Over the last 70 years, there has been little change in annual total rainfall at most of the Pacific
Islands observation sites. However, drying trends are observed is in Hawai'i and at three locations in the South Pacific subtropics.
• Over the last 70 years, there has been little change in annual consecutive dry days at most of the Pacific Islands observation sites. Consistent with the annual total rainfall drying trends, there is a trend towards longer periods of low rainfall in Hawai'i and the South Pacific subtropics.
• There is mixed evidence for change in heavy rainfall across the Pacific Islands. In the Southwest SPCZ region, annual heavy rainfall has increased.
Background Precipitation has wide-ranging impacts on humans and ecosystems, providing fresh drinking water to low-lying atolls, replenishing freshwater lenses, and providing moisture necessary for agriculture. Changes in precipitation could disrupt these and other natural processes. Heavy or extreme rainfall events can increase or enhance impacts to crop damage, soil erosion, and floods. Runoff from excessive precipitation can also carry harmful pollutants into nearby water bodies, endangering not only aquatic species, but also humans who depend on those resources for sustenance and their way of life.
Indicator: Total wet-day Rainfall Over the last 70 years, there has been little change in annual total rainfall on days where rainfall was greater or equal to 1 mm (0.04 inches) at most of the Pacific Islands observation sites (Figure 12). One of the four drying trends (station markers with 'x') is in Hawai'i with the remainder in the South Pacific subtropics. The drying trend observed on the Hawaiian Island of Kaua'i is strongest from December to February and consistent with numerous studies that have found Hawai'i has become drier in recent years7,8,9. In the South Pacific subtropics, the strongest drying trends are over September to November in the eastern South Pacific and July to August in the west. The latter is consistent with drying in recent decades across southern Australia over April to October10,11. In Table 2 the Pacific Islands are divided into subregions of similar year-to-year variability. Negative total rainfall trends are observed in the South Pacific subtropics and in the Southeast French Polynesia region (Society and Tubai Islands). The Hawaiian trend is marginally statistically significant. Elsewhere there has been little change in annual total rainfall on wet days. The drying trend in the southern hemisphere is associated with higher mean sea level pressure and a shift in large-scale weather patterns, with more atmospheric high pressure systems and fewer atmospheric low pressure systems10,12. This increase in mean sea level pressure across southern latitudes is a known response to global warming6,13.

PICCM 2021
17
Figure 12: Trends in annual total rainfall on wet days over 1951-2020. Circles with 'x' represent trends statistically significant at the 95% level. Closer to the equator, Pacific Island rainfall is highly variable from year-to-year and strongly influenced by phenomena such as El Niño and La Niña14,15. Climate drivers such as the Pacific Decadal Oscillation/Interdecadal Pacific Oscillation also influence Pacific rainfall resulting in significant decade-to-decade variability16,17. The high variability and apparent drying trends align with the canonical placement of both the Intertropical Convergence Zone (ITCZ) and South Pacific Convergence Zone (SPCZ), indicating that these subregions may be experiencing even higher variability compared to the rest of the Pacific, consistent with anticipated changes in circulation patterns.
PICCM 2021
18
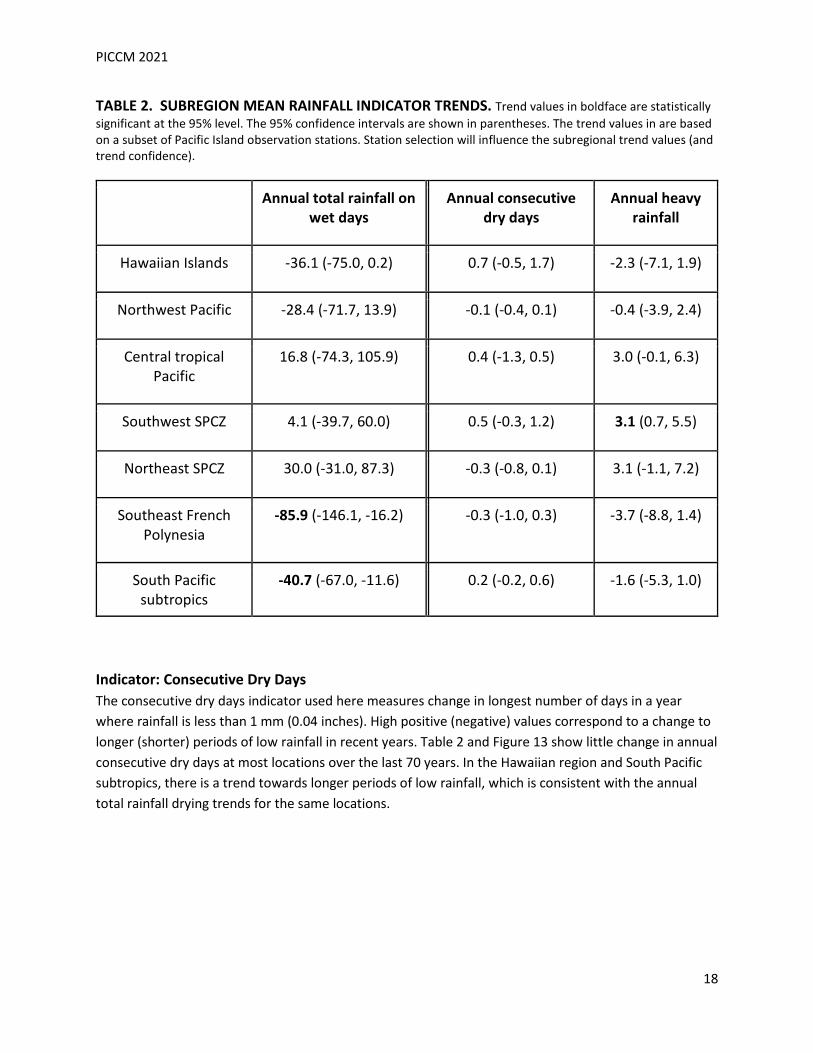
TABLE 2. SUBREGION MEAN RAINFALL INDICATOR TRENDS. Trend values in boldface are statistically significant at the 95% level. The 95% confidence intervals are shown in parentheses. The trend values in are based on a subset of Pacific Island observation stations. Station selection will influence the subregional trend values (and trend confidence).
Annual total rainfall on wet days
Annual consecutive dry days
Annual heavy rainfall
Hawaiian Islands -36.1 (-75.0, 0.2) 0.7 (-0.5, 1.7) -2.3 (-7.1, 1.9)
Northwest Pacific -28.4 (-71.7, 13.9) -0.1 (-0.4, 0.1) -0.4 (-3.9, 2.4)
Central tropical Pacific
16.8 (-74.3, 105.9) 0.4 (-1.3, 0.5) 3.0 (-0.1, 6.3)
Southwest SPCZ 4.1 (-39.7, 60.0) 0.5 (-0.3, 1.2) 3.1 (0.7, 5.5)
Northeast SPCZ 30.0 (-31.0, 87.3) -0.3 (-0.8, 0.1) 3.1 (-1.1, 7.2)
Southeast French Polynesia
-85.9 (-146.1, -16.2) -0.3 (-1.0, 0.3) -3.7 (-8.8, 1.4)
South Pacific subtropics
-40.7 (-67.0, -11.6) 0.2 (-0.2, 0.6) -1.6 (-5.3, 1.0)
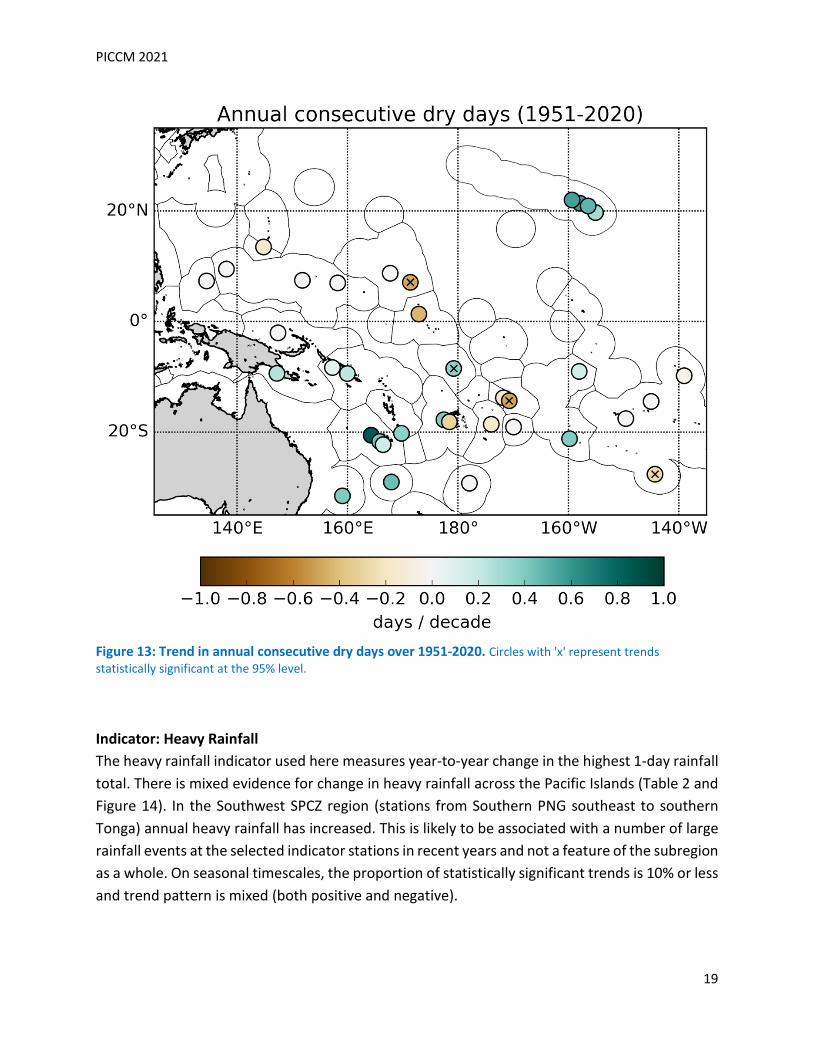
Indicator: Consecutive Dry Days The consecutive dry days indicator used here measures change in longest number of days in a year where rainfall is less than 1 mm (0.04 inches). High positive (negative) values correspond to a change to longer (shorter) periods of low rainfall in recent years. Table 2 and Figure 13 show little change in annual consecutive dry days at most locations over the last 70 years. In the Hawaiian region and South Pacific subtropics, there is a trend towards longer periods of low rainfall, which is consistent with the annual total rainfall drying trends for the same locations.
PICCM 2021
19
Figure 13: Trend in annual consecutive dry days over 1951-2020. Circles with 'x' represent trends statistically significant at the 95% level.
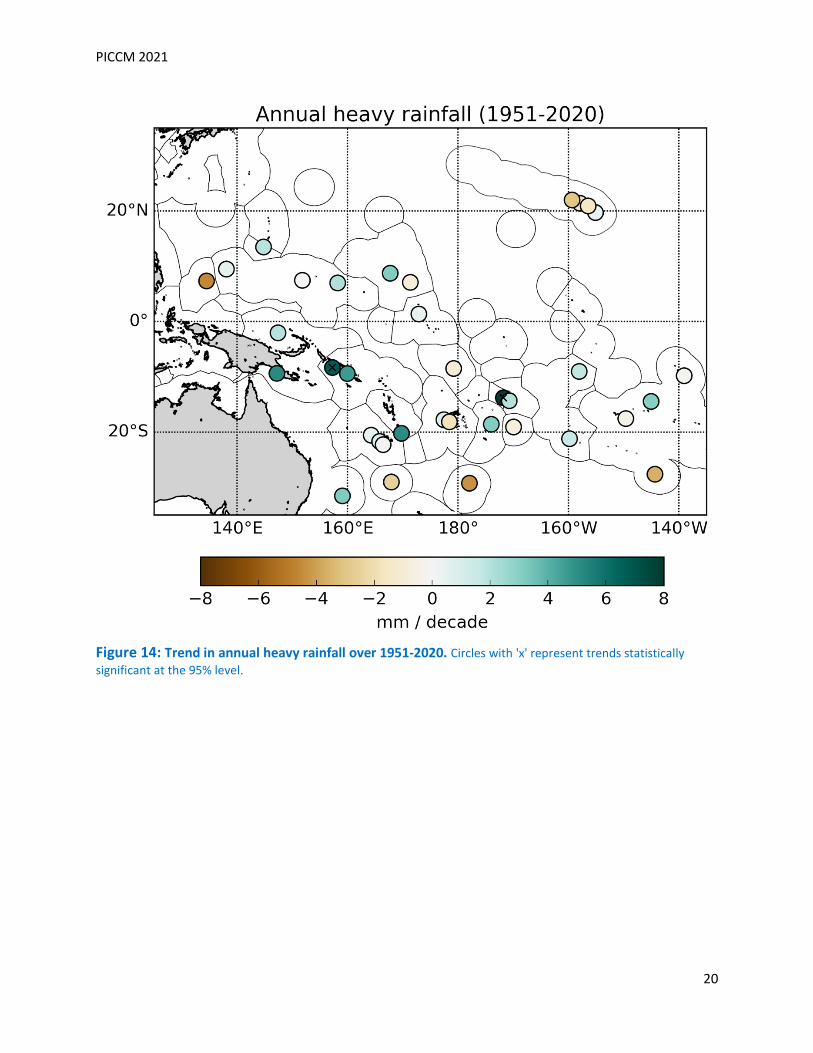
Indicator: Heavy Rainfall The heavy rainfall indicator used here measures year-to-year change in the highest 1-day rainfall total. There is mixed evidence for change in heavy rainfall across the Pacific Islands (Table 2 and Figure 14). In the Southwest SPCZ region (stations from Southern PNG southeast to southern Tonga) annual heavy rainfall has increased. This is likely to be associated with a number of large rainfall events at the selected indicator stations in recent years and not a feature of the subregion as a whole. On seasonal timescales, the proportion of statistically significant trends is 10% or less and trend pattern is mixed (both positive and negative).
PICCM 2021
20
Figure 14: Trend in annual heavy rainfall over 1951-2020. Circles with 'x' represent trends statistically significant at the 95% level.
PICCM 2021
21
Tropical Cyclones and Surface Winds
Highlights ● In all three subregions – Western North Pacific, Central North Pacific, and Western South Pacific -
there is not a notable up or down trend in the frequency or magnitude of storms and cyclones since the 1980’s, with nearly an equal number of above- and below- normal season activity.
● In the Western North Pacific, frequency counts since 1980 of surface winds greater than or equal to 34 knots show no statistically significant trends.
● In the Central North Pacific, frequency counts since 1980 of surface winds greater than or equal to 34 knots show no statistically significant trends.
● In the Western South Pacific, the extra-tropical sub-region shows a statistically significant rise in the frequency of 34 knot wind events since 1980.
Background Changes in the intensity, frequency, and location of Tropical Cyclones (TCs) is an important consideration with respect to climate change. The impact to human life and property from a landfalling TC can be devastating, especially for small islands across the Pacific. Changes in wind speed can increase evaporation, resulting in greater water demand for agriculture1. The Pacific Ocean basin covers a large geographic area, near 40°N–40°S, 120°E–120°W, and as such, is broken down into three subregions: Western North Pacific, Central North Pacific, and Western South Pacific for TC monitoring and recording keeping according to the International Best Track Archive for Climate Stewardship (IBTrACS)2,3. These subregions map closely to the RMSC areas of responsibility.
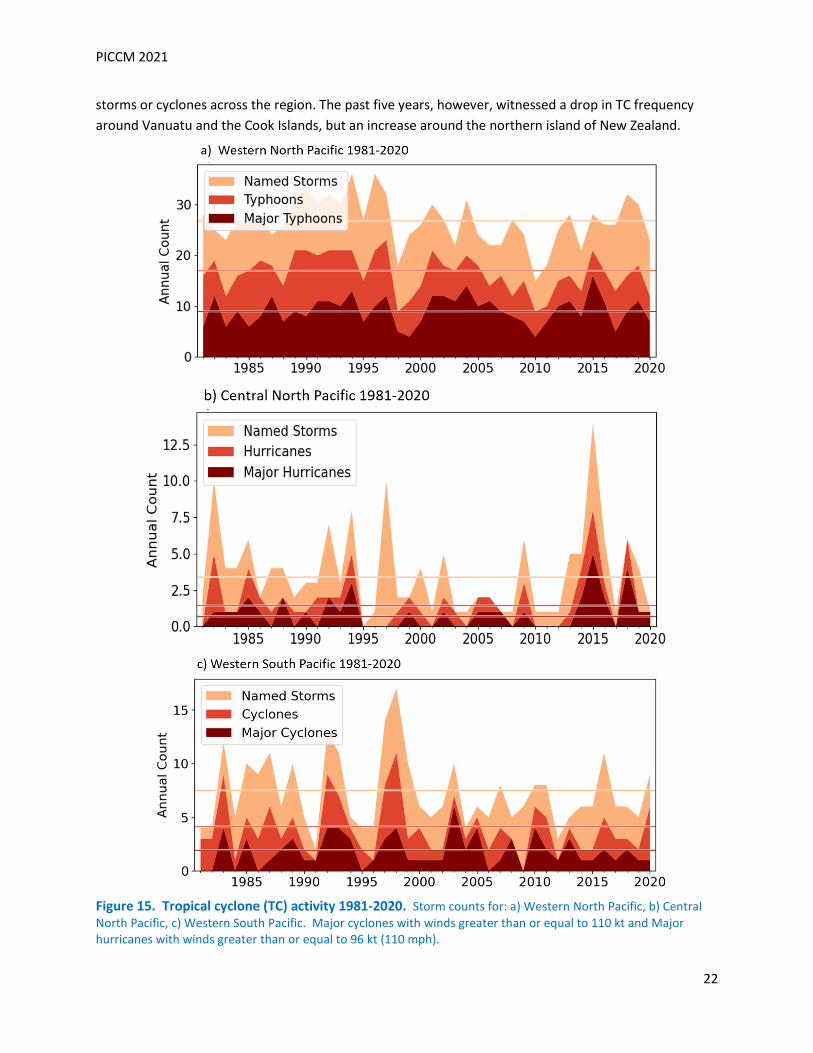
Indicator: Total number of TCs by basin Western North Pacific (Figure 15a): Since 1980, trends in the number of named storms and typhoons have remained constant, with nearly an equal number of above- and below-normal season activity. The quietest season was during 2010, with only 15 named storms. However, nine out of the last ten years have seen relatively shorter-lived TCs, despite the TC count being near normal. This is also reflected in a broad area of decreasing activity between 20°–40°N latitude (and an increase near the Philippines). Central North Pacific (Figure 15b):Since 1980, trends in the number of named storms and hurricanes have remained constant, with nearly an equal number of above- and below- normal season activity. The last three seasons (2017/2018, 2018/2019, 2019/2020) have witnessed TC numbers close to the long-term averages compared to the period 2010-2015 which had TC seasons with TC numbers below average. The most active year was 1992, with 28 named storms. For the period 1991–2020, the IBTrACS dataset indicates a reduction in the number of TCs near 120°W, west of Mexico, but with a slight increase in occurrences over the Baja Peninsula. Western South Pacific (Figure 15c): 2016 was the busiest year on record since 1998 with 12 TCs. Like the other sub-regions, long-term trends do not exhibit noticeable trends in the frequency or magnitude of
PICCM 2021
22
storms or cyclones across the region. The past five years, however, witnessed a drop in TC frequency around Vanuatu and the Cook Islands, but an increase around the northern island of New Zealand.
Figure 15. Tropical cyclone (TC) activity 1981-2020. Storm counts for: a) Western North Pacific, b) Central North Pacific, c) Western South Pacific. Major cyclones with winds greater than or equal to 110 kt and Major hurricanes with winds greater than or equal to 96 kt (110 mph).
PICCM 2021
23
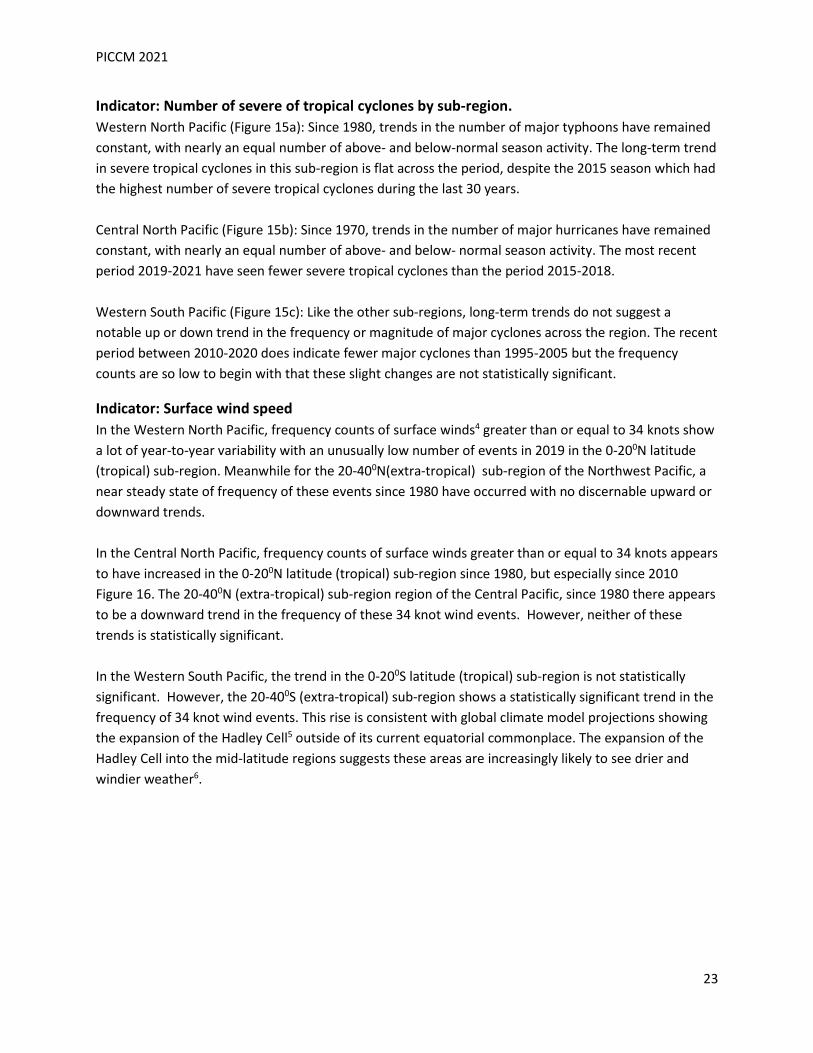
Indicator: Number of severe of tropical cyclones by sub-region. Western North Pacific (Figure 15a): Since 1980, trends in the number of major typhoons have remained constant, with nearly an equal number of above- and below-normal season activity. The long-term trend in severe tropical cyclones in this sub-region is flat across the period, despite the 2015 season which had the highest number of severe tropical cyclones during the last 30 years. Central North Pacific (Figure 15b): Since 1970, trends in the number of major hurricanes have remained constant, with nearly an equal number of above- and below- normal season activity. The most recent period 2019-2021 have seen fewer severe tropical cyclones than the period 2015-2018. Western South Pacific (Figure 15c): Like the other sub-regions, long-term trends do not suggest a notable up or down trend in the frequency or magnitude of major cyclones across the region. The recent period between 2010-2020 does indicate fewer major cyclones than 1995-2005 but the frequency counts are so low to begin with that these slight changes are not statistically significant.
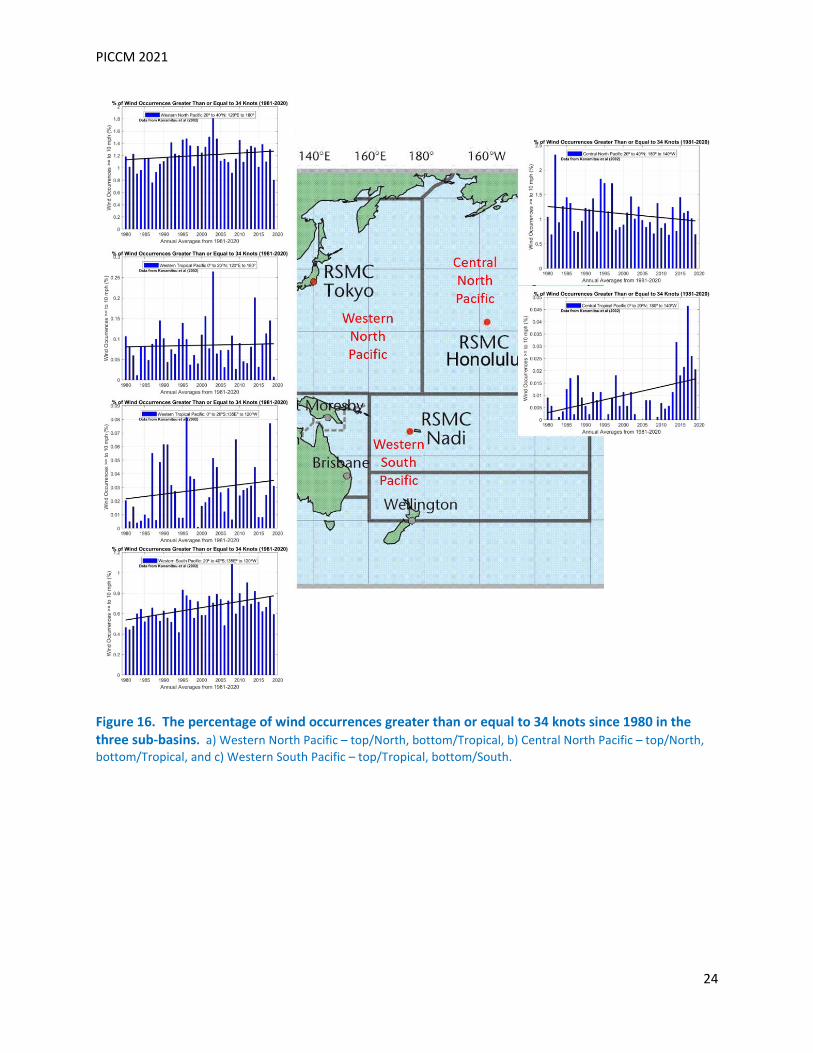
Indicator: Surface wind speed In the Western North Pacific, frequency counts of surface winds4 greater than or equal to 34 knots show a lot of year-to-year variability with an unusually low number of events in 2019 in the 0-200N latitude (tropical) sub-region. Meanwhile for the 20-400N(extra-tropical) sub-region of the Northwest Pacific, a near steady state of frequency of these events since 1980 have occurred with no discernable upward or downward trends. In the Central North Pacific, frequency counts of surface winds greater than or equal to 34 knots appears to have increased in the 0-200N latitude (tropical) sub-region since 1980, but especially since 2010 Figure 16. The 20-400N (extra-tropical) sub-region region of the Central Pacific, since 1980 there appears to be a downward trend in the frequency of these 34 knot wind events. However, neither of these trends is statistically significant. In the Western South Pacific, the trend in the 0-200S latitude (tropical) sub-region is not statistically significant. However, the 20-400S (extra-tropical) sub-region shows a statistically significant trend in the frequency of 34 knot wind events. This rise is consistent with global climate model projections showing the expansion of the Hadley Cell5 outside of its current equatorial commonplace. The expansion of the Hadley Cell into the mid-latitude regions suggests these areas are increasingly likely to see drier and windier weather6.
PICCM 2021
24
Figure 16. The percentage of wind occurrences greater than or equal to 34 knots since 1980 in the three sub-basins. a) Western North Pacific – top/North, bottom/Tropical, b) Central North Pacific – top/North, bottom/Tropical, and c) Western South Pacific – top/Tropical, bottom/South.
PICCM 2021
25
Ocean
Sea Level
Highlights • Sea level has risen across the Pacific Islands region. In much of the western tropical Pacific sea level
has risen approximately 10—15 cm (4—6 in), close to or nearly twice the global rate measured since 1993. In the central tropical Pacific sea level has risen approximately 5—10 cm (2—4 in).
• For the most part, local rates of change obtained from tide gauges are in agreement with those derived from satellites. However owing to vertical land motion and other factors, there are locations such as Pago Pago, American Samoa where the local change of 31 ±7 cm (12 in ± 3 in) since 1993 as measured in the tide gauge is well above the amount derived from satellite observations.
• Natural patterns of variability play an important role in regional and local variation in sea level. These seasonal, interannual, and multi-decadal changes in sea level sometimes exceed 30 cm (12 in) above or below normal, which is a much larger amplitude than the observed long-term trend.
• Rising mean sea levels have already resulted in dramatic increases in the frequency of minor flooding since 1980. Notable increases include: Guam from 2 to 22 times a year (a 1000% increase); Penrhyn, Cook Islands from 5 to 43 times a year (a 760% increase); Majuro, Republic of the Marshall Islands from 2 to 20 times a year (a 900% increase); Papeete, French Polynesia from 5 to 34 times a year (a 548% increase); and Pago Pago, American Samoa from 0 to 102 times a year.
Background Sea level rise is a crucial issue for many coastal regions in the Pacific due to the associated increase in damaging inundation, flooding, erosion and receding sandy coasts1,2. Impacts of higher sea levels also occur through saltwater intrusion and flood inundation of aquifers and other domestic water supplies, as well as salinization and flood damage to agriculture3.4.
Since the start of continuous satellite measurements of global sea level in 1993, the global mean sea level (GMSL) has risen at an average rate of 3.3 mm (0.13 in) per year5. A new record high GMSL was set in 2020 of 9.1 cm (3.6 in) above 1993 levels6. This rise in GMSL is primarily attributable to greenhouse warming, which influences the sea level in two ways. Heating of the ocean causes the water to become more buoyant and expand. Additionally, melting of glaciers and ice sheets transfer water mass from the land to the ocean. Changes in storage of water on land (e.g. in lakes and reservoirs) also affect the global sea level, especially on year-to-year time scales, but have a much smaller contribution to the long-term trend. Sea level trends measured in many parts of the Pacific Islands region differ relative to the absolute GMSL rate, often by as much as 5 times depending on the location and year. Several factors contribute to this spatial and temporal variability. There are contrasting regional fingerprints in SLR caused by global warming5,7,8. Trends driven by global warming are accompanied by naturally-occurring regional SLR
PICCM 2021
26
variations due to e.g., the El Niño–Southern Oscillation (ENSO) on interannual time scales9-14, and the IPO (Interdecadal Pacific Oscillation)/PDO (Pacific Decadal Oscillation) on decadal to multi-decadal time scales12,15,16. The natural variations can amplify or dampen the underlying trends arising from global warming. Natural climate variability is associated with large sea level fluctuations in the tropical western and Pacific, with below-normal sea levels during El Niño events and above-normal sea levels during La Niña. In Guam, for example, ENSO-related variations in sea level are on the order of ±30 cm (12 in) and the anomalies typically last for several months. Hawaiʻi, in the central North Pacific, experiences less sea level variability on interannual and decadal time scales. There are also factors other than climate variability that have a strong effect on coastal sea levels in the tropical Pacific. Vertical land motion (e.g., associated with some earthquakes) is large for several Pacific Islands17,18, such as the Samoan Archipelago where it accounts for substantial differences in sea level trends measured by tide gauges and satellites, since only the former instruments record water levels relative to the land19.
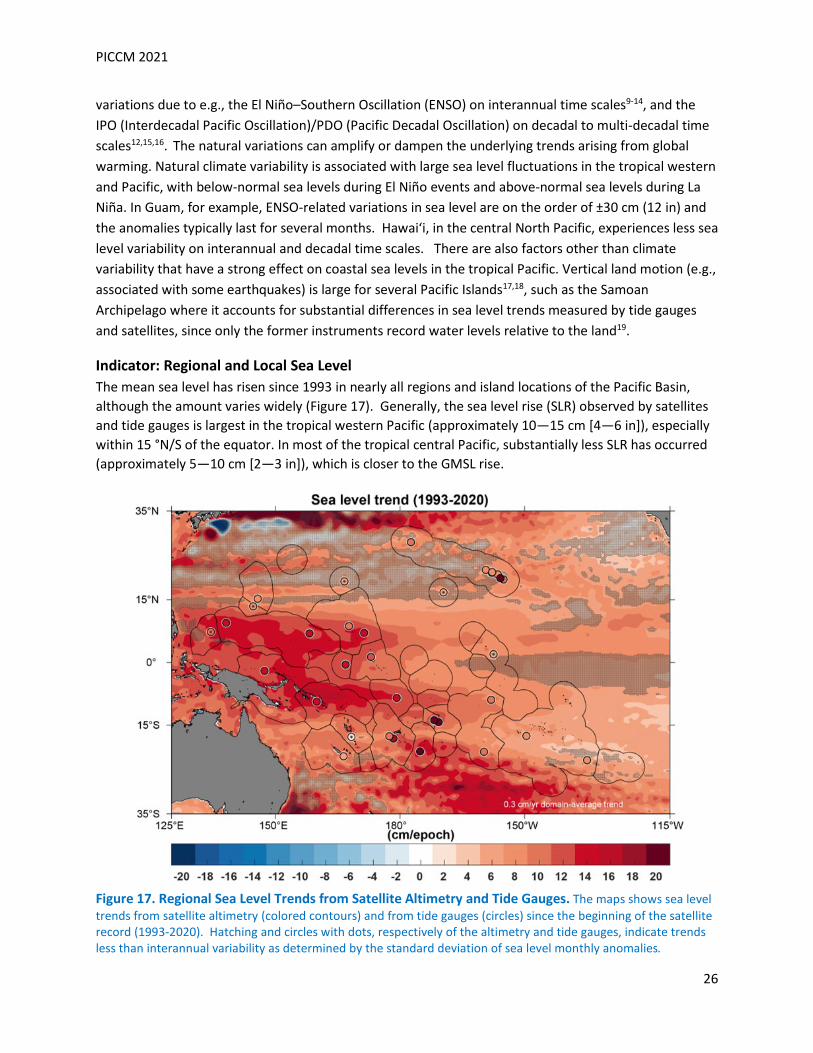
Indicator: Regional and Local Sea Level The mean sea level has risen since 1993 in nearly all regions and island locations of the Pacific Basin, although the amount varies widely (Figure 17). Generally, the sea level rise (SLR) observed by satellites and tide gauges is largest in the tropical western Pacific (approximately 10—15 cm [4—6 in]), especially within 15 °N/S of the equator. In most of the tropical central Pacific, substantially less SLR has occurred (approximately 5—10 cm [2—3 in]), which is closer to the GMSL rise.
Figure 17. Regional Sea Level Trends from Satellite Altimetry and Tide Gauges. The maps shows sea level trends from satellite altimetry (colored contours) and from tide gauges (circles) since the beginning of the satellite record (1993-2020). Hatching and circles with dots, respectively of the altimetry and tide gauges, indicate trends less than interannual variability as determined by the standard deviation of sea level monthly anomalies.
PICCM 2021
27
Tide gauge measured SLR is consistent with the satellite-measured local trends for most of the tropical Pacific Islands (Figure 17). There are some notable exceptions, which are mostly explained by processes affecting the local sea level measured relative to land (e.g., subsidence manifests as sea level rise recorded by tide gauges). Locations where trends observed in tide gauges (means and ±standard deviations above GMSL) show marked differences from trends derived from satellites are: Kawaihae, Hawaiʻi (24 ± 5 cm: 9 ± 2 in); Apia, Samoa (28 ± 7 cm : 11 ± 3 in); Pago Pago, American Samoa (31 ± 7 cm: 12 ± 3 in); Nuku`alofa, Tonga (19 ± 5 cm: 8 ± 2 in); Suva, Fiji (19 cm ± 5 cm; 7 ± 2 in); and Funafuti, Tuvalu (13 ± 7 cm; 5 ± 3 in).
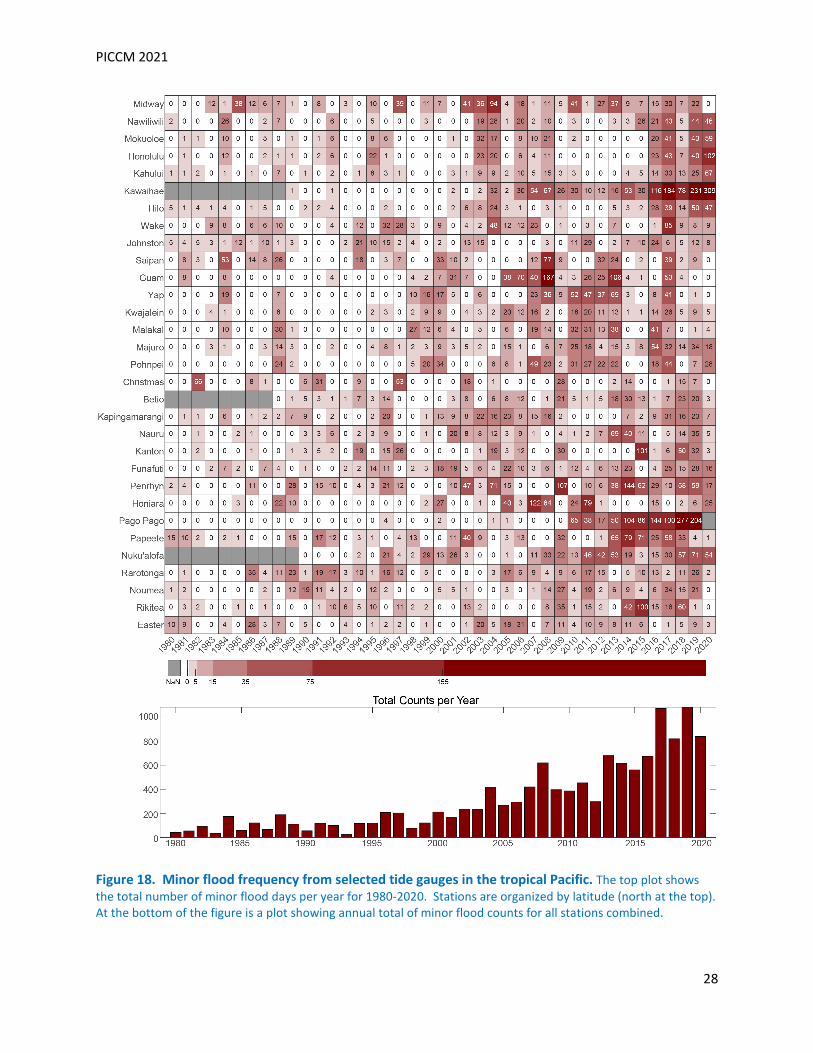
Indicator: Minor Flood Frequency Local sea level variability and trends account for substantial changes in the minor flood frequency 20,21. Minor floods sometimes occur when exceptionally high tides combine with large waves and/or other oceanic and atmospheric phenomena that raise the coastal water level 22,23,24 . Though their impacts are less than major floods which occur during severe storms, the cumulative impacts associated with minor flooding can be considerable25. The total number of minor flood days per year for a select set of tide gauges in the western and central tropical Pacific is shown in Figure 18. Here, a minor flood day is defined as a day in which the sea level at a given tide gauge exceeds the elevation reached twice a year on average (i.e., the 0.5 year return interval derived from extreme value analysis). Increases in minor flood frequency are apparent (white to red), which is consistent with the regional trends in mean sea level. During the decade 2010-2019 relative to the decade 1980-1989, minor flood frequency increased at all but 3 out of 31 locations across the Pacific. The three exceptions are: Easter Island, Chile; Christmas Island, Kiribati; and Saipan, Commonwealth of the Mariana Islands. Some of the increases have been extraordinary. For example, minor flood counts increased in Guam from 2 to 22 times a year (a 1000% increase); in Penrhyn, Cook Islands from 5 to 43 times a year (a 760% increase); in Majuro, Republic of the Marshall Islands from 2 to 20 times a year (a 900% increase); in Papeete, French Polynesia from 5 to 34 times a year (a 548% increase); and in Pago Pago, American Samoa from 0 to 102 times a year. Average annual minor flood frequency counts over these same time periods (the 1980’s versus the 2010’s) for all stations combined increased from 93 to 709 (a 654% increase). Interannual variability of minor flood occurrence is also discernable in Figure 18. La Niña events (e.g., occurring during 1988-1989, 1998-2001, 2005-2006, 2007-2008, 2010-2012, and 2016-2018) are associated with high counts of minor flood days in Guam and Yap, Federated States of Micronesia. In contrast, El Niño (especially the strongest events that began in 1997 and 2015) is rarely associated with high counts of minor flood days, at least in northwestern tropical Pacific around these two places.
PICCM 2021
28
Figure 18. Minor flood frequency from selected tide gauges in the tropical Pacific. The top plot shows the total number of minor flood days per year for 1980-2020. Stations are organized by latitude (north at the top). At the bottom of the figure is a plot showing annual total of minor flood counts for all stations combined.
PICCM 2021
29
Temperature
Highlights • For the most part, mean sea surface temperature in the Pacific has warmed over the past few
decades by a few tenths of a degree per decade, with an overall warming of approximately 0.90C (1.6°F) since 1982.
• From the 1980s to 2000s the average duration of marine heatwaves is consistent, with much of the Pacific region within the 5- to 16-day range. However, there is a significant increase in event duration in the 2010s, with most of the Pacific in the 8 to 20+ day range.
• Trends in subsurface heat content over period 1981 to 2018 are largely positive in the Western Warm Pool region and in the northern and southern sub-tropics
• Highest positive trends in subsurface heat content were found in western PNG, Solomon Islands, Nauru, and Tokelau. Slightly negative trends were found in the eastern Pacific just north and south of the equator.
Background Changes in ocean temperature are one of the most important measures of long-term global climate change. Ocean temperature is an indicator of the state of marine ecosystems, as surface and subsurface variations surface can influence species distribution, growth, and life span, alter their migration and breeding patterns, and threaten sensitive ecosystems such as coral reefs1.
Indicator: Mean Sea Surface Temperature SST is probably one of the most well-known and widely observed climate indicators2. SST is used to monitor human-forced climate change and modes of natural climate variability that affect patterns of wind and rain as well as ocean circulation, such as the El Niño–Southern Oscillation (ENSO) and the Interdecadal Pacific Oscillation (IPO)/Pacific Decadal Oscillation (PDO)3,4. The Physical Sciences Division at NOAA produces an SST product based on optimum interpolation (OI) analysis. The product, NOAA OISSTv25,6,7 is produced weekly on a one-degree grid. Monthly averages are used here. The temporal coverage of the monthly data used is from January 1982 through December 2021.
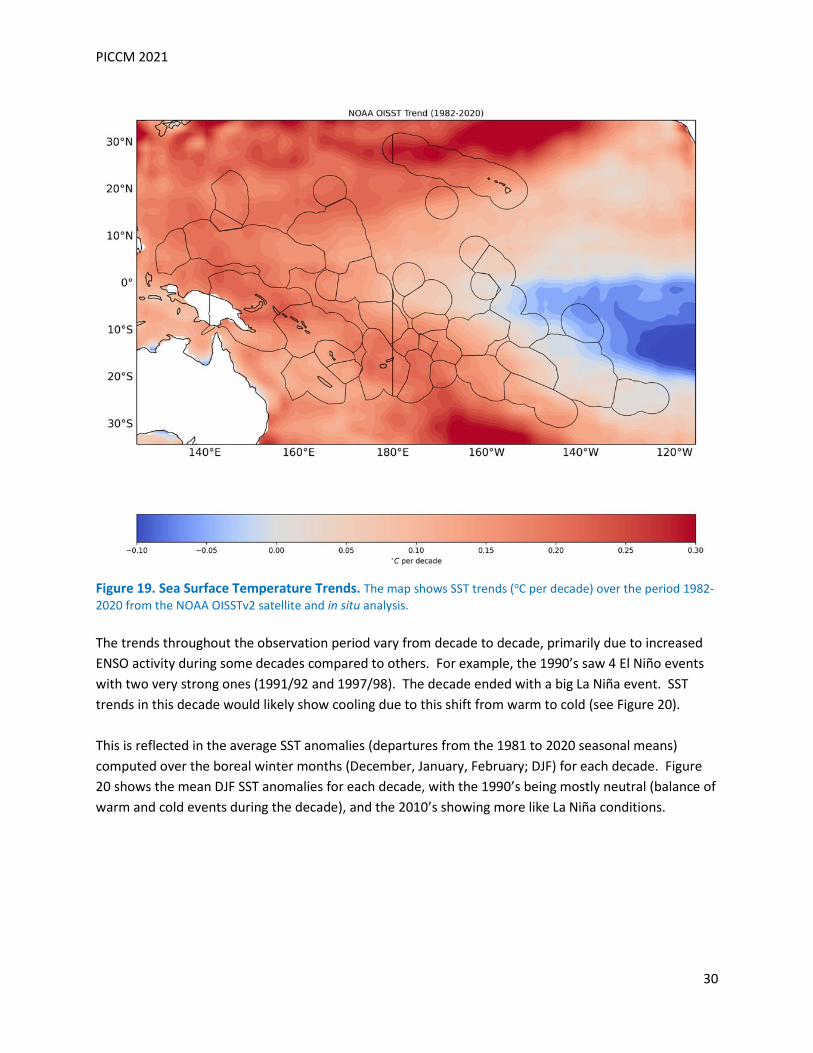
The observed trend at each 1-degree grid point, in oC per decade, is shown in Figure 19. Almost all Pacific Island countries have experienced warming during this period. Hawaiʻi, Niue and Tonga have all experienced at least 0.2 oC (0.4°F) per decade warming, while most other countries have experience warming between 0.1 and 0.2 oC (0.2 to0.4°F) per decade. The southeastern part, around the Marquesas is a notable exception. Here, temperatures show cooling trends over the period 1982-2021 which may be related to changes to the large-scale winds8.
PICCM 2021
30
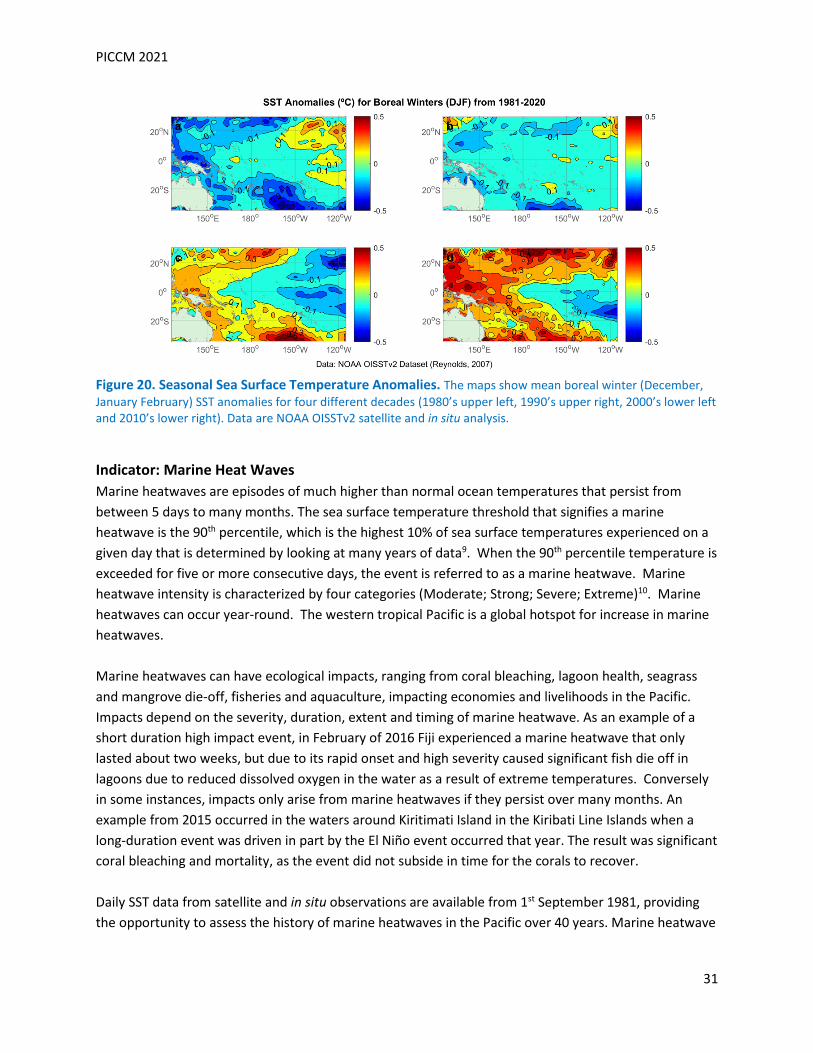
Figure 19. Sea Surface Temperature Trends. The map shows SST trends (oC per decade) over the period 1982-2020 from the NOAA OISSTv2 satellite and in situ analysis. The trends throughout the observation period vary from decade to decade, primarily due to increased ENSO activity during some decades compared to others. For example, the 1990’s saw 4 El Niño events with two very strong ones (1991/92 and 1997/98). The decade ended with a big La Niña event. SST trends in this decade would likely show cooling due to this shift from warm to cold (see Figure 20). This is reflected in the average SST anomalies (departures from the 1981 to 2020 seasonal means) computed over the boreal winter months (December, January, February; DJF) for each decade. Figure 20 shows the mean DJF SST anomalies for each decade, with the 1990’s being mostly neutral (balance of warm and cold events during the decade), and the 2010’s showing more like La Niña conditions.
PICCM 2021
31
Figure 20. Seasonal Sea Surface Temperature Anomalies. The maps show mean boreal winter (December, January February) SST anomalies for four different decades (1980’s upper left, 1990’s upper right, 2000’s lower left and 2010’s lower right). Data are NOAA OISSTv2 satellite and in situ analysis.
Indicator: Marine Heat Waves Marine heatwaves are episodes of much higher than normal ocean temperatures that persist from between 5 days to many months. The sea surface temperature threshold that signifies a marine heatwave is the 90th percentile, which is the highest 10% of sea surface temperatures experienced on a given day that is determined by looking at many years of data9. When the 90th percentile temperature is exceeded for five or more consecutive days, the event is referred to as a marine heatwave. Marine heatwave intensity is characterized by four categories (Moderate; Strong; Severe; Extreme)10. Marine heatwaves can occur year-round. The western tropical Pacific is a global hotspot for increase in marine heatwaves. Marine heatwaves can have ecological impacts, ranging from coral bleaching, lagoon health, seagrass and mangrove die-off, fisheries and aquaculture, impacting economies and livelihoods in the Pacific. Impacts depend on the severity, duration, extent and timing of marine heatwave. As an example of a short duration high impact event, in February of 2016 Fiji experienced a marine heatwave that only lasted about two weeks, but due to its rapid onset and high severity caused significant fish die off in lagoons due to reduced dissolved oxygen in the water as a result of extreme temperatures. Conversely in some instances, impacts only arise from marine heatwaves if they persist over many months. An example from 2015 occurred in the waters around Kiritimati Island in the Kiribati Line Islands when a long-duration event was driven in part by the El Niño event occurred that year. The result was significant coral bleaching and mortality, as the event did not subside in time for the corals to recover. Daily SST data from satellite and in situ observations are available from 1st September 1981, providing the opportunity to assess the history of marine heatwaves in the Pacific over 40 years. Marine heatwave
PICCM 2021
32
summaries showing frequency of events, maximum severity, and average duration in each decade since 1981 are shown in Figure 21.
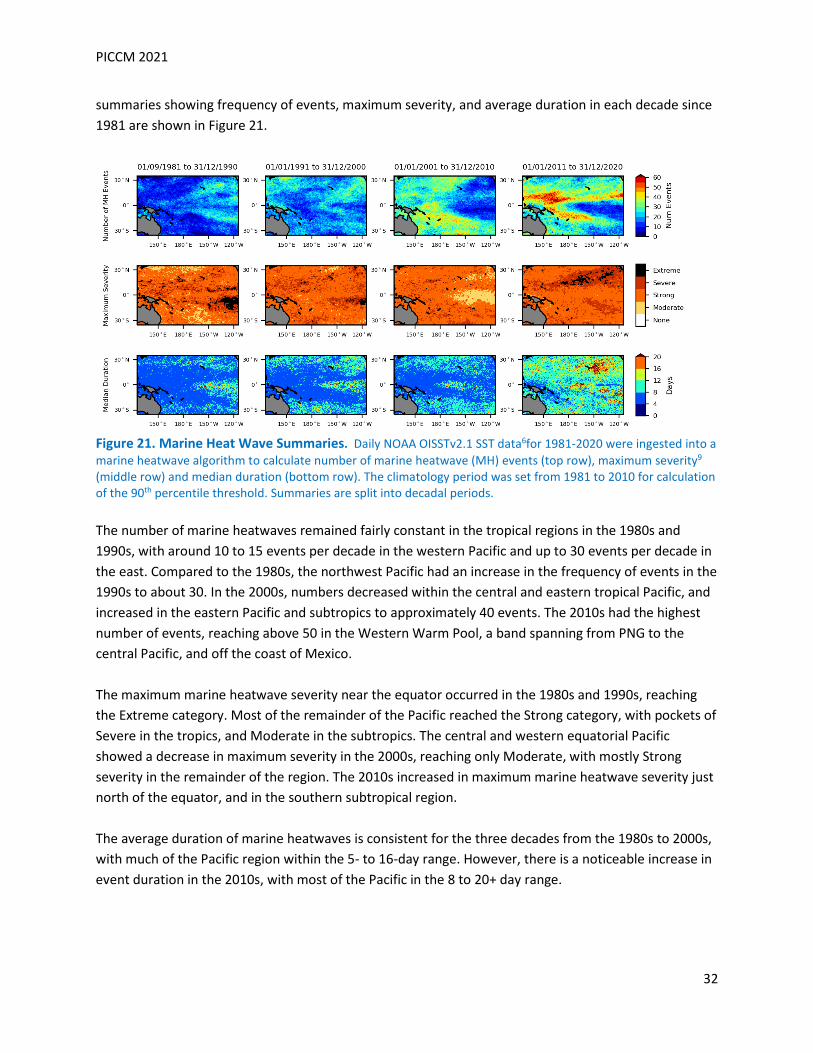
Figure 21. Marine Heat Wave Summaries. Daily NOAA OISSTv2.1 SST data6for 1981-2020 were ingested into a marine heatwave algorithm to calculate number of marine heatwave (MH) events (top row), maximum severity9 (middle row) and median duration (bottom row). The climatology period was set from 1981 to 2010 for calculation of the 90th percentile threshold. Summaries are split into decadal periods. The number of marine heatwaves remained fairly constant in the tropical regions in the 1980s and 1990s, with around 10 to 15 events per decade in the western Pacific and up to 30 events per decade in the east. Compared to the 1980s, the northwest Pacific had an increase in the frequency of events in the 1990s to about 30. In the 2000s, numbers decreased within the central and eastern tropical Pacific, and increased in the eastern Pacific and subtropics to approximately 40 events. The 2010s had the highest number of events, reaching above 50 in the Western Warm Pool, a band spanning from PNG to the central Pacific, and off the coast of Mexico. The maximum marine heatwave severity near the equator occurred in the 1980s and 1990s, reaching the Extreme category. Most of the remainder of the Pacific reached the Strong category, with pockets of Severe in the tropics, and Moderate in the subtropics. The central and western equatorial Pacific showed a decrease in maximum severity in the 2000s, reaching only Moderate, with mostly Strong severity in the remainder of the region. The 2010s increased in maximum marine heatwave severity just north of the equator, and in the southern subtropical region. The average duration of marine heatwaves is consistent for the three decades from the 1980s to 2000s, with much of the Pacific region within the 5- to 16-day range. However, there is a noticeable increase in event duration in the 2010s, with most of the Pacific in the 8 to 20+ day range.
PICCM 2021
33
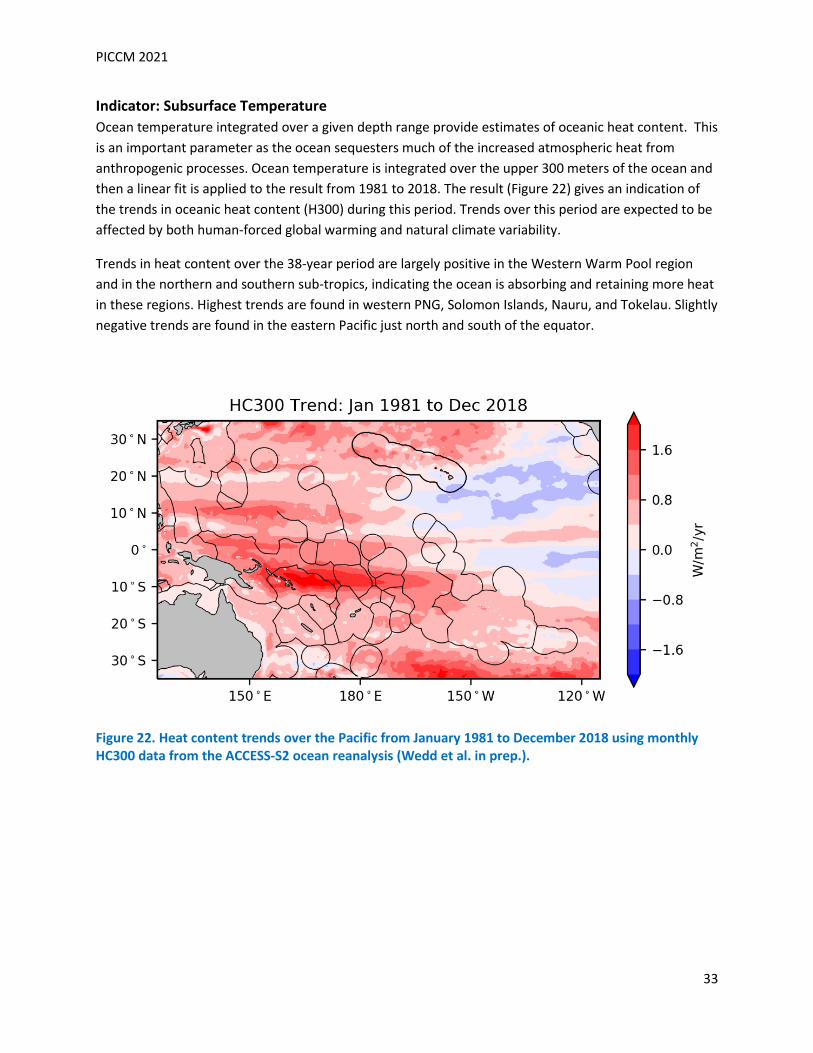
Indicator: Subsurface Temperature Ocean temperature integrated over a given depth range provide estimates of oceanic heat content. This is an important parameter as the ocean sequesters much of the increased atmospheric heat from anthropogenic processes. Ocean temperature is integrated over the upper 300 meters of the ocean and then a linear fit is applied to the result from 1981 to 2018. The result (Figure 22) gives an indication of the trends in oceanic heat content (H300) during this period. Trends over this period are expected to be affected by both human-forced global warming and natural climate variability.
Trends in heat content over the 38-year period are largely positive in the Western Warm Pool region and in the northern and southern sub-tropics, indicating the ocean is absorbing and retaining more heat in these regions. Highest trends are found in western PNG, Solomon Islands, Nauru, and Tokelau. Slightly negative trends are found in the eastern Pacific just north and south of the equator.
Figure 22. Heat content trends over the Pacific from January 1981 to December 2018 using monthly HC300 data from the ACCESS-S2 ocean reanalysis (Wedd et al. in prep.).
PICCM 2021
34
Biochemistry
Highlights • Oceanic pH measurements collected from Station ALOHA, Hawaiʻi, show a more than 12% increase
in acidity over the period 1988 to 2020. • Significant declines in surface ocean chlorophyll-a concentration and estimated phytoplankton size
since 1998 are detectable across major portions of the Pacific Islands region.
Background Measures of changing ocean biochemistry include changes in the pH of the ocean and changes in phytoplankton abundance. Increased acidity (decreased pH) in the ocean results from absorption of atmospheric CO2. Changes in chlorophyll-a concentration in the surface ocean (measured by satellites as ocean color) are used as a proxy for changes in phytoplankton abundance and biological production at the base of the ocean food chain. Ocean color observations can be combined with satellite-derived sea surface temperatures (SSTs) to estimate median phytoplankton size. Decreases in phytoplankton abundance and size have the potential to negatively impact ocean and coastal fisheries.
Indicator: Ocean Acidification Ocean pH is an important indicator of the chemistry of the ocean. As the amount of CO2 in the atmosphere has risen, a substantial portion (as much as 26%) has been absorbed by the ocean. The result is that the ocean has become more acidic (that is, the ocean pH has decreased). Increasing ocean acidity can make it harder for corals and plankton to form calcium carbonate, the main mineral that makes up their hard skeletons and shells1. This adversely impacts coral reefs and shellfish, and threatens other marine ecosystems including pelagic fisheries.
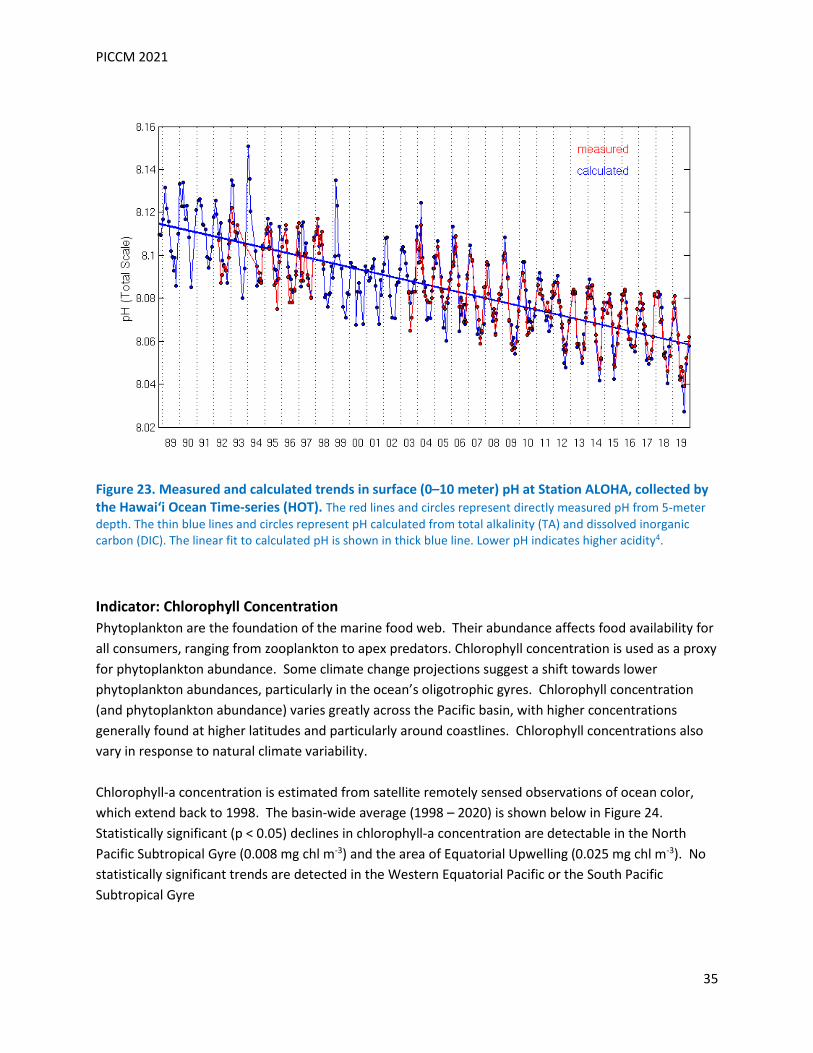
Since October 1988, scientists working on the Hawaiʻi Ocean Time-series (HOT) program have undertaken research cruises about once a month to observe the hydrography, chemistry, and biology of the water column at deep-water Station ALOHA (A Long-Term Oligotrophic Habitat Assessment) located 100 km north of Oahu, Hawaiʻi2. Among other measurements, two measures of pH are made: directly measured pH and pH calculated from total alkalinity (TA) and dissolved inorganic carbon (DIC). The 30+ year time series at Station ALOHA represents the best available documentation of the downward trend in oceanic pH since data collection began in 1988 (Figure 23). During the period 1988 to 2020 oceanic pH has shown a linear decrease of 0.051 pH units. This corresponds to an increase of more than 12% increase in acidity over that time span3. Oceanic pH also exhibits short-term fluctuations of roughly 0.025 pH units up and down. The steady decline in pH, however, means that current high pH fluctuations represent conditions that were considered average or low pH at the beginning of the time series. Although oceanic pH varies over both time and space, the conditions at Station ALOHA are considered broadly representative of those across the western and central Pacific.
PICCM 2021
35
Figure 23. Measured and calculated trends in surface (0–10 meter) pH at Station ALOHA, collected by the Hawaiʻi Ocean Time-series (HOT). The red lines and circles represent directly measured pH from 5-meter depth. The thin blue lines and circles represent pH calculated from total alkalinity (TA) and dissolved inorganic carbon (DIC). The linear fit to calculated pH is shown in thick blue line. Lower pH indicates higher acidity4.
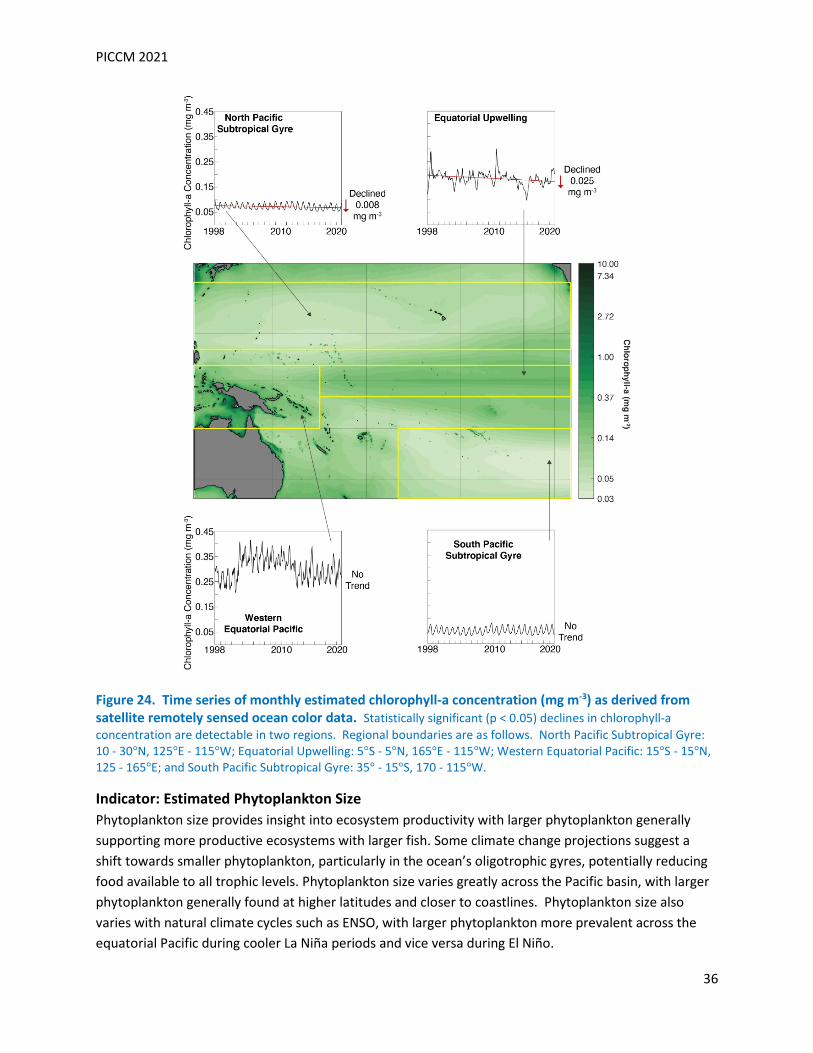
Indicator: Chlorophyll Concentration Phytoplankton are the foundation of the marine food web. Their abundance affects food availability for all consumers, ranging from zooplankton to apex predators. Chlorophyll concentration is used as a proxy for phytoplankton abundance. Some climate change projections suggest a shift towards lower phytoplankton abundances, particularly in the ocean’s oligotrophic gyres. Chlorophyll concentration (and phytoplankton abundance) varies greatly across the Pacific basin, with higher concentrations generally found at higher latitudes and particularly around coastlines. Chlorophyll concentrations also vary in response to natural climate variability. Chlorophyll-a concentration is estimated from satellite remotely sensed observations of ocean color, which extend back to 1998. The basin-wide average (1998 – 2020) is shown below in Figure 24. Statistically significant (p < 0.05) declines in chlorophyll-a concentration are detectable in the North Pacific Subtropical Gyre (0.008 mg chl m-3) and the area of Equatorial Upwelling (0.025 mg chl m-3). No statistically significant trends are detected in the Western Equatorial Pacific or the South Pacific Subtropical Gyre
PICCM 2021
36
Figure 24. Time series of monthly estimated chlorophyll-a concentration (mg m-3) as derived from satellite remotely sensed ocean color data. Statistically significant (p < 0.05) declines in chlorophyll-a concentration are detectable in two regions. Regional boundaries are as follows. North Pacific Subtropical Gyre: 10 - 30°N, 125°E - 115°W; Equatorial Upwelling: 5°S - 5°N, 165°E - 115°W; Western Equatorial Pacific: 15°S - 15°N, 125 - 165°E; and South Pacific Subtropical Gyre: 35° - 15°S, 170 - 115°W.
Indicator: Estimated Phytoplankton Size Phytoplankton size provides insight into ecosystem productivity with larger phytoplankton generally supporting more productive ecosystems with larger fish. Some climate change projections suggest a shift towards smaller phytoplankton, particularly in the ocean’s oligotrophic gyres, potentially reducing food available to all trophic levels. Phytoplankton size varies greatly across the Pacific basin, with larger phytoplankton generally found at higher latitudes and closer to coastlines. Phytoplankton size also varies with natural climate cycles such as ENSO, with larger phytoplankton more prevalent across the equatorial Pacific during cooler La Niña periods and vice versa during El Niño.
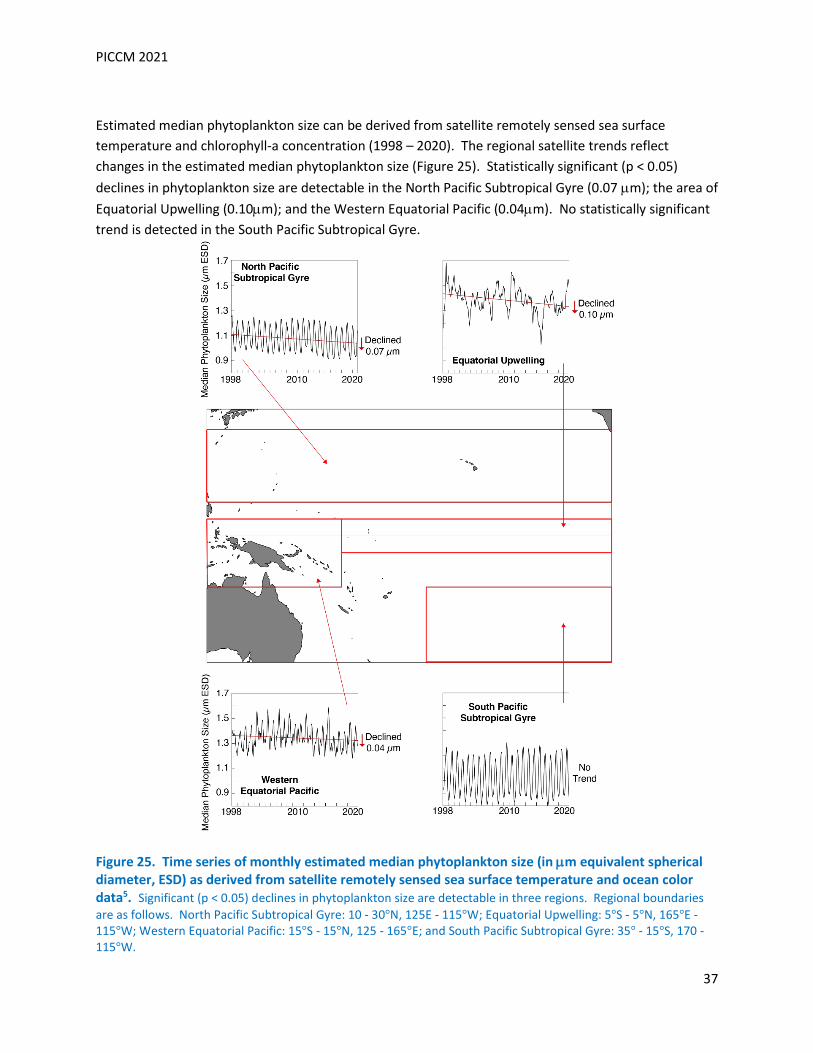
PICCM 2021
37
Estimated median phytoplankton size can be derived from satellite remotely sensed sea surface temperature and chlorophyll-a concentration (1998 – 2020). The regional satellite trends reflect changes in the estimated median phytoplankton size (Figure 25). Statistically significant (p < 0.05) declines in phytoplankton size are detectable in the North Pacific Subtropical Gyre (0.07 µm); the area of Equatorial Upwelling (0.10µm); and the Western Equatorial Pacific (0.04µm). No statistically significant trend is detected in the South Pacific Subtropical Gyre.
Figure 25. Time series of monthly estimated median phytoplankton size (in µm equivalent spherical diameter, ESD) as derived from satellite remotely sensed sea surface temperature and ocean color data5. Significant (p < 0.05) declines in phytoplankton size are detectable in three regions. Regional boundaries are as follows. North Pacific Subtropical Gyre: 10 - 30°N, 125E - 115°W; Equatorial Upwelling: 5°S - 5°N, 165°E - 115°W; Western Equatorial Pacific: 15°S - 15°N, 125 - 165°E; and South Pacific Subtropical Gyre: 35° - 15°S, 170 - 115°W.
PICCM 2021
38
Future Climate
Highlights • Greenhouse gas concentrations will increase, but beyond the near-term the concentration depends
strongly on the net greenhouse gas emissions associated with the global pathway of human development
• Surface air temperature will continue to rise proportional to the emission pathway, with more heat extremes, affecting human health, agriculture and ecosystems.
• Rainfall projections vary by region, according to the local dominant rainfall feature. A strong increase in rainfall is projected at the equator. An increase in frequency and intensity of heavy precipitation events is projected almost everywhere.
• Tropical cyclones are projected to have greater impact, with higher rainfall rates, making landfall on top of a higher sea level, as well as a greater proportion of tropical cyclones in the more intense categories and higher peak wind intensities.
• Sea level will continue to rise for centuries, but the rise would be significantly lower and slower under low emissions pathways compared to higher ones.
• Ocean temperature will continue to increase, with more marine heatwaves, proportional to global emissions.
• Ocean acidification will continue proportional to the atmospheric CO2 concentration; oceans are projected to have reduced oxygen.
Background Climate projections are generally similar for the different generations of climate models and between the two recent sets of global emissions pathways, especially when standardized to a common comparison such as a particular level of global warming. Confidence in projected change is assessed using multiple lines of evidence (process understanding, consistency between modelled and observed trends, degree of agreement among climate models), and is higher when there is agreement between those lines of evidence1. An impediment to confidence in some climate projections in the Pacific is the long-standing climate model biases in the simulation of important processes and patterns of mean climate and climate variability in the Pacific. Important context for interpreting climate projections includes: • Global surface temperature will continue to rise, and regional climate will continue to change until
at least mid-century under any plausible emissions pathway the world follows. If the world reaches net zero emissions and limits further global warming some changes would stabilize such as global average temperature, but others will continue for centuries such as sea level rise.
• Natural climate drivers and internal climate variability in the Pacific include that from the El Niño Southern Oscillation (ENSO) and year-to-year movement of the dominant South Pacific Convergence Zone (SPCZ) and Inter-Tropical Convergence Zone (ITCZ). Climate variability means that there is a range of possibilities for any particular year, and short-term trends (e.g., 2021-2030) may go against the long-term (multi-decadal) projected trend due to climate change.
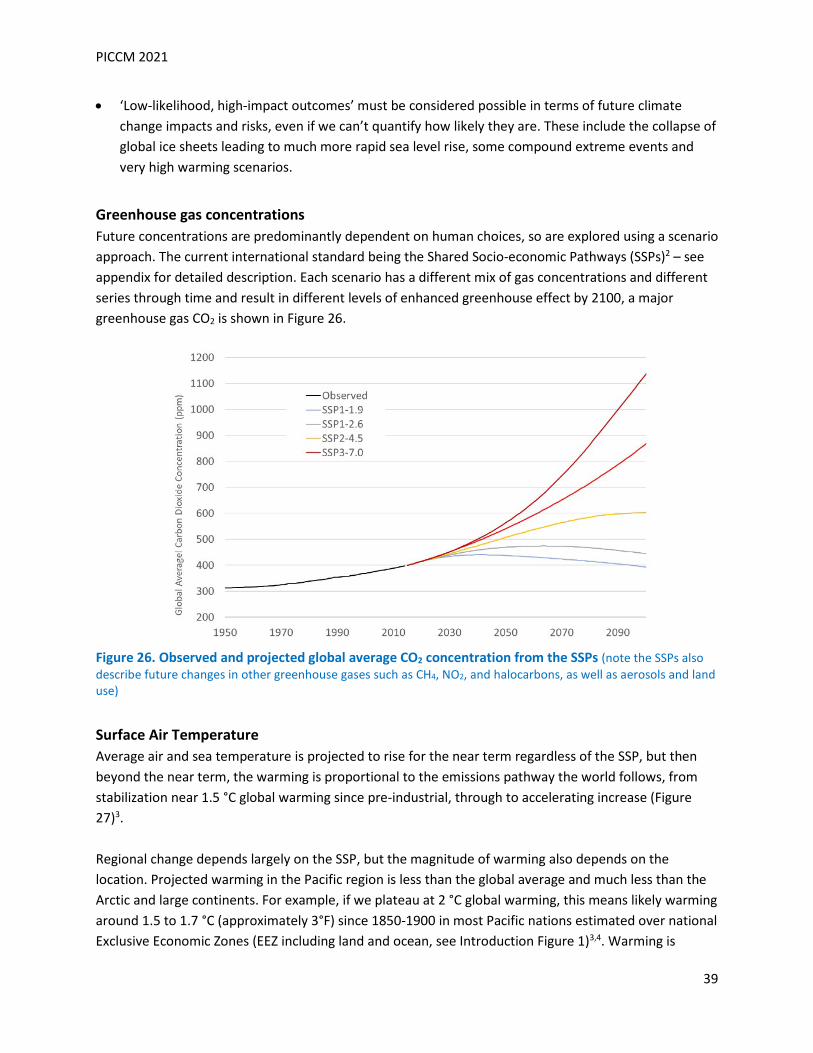
PICCM 2021
39
• ‘Low-likelihood, high-impact outcomes’ must be considered possible in terms of future climate change impacts and risks, even if we can’t quantify how likely they are. These include the collapse of global ice sheets leading to much more rapid sea level rise, some compound extreme events and very high warming scenarios.
Greenhouse gas concentrations Future concentrations are predominantly dependent on human choices, so are explored using a scenario approach. The current international standard being the Shared Socio-economic Pathways (SSPs)2 – see appendix for detailed description. Each scenario has a different mix of gas concentrations and different series through time and result in different levels of enhanced greenhouse effect by 2100, a major greenhouse gas CO2 is shown in Figure 26.
Figure 26. Observed and projected global average CO2 concentration from the SSPs (note the SSPs also describe future changes in other greenhouse gases such as CH4, NO2, and halocarbons, as well as aerosols and land use)
Surface Air Temperature Average air and sea temperature is projected to rise for the near term regardless of the SSP, but then beyond the near term, the warming is proportional to the emissions pathway the world follows, from stabilization near 1.5 °C global warming since pre-industrial, through to accelerating increase (Figure 27)3. Regional change depends largely on the SSP, but the magnitude of warming also depends on the location. Projected warming in the Pacific region is less than the global average and much less than the Arctic and large continents. For example, if we plateau at 2 °C global warming, this means likely warming around 1.5 to 1.7 °C (approximately 3°F) since 1850-1900 in most Pacific nations estimated over national Exclusive Economic Zones (EEZ including land and ocean, see Introduction Figure 1)3,4. Warming is
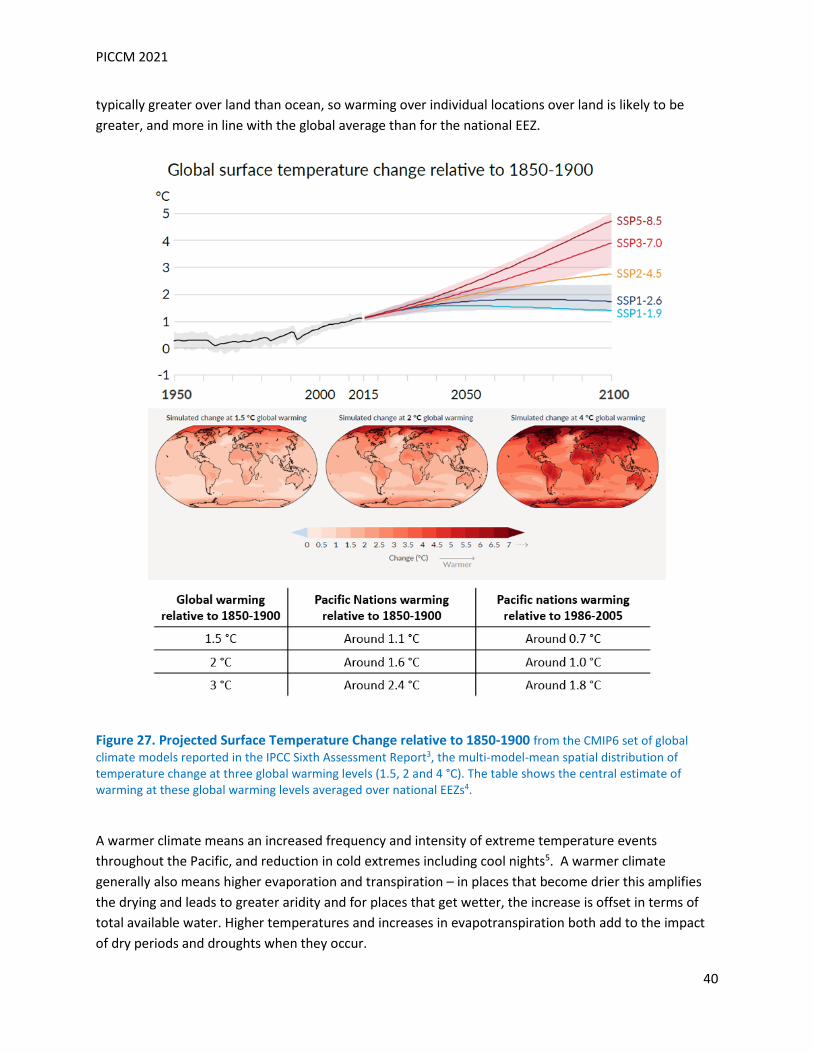
PICCM 2021
40
typically greater over land than ocean, so warming over individual locations over land is likely to be greater, and more in line with the global average than for the national EEZ.
Figure 27. Projected Surface Temperature Change relative to 1850-1900 from the CMIP6 set of global climate models reported in the IPCC Sixth Assessment Report3, the multi-model-mean spatial distribution of temperature change at three global warming levels (1.5, 2 and 4 °C). The table shows the central estimate of warming at these global warming levels averaged over national EEZs4.
A warmer climate means an increased frequency and intensity of extreme temperature events throughout the Pacific, and reduction in cold extremes including cool nights5. A warmer climate generally also means higher evaporation and transpiration – in places that become drier this amplifies the drying and leads to greater aridity and for places that get wetter, the increase is offset in terms of total available water. Higher temperatures and increases in evapotranspiration both add to the impact of dry periods and droughts when they occur.
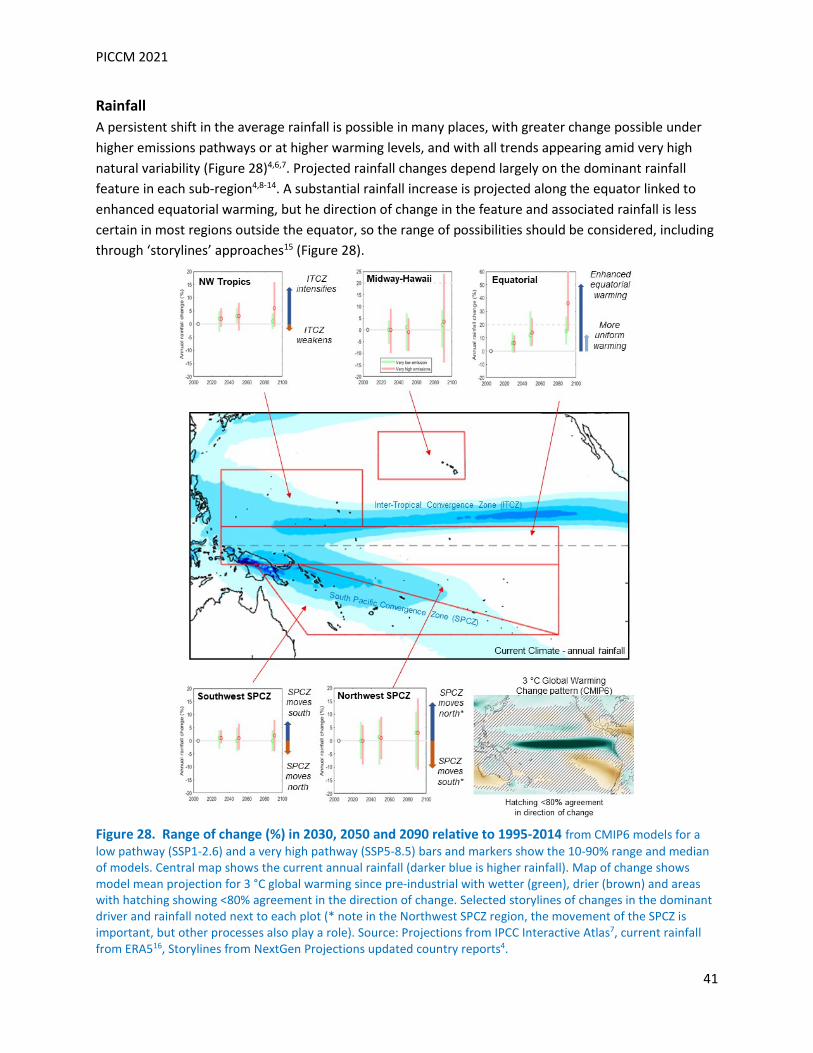
PICCM 2021
41
Rainfall A persistent shift in the average rainfall is possible in many places, with greater change possible under higher emissions pathways or at higher warming levels, and with all trends appearing amid very high natural variability (Figure 28)4,6,7. Projected rainfall changes depend largely on the dominant rainfall feature in each sub-region4,8-14. A substantial rainfall increase is projected along the equator linked to enhanced equatorial warming, but he direction of change in the feature and associated rainfall is less certain in most regions outside the equator, so the range of possibilities should be considered, including through ‘storylines’ approaches15 (Figure 28).
Figure 28. Range of change (%) in 2030, 2050 and 2090 relative to 1995-2014 from CMIP6 models for a low pathway (SSP1-2.6) and a very high pathway (SSP5-8.5) bars and markers show the 10-90% range and median of models. Central map shows the current annual rainfall (darker blue is higher rainfall). Map of change shows model mean projection for 3 °C global warming since pre-industrial with wetter (green), drier (brown) and areas with hatching showing <80% agreement in the direction of change. Selected storylines of changes in the dominant driver and rainfall noted next to each plot (* note in the Northwest SPCZ region, the movement of the SPCZ is important, but other processes also play a role). Source: Projections from IPCC Interactive Atlas7, current rainfall from ERA516, Storylines from NextGen Projections updated country reports4.
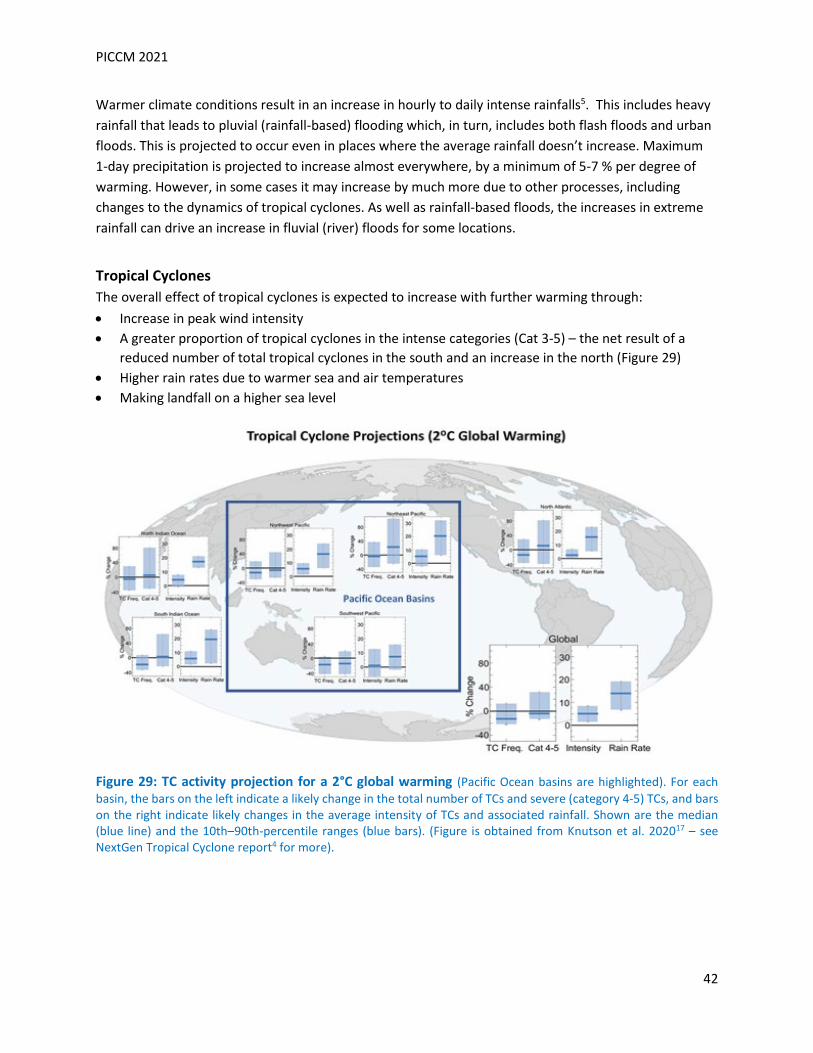
PICCM 2021
42
Warmer climate conditions result in an increase in hourly to daily intense rainfalls5. This includes heavy rainfall that leads to pluvial (rainfall-based) flooding which, in turn, includes both flash floods and urban floods. This is projected to occur even in places where the average rainfall doesn’t increase. Maximum 1-day precipitation is projected to increase almost everywhere, by a minimum of 5-7 % per degree of warming. However, in some cases it may increase by much more due to other processes, including changes to the dynamics of tropical cyclones. As well as rainfall-based floods, the increases in extreme rainfall can drive an increase in fluvial (river) floods for some locations.
Tropical Cyclones The overall effect of tropical cyclones is expected to increase with further warming through: • Increase in peak wind intensity • A greater proportion of tropical cyclones in the intense categories (Cat 3-5) – the net result of a
reduced number of total tropical cyclones in the south and an increase in the north (Figure 29) • Higher rain rates due to warmer sea and air temperatures • Making landfall on a higher sea level
Figure 29: TC activity projection for a 2°C global warming (Pacific Ocean basins are highlighted). For each basin, the bars on the left indicate a likely change in the total number of TCs and severe (category 4-5) TCs, and bars on the right indicate likely changes in the average intensity of TCs and associated rainfall. Shown are the median (blue line) and the 10th–90th-percentile ranges (blue bars). (Figure is obtained from Knutson et al. 202017 – see NextGen Tropical Cyclone report4 for more).
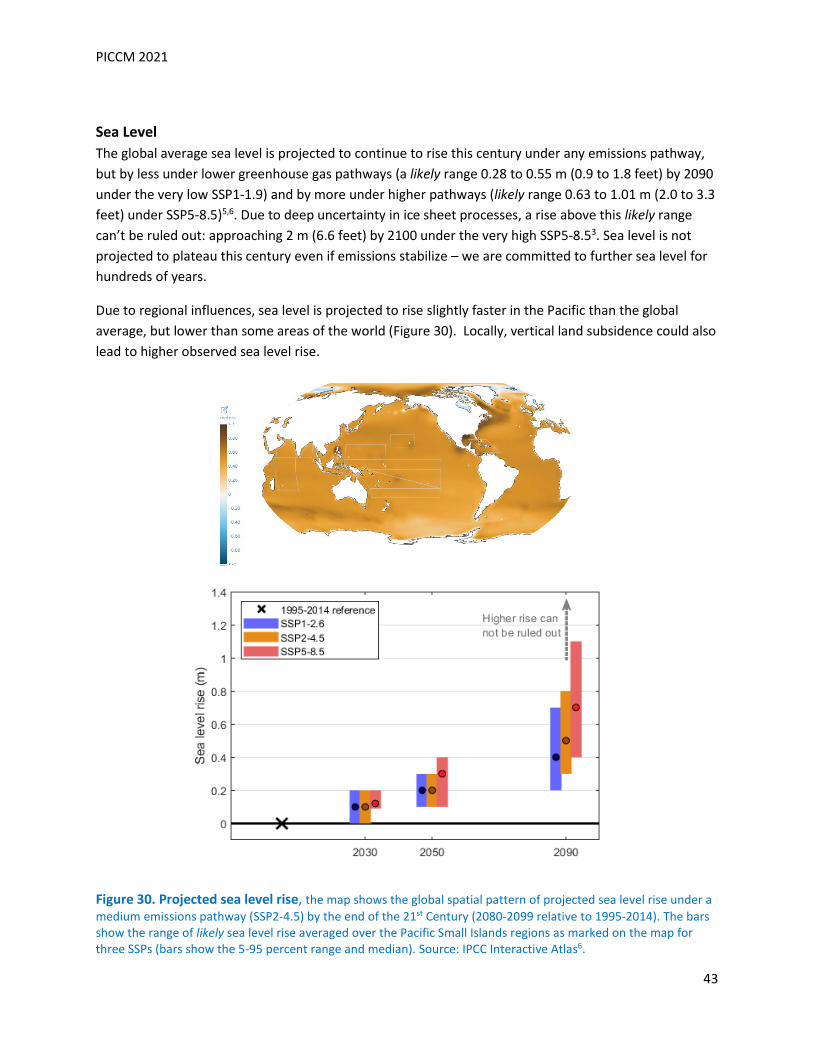
PICCM 2021
43
Sea Level The global average sea level is projected to continue to rise this century under any emissions pathway, but by less under lower greenhouse gas pathways (a likely range 0.28 to 0.55 m (0.9 to 1.8 feet) by 2090 under the very low SSP1-1.9) and by more under higher pathways (likely range 0.63 to 1.01 m (2.0 to 3.3 feet) under SSP5-8.5)5,6. Due to deep uncertainty in ice sheet processes, a rise above this likely range can’t be ruled out: approaching 2 m (6.6 feet) by 2100 under the very high SSP5-8.53. Sea level is not projected to plateau this century even if emissions stabilize – we are committed to further sea level for hundreds of years.
Due to regional influences, sea level is projected to rise slightly faster in the Pacific than the global average, but lower than some areas of the world (Figure 30). Locally, vertical land subsidence could also lead to higher observed sea level rise.
Figure 30. Projected sea level rise, the map shows the global spatial pattern of projected sea level rise under a medium emissions pathway (SSP2-4.5) by the end of the 21st Century (2080-2099 relative to 1995-2014). The bars show the range of likely sea level rise averaged over the Pacific Small Islands regions as marked on the map for three SSPs (bars show the 5-95 percent range and median). Source: IPCC Interactive Atlas6.
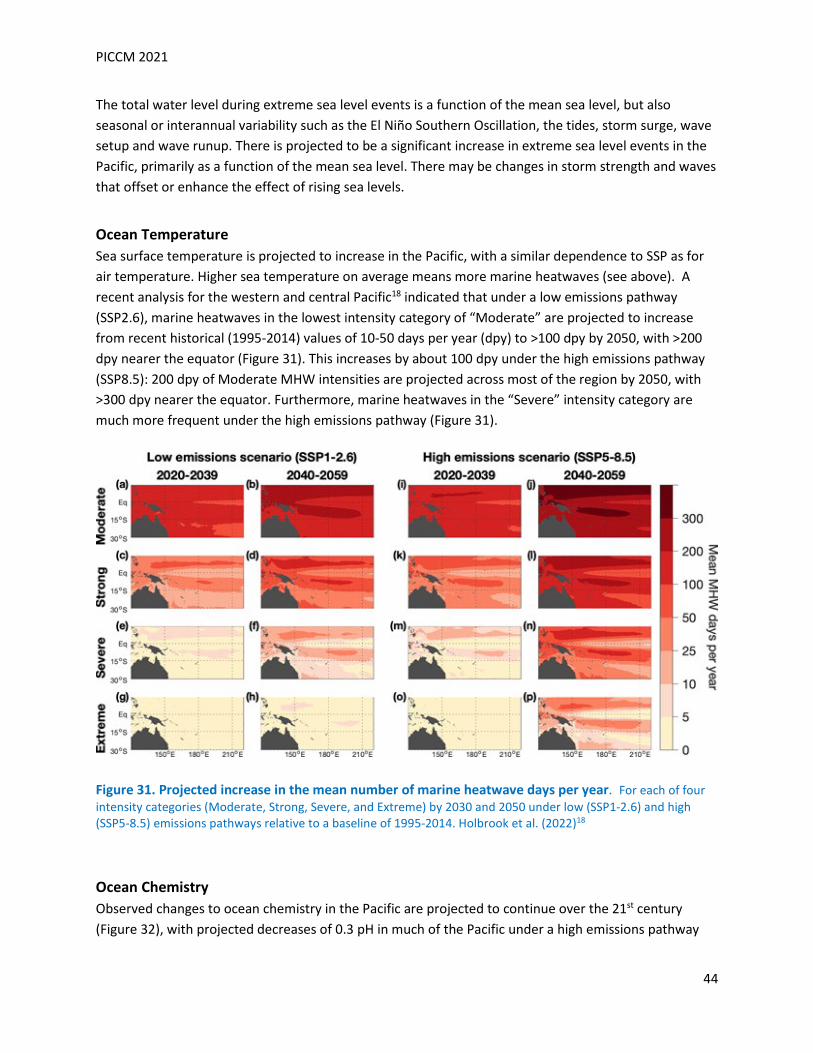
PICCM 2021
44
The total water level during extreme sea level events is a function of the mean sea level, but also seasonal or interannual variability such as the El Niño Southern Oscillation, the tides, storm surge, wave setup and wave runup. There is projected to be a significant increase in extreme sea level events in the Pacific, primarily as a function of the mean sea level. There may be changes in storm strength and waves that offset or enhance the effect of rising sea levels.
Ocean Temperature Sea surface temperature is projected to increase in the Pacific, with a similar dependence to SSP as for air temperature. Higher sea temperature on average means more marine heatwaves (see above). A recent analysis for the western and central Pacific18 indicated that under a low emissions pathway (SSP2.6), marine heatwaves in the lowest intensity category of “Moderate” are projected to increase from recent historical (1995-2014) values of 10-50 days per year (dpy) to >100 dpy by 2050, with >200 dpy nearer the equator (Figure 31). This increases by about 100 dpy under the high emissions pathway (SSP8.5): 200 dpy of Moderate MHW intensities are projected across most of the region by 2050, with >300 dpy nearer the equator. Furthermore, marine heatwaves in the “Severe” intensity category are much more frequent under the high emissions pathway (Figure 31).
Figure 31. Projected increase in the mean number of marine heatwave days per year. For each of four intensity categories (Moderate, Strong, Severe, and Extreme) by 2030 and 2050 under low (SSP1-2.6) and high (SSP5-8.5) emissions pathways relative to a baseline of 1995-2014. Holbrook et al. (2022)18
Ocean Chemistry Observed changes to ocean chemistry in the Pacific are projected to continue over the 21st century (Figure 32), with projected decreases of 0.3 pH in much of the Pacific under a high emissions pathway
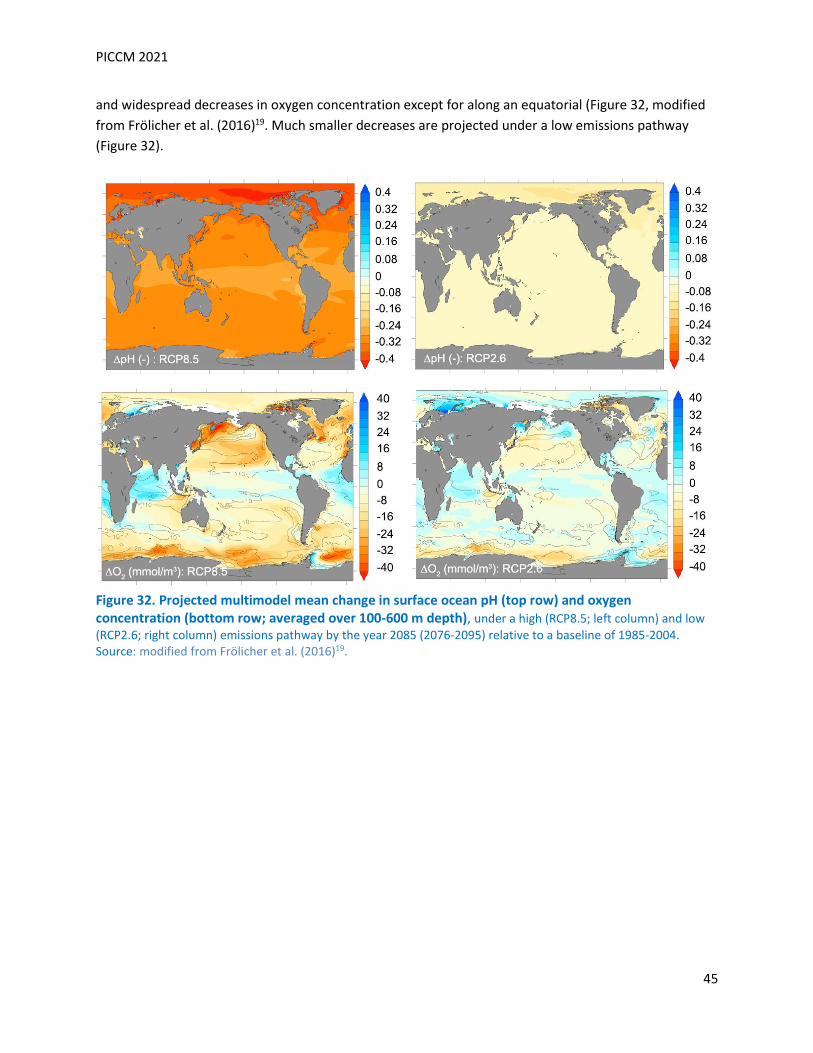
PICCM 2021
45
and widespread decreases in oxygen concentration except for along an equatorial (Figure 32, modified from Frölicher et al. (2016)19. Much smaller decreases are projected under a low emissions pathway (Figure 32).
Figure 32. Projected multimodel mean change in surface ocean pH (top row) and oxygen concentration (bottom row; averaged over 100-600 m depth), under a high (RCP8.5; left column) and low (RCP2.6; right column) emissions pathway by the year 2085 (2076-2095) relative to a baseline of 1985-2004. Source: modified from Frölicher et al. (2016)19.
PICCM 2021
46
Observed and Expected Impacts on Key Sectors Highlights • Agriculture and Food Security - Increasing air temperature will have negative impacts to agroforestry
and crops, and increased invasive species, pests, and diseases. Increasing sea level will lead to increasing saltwater intrusion/thinning freshwater lens impacts impacting local food production and security
• Disaster Risk Management - Increasing tropical cyclone intensity will result in more extreme rainfall and flooding, coastal erosion, wave inundation, freshwater contamination, and risks to human safety. Increasing air temperature cause more frequent extreme heat events-related illness in vulnerable populations
• Energy _ Increasing air temperatures will lead to increasing demand. Increasing storm intensity and rising sea levels will result in increased impacts to electric infrastructure.
• Health – Increases in air temperature, storm intensity, and rising sea levels among changes will lead to increased incidence of heat-related illness and vector-borne disease, and threats to physical safety. This will contributed to increases in mental health-related illness.
• Water – Decreasing rainfall, in some areas, will reduce the quantity of freshwater resources. Increasing sea level will lead to increasing saltwater intrusion/thinning freshwater and reduction in water quality. Increases in heavy rainfall leading to increased land based pollution in ground and surface waters will all adversely affect water quality. Increasing severity of storms and rising sea levels will adversely affect water and wastewater infrastructure.
• Fisheries and Aquaculture – Increasing surface and sea surface temperatures, increasing acidification, and decreasing chlorophyll concentration will lead to reduced commercial and subsistence catch due to shifting fisheries, reduction in fish size, and degraded of coral reefs.
• Tourism – Increasing storm intensity and rising sea levels resulting in increased land-based pollution and beach erosion, along with changes in ocean conditions resulting in degraded coral reef and open-ocean fishing habitat will adversely impact tourism and recreation-based activities.
Background
The SPREP Pacific Roadmap for Strengthened Climate Services (SPREP, 2019) details the seven most relevant key sectors to guide climate services development in the island nation states and territories of the Pacific. The Roadmap was developed from the World Meteorological Organization’s Global Framework for Climate Services (GFCS) and is aligned with the Pacific Islands Meteorological Strategy (PIMS) from 2017-2026 that focuses on improving climate services across the region. For regional alignment, this report focuses on broad current and future climate impacts in these seven key sectors as informed by the climate indicators sections of the Pacific Climate Change Monitor. While many climate impacts cross multiple sectors and different Pacific Islands, this section identifies broad trends and risks across the region.
PICCM 2021
47
Agriculture and Food Security Increasing average air temperature, night-time temperatures, and evapotranspiration, will negatively impact production of staple food crops, export commodities, and agroforestry across the region1-5. For example, sugar yield in Fiji could decline by 2-14% under end-of-century scenarios ranging from 0.5 to 1.50C baseline conditions in 19956. Livestock - an important protein source in Pacific islands - is particularly vulnerable to heat stress1. As sea level rise and wave overwash increase saltwater intrusion into aquifers on islands, some areas are experiencing increased soil salinity with negative impacts on local food production and food security7,8.9. In 2015, Category 5 TC Pam caused losses and damages to the agricultural sector in Vanuatu valued at 64.1% of GDP10. A greater proportion of severe TCs will repeatedly damage agricultural productivity in Pacific islands with flow-on effects for food and nutritional security, and will cause increased reliance on imported food11. Climate change will directly affect the spread and degree of infestation of insect pests on agriculture across the region. Important regional pests including nematodes, leaf miners, and weevils, have all been shown to spread under higher temperatures or drought conditions2. Cultural food security is threatened as climate change affects the provision of subsistence foods and foods that enable Indigenous peoples to sustain the connection with cultural and social practices and traditions2,5,12. Disaster Risk Management Future increases in the proportion of intense tropical cyclones throughout the Pacific islands region will exacerbate impacts currently experienced including: riverine flooding , coastal inundation and erosion (compounded in places by higher sea levels and degradation of coral reefs), and wind damage to housing and infrastructure7,13-19. Some Pacific atoll islands are likely to experience storm-related wave overwash over their entire surface annually by 2060-2070 under a high emissions scenario (RCP 8.5) which may significantly reduce habitability due to repeated contamination of freshwater resources and damage to infrastructure7. Increasing exposure of Pacific populations to climate change-related coastal hazards is compounded by high-density population concentration on the coast and human modification of coastal environments16,20,21. In Kiribati, the Marshall Islands and Tuvalu more than >95% of infrastructure is located in the low elevation coastal zone.21 In 2015, flooding in Tuvalu and Kiribati triggered by distant severe TC Pam affected or destroyed up to 98% of households in some islands, inundating entire settlements and causing severe coastal erosion in some locations15,23. In the absence of substantial adaptation measures, monetary investment, and sustainable urban planning, damage to housing and infrastructure is likely to increase from severe-category tropical cyclones, extreme rainfall events and SLR21,24.
PICCM 2021
48
Where more frequent and/or intense climate extremes are expected, economic and humanitarian risk increases25. In Fiji, where there is a trend towards heavier rainfall events, a high intensity rainfall event in 2012 led to severe flooding in the Western Division of Viti Levu displacing thousands and causing damage estimated at FJD$70 million26. In the same country, in 2016 severe TC Winston caused losses in Fiji equivalent to more than 20% of GDP27. In Hawai’i where a drying trend is present, the 2007-2014 drought cost an estimated USD$44.5 million in lost production from ranching28. In addition, investment in economic development declines after severe weather events as resources are diverted to clean-up and recovery. Impacts and risks from multiple climate change-related extremes are worse for the most vulnerable. Informal settlements are highly vulnerable to riverine and coastal flooding, storm surge and tropical cyclones due to high exposure and difficulties in enforcing building regulations29,30. Women and people with special needs are frequently disproportionately affected through for example, less ability to access economic alternatives13. Energy Demand for electricity to run air conditioning has increased significantly over the last 65 years at a regional scale31. Trends towards more extreme temperatures suggests that this demand for electricity will continue to increase. Energy is used to pump and distribute freshwater. An increase in hot days will increase the need for water, as well as evaporative loss, resulting in increased energy use to supply water demand32. Energy infrastructure is exposed to increased damages from more intense and/or frequent extremes such as TCs, high winds, riverine flooding, storm surge, and coastal inundation. Most Pacific countries have a high reliance on imported fuel and are therefore highly vulnerable to supply chain interruptions caused by climate extremes such as storms and floods. Additionally, this reliance comes at a very high cost to energy users, contributing to vulnerability of populations that have typically high rates of poverty33. Health Direct human health impacts from climate change in Pacific Islands include threats to human safety from more intense or frequent extreme weather events such as TCs or drought and increased heat-related illness34. Increasing coastal storm intensity for example, threatens physical safety via flooding and landslide events35. Additionally, infrastructure such as healthcare facilities and schools on the coasts or in low-lying areas will be increasingly affected and need repairs and updates to building and energy codes9. When extreme events overlap with King Tides and disease outbreaks, the health sector response will be disrupted. Indirect impacts on health include increased risk of vector-borne and water borne disease (e.g., dengue, filariasis, or leptospirosis) incidence in almost all Pacific Island countries and increased food and water insecurity from altered rainfall patterns, flood, and drought34,36. High temperatures are observed to increase the risk of hospitalizations for cardiovascular, renal and respiratory disorders. Non-
PICCM 2021
49
communicable disease are already a leading cause of death in many Pacific Islands37,38. Climate change challenges prevention and management of non-communicable disease because hot weather can make it unsafe to exercise and compromised local food systems may result in greater reliance on less nutritious, imported foods. Increasing extreme events, displacement, and migration from climate change will also pose mental health risks to impacted populations39. Frontline communities will experience disparities in health, climate exposure, and risks depending on varying and compounding factors (e.g. urban vs. rural areas, low-lying areas, socioeconomic status, age, disability, minority and class status, property-ownership). Children, the elderly, and those with chronic disabilities are at greater risk for heat illness, including dehydration, heat stress, fever, and respiratory problems. As the frequency and intensity of hot days increases across the region, these populations will be disproportionately impacted9,34,40-43. Climate impacts on subsistence food systems may lead to an increased dependence on imported foods that have less nutritional value, already a public health stressor for Pacific Islands contending with high rates of non-communicable diseases, including diabetes44. Water Freshwater quality and quantity will be impacted by increasing air temperature and evaporation, changing seasonal rainfall patterns, increasing intensity of storms, sea level rise, and the ways in which these trends overlap with climate and non-climate disasters. Access to freshwater can be a problem on islands with limited land storage. Local and regional drought are strongly correlated with El Niño events in the western Pacific and with La Niña in the central equatorial Pacific and islands. Increases in the strength of El Niño and La Niña events have been observed, and some of their impacts are projected to increase45,46. Communities may need to rely on mobile desalination systems more often5,47. Uncertainty associated with future rainfall will make it more challenging to successfully manage surface water for both ecological as well as social uses48. As sea level continues to rise, groundwater aquifers will be threatened by both increased wave overwash events and a narrowing freshwater transition lens, decreasing freshwater security. These impacts are being experienced across the region, but are more severe on atolls7.32. Extreme rainfall events have become more common across the region, causing increased runoff, erosion, flooding, brown water events, and decreased water quality49. Fisheries and Aquaculture Fisheries and aquaculture provide an important source of household income and employment in the region50. Commodity fisheries, such as pearls, shrimp, and seaweed, also provide thousands of people with part- or full-time work51. Fisheries, particularly reef fisheries, provide social and cultural value, and are a significant source of nutrition.
PICCM 2021
50
Declines in localized upwelling systems in the tropical Pacific, as a result of shifting currents and higher temperatures and acidification, may lead to reduced primary productivity with a cascading effect on higher trophic levels50. Over half of Pacific Island nations are projected to experience greater than 50% declines in maximum catch potential of exploited fishes and invertebrates by 2100, with the largest declines occurring in the western tropical Pacific (under RCP8.5) 52. Pacific Island economies are projected to experience an average 20% decline in purse-seine tuna catches by 2050, an average annual loss in regional tuna-fishing access fees of US$90 million (under RCP8.5) 53. Pelagic fish catches are projected to slightly increase to the east of 1700 E (under A2)54. The projected eastward redistribution of skipjack and yellowfin tuna could result in opportunities for French Polynesia and Pacific Island nations in the subtropics, e.g. Vanuatu and Fiji, to obtain increased economic benefits (under RCP8.5)54,55. Widespread coral bleaching is expected to occur annually by the 2050s across the region (under RCP8.5), and declines in pH will further degrade corals56. Decline in reef-associated species have been observed. associated with coral bleaching 57.
In Pacific Islands that possess mangroves and seagrass, capture-fisheries species (e.g., sea cucumber and lobster) have close associations with these habitats, either as a food source or preferred habitat. Melanesian seagrass habitats have been valued at US$151.4 billion with long-term carbon sequestration alone estimated at approximately 760 US$/ha/yr58,59. Increasing ocean temperatures, rainfall, and storm frequency threaten seagrass ecosystem resilience and function60. Freshwater pond aquaculture to produce tilapia, carp, and milkfish for food security is likely to benefit from projected increases in temperature and rainfall throughout much of the Pacific, with the exception of the southwest Pacific, which may experience more extreme wet and dry periods51,61. The production of livelihood commodities in coastal waters are expected to incur production losses (under A2)51. Tourism A global analysis of climate change vulnerability in the tourism sector found that Small Island Developing States, particularly those in the Pacific who are economically more reliant on tourism, have the highest vulnerability to the impacts of climate change62. Degraded coral reefs are a major risk for local operators in many Pacific islands, which are also vulnerable to multiple climate change-related coastal hazards63,64. Globally, 9% of all coastal tourism value is found in countries with coral habitats, with a total value estimated at US$36 billion65. Mangrove areas are ideally situated for ecotourism opportunities, but are threatened both by overfishing and coastal development pressures as well as rising sea levels and air and sea temperatures66. Seagrass ecosystems benefit tourism by improving water clarity when located near dive sites as well as contributing substantially to Pacific Island livelihoods67,68. Higher sea temperatures combined with other anthropogenic stresses may result in loss of Pacific islands seagrass habitat of between 5-30% by 210060. The inundation of low-lying coastal land, erosion of beaches and shorelines, and saltwater intrusion into
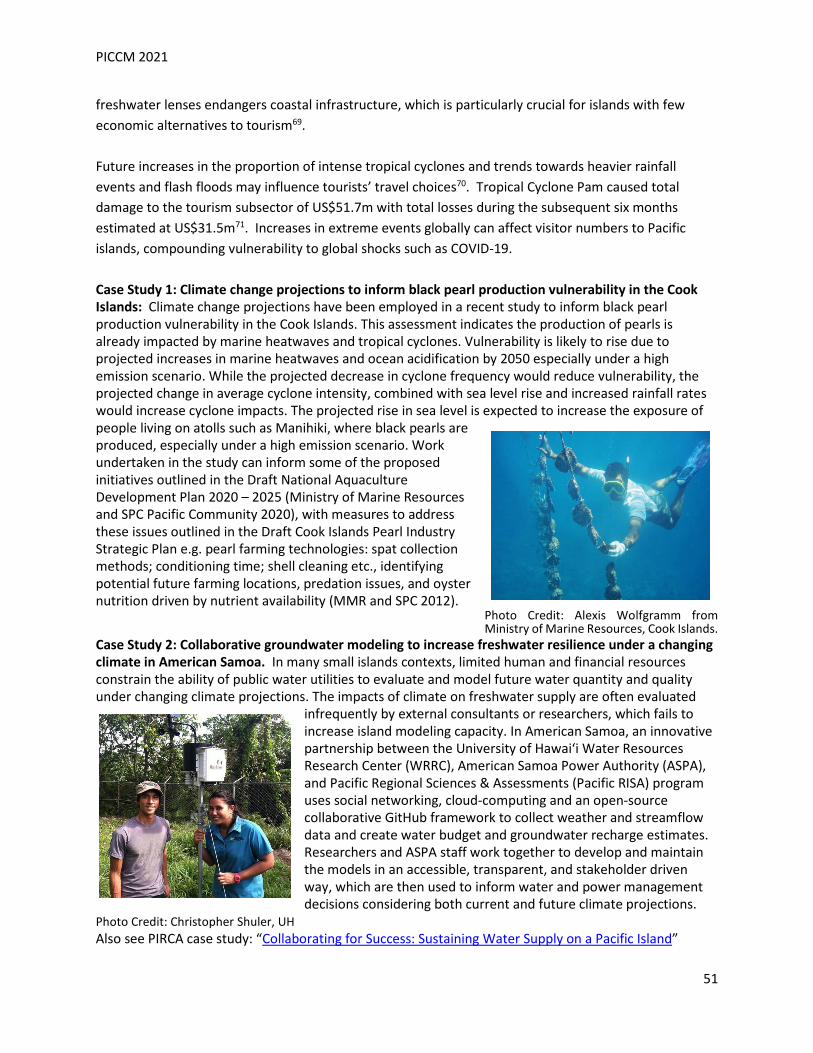
PICCM 2021
51
freshwater lenses endangers coastal infrastructure, which is particularly crucial for islands with few economic alternatives to tourism69. Future increases in the proportion of intense tropical cyclones and trends towards heavier rainfall events and flash floods may influence tourists’ travel choices70. Tropical Cyclone Pam caused total damage to the tourism subsector of US$51.7m with total losses during the subsequent six months estimated at US$31.5m71. Increases in extreme events globally can affect visitor numbers to Pacific islands, compounding vulnerability to global shocks such as COVID-19. Case Study 1: Climate change projections to inform black pearl production vulnerability in the Cook Islands: Climate change projections have been employed in a recent study to inform black pearl production vulnerability in the Cook Islands. This assessment indicates the production of pearls is already impacted by marine heatwaves and tropical cyclones. Vulnerability is likely to rise due to projected increases in marine heatwaves and ocean acidification by 2050 especially under a high emission scenario. While the projected decrease in cyclone frequency would reduce vulnerability, the projected change in average cyclone intensity, combined with sea level rise and increased rainfall rates would increase cyclone impacts. The projected rise in sea level is expected to increase the exposure of people living on atolls such as Manihiki, where black pearls are produced, especially under a high emission scenario. Work undertaken in the study can inform some of the proposed initiatives outlined in the Draft National Aquaculture Development Plan 2020 – 2025 (Ministry of Marine Resources and SPC Pacific Community 2020), with measures to address these issues outlined in the Draft Cook Islands Pearl Industry Strategic Plan e.g. pearl farming technologies: spat collection methods; conditioning time; shell cleaning etc., identifying potential future farming locations, predation issues, and oyster nutrition driven by nutrient availability (MMR and SPC 2012).
Photo Credit: Alexis Wolfgramm from Ministry of Marine Resources, Cook Islands.
Case Study 2: Collaborative groundwater modeling to increase freshwater resilience under a changing climate in American Samoa. In many small islands contexts, limited human and financial resources constrain the ability of public water utilities to evaluate and model future water quantity and quality under changing climate projections. The impacts of climate on freshwater supply are often evaluated
infrequently by external consultants or researchers, which fails to increase island modeling capacity. In American Samoa, an innovative partnership between the University of Hawaiʻi Water Resources Research Center (WRRC), American Samoa Power Authority (ASPA), and Pacific Regional Sciences & Assessments (Pacific RISA) program uses social networking, cloud-computing and an open-source collaborative GitHub framework to collect weather and streamflow data and create water budget and groundwater recharge estimates. Researchers and ASPA staff work together to develop and maintain the models in an accessible, transparent, and stakeholder driven way, which are then used to inform water and power management decisions considering both current and future climate projections.
Photo Credit: Christopher Shuler, UH Also see PIRCA case study: “Collaborating for Success: Sustaining Water Supply on a Pacific Island”
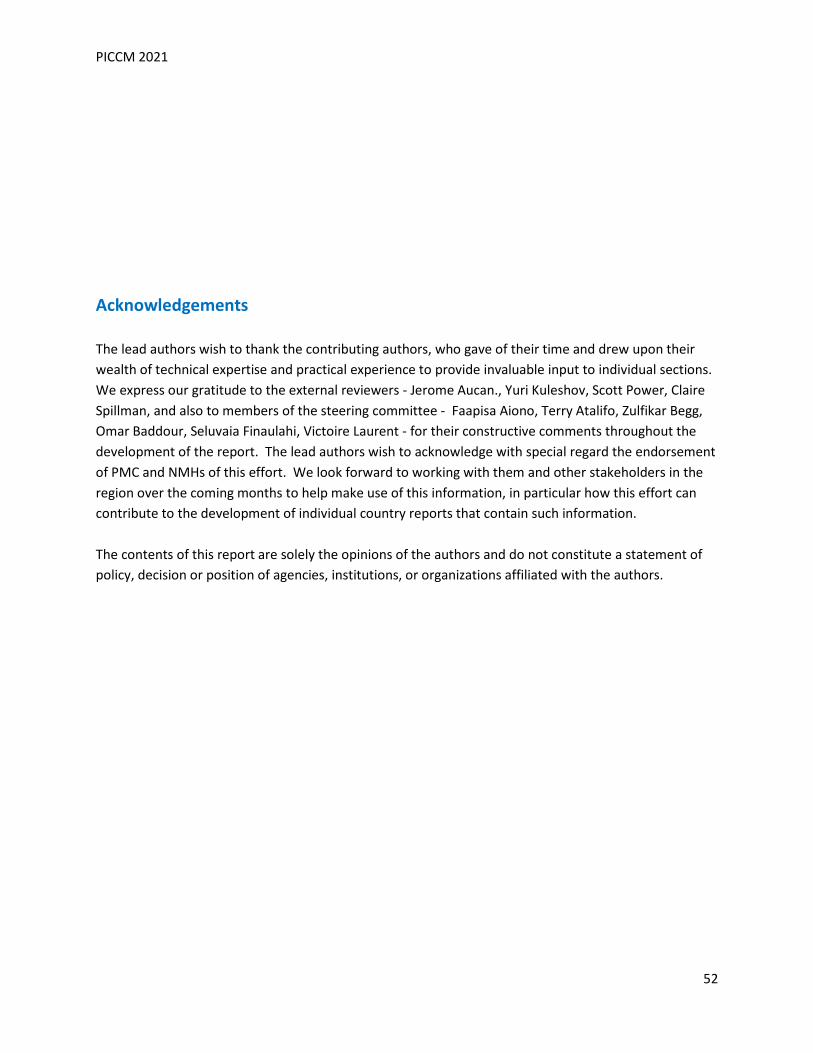
PICCM 2021
52
Acknowledgements The lead authors wish to thank the contributing authors, who gave of their time and drew upon their wealth of technical expertise and practical experience to provide invaluable input to individual sections. We express our gratitude to the external reviewers - Jerome Aucan., Yuri Kuleshov, Scott Power, Claire Spillman, and also to members of the steering committee - Faapisa Aiono, Terry Atalifo, Zulfikar Begg, Omar Baddour, Seluvaia Finaulahi, Victoire Laurent - for their constructive comments throughout the development of the report. The lead authors wish to acknowledge with special regard the endorsement of PMC and NMHs of this effort. We look forward to working with them and other stakeholders in the region over the coming months to help make use of this information, in particular how this effort can contribute to the development of individual country reports that contain such information. The contents of this report are solely the opinions of the authors and do not constitute a statement of policy, decision or position of agencies, institutions, or organizations affiliated with the authors.
PICCM 2021
53
Appendix: Traceable Accounts The Pacific Islands Sources of Information and Further Reading 1-Britannica: https://www.britannica.com/place/Pacific-Islands. 2-Keener, V.W., J. J. Marra, M. L. Finucane, D. Spooner, & M. H. Smith (Eds.), (2012): Climate Change and Pacific Islands: Indicators and Impacts. Report for the 2012 Pacific Islands Regional Climate Assessment (PIRCA). Washington, DC: Island Press. 3-Leong, J.A., J. J. Marra, M. L. Finucane, T. Giambelluca, M. Merrifield, S. E. Miller, J. Polovina, E. Shea, M. Burkett, J. Campbell, P. Lefale, F. Lipschultz, L. Loope, D. Spooner, and B. Wang (2014): Hawai‘i and U.S. Affiliated Pacific Islands. Climate Change Impacts in the United States: The Third National Climate Assessment. Ch. 23 National Climate Assessment, J. M. Melillo, Terese (T.C.) Richmond, and G. W. Yohe, Eds., U.S. Global Change Research Program, 537-556. doi:10.7930/J0W66HPM. [http://nca2014.globalchange.gov/report/regions/hawaii-and-pacific-islands.] 4-IPCC AR5 Climate Change (2014): Impacts, Adaptation, and Vulnerability, Chapter 29, Small Islands (Nurse et al. 2014); https://www.ipcc.ch/report/ar5/wg2/ . • CSIRO climate change information for the Pacific: https://www.csiro.au/en/research/environmental-
impacts/climate-change/pacific-climate-change-info. • Pacific Islands Regional Climate Assessment: https://pirca.org/ • IPCC (2021): Climate Change 2021: The Physical Science Basis. Contribution of Working Group I to the Sixth
Assessment Report of the Intergovernmental Panel on Climate Change [Masson-Delmotte, V., P. Zhai, A. Pirani, S.L. Connors, C. Péan, S. Berger, N. Caud, Y. Chen, L. Goldfarb, M.I. Gomis, M. Huang, K. Leitzell, E. Lonnoy, J.B.R. Matthews, T.K. Maycock, T. Waterfield, O. Yelekçi, R. Yu, and B. Zhou (eds.)]. Cambridge University Press. In Press.: https://www.ipcc.ch/report/ar6/wg1/.
• US Fourth National Climate Assessment: https://nca2018.globalchange.gov/. • CSIRO State of the Climate 2020: https://www.csiro.au/en/research/environmental-impacts/climate-
change/state-of-the-climate. About this Report Sources of Information and Further Reading 1-WMO State of the Global Climate 2020 https://public.wmo.int/en/our-mandate/climate/wmo-statement-state-of-global-climate. 2-PIRCA Cimate Change Reports: https://pirca.org/category/publications/reports/. 3-State of Environmental Conditions in Hawaiʻi and the U.S. Affiliated Pacific Islands under a Changing Climate:2017: Coordinating Authors: J.J. Marra and M.C. Kruk. Contributing Authors: M.Abecassis; H. Diamond; A. Genz; S.F. Heron; M. Lander; G. Liu; J. T. Potemra; W.V. Sweet; P. Thompson; M.W. Widlansky; and P. Woodworth-Jefcoats. September, 2017. NOAA NCEI. 4-Australia CSIRO State of the Climate 2020: https://www.csiro.au/en/research/environmental-impacts/climate-change/state-of-the-climate. 5-US EPA Climate Change Indicators in the USA: https://www.epa.gov/climate-indicators Kenney, M. A, A. C. Janetos, et. al., Greenhouse Gases Data and Methods Atmospheric Concentration of Carbon Dioxide, Other Greenhouse Gasses The red line in Figure 3represents the monthly mean values of CO2measured by NOAA on Mauna Loa, Hawaii, centered on the middle of each month. The black line is a moving average of SEVEN adjacent seasonal cycles centered on the month to be corrected, except for the first and last THREE and one-half years of the record, where
PICCM 2021
54
the seasonal cycle has been averaged over the first and last SEVEN years, respectively. Measurements take into account that successive daily means are not fully independent, the CO2 deviation on most days has some similarity to that of the previous day. If there is a missing month, its interpolated value is shown in blue.
Data are reported as a dry air mole fraction defined as the number of molecules of carbon dioxide divided by the number of all molecules in air, including CO2 itself, after water vapor has been removed. The mole fraction is expressed as parts per million (ppm). Example: 0.000400 is expressed as 400 ppm.
The Mauna Loa data are being obtained at an altitude of 3400 m in the northern subtropics, and may not be the same as the globally averaged CO2 concentration at the surface. Data collection was started by C. David Keeling of the Scripps Institution of Oceanography in March of 1958. Source: https://gml.noaa.gov/ccgg/trends/
The Cape Grim baseline carbon dioxide data in Figure ## shows both the annual cycle and the long-term trend. Carbon dioxide concentrations in air masses at are measured jointly by BOM/CSIRO. They been measured using a technique called cavity ring-down spectroscopy (CRDS) since 2013. These instruments can detect the concentration of carbon dioxide by measuring the amount infrared laser light absorbed by an air sample compared to a reference or calibration air sample. Prior to 2013, Non-Dispersive Infrared (NDIR) gas analysers were used to measure carbon dioxide. Carbon dioxide is measured in parts per million molar (ppm). Cape Grim Baseline Air Pollution Station (CG BAPS) first began measuring the composition of the atmosphere in April 1976. Source; https://www.csiro.au/en/research/natural-environment/atmosphere/latest-greenhouse-gas-data
The AGGI is a measure of the climate-warming influence of long-lived trace gases in the atmosphere (e.g., carbon dioxide (CO2), methane (CH4), nitrous oxide (N2O), and halogenated compounds -mainly CFCs) and how that influence has changed since the onset of the industrial revolution. Air samples are collected through the NOAA Global Greenhouse Gas Reference Network, which provides samples from up to 80 global background air sites, including some collected at 5 degree latitude intervals from ship routes. Weekly data are used from the most remote sites to create smoothed north-south latitude profiles from which global averages and trends are calculated.
To determine the total radiative forcing of the greenhouse gases for the AGGI IPCC [Ramaswamy et al., 2001] recommended expressions are used to convert changes in greenhouse gas global abundance relative to 1750, to instantaneous radiative forcing. This empirical expression is derived from atmospheric radiative transfer models and generally has an uncertainty of about 10%. By contrast, uncertainties in the measured global average abundances of the long-lived greenhouse gases are much smaller (<1%). Only direct forcing from these gases has been included. Model-dependent feedbacks, for example, due to water vapor and ozone depletion, are not included. Other spatially heterogeneous, short-lived, climate forcing agents, such as aerosols and tropospheric ozone, are highly variable and have uncertain global magnitudes and also are not included here to maintain accuracy. Source: https://gml.noaa.gov/aggi/aggi.html
Sources of Information and Further Reading 1-US EPA Climate Indicators: Greenhouse Gases:https://www.epa.gov/climate-indicators/greenhouse-gases. 2-IPCC (2021): Climate Change 2021: The Physical Science Basis. Contribution of Working Group I to the Sixth Assessment Report of the Intergovernmental Panel on Climate Change [Masson-Delmotte, V., P. Zhai, A. Pirani, S.L. Connors, C. Péan, S. Berger, N. Caud, Y. Chen, L. Goldfarb, M.I. Gomis, M. Huang, K. Leitzell, E. Lonnoy, J.B.R. Matthews, T.K. Maycock, T. Waterfield, O. Yelekçi, R. Yu, and B. Zhou (eds.)]. Cambridge University Press. In Press.: https://www.ipcc.ch/report/ar6/wg1/. 3-Wyrtki, K. (1975): El Niño—The dynamical response of the equatorial Pacific Ocean to atmospheric forcing. Journal of Physical Oceanography, 5, 572–584. 4-Mantua, N. J., Hare, S. R., Zhang, Y., Wallace, J. M., & Francis, R. C. (1997): A Pacific interdecadal climate oscillation with impacts on salmonproduction. Bulletin of the American Meteorological Society, 78, 1069–1079. 5-NOAA ESRL Monitoring Laboratory: https://gml.noaa.gov/ccgg/trends/ 6-CSIRO Cape Grim Greenhouse Gas Data https://www.csiro.au/en/research/natural-environment/atmosphere/latest-greenhouse-gas-data. 7-NOAA ESRL Monitoring Laboratory:https://gml.noaa.gov/aggi/.
PICCM 2021
55
• Battle, M., M. Bender, T. Sowers, P.P. Tans, J.H. Butler, J.W. Elkins, J.T. Ellis, T. Conway, N. Zhang, P. Lang, and
A.D. Clarke, (1996): Atmospheric gas concentrations over the past century measured in air from firn at the South Pole, Nature, 383, 231-235. doi:10.1029/2005JD006035.
• Bruhwiler, Lori, Sourish Basu, James H. Butler, Abhishek Chatterjee, Ed Dlugokencky, Melissa A. Kenney, Allison McComiskey, Stephen A. Montzka and Diane Stanitski, (2021): Observations of greenhouse gases as climate indicators, Climatic Change, 165, 1-2, 10.1007/s10584-021-03001-7.
• Butler, J. H., and S. A. Montzka, (2017): The NOAA Annual Greenhouse Gas Index (AGGI). NOAA Earth System Research Laboratory. [Available online at https://www.esrl.noaa.gov/gmd/aggi/aggi.html.]
• Dunn, R.J.H., D.M. Stanitski, N. Gobron and K.M. Willett, (2020): Chapter 2: Global Climate, Overview [in "State of the Climate in 2019"], Bulletin of the American Meteorological Society, 101, 8, S9-S127, 10.1175/BAMS-D-20-0104.1.
• Etheridge, D.M., L.P. Steele, R.L. Langenfelds, and R.J. Francey, (1996): Natural and anthropogenic changes in atmospheric CO2 over the last 1000 years from air in Antarctic ice and firn, J. Geophys. Res. 101, 4115–4128.
• Etheridge, D.M., L.P. Steele, R.J. Francey, and R.L. Langenfelds, (1998): Atmospheric methane between 1000 A.D. and present: Evidence of anthropogenic emissions and climate variability, J. Geophys. Res, *103*, 15,979-15,993.
• Hofmann, D. J., J. H. Butler, E. J. Dlugokencky, J. W. Elkins, K. Masarie, S. A. Montzka, and P. Tans, (2006a): The role of carbon dioxide in climate forcing from 1979 - 2004: Introduction of the Annual Greenhouse Gas Index, Tellus B, 58B, 614-619.
• Keeling, C. D., R. B. Bacastow, A. E. Bainbridge, C. A. Ekdahl, P. R. Guenther, L. S. Waterman, and J. F. S. Chin (1976): Atmospheric carbon dioxide variations at Mauna Loa Observatory, Hawaiʻi. Tellus, 28, 538–551, doi: 10.3402/tellusa.v28i6.11322.
• Lan, X., P. Tans, B.D. Hall, G. Dutton, J. Muhle, J.W. Elkins and I. Vimont, (2021), Long-lived greenhouse gases [in “State of the Climate in 2020”], Bulletin of the American Meteorological Society, 102, 8, S83-S87, 10.1175/BAMS-D-21-0098.1.
• Ramaswamy et al. (2001): Radiative Forcing of Climate Change, Chapter 6 in Climate Change 2001: The Scientific Basis. Cambridge Univ. Press, Cambridge UK and New York, NY USA.
Atmosphere - Surface Temperature, Rainfall, Tropical Cyclones (TCs) and Surface Winds Data and Methods Mean temperature, Amount of hot days, Amount of cold nights Total wet-day rainfall, Consecutive dry days, Heavy rainfall Daily temperature and rainfall data primarily sourced from the Bureau of Meteorology Pacific Climate Change Data Portal for the period 1951-2015, with updates to 2020 from
- CliDE databases (updates from 2015) - GHCND for the US states and territories (complete record) - GHCND for the US affiliates in the north Pacific (from 2015) - MeteoFrance New Caledonia and French Polynesia (from 2015) - Australia Bureau of Meteorology Climate Data Online (from 2015) - New Zealand NIWA's Cliflo (from 2015).
Quality control for US states and territories undertaken via GHCND. No further QC applied. For the remaining records QC checks have been applied to data obtained from the Pacific Climate Change Data Portal. • Annual mean daily mean temperature index calculated using Climpact package https://climpact-sci.org/ which
calculates the WMO ET-SCI indices https://climpact-sci.org/about/project/ : Annual mean daily mean temperature = Annual mean daily maximum temperature – Annual mean daily minimum temperature (Units: °C/decade)
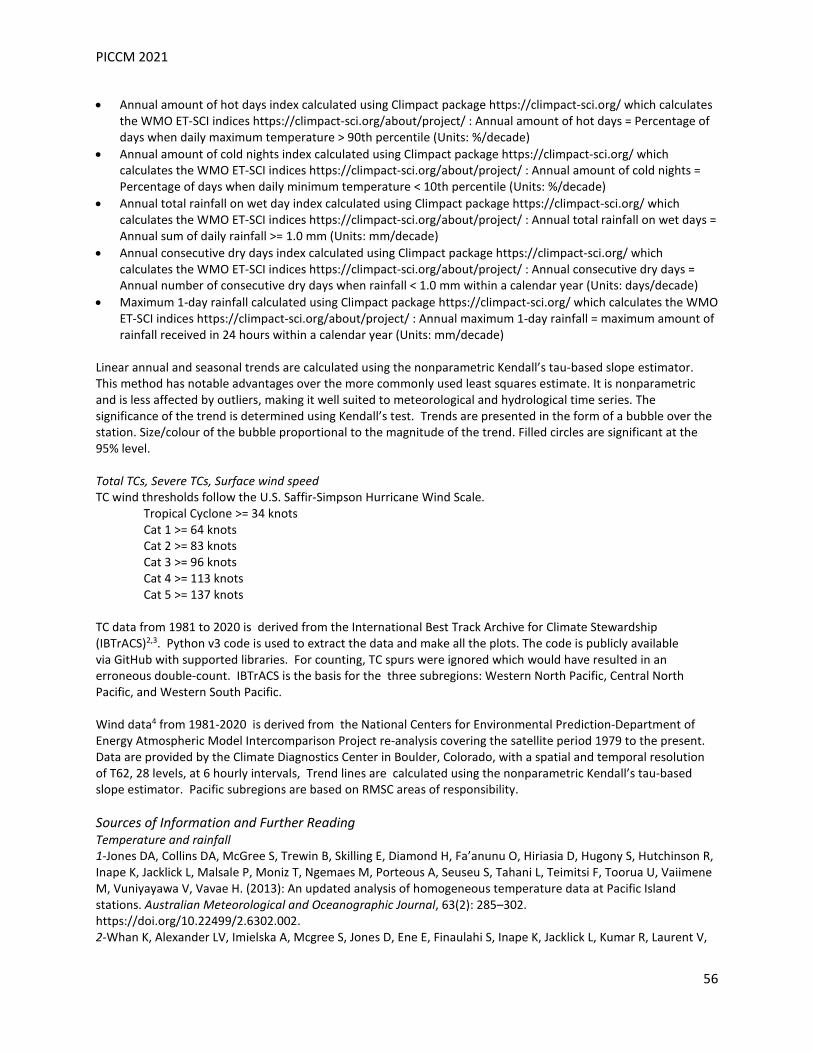
PICCM 2021
56
• Annual amount of hot days index calculated using Climpact package https://climpact-sci.org/ which calculates the WMO ET-SCI indices https://climpact-sci.org/about/project/ : Annual amount of hot days = Percentage of days when daily maximum temperature > 90th percentile (Units: %/decade)
• Annual amount of cold nights index calculated using Climpact package https://climpact-sci.org/ which calculates the WMO ET-SCI indices https://climpact-sci.org/about/project/ : Annual amount of cold nights = Percentage of days when daily minimum temperature < 10th percentile (Units: %/decade)
• Annual total rainfall on wet day index calculated using Climpact package https://climpact-sci.org/ which calculates the WMO ET-SCI indices https://climpact-sci.org/about/project/ : Annual total rainfall on wet days = Annual sum of daily rainfall >= 1.0 mm (Units: mm/decade)
• Annual consecutive dry days index calculated using Climpact package https://climpact-sci.org/ which calculates the WMO ET-SCI indices https://climpact-sci.org/about/project/ : Annual consecutive dry days = Annual number of consecutive dry days when rainfall < 1.0 mm within a calendar year (Units: days/decade)
• Maximum 1-day rainfall calculated using Climpact package https://climpact-sci.org/ which calculates the WMO ET-SCI indices https://climpact-sci.org/about/project/ : Annual maximum 1-day rainfall = maximum amount of rainfall received in 24 hours within a calendar year (Units: mm/decade)
Linear annual and seasonal trends are calculated using the nonparametric Kendall’s tau-based slope estimator. This method has notable advantages over the more commonly used least squares estimate. It is nonparametric and is less affected by outliers, making it well suited to meteorological and hydrological time series. The significance of the trend is determined using Kendall’s test. Trends are presented in the form of a bubble over the station. Size/colour of the bubble proportional to the magnitude of the trend. Filled circles are significant at the 95% level. Total TCs, Severe TCs, Surface wind speed TC wind thresholds follow the U.S. Saffir-Simpson Hurricane Wind Scale.
Tropical Cyclone >= 34 knots Cat 1 >= 64 knots Cat 2 >= 83 knots Cat 3 >= 96 knots Cat 4 >= 113 knots Cat 5 >= 137 knots
TC data from 1981 to 2020 is derived from the International Best Track Archive for Climate Stewardship (IBTrACS)2,3. Python v3 code is used to extract the data and make all the plots. The code is publicly available via GitHub with supported libraries. For counting, TC spurs were ignored which would have resulted in an erroneous double-count. IBTrACS is the basis for the three subregions: Western North Pacific, Central North Pacific, and Western South Pacific. Wind data4 from 1981-2020 is derived from the National Centers for Environmental Prediction-Department of Energy Atmospheric Model Intercomparison Project re-analysis covering the satellite period 1979 to the present. Data are provided by the Climate Diagnostics Center in Boulder, Colorado, with a spatial and temporal resolution of T62, 28 levels, at 6 hourly intervals, Trend lines are calculated using the nonparametric Kendall’s tau-based slope estimator. Pacific subregions are based on RMSC areas of responsibility. Sources of Information and Further Reading Temperature and rainfall 1-Jones DA, Collins DA, McGree S, Trewin B, Skilling E, Diamond H, Fa’anunu O, Hiriasia D, Hugony S, Hutchinson R, Inape K, Jacklick L, Malsale P, Moniz T, Ngemaes M, Porteous A, Seuseu S, Tahani L, Teimitsi F, Toorua U, Vaiimene M, Vuniyayawa V, Vavae H. (2013): An updated analysis of homogeneous temperature data at Pacific Island stations. Australian Meteorological and Oceanographic Journal, 63(2): 285–302. https://doi.org/10.22499/2.6302.002. 2-Whan K, Alexander LV, Imielska A, Mcgree S, Jones D, Ene E, Finaulahi S, Inape K, Jacklick L, Kumar R, Laurent V,
PICCM 2021
57
Malala H, Malsale P, Pulehetoa-Mitiepo R, Ngemaes M, Peltier A, Porteous A, Seuseu S, Skilling E, Tahani L, Toorua U, Vaiimene M. (2014): Trends and variability of temperature extremes in the tropical Western Pacific. International Journal of Climatology, 34(8). https://doi.org/10.1002/joc.3861. 3-McGree S, Herold N, Alexander L, Schreider S, Kuleshov Y, Ene E, Finaulahi S, Inape K, Mackenzie B, Malala H, Ngari A, Prakash B, Tahani L. (2019): Recent Changes in Mean and Extreme Temperature and Precipitation in the Western Pacific Islands. Journal of Climate. American Meteorological Society, 32(16): 4919–4941. https://doi.org/10.1175/JCLI-D-18-0748.1. 4-Wang G, Power SB, McGree S. (2016): Unambiguous warming in the western tropical Pacific primarily caused by anthropogenic forcing. International Journal of Climatology, 36(2). https://doi.org/10.1002/joc.4395. 5-Dutheil C, Bador M, Lengaigne M, Lefèvre J, Jourdain N, Vialard J, Jullien S, Peltier A, Menkes C. (2019): Impact of surface temperature biases on climate change projections of the South Pacific Convergence Zone. Climate Dynamics, 1–23. https://doi.org/10.1007/s00382-019-04692-6. 6-IPCC (2021). Climate Change 2021: The Physical Science Basis. Contribution of Working Group I to the Sixth Assessment Report of the Intergovernmental Panel on Climate Change. In: Masson-Delmotte V, Zhai P, Pirani A, Connors SL, Péan C, Berger S, Caud N, Chen Y, Goldfarb L, Gomis MI, Huang M, Leitzell K, Lonnoy E, Matthews JBR, Maycock TK, Waterfield T, Yelekçi O, Yu R and Zhou B (eds) Cambridge University Press. In Press. 7-Chen YR, Chu P-S. (2014): Trends in precipitation extremes and return levels in the Hawaiian Islands under a changing climate. International Journal of Climatology. John Wiley & Sons, Ltd, 29: 3913–3925. https://doi.org/10.1002/joc.3950. 8-Frazier AG, Giambelluca TW. (2017): Spatial trend analysis of Hawaiian rainfall from 1920 to 2012. International Journal of Climatology, 37(5): 2522–2531. https://doi.org/10.1002/joc.4862. 9-Clilverd HM, Tsang Y-P, Infante DM, Lynch AJ, Strauch AM. (2019): Long-term streamflow trends in Hawai’i and implications for native stream fauna. Hydrological Processes, 33(5): 699–719. https://doi.org/10.1002/hyp.13356. 10-Whan K, Timbal B, Lindesay J. (2014): Linear and nonlinear statistical analysis of the impact of sub-tropical ridge intensity and position on south-east Australian rainfall. International Journal of Climatology. John Wiley & Sons, Ltd, 34(2): 326–342. https://doi.org/10.1002/joc.3689. 11-Dey R, Lewis SC, Arblaster JM, Abram NJ. (2019): A review of past and projected changes in Australia’s rainfall. WIREs Climate Change, 10(3): e577. https://doi.org/10.1002/wcc.577. 12-Timbal B, Drosdowsky W. (2013): The relationship between the decline of Southeastern Australian rainfall and the strengthening of the subtropical ridge. International Journal of Climatology. John Wiley & Sons, Ltd., 33(4): 1021–1034. https://doi.org/10.1002/joc.3492. 13-Fyfe JC, Gillett NP, Marshall GJ. (2012): Human influence on extratropical Southern Hemisphere summer precipitation. Geophysical Research Letters, 39(L23711). https://doi.org/10.1029/2012GL054199. 14-Australian Bureau of Meteorology, CSIRO. (2011): Climate Change in the Pacific: Scientific Assessment and New Research. Volume 1: Regional Review. Volume 2: Country Reports. Melbourne, Australia. 15-Keener VW, Marra JJ, Finucane ML, Spooner D, Smith MH. (2012): Climate Change and Pacific islands: Indicators and Impacts Pacific Islands Regional Climate Assessment (PIRCA). Island Press: Washington D.C. 16-Folland CK, Renwick JA, Salinger MJ, Mullan AB. (2002): Relative influences of the Interdecadal Pacific Oscillation and ENSO on the South Pacific Convergence Zone. Geophysical Research Letters, 29(13): 21–24. https://doi.org/10.1029/2001GL014201. 17-Salinger MJ, McGree S, Beucher F, Power SB, Delage F. (2014): A new index for variations in the position of the South Pacific convergence zone 1910/11–2011/2012. Climate Dynamics. Springer Berlin Heidelberg, 1–12. https://doi.org/10.1007/s00382-013-2035-y. • Pacific Islands Regional Climate Assessment (PIRCA) Reports Palau, Guam, CNMI, American Samoa. 2020-21
East-West Center, Honolulu, HI. https://pirca.org/category/publications/. • Australian Bureau of Meteorology (BoM), and Commonwealth Scientific and Industrial Research Association
(CSIRO), 2014: Climate Variability, Extremes and Change in the Western Tropical Pacific: New Science and Updated Country Reports 2014. Australian Bureau of Meteorology and Commonwealth Scientific and Industrial Research Organisation, 372 pp. http://www.pacificclimatechangescience.org/wp-content/uploads/2014/07/PACCSAP_CountryReports2014_WEB_140710.pdf.
PICCM 2021
58
Total TCs, Severe TCs, Surface Wind Speed 1- Davarzani, H., Smits, K., Tolene, R. M., & Illangasekare, T. (2014): Study of the effect of wind speed on evaporation from soil through integrated modeling of the atmospheric boundary layer and shallow subsurface. Water resources research, 50(1), 661-680. 2-Knapp, K. R., M. C. Kruk, D. H. Levinson, H. J. Diamond, and C. J. Neumann (2010): The International Best Track Archive for Climate Stewardship (IBTrACS): Unifying tropical cyclone best track data. Bulletin of the American Meteorological Society, 91, 363–376, doi:10.1175/2009BAMS2755.1. 3-Kruk, M.C., Knapp, K.R., Levinson, D.H. (2010): A Technique for Combining Global Tropical Cyclone Best Track Data. Journal of Atmospheric and Oceanic Technology 04/2010; 27(4):680-692. 4-Kanamitsu, M., W. Ebisuzaki, J. Woollen, S-K Yang, J.J. Hnilo, M. Fiorino, and G. L. Potter (2002): NCEPDOE AMIP-II Reanalysis (R-2): Bull. Am. Met. Soc., 83, 1631-1643, https://doi.org/10.1175/BAMS-83- 11-1631. 5 - Lu, J., Vecchi, G. A., & Reichler, T. (2007): Expansion of the Hadley cell under global warming. Geophysical Research Letters, 34(6). 6-Kruk, M.C., Hilburn, K., Marra, J.J. (2015): Using Microwave Satellite Data to Assess Changes in Storminess over the Pacific Ocean. Monthly Weather Review, 08/2015, Vol. 143, No. 8, 3214-3229. Ocean - Sea Level, Sea Surface Temperature and Ocean Heat Content , Ocean Chemistry Data and Methods Regional and Local Sea Level Trends, Annual Counts of Flood Frequency Sea level trends are from satellite altimetry and island tide gauges since the beginning of the satellite record (1993-2020). Minor flood frequency is calculated as the total number of minor flood days per year measured by tide gauges since 1980 (1980 -1920). A minor flood day is defined as a day in which the elevation of the sea at the tide gauge exceeded the elevation associated with the 0.5 year return interval of a given station based on extreme value analysis (stationary GPD on detrended daily data). Results are set relative to the 1991-2009 epoch (centered on 2005 MHHW datum). No corrections were made for seismic-induced vertical land motion. Any effects of tsunamis and tropical cyclones were not removed. Tide gauge data is from the from the UHSLC Fast-Delivery database, http://uhslc.soest.hawaii.edu/data/?fd Satellite data is from the SSALTO/DUACS multi-mission dataset distributed by the European Copernicus Marine Environment Monitoring Service (CMEMS). https://www.aviso.altimetry.fr/en/data/product-information/information-about-mono-and-multi-mission-processing/ssaltoduacs-multimission-altimeter-products.html Thirty-one TG stations met either Level 1 or Level 2 data criteria and had at least 70% coverage between 1980 and 2020. Level 1 criteria requires the TG to have years with 80% of the record, missing no more than 2 months; months with 80% of days, missing no more than 5 days and no more than 3 consecutive days; and days with at least 4 regularly spaced observations (i.e., every 6 hours). Level 2 criteria requires the TG to have years with 75% of the record, missing no more than 3 months; months with 75% of days; and days with at least 1 observation in every 6 hour interval. A year is defined as May 1 - April 30. Mean Sea Surface Temperature, Ocean Heat Waves Sea surface temperature data were obtained from the Asia-Pacific Data Research Center (APDRC) at the University of Hawaiʻi (http://apdrc.soest.hawaii.edu). The Physical Sciences Division at NOAA produces an SST product based on optimum interpolation (OI) analysis. The product, NOAA OI.v2 SST is produced weekly on a one-degree grid. The analysis uses in situ and satellite SST plus SST simulated by sea-ice cover. Before the analysis is computed, the satellite data are adjusted for biases using the method of Reynoldsa and Reynolds and Marsicob. Monthly averages used here are derived by a linear
PICCM 2021
59
interpolation of the weekly optimum interpolation (OI) version 2 fields to daily fields then averaging the daily values over a month. The temporal coverage of the monthly data used is from January 1982 through December 2021 (although data are updated each month to present). a-Reynolds, Richard W. "A real-time global sea surface temperature analysis." Journal of climate 1.1 (1988): 75-87. b-Reynolds, Richard W., and Diane C. Marsico. "An improved real-time global sea surface temperature analysis." Journal of climate 6.1 (1993): 114-119. Marine heatwave information is derived from daily Optimally Interpolated Sea Surface Temperature (OISSTv2.1) that was obtained from the National Oceanic and Atmospheric Administration (NOAA).
Time series plots are from the marine heatwave tracker (http://www.marineheatwaves.org/tracker.html) which uses the climatology period 1982 to 2011. Marine heatwave maps use the climatology period 1981 to 2010.
Heat content down to 300 metres data were from the monthly ACCESS-S2 reanalysis from Bureau of Meteorology (1981-2018).
Ocean Acidification All HOT pH data were collected using the spectrophotometric method of Clayton and Byrne (1993) and are reported at a constant temperature of 25ºC. The +0.0047 unit correction suggested by DelValls and Dickson (1998) has NOT been applied to any HOT data. The 1992-1993 HOT pH data were originally reported on the Seawater Scale, while later data have all been reported on the Total Scale. For the sake of consistency, the 1992-1993 pH data have as of today been converted to the Total Scale according to Lewis and Wallace (1998). The Total Scale values are approximately 0.01 pH units higher than the Seawater Scale values they replace. The cruises affected are HOT 36-47 and HOT 49-50. Prior to 1992, on HOT 23-32, pH measurements were made using a pH electrode calibrated with NBS buffers and were reported on the NBS Scale. Potentiometric measurements of pH are inherently less precise than spectrophotometric measurements. Moreover, the relationship between the NBS Scale and the Total Scale is not exact and depends on characteristics of the electrode employed. Given these difficulties, we have not attempted to correct the pre-1992 data to the Total Scale. They are available in the raw data files via FTP and remain as reported on the NBS Scale, but have been assigned a questionable quality flag and thus are not accessible through HOT-DOGS. https://hahana.soest.hawaii.edu/hot/methods/ph.html Chlorophyll Concentration Trends were calculated using (1) NOAA’s CoralTemp sea surface temperature, and (2) the European Space Agency’s OC-CCI data, both hosted by NOAA’s OceanWatch. These data were used to estimate median phytoplankton size following the methods of Barnes et al. 2011. Sources of Information and Further Reading Regional and Local Sea Level Trends, Annual Counts of Flood Frequency 1-Oppenheimer, M., B.C. Glavovic , J. Hinkel, R. van de Wal, A.K. Magnan, A. Abd-Elgawad, R. Cai, M. Cifuentes-Jara, R.M. DeConto, T. Ghosh, J. Hay, F. Isla, B. Marzeion, B. Meyssignac, and Z. Sebesvari (2019): Sea Level Rise and Implications for Low-Lying Islands, Coasts and Communities. In: IPCC Special Report on the Ocean and Cryosphere in a Changing Climate [H.-O. Pörtner, D.C. Roberts, V. Masson-Delmotte, P. Zhai, M. Tignor, E. Poloczanska, K. Mintenbeck, A. Alegría, M. Nicolai, A. Okem, J. Petzold, B. Rama, N.M. Weyer (eds.)]. In press. 2-Storlazzi, C.D., Gingerich, S.B., Dongeren, A. van, Cheriton, O.M., Swarzenski, P.W., Quataert, E., Voss, C.I., Field, D.W., Annamalai, H., Piniak, G.A., McCall, R. (2018): Most atolls will be uninhabitable by the mid-21st century because of sea-level rise exacerbating wave-driven flooding. Science Advances 4, eaap9741. https://doi.org/10.1126/sciadv.aap9741. 3-Gingerich, S. B., C. I. Voss, and A. G. Johnson (2017): Seawater-flooding events and impact on freshwater lenses of low-lying islands: Controlling factors, basic management and mitigation. Journal of Hydrology, 551, 676688. doi:10.1016/j.jhydrol.2017.03.001. 4-Wairiu, M. Land degradation and sustainable land management practices in Pacific Island Countries. Reg Environ Change 17, 1053–1064 (2017): https://doi.org/10.1007/s10113-016-1041-0. 5-Fox-Kemper, B., H. T. Hewitt, C. Xiao, G. Aðalgeirsdóttir, S. S. Drijfhout, T. L. Edwards, N. R. Golledge, M. Hemer, R. E. Kopp, G. Krinner, A. Mix, D. Notz, S. Nowicki, I. S. Nurhati, L. Ruiz, J-B. Sallée, A. B. A. Slangen, Y. Yu (2021):
PICCM 2021
60
Ocean, Cryosphere and Sea Level Change. In: Climate Change 2021: The Physical Science Basis. Contribution of Working Group I to the Sixth Assessment Report of the Intergovernmental Panel on Climate Change [Masson-Delmotte, V., P. Zhai, A. Pirani, S. L. Connors, C. Péan, S. Berger, N. Caud, Y. Chen, L. Goldfarb, M. I. Gomis, M. Huang, K. Leitzell, E. Lonnoy, J.B.R. Matthews, T. K. Maycock, T. Waterfield, O. Yelekçi, R. Yu and B. Zhou (eds.)]. Cambridge University Press. In Press: https://www.ipcc.ch/report/ar6/wg1/downloads/report/IPCC_AR6_WGI_Chapter_09.pdf. 6-Climate Change: Global Sea Level NOAA Climate.gov https://www.climate.gov/news-features/understanding-climate/climate-change-global-sea-level. 7-Sweet, W. V., R. E. Kopp, C. P. Weaver, J. Obeysekera, R. M. Horton, E. R. Thieler, and C. Zervas (2017): Global and regional sea level rise scenarios for the United States. NOAA Technical Report NOS CO-OPS 083. Silver Spring, Maryland: US Department of Commerce, NOAA, National Ocean Service, Center for Operational Oceanographic Products and Services. https://doi.org/10.7289/V5/TR-NOS-COOPS-083. 8- Sweet, W.V., B.D. Hamlington, R.E. Kopp, C.P. Weaver, P.L. Barnard, D. Bekaert, W. Brooks, M. Craghan, G. Dusek, T. Frederikse, G. Garner, A.S. Genz, J.P. Krasting, E. Larour, D. Marcy, J.J. Marra, J. Obeysekera, M. Osler, M. Pendleton, D. Roman, L. Schmied, W. Veatch, K.D. White, and C. Zuzak, 2022: Global and Regional Sea Level Rise Scenarios for the United States: Updated Mean Projections and Extreme Water Level Probabilities Along U.S. Coastlines. NOAA Technical Report NOS 01. National Oceanic and Atmospheric Administration, National Ocean Service, Silver Spring, MD, 111 pp. https://oceanservice.noaa.gov/hazards/sealevelrise/noaa-nos-techrpt01-global-regional-SLR-scenarios-US.pdf. 9-Di Lorenzo, E., K. M. Cobb, J. C. Furtado, N. Scheider, B. T. Anderson, A. Bracco, M. A. Alexander, and D. J. Vimont (2010): Central Pacific El Niño and decadal climate change in the North Pacific Ocean. Nature Geosciences, 3, 762–765, doi:10.1038/NGEO984. 10-Becker, M., B. Meyssignac, W. Llovel, A. Cazenave, and T. Delcroix (2012): Sea level variations at tropical Pacific islands since 1950. Global and Planetary Change, 80-81, 85–98, doi:10.1016/j.gloplacha.2011.09.004. 11-Hamlington, B. D., R. R. Leben, K.-Y. Kim, R. S. Nerem, L. P. Atkinson, and P. R. Thompson (2015): The effect of the El Niño-Southern Oscillation on U.S. regional and coastal sea level. Journal of Geophysical Research Oceans, 120, 3970–3986, doi:10.1002/2014JC010602. 12-Moon, J.-H., Y. T. Song, and H. Lee (2015): PDO and ENSO modulations intensified decadal sea level variability in the tropical Pacific. Journal of Geophysical Research Oceans, 120, 8229–8237, doi:10.1002/2015JC011139. 13-Widlansky, M. W., A. Timmerman, and W. Cai (2015): Future extreme sea level seesaws in the tropical Pacific. Science Advances, 1, e1500560, doi: 10.1126/sciadv.1500560. 14-Long, X., Widlansky, M. J., Schloesser, F., Thompson, P. R., Annamalai, H., Merrifield, M. A., & Yoon, H. (2020): Higher sea levels at Hawaiʻi caused by strong El Niño and weak trade winds. J. Clim., 33(8), 3037-3059. https://dx.doi.org/10.1175/jcli-d-19-0221.1. 15-Feng, M., Li, Y., & Meyers, G. (2004): Multidecadal variations of Fremantle sea level: Footprint of climate variability in the tropical Pacific. Geophysical Research Letters, 31, L16302. https://doi.org/10.1029/2004GL019947. 16-Merrifield, M. A., & Thompson, P. R. (2018): Interdecadal Sea Level Variations in the Pacific: Distinctions Between the Tropics and Extratropics. Geophysical Research Letters, 45(13), 6604–6610. https://doi.org/10.1029/2018GL077666. 17-Hamlington, B. D., and P. R. Thompson (2015): Considerations for estimating the 20th century trend in global mean sea level. Geophys. Res. Lett., 42, 4102–4109. doi: 10.1002/2015GL064177. http://onlinelibrary.wiley.com/doi/10.1002/2015GL064177/full 18-Martínez-Asensio, A., G. Wöppelmann, V. Ballu, M. Becker, L. Testut, A.K. Magnan, V.K.E. Duvat (2019):. Relative sea-level rise and the influence of vertical land motion at Tropical Pacific Islands. Global and Planetary Change, V176, Pps 132-143. https://doi.org/10.1016/j.gloplacha.2019.03.008. 19-Han, S.-C., Sauber, J., Pollitz, F., & Ray, R. (2019): Sea level rise in the Samoan Islands escalated by viscoelastic relaxation after the 2009 Samoa-Tonga earthquake. Journal of Geophysical Research: Solid Earth, 124, 4142–4156. https://doi.org/10.1029/2018JB017110. 20-Sweet, W. V., and J. J. Marra (2015): 2014 State of nuisance tidal flooding. (A supplement to “State of the Climate: National Climate Report for August 2015”). [Available online at https://www.ncdc.noaa.gov/monitoring-content/sotc/national/2015/aug/sweet-marra-nuisance-flooding-2015.pdf.].
PICCM 2021
61
21-Thompson, P. R., Widlansky, M. J., Hamlington, B.D., Merrifield, M. A., Marra, J. J., Mitchum, G.T., Sweet, W. (2021): Rapid increases and extreme months in projections of United States high-tide flooding. Nature Climate Change https://doi.org/10.1038/s41558-021-01077-8. 22-Hoeke, R. H., K. L. McInnes, J. C. Kruger, R. J. McNaught, J. R. Hunter, S. G. Smithers (2013): Widespread inundation of Pacific islands triggered by distant-source wind-waves, Global and Planetary Change, Volume 108, Pages 128-138, ISSN 0921-8181,https://doi.org/10.1016/j.gloplacha.2013.06.006. 23- Merrifield, M. A., J. M. Becker, M. Ford, and Y. Yao (2014): Observations and estimates of wave-driven water level extremes at the Marshall Islands. Geophysical Research Letters, 41, 7245–7253, doi:10.1002/2014GL061005. 24- Quataert, E., Storlazzi, C. D., van Rooijen, A., Cheriton, O. M., and van Dongeren, A. R. (2015): The influence of coral reefs and climate change on wave-driven flooding of tropical coastlines, Geophys. Res. Lett., 1–9, doi:10.1002/2015GL064861. 25-Moftakhari, H. R., A. AghaKouchak, B. F. Sanders, and R. A. Matthew (2017): Cumulative hazard: The case of nuisance flooding. Earth’s Future, 5, 214–223, doi:10.1002/2016EF000494. 5. Sea Level 56 State of Environmental Conditions in Hawaiʻi and the USAPI: 2017. • BOM http://www.bom.gov.au/australia/tides/ • NASA https://sealevel.nasa.gov/understanding-sea-level/key-indicators/global-mean-sea-level • NOAA COOPS https://tidesandcurrents.noaa.gov/sltrends/sltrends.html • University of Hawaiʻi Sea Level Center: https://uhslc.soest.hawaii.edu/ Mean Sea Surface Temperature, Ocean Heat Waves 1-van Hooidonk, R., Maynard, J., Tamelander, J. et al. (2016):Local-scale projections of coral reef futures and implications of the Paris Agreement. Sci Rep 6, 39666. https://doi.org/10.1038/srep39666. 2-Namias, J. & Born, R. M. (1970): Temporal Coherence in North Pacific Sea-Surface Temperature Patterns. Journal of Geophysical Research 75, 5952–5955. 3-Deser, C., Alexander, M., Xie, S.-P. & Phillips, A. S. (2010): Sea Surface Temperature Variability: Patterns and Mechanisms. Annual Review of Marine Science 2, 115–43. 4-Shea, D. (2018): NINO SST Indices (NINO 1+2, 3, 3.4, 4: ONI and TNI), https://climatedataguide.ucar.edu/climate-data/nino-sst-indices-nino-12-3-34-4-oni-and-tni. 5-Reynolds, R.W. et al (2007): Daily high-resolution blended analyses for sea surface temperature, J. Climate, 20, 5473-5496. 6-Huang, B., Liu, C., Banzon, V., Freeman, E., Graham, G., Hankins, B., Smith, T., Zhang, H.-M. (2021): Improvements of the Daily Optimum Interpolation Sea Surface Temperature (DOISST) Version 2.1. Journal of Climate, 34, 2923-2939. doi: 10.1175/JCLI-D-20-0166.1. 7-Banzon, V., Smith, T.M., Chin, T.M., Liu, C, Hankins, W. (2016): A long-term record of blended satellite and in situ sea-surface temperature for climate monitoring, modelling and environmental studies, Earth System Science Data, 165–176. doi:10.5194/essd-8-165-2016. 8-Zou, y. and Xi, X. (2021): An ongoing cooling in the eastern Pacific linked to eastward migrations of the Southeast Pacific Subtropical Anticyclone Environ. Res. Lett. 16 034020. 9-Hobday, A.J., Alexander, L.V., Perkins, S.E., Smale, D.A., Straub, S.C., Oliver, E.C.J., Benthuysen, J., Burrows, M.T., Donat, M. G., Feng, M., Holbrook, N.J., Moore, P.J., Scannell, H.A., Gupta, A.S., Wernberg, T. (2016): A hierarchical approach to defining marine heatwaves. Progress in Oceanography 141, 227-238. doi: 210.1016/j.pocean.2015.1012.1014. 10-Hobday, A.J., Oliver, E.C.J., Gupta, A.S., Benthuysen, J.A., Burrows, M.T., Donat, M.G., Holbrook, N.J., Moore, P.J., Thomsen, M.S., Wernberg, T., Smale, D.A. (2018): Categorizing and Naming Marine Heatwaves. Oceanography 31(2). doi: 10.5670/oceanog.2018.5205. • BOM http://www.bom.gov.au/climate/ahead/about/model/access.shtml • NASA: https://climate.nasa.gov/vital-signs/global-temperature/ • NOAA: https://www.psl.noaa.gov/data/gridded/ • NOAA OISST https://www.ncei.noaa.gov/products/optimum-interpolation-sst • Marine heatwave tracker http://www.marineheatwaves.org/tracker.html
PICCM 2021
62
• Marine heatwave software https://github.com/ecjoliver/marineHeatWaves • APDRC: http://apdrc.soest.hawaii.edu/datadoc/noaasst.php • Bulgin, C.E., Merchant, C.J. & Ferreira, D. Tendencies, variability and persistence of sea surface temperature
anomalies. Sci Rep 10, 7986 (2020): https://doi.org/10.1038/s41598-020-64785-9. • Merchant, C. J. et al. (2019): Satellite-based time-series of sea-surface temperature since 1981 for climate
applications. Scientific Data 6, https://doi.org/10.1038/s41597-019-0236-x Ocean Acidification, Chlorophyll Concentration, and Estimated Phytoplankton Size 1-Feely, R.A., S. R. Alin, B. Carter, N. Bednarsek, B. Hales, F. Chan, T. M. Hill, B. Gaylord, E. Sanford, R. H. Byrne, C. L. Sabine, D. Greeley, and L. Juranek (2016): Chemical and biological impacts of ocean acidification along the west coast of North America. Estuarine, Coastal and Shelf Science, 183, 260–270. 2-UH SOEST HOT promo video: https://hahana.soest.hawaii.edu/hot/promo/promoVids.html). 3-NOAA PMEL primer on pH:https://www.pmel.noaa.gov/co2/story/A+primer+on+pH. 4 UH SOEST HOT Trends: https://hahana.soest.hawaii.edu/hot/trends/trends.html. 5-Barnes, C., Irigoien, X., De Oliveira, J.A.A., Maxwell, D., Jennings, S. (2011). Predicting marine phytoplankton community size structure from empirical relationships with remotely sensed variables. J. Plankton Res. 33 (1), 13–24. • Cao, L., and K. Caldeira (2008): Atmospheric CO2 stabilization and ocean acidification. Geophysical Research
Letters, 35, L19609, doi:10.1029/2008GL035072. • Clayton, T.D., and R.H. Byrne (1993): Spectrophotometric seawater pH measurements: total hydrogen ion
concentration scale calibration of m-cresol purple and at-sea results. Deep-Sea Res. I 40: 2115-2129. • DelValls, T.A., and A.G. Dickson (1998): The pH of buffers based on 2-amino-2-hydroxymethyl-1,3-propanediol
(tris) in synthetic seawater. Deep-Sea Res. I 45: 1541-1554. • Lewis, E., and D.W.R. Wallace (1998): Program Developed for CO2 System Calculations. ORNL/CDIAC-105.
Carbon Dioxide Information Analysis Center, ak Ridge National Laboratory, U.S. Department of Energy, Oak Ridge, Tennessee. 10.1016/j.ecss.2016.08.043.
• Polovina, Jeffrey J., and Phoebe A. Woodworth (2012): Declines in phytoplankton cell size in the subtropical oceans estimated from satellite remotely-sensed temperature and chlorophyll, 1998–2007. Deep Sea Research Part II: Topical Studies in Oceanography 77:82-88.
• Woodworth-Jefcoats, P. A., J. J. Polovina, J. P. Dunne, and J. L. Blanchard (2013): Ecosystem size structure response to 21st century climate projection: Large fish abundance decreases in the central North Pacific and increases in the California Current. Global Change Biology, 19, 724–733, doi:10.1111/gcb.12076.
Future Climate Data and Methods Confidence in projected changes is assessed from multiple lines of evidence using the semi-quantitative system used in IPCC assessments1. Evidence includes:
• Physical processes • Past trends and their formal attribution • Evaluation of climate models • Agreement between climate models
Confidence in some projections of the Pacific is lower than other regions due to long-standing model biases such as the ‘cold tongue’ bias and ‘double ITCZ’ bias (see Grose et al. 201420 and Grose et al. 202021).
Projections are given for the Shared Socio-economic Pathways (SSPs), each with a narrative about human development then a number quantifying the amount of enhanced greenhouse effect by 2100. The narrative and the Greenhouse effect for the most common (‘Tier 1’) combinations are:
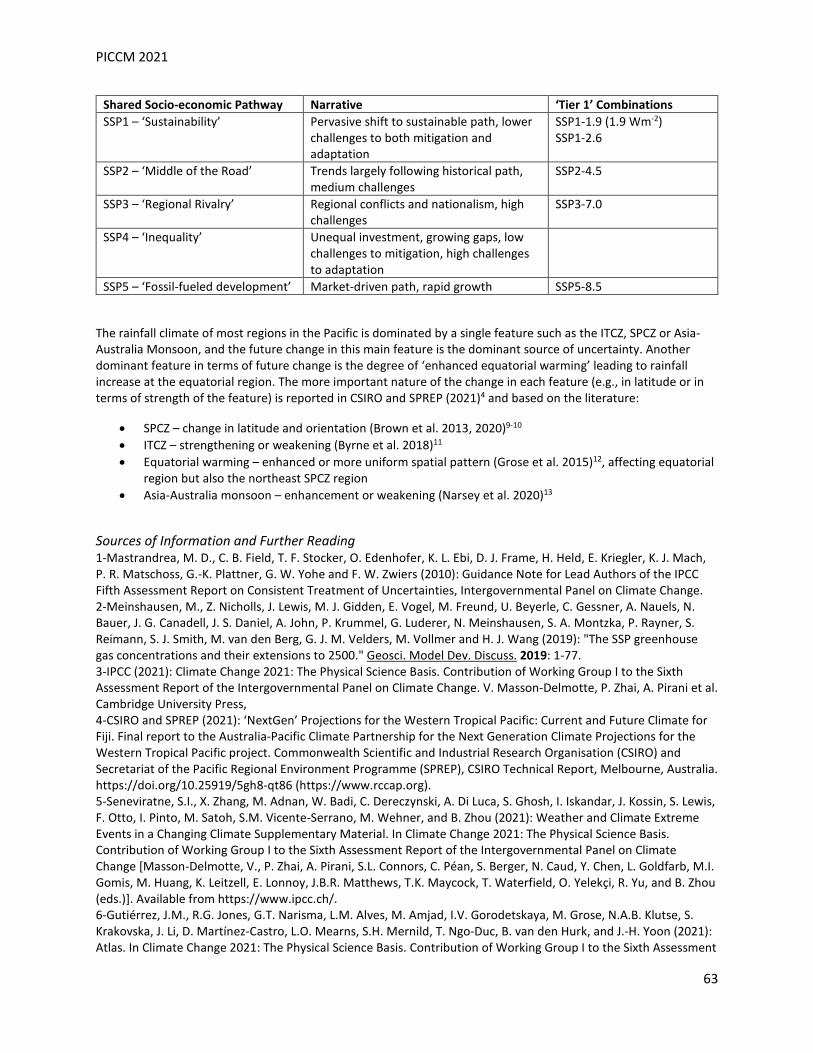
PICCM 2021
63
Shared Socio-economic Pathway Narrative ‘Tier 1’ Combinations SSP1 – ‘Sustainability’ Pervasive shift to sustainable path, lower
challenges to both mitigation and adaptation
SSP1-1.9 (1.9 Wm-2) SSP1-2.6
SSP2 – ‘Middle of the Road’ Trends largely following historical path, medium challenges
SSP2-4.5
SSP3 – ‘Regional Rivalry’ Regional conflicts and nationalism, high challenges
SSP3-7.0
SSP4 – ‘Inequality’ Unequal investment, growing gaps, low challenges to mitigation, high challenges to adaptation
SSP5 – ‘Fossil-fueled development’ Market-driven path, rapid growth SSP5-8.5
The rainfall climate of most regions in the Pacific is dominated by a single feature such as the ITCZ, SPCZ or Asia-Australia Monsoon, and the future change in this main feature is the dominant source of uncertainty. Another dominant feature in terms of future change is the degree of ‘enhanced equatorial warming’ leading to rainfall increase at the equatorial region. The more important nature of the change in each feature (e.g., in latitude or in terms of strength of the feature) is reported in CSIRO and SPREP (2021)4 and based on the literature:
• SPCZ – change in latitude and orientation (Brown et al. 2013, 2020)9-10 • ITCZ – strengthening or weakening (Byrne et al. 2018)11 • Equatorial warming – enhanced or more uniform spatial pattern (Grose et al. 2015)12, affecting equatorial
region but also the northeast SPCZ region • Asia-Australia monsoon – enhancement or weakening (Narsey et al. 2020)13
Sources of Information and Further Reading 1-Mastrandrea, M. D., C. B. Field, T. F. Stocker, O. Edenhofer, K. L. Ebi, D. J. Frame, H. Held, E. Kriegler, K. J. Mach, P. R. Matschoss, G.-K. Plattner, G. W. Yohe and F. W. Zwiers (2010): Guidance Note for Lead Authors of the IPCC Fifth Assessment Report on Consistent Treatment of Uncertainties, Intergovernmental Panel on Climate Change. 2-Meinshausen, M., Z. Nicholls, J. Lewis, M. J. Gidden, E. Vogel, M. Freund, U. Beyerle, C. Gessner, A. Nauels, N. Bauer, J. G. Canadell, J. S. Daniel, A. John, P. Krummel, G. Luderer, N. Meinshausen, S. A. Montzka, P. Rayner, S. Reimann, S. J. Smith, M. van den Berg, G. J. M. Velders, M. Vollmer and H. J. Wang (2019): "The SSP greenhouse gas concentrations and their extensions to 2500." Geosci. Model Dev. Discuss. 2019: 1-77. 3-IPCC (2021): Climate Change 2021: The Physical Science Basis. Contribution of Working Group I to the Sixth Assessment Report of the Intergovernmental Panel on Climate Change. V. Masson-Delmotte, P. Zhai, A. Pirani et al. Cambridge University Press, 4-CSIRO and SPREP (2021): ‘NextGen’ Projections for the Western Tropical Pacific: Current and Future Climate for Fiji. Final report to the Australia-Pacific Climate Partnership for the Next Generation Climate Projections for the Western Tropical Pacific project. Commonwealth Scientific and Industrial Research Organisation (CSIRO) and Secretariat of the Pacific Regional Environment Programme (SPREP), CSIRO Technical Report, Melbourne, Australia. https://doi.org/10.25919/5gh8-qt86 (https://www.rccap.org). 5-Seneviratne, S.I., X. Zhang, M. Adnan, W. Badi, C. Dereczynski, A. Di Luca, S. Ghosh, I. Iskandar, J. Kossin, S. Lewis, F. Otto, I. Pinto, M. Satoh, S.M. Vicente-Serrano, M. Wehner, and B. Zhou (2021): Weather and Climate Extreme Events in a Changing Climate Supplementary Material. In Climate Change 2021: The Physical Science Basis. Contribution of Working Group I to the Sixth Assessment Report of the Intergovernmental Panel on Climate Change [Masson-Delmotte, V., P. Zhai, A. Pirani, S.L. Connors, C. Péan, S. Berger, N. Caud, Y. Chen, L. Goldfarb, M.I. Gomis, M. Huang, K. Leitzell, E. Lonnoy, J.B.R. Matthews, T.K. Maycock, T. Waterfield, O. Yelekçi, R. Yu, and B. Zhou (eds.)]. Available from https://www.ipcc.ch/. 6-Gutiérrez, J.M., R.G. Jones, G.T. Narisma, L.M. Alves, M. Amjad, I.V. Gorodetskaya, M. Grose, N.A.B. Klutse, S. Krakovska, J. Li, D. Martínez-Castro, L.O. Mearns, S.H. Mernild, T. Ngo-Duc, B. van den Hurk, and J.-H. Yoon (2021): Atlas. In Climate Change 2021: The Physical Science Basis. Contribution of Working Group I to the Sixth Assessment
PICCM 2021
64
Report of the Intergovernmental Panel on Climate Change [Masson-Delmotte, V., P. Zhai, A. Pirani, S.L. Connors, C. Péan, S. Berger, N. Caud, Y. Chen, L. Goldfarb, M.I. Gomis, M. Huang, K. Leitzell, E. Lonnoy, J.B.R. Matthews, T.K. Maycock, T. Waterfield, O. Yelekçi, R. Yu, and B. Zhou (eds.)]. Cambridge University Press. In Press. 7-Gutiérrez, J.M., R.G. Jones, G.T. Narisma, L.M. Alves, M. Amjad, I.V. Gorodetskaya, M. Grose, N.A.B. Klutse, S. Krakovska, J. Li, D. Martínez-Castro, L.O. Mearns, S.H. Mernild, T. Ngo-Duc, B. van den Hurk, and J.-H. Yoon (2021): Atlas. In Climate Change 2021: The Physical Science Basis. Contribution of Working Group I to the Sixth Assessment Report of the Intergovernmental Panel on Climate Change [Masson-Delmotte, V., P. Zhai, A. Pirani, S.L. Connors, C. Péan, S. Berger, N. Caud, Y. Chen, L. Goldfarb, M.I. Gomis, M. Huang, K. Leitzell, E. Lonnoy, J.B.R. Matthews, T.K. Maycock, T. Waterfield, O. Yelekçi, R. Yu, and B. Zhou (eds.)]. Available from http://interactive-atlas.ipcc.ch/. 8-State of Hawai’I Climate Change portal 2021. Available at: https://climate.hawaii.gov/ Access Dec 2021. 9-Brown, J. R., R. A. Colman, A. F. Moise and I. N. Smith (2013): "The western Pacific monsoon in CMIP5 models: Model evaluation and projections." Journal of Geophysical Research: Atmospheres 118(22): 2013JD020290. 10-Brown, J. R., M. Lengaigne, B. R. Lintner, M. J. Widlansky, K. van der Wiel, C. Dutheil, B. K. Linsley, A. J. Matthews and J. Renwick (2020): "South Pacific Convergence Zone dynamics, variability and impacts in a changing climate." Nature Reviews Earth & Environment. 11-Byrne, M. P., A. G. Pendergrass, A. D. Rapp and K. R. Wodzicki (2018): "Response of the Intertropical Convergence Zone to Climate Change: Location, Width, and Strength." Current Climate Change Reports 4(4): 355-370. 12-Grose, M. R., J. Bhend, S. Narsey, A. S. Gupta and J. R. Brown (2015): "Can We Constrain CMIP5 Rainfall Projections in the Tropical Pacific Based on Surface Warming Patterns?" Journal of Climate 27(24): 9123-9138. 13-Narsey, S. Y., J. R. Brown, R. A. Colman, F. Delage, S. B. Power, A. F. Moise and H. Zhang (2020): "Climate Change Projections for the Australian Monsoon from CMIP6 Models." Geophysical Research Letters 47(13): e2019GL086816. 14-Dhage, L. and M. J. Widlansky (2022): "Assessment of 21stcentury changing sea surface temperature, rainfall, and sea surface height patterns in the tropical Pacific Islands using CMIP6 greenhouse warming projections." Earth's Future. https://doi.org/10.1029/2021EF002524. 15-Shepherd, T. G., E. Boyd, R. A. Calel, S. C. Chapman, S. Dessai, I. M. Dima-West, H. J. Fowler, R. James, D. Maraun, O. Martius, C. A. Senior, A. H. Sobel, D. A. Stainforth, S. F. B. Tett, K. E. Trenberth, B. J. J. M. van den Hurk, N. W. Watkins, R. L. Wilby and D. A. Zenghelis (2018): "Storylines: an alternative approach to representing uncertainty in physical aspects of climate change." Climatic Change 151(3): 555-571. 16-Hersbach, H., B. Bell, P. Berrisford, S. Hirahara, A. Horányi, J. Muñoz-Sabater, J. Nicolas, C. Peubey, R. Radu, D. Schepers, A. Simmons, C. Soci, S. Abdalla, X. Abellan, G. Balsamo, P. Bechtold, G. Biavati, J. Bidlot, M. Bonavita, G. De Chiara, P. Dahlgren, D. Dee, M. Diamantakis, R. Dragani, J. Flemming, R. Forbes, M. Fuentes, A. Geer, L. Haimberger, S. Healy, R. J. Hogan, E. Hólm, M. Janisková, S. Keeley, P. Laloyaux, P. Lopez, C. Lupu, G. Radnoti, P. de Rosnay, I. Rozum, F. Vamborg, S. Villaume and J.-N. Thépaut (2020): "The ERA5 global reanalysis." Quarterly Journal of the Royal Meteorological Society 146(730): 1999-2049. 17-Knutson, T., Camargo, S., Chan, J., Emanuel, K., Ho, C., & Kossin, J. et al. (2020): Tropical Cyclones and Climate Change Assessment: Part II: Projected Response to Anthropogenic Warming. Bulletin Of The American Meteorological Society, E303-E322. https://doi.org/10.1175/BAMS-D-18-0194.1. 18-Holbrook NJ, V Hernaman, S Koshiba, J Lako, JB Kajtar, P Amosa and A Singh (2022): Impacts of marine heatwaves on tropical western and central Pacific Island nations and their communities. Global and Planetary Change, 208, 103680. 19-Frölicher, T. L., K. B. Rodgers, C. A. Stock,and W. W. L. Cheung (2016): Sources of uncertainties in 21st century projections of potential ocean ecosystem stressors, Global Biogeochem. Cycles,30(8):1224–1243, doi:10.1002/2015GB005338. 20-Grose, M. R., J. N. Brown, S. Narsey, J. R. Brown, B. F. Murphy, C. Langlais, A. Sen Gupta, A. F. Moise and D. B. Irving (2014): "Assessment of the CMIP5 global climate model simulations of the western tropical Pacific climate system and comparison to CMIP3." International Journal of Climatology 34(12): 3382-3399. 21-Grose, M. R., S. Narsey, F. P. Delage, A. J. Dowdy, M. Bador, G. Boschat, C. Chung, J. B. Kajtar, S. Rauniyar, M. B. Freund, K. Lyu, H. Rashid, X. Zhang, S. Wales, C. Trenham, N. J. Holbrook, T. Cowan, L. Alexander, J. M. Arblaster and S. Power (2020): "Insights From CMIP6 for Australia's Future Climate." Earth's Future 8(5): e2019EF001469 (includes an assessment of the ‘cold tongue bias in the Pacific in CMIP6).
PICCM 2021
65
Observed and Expected Impacts Sources of Information and Further Reading 1-Bell, J., and M. Taylor (2015): Building climate-resilient food systems for Pacific Islands. 2015-15. Program Report 2015-15. WorldFish, Penang, Malaysia http://pubs.iclarm.net/resource_centre/2015-15.pdf. 2-Taylor, M., A. McGregor, and B. Dawson, Eds. (2016): Vulnerability of Pacific Island Agriculture and Forestry to Climate Change. Noumea Cedex, New Caledonia, 559 pp.http://www.pacificfarmers.com/wp-content/uploads/2016/07/Vulnerability-of-Pacific-Island-agriculture-and-forestry-to-climate-change.pdf. 3- Bell, J.D., Senina, I., Adams, T., Aumont, O., Calmettes, B., Clark, S., Dessert, M., Gehlen, M., Gorgues, T., Hampton, J., Hanich, Q., Harden-Davies, H., Hare, S.R., Holmes, G., Lehodey, P., Lengaigne, M., Mansfield, W., Menkes, C., Nicol, S., Ota, Y., Pasisi, C., Pilling, G., Reid, C., Ronneberg, E., Gupta, A.S., Seto, K.L., Smith, N., Taei, S., Tsamenyi, M., Williams, P. (2021): Pathways to sustaining tuna-dependent Pacific Island economies during climate change. Nat Sustain 4, 900–910. https://doi.org/10.1038/s41893-021-00745-z. 4-Friday, J. B., K. Friday, and C. Elevitch (2017: Appendix A: Regional summaries: Hawaiʻi and the U.S.-Affiliated Pacific Islands. Agroforestry: Enhancing Resiliency in U.S. Agricultural Landscapes Under Changing Conditions. Schoeneberger, M. M., G. Bentrup, and T. Patel-Weynand, Eds., U.S. Department of Agricutlure, Forest Service, Washington, DC, 147 153.https://www.fs.usda.gov/treesearch/pubs/55775. 5-Keener, V., D. Helweg, S. Asam, S. Balwani, M. Burkett, C. Fletcher, T. Giambelluca, Z. Grecni, M. Nobrega-Olivera, J. Polovina, and G. Tribble (2018): Hawai‘i and U.S.-Affiliated Pacific Islands. In Impacts, Risks, and Adaptation in the United States: Fourth National Climate Assessment, Volume II [Reidmiller, D.R., C.W. Avery, D.R. Easterling, K.E. Kunkel, K.L.M. Lewis, T.K. Maycock, and B.C. Stewart (eds.)]. U.S. Global Change Research Program, Washington, DC, USA, pp. 1242–1308. doi: 10.7930/NCA4.2018.CH27. 6-McGree, Simon, Sergei Schreider, Yuriy Kuleshov, and Bipendra Prakash (2020): “On the Use of Mean and Extreme Climate Indices to Predict Sugar Yield in Western Fiji.” Weather and Climate Extremes 29 (September): 100271. https://doi.org/10.1016/j.wace.2020.100271. 7-Storlazzi, C.D., Gingerich, S.B., Dongeren, A. van, Cheriton, O.M., Swarzenski, P.W., Quataert, E., Voss, C.I., Field, D.W., Annamalai, H., Piniak, G.A., McCall, R. (2018): Most atolls will be uninhabitable by the mid-21st century because of sea-level rise exacerbating wave-driven flooding. Science Advances 4, eaap9741. https://doi.org/10.1126/sciadv.aap9741. 8-Wairiu, M. Land degradation and sustainable land management practices in Pacific Island Countries. Reg Environ Change 17, 1053–1064 (2017): https://doi.org/10.1007/s10113-016-1041-0. 9-Keener, V., Grecni, Z., Shuler, C., Anderson Tagarino, K., & Miles, W. (2021): Climate Change in American Sāmoa: Indicators and Considerations for Key Sectors. Report for the Pacific Islands Regional Climate Assessment. East-West Center, Honolulu, HI. https://doi.org/10.5281/zenodo.4663397. 10-Nalau, Johanna, John Handmer, and Malcolm Dalesa (2017): “The Role and Capacity of Government in a Climate Crisis: Cyclone Pam in Vanuatu.” In Climate Change Adaptation in Pacific Countries. Climate Change Management, edited by W Leal Filho. Springer, Cham. 11-Haynes, Emily, Divya Bhagtani, Viliamu Iese, Catherine R. Brown, Jioje Fesaitu, Ian Hambleton, Neela Badrie, et al. (2020):“Food Sources and Dietary Quality in Small Island Developing States: Development of Methods and Policy Relevant Novel Survey Data from the Pacific and Caribbean.” Nutrients 12 (11): 1–22. https://doi.org/10.3390/nu12113350. 12-McNaught, Rebecca, Olivia Warrick, and Andrew Cooper (2014): “Communicating Climate Change for Adaptation in Rural Communities: A Pacific Study.” Regional Environmental Change 14 (4): 1491–1503. https://doi.org/10.1007/s10113-014-0592-1. 13-Brown, P., A. Daigneault, and D. Gawith (2017): “Climate Change and the Economic Impacts of Flooding on Fiji.” Climate and Development 9 (6): 493–504. https://doi.org/10.1080/17565529.2016.1174656. 14-Rey, Tony, Loic le De, Frederic Leone, and David Gilbert (2017): “An Integrative Approach to Understand Vulnerability and Resilience Post-Disaster: The 2015 Cyclone Pam in Urban Vanuatu as Case Study.” Disaster Prevention and Management 26 (3): 259–75. https://doi.org/10.1108/DPM-07-2016-0137.
PICCM 2021
66
15-Hoeke, Ron K., Herve Damlamian, Jérome Aucan, and Moritz Wandres (2021): “Severe Flooding in the Atoll Nations of Tuvalu and Kiribati Triggered by a Distant Tropical Cyclone Pam.” Frontiers in Marine Science 7 (January). https://doi.org/10.3389/fmars.2020.539646. 16-Salmon, Camille, Virginie KE Duvat, and Victoire Laurent (2019): “Human-and Climate-Driven Shoreline Changes on a Remote Mountainous Tropical Pacific Island: Tubuai, French Polynesia Human-and Climate-Driven Shoreline Changes on a Remote Mountainous Tropical Pacific.” Anthropocene Review 25. https://doi.org/10.1016/j.ancene.2019.100191ï. 17-Winter, Gundula, Curt Storlazzi, Sean Vitousek, Ap van Dongeren, Robert McCall, Ron Hoeke, William Skirving, et al. (2020): “Steps to Develop Early Warning Systems and Future Scenarios of Storm Wave-Driven Flooding Along Coral Reef-Lined Coasts.” Frontiers in Marine Science 7 (March). https://doi.org/10.3389/fmars.2020.00199. 18-Beetham, Edward, Paul S. Kench, and Stéphane Popinet (2017): “Future Reef Growth Can Mitigate Physical Impacts of Sea-Level Rise on Atoll Islands.” Earth’s Future 5 (10): 1002–14. https://doi.org/10.1002/2017EF000589. 19-Ahmed, Iftekhar, and Ted McDonnell (2020): “Prospects and Constraints of Post-Cyclone Housing Reconstruction in Vanuatu Drawing from the Experience of Tropical Cyclone Harold.” Progress in Disaster Science 8 (December). https://doi.org/10.1016/j.pdisas.2020.100126. 20-Romine, Bradley M., and Charles H. Fletcher (2013): “A Summary of Historical Shoreline Changes on Beaches of Kauai, Oahu, and Maui, Hawaiʻi.” Journal of Coastal Research 288 (May): 605–14. https://doi.org/10.2112/JCOASTRES-D-11-00202.1. 21-Kumar, Lalit, and Subhashni Taylor (2015): “Exposure of Coastal Built Assets in the South Pacific to Climate Risks.” Nature Climate Change 5 (11): 992–96. https://doi.org/10.1038/nclimate2702. 22-Andrew, Neil L., Phil Bright, Luis de la Rua, Shwu Jiau Teoh, and Mathew Vickers (2019): “Coastal Proximity of Populations in 22 Pacific Island Countries and Territories.” PLOS ONE 14 (9): e0223249. https://doi.org/10.1371/journal.pone.0223249. 23-Taupo, Tauisi, and Ilan Noy (2016): “At the Very Edge of a Storm: The Impact of a Distant Cyclone on Atoll Islands At the Very Edge of a Storm: The Impact of a Distant Cyclone on Atoll Islands At the Very Edge of a Storm: The Impact of a Distant Cyclone on Atoll Islands.” https://ssrn.com/abstract=2898124https://ssrn.com/abstract=2898124. 24-Fakhruddin, S. H.M., M. S. Babel, and A. Kawasaki (2015): “Assessing the Vulnerability of Infrastructure to Climate Change on the Islands of Samoa.” Natural Hazards and Earth System Sciences 15 (6): 1343–56. https://doi.org/10.5194/nhess-15-1343-2015. 25-Lee, Dongyeol, Huan Zhang, and Chau Nguyen. (2018): “The Economic Impact of Natural Disasters in Pacific Island Countries: Adaptation and Preparedness.” 26-Kuleshov, Yuriy, Simon McGree, David Jones, Andrew Charles, Andrew Cottrill, Bipen Prakash, Terry Atalifo, Salesa Nihmei, and Fata Lagomauitumua Sunny K. Seuseu. (2014): “Extreme Weather and Climate Events and Their Impacts on Island Countries in the Western Pacific: Cyclones, Floods and Droughts.” Atmospheric and Climate Sciences 04 (05): 803–18. https://doi.org/10.4236/acs.2014.45071. 27-Mansur, Aisha, Jesse Doyle, and Oleksiy Ivaschenko. (2017):. “Social Protection and Humanitarian Assistance Nexus for Disaster Response: Lessons Learnt from Fiji’s Tropical Cyclone Winston.” 28- Frazier, Abby G. (2019): “Economic Costs of Drought in Hawai’i.” http://dlnr.hawaii.gov/drought/. 29-Butcher-Gollach, Colleen. (2015): “Planning, the Urban Poor and Climate Change in Small Island Developing States (SIDS): Unmitigated Disaster or Inclusive Adaptation?” International Development Planning Review 37 (2): 225–48. https://doi.org/10.3828/idpr.2015.17. 30-Chandra, Alvin, and Petros Gaganis (2016): “Deconstructing Vulnerability and Adaptation in a Coastal River Basin Ecosystem: A Participatory Analysis of Flood Risk in Nadi, Fiji Islands.” Climate and Development 8 (3): 256–69. https://doi.org/10.1080/17565529.2015.1016884. 31- McGree, Simon, Nicholas Herold, Lisa Alexander, Sergei Schreider, Yuriy Kuleshov, Elifaleti Ene, Selu Finaulahi, et al.( 2019): “Recent Changes in Mean and Extreme Temperature and Precipitation in the Western Pacific Islands.” Journal of Climate 32 (16): 4919–41. https://doi.org/10.1175/JCLI-D-18-0748.1. 32-Gingerich, S. B., C. I. Voss, and A. G. Johnson (2017): Seawater-flooding events and impact on freshwater lenses of low-lying islands: Controlling factors, basic management and mitigation. Journal of Hydrology, 551, 676688. doi:10.1016/j.jhydrol.2017.03.001.
PICCM 2021
67
33-Feinstein, Charles (2014): “WB-UN HIGH LEVEL DIALOGUE ON ADVANCING SUSTAINABLE DEVELOPMENT IN SMALL ISLAND DEVELOPING STATES SIDS-Towards a Sustainable Energy Future Charles Feinstein Sector Manager, Water and Energy, East Asia and Pacific.” 34-World Health Organization, Western Pacific Region (2015): Human Health and Climate change in Pacific Island countries. WHO Press, Geneva, Switzerland. pp.145 https://www.who.int/publications/i/item/human-health-and-climate-change-in-pacific-island-countries. 35-Anderson, D.L., Ruggiero, P., Mendez, F.J., Barnard, P.L., Erikson, L.H., O’Neill, A.C., Merrifield, M., Rueda, A., Cagigal, L., Marra, J. (2021): Projecting Climate Dependent Coastal Flood Risk With a Hybrid Statistical Dynamical Model. Earth’s Future 9, e2021EF002285. https://doi.org/10.1029/2021EF002285. 36-Morrow, G. & Bowen, K. (2014): Accounting for health in climate change policies: a case study of Fiji, Global Health Action, 7:1, DOI: 10.3402/gha.v7.23550. 37-World Health Organization (2011): Noncommunicable diseases country profiles. Geneva: World Health Organization. 38- Ichiho, H. M., J. W. Gillan, and N. Aitaoto (2013): An Assessment of Non-Communicable Diseases, Diabetes, and Related Risk Factors in the Territory of Guam: A Systems Perspective. Hawaiʻi J Med Public Health, 72, 68–76. 39-Gibson, K.E., Barnett, J., Haslam, N., Kaplan, I. (2020): The mental health impacts of climate change: Findings from a Pacific Island atoll nation. Journal of Anxiety Disorders 73, 102237. https://doi.org/10.1016/j.janxdis.2020.102237. 40-Sarofim, M. C., and Coauthors (2016): Ch. 2: Temperature-related death and illness. The Impacts of Climate Change on Human Health in the United States: A Scientific Assessment, US Global Change Research Program, 43–68, http://dx.doi.org/10.7930/J0MG7MDX. 41-Miles, W., Grecni, Z., Matsutaro, P., Colin, P., Keener, V. & Golbuu, Y. (2020): Climate Change in Palau: Indicators and Considerations for Key Sectors. Report for the Pacific Islands Regional Climate Assessment. East-West Center, Honolulu, HI. https://doi.org/10.5281/zenodo.4124259. 42-Grecni, Z., Miles, W., King, R., Frazier, A., & Keener, V. (2020): Climate Change in Guam: Indicators and Considerations for Key Sectors. Report for the Pacific Islands Regional Climate Assessment. East-West Center, Honolulu, HI. https://doi.org/10.58281/zenodo.4037481. 43-Grecni, Z., Miles, W., Greene, R., Derrington, E., Keener, V. (2021): Climate Change in the Commonwealth of the Northern Marianas Islands: Indicators and Considerations for Key Sectors. Report for the Pacific Islands Regional Climate Assessment. East-West Center, Honolulu, HI. https://doi.org/10.5281/zenodo.4426942. 44-Savage, Amy, Lachlan McIver, and Lisa Schubert (2020): “Review: The Nexus of Climate Change, Food and Nutrition Security and Diet-Related Non-Communicable Diseases in Pacific Island Countries and Territories.” Climate and Development 12 (2): 120–33. https://doi.org/10.1080/17565529.2019.1605284. 45-Cai, W., S. Borlace, M. Lengaigne, P. van Rensch, M. Collins, G. Vecchi, A. Timmermann, A. Santoso, M. J. McPhaden, L. Wu, M. H. England, G. Wang, E. Guilyardi, and F.-F. Jin (2014): Increasing frequency of extreme El Niño events due to greenhouse warming. Nature Climate Change, 4 (2), 111–116. doi:10.1038/nclimate2100 46-Cai, W., G. Wang, A. Santoso, M. J. McPhaden, L. Wu, F.-F. Jin, A. Timmermann, M. Collins, G. Vecchi, M. Lengaigne, M. H. England, D. Dommenget, K. Takahashi, and E. Guilyardi, 2015: Increased frequency of extreme La Niña events under greenhouse warming. Nature Climate Change, 5 (2), 132–137. doi:10.1038/nclimate2492 47-Murphy, Bradley F., Scott B. Power, and Simon McGree (2014): “The Varied Impacts of El Niño–Southern Oscillation on Pacific Island Climates.” Journal of Climate 27 (11): 4015–36. https://doi.org/10.1175/JCLI-D-13-00130.1. 48-Strauch, A.M. (2020): "Evaluating the Management of a Tropical Reservoir: Implications of Climate Change for Water Availability," Pacific Science 74(2), 115-135. https://doi.org/10.2984/74.2.2. 49-Kruk, M. C., A. M. Lorrey, G. M. Griffiths, M. Lander, E. J. Gibney, H. J. Diamond, and J. J. Marra (2015): On the state of the knowledge of rainfall extremes in the western and northern Pacific basin. International Journal of Climatology, 35 (3), 321–336. doi:10.1002/joc.3990. 50-Johanna E. Johnson, Johann D. Bell, Valerie Allain, Quentin Hanich, Patrick Lehodey, Brad R. Moore, Simon Nicol, Tim Pickering and Inna Senina (2017): The Pacific Island Region: Fisheries, Aquaculture and Climate Change. In Climate Change Impacts on Fisheries and Aquaculture: A Global Analysis, Volume I, First Edition. Edited by Bruce F. Phillips and Mónica Pérez-Ramírez. 51-Pickering, T.D., Ponia, B., Hair, C.A., Southgate, P.C., Poloczanska, E.S., Patrona, L.D., Teitelbaum, A., Mohan, C.V., Phillips, M.J., Bell, J.D., Silva, S.D. (2011): Chapter 11: Vulnerability of aquaculture in the tropical Pacific to
PICCM 2021
68
climate change, in [Bell, J.D., Secretariat of the Pacific Community (Eds.)] Vulnerability of tropical Pacific fisheries and aquaculture to climate change. Secretariat of the Pacific Community, Noumea, New Caledonia. 52-Asch, R.G., Cheung, W.W.L., Reygondeau, G. (2018): Future marine ecosystem drivers, biodiversity, and fisheries maximum catch potential in Pacific Island countries and territories under climate change. Marine Policy 88, 285–294. https://doi.org/10.1016/j.marpol.2017.08.015. 53- Bell, J.D., Ganachaud, A., Gehrke, P.C., Griffiths, S.P., Hobday, A.J., Hoegh-Guldberg, O., Johnson, J.E., Le Borgne, R., Lehodey, P., Lough, J.M., Matear, R.J., Pickering, T.D., Pratchett, M.S., Gupta, A.S., Senina, I., Waycott, M. (2013): Mixed responses of tropical Pacific fisheries and aquaculture to climate change. Nature Clim Change 3, 591–599. https://doi.org/10.1038/nclimate1838. 54-Bell, J.D., Albert, J., Amos, G., Arthur, C., Blanc, M., Bromhead, D., Heron, S.F., Hobday, A.J., Hunt, A., Itano, D., James, P.A.S., Lehodey, P., Liu, G., Nicol, S., Potemra, J., Reygondeau, G., Rubani, J., Scutt Phillips, J., Senina, I., Sokimi, W. (2018): Operationalising access to oceanic fisheries resources by small-scale fishers to improve food security in the Pacific Islands. Marine Policy 88, 315–322. https://doi.org/10.1016/j.marpol.2017.11.008 55-Barange, M., Bahri, T., Beveridge, M.C.M., Cochrane, K.L., Funge Smith, S., Poulain, F., Food and Agriculture Organization of the United Nations (2018): Impacts of climate change on fisheries and aquaculture: synthesis of current knowledge, adaptation and mitigation options. https://www.fao.org/3/i9705en/i9705en.pdf. 56-Van Hooidonk, R., Maynard, J., Tamelander, J., Gove, J., Ahmadia, G., Raymundo, L., Williams, G., Heron, S.F., Planes, S. (2016): Local-scale projections of coral reef futures and implications of the Paris Agreement. Sci Rep 6, 39666. https://doi.org/10.1038/srep39666. 57- Magel, J., S. Dimoff and J. K. Baum (2020): Direct and indirect effects of climate change-amplified pulse heat stress events on coral reef fish communities. Ecological Applications, 30(6), doi:10.1002/eap.2124. 58- Hoegh-Guldberg, O., and T. Ridgway (2016): Reviving Melanesia's Ocean Economy: The Case for Action. Global Change Institute/WWF Oceania. 1-64 pp. ISBN, ISBN (978-2-940529-43-8). 59- Gonzalez, R., V. Ram-Bidesi, G. Leport, N. Pascal, L. Brander, L. Fernandes, J. Salcone, A. Seidl (2015): National marine ecosystem service valuation: Fiji. MACBIO (GIZ/IUCN/SPREP) Suva, Fiji.91 pp.. 60-Brodie, G, and A de Ramon N’Yeurt (2018): “Effects of Climate Change on Seagrasses and Seagrass Habitats Relevant to the Pacific Islands.” Suva . 61-Lough, J.M., Meehl, G.A. & Salinger, M.J. (2011): Observed and projected changes in surface climate of the tropical Pacific. In: J.D. Bell, Johnson, J.E. & Hobday, A.J. (Eds) Vulnerability of Tropical Pacific Fisheries and Aquaculture to Climate Change. Secretariat of the Pacific Community, Noumea, New Caledonia. pp. 40–99. 62-Scott, D., Hall, C.M., Gössling, S (2019): Global tourism vulnerability to climate change. Annals of Tourism Research 77, 49–61. https://doi.org/10.1016/j.annals.2019.05.007. 63-Mcleod, E., Hinkel, J., Vafeidis, A.T., Nicholls, R.J., Harvey, N., Salm, R. (2010): Sea-level rise vulnerability in the countries of the Coral Triangle. Sustain Sci 5, 207–222. https://doi.org/10.1007/s11625-010-0105-1. 64-Parsons, Meg, Cilla Brown, Johanna Nalau, and Karen Fisher (2018): “Assessing Adaptive Capacity and Adaptation: Insights from Samoan Tourism Operators.” Climate and Development 10 (7): 644–63. https://doi.org/10.1080/17565529.2017.1410082. 65-Spalding, M., Burke, L., Wood, S.A., Ashpole, J., Hutchison, J., zu Ermgassen, P. (2017): Mapping the global value and distribution of coral reef tourism. Marine Policy 82, 104–113. https://doi.org/10.1016/j.marpol.2017.05.014. 66-IUCN (2013): Impacts of Projected Climate Change on Mangrove and Coastal Ecosystems and Community Livelihoods in Solomon Islands, Vanuatu, Fiji, Tonga, Samoa. 46 pp.https://www.iucn.org/sites/dev/files/impacts_of_projected_climate_change_on_mangrove_and_coastal_ecosystems_and_community_livelihood.pdf. 67-Barbier, E. B. (2020): Progress and challenges in valuing coastal and marine ecosystem services. Review of Environmental Economics and Policy. 68-McKenzie, L.J., Yoshida, R.L., Aini, J.W., Andréfouet, S., Colin, P.L., Cullen-Unsworth, L.C., Hughes, A.T., Payri, C.E., Rota, M., Shaw, C., Skelton, P.A., Tsuda, R.T., Vuki, V.C., Unsworth, R.K.F. (2021): Seagrass ecosystems of the Pacific Island Countries and Territories: A global bright spot. Marine Pollution Bulletin 167, 112308. https://doi.org/10.1016/j.marpolbul.2021.112308. 69-Oppenheimer, M., B.C. Glavovic , J. Hinkel, R. van de Wal, A.K. Magnan, A. Abd-Elgawad, R. Cai, M. CifuentesJara, R.M. DeConto, T. Ghosh, J. Hay, F. Isla, B. Marzeion, B. Meyssignac, and Z. Sebesvari (2019): Sea Level Rise and Implications for Low-Lying Islands, Coasts and Communities. In: IPCC Special Report on the Ocean
PICCM 2021
69
and Cryosphere in a Changing Climate [H.-O. Pörtner, D.C. Roberts, V. Masson-Delmotte, P. Zhai, M. Tignor, E. Poloczanska, K. Mintenbeck, A. Alegría, M. Nicolai, A. Okem, J. Petzold, B. Rama, N.M. Weyer (eds.)]. 70-Wolf, F., Filho, W.L., Singh, P., Scherle, N., Reiser, D., Telesford, J., Miljković, I.B., Havea, P.H., Li, C., Surroop, D., Kovaleva, M., (2021): Influences of Climate Change on Tourism Development in Small Pacific Island States. Sustainability 13, 4223. https://doi.org/10.3390/su13084223. 71-Government of Vanuatu. 2015. “Vanuatu Post Disaster Needs Assessment: Tropical Cyclone Pam, March 2015.” Port Vila. Case Studies • Secretariat of the Pacific Regional Environment Programme (2019): Pacific Roadmap for Strengthened Climate
Services, 2021-2026. Apia, Samoa, 4pp. • Ministry of Marine Resources, and SPC Pacific Community (2012): “Cook Islands Aquaculture Development
Plan 2012-2016” Noumea. • Shuler, C.K., & Comeros-Raynal, M. (2020): Ridge to Reef Management Implications for the Development of an
Open-Source Dissolved Inorganic Nitrogen Loading Model in American Sāmoa. Environmental Management, 66(3), 498- 515. https://doi.org/10.1007/s00267-020-01314-4.
• Shuler, C.K., Brewington, L., & El-Kadi, A.I. (2021): A participatory approach to assessing groundwater recharge under future climate and land-cover scenarios, Tutuila, American Sāmoa. Journal of Hydrology: Regional Studies, 34: 100785. https://doi.org/10.1016/j.ejrh.2021.100785
Copyright © 2022 FDOKUMEN