Are the Pacific Islands Ready for a Currency Union? An Empirical Study of Degree of Economic...
18
Downloaded By: [[email protected]] At: 22:10 27 September 2007 Journal of the Asia Pacific Economy Vol. 12, No. 4, 504–521, November 2007 Are the Pacific Islands Ready for a Currency Union? An Empirical Study of Degree of Economic Convergence T. K. JAYARAMAN, ∗ B. D. WARD ∗∗ & Z. L. XU ∗∗ ∗ The University of the South Pacific, Suva, Fiji Islands ∗∗ Lincoln University, New Zealand ABSTRACT During the 2003 Annual meeting of Pacific Forum leaders from the 16 member states (14 Pacific Islands and two advanced countries in the region, namely Australia and New Zealand) held in Auckland, an idea of a single currency for the region was mooted. The single currency was indicated to be the Australia dollar. The success of any efforts for achieving such a form of integration depends on the degree of economic convergence of national economies. There are two aspects of convergence: nominal and real. They cover exchange rates, growth rates and inflation rates. Unless there is a high degree of convergence in these spheres, the costs of any premature integration could be disastrous. The objective of this paper is to investigate whether there exists any case at present for a currency union. The paper undertakes an empirical investigation, reports the results and presents some conclusions. KEY WORDS: Common currency, economic convergence, Pacific islands, Kalman filter, econo- metrics JEL CLASSIfiCATIONS: C32, F36, F42 Introduction The 2003 Annual Meeting of Pacific Forum leaders from the 16 member states (14 Pacific Islands and two metropolitan countries, namely Australia and New Zealand, also known as Forum States), held in Auckland, New Zealand, focused attention on the subject of regional economic integration with the possible adoption of a single currency for the region. The suggested common currency was the Australian dollar. The idea of a single currency was floated soon after the ratification by Pacific Forum countries of two agreements: the Pacific Agreement on Closer Economic Cooperation (PACER) among all the 16 member countries and the Pacific Island Countries Trade Agreement (PICTA). The latter aims at a phased dismantling of all existing trade Correspondence Address: B.D. Ward, Commerce Division, Lincoln University, PO Box 84, New Zealand. Email: [email protected] ISSN 1354–7860 Print/1469–9648 Online /07/040504–18 C 2007 Taylor & Francis DOI: 10.1080/13547860701594160
-
Upload
lincoln-nz -
Category
Documents
-
view
1 -
download
0
Transcript of Are the Pacific Islands Ready for a Currency Union? An Empirical Study of Degree of Economic...
Dow
nloa
ded
By:
[war
db@
linco
ln.a
c.nz
] At:
22:1
0 27
Sep
tem
ber 2
007
Journal of the Asia Pacific EconomyVol. 12, No. 4, 504–521, November 2007
Are the Pacific Islands Ready for aCurrency Union? An Empirical Study ofDegree of Economic Convergence
T. K. JAYARAMAN,∗ B. D. WARD∗∗ & Z. L. XU∗∗∗The University of the South Pacific, Suva, Fiji Islands∗∗Lincoln University, New Zealand
ABSTRACT During the 2003 Annual meeting of Pacific Forum leaders from the 16 memberstates (14 Pacific Islands and two advanced countries in the region, namely Australia and NewZealand) held in Auckland, an idea of a single currency for the region was mooted. The singlecurrency was indicated to be the Australia dollar. The success of any efforts for achieving sucha form of integration depends on the degree of economic convergence of national economies.There are two aspects of convergence: nominal and real. They cover exchange rates, growthrates and inflation rates. Unless there is a high degree of convergence in these spheres, the costsof any premature integration could be disastrous. The objective of this paper is to investigatewhether there exists any case at present for a currency union. The paper undertakes an empiricalinvestigation, reports the results and presents some conclusions.
KEY WORDS: Common currency, economic convergence, Pacific islands, Kalman filter, econo-metrics
JEL CLASSIfiCATIONS: C32, F36, F42
Introduction
The 2003 Annual Meeting of Pacific Forum leaders from the 16 member states (14Pacific Islands and two metropolitan countries, namely Australia and New Zealand,also known as Forum States), held in Auckland, New Zealand, focused attention onthe subject of regional economic integration with the possible adoption of a singlecurrency for the region. The suggested common currency was the Australian dollar.
The idea of a single currency was floated soon after the ratification by Pacific Forumcountries of two agreements: the Pacific Agreement on Closer Economic Cooperation(PACER) among all the 16 member countries and the Pacific Island Countries TradeAgreement (PICTA). The latter aims at a phased dismantling of all existing trade
Correspondence Address: B.D. Ward, Commerce Division, Lincoln University, PO Box 84, New Zealand.Email: [email protected]
ISSN 1354–7860 Print/1469–9648 Online /07/040504–18 C© 2007 Taylor & FrancisDOI: 10.1080/13547860701594160
Dow
nloa
ded
By:
[war
db@
linco
ln.a
c.nz
] At:
22:1
0 27
Sep
tem
ber 2
007
Are the Pacific Islands Ready for a Currency Union? 505
restrictions on each other’s imports by 14 island countries over the next ten yearstowards a free trade area amongst themselves. As the birth of the euro, the singlecurrency for 12 European countries in 1999, was preceded by similar efforts, whichwere accompanied by factor mobility and a strong sense of political commitment, thesigning of PACER and PICTA raised high expectations in the Pacific region.
A common currency is expected to bring about gains to the 14 Pacific Islandcountries (PICs) through elimination of currency conversion costs, thereby reduc-ing currency transaction costs on products and services as well as costs associatedwith exchange rate fluctuations. The theory of optimum currency area (OCA) indi-cates that the gains would be greater, the greater the volume of intra-trade (Mundell,1961). The intra-trade volume among the 14 PICs has, however, been found negligible(Jayaraman, 2001). Since PICs trade a great deal with Australia, gains from adoptingthe Australian dollar are likely to be substantial. Studies (de Brouwer, 2000; Jayara-man, 2003) showed that a currency union between PICs without Australia would notresult in as many gains as would result from a larger sized union with Australia. Fur-ther, there are uncertainties regarding the sharing of seignorage revenue by Australiawith PICs. Furthermore, there are no indications as to whether the Reserve Bank ofAustralia would be prepared to act as a lender of last resort to commercial banks incrises in PICs (Jayaraman, 2004).
The PICs in the process of forming a currency union either amongst themselvesor with Australia have to surrender their monetary sovereignty as they have to abideby a common set of monetary policies. This requires the presence of a high degreeof similarity in the shocks they have been experiencing (Mundell, 1961). Countriesexperiencing common external shocks would be better suited to a currency unionbecause it permits the use of union-wide policies to correct any imbalances, includingthe adjustment of the common currency. Since the currency union would have a singlemonetary policy, the more asymmetric the external shocks, the greater would be therisk to the stability of the union. Countries are less likely to face large asymmetricterms of trade shocks if they have similar structures (Masson & Pattillo, 2001a, 2001b).
Most of the adverse effects of asymmetric shocks, including increases in unemploy-ment and declines in income, would be reduced if there were downward flexibility inprices and wages (Soltwedel et al. 2000). In the absence of such downward flexibil-ity, the presence of considerable mobility of labour between member countries wouldbe a great help. Additionally, if the monetary union builds in some provision for amechanism of fiscal transfer to redistribute income or compensate for differences inunemployment between member countries, the asymmetry of shocks will be less of aproblem (Masson & Pattillo, 2001a, 2001b; de Brouwer, 2000; McKinnon, 1963; Ke-nen, 1969). With the possibilities of migration from PICs to Australia and fiscal trans-fers looking rather uncertain at this stage, it is at least worthwhile to check whetherPICs and the two advanced countries of the region – namely Australia and NewZealand – have been experiencing symmetrical shocks so as to emerge as suitable can-didate countries for forming a currency union, since a single currency imposes severe
Dow
nloa
ded
By:
[war
db@
linco
ln.a
c.nz
] At:
22:1
0 27
Sep
tem
ber 2
007
506 T. K. Jayaraman et al.
restrictions. The latter include adoption of a single legal tender for all member coun-tries with common monetary and exchange rate policies administered by one commoncentral bank, replacing all the existing individual central banks (Mundell, 1961; IMF,1997, 2001). The success of any ongoing efforts for achieving such a form of integra-tion depends on the degree of economic convergence of national economies. A high de-gree of convergence would mean that both external and domestic shocks were affectingall member countries in a similar fashion and that a union-wide, common set of policieswould, therefore, be appropriate. If the shocks were asymmetric, a common set of poli-cies would be the least desirable, as inability to use the exchange rate for making neces-sary adjustments would result in greater volatility in output and employment (Bayoumi& Ostry, 1997; Brash, 2000). There are two aspects of convergence: nominal and real.They cover exchange rates, growth and inflation. In the absence of a high degree of con-vergence in these spheres, the costs of any premature integration could be disastrous.
The objective of this paper is to investigate whether the Pacific island countrieseither with the two metropolitan countries or on their own, as a sub-group, exhibitany economic convergence and whether there exists any case at present for a currencyunion. The rest of the paper is organized into three sections. The next section dealswith the methodology adopted for the study; the section after reports the results andthe final section presents the conclusions.
Methodology
As Hall et al. (1992) observe, the study of convergence is concerned with relativelong-run behaviour of a number of time series. As time series of economic data aregenerally non-stationary, for convergence, differences between the series do not haveinfinite variances, that is, they do not drift indefinitely far apart. If two non-stationarytime series are not cointegrated, then they cannot converge. Hall et al. (1992) cautionus that testing for cointegration of the series is a necessary condition but not a sufficientone under all definitions of convergence. For example, convergence of exchange ratesmeans there exist n-1 cointegrating relations of n currencies, consisting of pairs ofexchange rates.
First, however, we consider a simple test for convergence based on the OLS resultsfrom a set of static linear regressions of the general form:
[X A − X B]t = a + b[X A − XC )t + et (1)
where X Aand X B are the logarithms of two series that we wish to consider for conver-gence, and another relevant series (explained below) is denoted XC, In equation (1), ifb = 0 then the difference between X A and X B approaches the constant a, indicatingthat the two series converge. Hence, a non-zero value for b implies that the series inquestion do not converge amongst themselves. On the other hand, the special casewhere b = 1 implies that a convergence between X B and the XC series.
Dow
nloa
ded
By:
[war
db@
linco
ln.a
c.nz
] At:
22:1
0 27
Sep
tem
ber 2
007
Are the Pacific Islands Ready for a Currency Union? 507
In this study we use equation (1) for investigating convergence in nominal exchangerates (SDR), inflation, real effective exchange rates and real GDP growth rates forfinding out whether the island countries and New Zealand are ready to form a currencyunion. The X A series represent those of Australia, X B those of island countries andNew Zealand, and XC those of the United States. The nominal exchange rates areSDR units per unit of the currency of the country concerned and, in the case of RealEffective Exchange Rates (REER), they are the indices reported in the InternationalFinancial Statistics of IMF. We let X B represent, successively, Fiji, New Zealand(NZ), Papua New Guinea (PNG), Samoa (SAM), the Solomon Islands (SOL), Tonga(TON) and Vanuatu (VAN). However, for the REER series, Tonga and Vanuatu areexcluded due to lack of data. All empirical results are presented in the next section.
Notice thatequation (1) depicts a static model, having constant parameters throughtime. However, since convergence of exchange rates, growth rates and inflation amongthe prospective member countries is a gradual and ongoing process, it seems morereasonable to allow for some dynamic adjustments in the form of time varying pa-rameters. Hence we follow Hall et al. (1992), Haldane & Hall (1991) and Kendall(2000) and incorporate dynamic adjustments by formulating a model with time vary-ing parameters:
[X A − X B](t) = a(t) + b(t)[X A − XC )(t) + e(t) (2)
Hall et al. (1992) convincingly show that model (2) may reject convergence in twodistinct ways. First, if b(t) is different from zero, we reject convergence on the factthat the relationship between X A and X B is affected by the relationship between X A
and XC . This is a specific alternative. However the possibility would exist that X A
and X B are drifting apart from each other; and neither of them remains affected byXC . This possibility is covered by the a(t) parameter, which might be regarded asthe other general alternative. If X A and X B are unaffected by the specific alternative,but nonetheless have not converged, then the parameter a(t) will proxy the unknowntrue alternative explanation of the movement in X A and X B and a(t) will be a non-stationary process reflecting the non-convergence of X A and X B , Therefore, the dualrequirement for convergence is both a(t) tend to a constant and b(t) tend to zero.
While measuring convergence in the European Community economies on the linesoutlined above, Hall et al. (1992) apply the Kalman Filter to estimate time varyingcoefficients for a(t) and b(t). The above procedure was also adopted by Kendall (2000)in his study on exchange rate convergence in the Caribbean Economic Community(CARICOM), and will be used in this paper.
The Kalman Filter was introduced in Kalman (1960) and its first appearance ineconomics appears to be Rosenberg (1968). A Kalman Filter model comprises twoparts, namely:
1. one or more state or transition equations, which describe the evolution of a set ofunobserved variables, the state variables, over time; and
Dow
nloa
ded
By:
[war
db@
linco
ln.a
c.nz
] At:
22:1
0 27
Sep
tem
ber 2
007
508 T. K. Jayaraman et al.
2. a measurement or observation equation, which describes how well the actuallyobserved data are generated from the state variables.
In this paper the state variables are the time-varying regression parameters [a(t)and b(t)] to be estimated. Hence for each of the four variables of interest we formulatethe following state space model:
[X A − X B](t) = a(t) + b(t)[X A − XC )(t) + et (3)
a(t) = a(t)−1 + v1t (4)
b(t) = b(t)1 + v2t (5)
For each of the four variables, equation (3) depicts the measurement or observationequation whereas equations (4) and (5) are the state or transition equations. Followingusual practice, we assume that the three error terms (et , v1t and v2t ) are all distributednormally with zero mean, constant variance with no serial correlation, and indepen-dent of each other. Under these assumptions the maximum likelihood estimators ofthe parameters represent an ‘optimal solution’ (Harvey, 1981, pp. 104–105; see alsoCuthbertson et al., 1992, Chapter 7).
Results
Constant-parameter Models
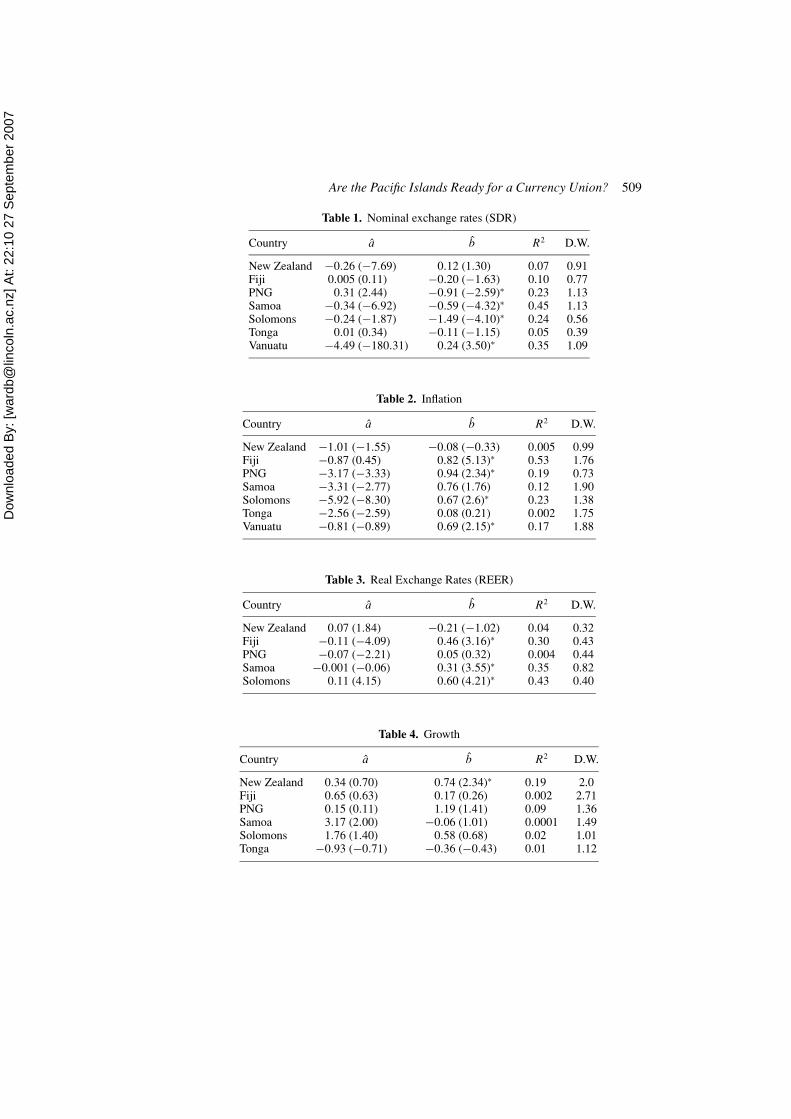
First, estimating the series of equations in the form of equation (1), we test the nullhypotheses that b j = 0 (no convergence) against a two-sided alternative. The resultsare collected in Tables 1–4.
OLS Results for equation (1) for XA = Australia
Figures in parentheses are the t-statistics for testing the null that the parameter is zero.The two-tailed 10 percent, 5 percent and 1 percent critical values are 1.714, 2.069and 2.807, respectively. An * indicates rejection of H0: b j = 0 (convergence) at the5 percent significance level.
According to visual inspection of these tables, at 5 percent significance level, forSDR series, we reject the null hypothesis of convergence for PNG, Samoa, Solomonsand Vanuatu. For the Inflation series, convergence for Fiji, PNG, Solomons and Van-uatu is rejected, and convergence for Fiji, Samoa and Solomons is rejected for realexchange rate series. As for Growth, only New Zealand is rejected at the 5 percentsignificance level.
In short, results from the constant parameter models do not provide evidence insupport of convergence amongst the economies of concern. Before drawing finalconclusions on this question, however, we need to consider the evidence from thetime-varying parameter models.
Dow
nloa
ded
By:
[war
db@
linco
ln.a
c.nz
] At:
22:1
0 27
Sep
tem
ber 2
007
Are the Pacific Islands Ready for a Currency Union? 509
Table 1. Nominal exchange rates (SDR)
Country a b R2 D.W.
New Zealand −0.26 (−7.69) 0.12 (1.30) 0.07 0.91Fiji 0.005 (0.11) −0.20 (−1.63) 0.10 0.77PNG 0.31 (2.44) −0.91 (−2.59)∗ 0.23 1.13Samoa −0.34 (−6.92) −0.59 (−4.32)∗ 0.45 1.13Solomons −0.24 (−1.87) −1.49 (−4.10)∗ 0.24 0.56Tonga 0.01 (0.34) −0.11 (−1.15) 0.05 0.39Vanuatu −4.49 (−180.31) 0.24 (3.50)∗ 0.35 1.09
Table 2. Inflation
Country a b R2 D.W.
New Zealand −1.01 (−1.55) −0.08 (−0.33) 0.005 0.99Fiji −0.87 (0.45) 0.82 (5.13)∗ 0.53 1.76PNG −3.17 (−3.33) 0.94 (2.34)∗ 0.19 0.73Samoa −3.31 (−2.77) 0.76 (1.76) 0.12 1.90Solomons −5.92 (−8.30) 0.67 (2.6)∗ 0.23 1.38Tonga −2.56 (−2.59) 0.08 (0.21) 0.002 1.75Vanuatu −0.81 (−0.89) 0.69 (2.15)∗ 0.17 1.88
Table 3. Real Exchange Rates (REER)
Country a b R2 D.W.
New Zealand 0.07 (1.84) −0.21 (−1.02) 0.04 0.32Fiji −0.11 (−4.09) 0.46 (3.16)∗ 0.30 0.43PNG −0.07 (−2.21) 0.05 (0.32) 0.004 0.44Samoa −0.001 (−0.06) 0.31 (3.55)∗ 0.35 0.82Solomons 0.11 (4.15) 0.60 (4.21)∗ 0.43 0.40
Table 4. Growth
Country a b R2 D.W.
New Zealand 0.34 (0.70) 0.74 (2.34)∗ 0.19 2.0Fiji 0.65 (0.63) 0.17 (0.26) 0.002 2.71PNG 0.15 (0.11) 1.19 (1.41) 0.09 1.36Samoa 3.17 (2.00) −0.06 (1.01) 0.0001 1.49Solomons 1.76 (1.40) 0.58 (0.68) 0.02 1.01Tonga −0.93 (−0.71) −0.36 (−0.43) 0.01 1.12
Dow
nloa
ded
By:
[war
db@
linco
ln.a
c.nz
] At:
22:1
0 27
Sep
tem
ber 2
007
510 T. K. Jayaraman et al.
Time Varying Parameter Models
Prior to estimating the Kalman Filter models, it is important that we investigate thetime series properties of the data by conducting tests for integration and cointegration.
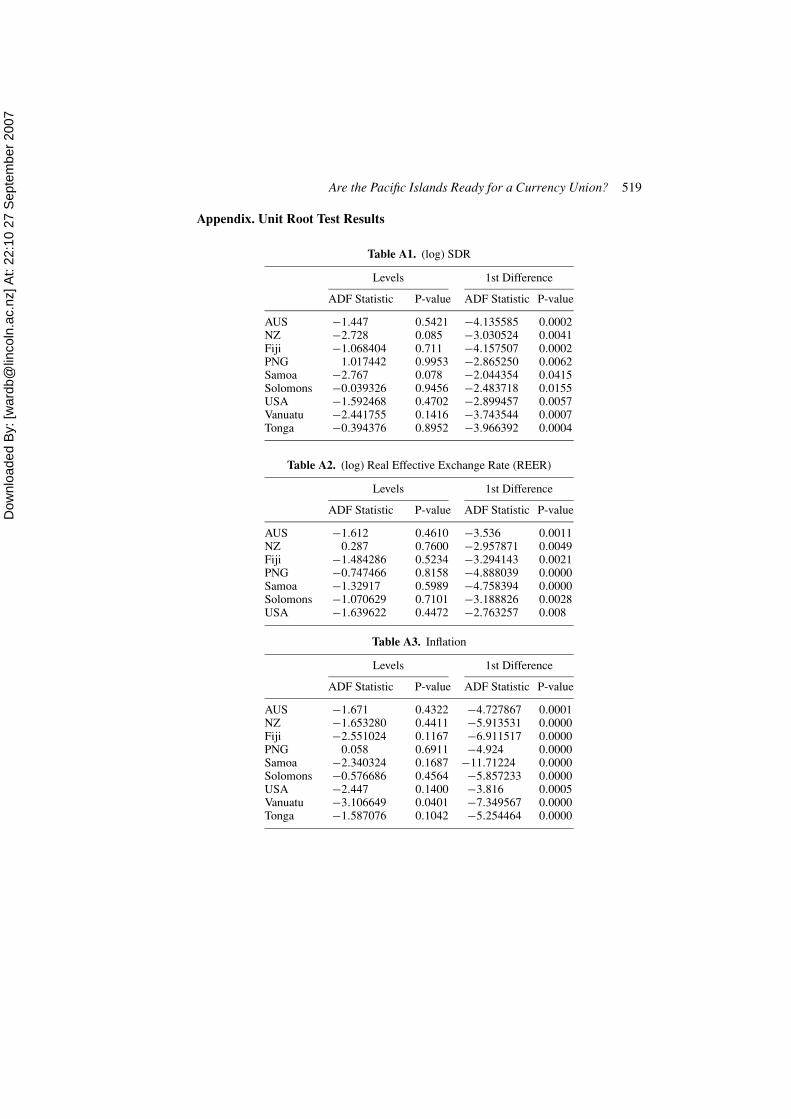
The results of the Augmented Dickey Fuller (ADF) unit root tests for integrationare presented in the Appendix in Tables A1 to A4. In each case the augmentinglag lengths were chosen with the Hannan-Quinn selection criterion, starting withmaximum length of two lags. For the ‘levels’ tests the ADF test equations includeda constant but not trend term, except for New Zealand REER and Inflation forPNG, which did not include either term (based on visual inspection of the t-plots).For the ‘1st difference’ tests both deterministic terms were excluded for allseries.
These results, which were obtained in EViews 5.1, may be summarized as follows.For the two exchange rate series (SDR and REER), at conventional significance levels,the tests indicate that the series are integrated to order 1 (i.e. X ∼ I(1)) for all countries.Moreover, with the possible exception of Vanuatu, the tests strongly suggest that theseries are all I(1). However, for Vanuatu, the null of I(1) would only be marginallyrejected at the 5 percent significance level, and there is no economic reason to expectthat country’s inflation to differ from its neighbours. Hence, we judge that the Inflationseries is non-stationary for all the countries.
For the growth series, on the other hand, the results shown in Table A4 clearlyindicate that the unit root null hypothesis is rejected for each country straight awayin ‘levels’. These findings are corroborated by visual inspection of the t-plots, whichdid not indicate evidence of trends of any sort.
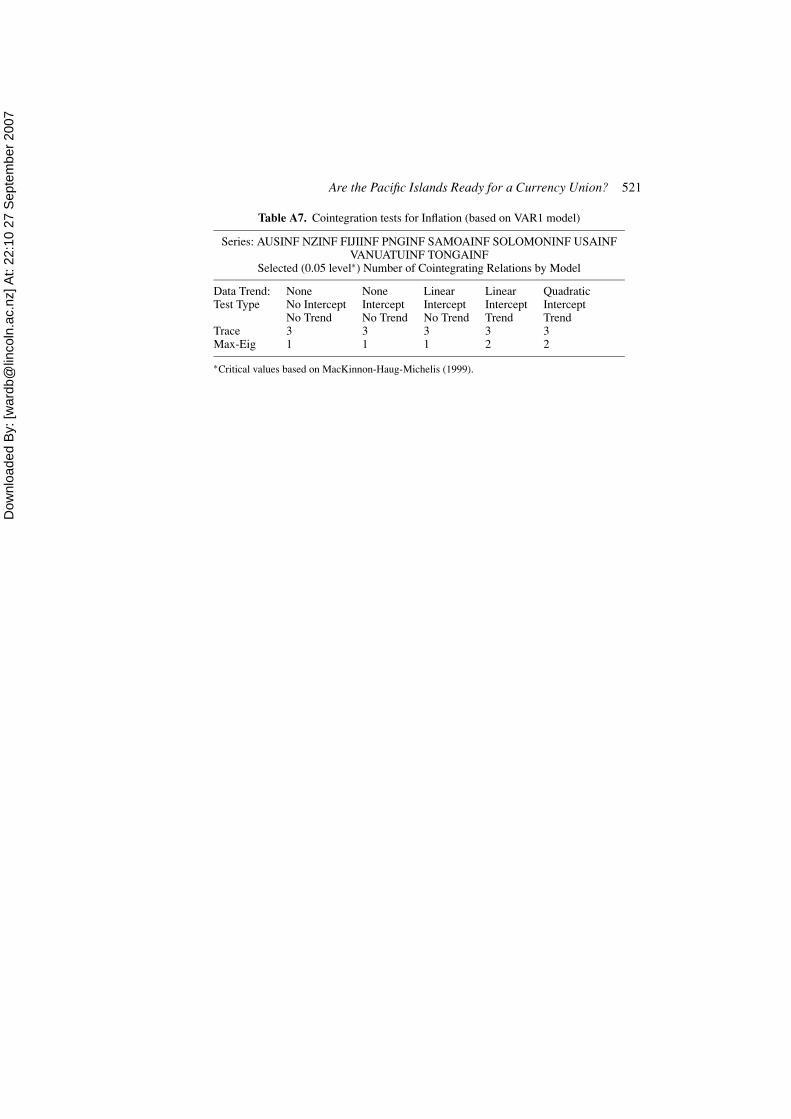
Before examining the series directly for evidence of convergence, a further pre-liminary step in the analysis is required. That is, Hall et al. (1992) reasoned that anecessary, but not sufficient, condition for convergence is that the I(1) series be coin-tegrated. Hence, our next step is to carry out Johansen maximum Likelihood tests forthe presence of cointegrating relations amongst SDR, REER and Inflation. The mainresults of these tests are presented in summary form in Appendix Tables A5–A7.These tests were performed on a set of VAR(1) models, where the unit lag lengthswere selected according to the multivariate version of the Hannan-Quinn criterion.
In short, the results form both tests (Trace and Max-Eigenvalue) indicate that thereis at least one cointegrating relation for each of the three I(1) series, irrespective ofthe model specification. This provides evidence that the series may have a long runtendency toward convergence, given that cointegration is a necessary but not sufficientcondition for convergence.
However, before reaching any definite conclusions it is necessary to estimate aKalman Filter model for each series, again using EViews 5.1 software. For eachcountry, the relevant estimates of the varying parameters for the SDR, inflation, REERand growth equations are displayed visually in chart form in Figures 1–4. (Numericaldetails are available on request.)

Dow
nloa
ded
By:
[war
db@
linco
ln.a
c.nz
] At:
22:1
0 27
Sep
tem
ber 2
007
Are the Pacific Islands Ready for a Currency Union? 511
Figure 1. State variable coefficients [b(t)] for SDR.
Figure 2. State variable coefficients [b(t)] for REER.
Dow
nloa
ded
By:
[war
db@
linco
ln.a
c.nz
] At:
22:1
0 27
Sep
tem
ber 2
007
512 T. K. Jayaraman et al.
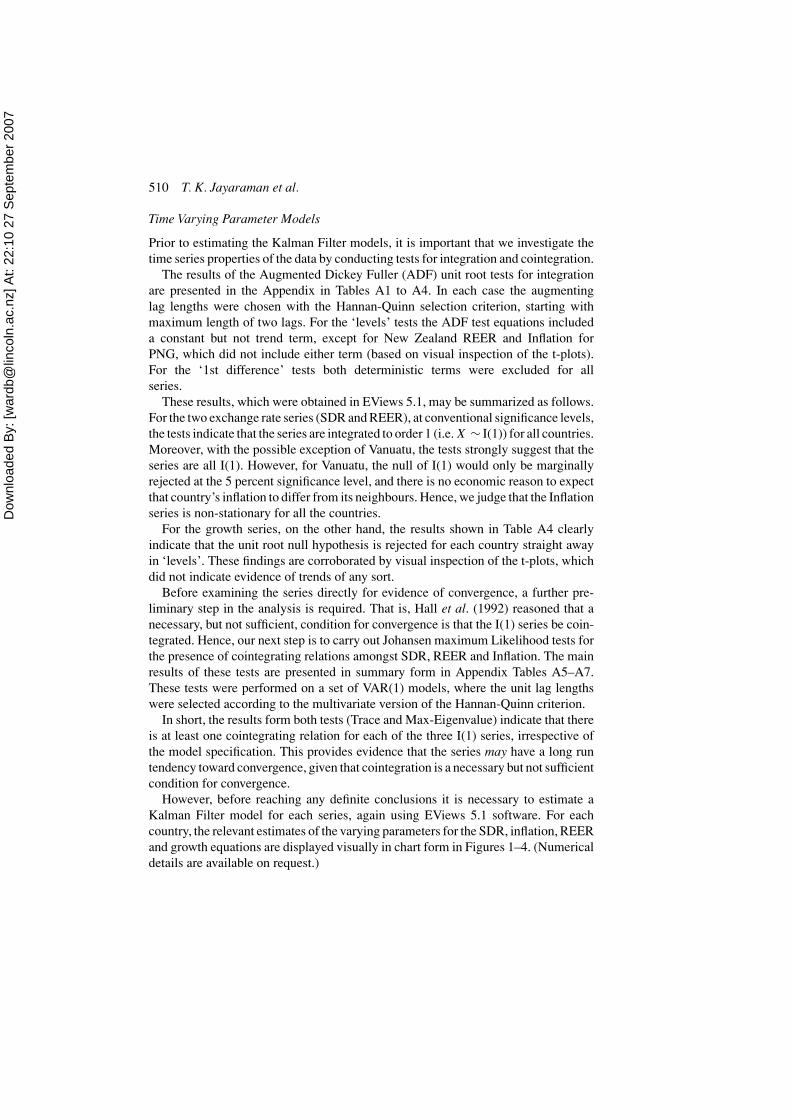
Figure 3. State variable coefficients [b(t)] for inflation.
According to Figure 1 there seems to be an emerging convergence in nominalexchange rates (SDR per units of national currencies) in recent years, the referencecountry being Australia. This is especially so with regard to those of New Zealandand PNG, given that the earlier fluctuations in both series dampen and they convergetowards zero. There is no indication, however, that the b(t) parameters for theremaining five countries are converging on zero at all.
As regards convergence in the other nominal variable, namely inflation, Figure 3reveals that there is a much higher degree of convergence in the later half of the 1990samong all the countries. Figures 2 and 4 relate to real variables, namely real effectiveexchange rate (REER) indices and growth rates. As de Brouwer (2000) pointed out,REERs are endogenous prices determined by domestic and external prices, whichreflect interaction of both domestic fiscal and monetary policies. Convergence inREERs signifies convergence in the monetary and fiscal policies of the prospectivemembers of the currency union. Figure 2 shows although there has been a notabledegree of convergence in the mid 1990s onwards, New Zealand and Fiji have not beendisplaying the common trend.
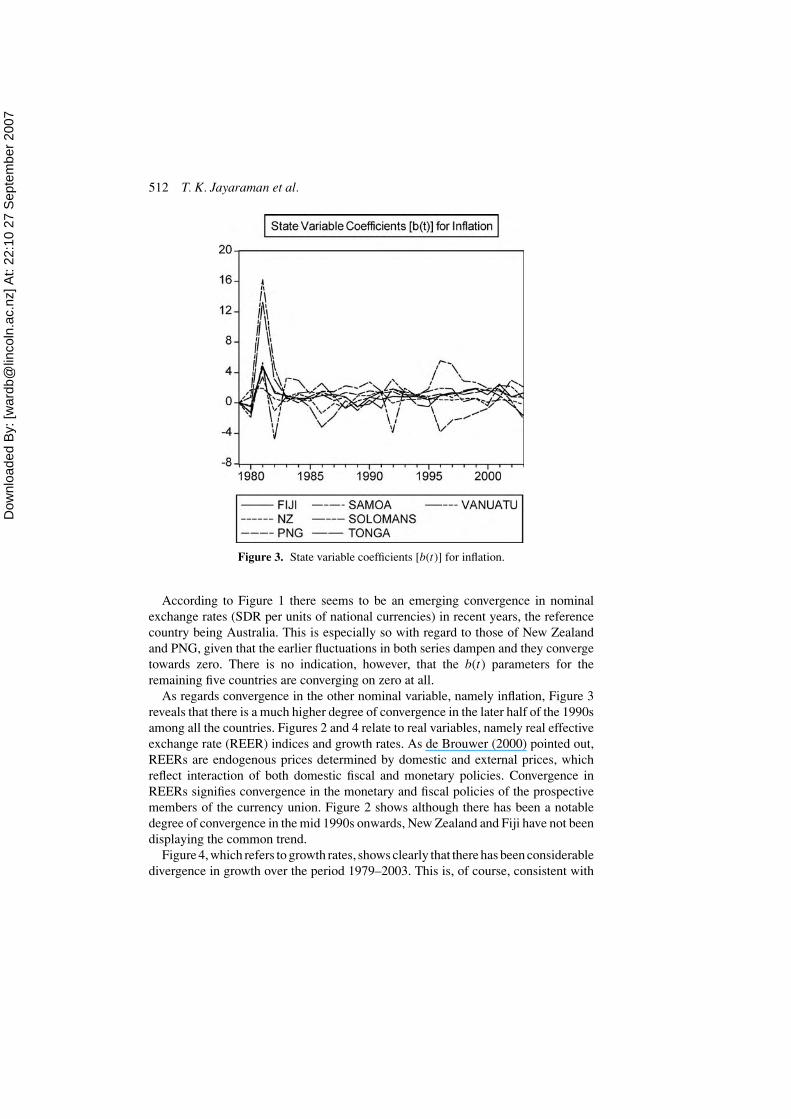
Figure 4, which refers to growth rates, shows clearly that there has been considerabledivergence in growth over the period 1979–2003. This is, of course, consistent with
Dow
nloa
ded
By:
[war
db@
linco
ln.a
c.nz
] At:
22:1
0 27
Sep
tem
ber 2
007
Are the Pacific Islands Ready for a Currency Union? 513
Figure 4. State variable coefficients [b(t)] for growth.
the results from the previous tests that the growth rates are not integrated, hencecannot be cointegrated.
Sub Group Economies
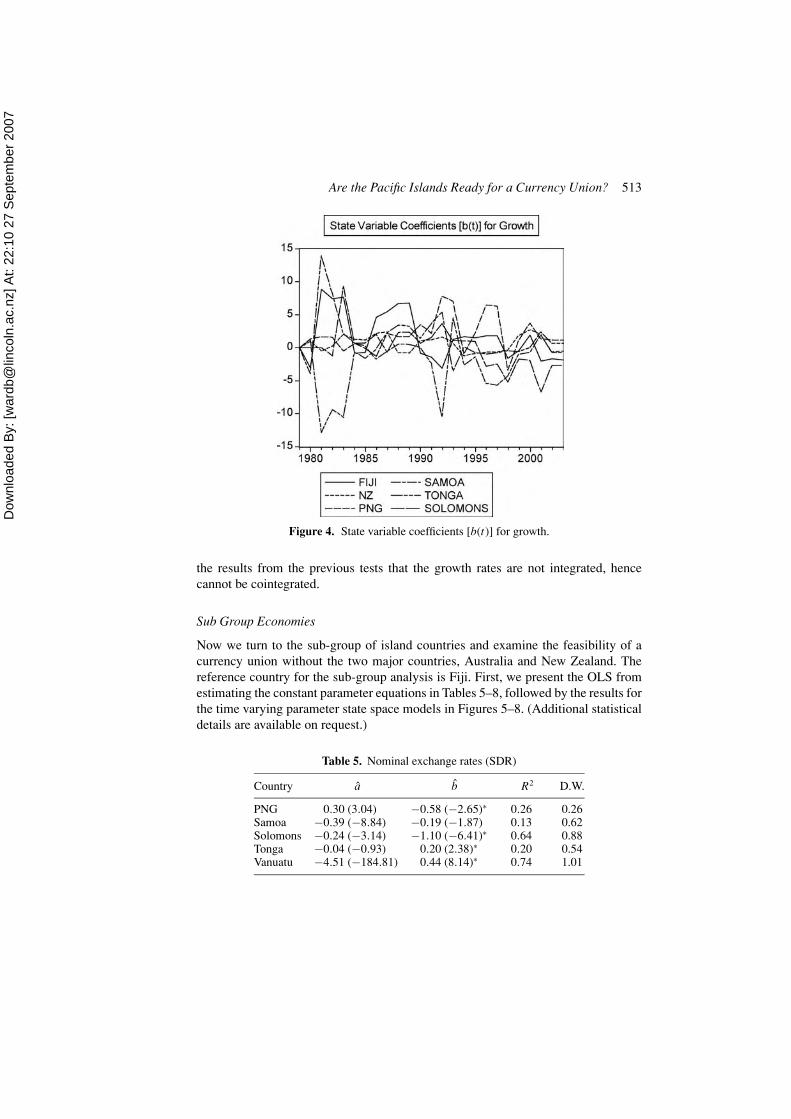
Now we turn to the sub-group of island countries and examine the feasibility of acurrency union without the two major countries, Australia and New Zealand. Thereference country for the sub-group analysis is Fiji. First, we present the OLS fromestimating the constant parameter equations in Tables 5–8, followed by the results forthe time varying parameter state space models in Figures 5–8. (Additional statisticaldetails are available on request.)
Table 5. Nominal exchange rates (SDR)
Country a b R2 D.W.
PNG 0.30 (3.04) −0.58 (−2.65)∗ 0.26 0.26Samoa −0.39 (−8.84) −0.19 (−1.87) 0.13 0.62Solomons −0.24 (−3.14) −1.10 (−6.41)∗ 0.64 0.88Tonga −0.04 (−0.93) 0.20 (2.38)∗ 0.20 0.54Vanuatu −4.51 (−184.81) 0.44 (8.14)∗ 0.74 1.01
Dow
nloa
ded
By:
[war
db@
linco
ln.a
c.nz
] At:
22:1
0 27
Sep
tem
ber 2
007
514 T. K. Jayaraman et al.
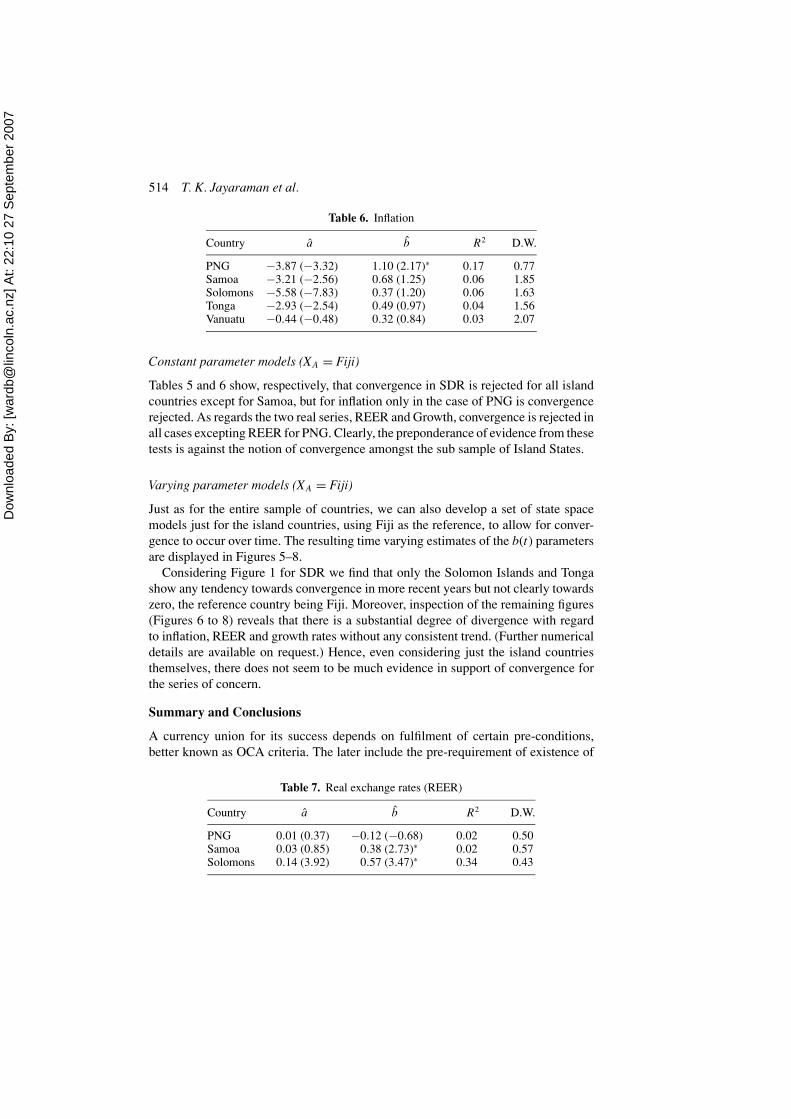
Table 6. Inflation
Country a b R2 D.W.
PNG −3.87 (−3.32) 1.10 (2.17)∗ 0.17 0.77Samoa −3.21 (−2.56) 0.68 (1.25) 0.06 1.85Solomons −5.58 (−7.83) 0.37 (1.20) 0.06 1.63Tonga −2.93 (−2.54) 0.49 (0.97) 0.04 1.56Vanuatu −0.44 (−0.48) 0.32 (0.84) 0.03 2.07
Constant parameter models (XA = Fiji)
Tables 5 and 6 show, respectively, that convergence in SDR is rejected for all islandcountries except for Samoa, but for inflation only in the case of PNG is convergencerejected. As regards the two real series, REER and Growth, convergence is rejected inall cases excepting REER for PNG. Clearly, the preponderance of evidence from thesetests is against the notion of convergence amongst the sub sample of Island States.
Varying parameter models (XA = Fiji)
Just as for the entire sample of countries, we can also develop a set of state spacemodels just for the island countries, using Fiji as the reference, to allow for conver-gence to occur over time. The resulting time varying estimates of the b(t) parametersare displayed in Figures 5–8.
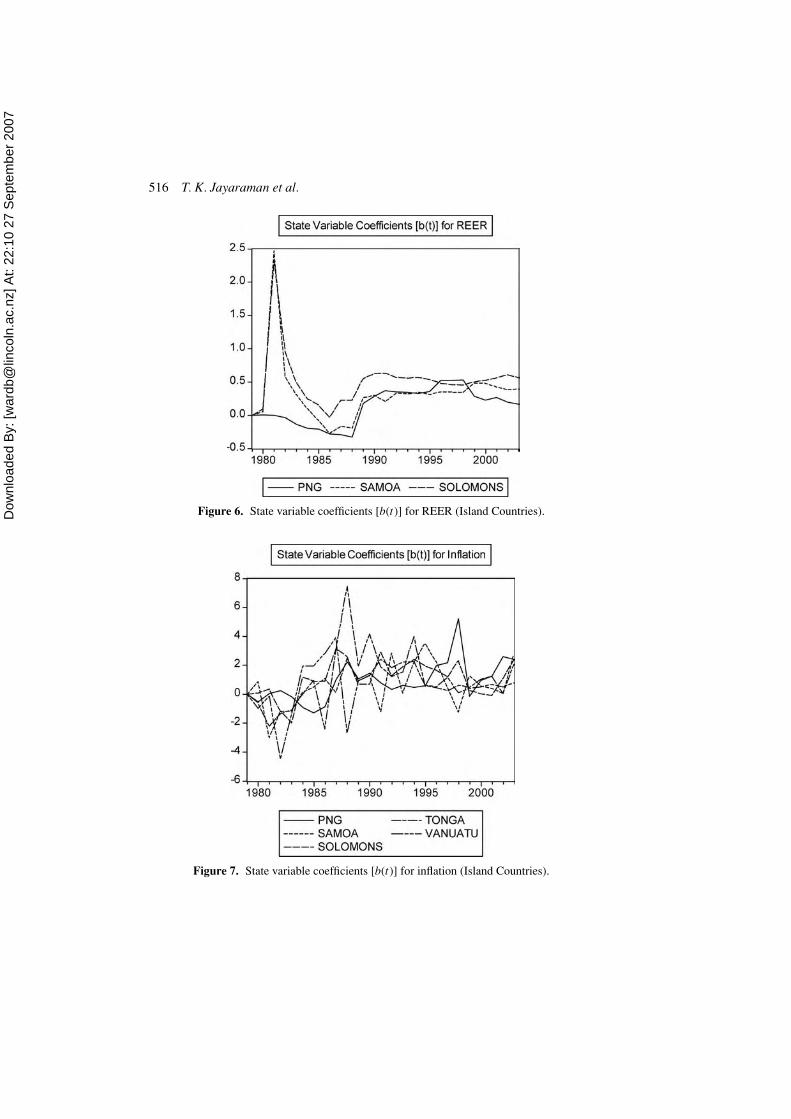
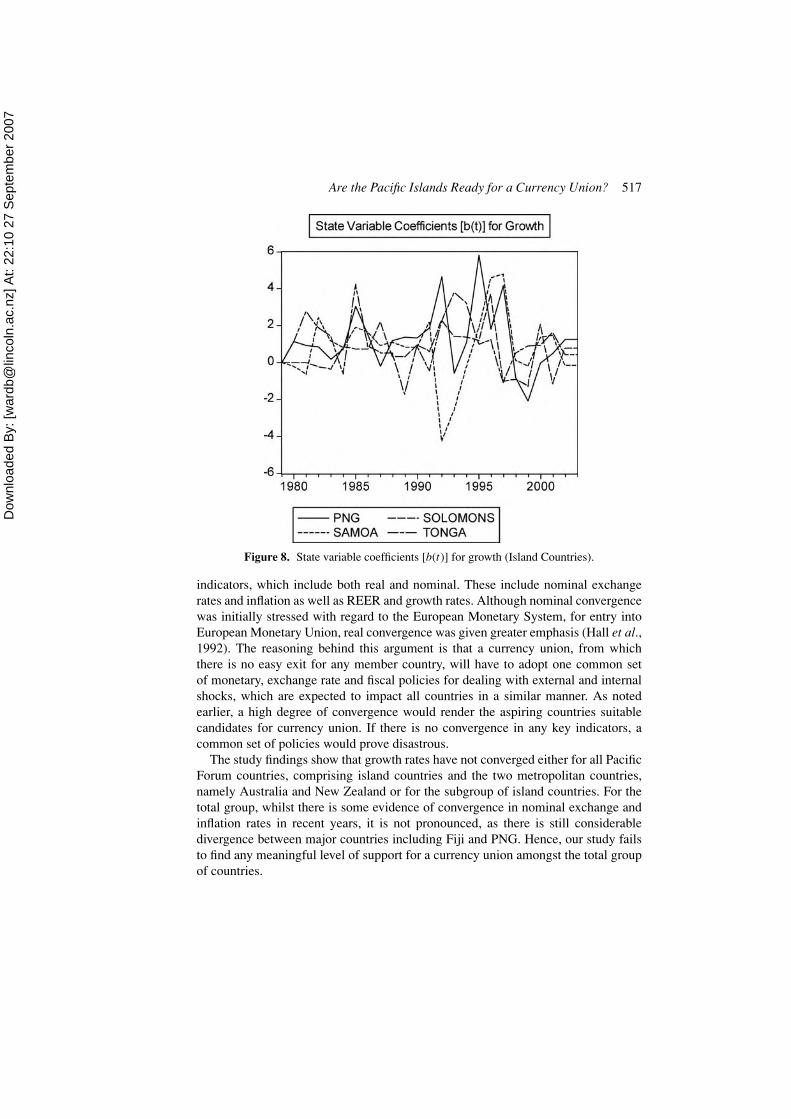
Considering Figure 1 for SDR we find that only the Solomon Islands and Tongashow any tendency towards convergence in more recent years but not clearly towardszero, the reference country being Fiji. Moreover, inspection of the remaining figures(Figures 6 to 8) reveals that there is a substantial degree of divergence with regardto inflation, REER and growth rates without any consistent trend. (Further numericaldetails are available on request.) Hence, even considering just the island countriesthemselves, there does not seem to be much evidence in support of convergence forthe series of concern.
Summary and Conclusions
A currency union for its success depends on fulfilment of certain pre-conditions,better known as OCA criteria. The later include the pre-requirement of existence of
Table 7. Real exchange rates (REER)
Country a b R2 D.W.
PNG 0.01 (0.37) −0.12 (−0.68) 0.02 0.50Samoa 0.03 (0.85) 0.38 (2.73)∗ 0.02 0.57Solomons 0.14 (3.92) 0.57 (3.47)∗ 0.34 0.43

Dow
nloa
ded
By:
[war
db@
linco
ln.a
c.nz
] At:
22:1
0 27
Sep
tem
ber 2
007
Are the Pacific Islands Ready for a Currency Union? 515
Table 8. Growth
Country a b R2 D.W.
PNG 0.16(0.13) 0.89(3.42)∗ 0.36 1.36Samoa 2.76(1.74) 0.88(2.76)∗ 0.27 1.43Solomons 1.41(1.16) 0.64(2.58)∗ 0.26 1.05Tonga −1.41(−1.03) 0.97(3.52)∗ 0.37 1.17
Figures in parentheses are the t-statistics for testing the null that the pa-rameter is zero. The two-tailed 10%, 5% and 1% critical values are 1.714,2.069 and 2.807, respectively. An ∗ indicates rejection of H0: b j = 0 (con-vergence) at the 5% significance level.
a very large volume of pre-union intra-trade amongst prospective members. Further,there should be a high degree of mobility within the union, especially in the absenceof downward wage and price flexibility coupled with fiscal transfers to mitigate theimpact of asymmetric shocks hitting the diverse economies. The adverse impactof shocks would be minimized if there were a high degree of convergence in key
Figure 5. State variable coefficients [b(t)] for SDR (Island Countries).
Dow
nloa
ded
By:
[war
db@
linco
ln.a
c.nz
] At:
22:1
0 27
Sep
tem
ber 2
007
516 T. K. Jayaraman et al.
Figure 6. State variable coefficients [b(t)] for REER (Island Countries).
Figure 7. State variable coefficients [b(t)] for inflation (Island Countries).
Dow
nloa
ded
By:
[war
db@
linco
ln.a
c.nz
] At:
22:1
0 27
Sep
tem
ber 2
007
Are the Pacific Islands Ready for a Currency Union? 517
Figure 8. State variable coefficients [b(t)] for growth (Island Countries).
indicators, which include both real and nominal. These include nominal exchangerates and inflation as well as REER and growth rates. Although nominal convergencewas initially stressed with regard to the European Monetary System, for entry intoEuropean Monetary Union, real convergence was given greater emphasis (Hall et al.,1992). The reasoning behind this argument is that a currency union, from whichthere is no easy exit for any member country, will have to adopt one common setof monetary, exchange rate and fiscal policies for dealing with external and internalshocks, which are expected to impact all countries in a similar manner. As notedearlier, a high degree of convergence would render the aspiring countries suitablecandidates for currency union. If there is no convergence in any key indicators, acommon set of policies would prove disastrous.
The study findings show that growth rates have not converged either for all PacificForum countries, comprising island countries and the two metropolitan countries,namely Australia and New Zealand or for the subgroup of island countries. For thetotal group, whilst there is some evidence of convergence in nominal exchange andinflation rates in recent years, it is not pronounced, as there is still considerabledivergence between major countries including Fiji and PNG. Hence, our study failsto find any meaningful level of support for a currency union amongst the total groupof countries.
Dow
nloa
ded
By:
[war
db@
linco
ln.a
c.nz
] At:
22:1
0 27
Sep
tem
ber 2
007
518 T. K. Jayaraman et al.
With regard to the sub-group of countries, the position is worse. There is a highdegree of divergence amongst nominal and real exchange rates, and there is no clearpattern of convergence in inflation. Further, there is total absence of convergence ingrowth rates. Thus, our study was not able to find any credible evidence to supportthe case for any currency union among the island countries.
References
Bayoumi, T. & Ostry, J.D. (1997) Macroeconomic shocks and trade flows within Sub-Saharan Africa:implications for optimum currency arrangements, Journal of African Economies, 6(5), pp. 412–444.
Brash, D. (2000) The Pros and Cons of Currency Union: A Reserve Bank Perspective. An address to theAuckland Rotary Club, 22 May 2000. http://www.rbnz.govt.nz/speeches/0091114.html.
de Brouwer, G, (2000) Should Pacific Island countries adopt the Australian dollar?, Pacific EconomicBulletin, 15(2), pp. 161–169.
Cuthbertson, K., Hall, S. & Taylor, M. (1992) Applied Econometric Techniques. (Oxford: Phillip Allan).Haldane, A.G & Hall, S.G. (1991) Sterling’s relationship with the Dollar and the Deutschmark: 1976-89,
Economic Journal, 101(406), pp. 436–443.Hall, S.G., Robertson, D. & Wickens, M.R. (1992) Measuring convergence of the EC economies, Manch-
ester School, LX (Supplement, June), pp. 99–111.Harvey, A.C. (1981) Time Series Models (Oxford: Phillip Allan).International Monetary Fund (IMF) (1997) Optimum Currency Areas: New Analytical and Policy Devel-
opments (Washington, DC: IMF).International Monetary Fund (IMF) (2001) International experience with common currency arrangements.
Paper presented at the Seminar on Common Currency Arrangements and the Exchange Rate Mech-anism in ASEAN, 6–7 August, Kuala Lumpur.
Jayaraman, T.K. (2001) Prospects for a currency union in the Pacific: a preliminary study, Journal of PacificStudies, 25(2), pp. 173–202.
Jayaraman, T.K. (2003) Is there a case for a single currency for the South Pacific Islands? Pacific EconomicBulletin, 18(1), pp. 41–53.
Jayaraman, T.K. (2004) A single currency for the Pacific Island countries: a stepwise approach, Asia PacificDevelopment Journal, 11(1), pp. 91–11.
Kalman, R.E. (1960) A new approach to linear filtering and prediction problems, Journal of Basic Engi-neering, 82, pp. 306–321.
Kendall, P. (2000) Exchange rate convergence in CARICOM, Social and Economic Studies, 49(2 & 3),pp. 139–165.
Kenen, P.B. (1969) The theory of optimum currency areas: an eclectic view, in: R. Mundell & A. Swoboda(eds) Monetary Problems of the International Economy, pp. 41–60 (Chicago: University of ChicagoPress).
Mackinnon, J.G., Haug, A.A. & Michelis, L. (1999) Numerical distribution functions of likelihood ratiotests for cointegration, Journal of Applied Econometrics, 14, pp. 563–577.
Masson, P. & Pattillo, C. (2001a) Monetary union in West Africa: an agency of restraint for fiscal policies,IMF Working Paper, WP/01/34 (Washington, DC: IMF).
Masson, P. & Pattillo, C. (2001b) Monetary union in West Africa (ECOWAS): is it desirable and how couldit be achieved, Occasional Paper No. 204 (Washington, DC: IMF).
McKinnon, R I, (1963) Optimum currency areas, American Economic Review, 53, pp. 717–724.Mundell, R. (1961) A theory of optimum currency areas, American Economic Review, 51, pp. 657–664.Rosenberg, B. (1968) An atomistic approach to linear regression, Berkeley Institute of Business and Eco-
nomic Research Working paper IP-137.Soltwedel, R., Dohse, D. & Krieger-Boden, C. (2000) EMU challenges to European labor markets, in:
World Economic Outlook: Supporting Studies, pp. 184–210, Chapter 3 (Washington, DC: IMF).
Dow
nloa
ded
By:
[war
db@
linco
ln.a
c.nz
] At:
22:1
0 27
Sep
tem
ber 2
007
Are the Pacific Islands Ready for a Currency Union? 519
Appendix. Unit Root Test Results
Table A1. (log) SDR
Levels 1st Difference
ADF Statistic P-value ADF Statistic P-value
AUS −1.447 0.5421 −4.135585 0.0002NZ −2.728 0.085 −3.030524 0.0041Fiji −1.068404 0.711 −4.157507 0.0002PNG 1.017442 0.9953 −2.865250 0.0062Samoa −2.767 0.078 −2.044354 0.0415Solomons −0.039326 0.9456 −2.483718 0.0155USA −1.592468 0.4702 −2.899457 0.0057Vanuatu −2.441755 0.1416 −3.743544 0.0007Tonga −0.394376 0.8952 −3.966392 0.0004
Table A2. (log) Real Effective Exchange Rate (REER)
Levels 1st Difference
ADF Statistic P-value ADF Statistic P-value
AUS −1.612 0.4610 −3.536 0.0011NZ 0.287 0.7600 −2.957871 0.0049Fiji −1.484286 0.5234 −3.294143 0.0021PNG −0.747466 0.8158 −4.888039 0.0000Samoa −1.32917 0.5989 −4.758394 0.0000Solomons −1.070629 0.7101 −3.188826 0.0028USA −1.639622 0.4472 −2.763257 0.008
Table A3. Inflation
Levels 1st Difference
ADF Statistic P-value ADF Statistic P-value
AUS −1.671 0.4322 −4.727867 0.0001NZ −1.653280 0.4411 −5.913531 0.0000Fiji −2.551024 0.1167 −6.911517 0.0000PNG 0.058 0.6911 −4.924 0.0000Samoa −2.340324 0.1687 −11.71224 0.0000Solomons −0.576686 0.4564 −5.857233 0.0000USA −2.447 0.1400 −3.816 0.0005Vanuatu −3.106649 0.0401 −7.349567 0.0000Tonga −1.587076 0.1042 −5.254464 0.0000

Dow
nloa
ded
By:
[war
db@
linco
ln.a
c.nz
] At:
22:1
0 27
Sep
tem
ber 2
007
520 T. K. Jayaraman et al.
Table A4. Growth Rates
Levels 1st Difference
ADF Statistic P-value ADF Statistic P-value
AUS −4.176945 0.0038 −5.840410 0.0000NZ −5.102120 0.0004 −6.284984 0.0000Fiji −8.124515 0.0000 −7.130312 0.0000PNG −3.164382 0.0363 −4.770177 0.0001Samoa −3.647078 0.0131 −5.747037 0.0000Solomons −2.716265 0.0093 −5.281024 0.0000Vanuatu −4.367988 0.0039 −6.454630 0.0000Tonga −1.869308 0.0599 −4.679207 0.0001USA −3.942071 0.0063 −7.280752 0.0000
Table A5. Cointegration tests for SDR (based on VAR1 model)
Series: LAUSSDR LNZSDR LFIJISDR LPNGSDR LSAMOASDRLSOLOMONSDR LUSASDR LVAUATUSDR LTONGASDR
Selected (0.05 level∗) Number of Cointegrating Relations by Model
Data Trend: None None Linear Linear QuadraticTest Type No Intercept Intercept Intercept Intercept Intercept
No Trend No Trend No Trend Trend TrendTrace 4 5 5 5 3Max-Eig 2 2 1 1 1
∗Critical values based on MacKinnon-Haug-Michelis (1999).
Table A6. Cointegration tests for REER (based on VAR1 model)
Series: LAUSREER LNZREER LPNGREER LSAMOAREERLSOLOMONREER LUSAREER
Selected (0.05 level∗) Number of CI Relations by Model
Data Trend: None None Linear Linear QuadraticTest Type No Intercept Intercept Intercept Intercept Intercept
No Trend No Trend No Trend Trend TrendTrace 1 1 1 1 1Max-Eig 1 1 1 1 1
∗Critical values based on MacKinnon-Haug-Michelis (1999).
Dow
nloa
ded
By:
[war
db@
linco
ln.a
c.nz
] At:
22:1
0 27
Sep
tem
ber 2
007
Are the Pacific Islands Ready for a Currency Union? 521
Table A7. Cointegration tests for Inflation (based on VAR1 model)
Series: AUSINF NZINF FIJIINF PNGINF SAMOAINF SOLOMONINF USAINFVANUATUINF TONGAINF
Selected (0.05 level∗) Number of Cointegrating Relations by Model
Data Trend: None None Linear Linear QuadraticTest Type No Intercept Intercept Intercept Intercept Intercept
No Trend No Trend No Trend Trend TrendTrace 3 3 3 3 3Max-Eig 1 1 1 2 2
∗Critical values based on MacKinnon-Haug-Michelis (1999).