Are Proposed African Monetary Unions Optimal Currency Areas? Real and Monetary Policy Convergence...
29
1 AFRICAN GOVERNANCE AND DEVELOPMENT INSTITUTE A G D I Working Paper WP/12/005 Are Proposed African Monetary Unions Optimal Currency Areas? Real and Monetary Policy Convergence Analysis Simplice A. Asongu African Governance and Development Institute, P.O. Box 18 SOA/ 1365 Yaoundé, Cameroon. E-mail: [email protected]
Transcript of Are Proposed African Monetary Unions Optimal Currency Areas? Real and Monetary Policy Convergence...

1
AFRICAN GOVERNANCE AND DEVELOPMENT
INSTITUTE
A G D I Working Paper
WP/12/005
Are Proposed African Monetary Unions Optimal Currency Areas? Real
and Monetary Policy Convergence Analysis
Simplice A. Asongu
African Governance and Development Institute,
P.O. Box 18 SOA/ 1365 Yaoundé, Cameroon.
E-mail: [email protected]

2
© 2012 African Governance and Development Institute WP/12/005
AGDI Working Paper
Research Department
Are Proposed African Monetary Unions Optimal Currency Areas? Real
and Monetary Policy Convergence Analysis
Simplice A. Asongu1
January 2012
Abstract
Purpose – A spectre is hunting embryonic African monetary zones: the EMU crisis. This
paper assesses real and monetary policy convergence within the proposed WAM and EAM
zones. The introduction of common currencies in West and East Africa is facing stiff
challenges in the timing of monetary convergence, the imperative of bankers to apply
common modeling and forecasting methods of monetary policy transmission, as well as the
requirements of common structural and institutional characteristics among candidate states.
Design/methodology/approach – In the analysis, monetary policy targets inflation and
financial dynamics of depth, efficiency, activity and size while real sector policy targets
economic performance in terms of GDP growth at macro and micro levels.
Findings – Findings suggest overwhelming lack of convergence: (1) initial conditions for
financial development are different across countries; (2) fundamental characteristics as
common monetary policy initiatives and IMF backed financial reform programs are
implemented differently across countries; (3) there is remarkable evidence of cross-country
variations in structural characteristics of macroeconomic performance; (4) institutional cross-
country differences could also be responsible for the deficiency in convergence within the
potential monetary zones.
Practical implications – As a policy implication, heterogeneous structural and institutional
characteristics across countries are giving rise to different levels and patterns of financial
intermediary development. Thus member states should work towards harmonizing cross-
country differences in structural and institutional characteristics that hamper the effectiveness
of convergence in monetary and real policies.
Originality/value – It is one of the few attempts to investigate the issue of convergence
within the proposed WAM and EAM unions.
JEL Classification: F15; F36; F42; O55; P52
Keywords: Currency Area; Convergence; Policy Coordination; Africa
1 Simplice A. Asongu is Lead economist in the Research Department of the AGDI ([email protected]).

3
1. Introduction
With much attention currently being placed on convergence criteria and preparedness
of the aspiring member states of embryonic African Monetary zones, candidate countries of
the West African Monetary Zone(WAMZ) have twice postponed the take –off for the single
currency. Bank experts in the up-coming East African Monetary Zone(EAMZ) fear that plans
for a common currency in 2012 may be too ambitious as central banks in the five countries
are given little time to prepare for the monetary union. These could be the result of the
European Monetary Union(EMU) crisis that has sent a strong signal to other common
currency regions on the goal of real and monetary policy convergence. A paramount lesson of
the EMU crisis is that serious disequilibria results from regional arrangements not designed to
be robust to a variety of shocks(Willet, 2010; Willett & Srisorn, 2011). In designing the
EMU, institutions’ almost exclusive concern was placed on mitigating crises caused by
financial sectors. The official stance of the German government today appears to remain that
failure of these safeguards is the predominant cause of the crisis. A position which can be
reasonably argued for Greece, although its loss of competiveness has also been a major factor.
Borrowing from AON(2012), today some experts asserts that knowledge is lacking in
several central banks in the EAMZ to implement reforms needed for a single currency region.
In a recent meeting, bankers agreed on the need for capacity-building in economic forecasting
and modeling among staff in order for them to be ready for the upcoming monetary union. A
report evaluating the capacities of each of the central banks found there were great needs for
training programs, especially in key modeling and forecasting methods as participants noted
great gaps in their usage. In an opening statement, Claver Gatete, Deputy Governor of the
Rwanda National Bank made it clear that the importance of economic modeling and
forecasting could not be underestimated2. In order to ensure timely and effective
2 He stressed these were key instruments in monetary policy formulation as well as a way of providing the
central bank with clear and efficient ways to assess trends and developments in domestic and external

4
implementation of the road map to a single currency in the WAMZ, the Convergence Council
has urged members states to pursue appropriate monetary and fiscal policies as well as
rigorous implementation of the structural and institutional policies under the ECOWAS
Multilateral Surveillance Mechanism, in order to achieve convergence and a durable
monetary union on a sustainable basis. Three issues result from these stylized facts: (1) the
need for monetary policy convergence; (2) the imperative of bankers to understand modeling
and forecasting methods in monetary policy transmission and; (3) the requirement of common
structural and institutional characteristics among members.
In this paper we examine the three issues by assessing real and monetary policy
convergence in the WAM and EAM zones. This work contributes to the current debate on
single currency unions by dissecting elements of macroeconomic and monetary policies into
financial intermediary dynamics(of depth, efficiency, activity and size), inflation and
economic performance. In so doing, it provides an in depth picture of the state of
convergence, the speed of convergence and the time required to achieved full convergence in
real and monetary policies. The rest of the paper is structured in the following manner.
Section 2 examines existing literature. Data and methodology are respectively presented and
discussed in Section 3. Empirical analysis, discussion and policy implications are covered in
Section 4. We conclude with Section 5.
2. Existing Literature
2.1 Motivations for convergence in the run-up to a monetary zone
Putting aside the premise of the EMU crisis highlighted above, the absence of studies
that focus on financial convergence in the African continent constitute a concrete motivation
for this paper. Though a number of studies have focused on financial market convergence
economies. “It is useful in monitoring where the economy stands and how to make short and long-term
projections in order to determine what monetary policy to follow. There is a need for a central bank to have a
clear understanding of its monetary transmission mechanisms”Gatete(AON,2012).

5
worldwide, the emphasis has often been on developed and the emerging economies of Latin
America and Asia. Borrowing from Alagidede(2008), such neglect is not unexpected as
African financial markets are viewed as too risky and little developed in operating and
institutional environmental settings. Political strife and economic instability have plagued
most African countries and continue to pose a significant threat to foreign investments and
private capital flows(Kenyan post election crises in 2007/2008, Zimbabwe’s economic
downturn, Nigeria’s marred transition in 2008, the unending Egyptian revolution and
currently Nigeria’s fuel subsidy related social unrest and threat of Islamic fundamentalism).
With very few exceptions(South Africa), African countries are yet to rise as emerging
economic powers. This might partly elucidate the relative lack of academic research on
financial convergence in the continent. Nay, in recent years Africa has witnessed significant
economic and financial developments; which has led to growing initiatives on common
currency unions.
Single currency unions are expected to provide gains in growth by favoring a breeding
atmosphere for competition and efficiency in the banking sector. These gains result from
price reductions in financial services which provide direct gains to customers and indirect
benefits through reduction of lending rates that favor investment(Weill, 2009). Financial
convergence is crucial in assessing the outcome of deregulation policies aimed at ameliorating
the performance and efficiency of the financial intermediary sector(Casu & Girardone, 2010).
Financial theory considers integrated markets to be relatively more efficient than divergent
ones. Thus an integrated financial intermediary market within a monetary zone improves
cross-border flow of funds, stimulates trading volume which in-turn improves liquidity.
Integrated banking markets provide investors with the opportunity of efficiently allocating
capital to economic operators(Chen et al., 2002). The ensuing effect is lower cost of capital
for firms and lower transaction cost for investors(Kim et al., 2005). Therefore when banks are

6
integrated within a single currency area, there are positive rewards to financial stability as it
diminishes the probability of asymmetric shocks(Umutlu et al., 2010). Financial stability in-
turn could attenuate the risk of cross-border financial contagion(Beine et al.,2010) and
augment the capacity of economies to absorb shocks(Yu et al., 2010).
The need for convergence in the banking sector within the WAM and EAM zones
draws on the tenets of arbitrage and hypothesis proffered by the portfolio theory. Dynamics of
financial intermediation converge to mirror the level of arbitrage activity. When they
converge, it implies a common momentum such as arbitrage activity is bringing the markets
together. This will reduce the potential for making above normal profits through international
diversification(Von Furstenberg & Jeon, 1989). In the same spirit, if deterrents or potential
barriers generating country risks and exchange rate premiums are absent, the consequence is
similar yields for financial assets of similar risk and liquidity regardless of locality and
nationality(Von Furstenberg & Jeon, 1989). Hence the motivations for convergence in
banking markets has premises on the literature of financial intermediary sector
interdependence and portfolio diversification(Grubel, 1968; Levy & Sarnat, 1970). A great
chunk of these papers have considered short-term links of stock markets and found the
presence of short-spell co-movements. Results which have been extended to long-run
financial market co-movements(Bessler & Yang, 2003).
As we have seen, the financial system exerts a significant influence on modern
economic literature debates(Scholtens & Naaborg, 2005). On a first note, the monetary policy
transmission mechanism’s effectiveness is contingent on the financial system(Bondt,2000).
Secondly, it is believed to affect channels through which finance is tied to economic
growth(Allen & Gale, 2000). Therefore, the financial system interacts with the economy by
producing information ex-ante about possible investments, monitoring of investments,

7
allocation of capital, facilitation of trade, diversification and management of risks,
mobilization and pooling of savings as well as easing of goods and services(Levine, 2004).
The above paragraph is important in the context of this paper because it points to how
and why assessing dynamics within a financial system could elucidate the three issues we
highlighted above that resulted from stylized facts. Plainly put, investigating convergence in
financial intermediary dynamics of depth, efficiency, activity and size within a financial
system on the one hand and calculating their corresponding speeds of convergence and time
required for full(100%) convergence on the other hand, addresses quite a number important
policy issues in the present debate over timing and monetary convergence of upcoming
African single currency zones. To complement monetary policies, this paper also examines
real policy convergence in terms of macroeconomic performance(GDP growth) and per
capita income growth.
2.1 Literature on the WAM and EAM zones
Literature pertaining to the WAM and EAM zones could be classified into two main
strands. While the first is dedicated to the later region, the second is focused on the former
region.
To the best of our knowledge only two empirical papers have been dedicated to the
EAMZ. Mkenda(2001) employ a Generalized Purchasing Power Parity(GPPP) model to
analyze the suitability of the EAC(East African Community) for a single currency union. The
results which indicate that the real exchange rates between the EAC countries are cointegrated
during the period 1980-98, suggest that the EAMZ is an optimal currency area. However as
pointed–out by Buigut & Valev(2005), the limitation of this approach is that movements in
macroeconomic variables reflect the combined effects of shocks and responses(Angeloni &
Dedola, 1999). Hence this methodology does not distinguish errors from responses. Buigut &
Valev(2005) empirically assess the suitability of the East African countries for a regional

8
monetary union by testing for symmetry of the underlying structural shocks. Results suggest
that supply and demand shocks are generally asymmetric, which does not support the
forming of a single currency union. Buigut & Valev(2005) further stress that the speed and
magnitude of adjustment to shocks is similar across the countries. Thus, further integration of
the economies could lead to more favorable conditions for a monetary union.
Some studies have also focused on analyzing the feasibility of forming a monetary
union in the Economic Community of West African States(ECOWAS). Thus in the second
strand, Celasun & Justiniano(2005) have used a dynamic factor analysis to examine the
synchronization of output fluctuations among member countries. Their results indicate that
small countries within ECOWAS experience relatively more synchronized output variations.
Hence, they suggest that monetary unification among subsets of countries is preferable over
wider monetary integration. Debrun et al. (2005) investigate the potential for monetary
integration in the ECOWAS using a model of monetary and fiscal policy interactions. Their
findings suggest that the proposed monetary union is desirable for most non-West African
Economic and Monetary Union(WAEMU) countries but not for the exiting WAEMU member
states. Tsangarides & Qureshi (2008) in applying hard and soft clustering algorithms to a set
of variables suggested by the convergence criteria and the theory of optimal currency areas,
examine the suitability of countries in the West African region to form the proposed monetary
union(WAMZ). Findings reveals considerable dissimilarities in the economic characteristics
of member countries. Much recently, Alagidede et al.(2011) have examined the inflation
dynamics and common trends in the real domestic product in candidate countries of the
embryonic WAMZ. Using fractional integration and cointegration method, they establish
significant heterogeneity among the countries.
With much attention currently being placed on convergence criteria and preparedness
of the aspiring member states, this paper is inspired by the premise of the EMU crisis. Thus

9
we assess if candidate countries of potential African monetary zones have similar
fundamental and structural characteristics for real and monetary policy convergence.
3. Data and Methodology
3.1 Data
We examine a sample of 4 West and 5 East African countries with data from African
Development Indicators(ADI) and the Financial Development and Structure Database(FDSD)
of the World Bank. While openness(trade), inflation, population growth, public investment,
GDP growth and GDP per capita growth indicators are obtained from the former source,
financial intermediary dynamics are fetched from the later. Owing to constraints in data
availability, our dataset spans from 1981 to 2009. Details on countries(Appendix 4), summary
statistics(Appendix 1), correlation analysis(Appendix 2) and variable definitions(Appendix3)
are in the appendices. The choice of variables is premised on two facts: (1) real economic
sector policies are designed to achieve macroeconomic performance through growth in GDP
at national and per capita income levels; (2) monetary policies are designed to keep inflation
in check and improve financial intermediary dynamics of depth(money supply and liquid
liabilities), efficiency(at banking and financial levels), activity(from banking and financial
perspectives) and size. For organizational reasons, selected variables are classified into the
following strands.
3.1.1 Financial variables
a) Financial depth
Lining on recent finance literature(Asongu, 2011abcd) and the FDSD, we measure
financial depth both from overall-economic and financial system perspectives with indicators
of broad money supply (M2/GDP) and financial system deposits (Fdgdp) respectively.
Whereas the former denotes the monetary base plus demand, saving and time deposits the
10
later represents liquid liabilities. The premise for distinguishing these aspects of financial
depth is the fact that we are dealing exclusively with developing countries, where-in a
significant chunk of the monetary base does not transit through the banking sector(Asongu,
2011e). Both measures are in GDP ratios(see Appendix 3) and can robustly cross-check one
another as either account for over 98% of variability in the other(see Appendix 2).
b) Financial efficiency
In the context of this paper, financial intermediation efficiency neither refers to the
production efficiency of decision making units nor to the profitability-oriented concept in the
banking industry. What we aim at eliciting is the ability of banks to effectively meet their
fundamental role of transforming mobilized deposits into credit for economic operators.
Thus, we employ proxies for banking-system-efficiency and financial-system-efficiency
(respectively ‘bank credit on bank deposits: Bcbd’ and ‘financial system credit on financial
system deposits: Fcfd’). Like with financial depth, these 2 intermediation efficiency proxies
can cross-check each other as either reflects more than 92% of variability in the other (see
Appendix 2).
c) Financial size
Lining on the FDSD we measure financial intermediary size as the ratio of “deposit
bank assets” to the “total assets” (deposit bank assets on central bank assets plus deposit bank
assets: Dbacba).
d) Financial activity
The concept of financial intermediary activity highlighted here is the ability of banks
to grant credit to economic operators. In order to ensure robustness we proxy for both
banking intermediary activity and financial intermediary activity with “private domestic credit
by deposit banks: Pcrb” and “private credit by domestic banks and other financial institutions:

11
Pcrbof” respectively. The later measure cross-checks the former as it represents more than
95% of variability in the former (see Appendix 2).
3.1.2 Other variables
Borrowing from the convergence literature we also measure the outcome of monetary
policy with inflation(Bruno et al.,2011). Macro economic performance is accounted for at
macro and micro levels with GDP and GDP per capita growth rates respectively. In
accordance with past studies, we control for control for openness, public investment and
population growth in the regressions(Pritchett, 1997; Bruno et al.,2011; Narayan et al., 2011).
In the literature on convergence of per capita incomes and the root of the convergence theory,
an important clue is that per capita incomes of countries identical in structural characteristics
such as preferences in technologies, rate of population growth and government policies have
the tendency to converge to one another if the countries share similar fundamental
characteristics(Prichett, 1997). In the current paper, these fundamental conditions are
monetary and real policies. Hence we proxy for preferences in technology, population growth
and government policy with openness(trade), population growth rate and public investment
respectively.
3.2 Methodology
As underlined by Fung(2009;3) the two equations below are the standard approaches
in the literature for investigating conditional convergence if tiW , is taken as strictly
exogenous.
titititititi WYYY ,,,,, )ln()ln()ln( (1)
tititititi WYY ,,,, )ln()ln( (2)
12
Where σ = 1+ β, tiY , is the proxy for per capita financial or real sector growth in country i at
period t. tiW , is a vector of macroeconomic determinants(openness, public investment and
population growth) of per capita finance(or real sector per capita), i is a country specific
effect, t is a time specific constant and ti , an error term. In line with the exogenous
growth model, a statistically significant negative coefficient on in Eq. (1) means that
countries relatively close to their steady state of per capita growth will experience a
slowdown in growth of the per capita banking(real sector) development, known as conditional
convergence(Narayan et al.,2011;2). Concurring with Fung(2009;3), if 10 in Eq.(2),
then tiY , is dynamically stable around the path with a trend growth rate the same as that of
tW , and with a height relative to the level of tW . The variables contained in tiW , and the
individual effect i are indicators of the long-term level the market(real sector) is converging
to. Thus, the country specific effect i highlights the existence of other determinants of a
country’s steady state not captured by tiW , .
Conditions for convergence elucidated above are conditional on the strict exogeneity
of tiW , . Unfortunately, this is not practical in the real world because, whereas openness,
public investment and population growth(components of tiW , ) influence per capita
financial(real sector) development, the reverse effect cannot be ruled-out. Thus we are
confronted with an issue of endogeneity where openness(trade), public investment and
population growth are correlated with the error term( ti , ). More so country and time specific
effects could be correlated with other variables in the model, which is often the case when
lagged dependent variables are part of the equations. A means of dealing with the problem of
the correlation between the individual specific-effect and the lagged endogenous variables
involves getting rid of the individual effect by first differencing. Thus Eq. (2) becomes:
13
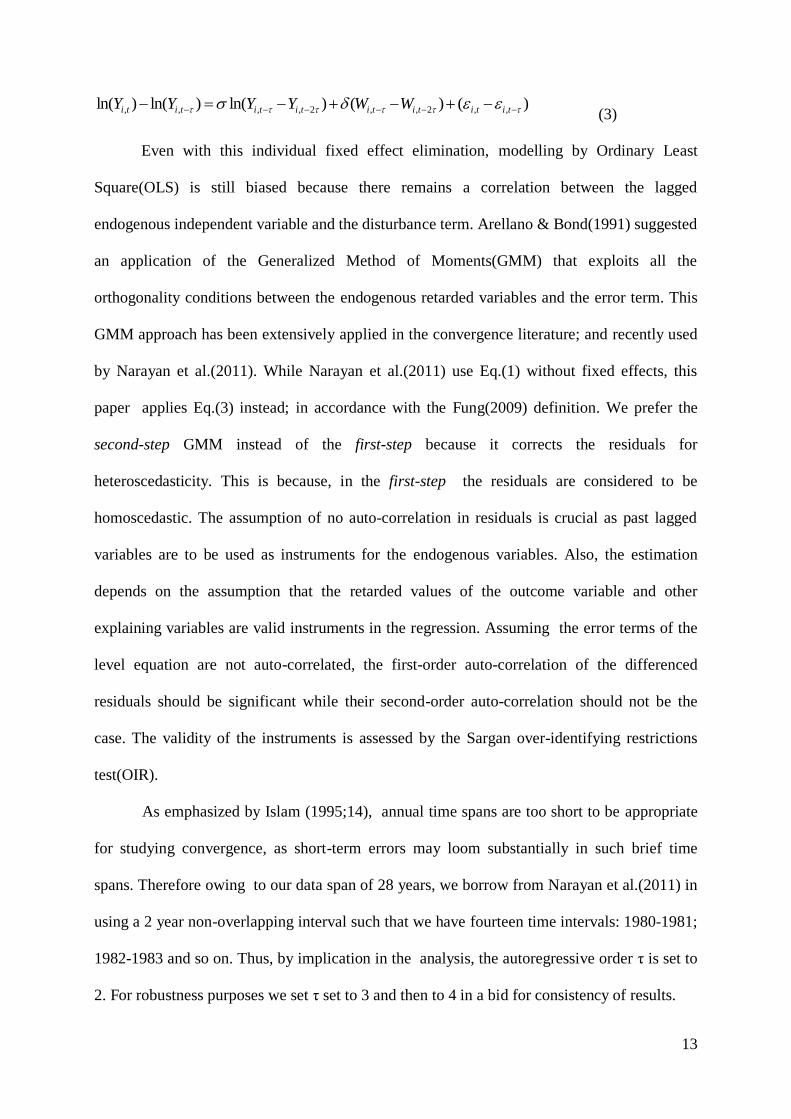
)()()ln()ln()ln( ,,2,,2,,,, titititititititi WWYYYY (3)
Even with this individual fixed effect elimination, modelling by Ordinary Least
Square(OLS) is still biased because there remains a correlation between the lagged
endogenous independent variable and the disturbance term. Arellano & Bond(1991) suggested
an application of the Generalized Method of Moments(GMM) that exploits all the
orthogonality conditions between the endogenous retarded variables and the error term. This
GMM approach has been extensively applied in the convergence literature; and recently used
by Narayan et al.(2011). While Narayan et al.(2011) use Eq.(1) without fixed effects, this
paper applies Eq.(3) instead; in accordance with the Fung(2009) definition. We prefer the
second-step GMM instead of the first-step because it corrects the residuals for
heteroscedasticity. This is because, in the first-step the residuals are considered to be
homoscedastic. The assumption of no auto-correlation in residuals is crucial as past lagged
variables are to be used as instruments for the endogenous variables. Also, the estimation
depends on the assumption that the retarded values of the outcome variable and other
explaining variables are valid instruments in the regression. Assuming the error terms of the
level equation are not auto-correlated, the first-order auto-correlation of the differenced
residuals should be significant while their second-order auto-correlation should not be the
case. The validity of the instruments is assessed by the Sargan over-identifying restrictions
test(OIR).
As emphasized by Islam (1995;14), annual time spans are too short to be appropriate
for studying convergence, as short-term errors may loom substantially in such brief time
spans. Therefore owing to our data span of 28 years, we borrow from Narayan et al.(2011) in
using a 2 year non-overlapping interval such that we have fourteen time intervals: 1980-1981;
1982-1983 and so on. Thus, by implication in the analysis, the autoregressive order τ is set to
2. For robustness purposes we set τ set to 3 and then to 4 in a bid for consistency of results.

14
We also assess the implied rate of convergence by computing (σ/2) which by virtue of
Eqs. (1) and (2) is the equivalent of the Narayan et al.(2011) computation with (1+β)/2. Thus
the paper divides the estimated coefficient of the lagged differenced endogenous variable by 2
because we have used a two year non overlapping span in a bid to absorb short term
disturbances. When the absolute value of the estimated autoregressive coefficient is greater
than zero but less than one( 10 ), we confirm the alternative hypothesis of
convergence. A detail interpretation suggests, past differences have less proportionate impact
on future differences, denoting the variation on the left hand side of Eq.(3) is diminishing
overtime as the country is converging to a stable state.
4. Empirical analysis
This section probes into three main issues: (1) assessment of the presence of
convergence ; (2) determination of the speed of convergence and; (3) computation of the time
needed for full(100%) convergence. Table 1 presents a summary of overall findings and
addresses the first two concerns, while Table 2 and Table 3 respectively reveal results for
unconditional and conditional convergence.
In assessing unconditional(absolute) convergence only the lagged difference of the
endogenous variable is used as exogenous variable while conditional convergence is in
respect of Eq. (3). It follows that unconditional convergence is estimated without tiW , : vector
of determinants(openness, public investment and population growth) of per capita finance(or
real sector per capita). In order to assess the validity of the model and correspondingly the
convergence hypothesis, we carry-out two tests, namely the Sargan test which examines the
over-identification of restrictions, and the Arrellano and Bond test for autocorrelation which
assesses the null hypothesis of no autocorrelation. The Sargan OIR test investigates if the
instruments are uncorrelated with the error term in the estimated equation. Its null hypothesis

15
is the stance that the instruments collectively are strictly exogenous(do not suffer from
endogeneity), which is needed for the validity of the GMM estimates. We also report the
Wald statistics for the collective significance of estimated coefficients.
The Sargan, autocorrelation and Wald tests statistics with corresponding p-values for
each of the panels are reported in the tables. The Sargan test statistics often appear with a p-
value greater than 0.10, hence its null hypothesis is not rejected for the majority of models.
Only results for the AR(2) test are reported because as opposed to the AR(1), it
detects autocorrelation in levels. For all estimated models we are unable to reject the AR(2)
null hypothesis of no autocorrelation. There is therefore robust evidence that all the models
are free from autocorrelation.
4.1 Summary of results
In Table 1, we provide a synthesis of results. This summary is premised on details
presented in Tables 2-3. We report the state of convergence and corresponding speeds,
respectively denoted in terms of AC(Absolute Convergence), CC(Conditional Convergence),
SAC(Speed of Absolute Convergence) and SCC(Speed of Conditional Convergence). We
notice that for the two panels, with regard to all real and monetary policy dynamics, only
banking system efficiency within the EAMZ reflects AC.
Table 1: Summary of results on convergence Financial Depth Money Supply Liquid Liabilities
AC CC SAC SCC AC CC SAC SCC
WAMZ No No --- --- No No --- ---
EAMZ No No --- --- No No --- ---
Financial Efficiency Banking System Efficiency Financial System Efficiency
AC CC SAC SCC AC CC SAC SCC
WAMZ No No --- --- No No --- ---
EAMZ Yes(1%) No 28.90% --- No No --- ---
Financial Activity Banking System Activity Financial System Activity
AC CC SAC SCC AC CC SAC SCC
WAMZ No No --- --- No No --- ---
EAMZ No No --- --- No No --- ---

16
Financial Size and Inflation
Financial Size Inflation(CPI)
AC CC SAC SCC AC CC SAC SCC
WAMZ No No --- --- No No --- ---
EAMZ No No --- --- No No --- ---
Economic Performance (GDP Growth) GDP Growth GDP per capita Growth
AC CC SAC SCC AC CC SAC SCC
WAMZ No No --- --- No No --- ---
EAMZ No No --- --- No No --- ---
AC: Absolute Convergence. CC: Conditional Convergence. SAC : Speed of Absolute Convergence. SCC: Speed of Conditional
Convergence. WAMZ: West African Monetary Zone. EAMZ: East African Monetary Zone. CPI: Consumer Price Index.
4.2 Results of absolute convergence
Table 2 below reports results of AC regressions. On a first note, in all models, the
instruments are valid as the null hypotheses of the AR(2) and Sargan-OIR tests are not
rejected. Where the lagged endogenous estimated coefficient is significant, the corresponding
Wald statistics is also significant. This was not unexpected since only one endogenous
variable is employed in the absolute convergence regressions: implying by definition the
statistics pertaining to the estimated coefficient is the same as the Wald statistics. We notice
significant evidence of convergence only for the EAMZ in banking system efficiency. The
speed of this AC is 28.90% per annum(p.a) and the time required to achieve full(100%)
convergence is 6.92 years(yrs).
Table 2: Absolute convergence Financial Depth Financial Efficiency Financial Size
Money Supply Liquid Liabilities Banking Efficiency Financial Efficiency
WAMZ EAMZ WAMZ EAMZ WAMZ EAMZ WAMZ EAMZ WAMZ EAMZ
Initial 0.021 0.204 -0.729 0.147 -0.997 0.578*** -0.288 -0.022 0.117 0.814
(0.975) (0.718) (0.417) (0.812) (0.333) (0.000) (0.772) (0.932) (0.791) (0.241)
AR(2) -0.371 0.271 0.489 0.820 -0.455 0.853 -0.724 -0.051 0.734 0.047
(0.710) (0.786) (0.624) (0.412) (0.648) (0.393) (0.468) (0.959) (0.462) (0.962)
OIR 1.934 1.670 0.943 1.886 0.765 3.509 2.879 4.048 1.528 4.276
(1.000) (1.000) (1.000) (1.000) (1.000) (1.000) (1.000) (1.000) (1.000) (1.000)
Wald 0.000 0.130 0.657 0.056 0.933 41.52*** 0.083 0.007 0.069 1.370
(0.975) (0.718) (0.417) (0.812) (0.333) (0.000) (0.772) (0.932) (0.791) (0.241)
Countries 4 5 4 5 4 5 4 5 4 5
Observations 50 56 50 56 51 63 50 56 51 60
Financial Activity Inflation(CPI) Economic Performance
Banking Activity Financial Activity GDP Growth GDPpc Growth
WAMZ EAMZ WAMZ EAMZ WAMZ EAMZ WAMZ EAMZ WAMZ EAMZ Initial -1.059 0.168 -1.095 0.233 -1.670 0.577 -0.628 -1.384 0.484 0.107
(0.236) (0.653) (0.231) (0.506) (0.128) (0.343) (0.352) (0.107) (0.516) (0.924)
AR(2) 0.340 0.462 0.531 0.759 -0.968 0.494 -1.059 -1.515 1.003 0.030
(0.733) (0.644) (0.595) (0.447) (0.333) (0.621) (0.289) (0.129) (0.315) (0.975)
OIR 0.270 2.298 0.203 2.500 0.220 4.812 2.225 1.288 3.791 3.269
(1.000) (1.000) (1.000) (1.000) (1.000) (1.000) (1.000) (1.000) (1.000) (0.999)
Wald 1.399 0.201 1.429 0.441 2.315 0.897 0.865 2.598 0.421 0.009
(0.236) (0.653) (0.231) (0.506) (0.128) (0.343) (0.352) (0.107) (0.516) (0.924)
Countries 4 5 4 5 3 5 4 5 4 5
Observations 50 56 50 56 39 56 36 42 21 20

17
*,**,***: significance levels of 10%, 5% and 1% respectively . WAMZ: West African Monetary Zone. EAMZ: East African Monetary
Zone. Syst: System. Initial: lagged autoregressive estimated coefficient. AR(2): Second Order Autocorrelation test. OIR: Overidentifying
Restrictions Sargan Test. Wald: statistics for joint significance of estimates. Obser: Observations. CPI: Consumer Price Index. GDP: Gross
Domestic Product. GDPpc : GDP per capita.
4.3 Results of conditional convergence
Table 3 below presents results of conditional convergence. We confirm the validity of
the models, as the instruments are valid since the null hypotheses of the AR(2) and Sargan-
OIR tests are not rejected. Unfortunately we do not find any support for CC in any monetary
or real policy. Owing to constraints in degrees of freedom requisite for the OIR test, we use
the macroeconomic conditioning information set( population growth, public investment and
trade) interchangeably and find the same results; details of which are presented in the
following section.
Table 3: Conditional convergence Financial Depth Financial Efficiency Financial Size
Money Supply Liquid Liabilities Banking Efficiency Financial Efficiency
WAMZ EAMZ WAMZ EAMZ WAMZ EAMZ WAMZ EAMZ WAMZ EAMZ
Initial -0.871 -0.809 -0.577 -0.784 -1.248 -0.115 -1.655 -1.582* -0.754 -0.707
(0.310) (0.417) (0.684) (0.401) (0.371) (0.812) (0.407) (0.083) (0.443) (0.388)
Intercept -0.127 0.132 -0.142 0.177 -0.011 0.132 -0.067 -0.022 -0.022 0.083**
(0.207) (0.340) (0.682) (0.332) (0.748) (0.261) (0.316) (0.448) (0.775) (0.034)
Trade -0.002 0.008 -0.002 0.009 0.004 0.0003 0.003 0.014 -0.004*** -0.002**
(0.106) (0.141) (0.538) (0.178) (0.526) (0.921) (0.345) (0.114) (0.000) (0.014)
Pop. Growth --- --- --- --- --- --- --- --- --- ---
Pub. Investment --- -0.016 --- -0.021 --- -0.007 --- 0.003 --- -0.003
(0.337) (0.290) (0.762) (0.801) (0.579)
AR(2) 1.126 0.057 0.915 0.412 -0.618 1.079 -0.669 -1.655 0.226 0.949
(0.259) (0.953) (0.359) (0.680) (0.536) (0.280) (0.503) (0.097) (0.821) (0.342)
OIR 0.080 0.152 0.212 0.017 0.035 0.979 0.159 0.010 0.309 0.062
(1.000) (1.000) (1.000) (1.000) (1.000) (1.000) (1.000) (1.000) (1.000) (1.000)
Wald 2.818 4.323 0.480 3.189 0.799 0.564 0.953 3.065 16.52*** 14.02***
(0.244) (0.228) (0.786) (0.363) (0.670) (0.904) (0.620) (0.381) (0.000) (0.002)
Countries 4 5 4 5 4 5 4 5 4 5
Observations 50 53 50 53 51 55 50 53 51 52
Financial Activity Inflation(CPI) Economic Performance
Banking Activity Financial Activity GDP Growth GDPpc Growth
WAMZ EAMZ WAMZ EAMZ WAMZ EAMZ WAMZ EAMZ WAMZ EAMZ
Initial -1.020 -0.716 -1.064 -0.583 84.643 -0.535 -1.417* 1.325 0.621 -1.490
(0.337) (0.264) (0.324) (0.277) (0.626) (0.609) (0.080) (0.899) (0.212) (0.273)
Intercept 0.067 0.290 0.059 0.206 115.96 0.689 4.288 -0.365 -5.988 0.221
(0.848) (0.145) (0.839) (0.212) (0.618) (0.737) (0.275) (0.892) (0.286) (0.725)
Trade -0.002 0.014 -0.001 0.012 -1.124 0.017 0.013 0.259 -0.088 0.039
(0.522) (0.174) (0.600) (0.215) (0.622) (0.679) (0.731) (0.801) (0.619) (0.750)
Pop. Growth --- --- --- --- --- --- --- --- --- ---
Pub. Investment --- -0.016 --- -0.008 --- 0.108** --- --- --- 0.277
(0.496) (0.708) (0.035) (0.262)
AR(2) 0.528 0.067 0.678 -0.059 0.427 0.405 0.879 -0.154 0.847 -1.196
(0.597) (0.946) (0.497) (0.952) (0.668) (0.685) (0.379) (0.877) (0.396) (0.231)
OIR 0.007 0.247 0.001 0.004 0.000 0.084 0.544 1.700 0.908 0.474
(1.000) (1.000) (1.000) (1.000) (1.000) (1.000) (1.000) (1.000) (1.000) (1.000)
Wald 1.546 2.081 1.572 1.931 0.929 7.731* 4.253 2.190 1.559 2.344
(0.461) (0.555) (0.455) (0.586) (0.628) (0.051) (0.119) (0.334) (0.458) (0.504)
Countries 4 5 4 5 3 5 4 5 4 5
Observations 50 53 50 53 39 49 36 41 21 18

18
*,**,***: significance levels of 10%, 5% and 1% respectively . WAMZ: West African Monetary Zone. EAMZ: East African Monetary Zone. Syst: System. Initial: lagged autoregressive estimated coefficient. AR(2): Second Order Autocorrelation test. OIR: Overidentifying
Restrictions Sargan Test. Wald: statistics for joint significance of estimates. Obser: Observations. CPI: Consumer Price Index. GDP: Gross
Domestic Product. GDPpc : GDP per capita. Pop: population. Pub: Public.
4.4 Robustness checks
In a bid to assess the validity of our results we perform three types of robustness tests:
(1)firstly, for every regression(whether in AC or CC terms) we use the conditioning
information set singly and in pairs; (2) secondly, we set τ to 3 and replicate the same analysis
in tables 2 and 3; (3) lastly, we set τ to 4 and still replicate the analysis. In so doing we find
results not significantly different from those in Tables 2-3.
4.4.1 Setting τ to 3
When τ is set to 3 we notice no significantly different results from those in tables 2
and 3. There is still evidence of AC in banking system efficiency within the EAMZ at a speed
of 14.23% per annum and time required to achieve a complete convergence of 21.08 years.
No significant results are noticed for the WAMZ. We replicate the analysis with different
pairs of the conditioning information set to further assess the robustness of the findings.
4.4.1 Setting τ to 4
With τ set to 4, the following new findings emerge. For the WAMZ there is evidence
of AC in real sector policies; with the speeds (time) of(for full) convergence in GDP and
GDP per capita growths respectively: 12.57% p.a (31.82yrs) and 11.82% p.a (33.84yrs). The
analysis is replicated with different pairs of the conditioning information set.
With regard to the EAMZ we find significant results only for financial depth. With
respect to the money supply dimension, convergence is at 22.25% p.a with a full converge
period of 17.97yrs. The liquid liability dimension of financial depth has a convergence rate(
full convergence period) of 21.45% p.a(18.64yrs). This EAMZ analysis is also replicated
with different pairs of the conditioning information set.
19
Overall, even after all available combinations of τ(3 & 4) and alternating macro
economic variables, results are not substantially different from those summarized in Table 1
and detailed in Tables 2-3.
4.5 Discussion and policy implications
Before diving into the discussion of the results, it is imperative at the outset to grasp
the economic intuition and circumstances motivating absolute and conditional convergence in
real and monetary policies within the WAMZ and EAMZ. The European Monetary Union
(EMU) crisis has sent a strong signal to other common currency regions on the imperatives of
real and monetary convergence. An important lesson of the EMU crisis is that serious
disequilibria result from regional monetary arrangements not designed to be robust to a
variety of shocks(Willet, 2010; Willett & Srisorn, 2011). In fashioning the euro zone,
institutions’ almost exclusive concern was placed on limiting crises caused by financial
sectors. The official position of the German government today appears to maintain that failure
of these safeguards is the principal cause of the crisis.
Member countries of the potential WAMZ have twice postponed the take –off for the
single currency. Banking experts in the up-coming EAMZ fear that plans for a common
currency in 2012 may be too ambitious as central banks in the five countries are given little
time to prepare for the monetary union. In a recent meeting among EAMZ central bank
officials, experts have asserted the lack of knowledge in modeling and forecasting monetary
policies as well as implementing reforms needed for a single currency union. In another recent
meeting among elements of the WAMZ Convergence Council, questions have been raised
over the achievement of monetary policy convergence. Three issues have resulted from these
stylized facts: (1) the need for monetary policy convergence; (2) the imperative of bankers to
understand modeling and forecasting methods in monetary policy transmission and; (3) the
requirement of common structural and institutional characteristics among candidate countries.

20
In order to address the issues, the present analysis has been based on two hypotheses:
(1) real economic sector policies are designed to achieve macroeconomic performance
through growth in GDP and GDP per capita at macro and micro levels respectively; (2)
monetary policies are designed to keep inflation in check and improve financial intermediary
dynamics of depth(money supply and liquid liabilities), efficiency(at banking and financial
levels), activity(from banking and financial perspectives) and size. We have also calculated
the speeds of convergence and period required to achieve full(100%) convergence; where
applicable.
4.5.1 Absolute convergence
Absolute convergence is the result from factors such as monetary zones and the
adoption of a single currency, among others(Nayaran et al., 2011). Absolute convergence in
real and monetary policy implies countries share the same fundamental characteristics with
regard to the financial intermediary market such that the only difference across countries is in
initial levels of financial intermediary market development.
Since the mid 1980s countries of the WAM and EAM zones have undertaken
structural reform programs engineered by the International Monetary Fund(IMF)which
include financial liberalization for the most part. The vested agenda has been to reduce
barriers to trade and increase foreign investment. Unlike other African countries without
prospects for a single currency, the WAM and EAM zones member states are expected to
benefit more in the reforms by virtue of reduced risk and low cross-border currency
conversion costs in the flows of trade and investments among member countries. Owing to
this financial liberalization, capital controls and control on exchange rate transactions have
been substantially eased in the WAM and EAM zones; together with advances in information
and communication technologies which have rendered the banking industry increasingly
synchronized. This synchronization has also increased the speed of shock adjustment;

21
implying the rate at which one bank in the potential monetary zones adjusts when there is a
shock in the other has increased. All these factors should naturally result in absolute
convergence. However, our findings do not reveal support for absolute convergence. It
follows that despite dissimilar initial levels in financial development, member states within
the WAM and EAM zones do not share the same fundamental characteristics. In other words
structural reform programs from the IMF and World Bank have not been evenly implemented
by candidate countries.
4.5.2 Conditional convergence
According to the economic growth literature(Barro, 1991), conditional convergence
depicts convergence whereby one’s own long-run stable state(equilibrium) is contingent on
the different structural characteristics or fundamentals of each economy or market(Nayaran et
al.,2011). Still from Narayan et al.(2011), when financial intermediary markets across
countries differ in terms of factors relative to the performance of their markets, there could be
conditional convergence. The convergence in dynamics of the banking sector is contingent on
proxies which we observe and empirically model. Our results are thus conditional on the
macroeconomic measures we have used. Note should be taken of the fact that, owing to
constraints in data availability and degrees of freedom required for the OIR-Sargan test, we
conditioned our analysis to three macroeconomic variables: consistent with the convergence
literature(Prichett,1997; Bruno et al.,2011; Narayan et al.,2011). As we have found no
evidence for this form of convergence, it follows that structural characteristics like
macroeconomic policies are different across countries. Also, based on stylized facts
presented in the motivation of the paper, it could be established that this insignificance is
also the result of cross-country differences in institutional characteristics like government
quality(democracy, control of corruption, voice and accountability, rule of law, regulation
quality, political stability…etc).

22
On a final note the findings of this paper are broadly consistent with the convergence
literature on the EAMZ(Mkenda,2001; Buigut & Valev,2005) and the WAMZ(Celasun &
Justiniano,2005; Debrun et al., 2005; Tsangarides & Qureshi, 2008; Alagidede et al.,2011).
4.5.3 Policy implications
In spite of common fundamental characteristics for candidate countries of the WAM
and EAM zones(as they are implementing common policies in the run-up to the new
monetary zones), we have found substantial insignificance in both types of convergence in the
analyses. These findings have four broad implications: (1) initial conditions for financial
development are different across countries; (2) fundamental characteristics as common
monetary policy initiatives and IMF backed financial reform programs are implemented
differently across countries; (3) there is remarkable evidence of cross-country variations in
structural characteristics of macroeconomic performance; (4) institutional cross-country
differences could also be responsible for the deficiency in convergence within the potential
monetary zones.
As a policy implication, heterogeneous structural and institutional characteristics
across countries are giving rise to different levels and patterns of financial intermediary
development. Thus member states should work towards harmonizing cross-country
differences in structural and institutional characteristics that hamper the effectiveness of
convergence in monetary and real policies.
5. Conclusion
A spectre is hunting embryonic African monetary zones: the EMU crisis. The
introduction of common currencies in West and East Africa is facing stiff challenges in the
timing of monetary convergence, the imperative of bankers to apply common modeling and
forecasting methods of monetary policy transmission, as well as the requirements of common

23
structural and institutional characteristics among candidate states. Inspired by the premise of
the EMU crisis, this paper has assessed real and monetary policy convergence within the
potential WAM and EAM zones. In the analysis, monetary policy targets inflation and
financial dynamics of depth, efficiency, activity and size while real sector policy targets
economic performance in terms of GDP growth at macro and micro levels. Findings suggest
overwhelming lack of convergence; an indication that candidate countries still have to work
towards harmonizing cross-country differences in fundamental, structural and institutional
characteristics that hamper the convergence process.

24
Appendices
Appendix 1: Summary statistics(Combined data for WAMZ and EAMZ) Mean S.D Minimum Maximum Observations
Financial Depth Money Supply 0.223 0.114 0.054 0.747 125
Liquid Liabilities 0.161 0.102 0.028 0.553 125
Financial
Efficiency
Banking Efficiency 0.651 0.315 0.070 1.844 132
Financial Efficiency 0.730 0.362 0.139 1.968 125
Financial
Activity
Banking Activity 0.103 0.069 0.013 0.255 125
Financial Activity 0.118 0.086 0.013 0.349 125
Financial Size Financial Size 0.563 0.242 0.054 1.155 130
Other Variables Openness(Trade) 54.581 26.818 6.320 138.76 129
Inflation 17.434 27.228 -100.00 196.12 120
Public Investment 7.180 3.719 0.000 15.734 106
GDP growth 3.584 6.759 -50.248 27.462 128
GDP per capita growth 0.752 6.200 -46.892 22.618 128
Population growth 2.747 1.606 -6.849 10.043 135
S.D: Standard Deviation. GDP: Gross Domestic Product
Appendix 2: Correlation analysis(Combined data for WAMZ and EAMZ) Fin. Depth Fin. Efficiency Fin. Activity F. Size Other Variables
M2 Fdgdp BcBd FcFd Pcrb Pcrbof Dbacba Trade Infl. Pub. I GDPg GDPpcg Popg
1.000 0.983 0.078 0.014 0.790 0.788 0.532 0.460 -0.210 -0.159 -0.010 -0.048 0.119 M2
1.000 0.084 0.005 0.810 0.823 0.567 0.406 -0.208 -0.238 0.020 -0.019 0.126 Fdgdp
1.000 0.920 0.590 0.565 0.394 0.162 -0.140 0.319 -0.062 -0.074 0.155 BcBd
1.000 0.473 0.503 0.367 0.035 -0.189 0.434 -0.163 -0.169 0.002 FcFd
1.000 0.955 0.683 0.420 -0.219 -0.074 -0.049 -0.083 0.100 Pcrb
1.000 0.640 0.301 -0.209 -0.105 -0.073 -0.108 0.101 Pcrbof
1.000 0.292 -0.258 0.043 0.087 0.051 0.174 Dbacba
1.000 -0.127 0.137 0.008 -0.017 0.084 Trade
1.000 -0.031 0.290 0.267 0.240 Infl.
1.000 0.025 0.021 0.057 Pub.I
1.000 0.973 0.509 GDPg
1.000 0.301 GDPpcg
1.000 Popg
M2 :Money Supply. Fdgdp : Liquid liabilities. BcBd : Bank credit on Bank deposit. FcFd: Financial credit on Financial deposit. Prcb:Private
domestic credit by deposit banks. Prcbof: Private domestic credit by deposit banks and other financial institutions. Dbacba: Deposit bank
assets on deposit bank assets plus central bank assets. Pub.I: Public Investment. GDPg: GDP growth. Popg: Population growth. Fin:
Financial.

25
Appendix 3: Variable definitions Variables Signs Variable definitions Sources
Inflation Infl. Consumer Price (Annual %) World Bank(WDI)
Openness Trade Imports(of goods and services) plus
Exports(of goods and services) on GDP
World Bank(WDI)
Public Investment PubI Gross Public Investment(% of GDP) World Bank(WDI)
GDP Growtth GDPg Average annual GDP growth rate World Bank(WDI)
GDP per capita Growth GDPpcg Average annual GDP per capita growth rate World Bank(WDI)
Population Growth Popg Annual population growth rate World Bank(WDI)
Economic financial
depth(Money Supply)
M2 Monetary Base plus demand, saving and
time deposits(% of GDP)
World Bank(FDSD)
Financial system
depth(Liquid liabilities)
Fdgdp Financial system deposits(% of GDP) World Bank(FDSD)
Banking system
allocation efficiency
BcBd Bank credit on Bank deposits World Bank(FDSD)
Financial system
allocation efficiency
FcFd Financial system credit on Financial system
deposits
World Bank(FDSD)
Banking system activity Pcrb Private credit by deposit banks (% of GDP) World Bank(FDSD)
Financial system activity Pcrbof Private credit by deposit banks and other
financial institutions(% of GDP)
World Bank(FDSD)
Financial size Dbacba Deposit bank assets on Central banks assets
plus deposit bank assets
World Bank(FDSD)
M2: Money Supply. Fdgdp: Liquid liabilities. BcBd: Bank credit on Bank deposits. FcFd: Financial system credit on Financial system deposits.
Pcrb: Private domestic credit by deposit banks. Pcrbof: Private domestic credit by deposit banks and other financial institutions. Dbacba: Deposit
bank assets on Central bank assets plus deposit bank assets. WDI: World Development Indicators. FDSD: Financial Development and Structure
Database.
Appendix 4: Presentation of countries Zones Definitions Countries Number
WAMZ West African Monetary Zone The Gambia, Ghana, Guinea*, Nigeria, Sierra Leone 4
EAMZ East African Monetary Zone Tanzania, Rwanda, Burundi, Kenya, Uganda. 5
*Guinea is not included in the WAMZ Analysis owing to constraints in data availability.

26
References
African Manager(2012, January). “ECOWAS single currency for launch 2020”,
http://www.africanmanager.com/site_eng/detail_article.php?art_id=13398 (accessed on the
15th
of January 2012).
African Online News(2012, January). “East Africa Monetary Union Challenging”, AON
http://www.afrol.com/articles/35643 (accessed on the 15th January 2012).
Alagidede, P.,(2008). “African Stock Market Integration: Implications for Portfolio
Diversification and International Risk Sharing”, Proceedings of the African Economic
Conferences 2008.
Alagidede, P., Coleman, S., & Cuestas, J. C.,(2011). “ Inflationary shocks and common
economic trends: Implications for West African Monetary Union membership”, Journal of
Policy Modeling, Forthcoming.
Allen, F., & Gale, D.,(2000). Comparing Financial Systems. The MIT Press, Cambridge, MA.
Angeloni, I., & Dedola, L.,(1999). “From the ERM to the Euro: New evidence on economic
and policy among EU countries”, European Central Bank Working Paper, No. 4
Arellano, M., & Bond, S., (1991). “Some tests of specification for panel data: Monte Carlo
evidence and an application to employment equations”. The Review of Economic Studies, 58,
pp. 277-297.
Asongu, S. A., (2011a). “Law, finance, economic growth and welfare: why does legal origin
matter?”, MPRA No. 33868.
Asongu, S. A., (2011b). “Law and finance in Africa”, MPRA No. 34080.
Asongu, S. A., (2011c). “Finance and democracy in Africa”, MPRA No. 35500.
Asongu, S. A., (2011d). “Why do French civil-law countries have higher levels of financial
efficiency”, MPRA No. 33950.

27
Asongu, S. A., (2011e). “New financial intermediary development indicators for developing
countries”, MPRA No. 30921.
Barro, R. J., (1991). “Economic growth in a cross section of countries”, Quarterly Journal of
Economics, 106, pp.407-443.
Beine, M., Cosma, A., & Vermeulen, R.,(2010).“The dark side of global integration:
increasing tail dependence“, Journal of Banking and Finance, 34, pp. 184-192.
Bessler, D.A., & Yang, J., (2003).“The structure of interdependence in international stock
markets”, Journal of International Money and Finance, 22, pp.261-287.
Bondt, G., (2000). “Financial Structure and Monetary Transmission in Europe” . Cheltenham:
Edward Elgar.
Brada, J. C., Kutan, A. M., & Zhou, S., (2005). “Real and monetary convergence between the
European Union’s core and recent member countries: A rolling cointegration approach”,
Journal of Banking and Finance, 29, pp.249-270.
Bruno, G., De Bonis, R., & Silvestrini, A., (2011). “Do financial systems converge? New
evidence from financial assets in OECD countries”, Journal of Comparative Economics;
Forthcoming.
Buigut, S.K., & Valev, N.T.,(2005). “Is the Proposed East African Monetary Union an
Optimal Currency Area? A Structural Vector Autoregression Analysis”, World Development,
33(12), pp.260-267.
Celasun, O., & Justiniano, A., (2005). “Synchronization of output fluctuations in West Africa:
Implications for monetary unification”, IMF Working Paper.
Casu, B., & Girardone, C.,(2010). “Integration and efficiency convergence in the EU
banking”, Omega, 38, pp.260-267.

28
Chen, G-M., Firth, M., & Rui, O.M.,(2002).“Stock market linkages: evidence from Latin
America”, Journal of Banking and Finance, 26, pp.1113-1141.
Debrun, X., Masson, P., & Pattillo, C., (2005). “Monetary union in West Africa: Who might
gain, who might lose and why?” Canadian Journal of Economics, 38(2), pp.454-481.
Fung, M.K., (2009). “Financial development and economic growth: convergence or
divergence?”, Journal of International Money and Finance, 28, pp.56-67.
Grubel, H., (1968). “Internationally diversified portfolio: welfare gains in capital flows”,
American Economic Review, 58, pp. 89-94.
Islam, N.,(1995). “Growth Empirics: A Panel Data Approach”, The Quarterly Journal of
Economics, 110, (4), pp. 1127-1170.
Kim, S. J., Moshirian, F., & Wu, E., (2005). “Evolution of international stock and bond
market integration: influence of the European Monetary Union”, Journal of Banking and
Finance, 30, pp. 1507-1534.
Levine, R., (2004). “Finance and Growth: Theory and Evidence”. NBER Working Paper
10766.
Levy, H., & Sarnat, M., (1970). “International diversification of investment portfolios”,
American Economic Review, 60, pp.668-675.
Mkenda, B. K., (2001). “Is EA an optimum currency area?”, Working Papers in Economics,
No. 41. School of Economics and Commercial Law, Goteborg University.
Narayan, P.K., Mishra, S., & Narayan, S., (2011). “Do market capitalization and stocks traded
converge? New global evidence”, Journal of Banking and Finance, 35, pp.2771-2781.
Prichett, L., (1997). “Divergence, big time”, Journal of Economic Perspectives, 11, pp.3-17.

29
Scholtens, B., & Naaborg, I.,(2005). “Convergence of Financial Intermediary Activities
within Europe: A comparison of banks’ balance sheets in the EU and the New E.U Member
States”, Department of Finance, University of Groningen.
Tsangarides, C.G., & Qureshi, M.S.,(2008). “Monetary Union Membership in West Africa: A
Cluster Analysis”, World Development, 36(7), pp.1261-1279.
Umutlu, M., Akdeniz, L., & Altag-Salih, A.,(2010).“The degree of financial liberalisation and
aggregated stock-return volatility in emerging markets”, Journal of Banking and Finance,
34(3), pp.509-521.
Von Furstenberg, G.M., & Jeon, B.N.,(1989).“International stock price movements: links and
messages”, Brookings Papers on Economic Activity, 1, pp.125-179.
Weill, L.,(2009). “Convergence in banking efficiency across European countries”,
International Financial Markets, Institutions and Money, 19, pp.818-833.
Willett, T. D., (2011). “Some Lessons for Economists from the Financial Crisis”. In Indian
Growth and Development Review, 3(2), pp.186-208.
Willett, T. D., & Srisorn, N., (2011, June). “Some Lessons for Asia from the Euro Crisis”,
The Claremont Colleges, Workshop on Global Growth and Economic Governance
Implications for Asia: George Mason University.
Yu, I-W., Fung, K-P., & Tam, C-S.,(2010). “Assessing the financial market integration in
Asia-equity markets”, Journal of Banking and Finance, 34, pp.2874-2885.