PACAP interactions in the mouse brain: Implications for behavioral and other disorders
8
PACAP interactions in the mouse brain: Implications for behavioral and other disorders George K. Acquaah-Mensah a, ⁎, Ronald C. Taylor b , Sanjiv V. Bhave c a Department of Pharmaceutical Sciences, Massachusetts College of Pharmacy and Health Sciences, Worcester, MA, USA b Computational Biology & Bioinformatics Group, Pacific Northwest National Laboratory (U.S. Dept of Energy), Richland, WA, USA c Department of Pharmacology, University of Colorado School of Medicine, Aurora, CO, USA abstract article info Article history: Accepted 9 September 2011 Available online 29 September 2011 Received by A.J. van Wijnen Keywords: PACAP Network inference Adenylate cyclase Gsk3b Sgk3 PI 3-kinase As an activator of adenylate cyclase, the neuropeptide Pituitary Adenylate Cyclase Activating Peptide (PACAP) impacts levels of cyclic AMP, a key second messenger available in brain cells. PACAP is involved in certain adult behaviors. To elucidate PACAP interactions, a compendium of microarrays representing mRNA expression in the adult mouse whole brain was pooled from the Phenogen database for analysis. A regulatory network was computed based on mutual information between gene pairs using gene expression data across the compendium. Clusters among genes directly linked to PACAP, and probable interactions between corre- sponding proteins were computed. Database “experts” affirmed some of the inferred relationships. The find- ings suggest ADCY7 is probably the adenylate cyclase isoform most relevant to PACAP's action. They also support intervening roles for kinases including GSK3B, PI 3-kinase, SGK3 and AMPK. Other high-confidence interactions are hypothesized for future testing. This new information has implications for certain behavioral and other disorders. © 2011 Elsevier B.V. All rights reserved. 1. Introduction The protein Pituitary Adenylate Cyclase Activating Peptide (PACAP), encoded by the gene Adcyap1, is not only a hypophysiotropic hormone, but also functions as a neurotransmitter and neuromodulator. As a neu- romodulator, it can function in a neuroprotective role (Dejda et al., 2005). PACAP's neuroprotective functions have relevant implications beyond the developmental window. Its activity can also affect Gene 491 (2012) 224–231 Abbreviations: Adcy7, Adenylate cyclase 7; Adcyap1, Gene for Pituitary Adenylate Cyclase Activating Peptide; AKT, Protein kinase B; AMPA, Alpha-amino-3-hydroxyl-5-methyl- 4-isoxazole-propionate; AMPK, 5'-prime-AMP-activated protein kinase; ANKRD6, Ankyrin repeat domain 6; AP-1, Activator Protein 1; ARACNE, Algorithm for the Reconstruction of Accurate Cellular Networks; BRAF, B-Raf; cAMP, Cyclic adenosine 3',5'-monophosphate; CFLAR, CASP8 and FADD-like apoptosis regulator isoform; ChEBI, Chemicals of Biological Interest ontology; CKROX, Zinc finger and BTB domain containing 7B; CMYC, v-myc myelocytomatosis viral oncogene homolog (avian); CREB, cAMP responsive element binding protein 1; CTSB, Cathepsin B preproprotein; DBP, D site of albumin promoter (albumin D-box); DDI, Domain-domain interaction; DPI, Data Processing Inequality; EBX, Similar to EBX transcription factor; ER, Estrogen receptor 1; FAF1, FAS-associated factor 1; GO, Gene Ontology; GO-BP, Biological Process; GO-BP-ChEBI, GO cross product with ChEBI; GO-CC, Cellular Compartment; GO-MF, Molecular function; GRIK2, Glutamate receptor, ionotropic, kainate 2; GRIN2B, N-methyl-D-aspartate receptor subunit 2B; GSK3B, Glycogen synthase kinase-3beta; GULP1, GULP, engulfment adaptor PTB domain containing; HNF3beta, Forkhead box A2; HNF4, Hepatocyte nuclear factor 4; HNMT, Histamine N-methyl- transferase isoform 1; HTR2A, 5-hydroxytryptamine (serotonin) receptor 2A; Igf1, Insulin-like growth factor-1; Igf1r, Insulin-like growth factor-1 receptor; IRS2, Insulin receptor substrate 2; KEGG, Kyoto Encyclopedia of Genes and Genomes; KID3, Zinc finger protein 354C; LRF, Zinc finger and BTB domain containing 7a; MAPK1, Mitogen-activated protein kinase 1; MAZ, MYC-associated zinc finger protein isoform 2; MCODE, Molecular Complex Detection; MI, Mutual Information; MLE, Maximum Likelihood Estimation; MYB, v-myb myeloblastosis viral oncogene homolog; V-MYB, v-myb myeloblastosis viral oncogene homolog; NKX2-5, NK2 transcription factor related, locus 5; NMDA, N-methyl-D-aspartate; P53, Tumor protein p53; p75NTR, Nerve growth factor receptor (TNFR superfamily, member 16); PACAP, Pituitary Adenylate Cyclase Activating Peptide; PAC1R, PACAP receptor I; PAINT, Promoter Analysis and Interaction Network Toolset; PAX-3, Paired box gene 3; PEX13, Peroxisomal biogenesis factor 13; Pheno, Mammalian Phenotype Ontology; PIK3CA, Catalytic unit of PI 3-kinase; PIK3R1, Regulatory subunit 1 of phosphoinositide-3-kinase; PIP3, Inositol (3,4,5)-trisphosphate; PPI, Protein-protein interaction; PreMod, Predicted Regulatory Modules; PRKAA1, Catalytic subunit of AMPK; Prkg1, Type I cGMP-dependent protein kinase; RELA, v-rel reticuloendotheliosis viral oncogene; RMA, Robust MultiArray Analysis; RORA, RAR-related orphan receptor A isoform b; S100B, S100 calcium-binding protein, beta; SGK3, Serum/glucocorticoid regulated kinase 3; SH3KBP1, SH3-domain ki- nase binding protein 1 isoform a; SIX3, SIX homeobox 3; SMAD3, Mothers against decapentaplegic homolog 3; SMNDC1, Survival motor neuron domain containing 1; SNP, Single nucleotide polymorphism; SOX1, SRY (sex determining region Y)-box 1; SPP1, Secreted phosphoprotein 1 isoform a; STAT1, Signal transducer and activator of transcription 1; STAT5B, Signal transducer and activator of transcription 5B; TCF7L2, Transcription factor 7-like 2 isoform 1; TRIM9, Tripartite motif protein 9 isoform 1; TrKA, Neurotrophic tyrosine kinase, receptor, type 1; Trp53, Tumor protein p53; UTP11L, UTP11-like, U3 small nucleolar; VEGFA, Vascular endothelial growth factor A isoform a; WT1, Homo sapiens Wilms tumor upstream neighbor 1, mRNA; ZF5, Zinc finger protein 161. ⁎ Corresponding author at: School of Pharmacy- Worcester/Manchester, Massachusetts College of Pharmacy and Health Sciences, 19 Foster Street, Worcester, MA 01608, USA. Tel.: + 1 508 373 5643; fax: +1 508 890 5618. E-mail address: [email protected] (G.K. Acquaah-Mensah). 0378-1119/$ – see front matter © 2011 Elsevier B.V. All rights reserved. doi:10.1016/j.gene.2011.09.017 Contents lists available at SciVerse ScienceDirect Gene journal homepage: www.elsevier.com/locate/gene
-
Upload
independent -
Category
Documents
-
view
0 -
download
0
Transcript of PACAP interactions in the mouse brain: Implications for behavioral and other disorders
Gene 491 (2012) 224–231
Contents lists available at SciVerse ScienceDirect
Gene
j ourna l homepage: www.e lsev ie r .com/ locate /gene
PACAP interactions in the mouse brain: Implications for behavioral andother disorders
George K. Acquaah-Mensah a,⁎, Ronald C. Taylor b, Sanjiv V. Bhave c
a Department of Pharmaceutical Sciences, Massachusetts College of Pharmacy and Health Sciences, Worcester, MA, USAb Computational Biology & Bioinformatics Group, Pacific Northwest National Laboratory (U.S. Dept of Energy), Richland, WA, USAc Department of Pharmacology, University of Colorado School of Medicine, Aurora, CO, USA
Abbreviations: Adcy7, Adenylate cyclase 7; Adcyap1,4-isoxazole-propionate; AMPK, 5'-prime-AMP-activatedAccurate Cellular Networks; BRAF, B-Raf; cAMP, CyclicInterest ontology; CKROX, Zinc finger and BTB domainprotein 1; CTSB, Cathepsin B preproprotein; DBP, D sitto EBX transcription factor; ER, Estrogen receptor 1; FAGO-CC, Cellular Compartment; GO-MF, Molecular functisynthase kinase-3beta; GULP1, GULP, engulfment adapttransferase isoform 1; HTR2A, 5-hydroxytryptamine (sesubstrate 2; KEGG, Kyoto Encyclopedia of Genes and Gekinase 1; MAZ, MYC-associated zinc finger protein isofomyeloblastosis viral oncogene homolog; V-MYB, v-mybP53, Tumor protein p53; p75NTR, Nerve growth factor rPAINT, Promoter Analysis and Interaction Network ToolCatalytic unit of PI 3-kinase; PIK3R1, Regulatory subuniRegulatory Modules; PRKAA1, Catalytic subunit of AMPKAnalysis; RORA, RAR-related orphan receptor A isoformnase binding protein 1 isoform a; SIX3, SIX homeobox 3nucleotide polymorphism; SOX1, SRY (sex determiningSTAT5B, Signal transducer and activator of transcriptionkinase, receptor, type 1; Trp53, Tumor protein p53; UTPtumor upstream neighbor 1, mRNA; ZF5, Zinc finger pro⁎ Corresponding author at: School of Pharmacy-Worce
508 373 5643; fax: +1 508 890 5618.E-mail address: [email protected]
0378-1119/$ – see front matter © 2011 Elsevier B.V. Aldoi:10.1016/j.gene.2011.09.017
a b s t r a c t
a r t i c l e i n f oArticle history:Accepted 9 September 2011Available online 29 September 2011
Received by A.J. van Wijnen
Keywords:PACAPNetwork inferenceAdenylate cyclaseGsk3bSgk3PI 3-kinase
As an activator of adenylate cyclase, the neuropeptide Pituitary Adenylate Cyclase Activating Peptide(PACAP) impacts levels of cyclic AMP, a key second messenger available in brain cells. PACAP is involved incertain adult behaviors. To elucidate PACAP interactions, a compendium of microarrays representing mRNAexpression in the adult mouse whole brain was pooled from the Phenogen database for analysis. A regulatorynetwork was computed based on mutual information between gene pairs using gene expression data acrossthe compendium. Clusters among genes directly linked to PACAP, and probable interactions between corre-sponding proteins were computed. Database “experts” affirmed some of the inferred relationships. The find-ings suggest ADCY7 is probably the adenylate cyclase isoform most relevant to PACAP's action. They alsosupport intervening roles for kinases including GSK3B, PI 3-kinase, SGK3 and AMPK. Other high-confidenceinteractions are hypothesized for future testing. This new information has implications for certain behavioraland other disorders.
Gene for Pituitary Adenylate Cyclase Activating Peptide;protein kinase; ANKRD6, Ankyrin repeat domain 6; AP-1adenosine 3',5'-monophosphate; CFLAR, CASP8 and FADcontaining 7B; CMYC, v-myc myelocytomatosis viral once of albumin promoter (albumin D-box); DDI, Domain-dF1, FAS-associated factor 1; GO, Gene Ontology; GO-BPon; GRIK2, Glutamate receptor, ionotropic, kainate 2; GRIor PTB domain containing; HNF3beta, Forkhead box A2;rotonin) receptor 2A; Igf1, Insulin-like growth factor-1;nomes; KID3, Zinc finger protein 354C; LRF, Zinc finger arm 2; MCODE, Molecular Complex Detection; MI, Mutualmyeloblastosis viral oncogene homolog; NKX2-5, NK2 treceptor (TNFR superfamily, member 16); PACAP, Pituitarset; PAX-3, Paired box gene 3; PEX13, Peroxisomal bioget 1 of phosphoinositide-3-kinase; PIP3, Inositol (3,4,5)-t; Prkg1, Type I cGMP-dependent protein kinase; RELA, vb; S100B, S100 calcium-binding protein, beta; SGK3, Se; SMAD3, Mothers against decapentaplegic homolog 3; Sregion Y)-box 1; SPP1, Secreted phosphoprotein 1 isof
5B; TCF7L2, Transcription factor 7-like 2 isoform 1; TRIM911L, UTP11-like, U3 small nucleolar; VEGFA, Vascular etein 161.ster/Manchester, Massachusetts College of Pharmacy and H
(G.K. Acquaah-Mensah).
l rights reserved.
© 2011 Elsevier B.V. All rights reserved.
1. Introduction
The protein Pituitary Adenylate Cyclase Activating Peptide (PACAP),encoded by the gene Adcyap1, is not only a hypophysiotropic hormone,
but also functions as a neurotransmitter and neuromodulator. As a neu-romodulator, it can function in a neuroprotective role (Dejda et al.,2005). PACAP's neuroprotective functions have relevant implicationsbeyond the developmental window. Its activity can also affect
AKT, Protein kinase B; AMPA, Alpha-amino-3-hydroxyl-5-methyl-, Activator Protein 1; ARACNE, Algorithm for the Reconstruction ofD-like apoptosis regulator isoform; ChEBI, Chemicals of Biologicalogene homolog (avian); CREB, cAMP responsive element bindingomain interaction; DPI, Data Processing Inequality; EBX, Similar, Biological Process; GO-BP-ChEBI, GO cross product with ChEBI;N2B, N-methyl-D-aspartate receptor subunit 2B; GSK3B, GlycogenHNF4, Hepatocyte nuclear factor 4; HNMT, Histamine N-methyl-Igf1r, Insulin-like growth factor-1 receptor; IRS2, Insulin receptornd BTB domain containing 7a; MAPK1, Mitogen-activated proteinInformation; MLE, Maximum Likelihood Estimation; MYB, v-mybanscription factor related, locus 5; NMDA, N-methyl-D-aspartate;y Adenylate Cyclase Activating Peptide; PAC1R, PACAP receptor I;nesis factor 13; Pheno, Mammalian Phenotype Ontology; PIK3CA,risphosphate; PPI, Protein-protein interaction; PreMod, Predicted-rel reticuloendotheliosis viral oncogene; RMA, Robust MultiArrayrum/glucocorticoid regulated kinase 3; SH3KBP1, SH3-domain ki-MNDC1, Survival motor neuron domain containing 1; SNP, Singleorm a; STAT1, Signal transducer and activator of transcription 1;, Tripartite motif protein 9 isoform 1; TrKA, Neurotrophic tyrosinendothelial growth factor A isoform a; WT1, Homo sapiens Wilms
ealth Sciences, 19 Foster Street,Worcester, MA 01608, USA. Tel.: +1
225G.K. Acquaah-Mensah et al. / Gene 491 (2012) 224–231
neurodegenerative disorders such as Alzheimer's disease (Onoue et al.,2002). PACAP activity may also be relevant for other neurotoxic and re-lated injuries.
PACAP is a member of the PACAP/glucagon superfamily of hor-mones. Othermembers of this superfamily include vasoactive intestinalpolypeptide, GH-releasing hormone, glucagon, glucagon-like peptide-1,glucagon-like peptide-2, peptide histidine methionine, secretin, andglucose-dependent insulinotropic polypeptide. (See reviewby Sherwoodet al., (2000)). Perhaps as an indication of the fundamental role it plays inbiology PACAP is the most highly conserved member within the super-family both in terms of its sequence length and of its identity across anarray of species (Sherwood et al., 2000). PACAP is present both in thebrain and periphery. Within the central nervous system, PACAP haswide distribution.
The important role of PACAP is underscored by observationsmade inits absence. Compared to wild-typemice, PACAP knockout mice exhibitincreased expression of pro-inflammatory cytokines, decreased expres-sion of an anti-inflammatory cytokine, and delayed recovery followingaxotomy of the facial nerve or a simulated crush (Armstrong et al.,2008). PACAP-deficient femalemice exhibit reduced number of parturi-tions relative to number of pairings, an indication of reduced fertility(Shintani et al., 2002). Moreover, increased propensity for sudden neo-natal mortality, probably due to compromised respiration, has beenreported in PACAP-deficient mice (Cummings et al., 2004). They re-spond abnormally to stress via the hypothamo-pituitary–adrenal axis,are less sensitive to neuropathic and inflammatory pain, and have al-tered circadian rhythm (Hashimoto et al., 2006). Regarding alcoholism,ethanol preference is increased while ethanol-induced hypnotic effectsand hypothermia are reduced in PACAP-deficient mice (Tanaka et al.,2010).
In this study, signaling associatedwith effects of PACAP in themousebrain is explored using computational algorithms operating on correla-tions seen in gene expression data. The regulatory gene-to-gene connec-tions generated suggest that the adenylate cyclase isoformmost directlyrelevant to the actions of PACAP is probably ADCY7 and that the state ofthe PACAP gene, Adcyap1, is tied to the state of the Gsk3b gene. Gsk3b inturn was found to be in similar gene expression relationships with anumber of genes, including Prkg1. Furthermore, feed-forward regulato-ry relationships formed by gene triplets were found between Adcyap1-Gsk3b and several genes including Adcy7, Pik3ca, Braf and Vegfa. Severalof these inferred relationships have implications for current under-standing of PACAP's effects on neuronal survival as well as its relation-ship to major depression and related disorders.
2. Methods
Four hundred and eleven whole mouse brain microarrays on theAffymetrix (www.affymetrix.com) Mouse Genome 430 2.0 Arrayplatform were pooled from the Phenogen database (Bhave et al.,2007). The specific arrays used are itemized in SupplementaryTable 1.
These arrays represent mRNA expression in the whole brains ofdifferent inbred and recombinant inbred strains of Mus musculus,each strain representing a form of network perturbation (genetic).Some arrays involved treatment with ethanol and represent a formof network perturbation (pharmacological). The mice used were 10to 12 weeks old. These data were background corrected, normalized,and log-transformed using the Robust MultiArray Analysis (RMA)procedure in the Bioconductor (www.bioconductor.org) affy softwarepackage in the R environment (www.r-project.org). Using the GeneOntology as a guide, a subset of the 2797 probe sets out of 45,102on the arrays representing genes involved in the regulation of neuro-transmitter levels, apoptosis, the response to oxidative stress, the re-sponse to inflammation, as well as subunits of receptors of glutamate,acetylcholine, γ-amino butyric acid, and catecholamines were selectedfor focus using a parser written in Lisp for that purpose.
The Algorithm for the Reconstruction of Accurate Cellular Networks(ARACNE) was used to infer transcriptional regulatory gene-to-geneconnections of the mouse brain based on these data (Margolin et al.,2006). The regulatory networks formed by these sets of connectionscapture parts of the transcriptional regulatory relationships that existbetween the various gene products represented at the nodes. These in-ferred networks were then viewed using Cytoscape (Shannon et al.,2003). Gene Ontology (GO) gene overrepresentation was analyzed inthe Cytoscape BINGO plug-in using the Hypergeometric test andmulti-ple testing correction applied using the Benjamini and Hochberg FalseDiscovery Rate correction set at 0.05.
2.1. ARACNE
This algorithm operates by way of several discrete steps. First, itcalculates the Mutual Information (MI) (Cover and Thomas, 2006)that exists between a given pair of Affymetrix probesets, and doesthat for all the possible pairs among the probesets of focus. The MI es-timate, I, is given by:
I X;Yð Þ ¼ ∑i;j
P xi;yj� �
logp xi;yj� �
p xið Þp yj� �
where the discrete variables, X and Y, represent two given probesets(e.g., genes) such as a transcription factor and its regulated gene target;xi and yi represent particular expression levels.
This means I (X;Y) is zero iff P(xi, yj)=P(xi)P(yj), i.e., I(X;Y)=0means the states (expression levels) of the two genes representedare independent of each other. Thus, MI ranges between 0 and 1, issymmetric, and is a measure of the amount of information that thestate of one gene provides on the state of the other across the set ofexperiments. The MI in this way establishes the presence (or absence)of a dependence in state between variables X and Y (here, X and Y beinggenes). This dependence may be linear or non-linear. With the calcula-tion being nonparametric, independent of the probability distributionof calculated MI values, non-linear relationships will be capturedcorrectly.
Also, ARACNE utilizes the information theoretic property called theData Processing Inequality (DPI) to eliminate candidate interactionsthat are more probably indirect than direct regulatory relationships(Cover and Thomas, 2006). Briefly, if genes g1 and g3 interact onlythrough a third gene, g2, then DPI asserts that:
I g1; g3ð Þ≤min I g1; g2ð Þ; I g2; g3ð Þ½ �:
In otherwords, each such gene triplet found in ARACNE's earlier stepwas examined and, in each case, the edge with the smallest value wasremoved. Calculations for the DPI require a certain “DPI tolerance”needed for a ranking of the I values, to minimize the impact of the Ivalue variance. This is because errors in this estimate can affect theranking. For these studies, the DPI tolerance was set at 0.15.
Thus, ARACNE was applied to the processed microarray dataset,using what the ARACNE documentation calls the “accurate” versionof the algorithm at a kernel width of 0.124. As part of the run, usingthe tool GeneInfoViz, we identified a set of potential transcriptionalregulators on which to focus. Out of the 2797 probesets (genes) offocus, GeneInfoViz was used to designate a subset of 298 probesets(representing transcription factors as classified in the Gene Ontology)as potential regulators (Zhou and Cui, 2004).
2.2. Maximum Likelihood Estimation
The Cytoscape (Shannon et al., 2003) Cytoprophet plug-in was usedto infer probable protein–protein interactions among products of geneslinked to Adcyap1. The subset of the results of the ARACNE runs that
226 G.K. Acquaah-Mensah et al. / Gene 491 (2012) 224–231
includes Adcyap1 was used as input. Specifically, we employed the ro-bust method proposed by Deng et al., (2002) which applies the Maxi-mum Likelihood Estimation (MLE) algorithm (Deng et al., 2002) toinfer interacting domains consistent with observed protein–proteininteractions.
2.3. MCODE
The Molecular Complex Detection (MCODE) algorithm (Baderand Hogue, 2003) was also applied to products of the results of theARACNE runs that involved Adcyap1. MCODE performs a topologicalanalysis to find significant clusters in a network based on high intra-cluster connectivity, and it has been effective at detecting knownprotein complexes and groups of functionally engaged proteinswithin protein networks. The MCODE plug-in of Cytoscape (Shannonet al., 2003) was used.
2.4. Hanalyzer
In further analyzing the direct neighborhood of the PACAP gene inthe network, the Hanalyzer software method of Leach et al., (2009),was used (Leach et al., 2009). As input, 10,763MI relationships obtainedfrom the ARACNE run on the gene expression data just described madeup theData Network. AKnowledge Network of assertionsmade by a num-ber of knowledge “experts”was subsequently generated. The Hanalyzersoftware then performed integration of the Data and Knowledge Net-works, producing a single combined score for each proposed gene-to-gene relationship. The experts in the Knowledge Networks includedthe Gene Ontology (GO), the Kyoto Encyclopedia of Genes andGenomes(KEGG), theMammalian Phenotype Ontology (Pheno), the Chemicals ofBiological Interest ontology (ChEBI) and Interpro (as referenced by Leachet al., (2009)). These experts provided evidence of “indirect” relation-ships between genes or gene products. For example, an indirect relation-ship is asserted by the KEGG expert if two genes belong to the sameKEGG pathway. Similarly, the sub-ontologies of GO (Biological Process(GO-BP), Molecular function (GO-MF), and Cellular Compartment(GO-CC)) make relationship assertions between genes/gene productson the basis of shared association with terms and hierarchies. In addi-tion, a GO cross-product resource, the cross product with ChEBI(GO-BP-ChEBI) was used as an expert and made relationship assertions(Bada and Hunter, 2007). In applying GO-BP-ChEBI, a relationshipbetween two genes or gene products was asserted if the genes werelinked to GO-BP terms that are associated with the same ChEBI term.The Interpro expert asserted a relationship if given gene products(proteins) shared common domains. Also, relationships were assertedbetween pairs of genes if theywere linked to the sameMammalian Phe-notypeOntology (Pheno) term. OurHanalyzer analysis also used predic-tive experts such as the database of Predicted Regulatory Modules(PreMod), which takes advantage of putative transcription factor bind-ing sites in theBiobase TRANSFAC database (Wingender, 2008). The Pre-Mod2Gene expert relates a transcription factor recognizing a motif in aregulatorymodule to upstreamanddownstreamgenes, andmakes rela-tionship assertions based on that.
A possible limitation of certain expert assertions is that contextualinformation does not get incorporated. For instance, an interaction thatoccurs within the context of neurodevelopment would translate intoan assertion of a relationship. Such an assertion would not necessarilybe valid in a context outside of the neurodevelopmental window.More-over, certain interactions are species- or anatomical region-specific.
This and other limitations are assuaged somewhat via the solicitationof consensus between experts. Each assertion made within the Hanaly-zer tool by these experts regarding a relationship has aweight computedusing the Noisy-OR function of the reliability of the experts. Consensusamong the various experts provided a reliability estimate of the likeli-hood of a true relationship between the each pair of genes examined.Thus, overall, the reliability estimate is based on the gene expression
data based on which the input relationships were inferred via ARACNE,as well as the subsequent assertions made by the experts.
2.5. Promoter region analysis
The possibility of co-regulation of genes represented at the nodes ofthe networkwas investigated using version 4.0 of the Promoter Analysisand InteractionNetwork Toolset (PAINT) (Vadigepalli et al., 2003). Tran-scription factors and putative binding sites in the BioBase TRANSFAC da-tabase were used in the analysis (Wingender, 2008). We set the lengthof the upstream region to 2000 bases for each mouse gene examined.The core similarity threshold, a measure of the quality of the match be-tween the sequence being studied and the fivemost conserved positionsin the matrix, was set at 1.0.
3. Results
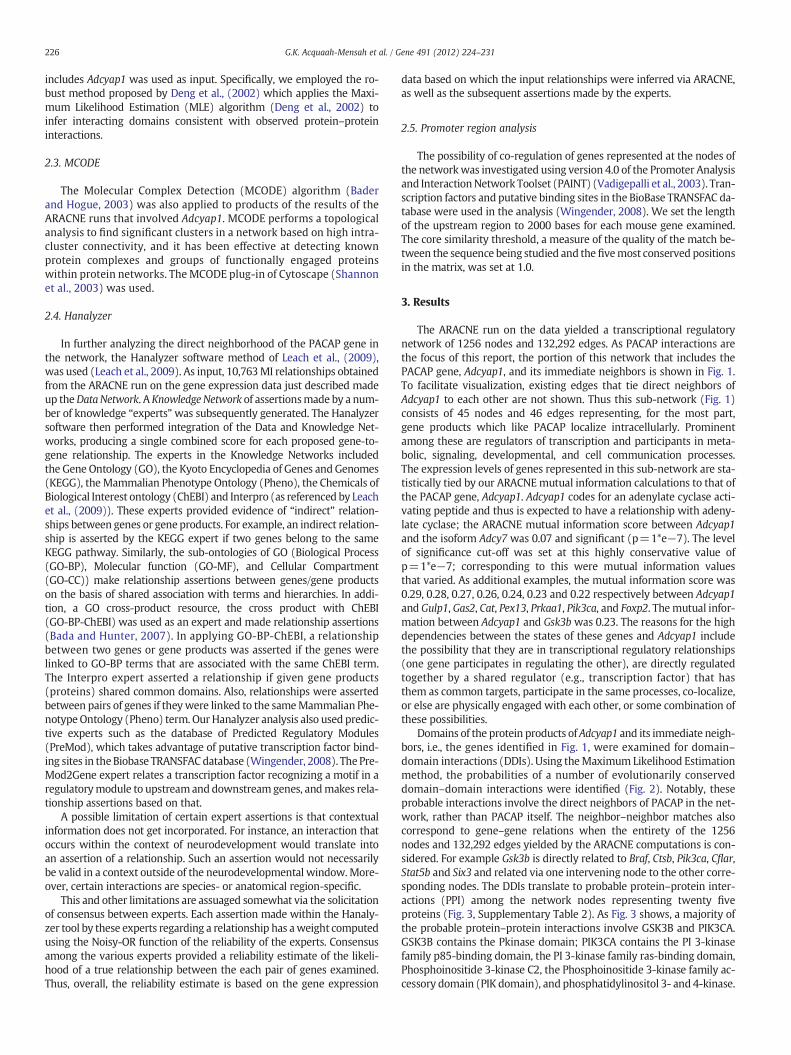
The ARACNE run on the data yielded a transcriptional regulatorynetwork of 1256 nodes and 132,292 edges. As PACAP interactions arethe focus of this report, the portion of this network that includes thePACAP gene, Adcyap1, and its immediate neighbors is shown in Fig. 1.To facilitate visualization, existing edges that tie direct neighbors ofAdcyap1 to each other are not shown. Thus this sub-network (Fig. 1)consists of 45 nodes and 46 edges representing, for the most part,gene products which like PACAP localize intracellularly. Prominentamong these are regulators of transcription and participants in meta-bolic, signaling, developmental, and cell communication processes.The expression levels of genes represented in this sub-network are sta-tistically tied by our ARACNEmutual information calculations to that ofthe PACAP gene, Adcyap1. Adcyap1 codes for an adenylate cyclase acti-vating peptide and thus is expected to have a relationship with adeny-late cyclase; the ARACNE mutual information score between Adcyap1and the isoform Adcy7 was 0.07 and significant (p=1*e−7). The levelof significance cut-off was set at this highly conservative value ofp=1*e−7; corresponding to this were mutual information valuesthat varied. As additional examples, the mutual information score was0.29, 0.28, 0.27, 0.26, 0.24, 0.23 and 0.22 respectively between Adcyap1and Gulp1, Gas2, Cat, Pex13, Prkaa1, Pik3ca, and Foxp2. Themutual infor-mation between Adcyap1 and Gsk3b was 0.23. The reasons for the highdependencies between the states of these genes and Adcyap1 includethe possibility that they are in transcriptional regulatory relationships(one gene participates in regulating the other), are directly regulatedtogether by a shared regulator (e.g., transcription factor) that hasthem as common targets, participate in the same processes, co-localize,or else are physically engaged with each other, or some combination ofthese possibilities.
Domains of the protein products of Adcyap1 and its immediate neigh-bors, i.e., the genes identified in Fig. 1, were examined for domain–domain interactions (DDIs). Using theMaximum Likelihood Estimationmethod, the probabilities of a number of evolutionarily conserveddomain–domain interactions were identified (Fig. 2). Notably, theseprobable interactions involve the direct neighbors of PACAP in the net-work, rather than PACAP itself. The neighbor–neighbor matches alsocorrespond to gene–gene relations when the entirety of the 1256nodes and 132,292 edges yielded by the ARACNE computations is con-sidered. For example Gsk3b is directly related to Braf, Ctsb, Pik3ca, Cflar,Stat5b and Six3 and related via one intervening node to the other corre-sponding nodes. The DDIs translate to probable protein–protein inter-actions (PPI) among the network nodes representing twenty fiveproteins (Fig. 3, Supplementary Table 2). As Fig. 3 shows, a majority ofthe probable protein–protein interactions involve GSK3B and PIK3CA.GSK3B contains the Pkinase domain; PIK3CA contains the PI 3-kinasefamily p85-binding domain, the PI 3-kinase family ras-binding domain,Phosphoinositide 3-kinase C2, the Phosphoinositide 3-kinase family ac-cessory domain (PIK domain), and phosphatidylinositol 3- and 4-kinase.
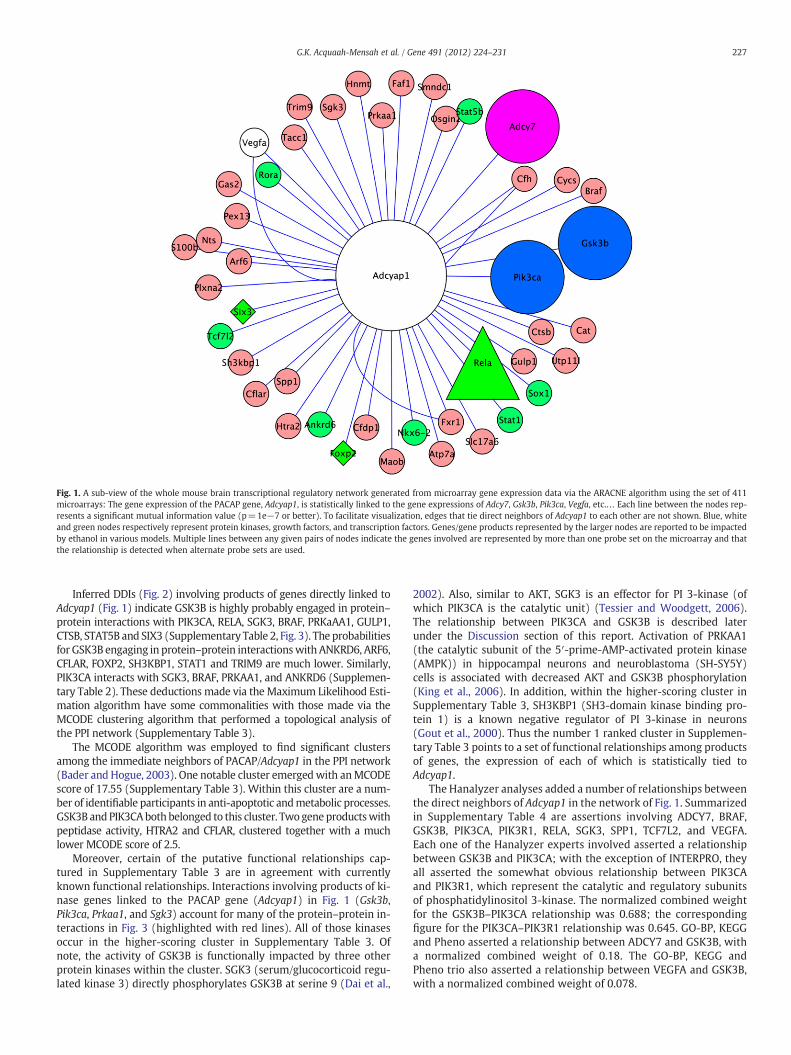
Fig. 1. A sub-view of the whole mouse brain transcriptional regulatory network generated from microarray gene expression data via the ARACNE algorithm using the set of 411microarrays: The gene expression of the PACAP gene, Adcyap1, is statistically linked to the gene expressions of Adcy7, Gsk3b, Pik3ca, Vegfa, etc.… Each line between the nodes rep-resents a significant mutual information value (p=1e−7 or better). To facilitate visualization, edges that tie direct neighbors of Adcyap1 to each other are not shown. Blue, whiteand green nodes respectively represent protein kinases, growth factors, and transcription factors. Genes/gene products represented by the larger nodes are reported to be impactedby ethanol in various models. Multiple lines between any given pairs of nodes indicate the genes involved are represented by more than one probe set on the microarray and thatthe relationship is detected when alternate probe sets are used.
227G.K. Acquaah-Mensah et al. / Gene 491 (2012) 224–231
Inferred DDIs (Fig. 2) involving products of genes directly linked toAdcyap1 (Fig. 1) indicate GSK3B is highly probably engaged in protein–protein interactions with PIK3CA, RELA, SGK3, BRAF, PRKaAA1, GULP1,CTSB, STAT5B and SIX3 (Supplementary Table 2, Fig. 3). The probabilitiesfor GSK3B engaging in protein–protein interactionswith ANKRD6, ARF6,CFLAR, FOXP2, SH3KBP1, STAT1 and TRIM9 are much lower. Similarly,PIK3CA interacts with SGK3, BRAF, PRKAA1, and ANKRD6 (Supplemen-tary Table 2). These deductions made via the Maximum Likelihood Esti-mation algorithm have some commonalities with those made via theMCODE clustering algorithm that performed a topological analysis ofthe PPI network (Supplementary Table 3).
The MCODE algorithm was employed to find significant clustersamong the immediate neighbors of PACAP/Adcyap1 in the PPI network(Bader and Hogue, 2003). One notable cluster emergedwith anMCODEscore of 17.55 (Supplementary Table 3). Within this cluster are a num-ber of identifiable participants in anti-apoptotic andmetabolic processes.GSK3B andPIK3CAboth belonged to this cluster. Twogene productswithpeptidase activity, HTRA2 and CFLAR, clustered together with a muchlower MCODE score of 2.5.
Moreover, certain of the putative functional relationships cap-tured in Supplementary Table 3 are in agreement with currentlyknown functional relationships. Interactions involving products of ki-nase genes linked to the PACAP gene (Adcyap1) in Fig. 1 (Gsk3b,Pik3ca, Prkaa1, and Sgk3) account for many of the protein–protein in-teractions in Fig. 3 (highlighted with red lines). All of those kinasesoccur in the higher-scoring cluster in Supplementary Table 3. Ofnote, the activity of GSK3B is functionally impacted by three otherprotein kinases within the cluster. SGK3 (serum/glucocorticoid regu-lated kinase 3) directly phosphorylates GSK3B at serine 9 (Dai et al.,
2002). Also, similar to AKT, SGK3 is an effector for PI 3-kinase (ofwhich PIK3CA is the catalytic unit) (Tessier and Woodgett, 2006).The relationship between PIK3CA and GSK3B is described laterunder the Discussion section of this report. Activation of PRKAA1(the catalytic subunit of the 5′-prime-AMP-activated protein kinase(AMPK)) in hippocampal neurons and neuroblastoma (SH-SY5Y)cells is associated with decreased AKT and GSK3B phosphorylation(King et al., 2006). In addition, within the higher-scoring cluster inSupplementary Table 3, SH3KBP1 (SH3-domain kinase binding pro-tein 1) is a known negative regulator of PI 3-kinase in neurons(Gout et al., 2000). Thus the number 1 ranked cluster in Supplemen-tary Table 3 points to a set of functional relationships among productsof genes, the expression of each of which is statistically tied toAdcyap1.
The Hanalyzer analyses added a number of relationships betweenthe direct neighbors of Adcyap1 in the network of Fig. 1. Summarizedin Supplementary Table 4 are assertions involving ADCY7, BRAF,GSK3B, PIK3CA, PIK3R1, RELA, SGK3, SPP1, TCF7L2, and VEGFA.Each one of the Hanalyzer experts involved asserted a relationshipbetween GSK3B and PIK3CA; with the exception of INTERPRO, theyall asserted the somewhat obvious relationship between PIK3CAand PIK3R1, which represent the catalytic and regulatory subunitsof phosphatidylinositol 3-kinase. The normalized combined weightfor the GSK3B–PIK3CA relationship was 0.688; the correspondingfigure for the PIK3CA–PIK3R1 relationship was 0.645. GO-BP, KEGGand Pheno asserted a relationship between ADCY7 and GSK3B, witha normalized combined weight of 0.18. The GO-BP, KEGG andPheno trio also asserted a relationship between VEGFA and GSK3B,with a normalized combined weight of 0.078.
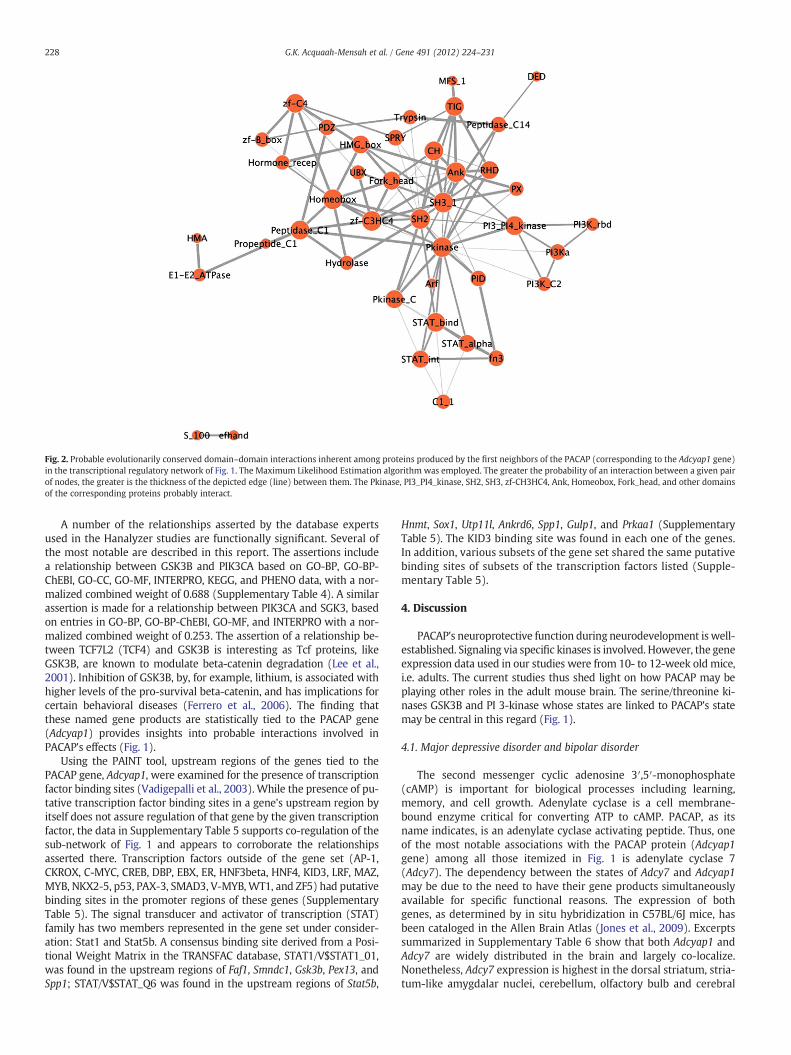
Fig. 2. Probable evolutionarily conserved domain–domain interactions inherent among proteins produced by the first neighbors of the PACAP (corresponding to the Adcyap1 gene)in the transcriptional regulatory network of Fig. 1. The Maximum Likelihood Estimation algorithm was employed. The greater the probability of an interaction between a given pairof nodes, the greater is the thickness of the depicted edge (line) between them. The Pkinase, PI3_PI4_kinase, SH2, SH3, zf-CH3HC4, Ank, Homeobox, Fork_head, and other domainsof the corresponding proteins probably interact.
228 G.K. Acquaah-Mensah et al. / Gene 491 (2012) 224–231
A number of the relationships asserted by the database expertsused in the Hanalyzer studies are functionally significant. Several ofthe most notable are described in this report. The assertions includea relationship between GSK3B and PIK3CA based on GO-BP, GO-BP-ChEBI, GO-CC, GO-MF, INTERPRO, KEGG, and PHENO data, with a nor-malized combined weight of 0.688 (Supplementary Table 4). A similarassertion is made for a relationship between PIK3CA and SGK3, basedon entries in GO-BP, GO-BP-ChEBI, GO-MF, and INTERPRO with a nor-malized combined weight of 0.253. The assertion of a relationship be-tween TCF7L2 (TCF4) and GSK3B is interesting as Tcf proteins, likeGSK3B, are known to modulate beta-catenin degradation (Lee et al.,2001). Inhibition of GSK3B, by, for example, lithium, is associated withhigher levels of the pro-survival beta-catenin, and has implications forcertain behavioral diseases (Ferrero et al., 2006). The finding thatthese named gene products are statistically tied to the PACAP gene(Adcyap1) provides insights into probable interactions involved inPACAP's effects (Fig. 1).
Using the PAINT tool, upstream regions of the genes tied to thePACAP gene, Adcyap1, were examined for the presence of transcriptionfactor binding sites (Vadigepalli et al., 2003). While the presence of pu-tative transcription factor binding sites in a gene's upstream region byitself does not assure regulation of that gene by the given transcriptionfactor, the data in Supplementary Table 5 supports co-regulation of thesub-network of Fig. 1 and appears to corroborate the relationshipsasserted there. Transcription factors outside of the gene set (AP-1,CKROX, C-MYC, CREB, DBP, EBX, ER, HNF3beta, HNF4, KID3, LRF, MAZ,MYB, NKX2-5, p53, PAX-3, SMAD3, V-MYB,WT1, and ZF5) had putativebinding sites in the promoter regions of these genes (SupplementaryTable 5). The signal transducer and activator of transcription (STAT)family has two members represented in the gene set under consider-ation: Stat1 and Stat5b. A consensus binding site derived from a Posi-tional Weight Matrix in the TRANSFAC database, STAT1/V$STAT1_01,was found in the upstream regions of Faf1, Smndc1, Gsk3b, Pex13, andSpp1; STAT/V$STAT_Q6 was found in the upstream regions of Stat5b,
Hnmt, Sox1, Utp11l, Ankrd6, Spp1, Gulp1, and Prkaa1 (SupplementaryTable 5). The KID3 binding site was found in each one of the genes.In addition, various subsets of the gene set shared the same putativebinding sites of subsets of the transcription factors listed (Supple-mentary Table 5).
4. Discussion
PACAP's neuroprotective function during neurodevelopment is well-established. Signaling via specific kinases is involved. However, the geneexpression data used in our studies were from 10- to 12-week old mice,i.e. adults. The current studies thus shed light on how PACAP may beplaying other roles in the adult mouse brain. The serine/threonine ki-nases GSK3B and PI 3-kinase whose states are linked to PACAP's statemay be central in this regard (Fig. 1).
4.1. Major depressive disorder and bipolar disorder
The second messenger cyclic adenosine 3′,5′-monophosphate(cAMP) is important for biological processes including learning,memory, and cell growth. Adenylate cyclase is a cell membrane-bound enzyme critical for converting ATP to cAMP. PACAP, as itsname indicates, is an adenylate cyclase activating peptide. Thus, oneof the most notable associations with the PACAP protein (Adcyap1gene) among all those itemized in Fig. 1 is adenylate cyclase 7(Adcy7). The dependency between the states of Adcy7 and Adcyap1may be due to the need to have their gene products simultaneouslyavailable for specific functional reasons. The expression of bothgenes, as determined by in situ hybridization in C57BL/6J mice, hasbeen cataloged in the Allen Brain Atlas (Jones et al., 2009). Excerptssummarized in Supplementary Table 6 show that both Adcyap1 andAdcy7 are widely distributed in the brain and largely co-localize.Nonetheless, Adcy7 expression is highest in the dorsal striatum, stria-tum-like amygdalar nuclei, cerebellum, olfactory bulb and cerebral
Fig. 3. A network of probable protein–protein interactions involving gene products whose corresponding gene expressions are linked to those of the PACAP gene, Adcyap1, as captured inFigs. 1 and 2. Protein–protein interactions involving the highlighted nodes representing GSK3B, PIK3CA, PRKAA1, and SGK3 represented by the red lines probably impact a major propor-tion of the protein products of genes directly linked to PACAP. Some relevant probabilities are shown in Supplementary Table 2.
229G.K. Acquaah-Mensah et al. / Gene 491 (2012) 224–231
cortex; levels in the lateral septal complex are low. Although they co-localize for the most part, the regional distribution of the nine iso-forms of adenylate cyclase in the brain suggests, in certain instances,that they are functionally specialized. For instance, there is evidencein specific cell types that ADCY7 is the effector isoform that actsdownstream of pathways that include alpha subunits of the GTP-binding proteins G12 or G13 (Jiang et al., 2008).
The tie between the PACAP gene (Adcyap1) and Adcy7 is affirmedby observations made in relation to major depressive disorder. Thereis evidence that Adcy7 expression may be critical in behaviors associ-ated with major depressive disorder (Hines et al., 2006). The productof the effector action of adenylate cyclases (such as ADCY7) is the sec-ond messenger cAMP. Pathways associated with cAMP appear to bedisrupted in the cerebellum in major depression, schizophrenia, andbipolar disorder (Fatemi et al., 2010). Furthermore, an association be-tween PACAP and major depression has been reported (Hashimoto etal., 2010). A G/A single nucleotide polymorphism (SNP) in theAdcyap1 gene's Intron 1 is associated with the disorder, with anodds ratio of 0.78 (95% confidence interval) (Hashimoto et al.,2010). In relation to this, there are two previous observations ofnote: First, individuals with major depression have decreased hippo-campal volumes on the left and the right sides (Sheline et al., 1996).Second, in a study of schizophrenia patients, individuals with the Gallele at the same location have smaller hippocampal volumes thanthose with the A allele (Hashimoto et al., 2007). Also, PACAP-deficientmice responded to a variant of the forced swimming test behavioralmodel as though depressed and responded to both the tricyclic antide-pressant desipramine and the anti-psychotic risperidone (Hashimoto etal., 2009). The convergence of both PACAP (Adcyap1) and Adcy7 on
major depressive disorder suggests the PACAP-Adcy7 relationshipmay be critically important in psychiatry.
Another key PACAP association in Fig. 1 relevant to psychiatry isthat with Gsk3b (glycogen synthase kinase-3beta). The PACAP–GSK3B correlation is also alluded to by associations with the PACAPreceptor, PAC1R. Indeed a SNP in the PAC1R gene is associated withpost-traumatic stress syndrome incidence in human females (Ressleret al., 2011). PACAP acts at the PAC1R receptor which is coupled to theG protein Gq (Macdonald et al., 2005). The gene for the alpha subunitof Gq, Gnaq, is linked to Gsk3b in Supplementary Fig. 1a.
Among Chinese subjects with major depression, four commonpolymorphisms of the Gsk3b gene have been found to be associatedwith the response to selective serotonin re-uptake inhibitor antide-pressants (Tsai et al., 2008). Lithium, which is widely used in thetreatment of bipolar disorder, inhibits GSK3B at therapeutically rele-vant concentrations (Ki=2 mM) (Klein and Melton, 1996). Lithiumalso inhibits the dephosphorylation of the inactive form of theGSK3B enzyme, thus keeping it inactive (Jope, 2003). In PC12 cells,PACAP (the Adcyap1 product) induces phosphorylation of the serine9 residue of GSK3B, rendering it less active; lithium enhances thisphosphorylation (Zhang et al., 2009). This kind of regulatory relation-ship could, at least in part, account for the Adcyap1–Gsk3b edge in thenetwork shown in Fig. 1, and underscores the need for these twofunctionally related genes to be co-expressed. In addition to thisPACAP (Adcyap1)–Gsk3b relationship, there is a dependency betweenAdcy7 and Gsk3b (Supplementary Fig. 1a). Mangan and Alon have de-scribed a variety of feed-forward loops in which two transcriptionfactor genes, one of which regulates the other, jointly target a thirdgene for regulatory purposes (Mangan and Alon, 2003). The logic
230 G.K. Acquaah-Mensah et al. / Gene 491 (2012) 224–231
may be extended to regulatory relationships involving other non-tran-scription factor proteins that also act in a regulatory role (e.g., signaling,co-factor, TF stabilizers, etc.). Given the relationships just discussed be-tween PACAP (Adcyap1) and Adcy7, and between PACAP and Gsk3b, theAdcy7–Gsk3b edge suggests a feed-forwardmotif within the broader net-work consisting of Adcyap1–Adcy7–Gsk3b which needs to be further de-lineated. It may be inferred from Fig. 1 and Supplementary Figs. 1a andb together that similar feed-forward motifs involving Adcyap1–Gsk3band nodes such as Vegfa, Pik3ca, Rora, Six3, Stat5b, Braf, Ctsb, Cflar, andS100b exist and remain to be experimentally confirmed.
The state of Gsk3b is linked to the state of Prkg1 (type I cGMP-de-pendent protein kinase) (Supplementary Fig. 1a). There is cross-talkbetween signaling associated with cAMP and cyclic 3′–5′ guanosinemonophosphate (cGMP) signaling (Pelligrino and Wang, 1998). LikecAMP signaling, cGMP signaling has been implicated in behaviors as-sociated with depression and schizophrenia (Kleppisch and Feil,2009). Indeed, Prkg1 is upregulated in the cerebella of patients withmajor depression (Fatemi et al., 2010). The specific nature of the di-rect ties between Gsk3b and Prkg1 in the mouse brain remains to beclearly defined.
As seen in Fig. 1 (and Supplementary Figs. 1a and b), both Adcyap1and Gsk3b are similarly directly linked to Pik3ca (the gene coding foralpha polypeptide catalytic subunit of phosphatidylinositol 3-kinase).PI 3-kinases phosphorylate phosphatidylinositol or its phosphorylatedderivatives to yield entities such as inositol (3,4,5)-trisphosphate (alsoknown as PIP3), which are critical in signaling and key cellular process-es. Inositol-related processes play a role in the effects of lithium (Agamet al., 2009). In Dictyostelium as well as HL60 (human neutrophil) cells,lithium suppresses PIP3 signaling (King et al., 2009). Furthermore, de-pletion of inositol in rat brain cortical slices leads to increased ex-pression of the PACAP gene, Adcyap1 (Brandish et al., 2005). It isalso reported that an inhibitor of PI 3-kinase, wortmannin, reducesPACAP-induced phosphorylation of GSK3B in PC12 cells (Zhang etal., 2009). The dependencies between Adcyap1, Gsk3b, and Pik3capreviously reported are supported by our new analysis and mayhave implications for other contexts in which one or other memberof the trio is engaged.
4.2. Other effects linked to PI 3-kinase
The state of the Pik3ca gene is directly correlated not only withthose of PACAP (Adcyap1) and Gsk3b, but also with the states of thegenes Pik3r1,Mapk1, Trp53, Igf1, Igfr1, Grin2b, Grik2 and several others(Supplementary Fig. 1b). The Pik3r1 gene codes for the regulatory sub-unit of the PI 3-kinase enzyme; Pik3ca codes for its catalytic subunit. Thecorrelation in expression seen between Pik3ca and Pik3r1 links them ascommon targets, tightly regulated together, as one would expect giventheir shared construction of the enzyme. Concerning the relationshipbetween Pik3ca and Mapk1 (mitogen-activated protein kinase 1/extra-cellular signal-related kinase 2), PI 3-kinase is an upstream regulatorof Mapk signaling in NMDA-dependent long-term potentiation inmouse CA1 hippocampal slices (Opazo et al., 2003). Observations inthe literature such as this explain the tight correlation in the expres-sions of the Pik3ca and Mapk1 genes. Trp53 (p53) is another genewhose expression is linked to Pik3ca (Supplementary Fig. 1b). PI 3-ki-nase is known to activate Akt (protein kinase B) which is responsiblefor regulating the activities of GSK3B and a number of transcription fac-tors including p53 to typically favor survival (Chong et al., 2005). Thecorrelation in expression between Pik3ca and Trp53 reflects and is addi-tional evidence for these regulatory relationships.
Pik3ca is also linked to that of the senescence regulator, Igf1 (insulin-like growth factor-1), and also to its receptor Igf1r by gene expressioncorrelations as determined by the ARACNE algorithm (SupplementaryFig. 1b). Within the context of the aging-associated switch betweenthe neurotrophin receptors TrkA and p75NTR, signaling events down-stream of Igf1r require Irs2, PIP3, and activation of Akt (Costantini et
al., 2006). Thus PI 3-kinase is critical in this regard. In HCN2 (humanneuronal) cells, phospholipid transfer protein (PLTP)-induced increasein serine 9 phosphorylation of GSK3B requires PI 3-kinase. The PLTP-mediated activation of the PI 3-kinase/Akt pathway is dependent on in-sulin receptor/IGFR receptor tyrosine kinase activity (Dong et al., 2009).Interactions such as this could explain why Pik3ca, Igf1, Igf1r, and Gsk3bare so tightly related in their expression.
In Supplementary Fig. 1b, Pik3ca is correlated with those of gluta-mate receptor subunit genes Grik2 and Grin2b. PI 3-kinase activity is,indeed, also associated with glutamate receptor signaling. Glutamatereceptor subtypes AMPA (alpha-amino-3-hydroxyl-5-methyl-4-iso-xazole-propionate)/kainite, and NMDA (N-methyl-D-aspartate)show this association in certain contexts (Waxman and Lynch, 2005).
As detailed above, the findings of these exploratory studies areconsistent with several known interactions. This work underscoresthe capacity of network inference algorithms to assemble and affirmknown relations as well as to point to novel relationships and interac-tions among genes and gene products. Using the expression-basedgene-to-gene connections found to involve Adcyap1, we were ableto further analyze this gene neighborhood around Adcyap1 to findprotein–protein interactions and functional relationships that helpin determining how PACAP functions. Among others, the results indi-cate intervening roles of key serine/threonine kinases includingGSK3B, PI 3-kinase, SGK3 and AMPK.
The findings also reveal several probable links between PACAP andgenes/gene products that have not previously been characterized.These links include those with ANKRD6, BRAF, GULP1, PRKAA1,RELA, SGK3, SH3KBP1, STAT1, STAT5B, TRIM9, TCF7L2, CTSB, andSPP1. These implicitly hypothesized interactions, affirmed across dif-ferent approaches, are thus worthy of further investigation. Thesefindings have implications for a variety of behavioral and neurode-generative disorders.
Supplementary materials related to this article can be found on-line at doi:10.1016/j.gene.2011.09.017.
Acknowledgments
GAM has been supported by resources of the Massachusetts Collegeof Pharmacy andHealth Sciences. RCTwas supported by the “Genomics:GTL Foundational Scientific Focus Area (FSFA) on Biological Systems In-teractions” project under U.S. Dept. of Energy Contract 56812. PacificNorthwest National Laboratory is operated by Battelle for the U.S.Dept. of Energy under Contract DE-AC05-76RL01830.
References
Agam, G., Bersudsky, Y., Berry, G.T., Moechars, D., Lavi-Avnon, Y., Belmaker, R.H., 2009.Knockout mice in understanding the mechanism of action of lithium. Biochem. Soc.Trans. 37, 1121–1125.
Armstrong, B.D., et al., 2008. Impaired nerve regeneration and enhanced neuroinflam-matory response in mice lacking pituitary adenylyl cyclase activating peptide.Neuroscience 151, 63–73.
Bada, M., Hunter, L., 2007. Enrichment of OBO ontologies. J. Biomed. Inform. 40, 300–315.Bader, G.D., Hogue, C.W., 2003. An automated method for finding molecular complexes
in large protein interaction networks. BMC Bioinforma. 4, 2.Bhave, S.V., et al., 2007. The PhenoGen informatics website: tools for analyses of com-
plex traits. BMC Genet. 8, 59.Brandish, P.E., et al., 2005. Regulation of gene expression by lithium and depletion of
inositol in slices of adult rat cortex. Neuron 45, 861–872.Chong, Z.Z., Li, F., Maiese, K., 2005. Activating Akt and the brain's resources to drive cellular
survival and prevent inflammatory injury. Histol. Histopathol. 20, 299–315.Costantini, C., Scrable, H., Puglielli, L., 2006. An aging pathway controls the TrkA to p75NTR
receptor switch and amyloid beta-peptide generation. EMBO J. 25, 1997–2006.Cover, T.M., Thomas, J.A., 2006. Elements of Information Theory. Wiley-Interscience.Cummings, K.J., Pendlebury, J.D., Sherwood, N.M., Wilson, R.J., 2004. Sudden neonatal
death in PACAP-deficient mice is associated with reduced respiratory chemore-sponse and susceptibility to apnoea. J. Physiol. 555, 15–26.
Dai, F., et al., 2002. Human serum and glucocorticoid-inducible kinase-like kinase(SGKL) phosphorylates glycogen syntheses kinase 3 beta (GSK-3beta) at serine-9through direct interaction. Biochem. Biophys. Res. Commun. 293, 1191–1196.
Dejda, A., Sokolowska, P., Nowak, J.Z., 2005. Neuroprotective potential of three neuro-peptides PACAP, VIP and PHI. Pharmacol. Rep. 57, 307–320.
231G.K. Acquaah-Mensah et al. / Gene 491 (2012) 224–231
Deng, M., Mehta, S., Sun, F., Chen, T., 2002. Inferring domain–domain interactions fromprotein–protein interactions. Genome Res. 12, 1540–1548.
Dong,W., Albers, J.J., Vuletic, S., 2009. Phospholipid transfer protein reduces phosphoryla-tion of tau in human neuronal cells. J. Neurosci. Res. 87, 3176–3185.
Fatemi, S.H., Folsom, T.D., Reutiman, T.J., Vazquez, G., 2010. Phosphodiesterase signal-ing system is disrupted in the cerebella of subjects with schizophrenia, bipolar dis-order, and major depression. Schizophr. Res. 119, 266–267.
Ferrero, A., Cereseto, M., Sifonios, L., 2006. The relationship between the Wnt signalingand the psychiatric diseases. Vertex 17, 165–171.
Gout, I., et al., 2000. Negative regulation of PI 3-kinase by Ruk, a novel adaptor protein.EMBO J. 19, 4015–4025.
Hashimoto, H., Shintani, N., Baba, A., 2006. New insights into the central PACAPergicsystem from the phenotypes in PACAP- and PACAP receptor-knockout mice. Ann.N. Y. Acad. Sci. 1070, 75–89.
Hashimoto, R., et al., 2007. Pituitary adenylate cyclase-activating polypeptide is associ-ated with schizophrenia. Mol. Psychiatry. 12, 1026–1032.
Hashimoto, H., et al., 2009. Depression-like behavior in the forced swimming test inPACAP-deficient mice: amelioration by the atypical antipsychotic risperidone. J.Neurochem. 110, 595–602.
Hashimoto, R., et al., 2010. Possible association between the pituitary adenylatecyclase-activating polypeptide (PACAP) gene and major depressive disorder. Neu-rosci. Lett. 468, 300–302.
Hines, L.M., et al., 2006. World Health Organization/International Society for Biomedi-cal Research on Alcoholism Study on State and Trait Markers of Alcohol Use andDependence Investigators, a sex-specific role of type VII adenylyl cyclase in depres-sion. J. Neurosci. 26, 12609–12619.
Jiang, L.I., Collins, J., Davis, R., Fraser, I.D., Sternweis, P.C., 2008. Regulation of cAMP responses bythe G12/13 pathway converges on adenylyl cyclase VII. J. Biol. Chem. 283, 23429–23439.
Jones, A.R., Overly, C.C., Sunkin, S.M., 2009. The Allen Brain Atlas: 5 years and beyond.Nat. Rev. Neurosci. 10, 821–828.
Jope, R.S., 2003. Lithium and GSK-3: one inhibitor, two inhibitory actions, multiple out-comes. Trends Pharmacol. Sci. 24, 441–443.
King, T.D., Song, L., Jope, R.S., 2006. AMP-activated protein kinase (AMPK) activatingagents cause dephosphorylation of Akt and glycogen synthase kinase-3. Biochem.Pharmacol. 71, 1637–1647.
King, J.S., et al., 2009. Themood stabiliser lithium suppresses PIP3 signalling inDictyosteliumand human cells. Dis. Model. Mech. 2, 306–312.
Klein, P.S., Melton, D.A., 1996. A molecular mechanism for the effect of lithium on de-velopment. Proc. Natl. Acad. Sci. U. S. A. 93, 8455–8459.
Kleppisch, T., Feil, R., 2009. cGMP signalling in the mammalian brain: role in synapticplasticity and behaviour. Handb. Exp. Pharmacol. 191, 549–579.
Leach, S.M., et al., 2009. Biomedical discovery acceleration, with applications to cranio-facial development. PLoS Comput. Biol. 5, e1000215.
Lee, E., Salic, A., Kirschner, M.W., 2001. Physiological regulation of [beta]-catenin stabil-ity by Tcf3 and CK1epsilon. J. Cell Biol. 154, 983–993.
Macdonald, D.S., et al., 2005. Modulation of NMDA receptors by pituitary adenylate cy-clase activating peptide in CA1 neurons requires G alpha q, protein kinase C, andactivation of Src. J. Neurosci. 25, 11374–11384.
Mangan, S., Alon, U., 2003. Structure and function of the feed-forward loop networkmotif. Proc. Natl. Acad. Sci. U. S. A. 100, 11980.
Margolin, A.A., et al., 2006. ARACNE: an algorithm for the reconstruction of generegulatory networks in a mammalian cellular context. BMC Bioinforma. 7(Suppl. 1), S7.
Onoue, S., Endo, K., Ohshima, K., Yajima, T., Kashimoto, K., 2002. The neuropeptidePACAP attenuates beta-amyloid (1–42)-induced toxicity in PC12 cells. Peptides23, 1471–1478.
Opazo, P., Watabe, A.M., Grant, S.G., O'Dell, T.J., 2003. Phosphatidylinositol 3-kinaseregulates the induction of long-term potentiation through extracellular signal-related kinase-independent mechanisms. J. Neurosci. 23, 3679–3688.
Pelligrino, D.A., Wang, Q., 1998. Cyclic nucleotide crosstalk and the regulation of cere-bral vasodilation. Prog. Neurobiol. 56, 1–18.
Ressler, K.J., et al., 2011. Post-traumatic stress disorder is associated with PACAP andthe PAC1 receptor. Nature 470, 492–493 497.
Shannon, P., et al., 2003. Cytoscape: a software environment for integrated models ofbiomolecular interaction networks. Genome Res. 13, 2498–2504.
Sheline, Y.I., Wang, P.W., Gado, M.H., Csernansky, J.G., Vannier, M.W., 1996. Hippocam-pal atrophy in recurrent major depression. Proc. Natl. Acad. Sci. U. S. A. 93,3908–3913.
Sherwood, N.M., Krueckl, S.L., McRory, J.E., 2000. The origin and function of the pitui-tary adenylate cyclase-activating polypeptide (PACAP)/glucagon superfamily.Endocr. Rev. 21, 619–670.
Shintani, N., et al., 2002. Defects in reproductive functions in PACAP-deficient femalemice. Regul. Pept. 109, 45–48.
Tanaka, K., Kunishige-Yamamoto, A., Hashimoto, H., Shintani, N., Hayata, A., Baba, A.,2010. Increased ethanol preference and serotonin 1A receptor-dependent attenu-ation of ethanol-induced hypothermia in PACAP-deficient mice. Biochem. Biophys.Res. Commun. 391, 773–777.
Tessier, M., Woodgett, J.R., 2006. Serum and glucocorticoid-regulated protein kinases:variations on a theme. J. Cell. Biochem. 98, 1391–1407.
Tsai, S.J., Liou, Y.J., Hong, C.J., Yu, Y.W., Chen, T.J., 2008. Glycogen synthase kinase-3betagene is associated with antidepressant treatment response in Chinese major de-pressive disorder. Pharmacogenomics J. 8, 384–390.
Vadigepalli, R., Chakravarthula, P., Zak, D.E., Schwaber, J.S., Gonye, G.E., 2003. PAINT: apromoter analysis and interaction network generation tool for gene regulatorynetwork identification. OMICS. 7, 235–252.
Waxman, E.A., Lynch, D.R., 2005. N-methyl-D-aspartate receptor subtype mediated bi-directional control of p38 mitogen-activated protein kinase. J. Biol. Chem. 280,29322–29333.
Wingender, E., 2008. The TRANSFAC project as an example of framework technol-ogy that supports the analysis of genomic regulation. Brief Bioinform. 9,326–332.
Zhang, W., et al., 2009. GSK3beta modulates PACAP-induced neuritogenesis in PC12cells by acting downstream of Rap1 in a caveolae-dependent manner. Cell. Signal.21, 237–245.
Zhou, M., Cui, Y., 2004. GeneInfoViz: constructing and visualizing gene relation net-works. In Silico Biol. 4, 323–333.