p103 Modeling and experimental validation of the dispersion of 222Rn released from a uranium mine...
7
Modeling and experimental validation of the dispersion of 222 Rn released from a uranium mine ventilation shaft Dong Xie a, c, * , Hanqing Wang b , Kimberlee J. Kearfott c a School of Urban Construction, University of South China, Hengyang 421001, China b School of Civil Engineering, University of Hunan Technology, Zhuzhou 412007, China c Department of Nuclear Engineering and Radiological Sciences, University of Michigan, Ann Arbor, MI 48109-2104, USA highlights < Computational fluid dynamics can account for complex meteorology and geography. < Modeling of radon dispersion from uranium mine shafts. < Increasing surface roughness causes Rn accumulation for small wind speeds. < Increasing wind speeds increases radon dispersion. < Field measurements agree closely with the numerical investigations. article info Article history: Received 1 February 2012 Received in revised form 1 June 2012 Accepted 4 July 2012 Keywords: Uranium mine shaft ventilation Radon ( 222 Rn) Atmospheric dispersion Modeling Field measurements abstract Radon ( 222 Rn) found in uranium mine shaft ventilation exhaust gases could pose hazards to the surrounding environment and the public by virtue of its progeny. Radon migration under complex terrain is complicated by pollution source characteristics, geographical features of the dispersion region, meteorological conditions and precipitation. Fluid dynamics computations of 222 Rn dispersion are per- formed for uranium mine shaft exhausts for complex models of the actual physical terrain corresponding to a mine in the Jiangxi Province of China. The eight cases studied included a ventilation shaft source, four downwind velocities (0.5, 1.0, 2.0, 4.0 m s 1 ) and two underlying surface roughness characteristics (0.1 m, 1.0 m). 222 Rn distributions in the vicinity of uranium mine ventilation shaft are computed and compared with field measurements. Ó 2012 Elsevier Ltd. All rights reserved. 1. Introduction Radon ( 222 Rn) and its progeny, uranium dusts, and radioactive aerosols produced in process of uranium mining account for 67% collective effective dose equivalent of the gas emissions from uranium mining and milling operations (Pan et al., 2004). Pan et al. (2004) reported that 222 Rn and its progeny account for more than 80% of the collective effective dose equivalent arising as a result of total uranium mine ventilation emissions. When radon and its progeny exhaled from underground uranium mining, it can harm the nearby ecological environment through significant internal and external radiation exposure to residents (Evans et al., 1981; Singh et al., 1989). Computational fluid dynamics (CFD) is a useful tool for simu- lation of turbulent flow and pollutant dispersion around buildings and complex terrain. CFD has been proven very powerful and efficient in parametric studies of wind field and dispersion of radionuclides. Some studies of atmospheric dispersion of radioac- tive material released from nuclear industry are based on Gaussian plume models (Venkatesan et al., 2002). These models are inex- pensive and easily implemented, and are useful for generalized atmosphere pollution forecasts. However, they fail to take into account the turbulence generated by the interaction of the wind with the complex terrain and the underlying surface roughness (De Sampaio et al., 2008). On a local scale, near the source of the emission, these are the dominant factors determining radionuclide dispersion. Recently Eulerian model and Lagrangian particle dispersion models have been broadly applied for predicting and assessing the radiological consequences to the public from radio- nuclides resulting from nuclear fuels or nuclear accidental releases * Corresponding author. School of Urban Construction, University of South China, Hengyang 421001, China. Tel.: þ86 734 828 2512; fax: þ86 734 828 2312. E-mail addresses: [email protected], [email protected] (D. Xie). Contents lists available at SciVerse ScienceDirect Atmospheric Environment journal homepage: www.elsevier.com/locate/atmosenv 1352-2310/$ e see front matter Ó 2012 Elsevier Ltd. All rights reserved. http://dx.doi.org/10.1016/j.atmosenv.2012.07.006 Atmospheric Environment 60 (2012) 453e459
Transcript of p103 Modeling and experimental validation of the dispersion of 222Rn released from a uranium mine...

at SciVerse ScienceDirect
Atmospheric Environment 60 (2012) 453e459
Contents lists available
Atmospheric Environment
journal homepage: www.elsevier .com/locate/atmosenv
Modeling and experimental validation of the dispersion of 222Rn released froma uranium mine ventilation shaft
Dong Xie a,c,*, Hanqing Wang b, Kimberlee J. Kearfott c
a School of Urban Construction, University of South China, Hengyang 421001, Chinab School of Civil Engineering, University of Hunan Technology, Zhuzhou 412007, ChinacDepartment of Nuclear Engineering and Radiological Sciences, University of Michigan, Ann Arbor, MI 48109-2104, USA
h i g h l i g h t s
< Computational fluid dynamics can account for complex meteorology and geography.< Modeling of radon dispersion from uranium mine shafts.< Increasing surface roughness causes Rn accumulation for small wind speeds.< Increasing wind speeds increases radon dispersion.< Field measurements agree closely with the numerical investigations.
a r t i c l e i n f o
Article history:Received 1 February 2012Received in revised form1 June 2012Accepted 4 July 2012
Keywords:Uranium mine shaft ventilationRadon (222Rn)Atmospheric dispersionModelingField measurements
* Corresponding author. School of Urban ConstructiHengyang 421001, China. Tel.: þ86 734 828 2512; fax
E-mail addresses: [email protected], dongxie@
1352-2310/$ e see front matter � 2012 Elsevier Ltd.http://dx.doi.org/10.1016/j.atmosenv.2012.07.006
a b s t r a c t
Radon (222Rn) found in uranium mine shaft ventilation exhaust gases could pose hazards to thesurrounding environment and the public by virtue of its progeny. Radon migration under complexterrain is complicated by pollution source characteristics, geographical features of the dispersion region,meteorological conditions and precipitation. Fluid dynamics computations of 222Rn dispersion are per-formed for uranium mine shaft exhausts for complex models of the actual physical terrain correspondingto a mine in the Jiangxi Province of China. The eight cases studied included a ventilation shaft source,four downwind velocities (0.5, 1.0, 2.0, 4.0 m s�1) and two underlying surface roughness characteristics(0.1 m, 1.0 m). 222Rn distributions in the vicinity of uranium mine ventilation shaft are computed andcompared with field measurements.
� 2012 Elsevier Ltd. All rights reserved.
1. Introduction
Radon (222Rn) and its progeny, uranium dusts, and radioactiveaerosols produced in process of uranium mining account for 67%collective effective dose equivalent of the gas emissions fromuranium mining and milling operations (Pan et al., 2004). Pan et al.(2004) reported that 222Rn and its progeny account for more than80% of the collective effective dose equivalent arising as a result oftotal uranium mine ventilation emissions. When radon and itsprogeny exhaled from underground uranium mining, it can harmthe nearby ecological environment through significant internal andexternal radiation exposure to residents (Evans et al., 1981; Singhet al., 1989).
on, University of South China,: þ86 734 828 2312.umich.edu (D. Xie).
All rights reserved.
Computational fluid dynamics (CFD) is a useful tool for simu-lation of turbulent flow and pollutant dispersion around buildingsand complex terrain. CFD has been proven very powerful andefficient in parametric studies of wind field and dispersion ofradionuclides. Some studies of atmospheric dispersion of radioac-tive material released from nuclear industry are based on Gaussianplume models (Venkatesan et al., 2002). These models are inex-pensive and easily implemented, and are useful for generalizedatmosphere pollution forecasts. However, they fail to take intoaccount the turbulence generated by the interaction of the windwith the complex terrain and the underlying surface roughness (DeSampaio et al., 2008). On a local scale, near the source of theemission, these are the dominant factors determining radionuclidedispersion. Recently Eulerian model and Lagrangian particledispersion models have been broadly applied for predicting andassessing the radiological consequences to the public from radio-nuclides resulting from nuclear fuels or nuclear accidental releases
D. Xie et al. / Atmospheric Environment 60 (2012) 453e459454
(Basit et al., 2006, 2008), with the results compared to Gaussianplume models (Lutman et al., 2004). Prior work involving theatmospheric dispersion of radionuclides using CFD simulation hasbeen limited to Nuclear Power Plant (NPP) releases (Srinivas andVenkatesan, 2005), specifically relating to the Chernobyl (Teradaand Chino, 2008) and the Fukushima accidents (Leelössy et al.,2011), which had source characteristics, meteorological condi-tions, and topographical and geographical features different fromuranium mine shaft ventilation.
Numerical modeling of the dispersion mechanism of 222Rn fromuraniummine shafts is absent from the literature. In this paper, theauthors demonstrate the use of CFD for modeling atmospheric222Rn above the ground in the vicinity of uranium mining area. Acomplex computational model of the physical terrain surroundinga uranium mine ventilation shaft in the Jiangxi Province of China isbuilt. CFD modeling was accomplished using Fluent (Ansys Fluent,2010), a commercially available and widely used tool incorporatingseveral turbulence models (ANSYS Fluent 13.0.0, ANSYS Inc.,Southpointe, 275 Technology Drive, Canonsburg, PA 15317 USA).The simulated results were then compared with fieldmeasurements.
2. Models
2.1. Physical model
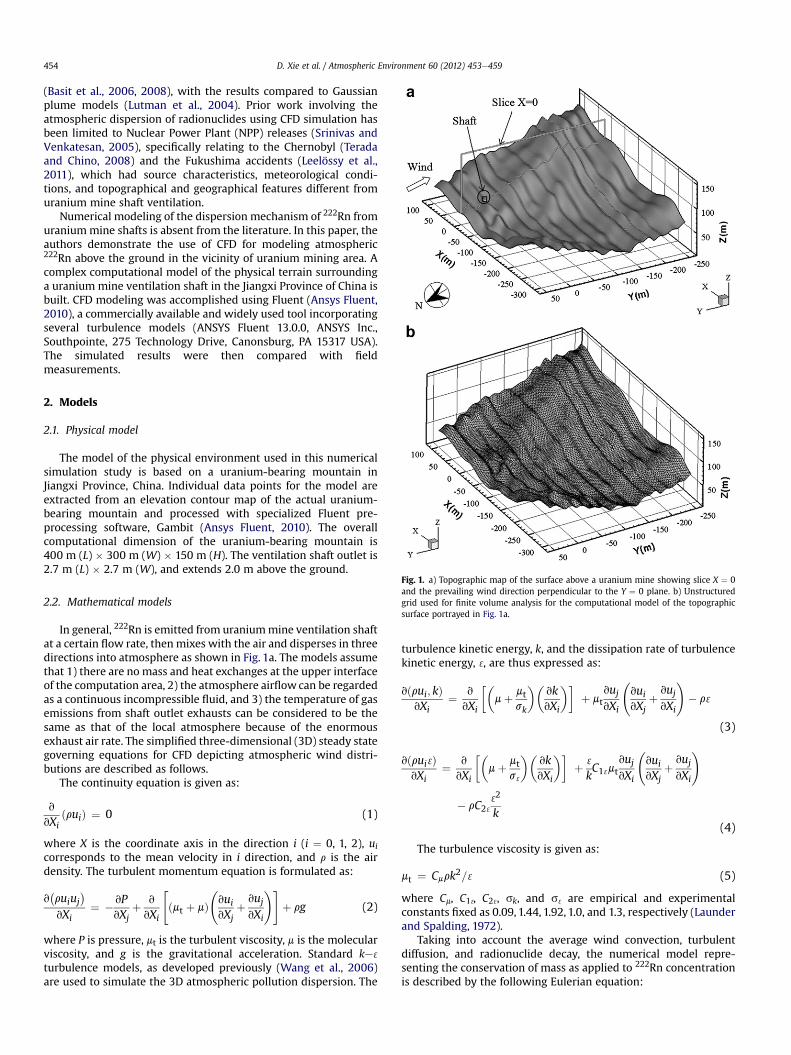
The model of the physical environment used in this numericalsimulation study is based on a uranium-bearing mountain inJiangxi Province, China. Individual data points for the model areextracted from an elevation contour map of the actual uranium-bearing mountain and processed with specialized Fluent pre-processing software, Gambit (Ansys Fluent, 2010). The overallcomputational dimension of the uranium-bearing mountain is400 m (L) � 300 m (W) � 150 m (H). The ventilation shaft outlet is2.7 m (L) � 2.7 m (W), and extends 2.0 m above the ground.
Fig. 1. a) Topographic map of the surface above a uranium mine showing slice X ¼ 0and the prevailing wind direction perpendicular to the Y ¼ 0 plane. b) Unstructuredgrid used for finite volume analysis for the computational model of the topographicsurface portrayed in Fig. 1a.
2.2. Mathematical models
In general, 222Rn is emitted from uraniummine ventilation shaftat a certain flow rate, thenmixes with the air and disperses in threedirections into atmosphere as shown in Fig. 1a. The models assumethat 1) there are no mass and heat exchanges at the upper interfaceof the computation area, 2) the atmosphere airflow can be regardedas a continuous incompressible fluid, and 3) the temperature of gasemissions from shaft outlet exhausts can be considered to be thesame as that of the local atmosphere because of the enormousexhaust air rate. The simplified three-dimensional (3D) steady stategoverning equations for CFD depicting atmospheric wind distri-butions are described as follows.
The continuity equation is given as:
v
vXiðruiÞ ¼ 0 (1)
where X is the coordinate axis in the direction i (i ¼ 0, 1, 2), uicorresponds to the mean velocity in i direction, and r is the airdensity. The turbulent momentum equation is formulated as:
v�ruiuj
�vXi
¼ �vPvXj
þ v
vXi
"ðmt þ mÞ
vuivXj
þ vujvXi
!#þ rg (2)
where P is pressure, mt is the turbulent viscosity, m is the molecularviscosity, and g is the gravitational acceleration. Standard ke 3
turbulence models, as developed previously (Wang et al., 2006)are used to simulate the 3D atmospheric pollution dispersion. The
turbulence kinetic energy, k, and the dissipation rate of turbulencekinetic energy, 3, are thus expressed as:
vðrui; kÞvXi
¼ v
vXi
��mþ mt
sk
��vkvXi
��þ mt
vujvXi
vuivXj
þ vujvXi
!� r 3
(3)
vðrui 3ÞvXi
¼ v
vXi
��mþ mt
s 3
��vkvXi
��þ 3
kC1 3mt
vujvXi
vuivXj
þ vujvXi
!
� rC2 3
32
k(4)
The turbulence viscosity is given as:
mt ¼ Cmrk2= 3 (5)
where Cm, C1 3, C2 3, sk, and s 3 are empirical and experimentalconstants fixed as 0.09, 1.44, 1.92, 1.0, and 1.3, respectively (Launderand Spalding, 1972).
Taking into account the average wind convection, turbulentdiffusion, and radionuclide decay, the numerical model repre-senting the conservation of mass as applied to 222Rn concentrationis described by the following Eulerian equation:
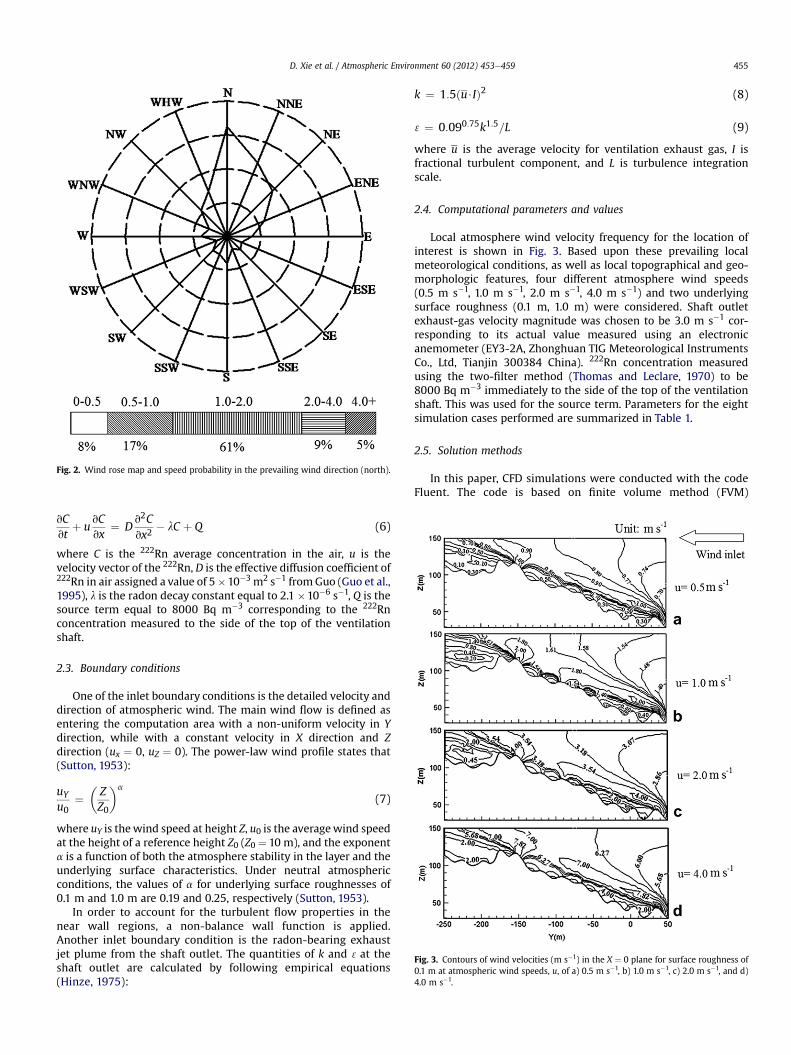
Fig. 2. Wind rose map and speed probability in the prevailing wind direction (north).
Fig. 3. Contours of wind velocities (m s�1) in the X ¼ 0 plane for surface roughness of0.1 m at atmospheric wind speeds, u, of a) 0.5 m s�1, b) 1.0 m s�1, c) 2.0 m s�1, and d)4.0 m s�1.
D. Xie et al. / Atmospheric Environment 60 (2012) 453e459 455
vCvt
þ uvCvx
¼ Dv2Cvx2
� lC þ Q (6)
where C is the 222Rn average concentration in the air, u is thevelocity vector of the 222Rn, D is the effective diffusion coefficient of222Rn in air assigned a value of 5�10�3 m2 s�1 fromGuo (Guo et al.,1995), l is the radon decay constant equal to 2.1 �10�6 s�1, Q is thesource term equal to 8000 Bq m�3 corresponding to the 222Rnconcentration measured to the side of the top of the ventilationshaft.
2.3. Boundary conditions
One of the inlet boundary conditions is the detailed velocity anddirection of atmospheric wind. The main wind flow is defined asentering the computation area with a non-uniform velocity in Ydirection, while with a constant velocity in X direction and Zdirection (ux ¼ 0, uZ ¼ 0). The power-law wind profile states that(Sutton, 1953):
uYu0
¼�ZZ0
�a
(7)
where uY is thewind speed at height Z, u0 is the averagewind speedat the height of a reference height Z0 (Z0 ¼ 10 m), and the exponenta is a function of both the atmosphere stability in the layer and theunderlying surface characteristics. Under neutral atmosphericconditions, the values of a for underlying surface roughnesses of0.1 m and 1.0 m are 0.19 and 0.25, respectively (Sutton, 1953).
In order to account for the turbulent flow properties in thenear wall regions, a non-balance wall function is applied.Another inlet boundary condition is the radon-bearing exhaustjet plume from the shaft outlet. The quantities of k and 3at theshaft outlet are calculated by following empirical equations(Hinze, 1975):
k ¼ 1:5ðu$IÞ2 (8)
3¼ 0:090:75k1:5=L (9)
where u is the average velocity for ventilation exhaust gas, I isfractional turbulent component, and L is turbulence integrationscale.
2.4. Computational parameters and values
Local atmosphere wind velocity frequency for the location ofinterest is shown in Fig. 3. Based upon these prevailing localmeteorological conditions, as well as local topographical and geo-morphologic features, four different atmosphere wind speeds(0.5 m s�1, 1.0 m s�1, 2.0 m s�1, 4.0 m s�1) and two underlyingsurface roughness (0.1 m, 1.0 m) were considered. Shaft outletexhaust-gas velocity magnitude was chosen to be 3.0 m s�1 cor-responding to its actual value measured using an electronicanemometer (EY3-2A, Zhonghuan TIG Meteorological InstrumentsCo., Ltd, Tianjin 300384 China). 222Rn concentration measuredusing the two-filter method (Thomas and Leclare, 1970) to be8000 Bq m�3 immediately to the side of the top of the ventilationshaft. This was used for the source term. Parameters for the eightsimulation cases performed are summarized in Table 1.
2.5. Solution methods
In this paper, CFD simulations were conducted with the codeFluent. The code is based on finite volume method (FVM)
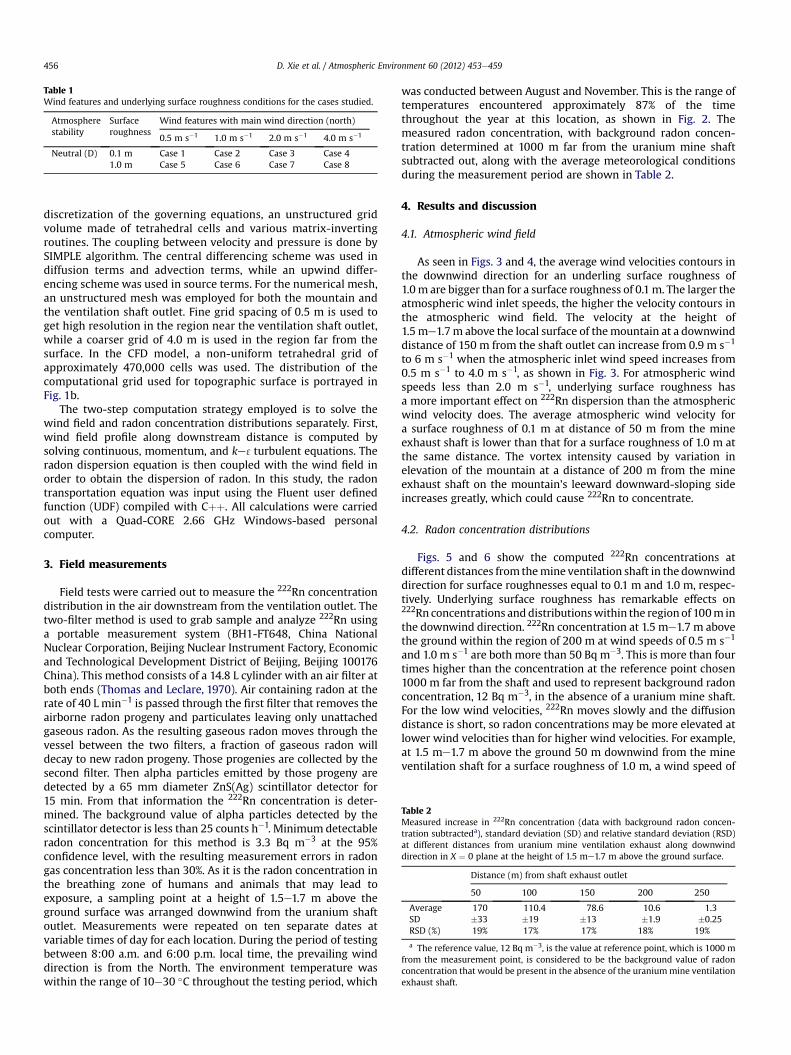
Table 1Wind features and underlying surface roughness conditions for the cases studied.
Atmospherestability
Surfaceroughness
Wind features with main wind direction (north)
0.5 m s�1 1.0 m s�1 2.0 m s�1 4.0 m s�1
Neutral (D) 0.1 m Case 1 Case 2 Case 3 Case 41.0 m Case 5 Case 6 Case 7 Case 8
Table 2Measured increase in 222Rn concentration (data with background radon concen-tration subtracteda), standard deviation (SD) and relative standard deviation (RSD)at different distances from uranium mine ventilation exhaust along downwinddirection in X ¼ 0 plane at the height of 1.5 me1.7 m above the ground surface.
Distance (m) from shaft exhaust outlet
50 100 150 200 250
Average 170 110.4 78.6 10.6 1.3SD �33 �19 �13 �1.9 �0.25RSD (%) 19% 17% 17% 18% 19%
a The reference value, 12 Bq m�3, is the value at reference point, which is 1000 mfrom the measurement point, is considered to be the background value of radonconcentration that would be present in the absence of the uraniummine ventilationexhaust shaft.
D. Xie et al. / Atmospheric Environment 60 (2012) 453e459456
discretization of the governing equations, an unstructured gridvolume made of tetrahedral cells and various matrix-invertingroutines. The coupling between velocity and pressure is done bySIMPLE algorithm. The central differencing scheme was used indiffusion terms and advection terms, while an upwind differ-encing scheme was used in source terms. For the numerical mesh,an unstructured mesh was employed for both the mountain andthe ventilation shaft outlet. Fine grid spacing of 0.5 m is used toget high resolution in the region near the ventilation shaft outlet,while a coarser grid of 4.0 m is used in the region far from thesurface. In the CFD model, a non-uniform tetrahedral grid ofapproximately 470,000 cells was used. The distribution of thecomputational grid used for topographic surface is portrayed inFig. 1b.
The two-step computation strategy employed is to solve thewind field and radon concentration distributions separately. First,wind field profile along downstream distance is computed bysolving continuous, momentum, and ke 3turbulent equations. Theradon dispersion equation is then coupled with the wind field inorder to obtain the dispersion of radon. In this study, the radontransportation equation was input using the Fluent user definedfunction (UDF) compiled with Cþþ. All calculations were carriedout with a Quad-CORE 2.66 GHz Windows-based personalcomputer.
3. Field measurements
Field tests were carried out to measure the 222Rn concentrationdistribution in the air downstream from the ventilation outlet. Thetwo-filter method is used to grab sample and analyze 222Rn usinga portable measurement system (BH1-FT648, China NationalNuclear Corporation, Beijing Nuclear Instrument Factory, Economicand Technological Development District of Beijing, Beijing 100176China). This method consists of a 14.8 L cylinder with an air filter atboth ends (Thomas and Leclare, 1970). Air containing radon at therate of 40 L min�1 is passed through the first filter that removes theairborne radon progeny and particulates leaving only unattachedgaseous radon. As the resulting gaseous radon moves through thevessel between the two filters, a fraction of gaseous radon willdecay to new radon progeny. Those progenies are collected by thesecond filter. Then alpha particles emitted by those progeny aredetected by a 65 mm diameter ZnS(Ag) scintillator detector for15 min. From that information the 222Rn concentration is deter-mined. The background value of alpha particles detected by thescintillator detector is less than 25 counts h�1. Minimum detectableradon concentration for this method is 3.3 Bq m�3 at the 95%confidence level, with the resulting measurement errors in radongas concentration less than 30%. As it is the radon concentration inthe breathing zone of humans and animals that may lead toexposure, a sampling point at a height of 1.5e1.7 m above theground surface was arranged downwind from the uranium shaftoutlet. Measurements were repeated on ten separate dates atvariable times of day for each location. During the period of testingbetween 8:00 a.m. and 6:00 p.m. local time, the prevailing winddirection is from the North. The environment temperature waswithin the range of 10e30 �C throughout the testing period, which
was conducted between August and November. This is the range oftemperatures encountered approximately 87% of the timethroughout the year at this location, as shown in Fig. 2. Themeasured radon concentration, with background radon concen-tration determined at 1000 m far from the uranium mine shaftsubtracted out, along with the average meteorological conditionsduring the measurement period are shown in Table 2.
4. Results and discussion
4.1. Atmospheric wind field
As seen in Figs. 3 and 4, the average wind velocities contours inthe downwind direction for an underling surface roughness of1.0m are bigger than for a surface roughness of 0.1m. The larger theatmospheric wind inlet speeds, the higher the velocity contours inthe atmospheric wind field. The velocity at the height of1.5me1.7m above the local surface of themountain at a downwinddistance of 150 m from the shaft outlet can increase from 0.9 m s�1
to 6 m s�1 when the atmospheric inlet wind speed increases from0.5 m s�1 to 4.0 m s�1, as shown in Fig. 3. For atmospheric windspeeds less than 2.0 m s�1, underlying surface roughness hasa more important effect on 222Rn dispersion than the atmosphericwind velocity does. The average atmospheric wind velocity fora surface roughness of 0.1 m at distance of 50 m from the mineexhaust shaft is lower than that for a surface roughness of 1.0 m atthe same distance. The vortex intensity caused by variation inelevation of the mountain at a distance of 200 m from the mineexhaust shaft on the mountain’s leeward downward-sloping sideincreases greatly, which could cause 222Rn to concentrate.
4.2. Radon concentration distributions
Figs. 5 and 6 show the computed 222Rn concentrations atdifferent distances from themine ventilation shaft in the downwinddirection for surface roughnesses equal to 0.1 m and 1.0 m, respec-tively. Underlying surface roughness has remarkable effects on222Rn concentrations anddistributionswithin the region of 100m inthe downwind direction. 222Rn concentration at 1.5 me1.7 m abovethe ground within the region of 200 m at wind speeds of 0.5 m s�1
and 1.0 m s�1 are both more than 50 Bq m�3. This is more than fourtimes higher than the concentration at the reference point chosen1000 m far from the shaft and used to represent background radonconcentration, 12 Bq m�3, in the absence of a uranium mine shaft.For the low wind velocities, 222Rn moves slowly and the diffusiondistance is short, so radon concentrations may be more elevated atlower wind velocities than for higher wind velocities. For example,at 1.5 me1.7 m above the ground 50 m downwind from the mineventilation shaft for a surface roughness of 1.0 m, a wind speed of

Fig. 5. Contours of radon concentration (Bq m�3) in the X ¼ 0 plane for surfaceroughness of 0.1 m at atmospheric wind speeds, u, of a) 0.5 m s�1, b) 1.0 m s�1, c)2.0 m s�1, and d) 4.0 m s�1.
Fig. 4. Contours of wind velocities (m s�1) in the X ¼ 0 plane for surface roughness of1.0 m at atmospheric wind speeds, u, of a) 0.5 m s�1, b) 1.0 m s�1, c) 2.0 m s�1, and d)4.0 m s�1.
D. Xie et al. / Atmospheric Environment 60 (2012) 453e459 457
0.5 m s�1 results in a 222Rn concentration of 400 Bq m�3, posinga much higher potential hazard from radiation pollution than the100 Bq m�3 predicted for a wind speed of 4.0 m s�1 for the sameconditions. In fact, 222Rndiffuses very rapidlyalong the downstreamwind direction distance in the vicinity of shaft ventilation outletwhen atmospheric wind speed increases to 4.0 m s�1. In fact, at200 m from the ventilation shaft for a surface roughness of 1.0 m,a height of 1.5 me1.7 m above the ground, and a wind speed of4.0 m s�1, the 222Rn concentration due to the uranium mine shaftventilation has dropped to 4 Bq m�3 from the value of 8000 Bqm�3
at the shaft itself. When the wind speed exceeds 4.0 m s�1, atmo-spheric wind velocity is the dominating factor affecting 222Rndispersion. The 222Rn pollution concentration at distancesexceeding 200 m downwind from the uranium mine ventilationshaft is lower than 10 Bqm�3, because 222Rn disperses more readilyat higher wind speeds.
As can be seen in Fig. 7a and b, underlying surface roughnesshas a significant effect on the 222Rn dispersion when the windspeed is less than 0.5 m s�1. It is observed that radon concen-tration for a surface roughness of 1.0 m is higher than fora surface roughness 0.1 m. An abundance of plants and treesleads to a high surface roughness level, which may cause theaccumulation of 222Rn in this range. 222Rn concentration dropsdramatically by a factor of 1.6 Bq m�3 per meter from the shaftoutlet to 50 m distance along downstream according to case 5.When the wind speed reaches 4.0 m s�1, then 222Rn concentra-tion at the height of 1.5 me1.7 m above the ground at thedistance of 200 m in the downwind direction approaches thetrivial value of 1 Bq m�3.
4.3. Comparisons of simulation results and measurement results
Fig. 7a shows the simulated and measured 222Rn concentra-tions as a function of distance from the ventilation shaft fora surface roughness of 0.1 m. For the most probable wind speed,2.0 m s�1, from the most likely direction, the north, and a surfaceroughness of 0.1 m, i.e. Case 3, the simulated 222Rn concentrationdrops from 174 Bq m�3 to 10 Bq m�3 along the downwind direc-tion from distances of 50 me250 m from the ventilation shaft. Asimilar trend is observed in the measured data, as 222Rnconcentration drops from 182 Bq m�3 to 12.3 Bq m�3 along thedownwind direction for the same distances. For similarconditions but a surface roughness of 1.0 m, the simulated data,shown in Fig. 7b, do not fit the measurement data well. This isprobably because there were not so many leaves on the trees orthick grasses on the ground, which are the main components ofunderlying surface roughness during the measurement season,which was between autumn and winter. The most likely prevail-ing wind conditions and the best surface roughness descriptionthus result in the best agreement of the simulation and measureddata.
The best agreement between the model results and themeasurements is at a distance of 50 m downwind for a wind speedof 2.0m s�1 and a surface roughness of 0.1 m. At 200m for the samewind speed and surface roughness this difference is 52%, the largestdisagreement for those conditions. The overall average differencebetween the model results and the measurements for thoseconditions at all distances is 22%.

Fig. 7. Comparison of the measured radon concentration to that computed usingdifferent wind speeds as a function of distance downstream from the uranium mineshaft outlet in X ¼ 0 plane for surface roughnessess of a) 0.1 m, and b) 1.0 m. Theexperimental data represent the averages for ten separate measurements at a givenlocation while the error bars correspond to �one standard deviation for thosemeasurements.
Fig. 6. Contours of radon concentration (Bq m�3) in the X ¼ 0 plane for surfaceroughness of 1.0 m at atmospheric wind speeds, u, of a) 0.5 m s�1, b) 1.0 m s�1, c)2.0 m s�1, and d) 4.0 m s�1.
D. Xie et al. / Atmospheric Environment 60 (2012) 453e459458
4.4. Uncertainty analysis of model
The computation strategy in this paper is to attain atmosphericwind field profile first, then couple this with 222Rn transportequation to obtain the 222Rn concentration distribution. As a result,there are two separate modeling uncertainties to be considered:the uncertainty relating to the atmospheric wind field and theuncertainty corresponding to the computation of the 222Rnconcentration distribution. The atmosphere wind field model hasinput parameters like wind speed and direction, surface roughness,while the 222Rn concentration distribution model has inputparameters like the 222Rn diffusion coefficient, shaft inlet speed,shaft inlet turbulence intensity and the 222Rn source term. Thereare coupled uncertainties in the final results because the uncer-tainties in atmospheric wind field will lead to further uncertaintiesin the 222Rn concentration distribution. There would be thousandsof cases to consider for determination of the uncertainty of theresults for variations in all of the input parameters. Analysis of themodel is thus suggested for future work. The 22% agreementbetween the experimental data and the model, however, providesan excellent sense of the errors involved in the modeling process.
For most noble gases, wet and dry deposition is negligiblebecause of their stable physical properties and negligible molecularweight. However, 222Rn has relative active physical properties, forexample it is sparingly soluble in water and more soluble thanlighter noble gases. Unlike other noble gases, 222Rn is approxi-mately eight times heavier than air. Because of this, surface
roughness caused by vegetation covering the mountains wouldcause 222Rn deposition. There exist no readily available researchreports on deposition parameters for radon. Although its magni-tude may be very small, neglecting the wet and dry deposition ofradon pose an unknown overestimation of radon concentration.
4.5. Uncertainty analysis of measurements
222Rn measurements were carried out under the atmosphericwind speeds with the region of 1.0e3.0m s�1, which corresponds tothe atmospheric wind speeds encountered almost 80% of the timein the given location. The season of the 222Rn measurements isautumn through winter, during which time there should be littlevegetation like trees and grass present. The average measured222Rn concentrations above 222Rn background measured far fromthe uranium mine ventilation shaft, standard deviations (SD)and relative standard deviations (RSD) obtained under the

D. Xie et al. / Atmospheric Environment 60 (2012) 453e459 459
meteorological conditions in this analysis are shown in Table 2. Theuncertainty in the measurements values is in the range 17e19%,while it is noted that these measured relative standard deviationsare the same order of magnitude as the differences between themeasurements and the model results, namely 8%e52% for the bestcase conditions.
5. Conclusions
The concentrations and distributions of 222Rn from uraniumshaft ventilation exhaust gas are simulated using 3D CFD models.The simulation results for the best assumptions of wind speed andsurface roughness are in good agreement, within 22% with fieldmeasurements. However, there still have some uncertainties inmeasured data and model input parameters including atmo-spheric wind speeds and direction, atmospheric stability,observed concentration of 222Rn, empirical power-law windprofile and turbulence structures at inlet boundary conditions,underlying surface roughness, and the radon diffusion coefficient.In addition, details of the atmospheric flow or the subgrid-scaleatmospheric processes are still unresolved well in modeling(Rao, 2005).
From the simulation results, it is suggested that the impactfactors of monitoring conditions, such as source characteristics,atmospheric wind shear, airflow turbulent characteristics, andgeographical features, should be taken into account in obtainingconcentrations of 222Rn for radiological evaluation and environ-ment analysis. For more precise simulations, the large physicalmodel, the detailed wind profile, aerosol characteristics, atmo-spheric temperature, shaft outlet flow rate and shaft height shouldbe further investigated. In addition, modeling and measurementson the dispersion of radon progeny will be investigated in futureresearch.
Acknowledgments
The authors acknowledge with thanks the financial supportprovided by National Natural Science Foundation of China (GrantNo. 11105068) and by the Science Foundation for Excellent YouthScholars of the Educational Commission of the Hunan Province ofChina (Grant No.11B108). The authors are also grateful to Prof. ZhouXinghuo of University of South China for providing the help on fieldmeasurements included in this work. We also deeply thank the
anonymous reviewers for their thoughtful suggestions that resul-ted in a much improved revision of this paper.
References
Ansys Fluent 13.0.0, 2010. Ansys Fluent Inc.Basit, A., Raza, S.S., Irfan, N., 2006. Dispersion of radionuclides released into a stable
planetary boundary layer using a Monte Carlo model. Journal of RadiologicalProtection 26, 375e387.
Basit, A., Espinosa, F., Avila, R., Raza, S., Irfan, N., 2008. Simulation of atmosphericdispersion of radionuclides using an EulerianeLagrangian modelling system.Journal of Radiological Protection 28, 539e561.
De Sampaio, P.A.B., Junior, M.A.G., Lapa, C.M.F., 2008. A CFD approach to theatmospheric dispersion of radionuclides in the vicinity of NPPs. Nuclear Engi-neering and Design 238, 250e273.
Evans, R.D., Harley, J.H., Jacobi, W., Mclean, A.S., Mills, W.A., Stewart, C.G., 1981.Estimate of risk from environmental exposure to radon-222 and its decayproducts. Nature 290, 98e100.
Guo, Q., Iida, T., Okamoto, K., 1995. Measurements of thoron concentration bypassive cup method and its application to dose assessment. Journal of NuclearScience and Technology 32 (8), 794e803.
Hinze, J.O., 1975. Turbulence. McGraw-Hill, New York.Launder, B.E., Spalding, D.B., 1972. Lectures in Mathematical Models of Turbulence.
Academic Press, London, England.Leelössy, Á., Mészáros, R., Lagzi, I., 2011. Short and long term dispersion patterns of
radionuclides in the atmosphere around the Fukushima Nuclear Power Plant.Journal of Environmental Radioactivity 102, 1117e1121.
Lutman, E.R., Jones, S.R., Hill, R.A., McDonald, P., Lambers, B., 2004. Comparisonbetween the predictions of a Gaussian plume model and a Lagrangian particledispersion model for annual average calculations of long-range dispersion ofradionuclides. Journal of Environmental Radioactivity 75, 339e355.
Pan, Z.Q., Wang, Z.B., Chen, Z.Z., Zhang, Y.X., Xie, J.L., 2004. Radiation EnvironmentalImpact Assessment of the Nuclear Industry in China in the Three Decades(1955e1985). Atomic Energy Press, Beijing.
Rao, K.S., 2005. Uncertainty analysis in atmospheric dispersion modeling. Pure andApplied Geophysics 162, 1893e1917.
Singh, J., Singh, L., Ramola, R.C., Singh, M., Virk, H.S., 1989. Radon pollution studiesin the environs of radioactive areas by using solid state nuclear track detectors.The International Journal of Radiation Applications and Instrumentation, Part E:Nuclear Geophysics 3, 297e298.
Srinivas, C.V., Venkatesan, R., 2005. A simulation study of dispersion of air borneradionuclides from a nuclear power plant under a hypothetical accidentalscenario at a tropical coastal site. Atmospheric Environment 39, 1497e1511.
Sutton, O.G., 1953. Micrometeorology. McGraw-Hill, New York.Terada, H., Chino, M., 2008. Development of an atmospheric dispersion model for
accidental discharge of radionuclides with the function of simultaneousprediction for multiple domains and its evaluation by application to the Cher-nobyl nuclear accident. Journal of Nuclear Science and Technology 45, 920e931.
Thomas, J.W., Leclare, P.C., 1970. A study of 2-filter method for radon-222. HealthPhysics 18 (2), 113e122.
Venkatesan, R., Mathiyarasu, R., Somayaji, K.M., 2002. A study of atmosphericdispersion of radionuclides at a coastal site using a modified Gaussian modeland a mesoscale sea breeze model. Atmospheric Environment 36, 2933e2942.
Wang, J.S., Chan, T.L., Cheung, C.S., Leung, C.W., Hung, W.T., 2006. Three-dimen-sional pollutant concentration dispersion of a vehicular exhaust plume in thereal atmosphere. Atmospheric Environment 40, 484e497.