Waste Isolation Pilot Plant Shaft Sealing System Compliance ...
371
SEP 3 0 1996 SANDIA REPORT SAND96-1326/1 • UC-721 Unlimited Release Printed August 1996 OCTl an Waste Isolation Pilot Plant Shaft Sealing System Compliance Submittal Design Report Volume 1 of 2: Main Report Appendices A, B, C, and D Repository Isolation Systems Department Preparedby Sandia National Laboratories Albuquerque, New'Mexico 87185 and Livermore, California 94550 for the United States Department of Energy under Contract DE-AC04-94AL85000 Approved for public release; distribution is unlimited. 1 :• 'IvM-i" I'l:;"' :!'.. !' !'•>•< ii: I'!;.. HI ...)-,i : I 1 1 ^^ ' SF2900Q(8-81) 1 . * *' i DISTRIBUTION'OF THIS DOCUMENT IS UNLIMITED
-
Upload
khangminh22 -
Category
Documents
-
view
0 -
download
0
Transcript of Waste Isolation Pilot Plant Shaft Sealing System Compliance ...

SEP 3 0 1996
SANDIA REPORTSAND96-1326/1 • UC-721Unlimited ReleasePrinted August 1996
O C T lan
Waste Isolation Pilot Plant Shaft Sealing SystemCompliance Submittal Design ReportVolume 1 of 2: Main ReportAppendices A, B, C, and D
Repository Isolation Systems Department
Prepared bySandia National LaboratoriesAlbuquerque, New'Mexico 87185 and Livermore, California 94550for the United States Department of Energyunder Contract DE-AC04-94AL85000
Approved for public release; distribution is unlimited. 1 :• ' I v M - i " I ' l : ; " ':!'.. !' !'•>•<
i i : I ' ! ; . .
H I . . . ) - , i :
I 1 1 ^ ^ '
SF2900Q(8-81)
1 . * *' i
DISTRIBUTION'OF THIS DOCUMENT IS UNLIMITED

DISCLAIMER
Portions of this document may be illegiblein electronic image products. Images areproduced from the best available originaldocument
DISCLAIMER
This report was prepared as an account of work sponsored by an agency of theUnited States Government Neither the United States Government nor any agencythereof, nor any of their employees, makes any warranty, express or implied, orassumes any legal liability or responsibility for the accuracy, completeness, or use-fulness of any information, apparatus, product, or process disclosed, or representsthat its use would not infringe privately owned rights. Reference herein to any spe-cific commercial product, process, or service by trade name, trademark, manufac-turer, or otherwise does not necessarily constitute or imply its endorsement, recom-mendation, or favoring by the United States Government or any agency thereof.The views and opinions of authors expressed herein do not necessarily state orreflect those of the United States Government or any agency thereof.

SAND96-1326/1 DistributionUnlimited Release Category UC-721
Printed August 1996
Waste Isolation Pilot PlantShaft Sealing System
Compliance Submittal Design Report
Volume 1 of 2:Main Report
Appendices A, B, C, and D
Repository Isolation Systems DepartmentSandia National Laboratories
Albuquerque, NM 87185
ABSTRACT
This report describes a shaft sealing system design for the Waste Isolation Pilot Plant (WIPP), aproposed nuclear waste repository in bedded salt. The system is designed to limit entry of waterand release of contaminants through the four existing shafts after the WIPP is decommissioned.The design approach applies redundancy to functional elements and specifies multiple, common,low-permeability materials to reduce uncertainty in performance. The system comprises 13elements that completely fill the shafts with engineered materials possessing high density andlow permeability. Laboratory and field measurements of component properties and performanceprovide the basis for the design and related evaluations. Hydrologic, mechanical, thermal, andphysical features of the system are evaluated in a series of calculations. These evaluationsindicate that the design, guidance is addressed by effectively limiting transport of fluids withinthe shafts, thereby limiting transport of hazardous material to regulatory boundaries.Additionally, the use or adaptation of existing technologies for placement of the seal componentscombined with the use of available, common materials assure that the design can be constructed.

Acknowledgments
The work presented in this document represents the combined effort of a number ofindividuals at Sandia National Laboratories, Parsons Brinckerhoff (under contract AG-4909),INTERA (under contract AG-4910), RE/SPEC (under contract AG-4911), and Tech Reps., TheSandian responsible for the preparation of each section of the report and the lead individual(s) atfirms under contract to Sandia that provided technical expertise are recognized below.
Section Author(s)
Executive Summary
Section 1, Introduction
Section 2, Site Geologic,Hydrologic, & Geochemical Setting
Section 3, Design Guidance
Section 4, Design Description
Section 5, Material Specifications
Section 6, Construction Techniques
Section 7, Structural Analyses ofShaft Seals
Section 8, Hydrologic Evaluation ofthe Shaft Seal System
Section 9, Conclusions
Appendix A, Material Specifications
Appendix B, Shaft SealingConstruction Procedures
Appendix C, Fluid Flow Analyses
Appendix D, Structural Analyses
Appendix E, Design Drawings
F.D. Hansen, Sandia
J.R. Tillerson, Sandia
A.W. Dennis and SJ. Lambert, Sandia
A.W. Dennis, Sandia
A.W. Dennis, Sandia
F.D. Hansen, Sandia
E.H. Ahrens, Sandia
L.D. Hurtado, Sandia; M.C. Loken and L.L. VanSambeek, RE/SPEC
M.K. Knowles, Sandia; V.A. Kelley, INTERA
J.R. Tillerson and A.W. Dennis, Sandia
F.D. Hansen, Sandia
E.H. Ahrens, Sandia, with the assistance of ParsonsBrinckerhoff Construction and Scheduling staff
M.K. Knowles, Sandia; V.A. Kelley, INTERA
L.D. Hurtado, Sandia; M.C. Loken and L.L. VanSambeek, RE/SPEC
A.W. Dennis, Sandia; CD. Mann, ParsonsBrinckerhoff, with the assistance of the ParsonsBrinckerhoff Design staff
Design reviews provided by Malcolm Gray, Atomic Energy Canada Ltd., WhiteshellLaboratory; Stephen Phillips, Phillips Mining, Geotechnical & Grouting, Inc.; and John Tinucci,Itasca Consulting Group. Inc. are appreciated, as are document reviews provided by DonGalbraith, U.S. Department of Energy Carlsbad Area Office; William Thompson, Carlsbad AreaOffice Technical Assistance Contractor; Robert Stinebaugh, Pahner Vaughn, Deborah Coffey,and Wendell Weart, Sandia.
T.P. Peterson and S.B. Kmetz, Tech Reps, served as technical editors of this document.
u

Contents
EXECUTIVE SUMMARY ..:.. ........ .:viiIntroduction viiSite Setting viiDesign Guidance viiiDesign Description viiiStructural Analysis ixHydrologic Evaluations xiConcluding Remarks xiii
1. INTRODUCTION >........:.................< .'. 11.1 Purpose of Compliance Submittal Design Report 11.2 WIPP Description 11.3 Performance Objective for WIPP Shaft Seal System 11.4 Sealing System Design Development Process 31.5 Organization of Document 41.6 Systems of Measurement 5
2. SITE GEOLOGIC, HYDROLOGIC, AND GEOCHEMICAL SETTING 72.1 Introduction 72.2 Site Geologic Setting....". 7
2.2.1 Regional WIPP Geology and Stratigraphy 72.2.2 Local WIPP Stratigraphy 102.2.3 Rock Mechanics Setting 10
2.3 Site Hydrologic Setting 122.3.1 Hydrostratigraphy 122.3.2 Observed Vertical Gradients 16
2.4 Site Geochemical Setting 172.4.1 Regional and Local Geochemistry in Rustler Formation and Shallower Units 172.4.2 Regional and Local Geochemistry in the Salado Formation 19
3. DESIGN GUIDANCE 233.1 Introduction 233.2 Design Guidance and Design Approach 23
4. DESIGN DESCRIPTION 254.1 Introduction 254.2 Existing Shafts -. 254.3 Sealing System Design Description 28
4:3.1 Salado Seals.: ...... .% 294.3.2 Rustler Seals : 344.3.3 Near-Surface Seals 34
5. MATERIAL SPECIFICATION 375.1 Longevity 385.2 Materials 39
5.2.1 Mass Concrete 39
m

5.2.2 Compacted Clay 405.2.3 Asphalt 415.2.4 Compacted Salt Column 415.2.5 Cementitious Grout 425.2.6 EarthenFill 43
5.3 Concluding Remarks 436. CONSTRUCTION TECHNIQUES 45• 6.1 Multi-Deck Stage 45
6.2 Salado Mass Concrete (Shaft Station Monolith and Shaft Plugs) 456.3 Compacted Clay Columns (Salado and Rustler Formations) :r;. 506.4 Asphalt Waterstops and Asphaltic-Mix Columns 506.5 Compacted WIPP Salt .'. 506.6 Grouting of Shaft Walls and Removal of Liners 516.7 EarthenFill 516.8 Schedule 53
7. STRUCTURAL ANALYSES OF SHAFT SEALS; 557.1 Introduction 55
" 7.2 Analysis .Methods '. ." 557.3 Models of Shaft Seals Features 55
7.3.1 Seal Material Models 567.3.2 Intact Rock Lithologies 567.3.3 Disturbed Rock Zone Models 56
7.4 Structural Analyses of Shaft Seal Components 567.4.1 Salado Mass Concrete Seals 567.4.2 Crushed Salt Seals 587.4.3 Compacted Clay Seals 597.4.4 Asphalt Seals 59
7.5 Disturbed Rock Zone Considerations 607.5.1 General Discussion of DRZ 607.5.2 Structural Analyses 60
7.6 Other Analyses 617.6.1 Asphalt Waterstops 617.6.2 Shaft Pillar Backfilling 62
8. HYDROLOGIC EVALUATION OF THE SHAFT SEAL SYSTEM 638.1 Introduction 638.2 Performance Models 638.3- Downward Migration of Rustler Groundwater 63
8.3.1 Analysis Method 648.3.2 Summary of Results 64
8.4 Gas Migration and Consolidation of Compacted Salt Column 658.4.1 Analysis Method 668.4.2 Summary of Results 66
8.5 Upward Migration of Brine 698.6 Intra-Rustler Flow ." 69
IV

9. CONCLUSIONS 71
10. REFERENCES 73
Appendix A — Material Specification A-l
Appendix B — Shaft Sealing Construction Procedures B-l
Appendix C — Fluid Flow Analyses C-l
Appendix D — Structural Analyses D-l
Appendix E — Design Drawings Volume 2
Figures
Figure 1-1. View of the WIPP underground facility 2Figure 2-1. Location of the WIPP in the Delaware Basin 8Figure 2-2. Chart showing major stratigraphic divisions, southeastern New Mexico 9Figure 2-3. Generalized stratigraphy of the WIPP site showing repository level 11Figure 4-1. Arrangement of the Air Intake Shaft sealing system 30Figure 6-1. Multi-deck stage illustrating dynamic compaction 46Figure 6-2. Multi-deck stage illustrating excavation for asphalt waterstop 47Figure 6-3. Drop pattern for 6-m-diameter shaft using a 1.2-m-diameter tamper 48Figure 6-4. Plan and section views of downward spin pattern of grout holes 49Figure 6-5. Plan and section views of upward spin pattern of grout holes 52Figure 8-1. Example of calculation of an effective salt column permeability from the depth-
dependent permeability at a point in time 68Figure 8-2. Effective permeability of the compacted salt column using the 95% certainty line. .68
Tables
Table 2-1. Salado Brine Seepage Intervals(I) 14Table 2-2. Permeability and Thickness of Hydrostratigraphic Units in Contact with Seals 15Table 2-3. Freshwater Head Estimates in the Vicinity of the Air Intake Shaft 17Table 2-4. Chemical Formulas, Distributions, and Relative Abundance of Minerals in the
Rustler and Salado Formations (after Lambert, 1992) 18Table 2-5. Major Solutes in Selected Representative Groundwater from the Rustler Formation
and Dewey Lake Redbeds, in mg/L (after Lambert, 1992) 19Table 2-6. Variations in Major Solutes in Brines from the Salado Formation, in mg/L (after
Lambert, 1992) 21Table 3-1. Shaft Sealing System Design Guidance 23Table 4-1. Drawings Showing Configuration of Existing WIPP Shafts (Drawings are in
Appendix E) 26Table 4-2. Summary of Information Describing Existing WIPP Shafts 27Table 4-3. Drawings Showing the Sealing System for Each Shaft (Drawings are in Appendix
E) 31Table 4-4. Drawings Showing the Shaft Station Monoliths (Drawings are in Appendix E) 33Table 8-1. Summary of Results from Performance Model 67

Acronyms
AIS Air Intake ShaftAMM asphalt mastic mixCFR Code of Federal RegulationsDOE Department of EnergyDRZ disturbed rock zoneEPA Environmental Protection AgencyHMAC hot mix asphalt concreteMDCF . Multimechanism Deformation Coupled FractureMD Munson-Dawsorf " ^ /NMVP No Migration Variance PetitionPA performance assessmentPTM Plug Test MatrixQA quality assuranceSMC Salado Mass ConcreteSPVD Site Preliminary Design ValidationSSSPT Small Scale Seal Performance TestSWCF Sandia WIPP Central FilesTRU transuranicWIPP Waste Isolation Pilot Plant
VI

EXECUTIVE SUMMARY
Introduction
This report documents a shaft seal system design developed as part of a submittal to theEnvironmental Protection Agency (EPA) that will demonstrate regulatory compliance of theWaste Isolation Pilot Plant (WIPP) for disposal of transuranic waste. The shaft seal systemlimits entry of water into the repository and restricts the release of contaminants. Shaft sealsaddress fluid transport paths through the opening itself, along the interface between the sealmaterial and the host rock, and within the disturbed rock surrounding the opening. The entireshaft seal system is described in this report and its five appendices, which include seal materialspecifications, construction methods, rock mechanics analyses, fluid flow evaluations, and thedesign drawings. The design represents a culmination of several years of effort that has mostrecently focused on providing to the EPA a viable shaft seal system design. Sections of thisreport and the appendices explore function and performance of the WIPP shaft seal system andprovide well documented assurance that such a shaft seal system could be constructed usingavailable materials and methods. — .
The purpose of the shaft seal system is to limit fluid flow within four existing shafts after therepository is decommissioned. Such a seal system would not be implemented for severaldecades, but to establish that regulatory compliance can be achieved at that future date, a shaftseal system has been designed that exhibits excellent durability and performance and isconstructable using existing technology. The design approach is conservative, applyingredundancy to functional elements and specifying various common, low-permeability materialsto reduce uncertainty in performance. It is recognized that changes in the design described herewill occur before construction and that this design is not the only possible combination ofmaterials and construction strategies that would adequately limit fluid flow within the shafts.
Site Setting
One of the Department of Energy's (DOE's) site selection criteria is a favorable geologic settingwhich minimizes fluid flow as a transport mechanism. Groundwater hydrology in the proximityof the WIPP site is characterized by geologic strata with low transmissivity and low hydrologicgradients, both very positive features with regard to sealing shafts. For purposes of performanceevaluations, hydrological analyses divide lithologies and requirements into the Rustler Formation(and overlying strata) and the Salado Formation, comprised mostly of salt. The principal designconcern is fluid transport phenomena of seal materials and lithologies within the SaladoFormation.
The rock mechanics setting is an important consideration in terms of system performance. Rockproperties affect hydrologic response of the shaft seal system. The stratigraphic section containslithologies that exhibit brittle and ductile behavior. A zone of rock around the shafts is disturbedowing to the creation of the opening. The disturbed rock zone (DRZ) is an important designconsideration because it possesses higher permeability than intact rock. Host rock response andits potential to fracture, flow, and heal around WIPP shaft openings are relevant to theperformance of the shaft seal system.
vn

Design Guidance
Use of both engineered and natural barriers to isolate wastes from the accessible environment isrequired by 40 CFR 191.14(d), and the use of engineered barriers to prevent or substantiallydelay movement of water or radionuclides toward the accessible environment is required by 40CFR 194.44. Hazardous constituent release limits are specified in 40 CFR 191 for the entirerepository system (EPA, 1996a; 1996b).
Design guidance for the shaft seal system addresses the need for the WIPP to comply withsystem requirements and to follow accepted engineering practices using demonstratedtechnology. Design guidance is categorized below:
• limit hazardous constituents reaching regulatory boundaries,
• restrict groundwater flow through the sealing system,
• use materials possessing mechanical and chemical compatibility,
• protect against structural failure of system components,
• - limit.subsidence and prevent accidental entry, and
• utilize available construction methods and materials.
Discussions of the design presented in the text of this report and the details presented in theappendices respond to these qualitative design guidelines. The shaft seal system design wascompleted under a Quality Assurance program that includes review by independent, qualifiedexperts to assure the best possible information is provided to the DOE on selection of engineeredbarriers (40 CFR 194.27). Technical reviewers examined the complete design includingconceptual, mathematical, and numerical models and computer codes (40 CFR 194.26). Thedesign reduces the impact of uncertainty associated with any particular element by using multiplesealing system components and by using components constructed from different materials.
Design Description
The shaft sealing system comprises 13 elements that completely fill the shaft with engineeredmaterials possessing high density and low permeability. Salado Formation components providethe primary regulatory barrier by limiting fluid transport along the shaft during and beyond the10,000-year regulatory period. Components within the Rustler Formation limit comminglingbetween brine-bearing members, as required by state regulations. Components from the Rustlerto the surface fill the shaft with common materials of high density, consistent with goodengineering practice. A synopsis of each component is given below.
Shaft Station Monolith. At the bottom of each shaft a salt-saturated concrete monolith supportsthe local roof. A salt-saturated concrete, called Salado Mass Concrete (SMC), is specified and isplaced using a conventional slickline construction procedure where the concrete is batched at thesurface. SMC has been tailored to match site conditions. The salt-handling shaft and thewaste-handling shaft have sumps which also will be filled with salt-saturated concrete as part ofthe monolith.
Clay Columns. A sodium bentonite is used for three compacted clay components in the Saladoand Rustler Formations. Although alternative construction specifications are viable, labor-
viu

intensive placement of compressed blocks is specified because of proven performance. Claycolumns effectively limit brine movement from the time they are placed to beyond the10,000-year regulatory period. Stiffness of the clay is sufficient to promote healing of fracturesin the surrounding rock salt near the bottom of the shafts, thus removing the proximal DRZ as apotential pathway. The Rustler clay column limits brine communication between the Magentaand Culebra Members of the Rustler Formation.
Concrete-Asphalt Waterstop Components. Concrete-asphalt waterstop components comprisethree elements: an upper concrete plug, a central asphalt waterstop, and a lower concrete plug.Three such components are located within the Salado Formation. These concrete-asphaltwaterstop components provide independent shaft cross-section and DRZ seals that limit fluidtransport, either downward or upward.,, Concrete fills irregularities in the shaft wall, while use ofthe salt-saturated concrete assures good bonding with salt. Salt creep against the rigid concretecomponents establishes a compressive stress state and promotes early healing of the salt DRZsurrounding the concrete plugs. The asphalt intersects the shaft cross section and the DRZ.
Compacted Salt Column. Each shaft seal includes a column of compacted WIPP salt with 1.5percent weight water added to the natural material. Construction demonstrations have shownthat mine-run WIPP salt can be dynamically compacted to a density equivalent to approximately90% of the average density of intact Salado salt. The remaining void space is removed throughconsolidation caused by creep closure. The salt column becomes less permeable as densityincreases. The location of the compacted salt column near the bottom of the shaft assures thefastest achievable consolidation of the compacted salt column after closure of the repository.Analyses indicate that the salt column becomes an effective long-term barrier in under 100 years.
Asphalt Column. An asphalt-aggregate mixture is specified for the asphalt column, whichbridges the Rustler/Salado contact and provides a seal essentially impermeable to brine for theshaft cross-section and the shaft wall interface. All asphalt is placed with a heated slickline.
Concrete Plugs. A concrete plug is located just above the asphalt column and keyed into thesurrounding rock. Mass concrete is separated from the cooling asphalt column with a layer offlbercrete, which permits work to begin on the overlying clay column before the asphalt hascompletely cooled. Another concrete plug is located near the surface, extending downward fromthe top of the Dewey Lake Redbeds.
Earthen Fill. The upper shaft is filled with locally available earthen fill. Most of the fill isdynamically compacted (the same method used to construct the salt column) to a densityapproximating the surrounding lithologies. The uppermost earthen fill is compacted with asheepsfoot roller or vibratory plate compactor.
Structural Analysis
Structural issues pertaining to the shaft seal system have been evaluated. Mechanical, thermal,physical, and hydrological features of the system are included in a broad suite of structuralcalculations. Conventional structural mechanics applications would normally calculate load onsystem elements and compare the loads to failure criteria. Several such conventional calculationshave been performed and show that the seal elements exist in a favorable, compressive stressstate that is low in comparison to the strength of the seal materials. Thermal analyses have been
IX

performed to examine the effects of concrete heat of hydration and heat transfer for asphaltelements. Coupling between damaged rockand fluid flow and between the density andpermeability of the consolidating salt column is evaluated within the scope of structuralcalculations.
The appendices provide descriptions of various structural calculations conducted as part of thedesign study. The purpose of each calculation varies; however, the calculations generallyaddress one or more of the following concerns: (1) stability of the component, (2) influences ofthe component on hydrological properties of the seal and surrounding rock, or (3) constructionmethods. Stability calculations address:
• potential for thermal cracking of concrete;
• structural loads on seal components resulting from salt creep, gravity, swelling clay,dynamic compaction, or possible repository-generated gas pressures.
Structural calculations defining input conditions to hydrological calculations include:
• spatial extent o£the DRZ within the Salado Formation salt beds as a function of depth,time, and seal material;
• fracturing and DRZ development within Salado Formation interbeds;
• shaft-closure induced consolidation of compacted salt columns;
• impact of pore pressures on salt consolidation.
Construction analyses examine:
• placement and structural performance of asphalt waterstops,
• potential subsidence reduction through backfilling the shaft station areas.
Structural calculations model shaft features including representation of the host rock and itsdamaged zone as well as the seal materials themselves. Two important structural calculationsdiscussed below are unique to shaft seal applications.
DRZ Behavior. The development and subsequent healing of a disturbed rock zone (DRZ) thatforms in the rock mass surrounding the WIPP shafts is a significant concern in the seal design. Itis well known that a DRZ will develop in rock salt adjacent to the shaft upon excavation.Placement of rigid components hi the shaft promotes healing within the salt DRZ as sealelements restrain inward creep and reduce the stress difference. Two computer models tocalculate development and extent of the salt DRZ are used. The first model uses a ratio of stressinvariants to predict fracture; the second approach uses a damage stress criterion. The temporaland spatial extent of the DRZ along the entire shaft length is evaluated.
Several analyses are performed to examine DRZ behavior of the rock salt surrounding the shaft.The time-dependent DRZ development and subsequent healing in the Salado salt surroundingeach of the four seal materials are considered. All seal materials below a depth of about 300 mprovide sufficient rigidity to heal the DRZ, a phenomenon that occurs quickly around rigidcomponents near the shaft bottom. An extensive calculation is made of construction effects onthe DRZ during placement of the asphalt-concrete waterstops. The time-dependent developmentof the DRZ within anhydrite and polyhalite interbeds of the Salado Formation is calculated. For

all interbeds, the factor of safety against shear or tensile fracturing increases with depth into therock surrounding the shaft wall. These results indicate that a continuous DRZ will not develop innonsalt Salado rocks. Rock mechanics analysis also determines which of the near surfacelithologies fracture in the proximity of the shaft. Results from these rock mechanics analyses areused as input conditions for the fluid-flow analyses.
Compacted Salt Behavior. Unique application of crushed salt as a seal component requireddevelopment of a constitutive model for salt reconsolidation. The model developed includes anonlinear elastic component and a creep consolidation component. The nonlinear elastic modulusis density-dependent, based on laboratory test data performed on WIPP crushed salt. Creepconsolidation behavior of crushed salt is based on three candidate models whose parameters areobtained from model fitting to hydrostatic;and shear consolidation test data gathered for WIPPcrushed salt. The model for consolidating crushed salt is used to predict permeability of the saltcolumn.
The seal system prevents fluid transport to the consolidating salt column to ensure that porepressure does not unacceptably inhibit the reconsolidation process. Calculations made toestimate fractional density-of the crushed salt seal as a function of time, depth, and pore pressureshow consolidation time increases as pore pressure increases, as expected. At a constant porepressure of one atmosphere, compacted salt will increase from its initial fractional density of90% to 96% within 40, 80, and 120 years after placement at the bottom, middle, and top of thesalt component, respectively. At a fractional density of 96%, the permeability of reconsolidatingsalt is approximately 10"18 m2. A pore pressure of 2 MPa increases times required to achieve afractional density of 96% to 92 years, 205 years, and 560 years at the bottom, middle, and top ofthe crushed salt column, respectively. A pore pressure of 4 MPa would effectively preventreconsolidation of the crushed salt within 1,000 years. Fluid flow calculations show onlyminimal transport of fluids to the salt column, so pore pressure equilibrium in the consolidatingsalt does not occur before low permeabilities (~10"18 m2) are achieved.
Hydrologic Evaluations
The ability of the shaft seal system to satisfy design guidance is determined by the performanceof the actual seal components within the physical setting in which they are constructed.Important elements of the physical setting are hydraulic gradients of the region, properties of thelithologic units surrounding a given seal component, and potential gas generation within therepository. Hydrologic evaluations focus on processes that could result in fluid flow through theshaft seal system and the ability of the seal system to limit any such flow. Transport ofradiological or hazardous constituents will be limited if the carrier fluids are similarly limited.
Physical processes that pould impact seal system performance have been incorporated into fourmodels. These models evaluate: (1) downward migration of groundwater from the RustlerFormation, (2) gas migration and reconsolidation of the crushed salt seal component, (3) upwardmigration of brines from the repository, and (4) flow between water-bearing zones in the RustlerFormation.
Downward Migration of Rustler Groundwater. The shaft seal system is designed to limitgroundwater flowing into and through the shaft sealing system. The principal source ofgroundwater to the seal system is the Culebra Member of the Rustler Formation. No significant
XI

sources of groundwater exist within the Salado Formation; however, brine seepage has beennoted at a number of the marker beds and is included in the models. Downward migration ofRustler groundwater is limited to ensure that liquid saturation of the compacted salt column doesnot impact the consolidation process and to limit quantities of brine reaching the repositoryhorizon.
Consolidation of the compacted salt column will be most rapid immediately following sealconstruction. Simulations conducted for the 200-year period following closure demonstrate that,during this initial period, downward migration of Rustler groundwater is insufficient to impactthe consolidation process. Rock mechanics analyses show that this period encompasses thereconsolidation process. Lateral migration of brine through the marker beds is quantified in theanalysis and shown to be inconsequential;--. . -.; :.\ix
At steady-state, the flow rate is most dependent on permeability of the system. Potential flowpaths within the seal system consist of the seal material, an interface with the surrounding rock,and the host rock DRZ. Low permeability is specified for the engineered materials, andconstruction methods ensure a tight interface. Thus the flow path most likely to impactperformance is the DRZ. Effects of the DRZ and sensitivity of the seal system performance toboth engineered and host rock barriers show that the DRZ is successfully mitigated by theproposed design.- •
Gas Migration and Salt Column Consolidation. A multi-phase flow model of the lower sealsystem evaluates the performance of components extending from the middle concrete-asphaltwaterstop located at the top of the salt column to the repository horizon for 200 years followingclosure. During this time period, the principal fluid sources to the model consist of potential gasgenerated by the waste and lateral brine migration within the Salado Formation. The predicteddownward migration of a small quantity of Rustler groundwater (discussed above) is included inthis analysis.
Effects of gas generation are evaluated for three different repository repressurization scenarios,which simulate pressures as high as 14 MPa. Model results predict that high repository pressuresdo not produce appreciable differences in the volume of gas migration over the 200-yearsimulation period. Relatively low gas flow is a result of the low permeability and rapid healingof the DRZ around the lower concrete-asphalt waterstop.
Upward Migration of Brine. The Salado Formation is overpressurized with respect to themeasured heads in the Rustler, and upward migration of contaminated brines could occur throughan inadequately sealed shaft. Results from the model discussed above demonstrate that thecrushed salt seal will reconsolidate to a very low permeability within 100 years followingrepository closure. Structural results show that the DRZ surrounding the long-term clay andcrushed salt seal components will completely heal within the first several decades. Modelcalculations predict that very little brine flows from the repository to the Rustler/Salado contact.
Intra-Rustler Flow. Based on head differences between the various members of the RustlerFormation, nonhydrostatic conditions exist within the Rustier Formation. Therefore, thepotential exists for vertical flow within water-bearing strata within the Rustler. The two unitswith the greatest transmissivity within the Rustier are the Culebra and the Magenta dolomites,which have the greatest potential for interflow. The relatively low undisturbed permeabilities of
xn

the mudstone and anhydrite units separating the Culebra and the Magenta naturally limitcrossflow. However, the construction and subsequent closure of the shaft provide a potentiallypermeable vertical conduit connecting water-bearing units.
The primary motivation for limiting formation crossflow within the Rustler is to prevent mixingof formation waters within the Rustler, as required by State of New Mexico statute. Commonly,such an undertaking would limit migration of higher dissolved solids (high-density) groundwaterinto lower dissolved solids groundwater. In the vicinity of the WIPP site, the Culebra has ahigher density groundwater than the Magenta, and the potential for fluid migration between thetwo most transmissive units is from the unit with the lower total dissolved solids to the unit withthe higher dissolved solids. This calculation shows that potential flow rates between the Culebraand the Magenta are insignificant. Under expected conditions, intra-Rustler flow is expected tobe of such a limited quantity that (1) it will not affect either the hydraulic or chemical regimewithin the Culebra or the Magenta and (2) it will not be detrimental to the seal system itself.
Concluding Remarks
The principal conclusion is that an effective, implementable shaft seal system has been designedfor the WIPP. Design guidance is addressed by limiting any transport of fluids within the shaft,thereby limiting transport of hazardous material to regulatory boundaries. The application oradaptation of existing technologies for placement of seal components combined with the use ofavailable, common materials provide confidence that the design can be constructed. Thestructural setting for seal elements is compressive, with shear stresses well below the strength ofseal materials. Because of the favorable hydrologic regime coupled with the low intrinsicpermeability of seal materials, long-term stability of the shaft seal system is expected.Credibility of these conclusions is bolstered by the basic design approach of using multiplecomponents to perform each sealing function and by using extensive lengths within the shafts toeffect a sealing system. The shaft seal system adequately meets design requirements and can beconstructed.
xiu

Page intentionally blank.
XIV
1. INTRODUCTION
1.1 Purpose of Compliance Submittal Design Report
This report documents the detailed design of the shaft sealing system for the WasteIsolation Pilot Plant (WIPP). The design documented in this report builds on the concepts andpreliminary evaluations presented in the Sealing System Design Report issued in 1995 (DOE,1995). The report contains a detailed description of the design and associated constructionprocedures, material specifications, analyses of structural and fluid flow performance, and designdrawings. The design documented in this report forms the basis for shaft sealing discussions inthe Compliance Certification Application (CCA) to the Environmental Protection Agency (EPA),for shaft sealing simulations in the associated-performance assessments, and for ongoingevaluations of the sealing system associated with the no-migration variance petition.
1.2 WIPP Description
The WIPP is designed as a full-scale, mined geological repository for the safemanagement, storage, and disposal of transuranic (TRU) radioactive wastes generated by USgovernment defense programs. The facility is located nearliarlsbad, New Mexico, in thesoutheastern portion of the state. The underground facility (Figure 1-1) consists of a series ofshafts, drifts, panels, and disposal rooms. Four shafts, ranging in diameter from 3.5 to 6.1 m,connect the disposal horizon to the surface. Sealing of these four shafts is the focus of thisreport.
The disposal horizon is at a depth of approximately 655 m in bedded halite within theSalado Formation. The Salado is a sequence of bedded evaporites approximately 600 m thickthat were deposited during the Permian Period, which ended about 225 million years ago. Saladosalt has been identified as a good geologic medium to host a nuclear waste repository because ofseveral favorable characteristics. The characteristics present at the WIPP site include very lowpermeability, vertical and lateral stratigraphic extent, tectonic stability, and the ability of salt tocreep and ultimately entomb material placed in excavated openings. Creep closure also plays animportant role in the shaft sealing strategy.
The WIPP facility must be determined to be in compliance with applicable regulationsprior to the disposal of waste. After the facility meets the regulatory requirements, disposalrooms will be filled with containers holding TRU wastes of various forms. Wastes placed in thedrifts and disposal rooms will be at least 150 m from the shafts. Regulatory requirements includeuse of both engineered and natural barriers to limit migration of hazardous constituents from therepository to the accessible environment. The shaft seals are part of the engineered barriers.
1.3 Performance Objective for WIPP Shaft Seal System
Each of the four shafts from the surface to the underground repository must be sealed tolimit hazardous material release to the accessible environment and to limit groundwater flow intothe repository. Although the seals will be permanent, the regulatory period applicable to therepository system analyses is 10,000 years.

Surface SaltStorage Area
Salt Handling Shaft
-v?* T R U W a s t e Storage Area
Cls*" Experimental Area
C^.SPDV AreaSouthDrift
TRI-634 6-59-29
Figure 1-1. View of the WIPP facility.
1.4 Sealing System Design Development Process
This report presents a conservative approach to shaft sealing system design. Shaft sealingsystem performance plays a crucial role in meeting regulatory radionuclide and hazardousconstituents release requirements. Although all engineering materials have uncertainties inproperties, a combination of available, low-permeability materials can provide an effectivesealing system. To reduce the impact of system uncertainties and to provide a high level ofassurance of compliance, numerous components are used in this sealing system. Components inthis design include long columns of clay, densely compacted crushed salt, a waterstop ofasphaltic material sandwiched between massive low-permeability concrete plugs, a column ofasphalt, and a column of earthen fill. Different materials perform identical functions within thedesign, thereby adding confidence in the'system performance through redundancy.
The design is based on common materials and construction methods that utilize availabletechnologies. When choosing materials, emphasis was given to permeability characteristics andmechanical properties of seal materials. However, the system is also chemically and physicallycompatible with the host formations, enhancing long-term performance.
Recent laboratory experiments, construction demonstrations, and field test results havebeen added to the broad and credible database and have supported advances in modelingcapability. Results from a series of multi-year, in situ, small-scale seal performance tests showthat bentonite and concrete seals maintain very low permeabilities and show no deleteriouseffects in the WIPP environment. A large-scale dynamic compaction demonstration establishedthat crushed salt can be successfully compacted. Laboratory tests show that compacted crushedsalt consolidates through creep closure of the shaft from initial conditions achieved in dynamiccompaction to a dense salt mass with regions where permeability approaches that of in situ salt.These technological advances have allowed more credible analysis of the shaft sealing system.
The design was developed through an interactive process involving a design teamconsisting of technical specialists in the design and construction of underground facilities,materials behavior, rock mechanics analysis, and fluid flow analysis. The design team includedspecialists drawn from the staff of Sandia National Laboratories, Parsons Brinckerhoff Quadeand Douglas, Inc. (contract number AG-4909), INTERA, Inc. (contract number AG-4910), andRE/SPEC Inc. (contract number AG-4911), with management by Sandia National Laboratories.The contractors developed a quality assurance program consistent with the Sandia NationalLaboratories Quality Assurance Program Description for the WIPP project. All three contractorsreceived quality assurance support visits and were audited through the Sandia NationalLaboratories audit and assessment program. Quality assurance (QA) documentation ismaintained in the Sandia National Laboratories WIPP Central Files. Access to project files foreach contractor can be accomplished using the contract numbers specified above. In addition tothe contractor support, technical input was obtained from consultants in various technicalspecialty areas.
Formal preliminary and final design reviews have been conducted on the technicalinformation documented in the report. In addition, technical, management, and QA reviews havebeen performed on this report. Documentation is in the WIPP Central File.

It is recognized that additional information, such as on specific seal material or formationcharacteristics, on the sensitivity .of system performance to component properties, on placementeffectiveness, and on long-term performance, could be used to simplify the design and perhapsreduce the length or number of components. Such design optimization and associatedsimplifications are left to future research that may be used to update the compliance evaluationscompleted between now and the time of actual seal emplacement.
1.5 Organization of Document
This report contains an Executive Summary, 10 sections, and 5 appendices. The body ofthe report does not generally contain detailed backup information; this information isincorporated by reference or in the appendices. . •
The Executive Summary is a synopsis of the design and the supporting discussionsrelated to seal materials, construction procedures, structural analyses, and fluid flow analyses.Introductory material in Section 1 sets the stage for and provides a "road map" to the remainderof the report.
Site characteristics that detail the setting into which the seals would be placed aredocumented in Section 2. These characteristics include the WIPP geology and stratigraphy forboth the region and the shafts as well as a brief discussion of rock mechanics considerations ofthe site that impact the sealing system. Regional and local characteristics of the hydrologic andgeochemical settings are also briefly discussed.
Section 3 presents the design guidance used for development of the shaft sealing systemdesign. Seal-related guidance from applicable regulations is briefly described. The designguidance is then provided along with the design approach used to implement the guidance. Theguidance forms the basis both for the design and for evaluations of the sealing system presentedin other sections.
The shaft sealing system is documented in Section 4; detailed drawings for the design areprovided in Appendix E. The seal components, their design, and their functions are discussed forthe Salado, the Rustler, and the overlying formations.
The sealing materials are described briefly in Section 5, with more detail provided in the-materials specifications (Appendix A). The materials used in the various seal components arediscussed along with the reasons they are expected to function as intended. Material propertiesincluding permeability, strength, and mechanical constitutive response are given for eachmaterial. Brief discussions of expected compatibility, performance, construction techniques, andother characteristics relevant to the WIPP setting are also given.
- Section 6 contains a brief description o£the construction techniques proposed for use.General site and sealing preparation activities are discussed, including construction of a multi-deck stage for use throughout the placement of the components. Construction procedures to beused for the various types of components are then summarized based on the more detaileddiscussions provided in Appendix B.
Section 7 summarizes structural analyses performed to assess the ability of the shaftsealing system to function in accordance with the design guidance provided in Section 3 and to

provide input to hydrological calculations. The methods and computer programs, the modelsused to simulate the behavior of the seal materials and surrounding salt, and the results of theanalyses are discussed. Particular emphasis is placed on the evaluations of the behavior of thedisturbed rock zone. Details of the structural analyses are presented in Appendix D.
Section 8 summarizes fluid flow analyses performed to assess the ability of the shaftsealing system to function in accordance with the design guidance provided in Section 3.Hydrologic evaluations are focused on processes that could result in fluid flow through the shaftseal system and the ability of the seal system to limit such flow. Processes evaluated aredownward migration of groundwater from the overlying formation, gas migration andreconsolidation of the crushed salt component, upward migration of brines from the repository,and flow between water-bearing zones in the overlyingformation. Hydrologic models aredescribed and the results are discussed as they relate to satisfying the design guidance, withextensive reference to Appendix C that documents details of the flow analyses.
Conclusions drawn about the performance of the WIPP shaft sealing system are describedin Section 9. The principal conclusion that an effective, implementable design has beenpresented is based on the presentations in the previous sections. A reference list that documents-principal references used in developing this-design is then provided.
The five appendices that follow provide details related to the following subjects:
Appendix A — Material Specification
Appendix B — Shaft Sealing Construction Procedures
Appendix C — Fluid Flow Analyses
Appendix D — Structural Analyses
Appendix E — Design Drawings (separate volume)
1.6 Systems of Measurement
Two systems of measurement are used in this document and its appendices. Both the SystemInternational d'Unites (SI) and English Gravitational (Jps units) system are used. This usagecorresponds to common practice in the United States, where SI units are used for scientificstudies anAJps units are used for facility design, construction materials, codes, and standards.Dual dimensioning is used in the design description and other areas where this use will aid thereader.

Page intentionally blank.

2. SITE GEOLOGIC, HYDROLOGIC, AND GEOCHEMICAL SETTING
The site characteristics relevant to the sealing system are discussed in this section. Thelocation and geologic setting of the "WIPP are discussed first to provide background. Thegeology and stratigraphy, which affect the shafts, are then discussed. The hydrologic andgeochemical settings, which influence the seals, are described last.
2.1 Introduction
The WIPP site is located in an area of semiarid rangeland in southeastern New Mexico.The nearest major population center is Carlsbad, 42 km west of the WIPP. Two smallercommunities, Loving and Malaga, are about 33 km to the southwest. Population density close tothe WIPP is very low: fewer than 30 permanent residents-live within a 16-km radius.
2.2 Site Geologic SettingGeologically the WIPP is located in the Delaware Basin, an elongated depression that
extends from just north of Carlsbad southward into Texas. The Delaware Basin is bounded bythe Capitan Reef (see Figure 2-1). The basin covers over 33,000 km2 and is filled withsedimentary rocks to depths of 7,300 m (Hills, 1984). Rock units of the Delaware Basin(representing the Permian System through the Quaternary System) are listed in Figure 2-2.
Minimal tectonic activity has occurred in the region since the Permian Period (Powers etal., 1978). Faulting during the late Tertiary Period formed the Guadalupe and DelawareMountains along the western edge of the basin. The most recent igneous activity in the areaoccurred during the mid-Tertiary Period about 35 million years ago and is evidenced by a dike inthe subsurface 16 km northwest of the WIPP. Major volcanic activity last occurred more than 1billion years ago during Precambrian time (Powers et al., 1978). None of these processesaffected the Salado Formation at the WIPP. Therefore, seismic-related design criteria are notincluded in the current seal systems design guidelines.
2.2.1 Regional WIPP Geology and Stratigraphy
The Delaware Basin began forming with crustal subsidence during the PennsylvanianPeriod approximately 300 million years ago. Relatively rapid subsidence over a period of about14 million years resulted in the deposition of a sequence of deep-water sandstones, shales, andlimestones rimmed by shallow-water limestone reefs such as the Capitan Reef (see Figure 2-1).Subsidence slowed during the late Permian Period. Evaporite deposits of the Castile Formationand the Salado Formation (which hosts the WIPP underground workings) filled the basin andextended over the reef margins. The evaporites, carbonates, and clastic rocks of the RustlerFormation and the Dewey Lake Redbeds were deposited above the Salado Formation near theend of the Permian Period. The Santa Rosa and Gatuna Formations were deposited after theclose of the Permian Period.
From the surface downward to the repository horizon the stratigraphic units are theQuaternary surface sand sediments, Gatuna Formation, Santa Rosa Formation, Dewey LakeRedbeds, Rustler Formation, and Salado Formation. Three principal stratigraphic units (theDewey Lake Redbeds, the Rustler Formation, and the Salado Formation) comprise all but theupper 15 to 30 m (50 to 100 ft) of the geologic section above the WIPP facility.

32-22' -
32°
30° -
_
NewMexico
^Texas -g
3CD
\
\
(
Artesia.N
JJ<Carlsbad *><
y j
\
\
%— o.<D
Delaware *Mountains
^ ^
\ Marfa\ Basin
1
ShelfwardEdge
J "~\ WIPP \
4 » \Ba
Pecos
^ \
^ 6 >
1
O 1 tn
New
Mex
ic
Texa
i
iI•
• JHobbs
i
Hobbs Channel
V • Eunice
\ iJal j
\ rfKermitUwlnkler
rstovA y M
TiFort JStockton/
/ /
Midland9, Basin
%
onahans
)
j
104° T103°40'
102°
20 40 mi
0 20 40 Km
— 32°22'
- 32°
— 30°
TRI-6121-351-1
Figure 2-1. Location of the WIPP in the Delaware Basin.

Erathem
Cenozoic
Mesozoic
Paleozoic
•
System
Quaternary
Tertiary
Cretaceous
Jurassic
Triassic
Upper
Permian
Lower
•
Modified from Bachman,
Series
HolocenePleistocene
Pliocene
Miocene
OligoceneEocenePaleocene
Upper
Lower -
UpperLower
Ochoan
Guadalupian
LeonardianWolfcampian
1987
LithostratigraphicUnit
Windblown sandMescalero calicheGatuna Formation
Ogallala Formation
Absent in southeasternNew Mexico
• Absent in southeasternNew MexicoDetritus preserved
Absent in southeasternNew Mexico
Dockum GroupAbsent in southeasternNew Mexico
Dewey Lake RedbedsRustler FormationSalado FormationCastile Formation
Capitan Limestoneand Bell CanyonFormation
Bone SpringsWolfcamp (informal)
Age Estimate (yr)
-500,000-600,000
5.5 million
24 million
66 million
144 million
208 million
245 million
286 million
Figure 2-2. Chart showing major stratigraphic divisions, southeastern New Mexico.
The Dewey Lake Redbeds consist of alternating layers of reddish-brown, fine-grainedsandstone and siltstone cemented with calcite and gypsum (Vine, 1963). The Rustler Formationlies below the Dewey Lake Redbeds; this formation, the youngest of the Late Permian evaporitesequence, includes units that provide potential pathways for radionuclide migration from theWIPP. The five units of the Rustler, from youngest to oldest, are: (1) the Forty-niner Member,(2) the Magenta Dolomite Member, (3) the Tamarisk Member, (4) the Culebra DolomiteMember, and (5) an unnamed lower member.
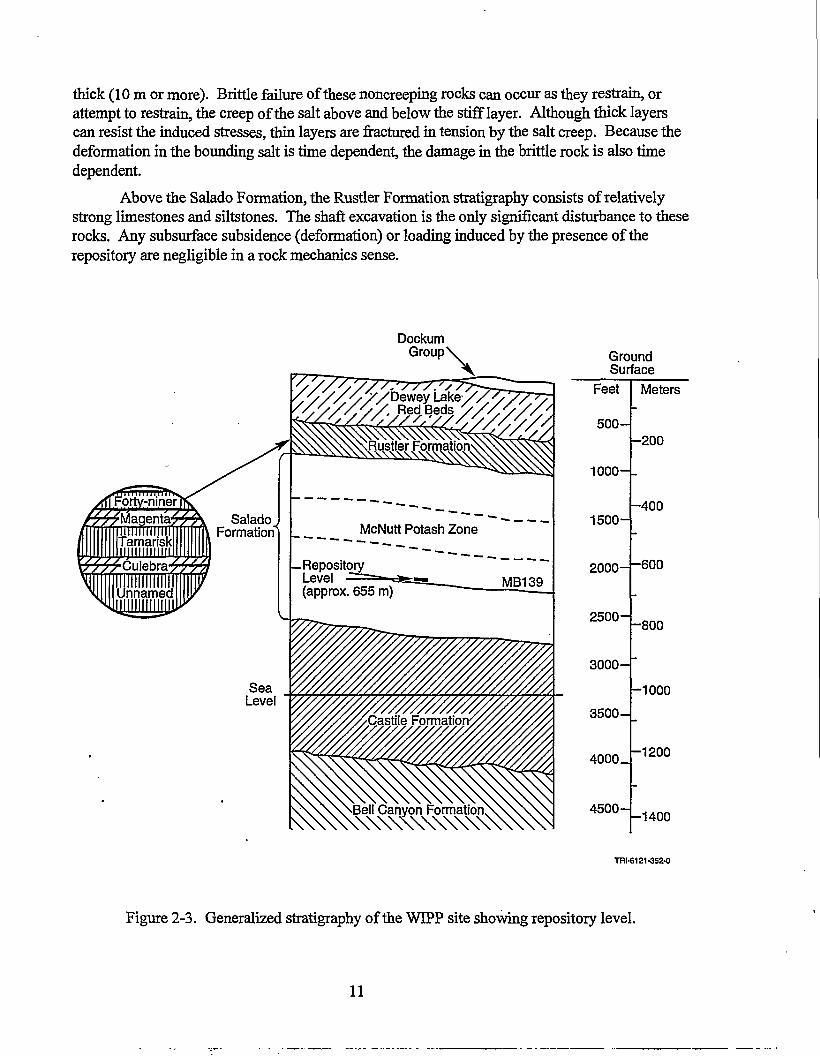
The 250-million-year-old Salado Formation lies below the Rustler Formation. This unitis about 600 m thick and consists of three informal members. From youngest to oldest, they are:(1) an upper member (unnamed) composed of reddish-orange to brown halite interbedded withpolyhalite, anhydrite, and sandstone, (2) a middle member (the McNutt Potash Zone) composedof reddish-orange and brown halite with deposits of sylvite and langbeinite; and (3) a lowermember (unnamed) composed of mostly halite with lesser amounts of anhydrite, polyhalite, andglauberite, with some layers of fine clastic material. These lithologic layers are nearly horizontalat the WIPP, with a regional dip of less than one degree. The WIPP repository is located in theunnamed lower member of the Salado Formation, approximately 655 m (2150 ft) below theground surface.
2.2.2 Local WIPP Stratigraphy
The generalized stratigraphy of the WIPP site, with the location of the repository, isshown in Figure 2-3. To establish the geologic framework required for the design of the WIPPfacility shaft sealing system, an evaluation was performed to assess the geologic conditionsexisting in and between the shafts, where the individual shaft sealing systems will eventually beemplaced (DOE, 1995: Appendix A). The study evaluated shaft stratigraphy, regionalgroundwater occurrence, brine occurrence in the exposed Salado Formation section, and theconsistency between recorded data and actual field data.
Four shafts connect the WIPP underground workings to the surface, the (1) Air IntakeShaft (AIS), (2) Exhaust Shaft, (3) Salt Handling Shaft, and (4) Waste Shaft. Stratigraphiccorrelation and evaluation of the unit contacts show that lithologic units occur at approximatelythe same levels in all four shaft locations. Some stratigraphic contact elevations vary because ofregional structure and stratigraphic thinning and thickening of units. However, the majority ofthe stratigraphic contacts used to date are suitable for engineering design reference because theyintersect all four shafts.
2.2.3 Rock Mechanics Setting
The WIPP stratigraphy includes rock types that exhibit both brittle and ductile behaviors.The majority of the stratigraphy intercepted by the shafts consists of the Salado Formation,which is predominantly halite. The primary mechanical behavior of halitic rocks is creep.Except near free surfaces (such as the shaft wall), the salt rocks will remain tight and undisturbeddespite the long-term creep deformation they sustain. The other rock types within the SaladoFormation, are anhydrites and polyhalites. These two rock types are typically brittle, stiff, andexhibit high strength in laboratory tests. The structural strength of particular anhydritic rocklayers, however, depends on the thickness of the layers, which range from thin (<1 m) to fairly
10
thick (10 m or more). Brittle failure of these noncreeping rocks can occur as they restrain, orattempt to restrain, the creep of the salt above and below the stiff layer. Although thick layerscan resist the induced stresses, thin layers are fractured in tension by the salt creep. Because thedeformation in the bounding salt is time dependent, the damage in the brittle rock is also timedependent.
Above the Salado Formation, the Rustler Formation stratigraphy consists of relativelystrong limestones and siltstones. The shaft excavation is the only significant disturbance to theserocks. Any subsurface subsidence (deformation) or loading induced by the presence of therepository are negligible in a rock mechanics sense.
DockumGroup"
RepositoryLevel(approx. 655 m)
Bell Canyon Formation. x\\w\\\\\\\\\
GroundSurface
Feet
500-
1000-
1500-
2000-
2500-
3000-
3500-
4000_
4500-
Meters
-200
-
-400
-600
-800
-
-1000
-1200
-1400
THI-6121 -352-0
Figure 2-3. Generalized stratigraphy of the WIPP site showing repository level.
11

Regardless of rock type, the shafts create a disturbed zone in the surrounding rock.Microfracturing will occur in the rock adjacent to the shaft wall, where confining stresses are lowor nonexistent. The extent of the zone depends on the rock strength and the prevailing stressstate, which is depth dependent. In the salt rocks, microfracturing occurs to form the disturbedzone both at the time of excavation and later as dilatant creep deformations occur. In the brittlerocks, the disturbance occurs at the time of excavation and does not worsen with time. Theextent of disturbed zones in the salt and brittle rocks can be calculated, as will be described inSection 7 and Appendix D.
Preventing the salt surrounding the shafts from creeping causes reintroduction of stressesthat reverse the damage process and cause healing (Van Sambeek et al., 1993). The seal systemdesign relies on this principlefor sealing the disturbed zonein salt. In the brittle rocks, groutingof the damage is a viable means of reducing the interconnected fractures that increase thepermeability of the rock.
2.3 Site Hydrologic Setting
The WlPP.shafts penetrate approximately 655 m (2150 ft) of sediments and rocks. Froma hydrogeologicperspective, relevant information includes the permeability of the water-bearingunits, the thickness of the water-bearing units, and the observed vertical pressure (head) gradientsexpected to exist after shaft construction and ambient pressure recovery. This section willdiscuss these three aspects of the site hydrogeology. The geochemistry of the pore fluidsadjacent to the shaft system is also important hydrogeologic information and will be provided inSection 2.4.
2.3.1 Hydrostratigraphy
The WIPP shafts penetrate Quaternary surface sediments, the Gatuiia Formation, theSanta Rosa Formation, the Dewey Lake Redbeds, the Rustler Formation, and the SaladoFormation. The Rustler Formation contains the only laterally-persistent water-bearing units inthe WIPP vicinity. As a result, flow-field characterization, regional flow-modeling, andperformance assessment off-site release scenarios focus on the Rustler Formation. Thehydrogeology of the stratigraphic units in contact with the upper portion of the AIS sealingsystem is fairly well known from detailed hydraulic testing of the Rustler Formation at well H-16located 17 m from the AIS (Beauhehn, 1987). The H-16 borehole was drilled in July and August1987 to monitor the hydraulic responses of the Rustler members to the drilling and constructionof the AIS. During the drilling of H-16, each member of the Rustler Formation was cored. Inaddition, detailed drill-stem, pulse, and slug hydraulic tests were performed in H-16 on themembers of the Rustler. Through the detailed testing program at H-16, the permeability of eachof the Rustler members was estimated. -Detailed mapping of the AIS by Holt and Powers (1990)and other investigators provided information on the location of wet zones and weeps within theSalado Formation. This information will be summarized below. The reader, unless particularlyinterested in this subject, should proceed to Section 2.3.2.
Water-bearing zones have been observed in units above the Rustler Formation in theWIPP site vicinity. However, drilling in the Dewey Lake Redbeds has not identified anycontinuous saturated units at the WIPP site. Water-bearing units within stratigraphic intervals
12

above the Rustler are typically perched saturated zones of very low yield. Thin perchedgroundwater intervals have been encountered in WIPP wells H-l, H-2, and H-3 (Mercer and Orr,1979). The only Dewey Lake Redbed wells that have sufficient yields for watering livestock arethe James Ranch wells, the Pocket well, and the Fairfield well (Brinster, 1991). These wells arelocated to the south of the WIPP and are not in the immediate vicinity of the WIPP shafts.
The Dewey Lake Redbeds overlie the Rustler Formation. The Rustler is composed offive members defined by lithology. These are, in ascending order, the unnamed lower member,the Culebra dolomite, the Tamarisk, the Magenta dolomite, and the Forty-niner (see Figure 2-3).Of these five members, the unnamed lower member, the Culebra, and the Magenta are the mosttransmissive units in the Rustler. The Tamarisk and the Forty-niner are aquitards within theRustler and have very low permeabilities .relative to the three members listed above.
To the east of the shafts in Nash Draw, the Rustler/Salado contact has been observed tobe permeable and water-bearing. This contact unit has been referred to as the "brine aquifer"(Mercer, 1983). The brine aquifer is not reported to exist in the vicinity of the shafts. Thehydraulic conductivity of the Rustler/Salado contact in the vicinity of the shafts is reported to beapproximately 4xlO"n m/s, which is equivalent to a permeability of 6*10'18 m2 using referencebrine fluid properties (Brinster, 1991). The unnamed lower member was hydraulic tested at wellH-l 6 in close proximity to the AIS. The maximum permeability of the unnamed lower memberwas interpreted to be 2.2xlO"18 m2 and was attributed to the unnamed lower member claystone byBeauheim (1987), which correlates to the transition and bioturbated clastic zones of Holt andPowers (1990).
The Culebra Dolomite Member is the most transmissive member of the RustlerFormation in the vicinity of the WIPP site and is the most transmissive saturated unit in contactwith the shaft sealing system. The Culebra is an argillaceous dolomicrite which containssecondary porosity in the form of abundant vugs and fractures. The permeability of the Culebravaries greatly in the vicinity of the WIPP and is controlled by the condition of the secondaryporosity (fractures). The permeability of the Culebra in the vicinity of the shafts isapproximately 2.1xlO'14 m2.
The Tamarisk Member is composed primarily of massive, lithified anhydrite, includinganhydrite 2, mudstone 3, and anhydrite 3. Testing of the Tamarisk at H-16 was unsuccessful.The estimated transmissivity of the Tamarisk at H-16 is one to two orders of magnitude lowerthan the least-transmissive unit successfully tested at H-16, which results in a permeability rangefrom 4.6x10"20 to 4.6x10"19 m2. Anhydrites in the Rustler have an approximate permeability oflxlO"19 m2. The permeability of mudstone 3 is 1.5xlO"19 m2 (Brinster, 1991).
The Magenta is a dolomite that is typically less permeable than the Culebra. TheMagenta Dolomite Member overlies the Tamarisk Member. The Magenta is an indurated,gypsiferous, arenaceous, dolomite that Holt and Powers (1990) classify as a dolarenite. Thedolomite grains are primarily composed of silt to fine sand-sized clasts. Wavy to lenticularbedding and ripple cross laminae are prevalent through most of the Magenta. Holt and Powers(1990) estimate that inflow to the shaft from the Magenta during shaft mapping was less than 1gal/min. The Magenta has a permeability of approximately 1.5 xlO"15 m2 (Saulnier and Avis,1988).
13

The Forty-niner Member is divided into three informal lithologic units. The lowest unitis anhydrite 4, a laminated anhydrite having a gradational contact with the underlying Magenta.Mudstone 4 overlies anhydrite 4 and is composed of multiple units containing mudstones,siltstones, and very fine sandstones. Anhydrite 5 is the uppermost informal lithologic unit of theForty-niner Member. The permeability of mudstone 4, determined from the pressure responsesin the Forty-niner interval of H-16 to the drilling of the AIS, is 3.9><10"16 m2 (referred to as theForty-niner claystone by Avis and Saulnier, 1990).
The Salado Formation is a very low permeability formation that is composed of beddedhalite, polyhalite, anhydrite, and mudstones. Inflows in the shafts have been observed over selectintervals during shaft mapping, but flows are below the threshold of quantification. In somecases these weeps are individual, lithologically distinct marker beds, and in some cases they arenot. Directly observable brine flow from the Salado Formation into excavated openings is ashort-lived process. Table 2-1 lists the brine seepage intervals identified by Holt and Powers(1990) during then: detailed mapping of the AIS. Seepage could be indicated by a wet rockfaceor by the presence of precipitate from brine evaporation on the shaft rockface. The zones listedin Table 2-1 make up less than 10% of the Salado section that is intersected by the WIPP shafts.
Table 2-1. Salado Brine Seepagelntervals(1)
Stratigraphic Unit
Marker Bed 103
Marker Bed 109
Vaca Triste
Zone A
Marker Bed 121
Union Anhydrite
Marker Bed 124
ZoneB
ZoneC
ZoneD
ZoneE
ZoneF
ZoneG
1 Zone H .
Marker Bed 129
Zone I
Zone J
Lithology
Anhydrite
Anhydrite
Mudstone
Halite
Polyhalite
Anhydrite
Anhydrite
Halite
Halite
Halite
Halite
Halite
Halite
Halite
Polyhalite
Halite
Halite .
Thickness (m)
5.07.72.4
2.90.52.32!7
0.92.73.20.6
0.9
0.61.80.51.71.2
(1) After US DOE, 1995.
14

To gain perspective into the important stratigraphic units from a hydrogeologic view, thepermeability and thickness of the units adjacent to the shafts can be compared. Table 2-2 liststhe lithologic units in the Rustler and the Salado Formations with their best estimatepermeabilities and their thickness as determined from the AIS mapping. The stratigraphy of theunits overlying the Rustler is not considered in Table 2-2 because these units are typically notsaturated in the vicinity of the WIPP shafts. The overlying sediments account for approximately25% of the stratigraphy column adjacent to the shafts.
Because permeability varies over several orders of magnitude, the log of the permeabilityis also listed to simplify comparison between units. Table 2-2 shows that by far the two mosttransmissive zones occur in the Rustler Formation; these are the Culebra"and Magenta dolomites.These units are relatively thin'when compared to the combined Rustler and Salado thicknessadjacent to the shafts (3% of Rustler and Salado combined thickness). The Magenta and theCulebra are the only two units that are known to possess permeabilities higher than lxlO"18 m2.
Table 2-2. Permeability and Thickness of Hydrostratigraphic Units in Contact with Seals
Formation
Rustler
Rustler
Rustler
Rustler
Rustler
Rustler
Salado
Salado
Salado
Member/ Lithology
Anhydrite(1)
Mudstone 4
Magenta
Mudstone 3
Culebra
Transition/ BioturbatedClastics
Halite
Polyhalite
Anhydrite
UndisturbedPermeability (m2)
l.OxlO"19
3.9xlO'16
1.5xl(r15
1.5xlO'19
2.1 xlO'14
2.2xlO"18
l.OxlO'21
3.0xl0"21
l.OxlO"19
Thickness (m)
46.7
4.4
7.8
2.9
8.9
18.7
356.6
10.9
28.2
(1) Anhydrite 5, Anhydrite 4, Anhydrite 3, and Anhydrite 2
The vast majority (97%) of the rocks adjacent to the shaft in the Rustler and the SaladoFormations are low permeability (<1 x 10"18 m2). The conclusion that can be drawn fromreviewing Table 2-2 is that the shafts are located hydrogeologically in a low permeability, lowgroundwater flow regime. Inflow measurements have historically been made at the shafts, andobservable flow is attributed to leakage from the Rustler Formation.
Flow modeling of the Culebra has demonstrated that depressurization has occurred as aresult of the sinking of the shafts at the site. Maximum estimated head drawdown in the Culebraat the centroid of the shafts was estimated by Haug et al. (1987) to be 33 m in the mid-1980s.This drawdown in the permeable units intersected by the shafts is expected because the shafts actas long-term constant pressure (atmospheric) sinks. Measurements of fluid flow into the WIPP
15

shafts when they were unlined show a range from a maximum of 0.11 L/s (3,469 m3/yr)measured in the Salt Handling Shaft on September 13,1981 to a minimum of 0.008 L/s(252 rnVyr) measured at the Waste Handling Shaft on August 6,1987 (LaVenue et al., 1990).
The following summary of shaft inflow rates from the Rustler is based on a review ofLaVenue et al. (1990) and Cauffman et al. (1990). Shortly after excavation and prior to groutingand liner installation, the inflow into the Salt Handling Shaft was 0.11 L/s (3,469 mVyr). Theaverage flow rate measured after shaft lining for the period from mid-1982 through October 1992was 0.027 L/s (851m3/yr). The average flow rate into the Waste Handling Shaft during the timewhen the shaft was open and unlined was about 0.027 L/s (851 m3/yr). Between the first andsecond grouting events (July 1984 to November 1987) the average inflow rate was 0.016 L/s(505 mVyr). No estimates were found after the second .grouting. Inflow to the pilot holes for theExhaust Shaft averaged 0.028 L/s (883 m3/yr). In December 1984 a liner plate was groutedacross the Culebra. After this time, a single measurement of inflow from the Culebra was 0.022L/s (694 m3/yr). After liner plate installation, three separate grouting events occurred at theCulebra. No measurable flow was reported after the third grouting event in the summer of 1987.Flow into the AIS when it was unlined and draining averaged 0.044 L/s (1,388 m3/yr). Since theRustler has been lined, flow into the AIS has been negligible.
The majority of the flow represented by these shaft measurements originates from theRustler. This is clearly evident by the fact that lining of the WIPP shafts was found to beunnecessary in the Salado Formation below the Rustler/Salado contact. When the liners wereinstalled, flow rates diminished greatly. Under sealed conditions, hydraulic gradients in rocksadjacent to the shaft will diminish as the far-field pressures approach ambient conditions. Thelow-permeability materials sealing the shaft combined with the reduction in lateral hydraulicgradients will likely result in flow rates into the shaft that are several orders of magnitude lessthan observed under open shaft or lined shaft conditions.
2.3.2 Observed Vertical Gradients
Hydraulic heads within the Rustler and between the Rustler and Salado Formations arenot in hydrostatic equilibrium. Mercer (1983) recognized that heads at the Rustler Saladotransition (referred to as the brine aquifer and not present in the vicinity of the WIPP shafts)indicate an upward hydraulic gradient from that zone to the Culebra. Later, with the availabilityof more head measurements within the Salado and Rustler members, Beauheim (1987) providedadditional insight into the potential direction of vertical fluid movement within the Rustler. Hereported that the hydraulic data indicate an upward gradient from the Salado to the Rustler.
Formation pressures in the Salado Formation have been decreased in the near vicinity ofthe WIPP underground facility. The highest, and thought to be least disturbed, estimatedformation fluid pressure from hydraulic testing is 12.55 MPa estimated from interpretation oftesting within borehole SCP01 in Marker Bed 139 (MB139) just below the underground facilityhorizon (Beauheim et al., 1993). The fresh-water head within MB139, based on the estimatedstatic formation pressure of 12.55 MPa, is 1,663.6 m (5,458 ft) above mean sea level (msl).
Hydraulic heads in the Rustler have also been impacted by the presence of the WIPPshafts. Impacts in the Culebra were significant in the 1980s with a large drawdown coneextending away from the shafts in the Culebra (Haug et al., 1987). The undisturbed head of the
16

Rustler Salado contact in the vicinity of the AIS is estimated to be about 936.0 m (3,071 ft) msl(Brinster, 1991). The undisturbed head in the Culebra is estimated to be approximately 926.9 m(3,041 ft) msl in the vicinity of the AIS (LaVenue et al., 1990). The undisturbed head in theMagenta is estimated to be approximately 960.1 m (3,150 ft) msl (Brinster, 1991).
The disturbed and undisturbed heads in the Rustler are summarized in Table 2-3. Alsoincluded is the freshwater head of MB 139 based on hydraulic testing in the WIPP underground.Consistent with the vertical flow directions proposed by previous investigators, estimatedvertical gradients in the vicinity of the AIS before the shafts were drilled indicate a hydraulicgradient from the Magenta to the Culebra and from the Rustler/Salado contact to the Culebra.There is also the potential for flow from the Salado Formation to the Rustler Formation.
Table 2-3. Freshwater Head Estimates in the Vicinity of the Air Intake Shaft
Hydrologic Unit
Magenta Member
Culebra Member
Lower UnnamedMember
Rustler/Salado Contact
Salado MB 139
Freshwater Head(masl)
Undisturbed
960.11
926.91
—
936.0 - 940.01
1,663.62
Disturbed
•948.82(H-16)
915.02(H-16)
953.42(H-16)
—
—
Reference
Brinster (1991)Beauheim(1987)
LaVenue etal. (1990)Beauheim (1987)
Beauheim (1987)
Brinster (1991)
Beauheim etal. (1993)
1 Estimated from a contoured head surface plot based principally on well data collected prior to sh'aftconstruction.
2 Measured through hydraulic testing and/or long-term monitoring.
2.4 Site Geochemical Setting
2.4.1 Regional and Local Geochemistry in Rustler Formation and Shallower Units
The Rustler Formation, overlying the Salado Formation, consists of interbeddedanhydrite/gypsum, mudstone/siltstone, halite east of the WIPP site, and two layers of dolomite.Principal occurrences of NaCl/MgSO4 brackish to briny groundwater in the Rustler at the WIPPsite and to the north, west, and south are found (1) at the lower member near its contact with theunderlying Salado and (2) in the two dolomite members having a variable fracture-inducedsecondary porosity. The mineralogy of the Rustler Formation is summarized in Table 2-4.
The five members of the Rustler Formation are described as follows: (1) The Forty-ninerMember is similar in lithology to the other non-dolomitic units but contains halite east of theWIPP site. (2) The Magenta Member is another variably fractured dolomite/sulfate unitcontaining sporadic occurrences of groundwater near and west of the WIPP site. (3) TheTamarisk Member is dominantly anhydrite (locally altered to gypsum) with subordinate fine-
17

grained elastics, containing halite to the east of the WIPP site. (4) The Culebra DolomiteMember is dominantly dolomite with subordinate anhydrite and/or gypsum, having a variablefracture-induced secondary porosity containing regionally continuous occurrences ofgroundwater at the WIPP site and to the north, west, and south. (5) An unnamed lower memberconsists of sandstone, siltstone, mudstone, claystone, and anhydrite locally altered to gypsum,and containing halite under most of the WIPP site and occurrences of brine at its base, mostlywest of the WIPP site.
Table 2-4. Chemical Formulas, Distributions, and Relative Abundance of Minerals in theRustler and Salado Formations (after Lambert, 1992)
Mineral
Amesite
Anhydrite
Calcite-
Carnallite
Chlorite
Corrensite
Dolomite
Feldspar
Glauberite
Gypsum
Halite
Illite
Kainite
Kieserite
Langbeinite
Magnesite
Polyhalite
Pyrite
Quartz
Serpentine
Smectite
Sylvite
Formula
(Mg4Al2)(Si2Al2)O10(OH)8
CaSO4
-CaCC-3
KMgCl3«6H2O
(Mg,Al,Fe)12(Si,Al)8O20 (OH)16
Mixed-layer chlorite/smectite
CaMg(CO3)2
(K,Na,Ca)(Si,Al)4O8
Na2Ca(SO4)2
CaSO4»2H2O
NaCl
KM.SAUCSWSAIM.SO^COH) ,
KMgClSO4»3H2O
MgSO4-H2O
K2Mg2(SO4)3
MgCO3
K2Ca2Mg(SO4)4-2H2O
FeS2
SiO2
Mg3Si205(0H)4
(Ca1/2,Na)o.7(Al,Mg,Fe)4(Si,Al)8020(OH)4«nH20
KC1
Occurrence/Abundance
S,R
SSS,RRR
S,RR
SSt
St,RtS$,RtRR
SfcRtS
S,RRR
SSS,RRR
St,R|
SSt
SSt
s*S,R
SS,R
S,R
St,Rt
St,Rt
St,RtSS*
Key to Occurrence/Abundance notations:
S = Salado Formation; R = Rustler Formation; 3* = abundant, 2x = common, lx = rare or accessory;* = potash-ore mineral (never near surface); f = potash-zone non-ore mineral; $ = in claystone interbeds.
18
The Dewey Lake Redbeds, overlying the Rustler Formation, are the uppermost Permianunit; they consist of siltstones and claystones locally transected by concordant and discordantfractures that may contain gypsum. The Dewey Lake Redbeds contain sporadic occurrences ofgroundwater that may be locally perched, mostly in the area south of the WIPP site. The TriassicDockum Group (undivided) rests on the Dewey Lake Redbeds in the eastern half of the WIPPsite and thickens eastward; it is a locally important source of groundwater for agricultural anddomestic use.
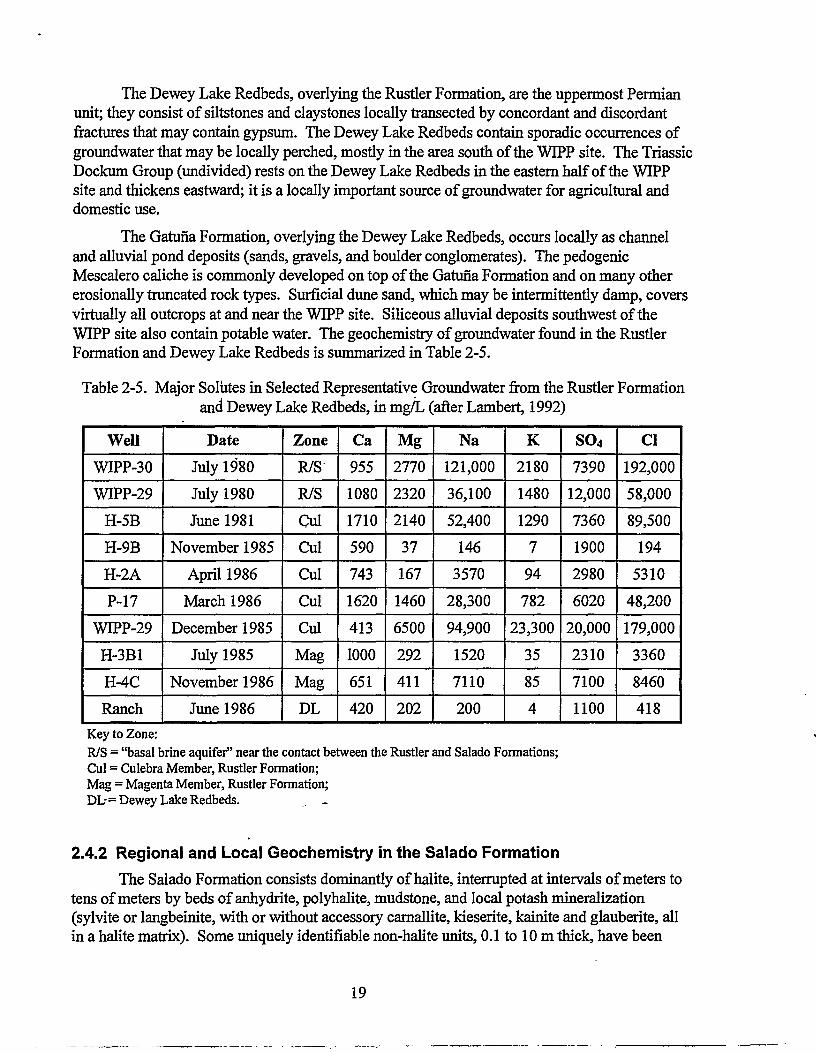
The Gatuna Formation, overlying the Dewey Lake Redbeds, occurs locally as channeland alluvial pond deposits (sands, gravels, and boulder conglomerates). The pedogenicMescalero caliche is commonly developed on top of the Gatuna Formation and on many othererosionally truncated rock types. Surficial dune sand, which may be intermittently damp, coversvirtually all outcrops at and near the WIPP site. Siliceous alluvial deposits southwest of theWIPP site also contain potable water. The geochemistry of groundwater found in the RustlerFormation and Dewey Lake Redbeds is summarized in Table 2-5.
Table 2-5. Major Solutes in Selected Representative Groundwater from the Rustler Formationand Dewey Lake Redbeds, in mg/L (after Lambert, 1992)
Well
WIPP-30
WIPP-29
H-5B
H-9B
H-2A
P-17
WIPP-29
H-3B1
H-4C
Ranch
Date
July 1980
July 1980
June 1981
November 1985
April 1986
March 1986
December 1985
July 1985
November 1986
June 1986
Zone
R/S
R/S
Cul
Cul
Cul
Cul
Cul
Mag
Mag
DL
Ca
955
1080
1710
590
743
1620
413
1000
651
420
Mg
2770
2320
2140
37
167
1460
6500
292
411
202
Na
121,000
36,100
52,400
146
3570
28,300
94,900
1520
7110
200
K
2180
1480
1290
794
782
23,300
35
85
4
SO4
7390
12,000
7360
1900
2980
6020
20,000
2310
7100
1100
Cl
192,000
58,000
89,500
194
5310
48,200
179,000
3360
8460
418
Key to Zone:R/S = "basal brine aquifer" near the contact between the Rustler and Salado Formations;Cul - Culebra Member, Rustler Formation;Mag = Magenta Member, Rustler Formation;DL-= Dewey Lake Redbeds. , _
2.4.2 Regional and Local Geochemistry in the Salado FormationThe Salado Formation consists dominantly of halite, interrupted at intervals of meters to
tens of meters by beds of anhydrite, polyhalite, mudstone, and local potash mineralization(sylvite or langbeinite, with or without accessory carnallite, kieserite, kainite and glauberite, allin a halite matrix). Some uniquely identifiable non-halite units, 0.1 to 10 m thick, have been
19

numbered from the top down (100 to 144) for convenience as marker beds to facilitate cross-basinal stratigraphic correlation. The WIPP facility was excavated just above Marker Bed 139 inthe Salado Formation at a depth of about 655 m.
Although the most common Delaware Basin evaporite mineral is halite, the presence ofless soluble interbeds (dominantly anhydrite, polyhalite, and claystone) and more solubleadmixtures (e.g. sylvite, glauberite, kainite) has resulted in chemical and physical propertiessignificantly different from those of pure NaCl. Under differential stress produced nearexcavations, brittle interbeds (anhydrite, polyhalite, magnesite, dolomite) may fracture, whereasunder a similar stress regime pure NaCl would undergo plastic deformation. Fracturing of theseinterbeds has locally enhanced the permeability, allowing otherwise nonporous rock to carrygroundwater (e.g., the fractured polyhalitic anhydrite ofMarker Bed 139 under the floor of theWIPP excavations).
Groundwater in evaporites represents the exposure of chemical precipitates to fluids thatmay be agents (as in the case of dissolution) or consequences of postdepositional alteration of theevaporites (as in the cases of dehydration of gypsum and diagenetic dewatering of otherminerals). Early in the geological studies of the WIPP site, groundwater occurrences that couldbe hydrologically characterized were identified.
Since the beginning of conventional mining in the Delaware Basin, relatively short-livedseeps (pools on the floor, efflorescences on the walls, and stalactitic deposits on the ceiling) havebeen known to occur in the Salado Formation where excavations have penetrated. These brineoccurrences are commonly associated with the non-halitic interbeds whose porosity is governedeither by fracturing (as in brittle beds) or mineralogical discontinuities (as in "clay" seams).
The geochemistry of brines encountered in the Salado Formation is summarized in Table2-6. The relative abundance of minerals was summarized in Table 2-4.
20

Table 2-6. Variations in Major Solutes in Brines from the Salado Formation, in mg/L(after Lambert, 1992)
Source of Brine
Room G Seep
Marker Bed 139
(under repository)
RoomJ
RoomQ
AIS Sump(accumulation in
bottom of sump)
McNutt Potash Zone
Duval mine
Miss. Chem. mine
Date
Sep-87
Nov-87
Feb-88
Mar-88
Jul-88
Sep-88
Apr-91Jul-91OctT91
Jul-88
May-89
May-89
Ca
278300
260
280
292
273
240239252
300
300300
230210
220
250190100
270280
279288257
9609001000
640200
Mg
14800
18700
18200
17000
13000
14700
14400
14100
14700
18900
17100
17600
17700
27400
17900
22200
31000
35400
18900
20200
31500
31100
34000-
1040
500800
55400
44200
K
15800
15400
17100
16200
•14800
13700
12900
13100
14100
14800
15600
15800
13500
22400
15600
18300
19900
27800
14500
17000
22600
24100
26300
1720
6001100
30000
45800
Na
99000
97100
94100
92100
96600
86500
95000
93000
95000
67700
72700
71600
63600
56400
73400
63000
46800
40200
59900
70400
68000
68000
63000
118000
83100
82400
27500
43600
Cl
188000
190000
186000
187000
188000
185000
189000
190000
189000
155900
158900
182200
167000
168000
165000
165000
170000
173000
166000
165000
205000
203000
205000
187000
122700
114200
236500
226200
so4
29500
32000
36200
34800
29300
28000
28000
27700
27100
14700
13400
14700
15100
19600
9300
31100
24600
30000
16200
10600
19400
19200
23500
6170
7700
8800
3650
12050
21

Page intentionally blank.
22

3. DESIGN GUIDANCE
3.1 Introduction
The WIPP is subject to regulatory requirements contained in 40 CFR 191 and 40 CFR194. The use of both engineered and natural barriers to isolate wastes from the accessibleenvironment is required by 40 CFR 191.14(d), and the use of engineered barriers to prevent orsubstantially delay the movement of water or radionuclides toward the accessible environment isrequired by 40 CFR 194.44. Quantitative requirements for potential releases of radioactive andother hazardous materials from the repository system are specified in 40 CFR 191 and 40 CFR268. The regulations impose quantitative release requirements on the total repository system, noton individual subsystems of the repository system, for example, the shaft sealing subsystem.
3.2 Design Guidance and Design Approach
The guidance described for the design of the shaft sealing system addresses the need forthe WIPP to comply with system requirements and to follow accepted engineering practicesusing demonstrated technology. The design guidance addresses the need to limit:
1. radiological or other hazardous constituents reaching the regulatory boundaries,
2. groundwater flow into and through the sealing system,
3. chemical and mechanical incompatibility,
4. structural failure of system components,
5. subsidence and accidental entry, and
6. development of new construction technologies and/or materials.
For each element of design guidance, a design approach has been developed. Table 3-1 containsqualitative design guidance and the design approach used to implement it.
Table 3-1. Shaft Sealing System Design Guidance
Qualitative Design Guidance
The shaft sealing system shall limit:
1. the migration of radiological orother hazardous constituents from therepository horizon to the regulatoryboundary during the 10,000-year regulatoryperiod following closure;
2. groundwater flowing into andthrough the shaft sealing system;
Design Approach
The shaft sealing system shall be designed tomeet the qualitative design guidance in the
following ways:
1. In the absence of human intrusion, brinemigrating from the repository horizon to theRustler Formation must pass through a lowpermeability sealing system.
2. In the absence of human intrusion,groundwater migrating from the RustlerFormation to the repository horizon must passthrough a low permeability sealing system.
23

Table 3-1. Shaft Sealing System Design Guidance
Qualitative Design Guidance
3. chemical and mechanicalincompatibility of seal materials with theseal environment;
4. the possibility for structural failureof individual components of the sealingsystem;
5. subsidence of the ground surface inthe vicinity of the shafts and the possibilityof accidental entry after sealing;
6. the need to develop newtechnologies or materials for constructionof the shaft sealing system.
Design Approach
3. Brine contact with seal elements islimited and materials possess acceptablemechanical properties.
4. State of stress from forces expected fromrock creep and other mechanical loads isfavorable for seal materials.
5. The shaft is completely filled with low-porosity materials, and construction equipmentwould be needed to gain entry.
6. Construction of the shaft sealing systemis feasible using available technologies andmaterials. ~
24

4. DESIGN DESCRIPTION
4.1 Introduction
The design presented in this section was developed based on (1) the design guidanceoutlined in Section 3.0, (2) past design experience, and (3) a desire to reduce uncertaintiesassociated with the performance of the WIPP sealing system. The WIPP shaft sealing systemdesign has evolved over the past decade from the initial concepts presented by Stormont (1984)to the design concepts presented in this document. The past designs are:
• the plugging and sealing program for the WIPP (Stormont, 1984),
• the initial reference seal system design. (Nowaketal., 1990),
• the seal design alternative study (Van" Sambeek etal., 1993),
• the WIPP sealing system design (DOE, 1995).
The present design changes were implemented to take advantage of knowledge gained fromsmall-_scale seals tests conducted at the WIPP (Knowles and Howard, 1996), advances in theability to predict the time-dependent mechanical behavior of compacted salt rock (Callahan et al.,1996), large-scale dynamic salt compaction tests and associated laboratory determination of thepermeability of compacted salt samples (Hansen and Ahrens, 1996; Brodsky et al., 1996), fieldtests to measure .the permeability of the DRZ surrounding the WIPP AIS (Dale and Hurtado,1996), and around seals (Knowles et al., 1996). A summary paper (Hansen et al., 1996)describing the design has been prepared.
The shaft sealing system is composed of seals within the Salado Formation, the RustlerFormation, and the Dewey Lake Redbeds and overlying units. All components of the sealingsystem are designed to meet Items 3,4, and 6 of the Design Guidance (Table 3-1.); that is, allsealing system components are designed to be chemically and mechanically compatible with theseal environment, structurally adequate, and constructable using currently available technologyand materials. The seals in the Salado Formation are also designed to meet Items 1 and 2 of theDesign Guidance. These seals will limit fluid migration upward from the repository to theRustler Formation and downward from the Rustler Formation to the repository. Migration ofbrine upward and downward is discussed in Sections 8.5 and 8.4 respectively. The seals in theRustler Formation are designed to meet Item 2 in addition to Items 3,4, and 6 of the DesignGuidance. The seals in the Rustler Formation limit migration of Rustler brines into the shaftcross-section and also limit cross-flow between the Culebra and Magenta members. Theprincipal function of the seals in the Dewey Lake Redbeds and overlying units is to meet Item 5of the Design Guidance, that is, to limit subsidence of the ground surface in the vicinity of theshafts and to prevent accidental entry after repository closure. Entry of water (surface water andany groundwater that might be preseht in the Dewey Lake Redbeds and overlying units) into thesealing system is limited by restraining subsidence and by placing high density fill in the shafts.
4.2 Existing Shafts
The WIPP underground facilities are accessed by four shafts commonly referred to as theWaste, Air Intake, Exhaust, and Salt Handling Shafts. These shafts were constructed between1981 and 1988. All four shafts are lined from the surface to just below the contact of the Rustler
25

and Salado Formations. The lined portion of the shafts terminates in a substantial concretestructure called the "key," which is located in the uppermost portion of the Salado Formation.Drawings showing the configuration of the existing shafts are included in Appendix E and listedbelow in Table 4-1. Table 4-2 contains a summary of information describing the existing shafts.
The upper portions of the WIPP shafts are lined. The Waste, Air Intake, and Exhaustshafts have concrete linings; the Salt Handling Shaft has a steel lining with grout backing. Inaddition, during shaft construction, steel liner plates, wire mesh, and pressure grouting were usedto stabilize portions of the shaft walls in the Rustler Formation and overlying units. Seepage ofgroundwater into the lined portions of the shafts has been observed. This seepage was expected;in fact, the shaft keys (massive concrete structures located at the base of each shaft liner) weredesigned to collect the seepage and transport it through a piping system to collection points at therepository horizon. In general, the seepage originates in the Magenta and Culebra members ofthe Rustler Formation and in the interface zone between the Rustier and Salado formations. Itflows along the interface between the shaft liner and the shaft wall and through the DRZimmediately adjacent to the shaft wall. In those cases where seepage through the liner occurred,it happened where the liner offered lower resistance to flow than the interface and DRZ, forexample, at construction joints. Maintenance grouting, in selected areas of the WIPP shafts, hasbeen utilized to reduce seepage.
Table 4-1. Drawings Showing Configuration of Existing WIPP Shafts(Drawings are in Appendix E)
Shaft
Waste
Waste
AIS
AIS
Exhaust
Exhaust
SaltHandling
SaltHandling
Drawing Title
Near-Surface/Rustler FormationWaste Shaft Stratigraphy & As-Built Elements
Salado FormationWaste Shaft Stratigraphy & As-Built Elements
Near-Surface/Rustler FormationAir Intake Shaft Stratigraphy & As-Built Elements
Salado FormationAir Intake Shaft Stratigraphy & As-Built Elements
Near-Surface/Rustler FormationExhaust Shaft Stratigraphy & As-Built Elements
Salado FormationExhaust Shaft Stratigraphy & As-Built Elements
Near-Surface/Rustler FormationSalt Handling Shaft Stratigraphy & As-Built Elements
Salado FormationSalt Handling Shaft Stratigraphy & As-Built Elements
Sheet Number ofDrawing SNL-007
2 of 28
3 of 28
7 of 28
8 of 28
12 of 28
13 of 28
17 of 28
18 of 28
26

Table 4-2. Summary of Information Describing Existing WIPP Shafts
to4
Shafts•
A. Construction Methodi. Sinking method
ii. Dates of shaft sinking
iii. Ground treatment in water-bearingzone
iv. Sump constructionB. Upper Portion of Shaft *
i. Type of linerii. Lining diameter (ID)iii. Excavated diameteriv. Installed depth of liner
C. Kev Portion of Shaft*i. Construction material iii. Liner diameter (ID)iii. Excavated diameteriv. Depth-top of Keyv. Depth-bottom of Keyvi. Dow Seal #1 depthvii. Dow Seal #2 depthviii. Dow Seal #3 depthix. Top of salt (Rustler/Salado contact)
D. Lower Shaft (Unlinedi •i. Type of supportii. Excavated diameteriii. Depth-top of "unlined"iv. Depth-bottom of "unlined"
E. Station •i. Type of supportii. Principal dimensionsiii. Depth-top of stationiv. Depth-floor of station ,
F. Sump*Depth-top of sumpDepth-bottom of sump
G. Shaft Dutv
Salt Handling
Blind bored
7/81-10/81
Grout behind steel liner duringconstructionDrill & blast
SteellO'-O"ll'-lO"838.5'
Reinf. cone, w/chem. sealslO'-O"15'-0" to 18'-0"844'883'846' to 848'853' to 856'868 to 891'851'
Unlinedll'-10"882'2144'
Wire mesh21Hx31W2144'2162'
2162'2272'Construction hoisting ofexcavated salt; personnelhoisting
Waste
Initial 6' pilot hole slashed by drill& blast (smooth wall blasting)Drilled 12/81-2/82 'Slashed 10/83-6/84Grouted 1984 & 1988
Drill & blast
Concrete19'-0"20'-8"to22'-4"812'
Reinf. concrete w/chem. seals19'-0"27'-6"to31'-0"836'900'846' to 849'856' to 859'NA843'
Chain link mesh20'-0"900'2142'
12H x 30W2142'2160'
2160'2286'Hoisting shaft for lowering wastecontainers; personnel hoistinguntil waste receipt
Air Intake
Raise bored
i• 12/87-8/88
Grouted 1993
No sump
Concrete18'-0716'-7"2O'-3"816'
Reinf. concrete w/chem. seals16'-7"29'-3" to 35'-3"834'897'839" to 842'854' to 857'NA841"
Unlined2O'-3"904'2128"
Wire mesh25H x 36W2128'2150'
No sump
Ventilation shaft for intake(fresh) air; personnel hoisting
Exhaust
Initial 6' pilot hole slashed by drill& blast (smooth wall blasting)9/83-11/84
Grouted 1985,1986, & 1987
No sump
Concrete14'-0"15'-8" to 16'-8"846'
Reinf. concrete w/chem. seals14'-0"21'-0" to 26'-0"846'910'853'to 856'867' to 870'NA853'
Chain link mesh15'-0"913'2148'
Wire mesh12H x 23W2148'2160'
No sump
Exhaust air ventilation shaft
•This information is from the Westinghouse WID drawings identified on Sheets 2,3,7,8,12,13,17, and 18 of Drawing SNL-007 (see Appendix E).
4.3 Sealing System Design Description
This section describes the shaft sealing system design, components, and functions. Theshaft sealing system consists of three essentially independent parts:
1. The seals in the Salado Formation provide the primary regulatory barrier. They will limitfluid flow into and out of the repository throughout the 10,000-year regulatory period.
2. The seals in the Rustler Formation will limit flow from the water-bearing members of theRustler Formation and limit commingling of Magenta and Culebra groundwaters.
3. The seals in the Dewey Lake Redbeds and the near-surface units will limit infiltration ofsurface water and preclude accidental entry through the shaft openings.
The same sealing system is used in all four shafts. Therefore an understanding of the sealingsystem for one shaft is sufficient to understand the sealing system in all shafts. Only minordifferences exist in the lengths of the components, and the component diameters differ toaccommodate the existing shaft diameters.
„__ The shaft liner will be removed in four locations in each shaft. All of these locations arewithin the Rustler Formation. Additionally, the upper portion of each shaft key will beeliminated. The portion of the shaft key that will be eliminated spans the Rustler/Saladointerface and extends into the Salado Formation. The shaft liner removal locations are
1. from 10ft above the Magenta Member to the base of the Magenta (removal distances varyfrom 34-39 ft because of different member thickness at shaft locations),
2. for a distance of 10 ft in the anhydrite of the Tamarisk Member,
3. through the full height of the Culebra (17-24 ft), and
4. from the top anhydrite unit in the unnamed lower member to the top of the key (67-85 ft).
Additionally, the concrete will be removed from the top of the key to the bottom of the key'slower chemical seal ring (23 to 29 ft). Drawing SNL-007, Sheets 4,9,14, and 19 in Appendix Eshow shaft liner removal plans, and Sheet 23 shows key removal plans.
The decision to abandon portions of the shaft lining and key in place is based on twofactors. First, no improvements in the performance of the sealing system associated withremoval of these isolated sections of concrete have been identified. Second, because the keys arethick and heavily reinforced, their removal would be costly and time consuming. No technicalproblems are associated with the removal of this concrete; thus, if necessary, its removal can beincorporated in any future design.
The DRZ will be pressure grouted throughout the liner and key removal areas and for adistance of 10 ft above and below all liner removal areas. The pressure grouting will stabilize theDRZ during liner removal and shaft'seaUng operations. The grouting will also controlgroundwater seepage during and after liner removal. The pressure grouting of the DRZ has notbeen assigned a sealing function beyond the construction period. It is likely that this grout willseal the DRZ for an extended period of time. However, past experience with grout in the miningand tunneling industries demonstrates that groundwater eventually opens alternative pathwaysthrough the media and reestablishes seepage patterns (maintenance grouting is common in both
28
mines and tunnels). Therefore, post-closure sealing of the DRZ in the Rustler Formation has notbeen assumed in the design.
The compacted clay sealing material (bentonite) will seal the shaft cross-section in theRustler Formation. In those areas where the shaft liner has been removed, the compacted claywill confine the vertical movement of groundwater in the Rustler to the DRZ. Sealing the shaftDRZ is accomplished in the Salado Formation. It is achieved initially through the interruption ofthe halite DRZ by concrete-asphalt waterstops and on a long-term basis through the naturalprocess of healing the halite DRZ. The properties of the compacted clay are discussed in Section5.3.2. The concrete-asphalt waterstops and DRZ healing in the Salado are discussed in Sections7.6.1 and 7.5.2 respectively.
Reduction of the uncertainty associated with long-term performance is addressed byreplacing the upper and lower Salado Formation salt columns used in some of the earlier designswith compacted clay columns and by adding asphalt sealing components in the SaladoFormation. Use of disparate materials for sealing components reduces the uncertainty associatedwith a common-mode failure.
The compacted salt column provides a seal with an initial permeability several orders ofmagnitude higher than the clay or asphalt columns; however, its long-term properties willapproach those of the host rock. The permeability of the compacted salt, after consolidation, willbe several orders of magnitude lower than that of the clay and comparable to that of the asphalt.The clay provides seals of known low permeability at emplacement, and asphalt provides anindependent low permeability seal of the shaft cross-section and the shaft wall interface at thetime of installation. Sealing of the DRZ in the Rustler Formation during the construction periodis accomplished by grouting, and initial sealing of the DRZ in the Salado Formation isaccomplished by three concrete-asphalt waterstops.
In the following sections, each component of each of the three shaft segments isidentified by name and component number (see Figure 4-1 for nomenclature). Associateddrawings in Appendix E are also identified. Drawings showing the overall system configurationsfor each shaft are listed in Table 4-3.
4.3.1 Salado Seals
The seals placed in the Salado Formation are composed of (1) consolidated salt, clay, andasphalt components that will function for very long periods, exceeding the 10,000-yearregulatory period; and (2) salt saturated concrete components that will function for extendedperiods. The specific components that comprise the Salado seals are described below.
4.3.1.1 Compacted Salt Column -The compacted salt column (Component 10 in Figure 4-1, and shown in Drawing SNL-
007, Sheet 25) will be constructed of crushed salt taken from the Salado Formation. The lengthof the salt column varies from 170 to 172 m (556 to 564 ft) in the four shafts. The compactedsalt column is sized to allow the column and concrete-asphalt waterstops at either end to beplaced between the Vaca Triste Unit and Marker Bed 136. The salt will be placed and
29

Oft56 ft Near-surface Units -
Dewey LakeRedbeds
530 ft
RustlerFormation
840 ft
SaladoFormation
2,150 ft
Sealing SystemComponents
- 1. Compacted earthen fill
2. Concrete plug
3. Compacted earthen fill
4. Rustler compacted clay column
—- 5. Concrete plug
6. Asphalt column
7. Upper concrete-asphalt waterstop
8. Upper Salado compacted clay column
9. Middle concrete-asphalt waterstop
10. Compacted salt column
11. Lower concrete-asphalt waterstop
12. Lower Salado compacted clay column
13. Shaft station monolith
Figure 4-1. Arrangement of the Air Intake Shaft sealing system.
30

Table 4-3. Drawings Showing the Sealing System for Each Shaft(Drawings are in Appendix E)
Shaft
Waste
Waste
AIS
AIS
Exhaust
Exhaust
Salt Handling
Salt Handling
Drawing Title
Near-Surface/Rustler FormationWaste Shaft Stratigraphy & Sealing SubsystemProfile
Salado FormationWaste Shaft Stratigraphy & Sealing SubsystemProfile . - . r . ,
Near-Surface/Rustler FormationAir Intake Shaft Stratigraphy & SealingSubsystem Profile
Salado FormationAir Intake Shaft Stratigraphy & SealingSubsystem Profile
Near-Surface/Rustler FormationExhaust Shaft Stratigraphy & SealingSubsystem Profile
Salado FormationExhaust Shaft Stratigraphy & SealingSubsystem Profile
Near-Surface/Rustler FormationSalt Handling Shaft Stratigraphy & SealingSubsystem Profile
Salado FormationSalt Handling Shaft Stratigraphy & SealingSubsystem Profile
Sheet Number ofDrawing SNL 007
4 of 28
5 of 28
9 of 28
10 of 28
14 of 28
15 of 28
19 of 28
20 of 28
compacted to a density approaching 90% of the average density of intact Salado salt. The effectsof creep closure will cause this density to increase with time, further reducing permeability.
The salt column will offer limited resistance to fluid migration immediately afteremplacement, but it will become less permeable as creep closure further compacts the salt. Saltcreep increases rapidly with depth; therefore, at any time, creep closure of the shaft will begreater at greater depth. The location and initial compaction density of the compacted saltcolumn were chosen to assure consolidation of the compacted salt column in the 100 yearsfollowing repository closure. The state of salt consolidation, results of analyses predicting thecreep closure of the shaft, consolidation and healing of the compacted salt, and healing of theDRZ surrounding the compacted salt column are presented in Sections 7.5 and 8.4 of thisdocument. These results indicate that the salt column will become an effective long-term barrierwithin 100 years.
31

4.3.1.2 Upper and Lower Salado Compacted Clay Columns
The upper and lower Salado compacted clay columns (Components 8 and 12 respectivelyin Figure 4-1) are shown in detail on Drawing SNL-007, Sheet 24. A commercial well-sealinggrade sodium bentonite will be used to construct the upper and lower Salado clay columns.These clay columns will effectively limit fluid movement from the time they are placed and willprovide an effective barrier to fluid migration throughout the 10,000-year regulatory period andthereafter. The upper clay column ranges in length from 102 to 107 m (335 to 351 ft), and thelower clay column ranges in length from 29 to 33 m (94 to 107 ft) in the four shafts. Thelocations for the upper and lower clay columns were selected based on the need to limit fluidmigration into the compacting salt column. The lower clay column stiffness is sufficient topromote early healing of the DRZ, thus removing the DRZ as a potential pathway for fluids(Appendix D, Section 5.2.1).
4.3.1.3 Upper, Middle, and Lower Concrete-Asphalt Waterstops
The upper, middle, and lower concrete-asphalt waterstops (Components 7,9, and 11respectively in'Figure 4-1) are identical and are" composed of three elements: an upper concreteplug, a central asphalt waterstop, and a lower concrete plug. These components are also shownonDrawingSNL-007, Sheet 22. The concrete specified is a specially developed salt-saturatedconcrete called Salado Mass Concrete_(SMC). In all cases the component's overall design lengthis 15 m (50 ft):
The upper and lower concrete plugs of the concrete-asphalt waterstop are identical. Theyfill the shaft cross-section and have a design length of 7 m (23 ft). The plugs are keyed into theshaft wall to provide positive support for the plug and overlying sealing materials. The interfacebetween the concrete plugs and the surrounding formation will be pressure grouted. The upperplug in each component will support dynamic compaction of the overlying sealing material ifcompaction is specified. Dynamic compaction of the salt column is discussed in Section 6.
The asphalt waterstop is located between the upper and lower concrete plugs. In all casesa kerf extending one shaft radius beyond the shaft wall is cut in the surrounding salt to containthe waterstop. The kerf is 0.3 m (1 ft) high at its edge and 0.6 m (2 ft) high at the shaft wall. Thekerf, which cuts through the existing shaft DRZ, will result in the formation of a new DRZ alongits perimeter. This new DRZ will heal shortly after construction of the waterstop, and thereafterthe waterstop will provide a very low permeability barrier to fluid migration through the DRZ.The formation and healing of the DRZ around the waterstop are addressed in Section 7.6.1. Theasphalt fill for the waterstop extends two feet above the top of the kerf to assure complete fillingof the kerf. The construction procedure used assures that shrinkage of the asphalt from coolingwill not result in the creation of voids within the kerf and will minimize the size of any voidbelow the upper plug.
Concrete-asphalt waterstops are placed at the top of the upper clay column, the top of thecompacted salt column, and the top of the lower clay column. The concrete-asphalt waterstopsprovide independent seals of the shaft cross-section and the DRZ. The SMC plugs (and grout)will fill irregularities in the shaft wall, bond to the shaft wall, and seal the interface. Salt creepagainst the rigid concrete components will place a compressive load on the salt and promote
32

early healing of the salt DRZ surrounding the SMC plugs. The asphalt waterstop will seal theshaft cross-section and the DRZ.
The position of the concrete components was first determined by the location of the saltand clay columns. The components were then moved upward or downward from their initialdesign location to assure the components were located in regions where halite was predominant.This positioning, coupled with variations in stratigraphy, is responsible for the variations in thelengths of the salt and clay columns.
4.3.1.4 Asphalt Column
An asphalt-aggregate mixture is specified for the asphalt column (Component 6 in Figure4-1). This column is 42 to 44 m (138-to 143 ft)in length in the four shafts, as shown in DrawingSNL-007, Sheet 23. The asphalt column is located above the upper concrete-asphalt waterstop; itextends approximately 5 m (16 ft) above the Rustler/Salado interface. A 6-m (20-ft) longconcrete plug (part of the Rustler seals) is located just above the asphalt column.
The existing shaft linings will be removed from a point well above the top of the asphaltcolumn to the top of the shaft keys. The concrete shaft keys will be removed to a point just below
• the lowest chemical seal ring in each key. The asphalt column is located at the top of the SaladoFormation and provides an essentially impermeable seal for the shaft cross section and along theshaft wall interface. The length of the asphalt column will decrease slightly as the column cools.The procedure for placing the flowable asphalt-aggregate mixture is described in Section 6.
4.3.1.5 Shaft Station Monolith
A shaft station monolith (Component 13) is located at the base of the each shaft. Becausethe configurations of each shaft differ, drawings of the shaft station monoliths for each shaft wereprepared. These drawings are identified in Table 4-4. The shaft station monoliths will beconstructed with SMC. The monoliths function to support the shaft wall and adjacent drift roof,thus preventing damage to the seal system as the access drift closes from natural processes.
Table 4-4. Drawings Showing the Shaft Station Monoliths (Drawings are hi Appendix E)
Shaft
Waste
AIS
Exhaust
Salt Handling
Drawing Title
Waste ShaftShaft Station Monolith
Air Intake ShaftShaft Station Monolith
Exhaust ShaftShaft Station Monolith
Salt Handling ShaftShaft Station Monolith
Sheet Number ofDrawing SNL-007
6 of 28
11 of 28
16 of 28
21 of 28
33

4.3.2 Rustler Seals
The seals in the Rustler Formation are composed of the Rustler compacted clay columnand a concrete plug: The concrete plug rests on top of the asphalt column of the Salado seals.The clay column extends from the concrete plug through most of the Rustler Formation andterminates above the Rustler's highest water-bearing zone in the Forty-niner Member.
4.3.2.1 Rustler Compacted Clay Column
The Rustler compacted clay column (Component 4 in Figure 4-1) is shown on DrawingSNL-007, Sheet 27 for each of the four shafts. A commercial well-sealing-grade sodiumbentonite will be used to construct the Rustler clay column, which will effectively limit fluidmovement from the time of placementand provide an effective barrier to fluid migrationthroughout the 10,000-year regulatory period and thereafter. Design length of the Rustler claycolumn is about 71 m (234 to 235 ft) in the four shafts.
The location for the Rustler clay columns was selected to limit fluid migration into theshaft cross-section and along the shaft wall interface and to limit mixing of Culebra and Magentawaters. • The clay column extends from above the Magenta Member to below the CulebraMember of the Rustler Formation. The Magenta and Culebra are the water-bearing units of theRustler. The members above the Magenta (the Forty-niner), between the Magenta and Culebra(the Tamarisk), and below the Culebra (the unnamed lower member) are aquitards in the vicinityof the WIPP shafts.
4.3.2.2 Rustler Concrete Plug
The Rustler concrete plug (Component 5 in Figure 3-1) is constructed of SMC. Theplugs for the four shafts are shown on Drawing SNL-007, Sheet 26. The plug is 6 m (20 ft) longand will fill the shaft cross-section. The plug is placed directly on top of the asphalt column ofthe Salado seals. The plug will be keyed into the surrounding rock and grouted. The plugpermits work to begin on the overlying clay column before the asphalt has completely cooled.The option of constructing the overlying clay columns using dynamic compaction (presentplanning calls for construction using compressed clay blocks) is also maintained by keying theplug into the surrounding rock.
4.3.3 Near-Surface Seals
The near-surface region is composed of dune sand, the Mescalero caliche, the GatunaFormation, the Santa Rosa Formation, and the Dewey Lake Redbeds. This region extends fromthe ground surface to the top of the Rustler Formation—a distance of about 160 m (525 ft). Allbut about 15 m (50 ft) of this distance is composed of the Dewey Lake Redbeds Formation. Thenear-surface seals are composed of two earthen fill columns and a concrete plug. The upperearthen fill column (Component 1) extends from the shaft collar through the surficial depositsdownward to the top of the Dewey Lake Redbeds. The concrete plug (Component 2) is placed inthe top portion of the Dewey Lake Redbeds, and the lower earthen fill column (Component 3)extends from the concrete plug into the Rustler Formation. These components are shown onDrawing SNL-007, Sheet 28.
34

This seal will limit the amount of surface water entering the shafts and will limit thepotential for any future groundwater migration into the shafts. The near surface seals will alsocompletely close the shafts and prevent accidental entry and excessive subsidence in the vicinityof the shafts. As discussed in Section 4.3.2, the existing shaft linings will be abandoned in placethroughout the near-surface region.
4.3.3.1 Near-Surface Upper Compacted Earthen Fill
This component (Component 1 in Figure 3-1) will be constructed using locally availablefill. The fill will be compacted to a density near that of the surrounding material to inhibit themigration of surface waters into the shaft cross-section. The length of this column varies from17 to 28 m (56 to 92 ft) in the four shafts. In all cases, this portion of the WIPP sealing systemmay be modified as required to facilitate decommissioning of the WIPP surface facilities.
4.3.3.2 Near-Surface Concrete Plug
Current plans call for an SMC plug (Component 2 in Figure 4-1). However, freshwaterconcrete may be used if found to be desirable at a future time. The plug extends 12 m (40 ft)downward from the top of the Dewey Lake Redbeds. It is placed inside the existing shaft lining,and the interface is grouted.
4.3.3.3 Near-Surface Lower Compacted Earthen Fill
This component (Component 3 in Figure 4-1) will be constructed using locally availablefill, which will be placed using dynamic compaction (the same method used to construct the saltcolumn). The fill will be compacted to a density equal to or greater than the surroundingmaterials to inhibit the migration of surface waters into the shaft cross-section. The length of thiscolumn varies from 136 to 148 m (447 to 486 ft) in the four shafts.
35

Page intentionally blank.
7 •_ T : '••
36

5. MATERIAL SPECIFICATION
Appendix A provides a body of technical information for each of the WIPP shaft sealmaterials. The materials specification characterizes each seal material, establishes the adequacyof its function, states briefly the method of component placement, and quantifies expectedcharacteristics (particularly permeability) pertinent to a WIPP-specific shaft seal design. Thegoal of the materials specifications is to substantiate why materials used in this seal systemdesign will limit fluid flow within the shafts and thereby limit releases of hazardous constituentsfrom the WIPP site at the regulatory boundary.
This section summarizes materials characteristics for shaft seal system componentsdesigned for the WIPP. The shaft seal system will not be constructed for decades; however, if itwere to be constructed in the near term, materials specified could be placed in the shaft and meetperformance specifications without unreasonable advances in either material development orconstruction techniques. Construction methods are described in Appendix B. Materialsspecifications and construction specifications are not to be construed as the only materials ormethods that would suffice to seal the shafts effectively. Undoubtedly, the design will bemodified, perhaps simplified, and construction alternatives may prove to be advantageous duringthe years before seal construction proceeds. Nonetheless, a materials specification is necessaryto establish a frame of reference for shaft seal design and analysis, to guide constructionspecifications, and to provide a basis for seal material parameters.
Design detail and other characteristics of the geologic, hydrologic, and chemical settingare provided in the text, appendices, and references. The four shafts will be entirely filled withdense materials possessing low permeability and other desirable engineering and economicattributes. Seal materials include concrete, clay, asphalt, and compacted salt. Other constructionand fill materials Include cementitious grout and earthen fill. Concrete, clay, and asphalt arecommon construction materials used extensively in sealing applications. Their descriptions,drawn from literature and site-specific references, are given in Appendix A. Compaction andnatural reconsolidation of crushed salt are uniquely applied here. Therefore, crushed saltspecification includes discussion of constitutive behavior and sealing performance, specific toWIPP applications. Cementitious grout is also specified in some detail. Only rudimentarydiscussion of earthen fill is given here and in Appendices A and B. Specifications for eachmaterial are discussed in the following order:
• functions,
• material characteristics,
• construction,
• performance requirements,
• verification methods.
Seal system components are materials possessing high durability and compatibility withthe host rock. The system contains functional redundancy and uses differing materials to reduceuncertainty in performance. All materials used in the shaft seal system are expected to maintaintheir integrity for very long periods. Some sealing components reduce fluid flow soon afterplacement while other components are designed to function well beyond the regulatory period.
37

5.1 Longevity
A major environmental advantage of the WIPP locale is an overall lack of groundwater toseal against. Even though very little regional water is present in the geologic setting, the sealsystem reflects great concern for groundwater's potential influence on the shaft seal system. Ifthe hydrologic system sustained considerable fluid flow, brine geochemistry could impactengineered materials. Brine would not chemically change the compacted salt column, butmechanical effects of pore pressure are of concern to reconsolidation. The geochemical setting,as further discussed in Section 2.4, will have little influence on concrete, asphalt, and clay shaftseal materials. Each material is durable because the potential for degradation or alteration is verylow.
Materials used to form the shaft seals are the same as those identified in the scientific andengineering literature as appropriate for sealing deep geologic repositories for radioactive wastes.Durability or longevity of seal components is a primary concern for any long-term isolationsystem. Issues of possible degradation have been studied throughout the internationalcommunity and within waste isolation programs in the USA. Specific degradation studies arenot detailed in this document because longevity is one of the over-riding attributes of thematerials selected and degradation is not perceived to be likely. However, it is acknowledgedhere that microbial degradation, seal material interaction, mineral transformation, such assilicification of bentonite, and-effects of a thermal pulse from asphalt or hydrating concrete areareas of continuing investigations.
Among longevity concerns, degradation of concrete is the most recognized. At this stageof the design, it is established that only small volumes of brine ever reach the concrete elements(see Section C4). Further analysis concerned with borehole plugging using cementitiousmaterials shows that at least 100 pore volumes of brine in an open system would be needed tobegin degradation processes. In a closed system, such as the hydrologic setting in the WIPPshafts, phase transformations create a degradation product of increased volume. Net volumeincrease owing to phase transformation in the absence of mass transport would decrease ratherthan increase permeability of concrete seal elements.
Asphalt has existed for thousands of years as natural seeps. Longevity studies specific toDOE's Hanford site have utilized asphalt artifacts buried in ancient ceremonies to assess long-term stability (Wing and Gee, 1994). Asphalt used as a seal component deep in the shaft willinhabit a benign environment, devoid of ultraviolet light or an oxidizing atmosphere. Additionalassurance against possible microbial degradation in asphalt elements is provided with addition oflime. For these reasons, it is believed that asphalt components will possess their designcharacteristics well beyond the regulatory period.
'" Natural bentonite is a stable material that generally will not change significantly over aperiod often thousand years. Bentonitic clays have been widely used in field and laboratoryexperiments concerned with radioactive waste disposal. As noted by Gray (1993), three internalmechanisms, illitization, silicification and charge change, could affect sealing properties ofbentonite. Illitization and silicification are thermally driven processes and, following discussionby Gray (1993), are not possible in the environment or time-frame of concern at the WIPP. Thenaturally occurring Wyoming bentonite which is the specified material for the WIPP shaft seal is
38
well over a million years old. It is, therefore, highly unlikely that the metamorphism of bentoniteenters as a design concern.
5.2 Materials
5.2.1 Mass Concrete
Concrete has low permeability and is widely used for hydraulic applications. Thespecification for mass concrete presents a special design mixture of a salt-saturated concretecalled Salado Mass Concrete (SMC). Performance of SMC and similar salt-saturated mixtureshas been established through analogous industrial applications and in laboratory and field testing.The documentation substantiates adequacy of SMC for concrete applications within the WIPPshafts.
The function of the concrete is to provide durable components with small void volume,adequate structural compressive strength, and low permeability. SMC is used as massive plugs,a monolith at the base of each shaft, and in tandem with asphalt waterstops. Concrete is a rigidmaterial that will support overlying seal components while promoting natural healing processeswithin the salt DRZ. Concrete is one of the redundant components that protects thereconsolidating salt column. The salt column will achieve low permeabilities in fewer than 100years, and concrete will no longer be needed at that time. However, concrete will continue toprovide good sealing characteristics for a very long time.
Salt-saturated concrete contains sufficient salt as an aggregate to saturate hydration waterwith respect to NaCl. Salt-saturated concrete is required for all uses within the Salado Formationbecause fresh water concrete would dissolve part of the host rock. The concrete specified for theshaft seal system has been tailored for the service environment and includes all the engineeringproperties of high quality concrete, as described in Appendix A. Among these are low heat ofhydration, high compressive strength, and low permeability. Because SMC provides materialcharacteristics of high-performance concrete, it will likely be the concrete of choice for all sealapplications at the WIPP.
Construction involves surface preparation and slickline placement. A batching andmixing operation on the surface will produce a wet mixture having low initial temperatures.Placement uses a tremie line, where the fresh concrete exits the slickline below the surface levelof the concrete being placed. Placed in this manner, the SMC will have low porosity (about 5%)with or without vibration. Tremie line placement is a standard construction method in miningoperations.
Specifications of concrete properties include mixture proportions and characteristicsbefore and after hydration. SMC strength is much greater than required for shaft seal elements,and the state of stress within the shafts is compressional with little shear stress developing.Volume stability of the SMC is also excellent; this, combined with salt-saturation, assures a goodbond with the salt. Permeability of SMC is very low, consistent with most concrete (Pfeifle etal., 1996). Because of a favorable state of stress and isothermal conditions, the SMC will remainintact. Because little brine is available to alter concrete elements, minimal degradation ispossible. These favorable attributes combine to assure concrete elements within the Salado willremain structurally sound and possess very low permeability (between 2x10" and lxlO"17 m2)
39

for exceedingly long periods. A permeability distribution function and associated discussion aregiven in Appendix A.
Standard ASTM specifications are made for the green and hydrated concrete properties.Quality control and a history of successful use in both civil construction and mining applicationsassure proper placement and performance.
5.2.2 Compacted Clay
Compacted clays are commonly proposed as primary sealing materials for nuclear wasterepositories and have been extensively investigated against rigorous performance requirements.Advantages of clays for sealing purposes include low permeability, demonstrated longevity inmany types of natural environments,-deformability, sorptive capacity, and demonstratedsuccessful utilization in practice for a variety of sealing purposes.
Compacted clay as a shaft sealing component functions as a barrier to brine flow andpossibly to gas flow (see alternative construction methods in Appendix B). Compactedbentonitic clay can generate swelling pressure and clays have sufficient rigidity to promotehealing of any DRZ in the salt. Wetted swelling clay will seal fractures as it expands into
• available space and will ensure tightness between the clay seal component and the shaft walls.
The Rustler and Salado compacted clay columns are specified to be constructed of densesodium bentonlte blocks. An extensive experimental data base exists for the permeability ofsodium bentonites under a variety of conditions. Many other properties of sodium bentonite,such as strength, stiffness, and chemical stability, are established. Bentonitic clays heal whenfractured and can penetrate small fractures or irregularities in the host rock. Further, bentonite isstable in the seal environment. These properties, noted by international waste isolationprograms, make bentonite a widely accepted seal material.
From the bottom clay component to the top earthen fill, different methods will be used toplace clay materials in the shaft. Seal performance within the Salado Formation is far moreimportant to regulatory compliance of the seal system than is performance of clay and earthen fillin the overlying formations. Therefore, more time and effort will be expended on placement ofSalado clay components. Three potential construction methods could be used to place clay in theshaft, as discussed in Appendix B: compacted blocks, vibratory roller, and dynamic compaction.Construction of Salado clay components specifies block assembly.
Required sealing performance of compacted clay elements varies with location. Forexample, Component 4 provides separation of water-bearing zones, while the lowest clay column(Component 12) limits fluid flow to the reconsolidating salt column. If liquid saturation in theclay column of 85% can be achieved, it would serve as a gas barrier. In addition, compacted clayseal components promote healing of the" salt DRZ. To achieve low permeabilities, the drydensity of the emplaced bentonite should be about 1.8 g/cm3. A permeability distributionfunction for performance assessment and the logic for its selection are given in Appendix A.
Verification of specified properties such as density, moisture content, permeability, orstrength of compacted clay seals can be determined by direct measurement during construction.However, indirect methods are preferred because certain measurements, such as permeability, are
40
likely to be time consuming and invasive. Methods used to verify the quality of emplaced sealswill include quality of block production and field measurements of density.
5.2.3 Asphalt
Asphalt is used to prevent water migration down the shaft in two ways: as an asphaltcolumn near the Rustler/Salado contact and as a "waterstop" sandwiched between concrete plugsat three locations within the Salado Formation. Asphalt components of the WIPP seal design addassurance that minimal transport of brine down the sealed shaft will occur.
Asphalt is a widely used construction material because of its many desirable engineeringproperties. Asphalt is a strong cement, readily adhesive, highly waterproof, and durable.Furthermore, it is a plastic substance that is readily mixed with mineral aggregates. A range ofviscosity is achievable for asphalt mixtures. It is highly resistant to most acids, salts, and alkalis.These properties are well suited to the requirements of the WIPP shaft seal system.
Construction of the seal components containing asphalt can be accomplished using aslickline process where low-viscosity heated material is effectively pumped into the shaft. Thetechnology to apply the asphalt in this manner is available as described in the constructionprocedures in Appendix B.
The asphalt components are required to endure for about 100 years and limit brine flowdown the shaft to the compacted salt component. Since asphalt will not be subjected toultraviolet light or an oxidizing environment, it is expected to provide an effective seal forcenturies. Air voids less than 2% ensure low permeability. The permeability of the massiveasphalt column is expected to have an upper limit 1 xlO"1 m2.
Sufficient construction practice and laboratory testing information is available to assureperformance of the asphalt component. Laboratory validation tests to optimize viscosity may bedesirable before final installation specifications are prepared. In general, verification tests wouldadd quantitative documentation to expected performance values and have direct application toWIPP.
5.2.4 Compacted Salt Column
A reconsolidated column of natural WIPP salt will seal the shafts permanently. If saltreconsolidation is unimpeded by fluid pore pressures, the material will eventually achieveextremely low permeabilities approaching those of the native Salado Formation. Recentdevelopments in support of the WIPP shaft seal system have produced confirming experimentalresults, constitutive material models, and construction methods that substantiate use of a saltcolumn to create a low permeability seal component. Reuse of salt excavated in the process ofcreating the underground openings has been advocated since its initial proposal in the 1950s.Replacing the natural material in its original setting ensures physical, chemical, and mechanicalcompatibility with the host formation.
The function of the compacted and reconsolidated salt column is to limit transmission offluids into or out of the repository for the statutory period of 10,000 years. The functional periodstarts within a hundred years and lasts essentially forever. After a period of consolidation, thesalt column will almost completely retard gas or brine migration within the former shaft opening.
41

A completely consolidated salt column will achieve flow properties indistinguishable fromnatural Salado salt.
The salt component is composed of crushed Salado salt with additional small amounts ofwater. The total water content of the crashed salt will be adjusted to 1.5 wt% before it is tampedinto place. Field and laboratory tests have verified that natural salt can be compacted tosignificant fractional density (p > 0.9) with addition of these moderate amounts of water.
Dynamic compaction is the specified construction procedure to tamp crashed salt in theshaft. Deep dynamic compaction provides great energy to the crushed salt, is easy to apply, andhas an effective depth of compactive influence greater than lift thickness. Dynamic compactionis relatively straightforward and requires a minimal work force in the shaft. Compaction itselfwill follow procedures developed in a lafge-Scale compaction demonstration, as outlined inAppendix B.
Numerical models of the shaft provide density of the compacted salt column as a functionof depth and time. Many calculations comparing models for consolidation of crushed salt wereperformed to. quantify performance of the salt column, as discussed in Appendix D and thereferences (Callahan et al., 1996; Brodsky et al., 1996). From the density-permeabilityrelationship of recorisolidating crashed salt, permeability of the compacted salt seal component iscalculated. In general, results show that the bottom of the salt column consolidates rapidly,achieving permeability of lxlO'19 m2 in about 50 years. By 100 years, the middle of the saltcolumn reaches similar permeability.
Results of the large-scale dynamic compaction demonstration suggest that deep dynamiccompaction will produce a sufficiently dense starting material. As with other seal components,testing of the material in situ will be difficult and probably not optimal to ensure quality of theseal element. This is particularly apparent for the compacted salt component because thecompactive effort produces a finely powdered layer on the top of each lift. It was demonstrated(Hansen and Ahrens, 1996) that the fine powder is very densely compacted upon tamping thesuperincumbent lifts. The best means to ensure that the crushed salt element is placed properly isto establish performance through verification of quality assurance/quality control procedures. Ifcrashed salt is placed with a reasonable uniformity of water and compacted with sufficientenergy, long-term performance can be assured.
5.2.5 Cementitious Grout
Cementitious grouting is specified for all concrete members. Grouting is also used inadvance of liner removal to stabilize the ground and to limit water inflow during shaft sealconstruction. Cementitious grout is specified because of its proven performance, nontoxicity,and previous use at the WIPP. - -
The function of grout is to stabilize the surrounding rock before existing concrete linersare removed. Grout will fill fractures within adjacent lithologies, thereby adding strength andreducing permeability and, hence, water inflow during shaft seal construction. Grout aroundconcrete members of the concrete asphalt waterstop will be employed in an attempt to tighten theinterface and fill microcracks in the DRZ. Efficacy of grouting will be determined duringconstruction.
42

An ultrafine cementitious grout has been specifically developed for use at the WIPP(Ahrens and Onofrei, 1996). This grout consists of Type 5 portland cement, pumice as apozollanic material, and superplasticizer. The average particle size is approximately 2 microns.The ultrafine grout is mixed in a colloidal grout mixer, with a water to components ratio (W:C)of 0.6:1.
Drilling and grouting sequences provided hi Appendix B follow standard procedures.Grout will be mixed on the surface and transported by slickline to the middle deck on the multi-deck stage (galloway). Grout pressures are specified below lithostatic to preventhydrofracturing.
Performance of grout is not a consideration for compliance issues. Grouting of concreteelements is an added assurance to tighten interfaces. Grouting is used to facilitate constructionby stabilizing any loose rock behind the concrete liner.
No verification of the effectiveness of grouting is currently specified. If injection aroundconcrete plugs is possible, an evaluation of quantities and significance of grouting will be madeduring construction. Procedural specifications will include measurements of fineness anddetermination of rheology hi keeping with processes established during the WIPP demonstrationgrouting (Ahrens et al., 1996).
5.2.6 Earthen Fill
A brief description of the earthen fill is provided hi Appendix A, and construction issummarized hi Appendix B. Compacted fill can be obtained from local borrow pits, or materialexcavated during shaft construction can be returned to the shaft. There are minimal designrequirements for earthen fill and none that are related to WIPP regulatory performance.
5.3 Concluding Remarks
Materials specifications hi Appendix A provide descriptions of seal materials along withreasoning on then: expected reliability in the WIPP setting. The specification follows aframework that states the function of the seal component, a description of the material, and asummary of construction techniques. The performance requirements for each material aredetailed. Materials chosen for use in the shaft seal system have several common desirableattributes: low permeability, high density, compatibility, longevity, low cost, constructability,availability, and supporting documentation.
43

Page intentionally blank.
44

6. CONSTRUCTION TECHNIQUES
Construction of the shaft sealing system is feasible. The described procedures utilizecurrently available technology, equipment, and materials to satisfy shaft sealing system designguidance. Although alternative methods are possible, those described satisfy the design guidancerequirements listed in Table 3-1 and detailed in the appendices. Construction feasibility isestablished by reference to comparable equipment and activities in the mining, petroleum, andfood industries and test results obtained at the WIPP. Equipment and procedures foremplacement of sealing materials are described below.
6.1 Multi-Deck Stage
A multi-deck stage (Figures 6-1 and 6-2) consisting of three vertically connected deckswill be the conveyance utilized during the shaft sealing operation. Detailed sketches of themulti-deck stage appear in Appendix E. The stage facilitates installation and removal of utilitiesand provides a working platform for the various sealing operations. A polar crane attached to thelower deck provides the mechanism required for dynamic compaction and excavation of the shaftwalls. Additionally, the header at the bottom of the slickline is supported by a reinforced steelshelf, which is securely bolted to the shaft wall during emplacement of sealing materials. Themulti-deck stage can be securely locked in place in the shaft whenever desired (e.g., duringdynamic compaction, excavation of the salt walls of the shaft, grouting, liner removal, etc.). Themulti-deck stage is equipped with floodlights, remotely aimed closed-circuit television, fold-outfloor extensions, a jib crane, and range-finding devices. Similar stages are commonly employedin shaft sinking operations.
The polar crane can be configured for dynamic compaction (Figure 6-1) or for excavationof salt (Figure 6-2); a man cage or bucket can be lowered through the stage to the workingsurface below. Controlled manually or by computer, the crane and its trolley utilize a gearedtrack drive. The crane can swiftly position the tamper (required for dynamic compaction) in thedrop positions required (Figure 6-3) or accommodate the undercutter required for excavation ofthe shaft walls. The crane incorporates a hoist on the trolley and an electromagnet, enabling it toposition, hoist, and drop the tamper. A production rate of one drop every two minutes duringdynamic compaction is possible.
6.2 Salado Mass Concrete (Shaft Station Monolith and Shaft Plugs)
Salado Mass Concrete, described in Appendix A, will be mixed on surface at 20°C andtransferred to emplacement depth through a slickline (i.e., a steel pipe fastened to the shaft walland used for the transfer of sealing materials from surface to the fill horizon) minimizing airentrainment and ensuring negligible segregation. Existing sumps will be filled to the elevation ofthe floor of the repository horizon, and emplacement of the shaft station monolith is designed toeliminate voids at the top (back) of the workings.
When excavating salt for waterstops or plugs in the Salado Formation, an undercutterattached to the trolley of the polar crane will be forced into the shaft wall by a combination ofgeared trolley and undercutter drives. Full circumferential cuts will be accomplished utilizingthe torque developed by the geared polar crane drive.
45

^ fSompfiterizeWManual PofarCran
v-PoJftf -Crane Track
otely Aimed Television Camera
C Ho//
Figure 6-1. Multi-deck stage illustrating dynamic compaction.
46

CtrcumferentinJiy Remforcarfj• Ftesclbfe Verrt!)fttfott fctaot
Ftokfing Ctacsr Extensions
Figure 6-2. Multi-deck stage illustrating excavation for asphalt waterstop.
47

Scale: 1" = 4'
TFU-6121-376-0
Figure 6-3. Drop pattern for 6-m-diameter shaft using a 1.2-m-diameter tamper.
The undercutter proposed is a modified version of those currently in use in salt and coalmines, where their performance is proven. Such modifications and applications have beenjudged feasible by the manufacturer.
The concrete-salt interface and DRZ around concrete plugs in the Salado Formation (andthe one at the base of the Rustler Formation) will be grouted with ultrafine grout. Injection holeswill be collared in the top of the plug and drilled downward at 45° below horizontal. The holeswill be drilled in a "spin" pattern describing a downward opening cone designed to intercept bothvertical and horizontal fractures (Figure 6-4). The holes will be stage grouted (i.e., primary holeswill be drilled and grouted, one at a time). Secondary holes will then be drilled and grouted, oneat a time, on either side of primaries that accepted grout.
48

PrimaryGrout Hole
SecondaryGrout Hole
Plan View of Grout Holes in Spin Pattern
Section A - A1
Figure 6-4. Plan and section views of downward spin pattern of grout holes.
49
TRI-6121-373-0

6.3 Compacted Clay Columns (Salado and Rustler Formations)
Cubic blocks of sodium bentonite, 20.8 cm on the edge and weighing approximately18 kg, will be precompacted on surface to a density between 1.8 and 2.0 gm/cm and emplacedmanually. The blocks will be transferred from surface on the man cage. Block surfaces will bemoistened with a fine spray of potable water, and the blocks will be manually placed so that allsurfaces are in contact Peripheral blocks will be trimmed to fit irregularities in the shaft wall,and remaining voids will be filled with a thick mortar of sodium bentonite and potable water.Such blocks have been produced at the WIPP and used in the construction of 0.9-m-diameterseals, where they performed effectively (Knowles and Howard, 1996). Alternatives, which maybe considered in future design evaluations, are discussed in Appendix B.
6.4 Asphalt Waterstops and Asphaltic Mix Columns
Neat asphalt is selected for the asphalt waterstops, and an asphaltic mastic mix (AMM)consisting of neat asphalt, fine silica sand, and hydrated lime will be the sealing material for thecolumns. Both will be fluid at emplacement temperature and remotely emplaced. Neat asphalt(or AMM, prepared in a pug mill near the shaft collar) will be heated to 180°C and transferred toemplacement depth via an impedance-heated, insulated tremie line (steel pipe) suspended fromslips (pipe holding device) at the collar of the shaft.
This method of line heating is common practice in the mining and petroleum industries.This method lowers the viscosity of the asphalt so that it can be pumped easily. Remoteemplacement by tremie line eliminates safety hazards associated with the high temperature andgas produced by the hot asphalt. Fluidity ensures that the material will flow readily andcompletely fill the excavations and shaft. Slight vertical shrinkage will result from cooling(calculations in Appendix D), but the material will maintain contact with the shaft walls and theexcavation for the waterstop. Vertical shrinkage will be counteracted by the emplacement ofadditional material.
6.5 Compacted WIPP Salt
Dynamic compaction of mine-run WIPP salt has been demonstrated (Ahrens and Hansen,1995). The surface demonstration produced salt compacted to 90% of in-place rock salt density,with a statistically averaged permeability of 1.65x10"5 m2. Additional laboratory consolidationof this material at 5 MPa confining pressure (simulating creep closure of the salt) resulted inincreased compaction and lower permeability (Brodsky, 1994). Dynamic compaction wasselected because it is simple, robust, proven, has excellent depth of compaction, and is applicableto the vertical WIPP shafts.
The compactive effect expanded laterally and downward in the demonstration, andobservation during excavation of the compacted salt revealed that the lateral compactive effectwill fill irregularities in the shaft walls. Additionally, the depth of compaction, which wasgreater than that of the three lifts of salt compacted, resulted in the bottom lift being additionallycompacted during compaction of the two overlying lifts. This cumulative effect will occur in theshafts.
50

Construction of the salt column will proceed in the following manner:
• Crushed and screened salt will be transferred to the fill elevation via slickline. Use ofslicklines is common in the mining industry, where they are used to transfer backfillmaterials or concrete to depths far greater than those required at the WIPP. Potable waterwill be added via a fine spray during emplacement at the fill surface to adjust themoisture content to 1.5 ±0.3 wt%, accomplished by electronically coordinating theweight of the water with that of the salt exiting the hose.
• Dynamic compaction will then be used to compact the salt by dropping the tamper inspecific, pre-selected positions such as those shown in Figure 6-3.
6.6 Grouting of Shaft Walls and Removal of Liners
The procedure listed below is a common mining practice which will be followed at eachelevation where liner removal is specified. If a steel liner is present, it will be cut intomanageable pieces and hoisted to the surface for disposal, prior to initiation of grouting.
Upward opening cones of diamond drill holes will be drilled into the shaft walls in a spinpattern (Figure 6-5) to a depth ensuring complete penetration of the Disturbed Rock Zone (DRZ)surrounding the shaft. For safety reasons, no major work will be done from the top deck; allsealing activities will be conducted from the bottom deck. The ends of the holes will be-3 mapart, and the fans will be 3 m apart vertically, covering the interval from 3 m below to 3 mabove the interval of liner removal. Tests at the WIPP demonstrated that the ultrafinecementitious grout penetrated more than 2 m from the injection holes(Ahrens et al., 1996).
Injection holes will be drilled and grouted one at a time, as is the practice in stagegrouting. Primary holes are grouted first, followed by the grouting of secondary holes on eitherside of primaries that accepted grout. Ultrafine grout will be injected below lithostatic pressure toavoid hydrofracturing the rock, proceeding from the bottom fan upward. Grout will be mixed onsurface and transferred to depth via the slickline.
Radial, horizontal holes will then be drilled on a 0.3-m grid, covering the interval to beremoved. These will be drilled to a depth sufficient to just penetrate the concrete liner. Achipping hammer will be used to break a hole through the liner at the bottom of the interval.This hole, approximately 0.3 m in diameter, will serve as "free face," to which the liner can bebroken. Hydraulically-actuated steel wedges will then be used in the pre-drilled holes to breakout the liner in manageable pieces, beginning adjacent to the hole and proceeding upward.Broken concrete will be allowed to fall to the fill surface, where it will be gathered and hoisted tothe surface for disposal. Chemical seal rings will be removed as encountered.
6.7 Earthen Fill
Local soil, screened to produce a maximum particle dimension of approximately 15 mm,will be the seal material. This material will be transferred to the fill surface via the slickline andemplaced in the same manner as the salt. After adjusting the moisture content of the earthen fillbelow the concrete plug in the Dewey Lake Redbeds to achieve maximum compaction, the fillwill be dynamically compacted, achieving a permeability as low as that of the enclosingformation.
51

• * Secondary* Grout Hole
PrimaryGrout Hole
Plan View of Grout Holes in Spin Pattern
Section A - A1
THI-6121-374-0
Figure 6-5. Plan and section views of upward spin pattern of grout holes.
52

The portion of the earthen fill above the plug will be compacted with a vibratory-impactsheepsfoot roller, a vibratory sheepsfoot roller, or a walk-behind vibratory plate compactor,because of insufficient height for dynamic compaction.
6.8 ScheduleFor discussion purposes, it has been assumed that the shafts will be sealed two at a time.
This results in the four shafts being sealed in approximately six and a half years. The schedulespresented in Appendix B are based on this logic. Sealing~the shafts sequentially would requireapproximately eleven and a half years.

Page intentionally blank.

7. STRUCTURAL ANALYSES OF SHAFT SEALS
7.1 Introduction
The shaft seal system was designed in accordance with design guidance described inSection 3.2. To be successful, seal system components must exhibit desired structural behavior.The desired structural behavior can be as simple as providing sufficient strength to resist imposedloads. In other cases, structural behavior is critical to achieving desired hydrological properties.For example, permeability of compacted salt depends onthe consolidation induced by shaftclosure resulting from salt creep. In this example, results from structural analyses feed directlyinto fluid-flow calculations, which are described in Section 8, because structural behavior affectsboth time-dependent permeabilities of the compacted salt and pore pressures within thecompacted salt. In other structural considerations, thermal effects are analyzed as they affect theconstructability and schedule for the seal system. Thus a series of analyses, loosely termedstructural analyses, were performed to accomplish three purposes:
1. to determine loads imposed on components and to assess both structural stability based onthe strength of the component and mechanical interaction between components;
2. to estimate the influence of structural behavior of seal materials and surrounding rock onhydrological properties; and
3. to provide structural and thermal related information on construction issues.
For the most part, structural analyses rely on information and design details presented inthe Design Description (Section 4), the Design Drawings (Appendix E), and MaterialSpecification (Section 5 and Appendix A). Some analyses are generic, and calculation input andsubsequent results are general in nature.
7.2 Analysis Methods
Finite-element modeling was the primary numerical modeling technique used to evaluatestructural performance of the shaft seals and surrounding rock mass. Well documented finite-element computer programs, SPECTROM-32 and SPECTROM-41, were used in structural andthermal modeling, respectively. The computer program SALTJSUBSID was used in thesubsidence modeling over the backfilled shaft-pillar area. Specific details of these computerprograms as they relate to structural calculations are listed in Appendix D, Section D2.
7.3 Models of Shaft Seals Features
Structural calculations require material models to characterize the behavior of (1) eachseal material (concrete, crushed salt, compacted clay, and asphalt); (2) the intact rock lithologiesin the near-surface, Rustler, and Salado formations; and (3) any DRZ within the surroundingrock. A general description of the material models used in characterizing each of these materialsand features is given below. Details of the models and specific values of model parameters aregiven in Appendix D, Section D3.
55

7.3.1 Seal Material Models
The SMC thermal properties required for the structural analyses (thermal conductivity,density, specific heat, and volumetric heat generation rate) were obtained from SMC test data.Concrete was assumed to behave as a viscoelastic material, based on experimental data, and theelastic modulus of SMC was modeled as age-dependent. Strength properties of SMC werespecified in the design (see Appendix A).
For crushed salt, the deformational model included a nonlinear elastic component and acreep consolidation component. The nonlinear elastic modulus was assumed to be density-dependent, based on laboratory test data performed on WIPP crushed salt. Creep consolidationbehavior of crushed salt was based on three candidate models whose parameters were obtainedfrom model fitting to hydrostatic and shear consolidation test data performed on WIPP crushedsalt. Creep consolidation models include functional dependencies on density, mean stress, stressdifference, temperature, grain size, and moisture content.
Compacted clay was assumed to behave according to a nonlinear elastic model in whichshear stiffness is negligible, and asphalt was assumed to behave as a weak elastic material.Thermal properties of asphalt were taken from literature.
7.3.2 Intact Rock Lithologies
Salado salt was assumed to be argillaceous salt that is governed by the MultimechanismDeformation Coupled Fracture (MDCF) model, which is an extension of the Munson-Dawson(M-D) creep model. A temperature-dependent thermal conductivity was necessary.
Salado interbeds were assumed to behave elastically. Their material strength wasassumed to be described by a Drucker-Prager yield function, consistent with values used inprevious WIPP analyses.
Deformational behavior of the near-surface and Rustler Formation rock types wasassumed to be time-invariant, and their strength was assumed to be described by a Coulombcriterion, consistent with literature values. '
7.3.3 Disturbed Rock Zone Models
Two different models were used to evaluate the development and extent of the DRZwithin intact salt. The first approach used ratios of time-dependent stress invariants to quantifythe potential for damage or healing to occur. The second approach used the damage stresscriterion according to the MDCF model for WIPP salt.
7.4 Structural Analyses of Shaft Seal Components
7.4.1 Salado Mass Concrete Seals
Five analyses related to structural performance of SMC seals were performed, including(1) a thermal analysis, (2) a structural analysis, (3) a thermal stress analysis, (4) a dynamiccompaction analysis, and (5) an analysis of the effects of clay swelling pressure. This sectionpresents these analyses and evaluates the results in terms of the performance of the SMC seal.Details of these calculations are given in Appendix D, Section D4.
56

(0,2, and 4 MPa). Results indicate that times required to consolidate the crushed salt increase asthe pore pressure increases, as expected. For example, for a pore pressure of 2 MPa, the timesrequired to achieve a fractional density of 96% are about 90 years, 205 years, and 560 years atthe bottom, middle, and top of the crushed salt column, respectively. A pore pressure of 4 MPawould effectively prevent reconsolidation of the crushed salt within a reasonable period (<l,000years). The results of this calculation were used in the fluid flow calculations, and the impact ofthese pore pressures on the permeability of the crushed salt seal is described in Section 8 andAppendix C.
7.4.3 Compacted Clay Seals
One analysis was performed to determine the structural response of compacted clay seals.The objective of this calculation was to determine stresses in the upper Salado compacted claycomponent and the lower Salado compacted clay component as a result of creep of thesurrounding salt. Details of this calculation are given in Appendix D, Section D4. Results ofthis calculation indicate that after 50 years the compressive stresses in the upper Saladocompacted clay component are about 0.7 MPaj not including the effects of swelling pressures.Similarly, after 50 years the stresses in the lower Salado compacted clay component areapproximately 2.6 MPa. Based on these results, the compacted clay component will providesome restraint to the creep of salt and induce a back (radial) stress in the clay seal, which will- .promote healing of the DRZ in the surrounding intact salt (see discussion about DRZ in Section7.5.1).
7.4.4 Asphalt Seals
Three analyses were performed related to structural performance of the asphalt seals,including (1) a thermal analysis, (2) a structural analysis, and (3) a shrinkage analysis. Thissection presents the results of these analyses and evaluates the results in terms of the performanceof the asphalt seal. Details of these analyses are given in Appendix D, Section D4.
7.4.4.1 Thermal Analysis
The objectives of this calculation were (1) to determine temperature histories within theasphalt seal and the surrounding salt and (2) to determine effects of the length of the waterstop.
Results indicate that the center of the asphalt column will cool from its emplacedtemperature of 180°C to 83°C, 49°C, 31°C, and 26°C at times 0.1 year, 0.2 year, 0.5 year, and1.0 year, respectively. Similarly, the asphalt/salt interface temperatures at corresponding timesare 47°C, 38°C, 29°C, and 26°C. The time required for a waterstop to cool is significantly lessthan that required to cool the asphalt column. Based on these results, about 40 days are requiredfor asphalt to cool to an acceptable working environment temperature. The thermal impact onenhanced creep rate of the surrounding salt is considered to be negligible.
7.4.4.2 Structural Analysis
The objective of this analysis was to calculate pressures in asphalt that result fromrestrained creep of the surrounding salt and to evaluate stresses induced on the concrete sealcomponent by such pressurization.
59

Results indicate that pressures in the waterstops after 100 years are 1.8 MPa, 2.5 MPa,and 3.2 MPa for the upper, middle, and lower waterstops, respectively. Based on these results,the structural integrity of concrete components will not be compromised by imposed pressures,and the rock surrounding the asphalt will not be fractured by the pressure. The pressure fromasphalt is enough to initiate healing of the DRZ surrounding the waterstop.
7.4.4.3 Shrinkage Analysis
The objective of this analysis was to calculate shrinkage of the asphalt column as it coolsfrom its emplaced temperature to an acceptable working environment temperature. Results ofthis analysis indicate that the 42-m asphalt column will shrink 0.9 m in height as the asphaltcools from its emplaced temperature of 180°C to 38°C.
7.5 Disturbed Rock Zone Considerations
7.5.1 General Discussion of DRZ
Microfracturing leading to a DRZ occurs within salt whenever excavations are made.Laboratory and field measurements show that a DRZ has enhanced permeability. The body ofevidence strongly suggests that induced fracturing is reversible and healed when deviatoric stressstates created by the opening are reduced. Rigid seal components in the shaft provide a restraintto salt creep closure, thereby inducing healing stress states in the salt. A more detaileddiscussion of the DRZ is included in Appendix D.
7.5.2 Structural Analyses
Three analyses were performed to determine the behavior of the DRZ in the rock masssurrounding the shaft. The first analysis considered time-dependent DRZ development andsubsequent healing of intact Salado salt surrounding each of the four seal materials. The secondanalysis considered time-dependent development of the DRZ within anhydrite and polyhaliteinterbeds within the Salado Formation. The last analysis considered time-independent DRZdevelopment within the near-surface and Rustler formations. These analyses are discussed belowand given in more detail in Appendix D, Section D5. Results from these analyses were used asinput conditions for the fluid flow analysis presented in Section 8 and Appendix C.
7.5.2.1 Salado Salt
The objective of this calculation was to determine time-dependent extent of the DRZ insalt, assuming no pore pressure effects, for each of the four shaft seal materials (i.e., concrete,crushed salt, compacted clay, and asphalt. The seal materials below a depth of about 300 mprovide sufficient rigidity to heal the DRZ within 100 years. Asphalt, modeled as a weak elasticmaterial, will not create a stress state capable of healing the DRZ because it is located high in theSalado.
7.5.2.2 Salado Anhydrite Beds
The objective of this calculation was to determine the extent of the DRZ within theSalado anhydrite and polyhalite interbeds as a result of creep of surrounding salt.
60

For all interbeds, the factor of safety against failure (shear or tensile fracturing) increaseswith depth into the rock surrounding the shaft wall. These results indicate that, with theexception of Marker Bed 117 (MB117), the factor of safety is greater than 1 (no DRZ willdevelop) for all interbeds. For MB117, the potential for fracturing is localized to within 1 m ofthe shaft wall.
7.5.2.3 Near-Surface and Rustler Formations
The objective of this calculation was to determine the extent of the DRZ surrounding theshafts in the near-surface and Rustler formations.
Rock types in near-surface and Rustler formations are anhydrite, dolomite, and mudstone.These rock types exhibit time-independent behavior. Results indicate that no DRZ will developin anhydrite and dolomite (depths between 165 and 213 m). For mudstone layers, the radialextent of the DRZ increases with depth, reaching a maximum of 2.6 shaft radii at a depth of223 m.
7.6 Other Analyses
This section discusses two structural analyses performed in support of design concerns,namely (1) the asphalt waterstops constructability and (2) benefits from shaft station backfilling. -Analyses performed in support of these efforts are discussed below and given in more detail inAppendix D, Section D6.
7.6.1 Asphalt Waterstops
The DRZ is a major contributor to fluid flows through a low permeability shaft sealsystem, regardless of the materials emplaced within the shaft. Therefore, to increase theconfidence in the overall shaft seal, low permeability layers (termed radial waterstops) wereincluded to intersect the DRZ surrounding the shaft. These waterstops are emplaced to alter theflow direction either inward toward the shaft seal or outward toward intact salt. Asphalt-filledwaterstops will be effective soon after emplacement. The objectives of these structuralcalculations were to evaluate performance of the waterstops in terms of (1) intersecting the DRZaround the shaft, (2) inducing a new DRZ because of special excavation, and (3) promotinghealing of the DRZ.
Results indicate that the DRZ from the shaft extends to a radial distance of less than oneshaft radius (3.04 m). Waterstop excavation extends the DRZ radially to about 1.4 shaft radii(4.3 m). However, this extension is localized within the span of the concrete component andextends minimally past the waterstop edge. The DRZ extent reduced rapidly after the concreteand asphalt restrained creep of the surrounding salt. After 20 years, the spatial extent of the DRZis localized near the asphalt-concrete interface, extending spatially into the salt at a distance ofless than 2 m. Based on these results, construction of waterstops is possible without substantiallyincreasing the DRZ. Furthermore, the waterstop extends well beyond the maximum extent of theDRZ surrounding the shaft and effectively blocks this flow path (within 2 years afteremplacement), albeit over only a short length of the flow path.
61

7.6.2 Shaft Pillar Backfilling
The objective of this calculation was to assess potential benefits from backfilling aportion of the shaft pillar to reduce subsurface subsidence and thereby decrease the potential forinducing fractures along the shaft wall. The calculated subsidence without backfilling is lessthan one foot, due to the relatively low extraction ratio at the WIPP. Based on the results of thisanalysis, backfilling portions of the shaft pillar would result in only 10% to 20% reduction insurface subsidence. This reduction in subsidence from backfilling is not considered enough towarrant backfilling the shaft pillar area. The shaft seals within the Salado are outside the arigle-of-draw for any horizontal displacements caused by the subsidence over the waste panels.Moreover, horizontal strains caused by subsidence induced by closures within the shaft pillar arecompressive in nature and insignificant in magnitude to induce fracturing along the shaft wall.
62

8. HYDROLOGIC EVALUATION OF THE SHAFT SEAL SYSTEM
8.1 Introduction
The design guidance in Section 3 presented the rationale for sealing the shaft seal systemwith low permeability materials, but it did not provide specific performance measures for the sealsystem. This section compares the hydrologic behavior of the system to several performancemeasures that are directly related to the ability of the seal system to limit liquid and gas flowsthrough the seal system. The hydrologic evaluation is focused on the processes that could resulthi fluid flow through the shaft seal system and the ability of the seal system to limit any suchflow. Transport of radiological or hazardous constituents will be limited if the carrier fluids aresimilarly limited.
The hydrologic performance models are fully described in Appendix C. The analysespresented are deterministic. Quantitative values for those parameters that are considereduncertain and that may significantly impact the primary performance measures have been varied,and the results are presented in Appendix C. This section summarizes the seal systemperformance analyses and discusses results within the context of the design guidance of Section3. The results demonstrate that (1) fluid flows will be limited within the shaft seal system and(2) uncertainty in the conceptual models and parameters for the seal system are mitigated byredundancy in component function and materials.
8.2 Performance Models
The physical processes that could impact seal system performance are presented in detailin Appendix C. These processes have been incorporated into four performance models. Thesemodels evaluate (1) downward migration of groundwater from the Rustler Formation, (2) gasmigration and consolidation of the crushed salt seal component, (3) upward migration of brinesfrom the repository, and (4) flow between water-bearing zones in the Rustler Formation. Thefirst three are analyzed using numerical models of the Air Intake Shaft (AIS) seal system and thefinite-difference codes SWIFT II and TOUGH28W. These codes are extensively used and welldocumented within the scientific community. A complete description of the models is providedin Appendix C. The fourth performance model uses a simple, analytical solution for fluid flow.Results from the analyses are summarized in the following sections and evaluated in terms of thedesign guidance presented in Section 3.
Material properties and conceptual models that may significantly impact seal systemperformance have been identified, and uncertainty in properties and models have been addressedthrough variation of model parameters. These parameters include (1) the effective permeabilityof the DRZ, (2) those describing salt column consolidation and the relationship betweencompacted salt density and penneability, and (3) repository gas pressure applied at the base ofthe shaft seal system.
8.3 Downward Migration of Rustler Groundwater
The shaft seal system is designed to limit groundwater flowing into and through the shaftsealing system (see Section 3). The principal source of groundwater to the seal system is theCulebra Member of the Rustler Formation. The Magenta Member of this formation is also
63

considered a groundwater source, albeit a less significant source than the Culebra. No significantsources of groundwater exist within the Salado Formation; however, brine seepage has beennoted at a number of the marker beds. The modeling includes the marker beds, as discussed inAppendix C. Downward migration of Rustler groundwater must be limited so that liquidsaturation of the compacted salt column salt column does not impact the consolidation processand to ensure that significant quantities of brine do not reach the repository horizon. Because itis clear that limitation of liquid flow into the salt column necessarily limits liquid flow to therepository, the volumetric flux of liquid into and through-the salt column were selected as -performance measures for this model.
Consolidation of the compacted salt column salt column will be most rapid immediatelyfollowing seal construction. Simulations were conducted for the 200-year period followingclosure to demonstrate that, during this initial period, downward migration of Rustlergroundwater will be insufficient to impact the consolidation process. Lateral migration of brinethrough the marker beds is also quantified in the analysis and shown to be nondetrimental to thefunction of the salt column.
8.3.1 Analysis Method
Seal materials will not, in general, be fully saturated with liquid at the time ofconstruction. The host rock surrounding the shafts will also be partially desaturated at the timeof seal construction. The analysis presented in this section assumes a fully saturated system.The effects of partial saturation of the shaft seal system are favorable in terms of systemperformance, as will be discussed in Section 8.3.2.
Seal material and host rock properties used in the analyses are discussed in Appendix C,Section C3. Appendix A contains a detailed discussion of seal material properties. A simpleperspective on the effects of material and host rock properties may be obtained from Darcy'sLaw. At steady-state, the flow rate in a fully saturated system depends directly on the systempermeability. The seal system consists of the component material and host rock DRZ. Lowpermeability is specified for the engineered materials; thus the system component most likely toimpact performance is the DRZ. Rock mechanics calculations presented in Appendix D predictthat the DRZ in the Salado Formation will not be vertically continuous because of theintermittent layers of stiff anhydrites (marker beds). Asphalt waterstops are included in thedesign to minimize DRZ impacts. The effects of the marker beds and the asphalt waterstops onlimiting downward migration are explicitly simulated through variation of the permeability of thelayers of Salado DRZ.
Initial, upper, and lateral boundary conditions for the performance model are consistentwith field measurements for the physical system. At the base of the shaft a constant atmospheric
. pressure is assumed.
8.3.2 Summary of Results
The initial pore volumes in the filled repository and the AIS salt column areapproximately 460,000 m3 and 250 m3, respectively. The performance model predicts amaximum cumulative flow of less than 5 m3 through the sealed shafts for the 200 yearsfollowing closure. If the marker beds have a disturbed zone immediately surrounding the shaft,
64

the maximum flow is less than 10 m3 during the same period. Assuming the asphalt waterstopsare not effective in interrupting the vertical DRZ, the volumetric flow increases but is still lessthan 30 m3 for the 200 years following closure. These volumes are less than 1/100 of 1% of thepore volume in the repository and less than 20% of the initial pore volume of the salt column.
Two additional features of the model predictions should also be considered. The first ofthese is that flow rates fall from less than 1 m3 / year in the first five years to negligible valueswithin 10 years of seal construction. Therefore most of the cumulative flow occurs within a fewyears following closure. The second feature is the model prediction that'the system returns'tonearly ambient undisturbed pressures within two years. The repressurization occurs quicklywithin the model due to the assumption of a fully saturated flow regime because of brineincompressibility. As will be discussed in Section 8.4, the pore pressure in the compacted saltcolumn is a critical variable in the analysis. The pressure profiles predicted by the model are anartifact of the assumption of full liquid saturation and do not apply to the pore pressure analysisof the salt column.
The magnitude of brine flow that can reach the repository through a sealed shaft isminimal and will not impact repository performance.' The flow that reaches the salt column mustbe assessed with regard to the probable impacts on the consolidation process. Although thevolume of flow to the salt column is a small percentage of the available pore volume, the: .saturation state and fluid pore pressure of this component are the variables of significance. Theseissues cannot be addressed by a fully saturated model. Instead it is necessary to include thesefindings in a multi-phase model that includes the salt column. This is the topic of Section 8.4.
The results of the fully saturated model will over-predict the flow rates through the sealedshaft. This analysis does not take credit for the time required for the system to resaturate, nordoes it take credit for the sorptive capabilities of the clay components. The principal source ofgroundwater to the system is the Rustier Formation. The upper clay component is located belowthe Rustler and above the salt column and will be emplaced at a liquid saturation state ofapproximately 80%. Bentonite clays exhibit strong hydrophilic characteristics, and it is expectedthat the upper clay component will have these same characteristics. As a result, it is possible thata significant amount of the minimal Rustler groundwater that reaches the clay column will beabsorbed and retained by this seal component. Although this effect is not directly included hi thepresent analysis, the installation of a partially saturated clay component provides assurance thatthe flow rates predicted by the model are maximum values.
8.4 Gas Migration and Consolidation of Compacted Salt Column
The seal system is designed to limit the flow of gas from the disposal system through thesealed shafts. Migration of gas could impact performance if this migration substantiallyincreases the fluid pore pressure of the compacted salt column. The initial pore pressure of thesalt column will be approximately atmospheric. The sealed system will interact with the adjacentdesaturated host rock as well as the far-field formation. Natural pressurization will occur as thesystem returns to an equilibrium state. This pressurization, coupled with seepage of brinethrough the marker beds, will also result in increasing fluid pore pressure within the compactedsalt column. The analysis presented in this section addresses the issue of fluid pore pressure hithe compacted salt column resulting from the effects of gas generation at the repository horizon
65

and natural repressurization from the surrounding formation. A brief discussion on theimpedance to gas flow afforded by the lower compacted clay column is also presented.
8.4.1 Analysis Method
A multi-phase flow model of the lower seal system was developed to evaluate theperformance of components extending from the middle SMC component to the repositoryhorizon.
Rock mechanics calculations presented in Section 7 and Appendix D predict that thecompacted salt column will consolidate for a period of approximately 400 years if the fluid-filledpores of the column do not produce a backstress. Within the physical setting of the compactedsalt column, three processes have been identified which may result in a significant increase inpore pressure: groundwater flow from the Rustler Formation, gas migration from the repository,and natural fluid flow and repressurization from the Salado Formation. The first two processeswere incorporated into the model as initial and boundary conditions, respectively. The thirdprocess was captured in all simulations through modeling of the lithologies surrounding theshaft. Simulations were conducted for 200 years following closure to evaluate any effects theseprocesses might have on the salt column during this initial period.
As discussed in Section 8.3.1, the host rock DRZ is an important consideration in sealsystem performance. A vertically continuous DRZ could exist in both the Rustler and SaladoFormations. Concrete-asphalt waterstops are included in the design to add assurance that a DRZwill not adversely impact seal performance. The significance of a continuous DRZ andwaterstops will be evaluated based on results of the performance model.
A detailed description of the model grid, assumptions, and parameters is presented inAppendix C.
8.4.2 Summary of Results
• The consolidation process is a function of both time and depth. The resultantpermeability of the compacted salt column will similarly vary. To simplify the evaluation, aneffective permeability of the salt component was calculated. This permeability is calculated byanalogy to electrical circuit theory. The permeability of each model layer is equated to a resistorin a series of resistors. The equivalent resistance (i.e., permeability) of a homogeneous columnof identical length is derived in this manner. Figure 8-1 illustrates this process.
Results of the performance model simulations are summarized in Table 8-1. Theeffective permeabilities were calculated by the model assuming that, as the salt consolidated,permeability was reduced pursuant to the best-fit line through the experimental data (Figure A-7).From Table 8-1 it is clear that, for all simulated conditions, the salt column consolidates to verylow values in 200 years. Differences in the effective permeability because of increasedrepository gas pressure and a vertically continuous DRZ were negligible. The DRZ aroundconcrete components is predicted to heal (Appendix D) within 25 years. If the asphalt waterstopsdo not function as intended, the DRZ in this region will still heal in 25 years, as compared to 2years for effective waterstops. The effective permeability of the compacted salt column increasesby about a factor of two for this condition. However, the resultant permeability is sufficiently
66

low that the compacted salt columns will comprise permanent effective seals within the WIPPshafts.
Table 8-1. Summary of Results from Performance Model
RepositoryPressure
7 MPa in 100 Years
14 MPa in 200 Years
7 MPa in 100 Years
7 MPa in 100 Years
Rustler Flow(m3)
0
0
2.7
17.2
ContinuousDRZ
(Yes/No)
No
No
Yes
Yes
Concrete-AsphaltWaterstop
Healing Time(Years) *
2
2
2
25
EffectivePermeability at200 Years (m2)
3.3xlO"20
3.3xlO"20
3.4xlO"20
6.0xl0*20
The relationship between the fractional density (i.e., consolidation state) of the compactedsalt column and permeability is uncertain, as discussed in Appendix A. Lines drawn through theexperimental data (Figure A-7) provide a means to quantify this uncertainty but do not capture .the actual physical process of consolidation. As observed through microscopy, consolidation isdominated by pressure solution and redeposition, a mechanism of mass movement facilitated bythe presence of moisture on grain boundaries (Hansen and Ahrens, 1996). As this processcontinues, the connected porosity and hence permeability of the composite mass will reduce at arate that has not been characterized by the data collected in WIPP experiments. The results of themulti-phase performance model presented in Table 8-1 used a best-fit line through the data.Additional simulations were conducted using a line that represents a 95% certainty that thepermeability is less than or equal to values taken from this line. Model simulations that used the95% line are not considered representative of the consolidation process. However, these resultsprovide an estimation of the significance that this uncertainty may have on the seal systemperformance.
Figure 8-2 depicts the effective permeability of the salt column as a function of timeusing the 95% line. The consolidation process, and hence permeability reduction, essentiallystopped at 75 years for this simulation. Although the model predicts mat the fractional density atthe base of the salt column will reach approximately 97% of the density of intact halite, thepermeability remains several orders of magnitude higher than that of the surrounding host rock.As a result, repressurization occurs rapidly throughout the vertical extent of the compacted saltcolumn, and consolidation ceases. Laboratory experiments have shown that permeability to brineshould decrease to levels of 10'18 to 10"20 m2 at the fractional densities predicted by theperformance model. The transport of brine within the consolidating salt will reduce thepermeability even further (Brodsky et al., 1995). The predicted permeability of 10"16 m2 is stillsufficiently low that brine migration would be limited (DOE, 1995). However, the results of thisanalysis are more valuable in terms of demonstrating the coupled nature of the mechanical andhydrological behavior of consolidating crushed salt.
67

ll I.
1990
CO
I
1447-
1990
•JO
IUJ
1447
10-21 iO-19 10-17 10-15
Depth Dependent Permeability (m2)
1 O-19
Equivalent Permeability (m2)
TRI-6121-380-0
Figure 8-1. Calculation of an effective salt column permeability from the depth-dependent permeability at a point in time.
10-13 _
10-1725 50 75 100 125 150 175 200
Time (yrs)TRl-6121-354-0
Figure 8-2. Effective permeability of the Salado salt column using the 95% certainty line.
68

A final consideration within this performance model relates to the lower compacted claycolumn. This clay column is included in the design to provide a barrier to both gas and brinemigration from the repository horizon. The ability of the clay to prevent gas migration willdepend upon its liquid saturation state (Section 5 and Appendix A). The lower clay componenthas an initial liquid saturation of about 80%, and portions of the column achieve brine saturationsof nearly 100% during the 200 year simulation period. If the clay component performs asdesigned, gas migration through this component should be minimal An examination of themodel gas saturations indicates that, for all runs, gas flow occurs primarily through the DRZprior to healing. These model predictions are consistent with field demonstrations that brine-saturated bentonite seals will prevent gas flow at differential pressures of up to 4 MPa (Knowlesand Howard, 1996).
8.5 Upward Migration of Brine
The performance model discussed in Section 8.3 was modified to simulate undisturbedequilibrium pressures. As discussed in Appendix C, the Salado Formation is overpressurizedwith respect to the measured heads in the Rustler, and upward migration of contaminated brinescould occur through an inadequately sealed shaft. Sections 8.3 and 8.4 demonstrated that thecompacted salt column will consolidate to a low permeability following repository closure.Appendix D and Section 7 show that the DRZ surrounding the long-term clay and crushed saltseal components will completely heal within the first several decades. As a result, upwardmigration at the base of the Salado salt is predicted to be approximately 1 m3 over the regulatoryperiod. At the Rustler/Salado contact, a total of approximately 20 m3 migrates through the sealedAIS over the regulatory period. The only brine sources between these two depths are the markerbeds. It can therefore be concluded that most of the brine flow reaching the Rustler/Saladocontact originates in marker beds above the repository horizon. The seal system effectivelylimits the flow of brine and gas from the repository through the sealed shafts throughout theregulatory period.
8.6 Intra-Rustler Flow
The potential exists for vertical flow within water-bearing strata of the Rustler Formation.Flow rates were estimated using a closed form solution of the steady-state saturated flowequation (Darcy's Law). The significance of the calculated flow rates can be assessed in terms ofthe width of the hydraulic disturbance (i.e., plume half-width) generated in the recipient flowfield. The plume half-width was calculated to be minimal for all expected conditions (SectionC7). Intra-Rustler flow is therefore concluded to be of such a limited quantity that (1) it will notaffect either the hydraulic or chemical regime in the Rustler and (2) it will not be detrimental tothe seal system.
69

Page intentionally blank.
70

9. CONCLUSIONS
The principal conclusion drawn from discussions in the previous sections and detailsprovided in the appendices is that an effective, implementable design has been documented forthe WIPP shaft sealing system. Specifically, the six elements of the Design Guidance, Table 3-1,are implemented in the design in the following manner:
1. The shaft sealing system shall limit the migration of radiological or other hazardousconstituents from the repository horizon to the regulatory boundary during the 10,000-yearregulatory period following closure.
Based on the analysis presented in Section 8.5, it was determined that this shaft sealing -system effectively limits the migration of radiological or other hazardous constituents fromthe repository horizon to the regulatory boundary during the 10,000-year regulatory periodfollowing closure.
2. The shaft sealing system shall limit groundwater flowing into and through the shaftsealing system.
The combination of the seal components in the Salado Formation, the Rustler Formation,and above the Rustler combine to produce a robust system. Based on analysis presented inSection 8.3, it was concluded that the magnitude of brine flow that can reach the repositorythrough the sealed shaft is minimal and will not impact repository performance.
3. The shaft sealing system shall limit chemical and mechanical incompatibility of sealmaterials with the seal environment.
The sealing system components are constructed of materials possessing high durabilityand compatibility with the host rock. Engineered materials including salt-saturated concrete,bentonite, clays, and asphalt are expected to retain their design properties over the regulatoryperiod.
4. The shaft sealing system shall limit the possibility for structural failure of individualcomponents of the sealing system.
Analysis of components has determined that: (a) the structural integrity of concretecomponents will not be compromised by induced radial stress, imposed vertical stress,temperature gradients, dynamic compaction of overlying materials, or swelling pressureassociated with bentonite (Section 7.4.1); (b) the thermal impact of asphalt on the creep rate ofthe salt surrounding the asphalt waterstops is negligible (Section 7.4.4); and (c) the pressurefrom the asphalt element of the concrete-asphalt waterstops is sufficient to initiate healing ofthe surrounding DRZ within two years of emplacement (Section 7.6.1). The potential forstructural failure of sealing components is minimized by the favorable compressive stressstate that will exist in the sealed WIPP shafts.
5. The shaft sealing system shall limit subsidence of the ground surface in the vicinity of theshafts and the possibility of accidental entry after sealing.
The use of high density sealing materials that completely fill the shafts eliminates thepotential for shaft wall collapse, eliminates the possibility of accidental entry after closure,and assures that local surface depressions will not occur at shaft locations.
71

6. The shaft sealing system shall limit the need to develop new technologies or materials forconstruction of the shaft sealing system.
The shaft sealing system utilizes existing construction technologies (identified inSection 6) and materials (identified in Section 5).
The design guidance can be summarized as focusing on two principal questions: Can youbuild it, and will it work? The use or adaptation of existing technologies for the placement.of theseal components combined with the use of available, common materials assure that the designcan be constructed. Performance of the sealing system has been demonstrated in the hydrologicanalyses that show very limited flows of gas or brine, in structural analyses that assure acceptablestress and deformation conditions, and in the use of low permeability materials that will functionwell in the environment in which they are placed. Confidence in these conclusions is bolsteredby the basic design approach of using multiple components to perform each intended sealingfunction and by using extensive lengths within the shafts to effect a sealing system. Additionalconfidence is added by the results of field and lab tests in the WIPP environment that support thedata base for the seal materials.
72

10. REFERENCES
Ahrens, E.H., and F.D. Hansen. 1995. Large-Scale Dynamic Compaction Demonstration UsingWIPP Salt: Fielding and Preliminary Results. SAND95-1941. Albuquerque, NM: SandiaNational Laboratories. (Copy on file in the Sandia WIPP Central Files, Sandia NationalLaboratories, Albuquerque, NM [SWCF] as WPO31104.)
Ahrens, E.H., and M. Onofrei. 1996. "Ultrafine Cement Grout for Sealing Underground NuclearWaste Repositories," 2nd North American Rock Mechanics Symposium (NARMS 96),Montreal, Quebec, June 19-21,1996. SAND96-0195C. Albuquerque, NM: Sandia NationalLaboratories. (Copy on file in the SWCF as WPO31251.)
Ahrens, E.H., T.F. Dale, and R.S. Van Pelt. 1996. Data Report on the Waste Isolation PilotPlant Small-Scale Seal Performance Test, Series F Grouting Experiment. SAND93-1000.Albuquerque, NM: Sandia National Laboratories. (Copy on file in the SWCF asWPO37355.)
Andersen, P.J., M.E. Andersen, and D. Whiting. 1992. A Guide to Evaluating Thermal Effects inConcrete Pavements. SHRP-C/FR-92-101. Washington, DC: Strategic Highway ResearchProgram, National Research Council. (Copy on file in the SWCF.)
Avis, J.D., and GJ. Saulnier, Jr. 1990. Analysis of the Fluid-Pressure Responses of the Rustler .Formation at H-16 to the Construction of the Air-Intake Shaft at the Waste Isolation PilotPlant (WIPP) Site. SAND89-7067. Albuquerque, NM: Sandia National Laboratories.(Copy on file in the SWCF as WPO24168.)
Bachman, G.O. 1987. Karst in Evaporites in Southeastern New Mexico. SAND86-7078.Albuquerque, NM: Sandia National Laboratories. (Copy on file in the SWCF asWPO24006.)
Beauheim, R.L. 1987. Interpretations of Single-Well Hydraulic Tests Conducted at and Nearthe Waste Isolation Pilot Plant (WIPP) Site, 1983-1987. SAND87-0039. Albuquerque,NM: Sandia National Laboratories. (Copy on file in the SWCF as WPO27679.)
Beauheim, R.L., R.M. Roberts, T.F. Dale, M.D. Fort, and W.A. Stensrud. 1993. HydraulicTesting ofSalado Formation Evaporites at the Waste Isolation Pilot Plant Site: SecondInterpretive Report. SAND92-0533. Albuquerque, NM: Sandia National Laboratories.(Copy on file in the SWCF as WPO23378.)
Brinster, K.F. 1991. Preliminary Geohydrologic Conceptual Model of the Los Medanos RegionNear the Waste Isolation Pilot Plant for the Purpose of Performance Assessment.SAND89-7147. Albuquerque, NM: Sandia National Laboratories. (Copy on file in theSWCFasWPO27781.)
Brodsky, N.S. 1994. Hydrostatic and Shear Consolidation Tests with PermeabilityMeasurements on Waste Isolation Pilot Plant Crushed Salt. SAND93-7058.Albuquerque, NM: Sandia National Laboratories.
73

Brodsky, N.S., D.H. Zeuch, and DJ. Holcomb. 1995. "Consolidation and Permeability ofCrushed WIPP Salt in Hydrostatic and Triaxial Compression," Rock MechanicsProceedings of the 35th U.S. Symposium, University of Nevada, Reno, NV, June 5-7,1995.Eds. J.J.K. Daemen and R.A. Schultz. Brookfield, VT: A.A. Balkema. 497-502. (Copy onfile in the SWCF as WPO22432.)
Brodsky, N.S., F.D. Hansen, and T.W. Pfeifle. 1996. "Properties ofDynamically CompactedWIPP Salt," 4th International Conference on the Mechanical Behavior of Salt, Montreal,Quebec, June 17-18,1996. SAND96-0838C. Albuquerque, NM: Sahdia NationalLaboratories. (Copy on file at the Technical Library, Sandia National Laboratories,Albuquerque, NM.)
Callahan, G.D., M.C. Loken, L.D. Hurtado, and F.D. Hansen. 1996. "Evaluation of ConstitutiveModels for Crushed Salt," 4th International Conference on the Mechanical Behavior ofSalt, Montreal, Quebec, June 17-18,1996. SAND96-0791C. Albuquerque, NM: SandiaNational Laboratories. (Copy on file in the SWCF as WPO36449.)
Cauffinan, T.L., A.M. LaVenue, and J.P. McGord. 1990. Ground-Water Flow Modeling of theCulebraDolomite. VolumeII: DataBase. SAND89-7068/2. Albuquerque,NM: SandiaNational Laboratories. (Copy on file in the SWCF as WPO10551.)
Dale, T., and L.D. Hurtado. 1996. "WIPP Air-Intake Shaft Disturbed-Rock Zone Study," 4thInternational Conference on the Mechanical Behavior of Salt, Montreal, Quebec, June 17-18,1996. SAND96-1327C. Albuquerque, NM: Sandia National Laboratories. (Copy on filein the SWCF.)
DOE (U.S. Department of Energy). 1995. Waste Isolation Pilot Plant Sealing System DesignReport. DOE/WIPP-95-3117. Carlsbad, NM: U.S. Department of Energy, Waste IsolationPilot Plant. (Copy on file in the SWCF as WPO29062.)
EPA (Environmental Protection Agency). 1996a. Criteria for the Certification and Re-Certification of the Waste Isolation Pilot Plant's Compliance with the 40 CFR Part 191Disposal Regulations. Response to Comments Document for 40 CFR Part 194. EPA 402-R-96-001. Washington, DC: U.S. Environmental Protection Agency, Office of Radiation andIndoor Air. (Copy on file in the Nuclear Waste Management Library, Sandia NationalLaboratories, Albuquerque, NM.)
EPA (Environmental Protection Agency). 1996b. Criteria for the Certification and Re-Certification of the Waste Isolation Pilot Plant's Compliance with the 40 CFR Part 191Disposal Regulations. Background Information Document for 40 CFR Part 194. EPA 402-R-96-002. Washington, DC: U.S. Environmental Protection Agency, Office of Radiationand Indoor Air. (Copy on file in the Nuclear Waste Management Library, Sandia NationalLaboratories, Albuquerque, NM.)
Gray, M.N. 1993. OECD/NEA International Stripa Project. Overview Volume III: EngineeredBarriers. Stockholm, Sweden: SKB, Swedish Nuclear Fuel and Waste ManagementCompany. (Copy on file in the Nuclear Waste Management Library, Sandia NationalLaboratories, Albuquerque, NM as TD898.2 .G73 1993.)
74
Hansen, F.D., and E.H. Ahrens. 1996. "Large-Scale Dynamic Compaction of Natural Salt," 4thInternational Conference on the Mechanical Behavior of Salt, Montreal, Quebec, June 17-18,1996. SAND96-0792C. Albuquerque, NM: Sandia National Laboratories. (Copy on filein the SWCF as WPO39544.)
Hansen, F.D., E.H. Ahrens, A.W. Dennis, L.D. Hurtado, M.K. Knowles, J.R. Tillerson, T.W.Thompson, and D. Galbraith. 1996. "A Shaft Seal System for the Waste Isolation PilotPlant," Proceedings of SPECTRUM '96, Nuclear and Hazardous Waste Management,International Topical Meeting, American Nuclear Society/Department of EnergyConference, Seattle, WA, August 18-23,1996. SAND96-1100C. Albuquerque, NM: SandiaNational Laboratories. (Copy on file in the SWCF as WPO39369.)
Haug, A., V.A. Kelley, A.M. LaVenue, and J.F. Pickens. 1987. Modeling of Ground-WaterFlow in the Culebra Dolomite at the Waste Isolation Pilot Plant (WIPP) Site: InterimReport. SAND86-7167. Albuquerque, NM: Sandia National Laboratories. (Copy on file inthe SWCF as WPO28486.)
Hills, J.M. 1984. "Sedimentation, Tectonism,- and Hydrocarbon Generation in [the] DelawareBasin, West Texas and Southeastern New Mexico," American Association of PetroleumGeologists Bulletin. Vol. 68, no. 3,250-267. (Copy on file in the SWCF.)
Holt, R.M., and D.W. Powers. 1990. Geologic Mapping of the Air Intake Shaft at the WasteIsolation Pilot Plant. DOE-WIPP 90-051. Carlsbad, NM: Westinghouse ElectricCorporation for U.S. Department of Energy. (Copy on file in the Nuclear WasteManagement Library, Sandia National Laboratories, Albuquerque, NM.)
Knowles, M.K., and C.L. Howard. 1996. "Field and Laboratory Testing of Seal MaterialsProposed for the Waste Isolation Pilot Plant," Proceedings of the Waste Management 1996Symposium, Tucson, AZ, February 25-29,1996. SAND95-2082C. Albuquerque, NM:Sandia National Laboratories. (Copy on file in the SWCF as WPO30945.)
Knowles, M.K., D. Borns, J. Fredrich, D. Holcomb, R. Price, D. Zeuch, T. Dale, and R.S. VanPelt. 1996. "Testing the Disturbed Zone Around a Rigid Inclusion in Salt," 4th Conferenceon the Mechanical Behavior of Salt, Montreal, Quebec, June 17-18,1996. SAND95-1151C. Albuquerque, NM: Sandia National Laboratories. (Copy on file in the SWCF.)
Lambert, S.J. 1992. "Geochemistry of the Waste Isolation Pilot Plant (WIPP) Site, SoutheasternNew Mexico, U.S.A.," Applied Geochemistry. Vol. 7, no. 6,513-531. (Copy on file in theSWCFasWPO26361.)
LaVenue, A.M., T.L. Cauffman, and J.F. Pickens. 1990. Ground-Water Flow Modeling of theCulebra Dolomite, Volume I: Model Calibration. SAND89-7068/1. Albuquerque, NM:Sandia National Laboratories. (Copy on file in the SWCF as WPO24085.)
Mercer, J.W. 1983. Geohydrology of the Proposed Waste Isolation Pilot Plant Site, LosMedanos Area, Southeastern New Mexico. Water-Resources Investigations Report83-4016. Albuquerque, NM: U.S. Geological Survey, Water Resources Division. (Copy onfile in the Nuclear Waste Management Library, Sandia National Laboratories, Albuquerque,NM.) (Copy on file in the SWCF.)
75

Mercer, J.W., and B.R. Orr. 1979. Interim Data Report on the Geohydrology of the ProposedWaste Isolation Pilot Plant Site, Southeast New Mexico. Water-Resources InvestigationsReport 79-98. Albuquerque, NM: U.S. Geological Survey, Water Resources Division.(Copy on file in the SWCF.)
Nowak, E.J., J.R. Tillerson, and T.M. Torres. 1990. Initial Reference Seal System Design: WasteIsolation Pilot Plant. SAND90-0355. Albuquerque, NM: Sandia National Laboratories.(Copy on file in the SWCF as WPO23981.)
* -Pfeifle, T.W., F.D. Hansen, and M.K. Knowles. 1996. "Salt-Saturated Concrete Strength and
Permeability," 4th Materials Engineering Conference, ASCE Materials EngineeringDivision, Washington, DC, November 11-18,1996. Albuquerque, NM: Sandia NationalLaboratories.)
Powers, D.W., S.J. Lambert, S-E. Shaffer, L.R. Hill, and W.D. Weart, eds. 1978. GeologicalCharacterization Report Waste Isolation Plant (WIPP) Site, Southeastern New Mexico.SAND78-1596. Albuquerque, NM: Sandia National Laboratories. Vols. I-II. (Copy on filein the SWCF as WPO5448, WPO26829-26830.)
Saulnier, G.J., Jr., and J.D. Avis. 1988. Interpretation of Hydraulic Tests Conducted in theWaste-Handling Shaft at the Waste Isolation Pilot Plant (WIPP) Site. SAND88-7001.Albuquerque, NM: Sandia National Laboratories. (Copy on file in the SWCF asWPO24164.)
Stormont, J.C. 1984. Plugging and Sealing Program for the Waste Isolation Pilot Plant(WIPP). SAND84-1057. Albuquerque, NM: Sandia National Laboratories. (Copy on filein the SWCF as WPO24698.)
Van Sambeek, L.L., D.D. Luo, M.S. Lin, W. Ostrowski, and D. Oyenuga. 1993. Seal DesignAlternatives Study. SAND92-7340. Albuquerque, NM: Sandia National Laboratories.(Copy on file in the SWCF as WPO23445.)
Vine, J.D. 1963. Surface Geology of the Nash Draw Quadrangle, Eddy County, New Mexico.Geological Survey Bulletin 1141-B. Washington, DC: U.S. Government Printing Office.(Copy on file in the SWCF as WPO39558.)
Wing, N.R., and G.W. Gee. 1994. "Quest for the Perfect Cap," Civil Engineering. Vol. 64, no.10,38-41. (Copy on file in the SWCF as WPO21158.)
76

Appendix A
Material Specification
Appendix A Abstract
This appendix specifies material characteristics for shaft seal system components designed forthe Waste Isolation Pilot Plant. The shaft seal system will not be constructed for decades;however, if it were to be constructed in the near term, materials specified here could be placed inthe shaft and meet performance specifications. A material specification is necessary today toestablish a frame of reference for design and analysis activities and to provide a basis for sealmaterial parameters. This document was used by three integrated working groups: (1) thearchitect/engineer for development of construction methods and supporting infrastructure, (2)fluid flow and structural analysis personnel for evaluation of seal system adequacy, and (3)technical staff to develop probability distribution functions for use in performance assessment.The architect/engineers provide design drawings, construction methods and schedules asappendices to the final shaft seal system design report, called the Compliance Submittal DesignReport. Similarly, analyses of structural aspects of the design and fluid flow calculationscomprise other appendices to the final design report. These products together are produced todemonstrate the adequacy of the shaft seal system to independent reviewers, the EPA, andstakeholders. It is recognized that actual placement of shaft seals is many years in the future, sodesign, planned construction method, and components will almost certainly change between nowand the time that detailed construction specifications are prepared for the bidding process.Specifications provided here are likely to guide future work between now and the time ofconstruction, perhaps benefiting from optimization studies, technological advancements, orexperimental demonstrations.
A-l

Page intentionally blank.
A-2

Contents
Al. INTRODUCTION 5Al.l Sealing Strategy 8A1.2 Longevity 8
A2. MATERIAL SPECIFICATIONS •. 10A2.1 Mass Concrete 10
A2.1.1 Functions ~ : ......11A2.1.2 Material Characteristics 11A2.1.3 Construction 13A2.1.4 Performance Requirements 14A2.1.5 Verification Methods 16
A2.2 Compacted Clay 18A2.2.1 Functions 18A2.2.2 Material Characteristics 18A2.2.3 Construction : , 20A2.2.4 Performance Requirements 20A2.2.5 Verification Methods 23
A2.3 Asphalt Components 24A2.3.1 Functions 24A2.3.2 Material Characteristics 24A2.3.3 Construction 25A2.3.4 Performance Requirements 26A2.3.5 Verification Methods 27
A2.4 Compacted Salt Column 27A2.4.1 Functions 28A2.4.2 Material Characteristics 29A2.4.3 Construction 29A2.4.4 Performance Requirements : 30A2.4.5 Verification Methods 33
A2.5 Cementitious Grout 34A2.5.1 Functions 34A2.5.2 Material Characteristics 34A2.5.3 Construction 35A2.5.4 Performance Requirements 35A2.5.5 Verification Methods 36
A2.6 Earthen Fill...... 36A2.6.1 Functions 36A2.5.2 Material Characteristics 36A2.5.3 Construction 36A2.5.4 Performance Requirements 36A2.5.6 Verification 36
A3. CONCLUDING REMARKS 36
A4. REFERENCES 37
A-3

Figures
Figure A-l. Schematic of the WIPP shaft seal design 6Figure A-2. Cumulative distribution function for SMC 16Figure A-3. Sodium bentonite permeability versus density 22Figure A-4. Cumulative frequency distribution for compacted bentonite 23Figure A-5. Asphalt permeability cumulative frequency distribution function 27Figure A-6. Fractional density of the consolidating salt column .> .......31Figure A-7. Permeability of consolidated crushed salt as a function of fractional density 32Figure A-8. Compacted salt column permeability cumulative frequency distribution
function at seal midpoint 100 years following closure 33
Tables
Table A-l. Concrete Mixture Proportions ." ; 12Table A-2. Standard Specifications for Concrete Materials 12Table A-3. Chemical Composition of Expansive Cement 13Table A-4. Requirements for Salado Mass Concrete Aggregates 14Table A-5. Target Properties for Salado Mass Concrete 15Table A-6. Test Methods Used for Measuring Concrete Properties During and After Mixing....l7Table A-7. Test Methods Used for Measuring Properties of Hardened Concrete 17Table A-8. Representative Bentonite Composition 19Table A-9. Asphalt Component Specifications 25Table A-10. Ultrafine Grout Mix Specification 35
A-4

A1. INTRODUCTION
This appendix provides a body of technical information for each of the WEPP shaft sealsystem materials identified in the text of the Compliance Submitted Design Report. This materialspecification characterizes each seal material, establishes why it will function adequately, statesbriefly how each component will be placed, and quantifies expected characteristics, particularlypermeability, pertinent to a WIPP-specific shaft seal design. Each material is first describedfrom an engineering viewpoint, then appropriate properties are summarized in tables and figureswhich emphasize penneability parameter distribution functions used in performance calculations.Materials are discussed beyond limits normally found in conventional constructionspecifications. Descriptive elements focus on stringent shaft seal system requirements that are-vital to regulatory compliance demonstration. Information normally contained in an engineeringperformance specification is included because more than one construction method, or even acompletely different material, may function adequately. Content that would eventually beincluded contractually in specifications for materials or specifications for workmanship are notincluded in detail. The goal of these specifications is to substantiate why materials used in thisseal system design will limit fluid flow and thereby adequately limit releases of hazardousconstituents from the WIPP site at the regulatory boundary.
Figure A-l is a schematic drawing of the proposed WIPP shaft sealing system. Design..detail and other characteristics of the geologic, hydrologic and chemical setting are provided inthe main body of the report, other appendices, and references. The four shafts will be entirelyfilled with dense materials possessing low permeability and other desirable engineering andeconomic attributes. Seal materials include concrete, clay, asphalt, and compacted salt. Otherconstruction and fill materials include cementitious grout and earthen fill. The level of detailincluded for each material, and the emphasis of detail, vary among the materials. Concrete, clay,and asphalt are common construction materials used extensively in hydrologic applications.Their descriptions will be rather complete, and performance expectations will be drawn from theliterature and site-specific references. Portland cement concrete is the most common structuralmaterial being proposed for the WIPP shaft seal system and its use has a long history.Considerable specific detail is provided for concrete because it is salt-saturated. Clay is usedextensively in the seal system. Clay is often specified in industry as a construction material, andbentonitic clay has been widely specified as a low permeability liner for hazardous waste sites.Therefore, a considerable body of information is available for clay materials, particularlybentonite. Asphalt is a widely used paving and waterproofing material, so its specification herereflects industry practice. It has been used to seal shaft linings as a filler between the concreteand the surrounding rock, but has not been used as a full shaft seal component. Compaction andnatural reconsolidation of crushed salt are uniquely applied here. Therefore, the crushed saltspecification provides additional information on its constitutive behavior and sealingperformance. Cementitious grout is also specified in some detail because it has been developedand tested for WIPP-specific applications and similar international waste programs. Earthen fillwill be given only cursory specifications here because it has little impact on the shaft sealperformance and placement to nominal standards is easily attained.
A-5
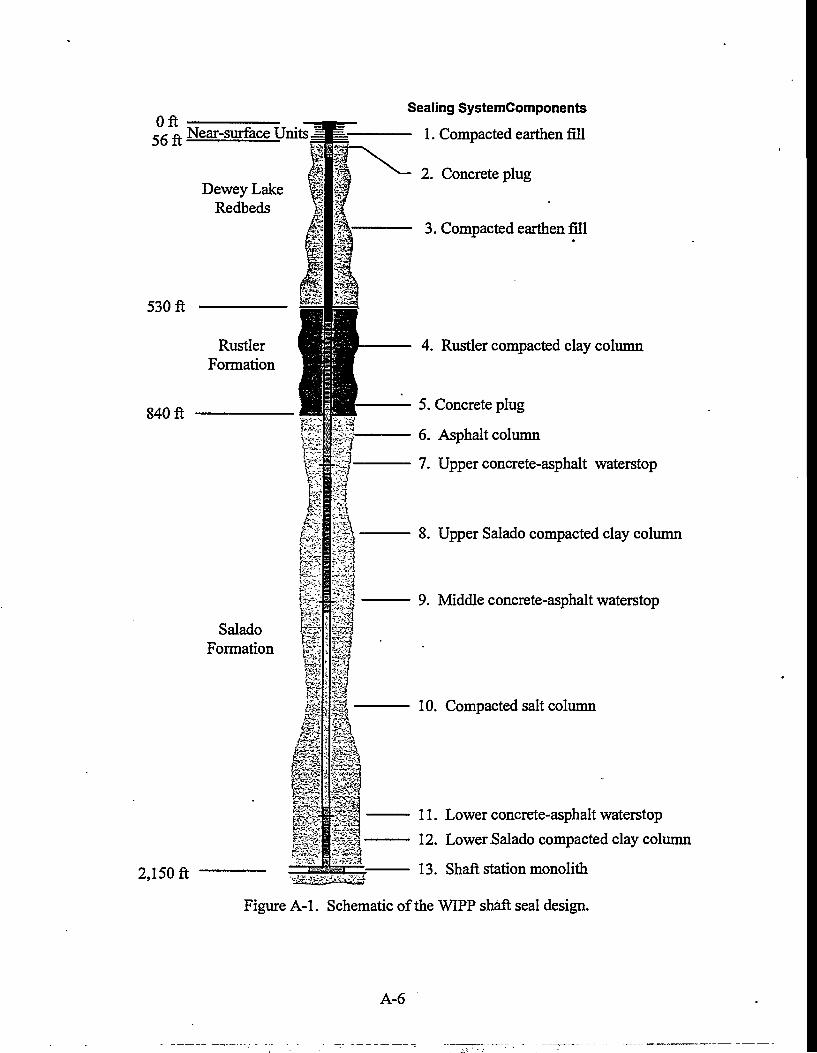
Oft~ Near-surface Units.
Dewey LakeRedbeds
530 ft
RustlerFormation
840 ft
SaladoFormation
2,150 ft
£•%•:'
m
Mm
Sealing SystemComponents
- 1. Compacted earthen fill
2. Concrete plug
3. Compacted earthen fill
4. Rustler compacted clay column
5. Concrete plug
6. Asphalt column
7. Upper concrete-asphalt waterstop
8. Upper Salado compacted clay column
9. Middle concrete-asphalt waterstop
10. Compacted salt column
11. Lower concrete-asphalt waterstop
12. Lower .Salado compacted clay column
13. Shaft station monolith
Figure A-l. Schematic of the WIPP shaft seal design.
A-6
Discussion of each material is divided into sections, which are described in the annotatedbullets below:
• Functions
A general summary of functions of specific seal components is presented. Each sealcomponent must function within a natural setting, so design considerations embracenaturally occurring characteristics of the surrounding rock.
• Material Characteristics
Constitution of the seal material is described and key physical, chemical, mechanical,hydrological, and thermal features are discussed.
• Construction
A brief mention is made regarding construction, which is more thoroughly treated inAppendix B of the Compliance Submittal Design Report. Construction, as discussed inthis section, is primarily concerned with proper placement of materials. A viableconstruction procedure that will attain placement specifications is identified, but such aspecification does not preclude other potential methods from use when the seal system iseventually constructed.
• Performance Requirements
Regulations to which the WIPP must comply do not provide quantitative specificationsapplicable to seal design. Performance of the WIPP repository is judged against potentialreleases of hazardous constituents at the regulatory boundary, which is a probabilisticcalculation. To this end, probability distribution functions for permeabilities (referred toas PDFs) of each material have been derived for performance assessment of the WIPPsystem and are included within this subsection on performance requirements.
• Verification Methods
It must be assured that seal materials placed in the shaft meet specifications. Both designand selection of materials reflect this principal concern. Assurance is provided by qualitycontrol procedures, quality assurance protocol, real-time testing, demonstrations oftechnology before construction, and personnel training. Materials and constructionprocedures are kept relatively simple, which creates robustness within the overall system.In addition, elements of the seal system often are extensive in length, and constructionwill require years to complete. If atypical placement of materials is detected, correctionscan be implemented without impacting performance. These specifications limit in situtesting of seal material as it is constructed although, if it is later determined to bedesirable, certain in situ tests can be amended in construction specifications. Invasivetesting has the potential to compromise the material, add cost, and create logistic andsafety problems. Conventional specifications are made for property testing and qualitycontrol.
• References
These specifications draw on a wealth of information available for each material.Reference to literature values, existing data, anecdotal information, similar applications,laboratory and field testing, and other applicable supportive documentation is made.
A-7

A1.1 Sealing Strategy
The shaft seal system design is an integral part of compliance with 40 CFR191. TheEPA has also promulgated 40 CFR 194, entitled "Criteria for the Certification and Re-certification of the Waste Isolation Pilot Plant's Compliance with the 40 CFR Part 191," towhich this design and these specifications are responsive. Other seal design requirements, suchas State of New Mexico regulations, apply to stratigraphy above the Salado.
Compliance of the site with 40 CFR 191 will be determined in part by the ability of theseal system to limit migration of hazardous constituents to the regulatory boundary. Both naturaland engineered barriers may combine to form the isolation system, with the shaft seal systemforming an engineered barrier in a natural setting. Seal system materials possess high durabilityand compatibility with the host rock. All materials used in the shaft seal system are expected tomaintain their integrity for very long periods. The system contains functional redundancy anduses differing materials to reduce uncertainty in performance. Some sealing components areused to retard fluid flow soon after placement, while other components are designed to functionwell beyond the regulatory period. International programs engaged in research anddemonstration of sealant technology provide significant information on longevity of materialssimilar to those proposed for this shaft seal system (Gray, 1993). When this information isapplied to the setting and context of the WDPP, there is strong evidence that the materials.specified will maintain their positive attributes for defensibly long periods.
A1.2 Longevity
Longevity of materials is considered within the site geologic and hydrologic setting assummarized in the main body of this report and described in the Seal System Design Report(DOE, 1995). A major environmental advantage of the WTPP locality is an overall lack ofgroundwater to seal against. In terms of sealing the WIPP site, the stratigraphy can beconveniently divided into the Salado Formation and the superincumbent formations comprisingprimarily the Rustier Formation and the Dewey Lake Redbeds. The Salado Formation,composed mainly of evaporite sequences dominated by halite, is nearly impermeable.Transmissivity of engineering importance in the Salado Formation is lateral along anhydriteinterbeds, basal clays, and fractured zones near underground openings. Neither the Dewey LakeRedbeds nor the Rustier Formation contains regionally productive sources of water, althoughseepage near the surface in the Exhaust Shaft has been observed. Permeability of materialsplaced in the Salado below the contact with the Rustler, and their effects on the surroundingdisturbed rock zone, are the primary engineering properties of concern. Even though very littleregional water is present in the geologic setting, the seal system reflects great concern forgroundwater's potential influence on materials comprising the shaft seal system.
Shaft seal materials have been selected in part because of their exceptional durability.However, it is recognized that brine chemistry could impact engineered materials if conditionspermitted. Highly concentrated saline solutions can, under severe circumstances, affectperformance of cementitious materials and clay. Concrete has been shown to degrade undercertain conditions, and clays can be more transmissive to brine than to potable water. Asphaltand compacted salt are essentially chemically inert to brine. Although stable in naturallyoccurring seeps such as those in the Santa Barbara Channel (California), asphalt can degrade
A-8

when subjected to ultraviolet light or through microbial activity. Brine would not chemicallychange the compacted salt column, but mechanical effects of pore pressure are of concern toreconsolidation. Mechanical influences of brine on the reconsolidating salt column are discussedin Sections 7 and 8 of the main report, which summarize Appendices D and C, respectively.
Because of limited volumes of brine, low hydraulic gradients, and low permeabilitymaterials, the geochemical setting will have little influence on shaft seal materials. Each materialis durable, though the potential exists for degradation or alteration under extreme conditions. Forexample, the three major components of portland cement concrete, portlandite (Ca (OH)2,) "calcium-aluminate-hydrate (CAH) and calcium-silicate-hydrate (CSH), are notthermodynamically compatible with WIPP brines. If large quantities of high ionic strength brinewere available and transport of mass was possible, degradation of cementitious phases would 'certainly occur. Such a localized phenomenon was observed on a construction joint in the linerof the Waste Handling Shaft at the WIPP site. Within the shaft seal system, however, thehydrologic setting does not support such a scenario. Locally brine will undoubtedly contact thesurface of mass placements of concrete. A low hydrologic gradient will limit mass transport,although degradation of paste constituents is expected where brine contacts concrete.
Among longevity concerns, degradation of concrete is the most recognized. At this stageof the design, it is established that only small volumes of brine ever reach the concrete elements(see Section 8). Further analysis concerned with borehole plugging using cementitious materialsshows that at least 100 pore volumes of brine in an open system would be needed to begindegradation processes. In a closed system, such as the hydrologic setting in the WIPP shafts,phase transformations create a degradation product of increased volume. Net volume increaseowing to phase transformation in the absence of mass transport would decrease rather thanincrease permeability of concrete seal elements.
Mechanical and chemical stability of clays, in this case the emphasis is on bentoniticclay, is particularly favorable in the WIPP geochemical and hydrological environment. Acompendium of recent work associated with the Stripa project in Sweden (Gray, 1993) providesfield-scale testing results, supportive laboratory experimental data, and thennodynamic modelingthat lead to a conclusion that negligible transformation of the bentonite structure will occur overthe regulatory period of the WIPP. In fact, very little brine penetration into clay components isexpected, based on intermediate-scale experiments at WIPP. Any wetting of bentonite will resultin development of swelling pressure, a favorable situation that would accelerate return to auniform stress state within the clay component.
Natural bentonite is a stable material that generally will not change significantly over aperiod often thousand years. Bentonitic clays have been widely used in field and laboratoryexperiments concerned with radioactive waste disposal. As noted by Gray (1993), three internal•mechanisms, illitization, silicification and charge change, could affect sealing properties ofbentonite. Illitization and silicification are thermally driven processes and, following discussionby Gray (1993), are not possible in the environment or time-frame of concern at the WIPP. Thenaturally occurring Wyoming bentonite which is the specified material for the WIPP shaft seal iswell over a million years old. It is, therefore, highly unlikely that metamorphism of bentoniteenters as a design concern.
A-9

Asphalt has existed for thousands of years as natural seeps. Longevity studies specific toDOE's Hanford site have utilized asphalt artifacts buried in ancient ceremonies to assess long-term stability (Wing and Gee, 1994). Asphalt used as a seal component deep in the shaft willinhabit a benign environment, devoid of ultraviolet light or an oxidizing atmosphere. Additionalassurance against possible microbial degradation in asphalt elements is mitigated with additionof lime. For these reasons, it is thought that design characteristics of asphalt components willendure well beyond the regulatory period.
Materials being used to form the shaft seals are the same as those "being suggested in thescientific and engineering literature as appropriate for sealing deep geologic repositories forradioactive wastes. This fact was noted during independent technical review. Durability orlongevity of seal components is a primary concern for any long-term isolation system. Issues ofpossible degradation have been studied throughout the. international community and within wasteisolation programs in the USA. Specific degradation studies are not detailed in this documentbecause longevity is one of the over-riding attributes of the materials selected and degradation isnot perceived to be likely. However, it is acknowledged here that microbial degradation, sealmaterial interaction, mineral transformation, such as silicification of bentonite, and effects of athermal pulse from asphalt or hydrating concrete remain areas of continued study.
A2. MATERIAL SPECIFICATIONS
The WIPP shaft seal system plays an important role in meeting regulatory requirements.A combination of available, durable materials which can be emplaced with low permeability isproposed as the seal system. Components include mass concrete, asphalt waterstops sandwichedbetween concrete plugs, a column of asphalt, long columns of compacted clay, and a column ofcompacted crushed WIPP salt. The design is based on common materials and constructiontechnologies that could be implemented using today's technology. In choosing materials,emphasis was given to permeability characteristics and mechanical properties. The function,constitution, construction, performance, and verification of each material are given in thefollowing sections.
A2.1 Mass Concrete
Concrete has exceptionally low permeability and is widely used for hydraulicapplications such as water storage tanks, water and sewer systems, and massive dams. Salt-saturated concrete has been used successfully as a seal material in potash and salt miningapplications. Upon hydration, unfractured concrete is nearly impermeable, having a permeabilityless than 10'20 m2. In addition, concrete is a primary structural material used for compressionmembers in countless applications. Use of concrete as a shaft seal component takes advantage ofits many attributes and the extensive documentation of its use.
This specification for mass concrete will discuss a special design mixture of a salt-saturated concrete called Salado Mass Concrete or SMC (Wakeley et al., 1995). Performance ofSMC and similar salt-saturated mixtures is established and will be completely adequate for.concrete applications within the WIPP shafts. Because concrete is such a widely used material, ithas been written into specifications many times. Therefore, the specification for SMC contains
A-10

recognized standard practices, established test methods, quality controls, and other details thatare not available at a similar level for other seal materials. Use of salt-saturated concrete,especially SMC, is backed by extensive laboratory and field studies that establish performancecharacteristics far exceeding requirements of the WIPP shaft seal system.
A2.1.1 Functions
The function of the concrete is to provide a durable component with small void volume,adequate structural compressive strength, and low permeability. Concrete components appearwithin the shaft seal system at the very bottom, the very top, and several locations in betweenwhere they provide a massive plug that fills the opening and a tight interface between the plugand host rock. In addition, concrete is a rigid material that will support overlying sealcomponents while promoting natural healing processes within the salt disturbed rock zone (theDRZ is discussed further in Appendix D).
Concrete is one of the redundant components that protects the reconsolidating saltcolumn. Since the salt column will achieve low permeabilities in fewer than 100 years (seeSection 2.4.4 of this specification), concrete would no longer be needed after that time. Forpurposes of performance assessment calculations, a change in concrete permeability to degradedvalues is "allowed" to occur. However, concrete within the Salado Formation is likely to-endure.throughout the regulatory period with sustained engineering properties.
All concrete sealing elements, with the exception of a possible concrete cap, areunreinforced. In conventional civil engineering design, reinforcement is used to resist tensilestresses since concrete is weak in tension and reinforcement bar (rebar) balances tensile stressesin the steel with compressive stresses in concrete. However, concrete has exceptionalcompressive strength, and all the states of stress within the shaft will be dominated bycompressive stress. Mass concrete, by definition, is related to any volume of concrete where heatof hydration is a design concern. SMC is tailored to minimise heat of hydration and overalldifferential temperature. An analysis of hydration heat distribution is included in Appendix D.Boundary conditions are favorable for reducing any possible thermally induced tensile crackingduring the hydration process.
A2.1.2 Material Characteristics
Salt-saturated concrete contains sufficient salt as an aggregate to saturate hydration waterwith respect to NaCl. Salt-saturated concrete is required for all uses within the Salado Formationbecause fresh water concrete would dissolve part of the host rock. Dissolution would cause apoor bond and perhaps a more porous interface, at least initially.
Dry materials for SMC include cementitious materials, fine and coarse aggregates, andsodium chloride. Concrete mixture proportions of materials for one cubic yard of concreteappear in Table A-l.
A-ll

Table A-l.
Material
Portland cement
Class F fly ash
Expansive cement
Fine aggregate
Coarse aggregate
Sodium chloride
Water
Concrete Mixture Proportions
lb/yd3
278207134
1292
1592
88225
kg/m3 = (lb/yd3) * (0.59). Water: Cement Ratio is weight of water divided by all cementitious materials.
Table A-2 is a summary of standard specifications for concrete materials. Furtherdiscussion of each specification is presented in subsequent text, where additional specificationspertinent to particular concrete components are also given.
Table A-2. Standard Specifications for Concrete Materials
Material
ClassHoilwellcement
Class F flyash
Expansivecement
Salt
Coarse andfine
aggregates
Applicable Standard Tests andSpecifications
American Petroleum InstituteSpecification 10
ASTM C 618, Standard Specificationfor Fly Ash
Similar to ASTM C 845.
ASTM E 534, Chemical Analysis ofSodium Chloride
ASTM C 33, Standard Specification forConcrete Aggregates; ASTM C 294
and C 295 also applied
Comments
Chemical composition determinedaccording to ASTM C 114
Composition and propertiesdetermined according to
ASTM C 311
Composition determined accordingto ASTM C 114
Batched as dry ingredient, not as anadmixture
Moisture content determined byASTM C 566
Portland cement shall conform to American Petroleum Institute (API) Specification 10Class G or Class H. Additional requirements for the cement are that the fineness as determinedaccording to ASTM C 204 shall not exceed 300 m2/kg, and the cement must meet therequirement in ASTM C 150 for moderate heat of hydration.
Fly Ash shall confonn to ASTM C 618, Class F, with the additional requirement that thepercentage of Ca cannot exceed 10 %.
A-12

Expansive cement for shrinkage-compensation shall have properties so that, when usedwith portland cement, the resulting blend is shrinkage compensating by the mechanism describedin ASTM C 845 for Type K cement. Additional requirements for chemical composition of theshrinkage compensating cement appear in Table A-3.
Table A-3. Chemical Composition of Expansive Cement
Chemical composition
Magnesium oxide, max
Calcium oxide, min
Sulfur trioxide, max
Aluminum trioxide (AL2O3), min
Silicon dioxide, min
Insoluble residue, max
Loss on ignition, max
Weight %
1.038.0
28.0
7.07.01.0
12.0
Sodium Chloride shall be of a technical grade consisting of a minimum of 99.0 % •sodium chloride as determined according to ASTM E 534, and shall have a maximum particlesize of 600 jam.
Aggregate proportions are reported here on saturated surface-dry basis. Specific gravityof coarse and fine aggregates used in these proportions were 2.55 and 2.58, respectively.Absorptions used in calculations were 2.25 (coarse) and 0.63 (fine) % by mass. Concretemixture proportions will be adjusted to accommodate variations in the materials selected,especially differences in specific gravity and absorptions of aggregates. Fine aggregate shallconsist of natural silica sand. Coarse aggregate shall consist of gravel. The quantity of flat andelongated particles in the separate size groups of coarse aggregates, as determined by ASTM D4791, using a value of 3 for width-thickness ratio and length-width ratio, shall not exceed 25 %hi any size group. Moisture in the fine and coarse aggregate shall not exceed 0.1 % whendetermined in accordance with ASTM C 566. Aggregates shall meet the requirements listed inTable A-4.
A2.1.3 Construction
Construction techniques include surface preparation of mass concrete and slickline (adrop pipe from the surface) placement at depth within the shaft. A batching and mixingoperation on the surface will produce a wet mixture having initial temperatures not exceeding20°C. Placement uses a tremie line, where the fresh concrete exits the slickline below the surfacelevel of the concrete being placed. This procedure will minimize entrained air. Placementrequires no vibration and, except for the large concrete monolith at the base of each shaft, noform work. No special curing is required for the concrete because its natural environmentensures retention of humidity and excellent hydration conditions. It is desired that each concretepour be continuous, with the complete volume of each component placed without constructionjoints. However, no perceivable reduction in performance is anticipated if, for any reason,
A-13

concrete placement is interrupted. A free face or cold joint could allow lateral flow but wouldremain perpendicular to flow down the shaft. Further discussion of concrete construction ispresented in Appendix B.
Table A-4. Requirements for Salado Mass Concrete Aggregates
Property
Specific Gravity (ASTM C 127,ASTM C 128)
Absorption (ASTM C 127,ASTM C 128)
Clay Lumps and Friable Particles(ASTM C 142)
Material Finer than 75-um (No.200) Sieve (ASTM C 117)
Organic Impurities (ASTM C 40)
L.A. Abrasion (ASTM C 131,ASTM C 535)
Petrographic Examination(ASTM C 295)
Coal and Lignite, less than 2.00specific gravity (ASTM C 123)
Fine Aggregate
2.65, max_
1.5 percent, max
3.0 percent, max
3.0 percent, max
No. 3, max
N/A
Carbonate mineralaggregates shall not be
used
0.5 percent, max
Coarse Aggregate
. 2.80, max
3.5 percent, max
3.0 percent, max
1.0 percent, max
N/A
50 percent, max
Carbonate rockaggregates shall not be
used
0.5 percent, max
A2.1.4 Performance Requirements
Specifications of concrete properties include characteristics in the green state as well asthe hardened state. Properties of hydrated concrete include conventional mechanical propertiesand projections of permeabilities over hundreds of years, a topic discussed at the end of thissection. Table A-5 summarizes target properties for SMC. Attainment of these characteristicshas been demonstrated (Wakeley et al., 1995). SMC has a strength of about 40 MPa at 28 daysand continues to gain strength after that time, as is typical of hydrating cementitious materials.Concrete strength is naturally much greater than required for shaft seal elements because the stateof stress within the shafts is compressional with little shear stress developing. In addition,compressive strength of SMC increases as confining pressure increases (Pfeifle et al., 1996).Volume stability of the SMC is also excellent, which assures a good bond with the salt.
Thermal and constitutive models for the SMC are described in Appendix D. Thermalproperties are fit to laboratory data and used to calculate heat distribution during hydration. Anisothermal creep law and an increasing modulus are used to represent the concrete in structuralcalculations. The resistance established by concrete to inward creep of the Salado Formationaccelerates healing of microcracks in the salt. The state of stress impinging on concrete elementswithin the Salado Formation will approach a lithostatic condition.
A-14

Table A-5. Target Properties for Salado Mass Concrete
Property
Initial slump 10 ± 1.0 in.Slump at 2 hr 8 ±1.5 in.
Initial temperature < 20°C
Air content <2.0%
Self-leveling
No separately batched admixtures
Adiabatic temperature rise<16°Cat28days
30 MPa (4500 psi) compressivestrength
Volume stability
Comment
ASTM C 143, high slump needed for pumping andplacement
ASTM C 1064, using ice as part of mixing water
ASTM C 231 (Type B meter), tight microstructureand higher strength
Restrictions on underground placement may precludevibration
Simple and reproducible operations
To reduce thermally induced cracking
ASTM C 39, at 180 days after placement
ASTM C 157, length change between +0.05 and-0.02% through 180 days
Permeability of SMC is very low, consistent with most concretes. Owing to a favorablestate of stress and isothermal conditions, the SMC will remain intact. Because little brine isavailable to alter concrete elements, minimal degradation is possible. Resistance to phasechanges of salt-saturated concretes and mortars within the WIPP setting has been excellent.These favorable attributes combine to assure concrete elements within the Salado will remainstructurally sound and possess very low permeability for exceedingly long periods.
Permeabilities of SMC and other salt-saturated concretes have been measured in Small-Scale Seal Performance Tests (SSSPT) and Plug Test Matrix (PTM) at the WIPP for a decadeand are corroborated by laboratory measurements (e.g., Knowles and Howard, 1996; Pfeifle etal., 1996). From these tests, values and ranges of concrete permeability have been developed.For performance assessments calculations, permeability of SMC seal components is treated as arandom variable defined by a log triangular distribution with a best estimator of 1.78><10"19 m2
and lower and upper limits of 2.0x10 and l.OxlO"17 m2, respectively.
The probability distribution function is shown in Figure A-2. Further, it is recognizedthat concrete function is required for only a relatively short-term period as salt reconsolidates.Concrete is expected to function adequately beyond its design life. For calculational expediency,a higher, very conservative permeability of 1.0x10*14 is assigned to concrete after 400 years.This abrupt change in permeability does not imply degradation, but rather reflects systemredundancy and the fact that concrete is no longer relied on as a seal component.
A-15

CD
u.
Ii53
o
Log Permeability (m )TRI-8121-347-0
Figure A-2. Cumulative distribution function for SMC.
A2.1.5 Verification Methods
The concrete supplier shall perform the inspection and tests described below (Tables A-6and A-7) and, based on the results of these inspections and tests, shall take appropriate action.The laboratory performing verification tests shall be on-site and shall conform with ASTMC 1077. Individuals who sample and test concrete or the constituents of concrete as required inthis specification shall have demonstrated a knowledge and ability to perform the necessary testprocedures equivalent to the ACI minimum guidelines for certification of Concrete LaboratoryTesting Technicians, Grade I. The Buyer will inspect the laboratory, equipment, and testprocedures for conformance with ASTM C 1077 prior to start of dry materials batchingoperations and prior to restarting operations.
A2.1.5.1 Fine Aggregate
(A) Grading. Dry materials will be sampled while the batch plant is operating; there shall be asieve analysis and fineness modulus determination in accordance with ASTM C 136.
(B) Fineness Modulus Control Chart. Results for fineness modulus shall be grouped in sets ofthree consecutive tests, and the average and range of each group shall be plotted on a controlchart. The upper and lower control limits for average shall be drawn 0.10 units above and belowthe target fineness modulus, and the upper control limit for range shall be 0.20 units above thetarget fineness modulus.
A-16

Table A-6. Test Methods Used for Measuring Concrete Properties During and After Mixing
Property
Slump
Unit weight
Air content
Mixture temperature
Test Method
ASTM C 143
ASTM C 138
ASTM C 231
ASTM C 1064
Title
Slump of Portland Cement Concrete
Unit Weight, Yield, and Air Content(Gravimetric) of Concrete
Air Content of Freshly Mixed Concrete bythe Pressure Method
Temperature of Freshly Mixed Concrete
Table A-7. Test Methods Used for Measuring Properties of Hardened Concrete
Property
Compressive strength
Modulus of elasticity
Volume stability
Test Method
ASTM C 39
ASTM C 469
ASTM C 157
Title
Compressive Strength of CylindricalConcrete Specimens
Static Modulus of Elasticity and Poisson'sRatio of Concrete in Compression ~ .
Length Change of Hardened CementMortar and Concrete
(C) Corrective Action for Fine Aggregate Grading. When the amount passing any sieve isoutside the specification limits, the fine aggregate shall be immediately resampled and retested.If there is another failure for any sieve, the fact shall be immediately reported to the Buyer.Whenever a point on the fineness modulus control chart, either for average or range, is beyondone of the control limits, the frequency of testing shall be doubled. If two consecutive points arebeyond the control limits, the process shall be stopped and stock discarded if necessary.
(D) Moisture Content Testing. There shall be at least two tests for moisture content inaccordance with ASTM C 566 during each 8-hour period of dry materials batch plant operation.
(E) Moisture Content Corrective Action. Whenever the moisture content of fine aggregateexceeds 0.1.% by weight, the fine aggregate shall be immediately resampled and retested. Ifthere is another failure the batching shall be stopped.
A2.1.5.2 Coarse Aggregate
(A) Grading. Coarse aggregate shall be analyzed in accordance with ASTM C 136.
(B) Corrective Action for Grading. When the amount passing any sieve is outside thespecification limits, the coarse aggregate shall be immediately resampled and retested. If thesecond sample fails on any sieve, that fact shall be reported to the Buyer. Where two consecutiveaverages of five tests are outside specification limits, the dry materials batch plant operation shallbe stopped, and immediate steps shall be taken to correct the grading.
A-17
(C) Moisture Content Testing. There shall be at least two tests for moisture content inaccordance with ASTM C 566 during each 8-hour period of dry materials batch plant operation.
(D) Moisture Content Corrective Action. Whenever the moisture content of coarse aggregateexceed 0.1 % by weight, the coarse aggregate shall be immediately resampled and retested. Ifthere is another failure, batching shall be stopped.
A2.1.5.3 Batch-Plant Control
The measurement of all constituent materials including cementitious materials, each sizeof aggregate, and granular sodium chloride shall be continuously controlled. The aggregatebatch weights shall be adjusted as necessary to compensate for their nonsaturated surface-dry'condition.
A2.1.5.4 Concrete Products
Concrete products will be tested during preparation and after curing as summarized inTables A-6 and A-7 for preparation and hydrated concrete, respectively.
A2.2 Compacted Clay
Compacted clays are commonly proposed as primary sealing materials for nuclear wasterepositories and have been extensively investigated (e.g., Gray, 1993). Compacted clay as a shaftsealing component provides a barrier to brine and possibly to gas flow into or out of therepository and supports the shaft with a high density material to minimize subsidence. In theevent that brine does contact the compacted clay columns, bentonitic clay can generate abeneficial swelling pressure. Swelling would increase internal supporting pressure on the shaftwall and accelerate healing of any disturbed rock zone. Wetted, swelling clay will seal fracturesas it expands into available space and will ensure tightness between the clay seal component andthe shaft walls.
A2.2.1 Functions
In general, clay is used to prevent fluid flow either down or up the shaft. In addition, claywill stabilize the shaft opening and provide a backstress within the Salado Formation that willenhance healing of microfractures in the disturbed rock. Bentonitic clays are specified forComponents 4, 8, and 12. In addition to limiting brine migration down the shafts, a primaryfunction of a compacted clay seal through the Rustler Formation (Component 4) is to provideseparation of water bearing units. The primary function of the upper Salado clay column(Component 8) is to limit groundwater flow down the shaft, thereby adding assurance that thereconsolidating salt column is protected. The lower Salado compacted clay column (Component12) will act as a barrier to brine and possibly to gas flow (see construction alternatives inAppendix B) soon after placement and remain a barrier throughout the regulatory period.
A2.2.2 Material Characteristics
The Rustler and Salado compacted clay columns will be constructed of a commercialwell-sealing grade sodium bentonite blocks compacted to between 1.8 and 2.0 g/cm . Anextensive experimental data base exists for the permeability of sodium bentonites under a variety
A-18

of conditions. Many other properties of sodium bentonite, such as strength, stiffness, andchemical stability also have been thoroughly investigated. Advantages of clays for sealingpurposes include low permeability, demonstrated longevity in many types of naturalenvironments, deformability, sorptive capacity, and demonstrated successful utilization inpractice for a variety of sealing purposes.
A variety of clays could be considered for WIPP sealing purposes. For WIPP, as for mostif not all nuclear waste repository projects, bentonite has been and continues to be a primecandidate as the clay sealing material. Bentonite clay is chosen here because of itsoverwhelming positive sealing characteristics. Bentonite is a highly plastic swelling claymaterial (e.g., Mitchell, 1993), consisting predominantly of smectite minerals (e.g., IAEA, 1990).Montmorillonite, the predominant smectite mineral in most bentonites, has the typical plate-likestructure characteristic of most clay minerals.
The composition of a typical commercially available sodium bentonite (e.g. Volclay,granular sodium bentonite) contains over 90% montmorillonite and small portions of feldspar,biotite, selenite, etc. A typical sodium bentonite has the chemical composition summarized inTable A-8 (American Colloid Company, 1995). This chemical composition is close to thatreported for MX-80 which was used successfully in the Stripa experiments (Gray, 1993).Sodium bentonite has a tri-layer expanding mineral structure of approximately (Al Fei 67 Mg033)Si4OI0 (OH2) Na+Ca++
0 33. Specific gravity of the sodium bentonite is about 2.5. The dry bulkdensity of granular bentonite is about 1.04 g/cm3.
Densely compacted bentonite (of the order of 1.75g/cm3), when confined, can generate aswelling pressure up to 20 MPa when permeated by water (IAEA, 1990). The magnitude of theswelling pressure generated depends on the chemistry of the permeating water. Laboratory andfield measurements suggest that the bentonite specified for shaft seal materials in the Salado mayachieve swell pressures of 3 to 4 MPa, and likely substantially less. Swelling pressure in thebentonite column is not expected to be appreciable because little contact with brine fluids isconceivable. Further considerations of potential swelling of bentonite within the RustierFormation may be appropriate, however. '
Table A-8. Representative Bentonite Composition.
Chemical Compound
SiO2
A12O3
FeAFeOMgO
Na2O
CaO
H2O
Trace Elements
Weight %
63.0
21.1
3.00.42.72.60.75.60.7
A-19
Mixtures of bentonite and water can range in rheological characteristics from a virtuallyNewtonian fluid to a stiff solid, depending on water content Bentonite can form stiff seals atlow moisture content, and can penetrate fractures and cracks when it has a higher water content.Under the latter conditions it can fill void space in the seal itself and disturbed rock zones.Bentonite with dry density of 1.75 g/cm3 has a cohesion of 5-50 kPa, and a friction angle of 5 to15° (IAEA, 1990). At density greater than 1.6-1.7 g/cm3, swelling pressure of bentonite is lessaffected by the salinity of groundwater providing better chemical and physical stabilities.
A2.2.3 Construction
Seal performance within the Salado Formation is far more important to regulatorycompliance than is performance of earthen fill in the overlying formations. Three potentialconstruction methods might be used to place clay in the shaft, as discussed in Appendix B.Construction of bentonite clay components specifies block assembly procedures demonstratedsuccessfully at the WDPP site (Knowles and Howard, 1996) and in a considerable body of workby Roland Pusch (see summary in Gray, 1993). To achieve low permeabilities, dry density ofthe bentonite blocks should be about 2.0 g/cm3, although a range of densities is discussed inSection 2.2.4. A high density of clay components is also desirable to carry the weight ofoverlying seal material effectively and to minimize subsidence.
Placement of clay in the shaft is one area of construction that might be made more costand time effective through optimization studies. An option to construct clay columns usingdynamic compaction will likely prove to be efficient, so it is specified for earthen fill in theDewey Lake Redbeds (as discussed later) and may prove to be an acceptable placement methodfor other components. Dynamic compaction would use equipment developed for placement ofcrushed salt. The Canadian nuclear waste program has conducted extensive testing, both in situand in large scale laboratory compaction of clay-based barrier materials with dynamichydraulically powered impact hammers (e.g., Kjartanson et al, 1992). The Swedish programsimilarly has investigated field compaction of bentonite-based tunnel backfill by means of platevibrators (e.g., Nilsson, 1985). Both studies demonstrated the feasibility of in situ compaction ofbentonite-based materials to a high density. Near surface, conventional compaction methods willbe used because insufficient space remains for dynamic compaction using the multi-deck workstage.
A2.2.4 Performance Requirements
The proven characteristics of bentonite assure attainment of very low permeability seals.It is recognized that the local environment contributes to the behavior of compacted claycomponents. Long-term material stability is a highly desired sealing attribute. Claycomponents located in brine environments will have to resist cation exchange and materialstructure alteration. Clay is geochemically mature, reducing likelihood of alteration andimbibition of brine is limited to isolated areas. Compacted clay is designed to withstand possiblepressure gradients and to resist erosion and channeling that could conceivably lead togroundwater flow through the seal. Compacted clay seal components support the shaft walls andpromote healing of the salt DRZ. Volume expansion or swelling would accelerate healing in thesalt. A barrier to gas flow could be constructed if moisture content of approximately 85% ofsaturation could be achieved.
A-20

Permeability of bentonite is inversely correlated to dry density. Figure A-3 plotsbentonite permeability as a function of reported sample density for sodium bentonite samples.The permeability ranges from approximately 1x10* l to 1 x 10"17 m2. In all cases, the data inFigure A-3 are representative of low ionic strength permeant waters. Data provided in this figureare limited to sodium bentonite and bentonite/sand mixtures with clay content greater than orequal to 50 %. Cheung et al. (1987) report that in bentonite/sand mixtures, sand acts as an inertfraction which does not alter the permeability of the mixture from that of a 100 % bentonitesample at the same equivalent dry density. Also included in Figure A-3 are the three point -estimates of permeability at dry densities of 1.4,1.8, and 2.1 g/cm3 provided by Jaak Daemen ofthe University of Nevada, Reno, who is actively engaged in WIPP-specific bentonite testing.
A series of in situ tests (SSSPTs) that evaluated compacted bentonite as a sealing materialat the WIPP site corroborate data shown in Figure A-3. Test Series D tested two 100 %bentonite seals in vertical boreholes within the Salado Formation at the repository horizon. Thediameter of each seal was 0.91 m, and the length of each seal was 0.91 m. Cores of the twobentonite seals had initial dry densities of 1.8 and 2.0 g/cm . Pressure differentials of 0.72 and0.32 MPa were maintained across the bentonite seals with a brine reservoir on the upstream(bottom) of the seals for several years.
Over the course of the seal test, no visible brine was observed at the downstream endofthe seals. Upon decommissioning the SSSPT, brine penetration was found to be only 15 cm.Determination of the absolute permeability of the bentonite seal was not precise; however, abounding calculation of 1 x 10' 9 m2 was made by Knowles and Howard (1996).
Beginning with a specified dry density of 1.8 to 2.0 g/cm3 and Figure A-3, a distributionfunction for clay permeability was developed and is provided in Figure A-4. Parameterdistribution reflects some conservative assumptions pertaining to WIPP seal applications. Thefollowing provide rationale behind the distribution presented in Figure A-4.
1. A practical minimum for the distribution can be specified at 1 x 10"21 m2.
2. If effective dry density of the bentonite emplaced in the seals only varies from 1.8 to 2.0g/cm3, then a maximum expected permeability can be extrapolated from Figure A-3 aslxlO"19m2.
3. Uncertainty exists in being able to place massive columns of bentonite to designspecifications. To address this uncertainty in a conservative manner, it is assumed that thecompacted clay be placed at a dry density as low as 1.6 g/cm3. At 1.6 g/cm3, the maximumpermeability for the clay would be approximately 5x10" 9 m2. Therefore, neglectingsalinity effects, a range of permeability from lxlO"21 to 5xlO'19 m2 with a best estimate ofless than 1 x 10"19 m 2 could be reasonably defined (assuming a best estimate emplacementdensity of 1.8 g/cm3). It could be argued, based on Figure A-3, that a best estimate couldbe as low as 2x10 m .
Salinity increases bentonite permeability; however, these effects are greatly reduced at thedensities specified for the shaft seal. At seawater salinity, Pusch et al. (1989) report the effectson permeability could be as much as a factor of 5 (one-half order of magnitude). To account forsalinity effects in a conservative manner, the maximum permeability is increased from 5xlO"19 to5xlO"18 m2. The best estimate permeability is increased by one-half order of magnitude to
A-21

5xlO'19 m2. The lower limit is held at lxlO"21 m2. Because salinity effects are greatest at lowerdensities, the maximum is adjusted one full order of magnitude while the best estimate (assumedto reside at a density of 1.8 g/cm3) is adjusted one-half of an order.
The four arguments presented above give rise to the permeability cumulative frequencydistribution plotted in Figure A-4, which summarizes the performance specification for bentonitecolumns.
1E-16
1E-17
1E-18
5 1E-19CD
1E-20
1E-21
1E-22
i i i i i i i i t i i [ i i i i i — ^ i i r
• Daemen Values
Literature Values
— — Approximate Range of Literature
Pusch and Borgesson (1989)
_ Pusch etal. (1989)
Pusch (1982)
, I , I , I , I , I , I , I , I t I , I .0.4 0.6 0.8 1.0 1.2 1.4 1.6 1.8 2.0 2.2 2.4 2.6
Reported Density (g/cm )
Figure A-3. Sodium bentonite permeability versus density.
TRI-6121-360-1
A-22

Q)
IIo
TRI-8121-361-0
Log Intrinsic Permeability (m )
Figure A-4. Cumulative frequency distribution for compacted bentonite.
A2.2.5 Verification Methods
Verification of specified properties such as density, moisture content or strength ofcompacted clay seals can be determined by direct access during construction. However, indirectmethods are preferred because certain measurements, such as permeability, are likely to be timeconsuming and invasive. Methods used to verify the quality of emplaced seals will includequality of block production and field measurements of density. As a minimum, standard qualitycontrol procedures recommended for compaction operations will be implemented includingvisual observation, in situ density measurements, and moisture content measurements. Visualobservation accompanied by detailed record keeping will assure design procedures are beingfollowed. In situ testing will confirm design objectives are accomplished in the field.
Density measurements of compacted clay shall follow standard procedures such asASTM D 1556, D 2167, and D 2922. The moisture content of clay blocks shall be calculatedbased'on the water added during mixing and can be confirmed by following ASTM Standardprocedures D 2216 and D 3017. It is probable that verification procedures will requiremodifications to be applicable within the shaft. As a minimum, laboratory testing to certify theabove referenced quality control measures will be performed to assure that the fieldmeasurements provide reliable results.
A-23

A2.3 Asphalt ComponentsAsphalt is used to prevent water migration down the shaft in two ways: an asphalt
column bridging the Rustler/Salado contact and a "waterstop" sandwiched between concreteplugs at three locations within the Salado Formation, two above the salt column and one belowthe salt column. An asphalt mastic mix (AMM) that contains aggregate is specified for thecolumn while the specification for the waterstop layer is pure asphalt.
Asphalt is a widely used construction material with many desirable properties. Asphalt isa strong cement, is readily adhesive, highly waterproof, and durable. Furthermore, it is a plasticsubstance that provides controlled flexibility to mixtures of mineral aggregates with which it isusually combined. It is highly resistant to most acids, salts, and alkalis. A number of asphaltsand asphalt mixes are available that cover a wide range of viscoelastic properties which allowsthe properties of the mixture to be designed for a wide range of requirements for eachapplication. These properties are well suited to the requirements of the WIPP shaft seal system.
A2.3.1 FunctionsThe generic purpose of asphalt seal components above the salt column is to eliminate
water migration downward. The asphalt waterstops above the salt column are designed tointersect the DRZ and limit fluid flow. Asphalt is not the lone component preventing flow ofbrine downward; it functions in tandem with concrete and a compacted clay column. WaterstopComponent #11 located below the salt column would naturally limit upward flow of brine orgas. Concrete abutting the asphalt waterstops provides a rigid element that creates a backstressupon the inward creeping salt, promoting healing within the DRZ. Asphalt is included in theWIPP shaft seal system to reduce uncertainty of system performance by providing redundancy offunction while using an alternative material type. The combination of shaft seal componentsrestricts fluid flow up or down to allow time for the salt column to reconsolidate and form anatural fluid-tight seal.
The physical and thermal attributes of asphalt combine to reduce fluid flow processes.The placement fluidity permits asphalt to flow into uneven interstices or fractures along the shaftwall. Asphalt will self-level into a nearly voidless mass. As it cools, the asphalt will eventuallycease flowing. The elevated temperature and thermal mass of the asphalt will enhance creepdeformation of the salt and promote healing of the DRZ surrounding the shaft. Asphalt adherestightly to most materials, eliminating flow along the interface between the seal material and thesurrounding rock.
A2.3.2 Material Characteristics
The asphalt column specified for the WIPP seal system is an AMM commonly used forhydraulic structures. The AMM is a mixture of asphalt, sand, and hydrated lime. The asphaltcontent of AMM is higher than those used in typical hot mix asphalt concrete (pavements). Highasphalt contents (10-20% by weight) and fine, well-graded aggregate (sand and mineral fillers)are used to obtain a near voidless mix. A low void content ensures a material with extremely lowwater permeability because there are a minimum number of connected pathways for brinemigration.
A-24

A number of different asphaltic construction materials, including hot mix asphalt concrete(HMAC), neat asphalt, and AMMs, were evaluated for use in the WIPP seal design. HMAC waseliminated because of construction difficulty that might have led to questionable performance.An AMM is selected as a preferred alternative for the asphalt columns because it has economicand performance advantages over the other asphaltic options. Aggregate and mineral fines in theAMM increase rigidity and strength of the asphalt seal component, thereby enhancing thepotential to heal the DRZ and reducing shrinkage relative to neat asphalt.
Viscosity of the AMM is an important physical property affecting construction and"performance. The AMM is designed to have low enough viscosity to be pumpable at applicationtemperatures and able to flow readily into voids. High viscosity of the AMM at operatingtemperatures prevents long-term flow, although none is expected. Hydrated lime is included inthe mix design to increase the stability of the material, decrease moisture susceptibility, and actas an anti-microbial agent. Table A-9 details the mix design specifications for the AMM.
The asphalt used in the waterstop is AR-4000, a graded asphalt of intermediate viscosity.The waterstop uses pure, or neat, asphalt because it is a relatively small volume when comparedto the column.
A2.3.3 Construction
Construction of asphalt seal components can be accomplished using a slickline processwhere the molten material is effectively pumped into the shaft. The AMM will be mixed atground level in a pug mill at approximately 180°C. At this temperature the material is readilypourable. The AMM will be slicklined and placed using a heated and insulated tremie line. TheAMM will easily flow into irregularities in the surface of the shaft or open fractures until theAMM cools. After cooling, flow into surface irregularities in the shaft and DRZ will slowconsiderably because of the sand and mineral filler components in the AMM and the temperaturedependence of the viscosity of the asphalt. AMM requires no compaction in construction. Neatasphalt will be placed in a similar fashion.
The technology to pump AMM is available as described in the construction procedures inAppendix B. One potential problem with this method of construction is ensuring that theslickline remains heated throughout the construction phase. Impedance heating (a currentconstruction technique) can be used to ensure the pipe remains at temperatures sufficient topromote flow. The lower section (say 10 m) of the pipe may not need to be heated, and it maynot be desirable to heat it as it is routinely immersed in the molten asphalt during construction tominimize air entrainment. Construction using large volumes of hot asphalt would be facilitatedby placement in sections. After several meters of asphalt are placed, the slickline would beretracted by two lengths of pipe and pumping resumed. Once installed, the asphalt componentswill cool; the column will require several months to approach ambient conditions. Calculationsof cooling times and plots of isotherms for the asphalt column are given in Appendix D. Itshould be noted that a thermal pulse into the surrounding rock salt could produce positive rockmechanics conditions. Fractures will heal much faster owing to thermally activated dislocationmotion and diffusion. Salt itself will creep inward at a much greater rate as well.
A-25

Table A-9. Asphalt Component Specifications
AMM Composition: 20 wt% asphalt (AR-4000 graded asphalt)70 wt% aggregate (silicate sand)10 wt% hydrated lime
Aggregate(% passing by weight)
US Sieve Size Specification Limits
2.36 mm (No: 8) 100
1.18 mm (No. 16) 90
600 (No. 30) 55-75
300 (No. 50) 35-50
150 (No. 100) 15-30
75 (No. 200) ' 5-15
Mineral Filler: Hydrated Lime Chemical Composition:Total active lime content (% by weight) min. 90.0%Unhydrated lime weight (% by weight CaO) max. 5.0%Free water (% by weight H2O) max. 4.0%
Residue Analysis:Residue retained on No. 6 sieve max. 0.1%Residue retained on No. 30 sieve max. 3.0%
A2.3.4 Performance Requirements
Asphalt components are required to endure for about 100 years as an interim seal whilethe compacted salt component reconsolidates to create a very low permeability seal component.Since asphalt will not be subjected to ultraviolet light or an oxidizing environment, it is expectedto provide an effective brine seal for several centuries. Air voids should be less than 2% toensure low permeability. Asphalt mixtures do not become measurably permeable to water untilvoids approach 8% (Brown, 1990).
At Hanford, experiments are ongoing on the development of a passive surface barrierdesigned to isolate wastes (in this case to prevent downward flux of water and upward flux ofgases) for 1000 years with no maintenance. The surface barrier uses asphalt as one of manyhorizontal components because low-air-void, high-asphalt-content materials are noted for lowpermeability and improved mechanically stable compositions. The design objective of thisasphalt concrete was to limit infiltration to 1.6*10"9 cm/s (1.6X10'11 m/s, or for fresh water, anintrinsic permeability of 1.6*10"18 m2). The asphalt component of the barrier is composed of a15 cm layer of asphaltic concrete overlain with a 5-mm layer of fluid-applied asphalt. Thereported hydraulic conductivity of the asphalt concrete is estimated to be 1 xlO"9 m/s (equivalent
A-26
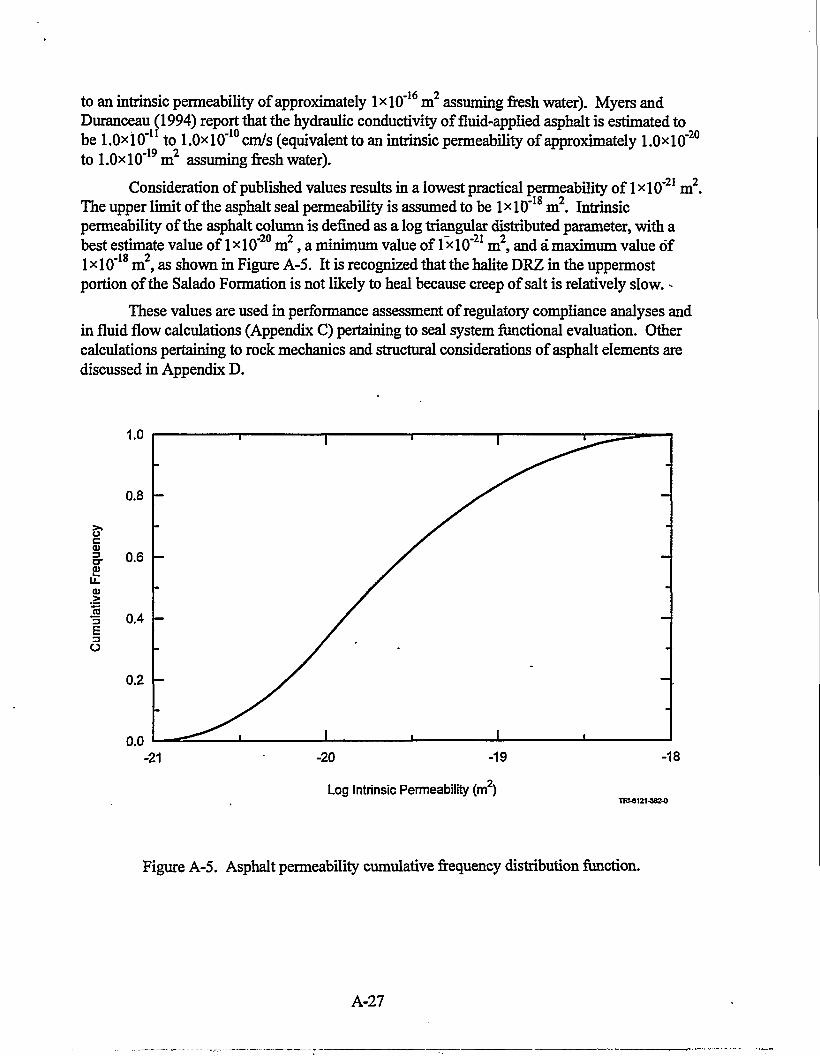
to an intrinsic permeability of approximately lxlO'16 m2 assuming fresh water). Myers andDuranceau (1994) report that the hydraulic conductivity of fluid-applied asphalt is estimated tobe l.OxiO'11 to 1.0xl0"10cm/s (equivalent to an intrinsic permeability of approximately l.OxlO"20
assuming fresh water).tol.0xl0*19m2
Consideration of published values results in a lowest practical permeability of 1 xlO*21 m2
The upper limit of the asphalt seal permeability is assumed to be lxlO"18 m2. Intrinsicpermeability of the asphalt column is defined as a log triangular distributed parameter, with abest estimate value of 1 x 10" m 2 , a minimum value of 1 x 10"21 m2, and a maximum value of1 x 10"18 m2, as shown in Figure A-5. It is recognized that the halite DRZ in the uppermostportion of the Salado Formation is not likely to heal because creep of salt is relatively slow. -
These values are used in performance assessment of regulatory compliance analyses andin fluid flow calculations (Appendix C) pertaining to seal system functional evaluation. Othercalculations pertaining to rock mechanics and structural considerations of asphalt elements arediscussed in Appendix D.
Log Intrinsic Permeability (m )TRI-8121-382-0
Figure A-5. Asphalt permeability cumulative frequency distribution function.
A-27

A2.3.5 Verification Methods
Viscosity of the AMM must be low enough for easy delivery through a heated slickline.Sufficient text book information is available to assure performance of the asphalt component;however, laboratory validation tests may be desirable before installation. There are no plans totest asphalt components after they are placed. With that in mind, some general tests identifiedbelow would add quantitative documentation to expected performance values and have directapplication to WIPP. The types and objectives of the verification tests are:
Mix Design. A standard mix design which evaluates a combination of asphalt and aggregatemixtures would quantify density, air voids, viscosity, and permeability. Although thespecified mixture will function adequately, studies could optimize the mix design.
Viscoelastic Properties at Service Temperatures. Viscoelastic properties over the range ofexpected service temperatures would refine the rheological model.
Accelerated Aging Analysis. Asphalt longevity issues could be further addressed by using theapproach detailed in PNL-Report 9336 (Freeman and Romine, 1994).
Brine Susceptibility Analysis. The presumed inert nature of the asphalt mix can bedemonstrated through exposure to groundwater brine solutions found in the Salado Formation.Potential for degradation will be characterized by monitoring the presence of asphaltdegradation products in WIPP brine or brine simulant as a function of time. Effects onhydraulic conductivity can be measured during these experiments.
A2.4 Compacted Salt Column
A reconstituted salt column has been proposed as a primary means to isolate for severaldecades those repositories containing hazardous materials situated in evaporite sequences. Reuseof salt excavated in the process of creating the underground openings has been advocated sincethe initial proposal by the NAS in the 1950s. Replacing the natural material to its original settingensures physical, chemical, and mechanical compatibility with the host formation. Recentdevelopments in support of the WIPP shaft seal system have produced confirming experimentalresults, constitutive material laws, and construction methods that substantiate use of a saltcolumn for a low permeability, perfectly compatible seal component.
Numerical models of the shaft and seal system have been used to provide information onthe mechanical processes that affect potential pathways and overall performance of the sealsystem. Several of these types of analyses are developed in Appendix D. Simulations of theexcavated shaft and the compacted salt seal element behavior after placement show that as tunepasses, the host salt creeps inward, the compacted salt is loaded by the host formation andconsolidates, and a back pressure is developed along the shaft wall. The back pressure impartedto the host formation by the compacted salt promotes healing of any microcracks in the hostrock. As compacted salt consolidates, density and stiffness increase and permeability decreases.
A2.4.1 Functions
The function of the compacted and reconsolidated salt column is to limit transmission offluids into or out of the repository for the statutory period of 10,000 years. The functional period
A-28
starts within a hundred years and lasts essentially forever. After a period of consolidation, thesalt column will almost completely retard gas or brine migration within the former shaft opening.A completely consolidated salt column will achieve flow properties indistinguishable fromnatural Salado salt.
A2.4.2 Material Characteristics
The salt component comprises crushed Salado salt with addition of small amounts ofwater. No admixtures other than water are needed to meet design specifications. Natural Saladosalt (also called WIPP salt) is typical of most salts in the Permian Basin: it has an overallcomposition approaching 90-95 % halite with minor clays, carbonate, anhydrite, and other halite =minerals. Secondary minerals and other impurities are of little consequence to construction orperformance of the compacted salt column as long as the halite content is approximately 90 %.
The total water content of the crushed salt should be approximately 1.5 wt% as it istamped into place. Field and laboratory testing verified that natural salt can be compacted tosignificant density (p > 0.9) with addition of these modest amounts of water. In situ WIPP saltcontains approximately 0.5 wt% water. After it is mined, transported, and stored, some of theconnate water is lost to evaporation and dehydration. Water content of the bulk material thatwould be used for compaction in the shaft is normally quite small, on the order of 0.25-wt%, asmeasured during compaction demonstrations (Hansen and Ahrens, 1996). Measurements ofwater content of the salt will be necessary periodically during construction to calibrate the properamount of water to be added to the salt as it is placed.
Water added to the salt will be sprayed in a fine mist onto the crushed salt as it is cast ineach lift. Methods similar to those used in the large-scale compaction demonstration will bedeveloped such that the spray visibly wets the salt grain surfaces. General uniformity of spray isdesired. The water has no special chemical requirements for purity. It can be of high quality(drinkable) but need not be potable. Brackish water would suffice because water of any qualitywould become brackish upon application to the salt.
The mined salt will be crushed and screened to a nominal maximum diameter of 5 mm.Gradation of particles smaller than 5 mm is not of concern because the crushing process willcreate relatively few fines compared to the act of dynamic compaction. Based on preliminarylarge-scale demonstrations, excellent compaction was achieved without optimization of particlesizes. It is evident from results of the large compaction demonstration coupled with laboratorystudies that initial density can be increased and permeability decreased beyond existing favorableresults. Further demonstrations of techniques, including crushing and addition of water may beundertaken in ensuing years between compliance certification and beginning of seal placement.
A2.4.3 Construction
Dynamic compaction is the specified procedure to tamp crushed salt in the shaft. Othertechniques of compaction have potential, but their application has not been demonstrated. Deepdynamic compaction provides the greatest energy input to the crushed salt, is easy to apply, andhas an effective depth of compactive influence far greater than lift thickness. Dynamiccompaction is relatively straightforward and requires a minimal work force. If the number ofdrops remains constant, diameter and weight of the tamper increases in proportion to the
A-29

diameter of the shaft. The weight of the tamper is a factor in design of the infrastructuresupporting the hoisting apparatus. Larger, heavier tampers require equally stout staging. Theconstruction method outlined in Appendix B balances these opposing criteria. Compaction itselfwill follow the successful procedure developed in the large-scale compaction demonstration(Hansen and Ahrens, 1996).
Transport of crushed salt to the working level can be accomplished by dropping it down aslickline. As noted, additional water will be sprayed onto the crushed salt at the bottom of theshaft as it is placed. Lift heights of approximately 2 m are specified, though greater depths couldbe compacted effectively using dynamic compaction. Uneven piles of salt can be hand leveled.
A2.4.4 Performance Requirements
Compacted crushed salt is a unique seal material because it consolidates naturally as thehost formation creeps inward. As the crushed salt consolidates, void space diminishes, densityincreases, and permeability decreases. Thus, sealing effectiveness of the compacted salt columnwill improve with time. Laboratory testing over the last decade has shown that pulverized saltspecimens can be compressed to high densities and low permeabilities (Brodsky et al., 1996). Inaddition, consolidated crushed salt uniquely guarantees chemical and mechanical compatibilitywith the host salt formation. Therefore, crushed salt will provide a seal that will functionessentially forever once the consolidation process is completed. Primary performance results ofthese analyses include plots of fractional density as a function of depth and time for the crushedsalt column and permeability distribution functions that will be used for performance assessmentcalculations. These performance results are summarized near the end of this section, following alimited background discussion.
To predict performance, a constitutive model for crushed salt is required. To this end, atechnical evaluation of potential crushed salt constitutive models was completed (Callahan et al.,1996). Ten potential crushed salt constitutive models were identified in a literature search todescribe the phenomenological and micromechanical processes governing consolidation ofcrushed salt. Three of the ten potential models were selected for rigorous comparisons to aspecially developed, although somewhat limited, database. The database contained data fromhydrostatic and shear consolidation laboratory experiments. The experiments providedeformation (strain) data as a function of time under constant stress conditions. Based onvolumetric strain measurements from experiments, change in crushed salt density and porosityare known. In some experiments, permeability was also measured, which provides a relationshipbetween density and permeability of crushed salt. Models were fit to the experimental databaseto determine material parameter values and the model that best represents experimental data.
• Modeling has been used to predict consolidating salt density as a function of time andposition in the shaft. Position or depth of the calculation is important because creep rates ofintact salt and crushed salt are strong functions of stress difference. Analyses made use of a"pineapple" slice structural model at the top (430 m), middle (515 m), and bottom (600 m) ofthe compacted salt column. Initial fractional density of the compacted crushed salt was 0.90(1944 kg m"3). The structural model, constitutive material models, boundary conditions, etc. aredescribed in Appendix D. Modeling results coupled with laboratory-determined relationships
A-30
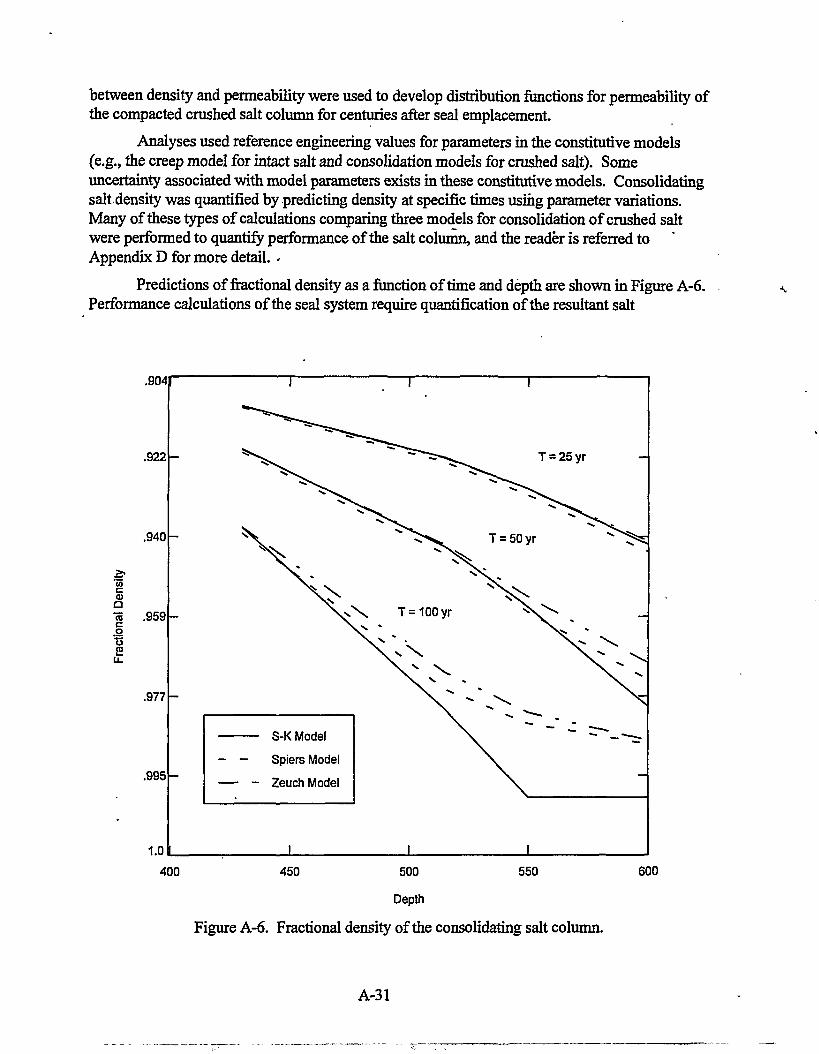
between density and permeability were used to develop distribution functions for permeability ofthe compacted crushed salt column for centuries after seal emplacement.
Analyses used reference engineering values for parameters in the constitutive models(e.g., the creep model for intact salt and consolidation models for crushed salt). Someuncertainty associated with model parameters exists in these constitutive models. Consolidatingsalt density was quantified by predicting density at specific times using parameter variations.Many of these types of calculations comparing three models for consolidation of crushed saltwere performed to quantify performance of the salt column, and the reader is referred toAppendix D for more detail. -
Predictions of fractional density as a function of time and depth are shown in Figure A-6.Performance calculations of the seal system require quantification of the resultant salt
CO
<uQ"Hi. o•32
.904
.922
.940
.959
.977
.995
10
I
^ ^ ^ ^
—
—
S-K Model
— — Spiers Model
— - Zeuch Model
I
T=100yr
\ >
\
I
I
T = 25yr
T = 50yr ^ ^ = ?
i
400 450 500
Depth
550 600
Figure A-6. Fractional density of the consolidating salt column.
A-31

permeability. The permeability can be derived from the experimental data presented in FigureA-7. This plot depicts probabilistic lines through the experimental data. From theselineSjdistribution functions can be derived. Permeability of the compacted salt column is treatedas a transient random variable defined by a log triangular distribution. Distribution functionswere provided for 0,50,100,200, and 400 years after seal emplacement, assuming that fluids inthe salt column pores spaces would not produce a backstress. The resultant cumulativefrequency distribution for seal permeability at the seal mid-height is shown in Figure A-8. Thismethod predicts permeabilities ranging from lxlO"23 m2 to l*10"16 m2. Because crushed saltconsolidation will be affected by both mechanical and hydrological processes, detailedcalculations were performed. These calculations are presented in Appendices C and D.
1E-06
1E-10
1E-14
^J3CO
£. 1E-18
1E-22
1E-26
• ' • ' • : - x ^ ^ •
B MeasuredBest Fit1% Predictor Umit
5% Predictor Limit10% Predictor Limit90% Predictor Umit95% Predictor Limit99% Predictor limit
^ ^ ^ ' " * • ' •
0.82 0.84 0.86 0.88 0.90 0.92 0.94 0.96 0.98 1.00 1.02
Dry Fractional Density
Figure A-7. Permeability of consolidated crushed salt as a function of fractional density.
A-32
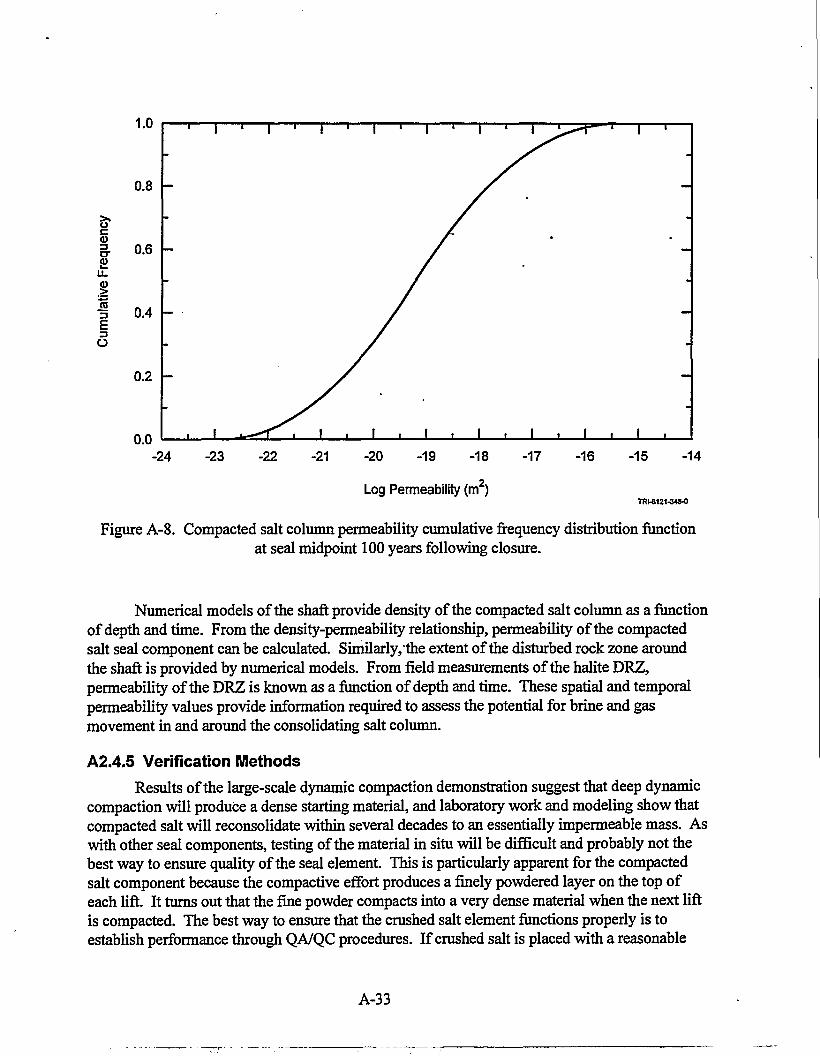
§
.1=1|
O
Log Permeability (m )TR1-6121-34S-0
Figure A-8. Compacted salt column permeability cumulative frequency distribution functionat seal midpoint 100 years following closure.
Numerical models of the shaft provide density of the compacted salt column as a functionof depth and time. From the density-permeability relationship, permeability of the compactedsalt seal component can be calculated. Similarly, the extent of the disturbed rock zone aroundthe shaft is provided by numerical models. From field measurements of the halite DRZ,permeability of the DRZ is known as a function of depth and time. These spatial and temporalpermeability values provide information required to assess the potential for brine and gasmovement in and around the consolidating salt column.
A2.4.5 Verification Methods
Results of the large-scale dynamic compaction demonstration suggest that deep dynamiccompaction will produce a dense starting material, and laboratory work and modeling show thatcompacted salt will reconsolidate within several decades to an essentially impermeable mass. Aswith other seal components, testing of the material in situ will be difficult and probably not thebest way to ensure quality of the seal element. This is particularly apparent for the compactedsalt component because the compactive effort produces a finely powdered layer on the top ofeach lift. It turns out that the fine powder compacts into a very dense material when the next liftis compacted. The best way to ensure that the crushed salt element functions properly is toestablish performance through QA/QC procedures. If crushed salt is placed with a reasonable
A-33

uniformity of water and is compacted with sufficient energy, long-term performance can beassured.
Periodic measurements of the water content of loose salt as it is placed in lifts will beused for verification and quality control. Thickness of lifts will be controlled. Energy impartedto each lift will be documented by logging drop patterns and drop height. If deemed necessary,visual inspection of the tamped salt can be made by human access. The powder layer can beshoveled aside and hardness of underlying material can be qualitatively determined or tested.Overall geometric measurements made from the original surface of each lift could be used toapproximate compacted density.
A2.5 Cementitious Grout
Cementitious grouting is specified for all concrete members in response to externalreview suggestions. Grouting is also used in advance of liner removal to stabilize the ground.Cementitious grout is specified because of its proven performance, nontoxicity, and previous useattheWIPP.
A2.5.1 Functions
The function of grout is to stabilize the surrounding rock before existing concrete linersare removed. Grout will fill fractures within adjacent lithologies, thereby adding strength andreducing permeability. Grout around concrete members of the concrete asphalt waterstop will beemployed in an attempt to tighten the interface and fill microcracks in the DRZ. Efficacy ofgrouting will be determined during construction. In addition, reduction of local permeability willfurther limit groundwater influx into the shaft during construction. Concrete plugs are plannedfor specific elevations in the lined portion of each shaft. The formation behind the concrete linerwill be grouted from approximately 3 m below to 3 m above the plug positions to ensure stabilityof any loose rock.
A2.5.2 Material Characteristics
The grout developed for use in the shaft seal system has the following characteristics:
• no water separation upon hydration,
• low permeability paste,
• fine particle size,
• low hydrational heat,
• no measurable agglomeration subsequent to mixing,
• two hours of injectability subsequent to mixing,
• short set time,
• high compressive strength, and
• competitive cost.
A cementitious grout developed by Ahrens and coworkers (Ahrens et al., 1996) isspecified for application in the shaft seal design. This grout consists of portland cement, pumice
A-34

as a pozollanic material, and superplasticizer in the proportions listed in Table A-10. Theultrafine grout is mixed in a colloidal grout mixer, with a water to components ratio (W:C) of0.6:1. Grout has been produced with 90 % of the particles smaller than 5 microns and an averageparticle size of 2 microns. The extremely small particle size enables the grout to penetratefractures with apertures as small as 6 microns.
Table A-10. Ultrafine Grout Mix Specification
Component
Type 5 portland cement
Pumice
Superplasticizer
Weight Percent (wt%)
45
55
1.5
A2.5.3 Construction
Grout holes will be drilled in a spin pattern that extends from 3 m below to 3 m abovethat portion of the lining to be removed. The drilling and grouting sequence will be defined inthe workmanship specifications prior to construction. Grout will be mixed on surfaceand _ .transferred to thw work deck via the slick line. Maximum injection pressure will be lithostatic,"less 50 psig. It is estimated that four holes can be drilled and grouted per shift.
A2.5.4 Performance Requirements
Performance of grout is not a consideration for compliance issues. Grouting is used tofacilitate construction by stabilizing any loose rock behind the concrete liner. If the country rockis fractured, grouting will reduce the permeability of the DRZ significantly. Application at theWIPP demonstrated permeability reduction in an anhydrite marker bed of two to three orders ofmagnitude (Ahrens et al., 1996). Reduction of local permeability adds to longevity of the groutitself and reduces the possibility of brine contacting seal elements. Because grout does notinfluence compliance issues, a model for it is not used and has not been developed. Generalperformance achievements are:
• filled fractures as small as 6 microns,
• no water separation upon hydration,
• no evidence of halite dissolution,
• no measurable agglomeration subsequent to mixing,
• one hour of injectability,
• initial Vicat needle set in 2.5 hours,
• compressive strength 40 MPa at 28 days, and
• competitive cost.
A-35

A2.5.5 Verification Methods
No verification of the effectiveness of grouting is currently specified. If injection aroundconcrete plugs is possible, an evaluation of quantities and significance of grouting will be madeduring construction. Procedural specifications will include measurements of fineness anddetermination of rheology in keeping with processes established during the WIPP demonstrationgrouting (Ahrens et al., 1996).
A2.6 Earthen Fill
Compacted earthen fill comprise approximately 150 m of shaft fill in the Dewey LakeRedbeds and near surface stratigraphy.
A2.6.1 Functions
There are minimal performance requirements imposed for Components 1 and 3 and nonethat affect regulatory compliance of the site. Specifications for Components 1 and 3 are general:fill the shaft with relatively dense material to reduce subsidence.
A2.5.2 Material Characteristics
Fill can utilize material that was excavated during shaft sinking and stored at the WIPPsite, or a borrow pit may be excavated to secure fill material. The bulk fill material may includebentonite additive, if deemed appropriate.
A2.5.3 Construction
Dynamic compaction is specified for the clay column in the Dewey Lake Formationbecause of its perceived expediency. Vibratory compaction will be used near surface when thereis no longer space for the three stage construction deck.
A2.5.4 Performance Requirements
Care will be taken to compact the earthen fill with an energy of twice Modified Proctorenergy, which has been shown to produce a dense, uniform fill.
A2.5.6 Verification
Materials placed will be documented, with density measurements as appropriate.
A3. CONCLUDING REMARKS
Material specifications in this appendix provide descriptions of seal materials along withreasoning about why they are expected to function well in the WIPP setting. The specificationfollows a framework that states the function of the seal component, a description of the material,and a summary of construction techniques that could be implemented without resorting toextensive development efforts. Discussion of performance requirements for each material is themost detailed section because design of the seal system requires analysis of performance toascertain compliance with regulations. Successful design of the shaft seal system is
A-36

demonstrated by an evaluation of how well the design performs, rather than by comparison witha predetermined quantity.
Materials chosen for use in the shaft seal system have several common desirableattributes: low permeability, availability, high density, longevity, low cost, constructability, andsupporting documentation. Functional redundancy using different materials provides aneconomically and technologically feasible shaft seal system that limits fluid transport.
A4. REFERENCESAhrens, E.H., T.F. Dale, and R.S. Van Pelt 1996. Data Report on the Waste Isolation Pilot
Plant Small-Scale Seal Performance Test, Series F Grouting Experiment. SAND93-1000.Albuquerque, NM: Sandia National Laboratories. (Copy on file in the Sandia WIPP CentralFiles, Sandia National Laboratories, Albuquerque, NM [SWCF] as WPO37355.)
American Colloid Company. 1995. "Technical Data Sheet. Volclay GPG 30." Arlington Heights,IL: Industrial Chemical Division, American Colloid Company. 1 p. (Copy on file in theSWCF as WPO39636.) .
American Petroleum Institute. 1990. "Specification for Materials and Testing for Well Cements."API Specification 10. 5th ed. Washington, DC: American Petroleum Institute. (Availablefrom American Petroleum Institute, 1220 L St. NW, Washington, DC 20005,202/682-8375.)
ASTM C 33 - 93. "Specification for Concrete Aggregates," Annual Book of ASTMStandards,Volume 04.02, Concrete and Aggregates. Philadelphia, PA: American Society for Testingand Materials. (Available from American Society for Testing and Materials, 1916 RaceStreet, Philadelphia, PA 19103-1187,215/299-5400.)
ASTM C 39 - 94. "Test Method for Compressive Strength of Cylindrical Concrete Specimens,"Annual Book of ASTMStandards, Volume 04.02, Concrete and Aggregates. Philadelphia,PA: American Society for Testing and Materials. (Available from American Society forTesting and Materials, 1916 Race Street, Philadelphia, PA 19103-1187,215/299-5400.)
ASTM C 40 - 92. "Test Method for Organic Impurities in Fine Aggregates for Concrete," AnnualBook of ASTMStandards, Volume 04.02, Concrete and Aggregates. Philadelphia, PA:American Society for Testing and Materials. (Available from American Society for Testingand Materials, 1916 Race Street, Philadelphia, PA 19103-1187,215/299-5400.)
ASTM C 114 - 94. "Test Methods for Chemical Analysis of Hydraulic Cement," Annual Book ofASTM Standards, Volume 04.01, Cement; Lime; Gypsum. Philadelphia, PA: AmericanSociety for Testing and Materials. (Available from American Society for Testing andMaterials, 1916 Race Street, Philadelphia, PA 19103-1187,215/299-5400.)
ASTM C 117 - 95. "Test Method for Material Finer Than 75-(im (No. 200) Sieve in MineralAggregates by Washing," Annual Book of 'ASTM Standards, Volume 04.02, Concrete andAggregates. Philadelphia, PA: American Society for Testing and Materials. (Available fromAmerican Society for Testing and Materials, 1916 Race Street, Philadelphia, PA 19103-1187,215/299-5400.)
A-37

ASTM C 123 - 94. "Test Method for Lightweight Pieces in Aggregate," Annual Book ofASTMStandards, Volume 04.02, Concrete and Aggregates. Philadelphia, PA: American Societyfor Testing and Materials. (Available from American Society for Testing and Materials,1916 Race Street, Philadelphia, PA 19103-1187,215/299-5400.)
ASTM C 127 - 88 (1993). "Test Method for Specific Gravity and Absorption of CoarseAggregate," Annual Book of ASTM Standards, Volume 04.02, Concrete and Aggregates.Philadelphia, PA: American Society for Testing and Materials. (Available from AmericanSociety for Testing and Materials, 1916 Race Street," Philadelphia, PA 19103-1187, "215/299-5400.)
ASTM C 128 - 93. "Test Method for Specific Gravity and Absorption of Fine Aggregate,"Annual Book of ASTM Standards, Volume 04.02, Concrete and Aggregates. Philadelphia,PA: American Society for Testing and Materials. (Available from American Society forTesting and Materials, 1916 Race Street, Philadelphia, PA 19103-1187,215/299-5400.)
ASTM C 131 - 89. "Test Method for Resistance to Degradation of Small-Size Coarse Aggregateby Abrasion and Impact in the Los Angeles Machine," Annual Book of ASTM Standards,Volume 04.02, Concrete and Aggregates. Philadelphia, PA: American Society for Testingand Materials. (Available from American Society for Testing and Materials, 1916 RaceStreet, Philadelphia, PA 19103-1187,215/299-5400.)
ASTM C 136 - 95a. "Test Method for Sieve Analysis of Fine and Coarse Aggregates," AnnualBook of ASTM Standards, Volume 04.02, Concrete and Aggregates. Philadelphia, PA:American Society for Testing and Materials. (Available from American Society for Testingand Materials, 1916 Race Street, Philadelphia, PA 19103-1187,215/299-5400.)
ASTM C 138 - 92. "Test Method for Unit Weight, Yield, and Air Content (Gravimetric) ofConcrete," Annual Book ofASTMStandards, Volume 04.02, Concrete and Aggregates.Philadelphia, PA: American Society for Testing and Materials. (Available from AmericanSociety for Testing and Materials, 1916 Race Street, Philadelphia, PA 19103-1187,215/299-5400.)
ASTM C 142 - 78 (1990). "Test Method for Clay Lumps and Friable Particles in Aggregates,"Annual Book of ASTM Standards, Volume 04.02, Concrete and Aggregates. Philadelphia,PA: American Society for Testing and Materials. (Available from American Society forTesting and Materials, 1916 Race Street, Philadelphia, PA 19103-1187,215/299-5400.)
ASTM C 143 - 90a. "Test Method for Slump of Hydraulic Cement Concrete," Annual Book ofASTM Standards, Volume 04.02, Concrete and Aggregates. Philadelphia, PA: AmericanSociety for Testing and Materials. (Available from American Society for Testing andMaterials, 1916 Race Street, Philadelphia, PA 19103-1187,215/299-5400.)
ASTM C 150 - 95. "Specification for Portland Cement," Annual Book of ASTM Standards,Volume 04.01, Cement; Lime; Gypsum. Philadelphia, PA: American Society for Testing andMaterials. (Available from American Society for Testing and Materials, 1916 Race Street,Philadelphia, PA 19103-1187,215/299-5400.)
A-38

ASTM C 157 - 93. "Test Method for Length Change of Hardened Hydraulic-Cement Mortar andConcrete"Annual Book of'ASTMStandards, Volume 04.02, Concrete and Aggregates.Philadelphia, PA: American Society for Testing and Materials. (Available from AmericanSociety for Testing and Materials, 1916 Race Street, Philadelphia, PA 19103-1187,215/299-5400.)
ASTM C 204 - 94a. "Test Method for Fineness of Hydraulic Cementby Air PermeabilityApparatus," Annual Book of ASTMStandards, Volume 04.01, Cement; Lime; Gypsum.Philadelphia, PA: American Society for Testing and'Materials. (Available from AmericanSociety for Testing and Materials, 1916 Race Street, Philadelphia, PA 19103-1187,215/299-5400.)
ASTM C 231 - 91b. "Test Method for Air Content of Freshly Mixed Concrete by the PressureMethod,"Annual Book of'ASTMStandards, Volume 04.02, Concrete and Aggregates.Philadelphia, PA: American Society for Testing and Materials. (Available from AmericanSociety for Testing and Materials, 1916 Race Street, Philadelphia, PA 19103-1187,215/299-5400.)
ASTM C 294 - 86 (1991). "Descriptive Nomenclature for Constituents of Natural MineralAggregates," Annual Book of'ASTMStandards, Volume 04.02, Concrete and Aggregates.Philadelphia, PA: American Society for Testing and Materials. (Available from American.Society for Testing and Materials, 1916 Race Street, Philadelphia, PA 19103-1187,215/299-5400.)
ASTM C 295 - 90. "Guide for Petrographic Examination of Aggregates for Concrete," AnnualBook of ASTM Standards, Volume 04.02, Concrete and Aggregates. Philadelphia, PA:American Society for Testing and Materials. (Available from American Society for Testingand Materials, 1916 Race Street, Philadelphia, PA 19103-1187,215/299-5400.)
ASTM C 311 - 94b. "Test Methods for Sampling and Testing Fly Ash or Natural Pozzolans forUse as a Mineral Admixture in Portland-Cement Concrete," Annual Book of ASTMStandards, Volume 04.02, Concrete and Aggregates. Philadelphia, PA: American Societyfor Testing and Materials. (Available from American Society for Testing and Materials,1916 Race Street, Philadelphia, PA 19103-1187,215/299-5400.)
ASTM C 469 - 94. "Test Method for Static Modulus of Elasticity and Poisson's Ratio ofConcrete in Compression," Annual Book of 'ASTMStandards, Volume 04.02, Concrete andAggregates. Philadelphia, PA: American Society for Testing and Materials. (Available fromAmerican Society for Testing and Materials, 1916 Race Street, Philadelphia, PA 19103-1187,215/299-5400.)
ASTM C 534 - 94. "Specification for Preformed Flexible Elastomeric Cellular ThermalInsulation in Sheet and Tubular Form," Annual Book of ASTM Standards, Volume 04.06,Thermal Insulation; Environmental Acoustics. Philadelphia, PA: American Society forTesting and Materials. (Available from American Society for Testing and Materials, 1916Race Street, Philadelphia, PA 19103-1187,215/299-5400.)
A-39

ASTM C 535 - 89. "Test Method for Resistance to Degradation of Large-Size Coarse Aggregateby Abrasion and Impact in the Los Angeles Machine," Annual Book of ASTM Standards,Volume 04.02, Concrete and Aggregates. Philadelphia, PA: American Society for Testingand Materials. (Available from American Society for Testing and Materials, 1916 RaceStreet, Philadelphia, PA 19103-1187,215/299-5400.)
ASTM C 566 - 95. "Test Method for Total Moisture Content of Aggregate by Drying," AnnualBook of ASTM Standards, Volume 04.02, Concrete and Aggregates. Philadelphia, PA:American Society for Testing and Materials. (Available from American Society for Testingand Materials, 1916 Race Street, Philadelphia, PA 19103-1187,215/299-5400.)
ASTM C 618 - 95. "Specification for Coal Fly Ash and Raw or Calcined Natural Pozzolan forUse as a Mineral Admixture in Portland Cement Concrete," Annual Book of ASTMStandards, Volume 04.02, Concrete and Aggregates. Philadelphia, PA: American Societyfor Testing and Materials. (Available from American Society for Testing and Materials,1916 Race Street, Philadelphia, PA 19103-1187,215/299-5400.)
ASTM C 845 - 90. "Specification for Expansive Hydraulic Cement," Annual Book of ASTMStandards, Volume 04.01, Cement; Lime; Gypsum. Philadelphia, PA: American Society forTesting and Materials. (Available from American Society for Testing and Materials, 1916Race Street, Philadelphia, PA 19103-1187,215/299-5400.)
ASTM C 1064 - 86 (1993). "Test Method for Temperature of Freshly Mixed Portland CementConcrete," Annual Book of'ASTMStandards, Volume 04.02, Concrete and Aggregates.Philadelphia, PA: American Society for Testing and Materials. (Available from AmericanSociety for Testing and Materials, 1916 Race Street, Philadelphia, PA 19103-1187,215/299-5400.)
ASTM C 1077 - 95a. "Practice for Laboratories Testing Concrete and Concrete Aggregates forUse in Construction and Criteria for Laboratory Evaluation," Annual Book of ASTMStandards, Volume 04.02, Concrete and Aggregates. Philadelphia, PA: American Societyfor Testing and Materials. (Available from American Society for Testing and Materials,1916 Race Street, Philadelphia, PA 19103-1187,215/299-5400.)
ASTM D 1556 - 90. "Test Method for Density and Unit Weight of Soil in Place by the Sand-Cone Method," Annual Book of ASTM Standards, Volume 04.08, Soil and Rock.Philadelphia, PA: American Society for Testing and Materials. (Available from AmericanSociety for Testing and Materials, 1916 Race Street, Philadelphia, PA 19103-1187,215/299-5400.)
ASTM D 2167 - 94. "Test Method for Density and Unit Weight of Soil in Place by the Rubber' Balloon Method," Annual Book of ASTM Standards, Volume 04.08, Soil and Rock.Philadelphia, PA: American Society for Testing and Materials. (Available from AmericanSociety for Testing and Materials, 1916 Race Street, Philadelphia, PA 19103-1187,215/299-5400.)
A-40

ASTM D 2216 - 92. "Test Method for Laboratory Determination of Water (Moisture) Content ofSoil and Rock," Annual Book of'ASTMStandards, Volume 04.08, Soil and RockPhiladelphia, PA: American Society for Testing and Materials. (Available from AmericanSociety for Testing and Materials, 1916 Race Street, Philadelphia, PA 19103-1187,215/299-5400.)
ASTM D 2922 - 91. "Test Methods for Density of Soil and Soil-Aggregate in Place by NuclearMethods (Shallow Depth)," Annual Book of ASTM Standards, Volume 04.08, Soil and Rock.Philadelphia, PA: American Society for Testing and Materials. (Available from AmericanSociety for Testing and Materials, 1916 Race Street, Philadelphia, PA 19103-1187,215/299-5400.)
ASTM D 3017 - 88 (1993). "Test Method for Water Content of Soil and Rock in Place byNuclear Methods (Shallow Depth)," Annual Book of ASTM Standards, Volume 04.08, Soiland Rock. Philadelphia, PA: American Society for Testing and Materials. (Available fromAmerican Society for Testing and Materials, 1916 Race Street, Philadelphia, PA 19103-1187,215/299-5400.)
ASTM D 4791 - 95. "Test Method for Flat or Elongated Particles in Coarse Aggregate," AnnualBook of ASTM Standards, Volume 04.03, Road and Paving Materials; PavementManagement Technologies. Philadelphia, PA: American Society for Testing and Materials. ~(Available from American Society for Testing and Materials, 1916 Race Street,Philadelphia, PA 19103-1187,215/299-5400.)
ASTM E 534 - 91. "Test Methods for Chemical Analysis of Sodium Chloride," Annual Book ofASTM Standards, Volume 15.05, Engine Coolants; Halogenated Organic Solvents;Industrial Chemicals. Philadelphia, PA: American Society for Testing and Materials.(Available from American Society for Testing and Materials, 1916 Race Street,Philadelphia, PA 19103-1187,215/299-5400.)
Brodsky, N.S., F.D. Hansen, and T.W. Pfeifle. 1996. "Properties of Dynamically CompactedWIPP Salt," 4th International Conference on the Mechanical Behavior of Salt, Montreal,Quebec, June 17-18,1996. SAND96-0838C. Albuquerque, NM: Sandia NationalLaboratories. (Copy on file at the Technical Library, Sandia National Laboratories,Albuquerque, NM.)
Brown, E.R. 1990. "Density of Asphalt Concrete-How Much is Needed?," TransportationResearch Record No. 1282. Washington, DC: Transportation Research Board. 27-32.(Copy on file in the SWCF.)
Callahan, G.D., M.C. Loken, L.D. Hurtado, and F.D. Hansen. 1996. "Evaluation of ConstitutiveModels for Crushed Salt," 4th International Conference on the Mechanical Behavior ofSalt, Montreal, Quebec, June 17-18,1996. SAND96-0791C. Albuquerque, NM: SandiaNational Laboratories. (Copy on file in the SWCF as WPO36449.)
A-41

Cheung, S.C.H., M.N. Gray, and D.A. Dixon. 1987. "Hydraulic and Ionic Diffusion Propertiesof Bentonite-Sand Buffer Materials," Coupled Processes Associated with Nuclear WasteRepositories, Proceedings of the International Symposium on Coupled Processes Affectingthe Performance of a Nuclear Waste Repository, Berkeley, CA, September 18-20,1985. Ed.C-F. Tsang. Orlando, FL: Academic Press, Inc. 383-407. (Copy on file in the SWCF.)
CRD-C 38 - 73. "Method of Test for Temperature Rise in Concrete," Handbook for Concreteand Cement. Vicksburg, MS: U.S. Army Corps of Engineers, Waterways ExperimentStation. (Copy on file in the SWCF as WPO39656.)"
DOE (U.S. Department of Energy). 1995. Waste Isolation Pilot Plant Sealing System DesignReport. DOE/WIPP-95-3117. Carlsbad, NM: U.S. Department of Energy, Waste IsolationPilot Plant. (Copy on file in the SWCF as WPO29062.)
EPA (Environmental Protection Agency). 1996a. Criteria for the Certification and Re-Certification of the Waste Isolation Pilot Plant's Compliance with the 40 CFR Part 191Disposal Regulations. Response to Comments Document for 40 CFR Part 194. EPA 402-R-96-001. Washington, DC: Environmental Protection Agency, Office of Radiation andIndoor Air. (Copy on file in the Nuclear Waste Management Library, Sandia NationalLaboratories, Albuquerque, NM.)
EPA (Environmental Protection Agency). 1996b. Criteria for the Certification and Re-Certification of the Waste Isolation Pilot Plant's Compliance with the 40 CFR Part 191Disposal Regulations. Background Information Document for 40 CFR Part 194. EPA 402-R-96-002. Washington, DC: Environmental Protection Agency, Office of Radiation andIndoor Ah*. (Copy on file in the Nuclear Waste Management Library, Sandia NationalLaboratories, Albuquerque, NM.)
Freeman, H.D., and R.A. Romine. 1994. Hanford Permanent Isolation Barrier Program:Asphalt Technology Test Plan. PNL-9336. Richland, WA: Pacific Northwest Laboratories.(Copy available from National Technical Information Service, 5285 Port Royal Road,Springfield, VA, 22161,703/487-4650. Order number: DE94013454.)
Gray, M.N. 1993. OECD/NEA International Stripa Project. Overview Volume III: EngineeredBarriers. Stockholm, Sweden: SKB, Swedish Nuclear Fuel and Waste ManagementCompany. (Copy on file in the Nuclear Waste Management Library, Sandia NationalLaboratories, Albuquerque, NM as TD898.2 .G73 1993.)
Hansen, F.D., and E.H. Ahrens. 1996. "Large-Scale Dynamic Compaction of Natural Salt," 4thInternational Conference on the Mechanical Behavior of Salt, Montreal, Quebec, June 17-18,1996. SAND96-0792C. Albuquerque, NM: Sandia National Laboratories. (Copy on filehi the SWCF as WPO39544.)
IAEA (International Atomic Energy Agency). 1990. Sealing of Underground Repositories forRadioactive Wastes. STI/DOC/10/319. Technical Reports Series No. 319. Vienna, Austria:International Atomic Energy Agency; Lanham, MD: Unipub. (Copies on file at theTechnical Library, Sandia National Laboratories, Albuquerque, NM and at CentennialScience and Engineering Library, University of New Mexico, Albuquerque, NM.)
A-42

Kjartanson, B.H., N.A. Chandler, A.W.L. Wan, C.L. Kohle, and PJ . Roach. 1992. "Use of aMethod Specification for In Situ Compaction of Clay-Based Barrier Materials," High LevelRadioactive Waste Management, Proceedings of the Third International Conference, LasVegas, NV, April 12-16,1992. La Grange Park, IL: American Nuclear Society, Inc.; NewYork, NY: American Society of Civil Engineers. Vol. 1,1129-1136. (Copy on file in theSWCF.)
Knowles, M.K., and C.L. Howard. 1996. "Field and Laboratory Testing of Seal MaterialsProposed for the Waste Isolation Pilot Plant," Proceedings of the Waste Management 1996Symposium, Tucson, AZ, February 25-29,1996. SAND95-2082C. Albuquerque, NM:Sandia National Laboratories. (Copy on file in the SWCF as WPO30945.) -
Mitchell, J.K. 1993. Fundamentals of Soil Behavior. 2nd ed. New York, NY: John Wiley &Sons, Inc.
Myers, D.R., and D.A. Duranceau. 1994. Prototype Hanford Surface Barrier: Design BasisDocument. BHI-00007, Rev. 00. Richland, WA: Bechtel Hanford, Inc. for the U.S.Department of Energy, Office of Environmental Restoration and Waste Management. (Copyon file at the Nuclear Waste Management Library, Sandia National Laboratories,Albuquerque, NM.)
Nilsson, J. 1985. "Field Compaction of Bentonite-Based Backfilling," Engineering Geology.Vol. 21, no. 3-4,367-376. (Copy on file in the SWCF.)
Onofrei, M., M.N. Gray, W.E. Coons, and S.R. Alcorn. 1992. "High Performance Cement-Based Grouts for Use in a Nuclear Waste Disposal Facility," Waste Management. Vol. 12,no. 2/3,133-154. (Copy on file in the SWCF.)
Pfeifle, T.W., F.D. Hansen, and M.K. Knowles. 1996. "Salt-Saturated Concrete Strength andPermeability," 4th Materials Engineering Conference, ASCE Materials EngineeringDivision, Washington, DC, November 11-18,1996. Albuquerque, NM: Sandia NationalLaboratories.)
Pusch, R. 1982. "Mineral-Water Interactions and Their Influence on the Physical Behavior ofHighly CompactedNa Bentonite," Canadian GeotechnicalJournal. Vol. 19, no. 3, 381-387. (Copy on file in the SWCF.)
Pusch, R., and L. Borgesson. 1989. "Bentonite Sealing of Rock Excavations," Sealing ofRadioactive Waste Repositories, Proceedings of an NEA/CEC Workshop, Braunschweig,Germany, May 22-25,1989. EUR 12298. Paris: Organisation for Economic Co-Operationand Development. 297-308. (Copy on file in the SWCF.)
Pusch, R., M. Gray, F. Huertas, M. Jorda, A. Barbreau, and R. Andre-Jehan. 1989. "Sealing ofRadioactive Waste Repositories in Crystalline Rock," Sealing of Radioactive WasteRepositories, Proceedings of an NEA/CEC Workshop, Braunschweig, Germany, May 22-25,1989. EUR 12298. Paris: Organisation for Economic Co-Operation and Development. 214-228. (Copy on file in the SWCF.)
A-43

Wakeley, L.D., P.T. Harrington, and F.D. Hansen. 1995. Variability in Properties ofSaladoMass Concrete. SAND94-1495. Albuquerque, NM: Sandia National Laboratories. (Copy onfile in the SWCF as WPO22744.)
Wing, N.R., and G.W. Gee. 1994. "Quest for the Perfect Cap," Civil Engineering. Vol. 64, no.10,38-41. (Copy on file in the SWCF as WPO21158.)
A-44

Appendix B
Shaft Sealing Construction Procedures
Appendix B Abstract
This appendix describes equipment and procedures used to construct the shaft seals as.specified,in the main report. Existing or reasonably modified construction equipment is specified,standard mining practices are applied, and a general schedule is provided at the end of thisappendix. This appendix describes the following activities:
• pre-sealing activities for the sub-surface and surface,
• construction and operation of a multi-deck stage,
• installation of special concrete (sumps, shaft station monoliths, and concrete plugs),
• installation of compacted clay columns,
• emplacement and dynamic compaction of WIPP salt,
• installation of neat asphalt and asphaltic mastic mix,
• grouting of concrete plugs and the country rock behind existing shaft liners,
• removal of portions of the existing shaft liners, and
• emplacement of compacted earthen fill.
B-l

Page intentionally blank.
B-2

Contents
Bl. INTRODUCTION 5B2. PROJECT MOBILIZATION 6
B2.1 Subsurface 6B2.2 Surface ; 6B2.3 Installation of Utilities 7
B3. MULTI-DECK STAGE .:. .• : 7B4. PLACEMENT OF SEALING MATERIALS 11
B4.1 Concrete .....11B4.1.1 Shaft Station Monolith 12B4.1.2 Concrete-Asphalt Waterstops 13B4.1.3 Concrete Plugs 13
B4.2 Clay 13B4.2.1 Salado and Rustler Compacted Clay Column 13
B4.3 Asphalt - 14B4.3.1 Concrete-Asphalt Waterstops 14B4.3.2 Asphaltic Mastic Mix Column 16
B4.4 Compacted Salt Column 17B4.5 Grout 19B4.6 Compacted Earthen Fill 22
B4.6.1 Lower Section 24B4.6.2 Upper Section 24
B4.7 Schedule 24B5 REFERENCES 51
Figures
Figure B-l. Multi-deck stage illustrating dynamic compaction 9Figure B-2. Multi-deck stage illustrating excavation for asphalt waterstop 10Figure B-3. Typical fibercrete at top of asphalt 16Figure B-4. Drop pattern for 6-m-diameter shaft using a 1.2-m-diameter tamper. 20Figure B-5. Plan and section views of downward spin pattern of grout holes 21Figure B-6. Plan and section views of upward spin pattern of grout holes 23
B-3
Page intentionally blank.
B-4

B1. INTRODUCTION
This appendix describes construction specifications for placement of shaft seal materials.Flexibility is incorporated in construction specifications to facilitate placement of severaldifferent material types. Engineering materials used to seal the full length of the shaft includeearthen fill, compacted clay, tamped crushed salt, asphalt, concrete, and a combination ofconcrete and asphalt in concrete-asphalt waterstops. Appendix A of this report provides detailsof the materials. A full-length shaft seal of this type has never before been constructed; however,application of available technology and equipment, standard construction practices, and commonmaterials provides confidence that the system can be placed to satisfy the design requirements.
A primary feature of the construction specification is development of a work platformfrom which seal materials are placed. Although the proposed multi-deck stage (galloway)proposed here is engineered specifically for shaft sealing operations, it is similar to stages usedfor construction of shafts. Inherently flexible, the multi-deck stage facilitates severalconstruction methods required for the various materials specified for the shaft seal system. Itprovides an assembly of a slickline and header for transport of flowable materials from thesurface to the placement horizon. A crane device is attached to the base of the stage to facilitatecompaction, and an avenue through the stage provides a means to transport bulk material. It isunderstood that procedures specified here may change during the tens of years precedingconstruction as a result of equipment development, additional testing, or design changes.Further, it is acknowledged that the construction methods specified are not the only methods thatcould place the seal materials successfully.
A few assumptions are made for purposes of evaluating construction activities. Theseassumptions are not binding, but are included to assist discussion of general operationalscenarios. For example, four multi-deck stages are specified, one for each shaft. Thisspecification is based on shaft-sinking experience, which indicates that because of the wearencountered, it is advisable to replace rather than rebuild stages. However, much of theequipment on the multi-deck stage is reused. For scheduling purposes, it is assumed that sealingoperations are conducted in two of the four shafts simultaneously. The Air Intake and ExhaustShafts are sealed first, and the Waste and Salt Handling Shafts are sealed last. With thisapproach, shaft sealing will require about six and a half years, excluding related work undertakenby the WIPP Operating Contractor. Sealing the shafts sequentially would require approximatelyeleven and a half years. To facilitate discussion of scheduling and responsibilities, it is assumedthat sealing operations will be conducted by a contractor other than the WIPP OperatingContractor.
Years from now, when actual construction begins, it is probable that alternatives may befavored. Therefore, construction procedures note alternative methods in recognition that changesare likely and that the construction strategy is sufficiently robust to accommodate alternatives.This appendix contains both general and very specific information. It begins with a discussion ofgeneral mobilization in Section 2. Details of the multi-deck construction stage are provided inSection 3. Section 4 contains descriptions of the construction activities. Information presentedhere is supplemented by several engineering drawings and sketches contained in Appendix E.The topical information and the level of provided detail substantiate the theory that reliable shaftseal construction is possible using available technology and materials.
B-5
B2. PROJECT MOBILIZATION
The duty descriptions that follow are for discussion purposes. The discussions do notpresuppose contractual arrangements, but simply identify tasks necessary for shaft sealconstruction.
B2.1 Subsurface
Prior to initiation of sealing activities, the WIPP Operating Contractor will removeinstallations and equipment on the repository level. A determination of items removed will bemade before construction begins. Such removal would include, but is not limited to, gates andfences at the shaft; equipment such as winches, ventilation fans, pipelines; and communication "and power cables. Additionally, the following items will be removed from the shafts:
• cables, counterweights, and sheaves;
• existing waterlines; and
• electrical cables not required for sealing operations.
The following equipment will be stored near the shaft on the repository level by theSealing Contractor prior to initiation of sealing activities:
• a concrete header, hopper, and pump;
• a concrete pump line to distribute concrete; and
• an auxiliary mine fan and sufficient flexible ventilation tubing to reach work areasrequired for installation of the shaft station concrete monolith.
The subsurface will be prepared adequately for placement of the shaft station monolith.Determination of other preparatory requirements may be necessary at the time of construction.
B2.2 Surface
The Operating Contractor will remove surface facilities such as headframes, hoists, andbuildings to provide clear space for the Sealing Contractor. Utilities required for sealingactivities (e.g., air compressors, water, electrical power and communication lines) will bepreserved. The Sealing Contractor will establish a site office and facilities required to supportthe construction crews, including a change house, lamp room, warehouse, maintenance shop, andsecurity provisions. Locations will be selected and foundations constructed for headframes,multi-deck stage winches, man/equipment hoist, and exhaust fan. A drawing in Appendix E(Sketch E-4) depicts a typical headframe and associated surface facilities. The hoist and wincheswill be enclosed in suitable buildings; utilities and ventilation ducting will be extended to theshaft collar. The large ventilation fan located near the collar is designed to exhaust air throughthe rigid ventilation duct, resulting in the movement of fresh air down the shaft. Air flow will besufficient to support eight workers to the depth of the repository level. The following facilitieswill be procured and positioned near the shaft collar:
• a concrete batch plant capable of weighing, batching, and mixing the concrete to designspecifications;
• a crushing and screening plant to process WIPP salt and local soil;
B-6

• an insulated and heated pug mill, asphalt pump, asphalt storage tank, and other auxiliaryequipment; and
• pads, siloi&and structures to protect sealing materials from the weather.
The Sealing Contractor will construct a temporary structural steel bulkhead over the shaftat the surface. The bulkhead will be sufficiently strong to support the weight of the multi-deckstage, which will be constructed on it. When the multi-deck stage is completed, the headframewill be erected. The headframe (depicted in Appendix E r Sketch E-3) wijl be built around themulti-deck stage, and a mobile crane will be required during fabrication. When the headframe iscompleted, cables for hoisting and lowering the multi-deck stage will be installed. Cables willrun from the three winches, over the sheaves in the headframe, down and under the sheaves onthe multi-deck stage, and up to anchors in the headframe. The headframe will be sufficientlyhigh to permit the multi-deck stage to be hoisted until the lowest component is 3.05 m (10 ft)above surface. This will facilitate slinging equipment below the multi-deck stage and lowering itto the work surface, as well as activities required at the collar during asphalt emplacement.
The multi-deck stage will be lowered to clear .the collar, allowing the installation ofcompressed-air-activated steel shaft collar doors, which will serve as a safety device, permittingsafe access to the-man cage and bucket, while preventing objects from falling down the shaft.Following installation of these doors, workers will utilize the multi-deck stage to traverse the" *shaft from the collar to the repository horizon, inspecting it for safety hazards and making anynecessary repairs. After this inspection, the multi-deck stage will return to the surface.
B2.3 Installation of Utilities
In preparation for placement of shaft seal materials, requisite utilities will be outfitted foroperations. The multi-deck stage will descend from the collar to the repository horizon. Asadded assurance against unwanted water, a gathering system similar to the one currently in placeat the bottom of the concrete liner will be installed and moved upward as seal emplacementproceeds. Water collected will be hoisted to the surface for disposal. Additionally, anysignificant inflow will be located and minimized by grouting. After installation of the watergathering system, the following utilities will be installed from surface to the repository horizonby securely fastening them to the shaft wall:
• 5.1-cm steel waterline with automatic shut-off valves every 60 m;
• 10.2-cm steel compressed-air line;
• power, signal, and communications cables;
• 15.2 cm steel slickline and header; and
• a rigid, cylindrical, ventilation duct, which would range from 107 cm in diameter in thethree largest shafts to 91 cm in diameter in the Salt Handling Shaft.
B3. MULTI-DECK STAGE
The multi-deck stage (galloway) provides a work platform from which all sealingoperations except placement of asphalt are conducted. The concept of using a multi-deck stage isderived from similar equipment commonly employed during shaft sinking operations. Plan and
B-7

section views of conceptual multi-deck stages are shown in Appendix E, Sketches E-l and E-2.The construction decks specified here are modified from typical shaft sinking configurations intwo important ways to facilitate construction. Conceptual illustrations of these twomodifications are displayed hi Figures B-l and B-2. Figure B-l illustrates the multi-deckperforming dynamic compaction of salt. Figure B-2 illustrates the multi-deck stage configuredfor excavation of the kerf required for the asphalt waterstop in Salado salt.
A device called a polar crane mounted below the lower deck can be configured for eitherdynamic compaction or salt excavation. The crane can rotate 360° horizontally by actuating itsgeared track drive. Its maximum rotational speed will be approximately two revolutions perminute. The crane can be controlled manually or by computer (computerized control will swiftlyposition the tamper in the numerous drop positions required for dynamic compaction). Whenexcavation for the concrete-asphalt waterstops is required, the tamper, electromagnet, and cableused for dynamic compaction will be removed, and a custom salt undercutter will be mounted onthe polar crane trolley. Geared drives on the crane, trolley, and undercutter will supply the forcerequired for excavation. In addition to the special features noted above and shown in Figures B-1 and B-2, the multi-deck stage has the following equipment and capabilities:
• Maximum hoisting/lowering speed is approximately 4.6 m (15 ft) per minute.
• A cable, electromagnet, and tamper will be attached to the polar crane during dynamic *compaction. The cylindrical tamper consists of A-36 carbon steel plates bolted togetherwith high-tensile-strength steel bolts. It is hoisted and dropped by the polar crane usingthe electromagnet. The tamper will be mechanically secured to the polar crane beforepersonnel are allowed under it.
• Range-finding lasers will facilitate the accurate positioning of the multi-deck stage abovethe work surface and allow the operator to determine when the surface is sufficientlylevel. The distance indicated by each laser will be displayed on a monitor at the cranecontrol station.
• Flood lights and remotely controlled closed-circuit television equipment will enable thecrane operator to view operations below the multi-deck stage on a monitor.
• Fold-out floor extensions that accommodate the variance hi shaft diameter between theunlined and lined portions of the shaft will be provided for safety.
• A cutout hi each deck, combined with a removable section of the polar crane track, willpermit stage movement without removal of the rigid ventilation duct (which is fastened tothe shaft wall).
The multi-deck stage is equipped with many of the features found on conventional shaft sinkingstages, such as:
• three independent hoisting/lowering cables,
• man and material conveyances capable of passing through the multi-deck stage andaccessing the working surface below,
• a jib crane that can be used to service the working surface below,
• removable safety screens and railings, and
• centering devices.
B-8
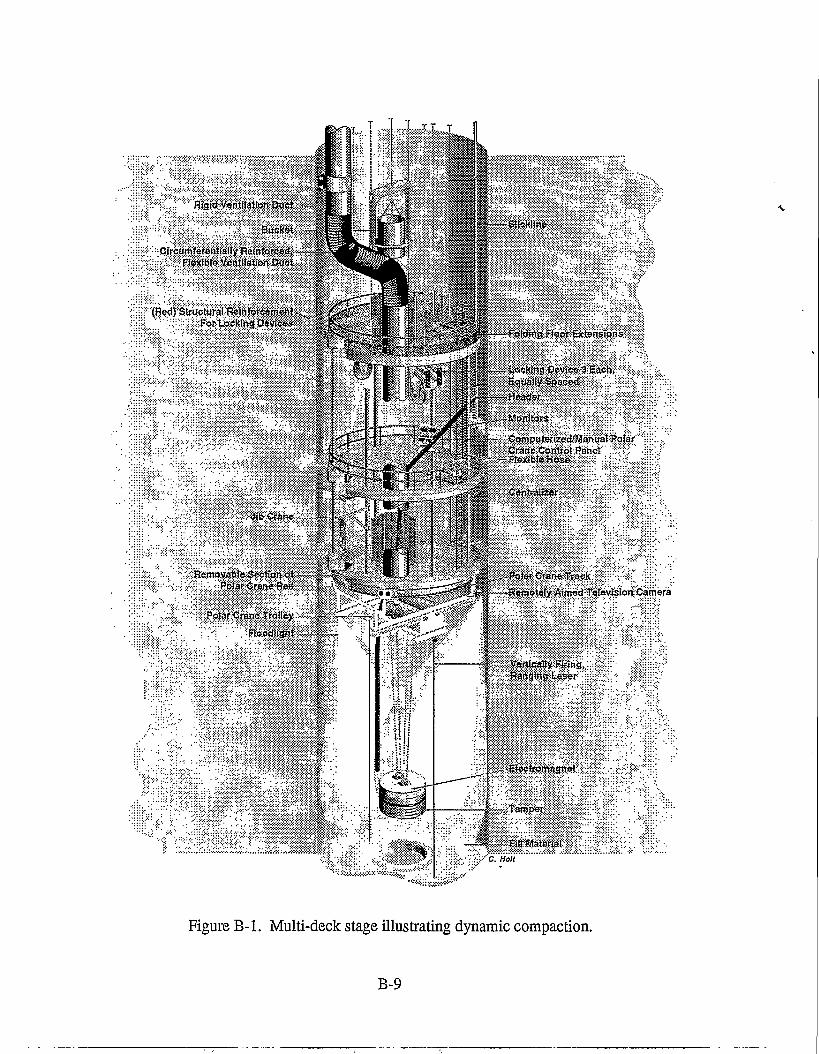
- •> PoJar -Ctanft. Track
i«»ot«fy^A(roedT«!tevision Camera
Figure B-l. Multi-deck stage illustrating dynamic compaction.
B-9
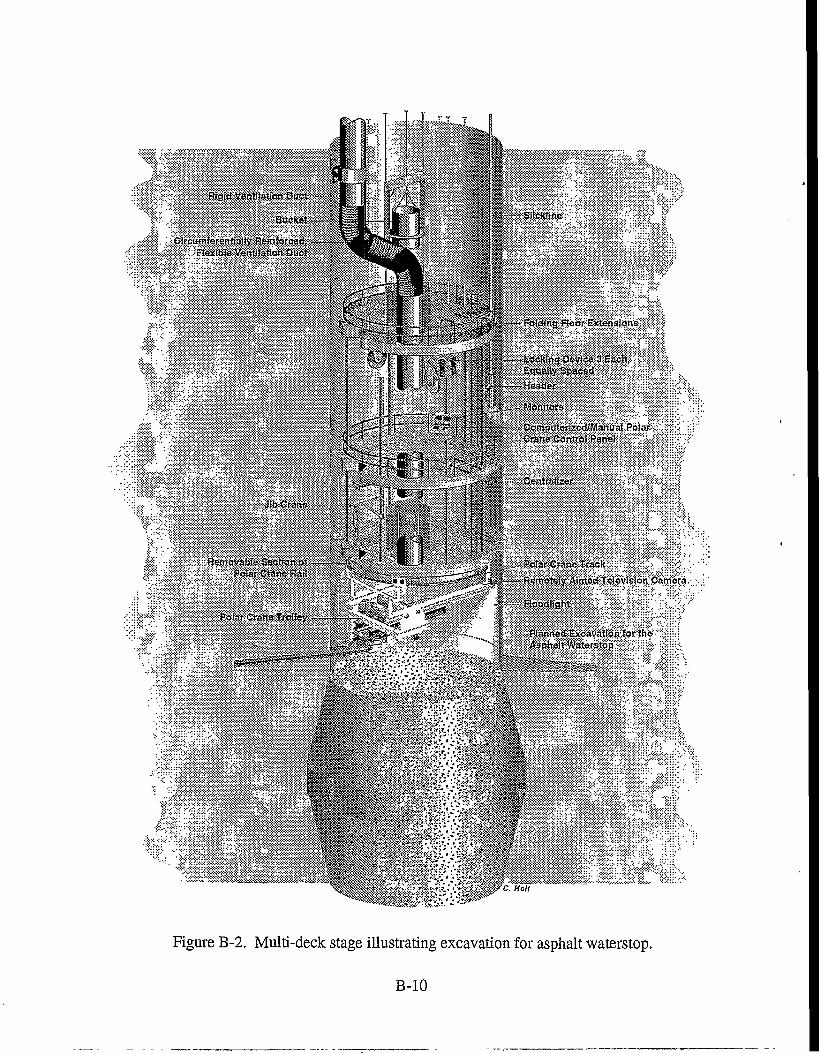
Figure B-2. Multi-deck stage illusti-ating excavation for asphalt waterstop.
B-10

Three sets of double locking devices are provided to secure the multi-deck stage to theshaft wall. A suitable factor of safety for these locking devices is judged to be 4. The area of thegrips securing the deck is calculated from static principles:
FS=\i(Co){A)/W (B-l)
where:
FS = factor of safety
u. = steel/salt friction coefficient = 0.15 (see Table 20.1 in McClintock and Argon,1966; and Van Sambeek, 1988)
Co — compressive strength of WIPP salt, which varies from 172 kg/cm2 to 262 kg/cm2
(Van Sambeek, 1988)
W = total vertical weight
A = total gripper pad surface area.
Manipulating the equation to solve for required area, applying a factor of safety of 4,selecting the heaviest work stage (753,832 kg) and the minimum compressive strength value forsalt (assuming that the locking pressure equals the minimum compressive strength of salt), the -following gripper surface area (A) is:
A = 4(753,832 kg)/0.15(172 kg/cm2) = 11,416.5 cm2, and each of the six gripper pads would be1902.8 cm2.
As designed, each gripper pad area is 2167.2 cm2, resulting in a factor of safety (FS) of 4.56.Additionally, although tension in the hoisting cables is relaxed while the multi-deck stage is inthe locked configuration, the cables are still available to hold the work-deck, should the lockingdevices fail.
B4. PLACEMENT OF SEALING MATERIALS
Construction activities include placement of materials in three basic ways: (1) byslickline (e.g., concrete and asphalt), (2) by compaction (e.g., salt and earthen fill), and (3) byphysical placement (e.g., clay blocks). Materials will be placed at various elevations usingidentical procedures. Because placement procedures generally are identical regardless ofelevation, they will be described only once. Where differences occur, they will be identified anddescribed. In general, placement of shaft seal elements is described from bottom to top.
" B4.1 Concrete
Concrete is used as a seal material for several different components, such as the existingsumps in the Salt Handling Shaft and the Waste Shaft, the shaft station monoliths, concreteplugs, and concrete-asphalt waterstops. Existing sumps are shown in Appendix E, DrawingsSNL-007, Sheets 6 and 21. Shaft station monoliths are shown in Drawings SNL-007, Sheets 6,11,16, and 21. Concrete plugs are depicted on Drawings SNL-007, Sheets 4,5,9,10,14,15,19, and 20. Lower, middle, and upper concrete-asphalt waterstops are shown in Drawing
B-ll

SNL-007, Sheet 22. Construction material for all concrete members will be Salado MassConcrete (SMC).
As specified, all SMC will be mixed on surface to produce a product possessing thecharacteristics defined in Appendix A. Concrete will be transferred to its placement locationwithin the shaft via slickline and header. The slickline (shown in Figure B-l) is a steel pipefastened to the shaft wall. Vertical drops as great as 656 m to the repository horizon are required.Such concrete transport and construction are common in mining applications. For example, alarge copper mine in Arizona is placing concrete at a depth of 191 m using this procedure. Aheader attached to the bottom of the slickline is designed to absorb kinetic energy generated bythe falling material. The header, a steel pipe slightly larger in diameter than the slickline andmade of thicker steel, diverts the flow 45°, absorbing most of the impact. Because the dropgenerates considerable force, the header will be securely supported by a reinforced steel shelfbolted to the shaft wall. A flexible hose, in sections approximately 3 m long and joined byquick-connect fittings, will be attached to the header.
B4.1.1 Shaft Station Monolith
Construction of the shaft station monoliths is preceded by filling two existing sumps with"SMC. Initially, sufficient hose will be used to convey the concrete to the bottom of the sump.The discharge will remain below the concrete surface during placement to minimize airentrainment. Sections of hose will be withdrawn and removed as the SMC rises to the floor ofthe repository horizon in a continuous pour. Subsequent to filling the sump, arrangements willbe made to place the concrete monolith.
A small mine fan will be located above the rigid suction-duct inlet to ensure a fresh airbase. Masonry block forms will be constructed at the extremities of the shaft station monolith inthe drifts leading from the station. Temporary forms, partially filling the opening, will be erectedat the shafts to facilitate the placement of the outermost concrete. These temporary forms willpermit access necessary to ensure adequate concrete placement. SMC will be transported via theslickline to the header, which will discharge into a hopper feeding the concrete pump, and thepump will be attached to the pumpcrete line. The pumpcrete line, suspended in cable slings nearthe back of the drifts, will be extended to the outer forms. A flexible hose, attached to the end ofthe pumpcrete line, will be used by workers to direct emplacement. The pumpcrete line will bewithdrawn as emplacement proceeds toward the shaft.
When the concrete has reached the top of the temporary forms, they will be extended toseal the openings completely, and two 5-cm-diameter polyvinyl chloride (PVC) pipes will beincorporated in the upper portion of each form. Both pipes will be situated in a vertical planeoriented on the long axis of the heading and inclined away from the station at approximately 70°to the horizontal. The upper end of thetop pipe will extend to just below the back, and the upperend of the lower pipe will be located just below that of the top pipe. SMC will be injectedthrough the lower pipe until return is obtained from the upper pipe, ensuring that the heading hasbeen filled to the back. The header will then be moved to a position in the shaft above thedesigned elevation at the top of the shaft station monolith and supported by a bracket bolted tothe shaft wall. After the outer concrete has achieved stability, the temporary interior forms maybe removed. Equipment no longer required will be slung below the multi-deck stage and hoisted
B-12

to surface for storage and later use. The station and shaft will be filled to design elevation withconcrete via the slickline, header, and flexible hose. The slickline is cleaned with spherical,neoprene swabs ("pigs") that are pumped through the slickUne, header, and hose.
B4.1.2 Concrete-Asphalt Waterstops
Lower, middle, and upper concrete-asphalt waterstops in a given shaft are identical andconsist of two SMC sections separated by an asphalt waterstop. Before the bottom member ofthe lower concrete component is placed, the multi-deck stage will be raised into the headframe;the polar crane will be mounted below the lower deck; and the salt undercutter will be mountedon the crane trolley. The multi-deck stage will then return to the elevation of the concretecomponent Two undercutter bars will be used to make the necessary excavations for upper,middle, and lower asphalt-concrete waterstops and the concrete plug above the SaladoFormation. Notches for the plugs will be excavated using a short, rigid cutter bar (length lessthan half the radius). The kerf for the asphalt waterstop will be excavated using a long cutter barthat can excavate the walls to a depth of one shaft radius. These operations will be conducted asrequired as seal placement proceeds upward. .
The lower concrete member (and all subsequent concrete entities) will be placed via theslickline, header, and flexible hose, using the procedure outlined for the shaft station monolith;..Construction of vertical shaft seals provides the ideal situation for minimising interfacepermeability between the rock and seal materials. Concrete will flow under its own weight toprovide intimate contact. A tight cohesive interface was demonstrated for concrete in the small-scale seal performance tests (SSSPTs). The SSSPT concrete plugs were nearly impermeablewithout grouting. However, interface grouting is usually performed in similar construction, andit will be done here in the appropriate locations.
B4.1.3 Concrete Plugs
An SMC plug, keyed into the shaft wall, is situated a few meters above the upper Saladocontact in the Rustler Formation. A final SMC plug is located a few meters below surface in theDewey Lake Redbeds. This plug is emplaced within the existing shaft liner using the sameconstruction technique employed for the concrete-asphalt waterstops.
B4.2 Clay
B4.2.1 Salado and Rustler Compacted Clay Column
Blocks of sodium bentonite clay, precompacted to a density of 1.8 to 2.0 g/cm3, will bethe sealing material. This density has been achieved at the WIPP using a compaction pressure of492.2 kg/cm2 in a machine designed to produce adobe blocks (Knowles and Howard, 1996).Blocks are envisioned as cubes, 20.8 cm on the edge, weighing approximately 18 kg, areasonable weight for workers to handle. The bentonite blocks will be compacted at the WIPP ina new custom block-compacting machine and will be stored in controlled humidity to preventdesiccation cracking. Blocks will be transported from surface in the man cage, which will besized to fit through the circular "bucket hole" in the multi-deck stage. The conveyance will bestacked with blocks to a height of approximately 1.8 m.
B-13

Installation will consist of manually stacking individual blocks so that all interfaces are incontact. Block surfaces will be moistened with a spray of potable water as the blocks are placedto initiate a minor amount of swelling, which will ensure a tight fit and a decrease inpermeability. Peripheral blocks will be trimmed to fit irregularities in the shaft wall and placedas close to the wall as possible. Trimmed material will be manually removed with a vacuum.Dry bentonite will be manually tamped into remaining voids in each layer of blocks. Thisprocedure will be repeated throughout the clay column. The multi-deck stage will, in all cases,be raised and utilities removed to the surface as emplacement of sealing materials proceedsupward.
Dynamic compaction construction is an alternative method of clay emplacement thatcould be considered in the detailed design. Dynamic compaction materials being considered are:
• sodium bentonite/fine silica sand, and
• highly compressed bentonite pellets.
Boonsinsuk et al. (1991) developed and tested a dynamic (drop hammer) method for a relativelylarge diameter (0.5-m) hole, simulated with a steel cylinder, that gave very good results on 1 :1dry mass mixtures of sodium bentonite and sand, at a moisture content of 17% to 19%. Thealternatives have the advantages of simplifying emplacement.
B4.3 Asphalt
Asphalt, produced as a distillate of petroleum, is selected as the seal material because ofits longevity, extremely low permeability, history of successful use as a shaft lining material, andits ability to heal if deformed. Shielded from ultraviolet radiation and mixed with hydrated limeto inhibit microbial degradation, the longevity of the asphalt will be great. Emplaced by tremieline at the temperature specified, the material will be fluid and self-leveling, ensuring completecontact with the salt.
Construction of an asphalt column using heated asphalt will introduce heat to thesurrounding salt. The thermal shock and heat dissipation through the salt has not been studied indetail. Performance of the asphalt column may be enhanced by the introduction of the heat thatresults from acceleration of creep and healing of microfractures. If, upon further study, thethermomechanical effects are deemed undesirable or if an alternative construction method ispreferred at a later date, asphalt can readily be placed as blocks. Asphalt can "cold flow" to fillgaps, or the seams between blocks can be filled with low-viscosity material.
B4.3.1 Concrete-Asphalt Waterstops
- ' Electrically insulated, steel grated flooring will be constructed over the shaft at thesurface. A second, similar flooring will be built in the shaft 3 m below the first. These floorswill be used only during the emplacement of asphalt and asphaltic mastic mix (AMM) and willbe removed at all other times. A 12.7-cm ID/14-cm OD, 4130 steel pipe (tremie line) in 3-mlengths will be electrically equipped for impedance heating, then insulated and suspended in theshaft from slips (pipe holding devices) situated on the upper floor. The tremie line cross-sectional area is smallest at the shoulder of the top thread, where tensional yield is 50,000 kg; the
B-14

line weight is 20.8 kg/m. Heavier weights are routinely suspended in this manner in thepetroleum and mining industries.
Neat, AR-4000-graded petroleum-based asphalt cement will be the sealing material forasphalt waterstops. Neat asphalt from the refinery will be delivered to the WIPP atapproximately 80°C in conventional, insulated refinery trucks and pumped into a heated andinsulated storage tank located near the shaft The multi-deck stage will be hoisted into theheadframe and mechanically secured for safety. Asphalt, heated to 180°C ±5°, will be pumpeddown the shaft to the fill elevation through the heated tremie line. Viscosity of the neat asphaltfor the waterstops will be sufficiently low to allow limited penetration of the DRZ. Installationof asphalt in each of the concrete-waterstops is identical.
As the pipe is lowered, workers on the lower deck will attach the wiring required forheating circuits and apply insulation. Workers on the top deck will install flanged andelectrically insulated couplings as required (the opening in the slip bowl will be large enough topermit the passage of these couplings). Properly equipping and lowering the pipe shouldprogress at the rate of one section every 10 minutes. The lower asphalt waterstop requiresapproximately 607 m of pipe for a casing weight of 12,700 kg. Additionally, electrical wire andinsulation will weigh about 7250 kg for a total equipped tremie line weight of 20,000 kg.Therefore, the safety factor for the tremie line is 50,000 kg/20,000 kg, or 2.5.
To minimize air entrainment, the lower end of the tremie line will be immersed as muchas 1 m during hot asphalt emplacement. Therefore, the lower 3 m of casing will be left bare (tosimplify cleaning when emplacement has been completed).
Initially the tremie line will be lowered until it contacts the concrete plug (immediatelyunderlying the excavation for the waterstop) and then raised approximately 0.3 m. Asphaltemplacement will proceed as follows:
• The impedance heating system will be energized, heating the tremie line to 180°C ±5°,and the asphalt in the storage tank will be heated to approximately 180°C ±5°.
• Heated, neat asphalt will be pumped down the tremie line at a rate approximating 13L/min. This low rate will ensure that the asphalt flows across the plug from the insertionpoint, completely filling the excavation and shaft to the design elevation.
• The tremie line will be raised 3 m and cleaned by pumping a neoprene swab through itwith air pressure. Impedance heating will be stopped, and the line will be allowed tocool. When cool, the line will be hoisted, stripped, cleaned, disassembled, and stored forfuture use.
Sealing operations will be suspended until the air temperature at the top of the asphalt hasfallen to approximately 50°C for the comfort of the workers when they resume activity at the fillhorizon. Temperature will be determined by lowering a remotely read thermometer to anelevation approximately 3 m above the asphalt at the center of the shaft. The temperature of theasphalt at the center of the shaft will be 50°C in about a month, but active ventilation shouldpermit work to resume in about two weeks (see calculations in Appendix D).
When sufficient cooling has occurred, workers will descend in the multi-deck stage andcover the hot asphalt with an insulating and structural material such as fiber-reinforced shotcrete,
B-15

as illustrated in Figure B-3. To accomplish this, they will spray cementitious shotcretecontaining fibrillated polypropylene fibers (for added tensional strength), attaining a minimumthickness of approximately 0.6 m.
B4.3.2 Asphaltic Mastic Mix Column
Asphaltic mastic mix (AMM) for the column will be prepared on surface in a pug mill.Viscosity of the AMM can be tailored to provide desired properties such as limited migrationinto large fractures.
• AMM will be prepared by mixing the ingredients in the pug mill, which has been heatedto 180°C ±5°. The mix will be pumped from the pug mill through the tremie line to theemplacement depth. AMM is self-leveling at this temperature, and its hydrostatic headwill ensure intimate contact with the shaft walls.
• Pumping rate will be approximately 200 L/min for efficiency, because of the largervolume (approximately 1,224,700 L in the Air Intake Shaft). To facilitate efficientemplacement and avoid air entrainment, the tremie line will not be shortened until themix has filled 6 vertical meters of the shaft. Back pressure (approximately 0.84 kg/cm2)resulting from 6 m of AMM above the discharge point will be easily overcome fromsurface by the hydraulic head.
Air Intake ShaftCross Section
TFII-6121-375-0
Figure B-3. Typical fibercrete at top of asphalt.
B-16

After 6 vertical meters of AMM have been placed:
• Impedance heating current will be turned off and locked out (the hot line will draincompletely).
• To prevent excessive back pressure resulting from AMM above the insertion point, theline will be disconnected from the pump and hoisted hot. Two sections will be stripped,removed, cleaned with a "pig," and stacked near the shaft.
• Electrical feed will be adjusted (because of the decreased resistance of the shortened line).
• The tremie line will be reconnected to the pump.
• The impedance heating system will be energized.
• When the temperature of the line has stabilized at 180°C ±5°, pumping will resume.
This procedure will be followed until the entire column, including the volume computedto counteract 0.9 m of vertical shrinkage (calculations in Appendix D), has been placed. The linewill be disconnected from the pump and cleaned by pumping "pigs" through it with air pressure.It will then be hoisted, stripped, removed in 3-m sections, and stacked on surface for reuse.
Sealing operations will be suspended following removal of the tremie line, andventilation will be continuous to speed cooling. The column will shrink vertically but maintaincontact with the shaft walls as it cools. When the air temperature at 3 m above the asphalthas ~- .cooled sufficiently, workers will descend on the multi-deck stage and cover the hot asphalt withfibercrete as described for the concrete-asphalt waterstop (Section B4.3.1) and illustrated inFigure B-3.
Note: Near the top of the Salado Formation, portions of the concrete liner key, chemical sealrings, and concrete and steel shaft liners will be removed. Liner removal will occur beforeemplacement of AMM. For safety, exposed rock will be secured with horizontal, radial rockbolts and cyclone steel mesh. A range-finding device, fastened to the shaft wall approximately 3m above the proposed top of the asphaltic column, will indicate when the hot AMM reaches thedesired elevation. A remotely read thermometer, affixed to the shaft wall approximately 2 mabove the proposed top of the column, will show when the air temperature has fallen sufficientlyto resume operations. The intake of the rigid ventilation duct will be positioned approximately 3m above the proposed top of the column, and ventilation will be continuous throughoutemplacement and cooling of the asphaltic column. After the multi-deck stage has been hoistedinto the headframe and mechanically secured for safety, emplacement of AMM will proceed.
B4.4 Compacted Salt Column
Crushed, mine-run salt, dynamically compacted against intact Salado salt, is the majorlong-term shaft seal element. As-mined WIPP salt will be crushed and screened to a maximumparticle dimension of 5 mm. The salt will be transferred from surface to the fill elevation via theslickline and header. A flexible hose attached to the header will be used to emplace the salt, anda calculated weight of water will be added. After the salt has been nominally leveled, it will bedynamically compacted. Dynamic compaction consists of compacting material by dropping atamper on it and delivering a specified amount of energy. The application of three times
B-17

Modified Procter Energy (MPE) to each lift (one MPE equals 2,700,000 Joules/m3) will result incompacting the salt to 90% of the density of in-place rock salt.
Approximately 170 vertical meters of salt will be dynamically compacted. Dynamiccompaction was validated in a large-scale demonstration at Sandia National Laboratories during1995. As-mined WIPP salt was dynamically compacted to 90% density of in-place rock salt in acylindrical steel chamber simulating the Salt Handling Shaft (Ahrens and Hansen, 1995). Depthof compaction is greater than that achieved by most other methods, allowing the emplacement ofthicker lifts. For example, dropping the 4.69 metric ton tamper 18 m (as specified below) resultsin a compaction depth of approximately 4.6 m, allowing emplacement of lifts 1.5-m high. Mostother compaction methods are limited to lifts of 0.3 m or less. Lift thickness will be increasedand drop height decreased for the initial lift above the concrete plug at the base of the salt columnto ensure that the concrete is not damaged. Drop height for the second and third lifts will bedecreased as well. Although the tamper impact is thereby reduced, three MPE will be deliveredto the entire salt column.
If lifts are 1.5-m thick, the third lift below the surface will receive additional densificationduring compaction of overlying lifts, and this phenomenon will proceed up the shaft.Construction will begin by hoisting the multi-deck stage to the surface and attaching the cable,electromagnet, and tamper to the hoist on the polar crane. The multi-deck assembly will belowered to the placement elevation, and moisture content of the crushed and screened salt will becalibrated. Then the salt will be conveyed at a measured rate via a weighbelt conveyor to avibrator-equipped hopper overlying the 15.2-cm ID slickline. The salt will pass down theslickline and exit a flexible hose connected to the header. A worker will direct the discharge sothat the upper surface of the lift is nominally level and suitable for dynamic compaction. Asecond worker will add potable water, in the form of a fine spray, to the salt as it exits the hose.Water volume will be electronically controlled and coordinated with the weight of the salt toachieve the desired moisture content.
The initial lift above the SMC will be 4.6 m, and drop height will be 6 m. This increasedlift thickness and reduced drop height are specified to protect the underlying SMC plug fromdamage and/or displacement from tamper impact. Compaction depth for a drop height of 6 m isapproximately 3.7 m. Ultimately, the tamper will be dropped six times in each position,resulting in a total of 132 drops per lift in the larger shafts. The drop pattern is shown in FigureB-4. A salt lift 1.5 m high will then be placed and leveled. Following compaction of the initiallift, the multi-deck stage will be positioned so the base of the hoisted tamper is 10 m above thesurface of the salt.
The multi-deck stage will then be secured to the shaft walls by activating hydraulicallypowered locking devices. Hydraulic pressure will be maintained on these units when they are inthe locked position; in addition, a mechanical pawl and ratchet on each pair will preventloosening. The safety factor for the locking devices has been calculated to be approximately 4.5.After locking, tension in the hoisting cables will be relaxed, and centering rams will be activatedto level the decks. Prior to positioning the stage, tension will be applied to the hoisting cables;the centering rams will be retracted; and the locking devices will be disengaged.
The work deck will be hoisted until the base of the retracted tamper is 23 m above thesurface of the salt, where it will be locked into position and leveled as described above. This
B-18

procedure, repeated throughout the salt column, allows emplacement and compaction of threelifts (1.5-m thick) per multi-deck stage move. Depth of compaction for a drop height of 18 m isapproximately 4.6 m. Therefore the third lift below the fill surface will receive a total of 9 MPE(274,560 m kg/m3), matching the energy applied in the successful, large-scale demonstration.
The compactive effect expands laterally as it proceeds downward from the base of thetamper and will effectively compact the salt into irregularities in the shaft wall, as demonstratedin the large-scale demonstration. Although other techniques could be used, dynamic compactionwas selected because it is simple, can be used in the WIPP shafts, and has been demonstrated(Hansen and Ahrens, 1996).
The tamper will be dropped from the hoisted position by turning off the power to theelectromagnet. Immediately upon release, the crane operator will "chase" the tamper bylowering the electromagnet at twice hoisting speed; the magnet will engage the tamper, allowingit to be hoisted for the subsequent drop. Initially, the tamper will be dropped in positions thatavoid impact craters caused by preceding drops. The surface will then be leveled manually andthe tamper dropped in positions omitted during the previous drop series.
Experience gained during the large-scale salt compaction demonstration indicated that aconsiderable volume of dust is generated during the emplacement of the salt, but not duringdynamic compaction. However, because the intake of the rigid vent duct is below the multi-deckstage, workers below the stage will wear respirators during emplacement. They will be the onlyworkers affected by dust during dynamic compaction.
The Air Intake Shaft will require 22 drop positions (Figure B-4). Application of oneMPE requires six drops in each position, for a total of 132 drops per lift. Three MPE, a total of396 drops per lift, will be applied to all salt. After each compaction cycle, the salt surface will beleveled manually and the tamper will be dropped in positions omitted in the preceding dropseries. Two lifts, each 1.8 m high, will then be sequentially placed, leveled, and compacted withtwo MPE, using a 6-m drop height.
Dynamic compaction ensures a tight interface. Salt compacted during the large-scaledynamic compaction demonstration adhered so tenaciously to the smooth interior walls of thesteel compaction chamber that grinders with stiff wire wheels were required for its removal.
B4.5 Grout
Ultrafine sulfate-resistant cementitious grout (Ahrens et al., 1996) is selected as thesealing material. Specifically developed for use at the WIPP, and successfully demonstrated inan in situ test, the hardened grout has a permeability of 1 xlO"21 m2. It has the ability to penetratefractures smaller than 6-microns and is being used for the following purposes:
• to seal many of the microfracrures in the DRZ and ensure a tight interface between SMCand the enclosing rock, and
• to solidify fractured rock behind existing concrete shaft liners, prior to removal of theliner (for worker safety).
The interface between concrete plugs in the Salado Formation (and one in the RustlerFormation, a short distance above the Salado) will be grouted. A 45° downward-opening cone of
B-19

reverse circulation diamond drill holes will be collared in the top of the plugs, drilled in a spinpattern (see Figure B-5), and stage grouted with ultrafine cementitious grout at 3.5 kg/cm belowlithostatic pressure. Stage grouting consists of:
• drilling and grouting primary holes, one at a time;
• drilling and grouting secondary holes, one at a time, on either side of the primary holesthat accepted grout; and
• (if necessary) drilling and grouting tertiary holes on either side of secondary holes thataccepted grout.
Note: For safety, all liner removal tasks will be accomplished from the bottom deck. Inareas where the steel liner is removed, it will be cut into manageable pieces with a cutting torchand hoisted to the surface for disposal. Mechanical methods will be employed to clean androughen the existing concrete shaft liner before placing the Dewey Lake SMC plug in the shafts.
Scale: 1" = 4'
TRI-6121-376-0
Figure B-4. Drop pattern for 6-m-diameter shaft using a 1.2-m-diameter tamper.
B-20

PrimaryGrout Hole
SecondaryGrout Hole
Plan View of Grout Holes in Spin Pattern
Section A - A1
TRI-6121-373-0
Figure B-5. Plan and section views of downward spin pattern of grout holes.
B-21

The work sequence will start 3 m below the lower elevation of liner removal. A 45°upward-opening cone of grout injection holes, drilled in a "spin" pattern (Figure B-6), will bedrilled to a depth subtending one shaft radius on a horizontal plane. These holes will be stagegrouted as described in Section 4.5. Noncoring, reverse circulation, diamond drill equipmentwill be used to avoid plugging fractures with fine-grained diamond drill cuttings. Ultrafinecementitious grout will be mixed on the surface, transferred via the slickline to the upper deck ofthe multi-deck stage, and injected at 3.5 kg/cm2 gage below lithostatic pressure to avoidhydrofracturing the rock. Grout will be transferred in batches, and after each transfer, a "pig"will be pumped through the slickline and header to clean them. Grouting will proceed upwardfrom the lowest fan to the highest. Recent studies conducted in the Air Intake Shaft (Dale andHurtado, 1996) show that this hole depth exceeds that required for complete penetration of theDisturbed Rock Zone (DRZ). Maximum horizontal spacing at the ends of the holes will be 3 m.
The multi-deck stage will then be raised 3 m and a second fan, identical to the first, willbe drilled and grouted. This procedure will continue, with grout fans 3 m apart vertically, untilthe highest fan, located 3 m above the highest point of liner removal, has been drilled andgrouted. Ultrafine cementitious grout was observed to penetrate more than 2 m in theunderground grouting experiment conducted at the WIPP in Room L-3 (Ahrens and Onofrei,1996).
When grouting is completed, the multi-deck stage will be lowered to the bottom of theliner removal section and a hole will be made through the concrete liner. This hole,approximately 30 cm in diameter, will serve as "free-face" to which the liner will be broken.Similar establishment and utilization of free face is a common practice hi hard rock rnining (e.g.,the central drill hole in a series drilled into the rock to be blasted is left empty and used as free-face to which explosives in adjacent holes break the rock). Radial, horizontal percussion holeswill be drilled on a 30-cm grid (or less, if required), covering the liner to be removed. Hydraulicwedges, activated in these holes, will then break out the liner, starting adjacent to the free faceand progressing away from it, from the bottom up. Broken fragments of the concrete liner willfall to the fill surface below.
A mucking "claw," suspended from the trolley of the polar crane, will collect the brokenconcrete and place it in the bucket for removal to the surface. As many as three buckets can beused to speed this work.
B4.6 Compacted Earthen Fill
Local soil, screened to a maximum particle dimension of 13 mm, will be placed andcompacted to inhibit the migration of surficial water into the shaft cross section. Such movementis further decreased by a 12-m high SMC plug at the top of the Dewey Lake Redbeds.
B-22

•* SecondaryGrout Hole
PrimaryGrout Hole
Plan View of Grout Holes in Spin Pattern
&
Section A - A'TRI-6121-374-0
Figure B-6. Plan and section views of upward spin pattern of grout holes.
B-23

B4.6.1 Lower Section
Emplacement of the compacted earthen fill will proceed as follows:
• Moisture content of the screened soil will be determined.
• The soil will then be transferred via the slickline, header, and flexible hose from surfaceto the fill elevation. The moisture content optimal for compaction will be achieved usingthe same procedure as described for compacted salt (Section B4.4). The soil will beemplaced in lifts 1.2 m high (depth of compaction is approximately 3.7 m) anddynamically compacted using a drop height of 18.3 m.
• The fill will be dynamically compacted until its hydraulic conductivity to water isnominally equivalent to that of the surrounding formation.
This procedure will continue until the lower section has been emplaced and compacted. Carewill be exercised at the top of the column to ensure that all soil receives sufficient compaction.
B4.6.2 Upper Section
The upper section contains insufficient room to employ dynamic compaction. Thereforethe screened soil, emplaced as described above, will be compacted by vibratory-impactsheepsfoot roller, vibratory sheepsfoot roller, or a walk-behind vibratory-plate compactor.Because of the limited compaction depth of this equipment, lifts will be 0.3 m high. The top ofthe fill will be coordinated with the WIPP Operating Contractor to accommodate plans fordecommissioning surface facilities and placing niarkers.
B4.7 Schedule
Preliminary construction schedules are included on the following pages. The firstschedule is a concise outline of the total construction schedule. It is followed by individualschedules for each shaft. The first schedule in each shaft series is a truncated schedule showingthe major milestones. The truncated schedules are followed by detailed construction schedulesfor each shaft. These schedules indicate that it will take approximately six and a half years tocomplete the shaft sealing operations, assuming two shafts are simultaneously sealed.
B-24

SEALING SCHEDULE-ALL SHAFTS

ID Task Name DurationYear i
|Qtr ilQtr2|Qtr3|Qtr4Qtr 1|C
rQtri|Qtr2|Qtr3|Qtr4
Year 2 Year 3Qtr 1 iQtr 2|Qtr 3|Qtr 4Qtri|Qtr2|Qtr3|Qtr4
Year 4 YearsQtri|Qtr2|Qtr3|Qtr 4
YearsQtr 1 |Qtr 2JQtr 3|Qtr 4
YeQtr 1|Qtr2
Project Mobilization 15w
Air Intake Shaft Shaft 159.85W
Salt Shaft 115.19w
Exhaust Shaft 129.23W
Wt!jON
Waste Shaft 172.71w
Project Demobilization 8w 1
ProJect:SHAFT SEALING SCHEDULEDate: Tue 7/9/96
Task
Progress
Milestone
Summary
Rolled Up Task
Rolled Up Milestone
Rolled Up Progress
Tue 7/9/96 sealall5.MPP 1

SEALING SCHEDULE-AIR INTAKE SHAFT

ID Task NameYeari
Duration I Qtr1 | Qtr2 | Qtr 3 I QtrTYear 2
Qtr 1 | Qtr 2 | Qtr 3 | Qtr 4Year 3
Qtr1 | Qtr2 | Qtr3 Qtr 1
W
oo
11
15
17
26
28
37
39
48
56
61
63
65
67
71
73
Mobilization
Plant Set-up
Inspect & Scale Shaft-2151'
Install Construction Utilities
Drill & Grout Lining
Shaft Station Monollth-37'
Lower Salado Compacted Clay Column-93.5'
Lower Concrete-Asphalt Waterstop-50'
Compacted Salt Column-563.5"
Middle Concrete-Asphalt Waterstop-50'
Upper Salado Compacted ,Clay Column-344'
Upper Concrete-Asphalt Waterstop-50'
Asphalt Column-138.3"
Concrete Plug-20'
Remove Concrete Shaft Lining
Rustler Compacted Clay Column-234.7'
Compacted Earthen Fill-473'
Concrete Plug-40'
Compacted Earthen FIII-57'
Demobilization
4w
12w
1w
7.17w
11.5w
4.78w
4.96w
8.25w
23.58w
8.25w
18.24w
10.25w
19.41w
5.99w
5.71w
8.36W
7.59w
2.96w
0.65w
3.2w
4-.
•1Project: AIR INTAKE SHAFT
SEALING SCHEDULEDate: Tue 7/9/96
Task
Progress
Milestone
Summary
Rolled Up Task
Rolled Up Milestone <C>
Pagei
Rolled Up Progress

ID1
2
3
4
5
6
7
8
9
10
11
12
13
14
15
16
17
18
19
20
21
22
Task NameMobilization
Mobilize
Plant Set-up
Plant Set-up
Inspect & Scale Shaft-2151'
Inspect & Scale Shaft
Install Construction Utilities
Install Utilities .
Drill & Grout Lining
Drill & Grout Lining
Shaft Station Monollth-37' i (
Construct Bulkheads
Pour Concrete (37' high)
Cure Concrete
Lower Salado Compacted Clay Column-93.5'
Emplace Bentonite Blocks (93.5' high)
Lower Concrete-Asphalt Waterstop-50'
Excavate for Lower Plug
Pour Concrete-Lower Plug (23' high typ.)
Excavate Waterstop
Place Asphalt (4'high typ.)
Cool-down Asphalt
I Year i
Duration I Qtr1 | Qtr2
4wL4w I
12w
12w
1w
1w
7.17W
7.17W
11.5W
11.5w
4.78W
0.8w
0.98w
3w
4.96W
4.96w
8.25W
1.67W
0.28w
0.63W
0.72W
1w
11
Qtr3 Qtr4
•1
1
•
•
Year 2Qtr1 Qtr2 | Qtr3 | Qtr4
• •
•1
1
1
1
Year 3Qtr1 Qtr2 Qtr3 Qtr4 Qtr1
Project: AIR INTAKE SHAFTSEALING SCHEDULE
Date: Tue 7/9/96
Task
Progress
Milestone
• • • • • • • • • • • Sum
Rolle
mary H H H H H I Rolled Up Progress • • • • • • • • • • •
d Up Task
d Up Milestone O> .
Pagei

ID23
24
25
26
27
28
29
30
31
32
33
34
35
36
37
38
39
40
41
42
43
44
Task NameExcavate for Upper Plug
Pour Concrete-Upper Plug (23' high typ.)
Cure Concrete
Compacted Salt Column-563.5'
Emplace & Compact Crushed/Screened Salt
Middle Concrete-Asphalt Waterstop-SO'
Excavate for Lower Plug- ;
Pour Concrete-Lower Plug
Excavate Waterstop
Place Asphalt
Cool-down Asphalt '
Excavate for Upper Plug
Pour Concrete-Upper Plug
Cure Concrete
Upper Salado Compacted Clay Column-344'
Emplace Bentonite Blocks
Upper Concrete-Asphalt Waterstop-50'
Excavate for Lower Plug
Pour Concrete-Lower Plug
Excavate Waterstop
Place Asphalt
Cool-down Asphalt
Duration1.67w
0.28w
2w
23.58w
23.58W
8.25W
1.67W
0.2BW
0.63w
0.72w
1w
1.67W
0.28W
2w
18.24W
18.24W
10.25W
1.67w
0.28w
0.63w
0.72w
1w
YeariQtr 1 Qtr 2 Qtr 3 Qtr 4
•I
1
Year 2Qtr 1 Qtr 2 | Qtr 3 | Qtr 4
1
• • • • 1•1•1
1
1
e
•i
•
• • ••Mi
Year 3Qtri Qtr 2 Qtr 3 | Qtr 4
kmi 1
1
1
1
1
Qtr1
Project: AIR INTAKE SHAFTSEALING SCHEDULE
Date: Tue 7/9/96
Task
Progress
Milestone
• • • • • • • • i Summary I H H I H I H Rolled Up Progre• • • • • • M Rolled Up Task
Rolled Up Milestone < >
Page 2

ID45
46
•47
48
49
50
51
52
53
54
55
56
57
58
59
60
61
62
63
64
65
66
Task NameExcavate for Upper Plug
Pour Concrete-Upper Plug
Cure Concrete
Asphalt Column-138.31
Remove Lining in Key
Remove Chemical Seal Rings
Mobilize to Emplace Asphalt
Asphalt in Salt Section
Asphalt in Lower Lined Section
Complete Asphalt Emplacement
Cool-down Asphalt ' i
Concrete Plug-20'
Remove Concrete Lining & Rock
Remove Liner Plate
Pour Concrete(20' high)
Cure Concrete
Remove Concrete Shaft Lining
Remove 86' of lining—4 zones
Rustler Compacted Clay Column-234.7'
Emplace & Compact Bentonite(234.7' high)
Compacted Earthen Fill-473"
Emplace & Compact Earthen Fill(473' high)
Duration1.67w
0.28w
4w
19.41w
3.76w
0.6w
0.3w
3.62W
1.93W
2.77W
6.43w
5.99W
1.65w
0.13w
0.21w
4w
5.71 w
5.71w
8.36w
8.36w
7.59w
7.59w
YeariQtr 1 | Qtr2 Qtr3 Qtr 4
Year 2Qtr1 | Qtr 2 Qtr 3 Qtr 4
Year 3Qtr1 | Qtr2 | Qtr3 | Qtr4
•I
• I
•i
i
•••
•1
1
•
••1
•i
Qtr1
Project: AIR INTAKE SHAFTSEALING SCHEDULE
Date: Tue 7/9/96
Task
Progress
Milestone
• • • • ^ • • • B RolleRolle
mary H H H H I I I Rolled Up Progress • • • • • • M H Hd Up Task j
d Up Milestone <^>
Page 3

ID Task Name Duration Qtr1Year 1
Qtr2 I Qtr3 I Qtr4Year 2
Qtr 1 I Qtr2 I Qtr3 Qtr4Year 3
Qtr1 I Qtr2 I Qtr3 I Qtr4 Qtr167
68
69
70
71
72
73
74
Concrete Plug-40' 2.96w
Clean Existing Surface 0.6w
Pour Concrete(40' high) 0.36w
Cure Concrete 2w
Compacted Earthen FIII-57' 0.65w
Emplace & Compact Earthen Fill (57' high) 0.65W
Demobilization 3.2w
Demob 3.2w
Project: AIR INTAKE SHAFTSEALING SCHEDULE
Date: Tue 7/9/96
Task
Progress
Milestone
Summary
Rolled Up Task
Rolled Up Milestone
Page 4
Rolled Up Progress

SEALING SCHEDULE-SALT HANDLING SHAFT

ID Task Name Duration QtrYeari
Qtr2 i Qtr3 I Qtr4Year 2
Qtr1 | Qtr2 | Qtr3 | Qtr4~ Qtr1
12
16
18
27
29
38
40
49
57
61
63
65
67
71
73
Mobilization
Plant Set-up
Inspect & Scale Shaft-2164.5'
Install Construction Utilities
Drill & Grout Lining
Shaft Station Monolith-37'
Lower Salado Compacted Clay Column-107'
Lower Concrete-Asphalt Waterstop-50'
Compacted Salt Column-560'
Middle Concrete-Asphalt Waterstop-SO'
Upper Salado Compacted Clay Column-335'
Upper Concrete-Asphalt Waterstop-50'
Asphalt Column-140'
Concrete Plug-20'
Remove Concrete Shaft Lining
Rustler Compacted Clay Column-234'
Compacted Earthen Fill-449'
Concrete Plug-40'
Compacted Earthen Fill-92.5'
Demobilization
4w
12w
1.06w
7.6w
5.3Gw
4.44w
3.06w
8.74w
12.67w
6.74w
9.58w
8.74w
1S.33w
5.32w
1.9w
4.81w
3.65w
2.45w
0.65w
3w
Project: SALT HANDLING SHAFTSEALING SCHEDULE
Date: Tue 7/9/96
Task
Progress
Milestone
Summary
Rolled Up Task
Rolled Up Milestone <C>
Pagei
Rolled Up Progress

ID Task NameYeaM
Duration Qtr1 | Qtr2 | Qtr3 | Qtr4Year 2
Qtr1 Qtr2 Qtr3 Qtr4 Qlr1
td
10
11
12
13
14
15
16
17
18
19
20
21
22
Mobilization
Mobilize
Plant Set-up
Plant Set-up
Inspect & Scale Shaft-2164.5'
Inspect & Scale Shaft
Install Construction Utilities.
Install Utilities
Drill ft Grout Lining
Drill Grout Holes
Grout Lining
Shaft Station Monollth-37"
Construct Bulkheads
Pour Concrete (37' high)
Cure Concrete
Lower Salado Compacted Clay Column-107'
Emplace Bentonite Blocks (107.0' high)
Lower Concrete-Asphalt Waterstop-SO'
Excavate for Lower Plug
Pour Concrete-Lower Plug (23' high-typ)
Excavate Waterstop
Place Asphalt (41 high-typ)
4wl
4w
12wl
12w
1.06w
1.06w
7.6w
7.6w
5.3Sw
2.14w
3.21w
4.44w
0.8w
0.64w
3w
3.06w
3.06w
S.74W
1.38w
0.17W
0.34w
0.3w
•
Project: SALT HANDLING SHAFTSEALING SCHEDULE
Date: Tue 7/9/96
Task
Progress
Milestone
Summary
Rolled Up Task
Rolled Up Milestone
Pagei
Rolled Up Progress

ID Task Name DurationYeari
Q»r1 Qtr2 Qtr3 Qtr4Year 2
Qtr1 Qtr2 Qtr3 Qlr4 Qtri23
24
25
26
27
28
29
30
31
32
33
34
35
36
37
38
39
40
41
42
43
44
Cool-down Asphalt
Excavate for Upper Plug
Pour Concrete-Upper Plug (231 hlgh-typ)
Cure Concrete •
Compacted Salt Column-560'
Emplace & Compact Crushed/Screened Salt
Middle Concrete-Asphalt Waterstop-501
Excavate for Lower Plug
Pour Concrete-Lower Plug
Excavate Waterstop
Place Asphalt
Cool-down Asphalt
Excavate for Upper Plug
Pour Concrete-Upper Plug
Cure Concrete
Upper Salado Compacted Clay Column-335'
Emplace Bentonite Blocks
Upper Concrete-Asphalt Waterstop-50'
Excavate for Lower Plug
Pour Concrete-Lower Plug
Excavate Waterstop
Place Asphalt
1w
1.38w
0.17w
4w
12.67w
12.67w
6.74w
1.38w
0.17w
0.34w
0.3w
1w
1.38w
0.17w
2w
9.58w
9.58w
8.74w
1.38w
0.17w
0.34w
0.3w
Project: SALT HANDLING SHAFTSEALING SCHEDULE
Date: Tue 7/9/96
Task
Progress
Milestone
Summary
Rolled Up Task
Rolled Up Milestone <C>
Page 2
Rolled Up Progress

ID45
46
47
4B
49
SO
51
52
53
54
55
56
57
58
59
60
61
62
63
64
65
66
Task NameCool-down Asphalt
Excavate for Upper Plug,
Pour Concrete-Upper Plug
Cure Concrete
Asphalt Column-140'
Remove Lining In Key
Remove Chemical Seal Rings
Mobilize to emplace asphalt
Asphalt in Salt Section
Asphalt in Lower Lined Section
Complete Asphalt Emplacement
Cool-down Asphalt
Concrete Plug-20'
Remove Concrete Lining & Rock
Pour Concrete (20' high)
Cure Concrete
Remove Concrete Shaft Lining
Remove 72' of lining—4 zones
Rustler Compacted Clay Column-234'
Emplace & Compact Bentonite (234* high)
Compacted Earthen Fill-449'
Emplace & Compact Earthen Fill (449' high)
Project: SALT HANDLING SHAFTSEALING SCHEDULE
Date: TUB 7/9/96
Task
Progress
Milestone
Duration1w
1.38w
0.17w
4w
15.33W
2.02w
0.4w
2w
2.73w
0.25w
1.5W
6.43W
5.32W
1.11W
0.21W
4w
1.9w
1.9w
4.81W
4.81W
3.65W
3.65W
YeariQtr1 Qtr2 | Qtr3 Qtr4
•
• M H M M M I Summary H H I I I i l lWmmmmmam Rolled Up Task
Rolled Up Milestone <0>
Year 2Qtr1 Qtr2 Qtr3 Qtr4
1
•1
• • • ••
1
•
1
•mmm
wm•i
• •
I
Qtr1
• -
•
| Rolled Up Progress • • • • • • • • •
Page 3
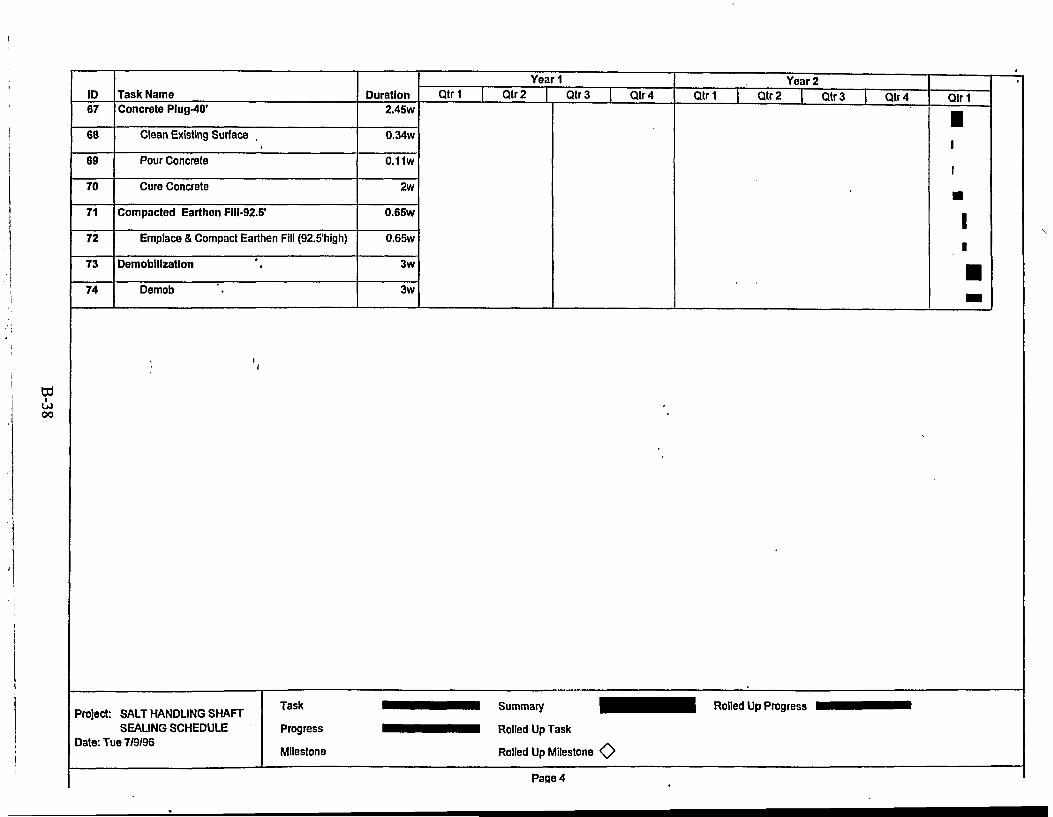
ID Task Name Duration Qtr1Yeari
Qtr2 I Qtr3 | QtrTYear 2
Qtr 1 | Qtr2 | Qtr3 f Qtr4 Qtr167
68
69
70
71
72
73
74
Concrete Plug-40' 2.4Sw
Clean Existing Surface 0.34w
Pour Concrete 0.11w
Cure Concrete 2w
Compacted Earthen FIII-92.5" 0.65w
Emplace & Compact Earthen Fill (92.5'high) 0.65w
Demobilization 3w
Demob 3w
Project: SALT HANDLING SHAFTSEALING SCHEDULE
Date: Tue 7/9/96
Task
Progress
Milestone
Summary
Rolled Up Task
Rolled Up Milestone <0>
Page 4
Rolled Up Progress

SEALING SCHEDULE-EXHAUST SHAFT
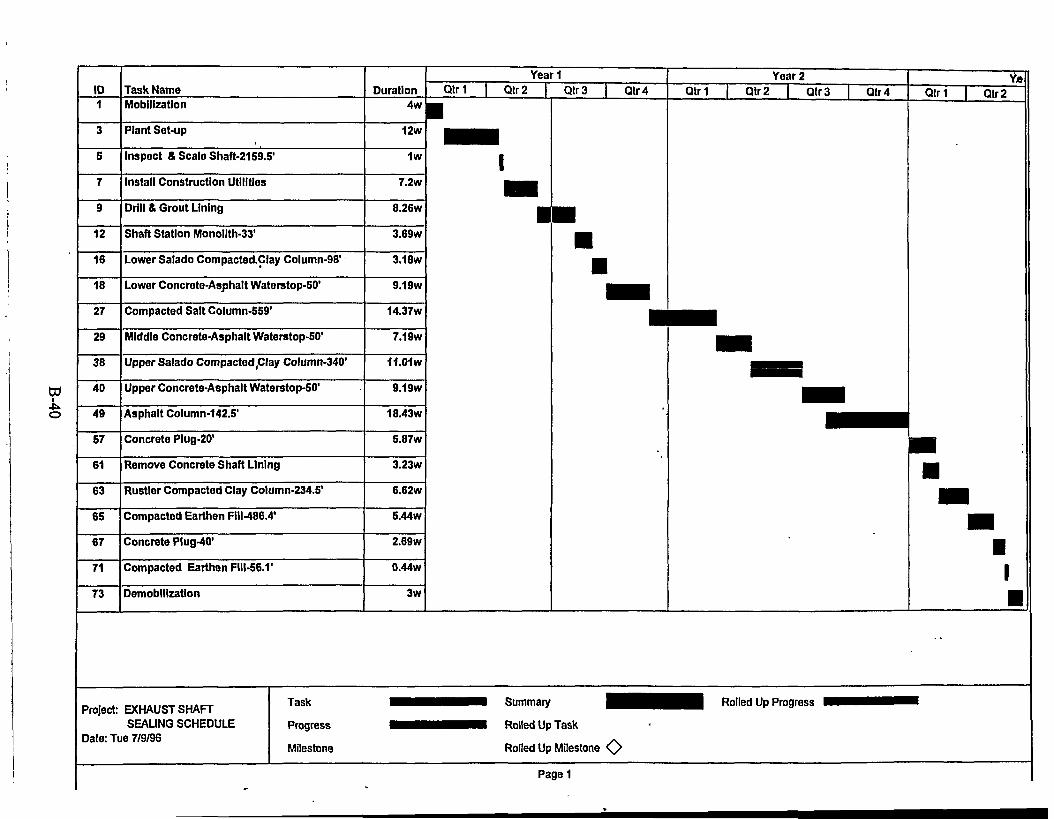
ID Task Name Duration Qtr1Year1
Qtr2 I Qlr3 | Qtr4Year 2
Q(r1 Qtr2 Qtr3 Qtr4 Qtri Qtr2
12
16
18
27
29
38
40
49
57
61
63
65
67
71
73
Mobilization
Plant Set-up
Inspect & Scale Shaft-2159.5'
Install Construction Utilities
Drill & Grout Lining
Shaft Station Monolith-33'
Lower Salado CompactedClay Column-98'
Lower Concrete-Asphalt Watorstop-50"
Compacted Salt Column-559'
Middle Concrete-Asphalt Waterstop-50'
Upper Salado Compacted Clay Column-340'
Upper Concrete-Asphalt Waterstop-50'
Asphalt Column-142.51
Concrete Plug-201
Remove Concrete Shaft Lining
Rustler Compacted Clay Column-234.51
Compacted Earthen Fill-486.4'
Concrete Plug-40"
Compacted Earthen FIII-56.V
Demobilization
4w
12w
1w
7.2w
8.26W
3.69w
3.18W
9.19w
14.37W
7.19w
11.01W
9.19W
18.43W
5.87w
3.23W
6.62w
5.44W
2.69w
0.44W
3w
Project: EXHAUST SHAFTSEALING SCHEDULE
Date: Tue 7/9/96
Task
Progress
Milestone
Summary
Rolled Up Task
Rolled Up Milestone <0>
Page 1
Rolled Up Progress

ID Task NameYear
Duration Qtr1 | Qtr2 | Qtr3 | Qtr4~Year 2 Yo
Qtr1 Qtr2 Qtr3 Qtr4 Qtr1 Qtr2
10
11
12
13
14
15
16
17
18
19
20
21
22
Mobilization
Mobilize
Plant Set-up
Plant Set-up
Inspect & Scale Shaft-2159.5'
Inspect & Scale Shaft
Install Construction Utilities
Install Utilities
Drill & Grout Lining
Drill Grout Holes
Grout Lining
Shaft Station Monollth-331
Construct Bulkheads
Pour Concrete (33' high)
Cure Concrete
Lower Salado Compacted Clay Column-98'
Emplace Bentonite Blocks (98' high)
Lower Concrete-Asphalt Waterstop-50'
Excavate for Lower Plug
Pour Concrete-Lower Plug (231 high-typ)
Excavate Waterstop
Place Asphalt (41 high-typ)
4w
4wl
12w
12w
1w
1w
7.2w
7.2w
8.26w
3.3w
4.96w
3.69w
0.4w
0.29w
3w
3.18w
3.18w
9.19w
1.45w
0.22w
0.47w
0.38w
t
Project: EXHAUST SHAFTSEALING SCHEDULE
Date: Tue 7/9/96
Task
Progress
Milestone
Summary
Rolled Up Task
Rolled Up Milestone
Pagei
Rolled Up Progress

ID Task Name Duration QtriYeari
Qtr2 i Qtrl I Qtr4Year 2
Qtr1 I Qtrl I Qtr3Ye
Qtr4~ Qtr 1 Qtr223
24
25
26
27
28
29
30
31
32
33
34
35
38
37
38
39
40
41
42
43
44
Cool-down Asphalt
Excavate for Upper Plug
Pour Concrete-Upper Plug (23' hlgh-typ)
Cure Concrete
Compacted Salt Column-559'
Emplace & Compact Crushed/Screened Salt
Middle Concrete-Asphalt Waterstop-50'
Excavate for Lower Plug
Pour Concrete-Lower Plug
Excavate Waterstop
Place Asphalt
Cool-down Asphalt
Excavate for Upper Plug
Pour Concrete-Upper Plug
Cure Concrete
Upper Salado Compacted Clay Column-340'
Emplace Bentonite Blocks(340' high)
Upper Concrete-Asphalt Waterstop-50'
Excavate for Lower Plug
Pour Concrete-Lower Plug
Excavate Waterstop
Place Asphalt
1w
1.45w
0.22w
4w
14.37W
14.37w
7.19 w
1.45w
0.22w
0.47w
0.38w
1w
1.45w
0.22w
2w
9.19 w
1.45w
0.22w
0.47w
0.38w
Project: EXHAUST SHAFTSEALING SCHEDULE
Date: Tue 7/9/96
Task
Progress
Milestone
Summary
Rolled Up Task
Rolled Up Milestone
Page 2
Rolled Up Progress

ID Task Name DurationYeari
Qtr1 Qtr2 Qtr3 QtrTYear 2 Ye
Qtr1 Qtr2 Qtr3 Qtr4 Qtr1 Qtr245
46
47
48
49
SO
51
52
53
54
55
58
57
58
59
60
61
62
63
64
65
66
Cool-down Asphalt
Excavate for Upper Plug
Pour Concrete-Upper Plug
Cure Concrete
Asphalt Column-142.5'
Remove Lining in Key
Remove Chemical Seal Rings
Mobilize to Emplace Asphalt
Asphalt in Salt Section
Asphalt in Lower Lined Section
Complete Asphalt Emplacement
Cool-down Asphalt
Concrete Plug-20'
Remove Concrete Lining & Rock
Pour Concrete (201 high)
Cure Concrete
Remove Concrete Shaft Lining
Remove 84' of lining—4 zones
Rustler Compacted Clay Column-234.5'
Emplace & Compact Bentonite(234.5' high)
Compacted Earthen Fill-486.4'
Emplace & Compact Earthen Fill(486.4' high
1w
1.45w
0.22w
4w
18.43W
3.15w
0.5w
2w
2.64w
1.44w
2.27w
6.43w
5.87w
1.7w
0.17w
4w
3.23w
3.23w
6.62w
6.62w
5.44w
5.44W
i "
Project: EXHAUST SHAFTSEALING SCHEDULE
Date: Tue 7/9/96
Task
Progress
Milestone
Summary
Rolled Up Task
Rolled Up Milestone
Page 3
Rolled Up Progress
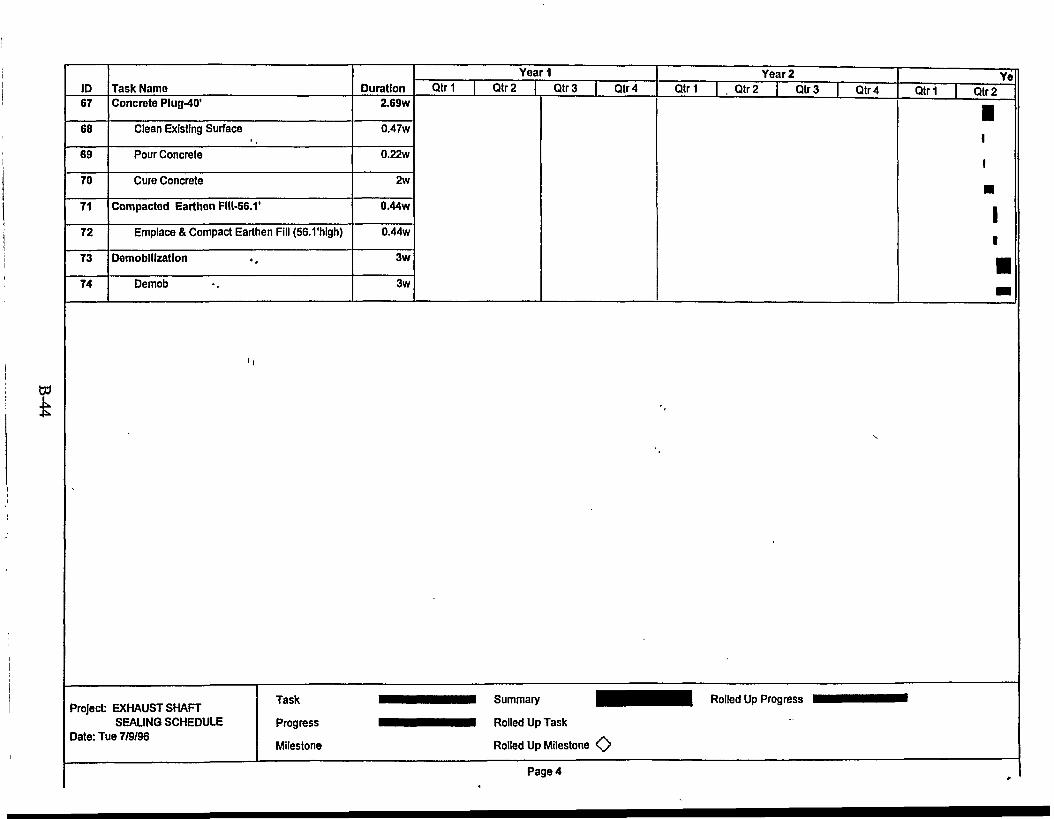
ID Task Name Duration
YeariQtr 1 Qtr2 Qtr 3 Qtr 4
Year 2 YeQtr1 Qtr 2 Qtr 3 Qtr 4 Qtri Qtr 2
67
68
69
70
71
72
73
74
Concrete Plug-40' 2.69w
Clean Existing Surface 0.47w
Pour Concrete 0.22w
Cure Concrete 2w
Compacted Earthen FIII-56.1' 0.44w
Emplace & Compact Earthen Fill (56.1 'high) 0.44w
Demobilization 3w
Demob 3w
Project: EXHAUST SHAFTSEALING SCHEDULE
Date: Tue 7/9/96
Task
Progress
Milestone
Summary
Rolled Up Task
Rolled Up Milestone <0>
Page 4
Rolled Up Progress

SEALING SCHEDULE-WASTE SHAFT

ID Task NameYear 1
Duration I Qtr 1 I Qtr2 I Qtr3 I Qtr4Year 2
Qtr 1 I Qtr2 I Qtr3 I Qtr4Year 3
Qtr1 | Qtr2 | Qtr3 j Qtr4~Ye
Qtr 1 | Qtr2~
12
16
18
27
29
38
40
49
57
61
63
65
67
71
73
Mobilization
Plant Set-up
Inspect & Scale Shaft-2159.51
Install Construction Utilities
Drill & Grout Lining
Shaft Station Monollth-37'
Lower Salado Compacted Clay Column-96'
Lower Concrete-Asphalt Waterstop-50'
Compacted Salt Column-555.5'
Middle Concrete-Asphalt Waterstop-50'
Upper Salado Compacted Clay Column-351.5'
Upper Concrete-Asphalt Waterstop-50'
Asphalt Column-142.3'
Concrete Plug-20'
Remove Concrete Shaft Lining
Rustler Compacted Clay Column-234.7'
Compacted Earthen Fill-447'
Concrete Plug-40'
Compacted Earthen FIII-61.51
Demobilization
4w
12w
1w
7.2w
11.21W
5.17W
5.01w
12.57W
22.87W
10.57W
17.86w
12.57W
20.71W
5.98W
5.07W
10.99W
8.25W
3.04W
1.14w
3.5w
• -
H.
Project: WASTE HANDLING SHAFTSEALING SCHEDULE
Date: Tue 7/9/96
Task
Progress
Milestone
Summary
Rolled Up Task
Rolled Up Milestone < >
Pagei
Rolled Up Progress

ID1
2
3
4
S
6
7
8
9
10
11
12
13
14
15
16
17
18
19
20
21
22
Task NameMobilization
Mobilize
Plant Set-up
Plant Set-up
Inspect & Scale Shaft-2159.51
Inspect & Scale Shaft
Install Construction Utilities'.
Install Utilities ' .
Drill & Grout Lining
Drill Grout Holes
Grout Lining ' i
Shaft Station Monolith-37'
Construct Bulkheads
Pour Concrete (371 high)
Cure Concrete
Lower Salado Compacted Clay Column-96'
Emplace Bentonite Blocks (96' high)
Lower Concrete-Asphalt Waterstop-SO'
Excavate for Lower Plug
Pour Concrete-Lower Plug (23' high-typ)
Excavate Waterstop
Place Asphalt (4' high-typ)
Project:
Date: Ti
WASTE HANDLING SHAFTSEALING SCHEDULE
e 7/9/96
Task
Progress
Milestone
Duration
4w
4w
12w
12w
1w
1w
7.2w
7.2w
11.21W
4.48W
6.73W
5.17W
1w
1.17W
3w
S.01w
5.01W
12.57W
2.72w
0.27W
0.84W
0.75W
MBMH
YeariQtr1 Qtr2
1•
11
•
Qtr3 | Qtr4
f•1
1
••
Year 2Qtr1 Qtr2 | Qtr3 Qtr4
•1
1
1
Year 3Qtr1 Qtr2 Qtr3 Qtr4
YeQtr1 | Qtr2
• • • • • Summary H H B ^ H i Rolled Up Pi H H H Rolled Up Task
Rolled Up Milestone <>
Page 1

ID Task Name DurationYeari
Qtr 1 I Qtr2 | Qtr3 | QtrT QtrYear 2
Qtr 2 I Qtr 3Year 3
Qtr1 | Qtr 2 | Qtr 3 | Qtr 4Ye
Qtr1 I Qtr 223
24
25
26
27
28
29
30
31
32
33
34
35
36
37
38
39
40
41
42
43
44
Cool-down Asphalt
Excavate for Upper Plug,
Pour Concrete-Upper Plug (23' high-typ)
Cure Concrete
Compacted Salt Column-555.5'
Emplace & Compact Crushed/Screened Salt
Middle Concrete-Asphalt Wa.terstop-50'
Excavate for Lower Plug
Pour Concrete-Lower Plug
Excavate Waterstop
Place Asphalt
Cool-down Asphalt
Excavate for Upper Plug
Pour Concrete-Upper Plug
Cure Concrete
Upper Salado Compacted Clay Column-351.5'
Emplace Bentonite Blocks(351.5' high)
Upper Concrete-Asphalt Waterstop-50'
Excavate for Lower Plug
Pour Concrete-Lower Plug
Excavate Waterstop
Place Asphalt
1w
2.72w
0.27w
4w
22.87w
22.87w
10.57W
2.72w
0.27w
0.84w
0.75W
1w
2.72w
0.27w
2w
17.86w
17.86W
12.57W
2.72W
0.27w
0.84w
0.75w
Project: WASTE HANDLING SHAFTSEALING SCHEDULE
Date: Tue 7/9/96
Task
Progress
Milestone
Summary
Rolled Up Task
Rolled Up Milestone <0>
Page 2
Rolled Up Progress
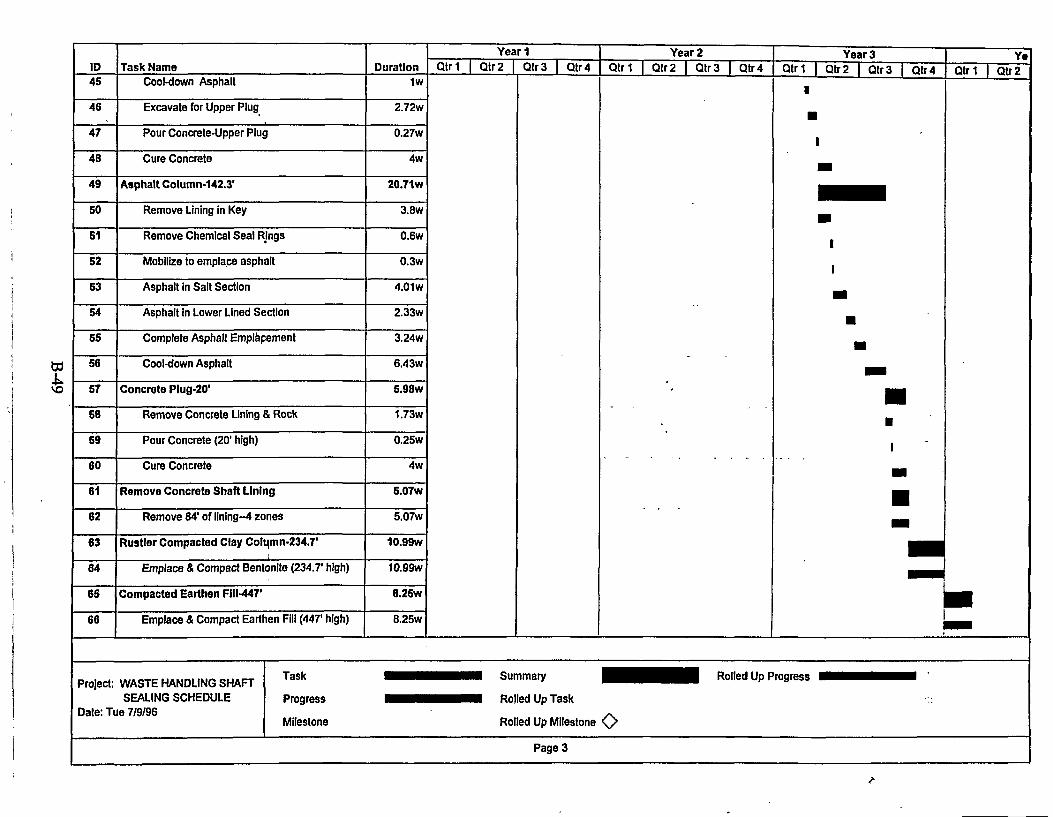
w
ID45
46
47
48
49
50
51
52
53
54
55
56
57
58
59
60
61
62
63
64
65
66
Task NameCool-down Asphalt
Excavate for Upper Plug
Pour Concrete-Upper Plug
Cure Concrete
Asphalt Cotumn-142.3'
Remove Lining in Key
Remove Chemical Seal Rings
Mobilize to emplace asphalt
Asphalt in Salt Section
Asphalt In Lower Lined Section
Complete Asphalt Emplacement
Cool-down Asphalt
Concrete Plug-20'
Remove Concrete Lining & Rock
Pour Concrete (20' high)
Cure Concrete
Remove Concrete Shaft Lining
Remove 84' of lining—4 zones
Rustler Compacted Clay Colqmn-234.7'
Emplace & Compact Bentonite (234.7' high)
Compacted Earthen FIII-447'
Emplace & Compact Earthen Fill (447' high)
Duration
1w
2.72w
0.27w
4w
20.71w
3.8w
0.6w
0.3w
4.01w
2.33w
3.24w
6.43w
5.98W
1.73w
0.25w
4w
5.07w
5.07W
10.99W
10.99W
8.25W
8.25w
YeariQtr1 Qtr2 Qtr3 | Qtr4
Year 2Qtr1 Qtr2 | Qtr3 Qtr4
•
Year 3Qtr1 Qtr2 | Qtr3 Qtr4
1
•1
m
•1
1
•••
H i
•1
H
•
YeQtr1 | Qtr2
X• H
Project: WASTE HANDLING SHAFTSEALING SCHEDULE
Date: Tue 7/9/96
Task
Progress
Milestone
• • • • •HHHHHH
• Summary H H H H H H I Rolled Up P
• Rolled Up Task
Rolled Up Milestone O
Page 3

ID Task Name Duration
YeariQtr1 | Qtr2 | Qtr3 | Q~tr4
Year 2Qtr1 I Qtr2 I Qtr3 I Qtr4
Year 3Qtr1 I Qtr2 I Qtr3 I Qtr4
YeQtr1 I Qtr2
67
68
69
70
71
72
73
74
Concrete Plug-40' 3.04W
Clean Existing Surface 0.64w
Pour Concrete 0.4w
Cure Concrete 2w
Compacted Earthen FIII-61.5' 1.14w
Emplace & Compact Earthen Fill (61.5' high) 1.14w
Demobilization 3.5w
Demob 3.5w
Project: WASTE HANDLING SHAFTSEALING SCHEDULE
Date: Tue 7/9/96
Task
Progress
Milestone
Summary
Rolled Up Task
Rolled Up Milestone
Page 4
Rolled Up Progress

B5. REFERENCESAhrens, E.H., and F.D. Hansen. 1995. Large-Scale Dynamic Compaction Demonstration Using
WIPP Salt: Fielding and Preliminary Results. SAND95-1941. Albuquerque, NM: SandiaNational Laboratories. (Copy on file in the Sandia WIPP Central Files, Sandia NationalLaboratories, Albuquerque, NM [SWCF] as WPO31104.)
Ahrens, E.H., and M. Onofrei. 1996. "Ultrafine Cement Grout for Sealing Underground NuclearWaste Repositories," 2nd North American Rock Mechanics Symposium (NARMS 96),Montreal, Quebec, June 19-21,1996. SAND96-0195C. Albuquerque, NM: Sandia NationalLaboratories. (Copy on file in the SWCF as WPO31251.)
Ahrens, E.H., T.F. Dale, and R.S. Van Pelt. 1996. Data Report on the Waste Isolation PilotPlant Small-Scale Seal Performance Test, Series F Grouting Experiment. SAND93-1000.Albuquerque, NM: Sandia National Laboratories. (Copy on file in the SWCF asWPO37355.)
Boonsinsuk,P.,B.C.Pulles,B.H.Kjartanson,andD.A.Dixon. 1991. "Prediction ofCompactive Effort for a Bentonite-Sand Mixture," 44th Canadian GeotechnicalConference, Preprint Volume, Calgary, Alberta, September 29-October 2,1991. Paper No.64. Waterloo, Ontario: Canadian Geotechnical Society. P t 2,64/1 through 64/12. (Copy onfile in the SWCF.)
Dale, T., and L.D. Hurtado. 1996. "WIPP Air-Intake Shaft Disturbed-Rock Zone Study," 4thInternational Conference on the Mechanical Behavior of Salt, Montreal, Quebec, June 17-18, 1996. SAND96-1327C. Albuquerque, NM: Sandia National Laboratories. (Copy on filein the SWCF.)
Hansen, F.D., and E.H. Ahrens. 1996. "Large-Scale Dynamic Compaction of Natural Salt," 4thInternational Conference on the Mechanical Behavior of Salt, Montreal, Quebec, June 17-18,1996. SAND96-0792C. Albuquerque, NM: Sandia National Laboratories. (Copy on filein the SWCF as WPO39544.)
Knowles, M.K., and C.L. Howard. 1996. "Field and Laboratory Testing of Seal MaterialsProposed for the Waste Isolation Pilot Plant," Proceedings of the Waste Management1996 Symposium, Tucson, AZ, February 25-29,1996. SAND95-2082C. Albuquerque,NM: Sandia National Laboratories. (Copy on file in the SWCF as WPO30945.)
McClintock, F.A., and A.S. Aragon. 1996. Mechanical Behavior of Materials. Reading MA:Addison-Wesley.
Van Sambeek, L.L. 1988. Considerations for the Use of Quarried Salt Blocks in Seal• Components at the WIPP. Topical Report RSI-0340. Rapid City, SD: RE/SPEC Inc.
(Copy on file in the SWCF as WPO9233.)
B-51

Page intentionally blank.
B-52

Appendix C
Fluid Flow Analyses
Appendix C Abstract
This appendix documents four models that were used to evaluate the performance of theproposed WIPP shaft seal system design in terms of fluid-flow (gas and brine) within the sealsystem components and surrounding Disturbed Rock Zone (DRZ). The common hydrogeologicframework used by the models is described in terms of a radially symmetric system centered onthe Air Intake Shaft and extending from the repository level upward through the Salado andRustler Formations. Properties that govern fluid flow within porous media are defined for theseal system components, the host lithologic units, and the DRZ. Laboratory, field, andmechanical modeling studies are utilized to develop a conceptualization of the DRZ, whichincludes a time-varying permeability within the Salado Formation dependent on depth andrigidity of adjacent seal components. Model 1 is a completely saturated numerical flow modeland is used to evaluate brine flow down the shaft from the Rustler Formation to the compactedsalt column component during the 200-year period immediately after seal emplacement.Model 2 is a two-phase (gas and brine) numerical flow model used to evaluate gas flow up fromthe repository to the compacted salt column as well as pressure within the compacted salt columnduring the same 200-year period. A compacted salt reconsolidation submodel is incorporated,which predicts crushed salt permeability as a function of time, pressure, and depth within thecolumn. Model 3 is a fully saturated numerical flow model and is used to evaluate brine flowupward within the seal system during the time period from 400 to 10,000 years after sealemplacement under ambient formation pressure conditions. Model 4 utilizes simple analyticalrelationships to analyze the potential brine flow through the shaft seals attributable to a range ofnonhydrostatic natural head conditions between the Magenta and Culebra, the two primarywater-bearing members' of the Rustler Formation. The seal-system performance models wereused to examined fluid-flow sensitivity to various assumptions of DRZ continuity, the existenceof asphalt within concrete seal components, and different repository pressure loading scenarios.
C-l

Page intentionally blank.
C-2

Contents
Cl. INTRODUCTION 7C2. DEFINITION OF PERFORMANCE MODELS 7C3. HYDROGEOLOGIC FRAMEWORK 9
C3.1 Stratigraphy 9C3.2 Observed Vertical Gradients 12C3.3 Shaft Seal Material Properties 13
C3.3.1 Saturated Flow Parameters 15C3.3.2 Two-Phase Flow Parameters 16
C3.4 Host-Rock Properties .'. 17C3.4.1 Permeability and Hydraulic Conductivity 17C3A2 Porosity 23C3.4.3 Formation Compressibility 23C3.4.4 Two-Phase Properties of the Salado 24
C3.5 DRZ Properties 25C3.5.1 Model for Calculating the Effective DRZ Permeability 27C3.5.2 Model DRZ Effective Permeability r,29
C4. FLOW DOWN FROM THE RUSTLER (MODEL 1) 31.C4.1 Statement of Problem „ 31C4.2 Performance Model 1 Description 31
C4.2.1 Conceptual Model and Assumptions 31C4.2.2 Numerical Method 36C4.2.3 Model Geometry and Boundary Conditions 36C4.2.4 Model Parameters 45
C4.3 Performance Model Results 45C5. GAS MIGRATION AND CONSOLIDATION OF COMPACTED SALT COLUMN(MODEL 2) 53
C5.1 Statement of Problem 53C5.2 Performance Model 2 Description 53
C5.2.1 Conceptual Model and Assumptions 53C5.2.2 Numerical Model 55C5.2.3 Model Geometry and Boundary Conditions 56C5.2.4 Model Parameters 63
C5.3 Performance Model Results 63C6.0 FLOW UP FROM THE SALADO (MODEL 3) 72
C6.1 Statement of Problem .A 72C6.2 Performance Model Description 73
C6.2.1 Conceptual Model and Assumptions 73C6.2.2 Numerical Method 75C6.2.3 Model Geometry and Boundary Conditions 75C6.2.4 Model Parameters 76
C6.3 Performance Model Results 76C7. INTRA-RUSTLER FLOW (MODEL 4) 78
C-3

C7.1 Statement of Problem 78C7.2 Performance Model Description 78
C7.2.1 Conceptual Model and Assumptions 78C7.2.2 Analytical Approach 80C7.2.3 Model Parameters 81
C7.3 Performance Model Results 83C8. REFERENCES 88
Figures
Figure C-l. AIS field permeability results 28Figure C-2. Log-linear model for the calculation of an effective permeability of the DRZ 29Figure C-3a. Full shaft model grid (top) 37Figure C-3b. Full shaft model grid (bottom) 38Figure C-4. Permeability fields for Run 1 (base case) 46Figure C-5. Permeability fields for Run 1 (base case). 47Figure C-6. Model 1 flow rates .'. 48Figure C-7. Cumulative flow at 200 years 50Figure C-8. Pressure distributions for Run 1 (base case) •..„ 51 .Figure C-9. Pressure distributions for Run 1 (base case) 52Figure C-10. Conceptual diagram of compacted salt column performance model
components 54Figure C-l 1. Grid used by the compacted salt column performance model 57Figure C-12. Two specifications of pressure at the base of the shaft 62Figure C-13. Rate of change in log permeability (fractional density) with pressure
and depth 64Figure C-l4. Reconsolidation surface for the best-fit permeability/fractional density
predictor 65Figure C-15. Calculated pressure versus time after seal emplacement at the top, middle, and
bottom of the compacted salt column (base case) 67Figure C-l6. Calculated salt column permeability versus elevation within the column for
several times following seal emplacement (base case) 68Figure C-l7. Calculated pressure versus time after seal emplacement at the top, middle, and
bottom of the compacted salt column (Run 2) 69Figure C-l8. Calculated salt column permeability versus elevation within the column for
several times following seal emplacement (Run 2) 70Figure C-l9. Pressure contours at 75 years for base case and for 95% permeability/fractional
density predictor (Run 2)7 71Figure C-20. Comparison of calculated pressure results for base case and continuous DRZ
with no watefstops (Run 6) 73Figure C-21. Calculated salt column permeability versus elevation within the column for
several times following seal emplacement (Run 6: Rustier flow included,continuous DRZ, no waterstops) 74
Figure C-22. Cumulative gas flow from the repository to the compacted salt column 75
C-4

Figure C-23. Permeability fields for Runs 1 through 3 (t > 400 years) 77Figure C-24. Intra-Rustler flow conceptual model 79Figure C-25. Effect of an injection well on a unidirectional flow field 82Figure C-26. Sensitivity of flow rate between Culebra and Magenta to head difference
(base case) 84Figure C-27. Sensitivity of flow-field disturbance to head difference (base case) 85Figure C-28. Sensitivity of flow rate between Culebra and Magenta to DRZ radius
(continuous DRZ) 86Figure C-29. Sensitivity of flow-field disturbance to DRZ radius (continuous DRZ) 87
Tables
Table C-l. Summary of Salado Stratigraphic Units Merged into Salado Model CombinedUnits 10
Table C-2. Freshwater Head Estimates in the Vicinity of the Air Intake Shaft 13Table C-3. Bentonite Compacted Clay Parameters 13Table C-4. Asphalt Parameters .'. 14Table C-5. Compacted Salt Parameters 14Table C-6. Concrete Parameters : 14Table C-7. Earthen Fill Parameters ....15.Table C-8. Capillary Pressure and Relative Permeability Model Parameters for Compacted
Clay, Concrete, Reconsolidated Salt, and Earthen Fill 15Table C-9. Summary of Permeability and Hydraulic Conductivity, Porosity, and
Compressibility for the Rustler Modeled Lithologic Units 18Table C-10. Summary of Permeability and Hydraulic Conductivity, Porosity, and
Compressibility for the Salado Modeled Lithologic Units 18Table C-l 1. Testing and Analysis Summary for Salado Halite 19Table C-12. Salado Brine Seepage Intervals(1) 20Table C-13. Testing Summary for Rustler Formation 22Table C-14. Summary of Literature Values for Formation Porosities 23Table C-15. Salado Two-Phase Properties 25Table C-l6. Model DRZ permeability for base-case conceptualization (corrected for model
DRZ area) 32Table C-17. Full-Shaft Model Vertical Layers 39Table C-18. Full-Shaft Model Radial Gridding 43Table C-19. Performance Model 1 Simulations 45Table C-20. Vertical Layers of the Compacted Salt Column Performance Model 58Table C-21. Compacted Salt Column Performance Model Radial Gridding 60Table C-22. Compacted Salt Column Performance Model Simulations 66Table C-23. Performance Model 3 Simulations 76Table C-24. Comparison of Flow Rates Up the Shaft/DRZ from Simulations that Incorporate
the Measured Pressure Conditions 78Table C-25. Regional Darcy Velocities for Culebra and Magenta Members of the Rustler
Formation 83
C-5

Page intentionally blank.
C-6

C1. INTRODUCTION
This appendix describes analyses conducted to quantify the fluid-flow performance of theWIPP shaft seal system design. The appendix is organized in the following manner. First, thestatements of the problems to be solved are developed. The problem statements are introduced interms of performance models. The analysis sections of this appendix are organized in terms ofthese performance models. For each performance model, the conceptual model is describedalong with a description of the quantitative method used. Each performance calculation isdefined in terms of the relevant assumptions, parameters, and boundary conditions. Finally,results from each performance model are presented. The numerical codes SWIFT II (Version2F) and TOUGH28W (Version 2.02) have been used in this appendix to quantitatively analyzefluid-flow performance for the WIPP shaft seal system.
The fluid-flow analyses presented in this appendix were performed using SI units.Dimensions, parameter values, and performance model results will be presented in SI units.However, graphical depiction of the models used will be presented in terms of feet above meansea level (ft msl) to facilitate comparisons with seal system design drawings.
C2. DEFINITION OF PERFORMANCE MODELS
Evaluation of the fluid-flow performance of the shaft seal system is facilitated throughdefinition of relevant performance models. Each performance model is derived fromperformance measures that quantify migration of fluids within and through the system. Thisapproach differs in scope from that of the assessment of the WIPP repository. In the latter case, ageneral system model is developed in an iterative manner. Physical processes that may result incontaminant release are systematically identified and evaluated through results of the systemmodel simulations. The performance models defined in this appendix are specific toperformance measures applicable to the shaft seal system. These models were developedthrough assessment of the physical characteristics of the WIPP shaft sealing system, thesurrounding media, and the sealing functions that are described in detail in Section 4 of the mainreport.
Qualitative design guidance has been developed for the shaft seal system based on thefunction of the shaft seal system. This guidance seeks (1) to limit the migration of radiologicalor other hazardous constituents from the repository horizon to the regulatory boundary over a10,000-year regulatory period and (2) to limit groundwater flow into and through the shaftsealing system. Additional qualitative design guidance arises from special requirements of thecompacted salt column. The salt column requires reconsolidation, a process that can beadversely affected by significant pore pressures within the column. This guidance seeks (3) tolimit both groundwater and repositoryrgenerated gas from flowing into the compacted saltcolumn.
The primary potential source of significant groundwater flow to the shaft sealing systemcomes from the Rustler Formation. Because of the low permeability of the Salado Formation, itis isolated from active groundwater circulation. However, because the Salado is significantlyover-pressured relative to the Rustler Formation (Beauehim et al., 1993), the Salado Formation
C-7

represents a possible source of long-term upward flow from the repository horizon through theseal system.
The motivations for limiting brine migration in the seal system are: (1) to limit brinemigration from the Rustler to the repository during repressurization of the seal system; (2) toprevent significant pore pressures from building in the compacted salt column and potentiallyaffecting reconsolidation; (3) to limit the interconnection of water-bearing strata in the Rustier;and (4) to limit brine migration upward from the Salado. Likewise, the motivations for limitinggas and brine migration up the seal system from the repository are: (5) to limit upward fluid flowto the accessible environment; and (6) to prevent significant pore pressures from building in thecompacted salt column.
These motivations, together with the features and processes that underlie them, can besynthesized into four flow-performance models:
Model 1: Flow Down from the Rustler
Model 2: Gas Migration and Compacted Salt Column Consolidation
Model 3: Flow up from the Salado
Model 4: Intra-Rustler Flow
These performance models are coupled or interdependent. For example, flow from the Rustler(Model 1) could be affected by the consolidation (permeability) of the compacted salt column(Model 2). Likewise, Model 2 performance could be affected by the flow from the Rustler(Model 1). Model 1 will be evaluated first, followed by the analysis of Model 2. Models 3 and 4will be evaluated separately.
Several analysis assumptions are shared among all the performance models and are listedbelow.
• Each analysis uses the Air Intake Shaft (AIS) as the shaft analyzed. It is assumed that theAIS analysis is representative of the three other WIPP shafts.
• The stratigraphy used in these performance calculations is consistent with the AISstratigraphy as presented by Holt and Powers (1990) and as summarized by DOE (1995).
• A radial model geometry is assumed.
• Isothermal conditions are considered. This means that fluid flow driven by temperaturegradients is assumed to be negligible.
• Each shaft can be considered independently. This means that it is assumed that nohydraulic interference exists between shafts.
•" Flow is considered through the-ihtact rocks, the seal materials, and the disturbed rockzone (DRZ).
• The DRZ can appropriately be described as having its largest permeability at theshaft/DRZ contact and approaching intact permeabilities at its outer extent. Thepermeability is assumed to vary log-linearly from the shaft/DRZ interface to the outerextent of the DRZ (intact rock).
C-8

• For Models 1 and 2, a preclosure period of 50 years is assumed. During the preclosureperiod, the shaft is held at atmospheric conditions.
The analyses presented in this appendix are deterministic and do not account for the full-range of potential outcomes that may be expected by performing a stochastic analysis allowingparameters to randomly vary across their respective uncertainty ranges. A stochastic analysis ofthe complete disposal system was conducted by WIPP PA for the 40 CFR191 ComplianceCertification Application of the WIPP (DOE, 1996). This analysis addressed the ranges of sealsystem parameters as applicable to the behavior of the disposal system. The analyses presentedin this report address those parameters that are considered the most uncertain and to which theprimary performance measures (flow rates) are most sensitive. These parameters include (1) thepermeability of the DRZ, (2) the relationship between compacted salt density and permeability,and (3) the repository gas pressure applied at the base of the shaft seal system. The prediction of •brine-flow migration down the shaft system (Model 1) is performed with a saturated flow model,which estimates the flow. In addition, a limited sensitivity analysis was performed, whichprovided a range in model predictions for variations in what are considered to be importantprocesses. These processes are incorporated in-modelparameters that address (1) the verticalcontinuity of the DRZ, (2) the healing rate against the concrete-asphalt waterstops, (3) therelationship between compacted salt density and permeability, and (4) the repository gas pressureapplied at the base of the shaft sealing system.
C3. HYDROGEOLOGIC FRAMEWORK
This section discusses the hydrogeologic framework for the hydraulic analysis of theperformance of the WIPP shaft seal system. The hydrogeologic framework includes (1) thestratigraphy of the host rocks and how it is conceptualized for the performance models; (2) theambient fluid pressure profile within the host rocks; (3) and the hydraulic parameters describingthe seal system, the host rocks, and the DRZ.
The properties that govern fluid flow within porous media are defined for the sealcomponents, the host lithologic units, and the DRZ. Both single-phase (SWIFT II) and multi-phase (TOUGH28W) fluid flow codes were used in these calculations.
C3.1 Stratigraphy
The stratigraphy of the host rocks adjacent to the shaft from the repository horizon to thesurface is composed of the Salado Formation, the Rustler Formation, the Dewey Lake Redbeds,and the surficial Santa Rosa and Gaturia Formations. Dune sand and caliche overlie thesediments at the surface. The primary water-bearing strata are confined to the Rustler and SaladoFormations. Therefore, the discussion'of stratigraphy will focus on the Salado and RustlerFormations.
The reference stratigraphy used to develop the performance models in this appendix isbased on the shaft mapping of the AIS (Holt and Powers, 1990). The detailed stratigraphy of theRustler and Salado Formations in the AIS is also summarized in Appendix A of DOE (1995).The detailed stratigraphy will not be discussed here.
C-9

The detailed modeling of the discrete stratigraphy present in the Rustler and Saladoformations presents a challenge. Several Salado marker beds are very thin, with thicknesses lessthan 0.5 m in many instances. To reduce the total number of grid cells to a manageable level inthe performance models, several individual stratigraphic units were merged into single modelcombined units. Units were merged together based on proximity, thickness, and lithology.Table C-1 lists the Salado Formation combined units and the individual beds that were merged toform them. Rock properties of the combined stratigraphic units were calculated based on thethickness-weighted arithmetic mean of the rock properties of individual beds composing thecombined units. DRZ permeabilities of the combined stratigraphic units were calculated basedon the thickness-weighted harmonic mean.
Table C-1. Summary of Salado Stratigraphic Units Merged into Salado Model Combined Units
CombinedUnit Name
Unitl
Unit 2
Unit 3
-"
Unit 4
Combined UnitThickness (m)
5.79
8.05
3.57
•*
5.79
StratigraphicUnit
MB103 • •
MB 104
MB105
MB106
MB107
MB108
MB109
MB110
MB111
MB112
MB113
MB114
MB115
MB116_-
MB117
MB118
MB119
MB120
Zone A
Rock Type
Anhydrite(1)(2)
Anhydrite
Anhydrite
Anhydrite
Polyhalite
Polyhalite
Anhydrite(1)(2)
Polyhalite
Polyhalite
Polyhalite
Polyhalite
Polyhalite
Polyhalite
Polyhalite
Polyhalite
Polyhalite
Polyhalite
Polyhalite
Halite(1)
Individual UnitThickness (m)
5.03
0.30
0.30
0.15
0.15
0.15
7.74
0.34
0.18
0.61
0.30
0.30
1.07
0.76
0.46
0.79
0.61
0.27
3.05
C-10

Table C-l. Summary of Salado Stratigraphic Units Merged into Salado Model Combined Units
CombinedUnit Name
Unit 5
Unit 6
Unit 7
Unit 8
Unit 9
Combined UnitThickness (m)
4.72
3.96
11.83
2.29
4.75
StratigraphicUnit
MB121
MB 122
MB 123
MB124
Zone B
ZoneC
MB126
MB127
MB128
ZoneD
ZoneE
ZoneF
ZoneG
ZoneH
MB 129
Zone I
MB130
MB131
Zone J
MB132
MB133
—
Unnamed
MB134
MB135
Rock Type
Polyhalite
Polyhalite
Anhydrite
Anhydrite(1)
Halite(1)
Halite(1)
Polyhalite
Polyhalite
Polyhalite
Halite(1)
Halite(1)
Halite(1)
Halite(1)
Halite(1)
Polyhalite(1)
Halite(1)
Polyhalite
Polyhalite
Halite(1)
Polyhalite
Polyhalite
Anhydrite
Anhydrite(2)
Anhydrite
Individual UnitThickness (m)
0.30
0.30
1.98
2.74
0.91
2.74
0.30
0.79
1.07
3.20
0.61
0.91
0.61
1.80
0.46
1.74
0.64
0.30
1.22
0.30
0.46
0.76
3.69
0.30
C-ll

Table C-l. Summary of Salado Stratigraphic Units Merged into Salado Model Combined Units
CombinedUnit Name
Unit 10
Unit 11
Combined UnitThickness (m)
0.49
StratigraphicUnit
MB136
MB137
MB138
Anhydrite A
Rock Type
Anhydrite®
Anhydrite
Anhydrite
Anhydrite
Individual UnitThickness (m)
4.30
0.40
0.18
0.30
(1) Identified brine seepage interval.(2) Anhydrite unit greater than 3 m in thickness.
C3.2 Observed Vertical Gradients
Heads within the Rustler and between the Rustler and Salado formations are not inhydrostatic equilibrium. Mercer (1983) recognized that heads at the Rustler/Salado transition(referred to as the brine aquifer and not present in the vicinity of the WIPP shafts) indicate anupward hydraulic gradient from that zone to the Culebra. Later, with the availability of morehead measurements within the Salado and Rustler, Beauheim (1987) provided additional insightinto the potential direction of vertical fluid movement within the Rustler. He reported that thehydraulic data indicate an upward gradient from the Salado to the Rustler.
Formation pressures in the Salado Formation have been decreased in the near vicinity ofthe WIPP underground facility. The highest, and thought to be least disturbed, estimatedformation fluid pressure from hydraulic testing is 12.55 MPa estimated from interpretation oftesting within borehole SCP01 in MB139 just below the underground facility horizon (Beauheimet al., 1993). The freshwater head within MB139, based on the estimated static formationpressure of 12.55 MPa, is 1663.6 m (5458 ft) above mean sea level (msl).
Heads in the Rustler have also been impacted by the presence of the WIPP shafts. Theseimpacts in the Culebra were significant in the 1980s, with a large drawdown cone extendingaway from the shafts in the Culebra (Haug et al., 1987). The undisturbed head of the Rustler/Salado contact in the vicinity of the AIS is estimated to be approximately 936.0 m (3071 ft) msl(Brinster, 1991). The undisturbed head in the Culebra is estimated to be approximately 926.9 m(3041 ft) msl in the vicinity of the AIS (LaVenue et al., 1990). The undisturbed head in theMagenta is estimated to be approximately 960.1 m (3150 ft) msl (Brinster, 1991).
The disturbed and undisturbed heads in the Rustler are summarized in Table C-2. Alsoincluded is the freshwater head of MB 139 based on hydraulic testing in the WIPP underground.Consistent with the vertical flow directions proposed by previous investigators, estimatedvertical gradients in the vicinity of the AIS before the shafts were drilled indicate a hydraulicgradient from the Magenta to the Culebra and from the Rustler/Salado contact to the Culebra.There is also the potential for flow from the Salado Formation to the Rustler Formation.
C-12

Table C-2. Freshwater Head Estimates in the Vicinity of the Air Intake Shaft
Hydrologic Unit
Magenta Member
Culebra Member
Lower UnnamedMember
Rustler/Salado Contact
Salado MB139
FreshwaterUndisturbed
960.1(1)
926.9(1)
—
936.0 - 940.0(1)
1663.6(2)
Head(masl)Disturbed
948.8{2)
(H-16)
915.0(2)
(H-16)
953.4(2)
(H-16)
—
—
Reference
Brinster(1991)
Beauheim(1987)
LaVenue et al. (1990)
Beauheim(1987)
Beauheim (1987)
Brinster(1991)
Beauheim et al. (1993)
(1) Estimated from contoured head surface plot based primarily on well data collected before shaft construction.(2) Measured through hydraulic testing and/or long-term monitoring.
C3.3 Shaft Seal Material Properties
The WIPP shaft seal system is composed of four primary materials: compacted clay,compacted salt, salt-saturated concrete, and asphalt. Eathern fill material is specified for theshafts in the near-surface regions. The performance models described in Section 2 requirequantitative values for certain properties of the seal materials. These properties may be broadlydivided into two categories: saturated flow parameters and two-phase flow parameters. Saturatedflow parameters include intrinsic permeability, porosity, and compressibility of the materials, aswell as the initial pore pressure of the components. Necessary parameters for two-phase flowwill depend on the selection of an appropriate conceptual model for two-phase flow. Thefollowing sections describe the process used in the selection of saturated and two-phase flowparameters for the performance models presented in Sections C4, C5, and C6. Values for theseparameters are summarized in Tables C-3 through C-8.
Table C-3. Bentonite Compacted Clay Parameters
Parameter
Intrinsic Permeability (m2)
Porosity (m3/m3)
Pore compressibility (I/Pa)-"Upper Salado clayLower Salado clay
Rustler clay column
Initial Pressure (Pa)
Initial Water Saturation
Value
5xlO"19
0.24
1.81xlO"9
1.59xlO*9
1.96xlO"9
101356.5
0.79
C-13

Table C-4. Asphalt Parameters
Parameter
Intrinsic Permeability (m2)
Porosity (m3/m3)
Pore compressibility (1/Pa)
Initial Pressure (Pa)
Initial Water Saturation
Value
lxlO"20
0.01
2.97xlO-8
101356.5
0.0
Table C-5. Compacted Salt Parameters
Parameter
Intrinsic Permeability (m2)
Porosity (m3/m3)
Pore compressibility (1/Pa)
Initial Pressure (Pa)
Initial Water Saturation
Value
.. 7.9xl0'13to6.3xl0-21(1)
0.05
8.5xW10
101356.5
0.32
(1) Section C5.3.
Table C-6. Concrete Parameters
Parameter
Intrinsic Permeability (m2)0 to 400 years
400 to 10000 years
Porosity (m3/m3)
Pore compressibility (1/Pa)
Initial Pressure (Pa)
Initial Water .Saturation
Value
1.78xlO"19
l.OxlO'14
0.0227
2.64xlO"9
101356.5
1.0
C-14

Table C-7. Earthen Fill Parameters
Parameter
Intrinsic Permeability (m2)
Porosity (m3/m3)
Pore compressibility (I/Pa)
Initial Pressure (Pa)
Initial Water Saturation
Value
lxlO" 1 4
0.32
3.1X10⁻⁸
101356.5
0.8
Table C-8. Capillary Pressure and Relative Permeability Model Parameters forCompacted Clay, Concrete, Reconsolidated Salt, and Earthen Fill
Parameter
Threshold Pressure (Pa)
Lambda (X)
Residual Water Saturation
Residual Gas Saturation
Value
Pt = 5.6xl0-7k-°346
0.94
0.2
0.2
C3.3.1 Saturated Flow Parameters
The simplest approximation of flow can be derived from Darcy's Law, an empiricalrelationship that demonstrates that flow through a porous material depends directly on thehydraulic gradient, fluid viscosity, and material permeability. The hydraulic gradient willdepend on the physical system, as will fluid viscosity. For an engineered system such as theWIPP shaft sealing system, it is possible to limit flow by specifying ver low materialpermeabilities. It is recognized that fluid flow through the WIPP shaft sealing system is complexand that a simple Darcy flow analysis will not suffice. Nonetheless, the importance of sealmaterial permeability and the ability to engineer low-permeability materials can be justifiablyretained in the performance analysis of the seal system. The specifications for seal materials arediscussed in considerable detail in Appendix A. The analyses presented in this appendix focuson the expected behavior of the seal system within the context of each performance model.Because of uncertainty in the consolidation process for crushed salt, deterministic calculationsare presented that capture this uncertainty. In all other cases, the selected permeability reflectsconfidence that the seal components will be constructed in a manner consistent with thespecifications put forth in Appendix A. The most probable value for each material permeabilitywas used for the analyses, except as noted otherwise in the text.
Unlike TOUGH28W, SWIFT II requires input of hydraulic conductivity rather thanintrinsic permeability. The conversion from permeability to hydraulic conductivity in this report
C-15

will use a fluid density of 1230 kg/m3, an acceleration of gravity of 9.792 m/s , and a fluidviscosity of 1.8x10'3 Pa • s. These fluid properties are representative of a WIPP saturated brine.
Material porosity and compressibility relate to the storage capacity of a porous media.Sensitivity studies conducted previously (WIPP PA, 1992-1993) have demonstrated that fluidflow is not significantly impacted by material storage capacity. With the exception of thecrushed salt column permeability, the performance measures identified for the shaft seal systemrelate to fluid flow. As discussed in the previous paragraphs, the uncertainty in the salt columnconsolidation process is addressed in the relevant performance model. Variations in seal materialporosity and compressibility were not included in these analyses. The most probable values forthese parameters were selected for use in the performance models (DOE, 1996).
The pressure in the open shafts is atmospheric. It was assumed that the initial porepressure for all seal materials was also atmospheric. Values for the saturated flow parametersand initial conditions for all seal materials are presented in Tables C-3 through C-7. Thesevalues are consistent with the most probable values listed in Appendix PAR of the WIPPCompliance Certification Application (DOE, 1996). Additional details regarding the uncertaintyin these parameters are presented as appropriate laterin the text.
C3.3.2 Two-Phase Flow Parameters
Two conditions necessitate consideration of two-phase flow within the shaft seal system.The first is that the seal system will be partially saturated with respect to brine at the time ofconstruction. The second relates to the possibility that gas will be generated by the waste forms,and this gas could migrate to the base of the sealed shafts. Modeling a system that has twophases requires knowledge of the two-phase properties, which are characterized by capillarypressure and relative permeability curves for each phase. Ideally, each material will have a set ofcharacteristic curves derived from experimental data. In practice, however, these curves rarelyexist for the precise materials being modeled. The curves can be estimated using functionalrelationships found in the literature (Brooks and Corey, 1966; van Genuchten, 1980; Parker et al.,1987). Webb (1996) performed a literature review of the relationships for determining two-phase characteristic curves. Based on those comparisons, he concluded that no single model bestfits all the data, and he further recommended the use of two models for future modeling activitiesat the WIPP. He referred to these two models as the mixed Brooks and Corey model and the vanGenuchten/Parker model. The van Genuchten/Parker model was implemented in the two-phasecalculations presented in this appendix.
Based on literature searches, two-phase parameters for the Brooks and Corey model werederived. These parameters were applied to all seal materials, with the exception of asphalt.Parameters necessary fox the van Genuchten/Parker model can be derived from those specifiedfor the Brooks and Corey model. The necessary parameters are the threshold pressure, pore sizedistribution index (X), residual water saturation, and residual gas saturation. An empiricallyderived relationship between threshold pressure and permeability (Davies, 1991) is used fordetermining the threshold pressure. The values used for two-phase flow parameters aresummarized in Table C-8.
C-16

The initial saturation condition must also be specified for the seal system. The initialliquid saturation state is derived from the following relationship:
S^wyQ^- (C-l)
where
S = the liquid saturation
y = the specific gravity of the material
w = the moisture content of the material
<j> = the material porosity.
For all materials, the liquid was assumed to be brine. Porosity and moisture content areengineered parameters specified for each material (DOE, 1996).
The capillary pressure model for asphalt is the. only exception to the parameters describedabove. Asphalt is a hydrophobic material. Using the parameters described for other sealmaterials and the low brine saturation of the asphalt, this seal component would develop a largesuction pressure, attracting water. This behavior is not consistent with a hydrophobic material. -Therefore, a linear capillary model is assumed for the asphalt. The model is defined by a zerocapillary pressure at all brine saturations.
C3.4 Host-Rock Properties
Because the permeability (or hydraulic conductivity) of the host-rock formations is themost important parameter characterizing the host formations, emphasis will be given to it.Porosity and compressibility used for each rock type will be summarized in tables, but discussionof these parameters and their sources will be limited.
C3.4.1 Permeability and Hydraulic Conductivity
The following sections discuss the permeability and hydraulic conductivity of the Saladoevaporites and each member of the Rustler Formation. The values assumed for both theundisturbed and disturbed formation are presented. Tables C-9 and C-10 summarize the valuesof permeability and hydraulic conductivity for the Rustler and Salado Formations.
The reported disturbed formation permeabilities represent the permeability of the DRZ atthe shaft/DRZ interface. These permeabilities will later be used to calculate the effective DRZpermeability. . * . _ -
C-17

Table C-9. Summary of Permeability and Hydraulic Conductivity, Porosity, and Compressibility for the Rustler Modeled LithologicUnits
Lithology
Anhydrite(l)
UndisturbedPermeability
(m2)715"
UndisturbedHydraulic
Conductivity (m/s)7H"
DisturbedPermeability
(m2)715"
DisturbedHydraulic
Conductivity (m/s)
Porosity(fraction)
RockCompressibility
(Pa1)
Pore-VolumeCompressibility
(Pa1)1.00*10 6.69*10 1.00x10 6.69xlQ-13 0.01 7TT2.2x10
9.8xlO"10
2.2x1075"
Mudstone 4 3.89x10" 2.60x10" 3.89x10"' 2.60x10⁻⁶ 0.30 3.3x1075"
TIT 78" TIT"Magenta 1.49xJ0 1.00x10 1.49x10715" 7TT
1.00x10"
l.OOxlO"9
0.16 1.1x1075" 6.9x1075"
Mudstone 3 1.49x10 1.00x10 1.49x10"' 0.30 9.8x10TnrTIT
3.3x1075"
Culebra 2.09x10" 1.40x10" 2.09x10715" THT 715"
1.4QX1Q-6
6.69xlO-130.16 l . lx lQ" 9
6.9x1075"
Anhydrite 1/Mudstone 1
1.00x10 6.69x10 1.00x10 0.05 200x1 Q- 4.5x10Tnr
7TT Tnr
oo
Transition/Bioturbated
Clastics
2.24*10 1.50x10" 2.24x10" 1.50x10" 0.20 7.9x10⁷TT 3.9x10
(1) Anhydrite 5, Anhydrite 4, Anhydrite 3, and Anhydrite 2.
Table C-10. Summary of Permeability and Hydraulic Conductivity, Porosity, and Compressibility for the Salado Modeled LithologicUnits
Lithology
Anhydrite>3 m thick
Anhydrite<3 m thick
Halite
Polyhalite
Vaca Triste
UndisturbedPermeability
(m2)l.OOxlO'19
1.00xl0'iy
l.OOxlO"21
3.00xl0'21
1.49xlO"iy
UndisturbedHydraulic
Conductivity (m/s)6.69x10'13
6.69xlO"1J
6.69xlO"15
2.01xl0"14
l.OOxlO"12
DisturbedPermeability
(m2)1.00xl0"iy
l.OOxlO"15
l.OOxlO"15
l.OOxlO'15
1.49xlO'16
DisturbedHydraulic
Conductivity (m/s)6.69x10"13
6.69xlO-9
6.69x10'9
6.69xlO"9
l.OOxlO'9
Porosity(fraction)
0.01
0.01
0.01
0.01
0.20
RockCompressibility
(Pa1)2.23x10""
2.23x10'"
8.05x10""
2.23x10""
6.6xlO"10
Pore-VolumeCompressibility
(Pa1)2.23 xlO"9
2.23xlO"9
8.05xl0"y
2.23xlO"v
3.3x10"*

Salado Formation
Table C-l 1 summarizes testing and analysis of test data for the Salado halite. In thisappendix, the permeability of the undisturbed halite is assumed to have a value of 1 xlO"21 m2,and the permeability of the disturbed halite is assumed to have a value of 1 x 10"15 m2. Thepermeability for undisturbed halite is consistent with the cumulative probability distribution forthe permeability of far field and depressurized halite given in Gorham et al. (1992). Thepermeability for disturbed halite was selected based on the probability density function fordisturbed halite recommended to PA and included in Appendix D of this document. The basisfor the disturbed halite permeability values is derived from field tests within the AIS (Dale andHurtado, 1996) and other field test programs (Knowles et al., 1996; Stormont, 1990), which arediscussed in Section C3.5. The disturbed halite distribution function recommended to PA is log-triangular with a maximum of 1 x 10"14 m2 (6Jx 10*8 m/s) and a minimum of 1 x 10'17 m2. Thepermeability of 1 x 10" m is consistent with the Salado disturbed permeability for halitepreviously used by PA.
The median permeability for undisturbed anhydrite, based on borehole testing, was1.0xlO"19rn2(DOE, 1996). The value for the disturbed permeability ofthe Salado anhydriteswas assumed to be lxlO"15 m2, which is consistent with the disturbed anhydrite permeabilityreported by Sandia WIPP Project (WIPP PA, 1992-1993).
The undisturbed polyhalite permeability of 3.0xl0"21 m2 was taken from Lappin et al.(1989) and Saulnier and Avis (1988). Because there was no specific information concerningpolyhalite disturbed permeability, it was assumed to be the same as that for halite and anhydrite.
Table C-l 1. Testing and Analysis Summary for Salado Halite
Lithology
UndisturbedHalite
DisturbedHalite
Reference(s)
Beauheim et al.,1991Beauehim et al.,1993
Gorham et al.,1992
Gorham et al.,1992 •«
WIPP PA,1992-1993
Dale andHurtado, 1996
Permeability(m2)
3xl0"18-10*21
io-19-io-24
10"13-10"18
lO^-lO" 2 2
io-14-io-17
HydraulicConductivity (m/s)
2xl0 'n-6.7xl0"1 5
6.9xl0"13-6.7xl0"18
6.7xl0"7-6.7xl0'12
6.9xlO"9- 6.7x10'16
6.9xlO'8- 6.7x10""
Comments
Underground testingat the WIPP from1988 to 1992
Valuesrecommended forPA calculation
Valuesrecommended for1992 PA calculation
Range used for 1992PA calculations
Testing in the AISduring 1995
C-19

The lithology of the Vaca Triste is a halitic siltstone and mudstone. No hydraulicconductivity information was available for the Vaca Triste. In the absence of any specificinformation, the undisturbed permeability and the disturbed permeability for the Vaca Tristewere assumed to be 1.49><10"19 m2 (LOxlO*12 m/s) and 1.49><10"16 m2 (l.OxlO'9 m/s),respectively. These values are the same as those used for Mudstone 3 in the Rustler, which has asimilar lithology.
Within the Salado formation, several brine seepage intervals were noted. Permeabilitiesfor these zones were assigned values of 10 times the base value for each rock type. Porositiesand compressibilities were not modified for the brine seepage zones. Table C-12 identifieswhich Salado stratigraphic units were treated as brine seepage intervals.
Table C-12. Salado Brine Seepage Intervals'd)
Stratigraphic Unit
Marker Bed 103
Marker Bed 109
Vaca Triste
Zone A
Marker Bed 121
Union Anhydrite
Marker Bed 124
ZoneB
ZoneC
ZoneD
ZoneE
ZoneF
ZoneG
ZoneH
Marker Bed 129
Zone I
Zone J
(1) After US DOE, 1995.
Rustler Formation
The Rustler Formation consists of five members, which from the oldest to youngest are:the unnamed lower member, the Culebra Dolomite Member, the Tamarisk Member, the MagentaDolomite Member, and the Forty-niner Member. Many of the members are composed ofinformal lithologic units. The lower unnamed member has been hydraulically tested in the
C-20

vicinity of the AIS (see Table C-13) Because the tests reported in Beauheim (1987) most likelytested the most transmissive portions of the unnamed lower member (i.e., the transition andbioturbated clastic zones), the maximum measured hydraulic conductivity of 1.5x10"11 m/s wasselected as the hydraulic conductivity for the transition and bioturbated zones units. The lowerpermeability units of the unnamed lower member, Anhydrite 1 and Mudstone 1, were assigned apermeability consistent with the anhydrite permeability of l.OxlO"19 m2. Mudstone 2, whichunderlies the Culebra, was tested in H-16 in the test interval that included the Culebra(Beauheim, 1987). For this reason, the model considers Mudstone 2 and the Culebra as a singleunit. The hydraulic conductivity of this unit is discussed with the Culebra.
A disturbed permeability 2.24x10*15 m2 was selected for the bioturbated clastic zone andthe transition zone. This value represents a three order of magnitude increase in hydraulicconductivity over the undisturbed value. A disturbed permeability of 1.0x10*15 m was assignedto Anhydrite 1 and Mudstone 1, which were considered as a single unit in the model. Rockmechanics calculations presented in Appendix D of this report evaluate DRZ development in theclay units of the Rustler Formation.
The hydraulic conductivity of the Culebra dolomite varies over a wide range (four ordersof magnitude) at the WIPP site. This wide variation is due to the presence of both open andfilled fractures within the Culebra. The hydraulic conductivity is lowest in regions where thefractures in the Culebra are filled and highest in regions where the fractures are open. Thelocation of the WIPP shafts is in a region of relatively lower hydraulic conductivity.
A value of 2.09x10'14 m2 was selected as the permeability for the Culebra. This valuerepresents the highest site-specific hydraulic conductivity estimated from testing the Culebra inthe vicinity of the AIS. The disturbed permeability for the Culebra was assigned a value of2.09x10'' m2. Mechanical calculations presented in Appendix D predict that Rustler dolomiteswill not develop a DRZ.
The Tamarisk Member of the Rustler Formation includes Anhydrite 2, which directlyoverlies the Culebra, Mudstone 3, and Anhydrite 3, which underlies the Magenta. Hydraulictesting of the Tamarisk was attempted at H-16 adjacent to the AIS but was unsuccessful(Beauheim, 1987). It was estimated that the transmissivity of the Tamarisk was one to twoorders of magnitude lower than the least-transmissive unit successfully tested at H-16. Thisresults in an estimated permeability ranging from 4.63 xlO"20 to 4.63 xlO*19 m2.
A value of l.OxlO"19 m2 was selected for the undisturbed permeability of the anhydriteunits (Anhydrite 3 and Anhydrite 2) of the Tamarisk. The value for the disturbed permeability ofthe anhydrite units was taken as l.OxlO"15 m2, which is consistent with the disturbed anhydritepermeability reported by Sandia WIPP Project (WIPP PA, 1992-1993). Rock mechanicscalculations presented in Appendix D of this report predict that Rustler anhydrites do not developa DRZ adjacent to the shaft. A value of 1.49xlO*19 m2 was selected for the undisturbedpermeability of Mudstone 3', consistent with Brinster (1991). A disturbed permeability threeorders of magnitude higher than the undisturbed value, or 1.49xlO'16 m2, was assumed forMudstone 3.
C-21

Table C-13. Testing Summary for Rustler Formation
Lithology
Unnamedlower
member:bioturbatedclastic zone
Siltymudstone at
238.4 m
Silty claystoneat 245.4 m
CulebraDolomite
TamariskMember
MagentaMember
Forty-ninerMember
(Mudstone 4)
Reference(s)
Beauheim, 1987Beauehim et al.,
1993
Saulnier & Avis,1988
Saulnier & Avis,1988
Beauheim, 1987
Avis & Saulnier,1990
Avis & Saulnier,1990
Beauheim, 1987
Avis & Saulnier,1990
Beauheim, 1987
Beauheim, 1987
Avis & Saulnier,1990
Range (m2)
2.24xlO"18-1.84xlO"18
1.49xlO"20-1.49xlO"21
7.47xlO"21-8.97x10"22
2 .09x l0 : 1 4 -1.18xlO"14
1.49xlO"14-2.84xlO"15
Responseinsufficient to
estimate
5.68xlO"16
1.49xlO"15
2.84xlO'16to2.54x10"16
2.39x10"15
3.89xlO"16
Conductivity(m/s)
1.5x10""-1.2xlO"n
l.OxlO"13-LOxlO"14"
5.0xl0" 1 4-6.0xl0"13
l.OxlO"7-7.9xlO"8
l.OxlO"7-1.9xlO"8
Responseinsufficient to
estimate
3.8xlO"9
l.OxlO"8
1.9xlO"9-1.7xlO"9
1.6xlO"18
2.6x10'9
Comments
Two build-up testsconducted over a34.1-m interval
Pulse testing in WasteHandling Shaft at
discrete depth intervals
Results of two drill-stem tests conducted inH-16
Interpretation fromfluid-pressure responsein H-16 during drillingofAIS
Interpretation fromfluid-pressure responsein H-16 during drillingofAIS
Drill-stem test in H-16
Interpretation fromfluid-pressure responsein H-16 during drillingofAIS
Testing at H-16
Testing at H-l 4
Interpretation fromfluid-pressure responsein H-16 during drillingofAIS
C-22

A value of 1.49*10"15 m2 was selected as the undisturbed permeability for the Magenta.A value of 1.49x 10"14 m2 was selected for the disturbed permeability for the Magenta. Thisvalue is one order of magnitude greater than the undisturbed value.
The Forty-Niner member is composed of Anhydrite, Mudstone 4, and Anhydrite 6. AtH-16, the permeability of the Forty-Niner Member is attached to Mudstone 4. Table C-3summarizes hydraulic testing results for the Forty-Niner Member. Because the hydraulicconductivity value interpreted by Avis and Saulnier (1990) derived from a test that stressed alarger volume of rock, and because their hydraulic conductivity is larger than that determined forMudstone 4 at H-16, a hydraulic conductivity of 3.89><10*16 m was selected as the undisturbedpermeability for Mudstone 4. The disturbed hydraulic conductivity for Mudstone 4 was assigneda value of 3.89*10'13 m2, which is three orders of magnitude greater than the undisturbed value.The undisturbed and disturbed permeability for the anhydrite units in the Forty-niner (Anhydrite4 and Anhydrite 5) were assigned values of l.OxlO"19 and 1.0*10*15 m2, respectively.
C3.4.2 Porosity
Hydraulic test analyses have been performed on the members of the Rustler Formation(Beauheim, 1987; Saulnier and Avis, 1988; and Avis and Saulnier, 1990). These investigatorsassumed porosity values consistent with clays and dolomites, which are considered to be themost permeable units within the Rustler. The porosity values for anhydrite and halite were -derived primarily from underground testing at the WIPP. The primary references for theanhydrites and halite porosities are Beauheim et al. (1991), Sandia WIPP Project (1992), andBeauheim et al. (1993). The ranges in porosity values used by WCPP investigators are listed inTable C-14. Selected values for the formation porosities fell within the ranges listed in this table(Tables C-9 and C-10).
Table C-14. Summary of Literature Values for Formation Porosities
Information/Lithology
Salado Halite and Anhydrite
Rustler clays and dolomites
Reference(s)
Peterson et al., 1987Beauheim etal., 1991WIPP PA, 1992-1993Beauheim et al., 1993
Beauheim, 1987Saulnier & Avis, 1988
Brinster, 1991Freeze & Cherry, 1979
Porosity Range
0.001 to 0.01
0.05 to 0.3
C3.4.3 Formation Compressibility
The compressibility of the mudstone units and the transition/bioturbated clastic unit werecalculated using Equation C-2 (Touloukian et al., 1981):
C-23

^ (C-2)
where:
CR = rock compressibility, Pa"1
v = Poisson's ratio, dimensionless
E = Young's modulus, Pa"1.
Touloukian et al. (1981) give a Young's modulus of 2.83 GPa an&aPoisson's ratio of0.04 for claystone. These values were assumed to be representative of the mudstones in theRustier Formation. Substituting these values into Equation C-2 yields a rock compressibility of9.8xlO"10 Pa*1. Dividing this value by the mudstone porosity of 0.30 results in a pore-volumecompressibility of 3.3xlO"9 Pa"1.
The lithology of the transition/bioturbated clastic unit can be described as sandstone,siltstone, and halite-cemented sandstone and siltstone. Compressibility data for this unit are notavailable; therefore Young's modulus and Poisson's ratio for sandstones and siltstones weretaken from Touloukian et al. (1981). The average Young's modulus and Poisson's ratio were19.0 and 0.24 GPa respectively for sandstone, and 25.2 and 0.18 GPa respectively for siltstone.The values for the two rock types were then averaged to obtain a Young's modulus of 22.1 GPaand a Poisson's ratio of 0.21, assumed to be representative of the transition/bioturbated clasticunit. Using Equation C-2 and the assumed porosity of 0.20 yields a rock compressibility of7.9xlO"n Pa"1 and a pore-volume compressibility of 3.9xlO"10 Pa"1 for this unit.
LaVenue et al. (1990) assumed a rock compressibility of 1.1 * 10"9 Pa"1 for the Culebra intheir regional groundwater flow model. This value was adopted for the rock compressibility ofthe Culebra and Magenta. Dividing this value by the assumed porosity of 0.16 yields a pore-volume compressibility of 6.9x10"9 Pa"1 for these two units.
The median rock compressibility for anhydrite interpreted from borehole testing was2.23 xlO"11 Pa"1 (DOE, 1996), which converts to a pore-volume compressibility of 2.23x10"9 Pa"1
for a porosity of 0.01. Because no information about polyhalite compressibility was available, avalue equal to that determined for anhydrite was assumed. A value of 8.05xl0"9 Pa"1 was usedfor pore-volume compressibility for the Salado halite. Rock and pore-volume compressibiltiesfor all lithologic units modeled are summarized in Tables C-9 and C-10.
C3.4.4 Two-Phase Properties of the Salado
.- Unsaturated flow properties for Salado halite and anhydrite marker beds were taken fromSandia WIPP Project (WIPP PA, 1992-1993) and are shown in Table C-15 in terms of parametervalues for the Brooks-Corey- equations for relative permeability and capillary pressure. Therequired parameters are threshold displacement pressure (Pt), residual wetting phase saturation(S!r), residual gas saturation (iS^), and the pore size distribution parameter (X). Thresholddisplacement pressure (Pt) is specified by using the correlation with permeability, k, suggested byDavies (1991) and documented in Sandia WIPP Project (WIPP PA, 1992-1993). The sameparameters were used for both disturbed and undisturbed rock. For the compacted salt column
C-24

performance model, it was found that greater numerical stability could be achieved if theTOUGH28W implementations of the Van Genuchten-Parker equations were used for relative''permeability and capillary pressure instead of the Brooks-Corey equations. Pressure parameterPo in the Van Genuchten-Parker equation for capillary pressure was derived from the Brooks-Corey parameter Pt in Table C-15 by equating the two formulas at an effective saturation of 0.5.
Table C-15. Salado Two-Phase Properties
Parameter
Pt(MPa)
s,rSgr
X
Salado Halite and Polyhalite
5.6xl0-7Dc(m2)r0'346
0.2
0.0
0.7
Salado Anhydrite
2.6xl0*7[k(m2)]-0-346
0.2
0.0
0.7
C3.5 DRZ Properties
A disturbed rock zone (DRZ) forms around excavations in the bedded halite of the SaladoFormation immediately upon passage of the mining tools, and progressively develops over timewith the unloading of the formation as it creeps into excavations (Stormont, 1990). VanSambeek et al. (1993) refer to the DRZ that forms upon mining as the "initial DRZ" and the DRZthat forms as a result of creep deformation and stress redistribution as the "secondary DRZ." TheDRZ extends radially out from the shaft wall into the host formation. The DRZ is expected tohave the following characteristics: (1) increased porosity resulting from micro- or macro-fracturing, (2) increased fluid (gas or liquid) permeability, (3) decreased brine saturation, (4)decreased load-bearing capacity, and (5) decreased lithostatic pressure (Stormont, 1990; VanSambeek et al., 1993). Because of these properties, the DRZ could act as a vertical flow path forbrine and gas around a shaft seal. It is important to characterize the extent of the DRZ around theshaft excavations and its time-dependent properties (especially permeability).
Laboratory, field, and modeling studies have been performed to determine the mechanicsof DRZ development. DRZ development has been documented in almost all horizontalrectangular excavations of the WIPP underground facility through gas permeability testing(Stormont et al., 1987; Stormont, 1990), visual observations (Boms and Stormont, 1988), and byother methodologies (Holcomb, 1988). Laboratory testing of salt cores has also providedsignificant insight into DRZ development. Hansen and Mellegard (1979) found that dilatancy isfavored by conditions of low confining stress and high deviatoric stress, which characterize theregion near an excavation. Laboratory testing has shown that a halite DRZ is self-healing giventhe proper stress conditions; Brodsky (1990) showed that artificially damaged cores could behealed with certain confining pressures and time.
Two hydraulic testing programs have been conducted within WIPP shafts. The earliesthydraulic testing program was conducted in the Waste Handling Shaft (Saulnier and Avis, 1988).More recently, hydraulic testing was performed to determine the extent of the DRZ in the AIS.
C-25

Six boreholes, three at each of two levels, were used to determine both gas and brinepermeabilities (Dale and Hurtado, 1996).
Waste Handling Shaft Hydraulic Testing
The objective of the hydraulic testing conducted in the Waste Handling Shaft (Saulnierand Avis, 1988) was to identify the DRZ using permeability testing. This testing used a three-packer system capable of simultaneously testing the permeability in three zones at three differentradial distances from the shaft. Four levels were tested, two in the unnamed lower member ofthe Rustler (depths 238.4 m [782 ft] and 245.4 m [805 ft] below ground surface [bgs], whichcoincide with the transition and bioturbated clastic zones), one just below the Rustler/Saladocontact in halite (at a depth of 259.1 m [850 ft] bgs), and one in Salado halite, anhydrite, andpolyhalite (at a depih of 402.3 m [1320 ft] bgs). The results from these tests showed nocorrelation between permeability and radial distance from the shaft at any level and did notidentify the DRZ. A potential reason the DRZ was not clearly identified in the Waste HandlingShaft was the location of the test intervals. For three of the test intervals, the test closest to theshaft was located 1 m (3.2 ft) from the excavation. One test conducted in the Waste HandlingShaft (W850W) tested a zone located within 0.3 m (1 ft) of the shaft liner. The test zone closestto the shaft for test W850W extended from the outer edge of the shaft liner to a distance of 1.25m (4.08 ft) from the shaft. This zone included the liner/DRZ interface and the DRZ. Saulnier .and Avis (1988) report that testing of this zone proved futile because the zone could not bepressurized. They concluded that the test zone included an open fracture or a gap representingthe liner/DRZ interface.
Air Intake Shaft Hydraulic Testing
Permeability testing was conducted to determine the radial extent of the DRZ in theSalado Formation surrounding the AIS. Testing was conducted at two levels within the AIS(Level A at 345.9 m [1135 ft] and Level C at 626.4 m [2,055 ft] bgs). At each of the two levelstested, three 10-cm (4-in.) diameter boreholes were drilled at a spacing of 120° into the formationat a 6° angle below the horizontal. The boreholes were drilled to a depth of approximately 6 m(20 ft). All six boreholes were gas-flow tested prior to the performance of brine testing. It isexpected that the regions of the DRZ closest to the shaft wall have the greatest dilation and arelikely the most desaturated (i.e., have brine saturations significantly less than 1.0). As thepermeability of the DRZ approaches the intact permeability at greater radial distances, it isexpected that the brine saturation of the DRZ approaches unity. Gas-flow tests were performedto determine the extent of the desaturated region (and, in so doing, define the radius where brinetesting can be performed), to identify the relative permeability to gas of the DRZ, and to bracketthe DRZ threshold pressure.
The distance within the boreholes at which the brine-permeability tests were conductedwas based on the results ofthe gas-permeability testing. For gas-flow testing, a four-packer testtool was initially set so that the first test zone started at 6 in. from the shaft wall and extended anadditional 15 in. into the formation. If gas flow was observed at that depth, the test tool wasinserted an additional 2 to 4 in. and another test was performed. The process was repeated until atest with no observable gas flow was obtained. Brine-flow testing was performed approximately5 to 6 in. beyond the distance at which no gas flow was observed. The objective ofthe brine-
C-26
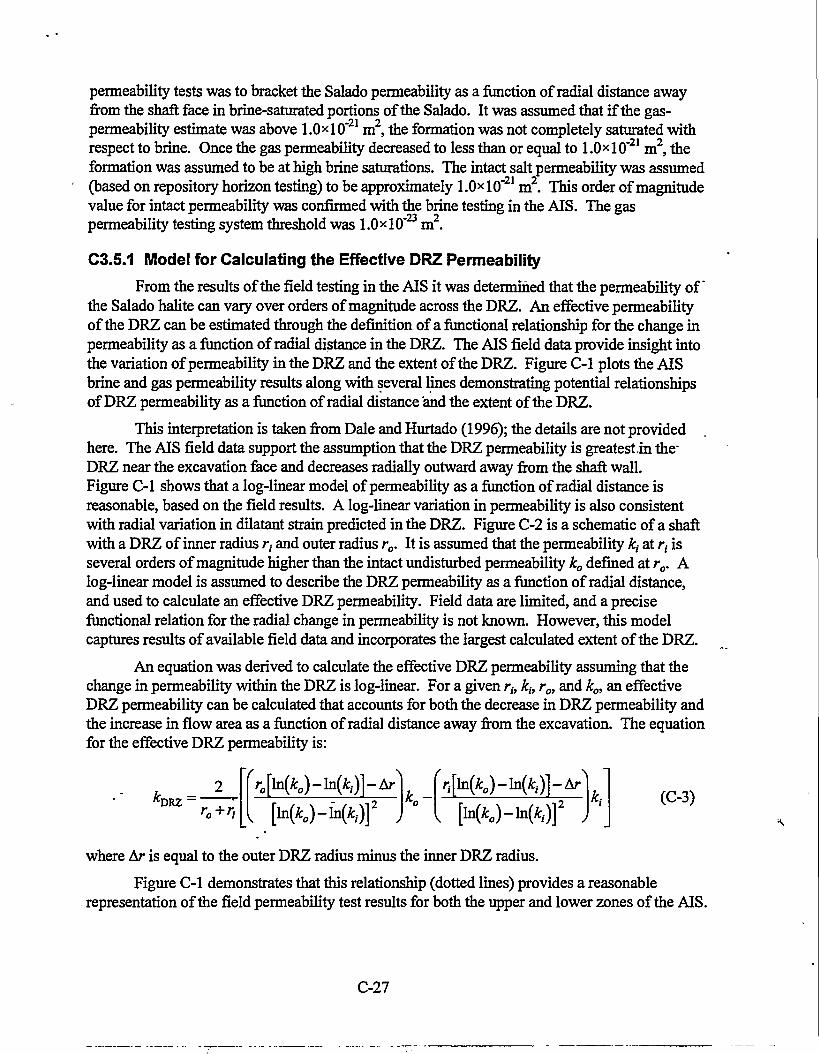
permeability tests was to bracket the Salado permeability as a function of radial distance awayfrom the shaft face in brine-saturated portions of the Salado. It was assumed that if the gas-permeability estimate was above l.OxlO"21 m2, the formation was not completely saturated withrespect to brine. Once the gas permeability decreased to less than or equal to l.OxlO"21 m2, theformation was assumed to be at high brine saturations. The intact salt permeability was assumed(based on repository horizon testing) to be approximately l.OxlO"21 m2. This order of magnitudevalue for intact permeability was confirmed with the brine testing in the AIS. The gaspermeability testing system threshold was l.OxlO"23 m2.
C3.5.1 Model for Calculating the Effective DRZ Permeability
From the results of the field testing in the AIS it was determined that the permeability of"the Salado halite can vary over orders of magnitude across the DRZ. An effective permeabilityof the DRZ can be estimated through the definition of a functional relationship for the change inpermeability as a function of radial distance in the DRZ. The AIS field data provide insight intothe variation of permeability in the DRZ and the extent of the DRZ. Figure C-l plots the AISbrine and gas permeability results along with several lines demonstrating potential relationshipsof DRZ permeability as a function of radial distance and the extent of the DRZ.
This interpretation is taken from Dale and Hurtado (1996); the details are not providedhere. The AIS field data support the assumption that the DRZ permeability is greatestin the-DRZ near the excavation face and decreases radially outward away from the shaft wall.Figure C-l shows that a log-linear model of permeability as a function of radial distance isreasonable, based on the field results. A log-linear variation in permeability is also consistentwith radial variation in dilatant strain predicted in the DRZ. Figure C-2 is a schematic of a shaftwith a DRZ of inner radius 77 and outer radius r0. It is assumed that the permeability kt at rt isseveral orders of magnitude higher than the intact undisturbed permeability ko defined at r0. Alog-linear model is assumed to describe the DRZ permeability as a function of radial distance,and used to calculate an effective DRZ permeability. Field data are limited, and a precisefunctional relation for the radial change in permeability is not known. However, this modelcaptures results of available field data and incorporates the largest calculated extent of the DRZ.
An equation was derived to calculate the effective DRZ permeability assuming that thechange in permeability within the DRZ is log-linear. For a given rt, kt, r0, and k0, an effectiveDRZ permeability can be calculated that accounts for both the decrease in DRZ permeability andthe increase in flow area as a function of radial distance away from the excavation. The equationfor the effective DRZ permeability is:
Koo I (C-3)
where Ar is equal to the outer DRZ radius minus the inner DRZ radius.
Figure C-l demonstrates that this relationship (dotted lines) provides a reasonablerepresentation of the field permeability test results for both the upper and lower zones of the AIS.
C-27

%COCD
-J £
y i
CD
a.
1E-13
1E-14
1E-15
1E-16
1E-17
1E-18
1E-19
1E-20
1E-21
1E-22
1E-23
1E-24 1E-24
extent of DRZ
0 20 40 60 80 100 120 140 160 180 200 220 240Radial distance from shaft wall (in)
CD
£>o
£1COCD
s.
8-i 2
CD
a.
1E-24 I _ . I|-Sg > 0 —|
_uncertainVy in _"extent of DRZ" •Sb = 1
1E-13
1E-14
1E-15
1E-16
1E-17
1E-18
1E-19
1E-20
1E-21
1E-22
1E-23
1E-24
0 . '20 40 60 8_& 100 120 140 160 180 200 220 240Radial distance from shaft wall (in)
J3O
cu
CDQ .
Figure C-1. AIS field permeability results.
C-28

IntactRock
kj Represents Maximum Dilationkg Represents Intact ConditionsFj Excavation Face, Inner Radius of DRZro Outer Radius of DRZ
Figure C-2. Log-linear model for the calculation of an effective permeability of the DRZ.
C3.5.2 Model DRZ Effective Permeability
Rock mechanics calculations have been performed to predict the DRZ extent in both theRustler and Salado formations. These calculations are presented in Appendix D of this report.The extent of the DRZ within the Rustler Formation is a function of rock type and depth.Mechanical calculations presented in Appendix D indicate no DRZ for anhydrites and dolomites,and a DRZ extent that increases with shaft depth for mudstones. The DRZ extent for the Rustlermudstones was interpolated from values given in Appendix D. For the base case assumption,the anhydrites were assumed to have no DRZ, consistent with the mechanical calculationspresented in Appendix D. However, for the base-case model conceptualization, the Magenta andCulebra dolomites were assigned a DRZ. This was done to account for the fact that both of thesedolomites are naturally fractured and the mechanical calculations did not account for the
C-29

presence of fractures. The extent of the DRZ for dolomite was set equal to one shaft radius. TheDRZ in the Rustler is assumed not to heal as a function of time.
The DRZ extent within the Salado halite is calculated as a function of depth, shaft sealmaterial, and time. In the Salado, the halite DRZ is at a maximum at closure and heals as afunction of time. Healing occurs quickest with increased depth of burial and increased stiffness(bulk modulus) of the shaft seal material. Calculations of the radial extent of the halite DRZ fortimes 0,10,25,50, and 100 years after shaft closure are provided in Appendix D. Plots of thehalite DRZ extent adjacent to the various seal materials are also shown in Appendix D.
For halite, the effective DRZ permeability was calculated with Equation C-3 using theextent of the halite DRZ from Appendix D and the disturbed halite permeability at the shaft/DRZinterface. The effective permeability of the DRZ, as calculated using Equation C-3, is controlledby the permeability at the shaft/DRZ interface (A-). For these calculations, kt is assumed toremain constant and at its maximum value as long as a DRZ is predicted. In reality, it isexpected that as the DRZ heals (halite), kt will also decrease in magnitude. Therefore thecalculation of the effective DRZ permeability is considered conservative.
Also presented in Appendix D are mechanical calculations that predict the DRZ inanhydrite Salado interbeds as a function of interbed thickness. These calculations show that foran anhydrite interbed thickness less than approximately 0.8 m, the anhydrite interbeds develop aDRZ approximately 1 m in extent. Previous estimates predicted that Salado anhydrite units witha thickness of less than 3 m have a DRZ extending 1 m from the shaft. For the base-caseconceptualization, anhydrite units equal to or greater than 3 m in thickness were assigned noDRZ.
Because the anhydrite and polyhalite DRZs do not heal, the values calculated for DRZextent do not change with time for these units. The DRZ extent for polyhalite for all times wasassumed to be equal to the halite DRZ extent for the open shaft time period. Effective DRZpermeabilities based on Equation C-3 were adjusted for the difference between model DRZareas, which do not vary (12% of shaft radius), and the variable DRZ areas described above.
Mechanical calculations predict that anhydrites within the Rustler and several within theSalado do not form a DRZ. These predictions do not account for damage induced during shaftconstruction, such as blasting damage. Because field data are not available for the DRZ in theRustier members and Salado anhydrites, the models assume mat the DRZ may be configured as"continuous" or "discontinuous." The discontinuous DRZ assumption utilizes only intactpermeability values for Salado anhydrites and Rustler members. The continuous DRZ assumesthese lithologies are damaged, and permeabilities are adjusted accordingly.
- The model grids, in this appendix do not include a discrete interface zone between shaftseal materials and the DRZ. This is because the model grids presented were based on theassumption that a continuous DRZ would be considered in all simulations. In the base-caseconceptualization, a discontinuous DRZ is modeled consistent with mechanical predictions.However, in all cases the models are also run considering a continuous DRZ.
Mechanical calculations presented in Appendix D indicate that the DRZ surrounding theconcrete-asphalt waterstops becomes discontinuous through healing of the salt within 2 yearsafter emplacement. In the modeling in this appendix, it is assumed that the waterstops
C-30

effectively intersect the DRZ at 2 years after seal emplacement Table C-16 gives thepermeability values used for the base case conceptualization of the DRZ.
At the Rustler/Salado contact, unsaturated Rustler brine can potentially enter the SaladoDRZ. Seepage of Rustler groundwater into the Salado DRZ could result in dissolution of Salado •salt. It has been postulated that this type of dissolution would produce a direct conduit from theRustler/ Salado contact to the lower Salado sealing system. Approximately 1.4X10"4 m3 (0.3 kg)of salt are required to fully saturate 10'3 m3 (1 kg) of Culebra groundwater (Siegel et al., 1991).The potential for creation of such a conduit will be treated within Performance Model 1.
C4. FLOW DOWN FROM THE RUSTLER (MODEL 1)
C4.1 Statement of Problem
The shaft seal system is designed to limit migration of fluids within the sealed shaft.Using the approximation of a completely saturated seal system, this calculation examined thepotential for-flow and quantity of flow that migrates from the Rustler and Salado down the shaftduring early times. The performance measures (results) from this model are brine flow rate andcumulative brine volume over a 200-year time frame after repository closure. These performancemeasures are presented at (1) the Rustler/Salado interface, (2) the top of the compacted saltcolumn, and (3) the base of the compacted salt column.
C4.2 Performance Model 1 Description
C4.2.1 Conceptual Model and Assumptions
To investigate the potential for vertical flow down from the Rustler through the shaft sealsystem, a full-shaft saturated-flow model was used. The focus of this calculation was to estimatethe amount of brine flowing down through the shaft seal system to reach the top of thecompacted salt column and, potentially, the repository.
Conceptually, flow down the seal system is an early-time issue. Over tune, pressures atdepth in the seal system will equilibrate to far-field pressures, which are significantly over-pressured with respect to the Rustler, and the downward driving force will reverse its direction.However, because the Rustler will repressurize more rapidly than the Salado, there is a potentialfor downward flow during the seal repressurization period. To characterize this period, the flowsystem has been conceptualized as a shaft seal system and an adjacent DRZ surrounded by hostrocks. The primary assumptions are listed below:
• This calculation assumed that the primary water-producing zones above the SaladoFormation are within the Rustler Formation. As a result, this calculation did not includesupra-Rustier units.
• The calculation assumed brine-saturated flow conditions. This assumption (1) did notaccount for the time required or volume of liquid required to saturate the seal componentsand (2) overestimated brine transmissivities over the time period where the DRZ andseals would be variably saturated.
C-31

Table C-16. Model DRZ Permeability for Base-Case Conceptualization (Corrected for Model DRZ Area)
Ou»
Row
1234567891Q11121314
15
16
17
18
19
2021
Unit
Anhydrite5
Anhydrite5
Mudstone4
Mudstone4Anhydrite4
Magenta
Anhydrite3Anhydrite3
Mudstone3Anhydrite2Anhydrite2
Culbera/Mudstone2
Anhydrite 1 /Mudstone 1Transition/Bioturbated
ClasticsTransition/Bioturbated
ClasticsTransition/Bioturbated
ClasticsTransition/Bioturbated
ClasticsTransition/Bioturbated
ClasticsTransition/Bioturbated
ClasticsSalado Halite
Salado Halite
Intrinsic Permeability (m2)Time=0 Yrl.OOxlO"19
l.OOxlO"19
5.99xlO"13
5.99xlO"13
LOOxlO"19
6.06xl0"14
l.OOxlO"19
l.OOxlO"19
2.75xlO"16
l.OOxlO"19
l.OOxlO"19
8.50xl0"13
l.OOxlO"19
4.94xlO"15
4.94x10"15
4.94xlO"15
4.94xlO"15
4.94xlO"15
4.94xlO"15
3.64xlO"16
3.68xlO"16
Time=2 Yr
l.OOxlO"19
l.OOxlO"19
5.99xlO"13
5.99xlO"u
l.OOxlO"19
6.06xl0"14
l.OOxlO"19
l.OOxlO"19
2.75xlO"16
l.OOxlO"19
l.OOxlO"19
8.5OxlO"1J
l.OOxlO"19
4.94x10"15
4.94x10"15
4.94xlO"15
4.94x10"15
4.94x10"15
4.94xlO"15
3.64xlO"16
3.68xlO"16
Time=10 Yrl.OOxlO"19
l.OOxlO"19
5.99xlO"13
5.99xlO"13
l.OOxlO"19
6.06xl0"14
l.OOxlO"19
l.OOxlO"19
2.75xlO"16
l.OOxlO'19
l.OOxlO"19
8.50xl0"1J 'l.OOxlO"19
4.94x10'1*
4.94x10'15
4.94x10"1S
4.94xlO"15
4.94xlO"15
4.94x10"15
3.62xlO"16
l . lOxlO'1 6
Time=25 Yrl.OOxlO"19
l.OOxlO"19
5.99xlO"13
5.99xlO"13
l.OOxlO"19
6.06xl0"14
l.OOxlO"19
l.OOxlO"19
2.75xlO"16
l.OOxlO"19
l.OOxlO"19
8.50xl0"13
l.OOxlO'19
4.94xlO"15
4.94xlO"15
4.94xlO"15
4.94xlO"15
4.94x10"15
4.94x10"15
3.59xlO"16
4.05 xlO"17
Time=50 Yrl.OOxlO"19
l.OOxlO"19
5.99xlO"13
5.99xlO"13
l.OOxlO"19
6.06xl0"14
l.OOxlO"19
l.OOxlO"19
2.75xlO"16
l.OOxlO"19
l.OOxlO"19
8.50xl0"13
l.OOxlO"19
4.94xlO"15
4.94xlO"15
4.94x10"15
4.94xlO"15
4.94xlO"15
4.94x10"15
3.55xlO"16
l.OOxlO"21
Time=100 Yrl.OOxlO"19
l.OOxlO"19
5.99xlO"13
5.99xlO"13
l.OOxlO"19
6.06xl0"14
l.OOxlO"19
l.OOxlO"19
2.75xlO"16
l.OOxlO"19
l.OOxlO"19
8.50xl0"13
l.OOxlO"19
4.94x10"15
4.94xlO"15
4.94xlO"15
4.94xlO"15
4.94x10"15
4.94xlO"19
3.49xlO'16
l.OOxlO'21

Table C-16. Model DRZ Permeability for Base-Case Conceptualization (Corrected for Model DRZ Area)
9
Row
22232425262728293031323334 -35363738394041424344454647
Unit
Salado Halite
Salado HaliteSalado Halite
Salado HaliteSalado Halite
• • Salado HaliteSalado HaliteSalado HaliteSalado Halite
. Salado HaliteSalado HaliteSalado Halite
Combined Unit 1Combined Unit 1
Salado HaliteSalado Halite
Salado HaliteCombined Unit 2
Salado Halite
Salado Halite
Salado HaliteCombined Unit 3
Salado Halite
Salado Halite
Salado HaliteVaca Triste
Intrinsic Permeability (m2)Time=0 Yr3.70x10"16
3.72xlO-16
3.73xlO'16
3.74xlO-16
3.76xlO"16
3.78xlO"16
3.83xlO"16
3.86xlO"16
3.88xlO"16
3.90xl0"16
3.91xlO"16
3.93xlO"16
1.15xlO"18
1.15xl0"18
4.00x10'16
4.05xl0-16
4.13xlO"16
1.04xl0'18
4.25x10"16
4.32x10'16
4.37xlO"16
4.79xlO"16
4.41 xlO'16
4.44x10"16
4.47x10"16
1.40X10⁻¹⁶
Time=2 Y r3.70xl0"16
3.72xlO"16
3.73xlO"16
3.74xlO"16
3.76xlO'16
3.78xlO"16
3.83xlO"16
3.86xlO"16
3.88xlO"16
l.OOxlO"20
3.91xlO"16
3.93xlO'16
1.15xlO'18
1.15xlO'18
4.00xl0"16
4.05 xlO"16
4.13xlO"16
1.04xl0"18
4.25xlO-16
4.32x10"16
4.37xlO"16
4.79xlO'16
4.41 xlO"16
4.44xlO"16
4.47x10"16
1.40xl0"16
Time=10 Yr1.08xl0"16
1.07xl0"16
1.06xl0"16
3.72xlO"16
3.73xlO"16
3.76xlO"16
3.81xlO"16
9.75xlO"17
9.62xlO'17
l.OOxlO"20
9.47xlO"17
9.33xlO"17 '1.15xlO"18
1.15xlO"18
2.92xlO"16
2.90xl0"16
2.86xlO"16
1.04xl0'18
2.75 xlO"16
2.66xlO"16
2.61xlO"16
4.79x10'16
2.55xlO"16
2.52xlO"16
2.49x10"16
1.40xl0"16
Time=25 Yr3.88xl0"17
3.80xl0"17
3.72xlO"17
3.69x10"16
3.70xl0"16
3.73xlO"16
3.78xlO"16
2.87xlO"17
2.74x10"17
l.OOxlO"20
2.60xl0"17
2.47x10"17
1.15xlO"i8
1.15xlO"18
1.97xlO"16
1.91 xlO"16
1.81xlO"16 .1.04xl0"18
1.63xlO"16
1.51xlO'16
1.42xlO"16
4.79x10"16
1.34xlO"16
1.29xlO*16
1.25xlO"16
1.40xl0"16
Time=50Yrl.OOxlO"21
l.OOxlO"21
l.OOxlO"21
3.65xlO"16
3.66xlO"16
3.69xlO"16
3.73xlO"16
l.OOxlO"21
l.OOxlO"21
l.OOxlO"20
l.OOxlO"21
l.OOxlO'21
1.15xlO"18
1.15xlO"18
l.OlxlO"16
9.13xlO"17
7.85xlO"17
1.04xl0"18
6.00xl0'17
5.04xl0'17
4.37xlO"17
4.79xlO"16
3.73xlO'17
3.35xlO"'7
3.00xl0"17
1.40xl0'16
Time=100 Yrl.OOxlO"21
l.OOxlO"21
l.OOxlO'21
3.58xlO'16
3.60xl0"16
3.62xlO"16
3.66xlO"16
l.OOxlO"21
l.OOxlO'21
l.OOxlO"20
l.OOxlO"21
l.OOxlO"21
1.15xlO"18
1.15xlO'18
2.56xlO"17
1.81xlO"17
7.76xlO"18
1.04xl0"18
l.OOxlO"21
l.OOxlO"21
l.OOxlO"21
4.79x10"16
l.OOxlO'21
l.OOxlO'21
l.OOxlO"21
1:40x10"16
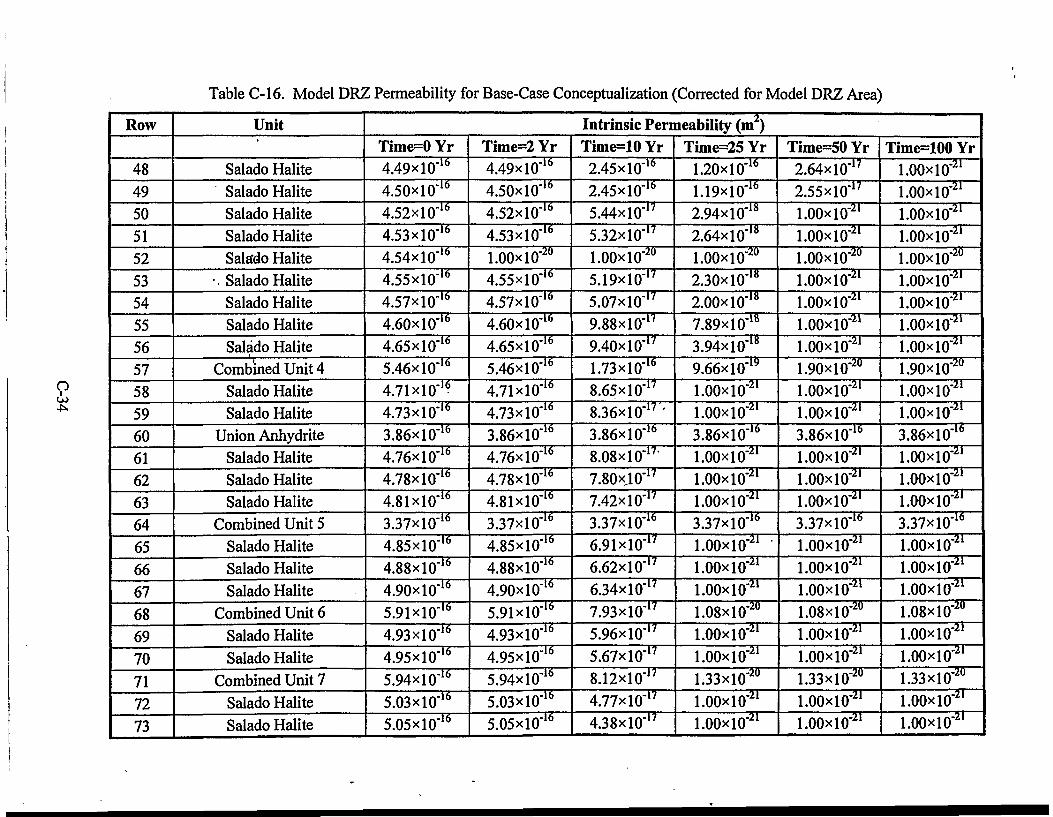
Table C-16. Model DRZ Permeability for Base-Case Conceptualization (Corrected for Model DRZ Area)
n
Row
4849505152535455565758596061626364656667686970717273
Unit1
Salado Halite
Salado Halite
Salado HaliteSalado Halite
Salado Halite•. Salado Halite
Salado HaliteSalado HaliteSalado Halite
Combined Unit 4
Salado HaliteSalado Halite
Union Anhydrite
Salado HaliteSalado Halite
Salado HaliteCombined Unit 5
Salado HaliteSalado Halite
Salado HaliteCombined Unit 6
Salado Halite
Salado Halite
Combined Unit 7
Salado Halite
Salado Halite
Time=0 Yr
4.49xlO"16
4.50xl0"16
4.52xlO"16
4.53 xlO'16
4.54x10"'°
4.55xlO"16
4.57x10"'°4.60x10"'°4.65x10"'°
5.46xlO*16
4.71xlO"16
4.73xlO"16
3.86x10"'°4.76x10"'°
4.78xlO'16
4.81xlO"16
3.37xlO"16
4.85x10"'°4.88x10"'°
4.90x10"'°5.91x10"'°
4.93x10"'°
4.95x10"'°5.94x10"'°
5.03x10"'°
5.05x10"'°
Time=2 Yr4.49x10"'°
4.50xl0"16
4.52x10"'°4.53x10"'°
l.OOxlO"20
4.55x10"'°
4.57x10"'°
4.60x10"'°4.65x10''°5.46x10"'°4.71x10"'°
4.73x10''°3.86x10"'°4.76x10"'°
4.78x10"'°4.81x10"'°
3.37x10"'°4.85x10"'°4.88x10"'°
4.90x10"'°5.91x10"'"
4.93x10"'°
4.95x10"'°
5.94x10"'°5.03xl0"'b
5.05 xlO"10
Intrinsic Permeability (m2)Time=10 Yr
2.45 xlO"16
2.45x10"'°5.44xlO"17
5.32xlO"17
l.OOxlO"20
5.19xl0"17
5.07x10"17
9.88xlO"17
9.40xl0'17
1.73x10"'°8.65xlO"'7
8.36xl0"17 '3.86xlO"16
8.08xl0"17'7.80xl0"17
7.42x10"17
3.37x10"'°6.91 xlO"17
6.62x10"'7
6.34xlO"17
7.93 xlO"'7
5.96xlO'17
5.67x10'17
8.12xlO"17
4.77x10"17
4.38xlO"17
Time=25 Yr1.20x10"'°1.19x10"'°2.94x10"'8
2.64xlO"'8
l.OOxlO"20
2.30xl0"18
2.00x10"'8
7.89x10'18
3.94xlO"'8
9.66xlO"'9
l.OOxlO"2'l.OOxlO'2'3.86x10"'°l.OOxlO"2'l.OOxlO"21
l.OOxlO"2'3.37x10"'°l.OOxlO"21
l.OOxlO"21
l.OOxlO"21
1.08xl0"20
l.OOxlO"21
l.OOxlO"21
1.33 xlO"20
l.OOxlO'21
l.OOxlO'21
Time=50 Yr2.64xlO'1 7
2.55xlO"17
l.OOxlO"21
l.OOxlO"21
l.OOxlO"20
l.OOxlO"21
l.OOxlO"2'l.OOxlO"21
l.OOxlO"2'1.90xl0"20
l.OOxlO"2'l.OOxlO"21
3.86xlO"16
l.OOxlO"21
l.OOxlO'21
l.OOxlO"21
3.37x10"'°l.OOxlO"21
l.OOxlO'21
l.OOxlO"21
1.08xl0"2U
l.OOxlO"21
l.OOxlO'21
1.33xlO'20
l.OOxlO'21
l.OOxlO"21
Time=100 Yrl.OOxlO"2'l.OOxlO"2'l.OOxlO"2'l.OOxlO"2'l.OOxlO'20
l.OOxlO'2 'l.OOxlO'21
l.OOxlO'2 'l.OOxlO'2 '1.90xl0"20
l.OOxlO"2'l.OOxlO"21
3.86x10"'°l.OOxlO"21
l.OOxlO"21
l.OOxlO"2'3.37x10"'°l.OOxlO"21
l.OOxlO"21
l.OOxlO"21
1.08xl0"20
l.OOxlO"21
l.OOxlO"21
1.33xlO"20
l.OOxlO"21
l.OOxlO"2'

Table C-16. Model DRZ Permeability for Base-Case Conceptualization (Corrected for Model DRZ Area)
2
Row
747576
77
787 9 '•
80
81
82
83
8485
86
87
88
89
90
919293949596979899
Unit•
Salado Halite
Combined Unit 8
i Salado Halite
Salado Halite
Sala'do Halite
Combined Unit 9
Combined Unit 9
Salado Halite
Salado Halite
• Salado Halite
F Salado Halite
Salado Halite
Salado Halite
Salado Halite
Salado Halite
Combined Unit 10
>• Combined Unit 10
Salado Halite
Salado Halite
Salado Halite
Salado Halite
Salado Halite
Combined Unit 11
Salado Halite
Salado Halite
Salado Halite
Intrinsic Permeability (m2)Time=0 Yr
5.06xl0"16
5.85xlO"16
5.08xl0"16
5.09xl0'16
5.11xlO"16
1.29xlO'19
1.29xlO'19
5.13xlO"16
5.13xlO"16
5.13xlO'16
5.14xlO"16
5.14xlO"16
5.15xlO"16
5.16xlO"16
5.16xl0"16
1.09xl0"19
1.09xl0'19
5.18xlO'16
5.19xlO"16
5.21xlO"16
5.21xlO'16
5.22xlO'16
2.86xlO"16
5.22xlO"16
5.22xlO'16
5.23xlO"16
• - I
Time=2 Yr
5.06xl0'16
5.85xlO"16
5.08xl0"16
5.09xl0'16
5.11xlO'16
1.29xlO"19
1.29xlO"19
5.13xlO"16
5.13xlO"16
5.13xlO"16
5.14xlO'16
l.OOxlO'20
5.15xlO'16
5.16xlO"16
5.16xlO"16
1.09xl0'19
1.09xl0'19
5.18xlO"16
5.19xlO"16
5.21 xlO"16
5.21xlO"16
5.22xlO"16
2.86xlO"16
5.22xlO'16
5.22xlO"16
5.23 xlO"16
Time=10 Yr
4.15xlO-17
8.42x10"17
3.89x10"17
3.61X10"17
3.31xl0"17
1.29xlO'19
1.29xlO"19
2.99xlO'17
5.53xlO"18
5.25xlO"18
4.95xlO"18
l.OOxlO"20 '
4.48xlO'18
4.08xl0"18
1.02xl0"16
1.09xl0'19
1.09xl0'19
9.66x 10⁻¹⁷
9.18xlO"17
8.76xlO"17
8.55xlO'17
8.44xlO-17
2.86x10"16
5.22x10"16
5.22xlO"16
5.23 xlO'16
Time=25 Yr
l.OOxlO"21
1.88xlO"20
l.OOxlO"21
l.OOxlO"21
l.OOxlO"21
1.29xlO"19
1.29xlO"19
l.OOxlO"21
l.OOxlO"21
l.OOxlO"21
l.OOxlO"21
l.OOxlO"20
l.OOxlO"21
l.OOxlO"21
1.91xlO'18
1.09xl0"19
1.09xl0"19
1.43 xlO"18
l.OlxlO"18
6.34x10"19
4.47xlO'19
3.53xlO"19
2.86xlO"16
5.22xlO"16
5.22xlO'16
5.23xlO"16
Time=50Yr
l.OOxlO*21
1.88xlO"20
l.OOxlO"21
l.OOxlO"21
l.OOxlO"21
1.29xlO"19
1.29xlO'19
l.OOxlO'21
l.OOxlO"21
l.OOxlO"21
l.OOxlO"21
l.OOxlO"20
l.OOxlO"21
l.OOxlO"21
l.OOxlO'21
1.09xl0'19
1.09xl0"19
l.OOxlO"21
l.OOxlO'21
l.OOxlO"21
l.OOxlO'21
l.OOxlO"21
2.86xlO'16
5.22xlO'16
5.22xlO"16
5.23 xlO'16
Time=100 Yr
l.OOxlO'21
1.88xlO"20
l.OOxlO"21
l.OOxlO"21
l.OOxlO"21
1.29xlO"19
1.29xlO"19
l.OOxlO"21
l.OOxlO'21
l.OOxlO'21
l.OOxlO'21
l.OOxlO"20
l.OOxlO"21
l.OOxlO'21
l.OOxlO"21
1.09xl0"19
1.09xl0"19
l.OOxlO'21
l.OOxlO'21
l.OOxlO'21
l.OOxlO"21
l.OOxlO'21
2.86xlO'16
5.22xlO'16
5.22x10'16
5.23xlO'16

• The model was initialized at hydrostatic conditions based on heads in the RustlerFormation.
• The base of the shaft, at the repository horizon, was held at atmospheric conditions.The pressure at the repository horizon will increase after closure in response to far-fieldpressures and waste-generated gas. This assumption maintains a large downwardpotential gradient.
Assumptions relevant to all numerical calculations in this appendix are listed in Section C2.
Except for isolated regions, the Rustler Formation will likely resaturate the DRZ andadjacent rock surrounding the shaft liner in a relatively short period. However, performancemodels show that the lower-shaft seal system will not resaturate with brine and repressurize toambient pressures for at least 100 years. Under variably saturated conditions along the shaft,brine flow rates are expected to be less than those provided in this analysis.
C4.2.2 Numerical Method
The modeling for this investigation was conducted using SWIFT II (Sandia WasteIsolation, Flow, and Transport Code), Version 2F. SWIFT II is a fully transient three-dimensional, finite-difference code that solves the coupled equations for single-phase flow andtransport in "porous and fractured geologic media. SWIFT H was selected because it is versatileand has been extensively verified against analytical results.
SWIFT II is supported by comprehensive documentation and an extensive testing history.Reeves et al. (1986a) discuss the theory and implementation of the code and basic limitations ofthe methodology. A guide to the input data is provided by Reeves et al. (1986b). Comparisonsof the results from SWIFT II to analytical solutions appear in Finley and Reeves (1981), Reeveset al. (1987), and Ward et al. (1984).
C4.2.3 Model Geometry and Boundary Conditions
The full-shaft model was implemented with the cylindrical grid shown in Figures C-3aand C-3b. This grid extends vertically from the shaft station monolith at elevation 387.4 m(1271.0 ft) msl up through the Rustler Formation to an elevation of 872.6 m (2862.7 ft) msl. Thegrid extends radially from the center of the shaft out to an outer radius of 30.9 m (101.4 ft). It iscomposed of 19 radial columns and 99 vertical layers. Tables C-14 and C-15 provide details ofthe grid representing various seal components and host rock units.
Layer thicknesses (Table C-17) and column widths (Table C-18) are chosen so that theywill adequately resolve the flow field within each seal component and each unit of the hostformation without unduly compromising computational efficiency. Consistent with the first-order analysis of Van Sambeek et al. (1993), the total DRZ width (0.370 m) representsapproximately 12% of the shaft radius (3.09 m).
C-36

Shaft Seal & DRZ
Earthen Fill E3Compacted Clay j |Freshwater Concrete j |Salt-Saturated Concrete I IAsphalt MMCompacted Salt I IDRZAsphalt/DRZ
2800-
2700-
2600-
mBSS1Z. 2500 BSSS^j^
evat
UJ 2400-
2300-J
2200-
2100-
|
:i
1:!:;;' 'a
11. ,T
rp'r
-*i
1iiiii
|
i:
ii ii
• • - • - r -
BE
IIIB1M
1
Anhydrite 5Mudstone 4Anhydrite 4
Magenta
Anhydrite3
Mudstone 3Anhydrite 2
Culebra/Mudstone 2
Anhydritel /Mudstone 1
Transition /Bioturbated Clastics
Salado Halite
Combined Unit 1
Salado Halite
Combined Unit 2
Salado Halite
Combined Unit 3
Salado Halite
0 5 10 15 20 25 —>101.4
Radial Distance from Center of Shaft (ft)
Figure C-3a. Full shaft model grid (top).
C-37
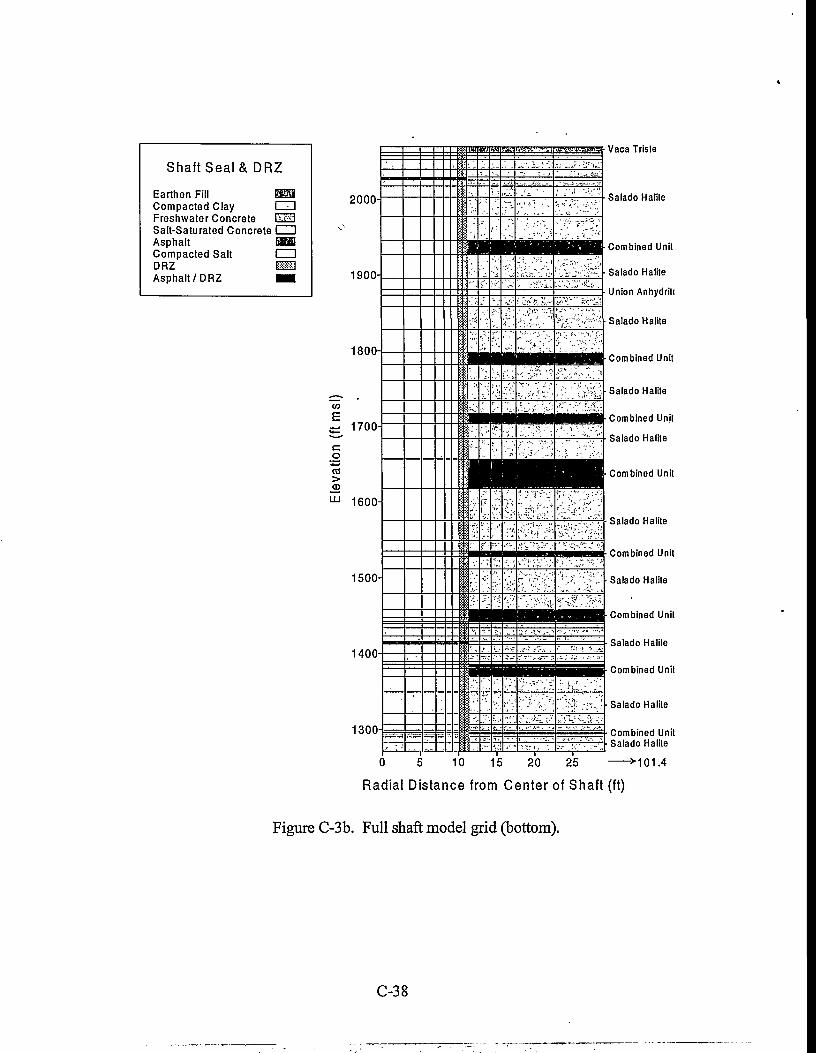
Shaft Seal & DRZ
Earthen FillCompacted Clay j jFreshwater Concrete t'-WiSalt-Saturated Concrete i iAsphalt BBBCompacted Salt I IDRZAsphal t /DRZ
2000-
o
1900-
1800-
CO
E~ 1700-
co"«
m 1600-
1500-
1400-
1300-!.- .
• • "
• J ^
m
7 -
1i-
'-
=
1
-
1
•i .
' ' " ; , - • ' " £
PBBi C-Jr:.'.-. t."'
't'^j :"~*
1
p
Hi" • - * * J
- - : ' ; " •
~ • •
V-
sae
;-i -
!"'^r- ~ V
t—_ - - -
.• ;•-( ^f;
•H'
•HH-
m
' . , • — . — -
. •-: ; i ..-, • .-i-
; - ; : - V ••-.••;{'-:••
Salado Halite
Combined Unit
Salado Halite
Union Anhydrili
Salado Halite
Combined Unit
Salado Halite
Combined Unit
Salado Halite
Combined Unit
Salado Halite
Combined Unit
Salado Halite
Combined Unit
Salado Halite
Combined Unit
Salado Halite
Combined UnitSalado Halite
10 15 20 25
Radial Distance from Center of Shaft (ft)
Figure C-3b. Full shaft model grid (bottom).
C-38

LayerNumber
1 (TOP)
2
3
4
5
6
•7
8
9
10
11
12
13
14
15
.1617
18
19
20
21
Table C-17. Full-Shaft Model Vertical
LayerThickness (m)
1.52
3.11
2.29
2.13
4.69
7.82
11.26
5.80
2.90
3.15
3.41
8.99
13.72
7.76
4.02
2.07
1.72
1.02 :
2.04
4.97
5.86
Shaft Seal Component
Earthen Fill
Earthen Fill
Earthen Fill
Rustler Compacted ClayColumn
Rustler Compacted ClayColumn
Rustler Compacted ClayColumn
Rustler Compacted ClayColumn
Rustler Compacted ClayColumn
Rustler Compacted ClayColumn
Rustler Compacted ClayColumn
Rustler Compacted ClayColumn
Rustler Compacted ClayColumn
Rustler Compacted ClayColumn
Rustler Compacted ClayColumn
Concrete Plug
Concrete Plug
Asphalt Column
Asphalt Column
Asphalt Column
Asphalt Column
Asphalt Column
Layers
Host Formation Unit
Anhydrite 5
Anhydrite 5
Mudstone 4
Mudstone 4
Anhydrite 4
Magenta
Anhydrite 3
Anhydrite 3
Mudstone 3
Anhydrite 2
Anhydrite 2
Culbera/Mudstone 2
Anhydritel/Mudstone 1
Transition/Bioturbated Clastics
Transition/Bioturbated Clastics
Transition/Bioturbated Clastics
Transition/Bioturbated Clastics
Transition/Bioturbated Clastics
Transition/Bioturbated Clastics
Salado Halite
Salado Halite
C-39
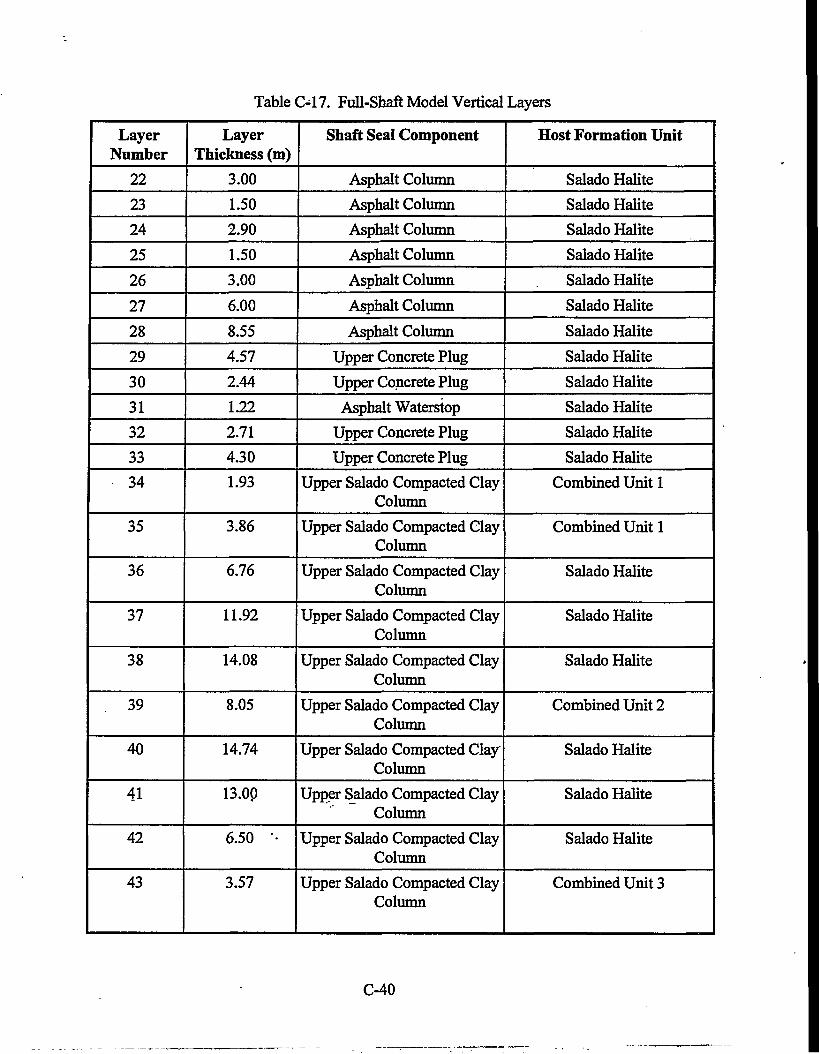
Table C-17. Full-Shaft Model Vertical Layers
LayerNumber
22
23
24
25
26
27
28
2930
31
32
33
34
35
36
37
38
39
40
41
42
43
LayerThickness (m)
3.00
1.50
2.90
1.50
3.00
6.00
8.55
4.57
2.44
1.22
2.71
4.30
1.93
3.86
6.76
11.92
14.08
8.05
14.74
13.00
6.50 ••
3.57
Shaft Seal Component
Asphalt Column
Asphalt Column
Asphalt Column
Asphalt Column
Asphalt Column
Asphalt Column
Asphalt Column
Upper Concrete Plug
Upper Concrete Plug
Asphalt Waterstop
Upper Concrete Plug
Upper Concrete Plug
Upper Salado Compacted ClayColumn
Upper Salado Compacted ClayColumn
Upper Salado Compacted ClayColumn
Upper Salado Compacted ClayColumn
Upper Salado Compacted ClayColumn
Upper Salado Compacted ClayColumn
Upper Salado Compacted ClayColumn
Upper Salado Compacted ClayColumn
Upper Salado Compacted ClayColumn
Upper Salado Compacted ClayColumn
Host Formation Unit
Salado Halite
Salado Halite
Salado Halite
Salado Halite
Salado Halite
Salado Halite
Salado Halite
Salado Halite
Salado Halite
Salado Halite
Salado Halite
Salado Halite
Combined Unit 1
Combined Unit 1
Salado Halite
Salado Halite
Salado Halite
Combined Unit 2
Salado Halite
Salado Halite
Salado Halite
Combined Unit 3
C-40

LayerNumber
44
45
46
47
48
49
50
51
52
53
54
55
56
57
58
59
60
61
62
63
34
65
66
61
68
69
Table <
LayerThickness (m)
4.87
6.13
4.27
2.44
1.22
1.52
3.90
3.12
1.22
2.44
4.57
7.65
9.69
5.79
9.49
4.57
2.29
4.57
9.17
9.45
4.72
6.41
8.17
5.24 ..
3.96
6.00
3-17. Full-Shaft Model Vertical Layers
Shaft Seal Component
Upper Salado Compacted ClayColumn
Upper Salado Compacted ClayColumn
Upper Salado Compacted ClayColumn
Upper Salado Compacted ClayColumn
Upper Salado Compacted ClayColumn
Upper Salado Compacted ClayColumn
Middle Concrete Plug
Middle Concrete Plug
Asphalt Waterstop
Middle Concrete Plug
Middle Concrete Plug
Compacted Salt Column
Compacted Salt Column
Compacted Salt Column
Compacted Salt Column
Compacted Salt Column
Compacted Salt Column
Compacted Salt Column
Compacted Salt Column
Compacted Salt Column
Compacted Salt Column
Compacted Salt Column
Compacted Salt Column
Compacted Salt Column
Compacted Salt Column
Compacted Salt Column
Host Formation Unit
Salado Halite
Salado Halite
Salado Halite
Vaca Triste
Salado Halite
Salado Halite
Salado Halite
Salado Halite .
Salado Halite
Salado Halite
Salado Halite
Salado Halite
Salado Halite
Combined Unit 4
Salado Halite
Salado Halite
Union Anhydrite
Salado Halite
Salado Halite
Salado Halite
Combined Unit 5
Salado Halite
Salado Halite
Salado Halite
Combined Unit 6
Salado Halite
C-41

LayerNumber
70
71
72
73
74
75
76
77
78
79
80
81
82
83
84
85
86
87
88
89
90
91
92
93
94
Table <
LayerThickness (m)
8.33
11.83
12.97
8.00
4.25
2.29
4.88
9.95
6.52
3.11
1.65
0.82
1.65
3.23
2.13
1.22
3.63
3.38
1.13
1.52
3.18
6.33
8.66
4.39
2.19
>17. Full-Shaft Model Vertical Layers
Shaft Seal Component
Compacted Salt Column
Compacted Salt Column
Compacted Salt Column
Compacted Salt Column
Compacted Salt Column
Compacted Salt Column
Compacted Salt Column
Compacted Salt Column
Compacted. Salt Column
Compacted Salt Column
Compacted Salt Column
Compacted Salt Column
Lower Concrete Plug
Lower Concrete Plug
Lower Concrete Plug
Asphalt Waterstop
Lower Concrete Plug
Lower Concrete Plug
Lower Salado Compacted ClayColumn
Lower Salado Compacted ClayColumn
Lower Salado Compacted ClayColumn
Lower Salado Compacted ClayColumn
Lower Salado Compacted ClayColumn
Lower Salado Compacted ClayColumn
Lower Salado Compacted ClayColumn
Host Formation Unit
Salado Halite
Combined Unit 7
Salado Halite
Salado Halite
Salado Halite
Combined Unit 8
Salado Halite
Salado Halite
Salado Halite
Combined Unit 9
Combined Unit 9
Salado Halite
Salado Halite
Salado Halite
Salado Halite
Salado Halite
Salado Halite
Salado Halite
Salado Halite
Combined Unit 10
Combined Unit 10
Salado Halite
Salado Halite
Salado Halite
Salado Halite
C-42
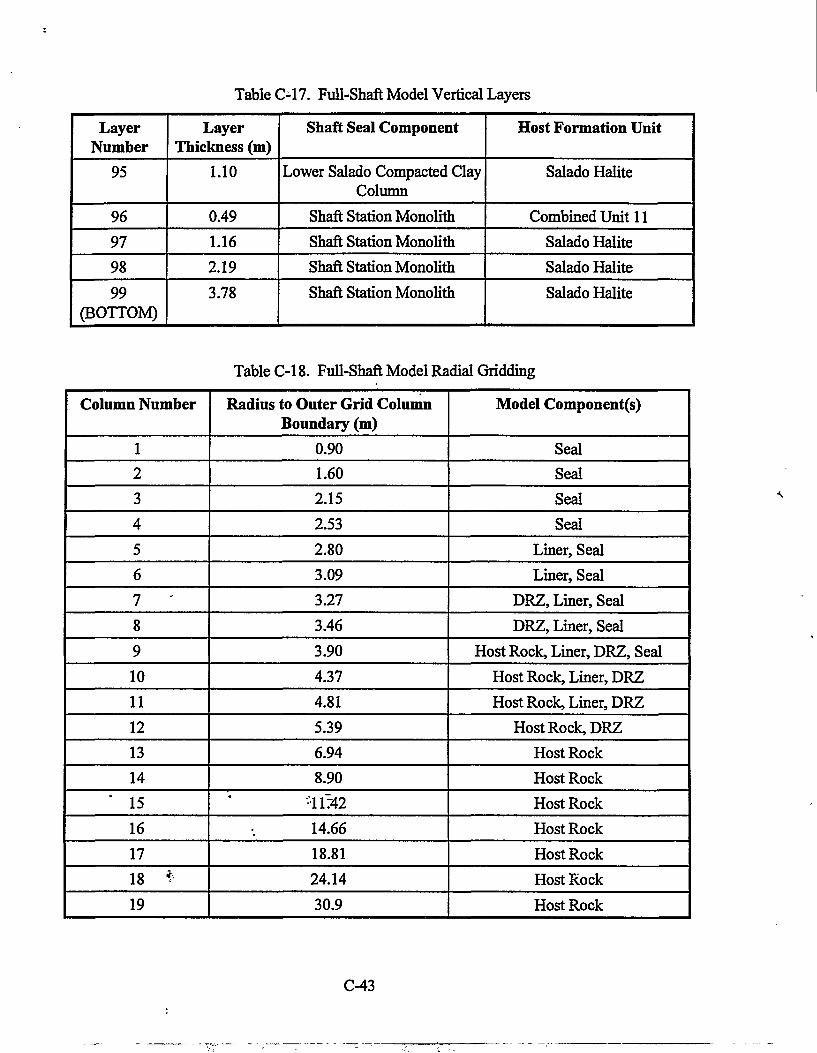
Table C-17. Full-Shaft Model Vertical Layers
LayerNumber
95
96
97
98
99(BOTTOM)
LayerThickness (m)
1.10
0.49
1.16
2.19
3.78
Shaft Seal Component
Lower Salado Compacted ClayColumn
Shaft Station Monolith
Shaft Station Monolith
Shaft Station Monolith
Shaft Station Monolith
Host Formation Unit
Salado Halite
Combined Unit 11
Salado Halite
Salado Halite
Salado Halite
TableC-18. Full-Shaft Model Radial Gridding
Column Number
12
3
4
5
6
7 '
8
9
10
11
12
13
14
15
16
17
18 *
19
Radius to Outer Grid ColumnBoundary (m)
0.90
1.60
2.15
2.53
2.80
3.09
3.27
3.46
3.90
4.37
4.81
5.39
6.94
8.90
-11:42
14.66
18.81
24.14
30.9
Model Component(s)
Seal
Seal
Seal
Seal
Liner, Seal
Liner, Seal
DRZ, Liner, Seal
DRZ, Liner, Seal
Host Rock, Liner, DRZ, Seal
Host Rock, Liner, DRZ
Host Rock, Liner, DRZ
Host Rock, DRZ
Host Rock
Host Rock
Host Rock
Host Rock
Host Rock
Host Rock
Host Rock
C-43

Because the outer boundary condition accurately characterizes an infinite aquifer, it isunnecessary to extend the radial grid to large distances. The radial boundary was fixed at 30.9 m(10 shaft radii), a distance sufficient to capture any vertical flow components that may arise inthe host rock during the shaft resaturation process. Beyond the outermost extent of the sealcomponents (4.81 m), a node-distributed grid is used because it is most appropriate for a radiallyconverging flow field. Here coordinates of the nodal points increase in geometric progression, asrecommended by Aziz and Settari (1979, p. 87).
Grid sensitivities are not expected. For liquid flow, flow rates are sufficiently small thatthe chosen level of refinement can resolve pressure gradients. It is important to resolve suchgradients because they control the rates at which groundwater moves downward through sealcomponents and radially inward through host rock.
For gas flow as simulated with a similar grid in Model 2, the situation is quite different.Within seal components lying below the lower seal, gas pressurization times are sufficientlysmall in comparison to the time required for salt-column reconsolidation that it is unnecessary toresolve gradients in the pressure front with either spatial or temporal discretization. Rather, gridrefinement must be focused on the critical lower seal components and the DRZ that surroundsthem. Here it is essential to resolve pressure gradients.
After DRZ healing, permeabilities of these components are sufficiently small so thatlong-term pressure gradients can be maintained, thus limiting gas pressurization of the saltcolumns as desired. Current results of two-phase simulations indicate that this grid is sufficientlyrefined to show substantially limited gas flows. Although some level of grid sensitivity could bepresent for gas flow within the lower seal components and surrounding DRZ, further refinementwould yield only steeper pressure gradients and even smaller gas flow rates into the salt column.
For the model to accurately represent formation conditions at the time of closure, a pre-closure period was simulated. Therefore the modeling was conducted in two stages. The pre-closure period extended from the time of shaft excavation to the time of shaft closure. Theduration was assumed to be 50 years. The shaft was considered to be instantaneously excavated,and development of the DRZ was considered to occur instantaneously after shaft excavation.The initial pressure conditions, in the portions of the system other than the open shaft, wererepresented by hydrostatic equilibrium based on an undisturbed head of 927 m msl at the centerof the Culebra and a single-density fluid of 1230 kg/m3. The pressure in the open shaft was heldat 1 atm for the duration of the pre-closure simulation. No-flow boundary conditions wereimposed at the top and bottom of the model. Infinite aquifer boundary conditions were set at theouter edge of the modeled region. The model components for the pre-closure simulation werethe open shaft, the existing shaft liner, the DRZ, and the undisturbed formation.
"- The purpose of pre-closure modeling was to develop the pressure distribution in theformations created by the open shaft. For the post-closure period, the shaft was sealed and theinitial grid-block pressures were set equal to the final grid-block pressures of the pre-closuresimulation. Sealing of the shaft was considered to occur instantaneously. To maximize thedriving force between the Rustler Formation and the bottom of the shaft, atmospheric pressurewas maintained at the bottom of the shaft and DRZ. Otherwise, no-flow boundary conditionswere imposed at the bottom and top of the model and along the vertical boundary at the center of
C-44

the shaft. Infinite aquifer boundary conditions were set at the outer edge of the modeled region.The model components for the post-closure simulation were the earthen fill, freshwater concrete,salt-saturated concrete, asphalt, compacted clay, crushed salt, the existing shaft liner, the DRZ,and the undisturbed formation. Freshwater concrete was assigned properties identical to thosespecified for salt-saturated concrete.
C4.2.4 Model Parameters
The model parameters were discussed in detail in Section C3. As reported in that section,permeabilities within the compacted salt column and within the Salado DRZ are transient (seeTables C-5 and C-16). Figures C-4 and C-5 illustrate the model permeabilities for the base-casesimulation during the open-shaft period, at closure (t = 0 years), at 2 years (t = 2), and at 200years (t = 200). These figures demonstrate the transient nature of the DRZ and compacted saltcolumn permeabilities. These figures offer a method to integrate all of the permeabilityinformation provided in the tables in Section C3.
The base-case simulation assumed that the anhydrites in the Rustler Formation andanhydrites greater than 3 m thick in the Salado Formation had no DRZ (based on mechanicalmodeling results presented in Appendix D). This condition results in a discontinuous DRZ at thetime of closure (see Figure C-4, second panel), as discussed in Section C3.5.1. Although thiscase could be realistic, a second case (Run 2) was considered to allow assessment of the impactof the discontinuous DRZ. The relationship developed for the Salado DRZ (Equation C-3) wasapplied to all lithologies for Run 2, resulting in a continuous DRZ along the shaft wall. Run 2included concrete-asphalt waterstops that completely healed the adjacent DRZ after two years.
Run 3 was a sensitivity simulation to examine the impact of the concrete-asphaltwaterstops. Run 3 incorporated a continuous DRZ at the time of shaft closure, as in Run 2.However, in contrast to Run 2, the DRZ adjacent to the concrete-asphalt waterstops was allowedto heal at the same rate as the DRZ adjacent to the concrete of the plugs, rather than in two years.Table C-19 summarizes the three simulations, highlighting the principal differences among them.
Table C-19. Performance Model 1 Simulations
Run
1 (Base-Case)
2
3
DRZ
Discontinuous
Continuous
Continuous
Waterstops
Yes
Yes
No
C4.3 Performance Model Results
Simulation results for Performance Model 1 are presented in terms of brine flow rates(m3/yr), cumulative flow (m3), and pressure distribution plots. Figure C-6 shows calculated brineflow rates for Runs 1 through 3 measured at the Rustler/Salado contact and at the top and bottomof the compacted salt column. Although the simulations continued out to 1000 years after shaftclosure, the brine flow values were plotted to only 50 years because flow rates diminished to lessthan 0.03 m3/yr by that time.
C-45

Open Shaft 0 Years (At Closure)
o
Logk(m')
-12.0
-12.5
--13.0
--13.5
--14.0
-14.5
-15.0
-15.5
-16.0
-16.5
-17.0
-17.5
-18.0
-18.5
-19.0
-19.5
-20.0
-20.5
-21.0
Log k (m2)
--12.5
--13.0
--13.5
--14.0
--14.5
•-15.0
•-15.5
--16.0
--16.5
•-17.0
--17.5
•-18.0
•-18.5
•-19.0
-19.5
•-20.0
•-20.5
--21.0
0 2 4 6 8 10 12 14 16 18
Column
0 2 4 6 8 10 12 14 16 18
Column
Figure C-4. Permeability fields for Run 1 (base case).

2 Years
n
200 Years
Logk(m2)
--12.5
•-13.0
--13.5
•-14.0
--14.5
•-15.0
•-15.5
--16.0
•-16.5
--17.0
--17.5
--18.0
--18.5
•-19.0
--19.5
--20.0
•-20.5
--21.0
0 2 4 6 8 10 12 14 16 18
Column
90
Logk(m2)
-12.5
--13.0
--13.5
--14.0
-14.5
-15.0
-15.5
-16.0
-16.5
-17.0
-17.5
-18.0
-18.5
-19.0
-19.5 ,
-20.0
-20.5
-21.0
0 2 4 6 8 10 12 14 16 18
Column
Figure C-5. Permeability fields for Run 1 (base case).

qoo
3 •
o - -
Run1Discontinuous DRZ
with Waterstops
• Rustler / Salado
•Top of Salt Column
• Base of Salt Column
0 20 40
Years After Shaft Closure
b -
4
3 -
2 -
1 -
o -
1 -
•
\
Run 2Continuous DRZwith Waterstops
Rustler / Salado
Top of Salt Column
Base of Salt Column
— , . , 1 , , . 1 , —
0 20 40
Years After Shaft Closure
4 •
1 • •
o • -
-1
Run 3Continuous DRZ
without Waterstops
' Rustler / Salado
•Top of Salt Column
• Base of Salt Column
0 20 40
Years After Shaft Closure
Figure C-6. Model 1 flow rates.

Figure C-7 shows the cumulative flow at 200 years measured at the Rustler/Saladocontact and the top and bottom of the compacted salt column. Flow for each level for each runwas divided into three components: flow through the shaft seal materials, flow through the DRZ,and flow through the intact host rock out to a radial distance of 10 shaft radii. As expected, flowthrough the intact rock was minimal for all cases. In Runs 2 and 3, where the DRZ iscontinuous, the amount of flow moving down through the seal system increased as a function ofdepth. This was a product of the model boundary conditions that direct formation fluids throughthe base of the shaft. In Run 1, the combination of a discontinuous DRZ and the waterstopscreated a pressure sink within and adjacent to the upper Salado compacted clay column. Thesmall amount of flow moving down across the Rustler/Salado contact was used to repressurizethe sink and did not migrate past the top of the compacted salt column.
The flow volumes predicted by Model 1 provided an estimate of the number of sealcomponent pore-volumes that will pass through a given seal component. This exercise providesa useful method of quantifying flow estimates and is useful in the evaluation of seal materiallongevity. The total volume passing across the Rustler/Salado contact, the top of the compactedsalt column, and the bottom of the compacted salt column was estimated for a 10,000-yearperiod. Because the simulation did not extend for 10J000 years, the last simulated flow rate wasused as a constant for times greater than the simulation time. As discussed in Section C4.2.1, theflow direction will reverse as the system equilibrates. The estimated flow volumes presented . .here are therefore maximum values.
The flow volumes were estimated for the top of the Salado concrete seal components andthe compacted clay components. These flow volumes were then converted to total number ofpore-volumes for a given seal component. The largest number of pore volumes predicted to flowthrough any Salado concrete component was 4. This calculation does not account for the volumeof the asphalt waterstop. The largest number of pore volumes that flowed through any Saladocompacted clay column was 0.4 for the lower Salado compacted clay column.
Figures C-8 and C-9 illustrate the change in pressure distribution with time for Run 1(Discontinuous DRZ with Waterstops). All pressures are referenced to the elevation at the baseof the model. The first panel of Figure C-8 shows the pressure drawdown at the end of the openshaft period just before shaft closure. The second panel shows the pressure profile just prior toactivation of the waterstops. The first of the two panels shown hi Figure C-9 illustrates the effectof the waterstops. The final panel in this sequence shows that most of the model has beenrepressurized by 200 years after shaft closure.
The potential for dissolution of salt in the Salado DRZ was introduced hi Section C3.5.The results of Model 1 can be used to estimate the volume of salt that could be dissolved. Run 1of the performance model predicts a maximum of about 1000 kg (1 m3) of groundwater willmigrate into the Salado DRZ. A maximum of about 0.14 m3 of salt could be dissolved hi thisquantity of groundwater. The DRZ adjacent to the asphalt column contains approximately1700 m3 of salt. Dissolution of 0.14 m3 of salt constitutes less than 0.01% of the DRZ volume.Therefore the probability that dissolutions will impact performance is exceedingly low.
C-49

o©
35
30-
25-
20
15
10-
5-Run 1
Discontinous DRZwith Waterstops
Run 2Continous DRZwith Waterstops
Rustler/ Top of Base ofSalado Salt Salt
Column Column
Rustler/ Top of Base ofSalado Salt Salt
Column Column
Run 3Continous DRZ
without Waterstops
Rustler/ Top of Base ofSalado Salt Salt
Column Column
Figure C-7. Cumulative flow at 200 years.
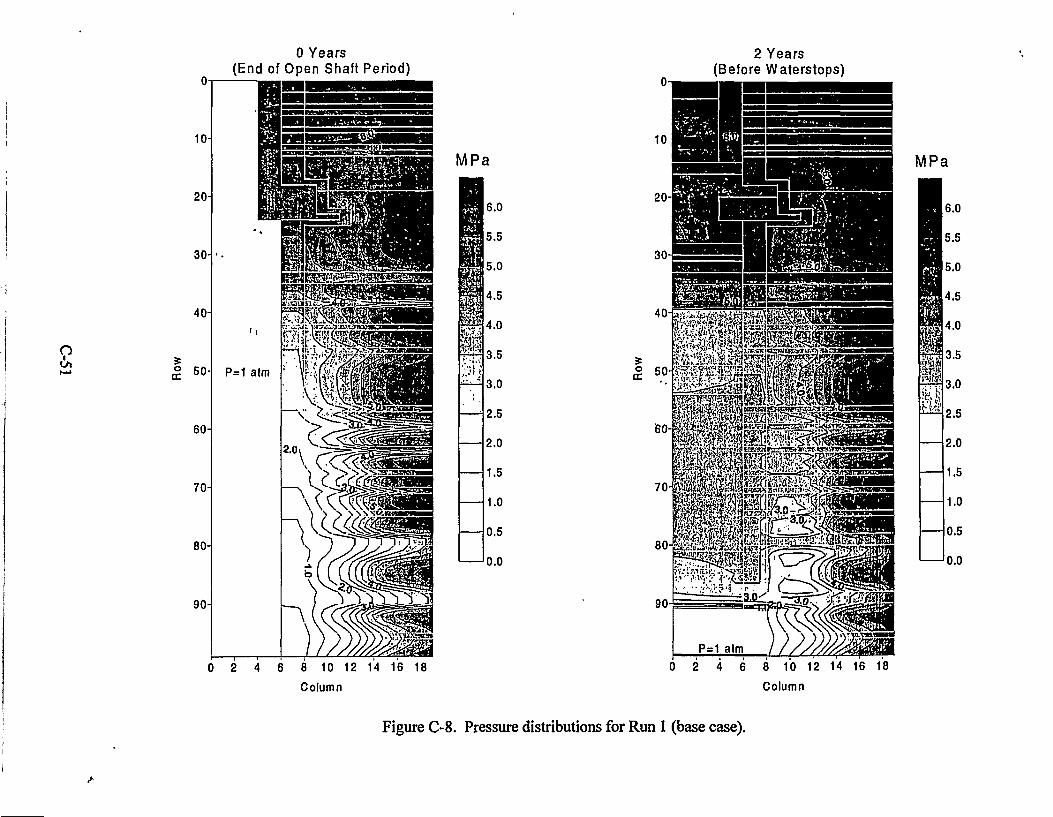
0 Years(End of Open Shaft Period)
S
2 Years(Before Waterstops)
MPa
16.0
5.5
|5.0
I4-5
H4.0
3.5
3.0
2.5
2.0
1.5
1.0
0.5
0.0
MPa
si
6.0
5.5
5.0
4.5
4.0
3.5
3.0
2.5
2.0
1.5
1.0
0.5
0.0
0 2 4 6 8 10 12 14 16 18
Column
0 2 4 6 8 10 12 14 16 18
Column
Figure C-8. Pressure distributions for Run 1 (base case).

10 Years(After Waterstops) 200 Years
9to
90
P=1 atm
MPa
ffik
6.0
5.5
5.0
4.5
4.0
3.5
3.0
2.5
2.0
1.5
1.0
0.5
0.0
0 2 4 6 8 10 12 14 16 18
Column
0 2 4 6 8 10 12 14 16 18
Column
Figure C-9. Pressure distributions for Run 1 (base case).
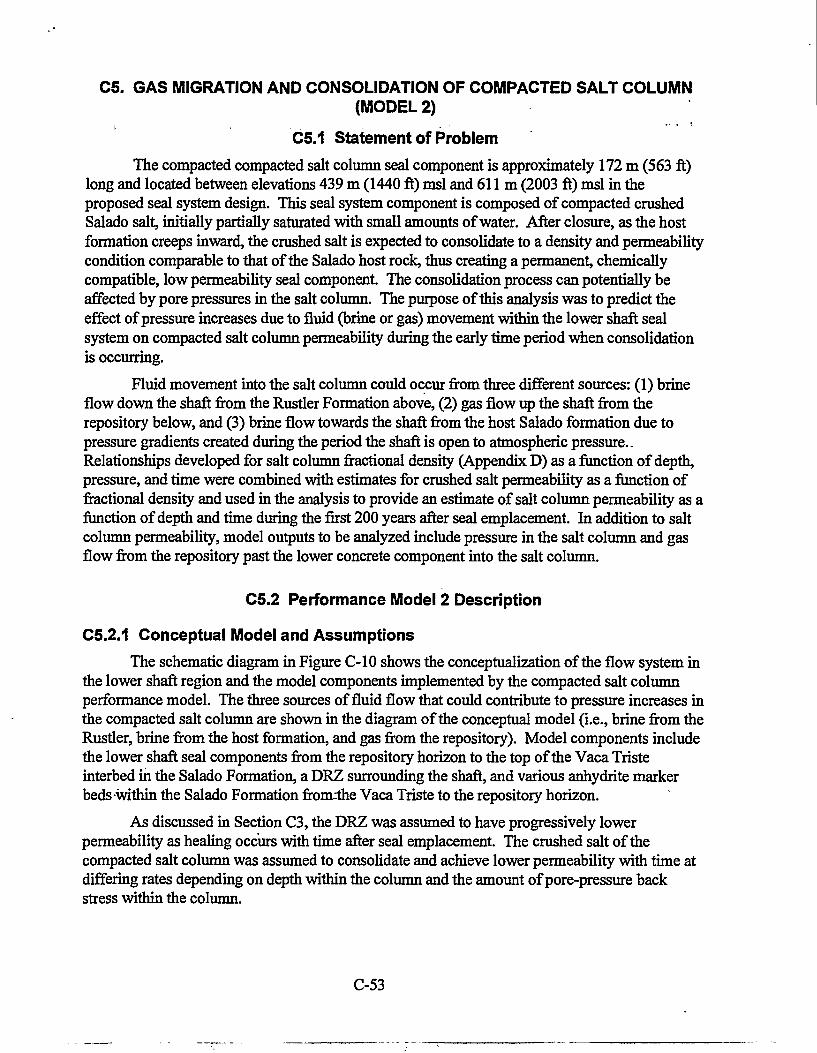
C5. GAS MIGRATION AND CONSOLIDATION OF COMPACTED SALT COLUMN(MODEL 2)
t . . . • . < • • '
C5.1 Statement of Problem
The compacted compacted salt column seal component is approximately 172 m (563 ft)long and located between elevations 439 m (1440 ft) msl and 611 m (2003 ft) msl in theproposed seal system design. This seal system component is composed of compacted crushedSalado salt, initially partially saturated with small amounts of water. After closure, as the hostformation creeps inward, the crushed salt is expected to consolidate to a density and permeabilitycondition comparable to that of the Salado host rock, thus creating a permanent, chemicallycompatible, low permeability seal component. The consolidation process can potentially beaffected by pore pressures in the salt column. The purpose of this analysis was to predict theeffect of pressure increases due to fluid (brine or gas) movement within the lower shaft sealsystem on compacted salt column permeability during the early time period when consolidationis occurring.
Fluid movement into the salt column could occur from three different sources: (1) brineflow down the shaft from the Rustler Formation above, (2) gas flow up the shaft from therepository below, and (3) brine flow towards the shaft from the host Salado formation due topressure gradients created during the period the shaft is open to atmospheric pressure.-Relationships developed for salt column fractional density (Appendix D) as a function of depth,pressure, and time were combined with estimates for crushed salt permeability as a function offractional density and used in the analysis to provide an estimate of salt column permeability as afunction of depth and time during the first 200 years after seal emplacement. In addition to saltcolumn permeability, model outputs to be analyzed include pressure in the salt column and gasflow from the repository past the lower concrete component into the salt column.
C5.2 Performance Model 2 Description
C5.2.1 Conceptual Model and Assumptions
The schematic diagram in Figure C-10 shows the conceptualization of the flow system inthe lower shaft region and the model components implemented by the compacted salt columnperformance model. The three sources of fluid flow that could contribute to pressure increases inthe compacted salt column are shown in the diagram of the conceptual model (i.e., brine from theRustler, brine from the host formation, and gas from the repository). Model components includethe lower shaft seal components from the repository horizon to the top of the Vaca Tristeinterbed in the Salado Formation, a DRZ surrounding the shaft, and various anhydrite markerbeds within the Salado Formation from-ihe Vaca Triste to the repository horizon.
As discussed in Section C3, the DRZ was assumed to have progressively lowerpermeability as healing occurs with time after seal emplacement. The crushed salt of thecompacted salt column was assumed to consolidate and achieve lower permeability with time atdiffering rates depending on depth within the column and the amount of pore-pressure backstress within the column.
C-53

Brine fromRustler
Brine from IHost Formation
ftSHAFTSTATlOHE' " M O N O U T H S * "
RepositoryGas
Brine fromHost Formation
Figure C-10. Conceptual diagram of compacted salt column performance model components.
C-54

Results obtained from the full-shaft saturated flow model discussed in Section C4indicate no brine flow down the shaft into the compacted salt column from the Rustler Formationfor the case of a discontinuous DRZ, 2.7 m3 for a continuous DRZ with waterstops, or 17.2 m3
for the case of a continuous DRZ without waterstops. This volume of fluid was accounted for inthe compacted salt column performance model by including it in the initial brine saturation of thecrushed salt. The Rustler flow was distributed evenly throughout the entire pore space of thecolumn by making an appropriate adjustment to initial salt column liquid saturation.
Pressure increase resulting from gas generation within the repository was simulated byapplying an increasing gas pressure boundary condition at the base of the shaft. The repositorypressure was assumed to increase to 7 MPa in 100 years in one case and 14 MPa in 200 years ina second case. Additional assumptions included in the compacted salt column performancemodel are discussed in Section C2.
C5.2.2 Numerical Model
The computer code used to implement the compacted salt column performance model isTOUGH28W, Version 2.02 (TOUGH2). TOUGH28W is a numerical simulation program formulti-dimensional coupled fluid and heat flows of multi-phase, multi-component fluid mixturesin porous and fractured media. This code was developed by Karsten Pruess at LawrenceBerkeley National Laboratory and has been used extensively in studies of high-level nuclearwaste isolation in partially saturated geologic media (Pruess, 1991). TOUGH28W includes anumber of fluid property equation-of-state modules. These modules make the code applicable toa variety of subsurface flow systems, including groundwater aquifers, unsaturated zones, andgeothermal reservoirs. The version of the code used for this study incorporates the equation-of-state module EOS8W, which allows for simulation of the three phases water, air, and oil. Thisversion includes a feature which optionally allows for specification of fluid propertiesrepresentative of WIPP brine instead of water and hydrogen instead of air.
Version 2.02 includes a modification that permits specification of permeability as afunction of time for specific model regions. This feature was included to simulate the reductionin permeability of the DRZ around the shaft attributable to healing after seal emplacement. Thefeature was implemented by allowing the user to provide as input a table specifyingpermeabilities at different values of the time variable and a rock type (i.e., region) to which thetable applies. At each calculational time-step, the code will interpolate a permeability value fromthe table and apply that value to the specified region.
Version 2.02 also includes a modification to allow specification of permeability as afunction of depth and pressure. This feature was included in order to simulate reconsolidation ofthe compacted salt column at differing rates depending on depth within the column and pore-pressure back stress. This feature was implemented by allowing the user to provide a table asinput specifying the rate of change of permeability at different values of pore pressure andelevation for a specific rock type (i.e., region) to which the table applies. At each time-step foreach grid element in the specified region, the rate of change in permeability obtained from thetable is multiplied by the step size and applied to that grid element subject to specified minimumand maximum permeability values.
C-55

C5.2.3 Model Geometry and Boundary Conditions
The compacted salt column performance model was implemented with the radiallysymmetric cylindrical grid shown in Figure C-l 1. The modeled region extends in the verticaldirection from the base of the shaft at elevation 387 m (1271 ft) up to the top of the Vaca Tristeunit at elevation 631 m (2070 ft). The modeled region extends in the radial direction from thecenter of the shaft to the outer radial boundary at 282 m (925 ft).
The radial extent of Figure C-l 1 is truncated at 100 ft in order to show shaft detail. Thegrid contains 25 columns of grid cells in the radial direction and 59 layers in the verticaldirection. The innermost four columns of grid cells represent the shaft and associated sealmaterials, and the next two columns radially outward represent a DRZ surrounding the shaft.Seal components represented in the model include, from top to bottom:
• a small portion of the upper Salado compacted clay column,
• the middle concrete component including asphalt waterstop,
• the compacted salt column,
• the lower concrete component including asphalt waterstop,
• the lower Salado compacted clay column, and
• the shaft station concrete monolith.
Although the last component is represented in the model grid, no "credit" is taken for its sealingproperties; thus the model permeability of the shaft station monolith was set relatively high(1 xlO"14 m2) when compared to other model permeabilities.
The host Salado Formation was modeled as layers of halite separated by several layers ofanhydrite marker beds. Some of the interbeds that occur close together are combined in themodel into single layers, as discussed in Section C3. Table C-20 provides details of the modelgrid layers representing the various seal components and host formation units. Table C-21provides details of model gridding in the radial direction.
The leftmost model boundary was considered to be no-flow since this is the line ofsymmetry at the center of the shaft. The rightmost model boundary (i.e. the outer radialboundary) was assumed to be a constant pressure boundary at hydrostatic equilibrium relative to12.5 MPa in MB139 near the base of the repository. A boundary radius of 282 m (926 ft) wasdetermined by conducting a series of one-dimensional sensitivity runs to determine at whatdistance pressure response in the shaft was not sensitive to boundary location. The top andbottom model boundaries were assumed to be no-flow boundaries. This is a reasonableassumption for the time period considered in this model since pressure gradients are primarilydirected radially inward'because of theiopen-shaft condition during the repository operationalperiod.
C-56
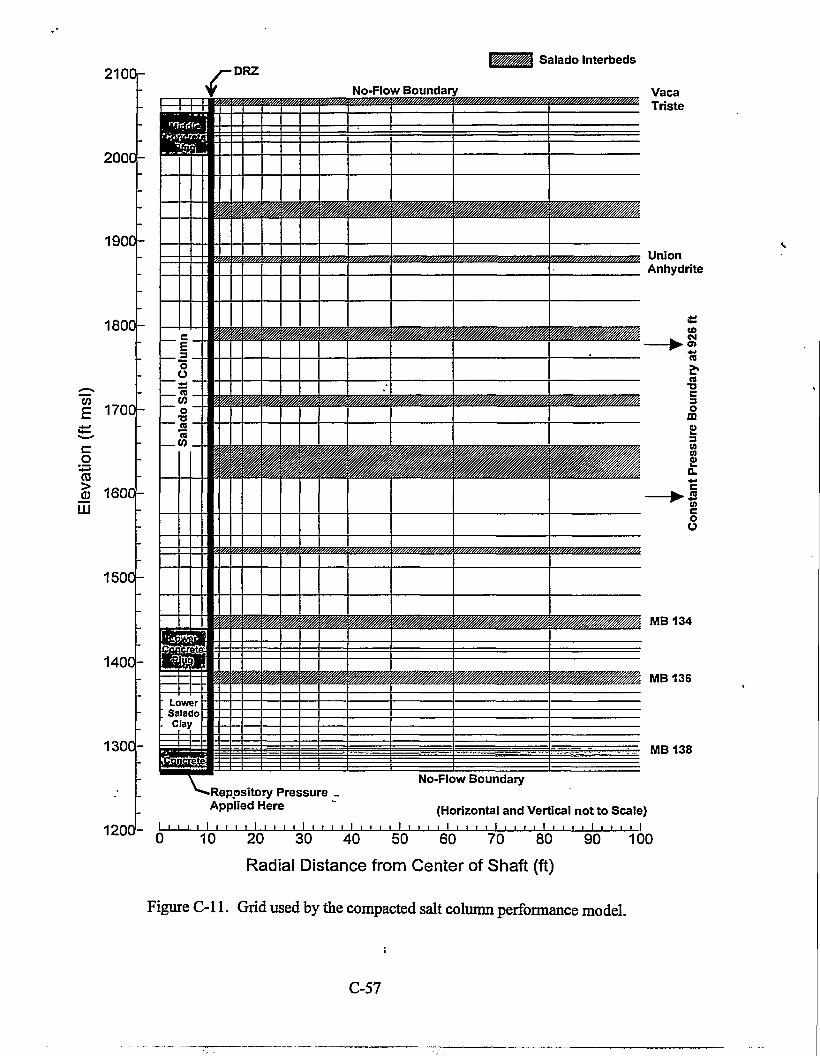
Salado Interbeds2100r
2000-
1900-
1800-
1700-
cJO"TOjLLJ
1600-
1500-
1400-
1300-
Vaca2 Triste
MB 138
•Repository Pressure _Applied Here
No-Flow Boundary
(Horizontal and Vertical not to Scale)I i i i i i i i i i i i i i i i , i . i i i i i i i
0 10 20 30 40 50 60 70 80 90 100
Radial Distance from Center of Shaft (ft)
Figure C-l 1. Grid used by the compacted salt column performance model.
C-57

Table C-20. Vertical Layers of the Compacted Salt Column Performance Model
LayerNumber
1(TOP)
2
3
4
5
6
7
8
9
10
11
12
13
14
15
16
17
18
19
20
21
" 22
23
24
25
26
LayerThickness (m)
2.44
2.74
4.57
2.44
1.22
2.44
4.57
7.65
9.69
5.79
9.49
4.57
2.29
4.57
9.17
9.45
4.72
6.41
8.17
5.24
3.96
6.00
8.33..
11.83
12.97
8.00
Shaft Seal Component
Upper Salado CompactedClay Column
Upper Salado CompactedClay Column
Middle Concrete Plug
Middle Concrete Plug
Asphalt Waterstop
Middle Concrete Plug
Middle Concrete Plug
Compacted Salt Column
Compacted Salt Column
Compacted Salt Column
Compacted Salt Column
Compacted Salt Column
Compacted Salt Column
Compacted Salt Column
Compacted Salt Column
Compacted Salt Column
Compacted Salt Column
Compacted Salt Column
Compacted Salt Column
Compacted Salt Column
Compacted Salt Column
Compacted Salt Column
Compacted Salt Column
Compacted Salt Column
Compacted Salt Column
Compacted Salt Column
Host Formation Unit
Vaca Triste
Salado Halite
Salado Halite
Salado Halite
Salado Halite
Salado Halite
Salado Halite
Salado Halite
Salado Halite
Combined MB117 - MB122and Zone A
Salado Halite
Salado Halite
Union Anhydrite
Salado Halite
Salado Halite
Salado Halite
Combined MB123 - MB124
Salado Halite
Salado Halite
Salado Halite
Combined Zone B - C andMB 126
Salado Halite
Salado Halite
Combined MB127 - MB130and Zones D -1
Salado Halite
Salado Halite
C-58

Table C-20. Vertical Layers of the Compacted Salt Column Perfonnance Model
LayerNumber
27
28
29
30
31
32
33
34
35
36
37
38
39
40
41
42
43
44
45
46
47
48
LayerThickness (m)
4.25
2.29
4.88
9.95
7.35
4.75
4.57
2.44
1.22
2.44
4.57
0.61
1.22
2.87
3.05
3.05
3.05
3.05
3.05
3.05..
2.32
1.83
Shaft Seal Component
Compacted Salt Column
Compacted Salt Column
Compacted Salt Column
Compacted Salt Column
Compacted Salt Column
Compacted Salt Column
Lower Concrete Plug
Lower Concrete Plug
Asphalt Waterstop
Lower Concrete Plug
Lower Concrete Plug
Lower Salado CompactedClay Column
Lower Salado CompactedClay Column
Lower Salado CompactedClay Column
Lower Salado CompactedClay Column
Lower Salado CompactedClay Column
Lower Salado CompactedClay Column
Lower Salado CompactedClay Column
Lower Salado Compacted-~ Clay Column
Lower Salado CompactedClay Column
Lower Salado CompactedClay Column
Lower Salado Compacted
Host Formation Unit
Salado Halite
Combined MB131 - MB133and Zone J
Salado Halite
Salado Halite
Salado Halite
Combined MB134 - MB135
Salado Halite
Salado Halite
Salado Halite
Salado Halite
Salado Halite
Combined MB136-MB137
Combined MB136-MB137
Combined MB136-MB137
Salado Halite
Salado Halite
Salado Halite
Salado Halite
Salado Halite
Salado Halite
Salado Halite
Salado Halite
C-59

Table C-20. Vertical Layers of the Compacted Salt Column Performance Model
LayerNumber
49
50
51
52
53
54
55
56
57
58
59(BOTTOM)
LayerThickness (m)
0.91
0.46
0.23
0.23
0.46
0.61
0.61
0.91
1.52
1.52
1.52
Shaft Seal Component
Clay Column
Lower Salado CompactedClay Column
Lower Salado CompactedClay Column
Shaft Station Monolith
Shaft Station Monolith
Shaft Station Monolith
Shaft Station Monolith
Shaft Station Monolith
Shaft Station Monolith
Shaft Station Monolith
Shaft Station Monolith
Shaft Station Monolith
Host Formation Unit
Salado Halite
Salado Halite
Combined MB138 andAnhydrite A/B
Combined MB138 andAnhydrite A/B
Salado Halite"
Salado Halite
Salado Halite
Salado Halite
Salado Halite
Salado Halite
Salado Halite
Table C-21. Compacted Salt Column Performance Model Radial Gridding
ColumnNumber
1
2
34
5
6
7
8
910
Radius to Outer Grid ColumnBoundary (m)
1.22
1.95
2.68
3.05
3.23
3.41
3.78
4.51
5.24
6.46
Model Component
Shaft
Shaft
Shaft
Shaft
DRZ
DRZ
Host Formation
Host Formation
Host Formation
Host Formation
C-60

Table C-21. Compacted Salt Column Performance Model Radial Gridding
ColumnNumber
11
12
13
1415
16
17
18
19
20
21
22
23
2425
Radius to Outer Grid ColumnBoundary (m)
7.68
8.90
10.12
11.95
14.69
18.65
24.75
33.89
47.61
68.95
99.43
145.15
190.87
236.59
282.31
Model Component
Host Formation
Host Formation
Host Formation
Host Formation
Host Formation
Host Formation
Host Formation
Host Formation
Host Formation
Host Formation
Host Formation
Host Formation
Host Formation
Host Formation
Host Formation
Two exceptions to the no-flow top and bottom model boundaries were considered. First,the possibility of brine flow down the shaft from the Rustler Formation was considered byincreasing the initial crushed-salt brine saturation as discussed above. Second, gas flow up fromthe repository was simulated by applying a time varying pressure boundary condition at the baseof the shaft. The waste forms in the repository may generate gas (WIPP PA, 1992-1993).Model 2 does not explicitly model the generation of gas in the repository. Rather, it indirectlyincorporates repository gas generation by applying a time-varying gas pressure boundarycondition at the base of the shaft. Two pressure specifications were considered in the gas flowanalysis. In one, the pressure increased to 7 MPa in 100 years and then remained constant for theremaining simulation time (200 years total). In the second, the pressure at the base of the shaftincreased steadily for the 200-year simulation period to 14 MPa. These two specifications arerepresentative of results.obtained for pressure at the base of the shaft by WIPP PA in the NoMigration Variance Petition (NMVP) simulations. The time-varying pressure boundaryconditions were chosen to correspond to the quickest pressure increase (i.e., highest gasgeneration rates) simulated in the NMVP simulations. Figure C-12 shows the pressure conditionapplied at the base of the shaft in the model runs for these two specifications. Because oflimitations in implementing the time-varying boundary condition at the base of the shaft inTOUGH28W, the pressure was "stepped up" to final values in a series of consecutive restartedsimulations.
C-61

OSQ.
COto9>
enoQ.
8.
14 -
12 -
10 -
8 -
6 -
•
4 -
• Specifi
:
cation 2 >
Specification 1(Base Case)
Pressure Steps used inContinuous DRZ Simulations
•
25 50 75 100 125Time (yrs)
150 175 200
Figure C-12. Two specifications of pressure at the base of the shaft.
: For most of the simulations presented here, the pressure was increased in 1.75-MPa stepsat 25-year intervals. For continuous DRZ simulations, however, the 1.75 MPa repositorypressure at time zero was considered an unrealistic boundary condition to apply to the pre-healedDRZ around the lower concrete component seal. For these cases, the boundary pressure wasincreased in 1-year steps of 0.07 MPa each. The lighter line between 0 and 25 years in FigureC-12 represents the repository pressure boundary condition used for continuous DRZsimulations.
C-62
C5.2.4 Model Parameters
Model parameters for the compacted salt column performance model include materialproperties for shaft seal components, fluid properties, two-phase flow properties, and materialproperties for Salado halite and anhydrite marker beds. The properties used in this model arediscussed in detail in Section C3. Also discussed in Section C3 are the time-varyingpermeabilities of the DRZ zones surrounding the shaft.
An additional process that must be modeled for the compacted salt column performancemodel was the consolidation behavior of the crushed salt column. Curves showing salt columnfractional density as a function of time at three different depths (430,515, and 600 m) and threedifferent pore pressures (0,2, and 4 MPa) are presented in Appendices A and D. The data arereplotted in Figure C-13 in terms of the average rate of change in fractional density (on the rightaxis) versus pressure for the three depths. A relationship has also been developed betweencrushed salt fractional density and permeability. To account for uncertainty in the permeabilityversus fractional density relationship, a best fit line through the data, as well as lines through95th and 5th percentiles, were developed. Using the best fit line between fractional density andpermeability, the left axis of Figure C-13 gives the average rate of change for the log ofpermeability as a function of pressure at the three depths. As shown in the figure, several pointswere extrapolated from the data to provide model data points up to 10 MPa. The consolidationrate at these higher pressures is not significant to model performance, but the data were requiredbecause it was anticipated-that salt column pressures could reach these values during late modeltimes.
The "consolidation surface" shown in Figure C-14 was developed by interpolatingbetween the data points shown in Figure C-13. This surface provides the relationship betweenthe rate of change in permeability and depth and pressure within the compacted salt column. Intabular form, this surface is required as input to the compacted salt column performance model.The general shape of this surface shows that the greatest magnitude of the rate of permeabilitychange (i.e., the highest consolidation rate) occurs at the greatest depth (lowest elevation) andlowest pore pressure.
C5.3 Performance Model Results
Six simulations were run with the compacted salt column performance model, a base-caseand five additional runs, to examine the sensitivity of the model to variations in repositorypressure, the crushed-salt permeability-fractional density relationship, flow down the shaft fromthe Rustler Formation, and continuous DRZ with and without waterstops.
Table C-22 summarizes the six simulations and provides information about thecombination of parameters used for each. The "Repository Pressure" column in the table refersthe pressure specifications defined in Figure C-12. The "Permeability/Fractional DensityPredictor" column in the table refers to either the best fit or the 95th percentile lines through thepermeability versus fractional density data. The primary difference between these twopermeability specifications is the starting and ending points for salt column permeability. For thebest fit line, crushed salt permeability starts at 2.5 *10"15 m2 (90% fractional density) andachieves a minimum possible value of 6.3x10'21 m2 (100% fractional density). For the "95%"predictor line, crushed salt permeability starts at 7.9x10"13 m2 and achieves a minimum possible
C-63

-0.08
-0.06 -
J3CO
£30)O)atO"5
Ior
- - - Depth = 430 m
Depth = 515 m
Depth = 600 m
-0.04 -
-0.02
0.00
Extrapolated Points
o.o 5.0Pressure (MPa)
10.0
IDCM
OOO
OO©
ioopo
omoo
gopo
oooopo
'toQ)
Q"TO
o
t3Su.
0)
o"5
Figure C-13. Rate of change in log permeability (fractional density) with pressure and depth.
value of 2.0x10"18 m2. The "Rustler Flow" column in the table indicates the amount by whichthe salt column initial liquid saturation was increased to account for brine flow down the shaftfrom the Rustler Formation, predicted by the full-shaft saturated flow model for the case of acontinuous DRZ with arid without watefstops.
Identical initial pressure conditions were used for each simulation and were established intwo steps. First, all grid elements were assigned an initial pressure based on hydrostatic pressurereferenced to 12.5 MPa at the elevation of MB 139. Next, a conditioning simulation was run inwhich the shaft was considered to be open to atmospheric pressure for 50 years. Grid-elementpressures were captured at the end of this 50-year simulation and used to initialize each of theperformance calculations.
C-64

Figure C-14. Reconsolidation surface for the best-fit permeability/fractional density predictor.
Simulation results are presented here in terms of pressure in the compacted salt column,gas flow past the lower concrete component into the compacted salt column, and predictedpermeability of the compacted salt column. For the base case of 7 MPa at the repository horizon,Figure C-15 shows calculated pressure in the compacted salt column versus time after sealemplacement at three locations near the top, middle, and bottom of the salt column. The figureshows pressure increased most rapidly at the bottom of the column. Pressure began to increaserapidly at the bottom of the salt column approximately 30 years after seal emplacement. The factthat the pressure in Figure C-15 increased to levels greater than the maximum pressure at the
C-65

Table C-22. Compacted Salt Column Performance Model Simulations
Run
1(Base Case)
2
3
4
5
6
Repository Pressure*
7 MPa in 100 Years
7 MPa in 100 Years
14 MPa in 200 Years
14 MPa in 200 Years
7 MPa in 100 Years(Linear First 25 Years)
7 MPa in 100 Years(Linear First 25 Years)
Permeability/Fractional
Density Predictor
Best Fit
95%
Best Fit
95%
Best Fit
Best Fit
RustlerFlow(m3)
0.00
0.00
0.00
0.00
2.70
17.20
ContinuousDRZ
No
No
No
No
Yes
Yes
WaterStops
Yes
Yes
Yes
Yes
Yes
No
* Source: NMVP calculations.
base of the shaft (7 MPa) indicates that the far-field pressure boundary was the primary sourcedriving the pressure increase. Figure C-16 shows calculated permeability profiles in thecompacted salt column at several points in time following seal emplacement. This figure showsthat permeability has decreased to a minimum value of 6.3x10"21 m2 over a portion of the base ofthe salt column in 100 years and shows little further reduction of permeability over the periodfrom 100 to 200 years. The figure generally shows lower permeability near the bottom of the saltcolumn where the consolidation rate is higher, and relatively higher permeability near the top ofthe salt column where the consolidation rate is lower. After 100 years, pressure increasesthroughout the column have almost completely stopped the consolidation process.
A small region, from elevation 439 m (1440 ft) to about elevation 457 m (1500 ft), at thebase of the salt column showed less reconsolidation at times ranging from 50 to 200 years thanthe region immediately above it due to the pressure influence of the repository. Figure C-16 alsoshows that for times greater than about 50 years, consolidation in the upper half of the saltcolumn was significantly slowed because of repressurization through the relatively highpermeability Union Anhydrite (l.OxlO"18 m2).
The results of Run 2, in terms of pressure and permeability in the compacted salt column,are shown in Figures C-.17 and C-18, respectively. Parameter specification for this run wasidentical to Run 1 except that the 95% p~ermeability-fractional density correlation was used (i.e.,the assumed salt column permeability was higher for a given fractional density). These resultsshow that pressurization in the salt column occured at later times than for the base case. Thepermeability profiles in Figure C-18 show that, in contrast to the base case, very little crushedsalt reconsolidation occured hi the lower half of the salt column after about 75 years. Thisoutcome occurs because the pressure increased throughout the vertical extent of the salt column
C-66
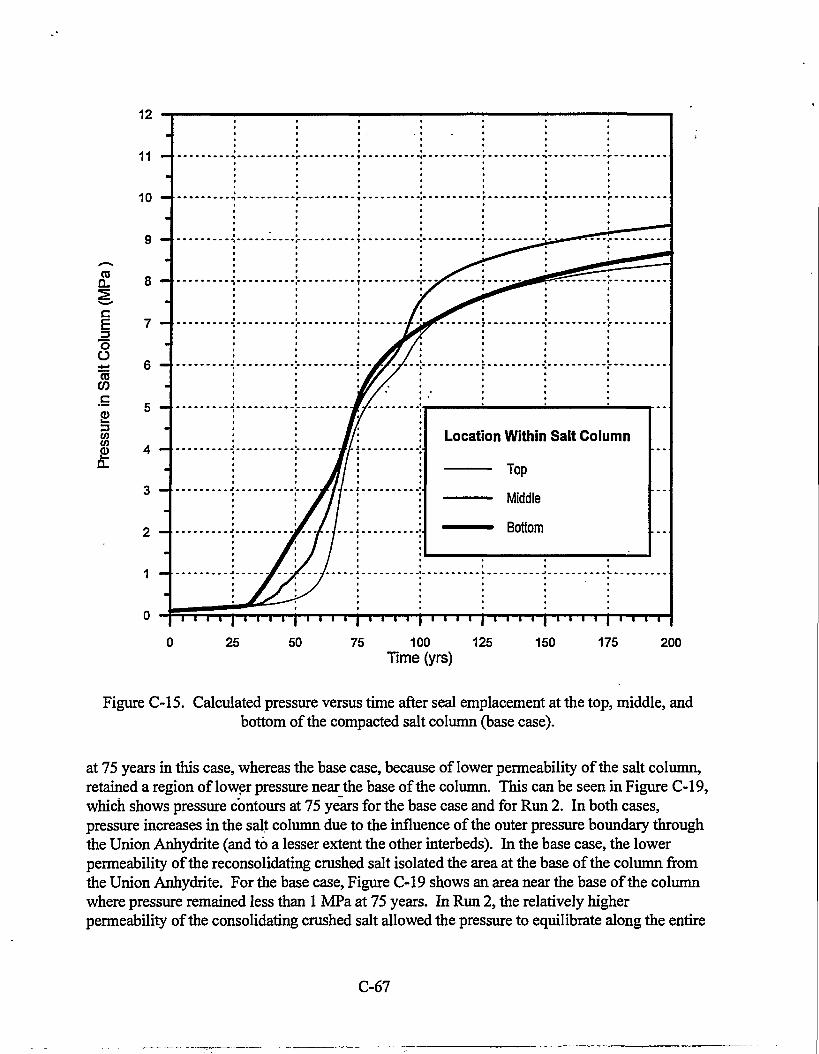
12
11 -
10 -
9 -
[MP
a
13OO
~caCOc
3COCO
g>a.
8 -
7 -
«6 -
-
5 -m
4 -
3 -
2 -
1 -
Location Within Salt Column
Top
Middle
Bottom
25 50 75 100Time (yrs)
125 150 175 200
Figure C-15. Calculated pressure versus time after seal emplacement at the top, middle, andbottom of the compacted salt column (base case).
at 75 years in this case, whereas the base case, because of lower permeability of the salt column,retained a region of lower pressure near the base of the column. This can be seen in Figure C-19,which shows pressure contours at 75 years for the base case and for Run 2. In both cases,pressure increases in the salt column due to the influence of the outer pressure boundary throughthe Union Anhydrite (and to a lesser extent the other interbeds). In the base case, the lowerpermeability of the reconsolidating crushed salt isolated the area at the base of the column fromthe Union Anhydrite. For the base case, Figure C-19 shows an area near the base of the columnwhere pressure remained less than 1 MPa at 75 years. In Run 2, the relatively higherpermeability of the consolidating crushed salt allowed the pressure to equilibrate along the entire
C-67
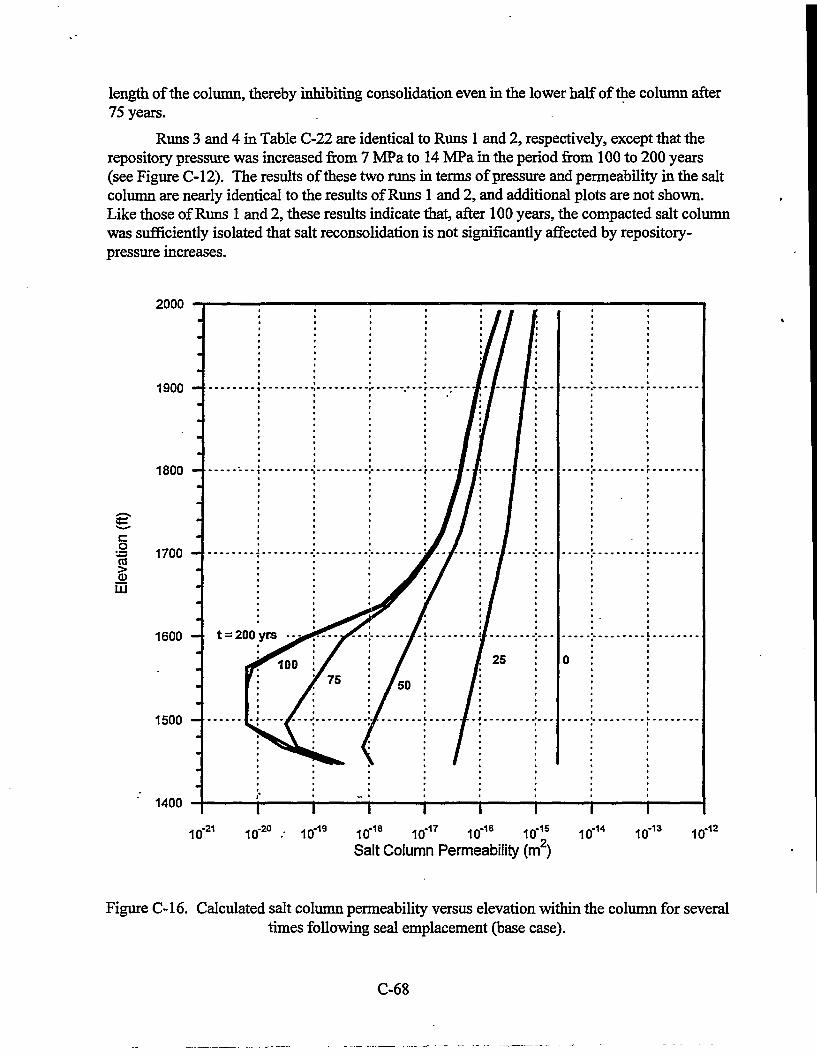
length of the column, thereby inhibiting consolidation even in the lower half of the column after75 years.
Runs 3 and 4 in Table C-22 are identical to Runs 1 and 2, respectively, except that therepository pressure was increased from 7 MPa to 14 MPa in the period from 100 to 200 years(see Figure C-12). The results of these two runs in terms of pressure and permeability in the saltcolumn are nearly identical to the results of Runs 1 and 2, and additional plots are not shown.Like those of Runs 1 and 2, these results indicate that, after 100 years, the compacted salt columnwas sufficiently isolated that salt reconsolidation is not significantly affected by repository-pressure increases.
2000
1900 -
1800 -
oro
LU
1700 -
1600 -
1500 -
1400T I T T i r i
10-21 I f f2 0 -• 10"19 10"18 10-17 I f f 1 6 10-15 10"14 10"13 10-12
Salt Column Permeability (m )
Figure C-16. Calculated salt column permeability versus elevation within the column for severaltimes following seal emplacement (base case).
C-68

12
11 -
10 -
9 -
IcE3OO•*_*COWc'£3(0
Pre
s
8 -
7 -
•6 -
-
5 -
m
4 -
3 -
2 -
1 -
Location Within Salt Column
Top
25 50 75 100Time (yrs)
125 150 175 200
Figure C-17. Calculated pressure versus time after seal emplacement at the top, middle, andbottom of the compacted salt column (Run 2).
Two additional runs (Runs 5 and 6 in Table C-22) were made in which brine flow downthe shaft from the Rustler Formation calculated by the full-shaft saturated flow model wasincluded in the initial brine saturation of the compacted salt column. For these two simulations,the permeability of the DRZ adjacent to the shaft at the level of MB134, MB135, MB136, andMB137 was increased to 2.9*10"16 m2, thus creating a continuous (prior to healing) DRZ fromthe gas source at the repository level to the salt column. In the previous simulations, these DRZunits were assumed to be mostly unfractured, with permeability more like the undisturbed hostanhydrite of the associated marker beds (l.OxlO"19 m2).
C-69

2000
1900 -
1800 -
c•B 170055Qi
LLJ
1600 -
1500 -
1400
10"'•21 10,-20 10',-19 10,-18 10,-17 10',-16 10'-15 10,-14 10,-13 10',-12
Salt Column Permeability (m )
Figure C-18. Calculated salt column permeability versus elevation within the column for severaltimes following seal emplacement (Run 2).
-" In Run 5 the asphalt waterstops were assumed to be in place as in the previous runs;however, in Run 6 the asphalt waterstops were excluded. The initial brine saturation of the saltcolumn was increased by 2.7 m3 and 17.2 m3 for the two runs, respectively, to account forRustler flow predicted by the full-shaft saturated flow model for these two cases. For thecontinuous DRZ assumption, with the increased communication between the base of the shaftand the compacted salt column prior to DRZ healing around the rigid concrete components, itwas thought that stepping the repository pressure up to 1.75 MPa at time zero would provideunrealistic results. Therefore, for these two runs, the repository boundary pressure was
C-70

2100-
2000-
180O
1S0O-
1700-
1800-
III
1600-
1400-
1300-
1200-
Base Case Pressure Contours
MB134
2100-
2000-
1900-
1800-
1700-
eo
1uj
1600-
1600-
1400-
1300-
120O
26 60 76 100 126 160 176 200
Radial Distance from Center of Shaft (Ft)
Run 2 Pressure Contours (
226 250
MB134
26 60 76 100 126 150 175 200 225 260
Radial Distance from Center of Shaft (FL)
Figure C-19. Pressure contours at 75 years for base case and for 95% permeability/fractionaldensity predictor (Run 2).
C-71

increased in 0.07-MPa increments at one-year time intervals (see Figure C-12). This rate ofpressure increase is the same for all simulations; however, it is applied in smaller timeincrements in Runs 5 and 6.
The pressure and permeability results of Run 5 are nearly identical to the results of thebase case (Run 1) shown in Figures C-15 and C-16, indicating no sensitivity to the inclusion of aDRZ adjacent to MB 134 through MB 13 7. The results of Run 6 do, however, show somesensitivity to the absence of the asphalt waterstops. Figure C-20 shows pressure versus time atthe top, middle, and bottom of the salt column for the base case and for Run 6. This figureshows that pressure rose faster than for the base case at early times before the DRZ had fullyhealed around the lower concrete seal at 25 years. As a result of the faster pressure increase inthe salt column, the calculated penneability profiles shown in Figure C-21 for this run show lesscrushed-salt reconsolidation at 100 years than in the base case shown in Figure C-16. FigureC-21 shows that, without concrete-asphalt waterstops, penneability at the bottom of the saltcolumn for the case does not reach the minimum value of 6.3* 10*21 m2.
Figure C-22 shows cumulative gas flow up the shaft from the repository past the lowerconcrete seal for each run. The right axis in thefiguregives cumulative mass of gas flow in kgand the left axis translates this mass to a cumulative volume of flow in m3 at standard conditions(20°C and atmospheric pressure). This figure shows that cumulative gas flow up from therepository was less than 100 m3 for all runs, except for Run 6 in which the concrete-asphaltwaterstops were omitted. Run 6 predicted that approximately 600 m3 of gas reached the saltcolumn in the first 25 years.
The lower Salado compacted clay column provides an effective barrier in shaft cross-section because of its low penneability and its relatively high brine saturation, thus forcing mostof the gas to flow through the DRZ. The compacted clay column was initialized at an initialbrine saturation of nearly 80%. For all simulations performed, it resaturated to near 100% at topand bottom over the 200-year simulation time.
C6.0 FLOW UP FROM THE SALADO (MODEL 3)
C6.1 Statement of Problem
This calculation examined the potential for brine flow and quantity of brine flow that maybe expected to migrate upward through the shaft seal system in response to the ambient pressureconditions that will be present several hundred years after closure. Pressures measured in theSalado at the repository horizon are significantly over-pressured with respect to hydrostaticconditions and to the Rustler (see Table C-2). Because the Salado is very impermeable, anynatural component of vertical flow fromlhe Salado upward must be very low. However, withthe connection of the Saladq and the Rustler Formations through the shaft seal system, thepotential for upward flow exists. The performance measure (result) for this model is the steady-state brine flow rate. The performance measure will be provided for the Rustler/Salado contact,the top of the compacted salt column, and the top of combined Unit 8 (composed of MB131,Zone J, MB132, and MB133).
C-72

(0D-
c
•5OCO
V)c
II
11 -
•in _
Q «y ™
•
8 -
7 -
•
6 -
4 -•
3 -
2 -
-
1 -
Location Within Salt Column
Top
« ^ ™ ^ ^ Bottom
MM'
\ //u
wJJf:Jf:
W. . . . . . Jz* J/ / »
M •'—•JrUMfit7!!»' / /
/ /f~-j—~
y
t
*
^ - - *
. . . . . . . . . J . . . . . . . . . . . . . . . . . . .
Base Case Results
Results With ContinuousDRZ and No Waterstops
t * » *
25 50 75 100 125
Time (yrs)150 175 200
Figure C-20. Comparison of calculated pressure results for base case and continuous DRZ withno waterstops (Run 6).
C6.2 Performance Model Description
C6.2.1 Conceptual Model and Assumptions
The model grid and simulation code (SWIFT II) used in this model are identical to thoseused in Model 1. The primary difference in the conceptual model between Model 1 and Model 3is the time frame over which this calculation is considered relevant. Model 1 predicted brineflow down the shaft. The Model 1 calculation is considered an early-time calculation before far-field pressures gradients reestablish in the vicinity of the shaft. The Model 1 calculation runsfrom shaft closure forward to 400 years post-closure. Model 3 assumed that equilibrium pressuregradients have reestablished in the vicinity of the shaft and DRZ healing has taken place withinthe Salado halite.
C-73
- - — i—— '

c•B
1900 -
1800 -
•
•
1700 -
•
1600 -
1500 -
t = 20C
(s100y
i^Lns /
/ :
1
I1/50
/
/
i /' /
1 25
1
0
10"•21 10',-20 10-1 10',-18 10',-17 10,-16 10,-15 10"1 10",-13 10'.-12
Salt Column Permeability (m )
Figure C-21. Calculated salt column permeability versus elevation within the column for severaltimes following seal emplacement (Run 6: Rustler flow included, continuous DRZ, no
waterstops).
In Section C2, the primary assumptions common to all numerical calculations in thisappendix are listed. In addition to those listed in Section C2, the following list summarizes theprimary assumptions specific to Model _3:
• The calculation assumed brine-saturated flow conditions.
• The model is initialized at nonhydrostatic conditions based on undisturbed heads in theRustler Formation and the maximum estimated formation pressure measured in theSalado Formation (see Table C-2).
• Seal system and DRZ permeabilities are representative of times greater than or equal to400 years after closure.
C-74

1000 -
Eo42
ILLWCOO100a>
|
Run 6
Runs 1 & 3
Run 5
Runs 2 & 4
7 MPa Repository Pressure
14 MPa Repository Pressure
100
- 10
Q.
O
(0CO
O
I3
o
^ l I I I I • I • I I • I^J I • I ( • I I I I • • I • I t I • • • I 1-1
0 20 40 60 80 100 120 140 160 180 200
Time (yrs)
Figure C-22. Cumulative gas flow from the repository to the compacted salt column.
C6.2.2 Numerical Method
The numerical code used in Model 3 is SWIFT n. This code was also used in Model 1;see Section C4.2.2 for a complete description.
C6.2.3 Model Geometry and Boundary Conditions
The model geometry and grid are the same as that used in Model 1; see Section C4.2.3for a complete description. However, the initial conditions and boundary conditions differ fromthose of Model 1. For Model 3, the shaft is completely sealed, and the DRZ and the compit&tedsalt column permeabilities are no longer transient and have achieved their lowest values. Thispermeability field was held constant in Model 3.
C-75

The lateral boundary and initial grid-block pressures were initialized at nonhydrostaticconditions consistent with the undisturbed heads reported for the Magenta, the Culebra, theRustler/Salado contact, and MB139 (see Table C-2). No-flow boundary conditions wereimposed at the top and bottom of the model. Infinite aquifer boundary conditions were set at theouter edge of the modeled region. The model components for the simulation are concrete,asphalt, compacted clay, crushed salt, shaft liner, DRZ, and undisturbed formation.
C6.2.4 Model Parameters
Best case model parameters as specified for Model 1 for the host-rock and seal systemhave been used. Table C-23 summarizes the three simulations performed in Model 3,highlighting the principal differences among them. This suite of runs is similar to the runssimulated in Model 1.
The base-case simulation (Run 1) assumed that the anhydrites in the Rustler Formation,and anhydrites greater than 3 m thick in the Salado Formation, have no DRZ (based onmechanical modeling results presented in Appendix D). This condition results in a discontinuousDRZ, which is discontinuous initially and remains so throughout the simulations. The secondsimulation (Run 2) assumes that Rustler members and Salado anhydrites are damaged, andallows healing to occur only in the Salado halite. Runs 1 and 2 include waterstops. The thirdsimulation (Run 3) is a sensitivity simulation to examine the impact of the asphalt waterstops: Itis the same as Run 2 except that the concrete-asphalt waterstops were not incorporated into themodel. Figure C-23 depicts the permeabilities used in these three simulations.
Table C-23. Performance Model 3 Simulations
Run
1 (Base-Case)
2
3
Rustler and Anhydrite DRZ
No
Yes
Yes
Waterstops
Yes
Yes
No
C6.3 Performance Model Results
Results are presented in terms of brine flow rates (m3/s). Because the vertical gradient isdirected upward, the flow rates reported are also upward. Table C-24 provides the steady-stateupward flow rates measured at the Rustler/Salado contact, the top of the compacted salt column,and the top of combined Unit 8 of the model. The difference between the results of Runs 1 and 2derives from the increased DRZ permeabilities assumed for the anhydrite units. The lack of adifference between the results of Runs 2 and 3 denotes the negligible effect of the waterstops onlong-term saturated flow. -.
The waterstops were included in the seal system design as an immediate seal for theDRZ. Therefore, then: inclusion in Runs 1 and 2 was not really appropriate. However, based onthe results from Run 3, it can be concluded that their presence in Runs 1 and 2 did" not affect thepredicted performance measure of upward steady-state flow rate for these simulations.
C-76

Run 1 (Base-Case) Run 2 Run 3
o
Logk(m2)
--12.5
--13.0
--13.5
--14.0
--14.5
--15.0
•-15.5
•-16.0
--16.5
•-17.0
--17.5
--18.0
--18.5
--19.0
•-19.5
--20.0
--20.5
--21.0
0 2 4 6 8 10 12 14 16 18
Column
0 2 4 6 8 10 12 14 16 18
Column
0 2 4 6 8 10 12 14 16 18
Column
Figure C-23. Permeability fields for Runs 1 through 3 (t > 400 years).

Table C-24. Comparison of Flow Rates Up the Shaft/DRZ from Simulations that Incorporate theMeasured Pressure Conditions
Run
1 (base-case)
2
3
Combined Unit 8 Top of Compacted Rustler/SaladoSalt Column Contact
Flow Rate up the Shaft and DRZ (m3/yr)
4.76x10'5
4.76x10"5
4.76x10"5
1.68X10"4
1.71X10"4
U l x l O " 4
8.27x1 (T4
9.68 xKT4
9.68X10"4
C7. INTRA-RUSTLER FLOW (MODEL 4)
C7.1 Statement of Problem
The shaft seal system is designed to limit migration of fluids within the sealed shaft. Thenatural heads within the Rustler Formation are nonhydrostatic indicating the potential for verticalflow (Beauheim, 1989). This calculation examined the potential for, and quantity of brine flow,which, after closure, could be expected to migrate between the Magenta and the Culebra, the twoprimary water-bearing members of the Rustler Formation.
C7.2 Performance Model Description
The previous models have used sophisticated numerical flow models. This performancemodel employed simple analytical relationships. The calculation assumptions yielded a relativelysimple conceptual model and estimates of intra-Rustler flow rates. The conceptual model,relevant assumptions, and the analysis approach are discussed below.
C7.2.1 Conceptual Model and Assumptions
Non-hydrostatic conditions exist within the Rustler Formation based on estimatedundisturbed or measured disturbed head differences between the various members of the RustlerFormation (see Table C-l). Relatively low undisturbed permeabilities of the mudstone andanhydrite units separating the Culebra and the Magenta naturally limit crossflow. However, theconstruction and subsequent closure of the shaft provide a potential permeable vertical conduitconnecting water bearing units. In this calculation, the hydraulic conductance of the shaft sealsystem was used to estimate flow rates between the Magenta and Culebra under variousassumptions. Figure C-24 schematically shows the conceptual model for calculating intra-Rustler flow rates. From Figure C-24 one can see that flow was considered through the seal andthrough the DRZ consistent with Models 1 through 3. The primary assumptions for this analysisare listed below:
• Saturated flow was assumed under isothermal and constant fluid-density conditions.
• Flow-rates were calculated using the steady-state version of Darcy's Law for saturatedflow.
C-78

, DRZ
Hydraulic Conductance of the Seal
IS|%i Conbined Hydraulic Conductance
M of the Seal Plus DRZ
Figure C-24. Intra-Rustler flow conceptual model.
C-79
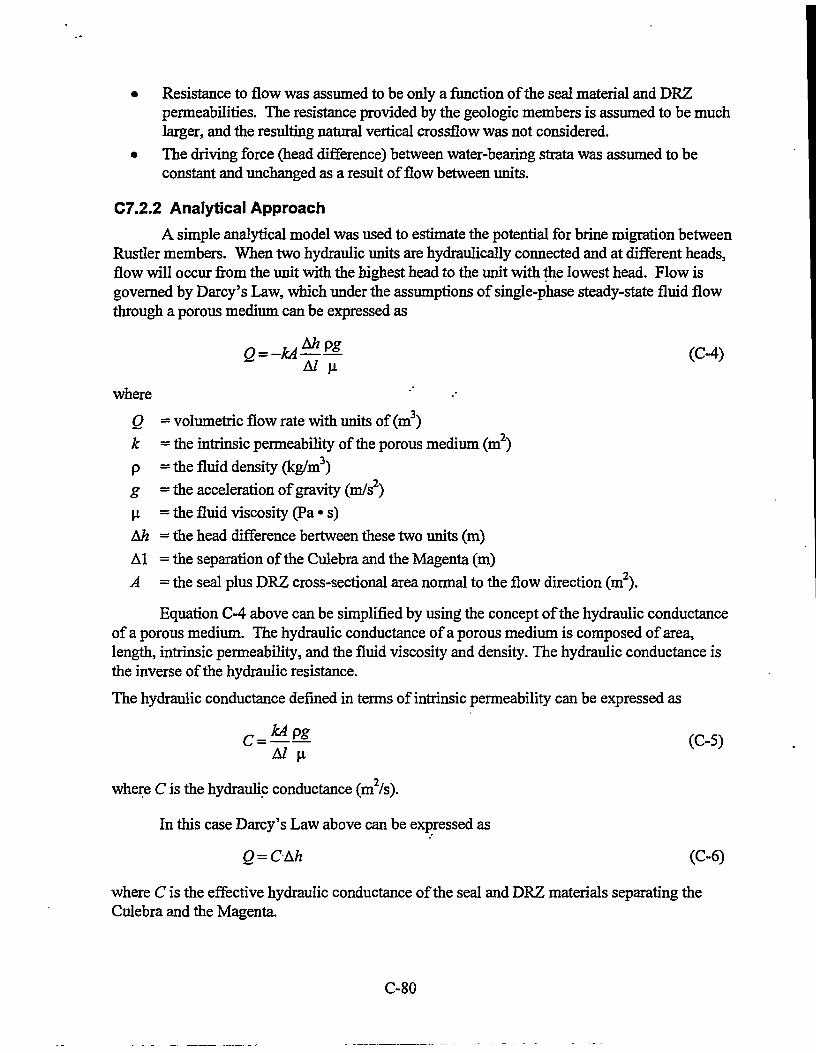
• Resistance to flow was assumed to be only a function of the seal material and DRZpermeabilities. The resistance provided by the geologic members is assumed to be muchlarger, and the resulting natural vertical crossflow was not considered.
• The driving force (head difference) between water-bearing strata was assumed to beconstant and unchanged as a result of flow between units.
C7.2.2 Analytical Approach
A simple analytical model was used to estimate the potential for brine migration betweenRustler members. When two hydraulic units are hydraulically connected and at different heads,flow will occur from the unit with the highest head to the unit with the lowest head. Flow isgoverned by Darcy's Law, which under the assumptions of single-phase steady-state fluid flowthrough a porous medium can be expressed as
2 = - f c ^ (C-4)Al p.
where
Q = volumetric flow rate with units of (m3)k = the intrinsic permeability of the porous medium (m2)p = the fluid density (kg/m3)g = the acceleration of gravity (m/s2)u = the fluid viscosity (Pa • s)Ah = the head difference bertween these two units (m)Al = the separation of the Culebra and the Magenta (m)A = the seal plus DRZ cross-sectional area normal to the flow direction (m2).
Equation C-4 above can be simplified by using the concept of the hydraulic conductanceof a porous medium. The hydraulic conductance of a porous medium is composed of area,length, intrinsic permeability, and the fluid viscosity and density. The hydraulic conductance isthe inverse of the hydraulic resistance.
The hydraulic conductance defined in terms of intrinsic permeability can be expressed as
C = Mfi£ (C5)
Al \i
where C is the hydraulic conductance (m2/s).
In this case Darcy's Law above can be expressed asQ = CAh (C-6)
where C is the effective hydraulic conductance of the seal and DRZ materials separating theCulebra and the Magenta.
C-80

Figure C-24 shows the conceptual model for intra-Rustler flow. An effective hydraulicconductance of the seal and DRZ system between the Magenta and the Culebra members can becalculated by analogy to electrical circuit theory. The effective hydraulic conductance iscomposed of the properties of the DRZ and the seal combined. The seal and DRZ act in parallel,and therefore the hydraulic conductance of these two regions can be directly added to get theircombined conductance:
^ A k A pg f C-7)CA/ JJ.
Because the DRZ permeability is a function of rock type, the effective seal plus DRZ hydraulicconductance must also be combined vertically in series between the Magenta and the Culebra.Using the hydraulic conductance of the seal system and the DRZ, a volumetric flow rate can beestimated from the potential head difference.
To put the calculated volumetric flow rates into perspective, the flow rate can be used tocalculate the width of the hydraulic disturbance which is created in the water-bearing unitreceiving the interflow. Figure C-25 depicts the case of a point injection into a linear flow field.The injected fluid displaces a certain volume of the receiving aquifer fluid and mis volume canbe expressed as the maximum plume width (measured in plan view, Figure C-25). Within thismaximum plume width, the fluid in the receiving aquifer is composed entirely of injected fluid.Outside of this width, the fluid is composed of the resident aquifer fluid. The equationdescribing the half plume width is:
& (C-8)2uob
where
Qw = the intra-Rustler fluid flow rateu0 = the Darcy velocity of the stratigraphic unit being injected intob = the thickness of the stratigraphic unit being injected into.
C7.2.3 Mode! Parameters
Model parameters having to do with the seal system and the Rustler rocks have beenpreviously defined (Section C3). Using the base case seal and DRZ conceptualization andparameters, the flow rate between the Magenta and the Culebra was calculated considering arange of head differences. The calculated flow rates are used to estimate plume half widths inboth the Culebra or the, Magenta. The flow rate between the Magenta and the Culebra was alsocalculated considering a continuous DRZ of variable normalized radius and considering aconstant head difference of similar magnitude to that which is currently estimated forundisturbed conditions (see Table C-2).
C-81

Region Gradient
It i i i t
Stagnation Point
Qw
Streamlines ofGroundwater Flow
Water Divide
Maximum Plume WidthOw
2w =UoAz
Legend:
Qw = Rate of Fluid ReleaseAz = Formation Thicknessu0 = Darcy Velocity
Figure C-25. Effect of an injection well on a unidirectional flow field.
C-82

The only parameters unique to Model 4 are the Darcy velocities in the Magenta and theCulebra. These velocities were calculated assuming steady-state Darcy flow and using theminimum regional hydraulic gradient for the Culebra and a regional hydraulic gradient for theMagenta reported by Lambert (1996). The Culebra Darcy velocity was chosen to predict thelargest plume half width for a given flow rate (see Equation C-8 above). Table C-25 lists thegradients and Darcy velocities calculated from them using the Culebra and Magenta hydraulicconductivities reported in Section C3.
Table C-25. Regional Darcy Velocities for Culebra and Magenta Membersof the Rustler Formation
Rustler Member
Magenta
Culebra
Hydraulic Gradient(1)
0.003788
0.001894
Darcy Velocity (m/s)
3.788xlO'n
2.652* 10"10
(1) After Lambert, 1996.
C7.3 Performance Model Results
Table C-2 shows that the approximate undisturbed head difference between the Magentaand the Culebra is 33.2 m (109 ft). Presently, this head difference would direct flow from theMagenta to the Culebra. However, the true head difference is uncertain, especially temporally.Using the base case conceptualization for the DRZ, the flow-rate between the Magenta and theCulebra was calculated for head differences ranging from 3.1 to 121.9 m (10 to 400 ft). FigureC-26 plots the resulting flow rates, which range from 0.002 to 0.096 m3/yr. Figure C-27 plotsthe resulting plume-half width assuming flow was directed into either the Magenta or theCulebra. As can be seen in Figure C-27, the plume half width did not extend past one shaftradius for head differences less than approximately 76 m (250 ft).
The base-case conceptualization assumed that no anhydrite DRZ exists in the Rustler.The next calculation examined the sensitivity of interflow to a continuous DRZ (in bothanhydrite and mudstone) for the estimated undisturbed head difference between the Magenta andCulebra.
Figure C-28 plots the flow rate between the Magenta and the Culebra assuming a headdifference of 33.5 m (110 ft) and assuming the DRZ is continuous and has a normalized radius ofextent varying from 1.0 (no DRZ) to 3.0 (three shaft radii). Flow rates range from 0.003 to 2.93m3/yr. Figure C-29 plots the calculated plume half-width for these flow rates assuming flow isdirected into either the Magenta or the Culebra. For a continuous DRZ normalized radius of lessthan 1.5, the hydraulic disturbance caused by Culebra-Magenta interflow is minimal. Becausethe flow-rate and plume half-width are linearly correlated to the head difference, results fromFigures C-28 and C-29 can be easily scaled to consider any head difference of interest.
C-83

0.100
Base Case DRZ Conceptualization
0.001
50 75Head Difference (m)
Figure C-26. Sensitivity of flow rate between Culebra and Magenta to head difference(base case).
C-84

1E+1
1E+0 —
73
TOX.
Q.
1E-1
1E-2
n i ! i • rBase-Case DRZ Conceptualization
Shall Radius (3.048 m)
Legend
Culebra Plume
| Magenta Plume
— - Shaft Radius (3.048 m)
I25
I50
Head
i
Difference
175
(m)
100 125
Figure C-27. Sensitivity of flow-field disturbance to head difference (base case).
C-85

10.000
Assumes head difference of 33.5 m (110 ft)
0.001
1.0
DRZ Normalized Radius
Figure C-28. Sensitivity of flow rate between Culebra and Magenta to DRZ radius(continuous DRZ).
C-86

1E+3 - =
1E+2 —
•a
mX
a>
a.
1E+1 - r
1E+0 —
1E-1
I ' I ' IAssumes head difference of 33.5 m (110 ft)
1E-2
Legend
Shaft Radius (3.048 m)
Culebra Plume
Magenta Plume
I I - I I I I 11.0 1.5 2.0 2.5 3.0
DRZ Normalized Radius
Figure C-29. Sensitivity of flow-field disturbance to DRZ radius (continuous DRZ).
C-87

C8. REFERENCESAvis, J.D., and G.J. Saulnier, Jr. 1990. Analysis of the Fluid-Pressure Responses of the Rustler
Formation at H-16 to the Construction of the Air-Intake Shaft at the Waste Isolation PilotPlant (WIPP) Site. SAND89-7067. Albuquerque, NM: Sandia National Laboratories.(Copy on file in the Sandia WIPP Central Files, Sandia National Laboratories, Albuquerque,NM [SWCF] as WPO24168.)
Aziz, K., and A. Settari. 1979. Petroleum Reservoir Simulation. New York, NY: ElsevierApplied Science Publishers.
Beauheim, R.L. 1987. Interpretations of Single-Well Hydraulic Tests Conducted at and Nearthe Waste Isolation Pilot Plant (WIPP) Site, 1983-1987. SAND87-0039. Albuquerque,NM: Sandia National Laboratories. (Copy on file in the SWCF as WPO27679.)
Beauheim, R.L. 1989. Interpretation of H-l Ib4 Hydraulic Tests and the H-l 1 MultipadPumping Test of the Culebra Dolomite at the Waste Isolation Pilot Plant (WIPP) Site.SAND89-0536. Albuquerque, NM: Sandia National Laboratories. (Copy on file in theSWCFasWPC-24154.)
Beauheim, R.L., G.J. Saulnier, Jr., and J.D. Avis. 1991. Interpretation of Brine-PermeabilityTests of the Salado Formation at the Waste Isolation Pilot Plant Site: First Interim Report.SAND90-0083. Albuquerque, NM: Sandia National Laboratories. (Copy on file in theSWCF as WPO26003.)
Beauheim, R.L., R.M. Roberts, T.F. Dale, M.D. Fort, and W.A. Stensrud. 1993. HydraulicTesting of Salado Formation Evaporites at the Waste Isolation Pilot Plant Site: SecondInterpretive Report. SAND92-0533. Albuquerque, NM: Sandia National Laboratories.(Copy on file in the SWCF as WPO23378.)
Borns, D.J., and J.C. Stormont. 1988. An Interim Report on Excavation Effect Studies at theWaste Isolation Pilot Plant: The Delineation of the Disturbed Rock Zone. SAND87-1375.Albuquerque, NM: Sandia National Laboratories. (Copy on file in the SWCF asWPO24694.)
Brinster, K.F. 1991. Preliminary Geohydrologic Conceptual Model of the Los Medanos RegionNear the Waste Isolation Pilot Plant for the Purpose of Performance Assessment. SAND89-7147. Albuquerque, NM: Sandia National Laboratories. (Copy on file in the SWCF asWPO27781.)
Brodsky, N.S. 1990. Crack Closure and Healing Studies in WIPP Salt Using CompressionalWave Velocity and Attenuation Measurements: Test Methods and Results. SAND90-7076.Albuquerque, NM: Sandia National Laboratories. (Copy on file in the SWCF asWPO25755.)
Brooks, R.H., and A.T. Corey. 1966. "Properties1 of Porous Media Affecting Fluid Flow,"Journal of the Irrigation and Drainage Division, Proceedings of the American Society ofCivil Engineers (ASCE). Vol. 92, no. IR2,61-88. (Copy on file in the SWCF.)
C-88

Dale, T., and L.D. Hurtado. 1996. "WIPP Air-Intake Shaft Disturbed-Rock Zone Study," 4thInternational Conference on the Mechanical Behavior of Salt, Montreal, Quebec, June 17-18,1996. SAND96-1327C. Albuquerque, NM: Sandia National Laboratories. (Copy on fileintheSWCF.)
Davies, P.B. 1991. Evaluation of the Role of Threshold Pressure in Controlling Flow of Waste-Generated Gas into Bedded Salt at the Waste Isolation Pilot Plant. SAND90-3246.Albuquerque, NM: Sandia National Laboratories. (Copy on file in the S WCF asWPO26169.)
DOE (U.S. Department of Energy). 1995. Waste Isolation Pilot Plant Sealing System DesignReport. DOE/WIPP-95-3117. Carlsbad, NM: U.S. Department of Energy, Waste IsolationPilot Plant. (Copy on file in the SWCF as WPO29062.)
1 DOE (U.S. Department of Energy). 1996. Compliance Certification Application for the WasteIsolation Pilot Plant. DOE/CAO-96-2184. Carlsbad, NM: U.S. Department of Energy,Carlsbad Area Office.
Finley, N.C., and M. Reeves. 1981. SWIFT Self-Teaching Curriculum: Illustrative Problems toSupplement the User's Manual for the Sandia Waste-Isolation Flow and Transport Model(SWIFT). SAND81-0410. Albuquerque, NM: Sandia National Laboratories. (Copy on filein the SWCF as WPO30254.)
Freeze, R.A., and J.A. Cherry. 1979. Groundwater. Englewood Cliffs, NJ: Prentice-Hall, Inc.(Copy on file in the Nuclear Waste Management Library, Sandia National Laboratories,Albuquerque, NM as GB1003.2 .F73 1979.)
Gorham, E., R. Beauheim, P. Davies, S. Howarth, and S. Webb. 1992. "Recommendations toPA on Salado Formation Intrinsic Permeability and Pore Pressure for 40 CFR191Subpart B Calculations," Preliminary Performance Assessment for the Waste Isolation PilotPlant, December 1992. Volume 3: Model Parameters. Sandia WIPP Project. SAND92-0700/3. Albuquerque, NM: Sandia National Laboratories. A-47 through A-66. (In AppendixA of SAND92-0700/3, which is on file in the SWCF as WPO23529.)
Hansen, F.D., and K.D. Mellegard. 1979. Creep Behavior of Bedded Salt from Southeastern NewMexico at Elevated Temperature. SAND79-7030; RSI-0062. Albuquerque, NM: SandiaNational Laboratories. (Copy on file in the SWCF as WPO27369.)
Haug, A., V.A. Kelley, A.M. LaVenue, and J.F. Pickens. 1987. Modeling of Ground-WaterFlow in the Culebra Dolomite at the Waste Isolation Pilot Plant (WIPP) Site: InterimReport. SAND86-7167. Albuquerque, NM: Sandia National Laboratories. (Copy on file inthe SWCF as WPO28486.)
Holcomb, DJ. 1988. "Cross-Hole Measurements of Velocity and Attenuation to Detect aDisturbed Zone in Salt at the Waste Isolation Pilot Plant," Key Questions in RockMechanics, Proceedings of the 29th U.S. Symposium, University of Minnesota,Minneapolis, MN, June 13-15,1988. Eds. P.A. Cundall, R.L. Sterling, and A.M. Starfield.SAND87-3016C. Brookfield, VT: A.A. Balkema. 633-640. (Copy on file in the SWCF asWPO29992.)
C-89

Holt, R.M., and D.W. Powers. 1990. Geologic Mapping of the Air Intake Shaft at the WasteIsolation Pilot Plant. DOE-WIPP 90-051. Carlsbad, NM: Westinghouse ElectricCorporation. (Copy on file in the Nuclear Waste Management Library, Sandia NationalLaboratories, Albuquerque, NM.)
Knowles, M.K., D. Borns, J. Fredrich, D. Holcomb, R. Price, D. Zeuch, T. Dale, and R.S. VanPelt 1996. "Testing the Disturbed Zone Around a Rigid Inclusion in Salt," 4th Conferenceon the Mechanical Behavior of Salt, Montreal, Quebec, June 17-18,1996. SAND95-1151C.Albuquerque, NM: Sandia National Laboratories. (Copy on file in the SWCF.)
Lambert, SJ. In preparation. Sources of Natural Brines at the Waste Isolation Pilot Plant andImplications for the Seal System. SAND94-0091. Albuquerque, NM: Sandia NationalLaboratories(Copy on file in the SWCF.)
Lappin, A.R., R.L. Hunter, D.P. Garber, and P.B. Davies, eds. 1989. Systems Analysis, Long-Term Radionuclide Transport, and Dose Assessments, Waste Isolation Pilot Plant (WIPP),Southeastern New Mexico; March 1989. SAND89-0462. Albuquerque, NM: SandiaNational Laboratories. (Copy on file in the SWCF as WPO24125.)
LaVenue, A.M., T.L. Cauffinan, and J.F. Pickens. 1990. Ground-Water Flow Modeling of theCulebra Dolomite. Volume I: Model Calibration. SAND89-7068/1. Albuquerque, NM:Sandia National Laboratories. (Copy on file in the SWCF as WPO24085.)
Mercer, J.W. 1983. Geohydrology of the Proposed Waste Isolation Pilot Plant Site, LosMedafios Area, Southeastern New Mexico. Water-Resources Investigations Report83-4016. Albuquerque, NM: U.S. Geological Survey, Water Resources Division. (Copy onfile in the SWCF.)
Parker, J.C., R.L. Lenhard, and T. Kuppusamy. 1987. "A Parametric Model for ConstitutiveProperties Regarding Multiphase Flow in Porous Media," Water Resource Research, Vol.23, no. 4.
Peterson, E.W., P.L. Lagus, and K. Lie. 1987. Fluid Flow Measurements of Test Series A and Bfor the Small Scale Seal Performance Tests. SAND87-7041. Albuquerque, NM: SandiaNational Laboratories. (Copy on file in the SWCF as WPO24430.)
Pruess, K. 1991. TOUGH2 - A General-Purpose Numerical Simulator for Multiphase Fluid andHeat Flow. LBL-29400. Berkeley, CA: Earth Sciences Division, Lawrence BerkeleyLaboratory. (Copy on file in the SWCF.)
Reeves, M., D.S. Ward, N.D. Johns, and R.M. Cranweli. 1986a. Theory and Implementation forSWIFT II, The Sandia Waste-Isolation Flow and Transport Model for Fractured Media,Release 4.84. SAND83-1159,NUREG/CR-3328. Albuquerque, NM: Sandia NationalLaboratories. (Copy on file in the SWCF as WPO28363.)
Reeves, M., D.S. Ward, N.D. Johns, and R.M. Cranweli. 1986b. Data Input Guide forSWIFT U, The Sandia Waste-Isolation Flow and Transport Model for Fractured Media,Release 4.84. SAND83-0242,NUREG/CR-3162. Albuquerque, NM: Sandia NationalLaboratories. (Copy on file in the SWCF as WPO29686.)
C-90

Reeves, M.,D.S. Ward, P.A. Davis, and EJ.Bonano. 1987. SWIFT II Self-TeachingCurriculum: Illustrative Problems for the Sandia Waste-Isolation Flow and TransportModel for Fractured Media. SAND84-1586 Revision, NUREG/CR-3925. Albuquerque,NM: Sandia National Laboratories. (Copy on file in the SWCF as WPO30179.)
Sandia WIPP Project. 1992. Preliminary Performance Assessment for the Waste Isolation PilotPlant, December 1992. Volume 3: Model Parameters. SAND92-0700/3. Albuquerque, NM:Sandia National Laboratories. (Copy on file in the SWCF as WPO20910.)
Saulnier, G.J., Jr., and J.D. Avis. 1988. Interpretation of Hydraulic Tests Conducted in theWaste-Handling Shaft at the Waste Isolation Pilot Plant (WIPP) Site. SAND88-7001.Albuquerque, NM: Sandia National Laboratories. (Copy on file in the SWCF asWPO24164.)
Siegel, M.D., SJ. Lambert, and K.L. Robinson, eds. 1991. Hydrogeochemical Studies of theRustler Formation and Related Rocks in the Waste Isolation Pilot Plant Area, SoutheasternNew Mexico. SAND88-0196. Albuquerque, NM: Sandia National Laboratories. (Copy onfile in the SWCF as WPO25624.)
Stormont, J.C. 1990. Summary of 1988 WIPP Facility Horizon Gas Flow Measurements.SAND89-2497. Albuquerque, NM: Sandia National Laboratories. (Copy on file in theSWCF as WPO24044.)
Stormont, J.C., E.W. Peterson, and P.L. Lagus. 1987. Summary of and Observations AboutWIPP Facility Horizon Flow Measurements Through 1986. SAND87-0176. Albuquerque,NM: Sandia National Laboratories. (Copy on file in the SWCF as WPO24698.)
Touloukian, Y.S., C.Y. Ho, W.R. Judd, and R.F. Roy. 1981. Physical Properties of Rocks andMinerals. McGraw-Hill/Cindas Data Series on Material Properties; Vol. II-2. New York,NY: McGraw-Hill. (Copies available at Technical Library, Sandia National Laboratories,Albuquerque, NM and at Centennial Science and Engineering Library, University of NewMexico, Albuquerque, NM.)
van Genuchten, M. Th. 1980. "A Closed-Form Equation for Predicting the HydraulicConductivity of Unsaturated Soils," Soil Science Society of America Journal. Vol. 44, no. 5,892-898. (Copy on file in the SWCF.)
Van Sambeek,, L.L., D.D. Luo, M.S. Lin, W. Ostrowski, and D. Oyenuga. 1993. Seal DesignAlternatives Study. SAND92-7340. Albuquerque, NM: Sandia National Laboratories.(Copy on file in the SWCF as WPO23445.)
Ward, D.S., M. Reeves, and L.E. Duda. 1984. Verification and Field Comparison of the Sandia.Waste-Isolation Flow and Transport Model (SWIFT). SAND83-1154, NUREG/CR-3316.Albuquerque, NM: Sandia National Laboratories. (Copy on file in the SWCF asWPO29695.)
Webb, S. W. 1996. Review of Two-Phase Characteristic Curves for Porous Media andApplication to the WIPP. SAND93-3912. Albuquerque, NM: Sandia NationalLaboratories. (WPO# 37539)
C-91

WIPPPA. 1992-1993. Preliminary Performance Assessment for the Waste Isolation Pilot Plant,December 1992. SAND92-0700. Albuquerque, NM: Sandia National Laboratories. (Vol. 1on file in the SWCF as WPO20762; Vol. 2 filed as WPO20805; Vol. 3 filed as WPO20910;Vol. 4 filed as WPO20958; Vol. 5 filed as WPO20929.)
C-92

Appendix D
Structural Analyses
Appendix D Abstract
The seals for the shafts at the WIPP are comprised of columns of compacted earthen fill,compacted clay, asphalt, and compacted crushed salt, separated by concrete seals. The structuralbehavior of these columns and the concrete components is the primary focus of the calculationspresented in this appendix. The development (and subsequent healing) of the disturbed rockzone that forms in the rock mass surrounding the shafts is a significant concern in the seal design,and these issues are also addressed in this appendix. In addition, several structural calculationsare included that were used as input to the hydrological calculations reported in Section 8 andAppendix C. Complexity of the calculations ranged from solving a simple equation to rigorousfinite-element modeling encompassing both thermal and structural elements.
D-l

Page intentionally blank.
D-2

Contents
Dl. INTRODUCTION 7D2. ANALYSES METHODS 8
D2.1 SPECTROM-32 9D2.2 SPECTROM-41 : 9D2.3. SALT_SUBSID 10
D3. MATERIAL CHARACTERIZATION 10D3.1 Shaft Seal Components 10
D3.1.1 Salado Mass Concrete 10D3.1.2 Crushed Salt 14D3.1.3 Compacted Clay 19D3.1.4 Asphalt 19
D3.2 In Situ Materials 21D3.2.1 Salado Salt 21D3.2.2 Salado Anhydrite and Polyhalite.. 26D3.2.3 Near Surface and Rustler Formations..... 28
D3.3 Models for the Disturbed Rock Zone within Salt 29D3.3.1 Stress-Invariant Criterion 29D3.3.2 Damage-Stress Criterion 30D3.3.3 Evaluation of DRZ Models 30
D4. SHAFT SEAL COMPONENT ANALYSES 33D4.1 Salado Mass Concrete Seals 33
D4.1.1 Thermal Analysis of Concrete Seals .'. 33D4.1.2 Structural Analysis of Concrete Seals 33D4.1.3 Thermal Stress Analysis of Concrete Seals 42D4.1.4 Effect of Dynamic Compaction on Concrete Seals ; 43D4.1.5 Effect of Clay Swelling Pressures on Concrete Seals 44
D4.2 Crushed Salt Seal 44D4.2.1 Structural Analysis of Crushed Salt Seal 44D4.2.2 Effect of Fluid Pressure on the Reconsolidation of Crushed Salt Seals 47
D4.3 Compacted Clay Seals 51D4.3.1 Structural Analysis of Compacted Clay Seals 51
D4.4 Asphalt Seals 51D4.4.1 Thermal Analysis of Asphalt Seals 51D4.4.2 Structural Analysis of Asphalt Seals 54D4.4.3 Shrinkage Analysis of Asphalt Seals 54
D5. DISTURBED ROCK ZONE CONSIDERATIONS 59D5.1 General Discussion , 59
D5.1.1 Salt Damage Models '. 60D5.1.2 Salt Healing Models 60
D5.2 Disturbed Rock Zone Analyses 62D5.2.1 Analysis of the Disturbed Rock Zone in Salado Salt 62D5.2.2 Salado Anhydrite Beds 70
D-3

D5.2.3 Near Surface and Rustler Formations 73D6. OTHER ANALYSES 74
D6.1 Asphalt Waterstops 74D6.2 Shaft Pillar Backfilling 76
D7. REFERENCES 83
Figures
Figure D-l. Heat generation of Salado Mass Concrete mixture 12Figure D-2. Comparison of calculated results using damage-stress and stress-invariant
DRZ models with measured AIS results 32Figure Dr3. Axisymmetric model used in the SMC thermal analysis 34Figure D-4. Temperature histories of SMC center and SMC/salt interface 35Figure D-5. Isotherms surrounding SMC seal at 0.02 year 36Figure D-6. Seal system conceptual design for the WIPP air intake shaft 38Figure D-7. Axisymmetric model configuration of upper concrete shaft seal 39Figure D-8. Axisymmetric model configuration of middle concrete shaft seal 40Figure D-9. Axisymmetric model configuration of lower concrete shaft seal 41Figure D-10. Swelling pressures as a function of time for a brine-saturated bentonite
specimen with a density of 1,800 kg/m3 45Figure D-l 1. "Pineapple slice" axisymmetric models 46Figure D-12. Consolidation of crushed salt in a shaft at depths of 430,515, and 600 m
using the modified Sjaardema-Krieg, Spiers, and Zeuch models 48Figure D-l 3. Crushed-salt fractional density as a function of time for a fluid pressure of
2 MPa and using the modified Sjaardema-Krieg creep consolidation model 50Figure D-14. WIPP shaft seal design showing asphalt components 52Figure D-15. Models used in thermal analysis of asphalt seal 53Figure D-l6. Temperature histories in asphalt (Point A, Figure D-l5a) and salt
(Point B, Figure D-15a) 55Figure D-l 7. Comparison of asphalt center temperatures for different waterstop
configurations 56Figure D-l 8. Pressure buildup in the upper, middle, and lower shaft seal waterstops 57Figure D-l 9. Normalized DRZ radius as a function of shaft seal stiffness at various depths
within the Salado Formation at time = 0 year after emplacement 64Figure D-20. Normalized DRZ radius as a function of shaft seal stiffness at various depths
within the Salado Formation at time =10 years after emplacement 65Figure D-21. Normalized DRZ radius as a function of shaft seal stiffness at various depths
within the Salado Formation at time = 25 years after emplacement 66Figure D-22. Normalized DRZ radius as a function of shaft seal stiffness at various depths
within the Salado Formation at time = 50 years after emplacement 67Figure D-23. Normalized DRZ radius as a function of shaft seal stiffness at various depths
within the Salado Formation at time = 100 years after emplacement 68Figure D-24. Factor of safety in polyhalite beds at 50 years 71
D-4

Figure D-25. Factor of safety in anhydrite beds at 50 years 72Figure D-26. Normalized DRZ radius for strength reduction factor of 4 and horizontal stress
factor of 1.5 ..75Figure D-27. Salt DRZ around the lower shaft seal at 50 years (prior to seal construction) 77Figure D-28. Salt DRZ around the lower shaft seal at 50.1 years (after excavations but before
seal construction) 78Figure D-29. Salt DRZ around the lower shaft seal at 20 years after seal construction 79Figure D-30. Mining blocks used to represent WIPP underground workings 81Figure D-31. Surface subsidence profiles over shaft area. 82
Tables
Table D-l. Salado Mass Concrete Thermal Properties 11Table D-2. Heat of Hydration Model Parameters 13Table D-3. Summary of Creep Data (from Wakeley et al., 1994) 13Table D-4. Variation of Elastic Modulus of SMC as a Function of Time
(from Wakeley et al., 1994) 13Table D-5. Nonlinear Elastic Material Parameters for WIPP Crushed Salt 15Table D-6. Creep Consolidation Parameters for Crushed Salt
(after Sjaardema and Krieg, 1987) 16Table D-7. Revised Sjaardema-Krieg, Zeuch, and Spiers Creep Consolidation Parameter
Values 18Table D-8. Nonlinear Elastic Material Parameters for Compacted Clay 20Table D-9. Asphalt Thermal Properties : 20Table D-10. Asphalt Elastic Properties 20Table D-l 1. Salado Salt Thermal Properties 21Table D-12. Munson-Dawson Parameter Values for Argillaceous Salt (after Munson et al.,
1989) 27Table D-13. Damage Model Parameters for Argillaceous Salt 28Table D-14. Anhydrite and Polyhalite Elastic and Drucker-Prager Parameter Values 28Table D-15. Rock Types and Properties 29Table D-l6. Normalized DRZ Radius Surrounding the AIS 30Table D-17. Initial Temperature and Stress Conditions within Salado Formation 42Table D-18. Normalized DRZ Radius—Concrete 69Table D-19. Normalized DRZ Radius—Crushed Salt 69Table D-20. Normalized DRZ Radius—Compacted Clay 69Table D-21. Normalized DRZ Radius—Asphalt 70
D-5

Page intentionally blank.
D-6
D1. INTRODUCTION
The seals for the shafts at the WIPP are comprised of columns of compacted earthen fill,compacted clay, asphalt, and compacted crushed salt, separated by concrete seals. Within theSalado Formation each shaft seal includes: (1) an asphalt column extending from above theRustler/ Salado interface down into the Salado salt, (2) an upper Salado compacted clay column,(3) a long compacted crushed salt column, and (4) a lower Salado compacted clay column. Eachof these columns is separated by specially designed salt-saturated concrete components. Thestructural behavior of the various columns and the concrete components is the initial focus of thecalculations presented hi this appendix.
The development (and subsequent healing) of a disturbed rock zone (DRZ) that forms hithe rock mass surrounding the WIPP shafts is a significant concern in the seal design. It is wellknown that an initial DRZ will develop hi the rock adjacent to the shaft immediately afterexcavation. Moreover, the DRZ within the Salado Formation continues to develop because ofsalt creep. Shaft seal emplacement will cause the DRZ to heal with time because of restraint tocreep closure by the seal materials and the subsequent reduction hi the stress differences hi thesurrounding intact salt. Within the formations above the Salado, the DRZ is assumed to be time-invariant, since the behavior of the rock masses encountered there is predominantly elastic. Thecalculation of the temporal and spatial extent of the DRZ along the entire shaft length is thesecond focus of this appendix.
This appendix provides a collection of calculations pertaining to the above mentionedstructural concerns. The purpose of each calculation varied; however, the calculations generallyaddressed one or more of the following issues (1) stability of the component, (2) influences of thecomponent on hydrological properties of the seal and surrounding rock, or (3) construction issues.Stability issues that were addressed in these calculations included:
• potential for thermal cracking of concrete seals, and.
• structural failure of concrete seal components because of loads resulting from (1) creep ofsurrounding salt, (2) dynamic compaction and gravity loads of overlying seal material, (3)repository generated gas pressures, and (4) clay swelling pressures.
Structural calculations were also used to define input conditions to the hydrological calculationsreported in Section 8, including:
• spatial extent of the DRZ within the Salado Formation surrounding the shafts as afunction of depth, time, and seal material type,
• fracturing and DRZ development within Salado Formation interbeds,
• . compacted-salt fractional density as a function of depth and tune,
• shaft-closure induced consolidation of compacted-salt seals, and
• impact of pore pressures on consolidation of compacted-salt seals.
The construction issues that were addressed included:
• emplacement and structural performance of asphalt waterstops, and
• potential benefits from backfilling shaft stations.
D-7
Complexity of the calculations ranged from solving a simple equation to rigorous finite-element modeling encompassing both thermal and structural elements. All calculations arepresented in a similar format, having approximately the same detail. Each calculation isdescribed in terms of its objectives, problem statement, assumptions, and results.
Calculations were performed concurrently with development of the shaft seal design.Consequently, in some instances calculations reported here do not exactly match particularcomponent dimensions shown in the design drawings (Appendix E) because of later changes inthe design. Conclusions drawn from the results of these earlier calculation would not, however,change simply because of dimensional changes or emplacement conditions. In some instances asingle calculation (e.g., a finite-element analysis of the concrete seal) was used to evaluate thestructural behavior of more than one seal component. For example, the finite-element analysis ofthe asphalt waterstops was used to calculate both the DRZ development in the Salado salt and thetime-dependent stresses in the concrete seals. Additionally, some results are drawn fromprevious similar analyses that are still generally applicable to the current design.
For convenience, the presentation of structural analyses in this appendix is divided intofive sections, describing:
• analyses methods,
• material models,
• structural behavior of the shaft seal components,
• DRZ development (and healing) in intact rock surrounding the shaft, and
• analyses related to construction issues.
More specifically, analyses methods and computer programs used in performing these analysesare presented in Section D2. The analyses methods include finite element modeling andanalytical techniques. Section D3 describes the models used in characterizing material behaviorof shaft seal components, the intact rock mass, and the DRZ. Material models included thermalproperties, deformational behavior, and strength properties for the four shaft seal materials andthe in situ materials. Also included is a description of the models used to characterize the DRZ.A summary of the structural analyses of the four shaft seal materials is presented in Section D4.Analyses of the shaft seal components are presented by material type, i.e., concrete, compactedcrushed salt, compacted clay, and asphalt. The behavior of the DRZ within the intact rock masssurrounding the shaft is described in Section D5. The DRZ was evaluated within Salado salt,Salado interbeds, and overlying nonsalt formations. Finally, analyses of asphalt waterstops andshaft station backfilling are discussed in Section D6.
D2. ANALYSES METHODS
Finite-element modeling and subsidence modeling were the primary methodologies usedin evaluating the structural performance of the shaft seals and the surrounding intact rock mass.The finite element programs SPECTROM-32 and SPECTROM-41 were used in the structuraland thermal calculations, respectively. The program SALT_SUBSID was used in the subsidencemodeling. These programs are described below.
D-8

D2.1 SPECTROM-32
The finite-element structural modeling program SPECTROM-32 (Callahan, 1994) wasused in performing structural calculations. These calculations included creep deformation of thehost rock, consolidation of shaft seal material, and development (and subsequent healing) of theDRZ within salt. This thermomechanical program was designed specifically for simulation ofunderground openings and structures. SPECTROM-32 has the capability to model the elastic-plastic response, commonly associated with brittle rock types, and has been used extensively tosimulate the time-dependent viscoplastic behavior observed in intact salt. In addition, creepconsolidation material behavior (e.g., crushed salt) can be modeled using SPECTROM-32.Specific features and capabilities of SPECTROM-32 required for numerical simulations include:
• capabilities for plane-strain and axisymmetric geometries,
• kinematic and traction boundary conditions,
• Multimechanism Deformation Coupled Fracture (MDCF) (Chan, 1993) constitutivemodel for modeling creep behavior of salt and estimating the DRZ in salt,
• creep consolidation models for time-dependent densification of crushed salt,
• nonlinear elastic behavior for modeling time-independent deformational behavior ofcrushed salt and compacted clay,
• capability to represent arbitrary in situ stress and temperature fields, and
• capability to simulate shaft excavation and seal material emplacements.
Most of the structural analyses were performed using Version 4.06 of this program. Analysesusing recently developed creep consolidation models and for calculating the effects of porepressure on consolidation of crushed-salt seal were performed using Version 4.08 of the program.
D2.2 SPECTROM-41
The finite-element program SPECTROM-41 (Svalstad, 1989) was used in performingthermal calculations. This program has been designed and used to solve heat transfer problemsresulting from the storage of heat-generating material in geologic formations for the past15 years. The program has been documented to satisfy the requirements and guidelines outlinedin NUREG-0856 (Silling, 1983). Specific features and capabilities of SPECTROM-41 that wererequired for the numerical simulations include:
• capabilities for two-dimensional and axisymmetric geometries,
• multimaterial behavior,
• specified initial temperature conditions,
• ' specified temperature or flux boundary conditions,
• temperature-dependent thermal properties,.
• time-dependent volumetric heat generation, and
• transient and/or steady-state solutions.
D-9

D2.3. SALT_SUBSID
SALT_SUBSID (Nieland, 1991) is a PC-based subsidence modeling software used toevaluate surface subsidence over underground openings in salt. The computer program has thecapability of developing a site-specific subsidence model which can be used for predicting thefuture subsidence over a new or existing mining plan. The computer program can also predictstresses and strains along the shaft height resulting from subsidence. Subsidence calculations canbe performed on either solution mines or dry mines in salt or potash. The analytical model isbased on the solution for ground movement above a closing displacement discontinuity in anisotropic material and includes a time-dependent function to account for the viscoplastic natureof salt. SALT_SUBSID is commercially available software from the Solution Mining ResearchInstitute (SMRI).
D3. MATERIAL CHARACTERIZATION
This section describes models used in characterizing material behavior of the WIPP shaftseal components, intact rock mass, and DRZ. Structural models used to characterize the fourshaft seal materials are discussed in Section D3.1. The structural models include thermalproperties, deformational behavior, and strength characteristics. Seal materials include concrete,crushed salt, compacted clay, and asphalt. Structural models for intact rock are presented inSection D3.2. These materials include Salado salt, Salado anhydrite and polyhalite, and the rocktypes encountered in the near-surface and Rustier Formations. Models used in characterizing theDRZ within the intact rock mass surrounding the shaft are presented in Section D3.3.
D3.1 Shaft Seal Components
The shaft seal components include Salado Mass Concrete (SMC), crushed salt,compacted clay, and asphalt. Thermal, deformational, and strength characteristics of these fourmaterials that were required in the structural analyses are given in the following sections.
D3.1.1 Salado Mass Concrete
Thermal, deformational, and strength characteristics of SMC were required in thesestructural analyses. These properties are discussed in the following subsections.
Thermal Properties. Required thermal properties include thermal conductivity, specific heat,density, and volumetric heat generation rate (Table D-l). Values of thermal conductivity,specific heat, and density are based on laboratory tests performed at Waterways ExperimentalStation (WES) (Wakeley et al., 1994).
' Heat of hydratioh of SMC is illustrated in Figure D-l which shows heat generation(Btu/lbcem) as a function of time (hr), where the subscript "cem" refers to the total weight ofcementitious material. The curve was digitized and fit to the functional form,
(D-l)
D-10

which was suggested by the Andersen et al. (1992) for describing the heat of hydration forconcrete pavements, where Qm, xe and a are the model parameters and / is time (hr).
These model parameters were determined using the statistical program BMDP/386 andare listed in Table D-2. The volumetric heat generation rate (dQ/dt) of the concrete is required inperforming the thermal analyses. Differentiating Equation D-l with respect to time results in:
= Q(t)(ie/t)a{a/t) (D-2)
to W-hr/m3 n , where m 3 ^ refers to cubic metersThe conversion of units
of concrete, is given as follows:
[1 Btu/lbceJ [1055 J/Btu] [2.2 lb/kg] [2280 kg/m3] [1 W-s/J] [1 hr/3600 s] [0.16= 235W-hr/nr con*
Deformational Properties. SMC is assumed to behave as a viscoelastic material, based onexperimental data for several mixes of SMC. The WES (Wakeley et al., 1994) creep data aresummarized in Table D-3. An isothermal form of the'Norton (power) creep law was fit to long-term laboratory creep-test data and resulted in the following:
where:
a
A
n
= steady-state strain rate
= deviatoric stress
= fitted model parameter = 0.1 l(10"Vday
= fitted model parameter = 0.54.
(D-3)
Table D-l. Salado Mass Concrete Thermal Properties
Property
Thermal Conductivity
Specific Heat
Density
Heat of Hydration Rate
Units
W/m-K
J/kg-K
kg/m3
W/m3
Value
2.145
971.
2,280
(Equation D-2)
D-ll

80
70
Salado Mass Concrete (SMC).[Wakeleyetal.1994]
20 40 60 80 100 120 140 160 180 200TIME (hrs)
Figure D-l. Heat generation of Salado Mass Concrete mixture.
D-12

Table D-2. Heat of Hydration Model Parameters
Parameter
Qco
a
Units
Btu/lb^CW-hr/m3^
hr
—
SMC
173.7 (40,837)
89.8
0.264
Table D-3. Summary of Creep Data (from Wakeley et al., 1994)
Test Number
1
2
3
Uniaxial Stress (MPa)
2.5
5.9
" 7 . 8 ••
Steady-State StrainRate (10^/day)
0.175
0.265
0.333
The elastic modulus of SMC is assumed to be age-dependent, based on experimental datareported by WES (Wakeley et al., 1994). These data are given in Table D-4. A functional formshown in Equation D-4 was used to represent the age-dependence of the elastic modulus of SMCas it sets (increases in stiffness):
where:
E(t)
t
E(t) = >max (D-4)
: modulus at time /: time (days): ultimate stiffness.
Table D-4. Variation of Elastic Modulus of SMC as a Function of Time(from Wakeley et al., 1994)
Time (days)
0
28 :
90
230
Elastic Modulus 106 (psi)
0
4.00
5.77
6.34
D-13

The model parameters derived from experimental results given in Table D-4 are:
^max = 6.7(106)psi
ro= 16.75 days.
Poisson's ratio of SMC was assumed to be 0.19 and is consistent with literature values forconcretes. The thermal expansion of SMC is 11.9 (1 O ^ C based on test data from WES(Wakeley et al., 1994).
Strength Properties. The design specification for concrete is a 28-day unconfined compressivestrength of 4,500 psi (31 MPa) (Appendix A). Recent laboratory tests indicate that SMC has anunconfined compressive strength of about 6,000 psi (40 MPa) (Wakeley et al., 1994).
D3.1.2 Crushed Salt
The total strain rate for the crushed-salt constitutive model is assumed to consist of three
components. These components include nonlinear elastic (ty), creep consolidation (eg), and
creep ( e,y ) contributions, and the total strain rate ( e,y )'can be written as:
Sjj — Sij + Sjj + Sjj (U'D)
Both the nonlinear elastic and creep consolidation portions of the model describe the materialbehavior in bulk (volumetric deformation) and in shear (deviatoric deformation). However, thecreep portion of the crushed-salt model only describes deviatoric behavior. In fact, the creepportion of the crushed-salt model is the same as that of intact salt, i.e., the Munson-Dawsonmodel described in Section D3.2.1. Nonlinear elastic and creep consolidation models used forcrushed salt are described in the next sections.
Nonlinear Elastic Model for Crushed Salt. Elastic strain, s,'-, is the contribution from the stressfield given by Hooke's law, which, in terms of the bulk modulus and shear modulus, is writtenas:
*•&. + % (D-6)
where:
•, mean stress
„• 8jj, deviatoric stress
8jj = Kronecker delta
K = bulk modulus
G = shear modulus.
D-14

Sjaardema and Krieg (1987) propose bulk and shear moduli as exponential functions ofthe current density, p:
G-G°I<J (D-7)
where Ko, K], Go, and Gj are material constants. The current density (p) is written in terms of thetotal volumetric strain, 8^ using the relation:
P =Po
1 + 8.(D-8)
where p0 is the density of the material before the volumetric strain is imposed. The moduli arecapped at values consistent with moduli for intact salt when the current density equals intactsalt's density.
Table D-5 lists material parameters of the nonlinear elastic model for WIPP crushed salt.The terms KQ and Go are the leading coefficients defiiing the bulk and shear moduli, respectivelyas the density approaches zero. The terms Kx and Gx are identical in magnitude and describe thedensity dependence in Equation D-7. Exponential function parameters are from Sjaardema andKrieg (1987). Intact crushed-salt constants (K^ Gfi and py) are based on recent measurements onWIPP salt.
Table D-5. Nonlinear Elastic Material Parameters for WIPP Crushed Salt
Parameter
Ko
* i
Go
G,
Kf
Gf
Pf
Units
MPa
m3/kg
MPa
m3/kg
MPa
MPa
kg/m3
Value
0.01760
0.00653
0.0106
0.00653
23,504
14,156
2,160
Creep Consolidation Models for Crushed Salt. Four constitutive laws were used to describe thecreep consolidation portion of the crushed-salt model:
• Sjaardema-Krieg
• Revised Sjaardema-Krieg
• Zeuch
• Spiers.
D-15

The first model is based on the work of Sjaardema and Krieg (1987) with a deviatoriccomponent added (Callahan and DeVries, 1991). In this study, this model is referred to as theoriginal S-K model. This model can be expressed mathematically as:
where:
Bg, BJ, A
Po
= s^, total volumetric strain
= average effective stress measure
= material constants.
(D-9)
Because Equation D-9 allows for unlimited consolidation, a cap is introduced that eliminatesfurther consolidation when the intact material density (p ) is reached. Thus, when the condition
(D-10)ISv >
is satisfied, no further creep consolidation occurs.
Table D-6 gives values of the crushed-salt parameters for the original S-K model.
Table D-6. Creep Consolidation Parameters for Crushed Salt (after Sjaardema and Krieg, 1987)
Parameter
Bo
Bi
A
Units
kg/m3 • s'1
kg/m3 • yr"1
MPa"1
m3/kg
Value
1.3 x 10⁸
4.10 x 10¹⁵
0.82
-1.73 x 10"2
The second creep consolidation model used in this study is a revised Sjaardema-Kriegmodel, reported originally by Callahan et al. (1995) and recently updated to include a moregeneral formulation and an updated database by Callahan et al. (1996). The mathematical formof this model is:
S;y — BegGij
(D-ll)
where zceq and v{g are the power-conjugate equivalent inelastic strain measure and equivalent
stress measure for creep consolidation, respectively, and aeq is an equivalent stress measure thatprovides a nonassociative formulation in governing the magnitude of the volumetric strain.
D-16

With these considerations, the equivalent stress measures can be written as:
(D-12)
where:
il = Tl0(l-Q)tl1
K = K 0 ( l -Q) K l
(Dt,0<D<DA[D,Dt<D<\]
D, = transitional fractional density"
D = fractional density
CTj and cr3 = principal stresses
<rri and cyf2 = reference stresses
"Ho. T\U n ^KQ, K J , K2,
mx,m1 = material parameters.
The kinetic equation as described by the revised Sjaardema-Krieg model can be written as:
where:
d = grain diameter
w = percent moisture by weight
T = absolute temperature
R . = universal gas constant
BQ,A,p,a b a2, Qc = material parameters. :
The revised Sjaardema-Krieg creep consolidation model has a total of 17 parameters, which arelisted in Table D-7.
D-17

Table D-7. Revised Sjaardema-Krieg, Zeuch, and Spiers Creep Consolidation Parameter Values
Parameter
no
mx
ah
A* i
Qc/R
p
BoA
hhhhn
Un
Units
MPa1"112
—
—
—
MPa
—
—
—
K—
kg • mp"3/(MPa • s)
m3/kg
—
—
mp/(MPa • s)
m p / (MPa»s)—
mp/(MPa • s)—
—
—
Modified Material Models
Sjaardema-Krieg
-1.437
2.594
3.623
0.731
3.535
0.867
17.00
47.50
4.01(103)'
0.564
6.459(107)
-1.307(10"2)
Zeuch
-42.33
2.740
3.049
0.605
18.33
0.888
20.10
96.60
9.26(10"17)
0.396
4.469
5.722
6.54(10"14)
9.05(10"19)
9.991
Spiers
-2.91O0"6)
0.108
5.523
0.174
0.019
0.881
71.10
0.626
1.8(102)
3.22(10"5)
1.02(10"7)
9.770
0.806
3.190
Reference
Values
—
—
—
—
—
—
—
—
—
—
—
-1.72(10"2)
1/3
1/2—
—
4.9
—
1/3
2
4.15
The third model used for the creep consolidation is the Zeuch model, which is based onthe kinetics of isostatic pressing. Similar to the revised Sjaardema-Krieg model, the Zeuchmodel was modified to account for a more general formulation. The Zeuch model is divided intotwo stages, depending on the fractional density. The kinetic equation describing the modifiedZeuch model is:
For Stage 1 (Do < D < 0.9):
•eg-pd"
D-18

For Stage 2 (0.9 < D < 1):
,e pofo (1-D)
« pd'fl-d-Z))'*'}-
where D - D(J{\+z^ and b2, b3, bn, bz, n, au a2, and Qc are model parameters (Table D-7).
The fourth model was developed by Spiers and coworkers based on pressure solutioningas the consolidation mechanism. The Spiers model was also modified to account for a moregeneral formulation and an updated database by Callahan et al. (1996). The modified Spiersmodel is:
where:
small strain (sv > -15%)
large strain (s v<-15%)
and <|)0 is the initial porosity and rh r2, r3, n, ax, a2,p, and Qc are material parameters (Table D-7).
D3.1.3 Compacted Clay
The clay used in the WIPP shaft seal design is assumed to behave according to anonlinear elastic model. The form of this model is identical to the nonlinear elastic portion of thecrushed-salt model, in which the bulk and shear moduli are expressed as exponential functions ofthe current density:
The parameters for the volumetric (bulk) behavior of clay are based on consolidation datareported in Lambe and Whitman (1969). These parameters are listed in Table D-8. The intactshear modulus (GJ) was calculated from the bulk modulus, assuming a Poisson's ratio of 0.25.
D3.1.4 Asphalt
Thermal properties of solidified asphalt are given in Table D-9. These properties aretaken from the literature (Yoder and Witczak, 1975). Asphalt was assumed to behave elastically.The elastic (primarily bulk) response of the asphalt is considered most important to sealapplication. Because the asphalt is emplaced in a confined volume and the expected stresses thatdevelop (as a result of creep of the surrounding salt and weight of the overlying seal materials)are compressive in nature, the volumetric behavior of the material is important to characterize.
D-19
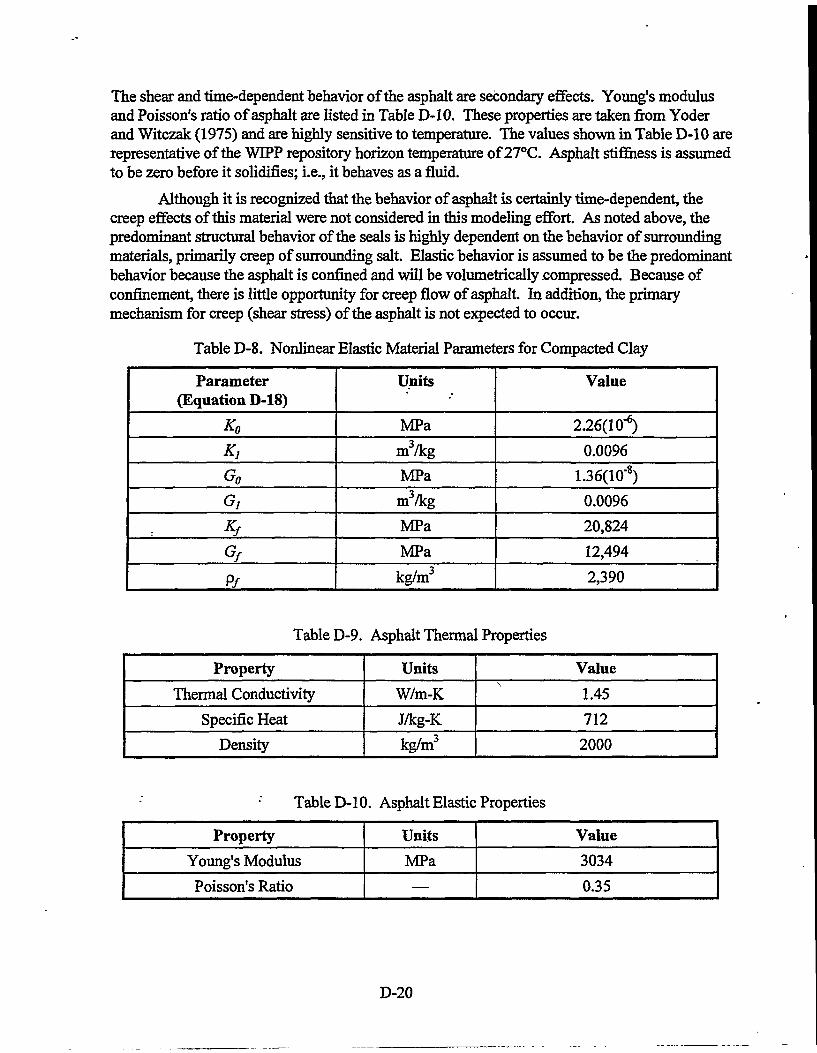
The shear and time-dependent behavior of the asphalt are secondary effects. Young's modulusand Poisson's ratio of asphalt are listed in Table D-10. These properties are taken from Yoderand Witczak (1975) and are highly sensitive to temperature. The values shown in Table D-10 arerepresentative of the WIPP repository horizon temperature of 27°C. Asphalt stiffness is assumedto be zero before it solidifies; i.e., it behaves as a fluid.
Although it is recognized that the behavior of asphalt is certainly time-dependent, thecreep effects of this material were not considered in this modeling effort. As noted above, thepredominant structural behavior of the seals is highly dependent on the behavior of surroundingmaterials, primarily creep of surrounding salt. Elastic behavior is assumed to be the predominantbehavior because the asphalt is confined and will be volumetrically compressed. Because ofconfinement, there is little opportunity for creep flow of asphalt. In addition, the primarymechanism for creep (shear stress) of the asphalt is not expected to occur.
Table D-8. Nonlinear Elastic Material Parameters for Compacted Clay
Parameter(Equation D-18)
Ko
K}
Go
G}
Kf
Gf
P/
Units
MPa
m3/kg
MPa
m3/kg
MPa
MPa
kg/m3
Value
2.26(10"6)
0.0096
1.36(10'8)
0.0096
20,824
12,494
2,390
Table D-9. Asphalt Thermal Properties
Property
Thermal Conductivity
Specific Heat
Density
Units
W/m-K
J/kg-K
kg/m3
Value
1.45
712
2000
Table D-10. Asphalt Elastic Properties
Property
Young's Modulus
Poisson's Ratio
Units
MPa
—
Value
3034
0.35
D-20

D3.2 In Situ Materials
The in situ materials include Salado salt, Salado interbeds (anhydrite and polyhalite), androck types encountered in the near-surface and Rustler Formations. Thermal, deformational, andstrength characteristics of these materials required for structural analyses are given in thefollowing subsections.
D3.2.1 Salado Salt
Thermal Properties. Thermal properties of Salado salt are given in Table D-l 1. These valuesare reported by Krieg (1984). Thermal conductivity of Salado salt is temperature dependent,expressed mathematically as:
where:
k(T)
T
&300
X
= thermal conductivity of salt as a function of temperature
= temperature (K)
= thermal conductivity at reference temperature (T= 300 K) = 5.0 W/m-K
= exponent describing temperature dependence =1.14.
Table D-l 1. Salado Salt Thermal Properties
Property
Thermal Conductivity
Specific Heat
Density
Units
W/m-K
J/kg-K
kg/m3
Value
(Equation D-19)
971
2160
Deformational Characteristics. Intact salt was assumed to be argillaceous salt that is governedby the Multimechanism Deformation Coupled Fracture (MDCF) model (Chan et al., 1995a).This model is an extension of the well-documented Munson-Dawson (M-D) creep model(Munson et al., 1989) to include a calculation of damage. The evolutionary equations for theMDCF model are:
'J - (D-20)
The first inelastic strain-rate represents climb-controlled creep, which is described by thefollowing kinetic equation:
(D-21)
where oceq and zc
eq are power-conjugate equivalent stress measure and equivalent inelastic strain
rate for the climb-controlled creep deformation mechanisms, respectively. The second inelastic
D-21
strain rate represents damage accumulation in the model. Two kinetic equations describe thedamage model, one for shear-induced damage and one for cleavage fracture. These kineticequations are additive to give the total inelastic damage strain rate as follows:
^ = • + 8 ? . .da,,
(D-22)
where |<T^ and a^' j and je®?' and s^ \ are power-conjugate equivalent stress measures and
equivalent inelastic stram rates for the damage mechanisms, respectively. The third inelasticstrain rate represents healing in the model. For calculations performed in support of the shaft
seal design, healing was not operative, i.e., s$ = 0.
Climb-Controlled Creep
The equivalent inelastic strain rate is assumed to consist of a multiplicative transientfunction on the steady-state creep rate, viz.:
(D-23)
The steady-state strain rate consists of three mechanisms that describe dislocation climb, anundefined mechanism, and dislocation glide.
(D-24)
exp - RT.(D-25)
=Ai\Geg (D-26)
sinh
RT.
.(1-co)- C T n
RT)
_ \
(D-27)
D-22

The transient function, F, describes work-hardening, equilibrium, and recovery branches:
exp A 1 -^T
F =
exp •Ji-4lwith an internal variable, 4, described in terms of an evolutionary equation as:
and the transient strain limit is defined by:
- c - •
i]=K^McT) T H ?
with the hardening parameter, A, given by:
A=a >eq
where:
= universal gas constant
= normalizing parameter
= activation volume
= stress limit of dislocation slip mechanism
Al,A2,Bl,
(D-28)
(D-29)
(D-30)
(D-31)
KQ, C, m,a, P, 8 = experimental constants
H(.) = Heaviside step function.
The maximum shear stress (Tresca) is chosen as the conjugate stress measure for climb-controlled creep:
= (D-32)
where:
D-23

J.2
<ym — , mean stress
8 y =Kronecker delta
3 2Jl'2 (D-33)
_1I — - SijSjkSki
Damage Induced Flow
The damage strain rate in Equation D-22 is examined next with the two termsrepresenting shear-induced damage and tension-induced damage considered separately (Chan etal., 1992; Chan, 1994a, 1994b; Chan et al., 1995b):
(D-34)
The equations describing the shear-induced (s) and tension-induced (/) damage are similar inform. Thus, the subscript i is used to represent s and f. The equivalent inelastic strain rate isgiven by:
bgq JT bs (D-35)
with:
= F exp
= F exp
(D-36)
(D-37)
and:-
sinhl (D-38)
and Cj is defined by:
D-24

- 5 i +*2exp- RTj(D-39)
where c0, c2, c3, c4, c$, and n3 are material constants and coo is the initial damage. The power-conjugate equivalent stress measures are given by:
£ = |cri -CT3|+fP xixi sgn(/, -CT3) /1-CJ3 (D-40)
(D-41)
where xx, x2, x6, and x7 are material constants of the damage model, /j is the first stress invariant,and CTj and a3 are the maximum and minimum principal stresses, respectively, with compressionassumed to be negative. The material parameter^ is related to the impurity content by:
fP=l-PiP (D-42)
where p is the impurity (clay) content and/?! is a material parameter, which is analogous to alocal stress intensity factor.
The preceding equations include the damage (00), which is described in terms of anevolutionary equation. The damage evolution equation is taken as:
(D-43)
where the damage rate components for the shear-induced and tension-induced damage are givenby:
(1-P)^
"o% g(ag?)'(1-P)^
(D-44)
(D-45)
where JC4, x3g, x3t, s> £t, and /0 are material constants. The parameter £s may have different values
according to the magnitude of the effective shear-induced damage stress; i.e.,:
(D-46)
The healing term in Equation D-43, h(a> ,Gheq), was assumed to be zero for these calculations.
D-25
The shear-induced inelastic damage flow is assumed to be nonassociative. The flowpotential power-conjugate stress measure for shear-induced damage is given by (cf. EquationD-42):
where JCg is a material constant.
The flow potential power-conjugate stress measure for tension-induced damage is given by:
a £ =*,<!, #(<*,) (D-48)
where X\ is a material constant
The Munson-Dawson creep parameter values for argillaceous WIPP salt are listed inTable D-12. The damage parameters are given in Table D-13.
D3.2.2 Salado Anhydrite and Polyhalite
Salado anhydrite and polyhalite interbeds were assumed to behave elastically. Elasticconstants for anhydrite and polyhalite are given hi Table D-14. These values have been used inprevious similar WIPP analyses (Morgan et al., 1987).
DRZ development was assessed using a Drucker-Prager strength criterion. Damage tothe interbeds is assumed to occur when the peak material strength of the rock is exceeded. Thematerial strength of brittle rocks can be described by a Drucker-Prager type yield:
C (D-49)
where:
/j = first invariant of the total stress tensor
J2 = second invariant of the deviatoric stress tensor
a and C = material constants.
Values for the Drucker-Prager material constants presented by Morgan et al. (1987) for anhydriteand polyhalite are given in Table D-14. The material is elastic when F< 0 and will fracture anddilate if F > 0. The potential for fracture development can be expressed as a factor of safetygiven by the ratio of the strength measure to the stress measure. The factor of safety as used inthis appendix is based on the following equation:
Factor of Safety = - ^ ^ 3 • (D-50)
D-26

Table D-12. Munson-Dawson Parameter Values for Argillaceous Salt(after Munson et al., 1989)
Parameter Units Value
Elastic Parameter Values
E
V
MPa
—31,000
0.25
Munson-Dawson Creep Parameter Values
Ax
A2
Qx/RQx
QJRQi
« i
«2
Bx
B2
q
m
Ko
c
a
P5
Kcal/mol •"
Kcal/mol
—
—
—
MPa
—
—
K"1
—
—
—
4.437xlO30
1.407X10²³
4.144xlO20
1.314xlO13
12,58125,000
503210,000
5.5
5.0
2.838xlO14
8.998xlO6
1.353xlO6
4.289xlO"2
5.335xlO3
20.57
3
2.47xlO6
9.198xlO"°3
-14.96
-7.738
0.58
D-27

Table D-13. Damage Model Parameters for Argillaceous Salt
Parameter
* i
*2
*3
x4
x6
*7
*8
CQ
C2
c3
c4
n3
© 0
Pi
Po
Units
—'
—
—r
—
(MPafs-s
—
MPa
—— .
• —
—
, —
—
—
—
—
Value
0.0
9.0
5.5
3.0
10 3; &x - o 3 > <r0
10 4;CT] - o r 3 < a 0
0.75
1
0.1
34.0
850.0
10.0
6.0
3
IO-4
28
0.029
Table D-14. Anhydrite and Polyhalite Elastic and Drucker-Prager Parameter Values
Material
Anhydrite
Polyhalite
E ;(MPa)
75,100
55,300
V
0.35
0.36
C(MPa)
1.35
1.42
a
0.450
0.473
D3.2.3 Near Surface and Rustler Formations
Failure of the rock within the near-surface and Rustler formations is assumed to be timeindependent and can be estimated according to two common failure criteria: Tresca andCoulomb criteria. The Tresca criterion for failure is based strictly on the difference betweenminimum and maximum principal stresses:
0-3-CT^Co (D-51)
D-28

where Co is uniaxial compressive strength. The von Mises criterion is a modification of the
Tresca criterion wherein Co is replaced by 2 Co / V3.
The Coulomb criterion accounts for the beneficial effect of confinement and says failureoccurs whenever:
(D-52)
1—sinij)
where <j> is the angle of internal friction.
Strength parameters of rock types encountered in near-surface and Rustler formations aregiven in Table D-15.
Table D-15. Rock Types and Properties
Rock Type
Mudstone
Anhydrite
Dolomite
Depth (m)
0-165,223-260
165-183,192-213
183-192,213-223
Strength Properties
C0(MPa)
16.8
92.6
107.3
ro(MPa)
1
5.72
4
<l>(Deg)34.4
44.8
41.9
D3.3 Models for the Disturbed Rock Zone within Salt
Two different models were used to evaluate the development and extent of the DRZwithin the intact salt. The first approach is based on the ratio between two stress invariants: i.e.,
^2 I / j . This criterion has been used to characterize the potential of salt damage or healing in
related WIPP studies. The second approach uses the damage stress ( feq) according to theMDCF constitutive model for WIPP salt. These criteria are discussed in the followingsubsections.
D3.3.1 Stress-Invariant Criterion
The stress-invariant criterion is based on the separation of stress conditions that do or do
not cause dilatancy in WIPP salt when plotted in Ix - Jj^ stress space. Ix is the first invariant of
the stress tensor and represents the mean stress. JJ2 is the second invariant of the deviatoric
stress tensor and represents the shear stress. Taken together, /, and -JJ^ provide a damagefactor that indicates the potential for dilatancy and fracture. The functional form of the stress-invariant criterion is:
D-29
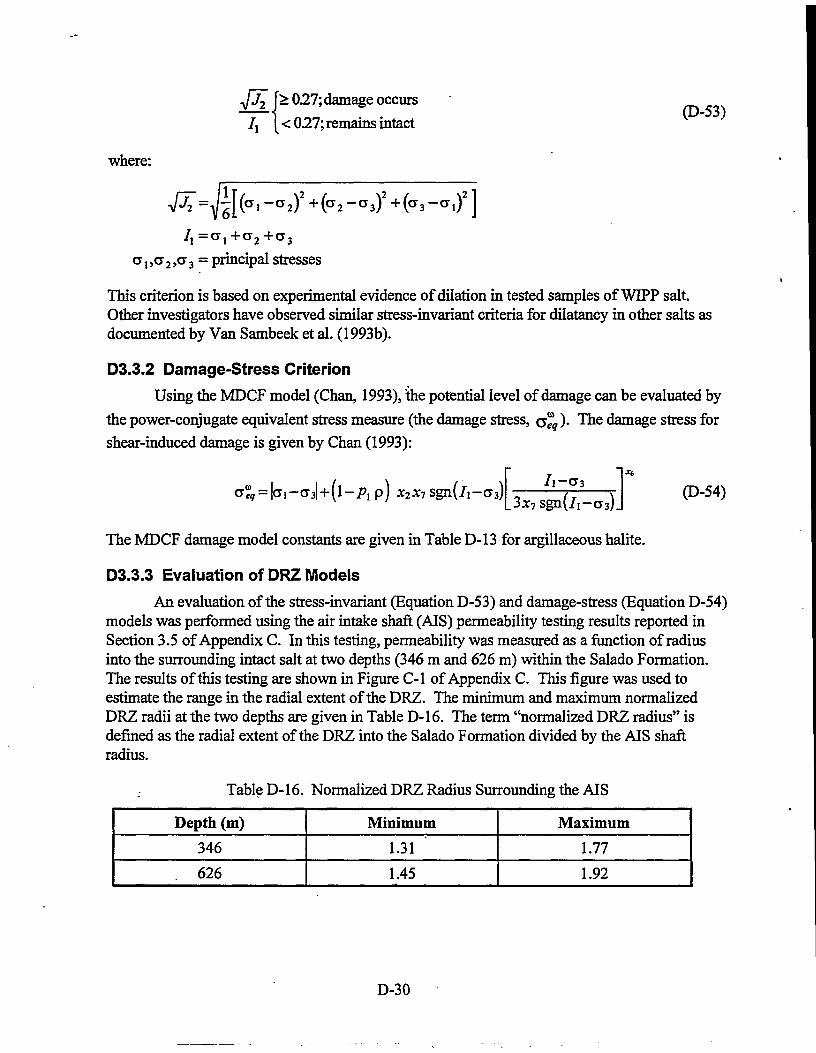
J> 027;damage occurs
[ < 0.27; remains intact(D-53)
where:
CT,,cy2,CT3 = principal stresses
This criterion is based on experimental evidence of dilation in tested samples ofWIPP salt.Other investigators have observed similar stress-invariant criteria for dilatancy in other salts asdocumented by Van Sambeek et al. (1993b).
D3.3.2 Damage-Stress Criterion
Using the MDCF model (Chan, 1993), the potential level of damage can be evaluated by
the power-conjugate equivalent stress measure (the damage stress, Q ^ ) . The damage stress for
shear-induced damage is given by Chan (1993):
(D-54).3x7sgn(/!-
The MDCF damage model constants are given in Table D-13 for argillaceous halite.
D3.3.3 Evaluation of DRZ Models
An evaluation of the stress-invariant (Equation D-53) and damage-stress (Equation D-54)models was performed using the air intake shaft (AIS) permeability testing results reported inSection 3.5 of Appendix C. In this testing, permeability was measured as a function of radiusinto the surrounding intact salt at two depths (346 m and 626 m) within the Salado Formation.The results of this testing are shown in Figure C-l of Appendix C. This figure was used toestimate the range in the radial extent of the DRZ. The minimum and maximum normalizedDRZ radii at the two depths are given in Table D-16. The term "normalized DRZ radius" isdefined as the radial extent of the DRZ into the Salado Formation divided by the AIS shaftradius.
Table D-l 6. Normalized DRZ Radius Surrounding the AIS
Depth (m)
346
626
Minimum
1.31
1.45
Maximum
1.77
1.92
D-30

An estimation of the state of stress surrounding the AIS can be made using the steady-state analytical solution for a circular opening in an infinite domain that has an initial lithostaticstress state (Van Sambeek, 1986). The material is assumed to be governed by a simple Nortoncreep law and a von Mises flow rule. The solution is given in terms of the radial (CT ) tangential(<%), and axial ( a ^ stresses as:
= P0(a/rf"
where:
a1} c2, CT3 = maximum, intermediate, and minimum principal stresses, respectively
a = radius of AIS = 3.05 [m]
r = arbitrary raduis (note: r > a)
Po = magnitude of preesixting stress in surrounding salt
= 5.8+0.0225 (d-250) [MPa]
d = depth [m]
n = exponent of effective stress in Norton creep law= 5.0 (steady-state, time = a>)= 1.0 (elastic, time = 0).
The normalized DRZ radius (r/a) was calculated as a function of depth by substitutingEquation D-55 into Equation D-53 (stress-invariant model) and Equation D-54 (damage-stressmodel). The results of these calculations are shown in Figure D-2. Superposed on this figure arethe AIS field test results (Table D-16). The following conclusions can be made regarding thiscalculation:
• The stress-invariant model (Equation D-53) substantially underpredicts the measuredDRZ.
• The damage-stress model (Equation D-54) provides a conservative estimate(overprediction) of the measured DRZ.
Based on the results of this simple exercise, the damage-stress model was used to estimate thebehavior of the DRZ in all subsequent structural calculations.
D-31

LEVEL A (346m)
CALCULATED
MEASURED
STRESS INVARIANTMODEL
DAMAGE STRESSMODEL
1.12 1.75 1.94
1.31 1.77
1.0 2.0
NORMALIZED "DRZ RADIUS ( r / r )
LEVEL C (626m)
CALCULATED
MEASURED
1.12
STRESS/ ~ MODEL
//
IIIIIIIIIUIIIIIIIIIIII1.45
INVARIANT
/
wmmm.1.87
Illllllllll1.92
1
DAMAGEMODEL
n2.22
1.0 2.0
NORMALIZED DRZ RADIUS ( r / l " o )
Figure D-2.. Comparison of calculated results using damage-stress and stress-invariant DRZmodels with measured AIS results.
D-32

D4. SHAFT SEAL COMPONENT ANALYSES
D4.1 Salado Mass Concrete Seals
D4.1.1 Thermal Analysis of Concrete Seals
Objective
The objective of this calculation was to determine the expected temperatures within (andsurrounding) an SMC emplacement attributable to its heat of hydration.
Problem Description
An axisymmetric representation of the SMC seal, the open shaft, and the surroundingSalado salt is shown in Figure D-3. The left vertical boundary is the centerline of the shaft and isa line of symmetry. The lower horizontal boundary is a plane of symmetry located at themidheight of the SMC seal. The upper horizontal and right vertical boundaries are beyond thethermal influence of the heat-generating SMC seal throughout the simulation period of 1 year.The modeled height of the SMC seal was 6.08 m (20 ft). The radius of the shaft was modeled as3.04 m. A simulation period of 1 year was determined to be of sufficient duration for the SMCand Salado salt temperatures to reach maximums.
Assumptions
• The SMC seal is placed instantaneously at time = 0 year and generates heat in accordancewith Equation D-2.
• The initial temperature of the surrounding salt is 27°C.
• The variations in stratigraphy within the Salado Formation are ignored in this calculation.The in situ material surrounding the shaft was assumed to be entirely Salado salt.
• The seal and shaft are thermally isolated from other seals and other shafts; i.e., thedomain surrounding the seal is assumed to be infinite in extent.
Results
Calculated temperatures from this analysis are shown in Figures D-4 and D-5. FigureD-4 shows that locations in the SMC increase in temperature from ambient (27°C) to a maximumof 53°C at 0.02 year after SMC placement. The maximum temperature in the surrounding salt is38°C at approximately the same time. Figure D-5 shows isotherms within and surrounding theseal at 0.02 year. The thermal gradient within the concrete is approximately 1.5°C/m. Thisfigure also shows that at a radial distance of 2.0 m into the surrounding salt, the temperature riseis less than 1°C.
D4.1.2 Structural Analysis of Concrete Seals
Objective
The objective of this calculation was to determine stresses within the concrete sealsresulting from creep of the surrounding salt and the weight of the overlying seal material.
D-33

-
L/2
{ ,
•
SHAFT(AIR)
i
i
SMC•
L
HALITE
POINT A = SMC MidpointPOINT B = SMC/Salt InterfaceL = Seal Length (20 ft)R = Shaft Radius = (10 ft)
Figure D-3. Axisymmetric model used in the SMC thermal analysis.
D-34

I • • • I
. 5a5°CataO2yr
SMC Midpoint
SMC /Salt Interface
g Y/x .\...i. 3a5°C at aO2 yr
Initial Temperature (27°C)t t i l i i i l i i i l i
0.0
Figure D-4. Temperature histories of SMC center and SMC/salt interface.
D-35

0.0)0.0 1.5
Temperature (°C)
A = 2B.00B= 30.00C - 3&00D« 34.00E 36.00P«6>H
aoo0.00aoo4.006.00
. 18.00
.= 50.00M - 52.00
TIME 20.00E-3yr
R(m)
Figure D-5. Isotherms surrounding SMC seal at 0.02 year.

Problem Description
The concrete seal components in the shaft seal were modeled using the Air Intake Shaft(AIS) geometry (see Figure D-6). The bottoms of the concrete components are located in goodquality halite at depths of 308 m, 429 m, and 616 m for the upper, middle, and lower concreteseals, respectively. Each of the three concrete components was analyzed independently.
As shown in Figures D-7 through D-9, sealing of the shaft and installation of seal systemcomponents were simulated from bottom to top of the modeled region in arbitrary increments of0.1 year for each stage. The response of the seal components and extent of the DRZ weresimulated to 100 years. The following marker beds (MBs) were included in the calculationmodel: MB101, MB103, MB115, MB116,MB117, MB134, MB136, and the Vaca Triste.
Assumptions
• Axisymmetric conditions are applicable, and a condition of axially restraineddisplacements exists with respect to the vertical direction at a moderate distance from theseal system.
• The shaft is instantaneously excavated at time t = 0. Excavations for the concrete sealwings and waterstop occur instantaneously at time / = 50 years.
• Each seal emplacement operation occurs instantaneously.
• The shaft has a uniform initial diameter of 6.1 m.
• The shaft is sufficiently isolated from other excavations that the response of the shaft isunaffected by other underground workings at the WIPP.
• Anhydrite, siltstone, and polyhalite beds exhibit elastic behavior only. Marker bedsMB104, MB105, MB118, and MB137 were not modeled in this study because theserelatively thin members are not structurally important and would not significantly affectthe results.
• Beds comprised predominately of halite are assumed to be argillaceous salt, as defined bythe MDCF model, with a clay content of"2.9%.
• Elastic properties of all materials are independent of temperature within the range ofinterest.
• Inelastic behavior, such as creep, yielding, or cracking, was not modeled for concrete.
• Tension-induced creep damage of salt is ignored.
• Damage stress can be used to indicate if a region within the salt is accumulating damageor healing.
• : Initial temperature and stress conditions are listed in Table D-17.
D-37
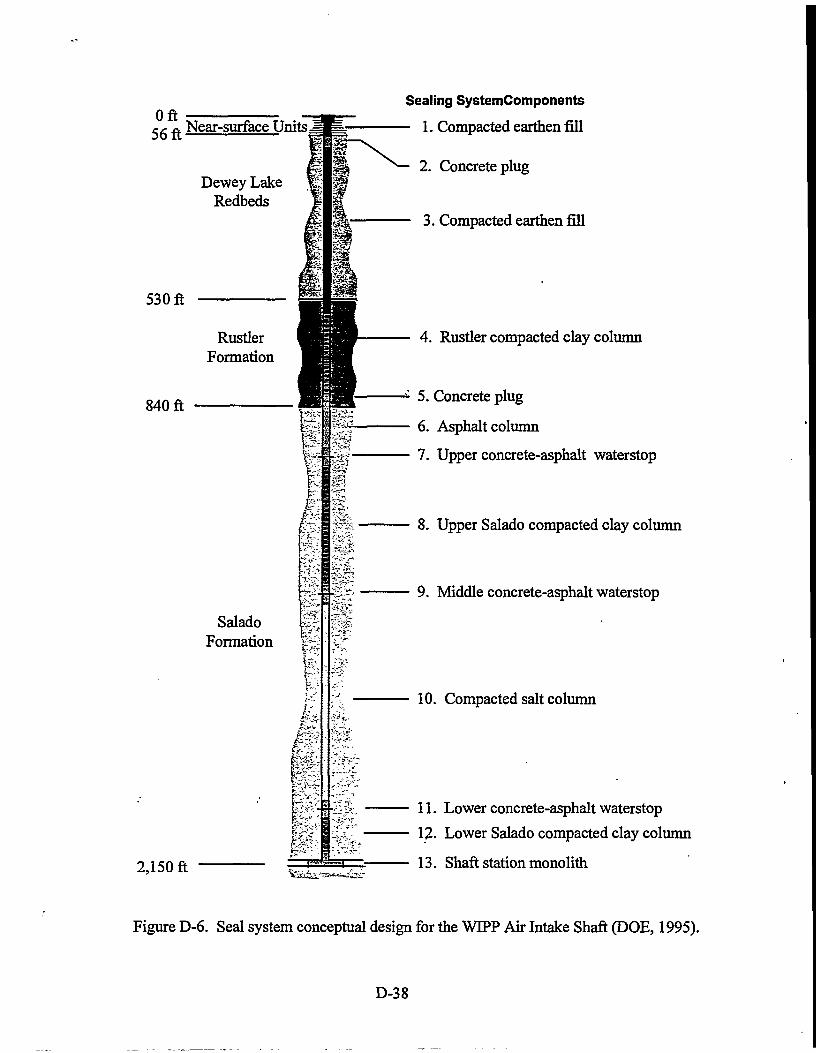
Oft56 ft Near-surface Units.
Dewey LakeRedbeds
530 ft
840 ft
SaladoFormation
RustlerFormation
2,150 ft
aif
' $
Sealing SystemComponents
1. Compacted earthen fill
2. Concrete plug
3. Compacted earthen fill
4. Rustler compacted clay column
^ 5. Concrete plug
6. Asphalt column
7. Upper concrete-asphalt waterstop
8. Upper Salado compacted clay column
9. Middle concrete-asphalt waterstop
10. Compacted salt column
11. Lower concrete-asphalt waterstop
12. Lower Salado compacted clay column
13. Shaft station monolith
Figure D-6. Seal system conceptual design for the WIPP Air Intake Shaft (DOE, 1995).
D-38

AIR..
SALT
SALT AIR.
MB103
SALT
SALT
B101
SALT
CLAY
SALT
MB 103
SALT
MB 103
0 < t < 50 50 < t < 50.1'SALT
50.1 < t < 50.2
SMC
CLAY
MB103
'SALT
50.2 < t < 50.3
SALT
ASPHALT
B101
SALT
SMC
CLAY\
MB103
'SALT
50.3 < » < 50.4
SMC
ASPHALT
SMC
CLAY
SALT
(8101
ASPHALT
SMC
S A L T ASPHALT
SMC
CLAY
SALT
MB103
"SALT
50.4 < » < 50.5
MB 103
'SALT
50.5 < t < 100
Figure D-7. Axisymmetric model configuration of upper concrete shaft seal.

imumiiuiHtimuiuuuuuiniiiuuBuiiuiumu
mumnnuBuntminiuinunuuinBiunuuniu
§
1CO5
1o
%
o
(30
C3oo
3II
CO
00
Q
D-40

13
w
1o§
uiumium«uuuuuuuuuuunuuBuunuuuu
I• 1
00
D-41

Table D-17. Initial Temperature and Stress Conditions within Salado Formation
Location WithinSalado Formation
Upper
Middle
Lower
Depth (m)
301421
608
Initial Conditions
Temperature(1)(°C)
23.5
24.7
26.6
Stress(2)(MPa)
6.95
9.65
13.86(1) Based on temperature of 27°C at 650-m depth and a geothermal gradient of 10°C/km (Sass et al., 1971).(2) Based on in situ stress of 14.8 MPa at 650-m depth and an average overburden density of 2,300 kg/ra3
(Krieg,1984,p. 14).
Results
Throughout the calculations, the salt surrounding the shaft creeps toward and into theshafts. This creep causes radial loading on the.shaft components when the creep is restrained. Inturn, the radial loading induces radial stress in the components. In the upper concretecomponent, the average radial stress increases from zero at time of emplacement (t = 0) to2.5 MPa at / = 50 years. Similarly, the radial stress in the middle concrete component rangesfrom 3.5 to 4.5 MPa and in the lower concrete component the radial stress ranges from 4.5 to5.5 MPa at t = 50 years.
To determine the axial loading on the shaft components, it was assumed that eachconcrete component must support the weight of the overlying seal material between it and thenext concrete component. Using an average vertical stress gradient of 0.02 MPa/m, thecalculated vertical stresses on the upper, middle, and lower concrete components from the weightof the overlying seal material are 7.0,2.4, and 3.8 MPa, respectively. The specified designstrength of the concrete material is 31.0 MPa.
D4.1.3 Thermal Stress Analysis of Concrete Seals
Objectives
The objectives of this calculation were (1) to determine the stresses in the concrete as aresult of its heat of hydration and (2) to determine the thermal impact on the creep of thesurrounding salt.
Problem Description
' Compressive stresses develop within the concrete as a result of thermal expansion of theconcrete and restrained creep of the surrounding salt. Thermal stresses within the concrete werecalculated using the formula:
(D-56)
where:
D-42

aT = thermal stress (for a fully confined condition)
E = Young's modulus
a = linear coefficient of thermal expansion
AT = temperature increase.
Thermal results indicate that the concrete will heat to approximately 53 °C atapproximately 0.02 year after placement (see Section D4.1.1) from an ambient temperature of27°C. The surrounding salt heats to a maximum of 38°C at approximately the same time.
ResultsThe thermoelastic stresses in the concrete were calculated based on a maximum
temperature increase of 26°C (Figure D-4) and assuming a fully confined condition. Thecalculation results indicate that short-term thermal stresses hi the concrete are less than 9.2 MPa.
As shown in Figure D-4, the maximum salt temperature will be approximately 38°C at0.02 year of the emplacement. While it is understoodthat elevated temperatures do increase thecreep rate of salt, the small magnitude and short duration of the thermal pulse in the salt hadnegligible effect on increasing stresses hi concrete through enhanced salt creep.
D4.1.4 Effect of Dynamic Compaction on Concrete Seals
Objective
The objective of this simple calculation was to determine a thickness of seal layer aboveeach of the concrete components to reduce the impact of dynamic compaction.
Problem Description
As shown hi Figure D-6, compacted clay and salt columns are included hi the shaft sealdesign directly above the three concrete components. These seal materials may be dynamicallycompacted as they are emplaced.
The compacted depth (£>) was calculated using the equation:
D = n(WH)112 (D-57)
where:
W = tamper weight = 5.14 (metric tons)
H = drop height = 6.1 (m)
n = material coefficient.
This equation is taken from a construction reference manual and is based on a functional fit tofield measurements. The material coefficient («) is given as 0.5 for all soil deposits and was usedin the calculation for crushed salt. For clay, this coefficient ranges from 0.35 to 0.40 fordecreasing moisture content. A higher value of n results hi a larger compactive depth.
D-43

Results
Using Equation D-57 and the design inputs, the compacted depths for crushed salt andclay are 9.2 feet and 7.2 feet, respectively. The calculations indicate that the provided thicknessfor crushed salt (12 ft) and clay (10 ft) are greater than the compacted depth.
D4.1.5 Effect of Clay Swelling Pressures on Concrete Seals
Objectives
The objectives of this analysis were to determine the potential for failing the concretecomponents as a result of clay swelling pressures and the potential for fracturing the salt wherethe swelling pressure acts directly on the shaft wall.
Problem Description and Results
In order to fail the concrete seals, the applied swelling pressures must exceed thecompressive strength of the concrete (4,500 psi = 31.0 MPa). Test measurements on confinedbentonite at a density of 1.8 g/c3 (Pfeifle and Brodsky; 1991) indicate that the maximum swellingpressures are on the order of 3.5 MPa (Figure D-10). These test results were used to approximatethe induced stresses on the concrete seals from clay swelling pressures.
D4.2 Crushed Salt Seal
D4.2.1 Structural Analysis of Crushed Salt Seal
Objective
The objective of this calculation was to determine the fractional density of the crushedsalt seal as a function of time and depth within the shaft.
Problem Description
The analysis performed is illustrated schematically in Figure D-l 1, which also shows themodel geometry. The model is an axisymmetric representation of the shaft and host rock at aprescribed depth. For time t < -50 years, the shaft is not present and a self-equilibrating initiallithostatic (hydrostatic) stress field exists in the salt such that the three principal stresses areidentical. At time t = -50 years, the cylindrical shaft is "excavated," and the surrounding salt isallowed to creep for 50 years, i.e., the operational period. At time t = 0, crushed salt iscompacted in the shaft with an initial density of 1.944 Mg/m3 (90% of the intact salt density).Salt surrounding the shaft continues to creep inward and consolidates the crushed salt until thecrushed-salt seal reaches the intact density of salt. At that time, the model describing crushedsalt is changed to the model for intact salt. Crushed salt was modeled using the candidate modelsdiscussed in Section D3.1.2. A simulation time of 450 years after emplacement was used, whichis sufficient to allow the compacted crushed salt, even at the shallowest depth, to achieve afractional density greater than 99% of the density of intact salt for each of the three crushed-saltmodels.
D-44

4.0
3.0
2.0t/i
1.0
0.0
SWP002Density = 1300 kg/m3
100% BentoniteHelght= 19 mm
4 6TIME (DAYS)
8 10
Figure D-l 0. Swelling pressures as a function of time for a brine-saturated bentonite specimenwith a density of 1,800 kg/m3.
D-45
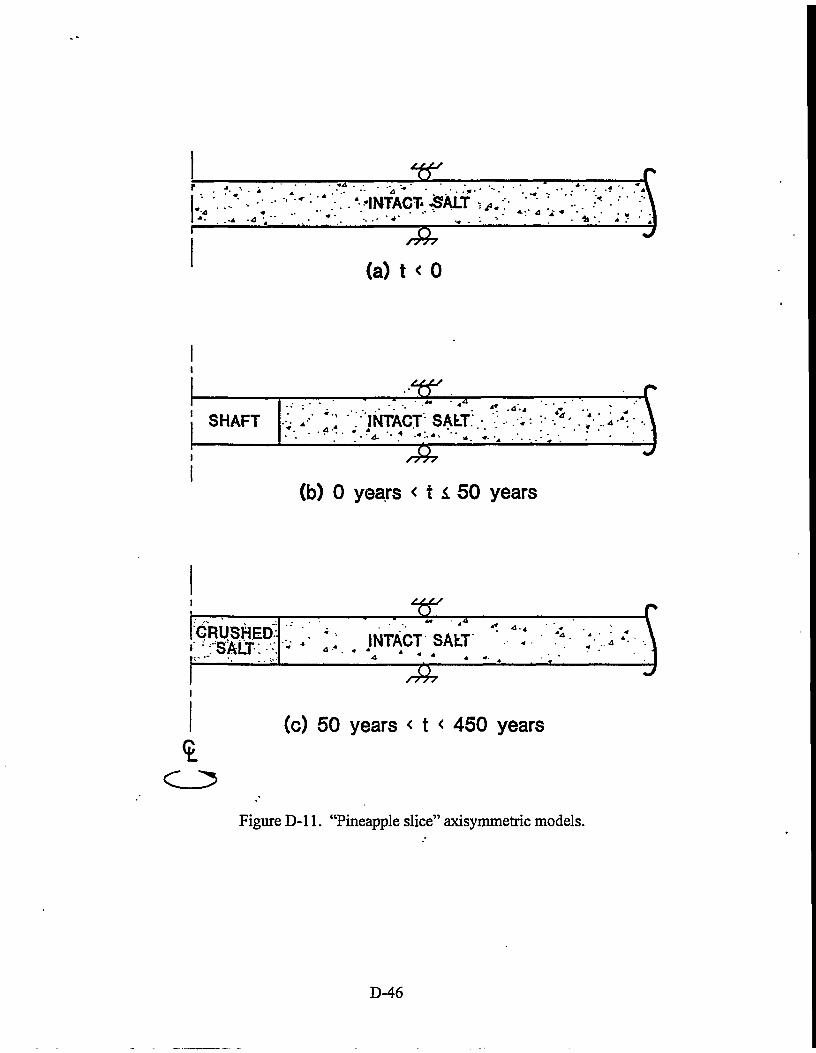
r .. •.VINTAGE
(a) t < 0
SHAFT• • * • • •
INTACT SALT
Ah
(b) 0 years < t L 50 years
CRUSHED" . * *; INTACT SALT
(c) 50 years < t < 450 years
C_2Figure D-11. "Pineapple slice" axisymmetric models.
D-46

Assumptions
• Axisymmetric conditions exist around the shaft, and plane-strain conditions areappropriate with respect to the axial (vertical) direction.
• Vertical variations in stratigraphy are ignored. Intact salt is modeled exclusively asargillaceous salt governed by the MDCF model.
• The initial stress state and temperature vary with depth within the Salado Formation asgiven in Table D-17.
• The modified creep consolidation models of Zeuch, Spiers, and Sjaardema-Krieg wereused. These models include the development of mean stresses in the crushed salt andrestraint to creep closure.
Results
The fractional densities of crushed-salt seal at the top (depth = 430 m), middle(depth = 515 m), and bottom (depth = 600 m) of the salt column are shown in Figure D-12 as afunction of time for the three consolidation models. The models predict essentially the samebehavior for fractional densities ranging from 90 to 95%. The times required to achieve afractional density of 95% are approximately 40, 80, and 120 years at the bottom, middle, and topof the seal, respectively. Only the modified Sjaardema-Krieg creep consolidation modelmathematically allows full consolidation. The times required to theoretically reconsolidate thecrushed salt to 100% fractional density are 70 years, 140 years, and 325 years at the bottom,middle, and top of the salt column, respectively.
D4.2.2 Effect of Fluid Pressure on the Reconsolidation of Crushed Salt Seals
Objective
The objective of this calculation was to determine the effect of fluid pressure on thereconsolidation of the crushed-salt seal. The results of this calculation were used as inputconditions to the fluid-flow analyses described in Appendix C. Because creep of intact salt is anexponential function of stress, fluid pressure applied to the shaft wall would significantly reducethe closure rate of the shaft and, consequently, the reconsolidation rate of the crushed salt.
Problem Description
In this analysis, three models representative of different depths were used. These modelsare axisymmetric representations of the AIS and the surrounding intact salt. The reconsolidationrate depends on the depth, fluid pressure, time, and creep rate of the surrounding intact salt.Representative models used in this analysis are shown schematically in Figure D-l 1. The initialstress and temperature conditions were obtained as described in the notes to Table D-17.
D-47

85
ARGILLACEOUS SALT
90% INITIAL FRACTIONAL DENSITY
modified S-K
modified Spiers
modified Zeuch.
100 200 300 400
Time After Emplacement (yrs)500
Figure D-12. Consolidation of crushed salt in a shaft at depths of 430,515, and 600 m using themodified Sjaardema-Krieg, Spiers, and Zeuch models.
D-48

Three depths were considered: 430 m, 515 m, and 600 m, which are representative of thetop, middle, and bottom of the compacted-salt seal. The fluid in the crushed salt was assumed tobehave as a linear elastic material, in which the fluid pressure is related to the volumetric strainthrough the bulk modulus as:
+ K(l-V/V0),Pmwi} (D-58)
where:P
Po
K
V
Vo
•'max
= fluid pressure
= initial fluid pressure
= fluid bulk modulus
= current volume of crushed salt
= initial volume (based on 90% fractional density)
= maximum fluid pressure.
Maximum fluid pressures CPmax) considered are 0,2, and 4 MPa. These values encompass theallowable range in fluid pressures in terms of salt reconsolidation. Based on the results of thiscalculation, fluid pressures greater than 4 MPa effectively prevent reconsolidation over a 1000-year time frame.
Assumptions
• The fractional densities of the crushed-salt seal were calculated through 500 years usingthe modified Sjaardema-Krieg consolidation model.
• The fractional density of the crushed salt after compaction is 90%, i.e., p0 = 0.90.• The shaft remains open for 50 years, then is instantaneously filled with compacted
crushed salt.• The initial fluid pressures are applied instantaneously at time = 50 years. This is a
conservative assumption because it provides an immediate restraint to creep closure andresults in longer reconsolidation times.
• Vertical variations in stratigraphy and material properties are neglected. Intact salt ismodeled exclusively as argillaceous salt governed by the MDCF model.
Results
Results for 0 MPa are shown in Figure D-12; results for 2 MPa are shown in Figure D-13.These results indicate that, as expected, the time required to consolidate the crushed saltincreases substantially as the fluid pore pressure increases. For fluid pressures of 4 MPa orgreater, reconsolidation times are increased to the point where the crushed salt does not achieve afractional density of 96% until substantially beyond 1000 years. For zero fluid pressure, times ofabout 40 years, 70 years, and more than 150 years are required. For a fluid pressure of 2 MPa,the times required to achieve a fractional density of 96% are about 90 years, 200 years, and560 years at the bottom, middle, and top of the crushed-salt column, respectively.
D-49

105
100 -
95 -
a0
Qi—i
O 90•i-i
ou
85 -
80
/
0
• *
t 0
/ y9 0
-
-
:
;*
^ ^ ^ ^ :
ARGILLACEOUS SALT _
90% INITIAL FRACTIONAL DENSITY
PORE PRESSURE = 2 MPa
DEPTH = 430 m
DEPTH = 515 m
DEPTH=600m
I . . . i I i . . . I , , , ,
100 200 300 400Time After Emplacement (yrs)
500
Figure D-13. Crushed-salt fractional density as a function of time for a fluid pressure of 2 MPaand using the modified Sjaardema-Krieg creep consolidation model.
D-50

D4.3 Compacted Clay Seals
D4.3.1 Structural Analysis of Compacted Clay Seals
Objective
The objective of this calculation was to determine the stresses in the upper and lowerSalado compacted clay columns as a result of creep of the surrounding salt. These stresses mayincrease the loads imposed on the concrete seal components. The problem description andassumptions used in performing this calculation are the same as those presented in Section 4.1.2.The results of this calculation indicate that after 50 years the compressive stress in the upperSalado compacted clay column ranges from 0.6 MPa at the top to 0.8 MPa at the bottom of thecolumn. Similarly, after 50 years, the mean stresses in the lower Salado compacted clay columnare approximately 2.6 MPa.
D4.4 Asphalt Seals
D4.4.1 Thermal Analysis of Asphalt Seals .-
Objectives
The objectives of this calculation were (1) to determine the temperature histories withinthe asphalt seal and the surrounding salt and (2) to determine the thermal effects which dependon the length of the waterstop.
Problem Description
A schematic diagram of the AIS seal showing the asphalt components is given inFigure D-14. The AIS is approximately 6.1 m (20 feet) in diameter. The asphalt seal through theRustier/Salado interface is more than 36 m (119 feet) in height (Figure D-6). The waterstops are1.22 m (4 feet) in height and, as shown in Figure D-14, extend radially 3.05 m (10 feet) into thesurrounding salt.
Two geometrical models were used to calculate thermal results. The first model, shown inFigure D-15(a), represents an asphalt seal of infinite length and can be used to approximate thermalconditions within the asphalt at the Rustler/Salado interface. This model was used to calculate themaximum asphalt (Point A) and salt (Point B) temperatures. The right boundary was extendedlaterally (100 shaft radii) to be beyond the thermal influence of the asphalt for 10 years. The leftvertical boundary represents the shaft centerline and is a line of symmetry. The second model,shown in Figure D-15(b), is referred to as a "quarter-symmetry model." It is used to representthermal conditions near the asphalt waterstops and to calculate the thermal effects of the radialextent of the waterstop into the salt. The left and lower boundaries are lines of symmetry locatedat the shaft centerlines and waterstop midheight, respectively. The modeled height of the asphaltis 0.61 m (2 ft). The radial extent of the waterstop as shown in Figure D-15(b) is 3.05 m (10 ft)or equivalently 1 shaft radius into the salt. The right and upper boundaries are extended 100 mfrom the waterstop center; beyond the thermal influence of the asphalt through 10 yearsfollowing emplacement. The temperatures at the asphalt center (Point A in Figure D-15) werecalculated as a function of time for two cases: (1) no waterstop and (2) full waterstop.
D-51

SHUT
UPPER MODLE LOWERPUJO PLUG PLUG
2447.0' 2053.0' 1439.5' MSL
UPPER MIDDLE LOWER «?PLUG PLUG PLUG fa1
2397.0' 2003.0' 1389.5' MSL "
r-cr
SALT-SATURATEDCONCRETE
D E T A I LSHEET ,2jSJlEET 3
WATERSTOP
CENTER OF SHAFT
S E C T I O N
TYPICAL SALADO MASS CONCRETE PLUG
WITH WATERSTOP (3 LOCATIONS)
Figure D-14. WIPP shaft seal design showing asphalt components.
D-52

(a) Pineapple-Slice Model
(b) Quarter-Symmetry Model
Figure D-15. Models used in thermal analysis of asphalt seal.
D-53
Assumptions
• The initial formation temperature is 23°C everywhere along the length of the seal.
• The AIS is thermally isolated from the remaining shafts; i.e., the domain surrounding theAIS is assumed to be infinite in extent.
• The stratigraphy can be neglected; i.e., the domain is assumed to be homogeneous (salt).
• The heat of hydration of the concrete is ignored.
• All seal materials are emplaced simultaneously at time = 0.
• All boundaries are adiabatic.
• The asphalt is emplaced at 180°C.
Results
The results of this analysis are shown in Figures D-16 through D-18. Figure D-16 showstemperature histories of the asphalt and surrounding salt near the seal midheight. These resultsindicate that the asphalt center cools from its emplaced temperature of 180°C to 83°C, 49°C,31°C, and 26°C at times 0.1 year, 0.2 year, 0.5 year, and 1.0 year, respectively. Similarly, theasphalt/salt interface temperatures at the same times are 47°C, 38°C, 29°C, and 26°C.
Figure D-17 shows the temperature histories in the asphalt waterstop. The time requiredto cool the waterstop is significantly less than that required to cool the asphalt column.Specifically, the waterstop center has cooled to temperatures of 38°C, 29°C, 24°C, and 23°C attimes 0.1 year, 0.2 year, 0.5 year, and 1.0 year, respectively.
D4.4.2 Structural Analysis of Asphalt Seals
The objective of this analysis was to calculate the pressures in the asphalt as a result ofcreep of surrounding salt to evaluate stresses induced on concrete seal components. The problemdescription and assumptions used in performing this calculation are the same as those presentedin Section 4.1.2. The results of this calculation are shown in Figure D-19, which shows thecalculated pressure in the upper, middle, and lower asphalt waterstops as a function of time afteremplacement. These results indicate that after 100 years, the pressures in the waterstop are1.8 MPa, 2.5 MPa, and 3.2 MPa for the upper, middle, and lower waterstops, respectively.
D4.4.3 Shrinkage Analysis of Asphalt Seals
Objective
.- The objective of this analysis was to determine the shrinkage of the asphalt column as itcools from its emplaced temperature to an acceptable working environment temperature.
D-54

200
180
60
40
20
• i • • • • i«
ASPHALT (SHAFT CENTER)SALT (SHAFT WALL)
INITIAL TEMPERATURE = 2 3 C
t i t i i i i i i i i i t i t i i i -,~rr7T'~0.00 0.10 0.20 0.30 0.40 0.50 0.60 0.70 0.80 0.90 1.00
TIME (yrs)
Figure D-16. Temperature histories in asphalt (Point A, Figure D-15a) and salt(Point B, Figure D-15a).
D-55

200
180
160
i * i
i
1: I
—ASPHALT— ASPHALT—ASPHALT
3IR (NO WATERSTOP)TER (FULL WATERSTOP)
TNITE LENGTH)
0.00 0.10 0.20 0.30 0.40 0.50 0.60 0.70 0.80 0.90 1.00TIME (yrs)
Figure D-17. Comparison of asphalt center temperatures for different waterstop configurations.
D-56

5.0
4 0
0.0
Lower SealMiddle SealUpper Seal
70 80 90Time (Years)
100
Figure D-18. Pressure buildup in the upper, middle, and lower shaft seal waterstops.
D-57

Problem Description
The height of the asphalt column is 138 ft. The volumetric coefficient of thermalexpansion for asphalt is 0.0003 S/T.1 The linear coefficient of thermal expansion for sandstoneaggregate is 0.000005/°F; the corresponding volume coefficient is about three times the linearcoefficient, or 0.000015/°F. Within the column, sand and lime comprise 80% of the volume andasphalt comprises 20%. Thermal contraction can be calculated for each constituent or anequivalent coefficient can be calculated. The equivalent coefficient is:
= 0.8(0.000015)+02(0.00035) (D-59)
= 0.00008/° F
Assumptions
It is assumed that the asphalt mastic mixture will retain enough mobility that all "voids"caused by shrinkage will occur at the top of the emplacement only. That is, the mixture will flowdownward as it shrinks. Accelerated creep closure of the shaft because of heating is ignored incalculating the shaft volume.
Results
The change in height of the asphalt column is given by:
. . AV VaAT Hnr2aAT . Arr
Ah = —-z- = =— = :— = haATTir nrz nr2
= (42.09m)(1.44 x 10"41° C) (180- 37.78° C) (D-60)= 0.89 m
where:
Ah = change in height of asphalt column (m)
AV = change in volume of asphalt column (m3)
r = shaft radius (m)
a = volumetric coefficient of thermal expansion (/°C)
AT = temperature change from emplacement (7=180°F) to cooled state(r=37.78°C).
1 Standard Practice for Determining Asphalt Volume Correction to a Base Temperature, ASTMDesignation: D 4311-83, Section 3.3.
D-58

D5. DISTURBED ROCK ZONE CONSIDERATIONS
D5.1 General Discussion
A DRZ develops around virtually every underground excavation. The DRZ can bedefined as that region near an excavation (in salt or nonsalt rock) that experiences a change inhydrological or mechanical properties. The DRZ is generally assumed to have the followingcharacteristics:
1. dilational deformation resulting from micro- or macrofracturing,
2. decreased load-bearing capacity (loss of strength), and
3. increased fluid permeability (increase in interconnected porosity).
Characterization of the DRZ in salt requires both spatial and temporal considerations. For thatpurpose, the DRZ can be divided into four regimes: (1) initial creation of the DRZ resulting fromstress perturbations brought on by the excavation, (2) changes in rock properties caused by"weathering" of exposed rock, (3) later changes in the DRZ extent that may occur with time asthe salt creeps, and (4) a decrease in the DRZ extent (and eventual elimination) that occursthrough healing of the micro- and macrofracturing when salt creep is restrained. Remediation ofthe DRZ may also be possible by engineering fixes such as grouting.
In situ fluid flow and permeability measurements performed in boreholes drilled fromexcavations in the WIPP provide a geometrical delineation of the DRZ and a measure of thehydrological properties for the DRZ. In general, the disturbance, as reflected by enhancedpermeability, is restricted to about one-half the effective radius of the excavation. Within thisregion the permeability will increase from 10" to 10"23 m2 (undisturbed permeability) at theedge of the DRZ to about 10"14 to 10*15 m2 near the excavation surface (Knowles et al., 1996).Although this discussion relates to underground measurements in the WIPP drifts, a similardelineation of the DRZ around the AIS was observed by Dale and Hurtado (1996).
Underground observations and measurements are consistent with the description of theDRZ extending to less than one excavation radius and having permeabilities that are largest nearthe excavation boundary and lowest (decreasing by several orders of magnitude to salt'sundamaged value) at the edge of the DRZ. Stress states around excavations, whether theinstantaneous elastic distributions or the creep-induced stationary distributions, follow a similartrend. Shear stresses are largest near the excavation and become smaller at greater distancesfrom the excavation. This similarity in trends suggests a conclusion that the DRZ can be definedin terms of the stress states existing in the salt. Laboratory testing data from independentlaboratories using three different test types also support a conclusion that the onset of damage insalt (dilatant behavior) is predictable based on the stress state imposed on the salt (Van Sambeeket al., 1993a). Other laboratory testing data support a conclusion that damage within a saltspecimen can be healed (in fact, healed quite rapidly) by applying favorable stress states to thedamaged specimen (e.g., Costin and Wawersik, 1980; Brodsky, 1990). From these results, aconceptual model for the DRZ is developed where (1) the maximum extent of the DRZ is strictlya function of the most severe stress state ever to exist around the excavation and (2) the currentextent of the DRZ is defined by the current stress state around the excavation. Implicit is that the
D-59

disturbed salt will heal "instantaneously" as the stress state is slowly changed from unfavorable(damage inducing) to favorable.
D5.1.1 Salt Damage Models
Two salt damage models are used to define the DRZ for the WIPP seals design: thestress-invariant ratio and the damage stress criterion (Section D.3.2) model. The stress-invariantratio states that salt will incur damage whenever the ratio between the shear stress (as measuredby the second invariant of the deviatoric stress tensor) and the confining pressure (as measuredby the first invariant of the stress tensor) exceeds a critical value of 0.27. Mathematically, this is:
. (D-61)
where JJ^ is the shear stress measure and Ix is the confining stress measure. The relationship isbased on laboratory testing data from numerous creep and quasi-static tests on WIPP and AveryIsland salts. In general, the relationship seems to represent both different salts and different testtypes as described by Van Sambeek et al. (1993b).
The MDCF model tracks the development of porosity as result of strain-induced damagewithin the salt, as described in Section D3.2.1. The dominant deformation mechanism governingthe dilational behavior of salt is the time-dependent microfracturing mechanism (Chan et al.,1992). This mechanism is operable for a limited range in stress states (i.e., high shear stressesrelative to a low mean stress). The stress states causing microfracturing are typically most severein the salt immediately adjacent the excavation and less severe deeper into the salt. At somedepth, the mean stress increases enough and the shear stresses decrease enough thatmicrofracturing stops; this depth defines the DRZ boundary.
Definition of the DRZ by the MDCF model is preferred over the stress-invariant ratiofrom a scientific viewpoint because it directly connects the variables of stress, strain, and damage(including damage reversal or healing) in one relationship, albeit a complex relationship. Thestress-invariant ratio can only indicate where damage is likely to occur and when healing canbegin based on changes in the stress-invariant ratio. The stress-invariant ratio provides noquantitative information about the degree of damage or the significance of the damage in termsof enhanced permeability. The stress-invariant ratio is, however, simpler to apply to engineeringproblems.
D5.1.2 Salt Healing Models
- Healing of damaged salt within the DRZ will occur whenever stress states no longercause damage. This condition is reached by (1) reducing shear stress, (2) increasing the meanstress, or (3) doing both. The most practical way to achieve a more favorable stress state is torestrain the natural creep of salt by forming a barrier to closure at the free surface of the shaft.By doing so, the stress parallel to the creep deformation direction will increase in compressivemagnitude. As this stress increases, the shear stress decreases and the mean stress increases,which is the situation required to reverse the damaging stress condition. Once the damagingstress state is reversed, healing of damage can begin.
D-60

Evidence for reversing damaging stress states into healing stress states can be found in(1) natural analogues, (2) laboratory tests (Costin and Wawersik, 1980), (3) in situ seal tests inthe WIPP (Knowles et al., 1996), and (4) bulkheads in salt and potash mines. The physicalprocess for healing the microfracture-damaged salt is primarily fluid-assisted pressure solutionand redeposition. In addition, dislocation motion of the solid state allows further deformation ofcrystals to occupy space. Both mechanisms operate effectively at stresses and temperaturesapplicable to the DRZ around the WIPP shafts.
Natural Analogues. Salt formations are universally considered to have very low permeabilities,which is why salt formations are an ideal storage medium. The Salado salt formation originatedas precipitate in oversaturated brines. The original porosity was huge because the salt mass wascomprised of loose hopper crystals. With time and superincumbent pressure from additionalsalts and other sediments, the salt became impermeable, possessing essentially no voids. Fromthis analog, suturing of grain boundaries under natural conditions is demonstrated. The geologictime available for healing is admittedly long; however, the natural stresses and temperatures forthe healing process are similar to conditions expected around the WIPP shaft.
Laboratory Test Evidence. Brodsky (1990) and Brodsky and Munson (1994) present test resultsfor the healing of damaged salt under isostatic stress. This work is particularly significantbecause the salt specimens used in the healing tests had been intentionally damaged in constant-strain-rate tests where the dilatant behavior (volumetric strain) was measured. Thus damage wasquantified before the healing phase of the test. The ultrasonic velocity degradation and recoverywere monitored during the damage and healing phases. The healing rate, as reflected byultrasonic velocity recovery, depends on the original damage level, applied pressure, andtemperature. The times to full recovery are short, based on the 20-day tests at a 20°C to 70°Crange of test temperatures. Therefore, once the seal components restrain the creep of salt andcause confining stresses to develop in the salt, crack closure and healing in the DRZ will berapid.
In Situ Seal Tests. Tests at the WIPP known as Small-Scale Seal Performance Tests (SSSPTs)have shown that large-diameter borehole seals constructed of bentonite and concrete providenearly impermeable barriers to fluid flow. These seals were emplaced in boreholes drilled intothe ribs and floor of a 5.5-m-square room. Thus the boreholes were drilled into a DRZsurrounding the room, and the borehole created a supplementary DRZ around itself. The timelapse between drilling the borehole and emplacing the seal was several months, so ample timewas allowed for the DRZ to develop. Testing of the borehole seals 9 years after emplacementrevealed no leakage through the DRZ. The DRZ must therefore have been healed because theborehole seal caused a stress state to reestablish that was conducive to healing.
Bulkheads in Salt and Potash Mines. The Rocanville potash mine in Saskatchewan provides onecompelling case history for healing of a salt DRZ. An exploratory drift in the mine entered abarren salt zone (devoid of sylvite, so the surrounding rock was halite) and sustained a brineinflow. Within about a month, a concrete bulkhead was built in the drift, including constructiongrouting of the interface between the bulkhead and the salt. After sealing the drift, the brinepressure behind the bulkhead reached a near hydrostatic pressure greater than 8 MPa andremained at that pressure for more than 10 years. There is no evidence of leakage through eitherthe bulkhead or the salt DRZ surrounding the drift. Although the drift was blocked at an early
D-61

age, a DRZ must have formed instantaneously with the excavation of the drift. To be consistentwith the observations, this DRZ must have been healed to avoid leakage during a 10-year timespan. This bulkhead remains accessible and continues to function perfectly.
D5.2 Disturbed Rock Zone Analyses
D5.2.1 Analysis of the Disturbed Rock Zone in Salado Salt
Objective
The objective of this calculation was to determine the spatial extent of the DRZ in theintact salt surrounding the shaft for each of the four shaft seal materials (i.e., concrete, crushedsalt, compacted clay, and asphalt). This information was used to define the input parameters tothe fluid-flow calculations reported in Section 8 of the main report.
Problem Description
The radial extent of the DRZ within the intact salt was determined using a series of"pineapple-slice" models. Each model corresponds to a depth (and its associated initialtemperature and stress conditions). Figure D-ll shows the schematic model geometry, whichincludes an axisymmetric representation of the shaft and surrounding host rock at a fixed depth.The outer (right) boundary is located 50 shaft radii from the axis of symmetry, the shaftcenterline. The boundary condition.at the outer boundary is maintained at the initial stressmagnitude, i.e., the lithostatic stress.
Five depths were chosen to be representative of conditions along the length of the shaftwithin the Salado Formation. Specifically, depths of 250,350,450,550, and 650 m wereconsidered in this analysis. The initial stress and temperature conditions for these depths weredetermined as shown by the notes to Table D-17. Four moduli of elasticity were considered toapproximate the seal materials of asphalt, compacted clay, crushed salt, and salt-saturatedconcrete. Five depths are considered adequate to determine a functional relationship between theDRZ radial extent and depth for each seal material type.
In the analysis for times t < 0 year, the shaft is not present, and an initial lithostatic stressfield exists in the salt. At time t = 0 year, the cylindrical shaft is excavated, and the surroundingsalt is allowed to creep for 50 years, i.e., the operational period. At time t = 50 years, the shaft issealed. In the analyses, salt surrounding the shaft continues to creep against the seal material andconsolidates the seal material (if applicable) for an additional 100 years. The time-dependentradial extent of the DRZ was calculated for each model (depth) and seal material-type. Thedamage-stress criterion for argillaceous salt (see Section D3.3.2) was used to estimate the spatialextent of the DRZ as a function of time for each of the models considered.
Assumptions
• The stratigraphy surrounding the AIS is modeled as being entirely argillaceous salt.
• The initial stress state prior to excavation is lithostatic.
• The modeled region remains isothermal.
D-62

• The shaft excavation and seal material emplacement are performed instantaneously attimes of 0 and 50 years, respectively.
• The shaft is sufficiently isolated from other excavations so that only the shaft isconsidered in the analysis. Axisymmetric conditions are, therefore, applicable and acondition of plane strain exists with respect to the axial (vertical) direction.
• The calculations are based on finite deformation solutions.
• The damage stress criterion can be used to define the spatial extent of the DRZ.
• Short-term thermally enhanced salt creep is ignored.
• Pore pressure effects are not incorporated.
• A Tresca flow rule was used for intact salt
Results
The results of this calculation are shown in Figures D-19 through D-23 in terms of thenormalized DRZ radius as a function of backfill stiffness (i.e., elastic modulus) at various depthswithin the Salado Formation at times 0,10,25,50, and 100 years after emplacement,respectively. The normalized DRZ radius is defined as the ratio of the radius to the DRZboundary and the shaft radius. The radius to the DRZ boundary is defined as the location wherethe damage stress (Equation D-54) is equal to zero. For all backfill types, the most conservative(i.e., largest) estimate of the extent of the DRZ was calculated using the minimum value of thematerial's stiffness.
The concrete seals are located at approximate depths of 301,420, and 608 m. An elasticmodulus of 30 GPa was used for concrete, corresponding to the 28-day stiffness according toEquation D-4. Using the results shown in Figures D-19 through D-23, the normalized DRZ radiisurrounding the three concrete seals are summarized in Table D-18 for times of 0,10,25,50, and100 years after emplacement.
The compacted-salt column is located at depths ranging from 420 to. 600 m. A minimumelastic modulus of 7.5 GPa was used for compacted crushed salt, corresponding to the emplacedfractional density of 90% using Equation D-7. Using the results shown in Figures D-19 throughD-23, the normalized DRZ radii surrounding the compacted crushed salt seal are summarized inTable D-19 at the top (429 m), middle (515 m), and bottom (600 m) of the column at times 0,10,25, 50, and 100 years following emplacment.
Compacted clay is used as a shaft seal in two locations within the Salado Formation. Theupper Salado compacted clay column is located at depths between 307 and 413 m. The lowerSalado compacted clay column is located at depths between 617 and 643 m. An elastic modulusof 1.2 GPa was assumed for compacted clay, corresponding to a fractional density of 90%according to Equation D-18. Using the results shown in Figures D-19 through D-23, thenormalized DRZ radii surrounding the compacted clay seals are summarized in Table D-20 at thetop and bottom of the upper and lower Salado compacted clay columns at times 0,10,25,50,and 100 years following emplacement.
D-63

35.0
30.0
£ 25.0
fe 15.0
gio.ofa
I 50
0.0
-5.0
0 yrs after emplacementdepth = 250 mdepth = 350 mdepth = 450 m
— — depth = 550 xndepth = 650 m
.J...J. .1 1
i • . , , I
0.9 1.0 1.1 1.2 1.3 1.4 1.5 1.6 1.7 1.8 1.9 Z0NORMALIZED DRZ RADIUS (-)
Figure D-19. Normalized DRZ radius as a function of shaft seal stiffness at various depthswithin the Salado Formation at time = 0 year after emplacement.
D-64

«30-4
35.0
30.0
25.0
m 20.0CO
55Ix<
£j 15.0E HCO
CO 10.0
5.0
0.0
-5.0
10 yrs after emplacementdepth = 250 mdepth = 350 m
r-depth = 450 m- — depth = 550 m
depth = 650 m
I , , , , I
0.9 1.0 1.1 1.2 1.3 1.4 1.5 1.6 1.7 1.8 1.9 £0NORMALIZED DRZ RADIUS (-)
Figure D-20. Normalized DRZ radius as a function of shaft seal stiffness at various depthswithin the Salado Formation at time =10 years after emplacement.
D-65

35.0
30.0
-5.0
• I • « I • t • •
2 5 yi*s ftft'ftr 6DdT)lcdepth = 250 mdepth = 350 m
• r- depth = 450 m- — depth = 550 m
depth = 650 m
t t i » i i i i i i i i i , l , , , , l , . t i 1 i i i i 1 , , , , 1 , , , ,
0.9 1.0 1.1 1.2 1.3 1.4 1.5 1.6 1.7 1.8 1.9 2.0NORMALIZED DRZ RADIUS (-)
Figure D-21. Normalized DRZ radius as a function of shaft seal stiffness at various depthswithin the Salado Formation at time = 25 years after emplacement.
D-66

C3
o
35.0
30.0
25.0
20.0
I " " •
50 yrs after emplacementdepth = 250 mdepth = 350 mdepth = 450 m
- — depth = 550 mdepth = 650 m
zfa6 15.0
gio.ofa
I 5-°0.0
-5.00.9 1.0 1.1 1.2 1.3 1.4 1.5 1.6 1.7 1.8 1.9 2.0
. NORMALIZED DRZ RADIUS (-)
Figure D-22. Normalized DRZ radius as a function of shaft seal stiffness at various depthswithin the Salado Formation at time = 50 years after emplacement.
i . . . , . , . . , , . , i
D-67

35.0
30.0
&&
WE
SS3T
IFI
1 SEA
L I
SHAF
T
25.0
20.0
15.0
10.0
5.0
0.0
-5.0
100 yrs after emplacementdepth = 250 mdepth = 350 m
• —-r- depth = 450 m— — depth = 550 m
depth = 650 m
t t t r I t I
0.9 1.0 1.1 1.2 1.3 1.4 1.5 1.6 1.7 1.8 1.9 £0NORMALIZED DRZ RADIUS (-)
Figure D-23. Normalized DRZ radius as a function of shaft seal stiffness at various depthswithin the Salado Formation at time =100 years after emplacement.
D-68

TableD-18. Normalized DRZ Radius—Concrete
Concrete Component
Upper (d = 301m)
Middle <d = 421m)
Lower (d = 608 m)
Time After Emplacement (yrs)0
1.65
1.76
1.85
10
1.16
1.09
1.01
25
1.05
1.011.00
50
1.00
1.00
1.00
100
1.00
1.00
1.00
Table D-19. Normalized DRZ Radius—Crushed Salt
Depth
Upper (d = 429 m)
Middle (d = 510 m)
Lower (d = 600 m)
Time After Emplacement (yrs)
0
1.77... 1.82
1.85
10
1.20
1.11
1.05
25
1.02
1.01
1.00
50
1.00
1.00
1.00
100
1.00
1.00
1.00
Table D-20. Normalized DRZ Radius—Compacted Clay
Depth
Top ofUSCCC(d = 308 m)
Bottom of USCCC (d = 413 m)
Top ofLSCCC(d = 616 m)
Bottom of LSCCC (d = 643 m)
Time After Emplacement (yrs)0
1.66
1.75
1.85
1.86
10
1.47
1.40
1.22
1.20
25
1.32
1.21
1.03
1.02
50
1.19
1.05
1.00
1.00
100
1.06
1.00
1.00
1.00USCCC = upper Salado compacted clay column; LSCCC = lower Salado compacted clay column.
Asphalt is used as a shaft seal material from the Rustler/Salado interface to the top of theupper concrete component (depths between 256 and 293 m). A minimum elastic modulus of0 GPa was assumed for asphalt, corresponding to its unsolidified stiffness.
Using the results shown in Figures D-19 through D-23, the normalized DRZ radiisurrounding the asphalt seal are summarized in Table D-21 at the top and bottom of the columnat times 0,10,25, 50, and 100 years after emplacement.
D-69

Table D-21. Normalized DRZ Radius—Asphalt
Depth
Top (d = 256 m)
Bottom (d = 293 m)
Time After Emplacement (yrs)
0
1.61
1.65
10
1.61
1.65
25
1.60
1.64
50
1.59
1.63
100
1.58
1.62
D5.2.2 Salado Anhydrite Beds
The material behavior of the interbeds within the Salado Formation is assumed to beelastic (time-invariant); in contrast, the salt creeps (time-dependent). Therefore the interbeds willtend to inhibit creep closure of the shaft. In addition, the salt creep that does occur will tend toincrease the potential for fracturing within the interbeds because of shear tractions that developalong the interface. The thickness of the interbeds relative to the thickness of the salt above andbelow the interbeds determines which of the two behaviors will dominate. That is, the thickerthe interbeds, the less salt creep will occur; and the thicker the salt bed layer, the greater thepotential for fracturing the interbeds.
Objective
The objective of this calculation is to determine the extent of the DRZ within the Saladoanhydrite and polyhalite interbeds as a result of the creep of the surrounding salt. The definitionof the DRZ within these interbeds was used in the fluid-flow consolidations reported inAppendix C.
Problem Description
The problem description and assumptions used in performing this calculation are thesame as those presented in Section D4.1.2. The marker bed locations relative to the concrete sealcomponents are shown in Figures D-7 and D-9. The deformational and strength properties of theanhydrite and polyhalite materials are given in Table D-15.
Results
The results are summarized in Figures D-24 and D-25, which show a calculated factor ofsafety against failure for the various anhydrite and polyhalite layers as a function of radialdistance from the shaft after the shaft has been left open for 50 years.
- For all interbeds, the factor of safety increases as the distance from the shaft wallincreases. Further, with the exception of MB 117, the factor of safety is greater than one (noDRZ) for all interbeds. For MB 117, the failure (DRZ) is localized to within 1 m of the shaftwall.
D-70

3 6 9 12DISTANCE FROM SHAFT (meters)
Figure D-24. Factor of safety in polyhalite beds at 50 years.
D-71

tn
OH
! •
1 -
1 i t
/ MB103
/
*****• * * * a- •
1 I
1
MS 136
MB134
i
3 6 9DISTANCE FROM SHAFT (meters)
Figure D-25. Factor of safety in anhydrite beds at 50 years.
12
D-72

D5.2.3 Near Surface and Rustler Formations
The DRZ around a circular opening (such as a shaft) was estimated using analyticalmeans. The extent of the DRZ in the formations above the Salado was calculated based on twocriteria for rock failure. The shaft excavation superimposes an increment of damage ordisturbance on any natural preexisting disturbance in the host rock. In the near-surface andRustler formations at the WIPP, the development of the DRZ is assumed to be time-invariant;rock behavior is observed to be elastic.
Objective
The objective of this calculation is to determine the extent of the DRZ surrounding theshafts in the near-surface and Rustler formations. The rock types that compose these formationsare anhydrite, dolomite, and mudstone and exhibit time-invariant behavior.
Problem Description
The rock surrounding the shafts can be-divided into two regions: the DRZ region inwhich the rock fails (plastic region) and a region that behaves elastically. The geometry of theregions is defined as:
DRZ region: a<r<RElastic region: R<r<co
where a is the shaft radius and R is the radius to the interface between the plastic and elasticregions. The radius R can be calculated so that the radial stress distribution is continuous acrossthe interface and satisfies the boundary conditions at the shaft wall and the far field. Similarly,stress distributions in the plastic zone are assumed to just satisfy the failure criterion.
The Coulomb failure criterion accounts for the beneficial effect of confinement and saysfailures occur whenever:
CJI-CT3 >C0+CT3(tanp-l)
_ l + sin(|) (D-63)tanp = -
1 — sin 4>where § is the angle of internal friction (Table D-16). The radius to the elastic/plastic interfacebased on the Coulomb failure criterion (Ladanyi, 1974) is:
r -
Coulomb: R/a= *>+7o-i*Co
where:
' Po = far-field stress magnitude
To = tensile strength = So / tan § (Table D-l 5)
Co = cohesion (Table D-l5).
D-73

Because of scale effects, rock is seldom as strong in situ as laboratory strength testsindicate. This scale effect is shown, for example, by Goodman (1980), who suggests a factor ofsafety (strength reduction factor) of five for foundation designs. The in situ strength of the rockwas determined by reducing the matrix strength (based on a literature survey of laboratory testedstrengths) by a factor ranging from three to five. To span the uncertainty hi the horizontal stressmagnitude, the in situ (far-field) stress was taken to be a multiple of between one to two timesthe vertical stress. The intermediate value for each parameter was used as the likely parametervalue for southeastern New Mexico. These parameters should result in a conservative estimateof the DRZ within these formations.
Results
The results of this calculation are shown in Figure D-26, which shows the radial extent ofthe DRZ as a function of depth. These results indicate that the DRZ is not present at depths lessthan 50 m and for the depth interval from 165 m to 213 m (principally, an anhydrite and dolomiteinterval). For the mudstones between 50 and 165 m and between 223 and 260 m, the radialextent of the DRZ increases with depth, reaching a maximum of 2.6 shaft radii at a depth of260 m. The results of this analysis were used to define the initial conditions to the fluid-flowcalculations predicted in Section 8.
D6. OTHER ANALYSES
This section discusses two supplementary analyses performed to support the shaft sealdesign: (1) the DRZ created by asphalt waterstops and (2) potential benefits from shaft stationbackfilling.
D6.1 Asphalt Waterstops .
The DRZ is potentially a major contributor to fluid flows past a shaft seal, regardless ofwhich seal materials are emplaced within the shaft. Therefore, to increase the confidence in theoverall shaft seal system, low permeability layers (termed radial waterstops) intersect the DRZsurrounding the shaft to impede fluid flow. These waterstops are emplaced to alter the flowdirection either inward toward the shaft seal or outward toward the intact salt. The waterstopeffectively blocks the full cross section of the shaft and DRZ using a virtually impermeablematerial (asphalt). The waterstop is thin so that its height is small relative to its width (radius); asmall ratio between height and width will concentrate the new DRZ at the edge of the waterstop.The extent of the new DRZ is small, so the area for fluid leakage past the waterstop is also small.
Objectives
The objectives of this calculation were (1) to estimate the additional damage introducedby excavating the radial slot in the shaft wall and (2) to analyze the potential for healing thisinduced DRZ.
D-74

Strength Reduction = 4.0Horizontal Stress Factor = 1.5
as
Coulomb
^ 1 IT
—r^
• r
8ra>
•5 3i2Q.Oa) 23•a(0
DC
10 50 100 150 200 250 300
Depth (m)
Figure D-26. Normalized DRZ radius for strength reduction factor of 4 and horizontal stressfactor of 1.5.
D-75

Problem Description
The problem description and assumptions used in performing this calculation are thesame as those presented in Section 4.1.2. The damage-stress criterion was used to indicate thespatial extent of the DRZ; i.e., zones with positive damage stress were assumed to be damagedand zones with negative damage stress were assumed to be either undamaged or healed. The rateof healing was assumed to be instantaneous; i.e., zones where the damage stress changed frompositive to negative were assumed to be healed immediately.
Results
The results from analysis of the lower concrete component waterstop are presented here;the structural behavior of the other two waterstops is similar. Figures D-27, D-28, and D-29show contours of damage stress surrounding the lower concrete component waterstop just beforeexcavation of the waterstop, immediately after excavation, and 20 years after emplacement of theasphalt and concrete seals. Figure D-27 indicates that the DRZ before excavating the waterstopis contained spatially within the salt to a radial .distance of less than one shaft radius (about 3 m).Figure D-28 indicates that the DRZ extends radially to approximately 1.4 shaft radii (4.3 m) intothe salt as a result of the waterstop excavation. This extension of the DRZ is localized within thespan of the concrete seals and approaches the waterstop kerf edge. The results shown in FigureD-29 indicate that the DRZ has reduced substantially in size as a result of emplacement of theconcrete and asphalt seals and 20 years creep of the surrounding salt. After 20 years, the spatialextent of the DRZ is localized near the asphalt/concrete interface, extending spatially into the salta distance of less than 2 m. For input to the fluid-flow calculations, a time of 2 years wasestimated for the asphalt waterstop to become effective in terms of sealing off flow through theDRZ.
D6.2 Shaft Pillar Backfilling
The underground portion of the WIPP is quite small when compared to most salt andpotash mines. Nonetheless, subsidence will occur as the underground openings close because ofcreep in the salt. The amount of subsidence depends on the volume of space remaining in therepository at the time of closure. The volume of space (void) will consist of empty access drifts,backfilled entries, and filled waste rooms. The waste rooms are expected to have a 63.8%porosity after accounting for the voids in the waste containers, voids between containers, andheadspace in the room (Callahan and DeVries, 1991). Similarly, backfilled entries are expectedto retain a porosity of about 40% following mechanical placement of salt backfill (backfillfractional density of 0.6). Subsidence of the ground around the shafts could conceivably disturbthe shaft seals. Backfilling the entries in the shaft pillar would reduce the eventual subsidence.
Objective
The objective of this calculation was to assess the benefits of backfilling the shaft pillar interms of reducing the subsidence of the shaft seal and therefore decreasing the potential fordifferential settlement within the seal.
D-76

25
20
15
10
5
Dep
th |
-10
-15
-20
_oc
u | i I i i i
• Salt— m^M
MB 134
E l H Salt
MB 138
H Salt
• • i i i i i
I I I
—
-
-
-
-
-
-
i i i
0 10 15 20 25 30 35
Radius (m)
DAMST
I0.0001.0002.0003.0004.0005.0006.000
40 45
Time 50.00
©=-8.738* = 4.114
50
Figure D-27. Salt DRZ around the lower shaft seal at 50 years (prior to seal construction).
D-77

i r
Salt
MB 134
Salt
MB 138
Salt
10 15 20 25 30
Radius (m)35 40 45 50
DAMST
10.0001.0002.0003.000 Time 50.104.000
_ 5.000• 6.000© = -8.736* = 5.040
Figure D-28. Salt DRZ around the lower shaft seal at 50.1 years (after excavations but beforeseal construction).
D-78

i r i i r
Salt
MB 134
Salt
-10
-15
-20
MB 138
Salt
0 5 10 15 20 25 30Radius (m)
35 40 45 50
DAMST
10.0001.0002.0003.000 Time 70.004.000
— 5.000• 6.000©= -8.720* = 3.044
Figure D-29. Salt DRZ around the lower shaft seal at 20 years after seal construction.
D-79

Problem Description
The subsidence analysis for this calculation was performed using the computer programSALT_SUBSID, which is distributed by the Solution Mining Research Institute (Nieland, 1991).Mathematically, the numerical model is represented by:
S M = I F{xJtyj,D,Aj,Vj) (D-65)
where S is the ultimate subsidence at the x, y coordinates of a point on the surface after totalclosure of the underground openings. The function F (xJ} yjt D, A, ^describes the spatialvariation of ultimate subsidence for individual mining areas with centers at Xj, yp at depth D, ofrectangular area Aj, and volume Vj. The spatial function, F, is based on the displacementdiscontinuity solution for the surface displacement after the closure of a rectangular prismaticopening in an elastic half space. The theoretical basis for the function was obtained from papersby Davis (1983).
The primary input to SALT_SUBSID is the underground opening geometries. Thecoordinates of the entries and rooms were taken from an AutoCad rendering of the WIPP site.The mining blocks used as input to the analysis are shown in Figure D-30. (The representation issufficiently accurate for purposes of this calculation but not accurate to the extent that theindividual coordinates can be relied on for any other purposes.)
Eight panels of waste rooms were represented in the subsidence model. The height of thewaste rooms was set to 8.29 ft based on an excavated height of 13 ft and a filled waste-roomporosity of 63.8%. The waste rooms are close enough to affect the surface subsidence at theshaft collars; they probably are not close enough to affect subsurface subsidence at the shaft seallocations.
Two backfilled areas were considered: backfilled areas of either 200 or 300-ft radiusaround each of the four shafts. To account for backfilling, the entry height was adjusted for anyportion of the entries within the circular area around each shaft. The adjusted height was 4.33 ftbased on an assumed backfill porosity of 30% and a nominal 1-ft headspace for the originally 12-ft-tall entries. For each scenario, the ultimate subsidence was calculated. This subsidence resultsfrom total closure of the shaft pillar workings.
Results
The ultimate subsidence was calculated for the three scenarios: no backfill in the shaftarea, 61-m (200-ft) radius backfilled areas, and 91-m (300-ft) radius backfilled areas around theshafts. Over the shaft area, the ultimate surface subsidence is about 0.15 m (0.5 ft) or lessdepending on the backfill situation. Figure D-31 shows profiles of the ultimate subsidence overthe shaft area; the profile is north-to-south, centered on the salt-handling shaft. The ultimatesurface subsidence in the shaft area is reduced from 0.15 m (0.5 ft) for the no backfill conditionto 0.13 m (0.44 ft) and 0.12 m (0.41 ft) by backfilling to 61 m and 91 m radii, respectively.- As amatter of interest, the maximum subsidence for WIPP is centered over the waste panel area witha magnitude of 0.26 m (0.85 ft). The restriction in subsidence is not considered to be enough thatit warrants backfilling the shaft pillar area.
D-80

900
2=3=4 •56 *
11
9
10
14
IS
16
24
TYPICAL 200 FT.AND 300 FT.RADIUS AREAS
29 [pa32
EXHAUST SHAFT
\ \
33
~3T35
SH SHAFT25
AIR INTAKESHAFT
14
WASTE SHAFT
97
98
99
100 1
101
102
103
II
39
114'
112
111110
109
108
5 1
117
T20
121
122
123
79
81
132'
131
130
129
128
127
126
» i:
l i
135
135
137138
T4T
ISO
14T
148
147
146
145
-iil
153
154
TS5~156
159
1 I168 '
167
166
165
164
163
~16T
2064'
ONORTH
Figure D-30. Mining blocks used to represent WIPP underground workings.

West-to-East Profile Thru Salt Shaft
-0.2
oo§-0.4
'55.QZJ
3 -0.6CO
£
-0.8
-1
o n
VN
O-ft .-Backfil
Radiused
i
//
300-Ba
•fi.-Rackfilled
— No
" \
dius
Backfil ii
i
>
i i
-2500 -2000 -1500 -1000 -500 0 500 1000 1500 2000 2500
Distance From Salt Handling Shaft (ft)
Figure D-31. Surface subsidence profiles over shaft area.
D-82

D7. REFERENCES
Andersen, P.J., M.E. Andersen, and D. Whiting. 1992. A Guide to Evaluating Thermal Effects inConcrete Pavements. SHRP-C/FR-92-101. Washington, DC: Strategic Highway ResearchProgram, National Research Council.
ASTM D 4311 - 83 (R1990). "Standard Practice for Determining Asphalt Volume Correction toa Base Temperature (R 1990)," Annual Book oj'ASTM Standards, Volume 04.03, Road andPaving Materials; Pavement Management Technologies. Philadelphia, PA: AmericanSociety for Testing and Materials. (Available from American Society for Testing andMaterials, 1916 Race Street, Philadelphia, PA 19103-1187,215/299-5400.)
Brodsky, N.S. 1990. CrackClosure and Healing Studies in WIPPSalt Using CompressionalWave Velocity and Attenuation Measurements: Test Methods and Results. SAND90-7076. Albuquerque, NM: Sandia National Laboratories. (Copy on file in the SandiaWIPP Central Files, Sandia National Laboratories, Albuquerque, NM [SWCF] asWPO25755.)
Brodsky, N.S., and D.E. Munson. 1994. "Thermomechanical Damage Recovery Parameters forRocksalt From the Waste Isolation Pilot Plant," Rock Mechanics, Models andMeasurements, Challenges from Industry: Proceedings of the 1st North American RockMechanics Symposium, University of Texas at Austin, Austin, TX, June 1-3,1994. Eds.P.P. Nelson and S.E. Laubach. Brookfield, VT: A.A. Balkema. 731-738. (Copy on file inthe SWCF as WPO27175.)
Callahan, G.D. 1994. SPECTROM-32: A Finite Element Thermomechanical Stress AnalysisProgram Version 4.06. Topical Report RSI-0531. Rapid City, SD: RE/SPEC Inc. (Copyon file in the SWCF as WPO36814.)
Callahan, G.D., and K.L. DeVries. 1991. Analyses of Backfilled Transuranic Wastes DisposalRooms. SAND91-7052. Albuquerque, NM: Sandia National Laboratories. (Copy on filein the SWCF as WPO23990.)
Callahan, G.D., M.C. Loken, L.L. Van Sambeek, R. Chen, T.W. Pfeifle, J.D. Nieland, and F.D.Hansen. 1995a. Evaluation of Potential Crushed-Salt Constitutive Models.SAND95-2143. Albuquerque, NM: Sandia National Laboratories. (Copy on file in theSWCF as WPO31068.)
Callahan, G.D., M.C. Loken, L.D. Hurtado, and F.D. Hansen. 1996. "Evaluation of ConstitutiveModels for Crushed Salt," 4th International Conference on the Mechanical Behavior ofSalt, Montreal, Quebec, June 17-18,1996. SAND96-0791C. Albuquerque, NM: SandiaNational Laboratories. (Copy on file in the SWCF as WPO36449.)
Chan, K.S. 1993. "Time Dependent Interface of Bed Separation Fracture Process in BeddedNatural Salt Deposits," Monthly Technical Report No. FY93-6. Prepared by SouthwestResearch Institute, San Antonio, TX for Sandia National Laboratories, Albuquerque, NM.(Copy on file in SWCF as WPO21030.)
D-83

Chan, K.S. 1994a. "Further Development of Fracture Constitutive Model for Rock Salt,"Monthly Technical Report No. FY 93-12. Prepared by Southwest Research Institute, SanAntonio, TX, for Sandia National Laboratories, Albuquerque, NM, January 15,1993[sic].(Copy on file in the SWCF as WPO21086.)
Chan, K.S. 1994b. "Further Development of Fracture Constitutive Model for Rock Salt,"Monthly Technical Report No. FY94-1. Prepared by Southwest Research Institute, SanAntonio, TX, for Sandia National Laboratories, Albuquerque, NM, February 14,1993[sic]. (Copy on file in the SWCF as WPO21087.)
Chan, K.S., S.R. Bodner, A.F. Fossum, and D.E. Munson. 1992. "A Constitutive Model forInelastic Flow and Damage Evolution in Solids Under Triaxial Compression,"Mechanics of Materials. Vol. 14, no. 1,1-14. (Copy on file in the SWCF as WPO29289.)
Chan, K.S., S.R. Bodner, A.F. Fossum, and D.E. Munson. 1995a. "Constitutive Representationof Damage Healing in WIPP Salt," Rock Mechanics, Proceedings of the 35 U.S.Symposium, University of Nevada, Reno, NV, June 5-7,1995. Eds. J.J.K. Daemen andR.A. Schultz. Brookfield, VT: A.A. Balkema. 485-490. (Copy on file in the SWCF asWPO23774.)
Chan, K.S., D.E. Munson, A.F. Fossum, and S.R. Bodner. 1995b. "Inelastic Flow Behavior ofArgillaceous Salt," International Journal of Damage Mechanics. SAND94-3017J.Albuquerque, NM: Sandia National Laboratories. (Copy on file in the SWCF asWPO22199.)
Costin, L.S., and W.R. Wawersik. 1980. Creep Healing of Fractures in Rock Salt.SAND80-0392. Albuquerque, NM: Sandia National Laboratories. (Copy on file in theSWCF as WPO26748.)
Dale, T., and L.D. Hurtado. 1996. "WIPP Air-Intake Shaft Disturbed-Rock Zone Study," 4thInternational Conference on the Mechanical Behavior of Salt, Montreal, Quebec, June 17-18,1996. SAND96-1327C. Albuquerque, NM: Sandia National Laboratories. (Copy on filein the SWCF.)
Davis, P.M. 1983. "Surface Deformation Associated With a Dipping Hydrofracture," Journal ofGeophysical Research. Vol. 88, no. B7,5826-5834. (Copy on file in the SWCF.)
DOE (U.S. Department of Energy). 1995. Waste Isolation Pilot Plant Sealing System DesignReport. DOE/WIPP-95-3117. Carlsbad, NM: U.S. Department of Energy, Waste IsolationPilot Plant. (Copy on file in the SWCF as WPO29062.)
Goodman, R.E. 1980. Introduction to Rock Mechanics. New York, NY: John Wiley & Sons. 85-: 88,310-311. (Copy on file in the. SWCF as microfilm NNA.910315.0132.)
Knowles, M.K., D. Boms, J. Fredrich, D. Holcomb, R. Price, D. Zeuch, T. Dale, and R.S. VanPelt. 1996. "Testing the Disturbed Zone Around a Rigid Inclusion in Salt," 4th Conferenceon the Mechanical Behavior of Salt, Montreal, Quebec, June 17-18,1996. SAND95-1151C. Albuquerque, NM: Sandia National Laboratories. (Copy on file in the SWCF.)
D-84

Krieg, R.D. 1984. Reference Stratigraphy and Rock Properties for the Waste Isolation PilotPlant (WIPP) Project. SAND83-1908. Albuquerque, NM: Sandia National Laboratories.(Copy on file in the SWCF as WPO24519.)
Ladanyi, B. 1974. "Use of the Long-Term Strength Concept in the Determination of GroundPressure on Tunnel Linings," Advances in Rock Mechanics, Proceedings of the ThirdCongress of the International Society for Rock Mechanics, Denver, CO, September 1-7,1974. Washington, DC: National Academy of Sciences. Vol. 2, pt. B, 1150-1156. (Copyon file in the SWCF.)
Lambe, T.W., and R.V. Whitman. 1969. Soil Mechanics. New York, NY: John Wiley & Sons.(Copy on file in the SNL Technical Library.)
Morgan, H.S., M. Wallner, and D.E. Munson. 1987. Results of an International ParallelCalculations Exercise Comparing Creep Responses Predicted with Three ComputerCodes for Two Excavations in Rock Salt. SAND87-2125. Albuquerque, NM: SandiaNational Laboratories. (Copy on file in the SWCF as WPO24110.)
Munson, D.E., A.F. Fossum, and P.E. Sensenyi 1989.; Advances in Resolution of DiscrepanciesBetween Predicted and Measured In Situ WIPP Room Closures. SAND88-2948.Albuquerque, NM: Sandia National Laboratories. (Copy on file in the SWCF asWPO27882.)
Nieland, J.D. 1991. "SALT_SUBSID: A PC-Based Subsidence Model, User's Manual." TopicalReport RSI-0389. Prepared for the Solution Mining Research Institute, Woodstock, IL.Rapid City, SD: RE/SPEC Inc. (Copy on file in the SWCF.)
Pfeifle, T.W., andN.S. Brodsky. 1991. Swelling Pressure, Water Uptake, and Permeability of70/30 Crushed Salt/Bentonite. SAND91-7070. Albuquerque, NM: Sandia NationalLaboratories. (Copy on file in the SWCF as WPO25438.)
Sass, J.H., A.H. Lachenbruch, R.J. Munroe, G.W. Greene, and T.H. Moses, Jr. 1971. "Heat Flowin the Western United States," Journal of Geophysical Research. Vol. 76, no. 26,6376-6413. (Copy on file in the SWCF.)
Silling, S.A. 1983. Final Technical Position on Documentation of Computer Codes for High-Level Waste Management. NUREG-0856. Washington, D.C.: Division of WasteManagement, Office of Nuclear Material Safety and Safeguards, U.S. Nuclear RegulatoryCommission. (Copy on file in the SWCF.)
Sjaardema, G.D., and R. D. Krieg. 1987. A Constitutive Model for the Consolidation of WIPPCrushed Salt and Its Use in Analyses of Backfilled Shaft and Drift Configurations.
: SAND87-1977. Albuquerque, NM: Sandia National Laboratories. (Copy on file in theSWCF as WPO27693.)
Svalstad, D.K. 1989. Documentation ofSPECTROM-41: A Finite Element Heat TransferAnalysis Program; Revision 0. DOE/CH/10378-1, RSI-0266. Prepared by RE/SPEC Inc.,Rapid City, SD. Argonne, IL: U.S. Department of Energy, Chicago Operations Office.(Copy available from National Technical Information Service, 5285 Port Royal Road,Springfield, VA, 22161,703/487-4650. Order number: DE90000683/XAB.)
D-85

Van Sambeek, L.L. 1986. "Creep of Rock Salt Under Inhomogeneous Stress Conditions." Ph.D.dissertation. Golden, CO: Colorado School of Mines. (Dissertation available fromColorado School of Mines Library, Golden, CO.)
Van Sambeek, L.L., D.D. Luo, M.S. Lin, W. Ostrowski, and D. Oyenuga. 1993a Seal DesignAlternatives Study. SAND92-7340. Albuquerque, NM: Sandia National Laboratories.(Copy on file in the SWCF as WPO23445.)
Van Sambeek, L.L., J.L. Ratigan, and F.D. Hansen. 1993b. "Dilatancy of Rock Salt inLaboratory Tests," InternationalJournal of Rock Mechanics and Mining Sciences &Geomechanics Abstracts, Rock Mechanics in the 1990s, 34th U.S. Symposium on RockMechanics, University of Wisconsin, Madison, WI, June 27-30,1993. Vol. 30, no. 7,735-738. (Copy on file in the SWCF.)
Wakeley, L.D., J.J. Ernzen, B.D. Neeley, and F.D. Hansen. 1994. Salado Mass Concrete:Mixture Development and Preliminary Characterization. SAND93-7066. Albuquerque,NM: Sandia National Laboratories. (Copy on file in the SWCF as WPO10671.)
Yoder, E.J., and M.W. Witczak. 1975. Principles of Pavement Design. 2nd ed. New York, NY:John Wiley & Sons.
D-86

WIPPUC721 Distribution List
Federal Agencies
US Department of Energy (4)Office of Civilian Radioactive Waste Mgmt.Attn: Deputy Director, RW-2
Acting Director, RW-10Office of Human Resources & Admin.
Director, RW-30Office of Program Mgmt & Integ.
Director, RW-40Office of Waste Accept, Stor., & Tran.
Forrestal BuildingWashington, DC 20585
Attn: Project Director (2)Yucca Mountain Site Characterization Office
Director, RW-3Office of Quality Assurance
101 Convention Center Drive, Suite #P-110Las Vegas, NV 89109
US Department of EnergyAlbuquerque Operations OfficeAtto: National Atomic Museum LibraryP.O. Box 5400Albuquerque, NM 87185-5400
US Department of EnergyResearch & Waste Management DivisionAttn: DirectorP.O. Box EOak Ridge, TN 37831
US Department of Energy (8)Carlsbad Area OfficeAttn: G. Dials
D.Galbraith(3)M. MatthewsM. McFaddenR.LarkJ. A. Mewhinney
P.O. Box 3090Carlsbad, NM 88221-309D • -
US Department of EnergyOffice of Environmental Restoration and
Waste ManagementAttn: J. Lytle, EM-30Forrestal BuildingWashington, DC 20585-0002
US Department of Energy (3)Office of Environmental Restoration and
Waste ManagementAttn: M. Frei, EM-34, Trevion IIWashington, DC 20585-0002
US Department of EnergyOffice of Environmental Restoration and
Waste ManagementAttn: S. Schneider, EM-342, Trevion IIWashington, DC 20585-0002
US Department of Energy (2)Office of Environment, Safety & HealthAttn: C. Borgstrom, EH-25
R.Pelletier,EH-231Washington, DC 20585
US Department of Energy (2)Idaho Operations OfficeFuel Processing & Waste Mgmt Division785 DOE PlaceIdaho Falls, ID 83402
US Environmental Protection Agency (2)Radiation Protection ProgramsAttn: M. OgeANR-460Washington, DC 20460
Boards
Defense Nuclear Facilities Safety BoardAttn: D. Winters625 Indiana Ave. NW, Suite 700Washington, DC 20004
Nuclear Waste Technical Review Board (2)Attn: Chairman
S. J. S. Parry1100 Wilson Blvd., Suite 910Arlington, VA 22209-2297
State Agencies
Attorney General of New MexicoP.O. Drawer 1508Santa Fe,NM 87504-1508
Distribution - 1

Environmental Evaluation Group (3)Attn: Library7007 Wyoming NE, Suite F-2Albuquerque, NM 87109
Metropolitan Water District of Southern Calif.Attn: J. NarvaizP.O. Box 54153Los Angeles, CA 90071-3123
NM Energy, Minerals, and NaturalResources DepartmentAttn: Library2040 S. PachecoSanta Fe,NM 87505
NM Environment Department (3)Secretary of the EnvironmentAttn: MarkWeidler1190 St. Francis DriveSanta Fe, NM 87503-0968
NM Bureau of Mines & Mineral ResourcesSocorro, NM 87801
NM Environment DepartmentWIPP Project SiteAttn: P. McCaslandP.O. Box 3090Carlsbad, NM 88221
Laboratories/Corporations
Battelle Pacific Northwest Laboratories (2)Attn: R. E. Westerman
R. Romine, MS P8-38P.O. Box 999900 Battelle Blvd.Richland, WA 99352
Brookhaven National LaboratoryAtto: P. D. MoskowitzEnvironmental & Waste Technology
CenterBuilding 830Upton, NY 11973
Harnischfeger Corp.Phonex Engineering Services'.Attn: R. Luebke2969 S. Chase AvenueMilwaukee, WI 53207-6408
Ian Clelland6656 N.Amdahl Dr.Tucson, AZ 85704
INTERA,Inc.Attn: G. A. Freeze1650 University Blvd. NE, Suite 300Albuquerque, NM 87102
INTERA, Inc. (6)Attn: J. F. Pickens
V. KelleyM. ReevesW. StathamJ. BeachD.FryarINTERA WIPP Library
6850 Austin Center Blvd., Suite 300Austin, TX 78731
INTERA, Inc.Attn: J.Lee,YMPPADept.1261 Town Center DriveLas Vegas, NV 89134
INTERA, Inc.Attn: W. StensrudP.O. Box 2123Carlsbad, NM 88221
Istasca Consulting Group, Inc.Attn: John TinucciThresher Square East708 South Third Street, Suite 310Minneapolis, MI 55415
Los Alamos National LaboratoryAttn: B. Erdal, INC-12P.O. Box 1663Los Alamos, NM 87544
Morton International, Morton SaltAttn: H. W. DiamondMorton International Building100 N. Riverside Plaza,Randolph Street at the RiverChicago, IL 60606-1597
Parsons Brinckerhoff Energy Services, Inc.Attn: W. S. RomanOne Penn PlazaNew York, NY 10119
Parsons Brinckerhoff Energy Services, Inc. (2)Attn: B. W. Lawerance
C. D. MannM. S. Lin
303 Second StreetSuite 850 NorthSan Francisco, CA 94107
Distribution-2

Parsons Brinckerhoff International, Inc.Attn: Mary Ann Novak700 11th Street, NW, Suite 710Washington, DC 20001
Phillips Mining, Geotechnical & GroutingAttn: Stephen Phillips8640 North Glenhurst PlaceTucson, AZ 85704
RE/SPEC, Inc. (5)Attn: L. Van Sambeek (3)
G. CallahanM. LokenJ. RatiganT. Pfeifle
3824 Jet DriveP.O. Box 725Rapid City, SD 57709
RE/SPEC, IncAttn: Angus Robb4775 Indian School NE, Suite 300Albuquerque, NM 87110-3927
Science Applications International Corp.Attn: W. Thompson15000 W. 6th Avenue, Suite 202Golden, CO 80401
Tech Reps, Inc. (3)Attn: J. Chapman (1)
L. Robledo (2)5000 Marble NE, Suite 222Albuquerque, NM 87110
Westinghouse Electric Corporation (5)Attn: Library
J. EpsteinJ.LeeB. A. HowardR.Kehrman
P.O. Box 2078Carlsbad, NM 88221
S. Cohen & AssociatesAttn: BillThurber1355 Beverly Road ; ;:McLean, VA 22101
National Academy of Sciences,WIPP Panel
Howard AdlerOxyrase, Incorporated7327 Oak Ridge HighwayKnoxville,TN 37931
Bob AndrewsBoard of Radioactive Waste ManagementGF4562101 Constitution Ave.Washington, DC 20418
Rodney C. EwingDepartment of GeologyUniversity of New MexicoAlbuquerque, NM 87131
Charles FairhurstDepartment of Civiland Mineral EngineeringUniversity of Minnesota500PillsburyDr.SEMinneapolis, MN 55455-0220
B. John GarrickPLG Incorporated4590 MacArthur Blvd., Suite 400Newport Beach, CA 92660-2027
Leonard F. KonikowUS Geological Survey .431 National CenterReston,VA 22092
Carl A. Anderson, DirectorBoard of Radioactive Waste ManagementNational Research CouncilHA 4562101 Constitution Ave. NWWashington, DC 20418
Christopher G. WhippleICF Kaiser Engineers1800 Harrison St, 7th FloorOakland, CA 94612-3430
John O. Blomeke720 Clubhouse WayKnoxville,TN 37909
Sue B. ClarkUniversity of GeorgiaSavannah River Ecology LabP.O. Drawer EAiken,SC 29802
Konrad B. KrauskopfDepartment of GeologyStanford UniversityStanford, CA 94305-2115
Distribution - 3
Delia RoyPennsylvania State University217 Materials Research LabHastings RoadUniversity Park, PA 16802
David A. WaiteCH2MHillP.O. Box 91500Bellevue, WA 98009-2050
Thomas A. ZordonZordan Associates, Inc.3807 Edinfaurg DriveMurrysville, PA 15668
Universities
Harvey Mudd CollegeAttn: M. CardenasDepartment of EngineeringClaremont,CA 91711
New Mexico State UniversityWaste-management Education & ResearchCorporation.Attn: R. BhadaP.O. Box 3001LasCruces.NM 88003-8001
University of CaliforniaDepartment of Mechanical and EnvironmentalEngineeringAttn: E. MarschallUniversity of CaliforniaSanta Barbara, CA 93106
University of Nevada-RenoDepartment of Mining EngineeringMackay School of MinesAttn: J. DaamenReno,NV 89557
University of New MexicoCenter for Radioactive Waste ManagementAttn: W.Lutze209'Faris Engineering Building '"•• ~Albuquerque, NM 87131-1341
University of New MexicoDepartment of Civil EngineeringAttn: J. C. StormontAlbuquerque, NM 87131-1351
University of New MexicoGeology DepartmentAttn: Library141 Northrop HallAlbuquerque, NM 87131
University of WashingtonCollege of Ocean & Fishery SciencesAttn: G.R. Heath583 Henderson Hall, HN-15Seattle, WA 98195
Libraries
Thomas Brannigan LibraryAtta: D.Dresp106 W. Hadley S tLas Cruces, NM 88001
Government Publications DepartmentZimmerman LibraryUniversity of New MexicoAlbuquerque, NM 87131
New Mexico Junior CollegePannell LibraryAttn: R.HU1Lovington HighwayHobbs,NM 88240
New Mexico State LibraryAttn: N.McCallan325 Don GasparSanta Fe,NM 87503
New Mexico TechMartin Speere Memorial LibraryCampus StreetSocorro.NM 87810
WIPP Public Reading RoomCarlsbad Public Library101 S. Halagueno St.Carlsbad, NM 88220
Foreign Addresses
Atomic Energy Canada Ltd. (5)Whiteshell LaboratoryAttn: Neil Chandler
Glenn McCrankB. Goodwin.Malcolm GrayMaria Onefrei
Pinawa Manitoba, CANADA ROE 1L0
Distribution - 4

Francois Chenevier (2)ANDRARoute de Panorama Robert SchumannB. P. 3892266 Fontenay-aux-Roses, CedexFRANCE
Claude SombretCentre d'Etudes Nucleairesde la Vallee RhoneCEN/VALRHOS.D.H.A. B.P. 17130205 Bagnols-Sur-Ceze, FRANCE
Commissariat a L'Energie AtomiqueAttn: D. AlexandreCentre d'Etudes de Cadarache13108 Saint Paul Lez Durance CedexFRANCE
Bundesanstalt fur Geowissenschaften undRohstoffe (2)Attn: M. Langer
M. WallnerPostfach510 153D-30631 Hannover, GERMANY
Bundesministerium fur Forschung undTechnologiePostfach 200 7065300 Bonn 2, GERMANY
Forschungszentrum Karlsruhe GmbHInstitut ftlr Nukleare EntsorgungstechnikAttn: E. KorthausPostfach 3640, D-76021 KarlsruheBundesrepublic DeutchlandGERMANY
Gesellschaft fur Anlagen und Reaktorsicherheit(GRS)Attn: B.BaltesSchwertnergasse 1D-50667 Cologne, GERMANY
Grundbau Und Felsbau GmbHAtth: W.Wittke ' :' ~HenricistraCe 5052072 Aachen, GERMANY •"
Institut Fur GebirgsmechanikAttn: W. MinkleyFriederikenstraBe 6004279 Leipzig, GERMANY
Institut Fur TieflagerungAttn: K.KuhnTheodor-Heuss-Strasse 4D-3300 Braunschweig, GERMANYShingo TashiroJapan Atomic Energy Research InstituteTokai-Mura, Ibaraki-Ken, 319-11JAPAN
Netherlands Energy Research Foundation ECNAttn: J.Prij3 WesterduinwegP.O. Box 11755ZGPetten .THE NETHERLANDS
Universiteit UtrechtDepartment of Geology (HPT-lab)Attn: C. J. SpiersPO Box 80021NL-3508TAUtrechBudapestlaan 4THE NETHERLANDS
Svensk Karnbransleforsorjning ABAttn: F.KarlssonProject KBS (Karnbranslesakerhet)Box 5864S-102 48 StockhohnSWEDEN
Nationale Genossenschaft fur die LagerungRadioaktiver Abfalle (2)Attn: S. Vomvoris
P. ZuidemaHardstrasse 73CH-5430 WettingenSWITZERLAND
AEA TechnologyAttn: J.H.ReesD5WZ29 Culham LaboratoryAbington, Oxfordshire OX14 3DBUNITED KINGDOM
AEA TechnologyAttn: W.R.Rodwell044/A31 Winfrith Technical CentreDorchester, Dorset DT2 8DHUNITED KINGDOM
AEA Technology „.Attn: J. E. TinsonB4244 Harwell LaboratoryDidcot, Oxfordshire OX11 ORAUNITED KINGDOM
Distribution - 5

Internal
MS04830706132013221322132213221322132213241325132513281328132813281335134113951395139513301330901808990619
Org.516561136719612161216121612161216121611568526852674967416849684967056748680067076841675267528523-2441412630
R. £. StinebaughJ.K.LinnE. J. NowakJ. R. Tillerson (10)E.H.Ahrens(2)A. W. Dennis (10)F. D. HansenL. D. HurtadoM. K. KnowlesP. B. DaviesL. S. CostinR. E: FinleyD. R. AndersonH.N.JowM. F. FewellP. VaughnM.ChuJ. T. HolmesL. ShephardM. MariettaV. H. SlaboszewiczB. J. Pierson (2)NWM Library (100)Central Technical FilesTechnical Library (5)Review and Approval Desk,ForDOE/OSTI (2)
Distribution - 6