Report into Cardan Shaft park brakes
33
RELEASED UNDER THE OFFICIAL INFORMATION ACT 1982
-
Upload
khangminh22 -
Category
Documents
-
view
1 -
download
0
Transcript of Report into Cardan Shaft park brakes

RELEASED U
NDER THE OFFIC
IAL INFORMATIO
N ACT 1982

WAKA KOTAHI NZ TRANSPORT AGENCY CSB IN-SERVICE TESTING REPORT // 2
Contents
In-service Testing and Evaluation .............................................................................................. 1
Executive Summary...................................................................................................................... 4
Cardan Shaft Park Brake Testing Program ................................................................................ 5
Pre-Testing Initiative .................................................................................................................... 7
Full test program .......................................................................................................................... 7
Results ........................................................................................................................................... 8
Stall Test in Detail ....................................................................................................................... 12
Pull Test Forward in Detail ........................................................................................................ 13
Pull Test Rearward in Detail ...................................................................................................... 14
Pull Test - Both Directions in Detail .......................................................................................... 15
Driver Questionnaire in Detail ................................................................................................... 16
Statistical Analysis ..................................................................................................................... 19
Observations ............................................................................................................................... 20
Conclusions ................................................................................................................................ 20
APPENDIX 1: OPERATION ORDER TRANSMISSION PARK BRAKE TESTING ......................... 22
Background ................................................................................................................................. 22
Operation Scope ......................................................................................................................... 22
Distribution List .......................................................................................................................... 23
Legislation ................................................................................................................................... 23
Appendix 1 – Site Layout and Testing Procedure ................................................................... 24
Site safety requirements and layout ......................................................................................... 24
Testing equipment ...................................................................................................................... 26
Testing procedure ...................................................................................................................... 26
Incomplete Criteria ..................................................................................................................... 27
Appendix 2 – Questionnaire and Data Capture Check Sheet ................................................ 28
APPENDIX 2: STATISTICS RESEARCH ASSOCIATES FULL REPORT ...................................... 29
Sample size calculation ............................................................................................................. 29
Sample versus Population ......................................................................................................... 30
Data Analysis .............................................................................................................................. 31
Failure estimates ............................................................................................................................................ 31
Regression ..................................................................................................................................................... 32
RELEASED U
NDER THE OFFIC
IAL INFORMATIO
N ACT 1982

RELEASED U
NDER THE OFFIC
IAL INFORMATIO
N ACT 1982

WAKA KOTAHI NZ TRANSPORT AGENCY CSB IN-SERVICE TESTING REPORT // 4
Executive Summary
Transmission park brakes, commonly known as Cardan Shaft park brakes (CSB), have been linked to a number of incidents where the vehicle has rolled away causing injury and damage - in three cases over the past decade, the injuries have been fatal. A fatal incident in March 2020 prompted Waka Kotahi to undertake an audit and review of in-service brake testing and performance in an effort to quantify and gain a better understanding of the issue.
To quantify these issues, the Waka Kotahi Vehicle Standards team developed an in-service CSB testing program. The program involved pulling over vehicles with CSB, gathering data from the driver, conducting a stall test (as used during Certificate of Fitness testing), and a pull test. A pull test is where the vehicle is held by the park brake, is connected to an anchor vehicle via a strop and load cell, then pulled using a force equivalent to 20% of its Gross Vehicle Mass (GVM). The program was conducted over a two-week period in September 2020 at a Commercial Vehicle Safety Centre (CVSC) in Wellington. Ninety vehicles were randomly selected and tested by a team consisting of Police Commercial Vehicle Safety Team (CVST), Waka Kotahi and an independent brake specialist consultant. The aim of the test procedures was to achieve a comprehensive mix of makes, models and usage types, with testing focused on simulating both Certificate of Fitness testing and testing required to meet the full intent of the heavy vehicle braking standards.
Data collected included answers to a range of questions aimed at understanding the general knowledge of
drivers and vehicle operators around CSB, along with various physical tests of the vehicles’ CSB performance
under a range of loads. The main findings of the testing were:
• Driver/operator knowledge of the park brake type was poor.
• Stall tests performed on Automatic & Automated Manual Transmission (AMT) equipped vehicles gave variable results showing that the stall test was an insufficient test for a Certificate of Fitness (CoF) on these vehicles.
• While the majority of vehicles tested were NB class (3500-12000kg GVM), 3 vehicles in NC class (>12000kg GVM) were observed and tested with a CSB.
• The CSB in 80% of vehicles tested could meet the current CoF inspection “stall test” but they did not
provide enough holding power for the “pull test”.
• The CSB in 12% of vehicles tested were not capable of meeting the current CoF inspection “stall test”
A range of initiatives may be required to address the issues born out of this CSB testing program. These include:
• Investigating and implementing improved in-service and entry testing for vehicles with CSB.
• A comprehensive communications and engagement campaign to ensure vehicle owners, drivers, importers and manufacturers are aware of the limitations of CSB.
• Further evidence gathering and investigation into CSB issues and research into other available levers to Waka Kotahi for managing the risks associated with CSB.
Acknowledgements
This report has been prepared with grateful assistance from Tohora Enterprises, TR Group and Mr Selwyn Rabbits (NZ Cranes). Acknowledgement must also go to our key stakeholder partners Police CVST and the CSB project steering group.
RELEASED U
NDER THE OFFIC
IAL INFORMATIO
N ACT 1982

WAKA KOTAHI NZ TRANSPORT AGENCY CSB IN-SERVICE TESTING REPORT // 5
Introduction
Cardan shaft park brakes (CSB), also known as driveshaft park brakes or transmission park brakes, are fitted as original equipment to many commercial vans, four-wheel drive vehicles and small passenger service vehicles (MB, MC & MD class), small to medium light trucks (NA & NB class), plus, a small number of heavy trucks (NC class) and heavy passenger service vehicles (ME class). They can also be fitted to other vehicles, including commercial and industrial vehicles such as telehandlers, forklifts and plant equipment.
CSB have been linked to a number of incidents where the vehicle has rolled away causing injury and damage - in three cases over the past decade the injuries have been fatal. The Coroner’s findings into one of these events recommended, “a review of the requirements and testing of park brakes is required” and that “a recommendation in relation to those issues may also raise public awareness of the safety issues”. Waka Kotahi NZ Transport Agency (Waka Kotahi) responded by commissioning two independent reviews to investigate any potential shortcomings to both legislation and in-service inspection of Heavy Motor Vehicle (HMV) park brakes. The summary of both reports was submitted to Waka Kotahi senior management in September 2019, indicating that CSB presents several challenges in operation and maintenance. There are approximately 55,000 NB class vehicles in service in NZ. NB class vehicles typically utilise a CSB. The risks posed due to poor maintenance of these brakes across such a large number of vehicles has led to Waka Kotahi taking action. Waka Kotahi introduced a park brake maintenance form (4085D) in December 2019. The form is used by a vehicle inspector where the park brake has failed a CoF test, or, where the vehicle inspector is not satisfied with the performance of the park brake or its components. The form is completed by a service provider to confirm the park brake had been maintained and is presented back to the vehicle inspector. A fatal incident in March 2020 has prompted Waka Kotahi to undertake an audit and review of in-service brake testing and performance in an effort to quantify and gain a better understanding of the issue.
Cardan Shaft Park Brake testing program
Key issues for current in-service CSB testing:
• Vehicles accepted for entry are those that have proven compliance with brake standards in one of the
jurisdictions recognised in NZ legislation. This means vehicles with CSB meet at least one of the
international standards required.
• The CoF test is the minimum performance requirement for a vehicle to meet the legislation for use on
New Zealand roads, but the test for CSB does not test the maximum conditions a vehicle is expected to
operate in. The stall test is widely used as it is the easiest to perform, however the technique may be
inadequate in testing the performance due to differing transmission:
o in a manual, the operator is asked to use an intermediate gear, this could be 2nd, 3rd, or 4th, all
of which produce a different result.
o in an automatic, there is no way to actually stall the engine as the transmission will slip, causing
rapid heat to build up that could damage the transmission.
o new technology has introduced AMT and Hill Start Assist (HAS) systems that are designed to
lock the service brakes to hold the vehicle - this means the clutch will not engage until the park
brake is released, therefore stall testing is very difficult.
• Traditional Roller Brake Machine (RBM) testing of CSB has an inherent danger as these brakes are not
designed to stop the vehicle while in motion - damage can occur if not correctly tested.
o However, some overseas jurisdictions do mandate an RBM test. This is where the vehicle is
placed on the roller bed and the brake applied, the rollers are then started, if the brake holds
the RBM rollers will reach the slip point and stall, a performance reading can then be obtained.
• The use of a 18% slope is limited as testing sites do not have suitable infrastructure.
• The use of a pull test (a test which is used to simulate testing on a gradient) requires specialised test
equipment and infrastructure that is not available at testing sites.
To meet brake standards, a vehicle fitted with a Cardan Shaft Brake (CSB) can be tested using one of the
following:
• ‘stall test’ method, where the vehicle is held by the park brake and an attempt is made to stall the
engine; or
RELEASED U
NDER THE OFFIC
IAL INFORMATIO
N ACT 1982

WAKA KOTAHI NZ TRANSPORT AGENCY CSB IN-SERVICE TESTING REPORT // 6
• the “hold test” method, where the vehicle is held by the park brake on a 18% gradient in both directions
while fully laden; or
• the “pull test” method, where the vehicle is held by the park brake and is connected to an anchor
vehicle via a strop and load cell then pulled using a force equivalent to 20% of its GVM.
The testing program was conceived by the Vehicle Standards team to simulate the requirements for a CSB to hold the vehicle on a slope in all conditions of loading. Full details of the procedures are covered in Appendix 1 (Operation Orders Transmission Park Brake Testing) and all vehicles were subjected to a “stall test” and a “pull test” in both directions. Each vehicle had the park brake applied using a digital scale (Figure 1) to a lever pull of 15 kilogram-force (kgf). Then the number of lever ratchet clicks was recorded and the vehicle stall tested to simulate a CoF inspection test. Each stall test was done in 3rd gear for manual transmissions and drive for automatic transmissions, although it must be noted the engine cannot be stalled because of torque converter slippage.
Figure 1: Components of the digital scale used during testing
Once the stall test had been completed, the vehicle was attached to an anchor vehicle and the pull force was applied to see if the CSB could withstand the pull applied - equivalent to being placed on a 18% slope with the brake applied. The vehicle was connected by 3000kg rated webbing strops through a calibrated digital 5000kg rated load cell (Figure 2) to a 5000kg hand winch so load could be applied (Figure 3) and tabulated.
Figure 2: Load cell used for testing
Figure 3: Hand winch used for testing
RELEASED U
NDER THE OFFIC
IAL INFORMATIO
N ACT 1982

WAKA KOTAHI NZ TRANSPORT AGENCY CSB IN-SERVICE TESTING REPORT // 7
Starting at the stall test settings, a target pull test force (20% of the vehicles GVM) was applied and the park brake unit observed. If the park brake unit moved before the target pull force had reached the calculated figure the force on the park brake lever was increased and the target pull force re-applied. This continued until the target pull force was achieved and the park brake unit held the vehicle. If the target pull test force was not achieved with the park brake lever at the travel limit of 5 extra ratchet clicks, or a lever force of 50kgf or more was required to move the lever, then the test was concluded. All results were recorded and the park brake performance analysed against the manufacturers specifications and settings (Cardan shaft park brake testing 2809-0810). Each driver was asked a range of questions prior to the conclusion of testing and this was included with the raw data.
Pre-testing initiative
In preparation for the full test program, on 10 September 2020 the Vehicle Standards and Safer Commercial
Vehicles teams carried out a pre-testing day in combination with NZ Police CVST at the Plimmerton Commercial
Vehicle Safety Centre (CVSC). Team members ran a testing sequence using a new vehicle supplied by
Hyundai NZ, with the aim being to ensure the procedures set out in the operation order were achievable,
repeatable and consistent in delivering the CSB program objective.
The procedures were carried out using the specialised equipment above and an anchor vehicle supplied by TR
Group. Each test procedure was refined and repeated throughout the day and team members were given
specific duties to ensure that test data could be consistently captured, and timings tested.
Full test program
The testing of CSB for the full program was done using a stall test and a pull test, and the aim was to simulate
the current testing regime for a CoF against the testing regime used by the vehicle manufacturer to comply with
the international standards that NZ accepts. Over an eight-day period, the Vehicle Standards team tested the
performance, in-service between CoF inspections, of ninety vehicles selected randomly as they passed through
the CVSC.
Each vehicle and its driver completed the testing procedure and questionnaire and the overall process was as
follows;
1. Vehicle directed into CVSC by Police, weighed and inspected to level 3 or 5 (compliance with rules and
regulations including Licence, RUC, TSL, Mass and Dimension and defects) and a Commercial Vehicle
Inspection Report (CVIR) generated.
2. Vehicle handed over to Waka Kotahi team members and the independent brake specialist to conduct
testing, collect details, and interview the driver (see exact questions below).
3. Stall test carried out at pre-determined settings.
4. Testing equipment connected and a pull test carried out using the stall test settings as a baseline,
followed by a range of force settings up to the pre-determined target kgf required to hold the vehicle
while fully laden at an 18% gradient, both forwards and backwards.
5. All results collected, collated and verified as correct for the vehicle being tested and a photo taken.
6. Vehicle handed back to driver with a CSB information sheet and a tread depth keyring.
Drivers questionnaire
1. Are you willing to help NZTA’s research?
2. Do you object to our engineer operating your vehicle?
3. Do you drive this vehicle regularly?
4. Are you aware of the type of park brake fitted to the vehicle?
5. Do you have any knowledge or experience with driveshaft mounted park brakes?
6. Are you aware that this type of type of parking brake should not be applied when the vehicle is in
motion?
7. Does the load change during the day?
8. How often is the load changed during the day?
9. Do you know when the last maintenance/adjustment of your park brake was?
10. Are you aware of any roll-away incidents or other park brake issues with this vehicle?
RELEASED U
NDER THE OFFIC
IAL INFORMATIO
N ACT 1982

WAKA KOTAHI NZ TRANSPORT AGENCY CSB IN-SERVICE TESTING REPORT // 8
Results
A total of 90 vehicles were tested representing seven manufacturers (Figure 4), configured in 13 different body
styles (Figure 5) and ranging from 3525kgs through to a GVM of 23,000kgs (Figure 6). All vehicles were fitted
with the drum brake version of CSB. The various body configurations were selected in an effort to cover as
many differing uses as possible. As CSB is fitted only to Asian sourced vehicles, these were the only
manufacturers selected for testing. Many of these vehicles are now equipped with driver aids such as air bags,
anti-lock braking (ABS), hill-start assistance (HAS) and traction control (TC), however there were none that
featured a full electronic braking system (EBS) (Figure 7).
The drivers of each vehicle tested were also asked a range of questions ranging from their knowledge of the
vehicle and its park brake system through to any issues they may have had with the CSB. A breakdown of
these questions is detailed in the charts below.
Key points from the results include:
• The largest represented manufacturer in the heavy vehicle fleet and also representative in the testing results was Isuzu (43%).
• 30% of vehicles tested (27/90) were fitted with ABS and nearly all of those vehicles had TC or HSA as part of the ABS control system (24/90).
• 80% of vehicles passed the current stall test.
• Almost 8% of vehicles could not be effectively stall tested as they had automatic or automated manual transmissions.
• The park brake eventually held on 72% of vehicles during the pull test in the forward direction (downhill) although one vehicle was so lightly loaded it started to skid.
• The park brake eventually held on 79% of vehicles during the pull test in the rearward direction (uphill).
• 66% of drivers were unaware of the type of park brake fitted to the vehicle they were driving.
• Over 60% of drivers had no knowledge or understanding of CSB.
• 66% of drivers were unaware that CSB should not be applied when the vehicle is moving.
• Almost 80% of drivers were unaware when the most recent park brake servicing had occurred.
• Over 70% of drivers had not encountered park brake issues, including a roll-away event, with the vehicle they were driving.
RELEASED U
NDER THE OFFIC
IAL INFORMATIO
N ACT 1982

RELEASED U
NDER THE OFFIC
IAL INFORMATIO
N ACT 1982

WAKA KOTAHI NZ TRANSPORT AGENCY CSB IN-SERVICE TESTING REPORT // 10
Figure 6: GVM range in Tonnes of vehicles tested
2
13
20
1110
18
10
42
0
5
10
15
20
25
3 4 4 5 5 6 6 7 7 8 8 9 9 10 10 15 15 23
No.
of vehic
les
GVM Range
GVM Range
RELEASED U
NDER THE OFFIC
IAL INFORMATIO
N ACT 1982

WAKA KOTAHI NZ TRANSPORT AGENCY CSB IN-SERVICE TESTING REPORT // 11
Figure 7: Driver Assistance Features
RELEASED U
NDER THE OFFIC
IAL INFORMATIO
N ACT 1982

WAKA KOTAHI NZ TRANSPORT AGENCY CSB IN-SERVICE TESTING REPORT // 12
Stall test in detail
The first series of tests was to carry out a stall test at a specified figure. Based on an average person’s
application of the lever, a force of 15kgf was placed perpendicular to and at 50mm from the head of the park
brake lever and the number of ratchet clicks counted. The chart below plots the percentage of vehicles where
the drum held stationary (passed), drum rotated (failed) and those unable to be stalled due to an automatic or
automated manual transmission being fitted.
• All vehicles with manual transmissions were tested in 3rd gear
• The average travel of the park brake lever was 7.6 clicks of the ratchet to achieve the 15kgf
• The lowest number of clicks was 3
• The highest number of clicks was 18
• The highest lever force was 48kgf (vehicle did not hold).
When comparing the stall test against the first pull tests in either direction using the same lever settings, the
results showed the pull test kgf figure was very low. In 69 of the 90 vehicles tested (76%) the figures show less
than half of the pull force required to hold the vehicle on a 1-5 gradient was produced.
To produce the target pull test kgf in either direction the park brake lever had to have;
• the travel increased on average 4 extra clicks
• the force increased to an average 22kgf.
RELEASED U
NDER THE OFFIC
IAL INFORMATIO
N ACT 1982

WAKA KOTAHI NZ TRANSPORT AGENCY CSB IN-SERVICE TESTING REPORT // 13
Pull test forward in detail
The second series of tests simulated the holding power of the brake with the vehicle being pull tested in a
forward direction (downhill if placed on a 18% slope), the target pull force represented 20% of the vehicles’
GVM. The base starting point was the same as used for the stall test. If the park brake drum rotated, the force
on the lever was increased and each additional click of the ratchet was recorded until the “drum held”. If the
drum did not hold at a total of 5 extra lever clicks or when a maximum of 50kgf was applied to the lever, the test
was stopped, and the result recorded as “drum rotated”. The chart below plots the percentage of vehicles where
the drum held stationary or the drum rotated.
The target pull force was not meet by 25 of the 90 vehicles (26.7%) and of the 64 (72.2%) vehicles where the
park brake has held, 25 (39%) required more than 3 extra clicks of the lever and 15 (23%) required more than
the average lever force.
• The highest lever travel was 22 clicks
• The highest lever force was 50+kgf
• 1 (1.1%) vehicle met the target pull force at the same setting as the stall test
• 16 (17.7%) vehicles met the target pull force at 1 extra click
• 22 (24.4%) vehicles met the target pull force at 2 extra clicks
• 23 (25.5%) vehicles met the target pull force at 3 extra clicks
• 1 (1.1%) vehicle failed to develop any pull force at full lever travel.
Note: one vehicle was too light on the rear axle and the tyres skidded resulting in an inconclusive test.
RELEASED U
NDER THE OFFIC
IAL INFORMATIO
N ACT 1982

WAKA KOTAHI NZ TRANSPORT AGENCY CSB IN-SERVICE TESTING REPORT // 14
Pull test rearward in detail
The third series of tests was to simulate the holding power of the brake with the vehicle being pull tested in a
rearward direction (downhill if placed on a 18% slope) - the target pull force represented 20% of the vehicles’
GVM. The base starting point was the same as used for the stall test; if the park brake drum rotated, the force
on the lever was increased and each additional click of the ratchet was recorded until the “drum held”. If the
drum did not hold at a total of 5 extra lever clicks or with a maximum of 50kgf applied, the test was stopped, and
the result recorded as “drum rotated”. The chart below plots the percentage of vehicles where the drum held
stationary or the drum rotated.
The target pull force was not meet by 19 of the 90 vehicles (21.1%) and of the 71 vehicles (78.9%) where the
park brake has held 29 (40.8%) required more than 3 extra clicks of the lever and 16 (22.5%) required more
than the average lever force.
• The highest lever travel was 22 clicks
• The highest lever force was 50+kgf
• 5 (5.5%) vehicles met the target pull force at the same setting as the stall test
• 15 (16.6%) vehicles met the target pull force at 1 extra click
• 15 (16.6%) vehicles met the target pull force at 2 extra clicks
• 24 (26.6%) vehicles met the target pull force at 3 extra clicks
• 1 (1.1%) vehicle failed to develop any pull force at full lever travel.
RELEASED U
NDER THE OFFIC
IAL INFORMATIO
N ACT 1982

WAKA KOTAHI NZ TRANSPORT AGENCY CSB IN-SERVICE TESTING REPORT // 15
Pull test - both directions in detail
The target pull force in both directions was achieved by 60 vehicles (66.7%), while 10 (11.1%) did not hold in
the forward direction and 4 (4.5%) did not hold in the rearward direction. The target pull force in both directions
was not met by 16 of the 90 vehicles (17.8%).
RELEASED U
NDER THE OFFIC
IAL INFORMATIO
N ACT 1982

WAKA KOTAHI NZ TRANSPORT AGENCY CSB IN-SERVICE TESTING REPORT // 16
Driver questionnaire in detail
Drivers were asked a range of questions about their knowledge and understanding of CSB, and the type of use
and loading the vehicle was subjected to during the working day. The range of questions and the responses are
depicted in the graphs below.
Question 1: 75% of drivers use the test vehicle regularly, while most of the drivers who don’t were made up of
new or temporary drivers.
Question 2: 67% of drivers are not aware of the type of park brake fitted to the vehicle they drive regularly,
while most of those who were aware had good knowledge.
Question 3: 70% of drivers had no knowledge or experience with CSB, while most of those who were aware
knew about its operation and any short comings.
RELEASED U
NDER THE OFFIC
IAL INFORMATIO
N ACT 1982

WAKA KOTAHI NZ TRANSPORT AGENCY CSB IN-SERVICE TESTING REPORT // 17
Question 4: 67% of drivers did not know the CSB could not be used as an emergency brake or while in motion,
while those who were aware had good knowledge.
Question 5: 77% of vehicles tested were subjected to load change during the working day, while those that
didn’t change were mostly dedicated units such as mobile plant, concrete pumps or service vehicles.
Question 6: Vehicle loads were changed on average 4.5 times a day.
RELEASED U
NDER THE OFFIC
IAL INFORMATIO
N ACT 1982

WAKA KOTAHI NZ TRANSPORT AGENCY CSB IN-SERVICE TESTING REPORT // 18
Question 7: 77% of drivers were unaware of when the CSB was last maintained or adjusted while most of
those that were aware could not say when it was done.
Question 8: 72% of drivers were not aware of any park brake issues in the vehicle they were driving, while
those that were knew of issues ranging from the brake not holding the vehicle when parked through to
experiencing a full runaway incident.
RELEASED U
NDER THE OFFIC
IAL INFORMATIO
N ACT 1982

WAKA KOTAHI NZ TRANSPORT AGENCY CSB IN-SERVICE TESTING REPORT // 19
Statistical analysis
The data collected from the CSB testing was reviewed by Alistair Gray of Statistics Research Associates
Limited (StatsResearch). The full report is included in Appendix 2.
The main reason for engaging independent statistical advice was to get some assurance that the testing method
and results were statistically robust and suitably representative of the fleet. The below graph shows a
comparison of the overall fleet with the vehicles tested, in terms of vehicle make. From this perspective the
testing provides a good representation of the fleet. The report from StatsResearch also indicated that the
method for selecting vehicles was suitably random, although a greater geographic spread would have been
preferable if resourcing had allowed.
Based on the data from the testing, a failure rate of 27% can be estimated for the entire fleet based on the pull forward test (with a 95% confidence interval (18%, 36%)) and a failure rate of 21% (95% confidence interval (14%, 30%)) can be estimated for the pull rearward test.
In terms of the comparison between the pull test and the stall test, the report concluded that on average, the pull
test forward required on average 4 more clicks of the handbrake lever than that required for the stall test. This
increased to 5 more clicks for the rearward test.
RELEASED U
NDER THE OFFIC
IAL INFORMATIO
N ACT 1982
WAKA KOTAHI NZ TRANSPORT AGENCY CSB IN-SERVICE TESTING REPORT // 20
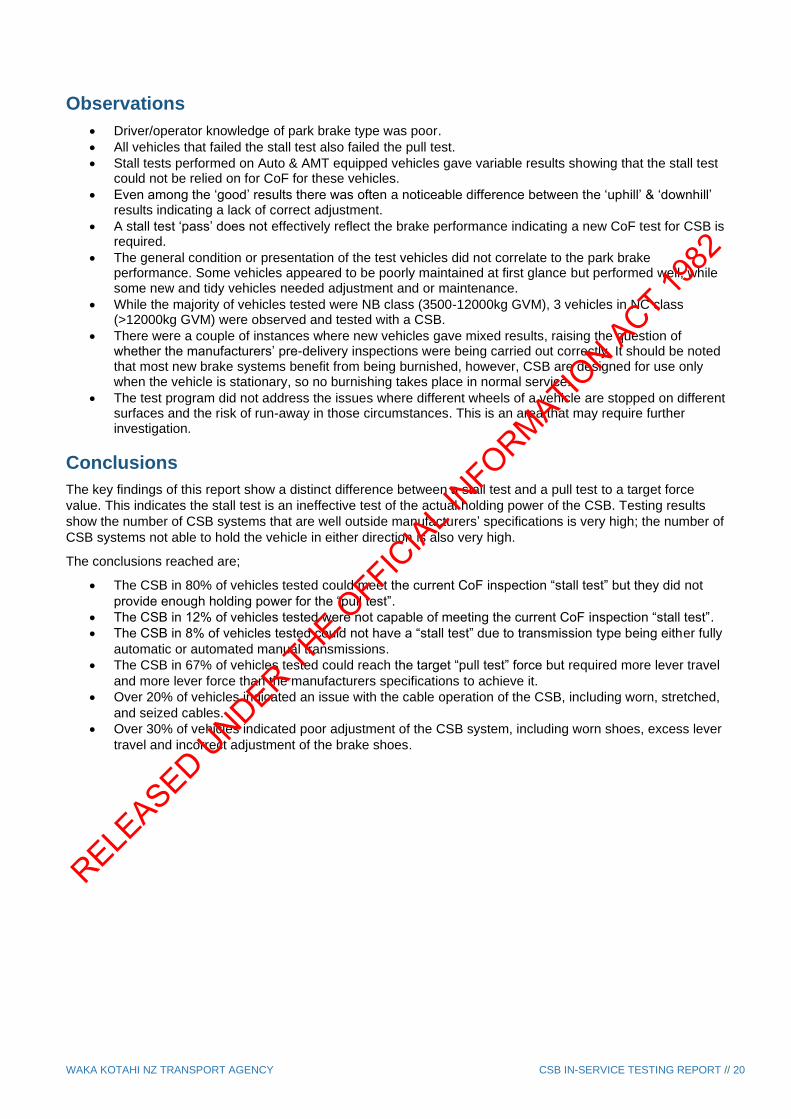
Observations
• Driver/operator knowledge of park brake type was poor.
• All vehicles that failed the stall test also failed the pull test.
• Stall tests performed on Auto & AMT equipped vehicles gave variable results showing that the stall test could not be relied on for CoF for these vehicles.
• Even among the ‘good’ results there was often a noticeable difference between the ‘uphill’ & ‘downhill’ results indicating a lack of correct adjustment.
• A stall test ‘pass’ does not effectively reflect the brake performance indicating a new CoF test for CSB is required.
• The general condition or presentation of the test vehicles did not correlate to the park brake performance. Some vehicles appeared to be poorly maintained at first glance but performed well, while some new and tidy vehicles needed adjustment and or maintenance.
• While the majority of vehicles tested were NB class (3500-12000kg GVM), 3 vehicles in NC class (>12000kg GVM) were observed and tested with a CSB.
• There were a couple of instances where new vehicles gave mixed results, raising the question of whether the manufacturers’ pre-delivery inspections were being carried out correctly. It should be noted that most new brake systems benefit from being burnished, however, CSB are designed for use only when the vehicle is stationary, so no burnishing takes place in normal service.
• The test program did not address the issues where different wheels of a vehicle are stopped on different surfaces and the risk of run-away in those circumstances. This is an area that may require further investigation.
Conclusions
The key findings of this report show a distinct difference between a stall test and a pull test to a target force
value. This indicates the stall test is an ineffective test of the actual holding power of the CSB. Testing results
show the number of CSB systems that are well outside manufacturers’ specifications is very high; the number of
CSB systems not able to hold the vehicle in either direction is also very high.
The conclusions reached are;
• The CSB in 80% of vehicles tested could meet the current CoF inspection “stall test” but they did not
provide enough holding power for the “pull test”.
• The CSB in 12% of vehicles tested were not capable of meeting the current CoF inspection “stall test”.
• The CSB in 8% of vehicles tested could not have a “stall test” due to transmission type being either fully
automatic or automated manual transmissions.
• The CSB in 67% of vehicles tested could reach the target “pull test” force but required more lever travel
and more lever force than the manufacturers specifications to achieve it.
• Over 20% of vehicles indicated an issue with the cable operation of the CSB, including worn, stretched,
and seized cables.
• Over 30% of vehicles indicated poor adjustment of the CSB system, including worn shoes, excess lever
travel and incorrect adjustment of the brake shoes.
RELEASED U
NDER THE OFFIC
IAL INFORMATIO
N ACT 1982

WAKA KOTAHI NZ TRANSPORT AGENCY CSB IN-SERVICE TESTING REPORT // 21
Recommendations
A range of initiatives may be required to address the issues borne out of this CSB testing program. The
recommendations below could be used in isolation or in a combination, and in no particular order they are;
• The current CoF inspection CSB test for entry and in-service operation is ineffective - a new CSB testing procedure should be investigated.
o A roller brake machine test of CSB should be investigated. The two major RBM suppliers have differing views on using their equipment in this manner and that needs to be discussed directly with both principals.
o An alternative winch test using the “pull test” method should be investigated. o Requiring a 18% slope to be available should be investigated. o Any new CoF test must be achieved in both directions with the vehicle in a laden state either
through load carried or through load simulation.
• Raise awareness of CSB operation, maintenance and adjustment with service providers, operators and drivers. Options include;
o Including information in the Road Code o Including questions in Driver Licence information and tests. o Including CSB information as a requirement for training within the OEM/Dealer/reseller/hirer
networks. This class of vehicles typically have frequent weight changes (e.g. tipper trucks, water cartage, building supplies, waste carting) which can increase the risks associated with CSB. This needs to be communicated to vehicle users.
o An information sheet signed for by the purchaser of a CSB vehicle on delivery. o A mandatory specific maintenance requirement statement produced for CoF inspection
(e.g.4085D form). o Including warning labels in vehicles with CSB. For new vehicles and used imports these could
be fitted by the OEM or dealer, for existing vehicles these could be fitted at CoF and service provider outlets.
• Chocks could be useful in a two-person operation where the service brake can be operated while the chocks are removed but potentially dangerous for a lone operator. Waka Kotahi needs to take a firm position on the use of wheel chocks and advise accordingly. This includes aligning messaging with other Government agencies.
• Co-operate with other relevant regulatory agencies and industry bodies who assist vehicle operators to achieve compliance with other requirements such as those relating to health and safety at work.
• Investigate alternative park brake systems for fitment to vehicles with CSB. USA and European
manufactured vehicles in this GVM class do not use a CSB, they instead opt for a wheel operated park
brake, typically this is a spring brake chamber acting directly on the service brake. Note: It needs to be
noted that these jurisdictions do not ban CSB use and they import many thousands of Asian sourced
vehicles with CSB in the same manner as both Australia and NZ.
• Investigate a change to the importation of vehicles fitted with CSB including testing requirements. It
should be noted this will not address the approximately 55,000 vehicles currently in use throughout the
NZ fleet.
RELEASED U
NDER THE OFFIC
IAL INFORMATIO
N ACT 1982

WAKA KOTAHI NZ TRANSPORT AGENCY CSB IN-SERVICE TESTING REPORT // 22
APPENDIX 1: OPERATION ORDER TRANSMISSION PARK BRAKE TESTING
OPERATION ORDER
TRANSMISSION PARK BRAKE TESTING
WAKA KOTAHI NZ TRANSPORT AGENCY – VEHICLE STANDARDS
16 SEPTEMBER 2020
FINAL
Background
1. Transmission park brakes, commonly known as a Cardan Shaft park brake (CSB), have been linked to a number of incidents where the vehicle has rolled away causing injury and damage, in three recent cases the injuries have been fatal.
2. The Coroner’s findings into one of the events recommended, “a review of the requirements and testing of park brakes is required” and that “a recommendation in relation to those issues may also raise public awareness of the safety issues”.
3. Waka Kotahi NZ Transport Agency (Waka Kotahi) responded by commissioning two independent reviews to investigate any potential shortcomings in both legislation and in-service inspection of HMV park brakes.
4. The summary of both reports was submitted to Waka Kotahi senior management in September 2019 and indicated that CSB present several challenges in operation and maintenance. There are approximately 50,000 NB vehicles in service in NZ. NB class vehicles typically utilise a CSB. The risks posed due to poor maintenance of these brakes across such a large number of vehicles led to Waka Kotahi taking action.
5. Waka Kotahi introduced a park brake maintenance form (4085D) in December 2019. The form is used by a vehicle inspector where the park brake has failed a CoF test, or, where the vehicle inspector is not satisfied with the performance of the park brake or its components. The form is used by a service provider to confirm the park brake had been maintained and is presented back to the vehicle inspector.
6. Another incident prompted Waka Kotahi to undertake an audit and review of in-service brake testing in an effort to investigate other options for testing of CSB systems.
Operation scope
7. This operation is a combined Waka Kotahi/NZ Police Commercial Vehicle Safety Team (CVST) effort. 8. The operation involves parties from both Waka Kotahi, CVST and independent brake specialists (where
required). 9. The aim of this operation is to inspect and test up to 100 NB class (3500 – 12,000Kg GVM) heavy motor
vehicles fitted with a CSB. 10. The operation is set to take place during mid to late September 2020. 11. The operation will be run at the Waka Kotahi/CVST Commercial Vehicle Safety Centre located in
Plimmerton, Wellington. 12. The operation, dependent on CVST operational requirements, will be conducted at either side of the
site. Northbound may produce more loaded vehicles, while southbound will interfere less with daily operations but may have more unladen vehicles.
13. Prior to the commencement of testing, a surface friction test has been carried out at all testing sites by a member of the Police serious crash unit using a surface friction measuring device mounted to a patrol vehicle. Both sites were measured at 0.79u Dry, 0.65u Wet.
RELEASED U
NDER THE OFFIC
IAL INFORMATIO
N ACT 1982

WAKA KOTAHI NZ TRANSPORT AGENCY CSB IN-SERVICE TESTING REPORT // 23
14. A site safety induction will be conducted prior to the operation by a member of CVST, the site safety officer will also be a member of CVST. All participants must have the minimum PPE of a Hi-Vis jacket and Safety boots.
15. A safe testing area will be set up and separated from normal traffic flow using 900mm road cones (see appendix 1).
16. Vehicles will be stopped using the “ALL TRUCKS STOP” signs located prior to the entry of each site. 17. Vehicles will be directed over the weighbridge and inspected by a member of CVST. 18. Vehicles will be screened by a member of Waka Kotahi, if identified as a CSB vehicle, then directed to
the testing area and tested according to the testing procedure (see appendix 1). 19. If resource allows, it may also be useful to collect data on the number of NB class vehicles which pass
the testing station and are not tested. This will provide data on the ratio of total vehicles assessed.
Distribution list
NZTA Police CVST Independent Specialists
Neil Cook Deputy General Manager – Regulatory Services Mark O’Connor Project Manager Michael Aitken Senior Manager Policy and Planning Davey Uprichard Manager Vehicles Team Robbie Stephen Senior Engineer Neil McAlpine Vehicle Specialist Alex Currie Senior Engineer
Inspector Mike Brooklands Senior Sgt Mike Moloney Senior Sgt Aaron Bunker Sgt Tim Walker Const. Rob Keen VSO Calvin Haycock
Steve Bullot Tohora Enterprises Doug Latto Brake Specialist John Long Brake Consultant Selwyn Rabbits NZ Crane Hire MTA HV advisor Mark Ngatuere RTF Alan Raynor VTNZ Alistair Gray – StatsResearch
Legislation
Current legislation pertaining to heavy vehicle brake testing is contained in the Land Transport Act 1998 (LTA), the Land Transport Rule Vehicle Standards Compliance 2002 (VSCR) and the Land Transport Rule Heavy Vehicle Brakes 2006 (HVBR). As New Zealand does not have a heavy vehicle manufacturing industry it is a technology taker, drawing on similar jurisdictions for motor vehicles standards. Both the VSCR and HVBR use aspects of UN/ECE regulation 13, ADR 35, FMVSS 105 & 121 and Japan Technical standards for heavy vehicle brakes. Each of these standards set out rigorous and sustained testing parameters for brake systems including park brake systems that a vehicle must meet. The standards do not stipulate the in-service inspection requirements for the park brake testing. The HVBR recognises and accepts those standards and also sets out standards for vehicles built prior to the Rule introduction in 2006 as well as those for a combination of vehicles, and those for modification and repairs carried out in NZ at any time after the vehicle was first registered in NZ. In all jurisdictions that NZ recognises, the in-service testing is set by the regulator as it would be impractical to repeat the same degree of testing that is required to meet the standard, thus NZ uses the Vehicle Inspection Requirements Manual (VIRM), supplemented by the Heavy Vehicle Brake Testing Protocol. Key Service Delivery Partners (KSDPs) are appointed to carry out brake testing as required by the VIRM and protocol. The in-service (CoF) test for a park brake is dependent on design and is either;
• A roller brake machine (RBM) test in which the brake must obtain 20% efficiency at 60% or more of the axle GVM, or
• A slope test of 18% in which the brake must hold the vehicle in forward and reverse direction at up to its GVM, or
• A stall test in which the vehicle must not move using an intermediate gear. The use of an RBM for CSB testing is considered impractical as CSB systems are not designed or constructed to bring the vehicle to a stop while in motion and damage may occur to the vehicle or the RBM. The slope test is impractical in most locations as there are no 18% slopes close to the KSDP sites; to have a slope on site would require major investment. The use of the stall test is the most common method used by KSDP’s for CSB CoF inspections.
RELEASED U
NDER THE OFFIC
IAL INFORMATIO
N ACT 1982

RELEASED U
NDER THE OFFIC
IAL INFORMATIO
N ACT 1982

RELEASED U
NDER THE OFFIC
IAL INFORMATIO
N ACT 1982

WAKA KOTAHI NZ TRANSPORT AGENCY CSB IN-SERVICE TESTING REPORT // 26
Testing equipment
1. An NC class 6X4 heavy motor vehicle with a Tare weight of approx. 8t equipped with a certified draw-
beam or a suitable alternative to act as an anchor point.
2. A hand powered recovery type winch rated to a minimum of 5000kg capacity.
3. A digital load cell capable of reading a pull force up to 3000kg/f or equivalent suitable for mounting in-
line with the winch and pull test equipment, the display of which must be in 10kgf increments and be
visible to the operator.
4. A digital load cell capable of reading a pull force up to 100kg/f or equivalent suitable for mounting at
50mm from the forward end of the park brake lever, the display of which must be in 1kgf increments and
be visible to the operator.
5. Recovery type strops, cables or rope that are in good condition and rated to a minimum of 3000kg
breaking strain.
6. Other equipment as may be required to make safe connections between the test vehicle and anchor
vehicle. This equipment must also be in good condition and rated to 3000kg breaking strain.
Testing procedure
1. Vehicles will be directed into the safety centre with the use of the “ALL TRUCKS STOP” signs (section
125(4) of the Land Transport Act 1998).
2. A CVST officer will be the only person to engage with the driver in the first instance and direct the driver
over the weighbridge.
3. The vehicle will be screened by a Waka Kotahi member to determine if it is an NB class vehicle fitted
with a CSB park brake.
4. The CVST officer will direct the vehicle to the test area (only one vehicle is to be positioned in the
testing area until the site is cleared).
5. The CVST member will carry out a Level 3 inspection, the details are to be noted on a Commercial
Vehicle Inspection Report (CVIR see appendix 5).
6. While the CVST officer is conducting the inspection, if it is safe to do so, the Waka Kotahi Vehicle
Specialist (VS) will carry out a visual inspection of the park brake system noting any issues, photos may
be taken where necessary.
7. Once the CVIR is completed the vehicle will be handed over to the Waka Kotahi member collecting the
brake test data;
o The driver will be asked if they have any objection to a designated Waka Kotahi member
operating the vehicle for testing procedures.
o If there is a legitimate reason for refusing, the test may be abandoned, or an alternative
arrangement made.
o The vehicle details will be collected on the data sheet, and
o The driver will be asked to answer the questionnaire (appendix 2a).
8. The vehicle is to be positioned in line with the test rig and facing forward, noting any service brake
issues.
9. The brake test specialist will connect the testing equipment and select the target test pull force from the
table in Appendix 3.
o The park brake lever digital load cell will be connected to the hand brake lever at approx. 50mm
from the forward end of the lever. The display must be visible to the driver or observer while
operating the park brake.
o The pull test load cell and equipment will be connected to the most suitable connection point on
the chassis, preferably a factory tow connection. The display must be visible to the winch
operator or an observer using a remote display.
o If no suitable chassis connection can be found an alternative may be used, the connection must
be verified as suitable by a Waka Kotahi VS or a CVST Vehicle Safety Officer (VSO).
10. The park brake lever will be applied with a 15kg lever force, noting the number of clicks of the ratchet.
The vehicle will be stall tested in a forward direction using 3rd gear, or drive (if automatic).
o If the vehicle moves after any driveline lash is taken up, another click on the lever will be
applied and the vehicle stall tested again.
o Continue above until the vehicle stops or the maximum number of clicks set by the
manufacturer is achieved.
o Note the lever force readings at each click and results on data sheet.
11. The park brake lever is to be released, the park brake unit is to be marked with a chalk line to indicate
movement relative to the mounting and then the lever reapplied with a 15kg lever force, noting the
number of clicks of the ratchet.
RELEASED U
NDER THE OFFIC
IAL INFORMATIO
N ACT 1982

WAKA KOTAHI NZ TRANSPORT AGENCY CSB IN-SERVICE TESTING REPORT // 27
12. The VS or VSO must observe the park brake unit for movement while the target pull test force is
applied using the hand winch. Care must be taken to ensure the force is maintained as the vehicle may
move slightly on its suspension or through driveline lash.
The pull force must be applied evenly and smoothly to avoid excessive movement or bouncing
of the vehicle and test equipment.
o The pull test equipment should be reasonably horizontal to the pavement so that no excessive
lift-up or pull-down forces are present.
o If, during any testing, deformation of the vehicle connection points becomes visible the test will
be stopped and an alternative connection used.
13. If the park brake unit is stationary;
a) Hold the pull test force for 1 minute ensuring the force does not decrease.
b) If the park brake unit remains stationary, apply an additional 10% of the test pull figure and note the
figure on the data sheet.
c) If the park brake unit remains stationary, repeat steps 11, 12, 13 a) and b) in the reverse direction.
d) If the park brake unit is stationary for all tests record the results on the data sheet, disconnect the
test equipment, hand the vehicle back to the driver with an information pack, place a sticker on the
windscreen and clear the vehicle from the test area.
14. If the target pull test force is not reached and the park brake unit moves during steps 11 and 12;
a) Note the pull test force achieved, then increase the force to the park brake lever to move it one click
of the ratchet and note the lever force reading. Re-apply the pull test force.
b) If the park brake unit moves, repeat a), one click at a time up to a MAX of 5 additional clicks on the
ratchet or MAX 50kg/f, note the lever force at each additional click.
c) If the park brake unit remains stationary at any point in b) hold the pull test force for 1 minute.
d) If the park brake unit remains stationary, repeat steps 11, 12, 13, and 14 a) if required in the reverse
direction.
e) If the park brake unit moves during any of the tests in reverse repeat 14 b).
f) If the park brake unit remains stationary in reverse at any point in step 14 b) hold the pull test force
for 1 minute.
g) Record all results on the data sheet. Disconnect the test equipment, hand the vehicle back to the
driver with an information pack, place a sticker on the windscreen and clear the vehicle from the
area.
15. If the park brake unit continues to move in forward or reverse direction after step 14 b);
a) The driver will be advised the vehicle has a very poor park brake performance and it should be
attended to immediately, the test equipment is to be removed.
b) The CVST officer may give a compliance notice to the driver if they believe the vehicle is not up to
CoF standard.
c) The driver will be handed the information pack and the vehicle cleared from the test area.
d) Ensure all results are recorded on the data sheet and the questions are complete.
16. If the vehicle moves in forward or reverse direction during any of the procedures described above and
the wheels are skidding on the test surface;
a) The test is to be suspended, the test equipment removed, the driver given the information pack and
the vehicle cleared from the test area.
b) Ensure all results are recorded on the data sheet and the questions are complete.
All vehicles tested where the park brake unit has held the vehicle stationary will have a sticker attached to the
left-hand corner of the front windscreen to ensure it is not tested again during the operation.
Incomplete Criteria
1. Where a vehicle moves but the wheels are skidding with the manufacturer’s lever force, the vehicle may
not have enough load for a conclusive test (if possible, retest with more load).
2. Where a vehicle moves but the wheels are skidding with any other lever force up to the maximum of 5
extra clicks or 50kg lever force, the vehicle may not have enough load for a conclusive test (if possible,
retest with more load).
3. Where a park brake unit moves during a test but during the following test the wheels skid, the vehicle
may not have enough load for a conclusive test (if possible, retest with more load).
RELEASED U
NDER THE OFFIC
IAL INFORMATIO
N ACT 1982

WAKA KOTAHI NZ TRANSPORT AGENCY CSB IN-SERVICE TESTING REPORT // 28
Appendix 2 – Questionnaire and Data Capture Check Sheet
The first questions for the driver will need to confirm their agreement to:
• Have someone else sit in the cab during testing (in order to get consistency for the lever force)
• Have a force applied to both the front and the rear of the vehicle
Note: Through the CVIR the following information is automatically collected:
• Day/Date/Time
• Location
• Driver licence no.
• Driver name
• Class and endorsements
• Transport Service Licence information:
• Vehicle Registration number
• Make
• Model
• Year
• Vehicle licence expiry date
• Registered owner
• Vehicle licence type
• CoF expiry data
• Hubodometer Reading
RELEASED U
NDER THE OFFIC
IAL INFORMATIO
N ACT 1982

WAKA KOTAHI NZ TRANSPORT AGENCY CSB IN-SERVICE TESTING REPORT // 29
APPENDIX 2: STATISTICS RESEARCH ASSOCIATES FULL REPORT
Note: the supporting graphs and datasets referenced in this report are available on request
Cardan Shaft Brake Testing by NZTA
Summary of Design and Initial Analysis
Alistair Gray,
Statistics Research Associates Limited
November 2020
Sample size calculation
Initially the requirement was to estimate the proportion of trucks which failed the braking
tests: a stall test, a pull forward test, and a pull rearward test. As there was not much
information about the approximate size of these failure rates in the population, it was decided
to take a two-stage approach to the sampling. The first stage would be a small sample to
estimate likely failure rates and their variability, and then from these sample estimates
calculate a sample size which would achieve the required accuracy. For example, estimate a
failure rate of 10%, with a 95% confidence interval (5\%, 15\%).1
As well as considering the statistical cost, i.e. how accurately do we need to estimate the
failure rate, the economic cost of doing the brake testing needs to be considered and how
much can be afforded. This suggested an upper bound on the sample size of around 100.
The sheet Proportion of Failures in the spreadsheet twostagesampling.xlsx has two tables
one for an initial sample of 30, the other for an initial sample of 50 which give the sample
sizes required for a range of failures for a specified coefficient of variation (cv).2 The cells in
red are sample sizes larger than the 100 which could be afforded. The cells in yellow indicate
that the initial sample size is large enough.
In that sheet there are also two tables giving the 95% confidence intervals3 for a range of
failure rates for a sample size of 30, and a sample size of 100.
Subsequently it was decided that in addition to simple failure rates a distribution of force
applied to failure rate should be estimated, say the mean force, and standard deviation of the
force. In the absence of further population information about the distribution a useful starting
point is to assume that this mean force to failure follows a Weibull distribution.
1 The method is described in Cochran SamplingTechniques 3rd edition 1977 John Wiley and Sons pages 78-80. 2 The sample error divided by the sample mean. 3 These are Jeffreys non-informative prior intervals, one of the ‘exact’ binomial confidence intervals and not the more usual normal approximation intervals because the failure rates could be small and the sample sizes are small. As the population of trucks is around 50,000 the sampling is assumed to be binomial rather than say hypergeometric.
RELEASED U
NDER THE OFFIC
IAL INFORMATIO
N ACT 1982

WAKA KOTAHI NZ TRANSPORT AGENCY CSB IN-SERVICE TESTING REPORT // 30
It has two parameters: scale and shape. Scale determines the values over which the
distribution has a positive probability. As scale increases the maximum probability decreases
and the values of positive probability increase. The shape as the name suggest determines
the shape of the distribution. If the shape is greater than 1 then it means the failure increases
as x increases. This seem sensible in the case of the brakes where presumably increasing
force leads to increasing failure. A location parameter can also be used to define the
distribution, but that is equivalent to relabelling the x-axis. For example, if the force applied
begins at say 2 kiloNewtons we could relabel the x-axis in a graph of the distribution as
starting at 2 instead of 0. Interestingly the population cv does not depend on the scale
parameter.
The graphs (Weibullcdf.pdf) show the cumulative distribution function of Weibull distributions
for various shape parameters. The y-axis is the proportion of trucks and the x-axis is the force
at which the brake fails. The graph for shape of 1 suggests that some trucks fail with almost
no force, while at least 50% fail (the median force to failure) with a relatively small force of .6.
Whereas 90% fail with a force of around 3 about 5 times the median force to failure. (The unit
for the force is arbitrary. I have labelled them 1, 2, 3 etc for illustrative purposes.) This does
not seem that plausible. Considering the curvature of these graphs of the cumulative
distribution function of Weibull distributions it is likely a shape in the range 1.7 to 2.3 is quite
plausible.
Once an accuracy requirement for the estimate is set, it is the cv that determines the sample
size. Hence having decided on a set of plausible force to failure shapes we need to know
what their cvs are. The graph WeibullCV.pdf plots the cv for various shapes. In the range 1.7
to 2.3 the cv decreases from about 0.60 to about 0.45. This is a reasonably narrow range.
The sheet mean force to failure in the spreadsheet twostagesampling.xlsx provides the
sample sizes for various population cvs and relative errors. If the cv is between 0.4 and 0.6
then a relative error of around 10 percent could be achieved for sample sizes around 100 or
less. These are the yellow highlighted cells.
However, because of practical issues with measuring a continuous force applied, force was
going to be applied at discrete intervals, and the number of clicks on the brake lever to hold
the force observed. Hence how to determine the sample size reverted to the first approach
outlined above.
Sample versus Population
For economic cost reasons the sampling of trucks could only be carried out at one site, the
Plimmerton Weigh Station. The sampling was carried out over two weeks. A common
method of sampling traffic, vehicles or people, is to use a systematic random sample. Here
the first vehicle is randomly selected as it passes the sampling point. If say based on
previous traffic counts, it is expected N vehicles will pass the sampling point and n vehicles
are required to be sampled, then we calculate a sampling interval k, which is the integer part
of N/n. After the first vehicle we then then count k vehicles and sample the kth one. We do
this until we have until we have n vehicles. For example, if 632 vehicles are expected to go
past and we need to sample 10 of then N/n = 6.32 and k = 6, so we sample every 6th vehicle
thereafter. Of course, we may get more or less than 10 depending on whether more or less
than around 600 vehicles pass by while we are sampling.
RELEASED U
NDER THE OFFIC
IAL INFORMATIO
N ACT 1982

WAKA KOTAHI NZ TRANSPORT AGENCY CSB IN-SERVICE TESTING REPORT // 31
However, for practical reasons including not having a line of trucks waiting to be tested, the
sampling was not strictly a systematic random sample. Rather the sampling with the
sampling interval is approximately random in time as an eligible truck is stopped when an
earlier truck has completed the testing. By the end of the two weeks 90 trucks were tested.
Comparing the characteristics of the trucks in the sample with those in the population is
sensible to see that no imbalances have occurred which might lead to incorrect inferences.
For example, if say a particular make of truck was more prone to brake failure and this truck
was underrepresented in the sample compared with the population then we might infer that
the population failure rate is smaller than is really is.
Ideally one would have compared several characteristics which could affect brake failure,
such as age of truck, time since CoF, New Zealand new, etc. But in the time frame I could
look at only model type.
The sheet Sample v Fleet in the spreadsheet brakedata output.xlsx gives tables of the makes
in the Fleet (Population) and the sample. Since the sample was small, I collapsed some of
the Fleet make categories as indicated in the column makef. For the sample data I have
calculated the expected number of each make if the Fleet proportions held in the sample. I
did a simple chi-squared test which indicated the make distribution in the sample was not
different from that in the Fleet.
Data Analysis
Failure estimates
The sheet Stall and Pull Test results in the spreadsheet brakedata output.xlsx gives summary
results from the 3 main tests: a stall test, a pull forward test, and a pull rearward test.
The stall test cannot be used on trucks which have automatic gearboxes. There were 7 such
trucks as indicated by the column <NA> in the stall test table. The estimate of the proportion
of trucks in the Fleet which would roll is 13% with a 95% confidence interval of (7%, 22%).
For the pull forward test one truck skidded but did not roll. If we consider only rolling a failure
then the Fleet estimate is 27% with a 95% confidence interval of (18%, 36%). But if we
include skidding as a failure then it is 28% (19%, 38%).
For the pull rearward test, the Fleet estimate is 21% (14%, 30%).
Although the estimate of failure rate for the pull rearward test is smaller than the pull forward
test, the respective confidence intervals overlap, so with this sample size we cannot be
confident there is a difference.
The overall mechanical condition of the brake was assessed and assigned to a five-point
Likert scale from Excellent to Poor. Collapsing the Excellent, Very Good and Good into a
PASS category, and regarding Fair as MARGINAL and Poor as a FAIL, the Fleet estimate of
FAIL is 47% (37%, 57%).
RELEASED U
NDER THE OFFIC
IAL INFORMATIO
N ACT 1982

WAKA KOTAHI NZ TRANSPORT AGENCY CSB IN-SERVICE TESTING REPORT // 32
Regression
The dataset is rich and worthy of further analysis. I carried out some exploratory data
analysis and discussed this with Alex Currie and Mark O’Connor from NZTA. Given the
apparent higher failure rates of the pull tests compared with the stall test, they were
interested in the relationship between the number of clicks to engage the brake for the stall
test and the pull test.
The graph pftVdstClicks.pdf is a scatterplot for each make of the number of clicks for the stall
test against the number of clicks for the pull forward test. There is a graph for each make.
There are too few trucks for the Hyundai, Mazda, and Other makes to say much about them.
The x-axis of each graph is the number of clicks (PB setting) on the brake lever used in the
stall test. For most trucks this was the initial setting taken from the truck’s manual. But for
some trucks a higher setting was also used. There was a target pull force for the pull forward
test. Generally, this force was attained by increasing the force to this target level through
several stages. The number of clicks were recorded at each incremental change in force. The
y-axis is the number of clicks at this target, or close to it, except if the truck rolled or stalled at
an earlier stage and then the number of clicks at this stage is used. A non-robust simple
regression line
pullforwardtest.clicks ~ intercept + stalltest.clicks
overlays the set of points
For both sets of graphs, each make with more than a few observations, follows a straight line
quite well. In the pull forward graph there is a fairly obvious outlier for the Isuzu, Fuso, and
Nissan makes. In the pull rearward graph the Fuso outlier is obvious but no others.
Similar comments hold for the scatterplots prtVdstClicks.pdf for the stall test against the pull
rearward test. In the pull rearward graph the Fuso outlier is also obvious but no others.
I fitted two linear regressions:
pullforwardtest.clicks ~ intercept + stalltest.clicks + make + stalltest.clicks : make
and
pullrearwardtest.clicks ~ intercept + stalltest.clicks + make + stalltest.clicks : make
This means I am fitting a separate regression line for each make, so the lines could have
different intercepts and slopes. This is essentially what the graphs are displaying.
We do not have a large enough sample for each make to distinguish differences in the slopes
for the different makes, but there are differences in the intercepts as a stepwise regression
shows. That is the reduced model
pullrearwardtest.clicks ~ intercept + stalltest.clicks + make
RELEASED U
NDER THE OFFIC
IAL INFORMATIO
N ACT 1982

WAKA KOTAHI NZ TRANSPORT AGENCY CSB IN-SERVICE TESTING REPORT // 33
fits better. This model says the slope of the line is the same for each make of truck, but the
intercept term is potentially different. If the variability remained the same, we would need to
have about 3 times the sample size to see if the slopes were significantly different by make.
The details of the regression output are in the sheet Click regression in the spreadsheet
brakedata output.xlsx. The output for full model is given first then the output for the reduced
model.
In summary what the regressions are saying is:
1. To hold the pull forward test on average we need 4 more clicks than the stall test (the
intercept estimate) but this could be more or less by make. For example, Isuzu trucks
need about 1.4 clicks on average less (the make Isuzu estimate), or only about 2.6
clicks to hold. Thereafter for each stall test click 1 pull test forward click is needed (the
stalltest.clicks estimate) for any make.
2. To hold the pull rearward test on average we need 5 more clicks than the stall test but
again this could be more or less by make. Thereafter for each stall test click a little less
than 1 pull test forward click is needed.
3. Generally, Isuzu, Nissan, and Toyota need fewer clicks than other makes.
The interpretation of these results would be that holding the brake at the number of clicks to pass the stall test
does not guarantee that the brake will hold the pull tests.
RELEASED U
NDER THE OFFIC
IAL INFORMATIO
N ACT 1982