Ozone Monitoring Instrument spectral UV irradiance products: comparison with ground based...
10
Atmos. Chem. Phys., 9, 585–594, 2009 www.atmos-chem-phys.net/9/585/2009/ © Author(s) 2009. This work is distributed under the Creative Commons Attribution 3.0 License. Atmospheric Chemistry and Physics Ozone Monitoring Instrument spectral UV irradiance products: comparison with ground based measurements at an urban environment S. Kazadzis 1,2 , A. Bais 2 , A. Arola 3 , N. Krotkov 4 , N. Kouremeti 2 , and C. Meleti 2 1 Finnish Meteorological Institute, Research and Development, Helsinki, Finland 2 Laboratory of Atmospheric Physics, Aristotle University Thessaloniki, Greece 3 Finnish Meteorological Institute, Research and Development, Kuopio, Finland 4 Goddard Earth Sciences and Technology Center, University of Maryland, Baltimore County, Baltimore, Maryland, USA Received: 8 July 2008 – Published in Atmos. Chem. Phys. Discuss.: 24 September 2008 Revised: 4 December 2008 – Accepted: 20 December 2008 – Published: 27 January 2009 Abstract. We have compared spectral ultraviolet overpass irradiances from the Ozone Monitoring Instruments (OMI) against ground-based Brewer measurements at Thessaloniki, Greece from September 2004 to December 2007. It is demonstrated that OMI overestimates UV irradiances by 30%, 17% and 13% for 305 nm, 324 nm, and 380 nm respec- tively and 20% for erythemally weighted irradiance. The bias between OMI and Brewer increases with increasing aerosol absorption optical thickness. We present methodologies that can be applied for correcting this bias based on experimental results derived from the comparison period and also theoret- ical approaches using radiative transfer model calculations. All correction approaches minimize the bias and the stan- dard deviation of the ratio OMI versus Brewer ratio. Accord- ing to the results, the best correction approach suggests that the OMI UV product has to be multiplied by a correction factor C A (λ) of the order of 0.8, 0.88 and 0.9 for 305 nm, 324 nm and 380 nm respectively. Limitations and possibil- ities for applying such methodologies in a global scale are also discussed. 1 Introduction During the past decades a lot of effort has been put into composing global UV irradiance climatology datasets using ground based (GB) measurements from different locations Correspondence to: S. Kazadzis ([email protected]) (WMO, 2007). However, due to the limited availability of long term UV data series, combined with the fact that GB measurements cover a small fraction of the Earth’s surface, satellite sensors are widely used for estimating UV irradiance reaching the ground from ozone and reflectivity measure- ments, have gained particular attention. The development of satellite UV estimation techniques have been among the most important scientific issues within the UV community during the previous years (e.g. Krotkov et al., 2002). Following the many successful years that Total Ozone Mapping Spectrom- eter (TOMS) has been providing global UV irradiance mea- surements, the Ozone Monitoring Instrument started provid- ing global UV data since September 2004 (Tanskanen et al., 2007). OMI is a Dutch-Finnish instrument that flies on NASA’s Aura Mission as part of the Earth Observation System (EOS) launched in July 2004. AURA is part of a constellation of satellites known as the A-Train. OMI is a contribution of the Netherlands’s Agency for Aerospace Programs (NIVR) in collaboration with the Finnish Meteorological Institute (FMI) to the EOS Aura mission and provides information on various atmospheric parameters (Levelt et al., 2006), such as ozone, aerosols, clouds, surface UV irradiance and other trace gasses. OMI is a wide swath, nadir viewing, near-UV and visible spectrograph that measures solar ultraviolet and visible reflected and backscattered radiation in the range 270- 500 nm (Levelt et al., 2006). The spatial resolution of the measurements is 13×24 km 2 in nadir and larger towards the edges of the swath. Published by Copernicus Publications on behalf of the European Geosciences Union.
-
Upload
independent -
Category
Documents
-
view
0 -
download
0
Transcript of Ozone Monitoring Instrument spectral UV irradiance products: comparison with ground based...
Atmos. Chem. Phys., 9, 585–594, 2009www.atmos-chem-phys.net/9/585/2009/© Author(s) 2009. This work is distributed underthe Creative Commons Attribution 3.0 License.
AtmosphericChemistry
and Physics
Ozone Monitoring Instrument spectral UV irradiance products:comparison with ground based measurements at an urbanenvironment
S. Kazadzis1,2, A. Bais2, A. Arola3, N. Krotkov 4, N. Kouremeti2, and C. Meleti2
1Finnish Meteorological Institute, Research and Development, Helsinki, Finland2Laboratory of Atmospheric Physics, Aristotle University Thessaloniki, Greece3Finnish Meteorological Institute, Research and Development, Kuopio, Finland4Goddard Earth Sciences and Technology Center, University of Maryland, Baltimore County, Baltimore, Maryland, USA
Received: 8 July 2008 – Published in Atmos. Chem. Phys. Discuss.: 24 September 2008Revised: 4 December 2008 – Accepted: 20 December 2008 – Published: 27 January 2009
Abstract. We have compared spectral ultraviolet overpassirradiances from the Ozone Monitoring Instruments (OMI)against ground-based Brewer measurements at Thessaloniki,Greece from September 2004 to December 2007. It isdemonstrated that OMI overestimates UV irradiances by30%, 17% and 13% for 305 nm, 324 nm, and 380 nm respec-tively and 20% for erythemally weighted irradiance. The biasbetween OMI and Brewer increases with increasing aerosolabsorption optical thickness. We present methodologies thatcan be applied for correcting this bias based on experimentalresults derived from the comparison period and also theoret-ical approaches using radiative transfer model calculations.All correction approaches minimize the bias and the stan-dard deviation of the ratio OMI versus Brewer ratio. Accord-ing to the results, the best correction approach suggests thatthe OMI UV product has to be multiplied by a correctionfactor CA(λ) of the order of 0.8, 0.88 and 0.9 for 305 nm,324 nm and 380 nm respectively. Limitations and possibil-ities for applying such methodologies in a global scale arealso discussed.
1 Introduction
During the past decades a lot of effort has been put intocomposing global UV irradiance climatology datasets usingground based (GB) measurements from different locations
Correspondence to:S. Kazadzis([email protected])
(WMO, 2007). However, due to the limited availability oflong term UV data series, combined with the fact that GBmeasurements cover a small fraction of the Earth’s surface,satellite sensors are widely used for estimating UV irradiancereaching the ground from ozone and reflectivity measure-ments, have gained particular attention. The development ofsatellite UV estimation techniques have been among the mostimportant scientific issues within the UV community duringthe previous years (e.g. Krotkov et al., 2002). Following themany successful years that Total Ozone Mapping Spectrom-eter (TOMS) has been providing global UV irradiance mea-surements, the Ozone Monitoring Instrument started provid-ing global UV data since September 2004 (Tanskanen et al.,2007).
OMI is a Dutch-Finnish instrument that flies on NASA’sAura Mission as part of the Earth Observation System (EOS)launched in July 2004. AURA is part of a constellation ofsatellites known as the A-Train. OMI is a contribution ofthe Netherlands’s Agency for Aerospace Programs (NIVR)in collaboration with the Finnish Meteorological Institute(FMI) to the EOS Aura mission and provides informationon various atmospheric parameters (Levelt et al., 2006), suchas ozone, aerosols, clouds, surface UV irradiance and othertrace gasses. OMI is a wide swath, nadir viewing, near-UVand visible spectrograph that measures solar ultraviolet andvisible reflected and backscattered radiation in the range 270-500 nm (Levelt et al., 2006). The spatial resolution of themeasurements is 13×24 km2 in nadir and larger towards theedges of the swath.
Published by Copernicus Publications on behalf of the European Geosciences Union.
586 S. Kazadzis et al.: OMI UV validation at an urban environment
One of the goals of OMI is the investigation of changesin global surface UV irradiance. Surface UV estimates basedon satellite data have been used extensively in the last decadeto establish global UV climatologies and to examine possi-ble long-term changes in surface UV (WMO, 2007 and ref-erences therein). The OMI surface UV algorithm consistsof a calculation for clear sky cases extended with correc-tions in the case of cloudy pixels (or ones containing non-absorbing aerosols) (Tanskanen et al., 2006). In the real at-mosphere, provided that cloud screening procedures are ac-curately taken into account, the accuracy of the UV prod-uct is limited by the imperfect knowledge of aerosol proper-ties and pollutants mainly in the boundary layer. Cloud ef-fects have also a large impact in the UV retrieval from OMIand in addition they need to be accurately detected for re-liable OMI aerosol retrieval. The small pixel-size of OMI,as compared with TOMS, is a major advantage for cloudscreening. The validation of satellite-derived UV productsagainst GB measurements is an essential task in order to as-sess their accuracy. Several validation studies with heritageTOMS satellite instrument (e.g. Herman et al., 1999; Fiole-tov et al., 2002; Kazantzidis et al., 2006) revealed a positivebias in many locations, with the satellite derived UV beinghigher. It was also observed that satellite UV agrees muchbetter with the GB measurements at pristine sites (Lauder,in New Zealand (McKenzie et al., 2001), or Canadian Westcoast (Fioletov et al., 2002) than in more polluted Europeanand North-American sites (Kazantzidis et al., 2006). There-fore, it was suggested that at least part of the bias could beattributed to the boundary layer aerosol absorption, not ac-counted for in the current satellite UV algorithm (Krotkov etal., 2002; Arola et al., 2005).
Lately, Tanskanen et al. (2008) focused on the validationof the widely used daily erythemally weighted irradiance.The satellite-derived erythemal daily doses were comparedwith those derived from the ground-based measurements at17 sites and 18 instruments. The main objectives of this studywere to discuss the applicability of the OMI data for surfaceUV monitoring and to establish a more accurate cloud cor-rection method for UV retrieval. One of their conclusions,confirmed also by Ialongo et al., 2008, is that the OMI UVaerosol absorption plays an important role in the UV radia-tion levels reaching the ground and for such cases OMI over-estimates the calculated surface UV irradiance levels, espe-cially at urban areas, by 20% to 40%. With regard to thespectral aspect, Wuttke et al. (2003) emphasized the impor-tance of spectral comparisons within validation studies as amean to provide possible hints about the sources of uncer-tainties.
In this study we focus on comparing OMI and GB UVspectral measurements at different wavelengths at the urbanaerosol environment of Thessaloniki, Greece. The differenceat each wavelength is quantified and categorized according tothe presence of clouds or aerosols in the area. Furthermore,we investigate possible off-line correction formulas in order
to take into account aerosol absorption effects that influencethe OMI UV.
2 Materials and methods
2.1 Ground based measurements
At the Laboratory of Atmospheric Physics, Aristotle Uni-versity of Thessaloniki (AUTH), a monitoring program forspectral solar irradiance measurements has been in opera-tion since 1989, using a Brewer MK III (290–365 nm, 0.5 nmstep) spectroradiometer (Garane et al., 2006). In addition, di-rect irradiance spectra under cloud-free conditions and totalozone measurements have been used to derive aerosol op-tical thickness (AOT) (Kazadzis et al., 2007). The moni-toring program includes a suite of other radiometric mea-surements and observations that are used for the character-ization of the atmospheric conditions during the measure-ments. These ancillary measurements include: solar irradi-ance at 302, 312, 320, 340 and 380 nm and erythemal irradi-ance from two NILU-UV multi-filter radiometers, erythemalirradiance from a YES UVB-1 radiometer, shortwave solarirradiance from a Kipp & Zonnen CM 21 pyranometer andsky images sampled every 5 min. These data sets have beenused to compare irradiance measurements at the surface withthe overpass irradiance data calculated from OMI measure-ments.
The monitoring station is located at the center of the city ofThessaloniki which is the second largest city in Greece, witha population of 1.2 million, and is bounded to the north by theBalkan countries and to the south by the Aegean Sea. Thes-saloniki is affected by both anthropogenic and natural emis-sion sources (Kazadzis et al., 2007). Local emissions and re-gional pollution transport contribute to the poor air quality ofthe city which is reflected mostly in particulate matter (PM)concentrations. The 24 h limit values for PM10 (50µgr/m3)are exceeded for more than half of the days during a year inthe city centre’s environmental monitoring sites. The amountof aerosols in this location is quite high, with a annual meanAOT at 340 nm equal to 0.45 and monthly values rangingbetween 0.3 and 0.7, for winter and summer months, respec-tively (Kazadzis et al., 2007).
Comparisons of GB data with OMI products were con-ducted for the spectral irradiance at 305, 324, 380 nm andfor the CIE (Standard Erythemal) weighted dose rate us-ing GB averaged irradiance measurements performed within±15 min from the OMI overpass time. The OMI grid in-cludes 50% of the urban area and 50% of city suburbs, ru-ral area and sea (25%). It is well known that satellite de-rived surface irradiance is greatly affected by clouds andunder such conditions comparisons with GB measurementsat a single point is always challenging. For this reason,the comparisons were separated in cloud-free and all-skiesdata sets. Cloud free cases have been determined using the
Atmos. Chem. Phys., 9, 585–594, 2009 www.atmos-chem-phys.net/9/585/2009/
S. Kazadzis et al.: OMI UV validation at an urban environment 587
classification of the ground based measurements using pyra-nometer data (Vassaras et al., 2001), in combination with me-teorological hourly sky observations.
Brewer spectroradiometer UV data were corrected forwavelength shifts using the SHICRIVM algorithm (Slaperet al., 1995). The OMI derived spectral irradiance data arereported at the same spectral resolution with the GB mea-surements (0.55 nm full width at half maximum). As theBrewer spectra are measured up to 365 nm, the irradiancedata at 380 nm was constructed from each measured spec-trum using the SHICRIVM algorithm. The time series of theOMI – GB irradiance were analyzed and the possible differ-ences that could depend on various parameters such as: solarzenith angle, ozone, time, presence of clouds and aerosols,were investigated.
The AOT information was taken into consideration in thefollowing analysis only for clear sky days and only whenat least one GB measurement was available within±30 minfrom OMI overpass time. The associated columnar (effec-tive) single scattering albedo (SSA) was retrieved at 340 nmusing the methodology described in Bais et al., 2005. Modelcalculations were performed using the Libradtran (Mayerand Kylling, 2005) package, in order to construct look uptables (LUT) of the ratio of UV irradiances, under aerosolfree and actual aerosol conditions.
2.2 OMI UV retrieval methodology
The OMI surface UV algorithm is an extension of the TOMSUV algorithm developed at NASA Goddard Space FlightCenter (GSFC) (Eck et al., 1995; Krotkov et al., 1998; Her-man et al., 1999; Krotkov et al., 2001; Tanskanen et al.,2006). The OMI surface UV algorithm is used for offlineproduction of the global surface UV data using as input theOMI TOMS total column ozone [Bhartia and Wellemeyer,2002] and reflectance at non-absorbing wavelength (360nm).The common approach involves estimation of the clear-skysurface irradiance Eclear which is adjusted to actual surfaceirradiance by using a satellite derived cloud/aerosol transmit-tance factor CT :
Ecloud = Eclear∗ CT (1)
The a-priori surface albedo information required for mod-eling of the surface UV irradiance is not point-wise surfacealbedo but rather a regional quantity, referred to as effec-tive albedo, and describes the overall effect of the surfacealbedo of the surrounding area on the surface UV irradiance.The radiative transfer model involves a climatological set oflatitude-dependent ozone and temperature profiles. Krotkovet al. (1998) describe the details of the model and assump-tions used in determination of the clear-sky irradiance. Theyconclude that in the absence of clouds, aerosols, and snowcover, the satellite estimates of the surface UV can have ac-curacies comparable to the GB measurements. Additional in-formation on clear sky modeling approaches can be found in
Tanskanen et al. (2008). For the calculation of CT , Krotkovet al. (2001) presented two alternative cloud correction meth-ods: (1) based on modified Lambertian Equivalent Reflectiv-ity (LER) model (Eck et al., 1995) and (1) based on homoge-neous plane-parallel C1 cloud layer. LER is determined bysolving a simple form of the radiative transfer equation thatassumes a pure Rayleigh scattering atmosphere bounded byan isotropically scattering Lambertian surface (e.g., Bhartiaet al., 1993) at terrain pressure, and CT is estimated fromequation:
CT =1 − LER
1 − Rs
(2)
where Rs is surface albedo.Absorbing aerosols (e.g., organic carbon, smoke, and dust)
or trace gases (e.g., NO2, SO2) are known to lead to system-atic overestimation of the surface UV irradiance (Krotkov etal., 1998; Arola et al., 2005; Chubarova, 2004). The currentOMI surface UV algorithm assumes no aerosol absorption.In this work we introduce an additional aerosol absorptioncorrection factor CA that can be applied to post-correct oper-ational OMI UV data as follows:
Ecorr = CA ∗ Ecloud = CA ∗ Eclear∗ CT (3)
The CA is defined to be equal unity in case of non-absorbing aerosols (sulfate, sea salt) and less than unity incase of absorpbing aerosols (i.e. dust, carbonaceous, pollu-tion). In this paper we provide and compare several algo-rithms for estimating CA, which can be later applied for apost correction of the operational OMI UV data according toEq. (3) to account for aerosol absorption effects.
3 Results
3.1 Validation statistics
The comparison of the Brewer spectroradiometer GB mea-surements and OMI standard UV product (Ecloud) was as-sessed by studying the OMI/GB ratio (RT). The histogramsof RT are plotted for each of the three wavelengths and theCIE dose rate separately. The distributions were analyzedby calculating the median value of RT (m). Additionallywe have determined the percentage of the satellite-deriveddata that agrees within±10 and±20% with the referencedata (denoted as W10 and W20 respectively). Cloudless casesstatistics are also presented. In addition, and only for cloud-less cases, GB measurements are compared with Eclear toassess the calculated CT that for this cases includes onlyaerosol scattering correction.
The validation statistics are presented in Table 1. Togetherwith the median and the W10 and W20 the coefficient of de-termination (R2) is presented.
www.atmos-chem-phys.net/9/585/2009/ Atmos. Chem. Phys., 9, 585–594, 2009
588 S. Kazadzis et al.: OMI UV validation at an urban environment
Table 1. OMI/GB ratio (RT) statistics.
Wavelength (nm) All data Cloudy Cloudless Eclear/GB Brewerm R2 W10 W20 M R2 W10 W20 m R2 W10 W20 m R2 W10 W20
305 1.30 0.94 43.3 68.2 1.32 0.91 32.4 57.7 1.27 0.95 64.8 87.6 1.31 0.95 64.1 89.4324 1.17 0.89 51.3 73.1 1.20 0.85 38.8 62.5 1.15 0.90 76.9 92.4 1.17 0.90 80.1 93.5380 1.13 0.89 47.2 70.7 1.16 0.85 37.4 61.6 1.11 0.90 71.8 89.7 1.14 0.89 72.5 91.5CIED 1.20 0.93 51.5 75.4 1.22 0.89 40.5 68.1 1.19 0.95 75.0 91.9 1.21 0.95 74.7 93.7
m: median,R2: coefficient of determination, Wi: per cent of cases ranging within±i% from the median
Thessaloniki September 2004 – December 2007
0 1 2 3OMI - GB ratio
0.0
0.1
0.2
0.3
ΔΝ
/Ν
305 nm
Days
cloud free
cloudy
0 1 2 3
OMI - GB ratio
0.0
0.1
0.2
0.3
ΔΝ
/Ν
324 nm
Days
cloud free
cloudy
0 1 2 3OMI - GB ratio
0.0
0.1
0.2
0.3
ΔΝ
/Ν
380 nm
Days
cloud free
cloudy
0 1 2 3
OMI - GB ratio
0.0
0.1
0.2
0.3
ΔΝ
/Ν
CIED
Days
cloud free
cloudy
Figure 1
1
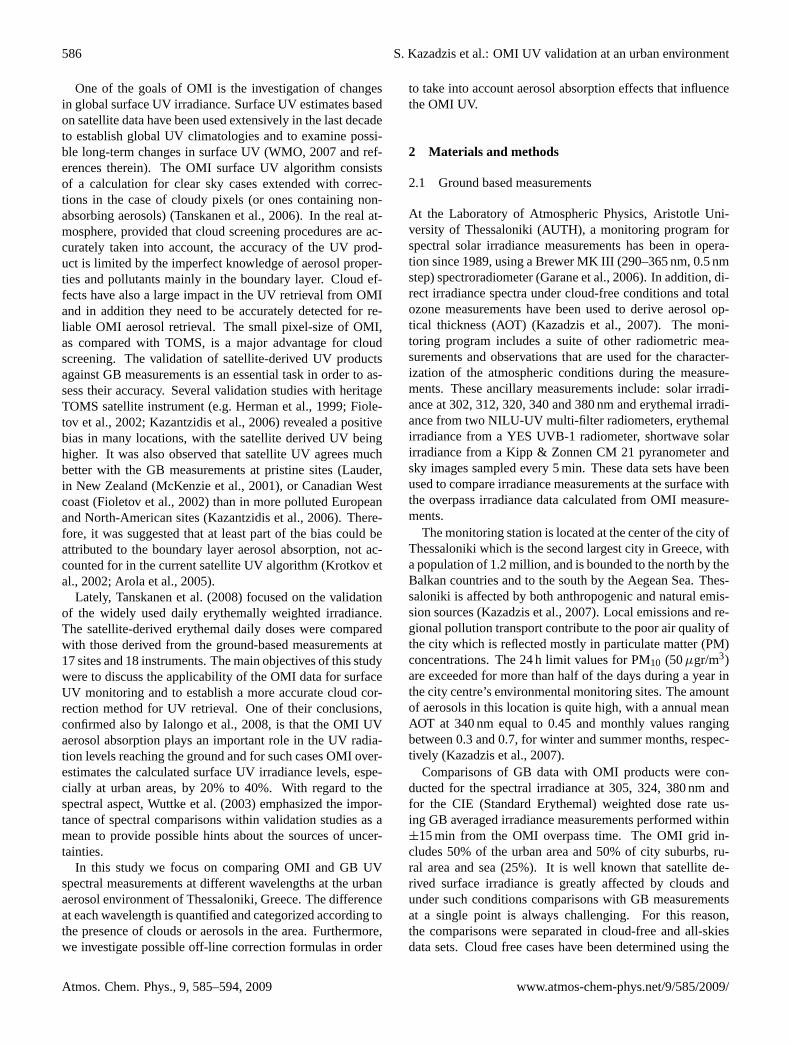
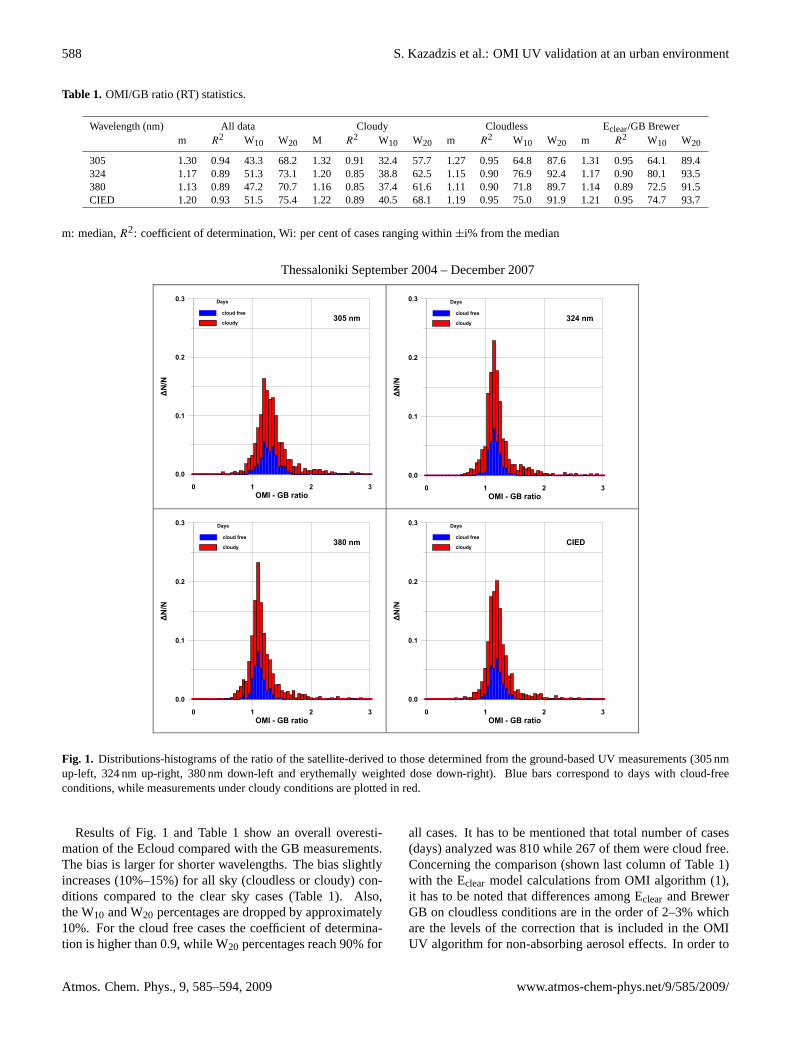
Fig. 1. Distributions-histograms of the ratio of the satellite-derived to those determined from the ground-based UV measurements (305 nmup-left, 324 nm up-right, 380 nm down-left and erythemally weighted dose down-right). Blue bars correspond to days with cloud-freeconditions, while measurements under cloudy conditions are plotted in red.
Results of Fig. 1 and Table 1 show an overall overesti-mation of the Ecloud compared with the GB measurements.The bias is larger for shorter wavelengths. The bias slightlyincreases (10%–15%) for all sky (cloudless or cloudy) con-ditions compared to the clear sky cases (Table 1). Also,the W10 and W20 percentages are dropped by approximately10%. For the cloud free cases the coefficient of determina-tion is higher than 0.9, while W20 percentages reach 90% for
all cases. It has to be mentioned that total number of cases(days) analyzed was 810 while 267 of them were cloud free.Concerning the comparison (shown last column of Table 1)with the Eclear model calculations from OMI algorithm (1),it has to be noted that differences among Eclear and BrewerGB on cloudless conditions are in the order of 2–3% whichare the levels of the correction that is included in the OMIUV algorithm for non-absorbing aerosol effects. In order to
Atmos. Chem. Phys., 9, 585–594, 2009 www.atmos-chem-phys.net/9/585/2009/
S. Kazadzis et al.: OMI UV validation at an urban environment 589
Jan Feb Mar Apr May Jun Jul Aug Sep Oct Nov DecMonths
-35
-30
-25
-20
-15
-10
-5
0
% U
V at
tenu
atio
n du
e to
aer
osol
at (
324
nm)
UV attenuation Ground based - OMI % bias
100 * (GB
- OM
I) / GB
77% of cases
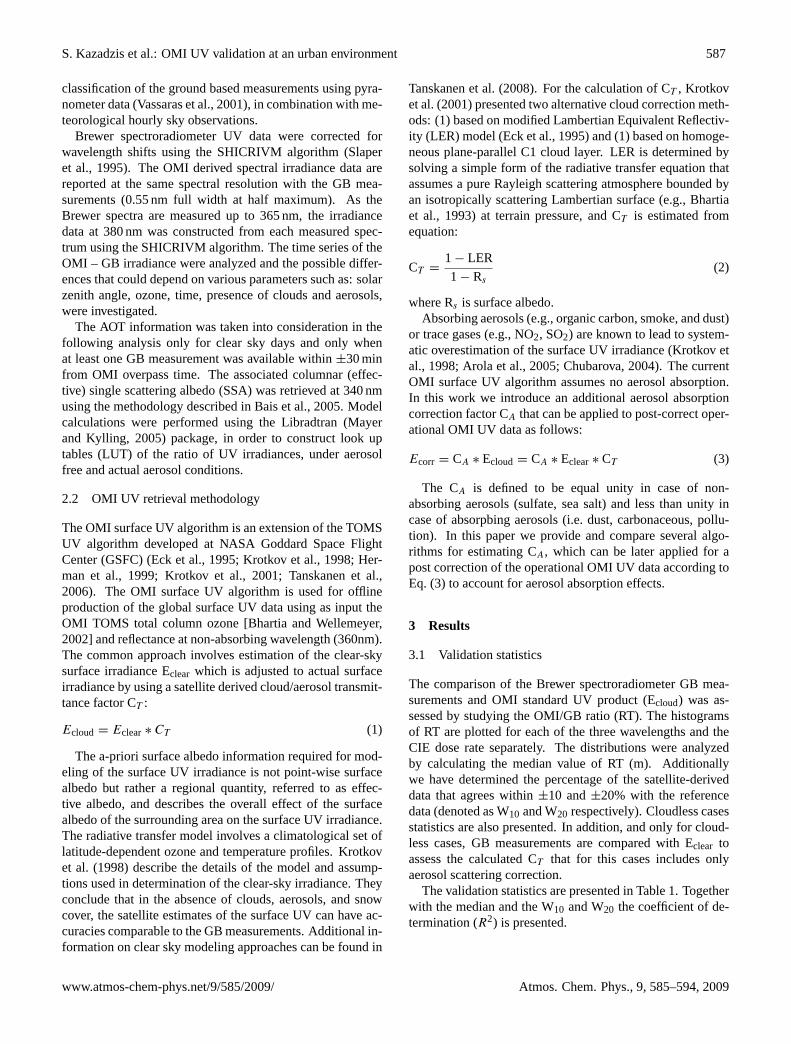
Figure 2.
1
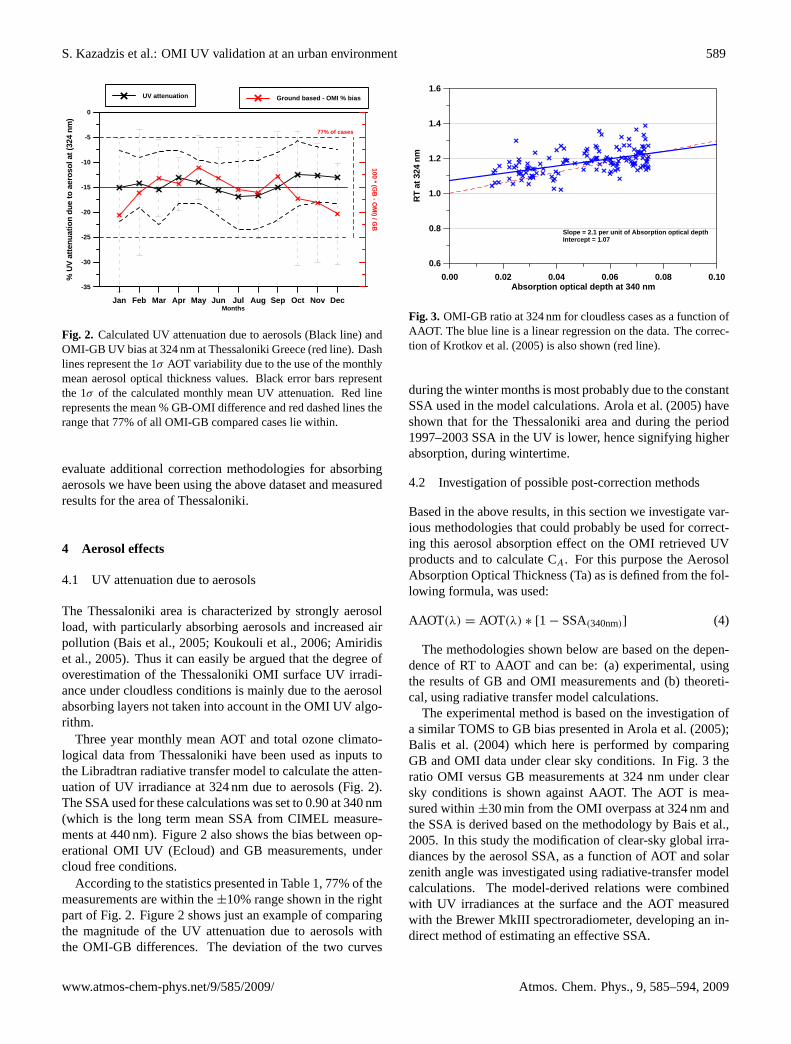
Fig. 2. Calculated UV attenuation due to aerosols (Black line) andOMI-GB UV bias at 324 nm at Thessaloniki Greece (red line). Dashlines represent the 1σ AOT variability due to the use of the monthlymean aerosol optical thickness values. Black error bars representthe 1σ of the calculated monthly mean UV attenuation. Red linerepresents the mean % GB-OMI difference and red dashed lines therange that 77% of all OMI-GB compared cases lie within.
evaluate additional correction methodologies for absorbingaerosols we have been using the above dataset and measuredresults for the area of Thessaloniki.
4 Aerosol effects
4.1 UV attenuation due to aerosols
The Thessaloniki area is characterized by strongly aerosolload, with particularly absorbing aerosols and increased airpollution (Bais et al., 2005; Koukouli et al., 2006; Amiridiset al., 2005). Thus it can easily be argued that the degree ofoverestimation of the Thessaloniki OMI surface UV irradi-ance under cloudless conditions is mainly due to the aerosolabsorbing layers not taken into account in the OMI UV algo-rithm.
Three year monthly mean AOT and total ozone climato-logical data from Thessaloniki have been used as inputs tothe Libradtran radiative transfer model to calculate the atten-uation of UV irradiance at 324 nm due to aerosols (Fig. 2).The SSA used for these calculations was set to 0.90 at 340 nm(which is the long term mean SSA from CIMEL measure-ments at 440 nm). Figure 2 also shows the bias between op-erational OMI UV (Ecloud) and GB measurements, undercloud free conditions.
According to the statistics presented in Table 1, 77% of themeasurements are within the±10% range shown in the rightpart of Fig. 2. Figure 2 shows just an example of comparingthe magnitude of the UV attenuation due to aerosols withthe OMI-GB differences. The deviation of the two curves
0.00 0.02 0.04 0.06 0.08 0.10Absorption optical depth at 340 nm
0.6
0.8
1.0
1.2
1.4
1.6
RT
at 3
24 n
m
Slope = 2.1 per unit of Absorption optical depthIntercept = 1.07
Figure 3
1
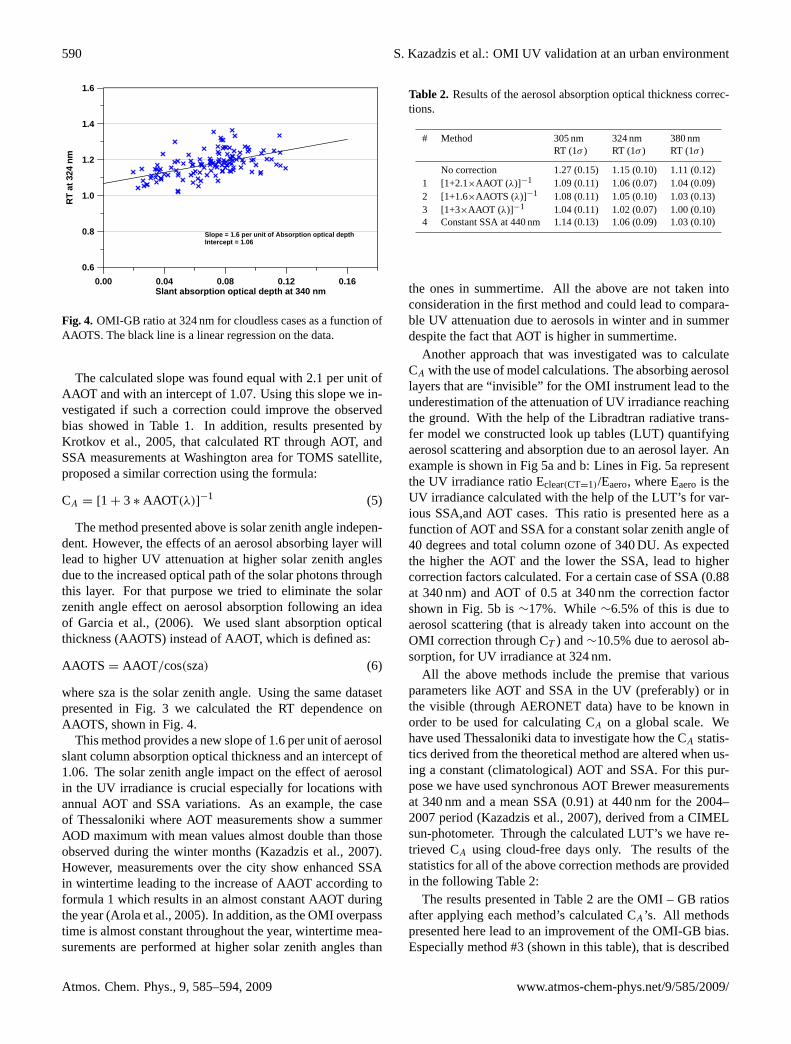
Fig. 3. OMI-GB ratio at 324 nm for cloudless cases as a function ofAAOT. The blue line is a linear regression on the data. The correc-tion of Krotkov et al. (2005) is also shown (red line).
during the winter months is most probably due to the constantSSA used in the model calculations. Arola et al. (2005) haveshown that for the Thessaloniki area and during the period1997–2003 SSA in the UV is lower, hence signifying higherabsorption, during wintertime.
4.2 Investigation of possible post-correction methods
Based in the above results, in this section we investigate var-ious methodologies that could probably be used for correct-ing this aerosol absorption effect on the OMI retrieved UVproducts and to calculate CA. For this purpose the AerosolAbsorption Optical Thickness (Ta) as is defined from the fol-lowing formula, was used:
AAOT(λ) = AOT(λ) ∗ [1 − SSA(340nm)] (4)
The methodologies shown below are based on the depen-dence of RT to AAOT and can be: (a) experimental, usingthe results of GB and OMI measurements and (b) theoreti-cal, using radiative transfer model calculations.
The experimental method is based on the investigation ofa similar TOMS to GB bias presented in Arola et al. (2005);Balis et al. (2004) which here is performed by comparingGB and OMI data under clear sky conditions. In Fig. 3 theratio OMI versus GB measurements at 324 nm under clearsky conditions is shown against AAOT. The AOT is mea-sured within±30 min from the OMI overpass at 324 nm andthe SSA is derived based on the methodology by Bais et al.,2005. In this study the modification of clear-sky global irra-diances by the aerosol SSA, as a function of AOT and solarzenith angle was investigated using radiative-transfer modelcalculations. The model-derived relations were combinedwith UV irradiances at the surface and the AOT measuredwith the Brewer MkIII spectroradiometer, developing an in-direct method of estimating an effective SSA.
www.atmos-chem-phys.net/9/585/2009/ Atmos. Chem. Phys., 9, 585–594, 2009
590 S. Kazadzis et al.: OMI UV validation at an urban environment
0.00 0.04 0.08 0.12 0.16Slant absorption optical depth at 340 nm
0.6
0.8
1.0
1.2
1.4
1.6
RT
at 3
24 n
m
Slope = 1.6 per unit of Absorption optical depthIntercept = 1.06
Figure 4
1
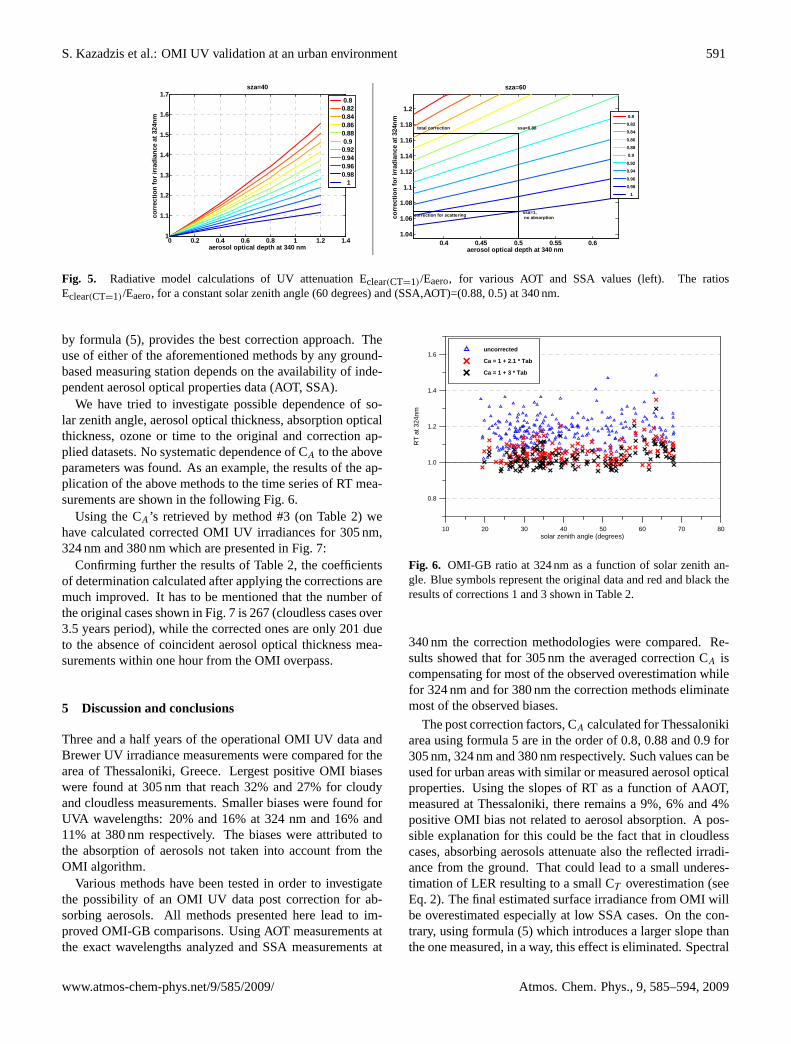
Fig. 4. OMI-GB ratio at 324 nm for cloudless cases as a function ofAAOTS. The black line is a linear regression on the data.
The calculated slope was found equal with 2.1 per unit ofAAOT and with an intercept of 1.07. Using this slope we in-vestigated if such a correction could improve the observedbias showed in Table 1. In addition, results presented byKrotkov et al., 2005, that calculated RT through AOT, andSSA measurements at Washington area for TOMS satellite,proposed a similar correction using the formula:
CA = [1 + 3 ∗ AAOT(λ)]−1 (5)
The method presented above is solar zenith angle indepen-dent. However, the effects of an aerosol absorbing layer willlead to higher UV attenuation at higher solar zenith anglesdue to the increased optical path of the solar photons throughthis layer. For that purpose we tried to eliminate the solarzenith angle effect on aerosol absorption following an ideaof Garcia et al., (2006). We used slant absorption opticalthickness (AAOTS) instead of AAOT, which is defined as:
AAOTS = AAOT/cos(sza) (6)
where sza is the solar zenith angle. Using the same datasetpresented in Fig. 3 we calculated the RT dependence onAAOTS, shown in Fig. 4.
This method provides a new slope of 1.6 per unit of aerosolslant column absorption optical thickness and an intercept of1.06. The solar zenith angle impact on the effect of aerosolin the UV irradiance is crucial especially for locations withannual AOT and SSA variations. As an example, the caseof Thessaloniki where AOT measurements show a summerAOD maximum with mean values almost double than thoseobserved during the winter months (Kazadzis et al., 2007).However, measurements over the city show enhanced SSAin wintertime leading to the increase of AAOT according toformula 1 which results in an almost constant AAOT duringthe year (Arola et al., 2005). In addition, as the OMI overpasstime is almost constant throughout the year, wintertime mea-surements are performed at higher solar zenith angles than
Table 2. Results of the aerosol absorption optical thickness correc-tions.
# Method 305 nm 324 nm 380 nmRT (1σ ) RT (1σ ) RT (1σ )
No correction 1.27 (0.15) 1.15 (0.10) 1.11 (0.12)1 [1+2.1×AAOT (λ)]−1 1.09 (0.11) 1.06 (0.07) 1.04 (0.09)2 [1+1.6×AAOTS (λ)]−1 1.08 (0.11) 1.05 (0.10) 1.03 (0.13)3 [1+3×AAOT (λ)]−1 1.04 (0.11) 1.02 (0.07) 1.00 (0.10)4 Constant SSA at 440 nm 1.14 (0.13) 1.06 (0.09) 1.03 (0.10)
the ones in summertime. All the above are not taken intoconsideration in the first method and could lead to compara-ble UV attenuation due to aerosols in winter and in summerdespite the fact that AOT is higher in summertime.
Another approach that was investigated was to calculateCA with the use of model calculations. The absorbing aerosollayers that are “invisible” for the OMI instrument lead to theunderestimation of the attenuation of UV irradiance reachingthe ground. With the help of the Libradtran radiative trans-fer model we constructed look up tables (LUT) quantifyingaerosol scattering and absorption due to an aerosol layer. Anexample is shown in Fig 5a and b: Lines in Fig. 5a representthe UV irradiance ratio Eclear(CT=1)/Eaero, where Eaero is theUV irradiance calculated with the help of the LUT’s for var-ious SSA,and AOT cases. This ratio is presented here as afunction of AOT and SSA for a constant solar zenith angle of40 degrees and total column ozone of 340 DU. As expectedthe higher the AOT and the lower the SSA, lead to highercorrection factors calculated. For a certain case of SSA (0.88at 340 nm) and AOT of 0.5 at 340 nm the correction factorshown in Fig. 5b is∼17%. While∼6.5% of this is due toaerosol scattering (that is already taken into account on theOMI correction through CT ) and∼10.5% due to aerosol ab-sorption, for UV irradiance at 324 nm.
All the above methods include the premise that variousparameters like AOT and SSA in the UV (preferably) or inthe visible (through AERONET data) have to be known inorder to be used for calculating CA on a global scale. Wehave used Thessaloniki data to investigate how the CA statis-tics derived from the theoretical method are altered when us-ing a constant (climatological) AOT and SSA. For this pur-pose we have used synchronous AOT Brewer measurementsat 340 nm and a mean SSA (0.91) at 440 nm for the 2004–2007 period (Kazadzis et al., 2007), derived from a CIMELsun-photometer. Through the calculated LUT’s we have re-trieved CA using cloud-free days only. The results of thestatistics for all of the above correction methods are providedin the following Table 2:
The results presented in Table 2 are the OMI – GB ratiosafter applying each method’s calculated CA’s. All methodspresented here lead to an improvement of the OMI-GB bias.Especially method #3 (shown in this table), that is described
Atmos. Chem. Phys., 9, 585–594, 2009 www.atmos-chem-phys.net/9/585/2009/
S. Kazadzis et al.: OMI UV validation at an urban environment 591
0 0.2 0.4 0.6 0.8 1 1.2 1.41
1.1
1.2
1.3
1.4
1.5
1.6
1.7
aerosol optical depth at 340 nm
corr
ectio
n fo
r irr
adia
nce
at 3
24nm
sza=40
0.80.820.840.860.88 0.90.920.940.960.98 1
0.4 0.45 0.5 0.55 0.61.04
1.06
1.08
1.1
1.12
1.14
1.16
1.18
1.2
aerosol optical depth at 340 nm
corr
ectio
n fo
r irr
adia
nce
at 3
24nm
sza=60
0.80.820.84
0.860.88
0.9
0.920.94
0.960.98
1
ssa=0.88
ssa=1, no absorption
total correction
correction for scattering
Figure 5
1
Fig. 5. Radiative model calculations of UV attenuation Eclear(CT=1)/Eaero, for various AOT and SSA values (left). The ratiosEclear(CT=1)/Eaero, for a constant solar zenith angle (60 degrees) and (SSA,AOT)=(0.88, 0.5) at 340 nm.
by formula (5), provides the best correction approach. Theuse of either of the aforementioned methods by any ground-based measuring station depends on the availability of inde-pendent aerosol optical properties data (AOT, SSA).
We have tried to investigate possible dependence of so-lar zenith angle, aerosol optical thickness, absorption opticalthickness, ozone or time to the original and correction ap-plied datasets. No systematic dependence of CA to the aboveparameters was found. As an example, the results of the ap-plication of the above methods to the time series of RT mea-surements are shown in the following Fig. 6.
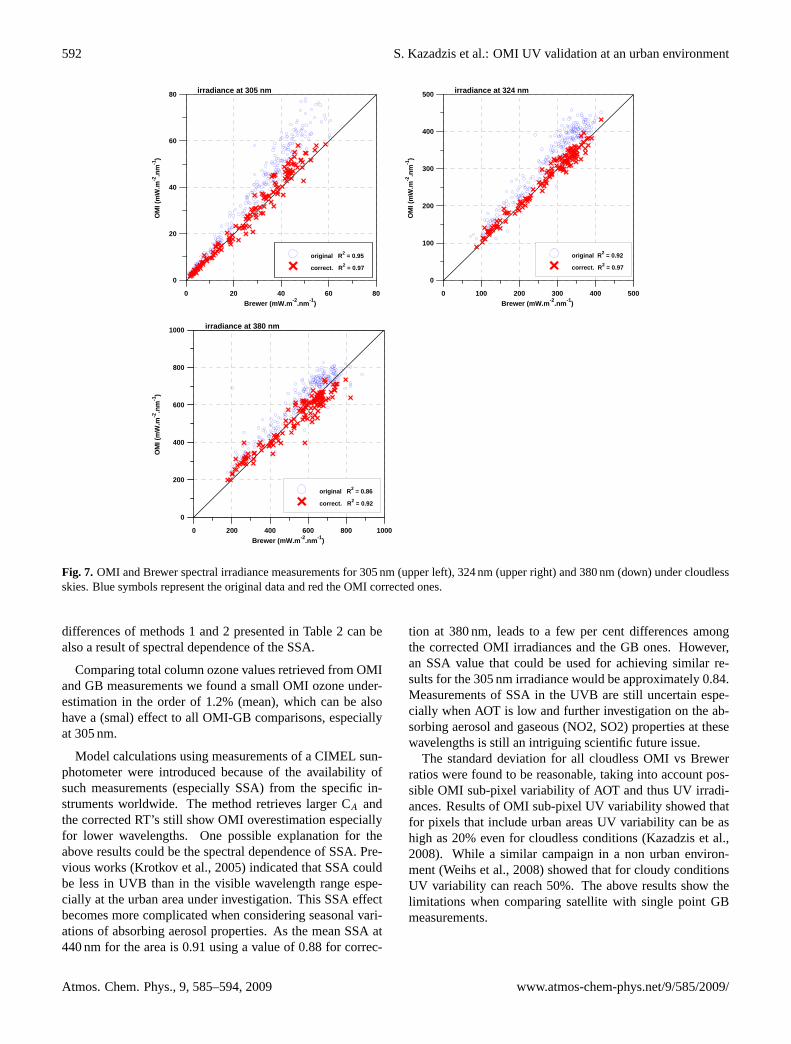
Using the CA’s retrieved by method #3 (on Table 2) wehave calculated corrected OMI UV irradiances for 305 nm,324 nm and 380 nm which are presented in Fig. 7:
Confirming further the results of Table 2, the coefficientsof determination calculated after applying the corrections aremuch improved. It has to be mentioned that the number ofthe original cases shown in Fig. 7 is 267 (cloudless cases over3.5 years period), while the corrected ones are only 201 dueto the absence of coincident aerosol optical thickness mea-surements within one hour from the OMI overpass.
5 Discussion and conclusions
Three and a half years of the operational OMI UV data andBrewer UV irradiance measurements were compared for thearea of Thessaloniki, Greece. Lergest positive OMI biaseswere found at 305 nm that reach 32% and 27% for cloudyand cloudless measurements. Smaller biases were found forUVA wavelengths: 20% and 16% at 324 nm and 16% and11% at 380 nm respectively. The biases were attributed tothe absorption of aerosols not taken into account from theOMI algorithm.
Various methods have been tested in order to investigatethe possibility of an OMI UV data post correction for ab-sorbing aerosols. All methods presented here lead to im-proved OMI-GB comparisons. Using AOT measurements atthe exact wavelengths analyzed and SSA measurements at
10 20 30 40 50 60 70 80solar zenith angle (degrees)
0.8
1.0
1.2
1.4
1.6
RT
at 3
24nm
uncorrected
Ca = 1 + 2.1 * Tab
Ca = 1 + 3 * Tab
Figure 6
1
Fig. 6. OMI-GB ratio at 324 nm as a function of solar zenith an-gle. Blue symbols represent the original data and red and black theresults of corrections 1 and 3 shown in Table 2.
340 nm the correction methodologies were compared. Re-sults showed that for 305 nm the averaged correction CA iscompensating for most of the observed overestimation whilefor 324 nm and for 380 nm the correction methods eliminatemost of the observed biases.
The post correction factors, CA calculated for Thessalonikiarea using formula 5 are in the order of 0.8, 0.88 and 0.9 for305 nm, 324 nm and 380 nm respectively. Such values can beused for urban areas with similar or measured aerosol opticalproperties. Using the slopes of RT as a function of AAOT,measured at Thessaloniki, there remains a 9%, 6% and 4%positive OMI bias not related to aerosol absorption. A pos-sible explanation for this could be the fact that in cloudlesscases, absorbing aerosols attenuate also the reflected irradi-ance from the ground. That could lead to a small underes-timation of LER resulting to a small CT overestimation (seeEq. 2). The final estimated surface irradiance from OMI willbe overestimated especially at low SSA cases. On the con-trary, using formula (5) which introduces a larger slope thanthe one measured, in a way, this effect is eliminated. Spectral
www.atmos-chem-phys.net/9/585/2009/ Atmos. Chem. Phys., 9, 585–594, 2009
592 S. Kazadzis et al.: OMI UV validation at an urban environment
0 20 40 60 8Brewer (mW.m-2.nm-1)
0
0
20
40
60
80
OM
I (m
W.m
-2.n
m-1
)
irradiance at 305 nm
original R2 = 0.95
correct. R2 = 0.97
0 100 200 300 400 500
Brewer (mW.m-2.nm-1)
0
100
200
300
400
500
OM
I (m
W.m
-2.n
m-1
)
irradiance at 324 nm
original R2 = 0.92
correct. R2 = 0.97
0 200 400 600 800 1000Brewer (mW.m-2.nm-1)
0
200
400
600
800
1000
OM
I (m
W.m
-2.n
m-1
)
irradiance at 380 nm
original R2 = 0.86
correct. R2 = 0.92
Figure 7
1
Fig. 7. OMI and Brewer spectral irradiance measurements for 305 nm (upper left), 324 nm (upper right) and 380 nm (down) under cloudlessskies. Blue symbols represent the original data and red the OMI corrected ones.
differences of methods 1 and 2 presented in Table 2 can bealso a result of spectral dependence of the SSA.
Comparing total column ozone values retrieved from OMIand GB measurements we found a small OMI ozone under-estimation in the order of 1.2% (mean), which can be alsohave a (smal) effect to all OMI-GB comparisons, especiallyat 305 nm.
Model calculations using measurements of a CIMEL sun-photometer were introduced because of the availability ofsuch measurements (especially SSA) from the specific in-struments worldwide. The method retrieves larger CA andthe corrected RT’s still show OMI overestimation especiallyfor lower wavelengths. One possible explanation for theabove results could be the spectral dependence of SSA. Pre-vious works (Krotkov et al., 2005) indicated that SSA couldbe less in UVB than in the visible wavelength range espe-cially at the urban area under investigation. This SSA effectbecomes more complicated when considering seasonal vari-ations of absorbing aerosol properties. As the mean SSA at440 nm for the area is 0.91 using a value of 0.88 for correc-
tion at 380 nm, leads to a few per cent differences amongthe corrected OMI irradiances and the GB ones. However,an SSA value that could be used for achieving similar re-sults for the 305 nm irradiance would be approximately 0.84.Measurements of SSA in the UVB are still uncertain espe-cially when AOT is low and further investigation on the ab-sorbing aerosol and gaseous (NO2, SO2) properties at thesewavelengths is still an intriguing scientific future issue.
The standard deviation for all cloudless OMI vs Brewerratios were found to be reasonable, taking into account pos-sible OMI sub-pixel variability of AOT and thus UV irradi-ances. Results of OMI sub-pixel UV variability showed thatfor pixels that include urban areas UV variability can be ashigh as 20% even for cloudless conditions (Kazadzis et al.,2008). While a similar campaign in a non urban environ-ment (Weihs et al., 2008) showed that for cloudy conditionsUV variability can reach 50%. The above results show thelimitations when comparing satellite with single point GBmeasurements.
Atmos. Chem. Phys., 9, 585–594, 2009 www.atmos-chem-phys.net/9/585/2009/
S. Kazadzis et al.: OMI UV validation at an urban environment 593
For the case of cloudy conditions the OMI-Brewer ratiosshowed approximately 5% higher values than the cloud-freeones and in addition higher standard deviation. For the highervalues the explanation is the high UV irradiance variabilityunder cloudy conditions and the absence of information onthe amount of the direct sun attenuation for each individualmeasurement. An additional reason is the fact that OMI over-passes and GB spectral measurements are not exactly syn-chronous, which is important issue comparing UV measure-ments under a variable radiation field. The absolute leveldifferences and their spectral dependence indicate that simi-lar CA’s have to be applied in cloudy cases too. However, theUV attenuation due to aerosol absorption under cloudy con-ditions is more difficult to be studied theoretically, as moreinformation about the clouds and the aerosol layer heightare necessary. In addition, aerosol absorption is difficult tobe quantified as sun-photometric measurements fail undercloudy conditions. In this case, the calculated CA’s can beused, or other possible correction procedures have to be con-sidered.
Post processing algorithms for OMI-UV products have tobe employed when using OMI data for regions with highaerosol load. Simple parameters for public use (e.g. UV In-dex) can be overestimated by more than 20% if using OMIoverpass data for urban areas such as Thessaloniki. The useof climatological mean values of AOT and absorption (SSA)aerosol quantities in a global scale could be used based in oneof the methodologies presented in this work. Finally, when itis possible, the spectral dependence of AOT and SSA has tobe taken into account in order to include a correction for thespectral dependence of UV attenuation reaching the ground,in the presence of an aerosol layer.
Acknowledgements.The Dutch-Finnish built OMI instrument ispart of the NASA EOS Aura satellite payload. The OMI projectis managed by NIVR and KNMI in the Netherlands. We thank theOMI International Science Team for the satellite data used in thisstudy.
Stelios Kazadzis would like to acknowledge the Marie Curie IntraEuropean fellowship “Validation of Aerosol optical Properties andsurface Irradiance measured from Ozone Monitoring Instrument onboard of AURA satellite” VAP-OMI, AOR A/119693 – PIEF-GA-2008-219908.
Edited by: A. Hofzumahaus
References
Arola, A., Kazadzis, S., Krotkov, N., Bais, A., Grobner, J., andHerman, J. R.: Assessment of TOMS UV bias due to absorbingaerosols, J. Geophys. Res. Atmos., 110(23), 1–7, 2005.
Amiridis, V., Balis, D. S., Kazadzis, S., Bais, A., Giannakaki, E.,Papayannis, A., and Zerefos, C.: Four-year aerosol observationswith a Raman lidar at Thessaloniki, Greece, in the frameworkof European aerosol Research Lidar Network (EARLINET), J.
Geophys. Res., 110(D21), D21203, doi:10.1029/2005JD006190,2005.
Bais, A. F., Kazantzidis, A., Kazadzis, S., Balis, D. S., Zerefos, C.S., and Meleti, C.: Deriving an effective aerosol single scatter-ing albedo from spectral surface UV irradiance measurements,Atmos. Environ., 39(6), 1093–1102, 2005.
Balis, D. S., Amiridis, V., Zerefos, C., Kazantzidis, A., Kazadzis,S., Bais, A. F., Meleti, C., Gerasopoulos, E., Papayannis, A.,Matthias, V., Dier, H., and Andreae, M. O.: Study of the effect ofdifferent type of aerosols on UV-B radiation from measurementsduring EARLINET, Atmos Chem. Phys., 4, 307–321, 2004.
Bhartia, P. K., Herman, J., McPeters, R. D., and Torres, O.: Effectof Mount Pinatubo aerosols on total ozone measurements frombackscatter ultraviolet (BUV) experiments, J. Geophys. Res.,98(D10), 18547–18554, 1993.
Bhartia, P. K. and Wellemeyer, C. W.: TOMS-V8 total O3 algo-rithm, in OMI Algorithm Theoretical Basis Document, NASAGoddard Space Flight Cent., Greenbelt, MD, USA, 2002.
Chubarova, N. E.: Influence of aerosol and atmospheric gases on ul-traviolet radiation in different optical conditions including smokymist of 2002, Doklady Earth Sci., 394(1), 62–67, 2004.
Eck, T. F., Holben, B. N., Dubovik, O., Smirnov, A., Goloub, P.,Chen, H. B., Chatenet, B., Gomes, L., Zhang, X. Y., Tsay, S.C., Ji, Q., Giles, D., and Slutsker, I.: Columnar aerosol opticalproperties at AERONET sites in central eastern Asia and aerosoltransport to the tropical mid-Pacific, J. Geophys. Res. Atmos.,110(6), 1–18, 2005.
Fioletov, V. E., Kerr, J. B., Wardle, D. I., Krotkov, N., and Herman,J. R.: Comparison of Brewer ultraviolet irradiance measurementswith total ozone mapping spectrometer satellite retrievals, Opt.Eng., 41(12), 3051–3061, 2002.
Garane, K., Bais, A. F., Kazadzis, S., Kazantzidis, A., and Meleti,C.: Monitoring of UV spectral irradiance at Thessaloniki (1990–2005): Data re-evaluation and quality control, Ann. Geophys.,24(12), 3215–3228, 2006.
Garcıa, O. E., Dıaz, A. M., Exposito, F. J., Dıaz, J. P., Grobner, J.,and Fioletov, V. E.: Cloudless aerosol forcing efficiency in theUV region from AERONET and WOUDC databases, Geophys.Res. Lett., 33, L23803, doi:10.1029/2006GL026794, 2006.
Herman, J. R., Krotkov, N., Celarier, E., Larko, D., and Labow, G.:Distribution of UV radiation at the Earth’s surface from TOMS-measured UV-backscattered radiances, J. Geophys. Res. Atmos.,104(D10), 12059–12076, 1999.
Ialongo, I., Casale, G. R., and Siani, A. M.: Comparison of to-tal ozone and erythemal UV data from OMI with ground-basedmeasurements at Rome station, Atmos. Chem. Phys., 8, 3283–3289, 2008.
Kazadzis, S., Bais, A., Amiridis, V., Balis, D., Meleti, C.,Kouremeti, N., Zerefos, C. S., Rapsomanikis, S., Petrakakis, M.,Kelesis, A., Tzoumaka, P., and Kelektsoglou, K.: Nine years ofUV aerosol optical depth measurements at Thessaloniki, Greece,Atmos. Chem. Phys., 7(8), 2091–2101, 2007.
Kazadzis S., Bais, A., Balis, D., Kouremeti, N., Zebila, M., Arola,A., Giannakaki, E., Kazantzidis, A., Amiridis, V.: Spatial andtemporal UV and aerosol variability within the area of an OMIsatellite pixel, submitted to Atmos. Chem. Phys., 2008.
Kazantzidis, A., Bais, A. F., Grobner, J., Herman, J. R., Kazadzis,S., Krotkov, N., Kyro, E., den Outer, P. N., Garane, K., Gorts, P.,Lakkala, K., Meleti, C., Slaper, H., Tax, R. B., Turunen, T., and
www.atmos-chem-phys.net/9/585/2009/ Atmos. Chem. Phys., 9, 585–594, 2009
594 S. Kazadzis et al.: OMI UV validation at an urban environment
Zerefos, C. S.: Comparison of satellite-derived UV irradianceswith ground-based measurements at four European stations, J.Geophys. Res. Atmos., 111(13), 2006.
Koukouli, M. E., Balis, D. S., Amiridis, V., Kazadzis, S., Bais, A.,Nickovic, S., and Torres, O.: Aerosol variability over Thessa-loniki using ground based remote sensing observations and theTOMS aerosol index, Atmos. Environ., 40, 5367–5378, 2006
Krotkov, N. A., Bhartia, P. K., Herman, J. R., Fioletov, V., and Kerr,J.: Satellite estimation of spectral surface UV irradiance in thepresence of tropospheric aerosols 1. Cloud-free case, J. Geophys.Res. Atmos., 103(D8), 8779-8793, 1998.
Krotkov, N. A., Herman, J. R., Bhartia, P. K., Fioletov, V., and Ah-mad, Z.: Satellite estimation of spectral surface UV irradiance2. Effects of homogeneous clouds and snow, J. Geophys. Res.Atmos., 106(D11), 11743–11759, 2001.
Krotkov, N., Herman, J., Bhartia, P. K., Seftor, C., Arola, A., Kau-rola, J., Kalliskota, S., Taalas, P., and Geogdzhaev, I. V.: Version2 total ozone mapping spectrometer ultraviolet algorithm: Prob-lems and enhancements, Opt. Eng., 41(12), 3028–3039, 2002.
Krotkov, N., Bhartia, P. K., Herman, J., Slusser, J., Scott, G., Labow,G., Vasilkov, A. P., Eck, T. F., Dubovik, O., and Holben, B. N.:Aerosol ultraviolet absorption experiment (2002 to 2004), part 2:Absorption optical thickness, refractive index, and single scatter-ing albedo, Opt. Eng., 44(4), 1–17, 2005.
Levelt, P. F., Hilsenrath, E., Leppelmeier, G. W., Van Den Oord, G.H. J., Bhartia, P. K., Tamminen, J., De Haan, J. F., and Veefkind,J. P.: Science objectives of the ozone monitoring instrument,IEEE T. Geosci. Remote Sens., 44(5), 1199–1207, 2006.
Marenco, F., Santacesaria, V., Bais, A. F., Balis, D. Di Sarra, A., Pa-payannis, A., and Zerefos, C.: Optical properties of troposphericaerosols determined by lidar and spectrophotometric measure-ments (Photochemical Activity and Solar Ultraviolet RadiationCampaign), Appl. Opt., 36(27), 6875–6886, 1997.
Mayer, B., and Kylling, A.: Technical note: The libRadtran soft-ware package for radiative transfer calculations – Descriptionand examples of use, Atmos. Chem. Phys., 5(7), 1855–1877,2005.
McKenzie, R. L., Seckmeyer, G., Bais, A. F., Kerr, J. B., andMadronich, S.: Satellite retrievals of erythemal UV dose com-pared with ground-based measurements at northern and southernmidlatitudes, J. Geophys. Res. Atmos., 106(D20), 24051–24062,2001.
Slaper, H., Reinen, H. A. J. M., Blumthaler, M., Huber, M., andKuik, F.: Comparing ground-level spectrally resolved solar UVmeasurements using various instruments: a technique resolvingeffects of wavelength shift and slit width, Geophys. Res. Lett.,22(20), 2721–2724, 1995.
Tanskanen, A., Krotkov, N. A., Herman, J. R., and Arola, A.: Sur-face ultraviolet irradiance from OMI, IEEE T. Geosci. RemoteSens., 44(5), 1267–1271, 2006.
Tanskanen, A., Lindfors, A., Maatta, A. , Krotkov, N., Herman,J., Kaurola, J., Koskela, T., Lakkala, K., Fioletov, V., Bern-hard, G., McKenzie, R., Kondo, Y., O’Neill, M., Slaper, H., De-nOuter, P., Bais, A. F., and Tamminen, J.: Validation of dailyerythemal doses from ozone Monitoring Instrument with ground-based UV measurement data, J. Geophys. Res., 5(112), D24S44,doi:10.1029/2007JD008830, 2008.
Vasaras, A., Bais, A. F., Feister, U., and Zerefos, C. S.: Comparisonof two methods for cloud flagging of spectral UV measurements,Atmos. Res., 57(1), 31–42, 2001.
Weihs, P., Blumthaler, M., Rieder, H. E., Kreuter, A., Simic, S.,Laube, W., Schmalwieser, A. W., Wagner, J. E., and Tanskanen,A.: Measurements of UV irradiance within the area of one satel-lite pixel, Atmos. Chem. Phys., 8, 5615–5626, 2008,http://www.atmos-chem-phys.net/8/5615/2008/.
Wuttke, S., Verdebout, J., and Seckmeyer, G.: An Improved Algo-rithm for Satellite-derived UV Radiation, Photochem.Photobiol.,77(1), 52–57, 2003.
World Meteorological Organization (WMO): Scientific Assessmentof Ozone Depletion: 2006, Global Ozone Research and Monitor-ing Project, WMO Rep. N, 47, Geneva, 2007.
Atmos. Chem. Phys., 9, 585–594, 2009 www.atmos-chem-phys.net/9/585/2009/