
Oxygen isotope ratios of FeO-poor chondrules in CR3 chondrites: Influence of dust enrichment and H2O...
23
Oxygen isotope ratios of FeO-poor chondrules in CR3 chondrites: Influence of dust enrichment and H 2 O during chondrule formation Travis J. Tenner a,⇑ , Daisuke Nakashima a,1 , Takayuki Ushikubo a,2 , Noriko T. Kita a , Michael K. Weisberg b,c a WiscSIMS, Department of Geoscience, University of Wisconsin-Madison, Madison, WI 53706, USA b Kingsborough Community College and Graduate Center, The City University of New York, 2001 Oriental Boulevard, Brooklyn, NY 11235-2398, USA c American Museum of Natural History, Central Park West at 79th Street, New York, NY 10024-5192, USA Received 14 February 2014; accepted in revised form 12 September 2014; available online 15 October 2014 Abstract We present detailed electron microprobe analyses and oxygen three-isotope measurements by high precision secondary ion mass spectrometry on 45 type I (FeO-poor) chondrules/fragments and 3 type II (FeO-rich) chondrule fragments from Mete- orite Hills 00426 and Queen Alexandra Range 99177, two of the most primitive CR3 chondrites. Type I chondrules/fragments have Mg#’s (defined as the Mg# of constituent olivine and/or low-Ca pyroxene) ranging from 94.2 to 99.2; type II chondrule fragments have Mg#’s of 53–63. Oxygen three-isotope measurements plot on the slope 1 primitive chondrule mineral (PCM) line. Within chondrules, D 17 O (=d 17 O–0.52 d 18 O) values of coexisting olivine, pyroxene, and plagioclase are homogeneous, with propagated uncertainties of 0.3&. This indicates each phase crystallized from the final chondrule melt, and that efficient oxygen isotope exchange occurred between ambient gas and chondrule melt. Among type I chondrules there is a well-defined increase in D 17 O, from –5.9& to 1&, as Mg#’s decrease from 99.2 to 96; type II chondrule fragments are comparatively 16 O-poor (D 17 O: 0.2–0.6&). The relationship between Mg# and D 17 O among type I chondrules confirms that addition of a 16 O-poor oxidizing agent to the highest Mg# chondrule precursors resulted in forming lower Mg# CR chondrules. Using aspects of existing equilibrium condensation models and a mass balance we estimate that type I CR chondrules formed at dust enrichments of 100–200, from dusts with 0–0.8 times the atomic abundance of ice, relative to CI dust. The type II chon- drule fragments are predicted to have formed at CI dust enrichments near 2500. Ó 2014 Elsevier Ltd. All rights reserved. 1. INTRODUCTION Chondrules are ubiquitous (20–80 volume percent) in primitive chondrites (Scott et al., 1996). Their igneous tex- tures and spherulitic morphologies indicate rapid heating and crystallization of pre-existing solids (Tsuchiyama et al., 1980; Hewins and Radomsky, 1990; Jones et al., 2000, 2005) within the inner regions of the protoplanetary disk (Cassen, 2001; Desch and Connolly, 2002). Chondrules from the least metamorphosed chondrites display a wide http://dx.doi.org/10.1016/j.gca.2014.09.025 0016-7037/Ó 2014 Elsevier Ltd. All rights reserved. ⇑ Corresponding author. Tel.: +1 608 262 8960; fax: +1 608 262 0693. E-mail address: [email protected] (T.J. Tenner). 1 Present address: Department of Earth and Planetary Material Sciences, Faculty of Science, Tohoku University, Aoba, Sendai, Miyagi 980-8578, Japan. 2 Present address: Kochi Institute for Core Sample Research, Japan Agency for Marine-Earth Science and Technology (JAMS- TEC), 200 Monobe Otsu, Nankoku City, Kochi 783-8502, Japan. www.elsevier.com/locate/gca Available online at www.sciencedirect.com ScienceDirect Geochimica et Cosmochimica Acta 148 (2015) 228–250
Transcript of Oxygen isotope ratios of FeO-poor chondrules in CR3 chondrites: Influence of dust enrichment and H2O...
Available online at www.sciencedirect.com
www.elsevier.com/locate/gca
ScienceDirect
Geochimica et Cosmochimica Acta 148 (2015) 228–250
Oxygen isotope ratios of FeO-poor chondrules in CR3chondrites: Influence of dust enrichment and H2O
during chondrule formation
Travis J. Tenner a,⇑, Daisuke Nakashima a,1, Takayuki Ushikubo a,2,Noriko T. Kita a, Michael K. Weisberg b,c
a WiscSIMS, Department of Geoscience, University of Wisconsin-Madison, Madison, WI 53706, USAb Kingsborough Community College and Graduate Center, The City University of New York, 2001 Oriental Boulevard, Brooklyn,
NY 11235-2398, USAc American Museum of Natural History, Central Park West at 79th Street, New York, NY 10024-5192, USA
Received 14 February 2014; accepted in revised form 12 September 2014; available online 15 October 2014
Abstract
We present detailed electron microprobe analyses and oxygen three-isotope measurements by high precision secondary ionmass spectrometry on 45 type I (FeO-poor) chondrules/fragments and 3 type II (FeO-rich) chondrule fragments from Mete-orite Hills 00426 and Queen Alexandra Range 99177, two of the most primitive CR3 chondrites. Type I chondrules/fragmentshave Mg#’s (defined as the Mg# of constituent olivine and/or low-Ca pyroxene) ranging from 94.2 to 99.2; type II chondrulefragments have Mg#’s of 53–63. Oxygen three-isotope measurements plot on the slope �1 primitive chondrule mineral (PCM)line. Within chondrules, D17O (=d17O–0.52 � d18O) values of coexisting olivine, pyroxene, and plagioclase are homogeneous,with propagated uncertainties of 0.3&. This indicates each phase crystallized from the final chondrule melt, and that efficientoxygen isotope exchange occurred between ambient gas and chondrule melt. Among type I chondrules there is a well-definedincrease in D17O, from –5.9& to ��1&, as Mg#’s decrease from 99.2 to �96; type II chondrule fragments are comparatively16O-poor (D17O: �0.2–0.6&). The relationship between Mg# and D17O among type I chondrules confirms that addition of a16O-poor oxidizing agent to the highest Mg# chondrule precursors resulted in forming lower Mg# CR chondrules. Usingaspects of existing equilibrium condensation models and a mass balance we estimate that type I CR chondrules formed atdust enrichments of 100–200�, from dusts with 0–0.8 times the atomic abundance of ice, relative to CI dust. The type II chon-drule fragments are predicted to have formed at CI dust enrichments near 2500�.� 2014 Elsevier Ltd. All rights reserved.
http://dx.doi.org/10.1016/j.gca.2014.09.025
0016-7037/� 2014 Elsevier Ltd. All rights reserved.
⇑ Corresponding author. Tel.: +1 608 262 8960; fax: +1 608 2620693.
E-mail address: [email protected] (T.J. Tenner).1 Present address: Department of Earth and Planetary Material
Sciences, Faculty of Science, Tohoku University, Aoba, Sendai,Miyagi 980-8578, Japan.
2 Present address: Kochi Institute for Core Sample Research,Japan Agency for Marine-Earth Science and Technology (JAMS-TEC), 200 Monobe Otsu, Nankoku City, Kochi 783-8502, Japan.
1. INTRODUCTION
Chondrules are ubiquitous (20–80 volume percent) inprimitive chondrites (Scott et al., 1996). Their igneous tex-tures and spherulitic morphologies indicate rapid heatingand crystallization of pre-existing solids (Tsuchiyamaet al., 1980; Hewins and Radomsky, 1990; Jones et al.,2000, 2005) within the inner regions of the protoplanetarydisk (Cassen, 2001; Desch and Connolly, 2002). Chondrulesfrom the least metamorphosed chondrites display a wide
200
150
100
50
0
-50
17O
(‰)
200100018O (‰)
TFL
PCM (slope ~1)
Acfer 094 COSEstimated CR H2OCR IOM
CAIs
CCchondrules
Sun
CR IOM
-50 50 150
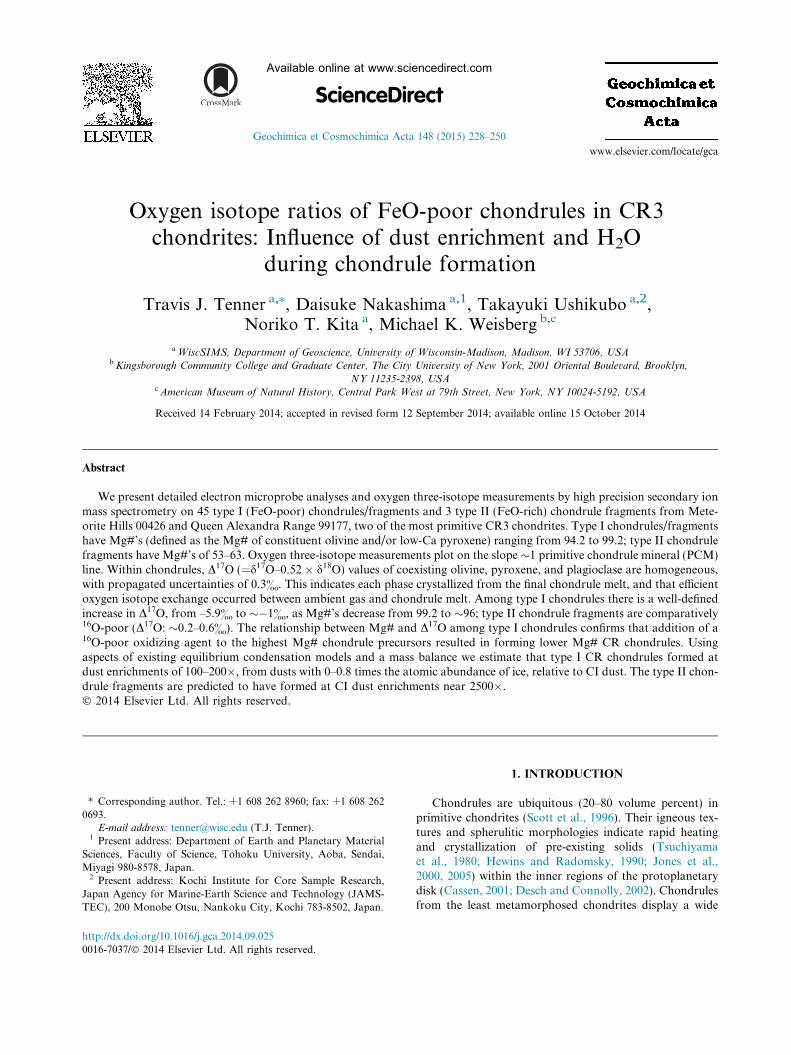
Fig. 1. Illustrative oxygen three-isotope diagram of chondriticmaterials. The slope �1 primitive chondrule minerals (PCM) linefrom Ushikubo et al. (2012) is shown for reference. Also shown isthe terrestrial fractionation line (TFL). The shaded region for CAIsrepresents data from Clayton (1993) and Gounelle et al. (2009), andextends near the TF line. The shaded region for carbonaceouschondrite (CC) chondrules represents data from Jones et al. (2000,2004), Kunihiro et al. (2004, 2005), Krot et al. (2006a), Connollyand Huss (2010), Libourel and Chaussidon (2011), Rudraswamiet al. (2011), Ushikubo et al. (2012), Schrader et al. (2013), andTenner et al. (2013). The estimated O-isotope ratio for the Sun istaken from McKeegan et al. (2011). Data from Acfer 094 cosmicsymplectites (COS), which are inferred to sample O-isotope ratiosof H2O, are from Sakamoto et al. (2007). The estimated O-isotoperatio of H2O in CR chondrites is from Clayton and Mayeda (1999),based on matrix and whole-rock measurements. The CR insolubleorganic material (IOM) datum is from Hashizume et al. (2011) andis the average of areas #1 and #2 in their study; some CR IOM hasextreme d17,18O values, exceeding +400&. Uncertainties are 2SD.
T.J. Tenner et al. / Geochimica et Cosmochimica Acta 148 (2015) 228–250 229
range of FeO contents in their constituent olivines andpyroxenes. Mg#’s (mol.% MgO/[MgO + FeO]) of chon-drule olivines and pyroxenes range from 40 to 100(McSween, 1977; Jones and Scott, 1989; Scott and Jones,1990; Jones, 1990, 1994, 1996; Kallemeyn et al., 1994;Kurahashi et al., 2008; Connolly and Huss, 2010; Kitaet al., 2010; Libourel and Chaussidon, 2011; Ushikuboet al., 2012; Schrader et al., 2013; Tenner et al., 2013). Thisindicates the redox state of the chondrule-forming environ-ment varied significantly, based on metal–silicate phaseequilibria (Kring, 1988; Zanda et al., 1994). In particular,type I chondrules, defined as those with olivine or low-Capyroxene Mg#’s between 90 and 100 (Jones et al., 2005)formed at more reducing conditions (log fO2: IW �6 toIW �2) than type II (mafic mineral Mg# < 90) chondrules(log fO2: IW �2 to IW; IW = iron-wustite buffer). As awhole, chondrules formed at more oxidizing conditionsthan Ca, Al-rich inclusions, or CAIs (log fO2 < IW �6;Grossman et al., 2008), suggesting their environments weremost likely enhanced in oxygen-rich dust (Wood, 1967).Imposed oxygen fugacities were probably controlled bythe degree of dust enrichment, relative to the Solar gas,and by the amount of H2O and carbon in solid precursors(Connolly et al., 1994; Ebel and Grossman, 2000; Fedkinand Grossman, 2006; Grossman et al., 2012; Fedkinet al., 2012). The Mg# of a chondrule reflects theseparameters.
In primitive chondrites oxygen isotope ratios of chond-rules are linked to the values of their precursors, andconceivably document exchange between ambient gas andchondrule melt. Specifically, homogeneous oxygen isotoperatios among silicate phases from individual chondrulesinfer the value of the final chondrule melt, and suggest oxy-gen isotope ratios did not change during and aftercrystallization (e.g. Ushikubo et al., 2012). Chondrulesfrom primitive carbonaceous chondrites plot on a slope�1 line when comparing d18O and d17O (where d17,18O(&) = [(Rsample/RVSMOW)�1] � 1000; R = 17,18O/16O;VSMOW = Vienna Standard Mean Ocean Water;Baertschi, 1976) and show an appreciable range (d17,18O:�–20& to +5&; Clayton, 1993; Jones et al., 2000, 2004;Kunihiro et al., 2004, 2005; Krot et al., 2006a, 2010;Connolly and Huss, 2010; Libourel and Chaussidon,2011; Rudraswami et al., 2011; Ushikubo et al., 2012;Schrader et al., 2013; Tenner et al., 2013) (Fig. 1), whichis distinct from the relatively small variability in oxygen iso-tope ratios of chondrules from ordinary and E3 chondrites(Clayton et al., 1991; Kita et al., 2010; Weisberg et al.,2011). Ushikubo et al. (2012) defined the primitive chon-drule mineral (PCM) line as having a d18O versus d17Oslope of 0.987 ± 0.013, based on high precision secondaryion mass spectrometry (SIMS) measurements of chondrulesfrom Acfer 094, one of the least metamorphosed carbona-ceous chondrites (Grossman and Brearley, 2005). This slopeis unique when compared to oxygen isotope ratios in terres-trial materials, and likely originated through mass-indepen-dent fractionation processes early in the Solar System(Thiemens and Heidenreich, 1983; Yurimoto andKuramoto, 2004; Lyons and Young, 2005; Young et al.,2008; Lyons et al., 2009; Chakraborty et al., 2013). Such
processes could be responsible for the large variations ofoxygen isotope ratios in chondritic materials, including16O-rich CAIs and chondrules with d17,18O values downto �–75& (Kobayashi et al., 2003; Gounelle et al., 2009)and 16O-poor cosmic symplectites (Fe, Ni metal and sul-fides oxidized by H2O; Sakamoto et al., 2007) and organicmaterial (Hashizume et al., 2011), with positive d17,18O val-ues up to several hundred per mil (Fig. 1). In relation tothese materials, chondrules from carbonaceous chondritesare intermediate in d17O and d18O (Fig. 1). Thus, it is con-ceivable that chondrule values, and their range of values,were influenced by mixing of 16O-rich and 16O-poor precur-sors (e.g. Clayton et al., 1983). The presence of isotopicallydistinct “relict” mineral grains in chondrules, which areeither 16O-rich or 16O-poor relative to minerals that crystal-lized from the final “host” chondrule melt (Kunihiro et al.,2004, 2005; Wasson et al., 2004; Connolly and Huss,2010; Rudraswami et al., 2011; Ushikubo et al., 2012;Schrader et al., 2013; Tenner et al., 2013) supports thishypothesis.
Within many primitive carbonaceous chondrites, type Ichondrules are enriched in 16O when compared to type IIchondrules (Jones et al., 2000, 2004; Kunihiro et al., 2004,2005; Krot et al., 2006a, 2006b; Connolly and Huss, 2010;Nakashima et al., 2010; Rudraswami et al., 2011;Ushikubo et al., 2012; Schrader et al., 2013; Tenner et al.,
230 T.J. Tenner et al. / Geochimica et Cosmochimica Acta 148 (2015) 228–250
2013). This relationship led Connolly and Huss (2010) tohypothesize that addition of 16O-poor H2O (e.g. Fig. 1) toFeO-poor chondrule precursors, along with increases indust enrichment, contributed to an oxidized environmentthat formed comparatively FeO-rich chondrules. If true,one might expect to observe a systematic relationshipbetween Mg#’s and oxygen isotope ratios of chondrules,particularly among type I chondrules, as metal–silicatephase equilibria predicts a four-order of magnitude increasein fO2 as chondrule Mg#’s decrease from 100 to 90. How-ever, such a relationship is not clearly defined among cur-rent type I chondrule datasets because either (1) they lackdetailed Mg#’s; (2) not enough data exist within a givenstudy; (3) the chondrules studied encompass a limitedMg# range (e.g. type I chondrules measured by Ushikuboet al., 2012 and Tenner et al., 2013 mainly haveMg#’s > 98, while a few have Mg#’s near 95); or (4)Mg# data are compromised by Fe–Mg diffusion duringthermal metamorphism (e.g. Allende CV3.6 chondrulesmeasured by Rudraswami et al., 2011). As a result, we havechosen to investigate Mg# and O-isotope systematics froma large suite of type I chondrules in pristine, CR3.0 chon-drites by scanning electron microscopy (SEM), electronmicroprobe analysis (EMP), and SIMS. CR3.0 chondritesare ideal for this undertaking because they lack evidenceof thermal metamorphism and aqueous alteration (Abreuand Brearley, 2010), and because CR chondrites are domi-nated by type I chondrules with a more complete range ofMg#’s (Weisberg et al., 1993). By determining the relation-ship between Mg#’s and oxygen isotope ratios of type I CRchondrules, our goal is to more clearly understand the envi-ronment from which they formed.
2. SAMPLE SELECTION AND ANALYTICAL
TECHNIQUES
Meteorite Hills (MET) 00426 and Queen AlexandraRange (QUE) 99177 CR chondrites were chosen for inves-tigation. Their mineralogic and petrologic characteristics(i.e. ubiquitous amorphous material and nanosulfides inmatrices and fine-grained rims, preserved unaltered chon-drule glass, and very low abundances of phyllosilicatesand calcite in matrices) indicate they escaped significantthermal metamorphism and aqueous alteration, leading totheir classification as rare, petrologic type 3.00 chondrites(Abreu and Brearley, 2010). CR chondrites also have abun-dant type I chondrules with olivine compositions rangingfrom Fo90–99.5 (Weisberg et al., 1993). Thin sections MET00426,46 and QUE 99177,49 were obtained forcharacterization.
2.1. Scanning electron microscopy
Chondrule petrography was examined with a HitachiS-3400 N SEM equipped with an energy dispersive X-rayspectrometer (EDS). Regions from phenocrysts that werefree of cracks, pits and inclusions were identified as targetsfor EMP and SIMS analysis. When possible, we locatedregions of interest from both multiple phenocrysts and mul-tiple phases per chondrule.
2.2. Electron microprobe analysis
Major element oxide (SiO2, TiO2, Al2O3, Cr2O3, FeO,MnO, MgO, CaO, Na2O, and K2O) concentrations of crys-talline phases were obtained with a Cameca SX-51 electronmicroprobe (EMP) using a 15 keV accelerating voltage, a10 nA beam current, a fully focused beam, and respectivepeak and background counting times of 10 and 5 s. Stan-dards consisted of olivine (Fo0, 83, 89, 100), pyroxene (ensta-tite, diopside, wollastonite, augite, jadeite and omphacite),plagioclase (An0, 18, 49, 67, 78, 95), rutile, hornblende, chro-mite, hematite, tephroite, and microcline. Data reduction,including a u(qZ) matrix correction, was performed withProbe for Windows software. For plagioclase, Na countrates were monitored using albite-rich endmember stan-dards, and no appreciable drop-off was observed underanalytical conditions. Calculated detection limits (at 99%confidence) are 0.06, 0.05, 0.05, 0.06, 0.09, 0.08, 0.05,0.04, 0.05, and 0.03 wt.%, respectively, for the oxides listedabove. During sessions olivine, pyroxene, and plagioclasestandards were periodically analyzed as unknowns toensure that appropriate concentrations and totals of 99–101 wt.% were achieved, and that cations were within 0.01of ideal stoichiometry. Line traverses of EMP analyses werecollected at the exact locations of subsequent SIMSanalyses.
2.3. Oxygen three-isotope analysis by SIMS
In-situ oxygen three-isotope measurements of olivine,pyroxene, and plagioclase in chondrules were acquired withthe Cameca IMS 1280 SIMS at the University of Wiscon-sin-Madison. Analytical methods are similar to thosedescribed in Kita et al. (2010). The primary Cs+ beamwas tuned to produce a 15 lm diameter spot with a primaryion intensity of �3 nA. Secondary ions of 16O, 17O, and 18Owere detected with three Faraday cups simultaneously, withrates of �2.5 � 109, �1 � 106, and �5 � 106 counts per sec-ond (cps), respectively. Mass resolving power (MRP at 10%peak height) was set to �2200 for 16O and 18O using twodetectors on the multi-collection array, and 5000 for 17Ousing a mono-collector at a fixed position. Following eachanalysis 16O1H was monitored to determine its contributionto the 17O signal (e.g. Heck et al., 2010) and was calculatedto have an effect of less than 0.1&, with a typical contribu-tion of �0.01&.
External reproducibility was established and intermit-tently monitored by measurements of a San Carlos olivinestandard (d18O = 5.32& VSMOW; Kita et al., 2010), where8 standard analyses, 4 before and 4 after, bracketed 10–15analyses of unknowns (Kita et al., 2009). External repro-ducibility is calculated as twice the standard deviation(2SD) of San Carlos olivine bracketing measurements (n:31 brackets), with average values of 0.3, 0.4 and 0.4& ford18O, d17O, and D17O (=d17O–0.52 � d18O), respectively.The external reproducibility in d17O is similar to the inter-nal error in d17O, and is consistent with the thermal back-ground noise (400 cps per 100 s integration; 1SD) fromthe FC detector. However, the external reproducibility ind18O exceeds the respective internal error of a single analy-
T.J. Tenner et al. / Geochimica et Cosmochimica Acta 148 (2015) 228–250 231
sis (typically 0.1&), indicating the instrumental bias variesfrom one spot to the next (e.g. Kita et al., 2009). As a result,we assign the bracketing 2SD to represent the uncertaintyof a single analysis. For reference, internal errors amongstandards and unknowns were indistinguishable. As such,we did not include internal error in the spot to spotuncertainty.
Instrumental biases due to variability in olivine andpyroxene compositions were assessed by measuringFo60–100, low-Ca pyroxene (En85–97), and diopside (Wo50)standards with known d18OVSMOW values, and by establish-ing calibration curves normalized relative to the bias of theSan Carlos olivine bracketing standard (Appendix EA1).Endmember ranges of standards cover the compositionsof nearly all unknowns measured. Differences in the biascorrection as a function of endmember component forFo60–100, En85–100, and Wo0–50 are, at a maximum, 0.5&,0.9&, and 2.8&, respectively (Appendix EA1). For plagio-clase measurements a constant 2.0& bias correction wasapplied, based on an An95 standard. This is appropriategiven that unknowns are near An95 in composition.
To assess the degree of homogeneity of chondruleoxygen isotope ratios, multiple SIMS analyses were collectedper chondrule (n = 3 to 14; average: 8). This is particularlyimportant because chondrules from carbonaceous chon-drites often have olivines with heterogeneous oxygen iso-tope ratios (Kunihiro et al., 2004, 2005; Wasson et al.,2004; Connolly and Huss, 2010; Rudraswami et al., 2011;Ushikubo et al., 2012; Schrader et al., 2013; Tenner et al.,2013), indicating they did not crystallize from the finalchondrule melt. Such olivines likely attained their oxygenisotope signatures from a previous generation of meltingand crystallization of solid precursors; grains then remainedpartially or fully intact during the final chondrule-formingevent. Their oxygen isotope signatures were preservedbecause of low oxygen diffusion rates in olivine at chon-drule-forming conditions (e.g. Chakraborty, 2010). Sucholivines are commonly defined as “relicts”; their data areexcluded when determining the “host” oxygen isotope ratioof a chondrule, defined as that representing the bulk valueof the final chondrule melt. Similar to Ushikubo et al.(2012) and Tenner et al. (2013), we define relict olivines asthose with D17O values exceeding the 3SD external repro-ducibility (in this study, 0.6&) when compared to the aver-aged “host” D17O value of a chondrule.
Uncertainties of averaged d18O and d17O per chondruleare taken as the propagation of (1) the 2 standard error(2SE) of chondrule analyses (=2SD/
pnumber of analyses);
(2) the 2SE of associated San Carlos olivine bracketinganalyses, which accounts for uncertainty in the matrix cor-rection (e.g. Appendix EA1); and (3) the uncertainty due tosample topography and/or sample positioning on the SIMSstage, estimated to be 0.3& for d18O and 0.15& for d17O(Kita et al., 2009). The propagated uncertainty in D17O usesonly components (1) and (2), because (3) is mass-dependentand does not affect D17O.
After SIMS analyses backscattered electron (BSE)images were collected of sputtered pits. Fifteen of 404 pitssignificantly overlapped surface imperfections and/or for-eign phases (>20% of the pit); such analyses were rejected
due to an increased likelihood of erroneous d18O andd17O data.
3. RESULTS
Representative BSE images of chondrules are shown inFig. 2. BSE images of all chondrules, denoting SIMS pitsand analysis numbers, are shown in Appendix EA2. EMPdata are compiled in Appendix EA3. Individual oxygen iso-tope measurements are summarized in Appendix EA4.
3.1. Chondrule petrography and mineralogy
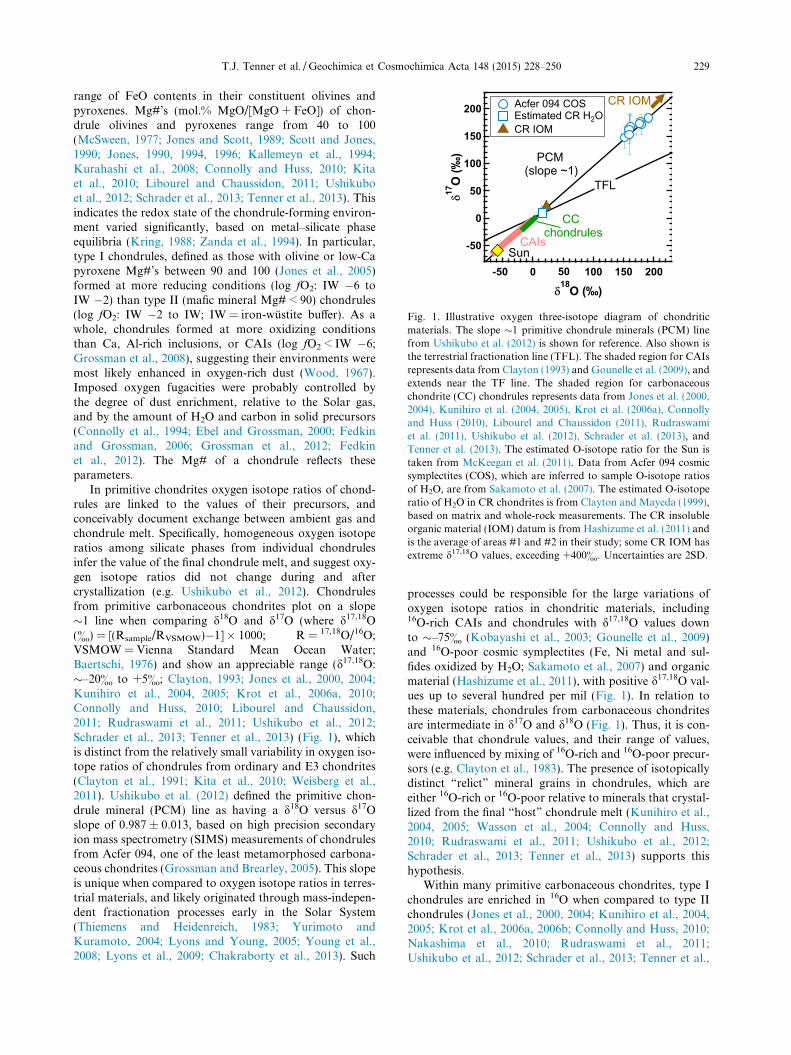
Within the MET 00426,46 section essentially everychondrule/fragment was investigated (Appendix EA2), con-stituting 26 type I chondrules/fragments, and 3 type IIchondrule fragments. Type I chondrules/fragments rangefrom 200 lm to 2 mm in diameter, while type II chondrulefragments are 70–100 lm in size. Twenty-five type I chond-rules/fragments are porphyritic; 3 are porphyritic olivine(PO; >80% modal olivine, relative to pyroxene) (e.g.Fig. 2a), 4 are porphyritic pyroxene (PP; <20% modal oliv-ine) (e.g. Fig. 2b), and 18 are porphyritic olivine-pyroxene(POP; 20–80% modal olivine) (e.g. Fig. 2c) in texture.One type I chondrule has a barred olivine (BO) texture(Fig. 2d). Type II chondrule fragments are PO textured(e.g. Fig. 2e and f). Fifteen of 29 objects have a high degreeof angularity along their outer periphery, leading to theirclassification as chondrule fragments (e.g. Ebel et al.,2008). One chondrule, M5, is irregular in shape (AppendixEA2). Admittedly, classification of chondrules as frag-ments, or as being irregularly-shaped, is somewhat subjec-tive. Within each type I chondrule/fragment, olivine andlow-Ca pyroxene compositions are spatially homogeneous,with typical Fo, En, and Wo variations of 0.2, 0.4 and 0.1,respectively (1SD). Chondrule fragment M3 (type I PP;Fig. 2b) exhibits the greatest spatial variability, as low-Capyroxenes vary by 1.6 and 1.2 (1SD) in En and Wo. Aver-aged olivine Fo contents among type I chondrules rangefrom 96.7 to 99.2, and averaged low-Ca pyroxene En andWo contents range from 91.4 to 98.1, and 0.4 to 3.0, respec-tively. Within the bounds of EMP analyses type II chon-drule fragments exhibit greater Fo spatial variability, asM11, M15, and M25 have 1SD’s of 0.8, 3.7, and 1.8, respec-tively (Appendix EA3). No high Fo content cores are pres-ent in their phenocrysts (e.g. Fig. 2e, f). Averaged Focontents in M11, M15, and M25 are 53.4, 53.8, and 62.2,respectively.
The QUE 99177,49 section has 55 type I chondrules/fragments (Appendix EA2). No suitable type II chond-rules/fragments were located. Nineteen of 55 were chosenfor characterization based on (1) maximizing the range ofconstituent olivine/pyroxene Mg#’s; and (2) the presenceof measurable anorthite for future 26Al–26Mg isotope chro-nology by SIMS. Chosen chondrules/fragments are 400 lmto 3 mm in size. Of the 19 type I chondrules/fragments, 15are POP (e.g. Fig. 2h) and 1 is a PO chondrule (Fig. 2i). Theremaining three chondrules are layered/compound in tex-ture; two consist of a BO core and a POP periphery(Fig. 2j and k), and one is a large POP chondrule containing
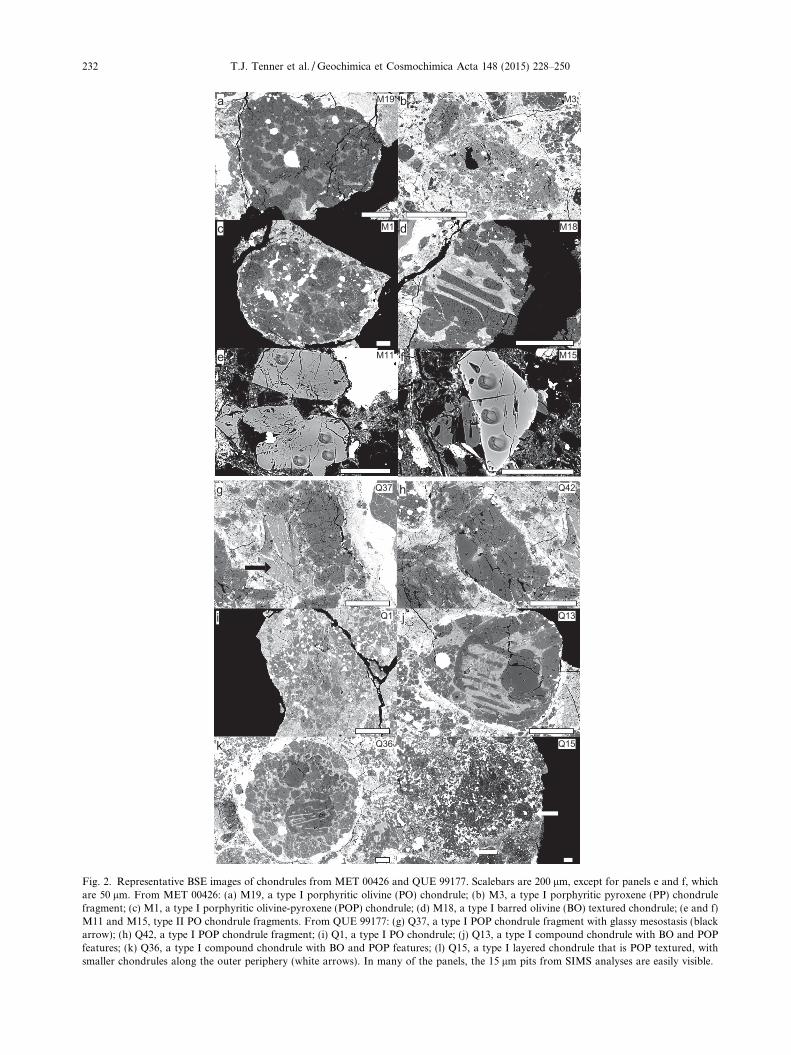
M3ba M19
d M18c M1
M11e M15f
g Q42
Q13j
Q37 h
Q1i
k Q36 l Q15
Fig. 2. Representative BSE images of chondrules from MET 00426 and QUE 99177. Scalebars are 200 lm, except for panels e and f, whichare 50 lm. From MET 00426: (a) M19, a type I porphyritic olivine (PO) chondrule; (b) M3, a type I porphyritic pyroxene (PP) chondrulefragment; (c) M1, a type I porphyritic olivine-pyroxene (POP) chondrule; (d) M18, a type I barred olivine (BO) textured chondrule; (e and f)M11 and M15, type II PO chondrule fragments. From QUE 99177: (g) Q37, a type I POP chondrule fragment with glassy mesostasis (blackarrow); (h) Q42, a type I POP chondrule fragment; (i) Q1, a type I PO chondrule; (j) Q13, a type I compound chondrule with BO and POPfeatures; (k) Q36, a type I compound chondrule with BO and POP features; (l) Q15, a type I layered chondrule that is POP textured, withsmaller chondrules along the outer periphery (white arrows). In many of the panels, the 15 lm pits from SIMS analyses are easily visible.
232 T.J. Tenner et al. / Geochimica et Cosmochimica Acta 148 (2015) 228–250
T.J. Tenner et al. / Geochimica et Cosmochimica Acta 148 (2015) 228–250 233
small chondrules along its periphery (Fig. 2l). Seven of 19are classified as chondrule fragments, and four chondrulesare irregularly shaped. Similar to MET 00426, multipleEMP analyses within QUE 99177 chondrules/fragmentsrevealed spatially homogeneous olivines and low-Ca pyrox-enes, with typical Fo, En, and Wo 1SD values of 0.2, 0.3,and 0.1, respectively. Chondrule fragment Q42 (POP;Fig. 2h) exhibits the greatest spatial variability, as olivineFo contents vary by 1.1 (1SD) (Appendix EA3). ChondruleQ13, a compound chondrule, contains a large Fo99.3 pheno-cryst set in a Fo98.4 barred olivine texture (Fig. 2j). Thisphenocryst has features suggesting it may or may not havecrystallized from the final chondrule melt (Appendix EA5).Averaged Fo contents among chondrules/fragments rangefrom 95.7 to 99.2, and averaged chondrule low-Ca pyrox-ene En and Wo contents range from 94.2–98.1 and 0.4–3.0, respectively (Appendix EA3).
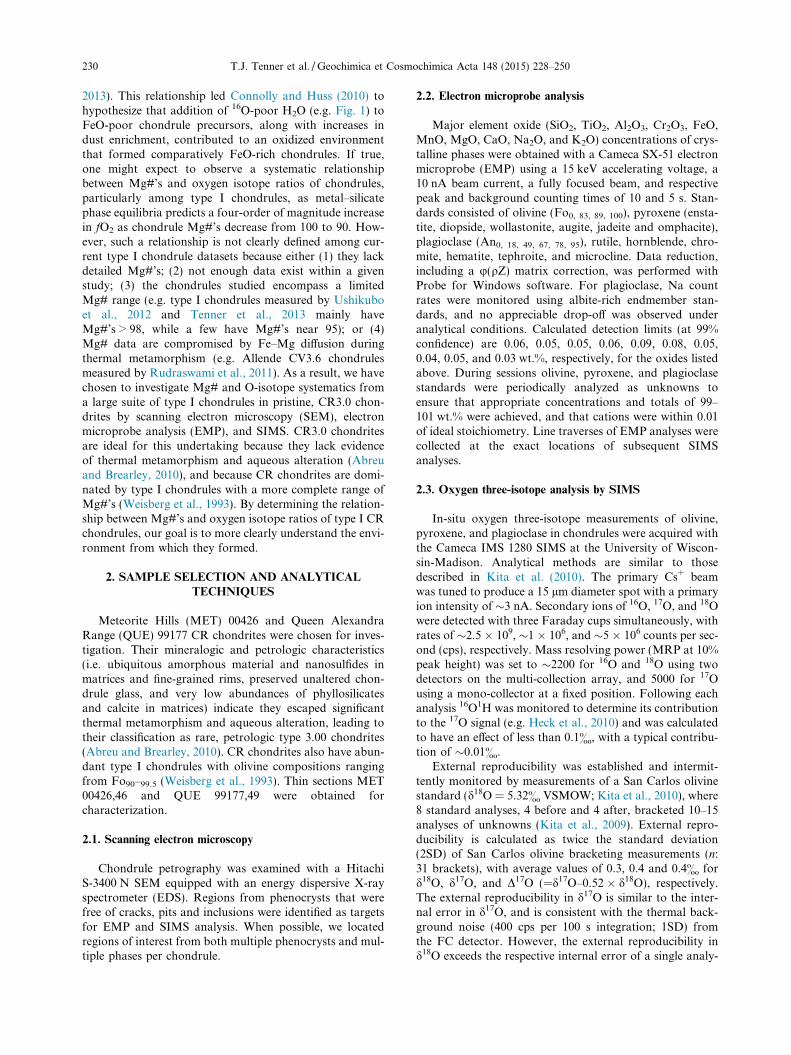
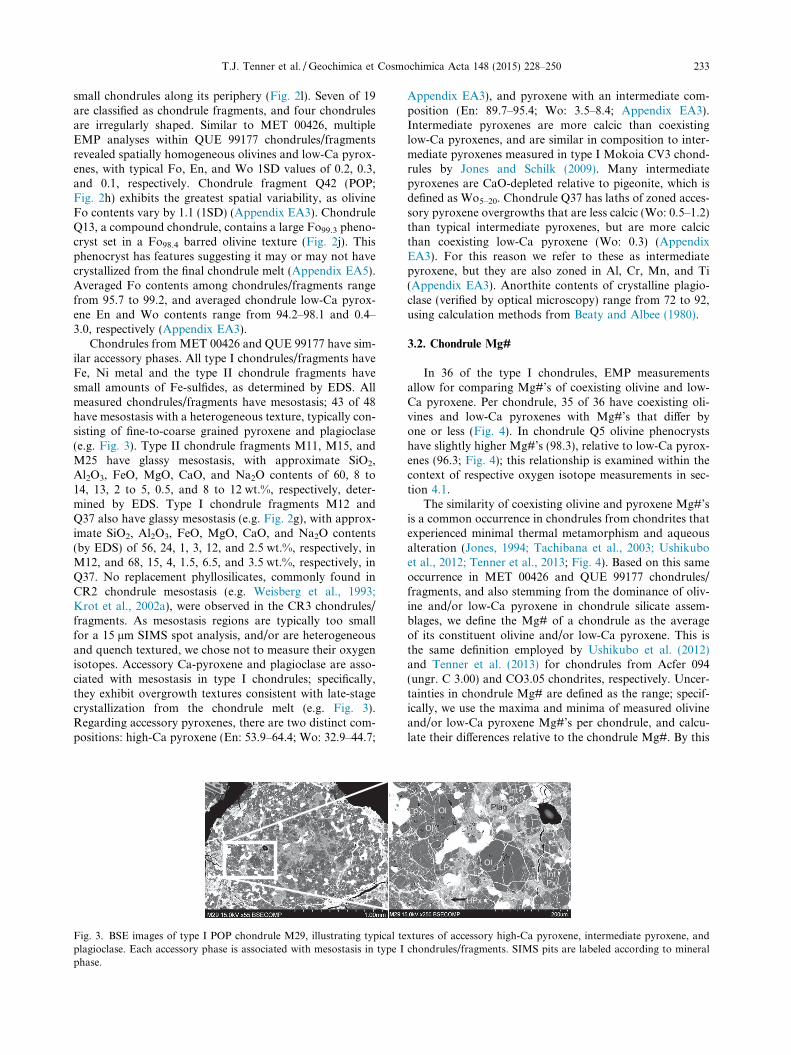
Chondrules from MET 00426 and QUE 99177 have sim-ilar accessory phases. All type I chondrules/fragments haveFe, Ni metal and the type II chondrule fragments havesmall amounts of Fe-sulfides, as determined by EDS. Allmeasured chondrules/fragments have mesostasis; 43 of 48have mesostasis with a heterogeneous texture, typically con-sisting of fine-to-coarse grained pyroxene and plagioclase(e.g. Fig. 3). Type II chondrule fragments M11, M15, andM25 have glassy mesostasis, with approximate SiO2,Al2O3, FeO, MgO, CaO, and Na2O contents of 60, 8 to14, 13, 2 to 5, 0.5, and 8 to 12 wt.%, respectively, deter-mined by EDS. Type I chondrule fragments M12 andQ37 also have glassy mesostasis (e.g. Fig. 2g), with approx-imate SiO2, Al2O3, FeO, MgO, CaO, and Na2O contents(by EDS) of 56, 24, 1, 3, 12, and 2.5 wt.%, respectively, inM12, and 68, 15, 4, 1.5, 6.5, and 3.5 wt.%, respectively, inQ37. No replacement phyllosilicates, commonly found inCR2 chondrule mesostasis (e.g. Weisberg et al., 1993;Krot et al., 2002a), were observed in the CR3 chondrules/fragments. As mesostasis regions are typically too smallfor a 15 lm SIMS spot analysis, and/or are heterogeneousand quench textured, we chose not to measure their oxygenisotopes. Accessory Ca-pyroxene and plagioclase are asso-ciated with mesostasis in type I chondrules; specifically,they exhibit overgrowth textures consistent with late-stagecrystallization from the chondrule melt (e.g. Fig. 3).Regarding accessory pyroxenes, there are two distinct com-positions: high-Ca pyroxene (En: 53.9–64.4; Wo: 32.9–44.7;
Fig. 3. BSE images of type I POP chondrule M29, illustrating typical teplagioclase. Each accessory phase is associated with mesostasis in type Iphase.
Appendix EA3), and pyroxene with an intermediate com-position (En: 89.7–95.4; Wo: 3.5–8.4; Appendix EA3).Intermediate pyroxenes are more calcic than coexistinglow-Ca pyroxenes, and are similar in composition to inter-mediate pyroxenes measured in type I Mokoia CV3 chond-rules by Jones and Schilk (2009). Many intermediatepyroxenes are CaO-depleted relative to pigeonite, which isdefined as Wo5–20. Chondrule Q37 has laths of zoned acces-sory pyroxene overgrowths that are less calcic (Wo: 0.5–1.2)than typical intermediate pyroxenes, but are more calcicthan coexisting low-Ca pyroxene (Wo: 0.3) (AppendixEA3). For this reason we refer to these as intermediatepyroxene, but they are also zoned in Al, Cr, Mn, and Ti(Appendix EA3). Anorthite contents of crystalline plagio-clase (verified by optical microscopy) range from 72 to 92,using calculation methods from Beaty and Albee (1980).
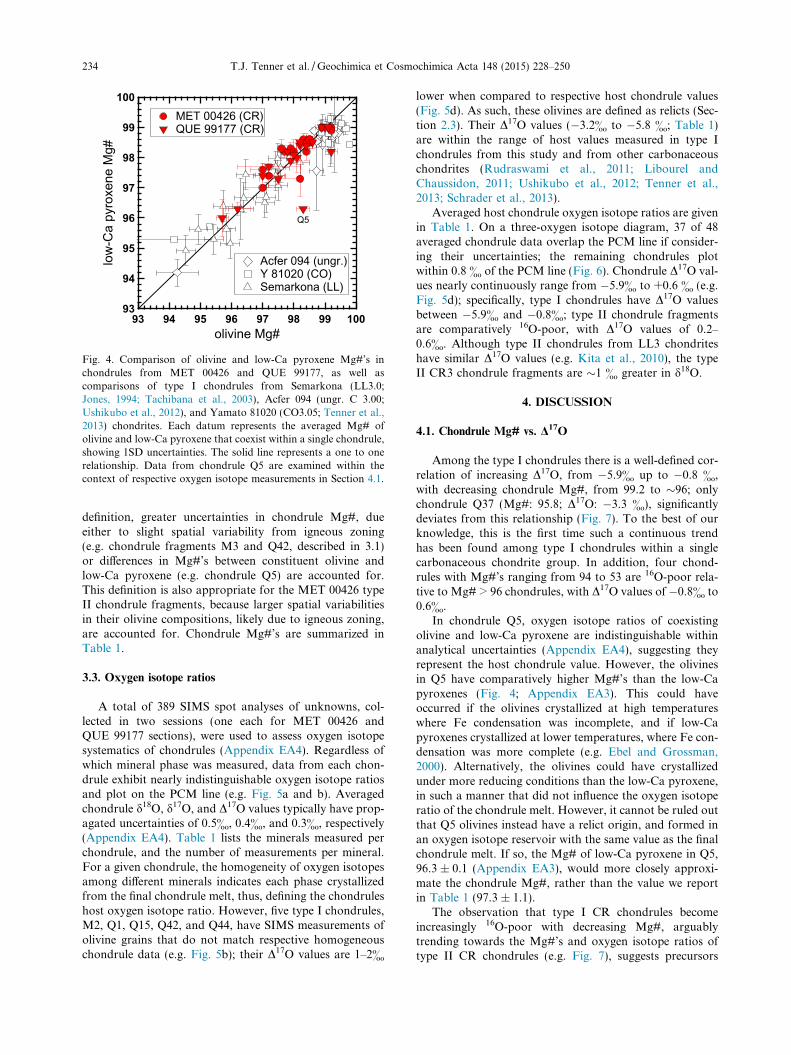
3.2. Chondrule Mg#
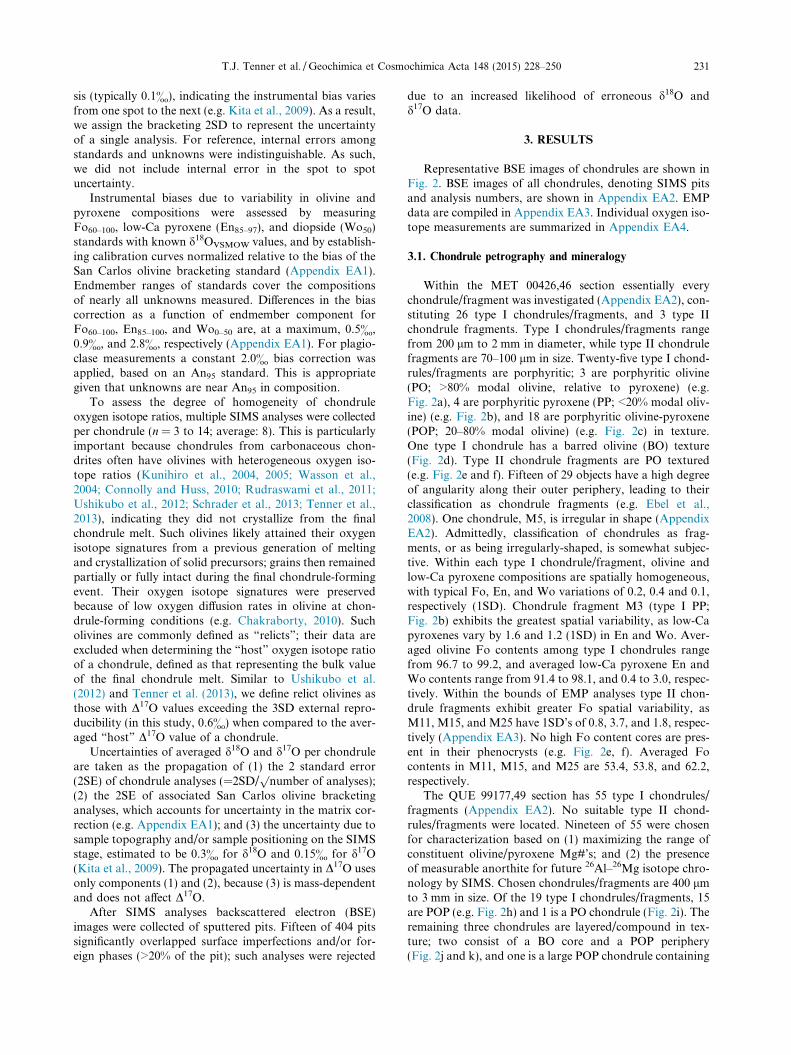
In 36 of the type I chondrules, EMP measurementsallow for comparing Mg#’s of coexisting olivine and low-Ca pyroxene. Per chondrule, 35 of 36 have coexisting oli-vines and low-Ca pyroxenes with Mg#’s that differ byone or less (Fig. 4). In chondrule Q5 olivine phenocrystshave slightly higher Mg#’s (98.3), relative to low-Ca pyrox-enes (96.3; Fig. 4); this relationship is examined within thecontext of respective oxygen isotope measurements in sec-tion 4.1.
The similarity of coexisting olivine and pyroxene Mg#’sis a common occurrence in chondrules from chondrites thatexperienced minimal thermal metamorphism and aqueousalteration (Jones, 1994; Tachibana et al., 2003; Ushikuboet al., 2012; Tenner et al., 2013; Fig. 4). Based on this sameoccurrence in MET 00426 and QUE 99177 chondrules/fragments, and also stemming from the dominance of oliv-ine and/or low-Ca pyroxene in chondrule silicate assem-blages, we define the Mg# of a chondrule as the averageof its constituent olivine and/or low-Ca pyroxene. This isthe same definition employed by Ushikubo et al. (2012)and Tenner et al. (2013) for chondrules from Acfer 094(ungr. C 3.00) and CO3.05 chondrites, respectively. Uncer-tainties in chondrule Mg# are defined as the range; specif-ically, we use the maxima and minima of measured olivineand/or low-Ca pyroxene Mg#’s per chondrule, and calcu-late their differences relative to the chondrule Mg#. By this
LPx
Ol
Ol
Ol
Plag
LPx
HPx
IntPx
IntPx
xtures of accessory high-Ca pyroxene, intermediate pyroxene, andchondrules/fragments. SIMS pits are labeled according to mineral
100
99
98
97
96
95
94
93
low
-Ca
pyro
xene
Mg#
10099989796959493olivine Mg#
MET 00426 (CR)QUE 99177 (CR)
Acfer 094 (ungr.)Y 81020 (CO)Semarkona (LL)
Q5
Fig. 4. Comparison of olivine and low-Ca pyroxene Mg#’s inchondrules from MET 00426 and QUE 99177, as well ascomparisons of type I chondrules from Semarkona (LL3.0;Jones, 1994; Tachibana et al., 2003), Acfer 094 (ungr. C 3.00;Ushikubo et al., 2012), and Yamato 81020 (CO3.05; Tenner et al.,2013) chondrites. Each datum represents the averaged Mg# ofolivine and low-Ca pyroxene that coexist within a single chondrule,showing 1SD uncertainties. The solid line represents a one to onerelationship. Data from chondrule Q5 are examined within thecontext of respective oxygen isotope measurements in Section 4.1.
234 T.J. Tenner et al. / Geochimica et Cosmochimica Acta 148 (2015) 228–250
definition, greater uncertainties in chondrule Mg#, dueeither to slight spatial variability from igneous zoning(e.g. chondrule fragments M3 and Q42, described in 3.1)or differences in Mg#’s between constituent olivine andlow-Ca pyroxene (e.g. chondrule Q5) are accounted for.This definition is also appropriate for the MET 00426 typeII chondrule fragments, because larger spatial variabilitiesin their olivine compositions, likely due to igneous zoning,are accounted for. Chondrule Mg#’s are summarized inTable 1.
3.3. Oxygen isotope ratios
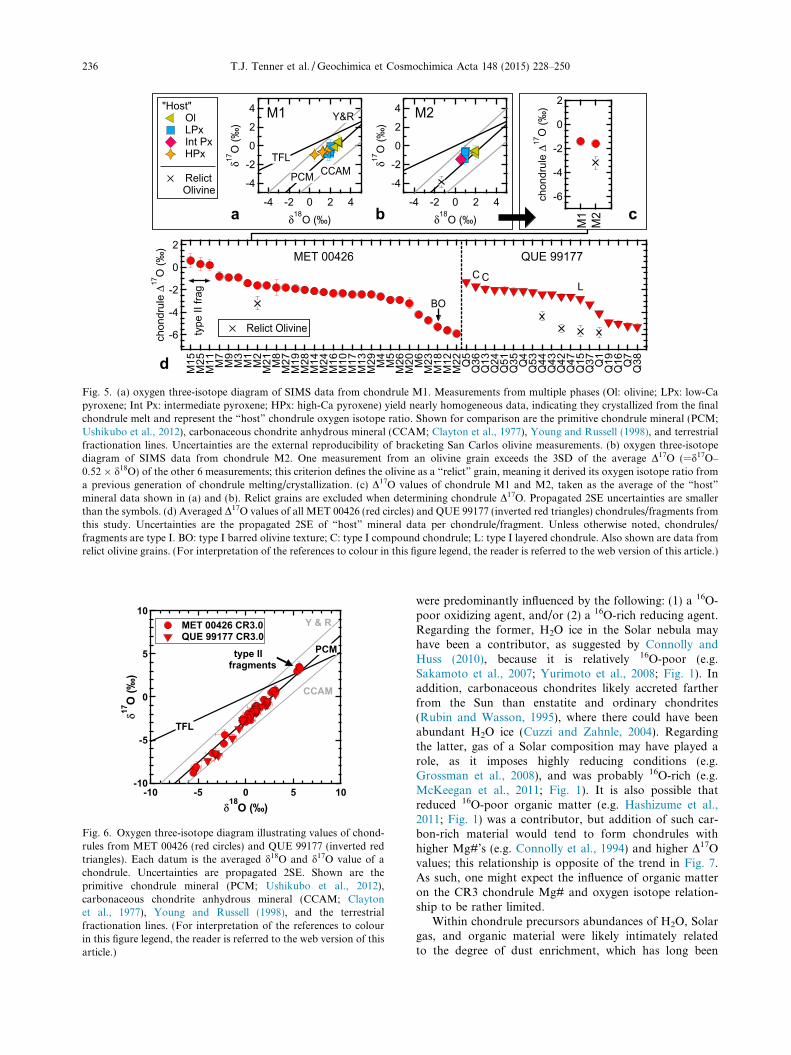
A total of 389 SIMS spot analyses of unknowns, col-lected in two sessions (one each for MET 00426 andQUE 99177 sections), were used to assess oxygen isotopesystematics of chondrules (Appendix EA4). Regardless ofwhich mineral phase was measured, data from each chon-drule exhibit nearly indistinguishable oxygen isotope ratiosand plot on the PCM line (e.g. Fig. 5a and b). Averagedchondrule d18O, d17O, and D17O values typically have prop-agated uncertainties of 0.5&, 0.4&, and 0.3&, respectively(Appendix EA4). Table 1 lists the minerals measured perchondrule, and the number of measurements per mineral.For a given chondrule, the homogeneity of oxygen isotopesamong different minerals indicates each phase crystallizedfrom the final chondrule melt, thus, defining the chondruleshost oxygen isotope ratio. However, five type I chondrules,M2, Q1, Q15, Q42, and Q44, have SIMS measurements ofolivine grains that do not match respective homogeneouschondrule data (e.g. Fig. 5b); their D17O values are 1–2&
lower when compared to respective host chondrule values(Fig. 5d). As such, these olivines are defined as relicts (Sec-tion 2.3). Their D17O values (�3.2& to �5.8 &; Table 1)are within the range of host values measured in type Ichondrules from this study and from other carbonaceouschondrites (Rudraswami et al., 2011; Libourel andChaussidon, 2011; Ushikubo et al., 2012; Tenner et al.,2013; Schrader et al., 2013).
Averaged host chondrule oxygen isotope ratios are givenin Table 1. On a three-oxygen isotope diagram, 37 of 48averaged chondrule data overlap the PCM line if consider-ing their uncertainties; the remaining chondrules plotwithin 0.8 & of the PCM line (Fig. 6). Chondrule D17O val-ues nearly continuously range from �5.9& to +0.6 & (e.g.Fig. 5d); specifically, type I chondrules have D17O valuesbetween �5.9& and �0.8&; type II chondrule fragmentsare comparatively 16O-poor, with D17O values of 0.2–0.6&. Although type II chondrules from LL3 chondriteshave similar D17O values (e.g. Kita et al., 2010), the typeII CR3 chondrule fragments are �1 & greater in d18O.
4. DISCUSSION
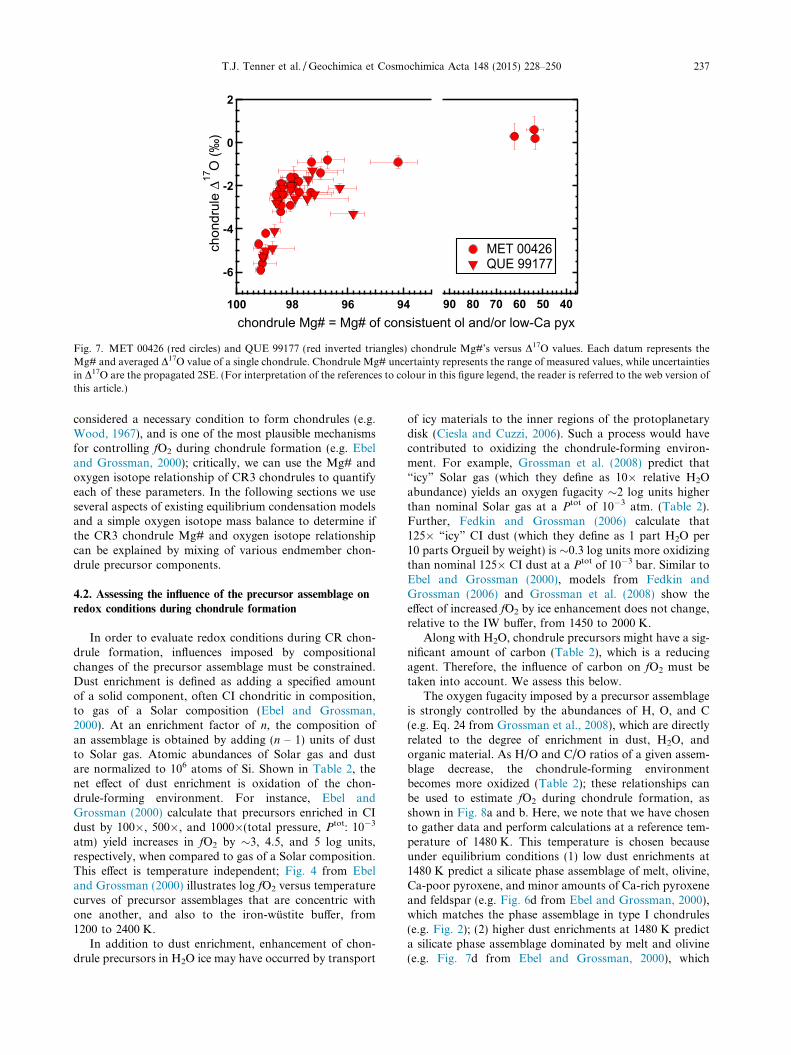
4.1. Chondrule Mg# vs. D17O
Among the type I chondrules there is a well-defined cor-relation of increasing D17O, from �5.9& up to �0.8 &,with decreasing chondrule Mg#, from 99.2 to �96; onlychondrule Q37 (Mg#: 95.8; D17O: �3.3 &), significantlydeviates from this relationship (Fig. 7). To the best of ourknowledge, this is the first time such a continuous trendhas been found among type I chondrules within a singlecarbonaceous chondrite group. In addition, four chond-rules with Mg#’s ranging from 94 to 53 are 16O-poor rela-tive to Mg# > 96 chondrules, with D17O values of �0.8& to0.6&.
In chondrule Q5, oxygen isotope ratios of coexistingolivine and low-Ca pyroxene are indistinguishable withinanalytical uncertainties (Appendix EA4), suggesting theyrepresent the host chondrule value. However, the olivinesin Q5 have comparatively higher Mg#’s than the low-Capyroxenes (Fig. 4; Appendix EA3). This could haveoccurred if the olivines crystallized at high temperatureswhere Fe condensation was incomplete, and if low-Capyroxenes crystallized at lower temperatures, where Fe con-densation was more complete (e.g. Ebel and Grossman,2000). Alternatively, the olivines could have crystallizedunder more reducing conditions than the low-Ca pyroxene,in such a manner that did not influence the oxygen isotoperatio of the chondrule melt. However, it cannot be ruled outthat Q5 olivines instead have a relict origin, and formed inan oxygen isotope reservoir with the same value as the finalchondrule melt. If so, the Mg# of low-Ca pyroxene in Q5,96.3 ± 0.1 (Appendix EA3), would more closely approxi-mate the chondrule Mg#, rather than the value we reportin Table 1 (97.3 ± 1.1).
The observation that type I CR chondrules becomeincreasingly 16O-poor with decreasing Mg#, arguablytrending towards the Mg#’s and oxygen isotope ratios oftype II CR chondrules (e.g. Fig. 7), suggests precursors

Table 1Oxygen isotope data for MET 00426 and QUE 99177 chondrules.
Chondrulea Type, texture n(ol, lpx, int. px, hpx, pl) d18O unc. d17O unc. D17O unc. D17O 2SD Mg#b +/�c
MET 00426
M1 I, POP 4,5,0,4,0 1.9 0.5 �0.3 0.4 �1.4 0.3 0.5 97.0 0.5,0.6M2 I, POP 3,3,1,0,0 1.0 0.8 �1.2 0.8 �1.6 0.3 0.6 97.9 0.5,0.3
M2 relict ol 1,0,0,0,0 �1.3 0.3 �3.9 0.6 �3.2 0.6 n.a. 97.7 n.a.M3 (f) I, PP 0,7,0,0,0 2.7 0.4 0.5 0.3 �0.9 0.3 0.4 94.2 1.0,0.7M4 I, POP & BO 1,4,0,0,0 �0.2 0.3 �2.7 0.3 �2.6 0.3 0.5 98.5 0.3,0.2M5 (ir.) I, POP 3,2,0,0,0 0.0 0.5 �2.9 0.3 �2.9 0.3 0.5 98.1 0.4,0.2M6 (f) I, POP 4,4,0,0,0 �2.3 0.4 �5.4 0.4 �4.2 0.2 0.6 99.0 0.1,0.1M7 (f) I, PP 0,4,0,0,0 3.1 0.5 0.8 0.5 �0.8 0.4 0.8 96.7 0.2,0.6M8 (f) I, POP 3,0,0,0,0 2.2 0.4 �0.6 0.7 �1.8 0.7 1.1 97.9 0.2,0.3M9 I, POP 4,4,1,4,0 2.9 0.4 0.7 0.4 �0.9 0.3 0.5 97.3 0.5,0.6M10 I, POP 4,4,0,0,0 1.1 0.5 �1.8 0.4 �2.3 0.2 0.4 97.3 0.5,0.8M11 (f) II, PO 4,0,0,0,0 5.4 0.3 3.0 0.5 0.2 0.5 0.3 53.4 0.9,0.8M12 (f) I, POP 4,4,1,3,0 �5.3 0.5 �8.3 0.4 �5.6 0.3 0.5 99.1 0.3,0.5M13 (f) I, POP 1,4,0,0,0 �0.3 0.3 �2.6 0.3 �2.4 0.2 0.4 98.6 0.2,0.1M14 (f) I, POP 3,4,0,2,0 0.4 0.6 �1.9 0.5 �2.1 0.3 0.7 98.0 0.6,0.4M15 (f) II, PO 3,0,0,0,0 5.6 0.3 3.5 0.6 0.6 0.6 0.6 53.8 3.3,4.1M16 I, POP 4,3,0,1,0 1.0 0.5 �1.8 0.3 �2.3 0.3 0.7 97.8 0.5,1.0M17 I, POP 4,4,0,0,0 0.6 0.4 �2.1 0.3 �2.4 0.2 0.5 98.3 0.2,0.6M18 I, BO 4,3,0,0,0 �5.2 0.5 �8.1 0.6 �5.3 0.4 1.0 99.0 0.1,0.1M19 I, PO 8,0,0,0,0 1.3 0.3 �1.2 0.2 �1.9 0.2 0.6 98.4 0.1,0.2M20 I, POP 1,2,0,1,0 �2.2 1.0 �4.4 0.6 �3.2 0.5 0.2 98.4 0.3,0.2M21 I, POP 3,4,3,0,0 1.1 0.5 �1.0 0.3 �1.6 0.2 0.5 98.1 0.3,0.2M22 (f) I, PO 8,0,0,0,0 �5.5 0.3 �8.8 0.3 �5.9 0.2 0.4 99.1 0.2,0.1M23 I, POP 6,0,2,0,0 �3.5 0.7 �6.5 0.4 �4.7 0.2 0.4 99.2 0.1,0.1M24 (f) I, POP 2,3,2,0,0 0.2 0.5 �2.0 0.4 �2.2 0.2 0.3 98.5 0.2,0.3M25 (f) II, PO 3,0,0,0,0 5.7 0.4 3.3 0.6 0.3 0.6 0.3 62.2 2.1,1.1M26 (f) I, PO 6,0,0,0,0 0.5 0.5 �2.7 0.3 �2.9 0.2 0.5 98.4 0.1,0.1M27 (f) I, PP 0,4,0,0,0 1.2 0.5 �1.1 0.3 �1.8 0.2 0.2 97.8 0.4,0.5M28 (f) I, POP 4,4,0,0,0 0.9 0.4 �1.5 0.4 �2.0 0.3 0.7 98.1 0.4,0.3M29 I, POP 4,4,4,1,0 �0.3 0.4 �2.6 0.3 �2.4 0.3 0.7 98.6 0.2,0.2
QUE 99177
Q1 I, PO 6,0,2,0,0 �1.4 0.4 �4.8 0.4 �4.1 0.3 0.8 98.6 0.1,0.2Q1 relict ol 1,0,0,0,0 �4.7 0.6 �8.2 0.4 �5.8 0.5 n.a. 98.4 n.a.
Q4 (f) I, POP 4,4,0,1,0 2.1 0.5 �1.0 0.3 �2.1 0.2 0.4 96.3 0.4,0.6Q5 I, POP 4,4,0,0,0 3.1 0.4 0.3 0.2 �1.3 0.2 0.2 97.3 1.2,1.1Q7 (ir.) I, POP 5,3,0,0,2 �2.9 0.5 �6.8 0.3 �5.2 0.3 0.5 99.0 0.2,0.1Q13 I, compound 3,4,0,0,2 1.1 0.4 �1.4 0.4 �1.9 0.3 0.6 98.4 0.2,0.2Q15 I, layered 4,5,0,1,1 �0.3 0.4 �3.0 0.3 �2.8 0.2 0.5 98.6 0.1,0.3
Q15 relict ol 1,0,0,0,0 �5.2 0.4 �8.4 0.6 �5.7 0.5 n.a. 98.7 n.a.Q16 (f) I, POP 4,4,1,0,1 �3.2 0.4 �6.7 0.3 �5.0 0.3 0.6 99.0 0.2,0.3Q19 (f) I, POP 4,4,0,0,0 �3.2 0.4 �6.5 0.5 �4.9 0.3 0.9 98.7 0.7,0.8Q24 (ir.) I, POP 4,4,0,0,1 1.7 0.5 �1.1 0.3 �2.0 0.2 0.5 98.0 0.3,0.3Q35 (ir.) I, POP 4,2,1,0,1 2.3 0.5 �0.9 0.4 �2.1 0.3 0.8 98.3 0.2,0.3Q36 I, compound 7,7,0,0,0 2.3 0.4 �0.5 0.3 �1.7 0.3 0.3 97.4 0.7,0.9Q37 (f) I, POP 3,3,3,0,0 �0.7 0.4 �3.7 0.3 �3.3 0.2 0.4 95.8 0.8,0.4Q38 (f) I, POP 3,4,0,0,1 �4.0 0.7 �7.4 0.3 �5.3 0.3 0.8 99.0 0.1,0.2Q42 (f) I, POP 6,3,0,0,0 0.5 0.5 �2.3 0.4 �2.6 0.3 0.7 97.5 0.8,1.5
Q42 relict ol 1,0,0,0,0 �4.1 0.4 �7.5 0.4 �5.4 0.4 n.a. 96.5 n.a.Q43 I, POP 6,2,4,0,0 1.1 0.4 �1.8 0.3 �2.4 0.2 0.5 97.2 0.4,0.6Q44 I, POP 3,4,0,1,1 0.7 0.4 �2.0 0.3 �2.4 0.2 0.5 98.3 0.2,0.2
Q44 relict ol 1,0,0,0,0 �1.5 0.2 �5.1 0.4 �4.4 0.4 n.a. 98.1 n.a.Q47 (ir.) I, POP 4,3,1,0,1 �0.3 0.5 �2.7 0.4 �2.6 0.2 0.4 97.9 0.1,0.1Q51 I, POP 3,3,0,0,0 0.8 0.5 �1.6 0.4 �2.0 0.3 0.7 98.1 0.3,0.6Q53 (f) I, POP 4,4,2,0,0 1.1 0.4 �1.6 0.3 �2.2 0.2 0.4 98.1 0.3,0.2
a (f) = chondrule fragment; (ir.) = irregularly shaped chondrule. Discussions in Zanda et al. (2002) and Ebel et al. (2008) were used as guidesto distinguish chondrule fragments from irregularly shaped chondrules.
b Chondrule Mg# = molar% MgO/(MgO + FeO) of constituent olivine and/or low-Ca pyroxene.c Uncertainties represent the range in measured Mg#’s of constituent olivine and/or low-Ca pyroxenes in chondrules.
T.J. Tenner et al. / Geochimica et Cosmochimica Acta 148 (2015) 228–250 235
-6
-4
-2
0
2
chon
drul
eΔ17
O (‰
)
-4
-2
0
2
4
δ17O
(‰)
-4 -2 0 2 4δ
18O (‰)
-4
-2
0
2
4
δ17O
(‰)
-4 -2 0 2 4δ
18O (‰)
-6
-4
-2
0
2
chon
drul
eΔ17
O (‰
)
M15
M25
M11 M
7M
9M
3M
1M
2M
21 M8
M27
M19
M28
M14
M24
M16
M10
M17
M13
M29 M
4M
5M
26M
20 M6
M23
M18
M12
M22 Q
5Q
36Q
13Q
24Q
51Q
35 Q4
Q53
Q44
Q43
Q42
Q47
Q15
Q37 Q
1Q
19Q
16 Q7
Q38
"Host" Ol LPx Int Px HPx
Relict Olivine
a
M1 M2
M1
M2b
d
TFL
type
II fr
ag
BO
C CL
Relict Olivine
MET 00426 QUE 99177
Y&R
PCM CCAM
c
Fig. 5. (a) oxygen three-isotope diagram of SIMS data from chondrule M1. Measurements from multiple phases (Ol: olivine; LPx: low-Capyroxene; Int Px: intermediate pyroxene; HPx: high-Ca pyroxene) yield nearly homogeneous data, indicating they crystallized from the finalchondrule melt and represent the “host” chondrule oxygen isotope ratio. Shown for comparison are the primitive chondrule mineral (PCM;Ushikubo et al., 2012), carbonaceous chondrite anhydrous mineral (CCAM; Clayton et al., 1977), Young and Russell (1998), and terrestrialfractionation lines. Uncertainties are the external reproducibility of bracketing San Carlos olivine measurements. (b) oxygen three-isotopediagram of SIMS data from chondrule M2. One measurement from an olivine grain exceeds the 3SD of the average D17O (=d17O–0.52 � d18O) of the other 6 measurements; this criterion defines the olivine as a “relict” grain, meaning it derived its oxygen isotope ratio froma previous generation of chondrule melting/crystallization. (c) D17O values of chondrule M1 and M2, taken as the average of the “host”mineral data shown in (a) and (b). Relict grains are excluded when determining chondrule D17O. Propagated 2SE uncertainties are smallerthan the symbols. (d) Averaged D17O values of all MET 00426 (red circles) and QUE 99177 (inverted red triangles) chondrules/fragments fromthis study. Uncertainties are the propagated 2SE of “host” mineral data per chondrule/fragment. Unless otherwise noted, chondrules/fragments are type I. BO: type I barred olivine texture; C: type I compound chondrule; L: type I layered chondrule. Also shown are data fromrelict olivine grains. (For interpretation of the references to colour in this figure legend, the reader is referred to the web version of this article.)
-10 -5 0 5 1018O (‰)
-10
-5
0
5
10
17O
(‰)
MET 00426 CR3.0 QUE 99177 CR3.0
TFL
PCM
CCAM
Y & R
type IIfragments
Fig. 6. Oxygen three-isotope diagram illustrating values of chond-rules from MET 00426 (red circles) and QUE 99177 (inverted redtriangles). Each datum is the averaged d18O and d17O value of achondrule. Uncertainties are propagated 2SE. Shown are theprimitive chondrule mineral (PCM; Ushikubo et al., 2012),carbonaceous chondrite anhydrous mineral (CCAM; Claytonet al., 1977), Young and Russell (1998), and the terrestrialfractionation lines. (For interpretation of the references to colourin this figure legend, the reader is referred to the web version of thisarticle.)
236 T.J. Tenner et al. / Geochimica et Cosmochimica Acta 148 (2015) 228–250
were predominantly influenced by the following: (1) a 16O-poor oxidizing agent, and/or (2) a 16O-rich reducing agent.Regarding the former, H2O ice in the Solar nebula mayhave been a contributor, as suggested by Connolly andHuss (2010), because it is relatively 16O-poor (e.g.Sakamoto et al., 2007; Yurimoto et al., 2008; Fig. 1). Inaddition, carbonaceous chondrites likely accreted fartherfrom the Sun than enstatite and ordinary chondrites(Rubin and Wasson, 1995), where there could have beenabundant H2O ice (Cuzzi and Zahnle, 2004). Regardingthe latter, gas of a Solar composition may have played arole, as it imposes highly reducing conditions (e.g.Grossman et al., 2008), and was probably 16O-rich (e.g.McKeegan et al., 2011; Fig. 1). It is also possible thatreduced 16O-poor organic matter (e.g. Hashizume et al.,2011; Fig. 1) was a contributor, but addition of such car-bon-rich material would tend to form chondrules withhigher Mg#’s (e.g. Connolly et al., 1994) and higher D17Ovalues; this relationship is opposite of the trend in Fig. 7.As such, one might expect the influence of organic matteron the CR3 chondrule Mg# and oxygen isotope relation-ship to be rather limited.
Within chondrule precursors abundances of H2O, Solargas, and organic material were likely intimately relatedto the degree of dust enrichment, which has long been
-6
-4
-2
0
2
100 98 96 94 90 80 70 60 50 40chondrule Mg# = Mg# of consistuent ol and/or low-Ca pyx
chon
drul
eΔ17
O (‰
)
MET 00426QUE 99177
Fig. 7. MET 00426 (red circles) and QUE 99177 (red inverted triangles) chondrule Mg#’s versus D17O values. Each datum represents theMg# and averaged D17O value of a single chondrule. Chondrule Mg# uncertainty represents the range of measured values, while uncertaintiesin D17O are the propagated 2SE. (For interpretation of the references to colour in this figure legend, the reader is referred to the web version ofthis article.)
T.J. Tenner et al. / Geochimica et Cosmochimica Acta 148 (2015) 228–250 237
considered a necessary condition to form chondrules (e.g.Wood, 1967), and is one of the most plausible mechanismsfor controlling fO2 during chondrule formation (e.g. Ebeland Grossman, 2000); critically, we can use the Mg# andoxygen isotope relationship of CR3 chondrules to quantifyeach of these parameters. In the following sections we useseveral aspects of existing equilibrium condensation modelsand a simple oxygen isotope mass balance to determine ifthe CR3 chondrule Mg# and oxygen isotope relationshipcan be explained by mixing of various endmember chon-drule precursor components.
4.2. Assessing the influence of the precursor assemblage on
redox conditions during chondrule formation
In order to evaluate redox conditions during CR chon-drule formation, influences imposed by compositionalchanges of the precursor assemblage must be constrained.Dust enrichment is defined as adding a specified amountof a solid component, often CI chondritic in composition,to gas of a Solar composition (Ebel and Grossman,2000). At an enrichment factor of n, the composition ofan assemblage is obtained by adding (n – 1) units of dustto Solar gas. Atomic abundances of Solar gas and dustare normalized to 106 atoms of Si. Shown in Table 2, thenet effect of dust enrichment is oxidation of the chon-drule-forming environment. For instance, Ebel andGrossman (2000) calculate that precursors enriched in CIdust by 100�, 500�, and 1000�(total pressure, Ptot: 10�3
atm) yield increases in fO2 by �3, 4.5, and 5 log units,respectively, when compared to gas of a Solar composition.This effect is temperature independent; Fig. 4 from Ebeland Grossman (2000) illustrates log fO2 versus temperaturecurves of precursor assemblages that are concentric withone another, and also to the iron-wustite buffer, from1200 to 2400 K.
In addition to dust enrichment, enhancement of chon-drule precursors in H2O ice may have occurred by transport
of icy materials to the inner regions of the protoplanetarydisk (Ciesla and Cuzzi, 2006). Such a process would havecontributed to oxidizing the chondrule-forming environ-ment. For example, Grossman et al. (2008) predict that“icy” Solar gas (which they define as 10� relative H2Oabundance) yields an oxygen fugacity �2 log units higherthan nominal Solar gas at a Ptot of 10�3 atm. (Table 2).Further, Fedkin and Grossman (2006) calculate that125� “icy” CI dust (which they define as 1 part H2O per10 parts Orgueil by weight) is �0.3 log units more oxidizingthan nominal 125� CI dust at a Ptot of 10�3 bar. Similar toEbel and Grossman (2000), models from Fedkin andGrossman (2006) and Grossman et al. (2008) show theeffect of increased fO2 by ice enhancement does not change,relative to the IW buffer, from 1450 to 2000 K.
Along with H2O, chondrule precursors might have a sig-nificant amount of carbon (Table 2), which is a reducingagent. Therefore, the influence of carbon on fO2 must betaken into account. We assess this below.
The oxygen fugacity imposed by a precursor assemblageis strongly controlled by the abundances of H, O, and C(e.g. Eq. 24 from Grossman et al., 2008), which are directlyrelated to the degree of enrichment in dust, H2O, andorganic material. As H/O and C/O ratios of a given assem-blage decrease, the chondrule-forming environmentbecomes more oxidized (Table 2); these relationships canbe used to estimate fO2 during chondrule formation, asshown in Fig. 8a and b. Here, we note that we have chosento gather data and perform calculations at a reference tem-perature of 1480 K. This temperature is chosen becauseunder equilibrium conditions (1) low dust enrichments at1480 K predict a silicate phase assemblage of melt, olivine,Ca-poor pyroxene, and minor amounts of Ca-rich pyroxeneand feldspar (e.g. Fig. 6d from Ebel and Grossman, 2000),which matches the phase assemblage in type I chondrules(e.g. Fig. 2); (2) higher dust enrichments at 1480 K predicta silicate phase assemblage dominated by melt and olivine(e.g. Fig. 7d from Ebel and Grossman, 2000), which
Table 2Atomic abundances of Solar gas and CI dust; estimated imposed oxygen fugacities at 1480 K and Ptot: 10�3 atm or 10�3 bar, taken from Ebeland Grossman (2000) and Grossman et al. (2008).
SolarAP SolarA&G Icy Solara CI dustA&G 100� CIb 500� CIb 1000� CIb
H 2.79 � 1010 2.79 � 1010 2.80 � 1010 5.28 � 106 2.84 � 1010 3.05 � 1010 3.32 � 1010
He 2.72 � 109 2.72 � 109 2.72 � 109 2.72 � 109 2.72 � 109 2.72 � 109
O 1.37 � 107 2.38 � 107 6.62 � 107 7.63 � 106 7.79 � 108 3.83 � 109 7.65 � 109
C 6.85 � 106 1.01 � 107 6.85 � 106 7.56 � 105 8.49 � 107 3.87 � 108 7.65 � 108
N 3.13 � 106 3.13 � 106 3.13 � 106 5.98 � 104 9.05 � 106 3.30 � 107 6.29 � 107
Mg 1.07 � 106 1.07 � 106 1.07 � 106 1.07 � 106 1.07 � 108 5.35 � 108 1.07 � 109
Si 1.00 � 106 1.00 � 106 1.00 � 106 1.00 � 106 1.00 � 108 5.00 � 108 1.00 � 109
Fe 9.00 � 105 9.00 � 105 9.00 � 105 9.00 � 105 9.00 � 107 4.50 � 108 9.00 � 108
S 4.46 � 105 5.15 � 105 4.46 � 105 5.15 � 105 5.15 � 107 2.58 � 108 5.15 � 108
Al 8.49 � 104 8.49 � 104 8.49 � 104 8.49 � 104 8.49 � 106 4.25 � 107 8.49 � 107
Ca 6.11 � 104 6.11 � 104 6.11 � 104 6.11 � 104 6.11 � 106 3.06 � 107 6.11 � 107
Na 5.74 � 104 5.74 � 104 5.74 � 104 5.74 � 104 5.74 � 106 2.87 � 107 5.74 � 107
Ni 4.93 � 104 4.93 � 104 4.93 � 104 4.93 � 104 4.93 � 106 2.47 � 107 4.93 � 107
Cr 1.35 � 104 1.35 � 104 1.35 � 104 1.35 � 104 1.35 � 106 6.75 � 106 1.35 � 107
P 1.04 � 104 1.04 � 104 1.04 � 104 1.04 � 104 1.04 � 106 5.20 � 106 1.04 � 107
Mn 9.55 � 103 9.55 � 103 9.55 � 103 9.55 � 103 9.55 � 105 4.78 � 106 9.55 � 106
K 3.77 � 103 3.77 � 103 3.77 � 103 3.77 � 103 3.77 � 105 1.89 � 106 3.77 � 106
Ti 2.40 � 103 2.40 � 103 2.40 � 103 2.40 � 103 2.40 � 105 1.20 � 106 2.40 � 106
Co 2.25 � 103 2.25 � 103 2.25 � 103 2.25 � 103 2.25 � 105 1.13 � 106 2.25 � 106
H/O 2041 1172 423 0.69 36.48 7.97 4.34C/O 0.50 0.42 0.10 0.10 0.11 0.10 0.10log fO2 – log IW �6.8c �6.1d �4.8c �3.1d �1.8d �1.3d
*Solar gas and dust compositions are normalized to 106 atoms of Si. AP: Allende Prieto and Lambert (2001, 2002). A&G: Anders andGrevesse (1989).
a Composition taken from Grossman et al. (2008). H2O is added relative to the Solar gas composition from Allende Prieto and Lambert(2001, 2002).
b Composition is calculated by adding (n – 1) units of specified CI dust to the Solar gas composition from Anders and Grevesse (1989).c fO2 determined from Fig. 5 of Grossman et al. (2008).d fO2 determined from Fig. 4 of Ebel and Grossman (2000).
-8.0
-7.5
-7.0
-6.5
-6.0
0.80.60.40.20.0C/O ratio
-7
-6
-5
-4
-3
-2
-1
0
logfO
2 – lo
g IW
at 1
480
K
1 10 100 1000H/O ratio
Ebel and Grossman (2000)Fedkin and Grossman (2006)Grossman et al. (2008)
nominal valuecorrected to
carbon free
1000x
500x
125x"icy"
125x 75x
100x 50x"icy"Solar
A&GSolar
AP Solar carbon enhanced Solar (AP)
compositions. Ptot: 10–4 atm.
nominal Solar value
a b
Fig. 8. (a) H/O versus fO2 of systems enriched in CI dust at 1480 K and Ptot: 10�3 atm. or 10�3 bar. Data from Ebel and Grossman (2000) usethe Solar gas composition from Anders and Grevesse (1989), while data from Fedkin and Grossman (2006) and Grossman et al. (2008) use theSolar gas composition from Allende Prieto and Lambert (2001, 2002). “Icy” Solar gas has 10� the amount of H2O, by weight, relative to thenominal composition. The 125� “icy” CI dust enriched composition employs dust that consists of 1 part H2O to 10 parts Orgueil by weight.(b) C/O versus oxygen fugacity of Solar gas from Grossman et al. (2008) at 1480 K and Ptot: 10�4 atm. Data fit: log fO2 – logIW = 1.2007 � ln (1 – C/O) – 5.9225; r2: 0.998. Using this fit, imposed oxygen fugacities of assemblages can be corrected to carbon-freesystems (i.e. C/O: 0), represented by vertical arrows. As dust enriched systems have low C/O ratios (e.g. Table 2), represented by the crossedgray box on the x-axis, the estimated correction in fO2 is small. Open symbols in (a) illustrate data that are corrected to carbon-free (fit: logfO2 – log IW = –0.7740 � ln (H/O) – 0.0217; r2: 0.994).
238 T.J. Tenner et al. / Geochimica et Cosmochimica Acta 148 (2015) 228–250
matches that of type II chondrules (e.g. Fig. 2e and f); and(3) greater than 98% of Fe is condensed at dust enrichmentsexceeding 100� at 1480 K (e.g. Fig. 8a and b from Ebel and
Grossman, 2000); this condition is likely necessary in orderto explain the abundance of Fe, Ni metal in type I chond-rules, as well as the amount of FeO in type II chondrules
T.J. Tenner et al. / Geochimica et Cosmochimica Acta 148 (2015) 228–250 239
(e.g. Fig. 2). Although the reference temperature is substan-tially lower than experimentally determined chondrule-forming conditions (i.e. 1720–1970 K; Hewins andRadomsky, 1990), predicted log fO2 – log IW values at1480 K should be similar to those at higher temperatures,based on the aforementioned concentric log fO2 versus Tbehavior of assemblages predicted by models.
Fig. 8a compares CI dust enriched systems from severalstudies. Although datasets differ with respect to thecomposition of Solar gas, or with respect to enhancementin ice, a well-defined trend of H/O versus log fO2 – logIW is produced. To account for the influence of carbonwe apply a correction based on C/O versus fO2 datafrom Grossman et al. (2008) from a system of Solargas at 1480 K and a Ptot of 10�4 atm. (Fig. 8b), empiricallyfit by:
log fO2 � log IW ¼ 1:2007� lnð1� C=OÞ � 5:9225 ð1Þ
For CI dust enriched assemblages, which have C/Oratios of �0.10 (Table 2), the correction is small; Eq. (1)predicts that a carbon-free system is only 0.13 log unitshigher in fO2; however, the uncertainty of the correctionis probably large for dust enriched assemblages, as theirlow C/O ratios represent a significant extrapolation fromthe Solar gas data used to produce Eq. (1) (e.g. Fig. 8b).Nonetheless, data from Fig. 8a are corrected to carbon-freesystems using the “slope” from Eq. (1). Doing so allows forisolating the influence of an assemblage’s H/O ratio on fO2
(open symbols; Fig. 8a), empirically fit by:
log fO2 � log IW ¼ �0:7740� lnðH=OÞ � 0:0217 ð2Þ
By combining Eqs. (1) and (2) the oxygen fugacityimposed by a solid precursor at a specified dust enrichmentfactor and/or ice enhancement factor can be quantified:
log fO2 � log IW ¼ �0:7740� lnðH=OÞ � 0:0217
þ 1:2007� lnð1� C=OÞ ð3Þ
chond
logfO
2 – lo
g IW
at 1
480
K
-4.0
-3.5
-3.0
-2.5
-2.0
-1.5
-1.0
-0.5
100 90 80
100x CI
200x CI
500x CI
100
Fig. 9. Chondrule Mg# versus fO2 at 1480 K and Ptot: 10�3 atm. Data adata, mole fractions of fayalite are converted to chondrule Mg# (=100 –Section 3.2. CI dust enrichment factors are converted to imposed fO2 vaTable 2), where the composition of Solar gas is that from Anders and Grevexp(([log fO2 – log IW] + 3.444)/0.6649); r2: 0.999.
For simplicity, only changes in carbon contents of pre-cursors that are directly tied to dust enrichment and iceenhancement are considered in the following models.
4.3. Estimating chondrule Mg# as a function of oxygen
fugacity imposed by the precursor assemblage
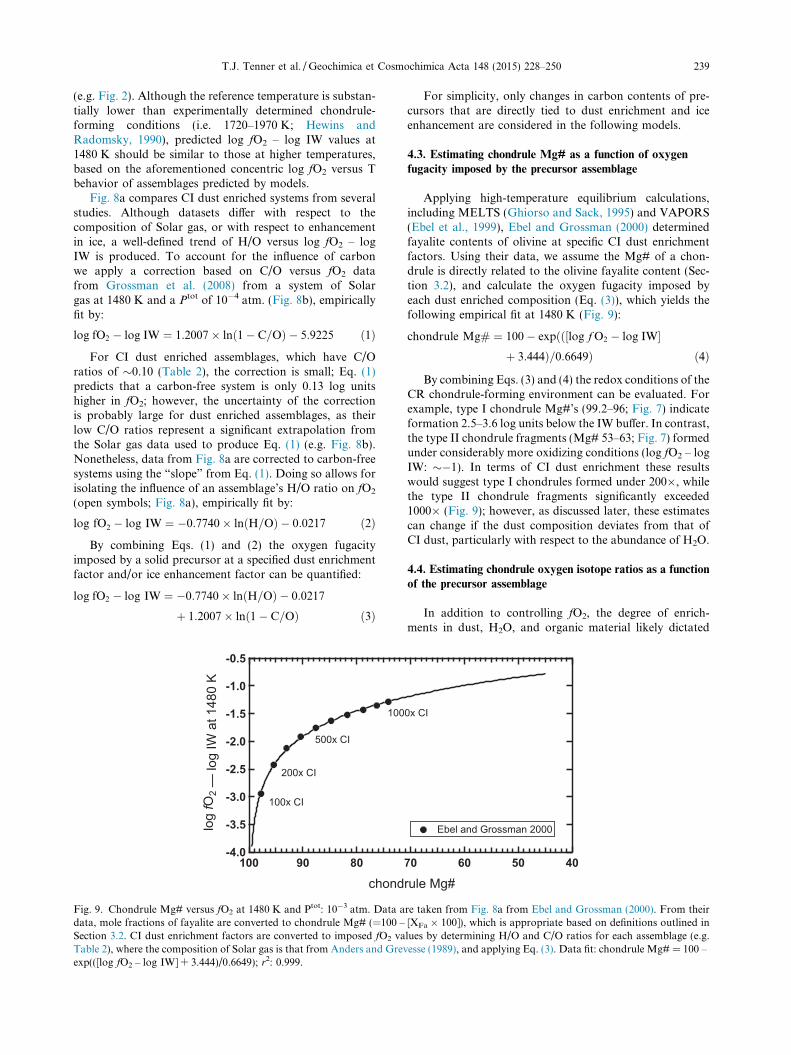
Applying high-temperature equilibrium calculations,including MELTS (Ghiorso and Sack, 1995) and VAPORS(Ebel et al., 1999), Ebel and Grossman (2000) determinedfayalite contents of olivine at specific CI dust enrichmentfactors. Using their data, we assume the Mg# of a chon-drule is directly related to the olivine fayalite content (Sec-tion 3.2), and calculate the oxygen fugacity imposed byeach dust enriched composition (Eq. (3)), which yields thefollowing empirical fit at 1480 K (Fig. 9):
chondrule Mg# ¼ 100� expðð½log f O2 � log IW�þ 3:444Þ=0:6649Þ ð4Þ
By combining Eqs. (3) and (4) the redox conditions of theCR chondrule-forming environment can be evaluated. Forexample, type I chondrule Mg#’s (99.2–96; Fig. 7) indicateformation 2.5–3.6 log units below the IW buffer. In contrast,the type II chondrule fragments (Mg# 53–63; Fig. 7) formedunder considerably more oxidizing conditions (log fO2 – logIW: ��1). In terms of CI dust enrichment these resultswould suggest type I chondrules formed under 200�, whilethe type II chondrule fragments significantly exceeded1000� (Fig. 9); however, as discussed later, these estimatescan change if the dust composition deviates from that ofCI dust, particularly with respect to the abundance of H2O.
4.4. Estimating chondrule oxygen isotope ratios as a function
of the precursor assemblage
In addition to controlling fO2, the degree of enrich-ments in dust, H2O, and organic material likely dictated
rule Mg#70 60 50 40
Ebel and Grossman 2000
0x CI
re taken from Fig. 8a from Ebel and Grossman (2000). From their[XFa � 100]), which is appropriate based on definitions outlined inlues by determining H/O and C/O ratios for each assemblage (e.g.esse (1989), and applying Eq. (3). Data fit: chondrule Mg# = 100 –
240 T.J. Tenner et al. / Geochimica et Cosmochimica Acta 148 (2015) 228–250
CR chondrule oxygen isotope ratios, as it is plausible toexpect that chondrule precursors had multiple sources ofoxygen isotopes with distinct ratios (e.g. Fig. 1). There-fore, the oxygen isotope ratio of a chondrule likely repre-sents a mass balance involving the fractions of oxygenfrom each source and their respective oxygen isotoperatios. This concept can be used to determine the influ-ence of various precursor enrichments on chondrule oxy-gen isotope ratios.
As an initial step we consider that chondrule precursorshad four primary sources of oxygen isotopes, (1) Solar gas;(2) the silicate portion of the dust; (3) organic material inthe dust; and (4) H2O ice in the dust:
chondrule D17O¼ðfrac:OSolar gas�D17OSolar gasÞþðfrac:Osilicate in dust�D17Osilicate in dustÞþðfrac:Oorganics in dust�D17Oorganics in dustÞþðfrac:OH2O in dust�D17OH2O in dustÞ ð5Þ
We use D17O for simplicity in Eq. (5). It is implied d17Oand d18O values of precursor components were on the PCMline, based on CR3 chondrule signatures (Fig. 6).
As a second step, the atomic abundances of oxygenfrom each source (given relative to 106 atoms of Si) mustbe established. For Solar gas we use the oxygen abun-dance from Allende Prieto and Lambert (2001, 2002),which is 1.367 � 107 atoms (Table 2). For sources inthe dust, we assume a CI composition (Table 2), andassign oxygen to each component. For silicate in the dust,we calculate an abundance of 3.350 � 106 atoms (43.9%of oxygen in the dust; Table 3), solved by using theatomic abundances of Mg, Si, Al, Ca, Na, Cr, P, Mn,K, and Ti in CI dust (Table 2), and assigning oxygento each as the following: MgO, SiO2, Al2O3, CaO,Na2O, Cr2O3, P2O5, MnO, K2O, and TiO2. We assumeFe, S, Ni, and Co in the dust existed as metal and sulfideat ambient conditions. For organic material we use theatomic abundance of carbon in CI dust (Table 2), andemploy a C/O ratio of 5, which is that measured inIOM from Orgueil (CI) and Murchison (CM) chondrites(Binet et al., 2002; Remusat et al., 2007; for reference,these studies predict that IOM comprises 75–90% of thetotal carbon in the chondrites). This amounts to1.512 � 105 atoms, or 2.0% of oxygen in the dust(Table 3). The remaining 54.1% of oxygen in the dust,4.129 � 106 atoms, is assigned to H2O ice (Table 3). Bydoing so, however, the necessary amount of hydrogento make H2O in the dust, 8.258 � 106 atoms (per 106
atoms of Si), is greater than the amount measured inCI chondrites, 5.28 � 106 atoms (Table 2). This discrep-ancy could represent a difference in how we assigned oxy-gen in model CI dust versus its actual association in CIchondrites. For instance, CI chondrites have oxidizedFe, while it is not expected that FeO was a primary con-densate in the Solar nebula (Grossman et al., 2012);therefore, we choose to use the higher estimate for Hinstead of the measured value in CI chondrites (Table 3).We note that enrichment in this “modified” CI dust yieldsmore reducing conditions (Eq. (3)), which predicts chond-
rules with marginally higher Mg#’s when compared toenrichment in nominal CI dust (Mg#’s at 100�: 97.9vs. 97.9; 500�: 88.0 vs. 87.4; 1000�: 76.7 vs. 74.3, respec-tively; Eq. (4)).
As a final step, the oxygen isotope ratios of each sourcein the mass balance must be defined. For Solar gas, we usethe estimated bulk Solar System value (D17O: �28.4&),based on measurements of Solar wind by McKeeganet al. (2011). For the silicate in the dust we consider its oxy-gen isotope ratio is probably similar to the most 16O-richhigh Mg# chondrule measured, and that addition of 16O-poor H2O ice to the silicate contributed to forming chond-rules with lower Mg#’s and higher D17O values. Therefore,we assign a D17O of �5.9 &, which is the value of Mg# 99.1chondrule fragment M22 (Table 1). For organic material inthe dust, we use the average oxygen isotope compositionmeasured by Hashizume et al. (2011) from the CR2 chon-drite Yamato 793495, which has a D17O value of 11.3&.For H2O ice in the dust we calculate D17O; we use Eq.(5), and take advantage of the strong likelihood that typeII (Mg# < 90) chondrules formed in highly dust-enrichedenvironments (e.g. Fig. 9), where it can be assumed the oxy-gen isotope contribution from Solar gas is negligible (e.g.Table 3). Using (1) the average D17O value of the three mea-sured type II CR3 chondrule fragments (0.4&; Table 1); (2)the fractions of atomic oxygen from the silicate, organicmaterial, and ice in CI dust (0.439, 0.020, and 0.541, respec-tively; Table 3); and (3) the assigned D17O values of organicand silicate components of the dust, Eq. (5) predicts thatH2O ice in CR3 chondrule precursors has a D17O value of+5.1&.
4.4.1. Efficiency of oxygen isotope exchange between ambient
gas and chondrule melt
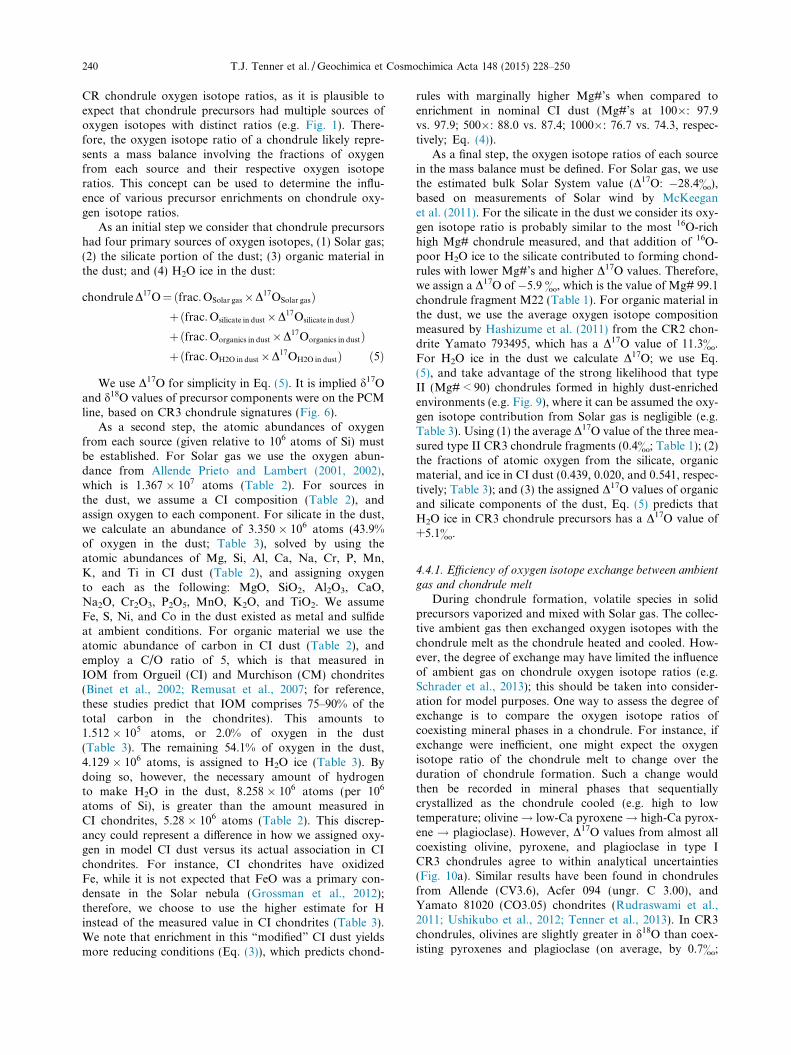
During chondrule formation, volatile species in solidprecursors vaporized and mixed with Solar gas. The collec-tive ambient gas then exchanged oxygen isotopes with thechondrule melt as the chondrule heated and cooled. How-ever, the degree of exchange may have limited the influenceof ambient gas on chondrule oxygen isotope ratios (e.g.Schrader et al., 2013); this should be taken into consider-ation for model purposes. One way to assess the degree ofexchange is to compare the oxygen isotope ratios ofcoexisting mineral phases in a chondrule. For instance, ifexchange were inefficient, one might expect the oxygenisotope ratio of the chondrule melt to change over theduration of chondrule formation. Such a change wouldthen be recorded in mineral phases that sequentiallycrystallized as the chondrule cooled (e.g. high to lowtemperature; olivine! low-Ca pyroxene! high-Ca pyrox-ene ! plagioclase). However, D17O values from almost allcoexisting olivine, pyroxene, and plagioclase in type ICR3 chondrules agree to within analytical uncertainties(Fig. 10a). Similar results have been found in chondrulesfrom Allende (CV3.6), Acfer 094 (ungr. C 3.00), andYamato 81020 (CO3.05) chondrites (Rudraswami et al.,2011; Ushikubo et al., 2012; Tenner et al., 2013). In CR3chondrules, olivines are slightly greater in d18O than coex-isting pyroxenes and plagioclase (on average, by 0.7&;
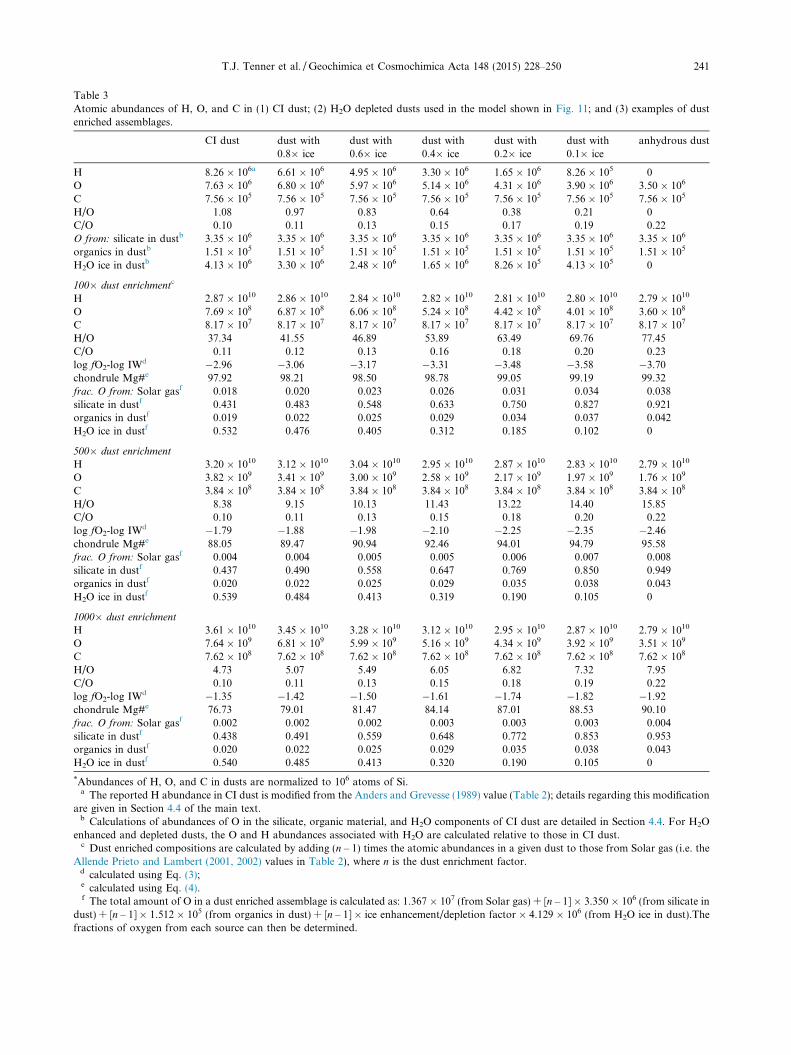
Table 3Atomic abundances of H, O, and C in (1) CI dust; (2) H2O depleted dusts used in the model shown in Fig. 11; and (3) examples of dustenriched assemblages.
CI dust dust with0.8� ice
dust with0.6� ice
dust with0.4� ice
dust with0.2� ice
dust with0.1� ice
anhydrous dust
H 8.26 � 106a 6.61 � 106 4.95 � 106 3.30 � 106 1.65 � 106 8.26 � 105 0O 7.63 � 106 6.80 � 106 5.97 � 106 5.14 � 106 4.31 � 106 3.90 � 106 3.50 � 106
C 7.56 � 105 7.56 � 105 7.56 � 105 7.56 � 105 7.56 � 105 7.56 � 105 7.56 � 105
H/O 1.08 0.97 0.83 0.64 0.38 0.21 0C/O 0.10 0.11 0.13 0.15 0.17 0.19 0.22O from: silicate in dustb 3.35 � 106 3.35 � 106 3.35 � 106 3.35 � 106 3.35 � 106 3.35 � 106 3.35 � 106
organics in dustb 1.51 � 105 1.51 � 105 1.51 � 105 1.51 � 105 1.51 � 105 1.51 � 105 1.51 � 105
H2O ice in dustb 4.13 � 106 3.30 � 106 2.48 � 106 1.65 � 106 8.26 � 105 4.13 � 105 0
100� dust enrichmentc
H 2.87 � 1010 2.86 � 1010 2.84 � 1010 2.82 � 1010 2.81 � 1010 2.80 � 1010 2.79 � 1010
O 7.69 � 108 6.87 � 108 6.06 � 108 5.24 � 108 4.42 � 108 4.01 � 108 3.60 � 108
C 8.17 � 107 8.17 � 107 8.17 � 107 8.17 � 107 8.17 � 107 8.17 � 107 8.17 � 107
H/O 37.34 41.55 46.89 53.89 63.49 69.76 77.45C/O 0.11 0.12 0.13 0.16 0.18 0.20 0.23log fO2-log IWd �2.96 �3.06 �3.17 �3.31 �3.48 �3.58 �3.70chondrule Mg#e 97.92 98.21 98.50 98.78 99.05 99.19 99.32frac. O from: Solar gasf 0.018 0.020 0.023 0.026 0.031 0.034 0.038silicate in dustf 0.431 0.483 0.548 0.633 0.750 0.827 0.921organics in dustf 0.019 0.022 0.025 0.029 0.034 0.037 0.042H2O ice in dustf 0.532 0.476 0.405 0.312 0.185 0.102 0
500� dust enrichment
H 3.20 � 1010 3.12 � 1010 3.04 � 1010 2.95 � 1010 2.87 � 1010 2.83 � 1010 2.79 � 1010
O 3.82 � 109 3.41 � 109 3.00 � 109 2.58 � 109 2.17 � 109 1.97 � 109 1.76 � 109
C 3.84 � 108 3.84 � 108 3.84 � 108 3.84 � 108 3.84 � 108 3.84 � 108 3.84 � 108
H/O 8.38 9.15 10.13 11.43 13.22 14.40 15.85C/O 0.10 0.11 0.13 0.15 0.18 0.20 0.22log fO2-log IWd �1.79 �1.88 �1.98 �2.10 �2.25 �2.35 �2.46chondrule Mg#e 88.05 89.47 90.94 92.46 94.01 94.79 95.58frac. O from: Solar gasf 0.004 0.004 0.005 0.005 0.006 0.007 0.008silicate in dustf 0.437 0.490 0.558 0.647 0.769 0.850 0.949organics in dustf 0.020 0.022 0.025 0.029 0.035 0.038 0.043H2O ice in dustf 0.539 0.484 0.413 0.319 0.190 0.105 0
1000� dust enrichment
H 3.61 � 1010 3.45 � 1010 3.28 � 1010 3.12 � 1010 2.95 � 1010 2.87 � 1010 2.79 � 1010
O 7.64 � 109 6.81 � 109 5.99 � 109 5.16 � 109 4.34 � 109 3.92 � 109 3.51 � 109
C 7.62 � 108 7.62 � 108 7.62 � 108 7.62 � 108 7.62 � 108 7.62 � 108 7.62 � 108
H/O 4.73 5.07 5.49 6.05 6.82 7.32 7.95C/O 0.10 0.11 0.13 0.15 0.18 0.19 0.22log fO2-log IWd �1.35 �1.42 �1.50 �1.61 �1.74 �1.82 �1.92chondrule Mg#e 76.73 79.01 81.47 84.14 87.01 88.53 90.10frac. O from: Solar gasf 0.002 0.002 0.002 0.003 0.003 0.003 0.004silicate in dustf 0.438 0.491 0.559 0.648 0.772 0.853 0.953organics in dustf 0.020 0.022 0.025 0.029 0.035 0.038 0.043H2O ice in dustf 0.540 0.485 0.413 0.320 0.190 0.105 0
*Abundances of H, O, and C in dusts are normalized to 106 atoms of Si.a The reported H abundance in CI dust is modified from the Anders and Grevesse (1989) value (Table 2); details regarding this modification
are given in Section 4.4 of the main text.b Calculations of abundances of O in the silicate, organic material, and H2O components of CI dust are detailed in Section 4.4. For H2O
enhanced and depleted dusts, the O and H abundances associated with H2O are calculated relative to those in CI dust.c Dust enriched compositions are calculated by adding (n – 1) times the atomic abundances in a given dust to those from Solar gas (i.e. the
Allende Prieto and Lambert (2001, 2002) values in Table 2), where n is the dust enrichment factor.d calculated using Eq. (3);e calculated using Eq. (4).f The total amount of O in a dust enriched assemblage is calculated as: 1.367 � 107 (from Solar gas) + [n – 1] � 3.350 � 106 (from silicate in
dust) + [n – 1] � 1.512 � 105 (from organics in dust) + [n – 1] � ice enhancement/depletion factor � 4.129 � 106 (from H2O ice in dust).Thefractions of oxygen from each source can then be determined.
T.J. Tenner et al. / Geochimica et Cosmochimica Acta 148 (2015) 228–250 241
-7
-6
-5
-4
-3
-2
-1
0
chon
drul
e m
iner
al a
vg
17O
(‰)
-6 -4 -2 0chondrule olivine avg 17O (‰)
-8
-6
-4
-2
0
2
4
chon
drul
e m
iner
al a
vg
18O
(‰)
-8 -6 -4 -2 0 2 4chondrule olivine avg 18O (‰)
a b
-7 -5 -3 -1
Ol vs LPxOl vs Int PxOl vs HPxOl vs Plag
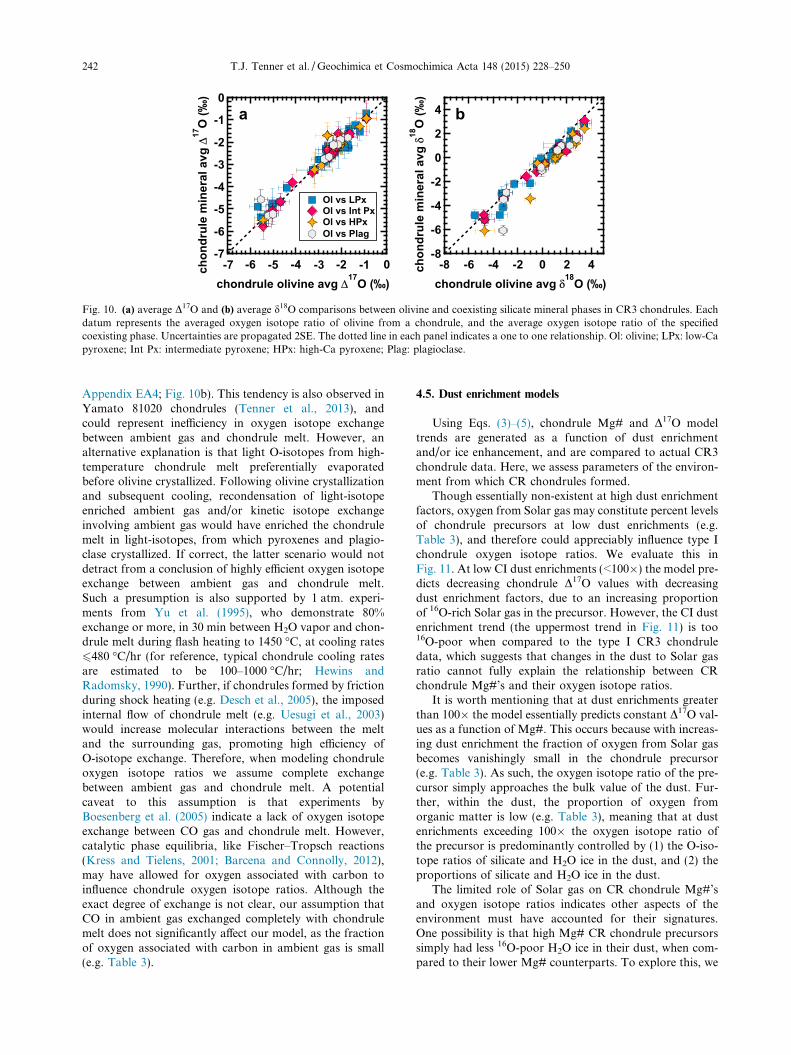
Fig. 10. (a) average D17O and (b) average d18O comparisons between olivine and coexisting silicate mineral phases in CR3 chondrules. Eachdatum represents the averaged oxygen isotope ratio of olivine from a chondrule, and the average oxygen isotope ratio of the specifiedcoexisting phase. Uncertainties are propagated 2SE. The dotted line in each panel indicates a one to one relationship. Ol: olivine; LPx: low-Capyroxene; Int Px: intermediate pyroxene; HPx: high-Ca pyroxene; Plag: plagioclase.
242 T.J. Tenner et al. / Geochimica et Cosmochimica Acta 148 (2015) 228–250
Appendix EA4; Fig. 10b). This tendency is also observed inYamato 81020 chondrules (Tenner et al., 2013), andcould represent inefficiency in oxygen isotope exchangebetween ambient gas and chondrule melt. However, analternative explanation is that light O-isotopes from high-temperature chondrule melt preferentially evaporatedbefore olivine crystallized. Following olivine crystallizationand subsequent cooling, recondensation of light-isotopeenriched ambient gas and/or kinetic isotope exchangeinvolving ambient gas would have enriched the chondrulemelt in light-isotopes, from which pyroxenes and plagio-clase crystallized. If correct, the latter scenario would notdetract from a conclusion of highly efficient oxygen isotopeexchange between ambient gas and chondrule melt.Such a presumption is also supported by 1 atm. experi-ments from Yu et al. (1995), who demonstrate 80%exchange or more, in 30 min between H2O vapor and chon-drule melt during flash heating to 1450 �C, at cooling rates6480 �C/hr (for reference, typical chondrule cooling ratesare estimated to be 100–1000 �C/hr; Hewins andRadomsky, 1990). Further, if chondrules formed by frictionduring shock heating (e.g. Desch et al., 2005), the imposedinternal flow of chondrule melt (e.g. Uesugi et al., 2003)would increase molecular interactions between the meltand the surrounding gas, promoting high efficiency ofO-isotope exchange. Therefore, when modeling chondruleoxygen isotope ratios we assume complete exchangebetween ambient gas and chondrule melt. A potentialcaveat to this assumption is that experiments byBoesenberg et al. (2005) indicate a lack of oxygen isotopeexchange between CO gas and chondrule melt. However,catalytic phase equilibria, like Fischer–Tropsch reactions(Kress and Tielens, 2001; Barcena and Connolly, 2012),may have allowed for oxygen associated with carbon toinfluence chondrule oxygen isotope ratios. Although theexact degree of exchange is not clear, our assumption thatCO in ambient gas exchanged completely with chondrulemelt does not significantly affect our model, as the fractionof oxygen associated with carbon in ambient gas is small(e.g. Table 3).
4.5. Dust enrichment models
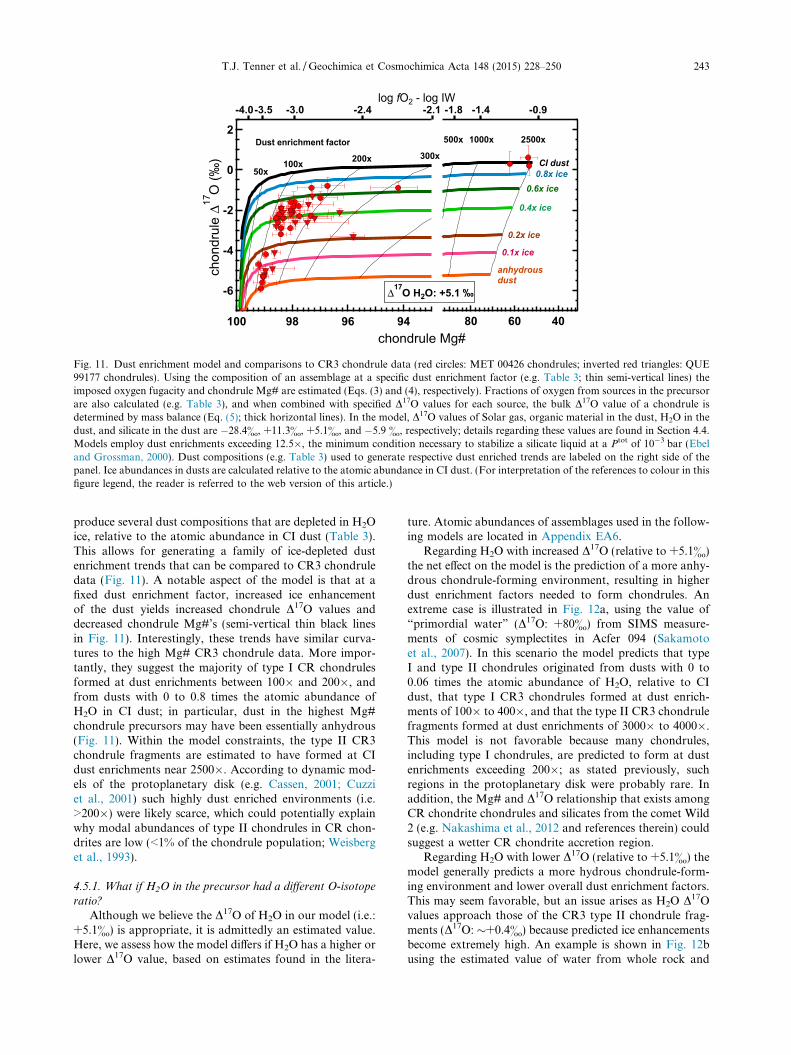
Using Eqs. (3)–(5), chondrule Mg# and D17O modeltrends are generated as a function of dust enrichmentand/or ice enhancement, and are compared to actual CR3chondrule data. Here, we assess parameters of the environ-ment from which CR chondrules formed.
Though essentially non-existent at high dust enrichmentfactors, oxygen from Solar gas may constitute percent levelsof chondrule precursors at low dust enrichments (e.g.Table 3), and therefore could appreciably influence type Ichondrule oxygen isotope ratios. We evaluate this inFig. 11. At low CI dust enrichments (<100�) the model pre-dicts decreasing chondrule D17O values with decreasingdust enrichment factors, due to an increasing proportionof 16O-rich Solar gas in the precursor. However, the CI dustenrichment trend (the uppermost trend in Fig. 11) is too16O-poor when compared to the type I CR3 chondruledata, which suggests that changes in the dust to Solar gasratio cannot fully explain the relationship between CRchondrule Mg#’s and their oxygen isotope ratios.
It is worth mentioning that at dust enrichments greaterthan 100� the model essentially predicts constant D17O val-ues as a function of Mg#. This occurs because with increas-ing dust enrichment the fraction of oxygen from Solar gasbecomes vanishingly small in the chondrule precursor(e.g. Table 3). As such, the oxygen isotope ratio of the pre-cursor simply approaches the bulk value of the dust. Fur-ther, within the dust, the proportion of oxygen fromorganic matter is low (e.g. Table 3), meaning that at dustenrichments exceeding 100� the oxygen isotope ratio ofthe precursor is predominantly controlled by (1) the O-iso-tope ratios of silicate and H2O ice in the dust, and (2) theproportions of silicate and H2O ice in the dust.
The limited role of Solar gas on CR chondrule Mg#’sand oxygen isotope ratios indicates other aspects of theenvironment must have accounted for their signatures.One possibility is that high Mg# CR chondrule precursorssimply had less 16O-poor H2O ice in their dust, when com-pared to their lower Mg# counterparts. To explore this, we
80 60 40
-6
-4
-2
0
2
100 98 96 94chondrule Mg#
chon
drul
eΔ17
O (‰
)
-4.0-3.5 -3.0 -2.4 -1.8 -1.4 -0.9log fO2 - log IW
-2.1
300x
1000x 2500x
anhydrousdust
0.1x ice
0.2x ice
0.4x ice
0.6x ice0.8x iceCI dust
50x
500x
200x100x
Dust enrichment factor
Δ17O H2O: +5.1 ‰
Fig. 11. Dust enrichment model and comparisons to CR3 chondrule data (red circles: MET 00426 chondrules; inverted red triangles: QUE99177 chondrules). Using the composition of an assemblage at a specific dust enrichment factor (e.g. Table 3; thin semi-vertical lines) theimposed oxygen fugacity and chondrule Mg# are estimated (Eqs. (3) and (4), respectively). Fractions of oxygen from sources in the precursorare also calculated (e.g. Table 3), and when combined with specified D17O values for each source, the bulk D17O value of a chondrule isdetermined by mass balance (Eq. (5); thick horizontal lines). In the model, D17O values of Solar gas, organic material in the dust, H2O in thedust, and silicate in the dust are �28.4&, +11.3&, +5.1&, and �5.9 &, respectively; details regarding these values are found in Section 4.4.Models employ dust enrichments exceeding 12.5�, the minimum condition necessary to stabilize a silicate liquid at a Ptot of 10�3 bar (Ebeland Grossman, 2000). Dust compositions (e.g. Table 3) used to generate respective dust enriched trends are labeled on the right side of thepanel. Ice abundances in dusts are calculated relative to the atomic abundance in CI dust. (For interpretation of the references to colour in thisfigure legend, the reader is referred to the web version of this article.)
T.J. Tenner et al. / Geochimica et Cosmochimica Acta 148 (2015) 228–250 243
produce several dust compositions that are depleted in H2Oice, relative to the atomic abundance in CI dust (Table 3).This allows for generating a family of ice-depleted dustenrichment trends that can be compared to CR3 chondruledata (Fig. 11). A notable aspect of the model is that at afixed dust enrichment factor, increased ice enhancementof the dust yields increased chondrule D17O values anddecreased chondrule Mg#’s (semi-vertical thin black linesin Fig. 11). Interestingly, these trends have similar curva-tures to the high Mg# CR3 chondrule data. More impor-tantly, they suggest the majority of type I CR chondrulesformed at dust enrichments between 100� and 200�, andfrom dusts with 0 to 0.8 times the atomic abundance ofH2O in CI dust; in particular, dust in the highest Mg#chondrule precursors may have been essentially anhydrous(Fig. 11). Within the model constraints, the type II CR3chondrule fragments are estimated to have formed at CIdust enrichments near 2500�. According to dynamic mod-els of the protoplanetary disk (e.g. Cassen, 2001; Cuzziet al., 2001) such highly dust enriched environments (i.e.>200�) were likely scarce, which could potentially explainwhy modal abundances of type II chondrules in CR chon-drites are low (<1% of the chondrule population; Weisberget al., 1993).
4.5.1. What if H2O in the precursor had a different O-isotope
ratio?
Although we believe the D17O of H2O in our model (i.e.:+5.1&) is appropriate, it is admittedly an estimated value.Here, we assess how the model differs if H2O has a higher orlower D17O value, based on estimates found in the litera-
ture. Atomic abundances of assemblages used in the follow-ing models are located in Appendix EA6.
Regarding H2O with increased D17O (relative to +5.1&)the net effect on the model is the prediction of a more anhy-drous chondrule-forming environment, resulting in higherdust enrichment factors needed to form chondrules. Anextreme case is illustrated in Fig. 12a, using the value of“primordial water” (D17O: +80&) from SIMS measure-ments of cosmic symplectites in Acfer 094 (Sakamotoet al., 2007). In this scenario the model predicts that typeI and type II chondrules originated from dusts with 0 to0.06 times the atomic abundance of H2O, relative to CIdust, that type I CR3 chondrules formed at dust enrich-ments of 100� to 400�, and that the type II CR3 chondrulefragments formed at dust enrichments of 3000� to 4000�.This model is not favorable because many chondrules,including type I chondrules, are predicted to form at dustenrichments exceeding 200�; as stated previously, suchregions in the protoplanetary disk were probably rare. Inaddition, the Mg# and D17O relationship that exists amongCR chondrite chondrules and silicates from the comet Wild2 (e.g. Nakashima et al., 2012 and references therein) couldsuggest a wetter CR chondrite accretion region.
Regarding H2O with lower D17O (relative to +5.1&) themodel generally predicts a more hydrous chondrule-form-ing environment and lower overall dust enrichment factors.This may seem favorable, but an issue arises as H2O D17Ovalues approach those of the CR3 type II chondrule frag-ments (D17O: �+0.4&) because predicted ice enhancementsbecome extremely high. An example is shown in Fig. 12busing the estimated value of water from whole rock and
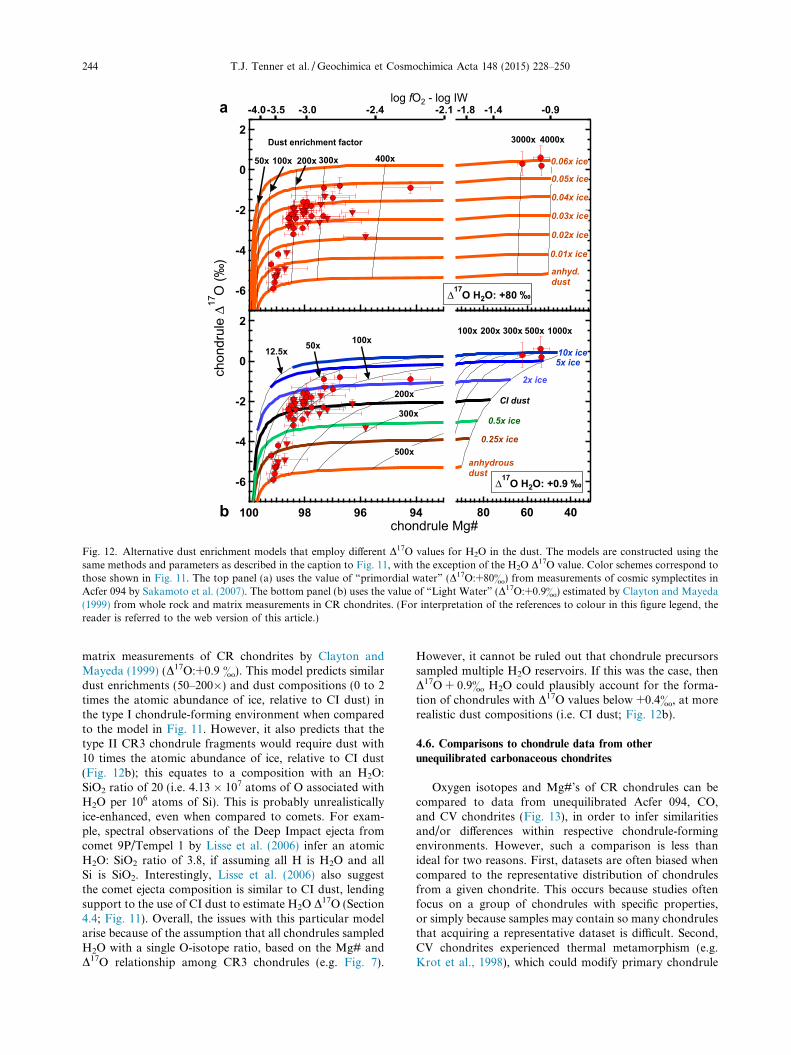
-6
-4
-2
0
2
80 60 40
-6
-4
-2
0
2
100 98 96 94chondrule Mg#
chon
drul
eΔ17
O (‰
)
-4.0-3.5 -3.0 -2.4 -1.8 -1.4 -0.9log fO2 - log IW
-2.1a
b
Dust enrichment factor 3000x 4000x
0.06x ice
0.05x ice
0.04x ice
0.03x ice
0.02x ice
0.01x ice
anhyd.dust
Δ17O H2O: +80 ‰
12.5x 50x 100x
200x
300x
500x
100x 200x 300x 500x 1000x
10x ice5x ice
2x ice
CI dust
0.5x ice
0.25x ice
anhydrousdust
Δ17O H2O: +0.9 ‰
400x300x200x100x50x
Fig. 12. Alternative dust enrichment models that employ different D17O values for H2O in the dust. The models are constructed using thesame methods and parameters as described in the caption to Fig. 11, with the exception of the H2O D17O value. Color schemes correspond tothose shown in Fig. 11. The top panel (a) uses the value of “primordial water” (D17O:+80&) from measurements of cosmic symplectites inAcfer 094 by Sakamoto et al. (2007). The bottom panel (b) uses the value of “Light Water” (D17O:+0.9&) estimated by Clayton and Mayeda(1999) from whole rock and matrix measurements in CR chondrites. (For interpretation of the references to colour in this figure legend, thereader is referred to the web version of this article.)
244 T.J. Tenner et al. / Geochimica et Cosmochimica Acta 148 (2015) 228–250
matrix measurements of CR chondrites by Clayton andMayeda (1999) (D17O:+0.9 &). This model predicts similardust enrichments (50–200�) and dust compositions (0 to 2times the atomic abundance of ice, relative to CI dust) inthe type I chondrule-forming environment when comparedto the model in Fig. 11. However, it also predicts that thetype II CR3 chondrule fragments would require dust with10 times the atomic abundance of ice, relative to CI dust(Fig. 12b); this equates to a composition with an H2O:SiO2 ratio of 20 (i.e. 4.13 � 107 atoms of O associated withH2O per 106 atoms of Si). This is probably unrealisticallyice-enhanced, even when compared to comets. For exam-ple, spectral observations of the Deep Impact ejecta fromcomet 9P/Tempel 1 by Lisse et al. (2006) infer an atomicH2O: SiO2 ratio of 3.8, if assuming all H is H2O and allSi is SiO2. Interestingly, Lisse et al. (2006) also suggestthe comet ejecta composition is similar to CI dust, lendingsupport to the use of CI dust to estimate H2O D17O (Section4.4; Fig. 11). Overall, the issues with this particular modelarise because of the assumption that all chondrules sampledH2O with a single O-isotope ratio, based on the Mg# andD17O relationship among CR3 chondrules (e.g. Fig. 7).
However, it cannot be ruled out that chondrule precursorssampled multiple H2O reservoirs. If this was the case, thenD17O + 0.9& H2O could plausibly account for the forma-tion of chondrules with D17O values below +0.4&, at morerealistic dust compositions (i.e. CI dust; Fig. 12b).
4.6. Comparisons to chondrule data from other
unequilibrated carbonaceous chondrites
Oxygen isotopes and Mg#’s of CR chondrules can becompared to data from unequilibrated Acfer 094, CO,and CV chondrites (Fig. 13), in order to infer similaritiesand/or differences within respective chondrule-formingenvironments. However, such a comparison is less thanideal for two reasons. First, datasets are often biased whencompared to the representative distribution of chondrulesfrom a given chondrite. This occurs because studies oftenfocus on a group of chondrules with specific properties,or simply because samples may contain so many chondrulesthat acquiring a representative dataset is difficult. Second,CV chondrites experienced thermal metamorphism (e.g.Krot et al., 1998), which could modify primary chondrule
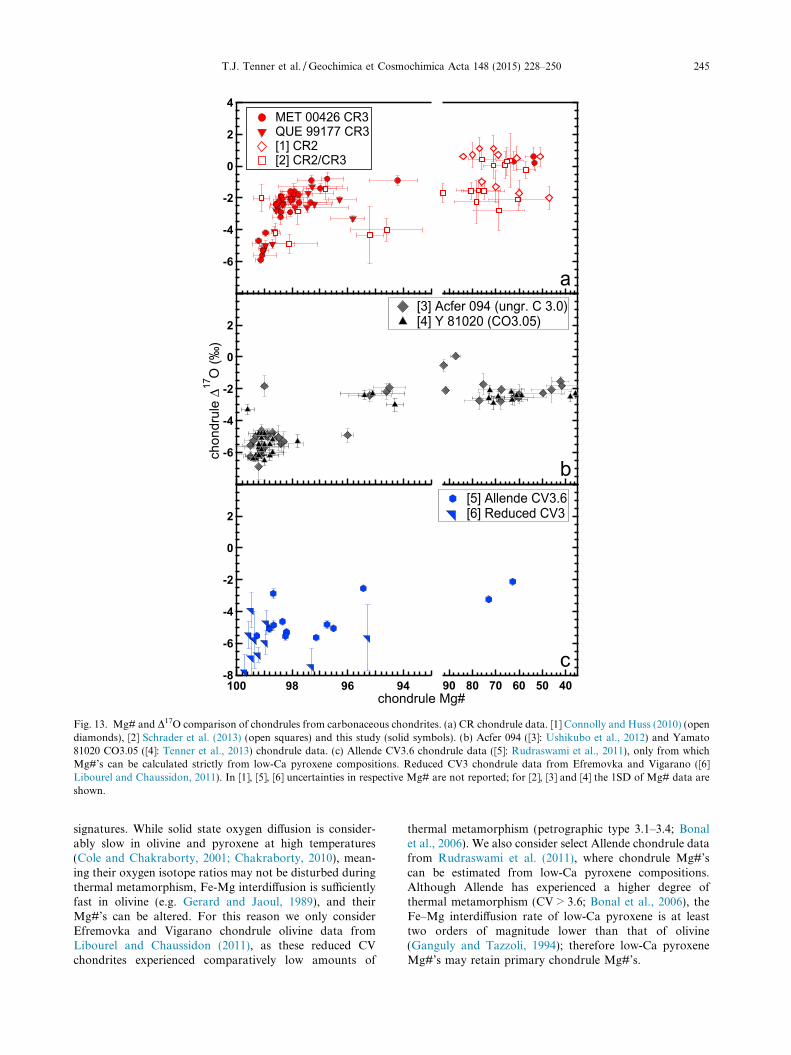
-8
-6
-4
-2
0
2
4-8
-6
-4
-2
0
2
4
chondrule Mg#
chon
drul
eΔ17
O (‰
)
-8
-6
-4
-2
0
2
4
100 98 96 94 90 80 70 60 50 40
[5] Allende CV3.6[6] Reduced CV3
[3] Acfer 094 (ungr. C 3.0)[4] Y 81020 (CO3.05)
a
b
c
MET 00426 CR3QUE 99177 CR3[1] CR2[2] CR2/CR3
Fig. 13. Mg# and D17O comparison of chondrules from carbonaceous chondrites. (a) CR chondrule data. [1] Connolly and Huss (2010) (opendiamonds), [2] Schrader et al. (2013) (open squares) and this study (solid symbols). (b) Acfer 094 ([3]: Ushikubo et al., 2012) and Yamato81020 CO3.05 ([4]: Tenner et al., 2013) chondrule data. (c) Allende CV3.6 chondrule data ([5]: Rudraswami et al., 2011), only from whichMg#’s can be calculated strictly from low-Ca pyroxene compositions. Reduced CV3 chondrule data from Efremovka and Vigarano ([6]Libourel and Chaussidon, 2011). In [1], [5], [6] uncertainties in respective Mg# are not reported; for [2], [3] and [4] the 1SD of Mg# data areshown.
T.J. Tenner et al. / Geochimica et Cosmochimica Acta 148 (2015) 228–250 245
signatures. While solid state oxygen diffusion is consider-ably slow in olivine and pyroxene at high temperatures(Cole and Chakraborty, 2001; Chakraborty, 2010), mean-ing their oxygen isotope ratios may not be disturbed duringthermal metamorphism, Fe-Mg interdiffusion is sufficientlyfast in olivine (e.g. Gerard and Jaoul, 1989), and theirMg#’s can be altered. For this reason we only considerEfremovka and Vigarano chondrule olivine data fromLibourel and Chaussidon (2011), as these reduced CVchondrites experienced comparatively low amounts of
thermal metamorphism (petrographic type 3.1–3.4; Bonalet al., 2006). We also consider select Allende chondrule datafrom Rudraswami et al. (2011), where chondrule Mg#’scan be estimated from low-Ca pyroxene compositions.Although Allende has experienced a higher degree ofthermal metamorphism (CV > 3.6; Bonal et al., 2006), theFe–Mg interdiffusion rate of low-Ca pyroxene is at leasttwo orders of magnitude lower than that of olivine(Ganguly and Tazzoli, 1994); therefore low-Ca pyroxeneMg#’s may retain primary chondrule Mg#’s.
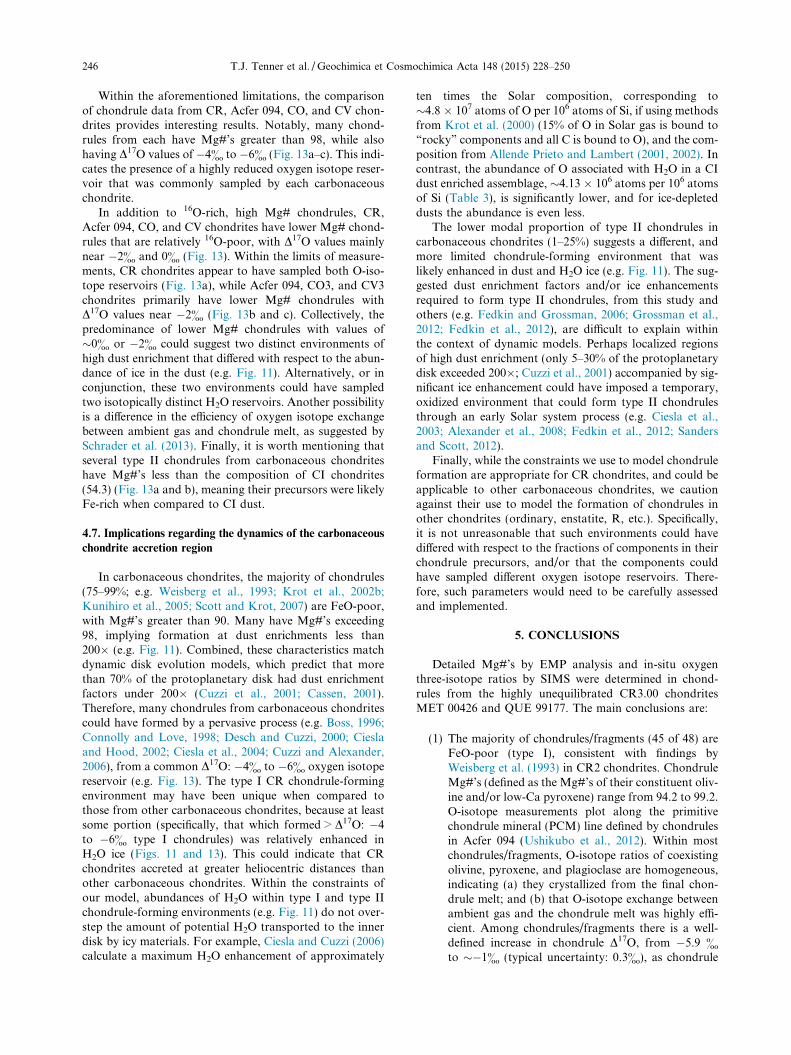
246 T.J. Tenner et al. / Geochimica et Cosmochimica Acta 148 (2015) 228–250
Within the aforementioned limitations, the comparisonof chondrule data from CR, Acfer 094, CO, and CV chon-drites provides interesting results. Notably, many chond-rules from each have Mg#’s greater than 98, while alsohaving D17O values of �4& to �6& (Fig. 13a–c). This indi-cates the presence of a highly reduced oxygen isotope reser-voir that was commonly sampled by each carbonaceouschondrite.
In addition to 16O-rich, high Mg# chondrules, CR,Acfer 094, CO, and CV chondrites have lower Mg# chond-rules that are relatively 16O-poor, with D17O values mainlynear �2& and 0& (Fig. 13). Within the limits of measure-ments, CR chondrites appear to have sampled both O-iso-tope reservoirs (Fig. 13a), while Acfer 094, CO3, and CV3chondrites primarily have lower Mg# chondrules withD17O values near �2& (Fig. 13b and c). Collectively, thepredominance of lower Mg# chondrules with values of�0& or �2& could suggest two distinct environments ofhigh dust enrichment that differed with respect to the abun-dance of ice in the dust (e.g. Fig. 11). Alternatively, or inconjunction, these two environments could have sampledtwo isotopically distinct H2O reservoirs. Another possibilityis a difference in the efficiency of oxygen isotope exchangebetween ambient gas and chondrule melt, as suggested bySchrader et al. (2013). Finally, it is worth mentioning thatseveral type II chondrules from carbonaceous chondriteshave Mg#’s less than the composition of CI chondrites(54.3) (Fig. 13a and b), meaning their precursors were likelyFe-rich when compared to CI dust.
4.7. Implications regarding the dynamics of the carbonaceous
chondrite accretion region
In carbonaceous chondrites, the majority of chondrules(75–99%; e.g. Weisberg et al., 1993; Krot et al., 2002b;Kunihiro et al., 2005; Scott and Krot, 2007) are FeO-poor,with Mg#’s greater than 90. Many have Mg#’s exceeding98, implying formation at dust enrichments less than200� (e.g. Fig. 11). Combined, these characteristics matchdynamic disk evolution models, which predict that morethan 70% of the protoplanetary disk had dust enrichmentfactors under 200� (Cuzzi et al., 2001; Cassen, 2001).Therefore, many chondrules from carbonaceous chondritescould have formed by a pervasive process (e.g. Boss, 1996;Connolly and Love, 1998; Desch and Cuzzi, 2000; Cieslaand Hood, 2002; Ciesla et al., 2004; Cuzzi and Alexander,2006), from a common D17O: �4& to �6& oxygen isotopereservoir (e.g. Fig. 13). The type I CR chondrule-formingenvironment may have been unique when compared tothose from other carbonaceous chondrites, because at leastsome portion (specifically, that which formed > D17O: �4to �6& type I chondrules) was relatively enhanced inH2O ice (Figs. 11 and 13). This could indicate that CRchondrites accreted at greater heliocentric distances thanother carbonaceous chondrites. Within the constraints ofour model, abundances of H2O within type I and type IIchondrule-forming environments (e.g. Fig. 11) do not over-step the amount of potential H2O transported to the innerdisk by icy materials. For example, Ciesla and Cuzzi (2006)calculate a maximum H2O enhancement of approximately
ten times the Solar composition, corresponding to�4.8 � 107 atoms of O per 106 atoms of Si, if using methodsfrom Krot et al. (2000) (15% of O in Solar gas is bound to“rocky” components and all C is bound to O), and the com-position from Allende Prieto and Lambert (2001, 2002). Incontrast, the abundance of O associated with H2O in a CIdust enriched assemblage, �4.13 � 106 atoms per 106 atomsof Si (Table 3), is significantly lower, and for ice-depleteddusts the abundance is even less.
The lower modal proportion of type II chondrules incarbonaceous chondrites (1–25%) suggests a different, andmore limited chondrule-forming environment that waslikely enhanced in dust and H2O ice (e.g. Fig. 11). The sug-gested dust enrichment factors and/or ice enhancementsrequired to form type II chondrules, from this study andothers (e.g. Fedkin and Grossman, 2006; Grossman et al.,2012; Fedkin et al., 2012), are difficult to explain withinthe context of dynamic models. Perhaps localized regionsof high dust enrichment (only 5–30% of the protoplanetarydisk exceeded 200�; Cuzzi et al., 2001) accompanied by sig-nificant ice enhancement could have imposed a temporary,oxidized environment that could form type II chondrulesthrough an early Solar system process (e.g. Ciesla et al.,2003; Alexander et al., 2008; Fedkin et al., 2012; Sandersand Scott, 2012).
Finally, while the constraints we use to model chondruleformation are appropriate for CR chondrites, and could beapplicable to other carbonaceous chondrites, we cautionagainst their use to model the formation of chondrules inother chondrites (ordinary, enstatite, R, etc.). Specifically,it is not unreasonable that such environments could havediffered with respect to the fractions of components in theirchondrule precursors, and/or that the components couldhave sampled different oxygen isotope reservoirs. There-fore, such parameters would need to be carefully assessedand implemented.
5. CONCLUSIONS
Detailed Mg#’s by EMP analysis and in-situ oxygenthree-isotope ratios by SIMS were determined in chond-rules from the highly unequilibrated CR3.00 chondritesMET 00426 and QUE 99177. The main conclusions are:
(1) The majority of chondrules/fragments (45 of 48) areFeO-poor (type I), consistent with findings byWeisberg et al. (1993) in CR2 chondrites. ChondruleMg#’s (defined as the Mg#’s of their constituent oliv-ine and/or low-Ca pyroxene) range from 94.2 to 99.2.O-isotope measurements plot along the primitivechondrule mineral (PCM) line defined by chondrulesin Acfer 094 (Ushikubo et al., 2012). Within mostchondrules/fragments, O-isotope ratios of coexistingolivine, pyroxene, and plagioclase are homogeneous,indicating (a) they crystallized from the final chon-drule melt; and (b) that O-isotope exchange betweenambient gas and the chondrule melt was highly effi-cient. Among chondrules/fragments there is a well-defined increase in chondrule D17O, from �5.9 &
to ��1& (typical uncertainty: 0.3&), as chondrule

T.J. Tenner et al. / Geochimica et Cosmochimica Acta 148 (2015) 228–250 247
Mg#’s decrease from 99.2 to �96. To the best of ourknowledge, this is the first time such a trend has beenobserved among chondrules within a single chondritegroup.
(2) Three type II chondrule fragments, with Mg#’s of53.4, 53.8, and 62.2, have O-isotopes that lie alongthe PCM line, and are 16O-poor relative to type Ichondrules, with D17O values of 0.2–0.6&. Althoughsimilar in D17O, they are �1& greater in d18O whencompared to type II chondrule data from LL3 chon-drites measured by Kita et al. (2010).
(3) The continuous increase in type I CR3 chondruleD17O with decreasing chondrule Mg# supports thehypothesis from Connolly and Huss (2010) that addi-tion of 16O-poor H2O ice to type I chondrule precur-sors, when combined with increasing dustenrichment, aided in forming type II CR chondrules.
(4) Using aspects of existing equilibrium condensationmodels (Ebel and Grossman, 2000; Fedkin andGrossman, 2006; Grossman et al., 2008) and a simpleO-isotope mass balance, the conditions of dustenrichment and/or H2O enhancement necessary toexplain the CR3 chondrule Mg# versus D17O trendwere evaluated. We predict type I CR chondrulesformed at dust enrichments between 100� and200�, and that dust in their precursors had 0 to 0.8times the atomic abundance of H2O, relative to CIdust. In addition, we estimate that the type II chon-drule fragments formed at CI dust enrichments near2500�. According to dynamic models (e.g. Cassen,2001; Cuzzi et al., 2001) environments with dustenrichments exceeding 200� were likely scarce inthe protoplanetary disk, which may explain the lowabundance of type II chondrules in CR chondrites.
(5) Chondrules in carbonaceous chondrites are predom-inantly FeO-poor (Mg# > 90; 75–99% modally), ofwhich many have D17O values of �4 to �6&. Thisindicates the presence of a reduced and commonlysampled O-isotope reservoir. Combined with theprevalence of low dust enrichment conditions in theprotoplanetary disk (i.e. greater than 70% existed atless than 200�; Cassen, 2001; Cuzzi et al., 2001)and suggested abundances of ice well-within thepotential amounts delivered by icy migrators (e.g.Ciesla and Cuzzi, 2006), the majority of type I chond-rules from carbonaceous chondrites could haveformed by a common, pervasive process.
(6) Type II chondrules from carbonaceous chondritesmainly have D17O values of �0& and ��2&. Thisindicates two distinct environments of high dustenrichment that could have differed in terms of theabundance of 16O-poor H2O ice in their precursors,and/or sampling of two distinct H2O ice oxygen iso-tope reservoirs, and/or different efficiencies of isotopeexchange between ambient gas and chondrule melt.CR chondrites sampled both chondrule-formingenvironments (e.g. Connolly and Huss, 2010;Schrader et al., 2013; this study). The low modalabundance of type II chondrules in carbonaceouschondrites (1–25%), when combined with high dust
enrichment factors and relatively high abundancesof H2O necessary for their formation, could indicatethe presence of a different, and more limited chon-drule-forming environment, with a different forma-tion process than type I chondrules.
ACKNOWLEDGEMENTS
We thank the ANSMET Program and Meteorite WorkingGroup for allocating CR3 chondrite thin sections for this study.We thank John Fournelle for assistance with EMP analysis, andJim Kern for technical assistance during SIMS operations. Con-structive reviews were provided by Harold Connolly Jr., YunbinGuan, Kazuhide Nagashima, and associate editor Dimitri Pap-anastassiou. This work is supported by the NASA Cosmochemistryprogram (NNX11AG62G, N.T.K.; NNX12AI06G, M.K.W.).WiscSIMS is partly supported by NSF (EAR03-19230, EAR07-44079, EAR10-53466).
APPENDIX A. SUPPLEMENTARY DATA
Supplementary data associated with this article can befound, in the online version, at http://dx.doi.org/10.1016/j.gca.2014.09.025.
REFERENCES
Abreu N. M. and Brearley A. J. (2010) Early solar system processesrecorded in the matrices of two highly pristine CR3 carbona-ceous chondrites, MET 00426 and QUE 99177. Geochim.
Cosmochim. Acta 74, 1146–1171.Alexander C. M. O. D., Grossman J. N., Ebel D. S. and Ciesla F. J.
(2008) The formation conditions of chondrules and chondrites.Science 320, 1617–1619.
Allende Prieto C. and Lambert D. L. (2001) The forbiddenabundance of oxygen in the Sun. Astrophys. J. 556, L63–L66.
Allende Prieto C. and Lambert D. L. (2002) A reappraisal of thesolar photospheric C/O ratio. Astrophys. J. 573, L137–L140.
Anders E. and Grevesse N. (1989) Abundances of the elements:meteoritic and solar. Geochim. Cosmochim. Acta 53, 197–214.
Baertschi P. (1976) Absolute 18O content of standard mean oceanwater. Earth Planet. Sci. Lett. 31, 341–344.
Barcena H. and Connolly Jr., H. C. (2012) Constraining the natureof type-I chondrules: I. chemical models. 43rd Lunar and Planet.
Sci. Conf. CD-ROM. #2506 (abstr.).Beaty D. W. and Albee A. L. (1980) Silica solid solution and
zoning in natural plagioclase. Am. Miner. 65, 63–74.Binet L., Gourier D., Derenne S. and Robert F. (2002) Hetero-
geneous distribution of paramagnetic radicals in insolubleorganic matter from the Orgueil and Murchison meteorites.Geochim. Cosmochim. Acta 66, 4177–4186.
Boesenberg J. S., Young E. D., Ziegler K. and Hewins R. H. (2005)Evaporation and the absence of oxygen isotopic exchangebetween silicate melt and carbon monoxide gas at nebularpressures. Meteorit. Planet. Sci. 40, A22 (abstr.)..
Bonal L., Quirico E., Bourot-Denise M. and Montagnac G. (2006)Determination of the petrologic type of CV3 chondrites byRaman spectroscopy of included organic matter. Geochim.
Cosmochim. Acta 70, 1849–1863.Boss A. P. (1996) A concise guide to chondrule formation models.
In Chondrules and the Protoplanetary Disk (eds. R. H. Hewins,
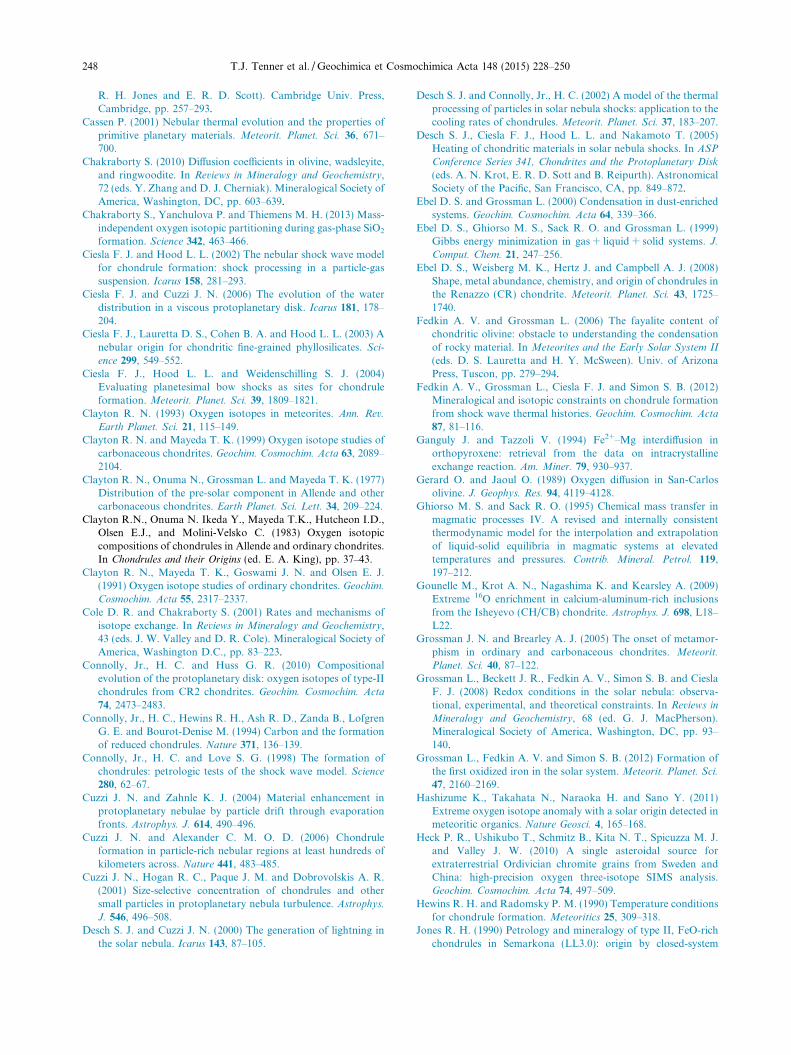
248 T.J. Tenner et al. / Geochimica et Cosmochimica Acta 148 (2015) 228–250
R. H. Jones and E. R. D. Scott). Cambridge Univ. Press,Cambridge, pp. 257–293.
Cassen P. (2001) Nebular thermal evolution and the properties ofprimitive planetary materials. Meteorit. Planet. Sci. 36, 671–700.
Chakraborty S. (2010) Diffusion coefficients in olivine, wadsleyite,and ringwoodite. In Reviews in Mineralogy and Geochemistry,72 (eds. Y. Zhang and D. J. Cherniak). Mineralogical Society ofAmerica, Washington, DC, pp. 603–639.
Chakraborty S., Yanchulova P. and Thiemens M. H. (2013) Mass-independent oxygen isotopic partitioning during gas-phase SiO2
formation. Science 342, 463–466.Ciesla F. J. and Hood L. L. (2002) The nebular shock wave model
for chondrule formation: shock processing in a particle-gassuspension. Icarus 158, 281–293.
Ciesla F. J. and Cuzzi J. N. (2006) The evolution of the waterdistribution in a viscous protoplanetary disk. Icarus 181, 178–204.
Ciesla F. J., Lauretta D. S., Cohen B. A. and Hood L. L. (2003) Anebular origin for chondritic fine-grained phyllosilicates. Sci-
ence 299, 549–552.Ciesla F. J., Hood L. L. and Weidenschilling S. J. (2004)
Evaluating planetesimal bow shocks as sites for chondruleformation. Meteorit. Planet. Sci. 39, 1809–1821.
Clayton R. N. (1993) Oxygen isotopes in meteorites. Ann. Rev.
Earth Planet. Sci. 21, 115–149.Clayton R. N. and Mayeda T. K. (1999) Oxygen isotope studies of
carbonaceous chondrites. Geochim. Cosmochim. Acta 63, 2089–2104.
Clayton R. N., Onuma N., Grossman L. and Mayeda T. K. (1977)Distribution of the pre-solar component in Allende and othercarbonaceous chondrites. Earth Planet. Sci. Lett. 34, 209–224.
Clayton R.N., Onuma N. Ikeda Y., Mayeda T.K., Hutcheon I.D.,Olsen E.J., and Molini-Velsko C. (1983) Oxygen isotopiccompositions of chondrules in Allende and ordinary chondrites.In Chondrules and their Origins (ed. E. A. King), pp. 37–43.
Clayton R. N., Mayeda T. K., Goswami J. N. and Olsen E. J.(1991) Oxygen isotope studies of ordinary chondrites. Geochim.
Cosmochim. Acta 55, 2317–2337.Cole D. R. and Chakraborty S. (2001) Rates and mechanisms of
isotope exchange. In Reviews in Mineralogy and Geochemistry,43 (eds. J. W. Valley and D. R. Cole). Mineralogical Society ofAmerica, Washington D.C., pp. 83–223.
Connolly, Jr., H. C. and Huss G. R. (2010) Compositionalevolution of the protoplanetary disk: oxygen isotopes of type-IIchondrules from CR2 chondrites. Geochim. Cosmochim. Acta
74, 2473–2483.Connolly, Jr., H. C., Hewins R. H., Ash R. D., Zanda B., Lofgren
G. E. and Bourot-Denise M. (1994) Carbon and the formationof reduced chondrules. Nature 371, 136–139.
Connolly, Jr., H. C. and Love S. G. (1998) The formation ofchondrules: petrologic tests of the shock wave model. Science
280, 62–67.Cuzzi J. N. and Zahnle K. J. (2004) Material enhancement in
protoplanetary nebulae by particle drift through evaporationfronts. Astrophys. J. 614, 490–496.
Cuzzi J. N. and Alexander C. M. O. D. (2006) Chondruleformation in particle-rich nebular regions at least hundreds ofkilometers across. Nature 441, 483–485.
Cuzzi J. N., Hogan R. C., Paque J. M. and Dobrovolskis A. R.(2001) Size-selective concentration of chondrules and othersmall particles in protoplanetary nebula turbulence. Astrophys.
J. 546, 496–508.Desch S. J. and Cuzzi J. N. (2000) The generation of lightning in
the solar nebula. Icarus 143, 87–105.
Desch S. J. and Connolly, Jr., H. C. (2002) A model of the thermalprocessing of particles in solar nebula shocks: application to thecooling rates of chondrules. Meteorit. Planet. Sci. 37, 183–207.
Desch S. J., Ciesla F. J., Hood L. L. and Nakamoto T. (2005)Heating of chondritic materials in solar nebula shocks. In ASP
Conference Series 341, Chondrites and the Protoplanetary Disk
(eds. A. N. Krot, E. R. D. Sott and B. Reipurth). AstronomicalSociety of the Pacific, San Francisco, CA, pp. 849–872.
Ebel D. S. and Grossman L. (2000) Condensation in dust-enrichedsystems. Geochim. Cosmochim. Acta 64, 339–366.
Ebel D. S., Ghiorso M. S., Sack R. O. and Grossman L. (1999)Gibbs energy minimization in gas + liquid + solid systems. J.
Comput. Chem. 21, 247–256.Ebel D. S., Weisberg M. K., Hertz J. and Campbell A. J. (2008)
Shape, metal abundance, chemistry, and origin of chondrules inthe Renazzo (CR) chondrite. Meteorit. Planet. Sci. 43, 1725–1740.
Fedkin A. V. and Grossman L. (2006) The fayalite content ofchondritic olivine: obstacle to understanding the condensationof rocky material. In Meteorites and the Early Solar System II
(eds. D. S. Lauretta and H. Y. McSween). Univ. of ArizonaPress, Tuscon, pp. 279–294.
Fedkin A. V., Grossman L., Ciesla F. J. and Simon S. B. (2012)Mineralogical and isotopic constraints on chondrule formationfrom shock wave thermal histories. Geochim. Cosmochim. Acta
87, 81–116.Ganguly J. and Tazzoli V. (1994) Fe2+–Mg interdiffusion in
orthopyroxene: retrieval from the data on intracrystallineexchange reaction. Am. Miner. 79, 930–937.
Gerard O. and Jaoul O. (1989) Oxygen diffusion in San-Carlosolivine. J. Geophys. Res. 94, 4119–4128.
Ghiorso M. S. and Sack R. O. (1995) Chemical mass transfer inmagmatic processes IV. A revised and internally consistentthermodynamic model for the interpolation and extrapolationof liquid-solid equilibria in magmatic systems at elevatedtemperatures and pressures. Contrib. Mineral. Petrol. 119,197–212.
Gounelle M., Krot A. N., Nagashima K. and Kearsley A. (2009)Extreme 16O enrichment in calcium-aluminum-rich inclusionsfrom the Isheyevo (CH/CB) chondrite. Astrophys. J. 698, L18–L22.
Grossman J. N. and Brearley A. J. (2005) The onset of metamor-phism in ordinary and carbonaceous chondrites. Meteorit.
Planet. Sci. 40, 87–122.Grossman L., Beckett J. R., Fedkin A. V., Simon S. B. and Ciesla
F. J. (2008) Redox conditions in the solar nebula: observa-tional, experimental, and theoretical constraints. In Reviews in
Mineralogy and Geochemistry, 68 (ed. G. J. MacPherson).Mineralogical Society of America, Washington, DC, pp. 93–140.
Grossman L., Fedkin A. V. and Simon S. B. (2012) Formation ofthe first oxidized iron in the solar system. Meteorit. Planet. Sci.
47, 2160–2169.Hashizume K., Takahata N., Naraoka H. and Sano Y. (2011)
Extreme oxygen isotope anomaly with a solar origin detected inmeteoritic organics. Nature Geosci. 4, 165–168.
Heck P. R., Ushikubo T., Schmitz B., Kita N. T., Spicuzza M. J.and Valley J. W. (2010) A single asteroidal source forextraterrestrial Ordivician chromite grains from Sweden andChina: high-precision oxygen three-isotope SIMS analysis.Geochim. Cosmochim. Acta 74, 497–509.
Hewins R. H. and Radomsky P. M. (1990) Temperature conditionsfor chondrule formation. Meteoritics 25, 309–318.
Jones R. H. (1990) Petrology and mineralogy of type II, FeO-richchondrules in Semarkona (LL3.0): origin by closed-system

T.J. Tenner et al. / Geochimica et Cosmochimica Acta 148 (2015) 228–250 249
fractional crystallization, with evidence for supercooling. Geo-
chim. Cosmochim. Acta 54, 1785–1802.Jones R. H. (1994) Petrology of FeO-poor, porphyritic pyroxene
chondrules in the Semarkona chondrite. Geochim. Cosmochim.
Acta 58, 5325–5340.Jones R. H. (1996) FeO-rich, porphyritic pyroxene chondrules in
unequilibrated ordinary chondrites. Geochim. Cosmochim. Acta
60, 3115–3138.Jones R. H. and Scott E. R. D. (1989) Petrology and thermal
history of type IA chondrules in the Semarkona (LL3.0)chondrite. Proc. 19th Lunar Planet. Sci. Conf., 523–536.
Jones R. H. and Schilk A. J. (2009) Chemistry, petrology and bulkoxygen isotope compositions of chondrules from the MokoiaCV3 carbonaceous chondrite. Geochim. Cosmochim. Acta 73,5854–5883.
Jones R. H., Saxton J. M., Lyon I. C. and Turner G. (2000) Oxygenisotopes in chondrule olivine and isolated olivine grains fromthe CO3 chondrule Allan Hills A77307. Meteorit. Planet. Sci.
35, 849–857.Jones R. H., Leshin L. A., Guan Y., Sharp Z. D., Durakiewicz T.
and Schilk A. J. (2004) Oxygen isotope heterogeneity inchondrules from the Mokoia CV3 carbonaceous chondrite.Geochim. Cosmochim. Acta 68, 3423–3438.
Jones R. H., Grossman G. N. and Rubin A .E. (2005) Chemical,mineralogical, and isotopic properties of chondrules: clues totheir origins. In Chondrites and the Protoplanetary Disk (eds.A.N. Krot, E.R.D. Scott and B. Reipurth). AstronomicalSociety of the Pacific Conference Series 341, pp. 251–286.
Kallemeyn G. W., Rubin A. E. and Wasson J. T. (1994) Thecompositional classification of chondrites: VI. The CR carbo-naceous chondrite group. Geochim. Cosmochim. Acta 58, 2873–2888.
Kita N. T., Ushikubo T., Fu B. and Valley J. W. (2009) Highprecision SIMS oxygen isotope analysis and the effect of sampletopography. Chem. Geol. 264, 43–57.
Kita N. T., Nagahara H., Tachibana S., Tomomura S., SpicuzzaM. J., Fournelle J. H. and Valley J. W. (2010) High precisionSIMS oxygen three isotope study of chondrules in LL3chondrites: role of ambient gas during chondrule formation.Geochim. Cosmochim. Acta 74, 6610–6635.
Kobayashi S., Imai H. and Yurimoto H. (2003) New extreme 16O-rich reservoir in the early solar system. Geochem. J. 37, 663–669.
Kress M. E. and Tielens A. G. G. M. (2001) The role of Fischer–Tropsch catalysis in solar nebula chemistry. Meteorit. Planet.
Sci. 36, 75–91.Kring D. A. (1988) The petrology of meteoritic chondrules:
evidence for fluctuating conditions in the solar nebula. PhDthesis, Harvard Univ.
Krot A. N., Petaev M. I., Scott E. D., Choi B.-G., Zolensky M. E.and Keil K. (1998) Progressive alteration in CV3 chondrites:more evidence for asteroidal alteration. Meteorit. Planet. Sci.
33, 1065–1085.Krot A. N., Fegley, Jr., B., Lodders K. and Palme H. (2000)
Meteoritical and astrophysical constraints on the oxidationstate of the solar nebula. In Protostars and Planets IV (eds. V.Mannings, et al.). Univ. of Arizona, Tuscon, pp. 1019–1054.
Krot A. N., Meibom A., Weisberg M. K. and Keil K. (2002a) TheCR chondrite clan: implications for early solar system pro-cesses. Meteorit. Planet. Sci. 37, 1451–1490.
Krot A. N., Hutcheon I. D. and Keil K. (2002b) Plagioclase-richchondrules in the reduced CV chondrites: evidence for complexformation history and genetic links between calcium-aluminum-rich inclusions and ferromagnesian chondrules. Meteorit.
Planet. Sci. 37, 155–182.
Krot A. N., Yurimoto H., McKeegan K. D., Leshin L., Chaussi-don M., Libourel G., Yoshitake M., Huss G. R., Guan Y. andZanda B. (2006a) Oxygen isotopic compositions of chondrules:implications for evolution of oxygen isotopic reservoirs in theinner solar nebula. Chem. Erde 66, 249–276.
Krot A. N., Libourel G. and Chaussidon M. (2006b) Oxygenisotope compositions of chondrules in CR chondrites. Geochim.
Cosmochim. Acta 70, 767–779.Krot A. N., Nagashima K., Yoshitake M. and Yurimoto H. (2010)
Oxygen isotopic compositions of chondrules from the metal-rich chondrites Isheyevo (CH/CBb), MAC 02675 (CBb) andQUE 94627 (CBb). Geochim. Cosmochim. Acta 74, 2190–2211.
Kunihiro T., Rubin A. E., McKeegan K. D. and Wasson J. T.(2004) Oxygen-isotopic compositions of relict and host grains inchondrules in the Yamato 81020 CO3.0 chondrite. Geochim.
Cosmochim. Acta 68, 3599–3606.Kunihiro T., Rubin A. E. and Wasson J. T. (2005) Oxygen-isotopic
compositions of low-FeO relicts in high FeO-host chondrules inAcfer 094, a type 3.0 carbonaceous chondrite closely related toCM. Geochim. Cosmochim. Acta 69, 3831–3840.
Kurahashi E., Kita N. T., Nagahara H. and Morishita Y. (2008)26Al–26Mg systematics of chondrules in a primitive CO chon-drite. Geochim. Cosmochim. Acta 72, 3865–3882.
Libourel G. and Chaussidon M. (2011) Oxygen isotopic constraintson the origin of Mg-rich olivines from chondritic meteorites.Earth Planet. Sci. Lett. 301, 9–21.
Lisse C. M., VanCleve J., Adams A. C., A’Hearn M. F., FernandezY. R., Farnham T. L., Armus L., Grillmair C. J., Ingalls J.,Belton M. J. S., Groussin O., McFadden L. A., Meech K. J.,Schultz P. H., Clark B. C., Feaga L. M. and Sunshine J. M.(2006) Spitzer spectral observations of the Deep Impact ejecta.Science 313, 635–640.
Lyons J. R. and Young E. D. (2005) CO self-shielding as the originof oxygen isotope anomalies in the early solar nebula. Nature
435, 317–320.Lyons J. R., Bergin E. A., Ciesla F. J., Davis A. M., Desch S. J.,
Hashizume K. and Lee J.-E. (2009) Timescales for the evolutionof oxygen isotope compositions in the solar nebula. Geochim.
Cosmochim. Acta 73, 4998–5017.McKeegan K. D., Kallio A. P. A., Heber V. S., Jarzebinski G.,
Mao P. H., Coath C. D., Kunihiro T., Wiens R. C., Nordholt J.E., Moses R. W., Reisenfeld D. B., Jurewicz A. J. G. andBurnett D. S. (2011) The oxygen isotopic composition of theSun inferred from captured solar wind. Science 332, 1528–1532.
McSween H. Y. (1977) Chemical and petrographic constraints onthe origin of chondrules and inclusions in carbonaceouschondrites. Geochim. Cosmochim. Acta 41, 1843–1860.
Nakashima D., Kimura M., Yamada K., Noguchi T., Ushikubo T.and Kita N. T. (2010) Study of chondrules in CH chondrites – I:oxygen isotope ratios of chondrules. Meteorit. Planet. Sci.
Suppl. 45, A148 (abstr.).Nakashima D., Ushikubo T., Joswiak D. J., Brownlee D. E.,
Matrajt G., Weisberg M. K., Zolensky M. E. and Kita N. T.(2012) Oxygen isotopes in crystalline silicates of comet Wild 2: acomparison of oxygen isotope systematics between Wild 2particles and chondritic materials. Earth Planet. Sci. Lett. 357–
358, 355–365.Remusat L., Robert F. and Derenne S. (2007) The insoluble
organic matter in carbonaceous chondrites: chemical structure,isotopic composition and origin. C. R. Geosci. 339, 895–906.
Rubin A. E. and Wasson J. T. (1995) Variations of chondriteproperties with heliocentric distance. Meteoritics 30, A569(abstr.).
Rudraswami N. G., Ushikubo T., Nakashima D. and Kita N. T.(2011) Oxygen isotope systematics of chondrules in the Allende
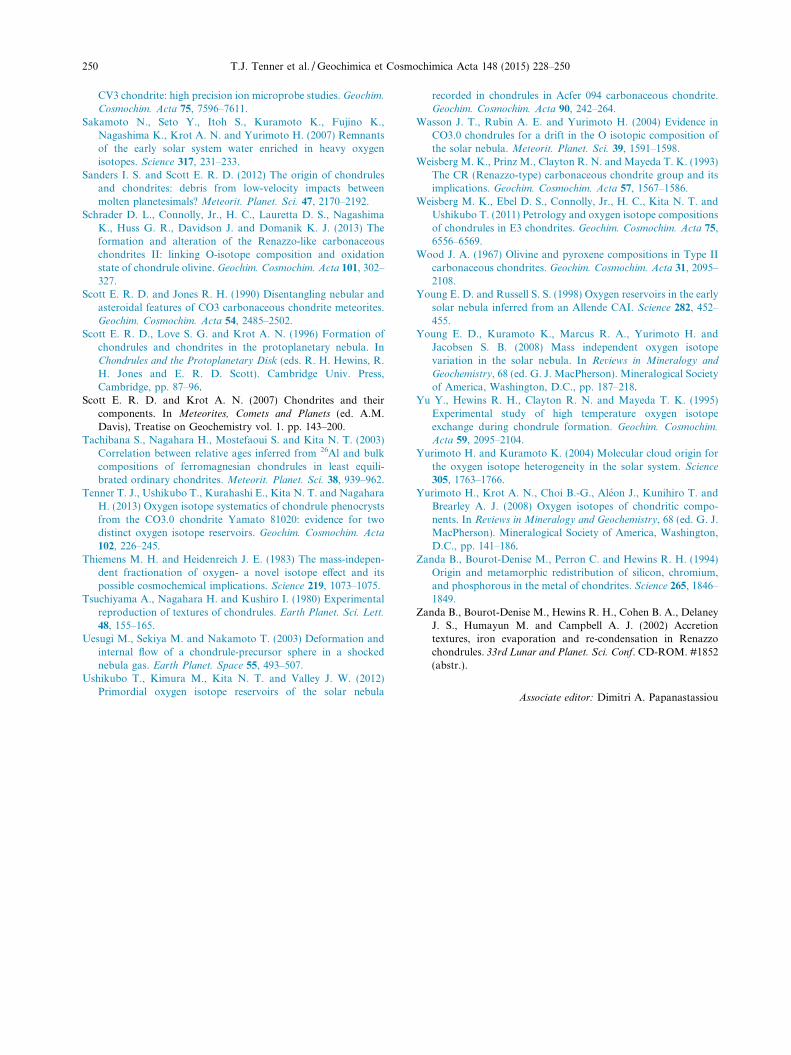
250 T.J. Tenner et al. / Geochimica et Cosmochimica Acta 148 (2015) 228–250
CV3 chondrite: high precision ion microprobe studies. Geochim.
Cosmochim. Acta 75, 7596–7611.Sakamoto N., Seto Y., Itoh S., Kuramoto K., Fujino K.,
Nagashima K., Krot A. N. and Yurimoto H. (2007) Remnantsof the early solar system water enriched in heavy oxygenisotopes. Science 317, 231–233.
Sanders I. S. and Scott E. R. D. (2012) The origin of chondrulesand chondrites: debris from low-velocity impacts betweenmolten planetesimals? Meteorit. Planet. Sci. 47, 2170–2192.
Schrader D. L., Connolly, Jr., H. C., Lauretta D. S., NagashimaK., Huss G. R., Davidson J. and Domanik K. J. (2013) Theformation and alteration of the Renazzo-like carbonaceouschondrites II: linking O-isotope composition and oxidationstate of chondrule olivine. Geochim. Cosmochim. Acta 101, 302–327.
Scott E. R. D. and Jones R. H. (1990) Disentangling nebular andasteroidal features of CO3 carbonaceous chondrite meteorites.Geochim. Cosmochim. Acta 54, 2485–2502.
Scott E. R. D., Love S. G. and Krot A. N. (1996) Formation ofchondrules and chondrites in the protoplanetary nebula. InChondrules and the Protoplanetary Disk (eds. R. H. Hewins, R.H. Jones and E. R. D. Scott). Cambridge Univ. Press,Cambridge, pp. 87–96.
Scott E. R. D. and Krot A. N. (2007) Chondrites and theircomponents. In Meteorites, Comets and Planets (ed. A.M.Davis), Treatise on Geochemistry vol. 1. pp. 143–200.
Tachibana S., Nagahara H., Mostefaoui S. and Kita N. T. (2003)Correlation between relative ages inferred from 26Al and bulkcompositions of ferromagnesian chondrules in least equili-brated ordinary chondrites. Meteorit. Planet. Sci. 38, 939–962.
Tenner T. J., Ushikubo T., Kurahashi E., Kita N. T. and NagaharaH. (2013) Oxygen isotope systematics of chondrule phenocrystsfrom the CO3.0 chondrite Yamato 81020: evidence for twodistinct oxygen isotope reservoirs. Geochim. Cosmochim. Acta
102, 226–245.Thiemens M. H. and Heidenreich J. E. (1983) The mass-indepen-
dent fractionation of oxygen- a novel isotope effect and itspossible cosmochemical implications. Science 219, 1073–1075.
Tsuchiyama A., Nagahara H. and Kushiro I. (1980) Experimentalreproduction of textures of chondrules. Earth Planet. Sci. Lett.
48, 155–165.Uesugi M., Sekiya M. and Nakamoto T. (2003) Deformation and
internal flow of a chondrule-precursor sphere in a shockednebula gas. Earth Planet. Space 55, 493–507.
Ushikubo T., Kimura M., Kita N. T. and Valley J. W. (2012)Primordial oxygen isotope reservoirs of the solar nebula
recorded in chondrules in Acfer 094 carbonaceous chondrite.Geochim. Cosmochim. Acta 90, 242–264.
Wasson J. T., Rubin A. E. and Yurimoto H. (2004) Evidence inCO3.0 chondrules for a drift in the O isotopic composition ofthe solar nebula. Meteorit. Planet. Sci. 39, 1591–1598.
Weisberg M. K., Prinz M., Clayton R. N. and Mayeda T. K. (1993)The CR (Renazzo-type) carbonaceous chondrite group and itsimplications. Geochim. Cosmochim. Acta 57, 1567–1586.
Weisberg M. K., Ebel D. S., Connolly, Jr., H. C., Kita N. T. andUshikubo T. (2011) Petrology and oxygen isotope compositionsof chondrules in E3 chondrites. Geochim. Cosmochim. Acta 75,6556–6569.
Wood J. A. (1967) Olivine and pyroxene compositions in Type IIcarbonaceous chondrites. Geochim. Cosmochim. Acta 31, 2095–2108.
Young E. D. and Russell S. S. (1998) Oxygen reservoirs in the earlysolar nebula inferred from an Allende CAI. Science 282, 452–455.
Young E. D., Kuramoto K., Marcus R. A., Yurimoto H. andJacobsen S. B. (2008) Mass independent oxygen isotopevariation in the solar nebula. In Reviews in Mineralogy and
Geochemistry, 68 (ed. G. J. MacPherson). Mineralogical Societyof America, Washington, D.C., pp. 187–218.
Yu Y., Hewins R. H., Clayton R. N. and Mayeda T. K. (1995)Experimental study of high temperature oxygen isotopeexchange during chondrule formation. Geochim. Cosmochim.
Acta 59, 2095–2104.Yurimoto H. and Kuramoto K. (2004) Molecular cloud origin for
the oxygen isotope heterogeneity in the solar system. Science
305, 1763–1766.Yurimoto H., Krot A. N., Choi B.-G., Aleon J., Kunihiro T. and
Brearley A. J. (2008) Oxygen isotopes of chondritic compo-nents. In Reviews in Mineralogy and Geochemistry, 68 (ed. G. J.MacPherson). Mineralogical Society of America, Washington,D.C., pp. 141–186.
Zanda B., Bourot-Denise M., Perron C. and Hewins R. H. (1994)Origin and metamorphic redistribution of silicon, chromium,and phosphorous in the metal of chondrites. Science 265, 1846–1849.
Zanda B., Bourot-Denise M., Hewins R. H., Cohen B. A., DelaneyJ. S., Humayun M. and Campbell A. J. (2002) Accretiontextures, iron evaporation and re-condensation in Renazzochondrules. 33rd Lunar and Planet. Sci. Conf. CD-ROM. #1852(abstr.).
Associate editor: Dimitri A. Papanastassiou
![Voltammetric Determination of Cocaine in Confiscated Samples Using a Carbon Paste Electrode Modified with Different [UO2(X-MeOsalen)(H2O)].H2O complexes](https://static.fdokumen.com/doc/165x107/63258de1545c645c7f09c2d3/voltammetric-determination-of-cocaine-in-confiscated-samples-using-a-carbon-paste.jpg)


![Theoretical studies on the interaction of some endohedral fullerenes {[X@C60]− (X=F−, Cl−, Br−) or [M@C60] (M=Li, Na, K)} with [Al(H2O)6]3+ and [Mg(H2O)6]2+ cations](https://static.fdokumen.com/doc/165x107/63245aa148d448ffa0071bdb/theoretical-studies-on-the-interaction-of-some-endohedral-fullerenes-xc60.jpg)


