Output file - Department of Industry, Science, Energy and ...
317
SUBMISSION PUBLIC VERSION Case No: ADC 416 Period of Investigation: 1 April 2016 – 31 March 2017 20 October 2017 The Director Operations 1 Anti-Dumping Commission EMAIL: [email protected] Ref: Anti-Dumping Investigation No.416 of Imports of Steel Rod In Coils from Indonesia, Republic of South Korea and Vietnam Sub: Comments on the Applicant’s particular market situation claims and Request for the Use of Rod In Coils Price in Vietnam to Determine the Normal Value in the Instant Investigation. Dear Mr. Director, On behalf of Government of Vietnam (hereinafter referred to as “GOV”), we hereby submit comments on the applicant’s particular market situation claims in the on-going anti- dumping investigation against steel rod in coils imported from Vietnam. In summary of this submission as analyzed below, the GOV requests the Australia Anti-dumping Commission (hereinafter referred to as “the Commission”):
-
Upload
khangminh22 -
Category
Documents
-
view
1 -
download
0
Transcript of Output file - Department of Industry, Science, Energy and ...

SUBMISSION PUBLIC VERSION
Case No: ADC 416
Period of Investigation: 1
April 2016 – 31 March 2017
20 October 2017
The Director
Operations 1
Anti-Dumping Commission
EMAIL: [email protected]
Ref: Anti-Dumping Investigation No.416 of Imports of Steel Rod In Coils
from Indonesia, Republic of South Korea and Vietnam
Sub: Comments on the Applicant’s particular market situation claims and
Request for the Use of Rod In Coils Price in Vietnam to Determine the
Normal Value in the Instant Investigation.
Dear Mr. Director,
On behalf of Government of Vietnam (hereinafter referred to as “GOV”), we hereby
submit comments on the applicant’s particular market situation claims in the on-going anti-
dumping investigation against steel rod in coils imported from Vietnam. In summary of this
submission as analyzed below, the GOV requests the Australia Anti-dumping Commission
(hereinafter referred to as “the Commission”):

Public Record
To reject the applicant’s claims of the existence of a particular market
situation in Vietnam and thus, to apply the rod in coils price in Vietnam’s
market in determining the normal value for those products originating from
Vietnam. In this case, any claim on a particular market situation in Vietnam
under Section 269 (2) (a) (ii) TAC, Custom Act 1901 is not warranted because
of insufficient evidence of the case record showing that:
(i) the rod in coils prices in Vietnam are artificially low due to the
absence of the GOV’s influence in both prices and cost of steel rod in
coils in Vietnam and
(ii) other conditions exist in Vietnam market that render the rod in coils
sales in Vietnam not suitable for use in determining the normal value
within the instant investigation.
In case of an affirmative decision on the particular market situation in
Vietnam, to implement Australia’s obligation under Article 2 of the WTO
Antidumping Agreement by using Vietnamese producers’ production cost data
to construct the normal value, instead of using Indonesian or any foreign data
as suggested by the applicant.
In addition, the GOV also notes that it has fully cooperated at its best capacity and provided
the Commission with requested response and information to the Commission’s questionnaire
in a timely manner. They are official and factual evidence to demonstrate that the GOV’s law
and policy do not intend to have or result in any distorting effects with regard to the rod in
coil industry and market in Vietnam. As an interested party to this proceeding, the GOV
requests that this position as supported by factual evidence should be carefully taken into
account by the Commission in accordance with its obligation under Article 6 of the
Agreement on Implementation of Article VI of the General Agreement on Tariffs and Trade
1994 (hereinafter referred to as “the WTO Antidumping Agreement) to which Vietnam and
Australia are both members. The GOV reserves its rights to provide additional comments on
the applicant’s allegation as well as any findings of the Commission at the later stage of this
investigation.
2

Public Record
Yours sincerely,
Dinh Anh Tuyet
IDVN Lawyers
Legal Counsel for the Government of Vietnam
3
3

Public Record
INTRODUCTION
1. At the outset, the GOV would like to note that the instant case against rod in coils is
the forth antidumping case and the second case having particular market situation
(herein after referred to as “PMS”) allegations initiated by the Commission against
Vietnamese imports only within 12 months. The first PMS investigation also targeted
the steel sector of Vietnam where the Commission sought detailed information on the
GOV’s law and policy applicable to the steel industry in general and galvanized steel
sector in particular as well as upstream producers of iron ore, coking coal, coke and
scrap steels. In its response to the Commission’s questionnaire, the GOV provided a
detailed explanation of its law and policy with supported data and legal documents
which was then reasonably and thoroughly examined by the Commission in order to
arrive at the conclusion that:
“... Additionally, the Commission did not find any evidence to support a finding that
the Government of Vietnam influenced or distorted the prices or costs of the goods in
the market, or any other conditions in the market that would support a finding of a
particular market situation in Vietnam.”1
2. This finding demonstrates an accurate and thorough understanding of the Commission
on the GOV’s law and policy with regards to the steel industry of Vietnam and should
serve as an important precedent for the Commission when considering any subsequent
PMS allegation against Vietnam, including this case on steel rod in coils. Therefore,
while the GOV is surprised and concerned with the Commission’s decision to
investigate the PMS issue within the steel sector again, it would trust that the
Commission would take a cautious approach in examining all evidence submitted by
the GOV in its response and other submissions and again reach a similar negative
conclusion on the existence of a particular market situation in Vietnam in this rod in
coil case.
3. In this case, the applicant relied entirely on its own misleading interpretation of the
GOV’s export and import tariff on raw materials to produce steel billet – the direct
input of steel rod in coils production to claim that the GOV intervened and distorted
1 Page 109-110, Final Report No.370, Alleged dumping of zinc coated (galvanized) steel exported to Australia from the Republic of India, Malaysia and the Socialist Republic of Vietnam.
4

Public Record
the prices of rod in coils on Vietnam market.2 Such claim is completely unwarranted
because neither the applicant’s submission nor factual evidence of the case record
supports the existence of any GOV’s intervention that may distort the rod in coils
price in Vietnam market. In this submission, the GOV discusses and analyzes all
factual evidence in light of Australia’s regulations and international obligations on
antidumping investigation to sustain (i) non-existence of a particular market situation
with regards to the rod in coils industry and market in Vietnam and (ii) the necessity
and suitability of using data associated with Vietnamese producers of rod in coils to
ensure a suitable determination of normal value under Article 2 of the WTO
Antidumping Agreement, instead of using Indonesian or any foreign cost benchmark
as suggested by the applicant as a result of any possible affirmation of a particular
market situation in Vietnam.
I. Any claim on the existence of a particular market situation in Vietnam
with regards to rod in coils in this case as provided under Section 269
(2)(a)(ii)TAC of Australia’s Custom Act 1901 is not warranted.
4. The GOV submits that there is no particular market situation in Vietnam regarding
rod in coils because criteria of establishing the existence of such market under Section
269(2)(a)(ii)TAC of Australia’s Custom Act 1901 and the Commission’s Dumping
and Subsidy Manual are not satisfied.
5. Pursuant to Section 269(1)TAC of Australia’s Custom Tariff 1901, a general principle
to establish the normal value of any goods exported to Australia is using “the price
paid or payable for like goods sold for home consumption in the exporting country”.
However, Section 269(2)(a)(ii) TAC provides an instance where the normal value of
goods exported to Australia cannot be ascertained by using the price paid or payable
in the exporting country because of the situation in the market of the country of export
which render the sales in that market are not suitable for use in determining a price
under subsection 1. This situation as described in Section 269(2)(a)(ii)TAC as such is
often referred to as “a particular market situation”.
6. The legislation does not define what constitutes a particular market situation that
would render domestic sales as unsuitable. However, the Commission in its Dumping
2 Page 67, Application for the publication of dumping and/or countervailing duty notices – Steel Rod in coils – exported from Republic of Indonesia, the Socialist Republic of Vietnam and the Republic of Korean, May 2017.
5

Public Record
and Subsidy Manual determines that a particular market situation exists in an
exporting country when
“(i) the prices are artificially low; or
(ii) there are other conditions in the market which render sales in that market not
suitable for use in determining prices under Subsection 269 TAC(1)” .3
7. The GOV believes that none of these factors exist in this case.
1. Insufficient evidence showing that the price of rod in coils sold in Vietnam are
artificially low
8. In the Commission’s Dumping and Subsidy Manual, in order to find “artificially low
pricing” of the subject merchandise, there must be sufficient evidence of the record
showing significant influence by the government of an exporting country that distorts
the prices or cost of that merchandise.
“…in investigating whether a market situation exists due to government influence, the
Commission will seek to determine whether the impact of the government’s
involvement in the domestic market has materially distorted competitive conditions. A
finding that competitive conditions have been materially distorted may give rise to a
finding that domestic prices are artificially low or not substantially the same as they
would be if they were determined in a competitive market. One example of
government influence distorting competitive conditions and leading to artificially low
prices may be the presence of government owned enterprises in the domestic market.
The presence of government owned enterprises, of itself, may not lead to the
conclusion that sales are unsuitable. Rather, market conditions will no longer be said
to prevail when the number of government owned enterprises, together with any
unprofitable sales by those same enterprises, has caused a significant distortion to the
prices received by private enterprises.”4
9. In the instant investigation, the GOV does not have any influence in a manner that
materially distorts competitive conditions of rod in coils on Vietnam market.
10. First, as indicated in its response to the Commission’s questionnaire, the GOV does
not have any direct ownership or representation in any rod in coil producers and
3 Page 36 Dumping and Subsidy Manual, April 2017 by the Anti-dumping Commission of Australia. 4 Page 36-37, Id.
6

Public Record
traders in Vietnam. The rod in coils industry is subject to the same set of laws and
regulations with other sectors of production and business in Vietnam. There is no
restriction or control by the GOV over the number of producers and traders or over
the private or foreign ownership in this sector or over the quantity of production and
sale in Vietnam and export markets. They are free to decide how much to produce and
at which price to sell their products in Vietnam and abroad. Being a steel rod in coil
maker or trader has never been a criterion to receive any benefit or favor under the
Vietnam’s law.
11. Second, to the extent that the Commission is concerned with the ownership of
Vietnam Steel Corporation – a state-owned company – in 05 rod in coils
producers,[INFORMATION OF ENTERPRISES] the GOV emphasizes two relevant
important factors to demonstrate that competitive market conditions still prevail in
Vietnam in this sector. Firstly, Vietnam Steel Corporation [INFORMATION OF
ENTERPRISES] did not produce and sell rod in coils during the POI but rather
operated as a holding company having equity interests and acting as shareholder in
those 05 producers,[INFORMATION OF ENTERPRISES]. Secondly, the local
private sector and foreign-invested enterprise prevail the whole rod in coils industry
when accounting for more than 75% of the total industry’s production quantity while
these 05 producers only accounted less than 25% and never exported the subject
merchandise to Australia.5 ,[INFORMATION OF ENTERPRISES] Thirdly, the only
exporter of rod in coils to Australia is a 100% private company in which both the
GOV and Vietnam Steel Corporation ,[INFORMATION OF ENTERPRISES]do not
have any ownership or equity interest.
12. Third, as responded to the Commission, steel rod in coils is not subject to any price
control measure taken by the GOV. Pursuant to Article 11 of the Law on Prices of
Vietnam6, enterprises have the right to self-determine the prices of goods or services
which they manufacture or deliver except for certain products subject to price
determination by the GOV. A list of these products is provided in Article 19 of this
Law. Rod in coils as well as all of the upstream raw materials including iron ore,
coking coal, coke, scrap steel and square billets are completely absent from such list.
5 Exhibit 1 to the GOV’s questionnaire response 6 This law is provided at Exhibit 10 to the GOV’s questionnaire response.
7
Public Record
Therefore, sale and purchase of rod in coils follow market supply and demand without
any intervention by the GOV.
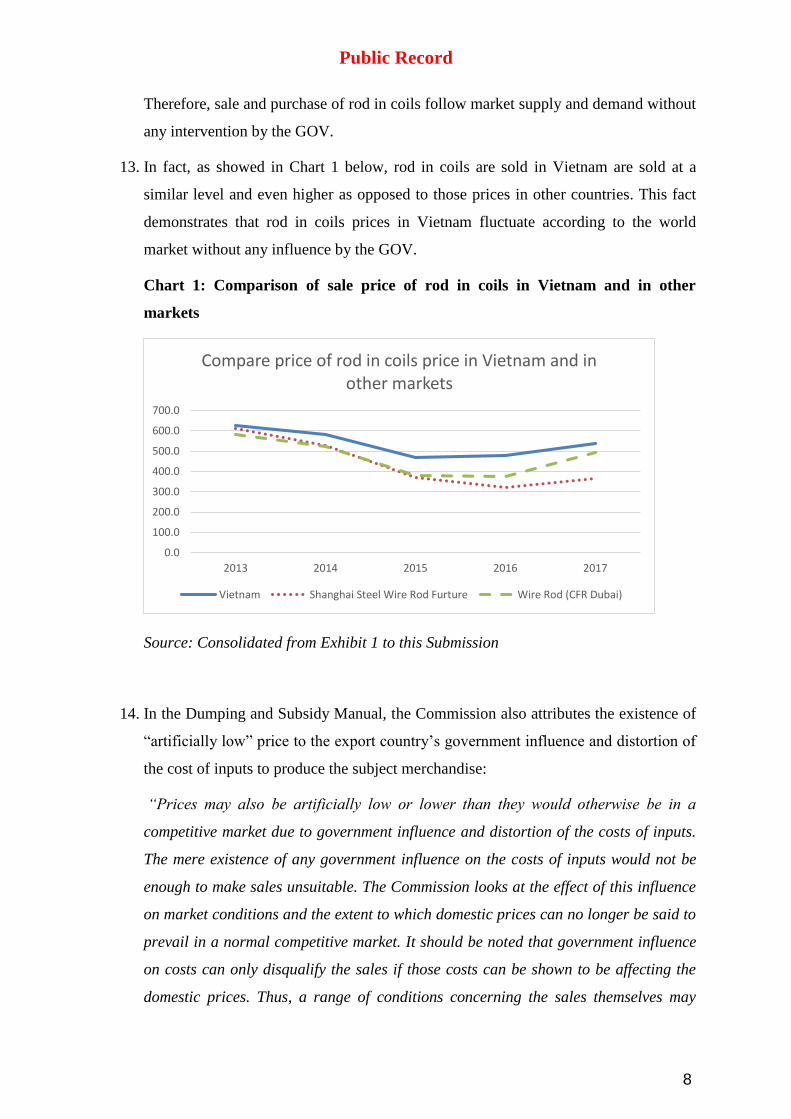
13. In fact, as showed in Chart 1 below, rod in coils are sold in Vietnam are sold at a
similar level and even higher as opposed to those prices in other countries. This fact
demonstrates that rod in coils prices in Vietnam fluctuate according to the world
market without any influence by the GOV.
Chart 1: Comparison of sale price of rod in coils in Vietnam and in other
markets
Source: Consolidated from Exhibit 1 to this Submission
14. In the Dumping and Subsidy Manual, the Commission also attributes the existence of
“artificially low” price to the export country’s government influence and distortion of
the cost of inputs to produce the subject merchandise:
“Prices may also be artificially low or lower than they would otherwise be in a
competitive market due to government influence and distortion of the costs of inputs.
The mere existence of any government influence on the costs of inputs would not be
enough to make sales unsuitable. The Commission looks at the effect of this influence
on market conditions and the extent to which domestic prices can no longer be said to
prevail in a normal competitive market. It should be noted that government influence
on costs can only disqualify the sales if those costs can be shown to be affecting the
domestic prices. Thus, a range of conditions concerning the sales themselves may
0.0
100.0
200.0
300.0
400.0
500.0
600.0
700.0
2013 2014 2015 2016 2017
Compare price of rod in coils price in Vietnam and in other markets
Vietnam Shanghai Steel Wire Rod Furture Wire Rod (CFR Dubai)
8

Public Record
have the effect of rendering those sales prices as being unsuitable for use in
determining prices under subsection 269TAC(1). When relevant and reasonably
reliable evidence supporting the proposition that domestic selling prices are
unsuitable for normal values is set out in the application, and an investigation is
initiated, the Commission will adopt the following procedures in order to ensure
interested parties have an opportunity to consider the claims and present evidence:
Notify the government of the country and the exporters of the claims and of the
evidence provided. Additional questions will be inserted into the exporter
questionnaire titled “Market Situation”. A ‘Market Situation’ questionnaire will
also be prepared for government.
Both questionnaires will be based upon the evidence provided by the Australian
industry that supported the decision to investigate. That is, the information
supporting the claim that the domestic prices are materially influenced by the
government of that country and are not substantially the same as they would be if
they were determined in a competitive market. Any other relevant information in
the possession of the Commission may also be taken into account when preparing
the questionnaire. The government and the exporter will be asked to respond as
specifically as possible to the questions. Accompanying letters will draw attention
to these questions.
If the government of the country or exporters fail to respond after being given a
reasonable opportunity to do so, or do not provide probative evidence in
response, all available evidence is weighed up, including the prima facie evidence
of the application. One possible outcome is that the Commission will determine
that a situation in the market has rendered domestic selling prices unsuitable for
establishing normal values.”7
15. In the Questionnaire, specific questions were raised to the GOV regarding its law and
policy regarding iron ore, coking coal, coke, scrap steels, and steel billet – raw
materials that constitute a part of production cost of the subject merchandise. The
GOV fully cooperated with the Commission by providing requested information and
data at its best capacity, which demonstrates that the GOV has not implemented any
policy to place a downward effect on the price of raw material inputs into the
7 Page 37, the Dumping and Subsidy Manual, April 2017 by the Anti-dumping Commission of Australia.
9
Public Record
production of rod in coils including iron ore, coking coal, coke and scrap steel as
further analyzed below:
1.1 Coking coal and coke
16. Contrary to the applicant’s claims in its Application, the GOV’s import and export
tariff policies on these materials did not distort the market conditions in Vietnam
during the period of investigation
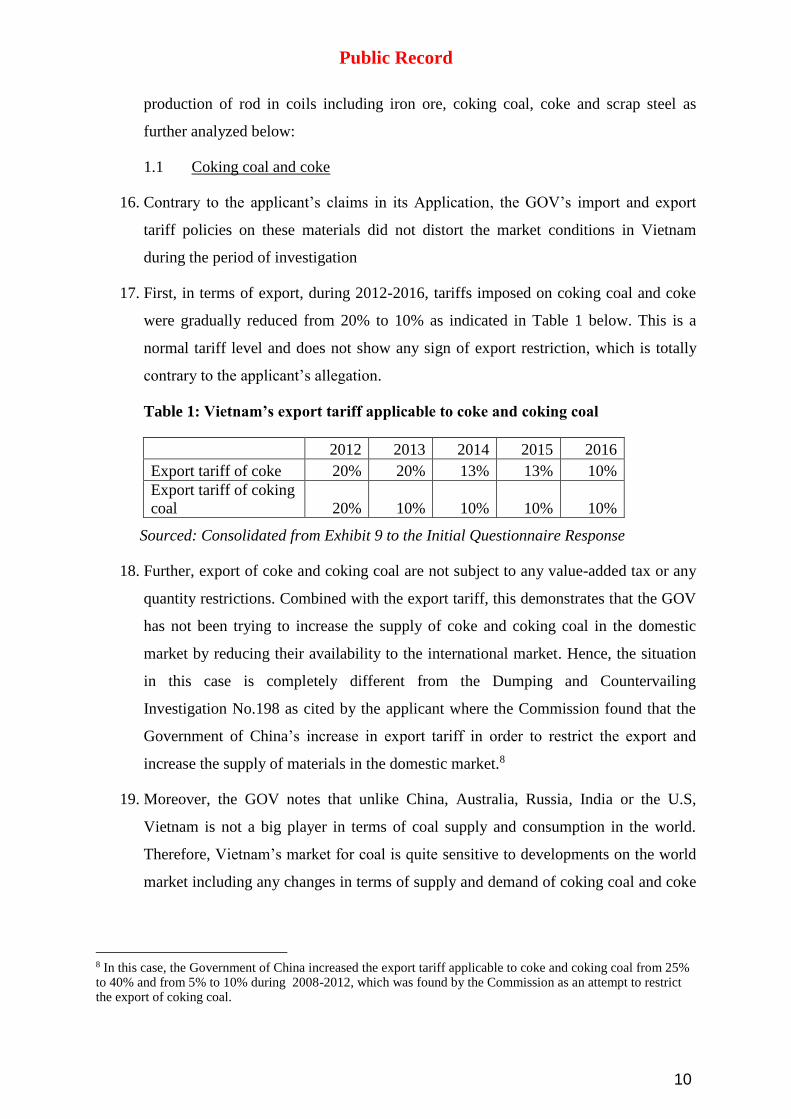
17. First, in terms of export, during 2012-2016, tariffs imposed on coking coal and coke
were gradually reduced from 20% to 10% as indicated in Table 1 below. This is a
normal tariff level and does not show any sign of export restriction, which is totally
contrary to the applicant’s allegation.
Table 1: Vietnam’s export tariff applicable to coke and coking coal
2012 2013 2014 2015 2016
Export tariff of coke 20% 20% 13% 13% 10%
Export tariff of coking
coal 20% 10% 10% 10% 10%
Sourced: Consolidated from Exhibit 9 to the Initial Questionnaire Response
18. Further, export of coke and coking coal are not subject to any value-added tax or any
quantity restrictions. Combined with the export tariff, this demonstrates that the GOV
has not been trying to increase the supply of coke and coking coal in the domestic
market by reducing their availability to the international market. Hence, the situation
in this case is completely different from the Dumping and Countervailing
Investigation No.198 as cited by the applicant where the Commission found that the
Government of China’s increase in export tariff in order to restrict the export and
increase the supply of materials in the domestic market.8
19. Moreover, the GOV notes that unlike China, Australia, Russia, India or the U.S,
Vietnam is not a big player in terms of coal supply and consumption in the world.
Therefore, Vietnam’s market for coal is quite sensitive to developments on the world
market including any changes in terms of supply and demand of coking coal and coke
8 In this case, the Government of China increased the export tariff applicable to coke and coking coal from 25% to 40% and from 5% to 10% during 2008-2012, which was found by the Commission as an attempt to restrict the export of coking coal.
10

Public Record
taking place in giant players rather than to the GOV’s import or export tariff on these
materials.
Table 2: Vietnam and other countries’ coal production and consumption
Coal: Production Unit: Million tonnes oil equivalent
Year 2012 2013 2014 2015 2016 Share (%)
US 517.79 500.87 507.70 449.34 364.82 10.0%
Russian Federation 168.29 173.12 176.59 186.38 192.77 5.3%
South Africa 146.57 145.26 148.23 142.89 142.44 3.9%
Australia 265.86 285.78 305.70 305.81 299.29 8.2%
China 1873.54 1894.59 1864.21 1825.56 1685.71 46.1%
India 255.05 255.73 269.45 280.90 288.53 7.9%
Indonesia 227.39 279.66 269.94 271.98 255.74 7.0%
Vietnam 23.57 23.00 23.01 23.23 22.04 0.6%
Coal: Consumption Unit: Million tonnes oil equivalent
Year 2012 2013 2014 2015 2016 Share (%)
US 437.92 454.57 453.53 391.82 358.43 10%
Total Europe &
Eurasia 528.06 508.05 487.26 471.34 451.56 12%
China 1927.79 1969.07 1954.48 1913.62 1887.55 51%
India 329.99 352.78 387.54 396.55 411.95 11%
Indonesia 53.02 57.01 45.12 51.16 62.70 2%
Japan 115.82 121.15 119.15 119.89 119.94 3%
Vietnam 15.04 15.83 18.94 22.25 21.33 1%
Source: Consolidated from World Energy Statistics 2017 provided at Exhibit 3 to this
Submission.
20. As can be seen from Table 2, Vietnam’s shares of the world’s coal production and
consumption account less than 1%. Indeed, Vietnam’s export of coking coal during
2012-2016 is totally inelastic to the GOV’s change in the export tariff on this
material:
Chart 2: Vietnam’s coking coal export quantity during 2012-2016
21. As can be seen, the export quantity of coking coal reached the highest level in 2012
when the export tariff was set at the highest level. When the tariff was reduced to 10%
in 2013 and maintained that level until 2016, the quantity of export did not increase
but followed a downward trend. Thus, there is no causation between the GOV’s
export tariff and the supply of coking coal to international markets.
11

Public Record
22. Similar observations can be made with regards to coke export as described in Table 3
below:
Table 3: Coke export by Vietnam and Applicable Export Tariff
23. The overall trend for both export tariff and the quantity of coke export by Vietnam is
decreasing during 2012-2016.
24. Second, in terms of import, the GOV notes that tariff levels levied on imported coking
coal and coke are not decided merely by the GOV’s discretion. Rather, they are
subject to Vietnam’s obligation under multilateral agreement (i.e. WTO) or free trade
agreements. Thus, applicable tariffs during 2012-2016 on imported coking coal and
coke from major country suppliers should be anticipated a long time before the POI
and should not be considered as an attempt of the GOV to encourage the importation
for the domestic market. For example, the fact that a decrease in the tariff of coking
coal of HS code 2704.0020 and 27.04.00.30 imported from Australia to 0% in 2016 as
cited by the applicant in the petition was in fact decided since 2009 as a Vietnam’s
obligation under the ASEAN-Australia/New Zealand Free Trade Area. Exhibit 2
provides detailed information of the import tariff on coking coal and coke into
Vietnam from 05 largest suppliers corresponding to Vietnam’s commitments under
relevant free trade agreements.
25. Import tariff rates applicable to coking coal and coke during 2012-2016 result from
the negotiation and agreement between the GOV and its counterparts in the process of
establishing free trade areas. It is the implementation of such obligations that led to
the reduction in the import tariff rates in 2016. This fact obviously contradicts the
applicant’s allegation that the GOV changed its import policy to encourage the
importation of these materials into Vietnam in order to create a favor to the
downstream value added industries such as steel billet and rod in coils.
26. In addition, the quantity of coking coal imported into Vietnam is more dependent on
prices fluctuations in the world market. For instance, as indicated in Chart 3 below,
the import volume of coking coal into Vietnam in 2016 from Australia – the largest
supplier – was completely elastic to the price market.
Chart 3: Price elasticity of Coal import into Vietnam from Australia in 2016
1.2 Iron ore and scrap steel
12

Public Record
27. First, the GOV submits that no export restriction measures in form of quota or tariff
against iron ore and scrap steel were introduced during the POI in order to reserve the
market for these products for domestic downstream users as claimed by the applicant.
It is an obvious fact that the export tariff levied by the GOV on iron core remained
unchanged during 2012-2016 while the quantity of export has increased dramatically
as shown in Table 4 below:
Table 4: Iron ore export by Vietnam and Applicable Export Tariff
28. A similar trend is observable with regards to the export of scrap steel.
Table 5: Scrap steel export by Vietnam and Applicable Export Tariff
29. Thus, there is no correlation between the GOV’s export tariff in this regard and the
so-called “export restriction” policy as claimed by the applicant.
30. Meanwhile, import tariff on iron ore of 0% applicable during 2012-2016 was actually
the ceiling rate under Vietnam’s WTO commitments since 2007. Obviously contrary
to the applicant’s claim, it is not the GOV’s policy to maintain a difference of 40%
between the export and import tariff rates on iron ore in order to favor the
downstream producers such as steel billet or rod in coils.
31. In addition, the increase in iron ore import volume during 2015-2016 is attributed to
the steel billet production expansion by a number of BOF projects invested with
private and foreign capital by Hoa Phat Group and Formosa Ha Tinh Steel
[INFORMATION OF ENTERPRISES]. Chart 4 shows that Vietnam’s domestic
production of iron ore hardly satisfied the demand during this period.
Chart 4: Iron ore production and consumption for steel billet production in
Vietnam
32. Similarly, the increase in scrap steel imports results from the investment in steel billet
by private sectors such as Vinakyoei Vietnam and POSCO SS Vina.
[INFORMATION OF ENTERPRISES]
13

Public Record
33. Therefore, the fact that import of iron ore and scrap steel increased significantly into
Vietnam during 2015-2016 has nothing to do with the GOV’s import tariff. Rather it
results from the capacity expansion of the billet sector by investment from the private
and foreign sectors.
1.3 Electricity
34. In its submission dated September 6, 2017, the applicant claimed that the rod in coil
prices in Vietnam is artificially low due to government influence and distortion of the
cost of electricity9 and requested the Commission to substitute the steel billet
production cost of Indonesia for that of Vietnam in order to calculate the cost of
production of rod in coils. This claim is clearly unfounded
35. First, the GOV’s influence in the electricity price – an input of steel billet production
– is not sufficient to allow a conclusion that a market situation exists in the
Vietnamese’s rod in coils market that renders the sale of rod in coils in Vietnam
unsuitable for determining normal value under Section 269TAC(1). The
Commission’s Dumping and Subsidy Manual correctly points out that:
“…The mere existence of any government influence on the costs of inputs would not
be enough to make sales unsuitable. The Commission looks at the effect of this
influence on market conditions and the extent to which domestic prices can no longer
be said to prevail in a normal competitive market. It should be noted that government
influence on costs can only disqualify the sales if those costs can be shown to be
affecting the domestic prices.”10
36. First, the GOV would note that its regulation of electricity tariff is a normal practice
that is also adopted by a number of other countries including Indonesia and Australia.
Exhibit 6 provides the applicable tariff decided by the GOV during 2012-2015 in
comparison with that of Indonesia and Australia (Queensland) where caps on
electricity tariff are also applied. Nowhere in Australia’s regulations on antidumping
and the Commission’s practice of previous cases that support an affirmative finding of
a particular market situation resulting from the government control on electricity
tariff. Further, given the fact that electricity tariffs in Vietnam and Indonesia are both
regulated by the government, it would be even more unreasonable if the Commission
9 Page 1, OneSteel Manufacturing Pty Ltd’s Submission dated 6 September 2017. 10 Page 36, the Dumping and Subsidy Manual, April 2017 by the Anti-dumping Commission of Australia
14
Public Record
accepts the applicant’s request to replace the Vietnamese steel billet cost data by
Indonesia’s value.
37. Second, the GOV’s influence on electricity cost cannot disqualify domestic sales of
rod in coils because it does not affect those sale prices. This position is fully in
accordance with the Commission’s view in the Deep Drawn Stainless Steel Sinks-
China (hereinafter referred to as Sink-China).
38. In the Sink-China case, the Commission concluded that the cost of 304 SS CRC steel
– an input to produce the sink did not impact the domestic price of the latter in a
manner that rendered domestic sales of sink unsuitable for determining normal values
because (i) the proportion of this material on average of 45-55% of the total cost of
the sinks are “considerably lower” than the proportion of distorted raw materials of
finished merchandise whose domestic sales are unsuitable in previous cases and (ii)
the difference between reasonably competitive market cost and the Chinese’s 304 SS
CRS steel is only 10% as follows:
“…Although satisfied that government influence has distorted the cost of 304 SS CRC
steel incurred by Chinese exporters of the goods, the Commissioner is not satisfied
that this has impacted the domestic selling prices of deep drawn stainless steel sinks
to such an extent that those prices are no longer suitable for determining section 269
TAC(1) normal values.
In making this assessment, the Commissioner notes the following.
the distorted input (304 SS CRC) represented on average 45% to 55% of the
total cost to manufacture incurred by Chinese deep drawn stainless steel sink
manufacturers. Although this is considered to reflect a significant proportion
of the cost to manufacture the goods, it is considerably lower than the
proportion of the cost to manufacture represented by distorted raw materials
in the production of HSS, hot rolled plate steel, galvanised steel and
aluminium zinc coated steel, all of which were found to be subject to have
particular market situations in China during the Commission’s investigations
into each product. In these cases, the percentage of total costs represented by
distorted raw materials was significantly higher, and hence more likely to
have a ‘flow on’ effect of rendering selling prices of the manufactured product
unsuitable for determining normal values.
15

Public Record
The difference between the reasonably competitive market cost determined by
the Commission for 304-SS CRC87 (see Non-Confidential Appendix 4 and
Non-Confidential Appendix 8 for discussion) and the costs actually incurred
by Chinese exporters of the goods is on average 10% (i.e. Chinese-incurred
costs are 10% lower than the reasonably competitive market cost for 304 SS
CRC). This uplift, while significant, is substantially lower than uplifts to steel
raw material costs observed by the Commission in its investigations into other
Chinese steel products.
When combined with the consideration that this is a 10% uplift to a cost that is
approximately 45 – 55% of total manufacturing costs, the Commission
considers this does not provide strong evidence that the impact of distorted
stainless steel costs has had the impact of creating a market situation in the
deep drawn stainless steel sinks market (i.e. it is likely that this distorted input
has not impacted the price of deep drawn stainless steel sinks to such an extent
that domestic prices of those goods are no longer suitable for use in
determining normal value)..”11
39. In this case, a thorough examination of Vietnam’s electricity tariff and its proportion
in the cost of billet and rod in coils production also shows a similar uplift level as in
the Deep Drawn Stainless Steel Sinks- China case.
40. First, electricity represents on average 3% to 10% of the total cost to manufacture
steel billet for BOF and EAF technologies.12 Adding to rolling stage (i.e. rolling billet
into rod in coils), total cost of electricity to manufacture long steel accounts for
around 35% and can even be more efficient.13This proportion is even much lower than
the proportion of the distorted cost of raw material in the China-Sink case.
41. Second, Vietnam’s electricity tariff during 2016 is almost at the same level with other
countries. Exhibit 6 provides the applicable tariff to electricity consumption for
production and business purpose in Vietnam and other countries including Indonesia,
11 Page 131-132, REP 238 Deep Drawn Stainless Steel Sinks- China
12 Cost of electricity to produce steel using BOF and EAF technologies can be found via
http://www.steelonthenet.com/cost-eaf.html and http://www.steelonthenet.com/cost-bof.html
13 Id.
16

Public Record
Thailand, Malaysia and Australia in 2016. Accordingly, Vietnam’s tariff is around
14% lower than the average of these countries and 9% lower than Indonesia.
42. As such, an uplift of 8%-14% to a cost that is approximately 35% of the total
manufacturing cost of rod in coils should not be considered strong evidence that
influence cost of electricity in Vietnam has had the impact of creating a market
situation in the rod in coil market.
43. In fact, electricity cost does not have any significant impact on the price of steel billet
and rod in coils in Vietnam. As indicated in Chart 5 below, fluctuations in electricity
tariffs had no correlation with the prices of steel billet in Vietnam’s market.
Chart 5: Electricity price changes and steel billet price developments in Vietnam
during 2012-2016
44. As can be seen, billet price reached its highest peak in 2012 when the electricity price
was lowest. Meanwhile, the former reduced almost by 50% when the latter reached
almost the highest level in 2015.
45. For all of reasons above, the GOV strongly requests the Commission to reject the
applicant’s position in its submission dated September 6, 2017 regarding the existence
of a particular market situation in Vietnam’s rod in coils market due to the GOV’s
influence on electricity and thus, render the applicant’s request for using Indonesia’s
billet cost of production groundless.
1.4 Steel billet
46. Regarding steel billet, as indicated in Exhibit 6 and 9 to the GOV’s Initial
Questionnaire Response, export tariff of steel billet was maintained at 0% for 2012-
2016 while import tariff for main foreign suppliers such as Japan and China were set
at various levels between 0% - 7%. In addition, steel billet is not subject to any import
or export restrictions. These are strong evidence that the GOV does not encourage the
importation and restrict the exportation of inputs to manufacture rod in coils as
alleged by the applicant.
47. In addition, as reported in the GOV’s Initial Questionnaire Response, effectively from
March 22, 2016, the GOV levied a safeguard tax of 23% on imported billet with a
17

Public Record
regular liberalization of 2% each year in order to rescue the domestic billet industry.
This, needless to say, results in increasing the price of steel billets in Vietnam.
Chart 7: Steel billet price in Vietnam after safeguard duty in 2016 in comparison
with price of Black sea areas
48. As a result, Vietnamese producers of rod in coils incurred a higher cost of production
of rod in coils given the fact that domestic production of billet did not satisfy the
consumption demand.14
49. Further, the GOV would note that all of its policy including import and export tariff
on iron ore, scrap steel, coking coal and coke were already reported to the
Commission in the Zinc Coated (Galvanized) Steel-Vietnam No 370 (hereinafter
referred to as Galvanized Steel-Vietnam), where the Commission concluded that there
is no evidence “to support a finding that the Government of Vietnam influenced or
distorted the prices or costs of the goods in the market, or any other conditions in the
market that would support a finding of a particular market situation in Vietnam.”15
Accordingly, the GOV requests the Commission to adopt the same findings as there
are no changes in terms of the GOV’s policies as reported in the Gavalnized Steel-
Vietnam case and this instant investigation.
50. As with galvanize steel producers, Vietnamese rod in coils manufacturers are totally
free from the GOV control to decide on their own production and sale price. Thus, the
GOV strongly opposes the applicant’s claim on the existence of the so-called
“artificially low” price of rod in coils sale in Vietnam market and requests the
Commission to conclude that there is no particular market situation in Vietnam that
may arise out of such claim.
2. There are no other conditions in the market rendering sales in Vietnam not
suitable for use in determining the normal value
14 As indicated in Exhibit 4 to the GOV’s Initial Questionnaire Response, total domestic supply of billet was 7.8 million tons in 2016 while the consumption quantity is more than 8.6 million tons. 15 Page 109-110, Final Report No.370, Alleged dumping of zinc coated (galvanized) steel exported to Australia from the Republic of India, Malaysia and the Socialist Republic of Vietnam.
18
Public Record
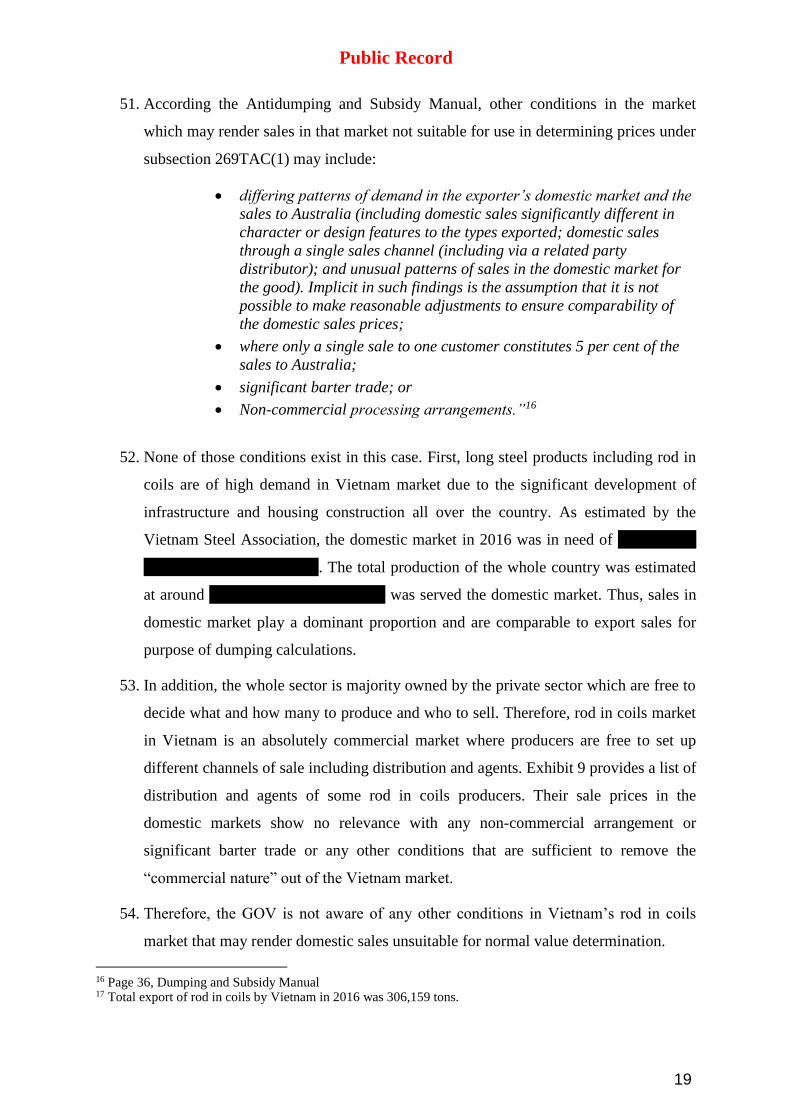
51. According the Antidumping and Subsidy Manual, other conditions in the market
which may render sales in that market not suitable for use in determining prices under
subsection 269TAC(1) may include:
differing patterns of demand in the exporter’s domestic market and the
sales to Australia (including domestic sales significantly different in
character or design features to the types exported; domestic sales
through a single sales channel (including via a related party
distributor); and unusual patterns of sales in the domestic market for
the good). Implicit in such findings is the assumption that it is not
possible to make reasonable adjustments to ensure comparability of
the domestic sales prices;
where only a single sale to one customer constitutes 5 per cent of the
sales to Australia;
significant barter trade; or
Non-commercial processing arrangements.”16
52. None of those conditions exist in this case. First, long steel products including rod in
coils are of high demand in Vietnam market due to the significant development of
infrastructure and housing construction all over the country. As estimated by the
Vietnam Steel Association, the domestic market in 2016 was in need of more than 3
million tons of rod in coils. The total production of the whole country was estimated
at around 1.3 million tons and 75%17 was served the domestic market. Thus, sales in
domestic market play a dominant proportion and are comparable to export sales for
purpose of dumping calculations.
53. In addition, the whole sector is majority owned by the private sector which are free to
decide what and how many to produce and who to sell. Therefore, rod in coils market
in Vietnam is an absolutely commercial market where producers are free to set up
different channels of sale including distribution and agents. Exhibit 9 provides a list of
distribution and agents of some rod in coils producers. Their sale prices in the
domestic markets show no relevance with any non-commercial arrangement or
significant barter trade or any other conditions that are sufficient to remove the
“commercial nature” out of the Vietnam market.
54. Therefore, the GOV is not aware of any other conditions in Vietnam’s rod in coils
market that may render domestic sales unsuitable for normal value determination.
16 Page 36, Dumping and Subsidy Manual 17 Total export of rod in coils by Vietnam in 2016 was 306,159 tons.
19

Public Record
II. In the event of an affirmative decision of a particular market situation in
Vietnam, the Commission is obliged to use Vietnam producers’ data of
production cost to construct the normal value.
55. Even if the Commission affirmatively determines that a particular market situation in
Vietnam exists in a manner that renders domestic sales of rod in coils in Vietnam
unsuitable for normal value calculation, it is obliged under Article 2.2 of the WTO
Antidumping Agreement to construct the normal value based on Vietnamese
producers’ data on cost of production or export sale to third countries.
56. Article 2.2 provides as below:
“ When there are no sales of the like product in the ordinary course of trade in the
domestic market of the exporting country or when, because of the particular market
situation or the low volume of the sales in the domestic market of the exporting
country(2), such sales do not permit a proper comparison, the margin of dumping
shall be determined by comparison with a comparable price of the like product when
exported to an appropriate third country, provided that this price is representative, or
with the cost of production in the country of origin plus a reasonable amount for
administrative, selling and general costs and for profits.”
57. As such, the existence of a particular market situation authorizes the Commission
only to disregard domestic sales of rod in coils in Vietnam for normal value
calculation. Either the cost of production incurred by Vietnamese producers or
representative sale prices of rod in coils to third countries must be applied to
determine normal value. Nothing in this Article further authorizes the Commission to
rely on a foreign benchmark of production cost to calculate the normal value as
requested by the applicant in this case. This interpretation is fully supported and
clarified by Article 2.2.1.1 as follows:
“For purpose of paragraph 2, costs “shall” normally be calculated on the basis of
records kept the exporter or producer under investigation, provided that such records
are in accordance with the generally accepted accounting principles of the exporting
country and reasonably reflect the costs associated with the production and sale of
the product under consideration.”
58. As long as the Vietnamese producer’s cost records comply with requirements under
Article 2.2.1.1, the Commission is obliged to calculate the cost of production based on
20
Public Record
the former’s records and data as a general principle. This Article does not require an
investigated producer’s cost to be on competitive basis in order for such cost records
to be used to construct normal value. Thus, the Commission is not authorized to use a
foreign cost benchmark to replace Vietnamese producers’ cost records merely because
the latter is not competitively based due to the existence of a particular market
situation in Vietnam.
59. The GOV’s position in this regard is supported by the WTO jurisprudence with
regards to the interpretation of Article 2.2 of the WTO Anti-dumping Agreement.
60. In EC-Tube or Pipe Fitting, the Appellate Body clearly indicated that Article 2.2.1.1
identified the records kept by the exporter or producer under investigation “to be the
preferred source for cost of production data.”18 Therefore, the Commission as the
investigation authority in this case is directed to base its calculation of costs on such
records when two conditions under this Article are met.
61. Moreover, in EU-Biodiesel – a dispute that addresses a similar situation where
Argentina challenged the EU’s departure from the Argentinian respondents’ recorded
costs of raw materials because of Argentina’s imposition of an export tax on soya-a
biodiesel input, the Appellate Body found that the EU’s departure acted inconsistently
with Article 2.2.1.1 and Article 2.2 of the WTO Anti-dumping Agreement. Therefore,
the GOV opines that the applicant’s request for substituting Indonesia’s steel billet
cost data for that of Vietnamese producers’ in this case would obviously amount to a
violation engaged by the EU in the Biodiesel case and thus, such request should be
dismissed by the Commission.
62. First, Article 2.2.1.1 of the WTO Antidumping Agreement requires the cost records to
“reasonably reflect” the cost actually incurred by the producers instead of insisting on
the reasonableness of the cost itself. In other words, this Article “requires a
comparison between the costs in the producer's or exporter's records and the costs
incurred by such producer or exporter. The object of the comparison is to establish
whether the records reasonably reflect the costs actually incurred, and not whether
they reasonably reflect some hypothetical costs that might have been incurred under a
different set of conditions or circumstances and which the investigating authority
considers more 'reasonable' than the costs actually incurred.”19 Therefore, in EU-
Biodiesel case, the mere affirmation by EU that the Argentina’s domestic prices of the
soya bean – main raw material used by biodiesel producers – were found to be
18 EC-Tube or Pipe Fittings, (DS219) AB report, para 99. 19 EU-Biodiesel, (DS473), AB report, para 6.41.
21
Public Record
artificially lower than international prices due to the distortion by Argentina
government’s export tax system “cannot serve as a sufficient basis under Article
2.2.1.1 for concluding that the producers' records do not reasonably reflect the costs
associated with the production and sale of biodiesel.20” Applying the same
interpretation in this rod in coils case, the applicant’s request for replacing
Vietnamese producers’ billet cost data with those of Indonesian by merely relying on
its alleged existence of “artificially low” prices of inputs to produce rod in coils in
Vietnam would present a violation of Article 2.2.1.1 in an exact manner with the EU
in the cited case. The GOV strongly believes that the Commission would carefully
take into account this issue in order to avoid this mistake.
63. Second, according to the Appellate Body, while Article 2.2 does not prohibit the
authority from relying on information other than that contained in the records kept by
the exporter or producer, including in-country and out-of-country evidence, this does
not mean that an investigating authority may simply substitute the costs from outside
the country of origin for the "cost of production in the country of origin" as suggested
by the applicant.21 According to the Appellate Body, Article 2.2 of the Anti-Dumping
Agreement and Article VI:1(b)(ii) of the GATT 1994 “make clear that the
determination is of the "cost of production […] in the country of origin". Thus,
whatever the information that it uses, an investigating authority has to ensure that
such information is used to arrive at the "cost of production in the country of origin.
Compliance with this obligation may require the investigating authority to adapt the
information that it collects22”. Thus, by replacing the actual cost of raw materials in
the Argentine producers’ records with the surrogate price of soybeans, the EU was
found not to adapt the information it used to arrive at the cost of production in
Argentina and thus, the arising cost was found not to represent the cost of production
in Argentina for purpose of constructing normal value as required by Article 2.2
64. In the rod in coils case, the applicant is repeating exactly the EU’s mistake when
requesting the Commission to just substitute the Vietnamese producer’s billet cost of
production data with those of Indonesia without any adapting attempt to ensure the
surrogate value may result in an arrival at the cost of production in Vietnam as
required by Article 2.2. Therefore, the GOV requests the Commission to reject the
applicant’s request for surrogate value.
20 Id, para 6.55. 21 Id, para6.73 22 Id.
22

Public Record
CONCLUSION
For the above analysis, the GOV once again urges the Commission to reject (i) the
applicant's claim on the existence of a particular market situation in Vietnam with regards to
rod in coils and (ii) its requests to replace Vietnamese producers's cost of production data
with those of Indonesia for purpose of constructing the normal value. In addition, in case
where the Commission decides to construct the normal value of rod in coils in this case, the
GOV requests the Commission to implement Australia's obligation under Article 2 of the
WTO Antidumping Agreement to ensure that the arising constructed normal value reflects
the the cost of production of rods in coils in Vietnam. The GOV also reverses its rights to
submit to the Commission additional comments in this matter within the schedule of the
authority in this investigation./
Respectfully .
IDVN Lawyers
Counsel for the Government of Vietnam
23
23

Column 1 Column 2 Column 3 Column 4 Column 5
Tariff Item Number
Description of Goods Base Rate
Category Note
2702.20.00.00.00 - Agglomerated lignite
5% B10
27.03 Peat (including peat litter), whether or not agglomerated.
2703.00.10.00.00 - Peat, whether or not compressed into bales, but not agglomerated
5% B10
2703.00.20.00.00 - Agglomerated peat
5% B10
27.04 Coke and semi-coke of coal, of lignite or of peat, whether or not agglomerated; retort carbon.
2704.00.10.00.00 - Coke and semi-coke of coal A 2704.00.20.00.00 - Coke and semi-coke of lignite or of
peat 5% B10
2704.00.30.00.00 - Retort carbon
5% B10
2705.00.00.00.00 Coal gas, water gas, producer gas and similar gases, other than petroleum gases and other gaseous hydrocarbons.
A
2706.00.00.00.00 Tar distilled from coal, from lignite or from peat, and other mineral tars, whether or not dehydrated or partially distilled, including reconstituted tars.
A
27.07 Oils and other products of the distillation of high temperature coal tar; similar products in which the weight of the aromatic constituents exceeds that of the non-aromatic constituents.
2707.10.00.00.00 - Benzol (benzene) 1% B10 2707.20.00.00.00 - Toluol (toluene) 1% B10 2707.30.00.00.00 - Xylol (xylenes) 1% B10 2707.40.00.00.00 - Naphthalene 1% B10 2707.50.00.00.00 - Other aromatic hydrocarbon mixtures of
which 65% or more by volume (including losses) distils at 250°C by the ASTM D 86 method
1% B10
- Other: 2707.91.00.00.00 - - Creosote oils 1% B10 2707.99 - - Other: 2707.99.20.00.00 - - - Carbon black feedstock 1% B10 2707.99.90.00.00 - - - Other
1% B10
27.08 Pitch and pitch coke, obtained from coal tar or from other mineral tars.
2708.10.00.00.00 - Pitch A 2708.20.00.00.00 - Pitch coke
A
27.09 Petroleum oils and oils obtained from bituminous minerals, crude.
2709.00.10.00.00 - Crude petroleum oil 15% B10 2709.00.20.00.00 - Condensates X 2709.00.90.00.00 - Other
X
Public Record Exhibit 2
24
User
Typewriter
VJEPA TARIFF SCHEDULE

HS Code Description
Base
rate
(MFN
2005)
2009 2010 2011 2012 2013 2014 2015 2016 2017 2018 2019 2020 2021
2022 and
subsequent
years
Viet Nam
Schedule of Tariff Commitments
Annex 1
2621.10.00.00 - Ash and residues from the incineration of
municipal waste
10% 10% 10% 10% 7% 5% 5% 5% 0% 0% 0% 0% 0% 0% 0%
2621.90.00.00 - Other 10% 10% 10% 10% 7% 5% 5% 5% 0% 0% 0% 0% 0% 0% 0%
27 Chapter 27-Mineral fuels, mineral oils and
products of their distillation; bituminous
substances; mineral waxes
27.01 Coal; briquettes, ovoids and similar solid
fuels manufactured from coal.
- Coal, whether or not pulverised, but not
agglomerated:
2701.11.00.00 - - Anthracite 5% 5% 5% 5% 5% 5% 5% 5% 0% 0% 0% 0% 0% 0% 0%
2701.12 - - Bituminous coal:
2701.12.10.00 - - - Coking coal 0% 0% 0% 0% 0% 0% 0% 0% 0% 0% 0% 0% 0% 0% 0%
2701.12.90.00 - - - Other 5% 5% 5% 5% 5% 5% 5% 5% 0% 0% 0% 0% 0% 0% 0%
2701.19.00.00 - - Other coal 5% 5% 5% 5% 5% 5% 5% 5% 0% 0% 0% 0% 0% 0% 0%
2701.20.00.00 - Briquettes, ovoids and similar solid fuels
manufactured from coal
5% 5% 5% 5% 5% 5% 5% 5% 0% 0% 0% 0% 0% 0% 0%
27.02 Lignite, whether or not agglomerated,
excluding jet.
2702.10.00.00 - Lignite, whether or not pulverised, but not
agglomerated
5% 5% 5% 5% 5% 5% 5% 5% 0% 0% 0% 0% 0% 0% 0%
2702.20.00.00 - Agglomerated lignite 5% 5% 5% 5% 5% 5% 5% 5% 0% 0% 0% 0% 0% 0% 0%
27.03 Peat (including peat litter), whether or not
agglomerated.
2703.00.10.00 - Peat, whether or not compressed into
bales, but not agglomerated
5% 5% 5% 5% 5% 5% 5% 5% 0% 0% 0% 0% 0% 0% 0%
2703.00.20.00 - Agglomerated peat 5% 5% 5% 5% 5% 5% 5% 5% 0% 0% 0% 0% 0% 0% 0%
27.04 Coke and semi-coke of coal, of lignite or
of peat, whether or not agglomerated;
retort carbon.
2704.00.10.00 - Coke and semi-coke of coal 0% 0% 0% 0% 0% 0% 0% 0% 0% 0% 0% 0% 0% 0% 0%
2704.00.20.00 - Coke and semi-coke of lignite or of peat 5% 5% 5% 5% 5% 5% 5% 5% 0% 0% 0% 0% 0% 0% 0%
2704.00.30.00 - Retort carbon 5% 5% 5% 5% 5% 5% 5% 5% 0% 0% 0% 0% 0% 0% 0%
2705.00.00.00 Coal gas, water gas, producer gas and
similar gases, other than petroleum gases
and other gaseous hydrocarbons.
0% 0% 0% 0% 0% 0% 0% 0% 0% 0% 0% 0% 0% 0% 0%
AANZFTA - Annex 1 (Viet Nam)
91 / 632
Public Record Exhibit 2
25

HS Code Description
Base
rate
(MFN
2005)
2009 2010 2011 2012 2013 2014 2015 2016 2017 2018 2019 2020 2021
2022 and
subsequent
years
Viet Nam
Schedule of Tariff Commitments
Annex 1
2706.00.00.00 Tar distilled from coal, from lignite or from
peat, and other mineral tars, whether or not
dehydrated or partially distilled, including
reconstituted tars.
0% 0% 0% 0% 0% 0% 0% 0% 0% 0% 0% 0% 0% 0% 0%
27.07Oils and other products of the distillation
of high temperature coal tar; similar
products in which the weight of the
aromatic constituents exceeds that of the
non-aromatic constituents.
2707.10.00.00 - Benzol (benzene) 1% 1% 1% 1% 1% 1% 1% 1% 0% 0% 0% 0% 0% 0% 0%
2707.20.00.00 - Toluol (toluene) 1% 1% 1% 1% 1% 1% 1% 1% 0% 0% 0% 0% 0% 0% 0%
2707.30.00.00 - Xylol (xylenes) 1% 1% 1% 1% 1% 1% 1% 1% 0% 0% 0% 0% 0% 0% 0%
2707.40.00.00 - Naphthalene 1% 1% 1% 1% 1% 1% 1% 1% 0% 0% 0% 0% 0% 0% 0%
2707.50.00.00 - Other aromatic hydrocarbon mixtures of
which 65% or more by volume (including
losses) distils at 250°C by the ASTM D 86
method
1% 1% 1% 1% 1% 1% 1% 1% 0% 0% 0% 0% 0% 0% 0%
- Other:
2707.91.00.00 - - Creosote oils 1% 1% 1% 1% 1% 1% 1% 1% 0% 0% 0% 0% 0% 0% 0%
2707.99 - - Other:
2707.99.20.00 - - - Carbon black feedstock 1% 1% 1% 1% 1% 1% 1% 1% 0% 0% 0% 0% 0% 0% 0%
2707.99.90.00 - - - Other 1% 1% 1% 1% 1% 1% 1% 1% 0% 0% 0% 0% 0% 0% 0%
27.08 Pitch and pitch coke, obtained from coal
tar or from other mineral tars.
2708.10.00.00 - Pitch 0% 0% 0% 0% 0% 0% 0% 0% 0% 0% 0% 0% 0% 0% 0%
2708.20.00.00 - Pitch coke 0% 0% 0% 0% 0% 0% 0% 0% 0% 0% 0% 0% 0% 0% 0%
27.09 Petroleum oils and oils obtained from
bituminous minerals, crude.
2709.00.10.00 - Crude petroleum oils 15% 15% 15% 10% 10% 7% 7% 5% 0% 0% 0% 0% 0% 0% 0%
2709.00.20.00 - Condensates 5% 5% 5% 5% 5% 5% 5% 5% 5% 5% 5% 5% 5% 5% 5%
2709.00.90.00 - Other 15% 15% 15% 15% 15% 15% 15% 15% 15% 15% 15% 15% 15% 15% 15%
AANZFTA - Annex 1 (Viet Nam)
92 / 632
Public Record Exhibit 2
26

2015 2016 2017 2018No CC AHTN 2012 Description Schedule
ATIGA Tariff (%)
2701.12 - - Bituminous coal:
1719 VN 2701.12.10 - - - Coking coal Sch-A 0 0 0 0
1720 VN 2701.12.90 - - - Other Sch-A 0 0 0 0
1721 VN 2701.19.00 - - Other coal Sch-A 0 0 0 0
1722 VN 2701.20.00 - Briquettes, ovoids and similar solid fuels manufactured from coal Sch-A 0 0 0 0
27.02 Lignite, whether or not agglomerated, excluding jet.
1723 VN 2702.10.00 - Lignite, whether or not pulverised, but not agglomerated Sch-A 0 0 0 0
1724 VN 2702.20.00 - Agglomerated lignite Sch-A 0 0 0 0
2703.00 Peat (including peat litter), whether or not agglomerated.
1725 VN 2703.00.10 - Peat, whether or not compressed into bales, but not agglomerated Sch-A 0 0 0 0
1726 VN 2703.00.20 - Agglomerated peat Sch-A 0 0 0 0
2704.00Coke and semi-coke of coal, of lignite or of peat, whether or not
agglomerated; retort carbon.
1727 VN 2704.00.10 - Coke and semi-coke of coal Sch-A 0 0 0 0
1728 VN 2704.00.20 - Coke and semi-coke of lignite or of peat Sch-A 0 0 0 0
1729 VN 2704.00.30 - Retort carbon Sch-A 0 0 0 0
1730 VN 2705.00.00Coal gas, water gas, producer gas and similar gases, other than petroleum
gases and other gaseous hydrocarbons.Sch-A 0 0 0 0
1731 VN 2706.00.00Tar distilled from coal, from lignite or from peat, and other mineral tars,
whether or not dehydrated or partially distilled, including reconstituted tars.Sch-A 0 0 0 0
27.07
Oils and other products of the distillation of high temperature coal tar; similar
products in which the weight of the aromatic constituents exceeds that of the
non-aromatic constituents.
1732 VN 2707.10.00 - Benzol (benzene) Sch-A 0 0 0 0
1733 VN 2707.20.00 - Toluol (toluene) Sch-A 0 0 0 0
1734 VN 2707.30.00 - Xylol (xylenes) Sch-A 0 0 0 0
1735 VN 2707.40.00 - Naphthalene Sch-A 0 0 0 0
1736 VN 2707.50.00- Other aromatic hydrocarbon mixtures of which 65% or more by volume (including
losses) distils at 250°C by the ASTM D 86 methodSch-A 0 0 0 0
- Other:
1737 VN 2707.91.00 - - Creosote oils Sch-A 0 0 0 0
2707.99 - - Other:
1738 VN 2707.99.10 - - - Carbon black feedstock Sch-A 0 0 0 0
Page 91 of 515
Public Record Exhibit 2
27
User
Typewriter
ATIGA TARIFF SCHEDULE

HS Code Description Base rate EIF 2016 2017 2018 2019 2020 2021 2022 2023 2024 2025 20262027 and subsequent
years
Viet Nam Schedule of Tariff Commitments
- Coal, whether or not pulverised, but not agglomerated:
2701.11.00 - - Anthracite 0 0 0 0 0 0 0 0 0 0 0 0 0 0
2701.12 - - Bituminous coal:
2701.12.10 - - - Coking coal 0 0 0 0 0 0 0 0 0 0 0 0 0 0
2701.12.90 - - - Other 0 0 0 0 0 0 0 0 0 0 0 0 0 0
2701.19.00 - - Other coal 0 0 0 0 0 0 0 0 0 0 0 0 0 0
2701.20.00- Briquettes, ovoids and similar solid fuels manufactured
from coal0 0 0 0 0 0 0 0 0 0 0 0 0 0
27.02 Lignite, whether or not agglomerated, excluding jet.
2702.10.00- Lignite, whether or not pulverised, but not
agglomerated0 0 0 0 0 0 0 0 0 0 0 0 0 0
2702.20.00 - Agglomerated lignite 0 0 0 0 0 0 0 0 0 0 0 0 0 0
2703.00 Peat (including peat litter), whether or not agglomerated.
2703.00.10- Peat, whether or not compressed into bales, but not
agglomerated0 0 0 0 0 0 0 0 0 0 0 0 0 0
2703.00.20 - Agglomerated peat 0 0 0 0 0 0 0 0 0 0 0 0 0 0
2704.00Coke and semi-coke of coal, of lignite or of peat, whether
or not agglomerated; retort carbon.
2704.00.10 - Coke and semi-coke of coal 3 2.5 2.0 1.5 1.0 0.5 0 0 0 0 0 0 0 0
2704.00.20 - Coke and semi-coke of lignite or of peat 3 2.5 2.0 1.5 1.0 0.5 0 0 0 0 0 0 0 0
2704.00.30 - Retort carbon 0 0 0 0 0 0 0 0 0 0 0 0 0 0
2705.00.00Coal gas, water gas, producer gas and similar gases, other
than petroleum gases and other gaseous hydrocarbons.U U U U U U U U U U U U U
2706.00.00
Tar distilled from coal, from lignite or from peat, and
other mineral tars, whether or not dehydrated or partially
distilled, including reconstituted tars.
0 0 0 0 0 0 0 0 0 0 0 0 0 0
27.07
Oils and other products of the distillation of high
temperature coal tar; similar products in which the weight
of the aromatic constituents exceeds that of the non-
aromatic constituents.
118
Public Record Exhibit 2
28
User
Typewriter
VEAEU TARIFF SCHEDULE

HS Code Description Base rate EIF 2016 2017 2018 2019 2020 2021 2022 2023 2024 2025 20262027 and subsequent
years
Viet Nam Schedule of Tariff Commitments
2707.10.00 - Benzol (benzene) 0 0 0 0 0 0 0 0 0 0 0 0 0 0
2707.20.00 - Toluol (toluene) 0 0 0 0 0 0 0 0 0 0 0 0 0 0
2707.30.00 - Xylol (xylenes) 0 0 0 0 0 0 0 0 0 0 0 0 0 0
2707.40.00 - Naphthalene 0 0 0 0 0 0 0 0 0 0 0 0 0 0
2707.50.00
- Other aromatic hydrocarbon mixtures of which 65% or
more by volume (including losses) distils at 250°C by the
ASTM D 86 method
0 0 0 0 0 0 0 0 0 0 0 0 0 0
- Other:
2707.91.00 - - Creosote oils 0 0 0 0 0 0 0 0 0 0 0 0 0 0
2707.99 - - Other:
2707.99.10 - - - Carbon black feedstock 0 0 0 0 0 0 0 0 0 0 0 0 0 0
2707.99.90 - - - Other 0 0 0 0 0 0 0 0 0 0 0 0 0 0
27.08Pitch and pitch coke, obtained from coal tar or from other
mineral tars.
2708.10.00 - Pitch 0 0 0 0 0 0 0 0 0 0 0 0 0 0
2708.20.00 - Pitch coke 0 0 0 0 0 0 0 0 0 0 0 0 0 0
2709.00Petroleum oils and oils obtained from bituminous
minerals, crude.
2709.00.10 - Crude petroleum oils 0 0 0 0 0 0 0 0 0 0 0 0 0 0
2709.00.20 - Condensates 0 0 0 0 0 0 0 0 0 0 0 0 0 0
2709.00.90 - Other 0 0 0 0 0 0 0 0 0 0 0 0 0 0
27.10
Petroleum oils and oils obtained from bituminous
minerals, other than crude; preparations not elsewhere
specified or included, containing by weight 70% or more
of petroleum oils or of oils obtained from bituminous
minerals, these oils being the basic constituents of the
preparations; waste oils.
- Petroleum oils and oils obtained from bituminous
minerals (other than crude) and preparations not
elsewhere specified or included, containing by weight 70
% or more of petroleum oils or of oils obtained from
bituminous minerals, these oils being the basic
constituents of the preparations, other than those
containing biodiesel and other than waste oils :
2710.12 - - Light oils and preparations :
- - - Motor spirit :
119
Public Record Exhibit 2
29

14
ANNEX 1
MODALITY FOR TARIFF REDUCTION AND ELIMINATION FOR TARIFF LINES PLACED IN THE NORMAL TRACK
1. Tariff lines placed by each Party in the Normal Track on its own accord shall have their respective applied MFN tariff rates gradually reduced and eliminated according to the following Schedules:
(i) ASEAN 6 and China
ACFTA Preferential Tariff Rate
(Not later than 1 January) X = Applied MFN Tariff Rate
2005* 2007 2009 2010
X > 20% 20 12 5 0
15% < x < 20% 15 8 5 0
10% < x < 15% 10 8 5 0
5% < x < 10% 5 5 0 0
X < 5% Standstill 0 0
* The first date of implementation shall be 1 July 2005. (ii) Viet Nam
ACFTA Preferential Tariff Rate
(Not later than 1 January) X = Applied MFN Tariff Rate
2005* 2006 2007 2008 2009 2011 2013 2015
X > 60% 60 50 40 30 25 15 10 0
45% < X < 60% 40 35 35 30 25 15 10 0
35% < X < 45% 35 30 30 25 20 15 5 0
30% < X < 35% 30 25 25 20 17 10 5 0
25% < X < 30% 25 20 20 15 15 10 5 0
20% < X < 25% 20 20 15 15 15 10 0-5 0
15% < X < 20% 15 15 10 10 10 5 0-5 0
10% < X < 15% 10 10 10 10 8 5 0-5 0
7% < X < 10% 7 7 7 7 5 5 0-5 0
5% < X < 7% 5 5 5 5 5 5 0-5 0
X < 5% Standstill 0
* The first date of implementation shall be 1 July 2005.
Public Record Exhibit 2
30
User
Typewriter
ACFTA TARIFF SCHEDULE

15
(iii) Cambodia, Lao PDR and Myanmar
ACFTA Preferential Tariff Rate
(Not later than 1 January) X = Applied
MFN Tariff Rate 2005* 2006 2007 2008 2009 2011 2013 2015
X > 60% 60 50 40 30 25 15 10 0
45% < X < 60% 40 35 35 30 25 15 10 0
35% < X < 45% 35 35 30 30 20 15 5 0
30% < X < 35% 30 25 25 20 20 10 5 0
25% < X < 30% 25 25 25 20 20 10 5 0
20% < X < 25% 20 20 15 15 15 10 0-5 0
15% < X < 20% 15 15 15 15 15 5 0-5 0
10% < X < 15% 10 10 10 10 8 5 0-5 0
7% < X < 10% 7** 7** 7** 7** 7** 5 0-5 0
5% < X < 7% 5 5 5 5 5 5 0-5 0
X < 5% Standstill 0
* The first date of implementation shall be 1 July 2005. ** Myanmar shall be allowed to maintain ACFTA Rates at no more than 7.5% until 2010.
2. If a Party places a tariff line in the Normal Track, that Party shall enjoy the tariff concessions other Parties have made for that tariff line as specified in and applied pursuant to the relevant Schedules either in Annex 1 or Annex 2 together with the undertakings and conditions set out therein. This right shall be enjoyed for so long as that Party adheres to its own commitments for tariff reduction and elimination for that tariff line.
3. The tariff rates specified in the relevant Schedules in paragraph 1 only set out the level of the applicable ACFTA preferential tariff rates to be applied by each Party for the tariff lines concerned in the specified year of implementation and shall not prevent any Party from unilaterally accelerating its tariff reduction or elimination at any time if it so wishes. 4. Tariff lines in the Normal Track, which are subject to specific tariff rates, shall have such tariffs reduced to zero, in equal proportions in accordance with the timeframes provided in the Schedules set out in paragraph 1 of this Annex. 5. For all tariff lines placed in the Normal Track where the applied MFN tariff rates are at 0%, they shall remain at 0%. Where they have been reduced to 0%, they shall remain at 0%. No Party shall be permitted to increase the tariff rates for any tariff line, except as otherwise provided by the Agreement.
Public Record Exhibit 2
31

16
6. As an integral part of its commitments to reduce and/or eliminate the applied MFN tariff rates in accordance with the relevant Schedules in paragraph 1, each Party hereby commits to undertake further tariff reduction and/or elimination in accordance with the following thresholds:
(a) ASEAN 6 and China
(i) Each Party shall reduce to 0-5% not later than 1 July 2005 the tariff rates for at least 40% of its tariff lines placed in the Normal Track.
(ii) Each Party shall reduce to 0-5% not later than 1 January 2007 the tariff rates for at least 60% of its tariff lines placed in the Normal Track.
(iii) Each Party shall eliminate all its tariffs for tariff lines placed in the Normal Track not later than 1 January 2010, with flexibility to have tariffs on some tariff lines, not exceeding 150 tariff lines, eliminated not later than 1 January 2012.
(iv) Each Party shall eliminate all its tariffs for tariff lines placed in the Normal Track not later than 1 January 2012.
(b) Newer ASEAN Member States
(i) Each Party shall reduce to 0-5% not later than 1 January 2009 for Viet Nam; 1 January 2010 for Lao PDR and Myanmar; and 1 January 2012 for Cambodia the tariff rates for at least 50% of its tariff lines placed in the Normal Track.
(ii) Cambodia, Lao PDR and Myanmar shall eliminate their respective tariffs not later than 1 January 2013 on 40% of its tariff lines placed in the Normal Track.
(iii) For Viet Nam, the percentage of Normal Track tariff lines to have their tariffs eliminated not later than 1 January 2013 shall be determined not later than 31 December 2004.
(iv) Each Party shall eliminate all its tariffs for tariff lines placed in the Normal Track not later than 1 January 2015, with flexibility to have tariffs on some tariff lines, not exceeding 250 tariff lines, eliminated not later than 1 January 2018.
(v) Each Party shall eliminate all its tariffs for tariff lines placed in the Normal Track not later than 1 January 2018.
7. The tariff lines listed by the Parties in Appendix 1 shall have their respective ACFTA tariffs eliminated not later than 1 January 2012 for ASEAN 6 and China, and 1 January 2018 for CLMV.
Public Record Exhibit 2
32
BP Statistical Review of World Energy 2017
BP Statistical Review of World Energy June 2017
This workbook contains information presented in the 2017 BP Statistical Review of World Energy, which can be found on the internet at:
http://www.bp.com/statisticalreview
Please use the contents or the tabs at the bottom to navigate between the tables.
Primary Energy: Consumption - Mtoe (from 1965)
Primary Energy: Consumption by fuel type - Mtoe (2015-2016)
Oil: Proved reserves
Oil: Proved reserves - Barrels (from 1980)
Oil: Production – Barrels (from 1965)
Oil: Production – Tonnes (from 1965)
Oil: Consumption – Barrels (from 1965)
Oil: Consumption – Tonnes (from 1965)
Oil: Regional consumption – by product (from 1965)
Oil: Spot crude prices
Oil: Crude prices since 1861
Oil: Refinery throughput (from 1980)
Oil: Refinery capacities (from 1965)
Oil: Regional refining margins (from 1992)
Oil: Trade movements (from 1980)
Oil: Inter-area movements
Oil: Trade 2015-2016
Gas: Proved reserves
Gas: Proved reserves - Bcm (from 1980)
Gas: Production – Bcm (from 1970)
Gas: Production – Bcf (from 1970)
Gas: Production – Mtoe (from 1970)
Gas: Consumption – Bcm (from 1965)
Gas: Consumption – Bcf (from 1965)
Gas: Consumption – Mtoe (from 1965)
Gas: Trade movements pipeline
Gas: Trade movements LNG
Gas: Trade 2015-2016
Public Record Exhibit 3
33

BP Statistical Review of World Energy 2017
Gas: Prices
Coal: Reserves
Coal: Prices
Coal: Production - Tonnes (from 1981)
Coal: Production - Mtoe (from 1981)
Coal: Consumption - Mtoe (from 1965)
Nuclear Energy – Consumption - TWh (from 1965)
Nuclear Energy – Consumption - Mtoe (from 1965)
Hydroelectricity – Consumption - TWh (from 1965)
Hydroelectricity – Consumption - Mtoe (from 1965)
Renewables - Other renewables consumption -Twh (from 1965)
Renewables - Other renewables consumption - Mtoe (from 1965)
Renewables - Solar consumption - TWh (from 1965)
Renewables - Solar consumption - Mtoe (from 1965)
Renewables - Wind consumption - TWh (from 1965)
Renewables - Wind consumption - Mtoe (from 1965)
Renewables - Geothermal, Biomass and Other - TWh (from 1965)
Renewables - Geothermal, Biomass and Other - Mtoe (from 1965)
Renewables - Biofuels production - Kboe/d (from 1990)
Renewables - Biofuels production - Ktoe (from 1990)
Electricity Generation - TWh (from 1985)
Carbon Dioxide Emissions (from 1965)
Renewable Energy - Geothermal (Installed capacity)
Renewable Energy - Solar (Installed capacity)
Renewable Energy - Wind (Installed capacity)
Approximate conversion factors
Definitions
Public Record Exhibit 3
34

BP Statistical Review of World Energy 2017
Primary Energy: Consumption*Share
Million tonnes oil equivalent 2012 2013 2014 2015 2016 2016 2005-15 2016
US 2209.3 2270.6 2296.5 2275.9 2272.7 -0.4% -0.3% 17.1%
Canada 326.5 336.1 334.3 327.7 329.7 0.3% 0.2% 2.5%
Mexico 188.5 189.1 190.4 188.8 186.5 -1.5% 1.2% 1.4%
Total North America 2724.3 2795.9 2821.2 2792.4 2788.9 -0.4% -0.2% 21.0%
Argentina 83.4 86.5 86.7 88.7 88.9 -0.1% 2.5% 0.7%
Brazil 284.8 296.8 304.9 302.6 297.8 -1.8% 3.7% 2.2%
Chile 34.1 34.4 35.4 35.9 36.8 2.0% 2.4% 0.3%
Colombia 38.4 38.2 40.3 41.0 41.1 ♦ 4.2% 0.3%
Ecuador 14.3 14.7 15.5 15.5 15.3 -1.3% 4.7% 0.1%
Peru 21.2 21.7 22.4 23.7 25.3 6.3% 5.7% 0.2%
Trinidad & Tobago 22.0 22.4 21.9 21.6 19.4 -10.7% 2.8% 0.1%
Venezuela 84.1 83.3 78.1 78.8 74.6 -5.5% 1.1% 0.6%
Other S. & Cent. America 98.7 98.7 98.9 102.6 106.2 3.3% 1.2% 0.8%
Total S. & Cent. America 680.9 696.7 704.1 710.4 705.3 -1.0% 2.8% 5.3%
Austria 35.4 35.1 33.8 33.9 35.1 3.3% -0.6% 0.3%
Azerbaijan 12.3 12.6 13.2 14.5 14.5 -0.4% 0.5% 0.1%
Belarus 27.9 24.7 25.5 22.4 23.7 5.4% -1.0% 0.2%
Belgium 58.7 60.0 55.8 56.9 61.7 8.1% -1.3% 0.5%
Bulgaria 18.1 16.7 17.9 19.0 18.1 -5.2% -0.3% 0.1%
Czech Republic 41.9 41.8 40.2 40.2 39.9 -1.0% -0.9% 0.3%
Denmark 17.1 17.9 17.4 16.9 17.1 1.1% -1.5% 0.1%
Finland 28.1 27.7 26.7 26.7 27.1 1.4% -1.2% 0.2%
France 244.8 247.2 237.6 239.4 235.9 -1.7% -0.9% 1.8%
Germany 316.4 325.5 312.1 317.8 322.5 1.2% -0.4% 2.4%
Greece 29.3 27.9 26.3 26.4 25.9 -2.2% -2.2% 0.2%
Hungary 21.1 20.1 20.0 21.2 21.9 3.2% -2.0% 0.2%
Ireland 14.0 13.7 13.7 14.5 15.2 4.1% -0.9% 0.1%
Italy 162.2 155.7 146.9 149.9 151.3 0.7% -2.1% 1.1%
Kazakhstan 59.4 60.2 66.4 62.7 63.0 0.3% 3.5% 0.5%
Lithuania 5.8 5.4 5.2 5.4 5.5 0.9% -3.7% ♦
Netherlands 88.1 85.9 80.9 82.1 84.5 2.6% -1.6% 0.6%
Norway 47.8 45.0 46.4 47.2 48.6 2.7% 0.3% 0.4%
Poland 95.7 96.0 92.4 93.4 96.7 3.2% 0.3% 0.7%
Portugal 22.4 24.5 24.6 24.6 26.0 5.5% -0.3% 0.2%
Romania 34.0 31.5 32.5 32.6 33.1 1.2% -1.8% 0.2%
Russian Federation 695.2 686.8 689.2 681.7 673.9 -1.4% 0.5% 5.1%
Slovakia 16.2 16.8 15.5 15.7 15.9 1.4% -1.9% 0.1%
Spain 142.4 134.2 132.2 134.4 135.0 0.2% -1.2% 1.0%
Sweden 54.5 51.3 51.4 52.9 52.2 -1.7% -0.5% 0.4%
Switzerland 28.8 29.7 28.5 27.9 26.4 -5.5% 0.2% 0.2%
Turkey 120.1 118.5 122.6 131.9 137.9 4.2% 4.4% 1.0%
Turkmenistan 29.7 26.8 29.5 33.1 33.2 0.2% 5.4% 0.3%
Ukraine 122.6 114.7 101.2 83.9 87.0 3.4% -4.7% 0.7%
United Kingdom 202.1 200.9 188.6 190.9 188.1 -1.7% -1.8% 1.4%
USSR n/a n/a n/a n/a n/a n/a n/a n/a
Uzbekistan 49.2 48.7 50.5 51.7 52.7 1.5% 1.1% 0.4%
Other Europe & Eurasia 95.0 97.0 93.6 94.8 97.6 2.6% 0.6% 0.7%
Total Europe & Eurasia 2936.3 2900.6 2838.3 2846.6 2867.1 0.4% -0.4% 21.6%
Iran 235.2 246.0 261.9 262.8 270.7 2.7% 4.0% 2.0%
Israel 25.2 25.2 24.5 26.0 26.4 1.5% 1.9% 0.2%
Kuwait 41.0 39.5 37.6 41.5 41.7 0.3% 3.1% 0.3%
Qatar 29.3 43.4 42.5 50.2 49.2 -2.3% 9.5% 0.4%
Saudi Arabia 235.7 237.4 252.1 260.8 266.5 1.9% 5.1% 2.0%
United Arab Emirates 95.8 97.2 99.5 108.6 113.8 4.5% 5.6% 0.9%
Other Middle East 118.7 123.6 121.9 124.7 126.8 1.4% 2.9% 1.0%
Total Middle East 780.8 812.4 840.0 874.6 895.1 2.1% 4.5% 6.7%
Algeria 45.1 47.8 51.6 55.1 55.1 -0.3% 5.4% 0.4%
Egypt 86.5 85.7 85.4 86.7 91.0 4.7% 3.4% 0.7%
South Africa 121.9 123.6 125.2 120.1 122.3 1.5% 0.8% 0.9%
Growth rate per annum
Public Record Exhibit 3
35

BP Statistical Review of World Energy 2017
Other Africa 149.3 158.3 165.6 171.7 171.8 -0.2% 3.5% 1.3%
Total Africa 402.9 415.4 427.9 433.5 440.1 1.2% 2.8% 3.3%
Australia 130.3 131.2 132.6 138.5 138.0 -0.6% 1.8% 1.0%
Bangladesh 26.5 27.0 28.2 31.3 32.4 3.2% 6.3% 0.2%
China 2797.4 2905.3 2970.6 3005.9 3053.0 1.3% 5.3% 23.0%
China Hong Kong SAR 27.0 27.8 27.1 27.9 28.6 2.3% 1.8% 0.2%
India 611.6 621.5 663.6 685.1 723.9 5.4% 5.7% 5.5%
Indonesia 170.5 174.2 162.9 164.8 175.0 5.9% 3.0% 1.3%
Japan 467.7 464.0 452.3 445.8 445.3 -0.4% -1.6% 3.4%
Malaysia 83.2 89.2 91.5 93.8 99.5 5.7% 3.3% 0.7%
New Zealand 19.7 19.9 20.9 21.0 21.4 1.8% 1.1% 0.2%
Pakistan 71.4 71.7 73.5 77.1 83.2 7.6% 2.3% 0.6%
Philippines 30.5 32.5 34.4 37.7 42.1 11.3% 3.6% 0.3%
Singapore 72.0 74.1 76.2 81.0 84.1 3.5% 5.5% 0.6%
South Korea 271.8 272.2 274.9 280.2 286.2 1.9% 2.4% 2.2%
Taiwan 108.4 109.9 112.1 111.1 112.1 0.6% 0.7% 0.8%
Thailand 113.7 115.7 119.1 121.8 123.8 1.4% 3.5% 0.9%
Vietnam 52.5 54.8 59.8 63.7 64.8 1.5% 7.5% 0.5%
Other Asia Pacific 54.3 54.1 57.5 60.7 66.3 8.9% 2.4% 0.5%
Total Asia Pacific 5108.6 5245.0 5357.2 5447.4 5579.7 2.1% 3.9% 42.0%
Total World 12633.8 12866.0 12988.8 13105.0 13276.3 1.0% 1.8% 100.0%
of which: OECD 5481.8 5540.4 5497.6 5505.5 5529.1 0.2% -0.3% 41.6%
Non-OECD 7152.0 7325.6 7491.3 7599.5 7747.2 1.7% 3.7% 58.4%
European Union # 1681.2 1669.3 1605.0 1626.7 1642.0 0.7% -1.1% 12.4%
CIS 1014.6 991.9 993.2 967.4 965.6 -0.5% 0.2% 7.3%
* Commercial solid fuels only, i.e. bituminous coal and anthracite (hard coal), and lignite and brown (sub-bituminous) coal, and other commercial solid fuels.
Excludes coal converted to liquid or gaseous fuels, but includes coal consumed in transformation processes.
^ Less than 0.05.
w Less than 0.05%.
n/a not available.
# Excludes Estonia, Latvia and Lithuania prior to 1985 and Slovenia prior to 1990.
Notes: Differences between these consumption figures and the world production statistics are accounted for by stock changes, and unadvoidable disparities in the definition, measurement or conversion of coal supply and demand data.
Annual changes and share of total are calculated using million tonnes oil equivalent figures.
Growth rates are adjusted for leap years.
Public Record Exhibit 3
36

BP Statistical Review of World Energy 2017
Primary Energy: Consumption by fuel*2015 2016
Million tonnes oil equivalent
Oil Natural
Gas
Coal Nuclear
Energy
Hydro
electric
Renew-
ables
Total Oil Natural
Gas
Coal Nuclear
Energy
Hydro
electric
Renew-
ables
Total
US 856.5 710.5 391.8 189.9 55.8 71.5 2275.9 863.1 716.3 358.4 191.8 59.2 83.8 2272.7
Canada 99.1 92.2 19.6 22.8 85.4 8.5 327.7 100.9 89.9 18.7 23.2 87.8 9.2 329.7
Mexico 84.4 78.4 12.7 2.6 7.0 3.7 188.8 82.8 80.6 9.8 2.4 6.8 4.1 186.5
Total North America 1040.0 881.2 424.2 215.3 148.2 83.6 2792.4 1046.9 886.8 386.9 217.4 153.9 97.1 2788.9
Argentina 32.2 43.4 1.4 1.6 9.6 0.6 88.7 31.9 44.6 1.1 1.9 8.7 0.7 88.9
Brazil 146.6 37.5 17.7 3.3 81.4 16.0 302.6 138.8 32.9 16.5 3.6 86.9 19.0 297.8
Chile 17.6 3.7 7.3 - 5.4 1.9 35.9 17.8 4.1 8.2 - 4.4 2.3 36.8
Colombia 15.6 9.6 5.3 - 10.1 0.4 41.0 15.9 9.5 4.6 - 10.6 0.5 41.1
Ecuador 11.8 0.6 - - 3.0 0.1 15.5 11.0 0.6 - - 3.5 0.1 15.3
Peru 10.7 6.4 0.8 - 5.4 0.4 23.7 11.4 7.1 0.8 - 5.4 0.6 25.3
Trinidad & Tobago 2.2 19.4 - - - ^ 21.6 2.2 17.2 - - - ^ 19.4
Venezuela 30.2 31.1 0.2 - 17.3 ^ 78.8 28.7 32.0 0.1 - 13.9 ^ 74.6
Other S. & Cent. America 67.5 6.6 3.2 - 20.8 4.5 102.6 68.5 6.7 3.4 - 22.5 5.1 106.2
Total S. & Cent. America 334.4 158.3 35.9 5.0 152.9 24.0 710.4 326.2 154.7 34.7 5.5 156.0 28.2 705.3
Austria 12.5 7.5 3.2 - 8.4 2.3 33.9 12.7 7.9 3.2 - 9.0 2.4 35.1
Azerbaijan 4.5 9.6 ^ - 0.4 ^ 14.5 4.6 9.4 ^ - 0.4 ^ 14.5
Belarus 7.7 14.0 0.7 - ^ ^ 22.4 7.5 15.3 0.8 - ^ 0.1 23.7
Belgium 31.0 13.6 3.2 5.9 0.1 3.2 56.9 31.8 13.9 3.0 9.8 0.1 3.2 61.7
Bulgaria 4.4 2.6 6.6 3.5 1.3 0.7 19.0 4.5 2.7 5.7 3.6 0.9 0.7 18.1
Czech Republic 8.9 6.5 16.6 6.1 0.4 1.7 40.2 8.4 7.0 16.9 5.5 0.5 1.7 39.9
Denmark 8.0 2.8 1.7 - ^ 4.3 16.9 8.0 2.9 2.1 - ^ 4.1 17.1
Finland 8.7 2.0 3.8 5.3 3.8 3.1 26.7 9.0 1.8 4.1 5.3 3.6 3.4 27.1
France 76.8 35.1 8.4 99.0 12.3 7.9 239.4 76.4 38.3 8.3 91.2 13.5 8.2 235.9
Germany 110.0 66.2 78.5 20.8 4.3 38.1 317.8 113.0 72.4 75.3 19.1 4.8 37.9 322.5
Greece 14.9 2.5 5.6 - 1.4 2.0 26.4 15.4 2.6 4.7 - 1.2 2.1 25.9
Hungary 7.0 7.5 2.4 3.6 0.1 0.7 21.2 7.1 8.0 2.3 3.6 0.1 0.8 21.9
Ireland 6.8 3.8 2.2 - 0.2 1.6 14.5 7.0 4.3 2.2 - 0.2 1.5 15.2
Italy 57.6 55.3 12.3 - 10.3 14.3 149.9 58.1 58.1 10.9 - 9.3 15.0 151.3
Kazakhstan 13.2 11.6 35.8 - 2.1 ^ 62.7 13.2 12.0 35.6 - 2.1 0.1 63.0
Lithuania 2.8 2.1 0.2 - 0.1 0.3 5.4 3.0 1.8 0.2 - 0.1 0.4 5.5
Netherlands 38.7 28.3 11.0 0.9 ^ 3.1 82.1 39.9 30.2 10.3 0.9 ^ 3.1 84.5
Norway 10.3 4.4 0.8 - 31.1 0.6 47.2 10.4 4.4 0.8 - 32.4 0.5 48.6
Poland 24.9 14.7 48.7 - 0.4 4.7 93.4 27.2 15.6 48.8 - 0.5 4.6 96.7
Portugal 11.5 4.3 3.3 - 2.0 3.6 24.6 11.2 4.6 2.9 - 3.6 3.7 26.0
Romania 9.2 9.0 5.9 2.6 3.8 2.2 32.6 9.5 9.5 5.4 2.6 4.1 2.0 33.1
Russian Federation 144.2 362.5 92.2 44.2 38.5 0.2 681.7 148.0 351.8 87.3 44.5 42.2 0.2 673.9
Public Record Exhibit 3
37

BP Statistical Review of World Energy 2017
Slovakia 3.7 3.9 3.3 3.4 0.9 0.5 15.7 4.0 4.0 3.1 3.3 1.0 0.5 15.9
Spain 61.2 24.6 13.7 13.0 6.3 15.6 134.4 62.5 25.2 10.4 13.3 8.1 15.5 135.0
Sweden 14.1 0.8 2.1 12.8 17.0 6.1 52.9 14.7 0.8 2.2 14.2 14.1 6.1 52.2
Switzerland 10.7 2.6 0.1 5.3 8.5 0.7 27.9 10.2 2.7 0.1 4.8 7.8 0.8 26.4
Turkey 38.9 39.2 34.7 - 15.2 3.9 131.9 41.2 37.9 38.4 - 15.2 5.2 137.9
Turkmenistan 6.6 26.5 - - - ^ 33.1 6.7 26.6 - - - ^ 33.2
Ukraine 9.2 25.9 27.3 19.8 1.2 0.4 83.9 9.1 26.1 31.5 18.3 1.6 0.3 87.0
United Kingdom 71.8 61.3 23.0 15.9 1.4 17.5 190.9 73.1 69.0 11.0 16.2 1.2 17.5 188.1
USSR - - - - - - - - - - - - - -
Uzbekistan 2.7 45.2 1.1 - 2.7 ^ 51.7 2.8 46.2 1.0 - 2.7 ^ 52.7
Other Europe & Eurasia 33.3 13.6 23.0 1.9 20.7 2.3 94.8 34.5 13.9 23.0 1.8 21.7 2.5 97.6
Total Europe & Eurasia 865.9 909.2 471.3 263.9 194.7 141.6 2846.6 884.6 926.9 451.6 258.2 201.8 144.0 2867.1
Iran 84.5 171.7 1.6 0.8 4.1 0.1 262.8 83.8 180.7 1.7 1.4 2.9 0.1 270.7
Israel 11.4 7.6 6.7 - ^ 0.3 26.0 11.6 8.7 5.7 - ^ 0.4 26.4
Kuwait 22.3 19.2 - - - ^ 41.5 22.0 19.7 - - - ^ 41.7
Qatar 10.7 39.5 - - - ^ 50.2 11.7 37.5 - - - ^ 49.2
Saudi Arabia 166.6 94.0 0.1 - - ^ 260.8 167.9 98.4 0.1 - - ^ 266.5
United Arab Emirates 40.9 66.4 1.3 - - 0.1 108.6 43.5 69.0 1.3 - - 0.1 113.8
Other Middle East 76.5 45.9 0.5 - 1.8 0.1 124.7 77.3 47.1 0.5 - 1.8 0.2 126.8
Total Middle East 412.8 444.3 10.2 0.8 5.9 0.5 874.6 417.8 461.1 9.3 1.4 4.7 0.7 895.1
Algeria 19.5 35.5 0.1 - ^ ^ 55.1 18.9 36.0 0.1 - ^ 0.1 55.1
Egypt 39.6 43.0 0.4 - 3.2 0.4 86.7 40.6 46.1 0.4 - 3.2 0.6 91.0
South Africa 27.9 4.6 83.4 2.8 0.2 1.4 120.1 26.9 4.6 85.1 3.6 0.2 1.8 122.3
Other Africa 95.1 39.2 11.4 - 23.5 2.4 171.7 98.9 37.6 10.3 - 22.4 2.6 171.8
Total Africa 182.1 122.2 95.3 2.8 26.9 4.2 433.5 185.4 124.3 95.9 3.6 25.8 5.0 440.1
Australia 47.9 38.6 44.1 - 3.2 4.8 138.5 47.8 37.0 43.8 - 4.0 5.4 138.0
Bangladesh 6.2 24.2 0.7 - 0.2 ^ 31.3 6.6 24.8 0.8 - 0.2 ^ 32.4
China 561.8 175.3 1913.6 38.6 252.2 64.4 3005.9 578.7 189.3 1887.6 48.2 263.1 86.1 3053.0
China Hong Kong SAR 18.3 2.9 6.7 - - ^ 27.9 18.9 3.0 6.7 - - ^ 28.6
India 195.8 41.2 396.6 8.7 30.2 12.7 685.1 212.7 45.1 411.9 8.6 29.1 16.5 723.9
Indonesia 71.8 36.4 51.2 - 3.1 2.4 164.8 72.6 33.9 62.7 - 3.3 2.6 175.0
Japan 189.0 102.1 119.9 1.0 19.0 14.8 445.8 184.3 100.1 119.9 4.0 18.1 18.8 445.3
Malaysia 35.5 37.6 16.9 - 3.5 0.3 93.8 36.3 38.7 19.9 - 4.2 0.3 99.5
New Zealand 7.5 4.0 1.4 - 5.6 2.4 21.0 7.7 4.2 1.2 - 5.9 2.4 21.4
Pakistan 24.6 39.2 4.7 1.1 7.3 0.3 77.1 27.5 40.9 5.4 1.3 7.7 0.4 83.2
Philippines 18.3 3.0 11.6 - 2.0 2.8 37.7 19.9 3.4 13.5 - 2.1 3.1 42.1
Singapore 69.4 11.0 0.4 - - 0.2 81.0 72.2 11.3 0.4 - - 0.2 84.1
South Korea 113.8 39.3 85.5 37.3 0.5 3.9 280.2 122.1 40.9 81.6 36.7 0.6 4.3 286.2
Taiwan 46.5 16.5 37.8 8.3 1.0 1.0 111.1 46.7 17.2 38.6 7.2 1.5 1.0 112.1
Thailand 57.3 43.8 17.6 - 0.9 2.3 121.8 59.0 43.5 17.7 - 0.8 2.8 123.8
Vietnam 18.8 9.6 22.3 - 12.9 ^ 63.7 20.1 9.6 21.3 - 13.7 0.1 64.8
Public Record Exhibit 3
38

BP Statistical Review of World Energy 2017
Other Asia Pacific 23.2 7.0 16.9 - 13.3 0.3 60.7 24.4 7.2 20.6 - 13.8 0.3 66.3
Total Asia Pacific 1505.8 631.6 2747.7 95.0 354.7 112.7 5447.4 1557.3 650.3 2753.6 105.9 368.1 144.5 5579.7
Total World 4341.0 3146.7 3784.7 582.7 883.2 366.7 13105.0 4418.2 3204.1 3732.0 592.1 910.3 419.6 13276.3
of which: OECD 2062.4 1464.9 972.7 446.7 309.9 248.9 5505.5 2086.8 1495.2 913.3 446.8 316.8 270.1 5529.1
Non-OECD 2278.5 1681.8 2812.0 136.0 573.4 117.8 7599.5 2331.4 1708.9 2818.7 145.2 593.4 149.5 7747.2
European Union 600.6 359.2 261.1 194.0 77.2 134.6 1626.7 613.3 385.9 238.4 190.0 78.7 135.6 1642.0
CIS 191.6 499.8 158.9 64.7 51.7 0.6 967.4 195.5 492.0 157.9 63.3 56.2 0.7 965.6
* In this review, primary energy comprises commercially traded fuels, including modern renewables used to generate electricity.
^ Less than 0.05.
Notes: Oil consumption is measured in million tonnes; other fuels in million tonnes of oil equivalent.
Public Record Exhibit 3
39

BP Statistical Review of World Energy 2017
Oil: Total proved reserves at end 1996 at end 2006 at end 2015 at end 2016
Thousand Thousand Thousand Thousand Thousand
million million million million million Share R/P
barrels barrels barrels barrels tonnes of total ratio
US 29.8 29.4 48.0 48.0 5.8 2.8% 10.6
Canada 48.9 179.4 171.5 171.5 27.6 10.0% 105.1
Mexico 48.5 12.8 8.0 8.0 1.1 0.5% 8.9
Total North America 127.3 221.7 227.5 227.5 34.5 13.3% 32.3
Argentina 2.6 2.6 2.4 2.4 0.3 0.1% 10.6
Brazil 6.7 12.2 13.0 12.6 1.8 0.7% 13.3
Colombia 2.8 1.5 2.3 2.0 0.3 0.1% 5.9
Ecuador 3.5 4.5 8.0 8.0 1.2 0.5% 40.1
Peru 0.8 1.1 1.2 1.2 0.1 0.1% 24.0
Trinidad & Tobago 0.7 0.8 0.7 0.2 ^ ♦ 6.9
Venezuela 72.7 87.3 300.9 300.9 47.0 17.6% 341.1
Other S. & Cent. America 1.0 0.8 0.5 0.5 0.1 ♦ 10.3
Total S. & Cent. America 90.7 110.8 329.0 327.9 50.8 19.2% 119.9
Azerbaijan 1.2 7.0 7.0 7.0 1.0 0.4% 23.1
Denmark 0.9 1.2 0.5 0.4 0.1 ♦ 8.5
Italy 0.8 0.5 0.6 0.5 0.1 ♦ 18.8
Kazakhstan 5.3 9.0 30.0 30.0 3.9 1.8% 49.0
Norway 11.7 8.5 8.0 7.6 0.9 0.4% 10.4
Romania 1.0 0.5 0.6 0.6 0.1 ♦ 20.7
Russian Federation 113.6 104.0 102.4 109.5 15.0 6.4% 26.6
Turkmenistan 0.5 0.6 0.6 0.6 0.1 ♦ 6.3
United Kingdom 5.0 3.6 2.5 2.5 0.3 0.1% 6.9
Uzbekistan 0.6 0.6 0.6 0.6 0.1 ♦ 29.3
Other Europe & Eurasia 2.4 2.2 2.1 2.1 0.3 0.1% 15.6
Total Europe & Eurasia 142.8 137.6 154.9 161.5 21.8 9.5% 24.9
Iran 92.6 138.4 158.4 158.4 21.8 9.3% 94.1
Iraq 112.0 115.0 142.5 153.0 20.6 9.0% 93.6
Kuwait 96.5 101.5 101.5 101.5 14.0 5.9% 88.0
Oman 5.3 5.6 5.3 5.4 0.7 0.3% 14.6
Qatar 3.7 27.4 25.2 25.2 2.6 1.5% 36.3
Saudi Arabia 261.4 264.3 266.6 266.5 36.6 15.6% 59.0
Syria 2.5 3.0 2.5 2.5 0.3 0.1% 273.2
United Arab Emirates 97.8 97.8 97.8 97.8 13.0 5.7% 65.6
Yemen 2.0 2.8 3.0 3.0 0.4 0.2% *
Public Record Exhibit 3
40

BP Statistical Review of World Energy 2017
Other Middle East 0.2 0.1 0.2 0.2 ^ ♦ 2.6
Total Middle East 674.0 755.9 803.0 813.5 110.1 47.7% 69.9
Algeria 10.8 12.3 12.2 12.2 1.5 0.7% 21.1
Angola 3.7 9.0 11.8 11.6 1.6 0.7% 17.5
Chad - 1.5 1.5 1.5 0.2 0.1% 56.1
Republic of Congo 1.6 1.6 1.6 1.6 0.2 0.1% 18.4
Egypt 3.8 3.7 3.5 3.5 0.5 0.2% 13.7
Equatorial Guinea 0.6 1.8 1.1 1.1 0.1 0.1% 10.7
Gabon 2.8 2.2 2.0 2.0 0.3 0.1% 24.1
Libya 29.5 41.5 48.4 48.4 6.3 2.8% 310.1
Nigeria 20.8 37.2 37.1 37.1 5.0 2.2% 49.3
South Sudan n/a n/a 3.5 3.5 0.5 0.2% 80.9
Sudan 0.3 5.0 1.5 1.5 0.2 0.1% 39.6
Tunisia 0.3 0.6 0.4 0.4 0.1 ♦ 18.4
Other Africa 0.7 0.7 3.7 3.7 0.5 0.2% 43.2
Total Africa 74.9 116.9 128.2 128.0 16.9 7.5% 44.3
Australia 3.8 3.5 4.0 4.0 0.4 0.2% 30.3
Brunei 1.1 1.2 1.1 1.1 0.1 0.1% 24.9
China 16.4 20.2 25.7 25.7 3.5 1.5% 17.5
India 5.5 5.7 4.8 4.7 0.6 0.3% 14.9
Indonesia 4.7 4.4 3.6 3.3 0.5 0.2% 10.3
Malaysia 5.0 5.4 3.6 3.6 0.5 0.2% 14.0
Thailand 0.2 0.5 0.4 0.4 ^ ♦ 2.3
Vietnam 0.9 3.3 4.4 4.4 0.6 0.3% 36.2
Other Asia Pacific 1.3 1.4 1.3 1.3 0.2 0.1% 12.5
Total Asia Pacific 39.0 45.5 48.8 48.4 6.4 2.8% 16.5
Total World 1148.8 1388.3 1691.5 1706.7 240.7 100.0% 50.6
of which: OECD 151.0 240.2 244.5 244.0 36.6 14.3% 28.8
Non-OECD 997.8 1148.1 1447.0 1462.7 204.1 85.7% 57.9
OPEC 805.0 936.1 1210.3 1220.5 171.2 71.5% 84.7
Non-OPEC 343.8 452.2 481.1 486.2 69.6 28.5% 25.2
European Union # 8.7 6.6 5.2 5.1 0.7 0.3% 9.3
CIS 121.9 121.9 141.1 148.2 20.1 8.7% 28.6
Canadian oil sands: Total 42.1 173.1 165.3 165.3 26.9
of which: Under active development 4.2 21.0 24.0 24.0 3.9
Venezuela: Orinoco Belt - 7.6 222.3 222.3 35.7
* More than 500 years.
^ Less than 0.05.
w Less than 0.05%.
# Excludes Estonia and Latvia in 2006.
Public Record Exhibit 3
41

BP Statistical Review of World Energy 2017
Notes: Total proved reserves of oil - Generally taken to be those quantities that geological and engineering information indicates with reasonable certainty
can be recovered in the future from known reservoirs under existing economic and operating conditions. The data series for total proved oil does not necessarily
meet the definitions, guidelines and practices used for determining proved reserves at company level, for instance as published by the US Securities and Exchange Commission,
nor does it necessarily represent BP’s view of proved reserves by country.
Reserves-to-production (R/P) ratio - If the reserves remaining at the end of any year are divided by the production in that year, the result is the length of time
that those remaining reserves would last if production were to continue at that rate.
Gas Journal and independent estimates of Russian reserves based on official data and Chinese reserves based on information in the public domain.
Canadian oil sands 'under active development' are an official estimate. Venezuelan Orinoco Belt reserves are based on the OPEC Secretariat and government announcements.
Reserves include gas condensate and natural gas liquids (NGLs) as well as crude oil.
Shares of total and R/P ratios are calculated using thousand million barrels figures.
Source of data - The estimates in this table have been compiled using a combination of primary official sources, third-party data from the OPEC Secretariat, World Oil, Oil &
Public Record Exhibit 3
42

BP Statistical Review of World Energy 2017
Oil: Proved reserves in thousand million barrelsShare
Thousand million barrels 2012 2013 2014 2015 2016 2016 2005-15 2016
US 44.2 48.5 55.0 48.0 48.0 - 4.8% 2.8%
Canada 173.7 173.0 172.2 171.5 171.5 - -0.5% 10.0%
Mexico 11.4 11.1 10.8 8.0 8.0 - -5.2% 0.5%
Total North America 229.3 232.6 237.9 227.5 227.5 - 0.2% 13.3%
Argentina 2.4 2.3 2.4 2.4 2.4 - 0.9% 0.1%
Brazil 15.3 15.6 16.2 13.0 12.6 -2.8% 1.0% 0.7%
Colombia 2.2 2.4 2.4 2.3 2.0 -13.3% 4.7% 0.1%
Ecuador 8.4 8.2 8.0 8.0 8.0 - 5.1% 0.5%
Peru 1.4 1.6 1.4 1.2 1.2 - 1.0% 0.1%
Trinidad & Tobago 0.8 0.8 0.8 0.7 0.2 -66.6% -1.0% ♦
Venezuela 297.7 298.3 300.0 300.9 300.9 - 14.2% 17.6%
Other S. & Cent. America 0.5 0.5 0.5 0.5 0.5 -3.0% -9.6% ♦
Total S. & Cent. America 328.8 329.8 331.7 329.0 327.9 -0.4% 12.2% 19.2%
Azerbaijan 7.0 7.0 7.0 7.0 7.0 - - 0.4%
Denmark 0.7 0.7 0.6 0.5 0.4 -10.3% -9.1% ♦
Italy 0.6 0.6 0.6 0.6 0.5 -12.4% 3.0% ♦
Kazakhstan 30.0 30.0 30.0 30.0 30.0 - 12.8% 1.8%
Norway 7.5 7.0 6.5 8.0 7.6 -5.0% -1.9% 0.4%
Romania 0.6 0.6 0.6 0.6 0.6 - 2.7% ♦
Russian Federation 105.5 105.0 103.2 102.4 109.5 7.0% -0.2% 6.4%
Turkmenistan 0.6 0.6 0.6 0.6 0.6 - 0.9% ♦
United Kingdom 3.0 3.0 2.8 2.5 2.5 - -4.1% 0.1%
USSR n/a n/a n/a n/a n/a n/a n/a n/a
Uzbekistan 0.6 0.6 0.6 0.6 0.6 - - ♦
Other Europe & Eurasia 2.0 2.0 2.1 2.1 2.1 1.1% -0.6% 0.1%
Total Europe & Eurasia 158.2 157.2 154.6 154.9 161.5 4.3% 1.1% 9.5%
Iran 157.3 157.8 157.8 158.4 158.4 - 1.4% 9.3%
Iraq 140.3 144.2 143.1 142.5 153.0 7.4% 2.2% 9.0%
Kuwait 101.5 101.5 101.5 101.5 101.5 - - 5.9%
Oman 5.5 5.0 5.2 5.3 5.4 1.3% -0.5% 0.3%
Qatar 25.2 25.1 25.7 25.2 25.2 - -1.0% 1.5%
Saudi Arabia 265.9 265.9 267.0 266.6 266.5 ♦ 0.1% 15.6%
Syria 2.5 2.5 2.5 2.5 2.5 - -1.8% 0.1%
United Arab Emirates 97.8 97.8 97.8 97.8 97.8 - - 5.7%
Yemen 3.0 3.0 3.0 3.0 3.0 - 0.3% 0.2%
Other Middle East 0.3 0.3 0.2 0.2 0.2 -10.4% 5.5% ♦
Growth rate per annum
Public Record Exhibit 3
43

BP Statistical Review of World Energy 2017
Total Middle East 799.3 803.0 803.8 803.0 813.5 1.3% 0.6% 47.7%
Algeria 12.2 12.2 12.2 12.2 12.2 - -0.1% 0.7%
Angola 12.7 12.7 12.6 11.8 11.6 -1.8% 2.7% 0.7%
Chad 1.5 1.5 1.5 1.5 1.5 - - 0.1%
Republic of Congo 1.6 1.6 1.6 1.6 1.6 - 0.6% 0.1%
Egypt 4.2 3.9 3.7 3.5 3.5 - -0.7% 0.2%
Equatorial Guinea 1.7 1.7 1.1 1.1 1.1 - -4.8% 0.1%
Gabon 2.0 2.0 2.0 2.0 2.0 - -0.7% 0.1%
Libya 48.5 48.4 48.4 48.4 48.4 - 1.6% 2.8%
Nigeria 37.1 37.1 37.1 37.1 37.1 ♦ 0.2% 2.2%
South Sudan 3.5 3.5 3.5 3.5 3.5 - n/a 0.2%
Sudan 1.5 1.5 1.5 1.5 1.5 - 10.3% 0.1%
Tunisia 0.4 0.4 0.4 0.4 0.4 - -2.7% ♦
Other Africa 3.7 3.7 3.7 3.7 3.7 - 21.0% 0.2%
Total Africa 130.6 130.1 129.2 128.2 128.0 -0.2% 1.4% 7.5%
Australia 3.9 4.0 4.0 4.0 4.0 - 0.7% 0.2%
Brunei 1.1 1.1 1.1 1.1 1.1 - ♦ 0.1%
China 24.4 24.7 25.1 25.7 25.7 - 5.1% 1.5%
India 5.7 5.7 5.7 4.8 4.7 -2.3% -2.1% 0.3%
Indonesia 3.7 3.7 3.6 3.6 3.3 -8.2% -1.5% 0.2%
Malaysia 3.7 3.8 3.6 3.6 3.6 - -3.7% 0.2%
Thailand 0.4 0.5 0.4 0.4 0.4 - -1.3% ♦
Vietnam 4.4 4.4 4.4 4.4 4.4 - 3.5% 0.3%
Other Asia Pacific 1.1 1.3 1.3 1.3 1.3 -1.8% -0.9% 0.1%
Total Asia Pacific 48.5 49.1 49.3 48.8 48.4 -0.9% 1.8% 2.8%
Total World 1694.6 1701.8 1706.5 1691.5 1706.7 0.9% 2.1% 100.0%
of which: OECD 246.4 249.2 253.9 244.5 244.0 -0.2% ♦ 14.3%
Non-OECD 1448.2 1452.5 1452.7 1447.0 1462.7 1.1% 2.5% 85.7%
OPEC 1204.6 1209.1 1211.1 1210.3 1220.5 0.8% 2.7% 71.5%
Non-OPEC 490.0 492.7 495.5 481.1 486.2 1.1% 0.7% 28.5%
European Union # 6.0 5.8 5.6 5.2 5.1 -3.4% -2.9% 0.3%
CIS 144.2 143.7 141.9 141.1 148.2 5.1% 1.4% 8.7%
Canadian Oil Sands: Total 167.8 167.1 166.2 165.3 165.3 - -0.5% 9.7%
of which: Under active development 25.8 25.2 23.6 24.0 24.0 - 9.0% 1.4%
Venezuela: Orinoco Belt 220.0 220.5 221.7 222.3 222.3 - n/a 13.0%
^ Less than 0.05.
w Less than 0.05%.
# Excludes Estonia, Latvia and Lithuania prior to 1996 and Slovenia prior to 1990.
'Remaining established reserves', less reserves 'under active development'.
Notes: Total proved reserves of oil - Generally taken to be those quantities that geological and engineering information indicates with reasonable certainty
Public Record Exhibit 3
44

BP Statistical Review of World Energy 2017
can be recovered in the future from known reservoirs under existing economic and operating conditions. The data series for total proved oil does not necessarily
meet the definitions, guidelines and practices used for determining proved reserves at company level, for instance as published by the US Securities and Exchange Commission,
nor does it necessarily represent BP’s view of proved reserves by country.
Reserves-to-production (R/P) ratio - If the reserves remaining at the end of any year are divided by the production in that year, the result is the length of time that those remaining reserves would last if
production were to continue at that rate.
Source of data - The estimates in this table have been compiled using a combination of primary official sources, third-party data from the OPEC Secretariat, World Oil, Oil &
Gas Journal and an independent estimates of Russian reserves based on official data and Chinese reserves based on information in the public domain.
Canadian oil sands 'under active development' are an official estimate. Venezuelan Orinoco Belt reserves are based on the OPEC Secretariat and government announcements.
Reserves include gas condensate and natural gas liquids (NGLs) as well as crude oil.
Annual changes and shares of total are calculated using thousand million barrels figures.
Public Record Exhibit 3
45

Oil: Production*Share
Thousand barrels daily 2012 2013 2014 2015 2016 2016 2005-15 2016
US 8894 10073 11779 12757 12354 -3.2% 6.3% 13.4%
Canada 3740 4000 4271 4389 4460 1.6% 3.7% 4.8%
Mexico 2911 2875 2784 2587 2456 -5.1% -3.7% 2.7%
Total North America 15545 16948 18833 19733 19270 -2.3% 3.7% 20.9%
Argentina 664 655 641 641 619 -3.3% -2.7% 0.7%
Brazil 2145 2110 2341 2525 2605 3.2% 4.0% 2.8%
Colombia 944 1004 990 1006 924 -8.1% 6.7% 1.0%
Ecuador 505 527 557 543 545 0.4% 0.2% 0.6%
Peru 154 167 169 145 135 -6.6% 2.6% 0.1%
Trinidad & Tobago 117 115 114 109 96 -11.2% -4.4% 0.1%
Venezuela 2704 2680 2692 2644 2410 -8.9% -2.2% 2.6%
Other S. & Cent. America 143 148 154 149 138 -7.5% 0.3% 0.2%
Total S. & Cent. America 7376 7407 7659 7761 7474 -3.7% 0.6% 8.1%
Azerbaijan 872 877 849 840 826 -1.6% 6.6% 0.9%
Denmark 204 178 167 158 142 -10.2% -8.4% 0.2%
Italy 112 116 121 115 79 -31.3% -1.0% 0.1%
Kazakhstan 1664 1737 1710 1695 1672 -1.4% 2.7% 1.8%
Norway 1917 1838 1889 1948 1995 2.4% -4.1% 2.2%
Romania 83 86 84 83 79 -5.0% -3.1% 0.1%
Russian Federation 10642 10780 10838 10981 11227 2.2% 1.4% 12.2%
Turkmenistan 229 240 249 261 261 ♦ 3.1% 0.3%
United Kingdom 946 864 852 963 1013 5.1% -6.2% 1.1%
USSR n/a n/a n/a n/a n/a n/a n/a n/a
Uzbekistan 68 61 59 57 55 -3.1% -6.7% 0.1%
Other Europe & Eurasia 390 397 388 379 367 -3.0% -1.8% 0.4%
Total Europe & Eurasia 17127 17174 17206 17479 17716 1.4% ♦ 19.2%
Iran 3819 3615 3725 3897 4600 18.0% -0.8% 5.0%
Iraq 3116 3141 3285 4031 4465 10.8% 8.2% 4.8%
Kuwait 3169 3129 3101 3068 3151 2.7% 1.4% 3.4%
Oman 918 942 943 981 1004 2.4% 2.4% 1.1%
Qatar 1931 1906 1886 1890 1899 0.5% 5.1% 2.1%
Saudi Arabia 11635 11393 11505 11986 12349 3.0% 0.9% 13.4%
Syria 171 59 33 27 25 -7.4% -24.5% ♦
United Arab Emirates 3401 3627 3674 3928 4073 3.7% 3.0% 4.4%
Yemen 174 193 147 44 16 -62.7% -20.3% ♦
Other Middle East 184 209 214 213 205 -3.8% 1.4% 0.2%
Total Middle East 28518 28213 28515 30065 31789 5.7% 1.6% 34.5%
Algeria 1537 1485 1589 1558 1579 1.4% -2.4% 1.7%
Angola 1784 1799 1712 1826 1807 -1.1% 3.6% 2.0%
Chad 101 83 82 73 73 0.6% -8.3% 0.1%
Republic of Congo 281 250 266 257 238 -7.6% 0.4% 0.3%
Egypt 715 710 714 726 691 -4.8% 0.8% 0.8%
Equatorial Guinea 272 267 281 289 280 -3.1% -2.1% 0.3%
Gabon 253 232 232 230 227 -1.1% -1.6% 0.2%
Libya 1510 988 498 432 426 -1.4% -13.0% 0.5%
Nigeria 2370 2270 2347 2329 2053 -11.9% -0.8% 2.2%
South Sudan 31 100 155 148 118 -20.0% n/a 0.1%
Growth rate per annum
Public Record Exhibit 3
46

Sudan 103 118 120 109 104 -5.0% -9.4% 0.1%
Tunisia 84 78 73 65 63 -3.3% -2.0% 0.1%
Other Africa 205 231 236 255 233 -8.7% 3.7% 0.3%
Total Africa 9247 8612 8307 8297 7892 -4.9% -1.7% 8.6%
Australia 479 407 436 393 359 -8.7% -3.6% 0.4%
Brunei 159 135 126 127 121 -4.6% -4.7% 0.1%
China 4155 4216 4246 4309 3999 -7.2% 1.7% 4.3%
India 906 906 887 876 856 -2.3% 1.7% 0.9%
Indonesia 918 882 852 841 881 4.8% -2.6% 1.0%
Malaysia 654 621 645 699 705 0.9% -0.8% 0.8%
Thailand 458 452 450 468 479 2.5% 4.5% 0.5%
Vietnam 357 361 373 362 333 -8.1% -0.7% 0.4%
Other Asia Pacific 287 272 291 295 278 -5.9% 0.4% 0.3%
Total Asia Pacific 8372 8252 8307 8369 8010 -4.3% 0.5% 8.7%
Total World 86183 86606 88826 91704 92150 0.5% 1.1% 100.0%
of which: OECD 19482 20635 22588 23596 23122 -2.0% 1.7% 25.1%
Non-OECD 66701 65971 66238 68108 69028 1.4% 0.9% 74.9%
OPEC 37480 36561 36573 38133 39358 3.2% 0.8% 42.7%
Non-OPEC 48703 50045 52254 53572 52792 -1.5% 1.4% 57.3%
European Union # 1526 1434 1412 1506 1488 -1.2% -5.7% 1.6%
CIS 13597 13810 13810 13932 14141 1.5% 1.7% 15.3%
* Includes crude oil, shale oil, oil sands and NGLs (natural gas liquids - the liquid content of natural gas where this is recovered separately).
Excludes liquid fuels from other sources such as biomass and derivatives of coal and natural gas.
^ Less than 0.05.
w Less than 0.05%.
# Excludes Estonia, Latvia and Lithuania prior to 1985 and Slovenia prior to 1990.
Notes: Annual changes and shares of total are calculated using thousand barrels daily figures.
Public Record Exhibit 3
47

Oil: Production*Share
Million tonnes 2012 2013 2014 2015 2016 2016 2005-15 2016
US 393.2 446.9 522.7 565.1 543.0 -4.2% 6.2% 12.4%
Canada 182.6 195.1 209.4 215.6 218.2 0.9% 4.2% 5.0%
Mexico 143.9 141.8 137.1 127.5 121.4 -5.1% -3.7% 2.8%
Total North America 719.6 783.8 869.2 908.3 882.6 -3.1% 3.6% 20.1%
Argentina 31.1 30.5 29.9 29.8 28.8 -3.7% -2.8% 0.7%
Brazil 112.4 110.2 122.5 132.2 136.7 3.1% 4.0% 3.1%
Colombia 49.9 52.9 52.2 53.0 48.8 -8.1% 6.7% 1.1%
Ecuador 27.1 28.2 29.8 29.1 29.3 0.4% 0.2% 0.7%
Peru 6.7 7.1 7.3 6.2 5.6 -10.4% 1.6% 0.1%
Trinidad & Tobago 5.2 5.1 5.1 4.8 4.3 -10.5% -5.0% 0.1%
Venezuela 139.3 137.8 138.5 135.9 124.1 -9.0% -2.2% 2.8%
Other S. & Cent. America 7.3 7.5 7.7 7.5 7.0 -7.5% 0.2% 0.2%
Total S. & Cent. America 378.9 379.2 392.9 398.6 384.5 -3.8% 0.6% 8.8%
Azerbaijan 43.4 43.5 42.1 41.6 41.0 -1.7% 6.5% 0.9%
Denmark 10.0 8.7 8.1 7.7 6.9 -10.2% -8.4% 0.2%
Italy 5.4 5.6 5.8 5.5 3.8 -31.4% -1.0% 0.1%
Kazakhstan 79.3 82.3 81.1 80.2 79.3 -1.4% 2.7% 1.8%
Norway 87.3 83.2 85.3 88.0 90.4 2.4% -4.4% 2.1%
Romania 4.0 4.1 4.1 4.0 3.8 -5.3% -3.0% 0.1%
Russian Federation 526.2 531.1 534.1 540.7 554.3 2.2% 1.3% 12.6%
Turkmenistan 11.2 11.7 12.1 12.7 12.7 -0.4% 3.0% 0.3%
United Kingdom 44.7 40.7 40.0 45.4 47.5 4.4% -6.1% 1.1%
USSR n/a n/a n/a n/a n/a n/a n/a n/a
Uzbekistan 3.2 2.9 2.8 2.7 2.6 -3.3% -6.9% 0.1%
Other Europe & Eurasia 19.2 19.6 19.2 18.8 18.2 -3.3% -1.6% 0.4%
Total Europe & Eurasia 833.6 833.3 834.7 847.3 860.6 1.3% ♦ 19.6%
Iran 180.7 169.8 174.2 181.6 216.4 18.9% -1.3% 4.9%
Iraq 152.5 153.2 160.3 197.0 218.9 10.8% 8.2% 5.0%
Kuwait 153.9 151.3 150.1 148.2 152.7 2.8% 1.3% 3.5%
Oman 45.0 46.1 46.2 48.0 49.3 2.4% 2.4% 1.1%
Qatar 82.2 80.3 79.4 79.1 79.4 0.1% 4.2% 1.8%
Saudi Arabia 549.8 538.4 543.4 567.8 585.7 2.9% 0.9% 13.4%
Syria 8.1 2.7 1.5 1.2 1.1 -8.3% -25.1% ♦
United Arab Emirates 154.8 165.1 166.2 176.2 182.4 3.2% 2.6% 4.2%
Yemen 8.0 8.9 6.7 2.0 0.8 -60.8% -20.5% ♦
Other Middle East 9.0 10.3 10.5 10.5 10.1 -3.9% 1.5% 0.2%
Total Middle East 1344.0 1326.1 1338.7 1411.6 1496.9 5.8% 1.4% 34.2%
Algeria 67.2 64.8 68.8 67.2 68.5 1.6% -2.5% 1.6%
Angola 86.9 87.3 83.0 88.7 87.9 -1.2% 3.5% 2.0%
Chad 5.3 4.4 4.3 3.8 3.8 0.6% -8.3% 0.1%
Republic of Congo 14.3 12.6 13.4 12.9 11.9 -7.8% 0.3% 0.3%
Egypt 34.7 34.4 35.1 35.4 33.8 -4.8% 0.7% 0.8%
Equatorial Guinea 12.7 12.4 13.1 13.5 13.1 -3.3% -1.9% 0.3%
Gabon 12.7 11.6 11.6 11.5 11.4 -1.1% -1.6% 0.3%
Libya 71.2 46.5 23.4 20.3 20.0 -1.5% -13.0% 0.5%
Nigeria 114.4 109.2 112.8 112.0 98.8 -12.1% -1.0% 2.3%
South Sudan 1.5 4.9 7.7 7.3 5.8 -20.0% n/a 0.1%
Growth rate per annum
Public Record Exhibit 3
48

Sudan 5.1 5.8 5.9 5.4 5.1 -5.0% -9.4% 0.1%
Tunisia 3.9 3.6 3.4 3.0 2.9 -3.8% -2.1% 0.1%
Other Africa 10.2 11.5 11.7 12.6 11.6 -8.6% 3.7% 0.3%
Total Africa 440.1 408.9 394.2 393.7 374.8 -5.1% -1.7% 8.6%
Australia 21.4 17.8 19.1 17.4 15.5 -11.1% -3.7% 0.4%
Brunei 7.8 6.6 6.2 6.2 5.9 -4.7% -4.8% 0.1%
China 207.5 210.0 211.4 214.6 199.7 -7.2% 1.7% 4.6%
India 42.5 42.5 41.6 41.2 40.2 -2.6% 1.7% 0.9%
Indonesia 44.6 42.7 41.2 40.7 43.0 5.2% -2.7% 1.0%
Malaysia 29.8 28.5 29.7 32.3 32.7 0.9% -0.7% 0.7%
Thailand 16.6 16.5 16.2 17.0 17.6 3.2% 4.0% 0.4%
Vietnam 17.3 17.4 18.1 17.4 16.0 -8.5% -0.8% 0.4%
Other Asia Pacific 12.6 12.0 13.0 13.2 12.4 -6.2% 0.7% 0.3%
Total Asia Pacific 400.2 393.9 396.5 400.0 383.0 -4.5% 0.4% 8.7%
Total World 4116.4 4125.3 4226.2 4359.5 4382.4 0.3% 1.0% 100.0%
of which: OECD 902.1 953.8 1041.9 1086.4 1060.0 -2.7% 1.6% 24.2%
Non-OECD 3214.4 3171.5 3184.3 3273.0 3322.4 1.2% 0.8% 75.8%
OPEC 1780.0 1732.0 1730.1 1803.2 1864.2 3.1% 0.6% 42.5%
Non-OPEC 2336.4 2393.3 2496.1 2556.2 2518.2 -1.8% 1.3% 57.5%
European Union # 73.0 68.5 67.3 71.9 70.8 -1.8% -5.5% 1.6%
CIS 668.8 676.8 677.1 682.5 694.5 1.5% 1.6% 15.8%
* Includes crude oil, shale oil, oil sands and NGLs (natural gas liquids - the liquid content of natural gas where this is recovered separately).
Excludes liquid fuels from other sources such as biomass and derivatives of coal and natural gas.
^ Less than 0.05.
w Less than 0.05%.
# Excludes Estonia, Latvia and Lithuania prior to 1985 and Slovenia prior to 1990.
Notes: Annual changes and shares of total are calculated using million tonnes figures.
Growth rates are adjusted for leap years.
Public Record Exhibit 3
49

Oil: Consumption*Share
Thousand barrels daily 2012 2013 2014 2015 2016 2016 2005-15 2016
US 18490 18961 19106 19531 19631 0.5% -0.6% 20.3%
Canada 2340 2383 2372 2299 2343 1.9% 0.1% 2.4%
Mexico 2063 2020 1943 1923 1869 -2.8% -0.5% 1.9%
Total North America 22894 23364 23421 23753 23843 0.4% -0.6% 24.7%
Argentina 636 683 674 692 687 -0.7% 4.4% 0.7%
Brazil 2901 3110 3239 3170 3018 -4.8% 4.1% 3.1%
Chile 376 362 371 376 378 0.6% 3.5% 0.4%
Colombia 297 298 316 333 340 2.3% 3.5% 0.4%
Ecuador 233 247 260 254 239 -5.9% 4.2% 0.2%
Peru 213 227 225 240 256 6.9% 4.7% 0.3%
Trinidad & Tobago 40 45 42 45 44 -3.9% 2.8% ♦
Venezuela 792 782 719 648 611 -5.7% 0.7% 0.6%
Other S. & Cent. America 1339 1319 1324 1381 1402 1.5% 0.3% 1.5%
Total S. & Cent. America 6826 7073 7171 7139 6976 -2.3% 2.9% 7.2%
Austria 259 264 259 259 263 1.5% -1.0% 0.3%
Azerbaijan 92 101 99 99 99 -0.2% -0.7% 0.1%
Belarus 211 145 165 156 152 -2.2% 0.3% 0.2%
Belgium 622 636 635 666 675 1.4% -0.3% 0.7%
Bulgaria 82 76 82 92 96 4.0% -1.1% 0.1%
Czech Republic 192 184 195 189 178 -6.0% -1.0% 0.2%
Denmark 158 158 160 164 164 0.5% -1.3% 0.2%
Finland 193 191 183 184 189 2.6% -2.2% 0.2%
France 1676 1664 1616 1616 1602 -0.9% -1.8% 1.7%
Germany 2356 2408 2348 2340 2394 2.3% -1.0% 2.5%
Greece 312 295 294 306 313 2.5% -2.9% 0.3%
Hungary 129 129 144 153 154 0.9% -0.3% 0.2%
Ireland 135 137 136 142 147 2.9% -2.9% 0.2%
Italy 1346 1260 1184 1222 1232 0.9% -3.8% 1.3%
Kazakhstan 245 260 265 289 287 -0.6% 4.1% 0.3%
Lithuania 55 53 53 57 61 6.5% ♦ 0.1%
Netherlands 926 898 866 835 851 1.9% -2.2% 0.9%
Norway 235 243 232 238 242 1.7% 0.6% 0.3%
Poland 553 520 521 541 589 8.8% 1.1% 0.6%
Portugal 230 239 238 245 236 -3.5% -3.1% 0.2%
Romania 191 174 187 191 197 3.2% -1.3% 0.2%
Russian Federation 3119 3135 3299 3137 3203 2.1% 1.7% 3.3%
Slovakia 74 75 71 77 83 8.5% -0.4% 0.1%
Spain 1291 1195 1191 1237 1268 2.5% -2.5% 1.3%
Sweden 309 306 308 300 313 4.3% -1.7% 0.3%
Switzerland 238 249 224 228 216 -5.2% -1.3% 0.2%
Turkey 680 718 741 839 886 5.7% 2.5% 0.9%
Turkmenistan 129 137 143 147 148 0.8% 3.0% 0.2%
Ukraine 267 257 222 198 195 -1.1% -3.9% 0.2%
United Kingdom 1533 1518 1511 1565 1597 2.1% -1.5% 1.7%
USSR n/a n/a n/a n/a n/a n/a n/a n/a
Uzbekistan 63 60 57 57 58 0.8% -5.7% 0.1%
Other Europe & Eurasia 692 683 660 683 705 3.2% -0.1% 0.7%
Total Europe & Eurasia 18594 18370 18287 18450 18793 1.9% -0.9% 19.5%
Growth rate per annum
Public Record Exhibit 3
50

Iran 1854 2014 1961 1850 1848 -0.1% 0.9% 1.9%
Israel 295 247 231 247 251 1.9% -0.4% 0.3%
Kuwait 541 512 480 506 499 -1.3% 2.1% 0.5%
Qatar 257 287 293 316 339 7.5% 11.2% 0.4%
Saudi Arabia 3462 3470 3726 3868 3906 1.0% 5.8% 4.0%
United Arab Emirates 765 774 860 926 987 6.7% 6.3% 1.0%
Other Middle East 1586 1646 1631 1588 1600 0.7% 1.8% 1.7%
Total Middle East 8760 8950 9180 9300 9431 1.4% 3.6% 9.8%
Algeria 370 387 390 425 412 -3.1% 5.5% 0.4%
Egypt 747 756 806 830 853 2.8% 3.0% 0.9%
South Africa 554 569 564 583 560 -3.9% 1.2% 0.6%
Other Africa 1900 2007 2012 2028 2111 4.1% 2.9% 2.2%
Total Africa 3571 3720 3771 3866 3937 1.8% 2.9% 4.1%
Australia 1036 1046 1045 1039 1036 -0.3% 1.8% 1.1%
Bangladesh 110 107 116 124 131 5.6% 4.5% 0.1%
China 10230 10734 11209 11986 12381 3.3% 5.7% 12.8%
China Hong Kong SAR 344 352 336 368 380 3.4% 2.5% 0.4%
India 3685 3727 3849 4164 4489 7.8% 4.8% 4.6%
Indonesia 1625 1639 1663 1592 1615 1.4% 2.0% 1.7%
Japan 4702 4516 4303 4139 4037 -2.5% -2.5% 4.2%
Malaysia 760 803 802 814 829 1.9% 2.5% 0.9%
New Zealand 148 151 154 160 164 2.3% 0.6% 0.2%
Pakistan 402 442 458 505 566 12.0% 5.0% 0.6%
Philippines 309 322 347 398 434 9.0% 2.4% 0.4%
Singapore 1202 1225 1268 1336 1382 3.4% 5.3% 1.4%
South Korea 2458 2455 2454 2577 2763 7.2% 1.1% 2.9%
Taiwan 983 1010 1032 1040 1046 0.6% -0.1% 1.1%
Thailand 1250 1298 1311 1355 1382 2.0% 2.9% 1.4%
Vietnam 369 371 389 407 431 6.0% 4.7% 0.4%
Other Asia Pacific 416 435 458 491 512 4.3% 4.6% 0.5%
Total Asia Pacific 30031 30636 31195 32494 33577 3.3% 2.8% 34.8%
Total World 90675 92114 93025 95003 96558 1.6% 1.2% 100.0%
of which: OECD 45512 45583 45184 45785 46217 0.9% -0.9% 47.9%
Non-OECD 45163 46531 47840 49218 50341 2.3% 3.6% 52.1%
European Union # 12955 12702 12500 12707 12942 1.8% -1.7% 13.4%
CIS 4205 4177 4326 4161 4223 1.5% 1.3% 4.4%
* Inland demand plus international aviation and marine bunkers and refinery fuel and loss. Consumption of biogasoline (such as ethanol), biodiesel and derivatives of coal and natural gas are also included.
w Less than 0.05%.
n/a not available.
# Excludes Estonia, Latvia and Lithuania prior to 1985 and Slovenia prior to 1990.
Notes: Differences between these world consumption figures and world production statistics are accounted for by stock changes, consumption of non-petroleum additives
and substitute fuels, and unavoidable disparities in the definition, measurement or conversion of oil supply and demand data.
Annual changes and shares of total are calculated using thousand barrels daily figures.
Public Record Exhibit 3
51

Oil: Consumption*Share
Million tonnes 2012 2013 2014 2015 2016 2016 2005-15 2016
US 817.0 832.1 838.1 856.5 863.1 0.5% -0.9% 19.5%
Canada 102.3 103.5 103.1 99.1 100.9 1.5% ♦ 2.3%
Mexico 92.3 89.8 85.4 84.4 82.8 -2.1% -0.7% 1.9%
Total North America 1011.6 1025.4 1026.6 1040.0 1046.9 0.4% -0.8% 23.7%
Argentina 29.6 31.9 31.3 32.2 31.9 -1.1% 4.5% 0.7%
Brazil 134.3 144.2 150.6 146.6 138.8 -5.6% 4.0% 3.1%
Chile 17.5 16.8 17.4 17.6 17.8 0.4% 3.5% 0.4%
Colombia 13.9 13.9 14.8 15.6 15.9 2.0% 3.7% 0.4%
Ecuador 10.9 11.6 12.2 11.8 11.0 -6.6% 4.1% 0.2%
Peru 9.6 10.1 10.0 10.7 11.4 6.8% 4.1% 0.3%
Trinidad & Tobago 2.0 2.3 2.1 2.2 2.2 -4.3% 2.9% ♦
Venezuela 37.2 36.7 33.6 30.2 28.7 -5.3% 0.7% 0.6%
Other S. & Cent. America 66.1 64.5 64.7 67.5 68.5 1.2% 0.1% 1.6%
Total S. & Cent. America 321.0 332.0 336.5 334.4 326.2 -2.7% 2.8% 7.4%
Austria 12.5 12.7 12.5 12.5 12.7 1.3% -1.2% 0.3%
Azerbaijan 4.2 4.5 4.4 4.5 4.6 1.5% -1.7% 0.1%
Belarus 10.4 7.1 8.1 7.7 7.5 -2.5% 0.2% 0.2%
Belgium 29.6 30.1 29.7 31.0 31.8 2.3% -0.8% 0.7%
Bulgaria 3.9 3.6 3.9 4.4 4.5 2.9% -1.0% 0.1%
Czech Republic 9.0 8.5 9.1 8.9 8.4 -6.2% -1.1% 0.2%
Denmark 7.8 7.7 7.8 8.0 8.0 0.3% -1.4% 0.2%
Finland 9.1 9.0 8.6 8.7 9.0 2.6% -2.4% 0.2%
France 80.3 79.3 76.9 76.8 76.4 -0.8% -1.9% 1.7%
Germany 111.4 113.4 110.4 110.0 113.0 2.4% -1.1% 2.6%
Greece 15.3 14.5 14.4 14.9 15.4 2.8% -3.0% 0.3%
Hungary 5.9 5.9 6.6 7.0 7.1 1.3% -0.5% 0.2%
Ireland 6.5 6.5 6.5 6.8 7.0 3.0% -3.1% 0.2%
Italy 64.2 59.4 55.8 57.6 58.1 0.5% -4.0% 1.3%
Kazakhstan 11.5 12.1 12.3 13.2 13.2 -0.2% 3.5% 0.3%
Lithuania 2.7 2.6 2.6 2.8 3.0 6.7% 0.1% 0.1%
Netherlands 43.7 41.4 39.6 38.7 39.9 2.8% -2.5% 0.9%
Norway 10.5 10.8 10.2 10.3 10.4 0.7% 0.2% 0.2%
Poland 25.7 23.8 23.9 24.9 27.2 8.8% 1.1% 0.6%
Portugal 11.0 11.3 11.1 11.5 11.2 -3.2% -3.5% 0.3%
Romania 9.2 8.4 9.0 9.2 9.5 3.4% -1.4% 0.2%
Russian Federation 144.6 144.3 152.3 144.2 148.0 2.4% 1.4% 3.3%
Slovakia 3.6 3.6 3.4 3.7 4.0 8.6% -0.4% 0.1%
Spain 64.7 59.3 59.0 61.2 62.5 1.8% -2.6% 1.4%
Sweden 14.6 14.4 14.5 14.1 14.7 3.7% -1.9% 0.3%
Switzerland 11.2 11.8 10.6 10.7 10.2 -5.4% -1.3% 0.2%
Turkey 31.6 33.5 34.3 38.9 41.2 5.6% 2.4% 0.9%
Turkmenistan 6.0 6.2 6.5 6.6 6.7 0.8% 2.9% 0.2%
Ukraine 12.5 11.9 10.3 9.2 9.1 -0.9% -3.9% 0.2%
United Kingdom 71.4 70.3 69.8 71.8 73.1 1.7% -1.5% 1.7%
USSR n/a n/a n/a n/a n/a n/a n/a n/a
Uzbekistan 3.0 2.9 2.7 2.7 2.8 0.7% -6.1% 0.1%
Other Europe & Eurasia 34.1 33.4 32.2 33.3 34.5 3.2% -0.2% 0.8%
Total Europe & Eurasia 882.1 864.3 858.8 865.9 884.6 1.9% -1.1% 20.0%
Growth rate per annum
Public Record Exhibit 3
52

Iran 85.7 93.6 90.4 84.5 83.8 -1.1% 0.5% 1.9%
Israel 13.9 11.5 10.6 11.4 11.6 1.9% -0.7% 0.3%
Kuwait 24.4 22.7 21.0 22.3 22.0 -1.5% 1.3% 0.5%
Qatar 8.2 9.3 9.7 10.7 11.7 9.2% 11.6% 0.3%
Saudi Arabia 146.2 147.3 159.8 166.6 167.9 0.5% 5.9% 3.8%
United Arab Emirates 35.0 35.5 38.6 40.9 43.5 6.1% 5.0% 1.0%
Other Middle East 76.0 78.8 78.2 76.5 77.3 0.8% 1.9% 1.7%
Total Middle East 389.5 398.6 408.4 412.8 417.8 0.9% 3.3% 9.5%
Algeria 16.8 17.6 17.7 19.5 18.9 -3.2% 5.8% 0.4%
Egypt 35.3 35.8 38.3 39.6 40.6 2.3% 2.9% 0.9%
South Africa 26.5 27.3 27.0 27.9 26.9 -3.6% 1.2% 0.6%
Other Africa 90.0 94.8 94.5 95.1 98.9 3.7% 2.8% 2.2%
Total Africa 168.6 175.4 177.5 182.1 185.4 1.5% 2.8% 4.2%
Australia 47.9 48.2 48.1 47.9 47.8 -0.3% 1.9% 1.1%
Bangladesh 5.4 5.3 5.8 6.2 6.6 6.0% 4.8% 0.1%
China 487.1 508.1 528.0 561.8 578.7 2.7% 5.5% 13.1%
China Hong Kong SAR 17.2 17.6 16.6 18.3 18.9 3.2% 2.7% 0.4%
India 173.6 175.3 180.8 195.8 212.7 8.3% 4.9% 4.8%
Indonesia 74.4 74.5 75.3 71.8 72.6 0.8% 1.6% 1.6%
Japan 217.7 207.4 197.0 189.0 184.3 -2.8% -2.6% 4.2%
Malaysia 32.9 34.9 34.9 35.5 36.3 1.8% 2.4% 0.8%
New Zealand 7.0 7.1 7.2 7.5 7.7 1.8% 0.7% 0.2%
Pakistan 20.0 21.9 22.6 24.6 27.5 11.4% 4.9% 0.6%
Philippines 14.4 14.9 16.1 18.3 19.9 8.5% 2.1% 0.5%
Singapore 63.4 64.2 65.8 69.4 72.2 3.7% 5.3% 1.6%
South Korea 108.8 108.3 107.9 113.8 122.1 7.1% 0.8% 2.8%
Taiwan 44.6 45.1 46.1 46.5 46.7 0.1% -0.6% 1.1%
Thailand 52.3 54.5 55.0 57.3 59.0 2.6% 2.2% 1.3%
Vietnam 17.1 17.3 18.0 18.8 20.1 6.2% 4.4% 0.5%
Other Asia Pacific 19.7 20.6 21.7 23.2 24.4 4.6% 4.4% 0.6%
Total Asia Pacific 1403.4 1425.2 1447.0 1505.8 1557.3 3.1% 2.7% 35.2%
Total World 4176.2 4220.9 4254.8 4341.0 4418.2 1.5% 1.0% 100.0%
of which: OECD 2071.7 2059.3 2036.7 2062.4 2086.8 0.9% -1.1% 47.2%
Non-OECD 2104.5 2161.6 2218.1 2278.5 2331.4 2.0% 3.4% 52.8%
European Union # 618.8 601.7 590.8 600.6 613.3 1.8% -1.9% 13.9% CIS 195.9 192.7 200.0 191.6 195.5 1.8% 1.0% 4.4%
♦ Less than 0.05%.
n/a not available.
# Excludes Estonia, Latvia and Lithuania prior to 1985 and Slovenia prior to 1990.
and substitute fuels, and unavoidable disparities in the definition, measurement or conversion of oil supply and demand data.
Annual changes and shares of total are calculated using million tonnes figures.
Growth rates are adjusted for leap years.
* Inland demand plus international aviation and marine bunkers and refinery fuel and loss. Consumption of biogasoline (such as ethanol), biodiesel
and derivatives of coal and natural gas are also included.
Notes: Differences between these world consumption figures and world production statistics are accounted for by stock changes, consumption of non-
Public Record Exhibit 3
53

Oil: Regional consumption - by product groupShare
Thousand barrels daily 2012 2013 2014 2015 2016 2016 2005-15 2016
North America
Light distillates 10572 10778 10841 11088 11312 2.0% 0.1% 47.4%
of which: gasoline 10225 10388 10479 10741 10957 2.0% 0.2% 46.0%
Middle distillates 6409 6519 6801 6812 6750 -0.9% -0.6% 28.3%
of which: diesel/gasoil 4822 4888 5125 5046 4918 -2.6% -0.5% 20.6%
of which: jet/kerosene 1587 1631 1676 1766 1833 3.8% -0.9% 7.7%
Fuel oil 662 576 447 419 505 20.5% -11.3% 2.1%
Others 5251 5492 5332 5435 5276 -2.9% ♦ 22.1%
Total North America 22894 23364 23421 23753 23843 0.4% -0.6% 100.0%
of which: US
Light distillates 8932 9125 9164 9413 9556 1.5% -0.1% 48.7%
of which: gasoline 8682 8843 8921 9178 9327 1.6% ♦ 47.5%
Middle distillates 5278 5371 5632 5657 5594 -1.1% -0.9% 28.5%
of which: diesel/gasoil 3875 3931 4153 4102 3981 -3.0% -0.8% 20.3%
of which: jet/kerosene 1403 1440 1479 1555 1614 3.8% -1.2% 8.2%
Fuel oil 367 317 256 258 356 37.8% -11.9% 1.8%
Others 3913 4147 4054 4203 4125 -1.8% 0.1% 21.0%
Total US 18490 18961 19106 19531 19631 0.5% -0.6% 100.0%
S. & Cent. America
Light distillates 2019 2118 2178 2231 2214 -0.7% 4.1% 31.7%
of which: gasoline 1831 1953 2018 2059 2032 -1.3% 4.7% 29.1%
Middle distillates 2635 2760 2774 2749 2696 -2.0% 3.7% 38.6%
of which: diesel/gasoil 2320 2440 2439 2411 2361 -2.1% 3.7% 33.8%
of which: jet/kerosene 315 320 335 338 334 -1.0% 3.3% 4.8%
Fuel oil 740 715 734 730 663 -9.2% -0.7% 9.5%
Others 1432 1481 1484 1429 1403 -1.8% 1.9% 20.1%
Total S. & Cent. America 6826 7073 7171 7139 6976 -2.3% 2.9% 100.0%
Europe & Eurasia
Light distillates 4325 4272 4208 4143 4144 ♦ -1.9% 22.1%
of which: gasoline 3198 3145 3134 3077 3071 -0.2% -1.7% 16.3%
Middle distillates 8839 8859 8787 9071 9269 2.2% 0.5% 49.3%
of which: diesel/gasoil 7299 7315 7194 7448 7609 2.2% 0.4% 40.5%
of which: jet/kerosene 1540 1544 1593 1623 1660 2.3% 0.6% 8.8%
Fuel oil 1499 1387 1369 1235 1306 5.7% -6.0% 7.0%
Others 3932 3852 3924 4000 4074 1.8% -0.6% 21.7%
Total Europe & Eurasia 18594 18370 18287 18450 18793 1.9% -0.9% 100.0%
of which: CIS
Light distillates 1300 1338 1329 1327 1314 -1.0% 2.3% 31.1%
of which: gasoline 1126 1141 1144 1118 1110 -0.7% 2.5% 26.3%
Middle distillates 1395 1379 1343 1278 1303 1.9% 1.6% 30.8%
of which: diesel/gasoil 1074 1078 1026 991 1025 3.4% 1.9% 24.3%
of which: jet/kerosene 321 301 317 287 278 -3.2% 0.8% 6.6%
Fuel oil 361 369 435 347 370 6.8% -3.6% 8.8%
Others 1149 1090 1219 1209 1236 2.3% 1.9% 29.3%
Total CIS 4205 4177 4326 4161 4223 1.5% 1.3% 100.0%
of which: USSR
Growth rate per annum
Public Record Exhibit 3
54

Light distillates n/a n/a n/a n/a n/a n/a n/a n/a
of which: gasoline n/a n/a n/a n/a n/a n/a n/a n/a
Middle distillates n/a n/a n/a n/a n/a n/a n/a n/a
of which: diesel/gasoil n/a n/a n/a n/a n/a n/a n/a n/a
of which: jet/kerosene n/a n/a n/a n/a n/a n/a n/a n/a
Fuel oil n/a n/a n/a n/a n/a n/a n/a n/a
Others n/a n/a n/a n/a n/a n/a n/a n/a
Total USSR n/a n/a n/a n/a n/a n/a n/a n/a
of which: European Union
Light distillates 2812 2719 2674 2602 2608 0.2% -3.4% 20.2%
of which: gasoline 1904 1838 1828 1798 1798 ♦ -3.4% 13.9%
Middle distillates 6696 6674 6618 6875 7020 2.1% -0.1% 54.2%
of which: diesel/gasoil 5566 5540 5482 5705 5804 1.7% -0.2% 44.8%
of which: jet/kerosene 1130 1134 1136 1170 1216 4.0% ♦ 9.4%
Fuel oil 1028 909 839 797 848 6.4% -6.6% 6.5%
Others 2419 2400 2370 2432 2466 1.4% -1.8% 19.1%
Total European Union * 12955 12702 12500 12707 12942 1.8% -1.7% 100.0%
Middle East
Light distillates 1839 1908 1944 2009 2053 2.2% 3.6% 21.8%
of which: gasoline 1488 1567 1601 1665 1699 2.0% 3.9% 18.0%
Middle distillates 2656 2753 2749 2672 2661 -0.4% 2.9% 28.2%
of which: diesel/gasoil 2204 2304 2278 2187 2161 -1.2% 3.2% 22.9%
of which: jet/kerosene 451 449 470 485 500 3.1% 1.8% 5.3%
Fuel oil 2042 2080 2211 2235 2192 -1.9% 3.9% 23.2%
Others 2223 2209 2276 2384 2525 5.9% 4.2% 26.8%
Total Middle East 8760 8950 9180 9300 9431 1.4% 3.6% 100.0%
Africa
Light distillates 867 883 902 954 1038 8.9% 3.1% 26.4%
of which: gasoline 863 878 897 949 1034 8.9% 3.5% 26.3%
Middle distillates 1680 1805 1846 1872 1843 -1.6% 4.2% 46.8%
of which: diesel/gasoil 1378 1481 1533 1595 1585 -0.6% 5.0% 40.3%
of which: jet/kerosene 302 324 314 277 258 -6.9% 0.3% 6.5%
Fuel oil 440 438 437 431 421 -2.3% -0.5% 10.7%
Others 583 595 586 609 634 4.1% 1.9% 16.1%
Total Africa 3571 3720 3771 3866 3937 1.8% 2.9% 100.0%
Asia
Light distillates 8944 9449 9759 10519 10955 4.2% 4.5% 32.6%
of which: gasoline 5208 5589 5732 6250 6542 4.7% 4.7% 19.5%
Middle distillates 10788 10991 11085 11368 11414 0.4% 2.3% 34.0%
of which: diesel/gasoil 8546 8684 8737 8928 8856 -0.8% 2.9% 26.4%
of which: jet/kerosene 2242 2307 2348 2439 2558 4.9% 0.6% 7.6%
Fuel oil 3216 2987 2828 2808 2898 3.2% -2.0% 8.6%Others 7083 7209 7523 7799 8310 6.5% 3.9% 24.7%
Total Asia Pacific 30031 30636 31195 32494 33577 3.3% 2.8% 100.0%
of which: China
Light distillates 2776 3105 3324 3768 4035 7.1% 9.5% 32.6%
of which: gasoline 1908 2191 2291 2652 2803 5.7% 8.9% 22.6%
Middle distillates 3963 4068 4114 4220 4046 -4.1% 5.3% 32.7%
of which: diesel/gasoil 3468 3522 3525 3560 3328 -6.5% 4.8% 26.9%
of which: jet/kerosene 495 546 588 659 718 8.9% 9.3% 5.8%
Public Record Exhibit 3
55

Fuel oil 560 564 592 591 617 4.4% -4.1% 5.0%
Others 2932 2998 3179 3408 3683 8.1% 5.6% 29.7%
Total China 10230 10734 11209 11986 12381 3.3% 5.7% 100.0%
of which: Japan
Light distillates 1614 1631 1575 1610 1560 -3.1% -1.0% 38.6%
of which: gasoline 981 952 924 915 908 -0.8% -1.5% 22.5%
Middle distillates 1361 1345 1319 1281 1291 0.8% -3.8% 32.0%
of which: diesel/gasoil 821 817 803 787 787 0.1% -3.7% 19.5%
of which: jet/kerosene 539 528 516 495 504 1.9% -3.9% 12.5%
Fuel oil 824 646 532 433 368 -14.9% -4.4% 9.1%
Others 903 895 876 816 817 0.2% -2.2% 20.3%
Total Japan 4702 4516 4303 4139 4037 -2.5% -2.5% 100.0%
World
Light distillates 28565 29408 29831 30943 31718 2.5% 1.6% 32.8%
of which: gasoline 22813 23522 23861 24741 25335 2.4% 1.5% 26.2%
Middle distillates 33007 33686 34041 34545 34632 0.3% 1.4% 35.9%
of which: diesel/gasoil 26570 27112 27306 27617 27489 -0.5% 1.7% 28.5%
of which: jet/kerosene 6437 6574 6735 6928 7143 3.1% 0.4% 7.4%
Fuel oil 8598 8182 8027 7858 7986 1.6% -2.3% 8.3%
Others 20505 20837 21125 21656 22223 2.6% 1.7% 23.0%
Total World 90675 92114 93025 95003 96558 1.6% 1.2% 100.0%
OECD
Light distillates 16864 16998 16988 17264 17506 1.4% -0.4% 37.9%
of which: gasoline 13861 13941 13987 14226 14450 1.6% -0.4% 31.3%
Middle distillates 16323 16466 16685 17067 17223 0.9% -0.3% 37.3%
of which: diesel/gasoil 12635 12719 12871 13111 13111 ♦ -0.2% 28.4%
of which: jet/kerosene 3688 3747 3814 3957 4112 3.9% -0.7% 8.9%
Fuel oil 2822 2424 2071 1905 2005 5.2% -7.6% 4.3%
Others 9502 9696 9441 9548 9484 -0.7% -0.6% 20.5%
Total OECD 45512 45583 45184 45785 46217 0.9% -0.9% 100.0%
Non-OECD
Light distillates 11701 12411 12843 13679 14212 3.9% 5.0% 28.2%
of which: gasoline 8951 9581 9874 10515 10884 3.5% 5.2% 21.6%
Middle distillates 16684 17220 17356 17478 17409 -0.4% 3.4% 34.6%
of which: diesel/gasoil 13936 14393 14435 14506 14378 -0.9% 3.8% 28.6%
of which: jet/kerosene 2748 2827 2922 2971 3031 2.0% 2.0% 6.0%
Fuel oil 5776 5759 5957 5953 5981 0.5% 0.4% 11.9%
Others 11002 11142 11685 12108 12739 5.2% 4.1% 25.3%
Total Non-OECD 45163 46531 47840 49218 50341 2.3% 3.6% 100.0%
* Excludes Estonia, Latvia, Lithuania prior to 1992 and Slovenia prior to 1990.
w Less than 0.05%.
n/a not available.
Notes: ‘Light distillates’ consists of aviation and motor gasolines and light distillate feedstock (LDF).
‘Middle distillates’ consists of jet and heating kerosenes, and gas and diesel oils (including marine bunkers).
‘Fuel oil’ includes marine bunkers and crude oil used directly as fuel.
‘Others’ consists of refinery gas, liquefied petroleum gas (LPG), solvents, petroleum coke, lubricants, bitumen, wax, other refined products and refinery fuel and loss.
Annual changes and shares of total are calculated using thousand barrels daily figures.
Growth rates are adjusted for leap years.
Public Record Exhibit 3
56

Oil: Spot crude prices
Dubai Brent Nigerian West Texas
Forcados Intermdiate
US dollars per barrel $/bbl * $/bbl † $/bbl $/bbl ‡
1972 1.90 - - -
1973 2.83 - - -
1974 10.41 - - -
1975 10.70 - - -
1976 11.63 12.80 12.87 12.23
1977 12.38 13.92 14.21 14.22
1978 13.03 14.02 13.65 14.55
1979 29.75 31.61 29.25 25.08
1980 35.69 36.83 36.98 37.96
1981 34.32 35.93 36.18 36.08
1982 31.80 32.97 33.29 33.65
1983 28.78 29.55 29.54 30.30
1984 28.06 28.78 28.14 29.39
1985 27.53 27.56 27.75 27.98
1986 13.10 14.43 14.46 15.10
1987 16.95 18.44 18.39 19.18
1988 13.27 14.92 15.00 15.97
1989 15.62 18.23 18.30 19.68
1990 20.45 23.73 23.85 24.50
1991 16.63 20.00 20.11 21.54
1992 17.17 19.32 19.61 20.57
1993 14.93 16.97 17.41 18.45
1994 14.74 15.82 16.25 17.21
1995 16.10 17.02 17.26 18.42
1996 18.52 20.67 21.16 22.16
1997 18.23 19.09 19.33 20.61
1998 12.21 12.72 12.62 14.39
1999 17.25 17.97 18.00 19.31
2000 26.20 28.50 28.42 30.37
2001 22.81 24.44 24.23 25.93
2002 23.74 25.02 25.04 26.16
2003 26.78 28.83 28.66 31.07
2004 33.64 38.27 38.13 41.49
2005 49.35 54.52 55.69 56.59
2006 61.50 65.14 67.07 66.02
2007 68.19 72.39 74.48 72.20
2008 94.34 97.26 101.43 100.06
2009 61.39 61.67 63.35 61.92
2010 78.06 79.50 81.05 79.45
2011 106.18 111.26 113.65 95.04
2012 109.08 111.67 114.21 94.13
2013 105.47 108.66 111.95 97.99
2014 97.07 98.95 101.35 93.28
2015 51.20 52.39 54.41 48.71
2016 41.19 43.73 44.54 43.34
* 1972 - 1985 Arabian Light, 1986 - 2016 Dubai dated.
† 1976 -1983 Forties, 1984 -2016 Brent dated.
Public Record Exhibit 3
57

‡ 1976 -1983 Posted WTI prices, 1984 -2016 Spot WTI (Cushing) prices.
Public Record Exhibit 3
58

Public Record Exhibit 3
59

Public Record Exhibit 3
60

Public Record Exhibit 3
61

Public Record Exhibit 3
62

Public Record Exhibit 3
63

Public Record Exhibit 3
64

Public Record Exhibit 3
65
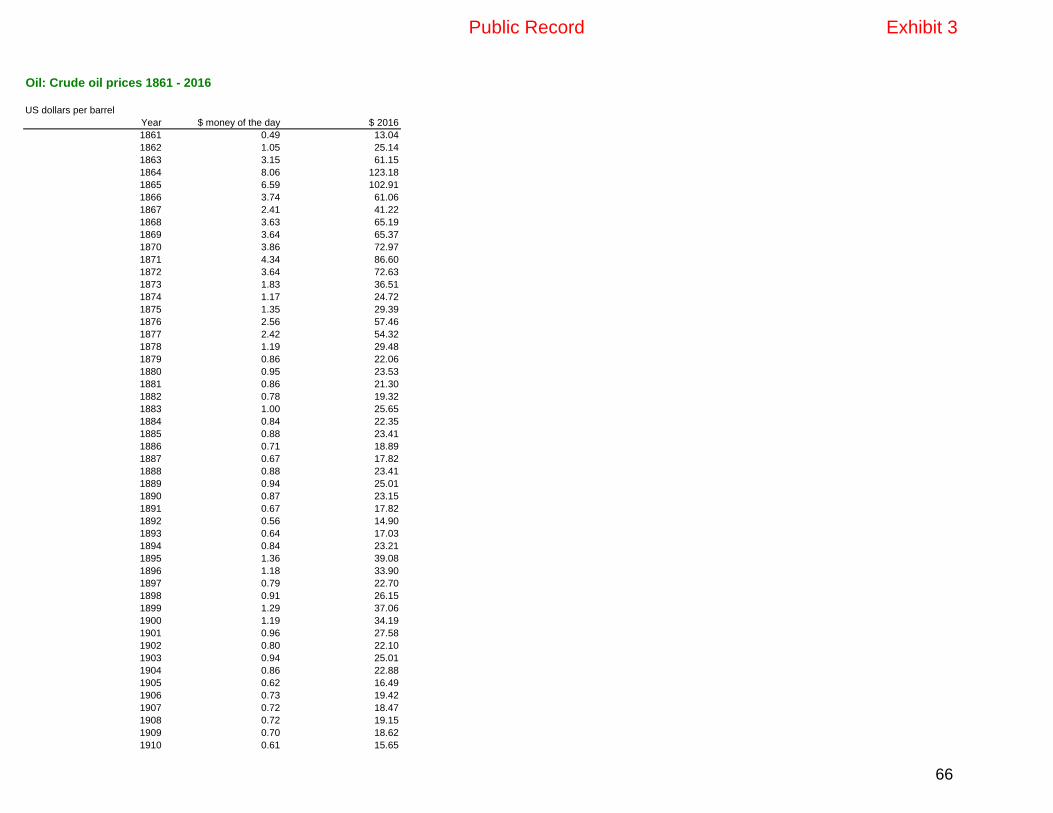
Oil: Crude oil prices 1861 - 2016
US dollars per barrel
Year $ money of the day $ 2016
1861 0.49 13.04
1862 1.05 25.14
1863 3.15 61.15
1864 8.06 123.18
1865 6.59 102.91
1866 3.74 61.06
1867 2.41 41.22
1868 3.63 65.19
1869 3.64 65.37
1870 3.86 72.97
1871 4.34 86.60
1872 3.64 72.63
1873 1.83 36.51
1874 1.17 24.72
1875 1.35 29.39
1876 2.56 57.46
1877 2.42 54.32
1878 1.19 29.48
1879 0.86 22.06
1880 0.95 23.53
1881 0.86 21.30
1882 0.78 19.32
1883 1.00 25.65
1884 0.84 22.35
1885 0.88 23.41
1886 0.71 18.89
1887 0.67 17.82
1888 0.88 23.41
1889 0.94 25.01
1890 0.87 23.15
1891 0.67 17.82
1892 0.56 14.90
1893 0.64 17.03
1894 0.84 23.21
1895 1.36 39.08
1896 1.18 33.90
1897 0.79 22.70
1898 0.91 26.15
1899 1.29 37.06
1900 1.19 34.19
1901 0.96 27.58
1902 0.80 22.10
1903 0.94 25.01
1904 0.86 22.88
1905 0.62 16.49
1906 0.73 19.42
1907 0.72 18.47
1908 0.72 19.15
1909 0.70 18.62
1910 0.61 15.65
Public Record Exhibit 3
66

1911 0.61 15.65
1912 0.74 18.33
1913 0.95 22.98
1914 0.81 19.33
1915 0.64 15.12
1916 1.10 24.16
1917 1.56 29.18
1918 1.98 31.53
1919 2.01 27.88
1920 3.07 36.76
1921 1.73 23.19
1922 1.61 23.04
1923 1.34 18.84
1924 1.43 20.06
1925 1.68 22.99
1926 1.88 25.48
1927 1.30 17.96
1928 1.17 16.38
1929 1.27 17.78
1930 1.19 17.10
1931 0.65 10.24
1932 0.87 15.28
1933 0.67 12.40
1934 1.00 17.91
1935 0.97 16.95
1936 1.09 18.87
1937 1.18 19.71
1938 1.13 19.24
1939 1.02 17.61
1940 1.02 17.44
1941 1.14 18.57
1942 1.19 17.51
1943 1.20 16.64
1944 1.21 16.50
1945 1.05 13.99
1946 1.12 13.75
1947 1.90 20.40
1948 1.99 19.83
1949 1.78 17.91
1950 1.71 17.04
1951 1.71 15.78
1952 1.71 15.45
1953 1.93 17.30
1954 1.93 17.22
1955 1.93 17.29
1956 1.93 17.04
1957 1.90 16.18
1958 2.08 17.26
1959 2.08 17.11
1960 1.90 15.38
1961 1.80 14.43
1962 1.80 14.27
1963 1.80 14.11
1964 1.80 13.91
1965 1.80 13.68
Public Record Exhibit 3
67

1966 1.80 13.31
1967 1.80 12.93
1968 1.80 12.41
1969 1.80 11.78
1970 1.80 11.12
1971 2.24 13.26
1972 2.48 14.23
1973 3.29 17.77
1974 11.58 56.39
1975 11.53 51.44
1976 12.80 53.98
1977 13.92 55.09
1978 14.02 51.61
1979 31.61 104.50
1980 36.83 107.27
1981 35.93 94.87
1982 32.97 82.00
1983 29.55 71.21
1984 28.78 66.48
1985 27.56 61.47
1986 14.43 31.60
1987 18.44 38.95
1988 14.92 30.28
1989 18.23 35.28
1990 23.73 43.57
1991 20.00 35.25
1992 19.32 33.05
1993 16.97 28.19
1994 15.82 25.62
1995 17.02 26.80
1996 20.67 31.62
1997 19.09 28.55
1998 12.72 18.72
1999 17.97 25.89
2000 28.50 39.72
2001 24.44 33.13
2002 25.02 33.38
2003 28.83 37.61
2004 38.27 48.62
2005 54.52 67.00
2006 65.14 77.55
2007 72.39 83.79
2008 97.26 108.42
2009 61.67 68.99
2010 79.50 87.50
2011 111.26 118.71
2012 111.67 116.73
2013 108.66 111.95
2014 98.95 100.31
2015 52.39 53.05
2016 43.73 43.73
1861-1944 US Average.
1945-1983 Arabian Light posted at Ras Tanura.
1984-2016 Brent dated.
Public Record Exhibit 3
68

$2016 (deflated using the Consumer Price Index for the US)
Public Record Exhibit 3
69
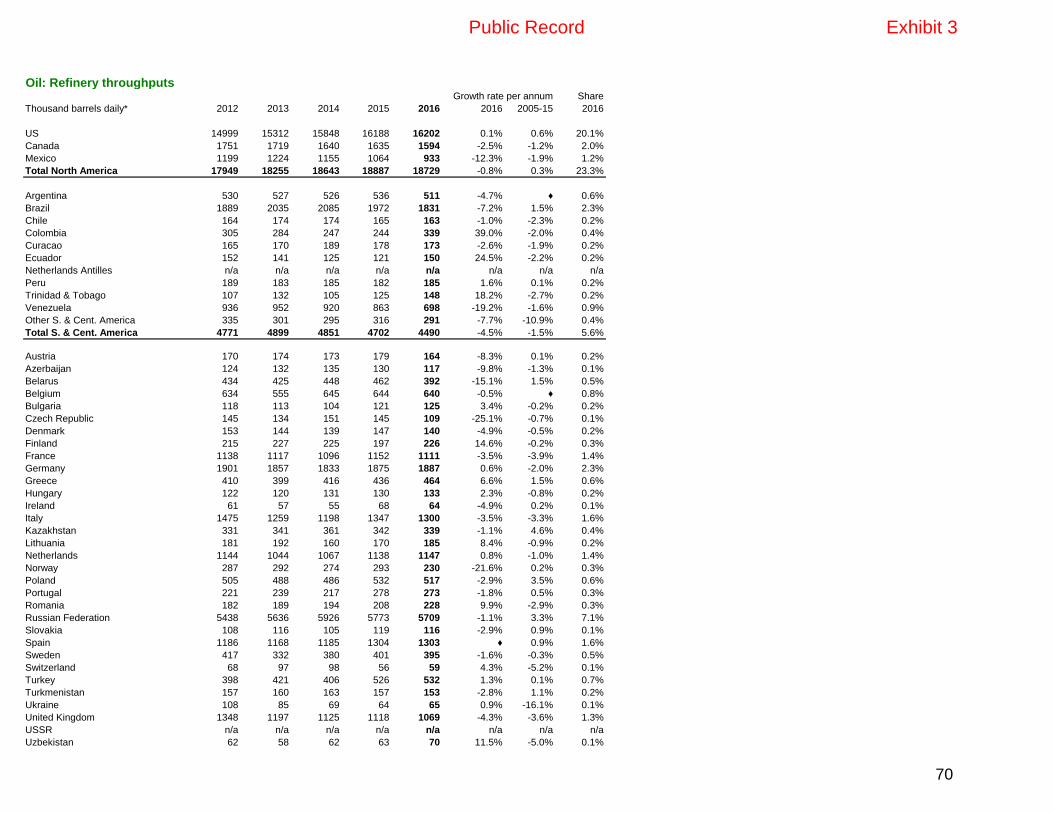
Oil: Refinery throughputsShare
Thousand barrels daily* 2012 2013 2014 2015 2016 2016 2005-15 2016
US 14999 15312 15848 16188 16202 0.1% 0.6% 20.1%
Canada 1751 1719 1640 1635 1594 -2.5% -1.2% 2.0%
Mexico 1199 1224 1155 1064 933 -12.3% -1.9% 1.2%
Total North America 17949 18255 18643 18887 18729 -0.8% 0.3% 23.3%
Argentina 530 527 526 536 511 -4.7% ♦ 0.6%
Brazil 1889 2035 2085 1972 1831 -7.2% 1.5% 2.3%
Chile 164 174 174 165 163 -1.0% -2.3% 0.2%
Colombia 305 284 247 244 339 39.0% -2.0% 0.4%
Curacao 165 170 189 178 173 -2.6% -1.9% 0.2%
Ecuador 152 141 125 121 150 24.5% -2.2% 0.2%
Netherlands Antilles n/a n/a n/a n/a n/a n/a n/a n/a
Peru 189 183 185 182 185 1.6% 0.1% 0.2%
Trinidad & Tobago 107 132 105 125 148 18.2% -2.7% 0.2%
Venezuela 936 952 920 863 698 -19.2% -1.6% 0.9%
Other S. & Cent. America 335 301 295 316 291 -7.7% -10.9% 0.4%
Total S. & Cent. America 4771 4899 4851 4702 4490 -4.5% -1.5% 5.6%
Austria 170 174 173 179 164 -8.3% 0.1% 0.2%
Azerbaijan 124 132 135 130 117 -9.8% -1.3% 0.1%
Belarus 434 425 448 462 392 -15.1% 1.5% 0.5%
Belgium 634 555 645 644 640 -0.5% ♦ 0.8%
Bulgaria 118 113 104 121 125 3.4% -0.2% 0.2%
Czech Republic 145 134 151 145 109 -25.1% -0.7% 0.1%
Denmark 153 144 139 147 140 -4.9% -0.5% 0.2%
Finland 215 227 225 197 226 14.6% -0.2% 0.3%
France 1138 1117 1096 1152 1111 -3.5% -3.9% 1.4%
Germany 1901 1857 1833 1875 1887 0.6% -2.0% 2.3%
Greece 410 399 416 436 464 6.6% 1.5% 0.6%
Hungary 122 120 131 130 133 2.3% -0.8% 0.2%
Ireland 61 57 55 68 64 -4.9% 0.2% 0.1%
Italy 1475 1259 1198 1347 1300 -3.5% -3.3% 1.6%
Kazakhstan 331 341 361 342 339 -1.1% 4.6% 0.4%
Lithuania 181 192 160 170 185 8.4% -0.9% 0.2%
Netherlands 1144 1044 1067 1138 1147 0.8% -1.0% 1.4%
Norway 287 292 274 293 230 -21.6% 0.2% 0.3%
Poland 505 488 486 532 517 -2.9% 3.5% 0.6%
Portugal 221 239 217 278 273 -1.8% 0.5% 0.3%
Romania 182 189 194 208 228 9.9% -2.9% 0.3%
Russian Federation 5438 5636 5926 5773 5709 -1.1% 3.3% 7.1%
Slovakia 108 116 105 119 116 -2.9% 0.9% 0.1%
Spain 1186 1168 1185 1304 1303 ♦ 0.9% 1.6%
Sweden 417 332 380 401 395 -1.6% -0.3% 0.5%
Switzerland 68 97 98 56 59 4.3% -5.2% 0.1%
Turkey 398 421 406 526 532 1.3% 0.1% 0.7%
Turkmenistan 157 160 163 157 153 -2.8% 1.1% 0.2%
Ukraine 108 85 69 64 65 0.9% -16.1% 0.1%
United Kingdom 1348 1197 1125 1118 1069 -4.3% -3.6% 1.3%
USSR n/a n/a n/a n/a n/a n/a n/a n/a
Uzbekistan 62 58 62 63 70 11.5% -5.0% 0.1%
Growth rate per annum
Public Record Exhibit 3
70

Other Europe & Eurasia 134 140 132 148 158 6.6% -3.2% 0.2%
Total Europe & Eurasia 19376 18908 19158 19724 19420 -1.5% -0.3% 24.1%
Iran 1932 1999 1932 1867 1891 1.3% 1.4% 2.3%
Iraq 579 598 487 409 440 7.6% -1.4% 0.5%
Israel 219 238 245 250 232 -7.4% 2.3% 0.3%
Kuwait 916 873 879 913 830 -9.2% 0.6% 1.0%
Qatar 292 270 261 253 280 10.8% 8.2% 0.3%
Saudi Arabia 1953 1876 2201 2479 2750 11.0% 2.2% 3.4%
United Arab Emirates 638 650 659 929 1000 7.6% 4.4% 1.2%
Other Middle East 719 685 671 629 605 -3.8% -2.1% 0.8%
Total Middle East 7248 7189 7335 7728 8028 3.9% 1.5% 10.0%
Algeria 478 492 615 591 584 -1.1% 5.2% 0.7%
Egypt 534 523 525 535 508 -5.0% -1.7% 0.6%
South Africa 401 411 461 441 477 8.1% -0.3% 0.6%
Other Africa 797 827 625 532 533 0.3% -6.6% 0.7%
Total Africa 2210 2254 2226 2099 2102 0.2% -1.7% 2.6%
Australia 600 588 538 427 433 1.5% -3.4% 0.5%
Bangladesh 24 27 24 25 23 -10.1% 1.1% ♦
China 9199 9599 10155 10684 11023 3.2% 6.2% 13.7%
India 4302 4462 4475 4561 4931 8.1% 5.9% 6.1%
Indonesia 820 822 848 836 885 5.8% -1.6% 1.1%
Japan 3400 3453 3289 3258 3280 0.7% -2.4% 4.1%
Malaysia 575 558 553 508 537 5.6% ♦ 0.7%
New Zealand 109 105 101 109 108 -1.4% 1.3% 0.1%
Pakistan 192 223 232 257 242 -5.7% 1.1% 0.3%
Philippines 170 158 168 212 216 1.7% 0.3% 0.3%
Singapore 1020 936 871 897 965 7.6% -2.7% 1.2%
South Korea 2582 2484 2516 2784 2928 5.2% 1.8% 3.6%
Taiwan 897 847 850 838 861 2.7% -2.2% 1.1%
Thailand 978 1078 1029 1132 1096 -3.2% 2.2% 1.4%
Vietnam 142 145 125 145 148 2.5% 32.0% 0.2%
Other Asia Pacific 89 97 96 92 107 16.8% -0.9% 0.1%
Total Asia Pacific 25098 25581 25869 26765 27781 3.8% 2.6% 34.5%
Total World 76653 77086 78083 79905 80550 0.8% 0.8% 100.0%
of which: OECD 37130 36733 36912 37965 37752 -0.6% -0.5% 46.9%
Non-OECD 39523 40353 41171 41940 42798 2.0% 2.1% 53.1%
European Union # 11895 11181 11132 11766 11660 -0.9% -1.5% 14.5%
CIS 6656 6840 7168 6996 6849 -2.1% 2.3% 8.5%
Source: Includes data from ICIS.
* Atmospheric distillation capacity on a calendar-day basis.
w Less than 0.05%.
# Excludes Estonia, Latvia and Lithuania prior to 1985 and Slovenia prior to 1990.
Note: Annual changes and shares of total are calculated using thousand barrels daily figures.
Public Record Exhibit 3
71

Oil: Refinery CapacitiesShare
Thousand barrels daily* 2012 2013 2014 2015 2016 2016 2005-15 2016
US 17824 17925 17889 18315 18621 1.7% 0.5% 19.1%
Canada 2050 1965 1965 1966 1967 ♦ 0.4% 2.0%
Mexico 1606 1606 1522 1522 1522 - 0.4% 1.6%
Total North America 21479 21495 21375 21803 22110 1.4% 0.5% 22.7%
Argentina 657 657 657 657 657 - 0.7% 0.7%
Brazil 2001 2093 2235 2278 2289 0.5% 1.6% 2.3%
Chile 254 254 258 258 258 - 0.8% 0.3%
Colombia 336 336 336 421 421 - 3.1% 0.4%
Curacao 320 320 320 320 320 - - 0.3%
Ecuador 175 175 175 175 210 19.7% -0.1% 0.2%
Netherlands Antilles n/a n/a n/a n/a n/a n/a n/a n/a
Peru 252 253 253 253 253 - 1.3% 0.3%
Trinidad & Tobago 165 165 165 165 165 - - 0.2%
Venezuela 1303 1303 1303 1303 1303 - 0.1% 1.3%
Other S. & Cent. America 356 361 376 384 384 - -10.3% 0.4%
Total S. & Cent. America 5819 5917 6078 6214 6259 0.7% -0.3% 6.4%
Austria 193 193 193 193 193 - -0.4% 0.2%
Azerbaijan 205 205 205 205 205 - - 0.2%
Belarus 460 460 460 460 460 - - 0.5%
Belgium 753 776 776 776 776 - 0.3% 0.8%
Bulgaria 195 195 195 195 195 - -0.5% 0.2%
Czech Republic 178 178 178 178 178 - -0.8% 0.2%
Denmark 181 181 180 180 180 - -0.5% 0.2%
Finland 261 261 261 261 261 - - 0.3%
France 1513 1375 1375 1375 1224 -11.0% -3.6% 1.3%
Germany 2097 2061 2077 2049 2024 -1.2% -1.2% 2.1%
Greece 498 498 498 498 498 - 1.8% 0.5%
Hungary 165 165 165 165 165 - - 0.2%
Ireland 75 75 75 75 75 - - 0.1%
Italy 2113 1876 1915 1915 1915 - -2.7% 2.0%
Kazakhstan 330 350 350 350 350 - 0.6% 0.4%
Lithuania 241 241 241 241 241 - - 0.2%
Netherlands 1274 1274 1274 1293 1293 - 0.1% 1.3%
Norway 316 316 316 316 316 - - 0.3%
Poland 582 582 582 581 581 - 1.4% 0.6%
Portugal 306 306 306 306 306 - - 0.3%
Romania 214 235 228 239 256 7.1% -4.8% 0.3%
Russian Federation 5826 6245 6347 6408 6418 0.2% 1.7% 6.6%
Slovakia 122 122 122 122 122 - - 0.1%
Spain 1546 1546 1546 1562 1562 - 1.3% 1.6%
Sweden 436 436 436 436 436 - - 0.4%
Switzerland 106 140 140 68 68 - -7.0% 0.1%
Turkey 613 613 613 613 613 - - 0.6%
Turkmenistan 251 251 251 271 271 - 0.8% 0.3%
Ukraine 248 262 248 248 248 - -7.2% 0.3%
United Kingdom 1526 1498 1337 1337 1227 -8.3% -3.0% 1.3%
USSR n/a n/a n/a n/a n/a n/a n/a n/a
Uzbekistan 232 232 232 232 232 - - 0.2%
Growth rate per annum
Public Record Exhibit 3
72

Other Europe & Eurasia 436 387 404 413 413 - -0.4% 0.4%
Total Europe & Eurasia 23492 23536 23528 23563 23304 -1.1% -0.5% 23.9%
Iran 1952 1985 1985 1985 1985 - 1.6% 2.0%
Iraq 971 823 931 903 919 1.8% 2.2% 0.9%
Israel 292 294 301 301 301 - 1.1% 0.3%
Kuwait 936 936 936 936 936 - - 1.0%
Qatar 283 283 283 283 429 51.6% 7.5% 0.4%
Saudi Arabia 2107 2507 2899 2899 2899 - 3.2% 3.0%
United Arab Emirates 710 710 1143 1143 1143 - 6.3% 1.2%
Other Middle East 978 864 864 864 864 - 0.3% 0.9%
Total Middle East 8229 8402 9342 9314 9476 1.7% 2.4% 9.7%
Algeria 652 647 651 651 651 - 3.9% 0.7%
Egypt 810 810 810 810 810 - - 0.8%
South Africa 520 520 520 520 520 - - 0.5%
Other Africa 1453 1473 1476 1476 1476 - 0.6% 1.5%
Total Africa 3435 3449 3457 3457 3457 - 0.9% 3.5%
Australia 663 662 536 443 452 2.0% -4.7% 0.5%
Bangladesh 40 43 43 43 43 - 1.8% ♦
China 12962 13594 14534 14306 14177 -0.9% 6.3% 14.6%
India 4279 4319 4319 4307 4620 7.3% 5.3% 4.7%
Indonesia 1141 1152 1155 1155 1155 - 0.9% 1.2%
Japan 4254 4123 3749 3721 3600 -3.2% -2.0% 3.7%
Malaysia 606 612 612 612 612 - 1.6% 0.6%
New Zealand 136 136 136 136 136 - 2.9% 0.1%
Pakistan 275 390 390 392 392 - 3.9% 0.4%
Philippines 261 270 271 271 271 - -0.3% 0.3%
Singapore 1422 1414 1514 1514 1514 - 0.6% 1.6%
South Korea 2878 2878 3110 3110 3234 4.0% 1.8% 3.3%
Taiwan 1197 1197 1197 988 988 - -1.6% 1.0%
Thailand 1230 1237 1252 1252 1235 -1.4% 1.5% 1.3%
Vietnam 159 159 159 159 163 2.5% 30.6% 0.2%
Other Asia Pacific 220 226 233 233 233 - 1.0% 0.2%
Total Asia Pacific 31723 32410 33210 32642 32825 0.6% 3.0% 33.7%
Total World 94176 95210 96990 96992 97430 0.5% 1.1% 100.0%
of which: OECD 44810 44314 43832 44073 44105 0.1% -0.2% 45.3%
Non-OECD 49367 50896 53158 52920 53325 0.8% 2.5% 54.7%
European Union # 14641 14247 14134 14151 13882 -1.9% -1.2% 14.2%
CIS 7562 8016 8121 8211 8221 0.1% 1.0% 8.4%
Source: Includes data from ICIS.
* Atmospheric distillation capacity at year end on a calendar-day basis.
w Less than 0.05%.
n/a not available.
# Excludes Estonia, Latvia and Lithuania prior to 1985 and Slovenia prior to 1990.
Note: Annual changes and shares of total are calculated using thousand barrels daily figures.
Public Record Exhibit 3
73

Oil: Regional refining margins
US dollars per barrel
USGC Medium Sour Coking NWE Light Sweet Cracking Singapore Medium Sour Hydrocracking
1Q00 2.70 2.07 2.42
2Q00 5.22 4.26 0.63
3Q00 3.87 3.44 3.19
4Q00 3.78 3.63 2.19
1Q01 6.69 2.35 0.7
2Q01 7.71 3.35 0.96
3Q01 3.24 1.74 0.75
4Q01 1.79 1.53 1.2
1Q02 2.04 0.09 0.2
2Q02 2.62 0.59 0.18
3Q02 1.82 1.28 0.47
4Q02 2.98 2.19 1.41
1Q03 6.14 3.7 2.98
2Q03 3.59 2.14 0.66
3Q03 5.61 2.47 1.27
4Q03 3.52 2.21 2.2
1Q04 6.92 2.73 3.42
2Q04 9.18 5.29 2.8
3Q04 6.99 4.37 5.48
4Q04 5.52 4.72 8.02
1Q05 7.3 2.84 4.98
2Q05 9.37 5.68 6.3
3Q05 17.12 7.78 6.52
4Q05 11.64 5.51 4.42
1Q06 10.86 2.88 3.54
2Q06 17.74 5.78 6.83
3Q06 11.47 4.54 3.58
4Q06 7.92 2.49 2.95
1Q07 10.14 4.16 4.84
2Q07 24.46 7.12 6.01
3Q07 12.58 3.82 4.52
4Q07 6.82 4.84 5.8
1Q08 6.21 4.79 4.76
2Q08 8.59 7.46 9.41
3Q08 9.87 7.13 5.9
4Q08 2.49 7.48 5.16
1Q09 6.69 4.67 2.51
2Q09 6.00 3.1 -0.11
3Q09 4.16 2.6 -0.02
4Q09 1.75 2.69 -1.47
1Q10 3.5 4.29 0.97
2Q10 6.59 3.84 0.85
3Q10 4.72 2.59 2.34
4Q10 5.03 4.5 2.32
1Q11 2.59 3.19 4.23
2Q11 8.59 1.92 4.18
3Q11 4.73 2.98 4.41
4Q11 -1.14 4.67 3.32
1Q12 4.44 4.84 2.35
Public Record Exhibit 3
74

2Q12 11.07 7.08 2.23
3Q12 13.72 9.26 5.22
4Q12 3.5 6.76 2.93
1Q13 5.88 5.82 4.76
2Q13 10.61 4.54 2.74
3Q13 8.34 3.12 1.80
4Q13 7.59 2.89 1.30
1Q14 7.13 2.6 2.63
2Q14 13.67 2.86 1.33
3Q14 10.72 4.72 1.11
4Q14 3.41 5.52 3.96
1Q15 10.63 7.38 6.44
2Q15 14.70 7.94 4.07
3Q15 16.56 8.83 2.36
4Q15 8.59 4.74 5.03
1Q16 7.07 4.10 4.55
2Q16 8.99 4.56 2.51
3Q16 9.54 3.35 3.30
4Q16 8.33 5.60 4.09
Note: The refining margins presented are benchmark margins for three major global refining centres. US Gulf Coast (USGC), North West Europe (NWE - Rotterdam) and Singapore
In each case they are based on a single crude oil appropriate for that region and have optimized product yields based on a generic refinery configuration (cracking, hydrocracking or coking), again appropriate for that region.
The margins are on a semi-variable basis, ie the margin after all variable costs and fixed energy costs.
Public Record Exhibit 3
75
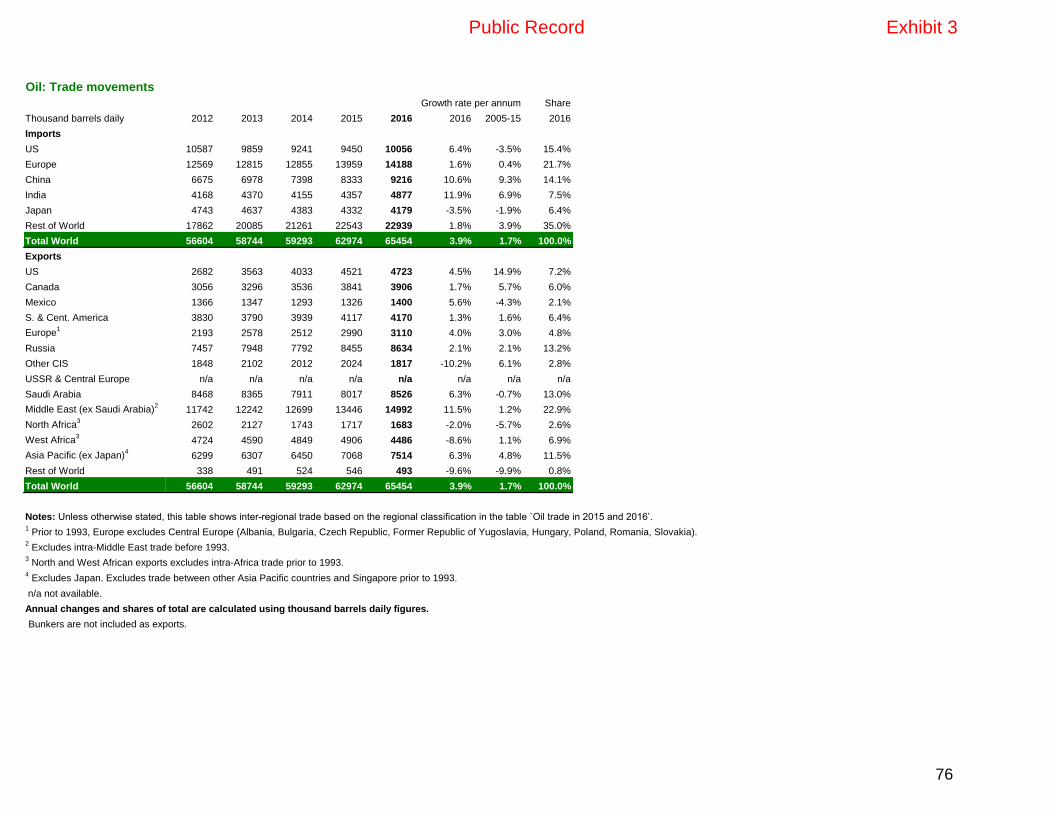
Oil: Trade movements
Share
Thousand barrels daily 2012 2013 2014 2015 2016 2016 2005-15 2016
Imports
US 10587 9859 9241 9450 10056 6.4% -3.5% 15.4%
Europe 12569 12815 12855 13959 14188 1.6% 0.4% 21.7%
China 6675 6978 7398 8333 9216 10.6% 9.3% 14.1%
India 4168 4370 4155 4357 4877 11.9% 6.9% 7.5%
Japan 4743 4637 4383 4332 4179 -3.5% -1.9% 6.4%
Rest of World 17862 20085 21261 22543 22939 1.8% 3.9% 35.0%
Total World 56604 58744 59293 62974 65454 3.9% 1.7% 100.0%
Exports
US 2682 3563 4033 4521 4723 4.5% 14.9% 7.2%
Canada 3056 3296 3536 3841 3906 1.7% 5.7% 6.0%
Mexico 1366 1347 1293 1326 1400 5.6% -4.3% 2.1%
S. & Cent. America 3830 3790 3939 4117 4170 1.3% 1.6% 6.4%
Europe1
2193 2578 2512 2990 3110 4.0% 3.0% 4.8%
Russia 7457 7948 7792 8455 8634 2.1% 2.1% 13.2%
Other CIS 1848 2102 2012 2024 1817 -10.2% 6.1% 2.8%
USSR & Central Europe n/a n/a n/a n/a n/a n/a n/a n/a
Saudi Arabia 8468 8365 7911 8017 8526 6.3% -0.7% 13.0%
Middle East (ex Saudi Arabia)2
11742 12242 12699 13446 14992 11.5% 1.2% 22.9%
North Africa3
2602 2127 1743 1717 1683 -2.0% -5.7% 2.6%
West Africa3
4724 4590 4849 4906 4486 -8.6% 1.1% 6.9%
Asia Pacific (ex Japan)4
6299 6307 6450 7068 7514 6.3% 4.8% 11.5%
Rest of World 338 491 524 546 493 -9.6% -9.9% 0.8%
Total World 56604 58744 59293 62974 65454 3.9% 1.7% 100.0%
Notes: Unless otherwise stated, this table shows inter-regional trade based on the regional classification in the table `Oil trade in 2015 and 2016’.1 Prior to 1993, Europe excludes Central Europe (Albania, Bulgaria, Czech Republic, Former Republic of Yugoslavia, Hungary, Poland, Romania, Slovakia).
2 Excludes intra-Middle East trade before 1993.
3 North and West African exports excludes intra-Africa trade prior to 1993.
4 Excludes Japan. Excludes trade between other Asia Pacific countries and Singapore prior to 1993.
n/a not available.
Annual changes and shares of total are calculated using thousand barrels daily figures.
Bunkers are not included as exports.
Growth rate per annum
Public Record Exhibit 3
76

Oil: Inter-area movements 2016
To
Crude (million tonnes) US Canada Mexico S. & Cent.
America
Europe Russia Other CIS Middle East Africa Australasia China India Japan
From
US - 15.0 - 3.3 4.0 - † 0.3 0.1 † 0.5 - 0.4
Canada 162.6 - - 0.1 1.6 - - † † † 0.2 - -
Mexico 29.1 0.7 - 1.7 13.5 - - 0.1 - - 1.0 6.2 4.6
S. & Cent. America 79.8 0.3 † - 12.7 † - - 0.6 - 51.0 27.7 1.7
Europe 3.2 2.1 - 1.2 - † † 0.5 0.7 † 5.8 1.2 -
Russia 1.9 - - 2.9 177.4 - 18.2 0.4 † 0.4 52.5 0.3 10.0
Other CIS 0.5 1.1 - - 61.6 0.8 - 5.3 0.7 - 4.2 1.3 0.4
Iraq 20.9 - - 0.4 49.7 † - 3.7 1.2 - 36.2 38.0 4.0
Kuwait 10.4 † - - 9.6 - - † 2.6 - 16.3 10.1 11.5
Saudi Arabia 54.8 3.1 - 3.3 43.0 - - 13.4 8.0 1.0 51.0 40.3 59.0
UAE 0.6 † - † 0.7 † - † 0.7 4.7 12.2 17.4 39.6
Other Middle East 1.5 † - † 22.2 - † 0.1 0.8 1.0 68.4 30.2 30.3
North Africa 3.6 3.4 - 1.5 38.5 - † 1.1 † 0.1 1.7 3.6 0.1
West Africa 22.2 3.5 - 10.1 64.6 † † † 10.7 1.6 59.5 28.9 0.3
East & S. Africa - - - - 0.1 - † † † - 6.7 † †
Australasia 0.2 - - 0.2 † - - † † - 3.2 † 0.4
China - - - † † - - † 0.2 † - - 1.2
India - - - † † - - - † † - - -
Japan - † - † - - - - - † - - -
Singapore - - - - - - - - - † † † -
Other Asia Pacific 2.1 † † † † † - 0.1 † 11.6 12.3 7.1 4.4
Total imports 393.3 29.2 † 24.6 499.4 0.8 18.3 25.1 26.3 20.4 382.6 212.3 168.0
Product (million tonnes)
From
US - 27.0 34.6 66.6 33.6 † † 2.3 5.6 0.5 7.2 6.7 7.7
Canada 26.0 - 0.1 0.3 2.1 † † † 0.2 † 0.2 0.1 0.4
Mexico 4.2 † - 1.5 0.2 † † † 0.1 † 0.2 † -
S. & Cent. America 9.6 0.1 1.1 - 4.8 † † 0.2 1.8 0.1 3.2 † 0.2
Europe 21.4 4.0 1.7 7.0 - 0.5 2.8 15.4 45.8 0.1 4.8 0.6 0.6
Russia 18.9 † - 2.2 89.3 - 9.1 4.2 2.7 - 2.3 0.5 1.6
Other CIS 0.7 † † 0.1 5.7 0.7 - † 0.1 † 0.3 † †
Iraq 0.2 - - - 0.1 - † 0.2 † - † 0.1 †
Kuwait † - - 0.6 2.3 - † 1.1 3.0 † 1.4 0.9 2.9
Saudi Arabia 0.3 † - 0.5 12.6 - † 1.3 6.4 † 2.2 7.7 2.3
Public Record Exhibit 3
77
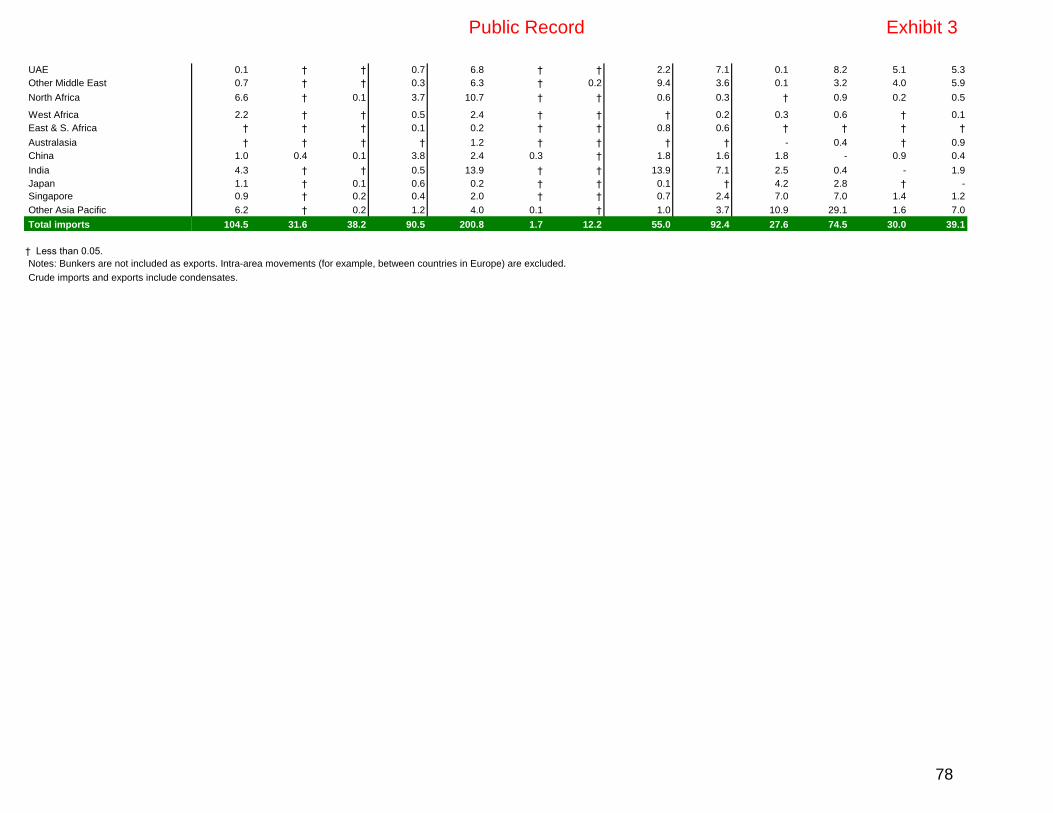
UAE 0.1 † † 0.7 6.8 † † 2.2 7.1 0.1 8.2 5.1 5.3
Other Middle East 0.7 † † 0.3 6.3 † 0.2 9.4 3.6 0.1 3.2 4.0 5.9
North Africa 6.6 † 0.1 3.7 10.7 † † 0.6 0.3 † 0.9 0.2 0.5
West Africa 2.2 † † 0.5 2.4 † † † 0.2 0.3 0.6 † 0.1
East & S. Africa † † † 0.1 0.2 † † 0.8 0.6 † † † †
Australasia † † † † 1.2 † † † † - 0.4 † 0.9
China 1.0 0.4 0.1 3.8 2.4 0.3 † 1.8 1.6 1.8 - 0.9 0.4
India 4.3 † † 0.5 13.9 † † 13.9 7.1 2.5 0.4 - 1.9
Japan 1.1 † 0.1 0.6 0.2 † † 0.1 † 4.2 2.8 † -
Singapore 0.9 † 0.2 0.4 2.0 † † 0.7 2.4 7.0 7.0 1.4 1.2
Other Asia Pacific 6.2 † 0.2 1.2 4.0 0.1 † 1.0 3.7 10.9 29.1 1.6 7.0
Total imports 104.5 31.6 38.2 90.5 200.8 1.7 12.2 55.0 92.4 27.6 74.5 30.0 39.1
† Less than 0.05.
Notes: Bunkers are not included as exports. Intra-area movements (for example, between countries in Europe) are excluded.
Crude imports and exports include condensates.
Public Record Exhibit 3
78
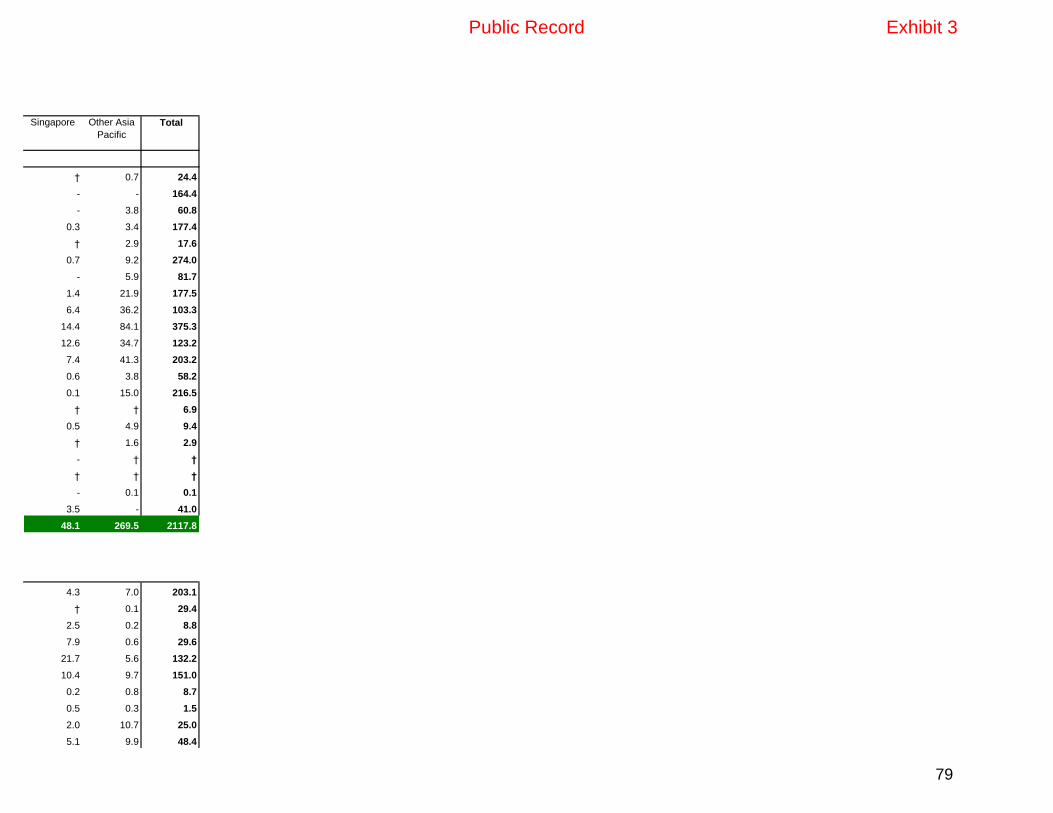
Singapore Other Asia
Pacific
Total
† 0.7 24.4
- - 164.4
- 3.8 60.8
0.3 3.4 177.4
† 2.9 17.6
0.7 9.2 274.0
- 5.9 81.7
1.4 21.9 177.5
6.4 36.2 103.3
14.4 84.1 375.3
12.6 34.7 123.2
7.4 41.3 203.2
0.6 3.8 58.2
0.1 15.0 216.5
† † 6.9
0.5 4.9 9.4
† 1.6 2.9
- † †
† † †
- 0.1 0.1
3.5 - 41.0
48.1 269.5 2117.8
4.3 7.0 203.1
† 0.1 29.4
2.5 0.2 8.8
7.9 0.6 29.6
21.7 5.6 132.2
10.4 9.7 151.0
0.2 0.8 8.7
0.5 0.3 1.5
2.0 10.7 25.0
5.1 9.9 48.4
Public Record Exhibit 3
79
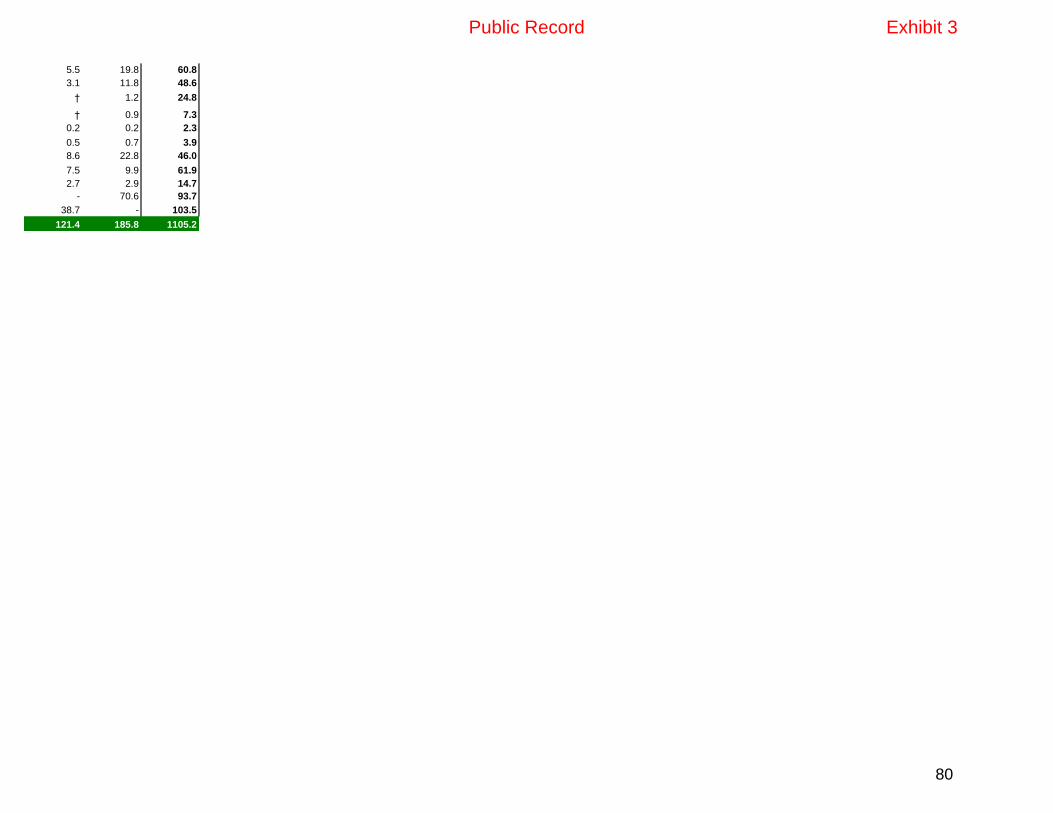
5.5 19.8 60.8
3.1 11.8 48.6
† 1.2 24.8
† 0.9 7.3
0.2 0.2 2.3
0.5 0.7 3.9
8.6 22.8 46.0
7.5 9.9 61.9
2.7 2.9 14.7
- 70.6 93.7
38.7 - 103.5
121.4 185.8 1105.2
Public Record Exhibit 3
80

Oil trade in 2015 and 2016
2015 2016
Crude Product Crude Product Crude Product Crude Product
Million tonnes Imports Imports Exports Exports Imports Imports Exports Exports
US 366.7 99.8 25.3 191.9 393.3 104.5 24.4 203.1
Canada 32.3 29.4 159.3 30.7 29.2 31.6 164.4 29.4
Mexico † 35.2 57.6 8.1 † 38.2 60.8 8.8
S. & Cent. America 27.0 88.9 173.4 30.4 24.6 90.5 177.4 29.6
Europe 499.9 187.6 11.8 131.7 499.4 200.8 17.6 132.2
Russia 2.9 2.0 261.9 152.9 0.8 1.7 274.0 151.0
Other CIS 23.1 12.8 88.5 11.8 18.3 12.2 81.7 8.7
Iraq - 1.7 161.2 0.8 † 1.2 177.5 1.5
Kuwait 0.1 0.7 96.6 26.4 † 0.8 103.3 25.0
Saudi Arabia † 7.3 359.2 38.4 † 7.3 375.3 48.4
United Arab Emirates 0.4 16.4 125.4 54.2 1.2 24.4 123.2 60.8
Other Middle East 26.2 19.3 157.5 42.4 23.9 21.4 203.2 48.6
North Africa 8.4 35.2 60.6 23.9 4.4 34.4 58.2 24.8
West Africa 0.8 31.3 236.7 7.3 0.7 32.9 216.5 7.3
East & S. Africa 20.0 31.3 8.8 2.7 21.2 25.1 6.9 2.3
Australasia 24.8 24.4 10.5 3.9 20.4 27.6 9.4 3.9
China 336.2 75.7 1.8 36.2 382.6 74.5 2.9 46.0
India 193.3 22.8 0.2 56.6 212.3 30.0 † 61.9
Japan 168.9 44.9 0.3 14.7 168.0 39.1 † 14.7
Singapore 45.9 125.8 0.1 87.7 48.1 121.4 0.1 93.7
Other Asia Pacific 259.1 164.2 39.1 104.0 269.5 185.8 41.0 103.5
Total World 2035.9 1056.7 2035.9 1056.7 2117.8 1105.2 2117.8 1105.2
Thousand barrels daily
US 7365 2086 509 4012 7877 2179 489 4234
Canada 649 614 3200 641 586 659 3293 613
Mexico ‡ 735 1157 169 ‡ 796 1217 184
S. & Cent. America 542 1858 3482 636 493 1887 3554 617
Europe 10039 3921 237 2753 10001 4187 353 2756
Russia 58 42 5259 3195 15 35 5487 3147
Other CIS 464 268 1777 247 366 254 1636 180
Iraq - 35 3238 17 ‡ 24 3554 30
Kuwait 2 15 1939 551 ‡ 17 2069 521
Saudi Arabia ‡ 153 7214 803 ‡ 152 7517 1009
United Arab Emirates 8 343 2518 1133 23 509 2468 1268
Other Middle East 526 404 3163 887 480 446 4069 1013
North Africa 168 737 1218 499 88 717 1165 518
West Africa 17 655 4753 153 14 686 4335 151
East & S. Africa 401 653 177 56 425 524 138 49
Australasia 497 509 211 81 408 575 189 81
China 6751 1582 36 757 7663 1553 58 959
Public Record Exhibit 3
81

India 3881 476 3 1184 4252 625 ‡ 1291
Japan 3392 939 6 306 3364 815 ‡ 307
Singapore 921 2630 2 1834 963 2531 2 1954
Other Asia Pacific 5204 3433 786 2174 5397 3872 822 2159
Total World 40885 22089 40885 22089 42413 23041 42413 23041
† Less than 0.05. ‡ Less than 0.5.
Notes: Bunkers are not included as exports. Intra-area movements (for example, between countries in Europe) are excluded.
Crude imports and exports include condensates.
Public Record Exhibit 3
82

Natural gas Total proved reserves at end 1996 at end 2006 at end 2015 at end 2016
Trillion Trillion Trillion Trillion Trillion
cubic cubic cubic cubic cubic Share R/P
metres metres metres metres feet of total ratio
US 4.7 6.0 8.7 8.7 307.7 4.7% 11.6
Canada 1.9 1.6 2.2 2.2 76.7 1.2% 14.3
Mexico 1.8 0.4 0.2 0.2 8.6 0.1% 5.2
Total North America 8.5 8.0 11.1 11.1 393.0 6.0% 11.7
Argentina 0.6 0.4 0.4 0.4 12.4 0.2% 9.2
Bolivia 0.1 0.7 0.3 0.3 9.9 0.2% 14.2
Brazil 0.2 0.3 0.4 0.4 13.1 0.2% 15.8
Colombia 0.2 0.1 0.1 0.1 4.4 0.1% 11.9
Peru 0.2 0.3 0.4 0.4 14.1 0.2% 28.5
Trinidad & Tobago 0.5 0.5 0.3 0.3 10.6 0.2% 8.7
Venezuela 4.1 4.7 5.7 5.7 201.3 3.1% 166.3
Other S. & Cent. America 0.1 0.1 0.1 0.1 2.2 ♦ 26.7
Total S. & Cent. America 6.0 7.2 7.7 7.6 268.0 4.1% 42.9
Azerbaijan n/a 0.9 1.1 1.1 40.6 0.6% 65.8
Denmark 0.1 0.1 ^ ^ 0.5 ♦ 2.9
Germany 0.2 0.1 ^ ^ 1.2 ♦ 5.3
Italy 0.3 0.1 ^ ^ 1.2 ♦ 6.6
Kazakhstan n/a 1.3 1.0 1.0 34.0 0.5% 48.3
Netherlands 1.6 1.2 0.7 0.7 24.6 0.4% 17.4
Norway 1.5 2.3 1.9 1.8 62.3 0.9% 15.1
Poland 0.1 0.1 0.1 0.1 3.2 ♦ 23.0
Romania 0.4 0.6 0.1 0.1 3.9 0.1% 12.0
Russian Federation 30.9 31.2 32.3 32.3 1139.6 17.3% 55.7
Turkmenistan n/a 2.3 17.5 17.5 617.3 9.4% 261.7
Ukraine n/a 0.7 0.6 0.6 20.9 0.3% 33.2
United Kingdom 0.8 0.4 0.2 0.2 7.3 0.1% 5.0
Uzbekistan n/a 1.2 1.1 1.1 38.3 0.6% 17.3
Other Europe & Eurasia 0.2 0.2 0.2 0.2 7.2 0.1% 23.2
Total Europe & Eurasia 39.8 42.8 56.8 56.7 2002.0 30.4% 56.7
Bahrain 0.1 0.1 0.2 0.2 5.8 0.1% 10.5
Iran 23.0 26.9 33.5 33.5 1183.0 18.0% 165.5
Iraq 3.4 3.2 3.7 3.7 130.5 2.0% *
Israel ^ ^ 0.2 0.2 5.5 0.1% 16.8
Kuwait 1.5 1.8 1.8 1.8 63.0 1.0% 104.2
Oman 0.6 1.0 0.7 0.7 24.9 0.4% 19.9
Qatar 8.5 25.5 24.3 24.3 858.1 13.0% 134.1
Saudi Arabia 5.7 7.1 8.4 8.4 297.6 4.5% 77.0
Syria 0.2 0.3 0.3 0.3 10.1 0.2% 79.1
United Arab Emirates 5.8 6.4 6.1 6.1 215.1 3.3% 98.5
Yemen 0.3 0.3 0.3 0.3 9.4 0.1% 365.8
Other Middle East ^ ^ ^ ^ 0.2 ♦ 52.6
Total Middle East 49.2 72.6 79.4 79.4 2803.2 42.5% 124.5
Algeria 3.7 4.5 4.5 4.5 159.1 2.4% 49.3
Egypt 0.8 2.0 1.8 1.8 65.2 1.0% 44.1
Public Record Exhibit 3
83

Libya 1.3 1.4 1.5 1.5 53.1 0.8% 149.2
Nigeria 3.5 5.2 5.3 5.3 186.6 2.8% 117.7
Other Africa 0.8 1.2 1.1 1.1 39.3 0.6% 54.9
Total Africa 10.2 14.4 14.2 14.3 503.3 7.6% 68.4
Australia 1.3 2.3 3.5 3.5 122.6 1.9% 38.1
Bangladesh 0.3 0.4 0.2 0.2 7.3 0.1% 7.5
Brunei 0.4 0.3 0.3 0.3 9.7 0.1% 24.6
China 1.2 1.7 4.8 5.4 189.5 2.9% 38.8
India 0.6 1.1 1.3 1.2 43.3 0.7% 44.4
Indonesia 2.0 2.6 2.8 2.9 101.2 1.5% 41.1
Malaysia 2.4 2.5 1.2 1.2 41.3 0.6% 15.8
Myanmar 0.3 0.5 0.5 1.2 42.0 0.6% 63.0
Pakistan 0.6 0.8 0.5 0.5 16.0 0.2% 10.9
Papua New Guinea ^ ^ 0.1 0.2 7.4 0.1% 20.1
Thailand 0.2 0.3 0.2 0.2 7.3 0.1% 5.4
Vietnam 0.2 0.2 0.6 0.6 21.8 0.3% 57.6
Other Asia Pacific 0.4 0.4 0.3 0.3 9.8 0.1% 13.7
Total Asia Pacific 9.9 13.2 16.2 17.5 619.3 9.4% 30.2
Total World 123.5 158.2 185.4 186.6 6588.8 100.0% 52.5
of which: OECD 14.7 14.9 17.9 17.8 629.1 9.5% 13.9
Non-OECD 108.9 143.3 167.5 168.8 5959.7 90.5% 74.3
European Union 3.6 2.8 1.3 1.3 45.3 0.7% 10.8
CIS 30.9 37.6 53.6 53.6 1891.8 28.7% 70.1
* More than 500 years.
^ Less than 0.05.
w Less than 0.05%.
n/a. not available.
Notes: Total proved reserves of natural gas - Generally taken to be those quantities that geological and engineering information indicates with reasonable certainty
can be recovered in the future from known reservoirs under existing economic and operating conditions. The data series for total proved natural gas does not necessarily
meet the definitions, guidelines and practices used for determining proved reserves at company level, for instance as published by the US Securities and Exchange Commission,
nor does it necessarily represent BP’s view of proved reserves by country.
Reserves-to-production (R/P) ratio - If the reserves remaining at the end of any year are divided by the production in that year, the result is the length of time
that those remaining reserves would last if production were to continue at that rate.
Source of data - The estimates in this table have been compiled using a combination of primary official sources and third-party data from Cedigaz and the OPEC Secretariat.
Public Record Exhibit 3
84

Natural Gas: Proved reservesShare
Trillion cubic metres 2012 2013 2014 2015 2016 2016 2005-15 2016
US 8.7 9.6 10.4 8.7 8.7 - 4.2% 4.7%
Canada 2.0 2.0 2.0 2.2 2.2 - 2.9% 1.2%
Mexico 0.4 0.3 0.3 0.2 0.2 - -5.0% 0.1%
Total North America 11.1 12.0 12.8 11.1 11.1 - 3.6% 6.0%
Argentina 0.3 0.3 0.3 0.4 0.4 - -2.2% 0.2%
Bolivia 0.3 0.3 0.3 0.3 0.3 - -9.4% 0.2%
Brazil 0.5 0.5 0.5 0.4 0.4 -12.2% 3.4% 0.2%
Colombia 0.2 0.2 0.1 0.1 0.1 - 0.9% 0.1%
Peru 0.4 0.4 0.4 0.4 0.4 - 1.8% 0.2%
Trinidad & Tobago 0.4 0.3 0.3 0.3 0.3 -7.9% -4.8% 0.2%
Venezuela 5.6 5.6 5.6 5.7 5.7 - 2.8% 3.1%
Other S. & Cent. America 0.1 0.1 0.1 0.1 0.1 -0.1% -0.5% ♦
Total S. & Cent. America 7.7 7.6 7.6 7.7 7.6 -1.0% 1.1% 4.1%
Azerbaijan 0.9 0.9 1.2 1.1 1.1 - 2.9% 0.6%
Denmark ^ ^ ^ ^ ^ -23.5% -17.9% ♦
Germany 0.1 0.1 ^ ^ ^ -9.3% -13.0% ♦
Italy 0.1 0.1 ^ ^ ^ -22.4% -8.3% ♦
Kazakhstan 0.8 0.9 0.9 1.0 1.0 - -2.8% 0.5%
Netherlands 0.8 0.8 0.7 0.7 0.7 - -5.9% 0.4%
Norway 2.1 2.0 1.9 1.9 1.8 -5.0% -2.4% 0.9%
Poland 0.1 0.1 0.1 0.1 0.1 - -0.6% ♦
Romania 0.1 0.1 0.1 0.1 0.1 - -16.0% 0.1%
Russian Federation 32.0 32.3 32.4 32.3 32.3 - 0.3% 17.3%
Turkmenistan 17.5 17.5 17.5 17.5 17.5 - 22.3% 9.4%
Ukraine 0.6 0.6 0.6 0.6 0.6 -2.1% -1.4% 0.3%
United Kingdom 0.2 0.2 0.2 0.2 0.2 - -8.1% 0.1%
USSR n/a n/a n/a n/a n/a n/a n/a n/a
Uzbekistan 1.1 1.1 1.1 1.1 1.1 - -0.8% 0.6%
Other Europe & Eurasia 0.2 0.2 0.2 0.2 0.2 5.8% -1.3% 0.1%
Total Europe & Eurasia 56.6 56.9 57.0 56.8 56.7 -0.2% 2.8% 30.4%
Bahrain 0.2 0.2 0.2 0.2 0.2 -5.2% 6.7% 0.1%
Iran 33.8 34.0 34.0 33.5 33.5 - 2.0% 18.0%
Iraq 3.6 3.6 3.7 3.7 3.7 - 1.5% 2.0%
Israel 0.2 0.2 0.2 0.2 0.2 -13.9% 14.9% 0.1%
Kuwait 1.8 1.8 1.8 1.8 1.8 - 1.3% 1.0%
Oman 0.5 0.7 0.7 0.7 0.7 - -3.4% 0.4%
Qatar 24.9 24.7 24.5 24.3 24.3 - -0.5% 13.0%
Saudi Arabia 8.1 8.2 8.3 8.4 8.4 - 2.1% 4.5%
Syria 0.3 0.3 0.3 0.3 0.3 - -0.2% 0.2%
United Arab Emirates 6.1 6.1 6.1 6.1 6.1 - ♦ 3.3%
Yemen 0.3 0.3 0.3 0.3 0.3 - -1.9% 0.1%
Other Middle East ^ ^ ^ ^ ^ - 0.1% ♦
Total Middle East 79.7 80.0 80.1 79.4 79.4 ♦ 0.9% 42.5%
Algeria 4.5 4.5 4.5 4.5 4.5 - ♦ 2.4%
Egypt 2.0 1.8 1.8 1.8 1.8 - -0.3% 1.0%
Libya 1.5 1.5 1.5 1.5 1.5 ♦ 1.4% 0.8%
Growth rate per annum
Public Record Exhibit 3
85

Nigeria 5.1 5.1 5.3 5.3 5.3 - 0.3% 2.8%
Other Africa 1.2 1.2 1.2 1.1 1.1 1.3% -0.8% 0.6%
Total Africa 14.4 14.2 14.3 14.2 14.3 0.1% 0.1% 7.6%
Australia 3.5 3.5 3.5 3.5 3.5 - 4.5% 1.9%
Bangladesh 0.3 0.3 0.2 0.2 0.2 - -6.6% 0.1%
Brunei 0.3 0.3 0.3 0.3 0.3 - -2.1% 0.1%
China 3.2 3.5 3.7 4.8 5.4 11.9% 11.7% 2.9%
India 1.3 1.4 1.4 1.3 1.2 -2.0% 1.3% 0.7%
Indonesia 2.9 2.9 2.8 2.8 2.9 3.3% 1.1% 1.5%
Malaysia 1.1 1.1 1.2 1.2 1.2 - -7.2% 0.6%
Myanmar 0.3 0.5 0.5 0.5 1.2 125.0% -0.2% 0.6%
Pakistan 0.6 0.6 0.5 0.5 0.5 - -6.1% 0.2%
Papua New Guinea 0.2 0.2 0.2 0.1 0.2 48.9% 50.2% 0.1%
Thailand 0.3 0.2 0.2 0.2 0.2 - -3.8% 0.1%
Vietnam 0.6 0.6 0.6 0.6 0.6 - 10.9% 0.3%
Other Asia Pacific 0.3 0.3 0.3 0.3 0.3 -0.1% -3.9% 0.1%
Total Asia Pacific 14.8 15.2 15.4 16.2 17.5 8.4% 2.2% 9.4%
Total World 184.3 185.8 187.2 185.4 186.6 0.6% 1.7% 100.0%
of which: OECD 18.3 19.1 19.6 17.9 17.8 -0.7% 1.8% 9.5%
Non-OECD 166.0 166.7 167.5 167.5 168.8 0.8% 1.6% 90.5%
European Union 1.5 1.4 1.3 1.3 1.3 -1.5% -8.0% 0.7%
CIS 53.0 53.3 53.7 53.6 53.6 ♦ 3.6% 28.7%
^ Less than 0.05.
w Less than 0.05%. 1.2
n/a not available.
Notes: Total proved reserves of natural gas - Generally taken to be those quantities that geological and engineering information indicates with reasonable certainty
can be recovered in the future from known reservoirs under existing economic and operating conditions. The data series for natural gas does not necessarily
meet the definitions, guidelines and practices used for determining proved reserves at company level, for instance as published by the US Securities and Exchange Commission,
nor does it necessarily represent BP’s view of proved reserves by country.
Reserves-to-production (R/P) ratio - If the reserves remaining at the end of any year are divided by the production in that year, the result is the length of time
that those remaining reserves would last if production were to continue at that rate.
Source of data - The estimates in this table have been compiled using a combination of primary official sources and third-party data from Cedigaz and the OPEC Secretariat.
Annual changes and share of total are calculated using trillion cubic metres.
Public Record Exhibit 3
86
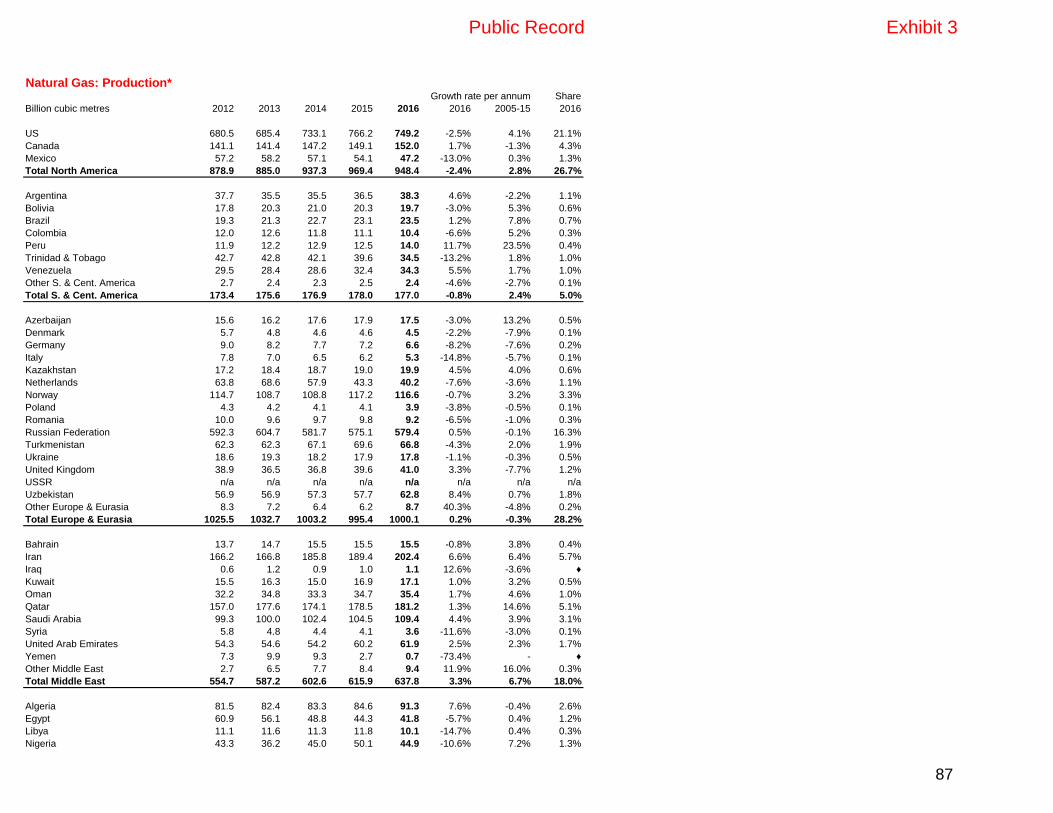
Natural Gas: Production*Share
Billion cubic metres 2012 2013 2014 2015 2016 2016 2005-15 2016
US 680.5 685.4 733.1 766.2 749.2 -2.5% 4.1% 21.1%
Canada 141.1 141.4 147.2 149.1 152.0 1.7% -1.3% 4.3%
Mexico 57.2 58.2 57.1 54.1 47.2 -13.0% 0.3% 1.3%
Total North America 878.9 885.0 937.3 969.4 948.4 -2.4% 2.8% 26.7%
Argentina 37.7 35.5 35.5 36.5 38.3 4.6% -2.2% 1.1%
Bolivia 17.8 20.3 21.0 20.3 19.7 -3.0% 5.3% 0.6%
Brazil 19.3 21.3 22.7 23.1 23.5 1.2% 7.8% 0.7%
Colombia 12.0 12.6 11.8 11.1 10.4 -6.6% 5.2% 0.3%
Peru 11.9 12.2 12.9 12.5 14.0 11.7% 23.5% 0.4%
Trinidad & Tobago 42.7 42.8 42.1 39.6 34.5 -13.2% 1.8% 1.0%
Venezuela 29.5 28.4 28.6 32.4 34.3 5.5% 1.7% 1.0%
Other S. & Cent. America 2.7 2.4 2.3 2.5 2.4 -4.6% -2.7% 0.1%
Total S. & Cent. America 173.4 175.6 176.9 178.0 177.0 -0.8% 2.4% 5.0%
Azerbaijan 15.6 16.2 17.6 17.9 17.5 -3.0% 13.2% 0.5%
Denmark 5.7 4.8 4.6 4.6 4.5 -2.2% -7.9% 0.1%
Germany 9.0 8.2 7.7 7.2 6.6 -8.2% -7.6% 0.2%
Italy 7.8 7.0 6.5 6.2 5.3 -14.8% -5.7% 0.1%
Kazakhstan 17.2 18.4 18.7 19.0 19.9 4.5% 4.0% 0.6%
Netherlands 63.8 68.6 57.9 43.3 40.2 -7.6% -3.6% 1.1%
Norway 114.7 108.7 108.8 117.2 116.6 -0.7% 3.2% 3.3%
Poland 4.3 4.2 4.1 4.1 3.9 -3.8% -0.5% 0.1%
Romania 10.0 9.6 9.7 9.8 9.2 -6.5% -1.0% 0.3%
Russian Federation 592.3 604.7 581.7 575.1 579.4 0.5% -0.1% 16.3%
Turkmenistan 62.3 62.3 67.1 69.6 66.8 -4.3% 2.0% 1.9%
Ukraine 18.6 19.3 18.2 17.9 17.8 -1.1% -0.3% 0.5%
United Kingdom 38.9 36.5 36.8 39.6 41.0 3.3% -7.7% 1.2%
USSR n/a n/a n/a n/a n/a n/a n/a n/a
Uzbekistan 56.9 56.9 57.3 57.7 62.8 8.4% 0.7% 1.8%
Other Europe & Eurasia 8.3 7.2 6.4 6.2 8.7 40.3% -4.8% 0.2%
Total Europe & Eurasia 1025.5 1032.7 1003.2 995.4 1000.1 0.2% -0.3% 28.2%
Bahrain 13.7 14.7 15.5 15.5 15.5 -0.8% 3.8% 0.4%
Iran 166.2 166.8 185.8 189.4 202.4 6.6% 6.4% 5.7%
Iraq 0.6 1.2 0.9 1.0 1.1 12.6% -3.6% ♦
Kuwait 15.5 16.3 15.0 16.9 17.1 1.0% 3.2% 0.5%
Oman 32.2 34.8 33.3 34.7 35.4 1.7% 4.6% 1.0%
Qatar 157.0 177.6 174.1 178.5 181.2 1.3% 14.6% 5.1%
Saudi Arabia 99.3 100.0 102.4 104.5 109.4 4.4% 3.9% 3.1%
Syria 5.8 4.8 4.4 4.1 3.6 -11.6% -3.0% 0.1%
United Arab Emirates 54.3 54.6 54.2 60.2 61.9 2.5% 2.3% 1.7%
Yemen 7.3 9.9 9.3 2.7 0.7 -73.4% - ♦
Other Middle East 2.7 6.5 7.7 8.4 9.4 11.9% 16.0% 0.3%
Total Middle East 554.7 587.2 602.6 615.9 637.8 3.3% 6.7% 18.0%
Algeria 81.5 82.4 83.3 84.6 91.3 7.6% -0.4% 2.6%
Egypt 60.9 56.1 48.8 44.3 41.8 -5.7% 0.4% 1.2%
Libya 11.1 11.6 11.3 11.8 10.1 -14.7% 0.4% 0.3%
Nigeria 43.3 36.2 45.0 50.1 44.9 -10.6% 7.2% 1.3%
Growth rate per annum
Public Record Exhibit 3
87
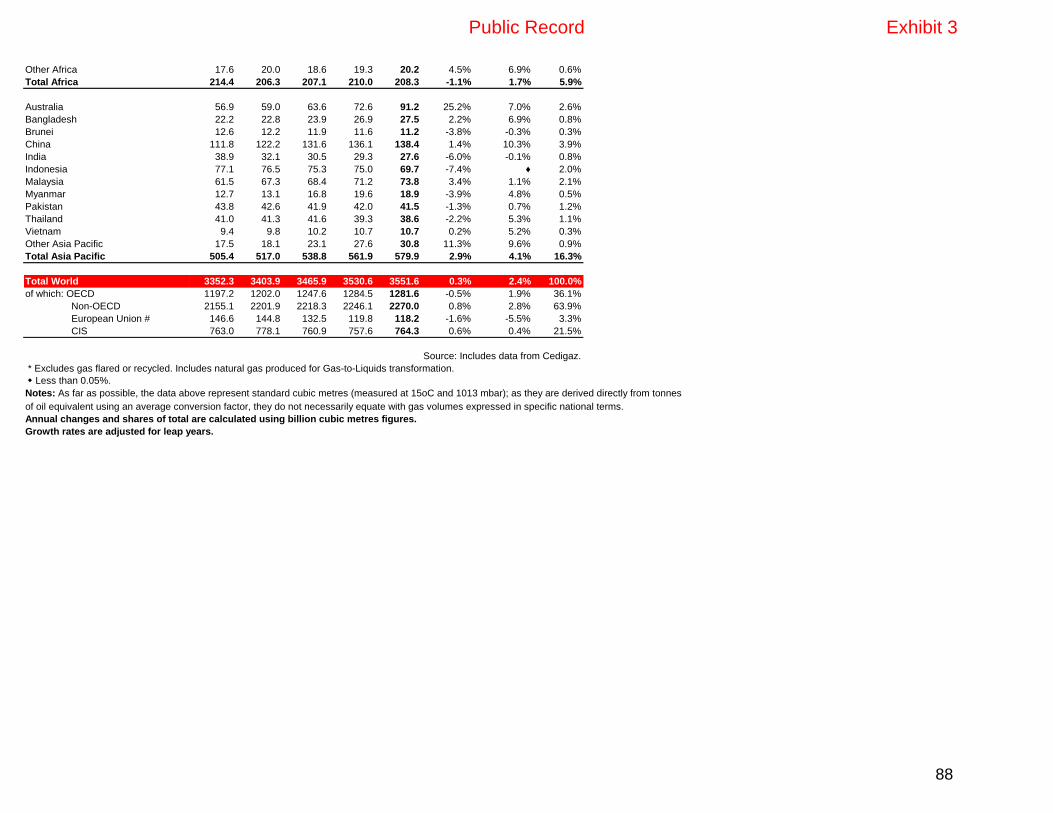
Other Africa 17.6 20.0 18.6 19.3 20.2 4.5% 6.9% 0.6%
Total Africa 214.4 206.3 207.1 210.0 208.3 -1.1% 1.7% 5.9%
Australia 56.9 59.0 63.6 72.6 91.2 25.2% 7.0% 2.6%
Bangladesh 22.2 22.8 23.9 26.9 27.5 2.2% 6.9% 0.8%
Brunei 12.6 12.2 11.9 11.6 11.2 -3.8% -0.3% 0.3%
China 111.8 122.2 131.6 136.1 138.4 1.4% 10.3% 3.9%
India 38.9 32.1 30.5 29.3 27.6 -6.0% -0.1% 0.8%
Indonesia 77.1 76.5 75.3 75.0 69.7 -7.4% ♦ 2.0%
Malaysia 61.5 67.3 68.4 71.2 73.8 3.4% 1.1% 2.1%
Myanmar 12.7 13.1 16.8 19.6 18.9 -3.9% 4.8% 0.5%
Pakistan 43.8 42.6 41.9 42.0 41.5 -1.3% 0.7% 1.2%
Thailand 41.0 41.3 41.6 39.3 38.6 -2.2% 5.3% 1.1%
Vietnam 9.4 9.8 10.2 10.7 10.7 0.2% 5.2% 0.3%
Other Asia Pacific 17.5 18.1 23.1 27.6 30.8 11.3% 9.6% 0.9%
Total Asia Pacific 505.4 517.0 538.8 561.9 579.9 2.9% 4.1% 16.3%
Total World 3352.3 3403.9 3465.9 3530.6 3551.6 0.3% 2.4% 100.0%
of which: OECD 1197.2 1202.0 1247.6 1284.5 1281.6 -0.5% 1.9% 36.1%
Non-OECD 2155.1 2201.9 2218.3 2246.1 2270.0 0.8% 2.8% 63.9%
European Union # 146.6 144.8 132.5 119.8 118.2 -1.6% -5.5% 3.3%
CIS 763.0 778.1 760.9 757.6 764.3 0.6% 0.4% 21.5%
Source: Includes data from Cedigaz.
* Excludes gas flared or recycled. Includes natural gas produced for Gas-to-Liquids transformation.
w Less than 0.05%.
Notes: As far as possible, the data above represent standard cubic metres (measured at 15oC and 1013 mbar); as they are derived directly from tonnes
of oil equivalent using an average conversion factor, they do not necessarily equate with gas volumes expressed in specific national terms.
Annual changes and shares of total are calculated using billion cubic metres figures.
Growth rates are adjusted for leap years.
Public Record Exhibit 3
88
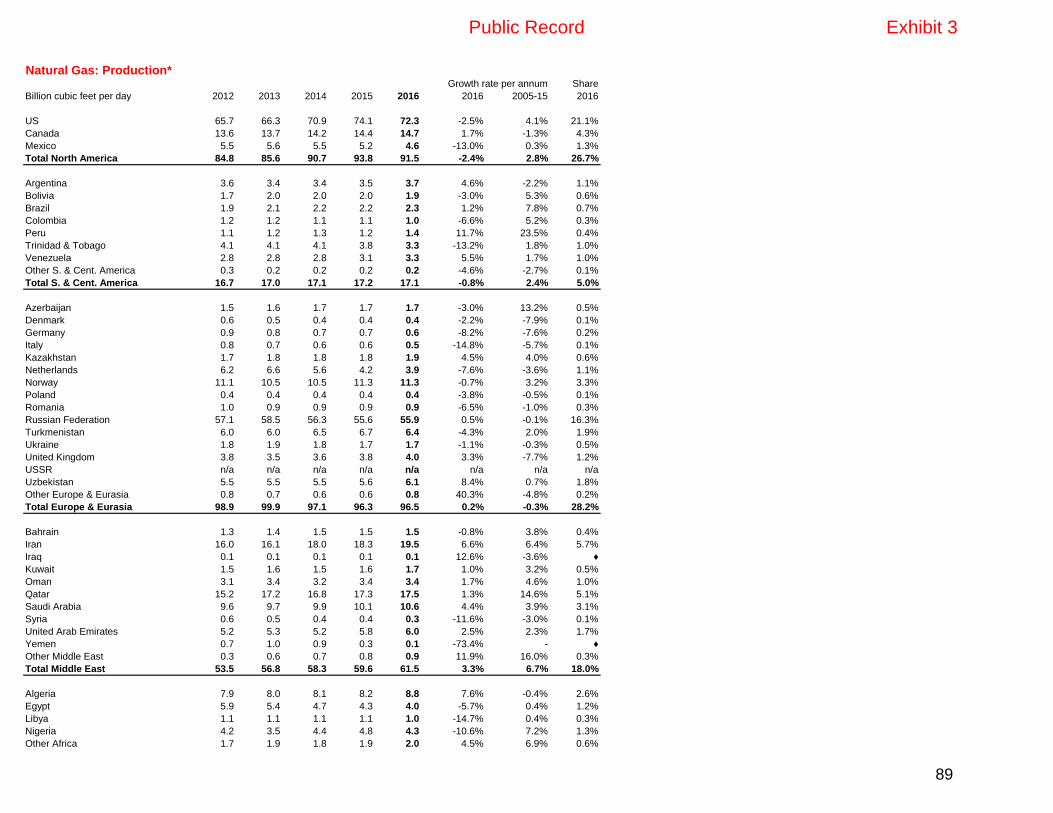
Natural Gas: Production*Share
Billion cubic feet per day 2012 2013 2014 2015 2016 2016 2005-15 2016
US 65.7 66.3 70.9 74.1 72.3 -2.5% 4.1% 21.1%
Canada 13.6 13.7 14.2 14.4 14.7 1.7% -1.3% 4.3%
Mexico 5.5 5.6 5.5 5.2 4.6 -13.0% 0.3% 1.3%
Total North America 84.8 85.6 90.7 93.8 91.5 -2.4% 2.8% 26.7%
Argentina 3.6 3.4 3.4 3.5 3.7 4.6% -2.2% 1.1%
Bolivia 1.7 2.0 2.0 2.0 1.9 -3.0% 5.3% 0.6%
Brazil 1.9 2.1 2.2 2.2 2.3 1.2% 7.8% 0.7%
Colombia 1.2 1.2 1.1 1.1 1.0 -6.6% 5.2% 0.3%
Peru 1.1 1.2 1.3 1.2 1.4 11.7% 23.5% 0.4%
Trinidad & Tobago 4.1 4.1 4.1 3.8 3.3 -13.2% 1.8% 1.0%
Venezuela 2.8 2.8 2.8 3.1 3.3 5.5% 1.7% 1.0%
Other S. & Cent. America 0.3 0.2 0.2 0.2 0.2 -4.6% -2.7% 0.1%
Total S. & Cent. America 16.7 17.0 17.1 17.2 17.1 -0.8% 2.4% 5.0%
Azerbaijan 1.5 1.6 1.7 1.7 1.7 -3.0% 13.2% 0.5%
Denmark 0.6 0.5 0.4 0.4 0.4 -2.2% -7.9% 0.1%
Germany 0.9 0.8 0.7 0.7 0.6 -8.2% -7.6% 0.2%
Italy 0.8 0.7 0.6 0.6 0.5 -14.8% -5.7% 0.1%
Kazakhstan 1.7 1.8 1.8 1.8 1.9 4.5% 4.0% 0.6%
Netherlands 6.2 6.6 5.6 4.2 3.9 -7.6% -3.6% 1.1%
Norway 11.1 10.5 10.5 11.3 11.3 -0.7% 3.2% 3.3%
Poland 0.4 0.4 0.4 0.4 0.4 -3.8% -0.5% 0.1%
Romania 1.0 0.9 0.9 0.9 0.9 -6.5% -1.0% 0.3%
Russian Federation 57.1 58.5 56.3 55.6 55.9 0.5% -0.1% 16.3%
Turkmenistan 6.0 6.0 6.5 6.7 6.4 -4.3% 2.0% 1.9%
Ukraine 1.8 1.9 1.8 1.7 1.7 -1.1% -0.3% 0.5%
United Kingdom 3.8 3.5 3.6 3.8 4.0 3.3% -7.7% 1.2%
USSR n/a n/a n/a n/a n/a n/a n/a n/a
Uzbekistan 5.5 5.5 5.5 5.6 6.1 8.4% 0.7% 1.8%
Other Europe & Eurasia 0.8 0.7 0.6 0.6 0.8 40.3% -4.8% 0.2%
Total Europe & Eurasia 98.9 99.9 97.1 96.3 96.5 0.2% -0.3% 28.2%
Bahrain 1.3 1.4 1.5 1.5 1.5 -0.8% 3.8% 0.4%
Iran 16.0 16.1 18.0 18.3 19.5 6.6% 6.4% 5.7%
Iraq 0.1 0.1 0.1 0.1 0.1 12.6% -3.6% ♦
Kuwait 1.5 1.6 1.5 1.6 1.7 1.0% 3.2% 0.5%
Oman 3.1 3.4 3.2 3.4 3.4 1.7% 4.6% 1.0%
Qatar 15.2 17.2 16.8 17.3 17.5 1.3% 14.6% 5.1%
Saudi Arabia 9.6 9.7 9.9 10.1 10.6 4.4% 3.9% 3.1%
Syria 0.6 0.5 0.4 0.4 0.3 -11.6% -3.0% 0.1%
United Arab Emirates 5.2 5.3 5.2 5.8 6.0 2.5% 2.3% 1.7%
Yemen 0.7 1.0 0.9 0.3 0.1 -73.4% - ♦
Other Middle East 0.3 0.6 0.7 0.8 0.9 11.9% 16.0% 0.3%
Total Middle East 53.5 56.8 58.3 59.6 61.5 3.3% 6.7% 18.0%
Algeria 7.9 8.0 8.1 8.2 8.8 7.6% -0.4% 2.6%
Egypt 5.9 5.4 4.7 4.3 4.0 -5.7% 0.4% 1.2%
Libya 1.1 1.1 1.1 1.1 1.0 -14.7% 0.4% 0.3%
Nigeria 4.2 3.5 4.4 4.8 4.3 -10.6% 7.2% 1.3%
Other Africa 1.7 1.9 1.8 1.9 2.0 4.5% 6.9% 0.6%
Growth rate per annum
Public Record Exhibit 3
89

Total Africa 20.7 20.0 20.0 20.3 20.1 -1.1% 1.7% 5.9%
Australia 5.5 5.7 6.2 7.0 8.8 25.2% 7.0% 2.6%
Bangladesh 2.1 2.2 2.3 2.6 2.7 2.2% 6.9% 0.8%
Brunei 1.2 1.2 1.1 1.1 1.1 -3.8% -0.3% 0.3%
China 10.8 11.8 12.7 13.2 13.4 1.4% 10.3% 3.9%
India 3.8 3.1 3.0 2.8 2.7 -6.0% -0.1% 0.8%
Indonesia 7.4 7.4 7.3 7.3 6.7 -7.4% ♦ 2.0%
Malaysia 5.9 6.5 6.6 6.9 7.1 3.4% 1.1% 2.1%
Myanmar 1.2 1.3 1.6 1.9 1.8 -3.9% 4.8% 0.5%
Pakistan 4.2 4.1 4.1 4.1 4.0 -1.3% 0.7% 1.2%
Thailand 4.0 4.0 4.0 3.8 3.7 -2.2% 5.3% 1.1%
Vietnam 0.9 0.9 1.0 1.0 1.0 0.2% 5.2% 0.3%
Other Asia Pacific 1.7 1.8 2.2 2.7 3.0 11.3% 9.6% 0.9%
Total Asia Pacific 48.8 50.0 52.1 54.4 56.0 2.9% 4.1% 16.3%
Total World 323.5 329.3 335.3 341.6 342.7 0.3% 2.4% 100.0%
of which: OECD 115.5 116.3 120.7 124.3 123.7 -0.5% 1.9% 36.1%
Non-OECD 207.9 213.0 214.6 217.3 219.0 0.8% 2.8% 63.9%
European Union # 14.1 14.0 12.8 11.6 11.4 -1.6% -5.5% 3.3%
CIS 73.6 75.3 73.6 73.3 73.7 0.6% 0.4% 21.5%
Source: Includes data from Cedigaz.
* Excludes gas flared or recycled. Includes natural gas produced for Gas-to-Liquids transformation.
^ Less than 0.05.
w Less than 0.05%
n/a not available.
# Excludes Estonia, Latvia and Lithuania prior to 1985 and Slovenia prior to 1990.
Notes: As the data above are derived from tonnes oil equivalent using average conversion factors, they do not necessarily equate with gas volumes expressed in specific national terms.
Annual changes and shares of total are calculated using billion cubic feet per day figures.
Public Record Exhibit 3
90

Natural Gas: Production* Share
Million tonnes oil equivalent 2012 2013 2014 2015 2016 2016 2005-15 2016
US 620.2 626.4 673.3 707.1 690.8 -2.6% 4.2% 21.5%
Canada 127.0 127.3 132.4 134.2 136.8 1.7% -1.3% 4.3%
Mexico 51.5 52.4 51.4 48.7 42.5 -13.0% 0.3% 1.3%
Total North America 798.7 806.1 857.1 890.0 870.1 -2.5% 2.9% 27.1%
Argentina 34.0 32.0 31.9 32.8 34.4 4.6% -2.2% 1.1%
Bolivia 16.0 18.3 18.9 18.2 17.8 -3.0% 5.3% 0.6%
Brazil 17.3 19.2 20.4 20.8 21.1 1.2% 7.8% 0.7%
Colombia 10.8 11.4 10.6 10.0 9.4 -6.6% 5.2% 0.3%
Peru 10.7 11.0 11.6 11.2 12.6 11.7% 23.5% 0.4%
Trinidad & Tobago 38.4 38.6 37.9 35.7 31.0 -13.2% 1.8% 1.0%
Venezuela 26.5 25.6 25.8 29.2 30.9 5.5% 1.7% 1.0%
Other S. & Cent. America 2.4 2.2 2.1 2.2 2.1 -4.6% -2.7% 0.1%
Total S. & Cent. America 156.1 158.1 159.2 160.2 159.3 -0.8% 2.4% 5.0%
Azerbaijan 14.0 14.6 15.8 16.2 15.7 -3.0% 13.2% 0.5%
Denmark 5.2 4.3 4.1 4.1 4.0 -2.2% -7.9% 0.1%
Germany 8.1 7.4 7.0 6.5 6.0 -8.2% -7.6% 0.2%
Italy 7.0 6.3 5.9 5.5 4.7 -14.8% -5.7% 0.1%
Kazakhstan 15.5 16.6 16.9 17.1 17.9 4.5% 4.0% 0.6%
Netherlands 57.4 61.8 52.1 39.0 36.1 -7.6% -3.6% 1.1%
Norway 103.3 97.9 97.9 105.4 105.0 -0.7% 3.2% 3.3%
Poland 3.9 3.8 3.7 3.7 3.6 -3.8% -0.5% 0.1%
Romania 9.0 8.6 8.8 8.8 8.2 -6.5% -1.0% 0.3%
Russian Federation 533.0 544.2 523.6 517.6 521.5 0.5% -0.1% 16.2%
Turkmenistan 56.1 56.1 60.4 62.6 60.1 -4.3% 2.0% 1.9%
Ukraine 16.7 17.3 16.4 16.1 16.0 -1.1% -0.3% 0.5%
United Kingdom 35.0 32.8 33.1 35.6 36.9 3.3% -7.7% 1.1%
USSR n/a n/a n/a n/a n/a n/a n/a n/a
Uzbekistan 51.2 51.2 51.6 52.0 56.5 8.4% 0.7% 1.8%
Other Europe & Eurasia 7.5 6.5 5.7 5.6 7.9 40.3% -4.8% 0.2%
Total Europe & Eurasia 923.0 929.4 902.9 895.9 900.1 0.2% -0.3% 28.0%
Bahrain 12.4 13.2 13.9 14.0 13.9 -0.8% 3.8% 0.4%
Iran 149.5 150.1 167.3 170.4 182.2 6.6% 6.4% 5.7%
Iraq 0.6 1.1 0.8 0.9 1.0 12.6% -3.6% ♦
Kuwait 14.0 14.7 13.5 15.2 15.4 1.0% 3.2% 0.5%
Oman 29.0 31.3 30.0 31.3 31.9 1.7% 4.6% 1.0%
Qatar 141.3 159.8 156.7 160.6 163.1 1.3% 14.6% 5.1%
Saudi Arabia 89.4 90.0 92.1 94.0 98.4 4.4% 3.9% 3.1%
Syria 5.2 4.3 4.0 3.7 3.2 -11.6% -3.0% 0.1%
United Arab Emirates 48.9 49.1 48.8 54.2 55.7 2.5% 2.3% 1.7%
Yemen 6.5 8.9 8.4 2.5 0.7 -73.4% - ♦
Other Middle East 2.4 5.9 6.9 7.6 8.5 11.9% 16.0% 0.3%
Total Middle East 499.2 528.5 542.4 554.3 574.0 3.3% 6.7% 17.9%
Algeria 73.4 74.2 75.0 76.1 82.2 7.6% -0.4% 2.6%
Egypt 54.8 50.5 43.9 39.8 37.6 -5.7% 0.4% 1.2%
Libya 10.0 10.5 10.2 10.6 9.1 -14.7% 0.4% 0.3%
Nigeria 39.0 32.6 40.5 45.1 40.4 -10.6% 7.2% 1.3%
Growth rate per annum
Public Record Exhibit 3
91
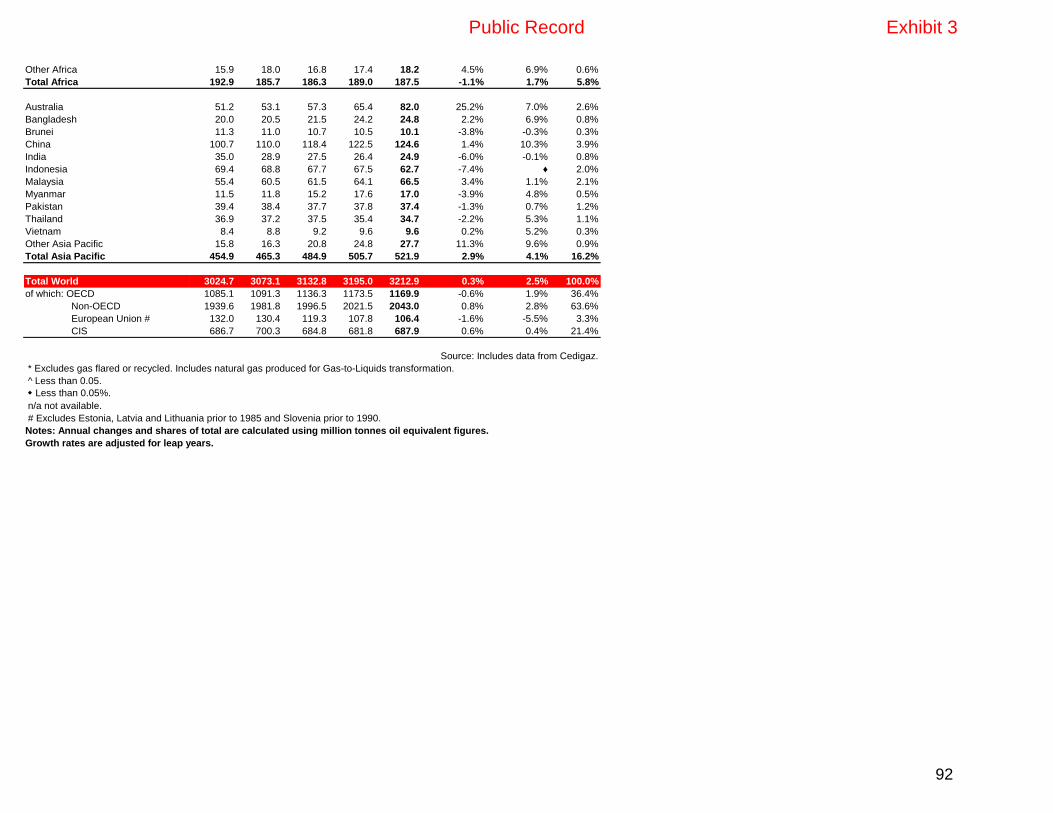
Other Africa 15.9 18.0 16.8 17.4 18.2 4.5% 6.9% 0.6%
Total Africa 192.9 185.7 186.3 189.0 187.5 -1.1% 1.7% 5.8%
Australia 51.2 53.1 57.3 65.4 82.0 25.2% 7.0% 2.6%
Bangladesh 20.0 20.5 21.5 24.2 24.8 2.2% 6.9% 0.8%
Brunei 11.3 11.0 10.7 10.5 10.1 -3.8% -0.3% 0.3%
China 100.7 110.0 118.4 122.5 124.6 1.4% 10.3% 3.9%
India 35.0 28.9 27.5 26.4 24.9 -6.0% -0.1% 0.8%
Indonesia 69.4 68.8 67.7 67.5 62.7 -7.4% ♦ 2.0%
Malaysia 55.4 60.5 61.5 64.1 66.5 3.4% 1.1% 2.1%
Myanmar 11.5 11.8 15.2 17.6 17.0 -3.9% 4.8% 0.5%
Pakistan 39.4 38.4 37.7 37.8 37.4 -1.3% 0.7% 1.2%
Thailand 36.9 37.2 37.5 35.4 34.7 -2.2% 5.3% 1.1%
Vietnam 8.4 8.8 9.2 9.6 9.6 0.2% 5.2% 0.3%
Other Asia Pacific 15.8 16.3 20.8 24.8 27.7 11.3% 9.6% 0.9%
Total Asia Pacific 454.9 465.3 484.9 505.7 521.9 2.9% 4.1% 16.2%
Total World 3024.7 3073.1 3132.8 3195.0 3212.9 0.3% 2.5% 100.0%
of which: OECD 1085.1 1091.3 1136.3 1173.5 1169.9 -0.6% 1.9% 36.4%
Non-OECD 1939.6 1981.8 1996.5 2021.5 2043.0 0.8% 2.8% 63.6%
European Union # 132.0 130.4 119.3 107.8 106.4 -1.6% -5.5% 3.3%
CIS 686.7 700.3 684.8 681.8 687.9 0.6% 0.4% 21.4%
Source: Includes data from Cedigaz.
* Excludes gas flared or recycled. Includes natural gas produced for Gas-to-Liquids transformation.
^ Less than 0.05.
w Less than 0.05%.
n/a not available.
# Excludes Estonia, Latvia and Lithuania prior to 1985 and Slovenia prior to 1990.
Notes: Annual changes and shares of total are calculated using million tonnes oil equivalent figures.
Growth rates are adjusted for leap years.
Public Record Exhibit 3
92

Natural Gas: Consumption in billion cubic metres*Share
Billion cubic metres 2012 2013 2014 2015 2016 2016 2005-15 2016
US 723.2 740.6 753.0 773.2 778.6 0.4% 2.2% 22.0%
Canada 100.2 103.9 104.2 102.5 99.9 -2.8% 0.5% 2.8%
Mexico 79.9 83.3 86.8 87.1 89.5 2.5% 3.6% 2.5%
Total North America 903.3 927.8 944.1 962.8 968.0 0.3% 2.1% 27.3%
Argentina 46.7 46.7 47.2 48.2 49.6 2.7% 1.8% 1.4%
Brazil 31.7 37.3 39.5 41.7 36.6 -12.5% 7.9% 1.0%
Chile 4.6 4.6 3.8 4.1 4.5 11.1% -6.3% 0.1%
Colombia 9.8 10.0 10.9 10.7 10.6 -1.6% 4.8% 0.3%
Ecuador 0.6 0.6 0.7 0.6 0.6 1.5% 6.9% ♦
Peru 6.2 6.0 6.8 7.2 7.9 9.8% 16.8% 0.2%
Trinidad & Tobago 22.2 22.4 22.0 21.5 19.1 -11.4% 2.8% 0.5%
Venezuela 31.4 30.5 30.7 34.5 35.6 2.7% 2.3% 1.0%
Other S. & Cent. America 6.5 7.0 7.3 7.3 7.4 1.1% 8.1% 0.2%
Total S. & Cent. America 159.6 165.2 168.9 175.8 171.9 -2.5% 3.6% 4.9%
Austria 8.9 8.6 7.9 8.3 8.7 4.4% -1.7% 0.2%
Azerbaijan 8.5 8.6 9.4 10.6 10.4 -2.2% 2.2% 0.3%
Belarus 18.5 18.5 18.3 15.6 17.0 9.0% -1.6% 0.5%
Belgium 16.0 15.8 13.8 15.1 15.4 1.8% -0.8% 0.4%
Bulgaria 2.7 2.6 2.6 2.9 3.0 3.9% -0.8% 0.1%
Czech Republic 7.6 7.7 6.9 7.2 7.8 7.9% -1.7% 0.2%
Denmark 3.9 3.7 3.1 3.2 3.2 1.4% -4.4% 0.1%
Finland 3.1 2.8 2.5 2.2 2.0 -9.2% -5.8% 0.1%
France 42.5 43.1 36.2 38.9 42.6 9.0% -1.6% 1.2%
Germany 77.5 81.2 70.6 73.5 80.5 9.2% -1.6% 2.3%
Greece 4.0 3.6 2.7 2.8 2.8 0.6% 0.5% 0.1%
Hungary 9.3 8.7 7.8 8.3 8.9 7.0% -4.7% 0.3%
Ireland 4.5 4.3 4.1 4.2 4.8 14.0% 0.8% 0.1%
Italy 68.2 63.8 56.3 61.4 64.5 4.7% -2.5% 1.8%
Kazakhstan 10.8 11.2 12.5 12.9 13.4 3.8% 6.3% 0.4%
Lithuania 2.9 2.4 2.3 2.3 2.0 -11.1% -1.8% 0.1%
Netherlands 36.0 36.5 31.8 31.5 33.6 6.4% -2.3% 0.9%
Norway 4.4 4.4 4.7 4.8 4.9 0.4% 0.8% 0.1%
Poland 16.6 16.6 16.3 16.3 17.3 5.7% 1.9% 0.5%
Portugal 4.5 4.3 4.1 4.8 5.2 8.1% 1.2% 0.1%
Romania 12.4 11.3 10.5 9.9 10.6 6.2% -4.3% 0.3%
Russian Federation 416.2 413.5 409.7 402.8 390.9 -3.2% 0.2% 11.0%
Slovakia 4.9 5.3 4.2 4.3 4.4 1.6% -4.1% 0.1%
Spain 31.7 29.0 26.3 27.3 28.0 2.0% -1.9% 0.8%
Sweden 1.0 1.0 0.9 0.9 0.9 10.0% -0.9% ♦
Switzerland 2.9 3.1 2.7 2.9 3.0 4.8% 0.2% 0.1%
Turkey 41.4 42.0 44.6 43.6 42.1 -3.7% 5.0% 1.2%
Turkmenistan 26.3 22.9 25.6 29.4 29.5 ♦ 6.2% 0.8%
Ukraine 49.6 43.3 36.8 28.8 29.0 0.3% -8.4% 0.8%
United Kingdom 73.9 73.0 66.7 68.1 76.7 12.2% -3.3% 2.2%
USSR n/a n/a n/a n/a n/a n/a n/a n/a
Uzbekistan 47.2 46.8 48.8 50.2 51.4 2.0% 1.6% 1.4%
Other Europe & Eurasia 16.0 14.9 14.9 15.1 15.5 2.4% 1.4% 0.4%
Total Europe & Eurasia 1074.0 1054.4 1005.6 1010.2 1029.9 1.7% -0.8% 29.1%
Growth rate per annum
Public Record Exhibit 3
93

Iran 161.5 162.9 183.7 190.8 200.8 5.0% 6.4% 5.7%
Israel 2.6 6.9 7.6 8.4 9.7 14.5% 17.8% 0.3%
Kuwait 18.5 18.7 18.5 21.3 21.9 2.5% 5.7% 0.6%
Qatar 23.4 37.9 36.4 43.9 41.7 -5.4% 9.0% 1.2%
Saudi Arabia 99.3 100.0 102.4 104.5 109.4 4.4% 3.9% 3.1%
United Arab Emirates 65.6 66.9 65.9 73.8 76.6 3.6% 5.8% 2.2%
Other Middle East 44.2 46.9 46.3 51.0 52.3 2.3% 5.2% 1.5%
Total Middle East 415.0 440.3 460.8 493.6 512.3 3.5% 5.9% 14.5%
Algeria 31.0 33.4 37.5 39.4 40.0 1.2% 5.4% 1.1%
Egypt 52.6 51.4 48.0 47.8 51.3 7.0% 4.2% 1.4%
South Africa 4.4 4.6 5.0 5.1 5.1 1.3% 4.9% 0.1%
Other Africa 32.6 33.8 36.6 43.5 41.7 -4.4% 4.9% 1.2%
Total Africa 120.6 123.2 127.0 135.8 138.2 1.4% 4.8% 3.9%
Australia 33.8 35.5 38.3 42.9 41.1 -4.4% 6.6% 1.2%
Bangladesh 22.2 22.8 23.9 26.9 27.5 2.2% 6.9% 0.8%
China 150.9 171.9 188.4 194.8 210.3 7.7% 15.0% 5.9%
China Hong Kong SAR 2.8 2.6 2.5 3.2 3.3 2.4% 1.9% 0.1%
India 71.1 49.3 48.8 45.7 50.1 9.2% 2.5% 1.4%
Indonesia 42.2 40.8 40.9 40.4 37.7 -7.0% 1.2% 1.1%
Japan 116.9 116.9 118.0 113.4 111.2 -2.2% 3.7% 3.1%
Malaysia 35.5 40.3 42.2 41.8 43.0 2.7% 1.8% 1.2%
New Zealand 4.2 4.5 4.9 4.5 4.7 4.3% 2.3% 0.1%
Pakistan 43.8 42.6 41.9 43.5 45.5 4.2% 1.1% 1.3%
Philippines 3.7 3.4 3.6 3.3 3.8 14.3% 0.6% 0.1%
Singapore 9.4 10.5 10.9 12.2 12.5 2.5% 6.5% 0.4%
South Korea 50.2 52.5 47.8 43.6 45.5 4.0% 3.7% 1.3%
Taiwan 16.3 16.3 17.2 18.4 19.1 3.6% 6.9% 0.5%
Thailand 46.5 46.7 47.7 48.7 48.3 -1.0% 4.7% 1.4%
Vietnam 9.4 9.8 10.2 10.7 10.7 0.2% 5.2% 0.3%
Other Asia Pacific 6.2 6.4 7.2 7.8 8.0 2.7% 4.0% 0.2%
Total Asia Pacific 665.1 672.9 694.4 701.8 722.5 2.7% 5.6% 20.4%
Total World 3337.7 3383.8 3400.8 3480.1 3542.9 1.5% 2.3% 100.0%
of which: OECD 1580.9 1609.5 1580.6 1611.4 1644.1 1.7% 1.2% 46.4%
Non-OECD 1756.8 1774.4 1820.2 1868.7 1898.8 1.3% 3.4% 53.6%
European Union # 438.6 431.2 383.0 399.1 428.8 7.1% -2.2% 12.1%
CIS 582.9 569.6 566.4 555.4 546.7 -1.8% -0.1% 15.4%
Source: Includes data from Cedigaz.
* Excludes natural gas converted to liquid fuels but includes derivatives of coal as well as natural gas consumed in Gas-to-Liquids transformation.
^ Less than 0.05.
w Less than 0.05%.
n/a not available.
# Excludes Estonia, Latvia and Lithuania prior to 1985 and Slovenia prior to 1990.
Notes: As far as possible, the data above represent standard cubic metres (measured at 15oC and 1013 mbar); as they are derived directly from tonnes
of oil equivalent using an average conversion factor, they do not necessarily equate with gas volumes expressed in specific national terms.
The difference between these world consumption figures and the world production statistics is due to variations in stocks at storage facilities
and liquefaction plants, together with unavoidable disparities in the definition, measurement or conversion of gas supply and demand data.
Annual changes and shares of total are calculated using billion cubic metres figures.
Growth rates are adjusted for leap years.
Public Record Exhibit 3
94
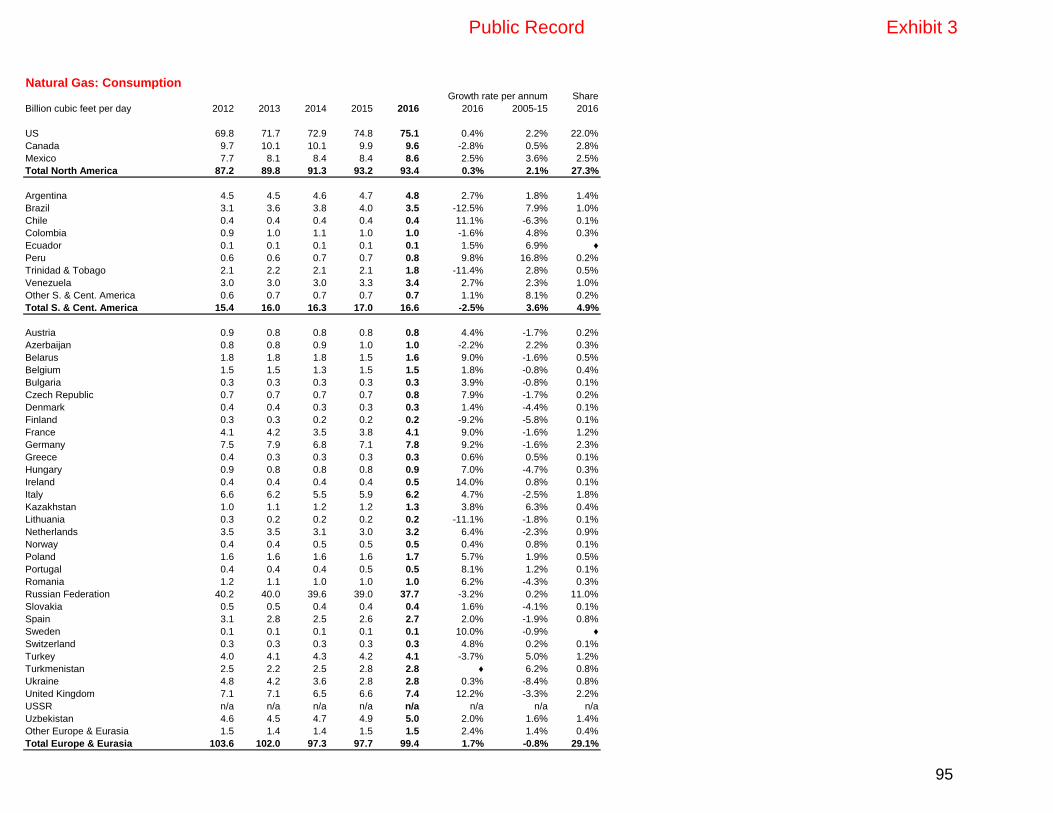
Natural Gas: ConsumptionShare
Billion cubic feet per day 2012 2013 2014 2015 2016 2016 2005-15 2016
US 69.8 71.7 72.9 74.8 75.1 0.4% 2.2% 22.0%
Canada 9.7 10.1 10.1 9.9 9.6 -2.8% 0.5% 2.8%
Mexico 7.7 8.1 8.4 8.4 8.6 2.5% 3.6% 2.5%
Total North America 87.2 89.8 91.3 93.2 93.4 0.3% 2.1% 27.3%
Argentina 4.5 4.5 4.6 4.7 4.8 2.7% 1.8% 1.4%
Brazil 3.1 3.6 3.8 4.0 3.5 -12.5% 7.9% 1.0%
Chile 0.4 0.4 0.4 0.4 0.4 11.1% -6.3% 0.1%
Colombia 0.9 1.0 1.1 1.0 1.0 -1.6% 4.8% 0.3%
Ecuador 0.1 0.1 0.1 0.1 0.1 1.5% 6.9% ♦
Peru 0.6 0.6 0.7 0.7 0.8 9.8% 16.8% 0.2%
Trinidad & Tobago 2.1 2.2 2.1 2.1 1.8 -11.4% 2.8% 0.5%
Venezuela 3.0 3.0 3.0 3.3 3.4 2.7% 2.3% 1.0%
Other S. & Cent. America 0.6 0.7 0.7 0.7 0.7 1.1% 8.1% 0.2%
Total S. & Cent. America 15.4 16.0 16.3 17.0 16.6 -2.5% 3.6% 4.9%
Austria 0.9 0.8 0.8 0.8 0.8 4.4% -1.7% 0.2%
Azerbaijan 0.8 0.8 0.9 1.0 1.0 -2.2% 2.2% 0.3%
Belarus 1.8 1.8 1.8 1.5 1.6 9.0% -1.6% 0.5%
Belgium 1.5 1.5 1.3 1.5 1.5 1.8% -0.8% 0.4%
Bulgaria 0.3 0.3 0.3 0.3 0.3 3.9% -0.8% 0.1%
Czech Republic 0.7 0.7 0.7 0.7 0.8 7.9% -1.7% 0.2%
Denmark 0.4 0.4 0.3 0.3 0.3 1.4% -4.4% 0.1%
Finland 0.3 0.3 0.2 0.2 0.2 -9.2% -5.8% 0.1%
France 4.1 4.2 3.5 3.8 4.1 9.0% -1.6% 1.2%
Germany 7.5 7.9 6.8 7.1 7.8 9.2% -1.6% 2.3%
Greece 0.4 0.3 0.3 0.3 0.3 0.6% 0.5% 0.1%
Hungary 0.9 0.8 0.8 0.8 0.9 7.0% -4.7% 0.3%
Ireland 0.4 0.4 0.4 0.4 0.5 14.0% 0.8% 0.1%
Italy 6.6 6.2 5.5 5.9 6.2 4.7% -2.5% 1.8%
Kazakhstan 1.0 1.1 1.2 1.2 1.3 3.8% 6.3% 0.4%
Lithuania 0.3 0.2 0.2 0.2 0.2 -11.1% -1.8% 0.1%
Netherlands 3.5 3.5 3.1 3.0 3.2 6.4% -2.3% 0.9%
Norway 0.4 0.4 0.5 0.5 0.5 0.4% 0.8% 0.1%
Poland 1.6 1.6 1.6 1.6 1.7 5.7% 1.9% 0.5%
Portugal 0.4 0.4 0.4 0.5 0.5 8.1% 1.2% 0.1%
Romania 1.2 1.1 1.0 1.0 1.0 6.2% -4.3% 0.3%
Russian Federation 40.2 40.0 39.6 39.0 37.7 -3.2% 0.2% 11.0%
Slovakia 0.5 0.5 0.4 0.4 0.4 1.6% -4.1% 0.1%
Spain 3.1 2.8 2.5 2.6 2.7 2.0% -1.9% 0.8%
Sweden 0.1 0.1 0.1 0.1 0.1 10.0% -0.9% ♦
Switzerland 0.3 0.3 0.3 0.3 0.3 4.8% 0.2% 0.1%
Turkey 4.0 4.1 4.3 4.2 4.1 -3.7% 5.0% 1.2%
Turkmenistan 2.5 2.2 2.5 2.8 2.8 ♦ 6.2% 0.8%
Ukraine 4.8 4.2 3.6 2.8 2.8 0.3% -8.4% 0.8%
United Kingdom 7.1 7.1 6.5 6.6 7.4 12.2% -3.3% 2.2%
USSR n/a n/a n/a n/a n/a n/a n/a n/a
Uzbekistan 4.6 4.5 4.7 4.9 5.0 2.0% 1.6% 1.4%
Other Europe & Eurasia 1.5 1.4 1.4 1.5 1.5 2.4% 1.4% 0.4%
Total Europe & Eurasia 103.6 102.0 97.3 97.7 99.4 1.7% -0.8% 29.1%
Growth rate per annum
Public Record Exhibit 3
95

Iran 15.6 15.8 17.8 18.5 19.4 5.0% 6.4% 5.7%
Israel 0.2 0.7 0.7 0.8 0.9 14.5% 17.8% 0.3%
Kuwait 1.8 1.8 1.8 2.1 2.1 2.5% 5.7% 0.6%
Qatar 2.3 3.7 3.5 4.3 4.0 -5.4% 9.0% 1.2%
Saudi Arabia 9.6 9.7 9.9 10.1 10.6 4.4% 3.9% 3.1%
United Arab Emirates 6.3 6.5 6.4 7.1 7.4 3.6% 5.8% 2.2%
Other Middle East 4.3 4.5 4.5 4.9 5.0 2.3% 5.2% 1.5%
Total Middle East 40.0 42.6 44.6 47.8 49.4 3.5% 5.9% 14.5%
Algeria 3.0 3.2 3.6 3.8 3.9 1.2% 5.4% 1.1%
Egypt 5.1 5.0 4.6 4.6 4.9 7.0% 4.2% 1.4%
South Africa 0.4 0.4 0.5 0.5 0.5 1.3% 4.9% 0.1%
Other Africa 3.1 3.3 3.5 4.2 4.0 -4.4% 4.9% 1.2%
Total Africa 11.6 11.9 12.3 13.1 13.3 1.4% 4.8% 3.9%
Australia 3.3 3.4 3.7 4.1 4.0 -4.4% 6.6% 1.2%
Bangladesh 2.1 2.2 2.3 2.6 2.7 2.2% 6.9% 0.8%
China 14.6 16.6 18.2 18.8 20.3 7.7% 15.0% 5.9%
China Hong Kong SAR 0.3 0.3 0.2 0.3 0.3 2.4% 1.9% 0.1%
India 6.9 4.8 4.7 4.4 4.8 9.2% 2.5% 1.4%
Indonesia 4.1 4.0 4.0 3.9 3.6 -7.0% 1.2% 1.1%
Japan 11.3 11.3 11.4 11.0 10.7 -2.2% 3.7% 3.1%
Malaysia 3.4 3.9 4.1 4.0 4.2 2.7% 1.8% 1.2%
New Zealand 0.4 0.4 0.5 0.4 0.5 4.3% 2.3% 0.1%
Pakistan 4.2 4.1 4.1 4.2 4.4 4.2% 1.1% 1.3%
Philippines 0.4 0.3 0.3 0.3 0.4 14.3% 0.6% 0.1%
Singapore 0.9 1.0 1.1 1.2 1.2 2.5% 6.5% 0.4%
South Korea 4.8 5.1 4.6 4.2 4.4 4.0% 3.7% 1.3%
Taiwan 1.6 1.6 1.7 1.8 1.8 3.6% 6.9% 0.5%
Thailand 4.5 4.5 4.6 4.7 4.7 -1.0% 4.7% 1.4%
Vietnam 0.9 0.9 1.0 1.0 1.0 0.2% 5.2% 0.3%
Other Asia Pacific 0.6 0.6 0.7 0.8 0.8 2.7% 4.0% 0.2%
Total Asia Pacific 64.2 65.1 67.2 67.9 69.7 2.7% 5.6% 20.4%
Total World 322.1 327.4 329.0 336.7 341.8 1.5% 2.3% 100.0%
of which: OECD 152.5 155.7 152.9 155.9 158.6 1.7% 1.2% 46.4%
Non-OECD 169.5 171.7 176.1 180.8 183.2 1.3% 3.4% 53.6%
European Union # 42.3 41.7 37.1 38.6 41.4 7.1% -2.2% 12.1%
CIS 56.2 55.1 54.8 53.7 52.7 -1.8% -0.1% 15.4%
Source: Includes data from Cedigaz.
* Excludes natural gas converted to liquid fuels but includes derivatives of coal as well as natural gas consumed in Gas-to-Liquids transformation.
^ Less than 0.05.
w Less than 0.05%.
n/a not available.
# Excludes Estonia, Latvia and Lithuania prior to 1985 and Slovenia prior to 1990.
Notes: The difference between these world consumption figures and the world production statistics is due to variations in stocks at storage facilities
and liquefaction plants, together with unavoidable disparities in the definition, measurement or conversion of gas supply and demand data.
Annual changes and shares of total are calculated using billion cubic feet per day figures.
Public Record Exhibit 3
96

Natural Gas: ConsumptionShare
Million tonnes oil equivalent 2012 2013 2014 2015 2016 2016 2005-15 2016
US 657.4 675.5 690.0 710.5 716.3 0.5% 2.3% 22.4%
Canada 90.2 93.5 93.8 92.2 89.9 -2.8% 0.5% 2.8%
Mexico 71.9 74.9 78.1 78.4 80.6 2.5% 3.6% 2.5%
Total North America 819.5 843.9 862.0 881.2 886.8 0.4% 2.2% 27.7%
Argentina 42.1 42.1 42.5 43.4 44.6 2.7% 1.8% 1.4%
Brazil 28.5 33.6 35.6 37.5 32.9 -12.5% 7.9% 1.0%
Chile 4.1 4.1 3.4 3.7 4.1 11.1% -6.3% 0.1%
Colombia 8.9 9.0 9.8 9.6 9.5 -1.6% 4.8% 0.3%
Ecuador 0.5 0.6 0.6 0.6 0.6 1.5% 6.9% ♦
Peru 5.5 5.4 6.1 6.4 7.1 9.8% 16.8% 0.2%
Trinidad & Tobago 20.0 20.2 19.8 19.4 17.2 -11.4% 2.8% 0.5%
Venezuela 28.3 27.5 27.7 31.1 32.0 2.7% 2.3% 1.0%
Other S. & Cent. America 5.8 6.3 6.6 6.6 6.7 1.1% 8.1% 0.2%
Total S. & Cent. America 143.6 148.7 152.0 158.3 154.7 -2.5% 3.6% 4.8%
Austria 8.1 7.7 7.1 7.5 7.9 4.4% -1.7% 0.2%
Azerbaijan 7.7 7.7 8.5 9.6 9.4 -2.2% 2.2% 0.3%
Belarus 16.7 16.7 16.5 14.0 15.3 9.0% -1.6% 0.5%
Belgium 14.4 14.2 12.4 13.6 13.9 1.8% -0.8% 0.4%
Bulgaria 2.5 2.4 2.4 2.6 2.7 3.9% -0.8% 0.1%
Czech Republic 6.9 6.9 6.2 6.5 7.0 7.9% -1.7% 0.2%
Denmark 3.5 3.3 2.8 2.8 2.9 1.4% -4.4% 0.1%
Finland 2.7 2.6 2.3 2.0 1.8 -9.2% -5.8% 0.1%
France 38.2 38.8 32.6 35.1 38.3 9.0% -1.6% 1.2%
Germany 69.7 73.1 63.5 66.2 72.4 9.2% -1.6% 2.3%
Greece 3.6 3.2 2.4 2.5 2.6 0.6% 0.5% 0.1%
Hungary 8.4 7.8 7.0 7.5 8.0 7.0% -4.7% 0.3%
Ireland 4.0 3.8 3.7 3.8 4.3 14.0% 0.8% 0.1%
Italy 61.4 57.4 50.7 55.3 58.1 4.7% -2.5% 1.8%
Kazakhstan 9.7 10.1 11.3 11.6 12.0 3.8% 6.3% 0.4%
Lithuania 2.7 2.2 2.1 2.1 1.8 -11.1% -1.8% 0.1%
Netherlands 32.4 32.8 28.6 28.3 30.2 6.4% -2.3% 0.9%
Norway 3.9 4.0 4.2 4.4 4.4 0.4% 0.8% 0.1%
Poland 15.0 15.0 14.6 14.7 15.6 5.7% 1.9% 0.5%
Portugal 4.0 3.8 3.7 4.3 4.6 8.1% 1.2% 0.1%
Romania 11.2 10.2 9.5 9.0 9.5 6.2% -4.3% 0.3%
Russian Federation 374.6 372.1 368.7 362.5 351.8 -3.2% 0.2% 11.0%
Slovakia 4.4 4.8 3.8 3.9 4.0 1.6% -4.1% 0.1%
Spain 28.6 26.1 23.7 24.6 25.2 2.0% -1.9% 0.8%
Sweden 0.9 0.9 0.8 0.8 0.8 10.0% -0.9% ♦
Switzerland 2.6 2.8 2.4 2.6 2.7 4.8% 0.2% 0.1%
Turkey 37.3 37.8 40.1 39.2 37.9 -3.7% 5.0% 1.2%
Turkmenistan 23.7 20.6 23.0 26.5 26.6 ♦ 6.2% 0.8%
Ukraine 44.6 38.9 33.1 25.9 26.1 0.3% -8.4% 0.8%
United Kingdom 66.5 65.7 60.0 61.3 69.0 12.2% -3.3% 2.2%
USSR n/a n/a n/a n/a n/a n/a n/a n/a
Uzbekistan 42.5 42.2 43.9 45.2 46.2 2.0% 1.6% 1.4%
Other Europe & Eurasia 14.4 13.4 13.4 13.6 13.9 2.4% 1.4% 0.4%
Total Europe & Eurasia 966.6 949.0 905.0 909.2 926.9 1.7% -0.8% 28.9%
Growth rate per annum
Public Record Exhibit 3
97

Iran 145.4 146.6 165.3 171.7 180.7 5.0% 6.4% 5.6%
Israel 2.3 6.2 6.8 7.6 8.7 14.5% 17.8% 0.3%
Kuwait 16.6 16.8 16.6 19.2 19.7 2.5% 5.7% 0.6%
Qatar 21.1 34.1 32.8 39.5 37.5 -5.4% 9.0% 1.2%
Saudi Arabia 89.4 90.0 92.1 94.0 98.4 4.4% 3.9% 3.1%
United Arab Emirates 59.0 60.2 59.3 66.4 69.0 3.6% 5.8% 2.2%
Other Middle East 39.8 42.2 41.7 45.9 47.1 2.3% 5.2% 1.5%
Total Middle East 373.5 396.3 414.7 444.3 461.1 3.5% 5.9% 14.4%
Algeria 27.9 30.0 33.7 35.5 36.0 1.2% 5.4% 1.1%
Egypt 47.3 46.3 43.2 43.0 46.1 7.0% 4.2% 1.4%
South Africa 4.0 4.1 4.5 4.6 4.6 1.3% 4.9% 0.1%
Other Africa 29.3 30.4 32.9 39.2 37.6 -4.4% 4.9% 1.2%
Total Africa 108.6 110.9 114.3 122.2 124.3 1.4% 4.8% 3.9%
Australia 30.4 32.0 34.4 38.6 37.0 -4.4% 6.6% 1.2%
Bangladesh 20.0 20.5 21.5 24.2 24.8 2.2% 6.9% 0.8%
China 135.8 154.7 169.6 175.3 189.3 7.7% 15.0% 5.9%
China Hong Kong SAR 2.5 2.4 2.3 2.9 3.0 2.4% 1.9% 0.1%
India 64.0 44.4 43.9 41.2 45.1 9.2% 2.5% 1.4%
Indonesia 38.0 36.7 36.8 36.4 33.9 -7.0% 1.2% 1.1%
Japan 105.2 105.2 106.2 102.1 100.1 -2.2% 3.7% 3.1%
Malaysia 31.9 36.3 38.0 37.6 38.7 2.7% 1.8% 1.2%
New Zealand 3.8 4.0 4.4 4.0 4.2 4.3% 2.3% 0.1%
Pakistan 39.4 38.4 37.7 39.2 40.9 4.2% 1.1% 1.3%
Philippines 3.3 3.0 3.2 3.0 3.4 14.3% 0.6% 0.1%
Singapore 8.5 9.5 9.8 11.0 11.3 2.5% 6.5% 0.4%
South Korea 45.2 47.3 43.0 39.3 40.9 4.0% 3.7% 1.3%
Taiwan 14.7 14.7 15.5 16.5 17.2 3.6% 6.9% 0.5%
Thailand 41.8 42.0 42.9 43.8 43.5 -1.0% 4.7% 1.4%
Vietnam 8.4 8.8 9.2 9.6 9.6 0.2% 5.2% 0.3%
Other Asia Pacific 5.6 5.8 6.5 7.0 7.2 2.7% 4.0% 0.2%
Total Asia Pacific 598.6 605.6 624.9 631.6 650.3 2.7% 5.6% 20.3%
Total World 3010.5 3054.4 3073.0 3146.7 3204.1 1.5% 2.3% 100.0%
of which: OECD 1429.4 1457.4 1434.8 1464.9 1495.2 1.8% 1.2% 46.7%
Non-OECD 1581.1 1596.9 1638.2 1681.8 1708.9 1.3% 3.4% 53.3%
European Union # 394.7 388.1 344.7 359.2 385.9 7.1% -2.2% 12.0%
CIS 524.6 512.6 509.8 499.8 492.0 -1.8% -0.1% 15.4%
Source: Includes data from Cedigaz.
* Excludes natural gas converted to liquid fuels but includes derivatives of coal as well as natural gas consumed in Gas-to-Liquids transformation.
^ Less than 0.05.
w Less than 0.05%.
n/a not available.
# Excludes Estonia, Latvia and Lithuania prior to 1985 and Slovenia prior to 1990.
Notes: The difference between these world consumption figures and the world production statistics is due to variations in stocks at storage facilities
and liquefaction plants, together with unavoidable disparities in the definition, measurement or conversion of gas supply and demand data.
Annual changes and share of total are calculated using million tonnes oil equivalent figures.
Growth rates are adjusted for leap years.
Public Record Exhibit 3
98

Natural Gas: Trade movements 2016 by pipeline in billion cubic metres
Billion cubic metres From
To US Canada Mexico Bolivia
Other S. &
Cent.
America Netherlands Norway
United
Kingdom Other Europe Azerbaijan Kazakhstan
Russian
Federation Turkmenistan Uzbekistan
US - 82.4 † - - - - - - - - - - -
Canada 21.9 - - - - - - - - - - - - -
Mexico 38.4 - - - - - - - - - - - - -
North America 60.3 82.4 † - - - - - - - - - - -
Argentina - - - 5.8 0.4 - - - - - - - - -
Brazil - - - 10.4 - - - - - - - - - -
Other S. & Cent. America - - - - 0.3 - - - - - - - - -
S. & Cent. America - - - 16.1 0.7 - - - - - - - - -
Austria - - - - - - 1.7 - - - - 5.6 - -
Belgium - - - - - 10.9 0.2 5.8 - - - 5.4 - -
Czech Republic - - - - - - 3.3 - - - - 4.2 - -
Finland - - - - - - - - - - - 2.3 - -
France - - - - - 4.6 16.6 - 0.6 - - 10.5 - -
Germany - - - - - 22.9 29.7 - 0.6 - - 46.0 - -
Poland - - - - - - - - 0.6 - - 2.5 - -
Hungary - - - - - - - - 2.1 - - 5.1 - -
Ireland - - - - - - - 2.7 - - - - - -
Italy - - - - - 9.2 5.9 - - - - 22.7 - -
Netherlands - - - - - - 18.6 1.6 3.1 - - 14.7 - -
Poland - - - - - - - - 2.4 - - 10.2 - -
Slovakia - - - - - - - - 10.0 - - 3.4 - -
Spain - - - - - - 3.2 - † - - - - -
Turkey - - - - - - - - - 6.5 - 23.2 - -
United Kingdom - - - - - 4.1 28.7 - 1.3 - - - - -
Other Europe - - - - - 0.6 1.7 † 3.6 2.1 - 10.3 - -
Europe - - - - - 52.3 109.8 10.0 24.4 8.6 - 166.1 - -
Belarus - - - - - - - - - - - 16.6 - -
Kazakhstan - - - - - - - - - - - 3.6 1.1 1.5
Russian Federation - - - - - - - - - - 16.1 - - 5.6
Ukraine - - - - - - - - 11.1 - - - - -
Other CIS - - - - - - - - † - - 4.5 - -
CIS - - - - - - - - 11.1 - 16.1 24.7 1.1 7.1
Iran - - - - - - - - - 0.2 - - 6.7 -
Oman - - - - - - - - - - - - - -
United Arab Emirates - - - - - - - - - - - - - -
Middle East - - - - - - - - - 0.2 - - 6.7 -
South Africa - - - - - - - - - - - - - -
Other Africa - - - - - - - - - - - - - -
Africa - - - - - - - - - - - - - -
Australia - - - - - - - - - - - - - -
Public Record Exhibit 3
99

China - - - - - - - - - - 0.4 - 29.4 4.3
Malaysia - - - - - - - - - - - - - -
Singapore - - - - - - - - - - - - - -
Thailand - - - - - - - - - - - - - -
Asia Pacific - - - - - - - - - - 0.4 - 29.4 4.3
Total exports 60.3 82.4 † 16.1 0.7 52.3 109.8 10.0 35.5 8.8 16.6 190.8 37.3 11.4
† Less than 0.05.
Public Record Exhibit 3
100

Iran Qatar Algeria Libya Other Africa Indonesia Myanmar Other Asia Pacific Total imports
- - - - - - - - 82.5
- - - - - - - - 21.9
- - - - - - - - 38.4
- - - - - - - - 142.8
- - - - - - - - 6.1
- - - - - - - - 10.4
- - - - - - - - 0.3
- - - - - - - - 16.8
- - - - - - - - 7.3
- - - - - - - - 22.2
- - - - - - - - 7.5
- - - - - - - - 2.3
- - - - - - - - 32.3
- - - - - - - - 99.3
- - - - - - - - 3.1
- - - - - - - - 7.2
- - - - - - - - 2.7
- - 17.2 4.4 - - - - 59.4
- - - - - - - - 38.0
- - - - - - - - 12.6
- - - - - - - - 13.4
- - 11.8 - - - - - 15.0
7.7 - - - - - - - 37.4
- - - - - - - - 34.1
- - 3.5 - - - - - 21.9
7.7 - 32.5 4.4 - - - - 415.8
- - - - - - - - 16.6
- - - - - - - - 6.2
- - - - - - - - 21.7
- - - - - - - - 11.1
0.7 - - - - - - - 5.1
0.7 - - - - - - - 60.8
- - - - - - - - 6.9
- 2.1 - - - - - - 2.1
- 17.9 - - - - - - 17.9
- 20.0 - - - - - - 26.9
- - - - 4.0 - - - 4.0
- - 4.6 - 0.1 - - - 4.7
- - 4.6 - 4.2 - - - 8.8
- - - - - - - 8.3 8.3
Public Record Exhibit 3
101
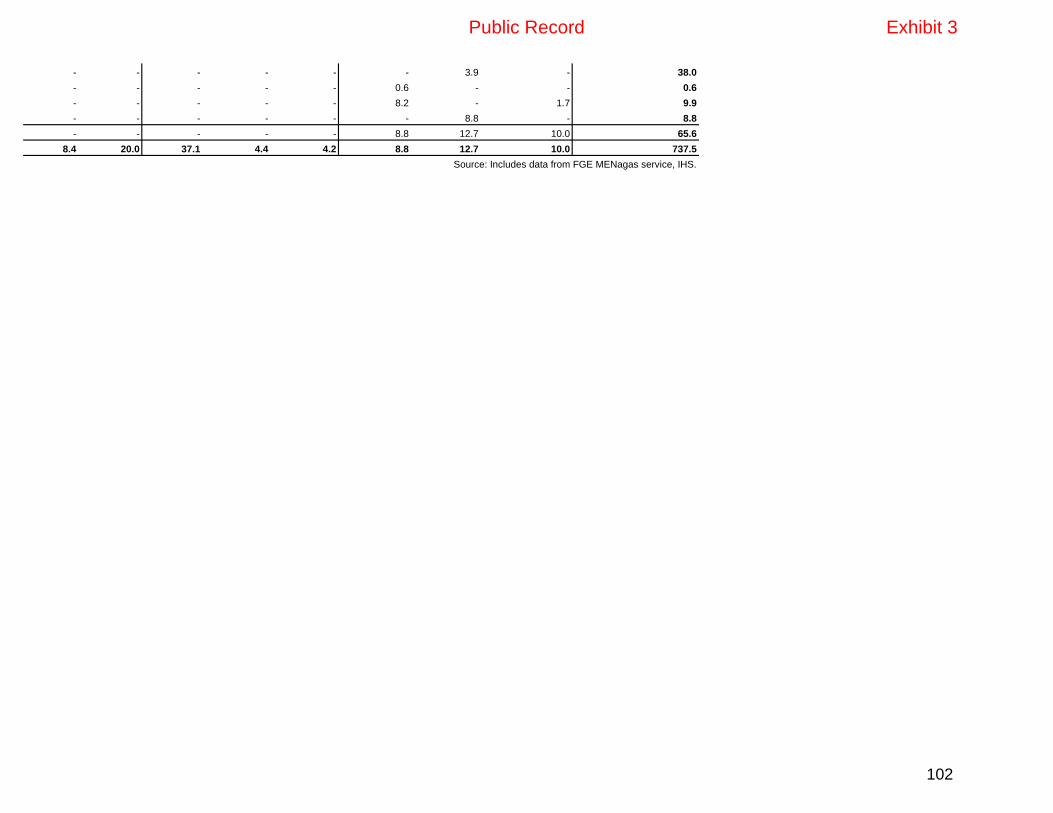
- - - - - - 3.9 - 38.0
- - - - - 0.6 - - 0.6
- - - - - 8.2 - 1.7 9.9
- - - - - - 8.8 - 8.8
- - - - - 8.8 12.7 10.0 65.6
8.4 20.0 37.1 4.4 4.2 8.8 12.7 10.0 737.5
Source: Includes data from FGE MENagas service, IHS.
Public Record Exhibit 3
102

Natural Gas: Trade movements 2016 as liquefied natural gas in billion cubic metres
From
Billion cubic metres Trinidad & Other Russian United Equatorial
To US* Brazil Peru Tobago Norway Europe* Federation Oman Qatar Arab Emirates Algeria Angola Egypt Guinea
US - - - 2.3 0.1 - - - - - - - - -
Canada † - - 0.2 0.1 - - - - - - - - -
Mexico 0.7 0.1 2.9 0.5 - - - - - - 0.1 - - 0.1
North America 0.7 0.1 2.9 3.1 0.2 - - - - - 0.1 - - 0.1
Argentina 0.4 0.4 - 1.4 0.5 0.3 - - 1.1 - 0.2 † - 0.1
Brazil 0.2 - - 0.3 0.3 0.2 - - 0.7 - - 0.1 - 0.2
Chile 0.7 - - 3.2 0.2 0.1 - - 0.1 - - - - 0.1
Other S. & Cent. America 0.1 - - 2.4 0.2 0.2 - - - - - - - 0.1
S. & Cent. America 1.5 0.4 - 7.2 1.1 0.7 - - 1.8 - 0.2 0.1 - 0.4
Belgium - - - - - 0.1 - - 2.7 - † - - -
France - - 0.2 - 0.6 † - - 0.8 - 6.2 - - -
Italy 0.1 - 0.1 - 0.1 † - - 5.2 - 0.1 - - -
Spain 0.1 - 1.7 0.6 0.7 † - - 2.5 - 2.9 0.1 - -
Turkey 0.2 - - 0.3 0.1 0.2 - - 1.0 - 4.4 - 0.1 -
United Kingdom - - - 0.1 0.2 0.1 - - 9.6 - 0.4 - † -
Other Europe & Eurasia 0.1 - - 0.2 2.4 † † - 1.9 0.1 0.9 - - -
Europe and Eurasia 0.5 - 2.0 1.2 4.1 0.5 † - 23.7 0.1 14.9 0.1 0.1 -
Middle East 0.5 - - 1.1 0.2 0.9 - 1.3 4.5 - - 0.1 0.2 1.2
Africa 0.1 - - 0.5 0.3 0.9 - - 6.4 - - - - 0.1
China 0.3 - 0.3 0.2 0.2 † 0.3 0.1 6.5 - - - 0.1 -
India 0.5 0.1 0.1 0.6 0.1 0.3 - 0.3 14.0 0.7 0.1 0.4 0.1 1.4
Japan - - - 0.1 - 0.7 9.5 3.3 15.8 6.5 0.4 - 0.1 0.4
Malaysia - - - 0.1 - 0.1 - 0.1 0.1 - - - 0.1 -
Pakistan - - - 0.2 - 0.1 - - 2.9 - - - - 0.4
Singapore - - - - - - - - 0.8 0.1 - - 0.1 0.2
South Korea 0.3 - 0.2 - 0.1 0.1 2.4 5.3 15.6 - 0.2 0.1 - 0.1
Taiwan - - - 0.1 0.1 - 1.7 0.2 8.2 0.1 0.1 - - 0.1
Thailand - - - - - - - 0.1 4.1 - - - - -
Other Asia Pacific - - - - - - - - - - - - - -
Asia Pacific 1.0 0.1 0.6 1.2 0.5 1.3 13.9 9.4 68.0 7.3 0.7 0.5 0.5 2.5
Total exports 4.4 0.6 5.5 14.3 6.3 4.2 14.0 10.6 104.4 7.4 15.9 0.8 0.7 4.3
† Less than 0.05.
* Includes re-exports
Public Record Exhibit 3
103

Papua Other
Nigeria Australia Brunei Indonesia Malaysia New Guinea Asia Pacific* Total imports
- - - - - - - 2.5
- - - - - - - 0.3
0.8 0.4 - 0.3 - - - 5.9
0.8 0.4 - 0.3 - - - 8.7
0.8 0.1 - - - - - 5.2
1.1 - - - - - - 3.0
- - - - - - - 4.3
0.1 - - - - - - 3.0
2.0 0.1 - - - - - 15.5
- - - - - - - 2.8
1.9 - - - - - - 9.7
0.1 - - - - - - 5.7
4.5 - - - - - - 13.2
1.4 - - - - - - 7.7
† - - - - - - 10.5
1.3 - - - - - - 6.9
9.2 - - - - - - 56.4
3.2 0.9 - 0.1 - - - 14.2
1.4 0.4 - - 0.1 - 0.1 10.2
0.4 15.7 0.1 3.7 3.4 2.9 0.2 34.3
2.7 1.2 - - 0.1 - - 22.5
2.5 29.2 5.5 8.7 20.2 5.5 0.2 108.5
- 0.7 0.5 - - - - 1.6
0.3 0.2 - - - - - 4.0
- 1.6 - - 0.1 - † 3.0
0.7 6.1 1.8 5.7 5.0 0.2 0.1 43.9
0.6 0.3 0.4 2.6 3.3 1.8 - 19.5
- - - - - - - 4.2
- - - 0.1 - - - 0.1
7.1 55.1 8.3 20.8 32.0 10.4 0.4 241.6
23.7 56.8 8.3 21.2 32.1 10.4 0.5 346.6
Public Record Exhibit 3
104

Gas Trade in 2015 and 2016 in billion cubic metres
Billion cubic metres 2015 2016
Pipeline LNG Pipeline LNG Pipeline LNG Pipeline LNG
imports imports exports exports imports imports exports exports
US 74.4 2.6 49.1 0.7 82.5 2.5 60.3 4.4
Canada 19.2 0.6 74.3 † 21.9 0.3 82.4 †
Mexico 29.9 7.3 † - 38.4 5.9 † -
Trinidad and Tobago - - - 16.9 - - - 14.3
Other S. & Cent. America 19.9 19.8 19.9 5.1 16.8 15.5 16.8 6.1
France 31.8 6.8 - 0.6 32.3 9.7 - 1.5
Germany 102.3 - 32.7 - 99.3 - 19.3 -
Italy 55.7 5.4 0.2 - 59.4 5.7 - -
Netherlands 33.6 2.1 47.1 1.3 38.0 1.5 52.3 0.7
Norway † - 109.6 5.9 † - 109.8 6.3
Spain 15.2 13.1 0.5 1.8 15.0 13.2 0.6 0.2
Turkey 38.4 7.7 0.6 - 37.4 7.7 0.6 -
United Kingdom 29.0 13.1 13.4 0.3 34.1 10.5 10.0 0.5
Other Europe 94.7 6.9 13.8 1.5 100.2 8.2 15.0 1.3
Russian Federation 21.8 - 179.1 14.0 21.7 - 190.8 14.0
Ukraine 17.3 - - - 11.1 - - -
Other CIS 27.0 - 72.3 - 27.9 - 74.0 -
Qatar - - 20.0 101.8 - - 20.0 104.4
Other Middle East 29.6 10.2 8.4 18.8 26.9 14.2 8.4 18.1
Algeria - - 26.3 16.6 - - 37.1 15.9
Other Africa 9.0 3.7 11.0 30.0 8.8 10.2 8.5 29.6
Australia 6.4 - - 38.1 8.3 0.1 - 56.8
China 33.6 25.8 - - 38.0 34.3 - -
Japan - 110.7 - - - 108.5 - -
Indonesia - - 9.3 20.7 - - 8.8 21.2
South Korea - 43.8 - 0.2 - 43.9 - 0.1
Other Asia Pacific 20.3 46.0 21.4 51.4 19.3 54.8 22.7 51.1
Total World 709.0 325.5 709.0 325.5 737.5 346.6 737.5 346.6
Source: Includes data from FGE MENAgas service, GIIGNL, IHS Waterborne, PIRA Energy Group, Wood Mackenzie.
† Less than 0.05.
Public Record Exhibit 3
105

Source: Includes data from FGE MENAgas service, GIIGNL, IHS Waterborne, PIRA Energy Group, Wood Mackenzie.
Public Record Exhibit 3
106

Public Record Exhibit 3
107

Public Record Exhibit 3
108

Natural Gas: Prices
US dollars per million Btu
LNG Natural gas Crude oil
Japan
Average
German import UK US Canada OECDcif price cif * (Heren NBP Index)* Henry Hub † (Alberta) ‡ countries cif
1984 5.10 4.00 - - - 5.00
1985 5.23 4.25 - - - 4.75
1986 4.10 3.93 - - - 2.57
1987 3.35 2.55 - - - 3.09
1988 3.34 2.22 - - - 2.56
1989 3.28 2.00 - 1.70 - 3.01
1990 3.64 2.78 - 1.64 1.05 3.82
1991 3.99 3.23 - 1.49 0.89 3.33
1992 3.62 2.70 - 1.77 0.98 3.19
1993 3.52 2.51 - 2.12 1.69 2.82
1994 3.18 2.35 - 1.92 1.45 2.70
1995 3.46 2.43 - 1.69 0.89 2.96
1996 3.66 2.50 1.87 2.76 1.12 3.54
1997 3.91 2.66 1.96 2.53 1.36 3.29
1998 3.05 2.33 1.86 2.08 1.42 2.16
1999 3.14 1.86 1.58 2.27 2.00 2.98
2000 4.72 2.91 2.71 4.23 3.75 4.83
2001 4.64 3.67 3.17 4.07 3.61 4.08
2002 4.27 3.21 2.37 3.33 2.57 4.17
2003 4.77 4.06 3.33 5.63 4.83 4.89
2004 5.18 4.30 4.46 5.85 5.03 6.27
2005 6.05 5.83 7.38 8.79 7.25 8.74
2006 7.14 7.87 7.87 6.76 5.83 10.66
2007 7.73 7.99 6.01 6.95 6.17 11.95
2008 12.55 11.60 10.79 8.85 7.99 16.76
2009 9.06 8.53 4.85 3.89 3.38 10.41
2010 10.91 8.03 6.56 4.39 3.69 13.47
2011 14.73 10.49 9.04 4.01 3.47 18.56
2012 16.75 10.93 9.46 2.76 2.27 18.82
2013 16.17 10.73 10.64 3.71 2.93 18.25
2014 16.33 9.11 8.25 4.35 3.87 16.80
2015 10.31 6.72 6.53 2.60 2.01 8.77
2016 6.94 4.93 4.69 2.46 1.55 7.04
* Source: 1984-1990 German Federal Statistical Office 1991-2016 German Federal Office of Economics and Export Control (BAFA).
† Source: ICIS Heren Energy Ltd.
‡ Source: Energy Intelligence Group, Natural Gas Week .
Note: Btu = British thermal units; cif = cost+insurance+freight (average prices).
Public Record Exhibit 3
109

Coal:
Total proved reserves at end 2016Anthracite Sub-bituminous
Million tonnes and bituminous and lignite Total Share of Total R/P ratio
US 221400 30182 251582 22.1% 381
Canada 4346 2236 6582 0.6% 109
Mexico 1160 51 1211 0.1% 151
Total North America 226906 32469 259375 22.8% 356
Brazil 1547 5049 6596 0.6% *
Colombia 4881 - 4881 0.4% 54
Venezuela 731 - 731 0.1% *
Other S. & Cent. America 1784 24 1808 0.2% *
Total S. & Cent. America 8943 5073 14016 1.2% 138
Bulgaria 192 2174 2366 0.2% 75
Czech Republic 1103 2573 3676 0.3% 80
Germany 12 36200 36212 3.2% 206
Greece - 2876 2876 0.3% 87
Hungary 276 2633 2909 0.3% 311
Kazakhstan 25605 - 25605 2.2% 250
Poland 18700 5461 24161 2.1% 184
Romania 11 280 291 ♦ 13
Russian Federation 69634 90730 160364 14.1% 417
Serbia 402 7112 7514 0.7% 196
Spain 868 319 1187 0.1% *
Turkey 378 10975 11353 1.0% 163
Ukraine 32039 2336 34375 3.0% *
United Kingdom 70 - 70 ♦ 17
Uzbekistan 1375 - 1375 0.1% 355
Other Europe & Eurasia 2618 5172 7790 0.7% 201
Total Europe & Eurasia 153283 168841 322124 28.3% 284
South Africa 9893 - 9893 0.9% 39
Zimbabwe 502 - 502 ♦ 186
Other Africa 2756 66 2822 0.2% 276
Middle East 1203 - 1203 0.1% *
Total Middle East & Africa 14354 66 14420 1.3% 54
Australia 68310 76508 144818 12.7% 294
China 230004 14006 244010 21.4% 72
India 89782 4987 94769 8.3% 137
Indonesia 17326 8247 25573 2.2% 59
Japan 340 10 350 ♦ 261
Mongolia 1170 1350 2520 0.2% 66
New Zealand 825 6750 7575 0.7% *
Pakistan 207 2857 3064 0.3% *
South Korea 326 - 326 ♦ 189
Thailand - 1063 1063 0.1% 63
Vietnam 3116 244 3360 0.3% 85
Other Asia Pacific 1322 646 1968 0.2% 29
Total Asia Pacific 412728 116668 529396 46.5% 102
Public Record Exhibit 3
110

Total World 816214 323117 1139331 100.0% 153
of which: OECD 319878 177264 497142 43.6% 291
Non-OECD 496336 145853 642189 56.4% 112
European Union 21813 53006 74819 6.6% 162
CIS 130162 93066 223228 19.6% 417
Source: Includes data from Federal Institute for Geosciences and Natural Resources (BGR) Energy Study 2016.
* More than 500 years.
w Less than 0.05%.
Notes: Total proved reserves of coal- Generally taken to be those quantities that geological and engineering information indicates with reasonable certainty
can be recovered in the future from known reservoirs under existing economic and operating conditions. The data series for total proved coal reserves does not necessarily
meet the definitions, guidelines and practices used for determining proved reserves at company level, for instance as published by the US Securities and Exchange Commission,
nor does it necessarily represent BP’s view of proved reserves by country.
Reserves-to-production (R/P) ratio - If the reserves remaining at the end of any year are divided by the production in that year, the result is the length of time
that those remaining reserves would last if production were to continue at that rate.
Reserves-to-production (R/P) ratios are calculated excluding other solid fuels in reserves and production.
Shares of total and R/P ratios are calculated using million tonnes figures.
Public Record Exhibit 3
111
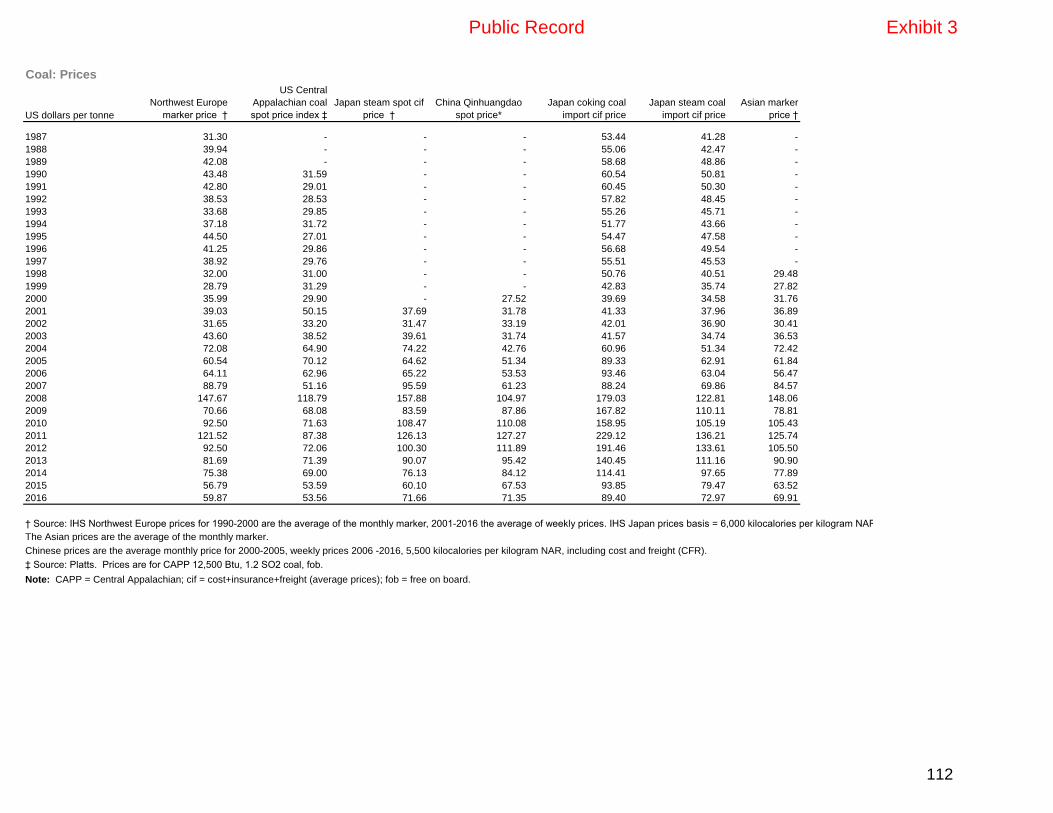
Coal: Prices
US dollars per tonne
Northwest Europe
marker price †
US Central
Appalachian coal
spot price index ‡
Japan steam spot cif
price †
China Qinhuangdao
spot price*
Japan coking coal
import cif price
Japan steam coal
import cif price
Asian marker
price †
1987 31.30 - - - 53.44 41.28 -
1988 39.94 - - - 55.06 42.47 -
1989 42.08 - - - 58.68 48.86 -
1990 43.48 31.59 - - 60.54 50.81 -
1991 42.80 29.01 - - 60.45 50.30 -
1992 38.53 28.53 - - 57.82 48.45 -
1993 33.68 29.85 - - 55.26 45.71 -
1994 37.18 31.72 - - 51.77 43.66 -
1995 44.50 27.01 - - 54.47 47.58 -
1996 41.25 29.86 - - 56.68 49.54 -
1997 38.92 29.76 - - 55.51 45.53 -
1998 32.00 31.00 - - 50.76 40.51 29.48
1999 28.79 31.29 - - 42.83 35.74 27.82
2000 35.99 29.90 - 27.52 39.69 34.58 31.76
2001 39.03 50.15 37.69 31.78 41.33 37.96 36.89
2002 31.65 33.20 31.47 33.19 42.01 36.90 30.41
2003 43.60 38.52 39.61 31.74 41.57 34.74 36.53
2004 72.08 64.90 74.22 42.76 60.96 51.34 72.42
2005 60.54 70.12 64.62 51.34 89.33 62.91 61.84
2006 64.11 62.96 65.22 53.53 93.46 63.04 56.47
2007 88.79 51.16 95.59 61.23 88.24 69.86 84.57
2008 147.67 118.79 157.88 104.97 179.03 122.81 148.06
2009 70.66 68.08 83.59 87.86 167.82 110.11 78.81
2010 92.50 71.63 108.47 110.08 158.95 105.19 105.43
2011 121.52 87.38 126.13 127.27 229.12 136.21 125.74
2012 92.50 72.06 100.30 111.89 191.46 133.61 105.50
2013 81.69 71.39 90.07 95.42 140.45 111.16 90.90
2014 75.38 69.00 76.13 84.12 114.41 97.65 77.89
2015 56.79 53.59 60.10 67.53 93.85 79.47 63.52
2016 59.87 53.56 71.66 71.35 89.40 72.97 69.91
† Source: IHS Northwest Europe prices for 1990-2000 are the average of the monthly marker, 2001-2016 the average of weekly prices. IHS Japan prices basis = 6,000 kilocalories per kilogram NAR CIF.
The Asian prices are the average of the monthly marker.
Chinese prices are the average monthly price for 2000-2005, weekly prices 2006 -2016, 5,500 kilocalories per kilogram NAR, including cost and freight (CFR).
‡ Source: Platts. Prices are for CAPP 12,500 Btu, 1.2 SO2 coal, fob.
Note: CAPP = Central Appalachian; cif = cost+insurance+freight (average prices); fob = free on board.
Public Record Exhibit 3
112

Coal: Production*Share
Million tonnes 2012 2013 2014 2015 2016 2016 2005-15 2016
US 922.1 893.4 907.2 813.7 660.6 -19.0% -2.3% 8.9%
Canada 67.3 68.4 67.3 61.2 60.3 -1.8% -1.1% 0.8%
Mexico 15.2 14.6 14.9 12.3 8.0 -34.8% -0.3% 0.1%
Total North America 1004.6 976.5 989.5 887.2 728.9 -18.1% -2.2% 9.8%
Brazil 6.6 8.6 7.9 8.0 8.1 - 2.5% 0.1%
Colombia 89.2 85.5 88.6 85.5 90.5 5.5% 3.7% 1.2%
Venezuela 1.9 1.2 0.8 0.8 0.3 -66.4% -19.7% ♦
Other S. & Cent. America 1.0 3.2 4.5 3.4 2.8 -18.7% 15.7% ♦
Total S. & Cent. America 98.7 98.5 101.8 97.8 101.6 3.6% 2.8% 1.4%
Bulgaria 33.4 28.6 31.3 35.9 31.5 -12.5% 3.8% 0.4%
Czech Republic 55.0 49.0 46.9 46.4 46.0 -1.2% -2.9% 0.6%
Germany 196.2 190.6 185.8 184.3 176.1 -4.7% -1.0% 2.4%
Greece 63.0 53.9 50.8 46.2 33.1 -28.7% -4.0% 0.4%
Hungary 9.3 9.6 9.6 9.3 9.3 0.6% -0.3% 0.1%
Kazakhstan 120.5 119.6 114.0 107.3 102.4 -4.9% 2.2% 1.4%
Poland 144.1 142.9 137.1 135.8 131.1 -3.8% -1.6% 1.8%
Romania 33.9 24.7 23.6 25.5 23.2 -9.2% -2.0% 0.3%
Russian Federation 358.3 355.2 357.4 372.7 385.4 3.1% 2.2% 5.2%
Serbia 38.2 40.3 29.8 37.8 38.4 1.4% n/a 0.5%
Spain 6.2 4.4 3.9 3.1 1.7 -43.5% -16.8% ♦
Turkey 71.5 60.4 65.2 58.4 70.6 20.5% -0.4% 0.9%
Ukraine 87.3 84.8 64.0 38.5 41.8 8.2% -7.0% 0.6%
United Kingdom 17.0 12.8 11.6 8.6 4.2 -51.5% -8.3% 0.1%
USSR n/a n/a n/a n/a n/a n/a n/a n/a
Uzbekistan 4.0 4.1 4.4 4.0 3.9 -2.2% 2.2% 0.1%
Other Europe & Eurasia 67.4 76.3 71.9 66.3 63.4 -4.6% -4.1% 0.9%
Total Europe & Eurasia 1305.2 1257.0 1207.4 1180.0 1162.0 -1.8% -0.4% 15.6%
Total Middle East 1.5 1.5 1.4 1.5 1.5 - -2.8% ♦
South Africa 258.6 256.3 261.5 252.1 251.3 -0.6% 0.3% 3.4%
Zimbabwe 1.6 3.1 5.8 4.3 2.7 -37.9% 2.6% ♦
Other Africa 7.1 8.2 9.0 9.6 10.2 5.7% 19.0% 0.1%
Total Africa 267.3 267.6 276.3 266.1 264.2 -1.0% 0.6% 3.5%
Australia 448.2 472.8 504.2 505.4 492.8 -2.8% 2.9% 6.6%
China 3945.1 3974.3 3873.9 3746.5 3411.0 -9.2% 4.7% 45.7%
India 605.6 608.5 646.2 674.2 692.4 2.4% 4.6% 9.3%
Indonesia 385.9 474.6 458.1 461.6 434.0 -6.2% 11.7% 5.8%
Japan 1.3 1.2 1.3 1.2 1.3 14.2% 0.5% ♦
Mongolia 29.9 30.1 25.3 24.2 38.1 57.0% 12.4% 0.5%
New Zealand 4.9 4.6 4.0 3.4 2.9 -15.1% -4.3% ♦
Pakistan 3.0 3.0 3.4 3.3 4.0 19.5% -0.5% 0.1%
South Korea 2.1 1.8 1.7 1.8 1.7 -2.4% -4.5% ♦
Thailand 18.1 18.1 18.0 15.2 17.0 11.8% -3.2% 0.2%
Vietnam 42.1 41.1 41.1 41.5 39.4 -5.4% 2.0% 0.5%
Other Asia Pacific 44.1 43.4 44.2 50.4 67.5 33.4% 2.6% 0.9%
Total Asia Pacific 5530.4 5673.5 5621.5 5528.6 5202.1 -6.2% 4.9% 69.7%
Growth rate per annum
Public Record Exhibit 3
113

Total World 8207.7 8274.6 8197.8 7961.2 7460.4 -6.5% 2.7% 100.0%
of which: OECD 2057.8 2026.9 2056.6 1928.0 1732.2 -10.4% -1.0% 23.2%
Non-OECD 6149.9 6247.7 6141.2 6033.2 5728.2 -5.3% 4.3% 76.8%
European Union # 590.3 557.9 539.3 527.5 484.7 -8.4% -1.9% 6.5%
CIS 574.4 567.9 544.0 526.6 538.3 1.9% 1.1% 7.2%
^ Less than 0.05.
w Less than 0.05%.
n/a not available.
# Excludes Estonia, Latvia and Lithuania prior to 1985 and Slovenia prior to 1990.
Notes: Annual changes and shares of total are calculated using million tonnes figures.
Growth rates are adjusted for leap years.
* Commercial solid fuels only, i.e. bituminous coal and anthracite (hard coal), and lignite and brown (sub-bituminous) coal, and other commercial solid fuels. Includes coal produced for Coal-
Public Record Exhibit 3
114
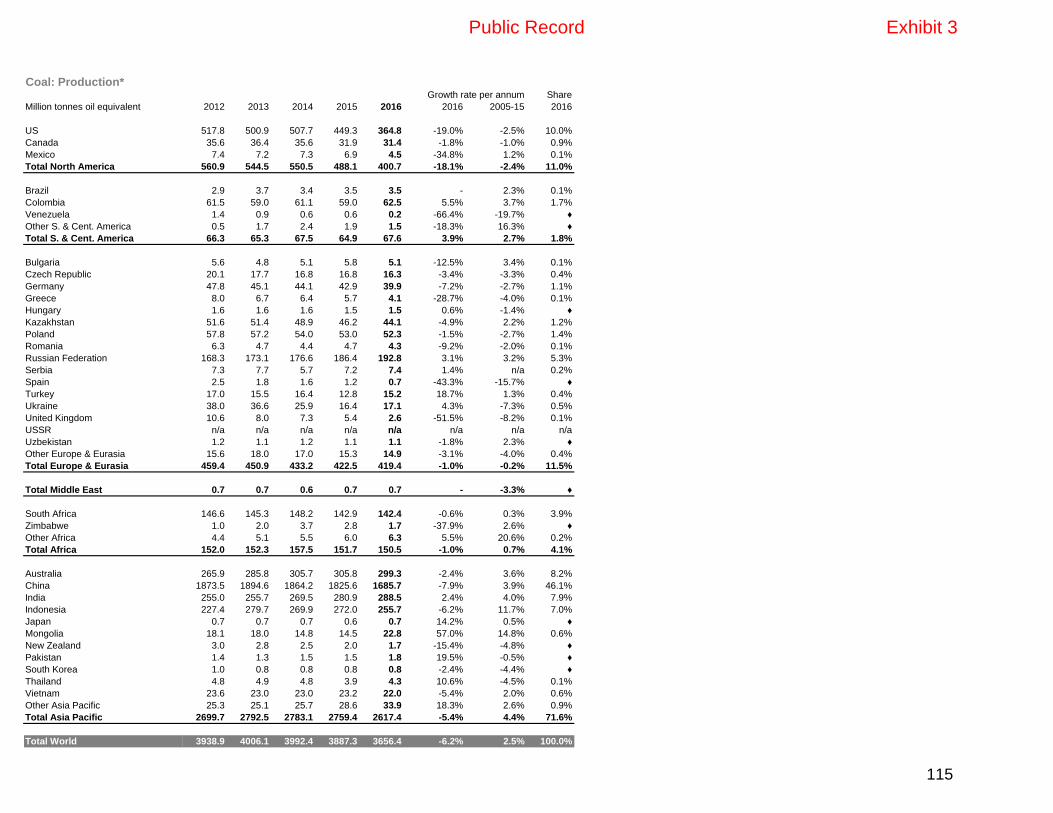
Coal: Production*Share
Million tonnes oil equivalent 2012 2013 2014 2015 2016 2016 2005-15 2016
US 517.8 500.9 507.7 449.3 364.8 -19.0% -2.5% 10.0%
Canada 35.6 36.4 35.6 31.9 31.4 -1.8% -1.0% 0.9%
Mexico 7.4 7.2 7.3 6.9 4.5 -34.8% 1.2% 0.1%
Total North America 560.9 544.5 550.5 488.1 400.7 -18.1% -2.4% 11.0%
Brazil 2.9 3.7 3.4 3.5 3.5 - 2.3% 0.1%
Colombia 61.5 59.0 61.1 59.0 62.5 5.5% 3.7% 1.7%
Venezuela 1.4 0.9 0.6 0.6 0.2 -66.4% -19.7% ♦
Other S. & Cent. America 0.5 1.7 2.4 1.9 1.5 -18.3% 16.3% ♦
Total S. & Cent. America 66.3 65.3 67.5 64.9 67.6 3.9% 2.7% 1.8%
Bulgaria 5.6 4.8 5.1 5.8 5.1 -12.5% 3.4% 0.1%
Czech Republic 20.1 17.7 16.8 16.8 16.3 -3.4% -3.3% 0.4%
Germany 47.8 45.1 44.1 42.9 39.9 -7.2% -2.7% 1.1%
Greece 8.0 6.7 6.4 5.7 4.1 -28.7% -4.0% 0.1%
Hungary 1.6 1.6 1.6 1.5 1.5 0.6% -1.4% ♦
Kazakhstan 51.6 51.4 48.9 46.2 44.1 -4.9% 2.2% 1.2%
Poland 57.8 57.2 54.0 53.0 52.3 -1.5% -2.7% 1.4%
Romania 6.3 4.7 4.4 4.7 4.3 -9.2% -2.0% 0.1%
Russian Federation 168.3 173.1 176.6 186.4 192.8 3.1% 3.2% 5.3%
Serbia 7.3 7.7 5.7 7.2 7.4 1.4% n/a 0.2%
Spain 2.5 1.8 1.6 1.2 0.7 -43.3% -15.7% ♦
Turkey 17.0 15.5 16.4 12.8 15.2 18.7% 1.3% 0.4%
Ukraine 38.0 36.6 25.9 16.4 17.1 4.3% -7.3% 0.5%
United Kingdom 10.6 8.0 7.3 5.4 2.6 -51.5% -8.2% 0.1%
USSR n/a n/a n/a n/a n/a n/a n/a n/a
Uzbekistan 1.2 1.1 1.2 1.1 1.1 -1.8% 2.3% ♦
Other Europe & Eurasia 15.6 18.0 17.0 15.3 14.9 -3.1% -4.0% 0.4%
Total Europe & Eurasia 459.4 450.9 433.2 422.5 419.4 -1.0% -0.2% 11.5%
Total Middle East 0.7 0.7 0.6 0.7 0.7 - -3.3% ♦
South Africa 146.6 145.3 148.2 142.9 142.4 -0.6% 0.3% 3.9%
Zimbabwe 1.0 2.0 3.7 2.8 1.7 -37.9% 2.6% ♦
Other Africa 4.4 5.1 5.5 6.0 6.3 5.5% 20.6% 0.2%
Total Africa 152.0 152.3 157.5 151.7 150.5 -1.0% 0.7% 4.1%
Australia 265.9 285.8 305.7 305.8 299.3 -2.4% 3.6% 8.2%
China 1873.5 1894.6 1864.2 1825.6 1685.7 -7.9% 3.9% 46.1%
India 255.0 255.7 269.5 280.9 288.5 2.4% 4.0% 7.9%
Indonesia 227.4 279.7 269.9 272.0 255.7 -6.2% 11.7% 7.0%
Japan 0.7 0.7 0.7 0.6 0.7 14.2% 0.5% ♦
Mongolia 18.1 18.0 14.8 14.5 22.8 57.0% 14.8% 0.6%
New Zealand 3.0 2.8 2.5 2.0 1.7 -15.4% -4.8% ♦
Pakistan 1.4 1.3 1.5 1.5 1.8 19.5% -0.5% ♦
South Korea 1.0 0.8 0.8 0.8 0.8 -2.4% -4.4% ♦
Thailand 4.8 4.9 4.8 3.9 4.3 10.6% -4.5% 0.1%
Vietnam 23.6 23.0 23.0 23.2 22.0 -5.4% 2.0% 0.6%
Other Asia Pacific 25.3 25.1 25.7 28.6 33.9 18.3% 2.6% 0.9%
Total Asia Pacific 2699.7 2792.5 2783.1 2759.4 2617.4 -5.4% 4.4% 71.6%
Total World 3938.9 4006.1 3992.4 3887.3 3656.4 -6.2% 2.5% 100.0%
Growth rate per annum
Public Record Exhibit 3
115

of which: OECD 1005.7 1000.7 1020.9 946.6 844.8 -11.0% -1.0% 23.1%
Non-OECD 2933.1 3005.5 2971.4 2940.7 2811.6 -4.7% 3.9% 76.9%
European Union # 168.1 157.3 150.6 144.6 133.6 -7.9% -3.1% 3.7%
CIS 260.3 263.5 254.0 251.5 256.8 1.8% 1.9% 7.0%
* Commercial solid fuels only, i.e. bituminous coal and anthracite (hard coal), and lignite and brown (sub-bituminous) coal, and other commercial solid fuels. Includes coal produced for Coal-to-Liquids and Coal-to-Gas transformations.
^ Less than 0.05.
w Less than 0.05%.
n/a not available.
# Excludes Estonia, Latvia and Lithuania prior to 1985 and Slovenia prior to 1990.
Notes: Annual changes and shares of total are calculated using million tonnes oil equivalent figures.
Growth rates are adjusted for leap years.
Public Record Exhibit 3
116

Coal: Consumption*Share
Million tonnes oil equivalent 2012 2013 2014 2015 2016 2016 2005-15 2016
US 437.9 454.6 453.5 391.8 358.4 -8.8% -3.8% 9.6%
Canada 21.0 20.8 19.7 19.6 18.7 -5.2% -4.2% 0.5%
Mexico 12.8 12.7 12.7 12.7 9.8 -22.9% 1.0% 0.3%
Total North America 471.8 488.1 486.0 424.2 386.9 -9.0% -3.7% 10.4%
Argentina 1.3 1.3 1.5 1.4 1.1 -22.5% 1.9% ♦
Brazil 15.3 16.5 17.5 17.7 16.5 -6.8% 3.1% 0.4%
Chile 6.7 7.5 7.6 7.3 8.2 12.3% 10.2% 0.2%
Colombia 4.6 5.0 5.2 5.3 4.6 -14.0% 14.8% 0.1%
Ecuador - - - - - - - -
Peru 0.9 0.9 0.9 0.8 0.8 - -1.3% ♦
Trinidad & Tobago - - - - - - - -
Venezuela 0.2 0.2 0.2 0.2 0.1 -66.4% 18.4% ♦
Other S. & Cent. America 2.7 2.9 3.2 3.2 3.4 5.4% 4.9% 0.1%
Total S. & Cent. America 31.7 34.2 36.1 35.9 34.7 -3.7% 5.4% 0.9%
Austria 3.2 3.3 3.0 3.2 3.2 -2.3% -2.1% 0.1%
Azerbaijan ^ ^ ^ ^ ^ - -19.8% ♦
Belarus 0.8 0.9 0.8 0.7 0.8 16.5% -0.3% ♦
Belgium 3.2 3.3 3.3 3.2 3.0 -6.7% -4.7% 0.1%
Bulgaria 6.9 5.9 6.4 6.6 5.7 -13.5% -0.4% 0.2%
Czech Republic 17.4 17.2 16.0 16.6 16.9 1.7% -2.0% 0.5%
Denmark 2.5 3.2 2.6 1.7 2.1 20.8% -7.3% 0.1%
Finland 4.5 5.0 4.5 3.8 4.1 8.0% -2.2% 0.1%
France 11.1 11.6 8.6 8.4 8.3 -1.1% -4.6% 0.2%
Germany 80.5 82.8 79.6 78.5 75.3 -4.3% -0.4% 2.0%
Greece 8.1 7.0 6.7 5.6 4.7 -16.7% -4.6% 0.1%
Hungary 2.6 2.3 2.2 2.4 2.3 -3.6% -2.5% 0.1%
Ireland 2.3 2.0 2.0 2.2 2.2 -0.7% -2.0% 0.1%
Italy 15.7 13.5 13.1 12.3 10.9 -11.9% -2.9% 0.3%
Kazakhstan 36.5 36.3 41.0 35.8 35.6 -0.8% 2.9% 1.0%
Lithuania 0.2 0.3 0.2 0.2 0.2 4.8% -0.1% ♦
Netherlands 8.2 8.2 9.1 11.0 10.3 -7.0% 3.1% 0.3%
Norway 0.8 0.8 0.9 0.8 0.8 -0.1% 1.3% ♦
Poland 51.2 53.4 49.4 48.7 48.8 ♦ -1.2% 1.3%
Portugal 2.9 2.7 2.7 3.3 2.9 -11.9% -0.2% 0.1%
Romania 7.6 5.8 5.7 5.9 5.4 -8.9% -3.9% 0.1%
Russian Federation 98.4 90.5 87.6 92.2 87.3 -5.5% -0.3% 2.3%
Slovakia 3.5 3.5 3.4 3.3 3.1 -5.0% -2.5% 0.1%
Spain 15.5 11.4 11.6 13.7 10.4 -23.9% -4.0% 0.3%
Sweden 2.2 2.2 2.1 2.1 2.2 6.0% -2.1% 0.1%
Switzerland 0.1 0.1 0.1 0.1 0.1 - -1.1% ♦
Turkey 36.5 31.6 36.1 34.7 38.4 10.3% 4.6% 1.0%
Turkmenistan - - - - - - - -
Ukraine 42.5 41.6 35.6 27.3 31.5 14.9% -3.1% 0.8%
United Kingdom 39.0 36.8 29.7 23.0 11.0 -52.5% -4.7% 0.3%
USSR n/a n/a n/a n/a n/a n/a n/a n/a
Uzbekistan 1.2 1.1 1.2 1.1 1.0 -10.1% 1.9% ♦
Other Europe & Eurasia 22.9 23.8 21.9 23.0 23.0 -0.1% 1.1% 0.6%
Total Europe & Eurasia 528.1 508.1 487.3 471.3 451.6 -4.5% -0.9% 12.1%
Growth rate per annum
Public Record Exhibit 3
117

Iran 1.1 1.4 1.6 1.6 1.7 4.3% 0.5% ♦
Israel 8.8 7.4 6.9 6.7 5.7 -15.5% -1.6% 0.2%
Kuwait - - - - - - - -
Qatar - - - - - - - -
Saudi Arabia 0.1 0.1 0.1 0.1 0.1 - 13.5% ♦
United Arab Emirates 1.7 1.4 1.5 1.3 1.3 - 24.1% ♦
Other Middle East 0.6 0.5 0.7 0.5 0.5 ♦ 13.2% ♦
Total Middle East 12.3 10.9 10.8 10.2 9.3 -9.5% 0.4% 0.2%
Algeria 0.3 0.2 0.2 0.1 0.1 - -13.2% ♦
Egypt 0.4 0.4 0.4 0.4 0.4 4.3% -7.0% ♦
South Africa 88.3 88.6 89.8 83.4 85.1 1.8% 0.4% 2.3%
Other Africa 7.0 8.3 11.9 11.4 10.3 -10.3% 3.8% 0.3%
Total Africa 96.1 97.5 102.3 95.3 95.9 0.4% 0.7% 2.6%
Australia 45.1 43.0 42.6 44.1 43.8 -0.9% -1.6% 1.2%
Bangladesh 0.9 1.0 0.8 0.7 0.8 17.0% 3.7% ♦
China 1927.8 1969.1 1954.5 1913.6 1887.6 -1.6% 3.7% 50.6%
China Hong Kong SAR 7.3 7.8 8.1 6.7 6.7 -0.3% -0.2% 0.2%
India 330.0 352.8 387.5 396.6 411.9 3.6% 6.5% 11.0%
Indonesia 53.0 57.0 45.1 51.2 62.7 22.2% 7.7% 1.7%
Japan 115.8 121.2 119.1 119.9 119.9 -0.2% 0.5% 3.2%
Malaysia 15.9 15.1 15.4 16.9 19.9 17.6% 9.4% 0.5%
New Zealand 1.7 1.5 1.5 1.4 1.2 -15.4% -4.5% ♦
Pakistan 4.0 3.2 4.7 4.7 5.4 15.1% 2.2% 0.1%
Philippines 8.1 10.0 10.6 11.6 13.5 16.0% 9.7% 0.4%
Singapore ^ 0.3 0.4 0.4 0.4 -6.5% 47.4% ♦
South Korea 81.0 81.9 84.6 85.5 81.6 -4.8% 4.6% 2.2%
Taiwan 38.0 38.6 39.0 37.8 38.6 1.7% 0.7% 1.0%
Thailand 16.5 16.3 17.9 17.6 17.7 0.7% 4.3% 0.5%
Vietnam 15.0 15.8 18.9 22.3 21.3 -4.4% 9.5% 0.6%
Other Asia Pacific 17.2 13.8 16.0 16.9 20.6 21.3% -2.3% 0.6%
Total Asia Pacific 2677.4 2748.3 2767.0 2747.7 2753.6 -0.1% 3.9% 73.8%
Total World 3817.3 3887.0 3889.4 3784.7 3732.0 -1.7% 1.9% 100.0%
of which: OECD 1047.3 1058.4 1040.9 972.7 913.3 -6.4% -1.9% 24.5%
Non-OECD 2770.0 2828.5 2848.5 2812.0 2818.7 ♦ 3.7% 75.5%
European Union # 294.3 288.0 268.4 261.1 238.4 -8.9% -1.9% 6.4%
CIS 180.7 171.8 167.8 158.9 157.9 -0.9% -0.2% 4.2%
* Commercial solid fuels only, i.e. bituminous coal and anthracite (hard coal), and lignite and brown (sub-bituminous) coal, and other commercial solid fuels.
Excludes coal converted to liquid or gaseous fuels, but includes coal consumed in transformation processes.
^ Less than 0.05.
w Less than 0.05%.
n/a not available.
# Excludes Estonia, Latvia and Lithuania prior to 1985 and Slovenia prior to 1990.
Annual changes and share of total are calculated using million tonnes oil equivalent figures.
Growth rates are adjusted for leap years.
Notes: Differences between these consumption figures and the world production statistics are accounted for by stock changes, and unadvoidable
disparities in the definition, measurement or conversion of coal supply and demand data.
Public Record Exhibit 3
118

Nuclear: Consumption*Share
Terawatt-hours 2012 2013 2014 2015 2016 2016 2005-15 2016
US 809.8 830.5 839.1 839.1 847.7 0.7% 0.2% 32.4%
Canada 94.2 102.7 106.5 100.7 102.6 1.6% 1.0% 3.9%
Mexico 8.8 11.8 9.7 11.6 10.6 -9.0% 0.7% 0.4%
Total North America 912.8 945.1 955.3 951.4 960.9 0.7% 0.3% 36.7%
Argentina 6.4 6.2 5.8 7.1 8.4 17.5% 0.4% 0.3%
Brazil 16.0 15.4 15.4 14.7 15.9 7.5% 4.1% 0.6%
Chile - - - - - - - -
Colombia - - - - - - - -
Ecuador - - - - - - - -
Peru - - - - - - - -
Trinidad & Tobago - - - - - - - -
Venezuela - - - - - - - -
Other S. & Cent. America - - - - - - - -
Total S. & Cent. America 22.4 21.7 21.2 21.9 24.3 10.7% 2.7% 0.9%
Austria - - - - - - - -
Azerbaijan - - - - - - - -
Belarus - - - - - - - -
Belgium 40.3 42.6 33.7 26.1 43.5 66.3% -5.8% 1.7%
Bulgaria 15.8 14.2 15.9 15.4 15.8 2.3% -1.8% 0.6%
Czech Republic 30.3 30.7 30.3 26.8 24.1 -10.4% 0.8% 0.9%
Denmark - - - - - - - -
Finland 23.2 23.9 23.8 23.5 23.5 -0.5% ♦ 0.9%
France 425.4 423.7 436.5 437.4 403.2 -8.1% -0.3% 15.4%
Germany 99.5 97.3 97.1 91.8 84.6 -8.0% -5.6% 3.2%
Greece - - - - - - - -
Hungary 15.8 15.4 15.6 15.8 16.1 1.1% 1.4% 0.6%
Ireland - - - - - - - -
Italy - - - - - - - -
Kazakhstan - - - - - - - -
Lithuania - - - - - - - -
Netherlands 3.9 2.9 4.1 4.1 4.1 0.7% 0.2% 0.2%
Norway - - - - - - - -
Poland - - - - - - - -
Portugal - - - - - - - -
Romania 11.5 11.6 11.7 11.6 11.3 -3.3% 7.7% 0.4%
Russian Federation 177.7 173.0 180.8 195.5 196.6 0.3% 2.8% 7.5%
Slovakia 15.5 15.7 15.5 15.1 14.8 -2.7% -1.6% 0.6%
Spain 61.5 56.7 57.3 57.3 58.7 2.2% ♦ 2.2%
Sweden 64.0 66.5 64.9 56.3 62.8 11.1% -2.5% 2.4%
Switzerland 25.6 26.2 27.8 23.3 21.3 -8.7% ♦ 0.8%
Turkey - - - - - - - -
Turkmenistan - - - - - - - -
Ukraine 90.1 83.2 88.4 87.6 81.0 -7.9% -0.1% 3.1%
United Kingdom 70.4 70.6 63.7 70.3 71.7 1.7% -1.5% 2.7%
USSR n/a n/a n/a n/a n/a n/a n/a n/a
Uzbekistan - - - - - - - -
Other Europe & Eurasia 7.8 7.7 8.8 8.4 8.1 -4.3% -0.2% 0.3%
Total Europe & Eurasia 1178.4 1161.8 1175.9 1166.5 1141.1 -2.4% -0.8% 43.6%
Growth rate per annum
Public Record Exhibit 3
119
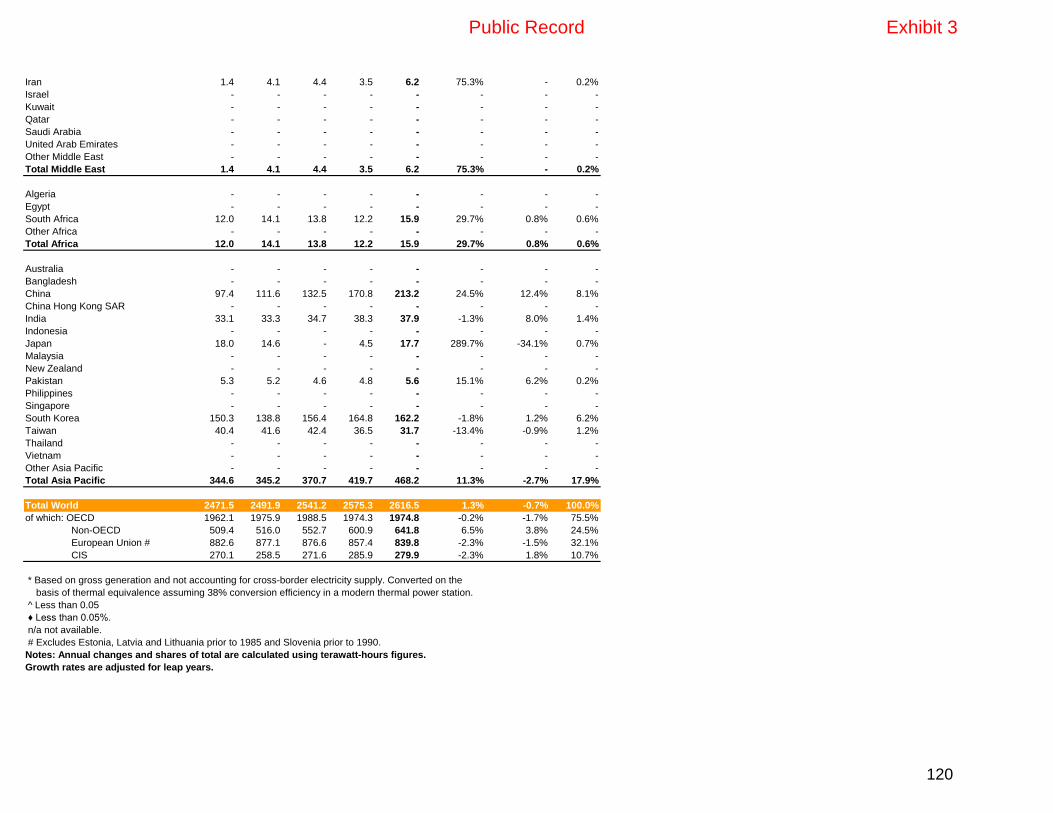
Iran 1.4 4.1 4.4 3.5 6.2 75.3% - 0.2%
Israel - - - - - - - -
Kuwait - - - - - - - -
Qatar - - - - - - - -
Saudi Arabia - - - - - - - -
United Arab Emirates - - - - - - - -
Other Middle East - - - - - - - -
Total Middle East 1.4 4.1 4.4 3.5 6.2 75.3% - 0.2%
Algeria - - - - - - - -
Egypt - - - - - - - -
South Africa 12.0 14.1 13.8 12.2 15.9 29.7% 0.8% 0.6%
Other Africa - - - - - - - -
Total Africa 12.0 14.1 13.8 12.2 15.9 29.7% 0.8% 0.6%
Australia - - - - - - - -
Bangladesh - - - - - - - -
China 97.4 111.6 132.5 170.8 213.2 24.5% 12.4% 8.1%
China Hong Kong SAR - - - - - - - -
India 33.1 33.3 34.7 38.3 37.9 -1.3% 8.0% 1.4%
Indonesia - - - - - - - -
Japan 18.0 14.6 - 4.5 17.7 289.7% -34.1% 0.7%
Malaysia - - - - - - - -
New Zealand - - - - - - - -
Pakistan 5.3 5.2 4.6 4.8 5.6 15.1% 6.2% 0.2%
Philippines - - - - - - - -
Singapore - - - - - - - -
South Korea 150.3 138.8 156.4 164.8 162.2 -1.8% 1.2% 6.2%
Taiwan 40.4 41.6 42.4 36.5 31.7 -13.4% -0.9% 1.2%
Thailand - - - - - - - -
Vietnam - - - - - - - -
Other Asia Pacific - - - - - - - -
Total Asia Pacific 344.6 345.2 370.7 419.7 468.2 11.3% -2.7% 17.9%
Total World 2471.5 2491.9 2541.2 2575.3 2616.5 1.3% -0.7% 100.0%
of which: OECD 1962.1 1975.9 1988.5 1974.3 1974.8 -0.2% -1.7% 75.5%
Non-OECD 509.4 516.0 552.7 600.9 641.8 6.5% 3.8% 24.5%
European Union # 882.6 877.1 876.6 857.4 839.8 -2.3% -1.5% 32.1%
CIS 270.1 258.5 271.6 285.9 279.9 -2.3% 1.8% 10.7%
* Based on gross generation and not accounting for cross-border electricity supply. Converted on the
basis of thermal equivalence assuming 38% conversion efficiency in a modern thermal power station.
^ Less than 0.05
♦ Less than 0.05%.
n/a not available.
# Excludes Estonia, Latvia and Lithuania prior to 1985 and Slovenia prior to 1990.
Notes: Annual changes and shares of total are calculated using terawatt-hours figures.
Growth rates are adjusted for leap years.
Public Record Exhibit 3
120

Nuclear: Consumption*Share
Million tonnes oil equivalent 2012 2013 2014 2015 2016 2016 2005-15 2016
US 183.2 187.9 189.9 189.9 191.8 0.7% 0.2% 32.4%
Canada 21.3 23.2 24.1 22.8 23.2 1.6% 1.0% 3.9%
Mexico 2.0 2.7 2.2 2.6 2.4 -9.0% 0.7% 0.4%
Total North America 206.5 213.8 216.2 215.3 217.4 0.7% 0.3% 36.7%
Argentina 1.4 1.4 1.3 1.6 1.9 17.5% 0.4% 0.3%
Brazil 3.6 3.5 3.5 3.3 3.6 7.5% 4.1% 0.6%
Chile - - - - - - - -
Colombia - - - - - - - -
Ecuador - - - - - - - -
Peru - - - - - - - -
Trinidad & Tobago - - - - - - - -
Venezuela - - - - - - - -
Other S. & Cent. America - - - - - - - -
Total S. & Cent. America 5.1 4.9 4.8 5.0 5.5 10.7% 2.7% 0.9%
Austria - - - - - - - -
Azerbaijan - - - - - - - -
Belarus - - - - - - - -
Belgium 9.1 9.6 7.6 5.9 9.8 66.3% -5.8% 1.7%
Bulgaria 3.6 3.2 3.6 3.5 3.6 2.3% -1.8% 0.6%
Czech Republic 6.9 7.0 6.9 6.1 5.5 -10.4% 0.8% 0.9%
Denmark - - - - - - - -
Finland 5.3 5.4 5.4 5.3 5.3 -0.5% ♦ 0.9%
France 96.3 95.9 98.8 99.0 91.2 -8.1% -0.3% 15.4%
Germany 22.5 22.0 22.0 20.8 19.1 -8.0% -5.6% 3.2%
Greece - - - - - - - -
Hungary 3.6 3.5 3.5 3.6 3.6 1.1% 1.4% 0.6%
Ireland - - - - - - - -
Italy - - - - - - - -
Kazakhstan - - - - - - - -
Lithuania - - - - - - - -
Netherlands 0.9 0.7 0.9 0.9 0.9 0.7% 0.2% 0.2%
Norway - - - - - - - -
Poland - - - - - - - -
Portugal - - - - - - - -
Romania 2.6 2.6 2.6 2.6 2.6 -3.3% 7.7% 0.4%
Russian Federation 40.2 39.1 40.9 44.2 44.5 0.3% 2.8% 7.5%
Slovakia 3.5 3.6 3.5 3.4 3.3 -2.7% -1.6% 0.6%
Spain 13.9 12.8 13.0 13.0 13.3 2.2% ♦ 2.2%
Sweden 14.5 15.0 14.7 12.8 14.2 11.1% -2.5% 2.4%
Switzerland 5.8 5.9 6.3 5.3 4.8 -8.7% ♦ 0.8%
Turkey - - - - - - - -
Turkmenistan - - - - - - - -
Ukraine 20.4 18.8 20.0 19.8 18.3 -7.9% -0.1% 3.1%
United Kingdom 15.9 16.0 14.4 15.9 16.2 1.7% -1.5% 2.7%
USSR n/a n/a n/a n/a n/a n/a n/a n/a
Uzbekistan - - - - - - - -
Other Europe & Eurasia 1.8 1.7 2.0 1.9 1.8 -4.3% -0.2% 0.3%
Total Europe & Eurasia 266.6 262.9 266.1 263.9 258.2 -2.4% -0.8% 43.6%
Growth rate per annum
Public Record Exhibit 3
121

Iran 0.3 0.9 1.0 0.8 1.4 75.3% - 0.2%
Israel - - - - - - - -
Kuwait - - - - - - - -
Qatar - - - - - - - -
Saudi Arabia - - - - - - - -
United Arab Emirates - - - - - - - -
Other Middle East - - - - - - - -
Total Middle East 0.3 0.9 1.0 0.8 1.4 75.3% - 0.2%
Algeria - - - - - - - -
Egypt - - - - - - - -
South Africa 2.7 3.2 3.1 2.8 3.6 29.7% 0.8% 0.6%
Other Africa - - - - - - - -
Total Africa 2.7 3.2 3.1 2.8 3.6 29.7% 0.8% 0.6%
Australia - - - - - - - -
Bangladesh - - - - - - - -
China 22.0 25.3 30.0 38.6 48.2 24.5% 12.4% 8.1%
China Hong Kong SAR - - - - - - - -
India 7.5 7.5 7.8 8.7 8.6 -1.3% 8.0% 1.4%
Indonesia - - - - - - - -
Japan 4.1 3.3 - 1.0 4.0 289.7% -34.1% 0.7%
Malaysia - - - - - - - -
New Zealand - - - - - - - -
Pakistan 1.2 1.2 1.1 1.1 1.3 15.1% 6.2% 0.2%
Philippines - - - - - - - -
Singapore - - - - - - - -
South Korea 34.0 31.4 35.4 37.3 36.7 -1.8% 1.2% 6.2%
Taiwan 9.1 9.4 9.6 8.3 7.2 -13.4% -0.9% 1.2%
Thailand - - - - - - - -
Vietnam - - - - - - - -
Other Asia Pacific - - - - - - - -
Total Asia Pacific 78.0 78.1 83.9 95.0 105.9 11.3% -2.7% 17.9%
Total World 559.2 563.9 575.0 582.7 592.1 1.3% -0.7% 100.0%
of which: OECD 444.0 447.1 449.9 446.7 446.8 -0.2% -1.7% 75.5%
Non-OECD 115.3 116.8 125.1 136.0 145.2 6.5% 3.8% 24.5%
European Union # 199.7 198.5 198.3 194.0 190.0 -2.3% -1.5% 32.1%
CIS 61.1 58.5 61.5 64.7 63.3 -2.3% 1.8% 10.7%
* Based on gross generation and not accounting for cross-border electricity supply. Converted on the
basis of thermal equivalence assuming 38% conversion efficiency in a modern thermal power station.
^ Less than 0.05
♦ Less than 0.05%.
n/a not available.
# Excludes Estonia, Latvia and Lithuania prior to 1985 and Slovenia prior to 1990.
Notes: Annual changes and share of total are calculated using million tonnes oil equivalent figures.
Growth rates are adjusted for leap years.
Public Record Exhibit 3
122

Hydroelectricity: Consumption*Share
Terawatt-hours 2012 2013 2014 2015 2016 2016 2005-15 2016
US 274.0 266.5 255.8 246.5 261.8 5.9% -0.8% 6.5%
Canada 380.4 391.9 382.6 377.6 388.2 2.5% 0.4% 9.7%
Mexico 31.9 28.0 38.9 30.9 30.0 -3.3% 1.1% 0.7%
Total North America 686.3 686.4 677.3 655.0 680.0 3.5% ♦ 16.9%
Argentina 37.3 41.1 41.3 42.3 38.4 -9.4% 0.7% 1.0%
Brazil 415.3 391.0 373.4 359.7 384.3 6.5% 0.6% 9.6%
Chile 20.2 19.6 23.6 24.0 19.5 -18.8% -0.6% 0.5%
Colombia 47.6 44.4 44.7 44.7 47.0 5.0% 1.3% 1.2%
Ecuador 12.2 11.0 11.5 13.1 15.6 18.7% 6.6% 0.4%
Peru 22.0 22.3 22.2 23.7 23.8 0.3% 2.8% 0.6%
Trinidad & Tobago - - - - - - - -
Venezuela 81.7 83.4 73.9 76.3 61.2 -20.0% -0.1% 1.5%
Other S. & Cent. America 94.7 97.0 92.1 91.8 99.7 8.3% 1.2% 2.5%
Total S. & Cent. America 731.2 709.8 682.8 675.6 689.5 1.8% 0.8% 17.1%
Austria 43.8 42.0 41.0 37.1 39.7 6.8% ♦ 1.0%
Azerbaijan 1.8 1.5 1.3 1.6 2.0 19.3% -5.9% ♦
Belarus 0.1 0.1 0.1 0.1 0.1 - 11.5% ♦
Belgium 0.4 0.4 0.3 0.3 0.4 22.4% 1.0% ♦
Bulgaria 3.2 4.1 4.6 5.7 3.9 -32.1% 2.9% 0.1%
Czech Republic 2.2 2.9 1.9 1.8 2.0 11.1% -2.8% ♦
Denmark ^ ^ ^ ^ ^ 2.8% -2.2% ♦
Finland 16.8 12.8 13.4 16.8 15.8 -6.1% 2.1% 0.4%
France 59.6 70.2 62.4 54.4 59.5 9.2% 0.5% 1.5%
Germany 22.1 23.0 19.6 19.0 21.0 10.4% -0.3% 0.5%
Greece 4.4 6.3 4.5 6.1 5.4 -12.3% 2.0% 0.1%
Hungary 0.2 0.2 0.3 0.2 0.3 11.1% 1.5% ♦
Ireland 0.8 0.6 0.7 0.8 0.7 -15.8% 2.5% ♦
Italy 41.9 52.8 58.5 45.5 41.0 -10.2% 2.4% 1.0%
Kazakhstan 7.6 7.7 8.3 9.3 9.3 - 1.7% 0.2%
Lithuania 0.4 0.5 0.4 0.3 0.5 29.8% -2.5% ♦
Netherlands 0.1 0.1 0.1 0.1 0.1 16.3% 0.6% ♦
Norway 141.7 128.2 135.4 137.4 143.4 4.1% 0.1% 3.6%
Poland 2.0 2.4 2.2 1.8 2.1 16.5% -1.8% 0.1%
Portugal 5.6 13.7 15.6 8.7 15.8 81.9% 6.2% 0.4%
Romania 12.1 14.8 18.5 16.6 17.9 7.4% -1.9% 0.4%
Russian Federation 164.5 179.4 174.9 169.9 186.6 9.5% -0.3% 4.6%
Slovakia 4.0 4.7 4.3 4.1 4.5 9.9% -1.1% 0.1%
Spain 20.5 36.8 39.2 27.9 35.6 27.3% 4.5% 0.9%
Sweden 78.9 61.4 63.8 75.3 62.4 -17.4% 0.4% 1.5%
Switzerland 37.9 37.8 37.4 37.6 34.4 -8.7% 1.9% 0.9%
Turkey 57.9 59.4 40.6 67.1 67.2 -0.2% 5.4% 1.7%
Turkmenistan - - - - - - -100.0% -
Ukraine 10.5 13.8 8.5 5.4 7.2 32.2% -8.0% 0.2%
United Kingdom 5.3 4.7 5.9 6.3 5.4 -14.9% 2.5% 0.1%
USSR n/a n/a n/a n/a n/a n/a n/a n/a
Uzbekistan 11.2 11.6 11.8 11.8 11.9 - 3.2% 0.3%
Other Europe & Eurasia 88.0 100.1 96.6 91.4 96.1 4.9% 0.4% 2.4%
Total Europe & Eurasia 845.7 894.1 872.1 860.3 891.7 3.4% 0.7% 22.2%
Growth rate per annum
Public Record Exhibit 3
123

Iran 12.1 14.9 15.1 18.1 12.8 -29.3% 3.3% 0.3%
Israel ^ ^ ^ ^ ^ - -1.5% ♦
Kuwait - - - - - - - -
Qatar - - - - - - - -
Saudi Arabia - - - - - - - -
United Arab Emirates - - - - - - - -
Other Middle East 10.2 9.0 6.0 8.0 8.0 -0.6% -1.7% 0.2%
Total Middle East 22.3 24.0 21.1 26.2 20.9 -20.5% 1.5% 0.5%
Algeria 0.4 0.1 0.2 0.1 0.1 -50.5% -12.6% ♦
Egypt 14.1 12.9 14.0 14.0 14.0 - 1.0% 0.3%
South Africa 1.2 1.2 1.0 0.8 1.0 32.2% -5.1% ♦
Other Africa 97.2 104.0 108.5 104.0 99.0 -5.1% 3.4% 2.5%
Total Africa 112.9 118.2 123.7 118.9 114.1 -4.3% 2.9% 2.8%
Australia 17.1 19.1 14.5 13.9 17.9 27.7% -1.0% 0.4%
Bangladesh 0.8 0.7 0.6 0.9 0.9 -1.8% 1.8% ♦
China 862.8 909.6 1051.1 1114.5 1162.8 4.0% 10.9% 28.9%
China Hong Kong SAR - - - - - - - -
India 115.8 132.0 139.0 133.3 128.8 -3.6% 3.2% 3.2%
Indonesia 12.8 16.9 15.1 13.7 14.4 4.8% 2.5% 0.4%
Japan 76.1 78.0 80.0 83.8 80.0 -4.9% 0.8% 2.0%
Malaysia 9.2 11.7 13.4 15.5 18.5 19.5% 9.9% 0.5%
New Zealand 22.9 23.1 24.4 24.6 26.0 5.4% 0.5% 0.6%
Pakistan 29.5 30.9 31.9 32.3 34.0 5.2% 0.5% 0.8%
Philippines 10.3 10.0 9.1 8.7 9.3 6.7% 0.3% 0.2%
Singapore - - - - - - - -
South Korea 4.0 4.3 2.8 2.1 2.5 14.1% -5.2% 0.1%
Taiwan 5.7 5.4 4.3 4.5 6.6 46.2% 1.2% 0.2%
Thailand 8.4 5.4 5.2 3.8 3.5 -6.0% -4.0% 0.1%
Vietnam 52.8 57.1 60.0 57.1 60.5 5.7% 13.2% 1.5%
Other Asia Pacific 51.1 60.3 57.7 58.7 61.2 3.9% 6.7% 1.5%
Total Asia Pacific 1279.0 1364.6 1509.1 1567.3 1626.8 3.5% 8.0% 40.4%
Total World 3677.3 3797.2 3886.1 3903.3 4022.9 2.8% 2.9% 100.0%
of which: OECD 1389.1 1408.7 1388.7 1369.4 1400.3 2.0% 0.6% 34.8%
Non-OECD 2288.2 2388.5 2497.4 2533.9 2622.7 3.2% 4.5% 65.2%
European Union # 337.2 370.9 374.5 341.0 347.8 1.7% 0.9% 8.6%
CIS 229.4 246.7 236.9 228.6 248.3 8.3% -0.5% 6.2%
* Based on gross primary hydroelectric generation and not accounting for cross-border electricity supply. Converted on the
basis of thermal equivalence assuming 38% conversion efficiency in a modern thermal power station.
^ Less than 0.05.
♦ Less than 0.05%.
n/a not available.
# Excludes Estonia, Latvia and Lithuania prior to 1985 and Slovenia prior to 1990.
Notes: Annual changes and shares of total are calculated using terawatt-hours figures.
Growth rates are adjusted for leap years.
Public Record Exhibit 3
124

Hydroelectricity: Consumption*Share
Million tonnes oil equivalent 2012 2013 2014 2015 2016 2016 2005-15 2016
US 62.0 60.3 57.9 55.8 59.2 5.9% -0.8% 6.5%
Canada 86.1 88.7 86.6 85.4 87.8 2.5% 0.4% 9.7%
Mexico 7.2 6.3 8.8 7.0 6.8 -3.3% 1.1% 0.7%
Total North America 155.3 155.3 153.2 148.2 153.9 3.5% ♦ 16.9%
Argentina 8.4 9.3 9.3 9.6 8.7 -9.4% 0.7% 1.0%
Brazil 94.0 88.5 84.5 81.4 86.9 6.5% 0.6% 9.6%
Chile 4.6 4.4 5.3 5.4 4.4 -18.8% -0.6% 0.5%
Colombia 10.8 10.0 10.1 10.1 10.6 5.0% 1.3% 1.2%
Ecuador 2.8 2.5 2.6 3.0 3.5 18.7% 6.6% 0.4%
Peru 5.0 5.1 5.0 5.4 5.4 0.3% 2.8% 0.6%
Trinidad & Tobago - - - - - - - -
Venezuela 18.5 18.9 16.7 17.3 13.9 -20.0% -0.1% 1.5%
Other S. & Cent. America 21.4 21.9 20.8 20.8 22.5 8.3% 1.2% 2.5%
Total S. & Cent. America 165.4 160.6 154.5 152.9 156.0 1.8% 0.8% 17.1%
Austria 9.9 9.5 9.3 8.4 9.0 6.8% ♦ 1.0%
Azerbaijan 0.4 0.3 0.3 0.4 0.4 19.3% -5.9% ♦
Belarus ^ ^ ^ ^ ^ - 11.5% ♦
Belgium 0.1 0.1 0.1 0.1 0.1 22.4% 1.0% ♦
Bulgaria 0.7 0.9 1.0 1.3 0.9 -32.1% 2.9% 0.1%
Czech Republic 0.5 0.6 0.4 0.4 0.5 11.1% -2.8% ♦
Denmark ^ ^ ^ ^ ^ 2.8% -2.2% ♦
Finland 3.8 2.9 3.0 3.8 3.6 -6.1% 2.1% 0.4%
France 13.5 15.9 14.1 12.3 13.5 9.2% 0.5% 1.5%
Germany 5.0 5.2 4.4 4.3 4.8 10.4% -0.3% 0.5%
Greece 1.0 1.4 1.0 1.4 1.2 -12.3% 2.0% 0.1%
Hungary ^ ^ 0.1 0.1 0.1 11.1% 1.5% ♦
Ireland 0.2 0.1 0.2 0.2 0.2 -15.8% 2.5% ♦
Italy 9.5 11.9 13.2 10.3 9.3 -10.2% 2.4% 1.0%
Kazakhstan 1.7 1.7 1.9 2.1 2.1 - 1.7% 0.2%
Lithuania 0.1 0.1 0.1 0.1 0.1 29.8% -2.5% ♦
Netherlands ^ ^ ^ ^ ^ 16.3% 0.6% ♦
Norway 32.1 29.0 30.6 31.1 32.4 4.1% 0.1% 3.6%
Poland 0.5 0.6 0.5 0.4 0.5 16.5% -1.8% 0.1%
Portugal 1.3 3.1 3.5 2.0 3.6 81.9% 6.2% 0.4%
Romania 2.7 3.3 4.2 3.8 4.1 7.4% -1.9% 0.4%
Russian Federation 37.2 40.6 39.6 38.5 42.2 9.5% -0.3% 4.6%
Slovakia 0.9 1.1 1.0 0.9 1.0 9.9% -1.1% 0.1%
Spain 4.6 8.3 8.9 6.3 8.1 27.3% 4.5% 0.9%
Sweden 17.9 13.9 14.4 17.0 14.1 -17.4% 0.4% 1.5%
Switzerland 8.6 8.6 8.5 8.5 7.8 -8.7% 1.9% 0.9%
Turkey 13.1 13.4 9.2 15.2 15.2 -0.2% 5.4% 1.7%
Turkmenistan - - - - - - -100.0% -
Ukraine 2.4 3.1 1.9 1.2 1.6 32.2% -8.0% 0.2%
United Kingdom 1.2 1.1 1.3 1.4 1.2 -14.9% 2.5% 0.1%
USSR n/a n/a n/a n/a n/a n/a n/a n/a
Uzbekistan 2.5 2.6 2.7 2.7 2.7 - 3.2% 0.3%
Other Europe & Eurasia 19.9 22.7 21.9 20.7 21.7 4.9% 0.4% 2.4%
Total Europe & Eurasia 191.4 202.3 197.3 194.7 201.8 3.4% 0.7% 22.2%
Growth rate per annum
Public Record Exhibit 3
125

Iran 2.7 3.4 3.4 4.1 2.9 -29.3% 3.3% 0.3%
Israel ^ ^ ^ ^ ^ - -1.5% ♦
Kuwait - - - - - - - -
Qatar - - - - - - - -
Saudi Arabia - - - - - - - -
United Arab Emirates - - - - - - - -
Other Middle East 2.3 2.0 1.4 1.8 1.8 -0.6% -1.7% 0.2%
Total Middle East 5.0 5.4 4.8 5.9 4.7 -20.5% 1.5% 0.5%
Algeria 0.1 ^ ^ ^ ^ -50.5% -12.6% ♦
Egypt 3.2 2.9 3.2 3.2 3.2 - 1.0% 0.3%
South Africa 0.3 0.3 0.2 0.2 0.2 32.2% -5.1% ♦
Other Africa 22.0 23.5 24.6 23.5 22.4 -5.1% 3.4% 2.5%
Total Africa 25.5 26.8 28.0 26.9 25.8 -4.3% 2.9% 2.8%
Australia 3.9 4.3 3.3 3.2 4.0 27.7% -1.0% 0.4%
Bangladesh 0.2 0.2 0.1 0.2 0.2 -1.8% 1.8% ♦
China 195.2 205.8 237.8 252.2 263.1 4.0% 10.9% 28.9%
China Hong Kong SAR - - - - - - - -
India 26.2 29.9 31.5 30.2 29.1 -3.6% 3.2% 3.2%
Indonesia 2.9 3.8 3.4 3.1 3.3 4.8% 2.5% 0.4%
Japan 17.2 17.7 18.1 19.0 18.1 -4.9% 0.8% 2.0%
Malaysia 2.1 2.6 3.0 3.5 4.2 19.5% 9.9% 0.5%
New Zealand 5.2 5.2 5.5 5.6 5.9 5.4% 0.5% 0.6%
Pakistan 6.7 7.0 7.2 7.3 7.7 5.2% 0.5% 0.8%
Philippines 2.3 2.3 2.1 2.0 2.1 6.7% 0.3% 0.2%
Singapore - - - - - - - -
South Korea 0.9 1.0 0.6 0.5 0.6 14.1% -5.2% 0.1%
Taiwan 1.3 1.2 1.0 1.0 1.5 46.2% 1.2% 0.2%
Thailand 1.9 1.2 1.2 0.9 0.8 -6.0% -4.0% 0.1%
Vietnam 11.9 12.9 13.6 12.9 13.7 5.7% 13.2% 1.5%
Other Asia Pacific 11.6 13.6 13.1 13.3 13.8 3.9% 6.7% 1.5%
Total Asia Pacific 289.4 308.8 341.5 354.7 368.1 3.5% 8.0% 40.4%
Total World 832.1 859.2 879.3 883.2 910.3 2.8% 2.9% 100.0%
of which: OECD 314.3 318.8 314.2 309.9 316.8 2.0% 0.6% 34.8%
Non-OECD 517.8 540.5 565.1 573.4 593.4 3.2% 4.5% 65.2%
European Union # 76.3 83.9 84.7 77.2 78.7 1.7% 0.9% 8.6%
CIS 51.9 55.8 53.6 51.7 56.2 8.3% -0.5% 6.2%
* Based on gross primary hydroelectric generation and not accounting for cross-border electricity supply. Converted on the
basis of thermal equivalence assuming 38% conversion efficiency in a modern thermal power station.
^ Less than 0.05.
♦ Less than 0.05%.
n/a not available.
# Excludes Estonia, Latvia and Lithuania prior to 1985 and Slovenia prior to 1990.
Notes: Annual changes and share of total are calculated using million tonnes oil equivalent figures.
Growth rates are adjusted for leap years.
Public Record Exhibit 3
126

Renewables: Consumption*Share
Terawatt-hours 2012 2013 2014 2015 2016 2016 2005-15 2016
US 228.3 266.2 296.8 315.8 370.2 16.9% 13.2% 20.0%
Canada 24.7 28.3 30.7 37.4 40.6 8.1% 13.8% 2.2%
Mexico 10.1 11.6 13.8 16.4 18.2 10.4% 7.2% 1.0%
Total North America 263.2 306.1 341.3 369.7 428.9 15.7% 12.9% 23.1%
Argentina 2.6 2.8 3.6 2.8 2.9 5.0% 8.4% 0.2%
Brazil 40.3 47.1 58.6 70.7 83.9 18.4% 17.8% 4.5%
Chile 5.2 6.3 7.3 8.4 10.1 19.9% 16.7% 0.5%
Colombia 1.3 1.3 1.7 1.8 2.1 15.4% 12.8% 0.1%
Ecuador 0.3 0.4 0.5 0.5 0.6 12.6% 18.1% ♦
Peru 0.7 1.2 1.7 1.9 2.5 29.9% 18.5% 0.1%
Trinidad & Tobago ^ ^ ^ ^ ^ - -14.1% ♦
Venezuela ^ ^ ^ ^ ^ - - ♦
Other S. & Cent. America 11.7 13.4 15.7 20.0 22.4 11.9% 14.5% 1.2%
Total S. & Cent. America 62.2 72.4 89.2 106.1 124.6 17.1% 16.6% 6.7%
Austria 7.4 8.4 8.9 10.2 10.8 6.0% 10.5% 0.6%
Azerbaijan - 0.1 0.1 0.1 0.2 66.3% - ♦
Belarus 0.1 0.1 0.1 0.2 0.3 100.5% 65.2% ♦
Belgium 10.1 11.3 11.9 14.1 14.0 -1.7% 22.8% 0.8%
Bulgaria 2.1 2.8 2.8 3.1 3.2 1.5% 90.3% 0.2%
Czech Republic 6.0 6.5 7.3 7.6 7.4 -3.5% 27.5% 0.4%
Denmark 14.8 16.0 18.0 18.9 17.9 -5.7% 6.8% 1.0%
Finland 11.6 12.7 12.8 13.7 14.9 8.6% 3.5% 0.8%
France 24.4 25.8 28.8 35.0 36.1 2.9% 21.8% 1.9%
Germany 120.3 128.3 141.8 168.4 167.4 -0.9% 14.7% 9.0%
Greece 5.7 8.0 7.7 8.8 9.2 4.7% 20.2% 0.5%
Hungary 2.4 2.6 2.8 3.0 3.5 15.8% 6.3% 0.2%
Ireland 4.5 5.0 5.7 7.1 6.7 -5.8% 19.0% 0.4%
Italy 50.3 59.2 62.1 63.4 66.3 4.3% 16.4% 3.6%
Kazakhstan ^ ^ ^ 0.2 0.4 95.1% - ♦
Lithuania 0.8 1.0 1.1 1.3 1.6 20.0% 65.2% 0.1%
Netherlands 12.4 12.1 11.6 13.6 13.7 0.8% 6.3% 0.7%
Norway 1.9 2.2 2.5 2.7 2.3 -14.6% 12.5% 0.1%
Poland 14.8 14.6 17.7 20.9 20.5 -1.8% 28.9% 1.1%
Portugal 13.8 15.7 16.0 15.7 16.5 4.4% 16.2% 0.9%
Romania 2.9 5.2 6.5 9.6 9.0 -6.0% 109.1% 0.5%
Russian Federation 0.5 0.5 0.6 0.7 0.7 6.9% 4.0% ♦
Slovakia 1.4 1.5 2.0 2.2 2.2 1.8% 49.5% 0.1%
Spain 66.4 71.9 71.1 69.1 68.7 -0.9% 10.8% 3.7%
Sweden 19.4 21.3 22.0 27.1 27.0 -0.8% 12.4% 1.5%
Switzerland 2.0 2.3 2.7 2.9 3.5 17.6% 10.3% 0.2%
Turkey 7.5 10.1 12.3 17.0 22.8 33.8% 51.0% 1.2%
Turkmenistan ^ ^ ^ ^ ^ 27.0% - ♦
Ukraine 0.8 1.3 1.7 1.7 1.5 -12.4% 46.9% 0.1%
United Kingdom 35.8 48.6 58.7 77.3 77.4 -0.1% 20.4% 4.2%
USSR n/a n/a n/a n/a n/a n/a n/a n/a
Uzbekistan - ^ ^ ^ ^ 50.0% - ♦
Other Europe & Eurasia 8.5 8.9 9.7 10.3 11.2 7.7% 17.2% 0.6%
Total Europe & Eurasia 448.5 504.2 547.2 625.7 636.6 1.5% 15.0% 34.3%
Growth rate per annum
Public Record Exhibit 3
127

Iran 0.2 0.4 0.4 0.4 0.5 2.6% 20.0% ♦
Israel 0.5 0.5 0.9 1.3 1.7 37.1% 60.6% 0.1%
Kuwait - - ^ ^ ^ 580.0% - ♦
Qatar ^ ^ ^ ^ ^ 10.0% - ♦
Saudi Arabia ^ ^ 0.1 0.1 0.1 14.3% - ♦
United Arab Emirates ^ 0.1 0.3 0.3 0.3 2.6% - ♦
Other Middle East ^ ^ 0.1 0.2 0.7 196.8% 39.9% ♦
Total Middle East 0.7 1.1 1.7 2.3 3.3 42.0% 38.4% 0.2%
Algeria ^ ^ 0.1 0.1 0.2 190.2% - ♦
Egypt 1.3 1.3 1.3 1.9 2.6 35.5% 13.3% 0.1%
South Africa 0.4 0.6 2.5 6.1 7.8 26.3% 35.3% 0.4%
Other Africa 4.5 5.7 7.9 10.6 11.6 9.6% 16.6% 0.6%
Total Africa 6.3 7.6 11.8 18.7 22.2 18.5% 19.6% 1.2%
Australia 13.2 16.4 18.3 21.1 23.7 12.0% 14.9% 1.3%
Bangladesh 0.1 0.1 0.1 0.2 0.2 15.3% 40.8% ♦
China 130.1 186.9 224.3 284.5 380.6 33.4% 44.1% 20.5%
China Hong Kong SAR 0.1 0.1 0.1 0.1 0.1 -0.4% - ♦
India 45.9 51.2 52.8 56.2 72.8 29.2% 18.8% 3.9%
Indonesia 9.7 9.7 10.3 10.5 11.3 7.1% 4.7% 0.6%
Japan 34.2 41.2 52.2 65.5 83.2 26.7% 10.0% 4.5%
Malaysia 1.5 1.2 1.1 1.2 1.5 21.6% - 0.1%
New Zealand 8.9 9.0 10.1 10.8 10.8 -0.2% 10.0% 0.6%
Pakistan 0.1 0.3 0.8 1.3 2.0 47.0% - 0.1%
Philippines 10.5 9.9 10.7 12.3 13.7 10.8% 2.2% 0.7%
Singapore 0.6 0.7 0.8 0.9 1.0 14.8% 6.2% 0.1%
South Korea 8.6 10.2 14.7 17.3 19.0 9.6% 45.6% 1.0%
Taiwan 3.5 3.9 4.1 4.5 4.6 1.8% 8.8% 0.2%
Thailand 5.2 7.2 9.0 10.0 12.5 24.4% 18.3% 0.7%
Vietnam 0.1 0.1 0.1 0.2 0.3 40.5% 15.9% ♦
Other Asia Pacific 0.8 1.0 1.2 1.4 1.4 1.3% 20.8% 0.1%
Total Asia Pacific 273.2 349.3 410.9 498.1 638.6 27.9% 21.1% 34.4%
Total World 1054.1 1240.7 1402.1 1620.6 1854.2 14.1% 16.1% 100.0%
of which: OECD 774.1 881.3 976.7 1100.0 1193.6 8.2% 13.9% 64.4%
Non-OECD 280.0 359.5 425.5 520.6 660.7 26.6% 23.4% 35.6%
European Union # 430.5 482.1 521.6 594.8 599.4 0.5% 14.8% 32.3%
CIS 1.4 2.0 2.6 2.9 3.1 7.8% 19.1% 0.2%
* Based on gross generation from renewable sources including wind, geothermal, solar, biomass and waste, and not accounting for cross-border electricity supply.
Converted on the basis of thermal equivalence assuming 38% conversion efficiency in a modern thermal power station.
^ Less than 0.05.
♦ Less than 0.05%.
n/a not available.
# Excludes Estonia, Latvia and Lithuania prior to 1985 and Slovenia prior to 1990.
Notes: Annual changes and shares of total are calculated using terawatt-hours figures.
Growth rates are adjusted for leap years.
Public Record Exhibit 3
128

Renewables: Consumption*Share
Million tonnes oil equivalent 2012 2013 2014 2015 2016 2016 2005-15 2016
US 51.7 60.2 67.2 71.5 83.8 16.9% 13.2% 20.0%
Canada 5.6 6.4 7.0 8.5 9.2 8.1% 13.8% 2.2%
Mexico 2.3 2.6 3.1 3.7 4.1 10.4% 7.2% 1.0%
Total North America 59.6 69.3 77.2 83.6 97.1 15.7% 12.9% 23.1%
Argentina 0.6 0.6 0.8 0.6 0.7 5.0% 8.4% 0.2%
Brazil 9.1 10.6 13.3 16.0 19.0 18.4% 17.8% 4.5%
Chile 1.2 1.4 1.6 1.9 2.3 19.9% 16.7% 0.5%
Colombia 0.3 0.3 0.4 0.4 0.5 15.4% 12.8% 0.1%
Ecuador 0.1 0.1 0.1 0.1 0.1 12.6% 18.1% ♦
Peru 0.2 0.3 0.4 0.4 0.6 29.9% 18.5% 0.1%
Trinidad & Tobago ^ ^ ^ ^ ^ - -14.1% ♦
Venezuela ^ ^ ^ ^ ^ - - ♦
Other S. & Cent. America 2.7 3.0 3.6 4.5 5.1 11.9% 14.5% 1.2%
Total S. & Cent. America 14.1 16.4 20.2 24.0 28.2 17.1% 16.6% 6.7%
Austria 1.7 1.9 2.0 2.3 2.4 6.0% 10.5% 0.6%
Azerbaijan - ^ ^ ^ ^ 66.3% - ♦
Belarus ^ ^ ^ ^ 0.1 100.5% 65.2% ♦
Belgium 2.3 2.6 2.7 3.2 3.2 -1.7% 22.8% 0.8%
Bulgaria 0.5 0.6 0.6 0.7 0.7 1.5% 90.3% 0.2%
Czech Republic 1.3 1.5 1.6 1.7 1.7 -3.5% 27.5% 0.4%
Denmark 3.4 3.6 4.1 4.3 4.1 -5.7% 6.8% 1.0%
Finland 2.6 2.9 2.9 3.1 3.4 8.6% 3.5% 0.8%
France 5.5 5.8 6.5 7.9 8.2 2.9% 21.8% 1.9%
Germany 27.2 29.0 32.1 38.1 37.9 -0.9% 14.7% 9.0%
Greece 1.3 1.8 1.7 2.0 2.1 4.7% 20.2% 0.5%
Hungary 0.6 0.6 0.6 0.7 0.8 15.8% 6.3% 0.2%
Ireland 1.0 1.1 1.3 1.6 1.5 -5.8% 19.0% 0.4%
Italy 11.4 13.4 14.1 14.3 15.0 4.3% 16.4% 3.6%
Kazakhstan ^ ^ ^ ^ 0.1 95.1% - ♦
Lithuania 0.2 0.2 0.3 0.3 0.4 20.0% 65.2% 0.1%
Netherlands 2.8 2.7 2.6 3.1 3.1 0.8% 6.3% 0.7%
Norway 0.4 0.5 0.6 0.6 0.5 -14.6% 12.5% 0.1%
Poland 3.4 3.3 4.0 4.7 4.6 -1.8% 28.9% 1.1%
Portugal 3.1 3.6 3.6 3.6 3.7 4.4% 16.2% 0.9%
Romania 0.6 1.2 1.5 2.2 2.0 -6.0% 109.1% 0.5%
Russian Federation 0.1 0.1 0.1 0.2 0.2 6.9% 4.0% ♦
Slovakia 0.3 0.3 0.5 0.5 0.5 1.8% 49.5% 0.1%
Spain 15.0 16.3 16.1 15.6 15.5 -0.9% 10.8% 3.7%
Sweden 4.4 4.8 5.0 6.1 6.1 -0.8% 12.4% 1.5%
Switzerland 0.5 0.5 0.6 0.7 0.8 17.6% 10.3% 0.2%
Turkey 1.7 2.3 2.8 3.9 5.2 33.8% 51.0% 1.2%
Turkmenistan ^ ^ ^ ^ ^ 27.0% - ♦
Ukraine 0.2 0.3 0.4 0.4 0.3 -12.4% 46.9% 0.1%
United Kingdom 8.1 11.0 13.3 17.5 17.5 -0.1% 20.4% 4.2%
USSR n/a n/a n/a n/a n/a n/a n/a n/a
Uzbekistan - ^ ^ ^ ^ 50.0% - ♦
Other Europe & Eurasia 1.9 2.0 2.2 2.3 2.5 7.7% 17.2% 0.6%
Total Europe & Eurasia 101.5 114.1 123.8 141.6 144.0 1.5% 15.0% 34.3%
Growth rate per annum
Public Record Exhibit 3
129

Iran 0.1 0.1 0.1 0.1 0.1 2.6% 20.0% ♦
Israel 0.1 0.1 0.2 0.3 0.4 37.1% 60.6% 0.1%
Kuwait - - ^ ^ ^ 580.0% - ♦
Qatar ^ ^ ^ ^ ^ 10.0% - ♦
Saudi Arabia ^ ^ ^ ^ ^ 14.3% - ♦
United Arab Emirates ^ ^ 0.1 0.1 0.1 2.6% - ♦
Other Middle East ^ ^ ^ 0.1 0.2 196.8% 39.9% ♦
Total Middle East 0.2 0.3 0.4 0.5 0.7 42.0% 38.4% 0.2%
Algeria ^ ^ ^ ^ 0.1 190.2% - ♦
Egypt 0.3 0.3 0.3 0.4 0.6 35.5% 13.3% 0.1%
South Africa 0.1 0.1 0.6 1.4 1.8 26.3% 35.3% 0.4%
Other Africa 1.0 1.3 1.8 2.4 2.6 9.6% 16.6% 0.6%
Total Africa 1.4 1.7 2.7 4.2 5.0 18.5% 19.6% 1.2%
Australia 3.0 3.7 4.1 4.8 5.4 12.0% 14.9% 1.3%
Bangladesh ^ ^ ^ ^ ^ 15.3% 40.8% ♦
China 29.4 42.3 50.8 64.4 86.1 33.4% 44.1% 20.5%
China Hong Kong SAR ^ ^ ^ ^ ^ -0.4% - ♦
India 10.4 11.6 12.0 12.7 16.5 29.2% 18.8% 3.9%
Indonesia 2.2 2.2 2.3 2.4 2.6 7.1% 4.7% 0.6%
Japan 7.7 9.3 11.8 14.8 18.8 26.7% 10.0% 4.5%
Malaysia 0.4 0.3 0.3 0.3 0.3 21.6% - 0.1%
New Zealand 2.0 2.0 2.3 2.4 2.4 -0.2% 10.0% 0.6%
Pakistan ^ 0.1 0.2 0.3 0.4 47.0% - 0.1%
Philippines 2.4 2.2 2.4 2.8 3.1 10.8% 2.2% 0.7%
Singapore 0.1 0.2 0.2 0.2 0.2 14.8% 6.2% 0.1%
South Korea 2.0 2.3 3.3 3.9 4.3 9.6% 45.6% 1.0%
Taiwan 0.8 0.9 0.9 1.0 1.0 1.8% 8.8% 0.2%
Thailand 1.2 1.6 2.0 2.3 2.8 24.4% 18.3% 0.7%
Vietnam ^ ^ ^ ^ 0.1 40.5% 15.9% ♦
Other Asia Pacific 0.2 0.2 0.3 0.3 0.3 1.3% 20.8% 0.1%
Total Asia Pacific 61.8 79.0 93.0 112.7 144.5 27.9% 21.1% 34.4%
Total World 238.5 280.7 317.3 366.7 419.6 14.1% 16.1% 100.0%
of which: OECD 175.2 199.4 221.0 248.9 270.1 8.2% 13.9% 64.4%
Non-OECD 63.4 81.3 96.3 117.8 149.5 26.6% 23.4% 35.6%
European Union # 97.4 109.1 118.0 134.6 135.6 0.5% 14.8% 32.3%
CIS 0.3 0.5 0.6 0.6 0.7 7.8% 19.1% 0.2%
* Based on gross generation from renewable sources including wind, geothermal, solar, biomass and waste, and not accounting for cross-border electricity supply.
Converted on the basis of thermal equivalence assuming 38% conversion efficiency in a modern thermal power station.
^ Less than 0.05.
♦ Less than 0.05%.
n/a not available.
# Excludes Estonia, Latvia and Lithuania prior to 1985 and Slovenia prior to 1990.
Notes: Annual changes and share of total are calculated using million tonnes oil equivalent figures.
Growth rates are adjusted for leap years.
Public Record Exhibit 3
130

Renewables: Consumption - Solar*Share
Terawatt-hours 2012 2013 2014 2015 2016 2016 2005-15 2016
US 9.0 16.0 29.2 39.4 56.8 43.6% 48.6% 17.1%
Canada 0.8 1.2 1.9 2.6 3.1 18.3% 64.0% 0.9%
Mexico 0.1 0.1 0.2 0.2 0.4 72.0% 39.2% 0.1%
Total North America 9.9 17.4 31.3 42.3 60.3 42.3% 49.1% 18.1%
Argentina ^ ^ ^ ^ ^ -3.1% 68.2% ♦
Brazil ^ ^ ^ 0.1 0.1 50.5% - ♦
Chile ^ ^ 0.5 1.3 2.6 96.6% - 0.8%
Colombia ^ ^ ^ ^ ^ - - ♦
Ecuador ^ ^ ^ ^ ^ 7.2% 122.0% ♦
Peru 0.1 0.2 0.2 0.2 0.2 4.7% - 0.1%
Trinidad & Tobago ^ ^ ^ ^ ^ - - ♦
Venezuela ^ ^ ^ ^ ^ - - ♦
Other S. & Cent. America 0.4 0.5 0.6 1.4 2.2 54.4% 36.2% 0.7%
Total S. & Cent. America 0.5 0.7 1.4 3.1 5.1 66.6% 47.4% 1.5%
Austria 0.3 0.6 0.8 0.9 1.1 14.2% 46.2% 0.3%
Azerbaijan - ^ ^ ^ 0.1 1242.0% - ♦
Belarus - ^ ^ ^ ^ 310.0% - ♦
Belgium 2.1 2.6 2.9 3.1 3.0 -4.0% 123.2% 0.9%
Bulgaria 0.8 1.4 1.3 1.4 1.4 1.6% - 0.4%
Czech Republic 2.2 2.1 2.1 2.3 2.1 -6.2% 183.3% 0.6%
Denmark 0.1 0.5 0.6 0.6 0.7 22.8% 75.7% 0.2%
Finland ^ ^ ^ ^ ^ 34.2% 12.8% ♦
France 4.1 4.7 5.9 7.4 8.3 11.4% 92.7% 2.5%
Germany 26.4 31.0 36.1 38.7 38.2 -1.6% 40.6% 11.5%
Greece 1.7 3.6 3.8 3.9 4.0 1.9% 128.6% 1.2%
Hungary ^ ^ 0.1 0.1 0.2 60.4% - 0.1%
Ireland ^ ^ ^ ^ ^ 229.6% - ♦
Italy 18.9 21.6 22.3 22.9 22.9 -0.5% 93.6% 6.9%
Kazakhstan - ^ ^ ^ 0.1 84.3% - ♦
Lithuania ^ ^ 0.1 0.1 0.1 -8.8% - ♦
Netherlands 0.3 0.5 0.8 1.1 1.5 36.2% 41.8% 0.5%
Norway ^ ^ ^ ^ ^ 48.8% - ♦Poland ^ ^ ^ 0.1 0.1 116.9% - ♦Portugal 0.4 0.5 0.6 0.8 0.8 2.2% 70.7% 0.2%Romania ^ 0.4 1.3 2.0 1.8 -7.2% - 0.6%Russian Federation ^ ^ ^ ^ 0.1 115.7% - ♦Slovakia 0.4 0.6 0.6 0.5 0.5 4.9% - 0.2%Spain 12.0 12.7 13.7 13.9 13.6 -2.6% 67.9% 4.1%Sweden ^ ^ ^ 0.1 0.2 74.2% 47.4% 0.1%Switzerland 0.3 0.5 0.9 1.1 1.4 23.6% 48.8% 0.4%Turkey ^ ^ ^ 0.2 0.7 253.3% - 0.2%Turkmenistan ^ ^ ^ ^ ^ 27.0% - ♦Ukraine 0.3 0.6 0.4 0.5 0.4 -17.2% - 0.1%United Kingdom 1.4 2.0 4.0 7.6 10.3 35.7% 98.4% 3.1%USSR n/a n/a n/a n/a n/a n/a n/a n/aUzbekistan - ^ ^ ^ ^ 50.0% - ♦Other Europe & Eurasia 0.3 0.4 0.6 0.8 0.8 7.3% 45.1% 0.2%Total Europe & Eurasia 71.9 86.5 98.9 110.1 114.4 3.6% 53.5% 34.4%
Growth rate per annum
Public Record Exhibit 3
131
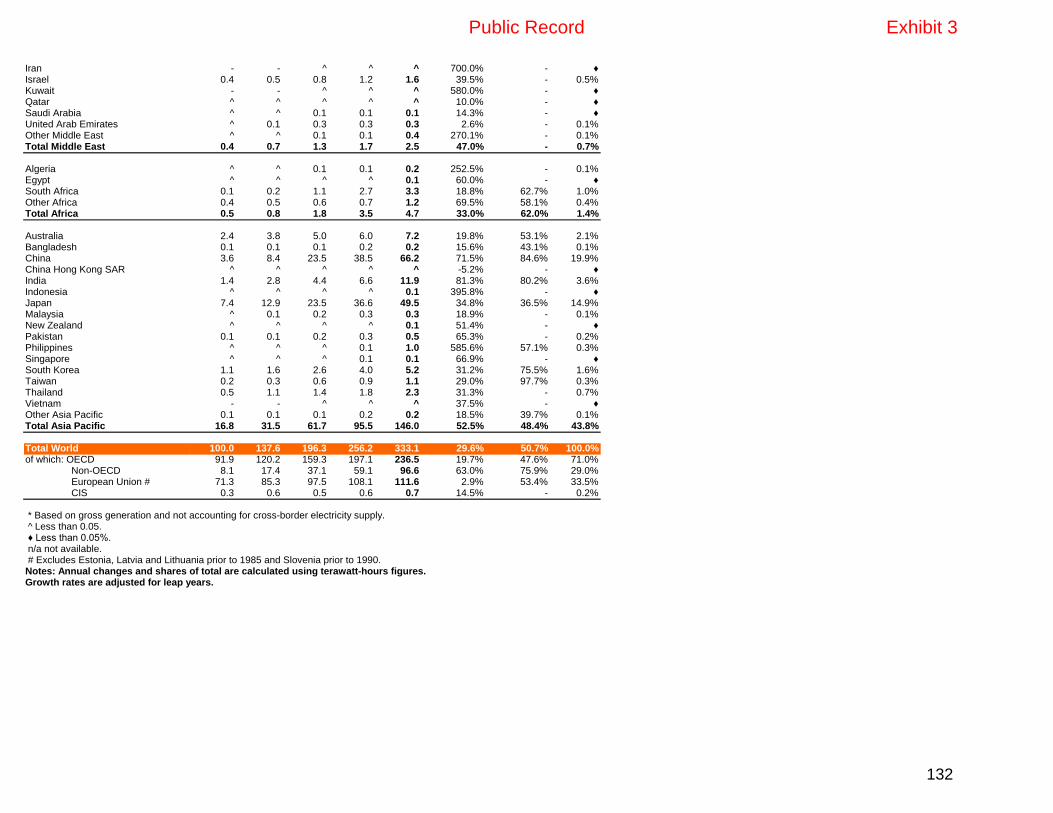
Iran - - ^ ^ ^ 700.0% - ♦Israel 0.4 0.5 0.8 1.2 1.6 39.5% - 0.5%Kuwait - - ^ ^ ^ 580.0% - ♦Qatar ^ ^ ^ ^ ^ 10.0% - ♦Saudi Arabia ^ ^ 0.1 0.1 0.1 14.3% - ♦United Arab Emirates ^ 0.1 0.3 0.3 0.3 2.6% - 0.1%Other Middle East ^ ^ 0.1 0.1 0.4 270.1% - 0.1%Total Middle East 0.4 0.7 1.3 1.7 2.5 47.0% - 0.7%
Algeria ^ ^ 0.1 0.1 0.2 252.5% - 0.1%Egypt ^ ^ ^ ^ 0.1 60.0% - ♦South Africa 0.1 0.2 1.1 2.7 3.3 18.8% 62.7% 1.0%Other Africa 0.4 0.5 0.6 0.7 1.2 69.5% 58.1% 0.4%Total Africa 0.5 0.8 1.8 3.5 4.7 33.0% 62.0% 1.4%
Australia 2.4 3.8 5.0 6.0 7.2 19.8% 53.1% 2.1%Bangladesh 0.1 0.1 0.1 0.2 0.2 15.6% 43.1% 0.1%China 3.6 8.4 23.5 38.5 66.2 71.5% 84.6% 19.9%China Hong Kong SAR ^ ^ ^ ^ ^ -5.2% - ♦India 1.4 2.8 4.4 6.6 11.9 81.3% 80.2% 3.6%Indonesia ^ ^ ^ ^ 0.1 395.8% - ♦Japan 7.4 12.9 23.5 36.6 49.5 34.8% 36.5% 14.9%Malaysia ^ 0.1 0.2 0.3 0.3 18.9% - 0.1%New Zealand ^ ^ ^ ^ 0.1 51.4% - ♦Pakistan 0.1 0.1 0.2 0.3 0.5 65.3% - 0.2%Philippines ^ ^ ^ 0.1 1.0 585.6% 57.1% 0.3%Singapore ^ ^ ^ 0.1 0.1 66.9% - ♦South Korea 1.1 1.6 2.6 4.0 5.2 31.2% 75.5% 1.6%Taiwan 0.2 0.3 0.6 0.9 1.1 29.0% 97.7% 0.3%Thailand 0.5 1.1 1.4 1.8 2.3 31.3% - 0.7%Vietnam - - ^ ^ ^ 37.5% - ♦Other Asia Pacific 0.1 0.1 0.1 0.2 0.2 18.5% 39.7% 0.1%Total Asia Pacific 16.8 31.5 61.7 95.5 146.0 52.5% 48.4% 43.8%
Total World 100.0 137.6 196.3 256.2 333.1 29.6% 50.7% 100.0%of which: OECD 91.9 120.2 159.3 197.1 236.5 19.7% 47.6% 71.0% Non-OECD 8.1 17.4 37.1 59.1 96.6 63.0% 75.9% 29.0% European Union # 71.3 85.3 97.5 108.1 111.6 2.9% 53.4% 33.5% CIS 0.3 0.6 0.5 0.6 0.7 14.5% - 0.2%
* Based on gross generation and not accounting for cross-border electricity supply. ^ Less than 0.05. ♦ Less than 0.05%. n/a not available. # Excludes Estonia, Latvia and Lithuania prior to 1985 and Slovenia prior to 1990.Notes: Annual changes and shares of total are calculated using terawatt-hours figures.Growth rates are adjusted for leap years.
Public Record Exhibit 3
132

Renewables: Consumption - Solar*Share
Million tonnes oil equivalent 2012 2013 2014 2015 2016 2016 2005-15 2016
US 2.0 3.6 6.6 8.9 12.8 43.6% 48.6% 17.1%
Canada 0.2 0.3 0.4 0.6 0.7 18.3% 64.0% 0.9%
Mexico ^ ^ 0.1 0.1 0.1 72.0% 39.2% 0.1%
Total North America 2.2 3.9 7.1 9.6 13.6 42.3% 49.1% 18.1%
Argentina ^ ^ ^ ^ ^ -3.1% 68.2% ♦
Brazil ^ ^ ^ ^ ^ 50.5% - ♦
Chile ^ ^ 0.1 0.3 0.6 96.6% - 0.8%
Colombia ^ ^ ^ ^ ^ - - ♦
Ecuador ^ ^ ^ ^ ^ 7.2% 122.0% ♦
Peru ^ ^ ^ 0.1 0.1 4.7% - 0.1%
Trinidad & Tobago ^ ^ ^ ^ ^ - - ♦
Venezuela ^ ^ ^ ^ ^ - - ♦
Other S. & Cent. America 0.1 0.1 0.1 0.3 0.5 54.4% 36.2% 0.7%
Total S. & Cent. America 0.1 0.2 0.3 0.7 1.2 66.6% 47.4% 1.5%
Austria 0.1 0.1 0.2 0.2 0.2 14.2% 46.2% 0.3%
Azerbaijan - ^ ^ ^ ^ 1242.0% - ♦
Belarus - ^ ^ ^ ^ 310.0% - ♦
Belgium 0.5 0.6 0.7 0.7 0.7 -4.0% 123.2% 0.9%
Bulgaria 0.2 0.3 0.3 0.3 0.3 1.6% - 0.4%
Czech Republic 0.5 0.5 0.5 0.5 0.5 -6.2% 183.3% 0.6%
Denmark ^ 0.1 0.1 0.1 0.2 22.8% 75.7% 0.2%
Finland ^ ^ ^ ^ ^ 34.2% 12.8% ♦
France 0.9 1.1 1.3 1.7 1.9 11.4% 92.7% 2.5%
Germany 6.0 7.0 8.2 8.8 8.6 -1.6% 40.6% 11.5%
Greece 0.4 0.8 0.9 0.9 0.9 1.9% 128.6% 1.2%
Hungary ^ ^ ^ ^ ^ 60.4% - 0.1%
Ireland ^ ^ ^ ^ ^ 229.6% - ♦
Italy 4.3 4.9 5.0 5.2 5.2 -0.5% 93.6% 6.9%
Kazakhstan - ^ ^ ^ ^ 84.3% - ♦
Lithuania ^ ^ ^ ^ ^ -8.8% - ♦
Netherlands 0.1 0.1 0.2 0.3 0.3 36.2% 41.8% 0.5%
Norway ^ ^ ^ ^ ^ 48.8% - ♦
Poland ^ ^ ^ ^ ^ 116.9% - ♦
Portugal 0.1 0.1 0.1 0.2 0.2 2.2% 70.7% 0.2%
Romania ^ 0.1 0.3 0.4 0.4 -7.2% - 0.6%
Russian Federation ^ ^ ^ ^ ^ 115.7% - ♦
Slovakia 0.1 0.1 0.1 0.1 0.1 4.9% - 0.2%
Spain 2.7 2.9 3.1 3.1 3.1 -2.6% 67.9% 4.1%
Sweden ^ ^ ^ ^ ^ 74.2% 47.4% 0.1%
Switzerland 0.1 0.1 0.2 0.3 0.3 23.6% 48.8% 0.4%
Turkey ^ ^ ^ ^ 0.2 253.3% - 0.2%
Turkmenistan ^ ^ ^ ^ ^ 27.0% - ♦
Ukraine 0.1 0.1 0.1 0.1 0.1 -17.2% - 0.1%
United Kingdom 0.3 0.5 0.9 1.7 2.3 35.7% 98.4% 3.1%
USSR n/a n/a n/a n/a n/a n/a n/a n/a
Uzbekistan - ^ ^ ^ ^ 50.0% - ♦
Other Europe & Eurasia 0.1 0.1 0.1 0.2 0.2 7.3% 45.1% 0.2%
Total Europe & Eurasia 16.3 19.6 22.4 24.9 25.9 3.6% 53.5% 34.4%
Growth rate per annum
Public Record Exhibit 3
133

Iran - - ^ ^ ^ 700.0% - ♦
Israel 0.1 0.1 0.2 0.3 0.4 39.5% - 0.5%
Kuwait - - ^ ^ ^ 580.0% - ♦
Qatar ^ ^ ^ ^ ^ 10.0% - ♦
Saudi Arabia ^ ^ ^ ^ ^ 14.3% - ♦
United Arab Emirates ^ ^ 0.1 0.1 0.1 2.6% - 0.1%
Other Middle East ^ ^ ^ ^ 0.1 270.1% - 0.1%
Total Middle East 0.1 0.1 0.3 0.4 0.6 47.0% - 0.7%
Algeria ^ ^ ^ ^ ^ 252.5% - 0.1%
Egypt ^ ^ ^ ^ ^ 60.0% - ♦
South Africa ^ 0.1 0.3 0.6 0.7 18.8% 62.7% 1.0%
Other Africa 0.1 0.1 0.1 0.2 0.3 69.5% 58.1% 0.4%
Total Africa 0.1 0.2 0.4 0.8 1.1 33.0% 62.0% 1.4%
Australia 0.5 0.9 1.1 1.3 1.6 19.8% 53.1% 2.1%
Bangladesh ^ ^ ^ ^ ^ 15.6% 43.1% 0.1%
China 0.8 1.9 5.3 8.7 15.0 71.5% 84.6% 19.9%
China Hong Kong SAR ^ ^ ^ ^ ^ -5.2% - ♦
India 0.3 0.6 1.0 1.5 2.7 81.3% 80.2% 3.6%
Indonesia ^ ^ ^ ^ ^ 395.8% - ♦
Japan 1.7 2.9 5.3 8.3 11.2 34.8% 36.5% 14.9%
Malaysia ^ ^ 0.1 0.1 0.1 18.9% - 0.1%
New Zealand ^ ^ ^ ^ ^ 51.4% - ♦
Pakistan ^ ^ 0.1 0.1 0.1 65.3% - 0.2%
Philippines ^ ^ ^ ^ 0.2 585.6% 57.1% 0.3%
Singapore ^ ^ ^ ^ ^ 66.9% - ♦
South Korea 0.2 0.4 0.6 0.9 1.2 31.2% 75.5% 1.6%
Taiwan ^ 0.1 0.1 0.2 0.3 29.0% 97.7% 0.3%
Thailand 0.1 0.2 0.3 0.4 0.5 31.3% - 0.7%
Vietnam - - ^ ^ ^ 37.5% - ♦
Other Asia Pacific ^ ^ ^ ^ ^ 18.5% 39.7% 0.1%
Total Asia Pacific 3.8 7.1 14.0 21.6 33.0 52.5% 48.4% 43.8%
Total World 22.6 31.1 44.4 58.0 75.4 29.6% 50.7% 100.0%
of which: OECD 20.8 27.2 36.0 44.6 53.5 19.7% 47.6% 71.0%
Non-OECD 1.8 3.9 8.4 13.4 21.9 63.0% 75.9% 29.0%
European Union # 16.1 19.3 22.1 24.5 25.2 2.9% 53.4% 33.5%
CIS 0.1 0.1 0.1 0.1 0.2 14.5% - 0.2%
* Based on gross generation and not accounting for cross-border electricity supply. Converted on the
basis of thermal equivalence assuming 38% conversion efficiency in a modern thermal power station.
^ Less than 0.05.
♦ Less than 0.05%.
# Excludes Estonia, Latvia and Lithuania prior to 1985 and Slovenia prior to 1990.
Notes: Annual changes and share of total are calculated using million tonnes oil equivalent figures.
Growth rates are adjusted for leap years.
Public Record Exhibit 3
134

Renewables: Consumption - Wind*Share
Terawatt-hours 2012 2013 2014 2015 2016 2016 2005-15 2016
US 142.2 169.5 183.5 192.6 228.8 18.4% 26.8% 23.8%
Canada 13.6 16.5 20.6 24.6 27.2 10.4% 31.8% 2.8%
Mexico 3.3 4.2 6.4 8.7 10.6 20.4% 84.6% 1.1%
Total North America 159.1 190.3 210.5 226.0 266.6 17.6% 27.7% 27.8%
Argentina 0.4 0.5 0.7 0.6 0.5 -8.1% 23.5% 0.1%
Brazil 5.1 6.6 12.2 21.6 32.9 51.8% 72.5% 3.4%
Chile 0.4 0.6 1.4 2.1 2.3 8.6% 77.0% 0.2%
Colombia 0.1 0.1 0.1 0.1 0.1 -22.0% 3.3% ♦
Ecuador ^ 0.1 0.1 0.1 0.1 -15.3% - ♦
Peru ^ ^ 0.3 0.6 1.0 70.3% 86.0% 0.1%
Trinidad & Tobago - - - - - - - -
Venezuela - - - ^ ^ - - ♦
Other S. & Cent. America 1.9 2.7 4.1 6.6 8.1 21.6% 35.8% 0.8%
Total S. & Cent. America 7.8 10.4 18.9 31.7 45.0 41.5% 50.5% 4.7%
Austria 2.5 3.2 3.8 4.8 5.2 6.3% 13.8% 0.5%
Azerbaijan - ^ ^ ^ ^ 285.9% - ♦
Belarus ^ ^ ^ ^ 0.2 500.0% 38.5% ♦
Belgium 2.8 3.7 4.6 5.6 5.7 1.6% 37.7% 0.6%
Bulgaria 1.2 1.4 1.3 1.5 1.4 -5.3% 76.3% 0.1%
Czech Republic 0.4 0.5 0.5 0.6 0.5 -13.5% 39.0% 0.1%
Denmark 10.3 11.1 13.1 14.1 12.8 -9.8% 7.9% 1.3%
Finland 0.5 0.8 1.1 2.3 3.1 31.5% 30.1% 0.3%
France 14.9 15.9 17.1 21.1 20.7 -2.2% 36.2% 2.2%
Germany 50.7 51.7 57.4 79.2 77.4 -2.5% 11.3% 8.1%
Greece 3.9 4.1 3.7 4.6 5.0 7.2% 13.8% 0.5%
Hungary 0.8 0.7 0.7 0.7 0.7 -0.9% 52.8% 0.1%
Ireland 4.0 4.5 5.1 6.6 6.2 -6.7% 19.4% 0.6%
Italy 13.4 14.9 15.2 14.8 17.6 18.4% 20.3% 1.8%
Kazakhstan ^ ^ ^ 0.1 0.3 98.3% - ♦
Lithuania 0.5 0.6 0.6 0.8 1.1 35.4% 84.2% 0.1%
Netherlands 5.0 5.6 5.8 7.5 7.9 4.9% 13.8% 0.8%
Norway 1.5 1.9 2.2 2.5 2.1 -16.1% 17.4% 0.2%
Poland 4.7 6.0 7.7 10.9 12.6 15.6% 55.1% 1.3%
Portugal 10.3 12.0 12.1 11.6 12.5 7.2% 20.7% 1.3%
Romania 2.6 4.5 4.7 7.1 6.7 -5.0% - 0.7%
Russian Federation ^ ^ 0.1 0.1 0.1 -1.0% 36.1% ♦
Slovakia ^ ^ ^ ^ ^ - -1.5% ♦
Spain 49.5 53.9 52.0 49.3 48.9 -1.2% 8.8% 5.1%
Sweden 7.2 9.8 11.2 16.3 15.1 -7.4% 32.9% 1.6%
Switzerland 0.1 0.1 0.1 0.1 0.1 -6.9% 30.0% ♦
Turkey 5.9 7.6 8.5 11.7 16.5 41.4% 69.7% 1.7%
Turkmenistan - - - - - - - -
Ukraine 0.3 0.6 1.1 1.1 1.0 -11.9% 40.4% 0.1%
United Kingdom 19.8 28.4 32.0 40.3 37.5 -7.2% 30.1% 3.9%
USSR n/a n/a n/a n/a n/a n/a n/a n/a
Uzbekistan - - - - - - - -
Other Europe & Eurasia 1.1 1.4 1.8 2.2 2.3 2.5% 29.0% 0.2%
Total Europe & Eurasia 213.9 245.1 263.6 317.7 321.0 0.8% 16.1% 33.5%
Growth rate per annum
Public Record Exhibit 3
135
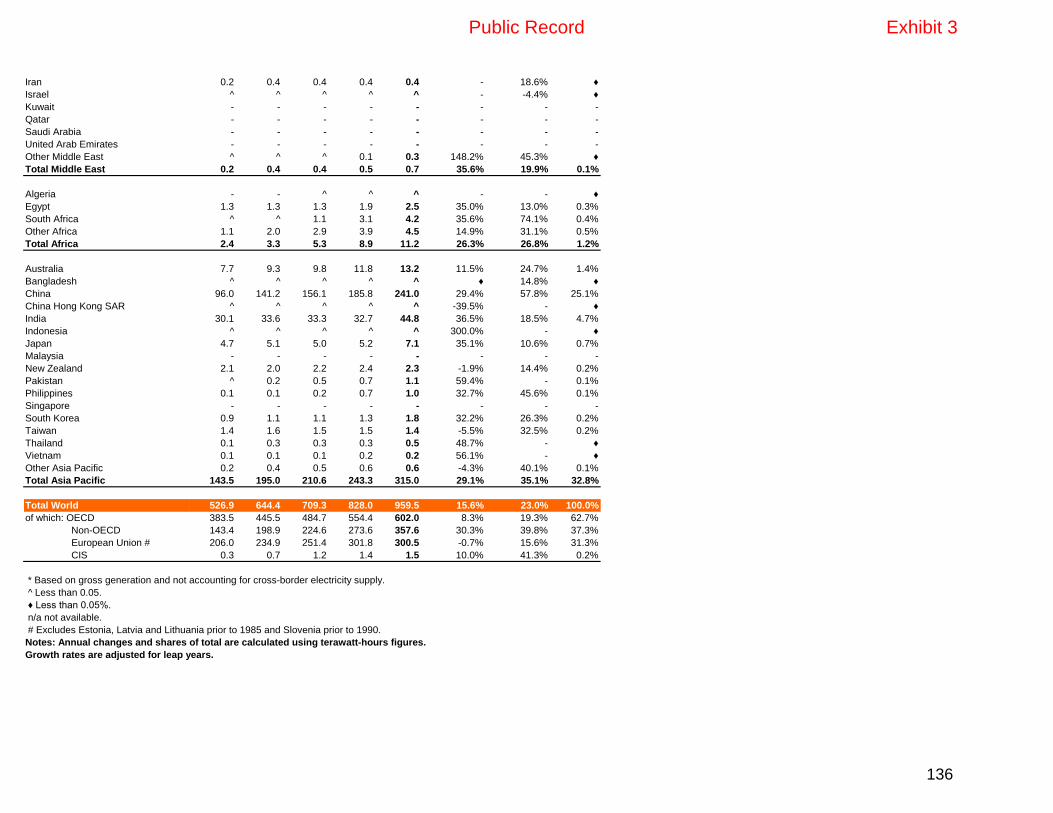
Iran 0.2 0.4 0.4 0.4 0.4 - 18.6% ♦
Israel ^ ^ ^ ^ ^ - -4.4% ♦
Kuwait - - - - - - - -
Qatar - - - - - - - -
Saudi Arabia - - - - - - - -
United Arab Emirates - - - - - - - -
Other Middle East ^ ^ ^ 0.1 0.3 148.2% 45.3% ♦
Total Middle East 0.2 0.4 0.4 0.5 0.7 35.6% 19.9% 0.1%
Algeria - - ^ ^ ^ - - ♦
Egypt 1.3 1.3 1.3 1.9 2.5 35.0% 13.0% 0.3%
South Africa ^ ^ 1.1 3.1 4.2 35.6% 74.1% 0.4%
Other Africa 1.1 2.0 2.9 3.9 4.5 14.9% 31.1% 0.5%
Total Africa 2.4 3.3 5.3 8.9 11.2 26.3% 26.8% 1.2%
Australia 7.7 9.3 9.8 11.8 13.2 11.5% 24.7% 1.4%
Bangladesh ^ ^ ^ ^ ^ ♦ 14.8% ♦
China 96.0 141.2 156.1 185.8 241.0 29.4% 57.8% 25.1%
China Hong Kong SAR ^ ^ ^ ^ ^ -39.5% - ♦
India 30.1 33.6 33.3 32.7 44.8 36.5% 18.5% 4.7%
Indonesia ^ ^ ^ ^ ^ 300.0% - ♦
Japan 4.7 5.1 5.0 5.2 7.1 35.1% 10.6% 0.7%
Malaysia - - - - - - - -
New Zealand 2.1 2.0 2.2 2.4 2.3 -1.9% 14.4% 0.2%
Pakistan ^ 0.2 0.5 0.7 1.1 59.4% - 0.1%
Philippines 0.1 0.1 0.2 0.7 1.0 32.7% 45.6% 0.1%
Singapore - - - - - - - -
South Korea 0.9 1.1 1.1 1.3 1.8 32.2% 26.3% 0.2%
Taiwan 1.4 1.6 1.5 1.5 1.4 -5.5% 32.5% 0.2%
Thailand 0.1 0.3 0.3 0.3 0.5 48.7% - ♦
Vietnam 0.1 0.1 0.1 0.2 0.2 56.1% - ♦
Other Asia Pacific 0.2 0.4 0.5 0.6 0.6 -4.3% 40.1% 0.1%
Total Asia Pacific 143.5 195.0 210.6 243.3 315.0 29.1% 35.1% 32.8%
Total World 526.9 644.4 709.3 828.0 959.5 15.6% 23.0% 100.0%
of which: OECD 383.5 445.5 484.7 554.4 602.0 8.3% 19.3% 62.7%
Non-OECD 143.4 198.9 224.6 273.6 357.6 30.3% 39.8% 37.3%
European Union # 206.0 234.9 251.4 301.8 300.5 -0.7% 15.6% 31.3%
CIS 0.3 0.7 1.2 1.4 1.5 10.0% 41.3% 0.2%
* Based on gross generation and not accounting for cross-border electricity supply.
^ Less than 0.05.
♦ Less than 0.05%.
n/a not available.
# Excludes Estonia, Latvia and Lithuania prior to 1985 and Slovenia prior to 1990.
Notes: Annual changes and shares of total are calculated using terawatt-hours figures.
Growth rates are adjusted for leap years.
Public Record Exhibit 3
136

Renewables: Consumption - Wind*Share
Million tonnes oil equivalent 2012 2013 2014 2015 2016 2016 2005-15 2016
US 32.2 38.4 41.5 43.6 51.8 18.4% 26.8% 23.8%
Canada 3.1 3.7 4.7 5.6 6.2 10.4% 31.8% 2.8%
Mexico 0.7 0.9 1.5 2.0 2.4 20.4% 84.6% 1.1%
Total North America 36.0 43.1 47.6 51.1 60.3 17.6% 27.7% 27.8%
Argentina 0.1 0.1 0.2 0.1 0.1 -8.1% 23.5% 0.1%
Brazil 1.1 1.5 2.8 4.9 7.4 51.8% 72.5% 3.4%
Chile 0.1 0.1 0.3 0.5 0.5 8.6% 77.0% 0.2%
Colombia ^ ^ ^ ^ ^ -22.0% 3.3% ♦
Ecuador ^ ^ ^ ^ ^ -15.3% - ♦
Peru ^ ^ 0.1 0.1 0.2 70.3% 86.0% 0.1%
Trinidad & Tobago - - - - - - - -
Venezuela - - - ^ ^ - - ♦
Other S. & Cent. America 0.4 0.6 0.9 1.5 1.8 21.6% 35.8% 0.8%
Total S. & Cent. America 1.8 2.4 4.3 7.2 10.2 41.5% 50.5% 4.7%
Austria 0.6 0.7 0.9 1.1 1.2 6.3% 13.8% 0.5%
Azerbaijan - ^ ^ ^ ^ 285.9% - ♦
Belarus ^ ^ ^ ^ ^ 500.0% 38.5% ♦
Belgium 0.6 0.8 1.0 1.3 1.3 1.6% 37.7% 0.6%
Bulgaria 0.3 0.3 0.3 0.3 0.3 -5.3% 76.3% 0.1%
Czech Republic 0.1 0.1 0.1 0.1 0.1 -13.5% 39.0% 0.1%
Denmark 2.3 2.5 3.0 3.2 2.9 -9.8% 7.9% 1.3%
Finland 0.1 0.2 0.3 0.5 0.7 31.5% 30.1% 0.3%
France 3.4 3.6 3.9 4.8 4.7 -2.2% 36.2% 2.2%
Germany 11.5 11.7 13.0 17.9 17.5 -2.5% 11.3% 8.1%
Greece 0.9 0.9 0.8 1.0 1.1 7.2% 13.8% 0.5%
Hungary 0.2 0.2 0.1 0.2 0.2 -0.9% 52.8% 0.1%
Ireland 0.9 1.0 1.2 1.5 1.4 -6.7% 19.4% 0.6%
Italy 3.0 3.4 3.4 3.4 4.0 18.4% 20.3% 1.8%
Kazakhstan ^ ^ ^ ^ 0.1 98.3% - ♦
Lithuania 0.1 0.1 0.1 0.2 0.2 35.4% 84.2% 0.1%
Netherlands 1.1 1.3 1.3 1.7 1.8 4.9% 13.8% 0.8%
Norway 0.4 0.4 0.5 0.6 0.5 -16.1% 17.4% 0.2%
Poland 1.1 1.4 1.7 2.5 2.8 15.6% 55.1% 1.3%
Portugal 2.3 2.7 2.7 2.6 2.8 7.2% 20.7% 1.3%
Romania 0.6 1.0 1.1 1.6 1.5 -5.0% - 0.7%
Russian Federation ^ ^ ^ ^ ^ -1.0% 36.1% ♦
Slovakia ^ ^ ^ ^ ^ - -1.5% ♦
Spain 11.2 12.2 11.8 11.2 11.1 -1.2% 8.8% 5.1%
Sweden 1.6 2.2 2.5 3.7 3.4 -7.4% 32.9% 1.6%
Switzerland ^ ^ ^ ^ ^ -6.9% 30.0% ♦
Turkey 1.3 1.7 1.9 2.6 3.7 41.4% 69.7% 1.7%
Turkmenistan - - - - - - - -
Ukraine 0.1 0.1 0.3 0.2 0.2 -11.9% 40.4% 0.1%
United Kingdom 4.5 6.4 7.2 9.1 8.5 -7.2% 30.1% 3.9%
USSR n/a n/a n/a n/a n/a n/a n/a n/a
Uzbekistan - - - - - - - -
Other Europe & Eurasia 0.3 0.3 0.4 0.5 0.5 2.5% 29.0% 0.2%
Total Europe & Eurasia 48.4 55.5 59.6 71.9 72.6 0.8% 16.1% 33.5%
Growth rate per annum
Public Record Exhibit 3
137

Iran ^ 0.1 0.1 0.1 0.1 - 18.6% ♦
Israel ^ ^ ^ ^ ^ - -4.4% ♦
Kuwait - - - - - - - -
Qatar - - - - - - - -
Saudi Arabia - - - - - - - -
United Arab Emirates - - - - - - - -
Other Middle East ^ ^ ^ ^ 0.1 148.2% 45.3% ♦
Total Middle East ^ 0.1 0.1 0.1 0.2 35.6% 19.9% 0.1%
Algeria - - ^ ^ ^ - - ♦
Egypt 0.3 0.3 0.3 0.4 0.6 35.0% 13.0% 0.3%
South Africa ^ ^ 0.2 0.7 0.9 35.6% 74.1% 0.4%
Other Africa 0.3 0.4 0.7 0.9 1.0 14.9% 31.1% 0.5%
Total Africa 0.6 0.7 1.2 2.0 2.5 26.3% 26.8% 1.2%
Australia 1.7 2.1 2.2 2.7 3.0 11.5% 24.7% 1.4%
Bangladesh ^ ^ ^ ^ ^ ♦ 14.8% ♦
China 21.7 31.9 35.3 42.0 54.5 29.4% 57.8% 25.1%
China Hong Kong SAR ^ ^ ^ ^ ^ -39.5% - ♦
India 6.8 7.6 7.5 7.4 10.1 36.5% 18.5% 4.7%
Indonesia ^ ^ ^ ^ ^ 300.0% - ♦
Japan 1.1 1.2 1.1 1.2 1.6 35.1% 10.6% 0.7%
Malaysia - - - - - - - -
New Zealand 0.5 0.5 0.5 0.5 0.5 -1.9% 14.4% 0.2%
Pakistan ^ ^ 0.1 0.2 0.3 59.4% - 0.1%
Philippines ^ ^ ^ 0.2 0.2 32.7% 45.6% 0.1%
Singapore - - - - - - - -
South Korea 0.2 0.3 0.3 0.3 0.4 32.2% 26.3% 0.2%
Taiwan 0.3 0.4 0.3 0.3 0.3 -5.5% 32.5% 0.2%
Thailand ^ 0.1 0.1 0.1 0.1 48.7% - ♦
Vietnam ^ ^ ^ ^ 0.1 56.1% - ♦
Other Asia Pacific ^ 0.1 0.1 0.1 0.1 -4.3% 40.1% 0.1%
Total Asia Pacific 32.5 44.1 47.6 55.0 71.3 29.1% 35.1% 32.8%
Total World 119.2 145.8 160.5 187.4 217.1 15.6% 23.0% 100.0%
of which: OECD 86.8 100.8 109.7 125.4 136.2 8.3% 19.3% 62.7%
Non-OECD 32.5 45.0 50.8 61.9 80.9 30.3% 39.8% 37.3%
European Union # 46.6 53.1 56.9 68.3 68.0 -0.7% 15.6% 31.3% CIS 0.1 0.1 0.3 0.3 0.3 10.0% 41.3% 0.2%
* Based on gross generation and not accounting for cross-border electricity supply. Converted on the
basis of thermal equivalence assuming 38% conversion efficiency in a modern thermal power station.
^ Less than 0.05.
♦ Less than 0.05%.
n/a not available.
# Excludes Estonia, Latvia and Lithuania prior to 1985 and Slovenia prior to 1990.
Notes: Annual changes and share of total are calculated using million tonnes oil equivalent figures.
Growth rates are adjusted for leap years.
Public Record Exhibit 3
138

Renewables: Consumption - Geothermal, Biomass and Other*Share
Terawatt-hours 2012 2013 2014 2015 2016 2016 2005-15 2016
US 77.0 80.7 84.1 83.7 84.6 0.8% 1.4% 15.1%
Canada 10.4 10.5 8.3 10.2 10.3 - 1.6% 1.8%
Mexico 6.8 7.3 7.1 7.4 7.2 -3.3% -0.9% 1.3%
Total North America 94.2 98.5 99.5 101.4 102.1 0.4% 1.3% 18.2%
Argentina 2.2 2.3 2.8 2.2 2.3 8.6% 6.3% 0.4%
Brazil 35.3 40.5 46.4 49.0 50.9 3.6% 13.7% 9.1%
Chile 4.9 5.8 5.3 5.0 5.3 4.9% 10.8% 0.9%
Colombia 1.2 1.3 1.6 1.7 2.0 17.2% 13.2% 0.4%
Ecuador 0.3 0.3 0.4 0.4 0.5 19.8% 14.8% 0.1%
Peru 0.7 1.0 1.3 1.1 1.2 12.9% 11.9% 0.2%
Trinidad & Tobago - - - - - - -100.0% -
Venezuela - - - - - - - -
Other S. & Cent. America 9.4 10.2 11.0 11.9 12.2 1.5% 9.6% 2.2%
Total S. & Cent. America 54.0 61.3 68.9 71.3 74.5 4.1% 12.3% 13.3%
Austria 4.6 4.6 4.3 4.4 4.6 3.9% 6.3% 0.8%
Azerbaijan - 0.1 0.1 0.1 0.1 -4.3% - ♦
Belarus 0.1 0.1 0.1 0.1 0.1 - - ♦
Belgium 5.2 5.0 4.4 5.5 5.3 -3.7% 13.2% 0.9%
Bulgaria 0.1 0.1 0.2 0.3 0.4 36.9% - 0.1%
Czech Republic 3.4 4.0 4.7 4.8 4.8 -1.1% 22.1% 0.8%
Denmark 4.4 4.3 4.3 4.2 4.4 4.2% 2.9% 0.8%
Finland 11.1 11.9 11.7 11.3 11.8 3.9% 1.8% 2.1%
France 5.4 5.2 5.8 6.4 7.1 9.9% 5.2% 1.3%
Germany 43.2 45.6 48.4 50.5 51.8 2.3% 13.4% 9.2%
Greece 0.2 0.2 0.2 0.2 0.2 1.3% 6.6% ♦
Hungary 1.7 1.8 2.1 2.2 2.6 18.6% 3.1% 0.5%
Ireland 0.4 0.5 0.5 0.5 0.5 5.2% 13.8% 0.1%
Italy 18.1 22.7 24.6 25.6 25.8 0.5% 8.3% 4.6%
Kazakhstan - - - ^ ^ 289.7% - ♦
Lithuania 0.2 0.4 0.4 0.4 0.4 -3.1% 51.5% 0.1%
Netherlands 7.2 6.0 5.0 4.9 4.3 -13.7% -0.7% 0.8%
Norway 0.4 0.3 0.3 0.2 0.2 - -5.1% ♦
Poland 10.1 8.6 10.0 9.9 7.8 -21.5% 20.7% 1.4%
Portugal 3.1 3.2 3.3 3.3 3.2 -4.9% 6.7% 0.6%
Romania 0.2 0.3 0.5 0.5 0.4 -14.4% 56.4% 0.1%
Russian Federation 0.5 0.5 0.5 0.5 0.5 - 0.8% 0.1%
Slovakia 0.9 0.9 1.4 1.7 1.7 0.8% 48.4% 0.3%
Spain 5.0 5.3 5.4 5.9 6.2 5.7% 5.4% 1.1%
Sweden 12.2 11.5 10.7 10.8 11.7 8.5% 3.7% 2.1%
Switzerland 1.6 1.7 1.8 1.7 2.0 15.2% 4.8% 0.4%
Turkey 1.6 2.5 3.8 5.2 5.6 8.5% 37.4% 1.0%
Turkmenistan - - - - - - - -
Ukraine 0.1 0.1 0.1 0.1 0.1 - - ♦
United Kingdom 14.7 18.2 22.7 29.4 29.6 0.4% 12.4% 5.3%
USSR n/a n/a n/a n/a n/a n/a n/a n/a
Uzbekistan - - - - - - - -
Other Europe & Eurasia 7.0 7.0 7.3 7.3 8.0 9.4% 14.4% 1.4%
Total Europe & Eurasia 162.7 172.6 184.7 197.9 201.1 1.4% 9.3% 35.8%
Growth rate per annum
Public Record Exhibit 3
139

Iran ^ ^ ^ ^ ^ - - ♦
Israel 0.1 ^ 0.1 0.1 0.1 - - ♦
Kuwait - - - - - - - -
Qatar - - - - - - - -
Saudi Arabia - - - - - - - -
United Arab Emirates - - - - - - - -
Other Middle East ^ ^ ^ ^ ^ 6.4% 1.8% ♦
Total Middle East 0.1 0.1 0.1 0.1 0.1 0.3% 37.8% ♦
Algeria - - - - - - - -
Egypt - - - - - - - -
South Africa 0.3 0.3 0.3 0.3 0.3 - 1.3% 0.1%
Other Africa 3.0 3.3 4.4 6.0 6.0 -0.7% 11.5% 1.1%
Total Africa 3.3 3.6 4.7 6.3 6.3 -0.7% 10.7% 1.1%
Australia 3.1 3.3 3.6 3.3 3.4 - -1.5% 0.6%
Bangladesh - - - - - - - -
China 30.5 37.3 44.7 60.3 73.4 21.4% 27.5% 13.1%
China Hong Kong SAR 0.1 0.1 0.1 0.1 0.1 - - ♦
India 14.4 14.8 15.2 16.9 16.0 -5.3% 15.4% 2.9%
Indonesia 9.7 9.7 10.3 10.5 11.2 6.3% 4.7% 2.0%
Japan 22.1 23.2 23.6 23.6 26.6 12.2% 0.9% 4.7%
Malaysia 1.5 1.1 0.9 0.9 1.2 22.3% - 0.2%
New Zealand 6.8 7.0 7.9 8.4 8.4 ♦ 9.0% 1.5%
Pakistan - - 0.2 0.3 0.3 - - 0.1%
Philippines 10.4 9.8 10.5 11.4 11.7 2.3% 1.4% 2.1%
Singapore 0.6 0.7 0.8 0.8 0.9 11.4% 5.6% 0.2%
South Korea 6.6 7.4 11.0 12.0 12.0 -0.1% 46.7% 2.1%
Taiwan 1.9 1.9 2.0 2.1 2.0 -4.2% 1.4% 0.4%
Thailand 4.6 5.8 7.4 7.9 9.6 21.8% 15.6% 1.7%
Vietnam 0.1 0.1 0.1 0.1 0.1 - 1.7% ♦
Other Asia Pacific 0.5 0.5 0.6 0.6 0.6 1.7% 12.9% 0.1%
Total Asia Pacific 112.9 122.8 138.6 159.3 177.6 11.2% 10.3% 31.6%
Total World 427.2 458.7 496.5 536.4 561.7 4.4% 7.7% 100.0%
of which: OECD 298.8 315.6 332.7 348.5 355.1 1.6% 5.6% 63.2%
Non-OECD 128.4 143.1 163.8 187.9 206.6 9.6% 13.4% 36.8%
European Union # 153.2 162.0 172.7 184.9 187.3 1.0% 9.1% 33.4%
CIS 0.7 0.8 0.8 0.9 0.9 -0.4% 6.6% 0.2%
* Based on gross generation and not accounting for cross-border electricity supply.
^ Less than 0.05.
♦ Less than 0.05%.
n/a not available.
# Excludes Estonia, Latvia and Lithuania prior to 1985 and Slovenia prior to 1990.
Notes: Annual changes and shares of total are calculated using terawatt-hours figures.
Growth rates are adjusted for leap years.
Public Record Exhibit 3
140

Renewables: Consumption - Geothermal, Biomass and Other*Share
Million tonnes oil equivalent 2012 2013 2014 2015 2016 2016 2005-15 2016
US 17.4 18.3 19.0 18.9 19.1 0.8% 1.4% 15.1%
Canada 2.3 2.4 1.9 2.3 2.3 - 1.6% 1.8%
Mexico 1.5 1.7 1.6 1.7 1.6 -3.3% -0.9% 1.3%
Total North America 21.3 22.3 22.5 22.9 23.1 0.4% 1.3% 18.2%
Argentina 0.5 0.5 0.6 0.5 0.5 8.6% 6.3% 0.4%
Brazil 8.0 9.2 10.5 11.1 11.5 3.6% 13.7% 9.1%
Chile 1.1 1.3 1.2 1.1 1.2 4.9% 10.8% 0.9%
Colombia 0.3 0.3 0.4 0.4 0.5 17.2% 13.2% 0.4%
Ecuador 0.1 0.1 0.1 0.1 0.1 19.8% 14.8% 0.1%
Peru 0.2 0.2 0.3 0.2 0.3 12.9% 11.9% 0.2%
Trinidad & Tobago - - - - - - -100.0% -
Venezuela - - - - - - - -
Other S. & Cent. America 2.1 2.3 2.5 2.7 2.8 1.5% 9.6% 2.2%
Total S. & Cent. America 12.2 13.9 15.6 16.1 16.8 4.1% 12.3% 13.3%
Austria 1.0 1.0 1.0 1.0 1.0 3.9% 6.3% 0.8%
Azerbaijan - ^ ^ ^ ^ -4.3% - ♦
Belarus ^ ^ ^ ^ ^ - - ♦
Belgium 1.2 1.1 1.0 1.2 1.2 -3.7% 13.2% 0.9%
Bulgaria ^ ^ ^ 0.1 0.1 36.9% - 0.1%
Czech Republic 0.8 0.9 1.1 1.1 1.1 -1.1% 22.1% 0.8%
Denmark 1.0 1.0 1.0 1.0 1.0 4.2% 2.9% 0.8%
Finland 2.5 2.7 2.6 2.6 2.7 3.9% 1.8% 2.1%
France 1.2 1.2 1.3 1.5 1.6 9.9% 5.2% 1.3%
Germany 9.8 10.3 11.0 11.4 11.7 2.3% 13.4% 9.2%
Greece ^ ^ ^ 0.1 0.1 1.3% 6.6% ♦
Hungary 0.4 0.4 0.5 0.5 0.6 18.6% 3.1% 0.5%
Ireland 0.1 0.1 0.1 0.1 0.1 5.2% 13.8% 0.1%
Italy 4.1 5.1 5.6 5.8 5.8 0.5% 8.3% 4.6%
Kazakhstan - - - ^ ^ 289.7% - ♦
Lithuania ^ 0.1 0.1 0.1 0.1 -3.1% 51.5% 0.1%
Netherlands 1.6 1.3 1.1 1.1 1.0 -13.7% -0.7% 0.8%
Norway 0.1 0.1 0.1 ^ ^ - -5.1% ♦
Poland 2.3 2.0 2.3 2.2 1.8 -21.5% 20.7% 1.4%
Portugal 0.7 0.7 0.7 0.7 0.7 -4.9% 6.7% 0.6%
Romania ^ 0.1 0.1 0.1 0.1 -14.4% 56.4% 0.1%
Russian Federation 0.1 0.1 0.1 0.1 0.1 - 0.8% 0.1%
Slovakia 0.2 0.2 0.3 0.4 0.4 0.8% 48.4% 0.3%
Spain 1.1 1.2 1.2 1.3 1.4 5.7% 5.4% 1.1%
Sweden 2.8 2.6 2.4 2.4 2.6 8.5% 3.7% 2.1%
Switzerland 0.4 0.4 0.4 0.4 0.4 15.2% 4.8% 0.4%
Turkey 0.4 0.6 0.9 1.2 1.3 8.5% 37.4% 1.0%
Turkmenistan - - - - - - - -
Ukraine ^ ^ ^ ^ ^ - - ♦
United Kingdom 3.3 4.1 5.1 6.7 6.7 0.4% 12.4% 5.3%
USSR n/a n/a n/a n/a n/a n/a n/a n/a
Uzbekistan - - - - - - - -
Other Europe & Eurasia 1.6 1.6 1.7 1.7 1.8 9.4% 14.4% 1.4%
Total Europe & Eurasia 36.8 39.1 41.8 44.8 45.5 1.4% 9.3% 35.8%
Growth rate per annum
Public Record Exhibit 3
141

Iran ^ ^ ^ ^ ^ - - ♦
Israel ^ ^ ^ ^ ^ - - ♦
Kuwait - - - - - - - -
Qatar - - - - - - - -
Saudi Arabia - - - - - - - -
United Arab Emirates - - - - - - - -
Other Middle East ^ ^ ^ ^ ^ 6.4% 1.8% ♦
Total Middle East ^ ^ ^ ^ ^ 0.3% 37.8% ♦
Algeria - - - - - - - -
Egypt - - - - - - - -
South Africa 0.1 0.1 0.1 0.1 0.1 - 1.3% 0.1%
Other Africa 0.7 0.7 1.0 1.4 1.4 -0.7% 11.5% 1.1%
Total Africa 0.7 0.8 1.1 1.4 1.4 -0.7% 10.7% 1.1%
Australia 0.7 0.8 0.8 0.8 0.8 - -1.5% 0.6%
Bangladesh - - - - - - - -
China 6.9 8.4 10.1 13.6 16.6 21.4% 27.5% 13.1%
China Hong Kong SAR ^ ^ ^ ^ ^ - - ♦
India 3.3 3.3 3.4 3.8 3.6 -5.3% 15.4% 2.9%
Indonesia 2.2 2.2 2.3 2.4 2.5 6.3% 4.7% 2.0%
Japan 5.0 5.2 5.3 5.3 6.0 12.2% 0.9% 4.7%
Malaysia 0.3 0.2 0.2 0.2 0.3 22.3% - 0.2%
New Zealand 1.5 1.6 1.8 1.9 1.9 ♦ 9.0% 1.5%
Pakistan - - ^ 0.1 0.1 - - 0.1%
Philippines 2.4 2.2 2.4 2.6 2.6 2.3% 1.4% 2.1%
Singapore 0.1 0.2 0.2 0.2 0.2 11.4% 5.6% 0.2%
South Korea 1.5 1.7 2.5 2.7 2.7 -0.1% 46.7% 2.1%
Taiwan 0.4 0.4 0.5 0.5 0.5 -4.2% 1.4% 0.4%
Thailand 1.0 1.3 1.7 1.8 2.2 21.8% 15.6% 1.7%
Vietnam ^ ^ ^ ^ ^ - 1.7% ♦
Other Asia Pacific 0.1 0.1 0.1 0.1 0.1 1.7% 12.9% 0.1%
Total Asia Pacific 25.6 27.8 31.4 36.0 40.2 11.2% 10.3% 31.6%
Total World 96.7 103.8 112.3 121.4 127.1 4.4% 7.7% 100.0%
of which: OECD 67.6 71.4 75.3 78.9 80.4 1.6% 5.6% 63.2%
Non-OECD 29.1 32.4 37.1 42.5 46.7 9.6% 13.4% 36.8%
European Union # 34.7 36.7 39.1 41.8 42.4 1.0% 9.1% 33.4%
CIS 0.2 0.2 0.2 0.2 0.2 -0.4% 6.6% 0.2%
* Based on gross generation and not accounting for cross-border electricity supply. Converted on the
basis of thermal equivalence assuming 38% conversion efficiency in a modern thermal power station.
^ Less than 0.05.
♦ Less than 0.05%.
n/a not available.
# Excludes Estonia, Latvia and Lithuania prior to 1985 and Slovenia prior to 1990.
Notes: Annual changes and share of total are calculated using million tonnes oil equivalent figures.
Growth rates are adjusted for leap years.
Public Record Exhibit 3
142

Renewable energy - Biofuels productionShare
Thousand b/doe 2012 2013 2014 2015 2016 2016 2005-15 2016
US 557 582 617 634 669 5.4% 15.2% 43.5%
Canada 19 20 22 21 22 1.2% 22.8% 1.4%
Mexico 0 1 1 1 1 - - 0.1%
Total North America 577 603 640 657 692 5.3% 15.4% 45.0%
Argentina 43 38 50 38 53 38.4% 71.7% 3.4%
Brazil 276 321 337 362 347 -4.3% 8.4% 22.5%
Colombia 12 12 13 13 12 -10.0% 46.2% 0.8%
Other S. & Cent. America 6 7 7 7 7 -1.9% 6.5% 0.5%
Total S. & Cent. America 336 377 407 421 418 -0.6% 9.8% 27.2%
Austria 7 7 6 7 8 9.8% 18.0% 0.5%
Belgium 11 10 11 10 10 - 89.9% 0.7%
Finland 5 6 7 8 8 - 51.8% 0.5%
France 40 43 48 47 42 -11.9% 18.5% 2.7%
Germany 57 52 65 60 60 -0.1% 7.2% 3.9%
Italy 6 9 11 11 11 - 5.1% 0.7%
Netherlands 24 28 33 31 31 - 87.5% 2.0%
Poland 12 13 14 18 17 -4.6% 23.2% 1.1%
Portugal 5 5 6 6 6 -7.5% 79.7% 0.4%
Spain 12 14 19 21 21 2.0% 14.0% 1.4%
Sweden 9 12 15 4 4 -5.1% 15.7% 0.3%
United Kingdom 6 10 8 6 7 12.8% 22.4% 0.4%
Other Europe & Eurasia 27 25 29 33 33 0.4% 19.2% 2.1%
Total Europe & Eurasia 219 234 271 263 258 -1.9% 15.5% 16.7%
Total Middle East 0 0 0 0 0 - - ♦
Total Africa 0 1 1 1 1 - 20.5% ♦
Australia 4 4 3 3 3 -8.5% 21.9% 0.2%
China 39 44 49 50 38 -22.8% 14.6% 2.5%
India 4 5 7 8 9 23.0% 12.7% 0.6%
Indonesia 26 33 48 25 47 84.3% 65.4% 3.0%
South Korea 5 6 6 7 8 4.7% 45.4% 0.5%
Thailand 20 25 28 30 30 0.2% 39.9% 2.0%
Other Asia Pacific 19 23 35 36 35 -1.5% 69.1% 2.3%
Total Asia Pacific 118 140 176 159 170 7.2% 25.0% 11.1%
Total World 1250 1355 1494 1500 1539 2.6% 14.1% 100.0%
of which: OECD 799 840 913 922 952 3.2% 15.5% 61.8%
Non-OECD 451 515 581 578 587 1.6% 12.2% 38.2%
European Union 217 232 268 259 254 -2.0% 15.5% 16.5%
CIS 1 0 0 0 0 - - ♦
^ Less than 0.05.
♦ Less than 0.05%.
Growth rate per annum
Public Record Exhibit 3
143

Notes: Consumption of fuel ethanol and biodiesel is included in oil consumption tables.
Annual changes and shares of total are calculated using thousand barrels a day oil equivalent figures.
Public Record Exhibit 3
144

Renewable energy - Biofuels production
Share
Thousand tonnes of oil equivalent 2012 2013 2014 2015 2016 2016 2005-15 2016
US 29808 31057 32890 33849 35779 5.4% 15.2% 43.5%
Canada 1017 1056 1188 1142 1160 1.2% 22.8% 1.4%
Mexico 15 58 58 58 58 - - 0.1%
Total North America 30840 32171 34137 35049 36997 5.3% 15.4% 45.0%
Argentina 2295 2014 2644 2038 2828 38.4% 71.7% 3.4%
Brazil 14739 17114 18005 19332 18552 -4.3% 8.4% 22.5%
Colombia 627 650 676 693 626 -10.0% 46.2% 0.8%
Other S. & Cent. America 300 354 378 379 373 -1.9% 6.5% 0.5%
Total S. & Cent. America 17961 20131 21703 22442 22378 -0.6% 9.8% 27.2%
Austria 390 374 329 381 419 9.8% 18.0% 0.5%
Belgium 562 547 574 556 558 - 89.9% 0.7%
Finland 263 330 367 445 446 - 51.8% 0.5%
France 2145 2306 2541 2519 2226 -11.9% 18.5% 2.7%
Germany 3031 2770 3460 3191 3198 -0.1% 7.2% 3.9%
Italy 298 457 585 582 583 - 5.1% 0.7%
Netherlands 1276 1495 1756 1675 1680 - 87.5% 2.0%
Poland 652 697 750 940 898 -4.6% 23.2% 1.1%
Portugal 276 274 301 321 298 -7.5% 79.7% 0.4%
Spain 620 749 1030 1122 1148 2.0% 14.0% 1.4%
Sweden 491 635 789 222 211 -5.1% 15.7% 0.3%
United Kingdom 303 517 403 310 351 12.8% 22.4% 0.4%
Other Europe & Eurasia 1428 1351 1560 1749 1761 0.4% 19.2% 2.1%
Total Europe & Eurasia 11734 12503 14445 14012 13777 -1.9% 15.5% 16.7%
Total Middle East 5 5 5 5 5 - - ♦
Total Africa 23 32 40 40 40 - 20.5% ♦
Australia 239 202 169 157 144 -8.5% 21.9% 0.2%
China 2103 2346 2609 2653 2053 -22.8% 14.6% 2.5%
India 229 268 349 410 505 23.0% 12.7% 0.6%
Indonesia 1397 1750 2547 1354 2503 84.3% 65.4% 3.0%
South Korea 283 321 337 385 404 4.7% 45.4% 0.5%
Thailand 1054 1330 1490 1603 1610 0.2% 39.9% 2.0%
Other Asia Pacific 997 1234 1873 1913 1889 -1.5% 69.1% 2.3%
Total Asia Pacific 6300 7450 9374 8476 9110 7.2% 25.0% 11.1%
Total World 66863 72293 79703 80024 82306 2.6% 14.1% 100.0%
of which: OECD 42733 44808 48698 49186 50900 3.2% 15.5% 61.8%
Non-OECD 24130 27485 31005 30838 31407 1.6% 12.2% 38.2%
European Union 11593 12394 14286 13820 13580 -2.0% 15.5% 16.5%
CIS 29 23 25 25 25 - - ♦
^ Less than 0.05.
♦ Less than 0.05%.
Notes: Consumption of fuel ethanol and biodiesel is included in oil consumption tables.
Annual changes and shares of total are calculated using thousand tonnes a day oil equivalent figures.
Growth rates are adjusted for leap years.
Growth rate per annum
Public Record Exhibit 3
145
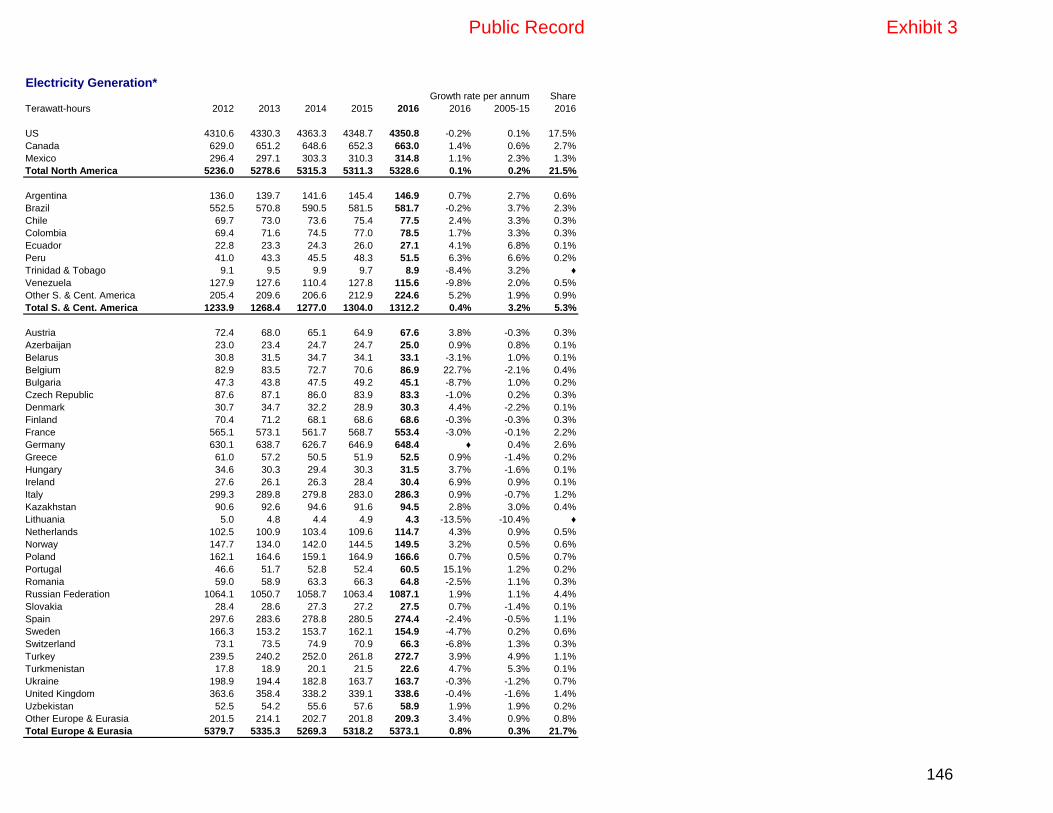
Electricity Generation*Share
Terawatt-hours 2012 2013 2014 2015 2016 2016 2005-15 2016
US 4310.6 4330.3 4363.3 4348.7 4350.8 -0.2% 0.1% 17.5%
Canada 629.0 651.2 648.6 652.3 663.0 1.4% 0.6% 2.7%
Mexico 296.4 297.1 303.3 310.3 314.8 1.1% 2.3% 1.3%
Total North America 5236.0 5278.6 5315.3 5311.3 5328.6 0.1% 0.2% 21.5%
Argentina 136.0 139.7 141.6 145.4 146.9 0.7% 2.7% 0.6%
Brazil 552.5 570.8 590.5 581.5 581.7 -0.2% 3.7% 2.3%
Chile 69.7 73.0 73.6 75.4 77.5 2.4% 3.3% 0.3%
Colombia 69.4 71.6 74.5 77.0 78.5 1.7% 3.3% 0.3%
Ecuador 22.8 23.3 24.3 26.0 27.1 4.1% 6.8% 0.1%
Peru 41.0 43.3 45.5 48.3 51.5 6.3% 6.6% 0.2%
Trinidad & Tobago 9.1 9.5 9.9 9.7 8.9 -8.4% 3.2% ♦
Venezuela 127.9 127.6 110.4 127.8 115.6 -9.8% 2.0% 0.5%
Other S. & Cent. America 205.4 209.6 206.6 212.9 224.6 5.2% 1.9% 0.9%
Total S. & Cent. America 1233.9 1268.4 1277.0 1304.0 1312.2 0.4% 3.2% 5.3%
Austria 72.4 68.0 65.1 64.9 67.6 3.8% -0.3% 0.3%
Azerbaijan 23.0 23.4 24.7 24.7 25.0 0.9% 0.8% 0.1%
Belarus 30.8 31.5 34.7 34.1 33.1 -3.1% 1.0% 0.1%
Belgium 82.9 83.5 72.7 70.6 86.9 22.7% -2.1% 0.4%
Bulgaria 47.3 43.8 47.5 49.2 45.1 -8.7% 1.0% 0.2%
Czech Republic 87.6 87.1 86.0 83.9 83.3 -1.0% 0.2% 0.3%
Denmark 30.7 34.7 32.2 28.9 30.3 4.4% -2.2% 0.1%
Finland 70.4 71.2 68.1 68.6 68.6 -0.3% -0.3% 0.3%
France 565.1 573.1 561.7 568.7 553.4 -3.0% -0.1% 2.2%
Germany 630.1 638.7 626.7 646.9 648.4 ♦ 0.4% 2.6%
Greece 61.0 57.2 50.5 51.9 52.5 0.9% -1.4% 0.2%
Hungary 34.6 30.3 29.4 30.3 31.5 3.7% -1.6% 0.1%
Ireland 27.6 26.1 26.3 28.4 30.4 6.9% 0.9% 0.1%
Italy 299.3 289.8 279.8 283.0 286.3 0.9% -0.7% 1.2%
Kazakhstan 90.6 92.6 94.6 91.6 94.5 2.8% 3.0% 0.4%
Lithuania 5.0 4.8 4.4 4.9 4.3 -13.5% -10.4% ♦
Netherlands 102.5 100.9 103.4 109.6 114.7 4.3% 0.9% 0.5%
Norway 147.7 134.0 142.0 144.5 149.5 3.2% 0.5% 0.6%
Poland 162.1 164.6 159.1 164.9 166.6 0.7% 0.5% 0.7%
Portugal 46.6 51.7 52.8 52.4 60.5 15.1% 1.2% 0.2%
Romania 59.0 58.9 63.3 66.3 64.8 -2.5% 1.1% 0.3%
Russian Federation 1064.1 1050.7 1058.7 1063.4 1087.1 1.9% 1.1% 4.4%
Slovakia 28.4 28.6 27.3 27.2 27.5 0.7% -1.4% 0.1%
Spain 297.6 283.6 278.8 280.5 274.4 -2.4% -0.5% 1.1%
Sweden 166.3 153.2 153.7 162.1 154.9 -4.7% 0.2% 0.6%
Switzerland 73.1 73.5 74.9 70.9 66.3 -6.8% 1.3% 0.3%
Turkey 239.5 240.2 252.0 261.8 272.7 3.9% 4.9% 1.1%
Turkmenistan 17.8 18.9 20.1 21.5 22.6 4.7% 5.3% 0.1%
Ukraine 198.9 194.4 182.8 163.7 163.7 -0.3% -1.2% 0.7%
United Kingdom 363.6 358.4 338.2 339.1 338.6 -0.4% -1.6% 1.4%
Uzbekistan 52.5 54.2 55.6 57.6 58.9 1.9% 1.9% 0.2%
Other Europe & Eurasia 201.5 214.1 202.7 201.8 209.3 3.4% 0.9% 0.8%
Total Europe & Eurasia 5379.7 5335.3 5269.3 5318.2 5373.1 0.8% 0.3% 21.7%
Growth rate per annum
Public Record Exhibit 3
146

Iran 247.7 254.6 274.6 281.9 286.0 1.2% 5.2% 1.2%
Israel 63.0 61.4 61.3 65.4 67.4 2.7% 2.8% 0.3%
Kuwait 62.7 61.0 65.1 68.3 71.1 3.9% 4.6% 0.3%
Qatar 34.8 34.7 38.7 41.8 42.4 0.9% 11.3% 0.2%
Saudi Arabia 271.7 284.0 311.8 328.1 330.5 0.4% 6.4% 1.3%
United Arab Emirates 106.2 110.0 116.5 127.4 136.8 7.1% 7.7% 0.6%
Other Middle East 177.2 171.1 179.1 179.4 181.5 0.9% 4.8% 0.7%
Total Middle East 963.2 976.7 1047.2 1092.4 1115.7 1.9% 5.7% 4.5%
Algeria 57.4 59.9 64.2 68.8 70.2 1.8% 7.3% 0.3%
Egypt 161.9 164.0 170.2 180.6 187.3 3.4% 5.7% 0.8%
South Africa 257.9 256.1 254.7 249.7 251.9 0.6% 0.2% 1.0%
Other Africa 242.3 262.6 275.8 276.3 272.7 -1.6% 4.6% 1.1%
Total Africa 719.4 742.5 764.9 775.4 782.1 0.6% 3.3% 3.2%
Australia 250.7 249.6 247.4 253.0 256.9 1.2% 0.9% 1.0%
Bangladesh 48.6 53.1 55.8 60.8 67.4 10.6% 8.7% 0.3%
China 4987.6 5431.6 5649.6 5814.6 6142.5 5.4% 8.8% 24.8%
China Hong Kong SAR 38.8 39.1 39.8 38.0 38.2 0.3% -0.1% 0.2%
India 1088.2 1141.4 1252.0 1308.4 1400.8 6.8% 6.4% 5.6%
Indonesia 200.3 216.2 228.5 234.0 248.9 6.1% 6.3% 1.0%
Japan 1106.9 1087.8 1062.7 1030.1 999.6 -3.2% -1.1% 4.0%
Malaysia 127.3 138.3 143.6 144.7 156.8 8.1% 4.4% 0.6%
New Zealand 44.3 43.3 43.6 44.3 43.9 -1.2% 0.3% 0.2%
Pakistan 99.3 102.2 107.2 110.2 115.4 4.5% 2.0% 0.5%
Philippines 72.9 75.3 77.3 82.4 89.9 8.8% 3.8% 0.4%
Singapore 46.9 48.0 49.3 50.3 51.6 2.3% 2.8% 0.2%
South Korea 531.2 537.2 540.4 545.5 551.2 0.8% 3.4% 2.2%
Taiwan 250.4 252.4 260.0 258.0 264.1 2.1% 1.3% 1.1%
Thailand 169.0 168.6 173.8 177.8 179.7 0.8% 3.1% 0.7%
Vietnam 115.1 124.5 142.3 159.7 175.7 9.7% 11.9% 0.7%
Other Asia Pacific 87.7 92.9 97.2 102.6 122.1 18.6% 4.5% 0.5%
Total Asia Pacific 9265.1 9801.2 10170.3 10414.3 10904.7 4.4% 5.7% 43.9%
Total World 22797.3 23402.9 23844.0 24215.5 24816.4 2.2% 2.8% 100.0%
of which: OECD 10939.9 10929.3 10875.5 10911.5 10939.2 ♦ 0.2% 44.1%
Non-OECD 11857.4 12473.6 12968.5 13304.0 13877.2 4.0% 5.5% 55.9%
European Union # 3295.7 3267.3 3185.3 3234.3 3247.3 0.1% -0.3% 13.1%
CIS 1523.7 1509.0 1515.3 1499.9 1527.8 1.6% 0.9% 6.2%
* Based on gross output.
♦ Less than 0.05%
# Excludes Slovenia prior to 1990.
Notes: Annual changes and share of total are calculated using terawatt-hours figures.
Growth rates are adjusted for leap years.
Public Record Exhibit 3
147

Carbon Dioxide EmissionsShare
Million tonnes carbon dioxide 2012 2013 2014 2015 2016 2016 2005-15 2016
US 5406.0 5544.3 5599.9 5445.0 5350.4 -2.0% -1.1% 16.0%
Canada 536.0 548.2 545.5 531.6 527.4 -1.1% -0.7% 1.6%
Mexico 491.8 490.0 481.6 481.4 470.3 -2.6% 0.9% 1.4%
Total North America 6433.8 6582.4 6627.0 6458.1 6348.0 -2.0% -1.0% 19.0%
Argentina 182.3 188.4 189.3 193.4 194.3 0.2% 2.9% 0.6%
Brazil 447.3 486.6 508.3 491.3 458.0 -7.0% 4.0% 1.4%
Chile 88.4 90.1 90.6 91.0 95.9 5.1% 4.2% 0.3%
Colombia 81.1 83.1 88.7 91.1 89.0 -2.6% 5.8% 0.3%
Ecuador 34.0 36.2 38.1 37.3 35.0 -6.4% 4.2% 0.1%
Peru 44.2 45.4 46.7 49.2 53.1 7.6% 5.6% 0.2%
Trinidad & Tobago 27.6 29.0 28.3 28.4 25.8 -9.4% 3.7% 0.1%
Venezuela 177.7 175.1 166.6 164.0 161.0 -2.1% 1.4% 0.5%
Other S. & Cent. America 223.6 220.3 223.4 232.1 236.1 1.4% 0.8% 0.7%
Total S. & Cent. America 1306.2 1354.3 1380.1 1377.9 1348.2 -2.4% 3.1% 4.0%
Austria 64.3 64.5 60.1 62.2 63.2 1.3% -1.9% 0.2%
Azerbaijan 28.7 29.4 31.0 33.9 33.9 -0.2% 0.4% 0.1%
Belarus 58.6 59.1 57.7 50.7 53.7 5.7% -1.0% 0.2%
Belgium 118.6 119.3 112.0 117.6 120.2 1.9% -1.6% 0.4%
Bulgaria 45.3 39.9 42.5 45.5 42.9 -6.0% -0.6% 0.1%
Czech Republic 106.7 104.9 99.0 102.3 105.2 2.5% -1.9% 0.3%
Denmark 40.9 43.4 40.3 37.2 38.9 4.4% -3.5% 0.1%
Finland 50.3 50.8 46.1 43.1 44.6 3.1% -3.2% 0.1%
France 336.4 337.3 304.2 309.7 316.0 1.7% -2.2% 0.9%
Germany 770.7 795.1 749.4 751.1 760.8 1.0% -0.9% 2.3%
Greece 88.1 79.8 76.2 73.4 70.5 -4.3% -3.4% 0.2%
Hungary 43.7 42.3 41.6 44.4 45.8 2.8% -2.5% 0.1%
Ireland 38.2 36.9 36.6 38.4 40.5 5.4% -2.2% 0.1%
Italy 380.5 349.9 325.1 336.2 336.9 ♦ -3.3% 1.0%
Kazakhstan 200.9 202.6 225.0 207.6 207.2 -0.5% 3.5% 0.6%
Lithuania 12.3 11.6 10.9 11.3 11.6 2.0% -1.3% ♦
Netherlands 216.4 210.9 199.4 207.5 212.5 2.1% -1.6% 0.6%
Norway 37.5 37.7 37.0 37.0 37.5 1.1% -0.1% 0.1%
Poland 304.5 307.4 290.4 290.1 299.0 2.8% -0.6% 0.9%
Portugal 50.9 49.3 49.2 53.9 52.9 -2.2% -2.0% 0.2%
Romania 81.1 69.4 69.4 69.1 69.2 -0.1% -3.1% 0.2%
Russian Federation 1582.2 1533.8 1542.2 1521.9 1490.1 -2.4% 0.2% 4.5%
Slovakia 32.2 32.9 30.0 30.1 30.7 1.7% -2.4% 0.1%
Spain 306.5 275.3 272.8 289.4 282.4 -2.7% -2.5% 0.8%
Sweden 50.3 48.5 47.6 47.3 49.1 3.6% -2.4% 0.1%
Switzerland 40.6 42.7 38.0 38.9 37.5 -4.0% -1.1% 0.1%
Turkey 317.0 305.5 337.9 343.0 361.8 5.2% 4.1% 1.1%
Turkmenistan 74.5 67.6 74.2 82.8 83.2 0.2% 5.3% 0.2%
Ukraine 296.8 281.3 241.5 190.3 206.9 8.4% -4.9% 0.6%
United Kingdom 512.2 497.4 454.4 433.4 406.4 -6.5% -2.8% 1.2%
USSR n/a n/a n/a n/a n/a n/a n/a n/a
Uzbekistan 109.6 108.5 112.4 115.1 117.0 1.4% 0.7% 0.3%
Other Europe & Eurasia 231.5 229.8 218.2 226.2 230.6 1.7% 0.5% 0.7%
Total Europe & Eurasia 6627.9 6464.8 6272.5 6240.7 6258.5 ♦ -1.0% 18.7%
Growth rate per annum
Public Record Exhibit 3
148
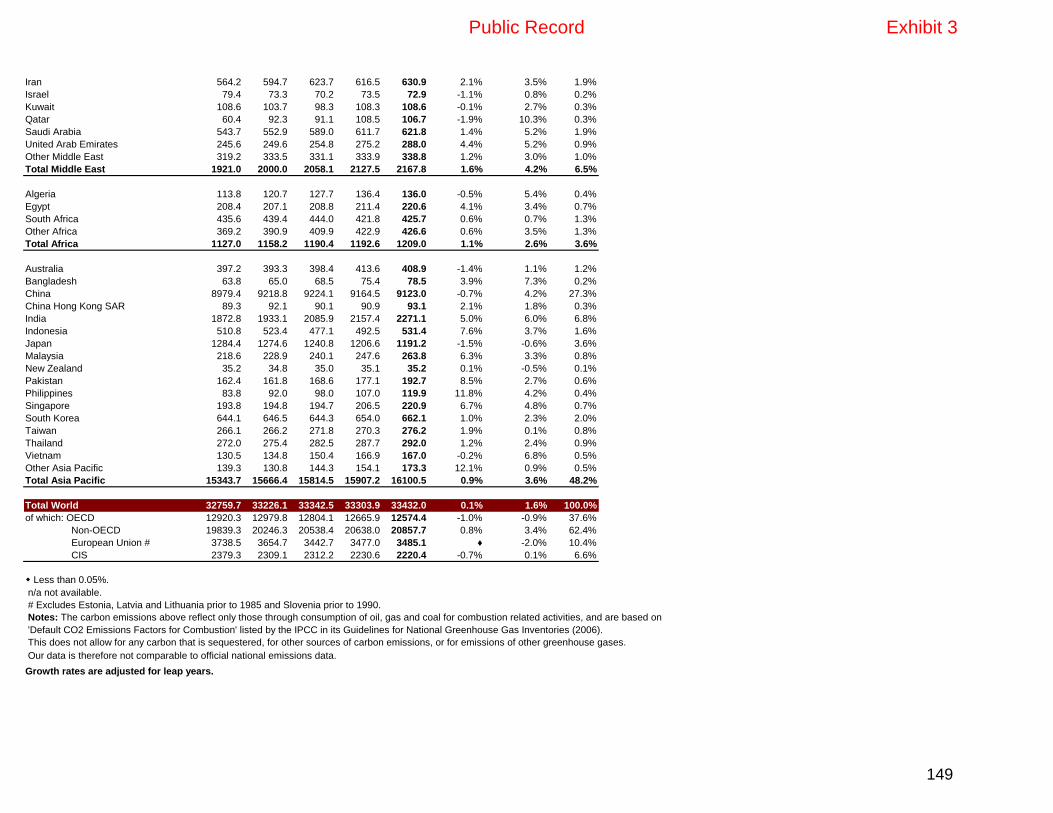
Iran 564.2 594.7 623.7 616.5 630.9 2.1% 3.5% 1.9%
Israel 79.4 73.3 70.2 73.5 72.9 -1.1% 0.8% 0.2%
Kuwait 108.6 103.7 98.3 108.3 108.6 -0.1% 2.7% 0.3%
Qatar 60.4 92.3 91.1 108.5 106.7 -1.9% 10.3% 0.3%
Saudi Arabia 543.7 552.9 589.0 611.7 621.8 1.4% 5.2% 1.9%
United Arab Emirates 245.6 249.6 254.8 275.2 288.0 4.4% 5.2% 0.9%
Other Middle East 319.2 333.5 331.1 333.9 338.8 1.2% 3.0% 1.0%
Total Middle East 1921.0 2000.0 2058.1 2127.5 2167.8 1.6% 4.2% 6.5%
Algeria 113.8 120.7 127.7 136.4 136.0 -0.5% 5.4% 0.4%
Egypt 208.4 207.1 208.8 211.4 220.6 4.1% 3.4% 0.7%
South Africa 435.6 439.4 444.0 421.8 425.7 0.6% 0.7% 1.3%
Other Africa 369.2 390.9 409.9 422.9 426.6 0.6% 3.5% 1.3%
Total Africa 1127.0 1158.2 1190.4 1192.6 1209.0 1.1% 2.6% 3.6%
Australia 397.2 393.3 398.4 413.6 408.9 -1.4% 1.1% 1.2%
Bangladesh 63.8 65.0 68.5 75.4 78.5 3.9% 7.3% 0.2%
China 8979.4 9218.8 9224.1 9164.5 9123.0 -0.7% 4.2% 27.3%
China Hong Kong SAR 89.3 92.1 90.1 90.9 93.1 2.1% 1.8% 0.3%
India 1872.8 1933.1 2085.9 2157.4 2271.1 5.0% 6.0% 6.8%
Indonesia 510.8 523.4 477.1 492.5 531.4 7.6% 3.7% 1.6%
Japan 1284.4 1274.6 1240.8 1206.6 1191.2 -1.5% -0.6% 3.6%
Malaysia 218.6 228.9 240.1 247.6 263.8 6.3% 3.3% 0.8%
New Zealand 35.2 34.8 35.0 35.1 35.2 0.1% -0.5% 0.1%
Pakistan 162.4 161.8 168.6 177.1 192.7 8.5% 2.7% 0.6%
Philippines 83.8 92.0 98.0 107.0 119.9 11.8% 4.2% 0.4%
Singapore 193.8 194.8 194.7 206.5 220.9 6.7% 4.8% 0.7%
South Korea 644.1 646.5 644.3 654.0 662.1 1.0% 2.3% 2.0%
Taiwan 266.1 266.2 271.8 270.3 276.2 1.9% 0.1% 0.8%
Thailand 272.0 275.4 282.5 287.7 292.0 1.2% 2.4% 0.9%
Vietnam 130.5 134.8 150.4 166.9 167.0 -0.2% 6.8% 0.5%
Other Asia Pacific 139.3 130.8 144.3 154.1 173.3 12.1% 0.9% 0.5%
Total Asia Pacific 15343.7 15666.4 15814.5 15907.2 16100.5 0.9% 3.6% 48.2%
Total World 32759.7 33226.1 33342.5 33303.9 33432.0 0.1% 1.6% 100.0%
of which: OECD 12920.3 12979.8 12804.1 12665.9 12574.4 -1.0% -0.9% 37.6%
Non-OECD 19839.3 20246.3 20538.4 20638.0 20857.7 0.8% 3.4% 62.4%
European Union # 3738.5 3654.7 3442.7 3477.0 3485.1 ♦ -2.0% 10.4%
CIS 2379.3 2309.1 2312.2 2230.6 2220.4 -0.7% 0.1% 6.6%
w Less than 0.05%.
n/a not available.
# Excludes Estonia, Latvia and Lithuania prior to 1985 and Slovenia prior to 1990.
Notes: The carbon emissions above reflect only those through consumption of oil, gas and coal for combustion related activities, and are based on
'Default CO2 Emissions Factors for Combustion' listed by the IPCC in its Guidelines for National Greenhouse Gas Inventories (2006).
This does not allow for any carbon that is sequestered, for other sources of carbon emissions, or for emissions of other greenhouse gases.
Our data is therefore not comparable to official national emissions data.
Growth rates are adjusted for leap years.
Public Record Exhibit 3
149

Renewable energy - geothemal
Cumulative installed geothermal power capacity*
Share
Megawatts 2012 2013 2014 2015 2016 2016 2005-15 2016
Australia 1 2 2 2 2 0.0% 30.2% 0.0%
Austria 1 1 1 1 1 0.0% 1.6% 0.0%
China 24 27 27 27 27 0.0% -0.3% 0.2%
Costa Rica 208 208 208 208 208 0.0% 2.5% 1.5%
El Salvador 204 204 204 204 204 0.0% 3.1% 1.5%
Ethiopia 7 7 7 7 7 0.0% 0.0% 0.1%
France (Guadeloupe) 16 17 17 17 17 0.0% 1.5% 0.1%
Germany 12 17 27 27 27 0.0% 63.1% 0.2%
Guatemala 52 48 48 48 48 0.0% 3.8% 0.4%
Iceland 665 665 665 665 665 0.0% 12.6% 4.9%
Indonesia 1339 1339 1401 1401 1590 13.5% 5.1% 11.8%
Italy 875 876 916 916 916 0.0% 1.5% 6.8%
Japan 536 537 539 544 544 0.0% 0.2% 4.1%
Kenya 217 253 450 605 676 11.7% 13.7% 5.0%
Mexico 812 834 834 887 907 2.3% -0.8% 6.7%
New Zealand 723 971 971 971 971 0.0% 8.6% 7.2%
Nicaragua 160 160 160 160 160 0.0% 7.5% 1.2%
Papua New Guinea 56 56 56 56 56 0.0% 26.1% 0.4%
Philippines 1848 1868 1917 1917 1929 0.6% -0.3% 14.4%
Portugal (The Azores) 29 29 29 29 29 0.0% 6.1% 0.2%
Russia (Kamchatka) 82 82 82 82 82 0.0% 0.4% 0.6%
Thailand 0 0 0 0 0 0.0% 0.0% 0.0%
Turkey 114 226 405 624 775 24.2% 40.8% 5.8%
US 3450 3524 3525 3596 3596 0.0% 2.2% 26.8%
Total World 11397 11917 12492 12995 13438 3.4% 3.3% 100.0%
Sources:ThinkGeoEnergy, International Geothermal Association, and national sources.
* End of year.
Growth rate per annum
Public Record Exhibit 3
150

Renewable energy - solar
Cumulative installed photovoltaic (PV) power* Share
Megawatts 2012 2013 2014 2015 2016 2016 2005-15 2016
US 7328 12079 18317 25570 40300 57.6% 63.3% 13.4%
Canada 827 1272 1904 2515 2715 8.0% 65.0% 0.9%
Mexico 35 66 114 170 320 88.2% 26.0% 0.1%
Total North America 8190 13416 20335 28255 43335 53.4% 62.2% 14.4%
Chile 2 15 218 848 1603 89.0% n/a 0.5%
Honduras 5 5 5 393 414 5.3% n/a 0.1%
Other S. & Cent. America 295 397 531 787 970 23.3% 80.8% 0.3%
Total S. & Cent. America 302 417 754 2028 2987 47.3% 98.7% 1.0%
Austria 263 626 785 923 1077 16.7% 44.0% 0.4%
Belgium 2800 3058 3153 3252 3422 5.2% 95.4% 1.1%
Bulgaria 1010 1020 1026 1029 1032 0.3% n/a 0.3%
Czech Republic 2022 2064 2068 2075 2073 -0.1% n/a 0.7%
Denmark 408 563 606 830 900 8.4% 77.3% 0.3%
Finland 8 8 11 15 20 33.3% 27.7% 0.0%
France 4094 4748 5702 6571 7130 8.5% 74.0% 2.4%
Germany 33033 36337 38343 39799 41275 3.7% 34.5% 13.7%
Greece 1536 2579 2596 2604 2611 0.3% 86.9% 0.9%
Hungary 12 35 77 168 225 33.9% n/a 0.1%
Italy 16456 18202 18606 18906 19279 2.0% 86.3% 6.4%
Netherlands 363 723 1123 1575 2100 33.3% 42.6% 0.7%
Norway 10 11 13 16 27 70.1% 8.0% 0.0%
Portugal 244 299 416 455 513 12.7% 72.1% 0.2%
Romania 41 761 1293 1326 1372 3.5% n/a 0.5%
Slovakia 513 533 533 533 540 1.3% n/a 0.2%
Spain 5104 5354 5376 5435 5490 1.0% 58.2% 1.8%
Sweden 24 43 79 115 175 52.2% 39.2% 0.1%
Switzerland 437 756 1061 1390 1640 18.0% 48.3% 0.5%
Turkey 12 18 58 248 832 235.5% 61.9% 0.3%
Ukraine 371 748 819 839 938 11.8% n/a 0.3%
United Kingdom 1771 2897 5493 9688 11727 21.0% 97.6% 3.9%
Other Europe & Eurasia 271 453 627 839 974 16.1% 42.1% 0.3%
Total Europe & Eurasia 70802 81836 89864 98630 105371 6.8% 45.4% 35.0%
Israel 237 481 681 780 910 16.7% 94.6% 0.3%
Other Middle East 39 75 115 173 510 194.8% n/a 0.2%
Total Middle East 276 556 796 953 1420 49.0% 98.6% 0.5%
South Africa 72 280 1034 1039 1544 48.6% 51.8% 0.5%
Other Africa 337 409 484 614 947 54.2% 40.8% 0.3%
Total Africa 409 689 1518 1653 2491 50.7% 46.6% 0.8%
Australia 2415 3226 4028 4735 5488 15.9% 54.6% 1.8%
China 6750 17740 28380 43530 78070 79.3% 90.8% 25.9%
India 1176 2320 3062 5040 9010 78.8% 75.7% 3.0%
Japan 6632 13599 23339 34151 42750 25.2% 37.4% 14.2%
Malaysia 32 139 204 232 286 23.3% n/a 0.1%
Growth rate per annum
Public Record Exhibit 3
151

Pakistan 0 46 119 778 978 25.7% n/a 0.3%
Philippines 16 21 22 144 900 525.0% n/a 0.3%
South Korea 1024 1555 2481 3500 4350 24.3% 74.3% 1.4%
Taiwan 223 392 620 842 1210 43.7% n/a 0.4%
Thailand 388 824 1299 1424 2150 51.0% 50.7% 0.7%
Other Asia Pacific 168 229 326 485 677 39.6% 47.6% 0.2%
Total Asia Pacific 18824 40090 63880 94861 145869 53.8% 50.3% 48.4%
Total World 98803 137005 177147 226380 301473 33.2% 48.9% 100.0%
Sources: IEA Photovoltaic Power Systems Programme, IRENA, Solar Power Europe, EurObserver, and national sources.
* End of year.
Public Record Exhibit 3
152

Renewable energy – wind
Cumulative installed wind turbine capacity* Share
Megawatts 2012 2013 2014 2015 2016 2016 2005-15 2016
US 60208 61292 66146 74260 82453 11.0% 23.2% 17.6%
Canada 6214 7813 9684 11209 11890 6.1% 32.3% 2.5%
Mexico 1512 1988 2510 3224 3678 14.1% 101.0% 0.8%
Total North America 67934 71093 78340 88693 98021 10.5% 24.6% 20.9%
Argentina 166 242 295 303 303 0.0% 25.6% 0.1%
Brazil 2508 3466 5962 8726 10740 23.1% 76.9% 2.3%
Chile 202 301 764 911 1424 56.3% 84.4% 0.3%
Costa Rica 148 148 197 278 319 14.7% 13.4% 0.1%
Uruguay 56 59 529 845 1210 43.2% n/a 0.3%
Other S. & Cent. America 896 1303 1445 2224 2751 23.7% 45.6% 0.6%
Total S. & Cent. America 3976 5519 9192 13287 16747 26.0% 52.7% 3.6%
Austria 1378 1661 2072 2390 2618 9.5% 11.3% 0.6%
Belgium 1444 1720 1960 2170 2401 10.6% 28.5% 0.5%
Bulgaria 643 650 660 660 660 0.0% n/a 0.1%
Denmark 4137 4747 4778 4966 5133 3.4% 4.9% 1.1%
Finland 268 428 611 984 1512 53.7% 27.7% 0.3%
France 7583 8164 9337 10324 11670 13.0% 29.6% 2.5%
Germany 30979 33477 38614 44541 49534 11.2% 9.3% 10.6%
Greece 1749 1866 1980 2136 2374 11.2% 13.5% 0.5%
Hungary 325 329 329 329 329 0.0% 34.1% 0.1%
Ireland 1812 2100 2322 2500 2824 13.0% 17.5% 0.6%
Italy 8102 8542 8683 9137 9257 1.3% 18.2% 2.0%
Netherlands 2552 2714 2876 3402 4191 23.2% 10.8% 0.9%
Norway 705 818 859 869 885 1.8% 12.2% 0.2%
Poland 2547 3441 3885 5149 5831 13.2% 54.8% 1.2%
Portugal 4363 4557 4683 4770 5005 4.9% 15.9% 1.1%
Romania 1913 2608 2962 2985 3037 1.7% n/a 0.6%
Spain 22722 22898 23025 22988 23026 0.2% 8.7% 4.9%
Sweden 3750 4474 5524 6128 6618 8.0% 27.2% 1.4%
Turkey 2261 2760 3630 4503 5376 19.4% 71.9% 1.1%
United Kingdom 8899 11212 13037 14291 15695 9.8% 26.7% 3.3%
Other Europe & Eurasia 1557 1809 2110 2404 2553 6.2% 31.1% 0.5%
Total Europe & Eurasia 109689 120974 133937 147625 160530 8.7% 13.7% 34.2%
Iran 98 98 117 117 117 0.0% 19.0% 0.0%
Other Middle East 12 12 19 127 202 59.1% 30.3% 0.0%
Total Middle East 110 110 136 244 319 30.7% 23.5% 0.1%
Egypt 552 552 610 810 810 0.0% 16.2% 0.2%
Ethiopia 81 171 171 324 324 0.0% n/a 0.1%
Morocco 394 495 798 798 798 0.0% 28.7% 0.2%
South Africa 10 257 569 1079 1473 36.5% 80.1% 0.3%
Tunisia 173 200 233 245 245 0.0% 29.1% 0.1%
Other Africa 56 62 74 125 136 8.8% 26.4% 0.0%
Total Africa 1266 1737 2455 3381 3786 12.0% 28.4% 0.8%
Australia 2834 3489 4056 4436 4576 3.2% 20.0% 1.0%
Growth rate per annum
Public Record Exhibit 3
153

China 62956 76560 96370 129340 148640 14.9% 58.9% 31.7%
India 18420 20150 22465 25088 28700 14.4% 18.9% 6.1%
Japan 2673 2722 2840 3084 3280 6.4% 10.3% 0.7%
New Zealand 623 623 683 690 690 0.0% 15.2% 0.1%
Pakistan 56 106 256 308 591 91.9% n/a 0.1%
Philippines 33 33 283 394 394 0.0% 31.8% 0.1%
South Korea 446 506 612 869 1089 25.3% 25.6% 0.2%
Taiwan 571 614 637 647 682 5.4% 39.1% 0.1%
Thailand 112 223 225 234 449 91.9% n/a 0.1%
Other Asia Pacific 118 156 344 425 496 16.7% 19.4% 0.1%
Total Asia Pacific 88842 105182 128771 165515 189587 14.5% 35.5% 40.4%
Total World 271817 304615 352831 418745 468989 12.0% 21.6% 100.0%
Sources: Navigant Consulting, Global Wind Energy Council, IRENA and national sources.
Public Record Exhibit 3
154

Approximate conversion factors
To
tonnes US tonnes/
Crude oil* (metric) kilolitres barrels gallons year
From Multiply by
Tonnes (metric) 1 1.165 7.33 307.86 –
Kilolitres 0.8581 1 6.2898 264.17 –
Barrels 0.1364 0.159 1 42 –
US gallons 0.00325 0.0038 0.0238 1 –
Barrels/day – – – – 49.8
*Based on worldwide average gravity.
To convert
barrels tonnes kilolitres tonnes
Products to tonnes to barrels to tonnes to kilolitres
Liquefied petroleum gas (LPG) 0.086 11.60 0.542 1.844
Gasoline 0.120 8.35 0.753 1.328
Kerosene 0.127 7.88 0.798 1.253
Gas oil/ diesel 0.134 7.46 0.843 1.186
Residual fuel oil 0.157 6.35 0.991 1.010
Product basket 0.125 7.98 0.788 1.269
To
billion cubic billion cubic million tonnes million tonnes trillion British million barrels
Natural gas (NG) and liquefied natural gas (LNG) metres NG feet NG oil equivalent LNG thermal units oil equivalent
From
1 billion cubic metres NG 1 35.3 0.90 0.74 35.7 6.16
1 billion cubic feet NG 0.028 1 0.025 0.021 1.01 0.17
1 million tonnes oil equivalent 1.11 39.2 1 0.82 39.7 6.84
1 million tonnes LNG 1.36 48.0 1.22 1 48.6 8.37
1 trillion British thermal units 0.028 0.99 0.025 0.021 1 0.17
1 million barrels oil equivalent 0.16 5.74 0.15 0.12 5.80 1
Units
1 metric tonne = 2204.62 lb.
= 1.1023 short tons
1 kilolitre = 6.2898 barrels
1 kilolitre = 1 cubic metre
1 kilocalorie (kcal) = 4.187 kJ = 3.968 Btu
1 kilojoule (kJ) = 0.239 kcal = 0.948 Btu
1 British thermal unit (Btu) = 0.252 kcal = 1.055 kJ
1 kilowatt-hour (kWh) = 860 kcal = 3600 kJ = 3412 Btu
Calorific equivalents
One tonne of oil equivalent equals approximately:
Heat units 10 million kilocalories
42 gigajoules
40 million Btu
Multiply by
Multiply by
Public Record Exhibit 3
155

Solid fuels 1.5 tonnes of hard coal
3 tonnes of lignite amd sub-bituminous coal
Gaseous fuels See Natural gas and LNG table
Electricity 12 megawatt-hours
One million tonnes of oil or oil equivalent produces about 4400 gigawatt-hours (=4.4 terawatt hours) of electricity in a modern power station.
1 barrel of ethanol = 0.58 barrels of oil equivalent
1 barrel of biodisel = 0.86 barrels of oil equivalent
1 tonne of ethanol = 0.68 tonne of oil equivalent
1 tonne of biodiesel = 0.88 tonne of oil equivalent
Other terms
Tonnes: Metric equivalent of tons
Public Record Exhibit 3
156
Definitions
Statistics published in this Review are taken from government sources and published data.
No use is made of confidential information obtained by BP in the course of its business
Country groupings are made purely for statistical purposes and are not intended to imply any judgement about political or economic standings.
Country and geographical groupings
North America:
US (excluding US territories), Canada and Mexico.
South and Central America:
Caribbean (including Puerto Rico and US Virgin Islands), Central and South America.
Europe:
European members of the OECD plus Albania, Bosnia-Herzegovina, Bulgaria, Croatia, Cyprus, The former Yugoslav Republic of Macedonia, Georgia, Gibraltar, Latvia, Lithuania, Malta,
Montenegro, Romania and Serbia.
Commonwealth of Independent Staets (CIS):
Armenia, Azerbaijan, Belarus, Kazakhstan, Kyrgyzstan, Moldova, Russian Federation, Tajikistan, Turkmenistan, Ukraine, Uzbekistan.
Europe and Eurasia:
All countries listed above under the headings Europe and CIS
Middle East:
Arabian Peninsula, Iran, Iraq, Israel, Jordan, Lebanon, Syria.
North Africa:
Territories on the north coast of Africa from Egypt to Western Sahara.
West Africa:
Territories on the west coast of Africa from Mauritania to Angola, including Cape Verde, Chad
East and Southern Africa:
Territories on the east coast of Africa from Sudan to Republic of South Africa. Also Botswana, Madagascar, Malawi, Namibia, Uganda, Zambia, Zimbabwe.
Asia Pacific:
Brunei, Cambodia, China, China Hong Kong SAR*, China Macau SAR*, Indonesia, Japan, Laos, Malaysia, Mongolia, North Korea, Philippines, Singapore, South Asia (Afghanistan, Bangladesh,
India, Myanmar, Nepal, Pakistan and Sri Lanka), South Korea, Taiwan, Thailand, Vietnam, Australia, New Zealand, Papua New Guinea and Oceania.
*Special Administrative Region
Australasia:
Australia, New Zealand.
OECD members (Organization For Economic Co-operation and Development)
Europe: Austria, Belgium, Czech Republic, Denmark, Estonia, Finland, France, Germany, Greece, Hungary, Iceland, Ireland, Italy, Luxembourg, Netherlands, Norway, Poland, Portugal, Slovakia,
Slovenia, Spain, Sweden, Switzerland, Turkey, United Kingdom. Other member countries: Australia, Canada, Chile, Israel, Japan, Mexico, New Zealand, South Korea, US.
OPEC members (Organization of the Petroleum Exporting Countries)
Middle East: Iran, Iraq, Kuwait, Qatar, Saudi Arabia, United Arab Emirates. North Africa: Algeria, Libya. West Africa: Angola, Nigeria. South America: Ecuador, Venezuela.
European Union members
Public Record Exhibit 3
157

Austria, Belgium, Bulgaria, Croatia, Cyprus, Czech Republic, Denmark, Estonia, Finland, France, Germany, Greece, Hungary, Ireland, Italy, Latvia, Lithuania, Luxembourg, Malta, Netherlands,
Poland, Portugal, Romania, Slovakia, Slovenia, Spain, Sweden, UK.
Non-OECD
All countries that are not members of the OECD.
MethodologyThe primary energy values of nuclear and hydroelectric generation, as well as electricity from renewable sources, have been derived by calculating
the equivalent amount of fossil fuel required to generate the same volume of electricity in a thermal power station, assuming a conversion efficiency of 38% (the average for OECD thermal power generation)Fuels used as inputs for conversion technologies (gas-to-liquids, coal-to-liquids, and coal to gas) are counted as production for the source fuel and the outputs are counted as consumption for the
converted fuel are counted as consumption for the converted fuel."
Percentages: Calculated before rounding of actuals.
Rounding differences: Because of rounding, some totals may not agree exactly with the sum of their component parts.
Tonnes: Metric equivalent of tons
Public Record Exhibit 3
158

Country Price (USD cent/kWh) Source
Thailand 8 http://www.boi.go.th/index.php?page=utility_costs
Malaysia 9 https://www.tnb.com.my/commercial-industrial/pricing-tariffs1/
Indonesia 8.1
https://www.mrfixitbali.com/electrical/electricity-
supply/electricity-cost-Indonesia.html
Vietnam 7.4
http://www.evn.com.vn/c3/evn-va-khach-hang/Bieu-gia-ban-le-
dien-9-79.aspx
Australia
(Queensland) 9.4
http://www.qca.org.au/getattachment/f3f7d440-1910-4134-85dc-
e2e7df5e9552/QCA-Final-Determination-Regulated-electricity-
pr.aspx
0
1
2
3
4
5
6
7
8
9
10
Thailand Malaysia Indonesia Vietnam Australia(Queensland)
Price (USD cent/kWh)
Public Record Exhibit 6
159

Sitemap
Webmail
Vietnamese
Introduction
Cooperation Information
Media
EVN and Customers
Contact Us
Electricity Price
Homepage
EVN and Customers
How to use our power services
Electricity Price
Customer contact centers
Community Activities
FAQ
RETAIL ELECTRICITY TARIFF
a) Manufacturing industries
Customer group Rate (VND/kWh)
1.1 Voltage of 110kV and above
a) Standard hour 1,388
Public Record Exhibit 6
160

Customer group Rate (VND/kWh)
b) Off-peak hour 869
c) Peak hour 2,459
1.2 Voltage of 22kV to below 110kV
a) Standard hour 1,405
b) Off-peak hour 902
c) Peak hour 2,556
1.3 Voltage of 6kV to below 22kV
a) Standard hour 1,453
b) Off-peak hour 934
c) Peak hour 2,637
1.4 Voltage of below 6kV
a) Standard hour 1,518
b) Off-peak hour 983
c) Peak hour 2,735
Customer purchasing electricity at 20kV voltage are charged at the rate for voltages of 22kV to below 110kV.
b) Administrative offices, civil service units
Customer group Rate (VND/kWh)
1 Hospitals, nurseries, kindergartens, schools
Voltage of 6kV and above 1,460
Voltage of below 6kV 1,557
2 Public lighting, administrative and civil service units
Voltage of 6kV and above 1,606
Voltage of below 6kV 1,671
c) Business
Public Record Exhibit 6
161

Customer group Rate (VND/kWh)
1 Voltage of 22kV and above
a) Standard hour 2,125
b) Off-peak hour 1,185
c) Peak hour 3,699
2 Voltage of 6kV up to below 22 kV
a) Standard hour 2,287
b) Off-peak hour 1,347
c) Peak hour 3,829
3 Voltage of below 6kV
a) Standard hour 2,320
b) Off-peak hour 1,412
c) Peak hour 3,991
d) Household
Customer group Rate (VND/kWh)
1 Retail price for household electricity
For the first 50 kWh (1 – 50 kWh) 1,484
For the next 50 kWh (51 – 100 kWh) 1,533
For the next 100 kWh (101 – 200 kWh) 1,786
For the next 100 kWh (201 – 300 kWh) 2,242
For the next 100 kWh (301 – 400 kWh) 2,503
For the next kWh (401 kWh onwards) 2,587
2 Retail price for household electricity via prepaid card
meter 2,141
For students and laborers living in rented housing: every four registered individuals is entitled to the rate applied to one household (one individual is charged at ¼ of the rate applied to a household).
Public Record Exhibit 6
162

21/12/2016 10:04
Other News
WHOLESALE ELECTRICITY TARIFF (19/12/2016)
TIME – OF – USE ELECTRICITY CHARGE (15/12/2016)
ELECTRICITY CHARGE APPLICABLE TO POOR, LOW-INCOME HOUSEHOLDS (12/12/2016)
ELECTRICITY CHARGE CALCULATION IN MONTHS WITH CHARGE RATE (10/12/2016)
CHARGE FOR REACTIVE POWER CAPACITY (09/12/2016)
Website: http://en.evn.com.vn/d6/gioi-thieu-d/RETAIL-ELECTRICITY-TARIFF-9-28-252.aspx
Public Record Exhibit 6
163

FAQ
CONTACT US
USEFUL LINKS
SITE MAP
USER SURVEY
Search :
Advanced Search
HOME
ABOUT US
WHY THAILAND
DOING BUSINESS
INVESTMENT PROMOTION
BUSINESS OPPORTUNITIES
RESOURCE CENTER
DOING BUSINESS / Cost of Doing Business in Thailand / Utility Costs
UTILITY COSTS Water Rates for Regional Areas
Commerce, Government Agency, State Enterprise and Industry
Volume (cubic meters)
Water rate per cubic meter
Baht US$
0 - 10 9.50 but not less than 90.00 Baht 0.27 but not less than 2.57
11 - 20 10.70 0.31
Public Record Exhibit 6
164

21 - 30 10.95 0.31
31 - 40 13.21 0.38
41 - 50 13.54 0.39
51 - 60 13.86 0.40
61 - 80 14.19 0.40
81 - 100 14.51 0.41
101 - 120 14.84 0.42
121 - 160 15.16 0.43
161 - 200 15.49 0.44
Over 200 15.81 0.45
Source: Metropolitan Waterworks Authority, as of July 2016: www.mwa.co.th Electricity Tariffs Schedule 1: Residential (Applicable to households and other dwelling places, monasteries, rectories and places of worship, including its compound through a single watt-hour meter.)
1.1 Normal Rate
Energy Charge (per kWh) Service Charge
Baht US$ Baht/month US$/month
1.1.1 Consumption not exceeding 150 kWh per month 8.19 0.23
- First 15 kWh (0-15th) 2.35 0.07
- Next 10 kWh (16th-25th) 2.99 0.09
- Next 10 kWh (26th-35th) 3.24 0.09
- Next 65 kWh (36th-100th) 3.62 0.10
- Next 50 kWh (101st-150th) 3.72 0.11
- Next 250 kWh (151st-400th) 4.22 0.12
- Over 400 kWh (401st and over) 4.42 0.13
Customer, who is classified under 1.1.1, will be received free electricity for that month if consumption not exceeding 50 kWh.
1.1.2 Consumption exceeding 150 kWh per month 38.22 1.09
Public Record Exhibit 6
165

- First 150 kWh (0-150th) 3.25 0.09
- Next 250 kWh (151st-400th) 4.22 0.12
- Over 400 kWh (401st and over) 4.42 0.13
1.2 Time of Use Rate (TOU)
Peak (per kWh)
Off Peak (per kWh) Service Charge
Baht US$ Baht US$ Baht/month US$/month
1.2.1 At voltage level between 12-24 kV 5.11 0.15 2.60 0.07 312.24 8.91
1.2.2 At voltage level less than 12 kV 5.80 0.17 2.64 0.08 38.22 1.09
Notes: 1. Customer with installed meter less than 5 Amp, 200 V., 1 phase, 2 Wires, is classified under 1.1.1. However, if monthly consumption is over 150 kWh for 3 consecutive months, the customer will be reclassified under 1.1.2 for the following month; and if monthly consumption is not over 150 kWh for 3 consecutive months, the customer will be reclassified under 1.1.1 for the following month. 2. Customer with installed meter over 5 Amp, 220 V., 1 Phase, 2 Wires, is classified under 1.1.2. 3. As for tariff No. 1.2, if meter is installed on the low voltage side of customer’s transformer, another 2% must be added to energy consumption in order to compensate for transformer losses. 4. Tariff No. 1.2 is an optional rate, and may be switched back to Tariff No. 1.1 following a minimum use of 12 months. Moreover, the customer is obligated to pay any additional cost for the installation and removal of any equipment that requires a meter, and/ or any cost charged by the PEA. Schedule 2: Small General Service (Applicable to businesses, residences, industries, government institutions, local authorities, state enterprises, embassies, establishments related to foreign countries, or international organizations, etc., Including compounds with a maximum of 15-minute integrated demand of less than 30 kW through a single watt-hour meter)
2.1 Normal Rate
Energy Charge (per kWh) Service Charge
Baht US$ Baht/month US$/month
1.1.1 At voltage level between 12-24 kV 3.91 0.11 312.24 8.91
1.1.2 At voltage level less than 12 kV 46.16 1.32
- First 150 kWh (0 - 150th) 3.25 0.09
- Next 250 kWh (151st - 400th) 4.22 0.12
- Over 400 kWh (401 - and over) 4.42 0.13
Peak (per kWh)
Off Peak (per kWh) Service Charge
Public Record Exhibit 6
166

2.2 Time of Use Rate (TOU) Baht US$ Baht US$ Baht/month US$/month
1.1.1 At voltage level between 22-33 kV 5.11 0.15 2.60 0.07 312.24 8.91
1.1.2 At voltage level less than 22 kV 5.80 0.17 2.64 0.08 46.16 1.32
Note: 1. As for Tariff No. 2.2, if the meter is installed on the low voltage side of a customer’s transformer, another 2% must be added to energy consumption in order to compensate for the transformer’s losses. 2. Tariff No. 2.2 is an optional rate and may switched back to Tariff No. 2.1 following a minimum use of 12 months. Moreover, the customer is obligated to pay any additional cost for the installation and removal of any equipment that requires a meter, and/ or any cost charged by the PEA. 3. In any month, if the maximum integrated demand is equal to or over 30 kW, the customer will be classified under Schedule 3-5 depending on the case. Schedule 3: Medium General Service (Applicable to businesses, industries, government institutions, local authorities, state enterprises, embassies, establishments related to foreign countries or international organizations, including compounds with a maximum 15-minute integrated demand of at least 30 kW but less than 1,000 kW, and an average energy consumption in the last 3 consecutive months, that does not exceed 250,000 kWh per month through a single demand meter)
3.1 Normal Rate
Demand Charge (per kW)
Energy Charge (per kWh)
Service Charge
(per month)
Baht US$ Baht US$ Baht US$
3.1.1 At voltage level 69 kV and above 175.70 5.01 3.14 0.09 312.24 8.91
3.1.2 At voltage level between 12-24 kV 196.26 5.60 3.17 0.09 312.24 8.91
3.1.3 At voltage level less than 12 kV 221.50 6.32 3.20 0.09 312.24 8.91
Demand Charge (per kW)
Energy Charge (per kWh)
Service Charge
(per month)
Baht US$ Baht US$ Baht US$
3.2 Time of Use Rate (TOU) Peak
(per kWh) Off Peak
(per kWh)
3.2.1 At voltage level 69 kV and above 74.14 2.12 4.13 0.12 2.61 0.07 312.24 8.91
3.2.2 At voltage level between 12-24 kV 132.93 3.79 4.21 0.12 2.63 0.08 312.24 8.91
Public Record Exhibit 6
167

3.2.3 At voltage level less than 12 kV 210.00 5.99 4.36 0.12 2.66 0.08 312.24 8.91
Minimum Charge: As for Schedule 3, the minimum charge shall not be lower than 70% of the maximum demand charge during the last 12 month period ending with the current month. Note: 1. If the meter is installed on the low voltage side of customer’s transformer, another 2% must be added to both total demand and energy consumption in order to compensate for transformer losses. 2. Tariff No. 3.2 must be applied on any customer who first qualified under Schedule 3 since October 2000. 3. Tariff No. 3.2 is an optional rate for PEA customers who shall not be permitted to switch back to Tariff No. 3.1. The customer is obligated to pay any additional cost for the installation and removal of any equipment that requires a meter, and/ or any cost charged by the PEA. 4. In any month, if the maximum integrated demand is less than 30 kW, this rate will be applied, regardless. However, if such demand has dropped below 30 kW for 12 consecutive months and still below 30 kW in the 13th month, the customer will be reclassified under Tariff No. 2.1. Schedule 4: Large General Service (Applicable to businesses, industries, government institutions, local authorities, state enterprises, embassies, establishments related to foreign countries or international organizations, including compounds with a maximum 15-minute integrated demand of over 1,000 kW or applied energy consumption over the last 3 consecutive months that exceeds 250,000 kWh per month on a single demand meter)
4.1 Time of Day Rate
(TOD)
Demand Charge (per kW) Energy Charge
Service Charge
Peak Partial Off Peak (per kWh) (per month)
Baht US$ Baht US$ Baht US$ Baht US$ Baht US$
4.1.1 At voltage level 69 kV and above 224.30 6.40 29.91 0.85 0 0 3.14 0.09 312.24 8.91
4.1.2 At voltage level between 12-24 kV 285.05 8.13 58.88 1.68 0 0 3.17 0.09 312.24 8.91
4.1.3 At voltage level less than 12 kV 332.71 9.49 68.22 1.95 0 0 3.20 0.09 312.24 8.91
Peak: 06.30 PM - 09.30 PM every day Partial: 08.00 AM - 06.30 PM every day (Demand charge considers only the excess demand over peak recorded on peak period) Off Peak: 09.30 PM - 08.00 AM every day
4.2 Time of Use Rate (TOU)
Demand Charge (per kW) Energy Charge (per kWh)
Service Charge (per month) Peak Peak Off Peak
Baht US$ Baht US$ Baht US$ Baht US$
Public Record Exhibit 6
168

4.2.1 At voltage level 69 kV and above 74.14 2.12 4.13 0.12 2.61 0.07 312.24 8.91
4.2.2 At voltage level between 12-24 kV 132.93 3.79 4.21 0.12 2.62 0.07 312.24 8.91
4.2.3 At voltage level less than 12 kV 210.00 5.99 4.36 0.12 2.66 0.08 312.24 8.91
Minimum Charge: As for Schedule 4, the minimum charge shall not be lower than 70% of the maximum demand charge during the last 12 month period ending with the current month. Note: 1. Tariff No. 4.2 must be applied on either any customer who first qualified under Schedule 4 or time of use customers who became a PEA customer. 2. Tariff No. 4.2 is an optional rate for PEA customers who shall not be permitted to switch back to Tariff No. 4.1. The customer is obligated to pay any additional cost for the installation and removal any equipment that requires a meter, and/or any cost charged by the PEA. 3. In any month, if the maximum integrated demand is less than 1,000 kW or the monthly energy consumption does not exceed 250,000 kWh, this rate will be applied, regardless. However, if such demand drops below 30 kW for 12 consecutive months and remains below 30 kW on the 12th month, the customer will be reclassified under Tariff No. 2.1 instead. Schedule 5: Specific Business Service (Applicable to hotels, guest houses, or other businesses providing lodging to customers, including its compounds with a maximum 15-minute integrated demand of 30 kW and over on a single demand meter)
5.1 Time of Use Rate (TOU)
Demand Charge (per kW)
Energy Charge (per kWh)
Service Charge (per month) Peak Peak Off Peak
Baht US$ Baht US$ Baht US$ Baht US$
5.1.1 At voltage level 69 kV and above 74.14 2.12 4.13 0.12 2.61 0.07 312.24 8.91
5.1.2 At voltage level between 12-24 kV 132.93 3.79 4.21 0.12 2.63 0.08 312.24 8.91
5.1.3 At voltage level less than 12 kV 210.00 5.99 4.36 0.12 2.66 0.08 312.24 8.91
5.2 During Installation of TOU Meter Baht US$ Baht US$ Baht US$
5.2.1 At voltage level 69 kV and above 220.56 6.29 3.14 0.09 312.24 8.91
Public Record Exhibit 6
169

5.2.2 At voltage level between 22-33 kV 256.07 7.31 3.17 0.09 312.24 8.91
5.2.3 At voltage level less than 22 kV 276.64 7.89 3.20 0.09 312.24 8.91
Minimum Charge: 70% of the maximum demand charge during the last 12-month period ending with the current month. Note: 1. If the meter is installed on the low voltage side of a customer’s transformer, another 2% must be added to both total demand and energy consumption in order to compensate for the transformer’s losses. 2. Tariff No. 5.1 must be applied on any customer who first qualified under Schedule 5. In addition, Tariff No. 5.2 is used temporarily during the installation of a TOU meter. 3. In any month, if the maximum integrated demand is less than 30 kW or monthly energy consumption does not exceed 250,000 kWh, this rate will be applied, regardless. However, if such demand has dropped below 30 kW for 12 consecutive months and remains below 30 kW on the 12th month, the customer will be reclassified under Tariff No. 2.1 instead. Schedule 6: Non-Profit Organization (Applicable to non-government organizations offering non-charge services on a single demand meter.)
6.1 Normal Rate
Energy Charge (per kWh)
Service Charge (per month)
US$ Baht US$ Baht US$
6.1.1 At voltage level 69 kV and above 3.44 0.10 312.24 8.91
6.1.2 At voltage level between 12-24 kV 3.61 0.10 312.24 8.91
6.1.3 At voltage level less than 12 kV 20.00 0.57
- First 10 kWh (0 - 10th) 2.83 0.08
- Over 10 kWh (11th and over) 3.92 0.11
6.2 Time of Use Rate (TOU)
Demand Charge (per kW)
Energy Charge (per kWh)
Service Charge (per month) Peak Peak Off Peak
Baht US$ Baht US$ Baht US$ Baht US$
6.2.1 At voltage level 69 kV and above 74.14 2.12 4.13 0.12 2.61 0.07 312.24 8.91
6.2.2 At voltage level between 12-24 kV 132.93 3.79 4.21 0.12 2.63 0.08 312.24 8.91
Public Record Exhibit 6
170

6.2.3 At voltage level less than 12 kV 210.00 5.99 4.36 0.12 2.66 0.08 312.24 8.91
Minimum Charge: As for Tariff No. 6.2, the minimum charge shall not be lower than 70% of the maximum demand charged during the last 12-month period ending with the current month. Note: 1. As for government institutions and local authorities, if the average energy consumption over the last 3 consecutive months exceeds 250,000 kWh, the customer will continue to be classified under Schedule 6 until the electric bill of September 2012. Subsequently, beginning with the electric bill of October 2012, the customer will be reclassified under Schedule 2-4, depending on the case. 2. If the meter is installed on the low voltage side of a customer’s transformer, another 2% must be added to both total demand and energy consumption in order to compensate for the transformer’s losses. 3. Tariff No. 6.2 is an optional rate for PEA customers who shall not be permitted to switch back to Tariff No. 6.1. The customer is obligated to pay any additional cost for the installation and removal of any equipment, and/or any costs as charged by the PEA. Schedule 7: Agricultural Pumping (Applicable to electricity consumption for the use of water pumps for agricultural purposes by government agricultural agencies, officially recognized farmers groups, agriculture co-operatives, on a single demand meter.) Monthly Rate
7.1 Normal Rate
Energy Charge (per kWh)
Service Charge (per month)
US$ Baht US$ Baht US$
115.16 3.29
- First 100 kWh (0 - 100th) 2.09 0.06
- Over 100 kWh (101st and over) 3.24 0.09
7.2 Time of Use Rate (TOU)
Demand Charge (per kW)
Energy Charge (per kWh)
Service Charge (per month) Peak Peak Off Peak
Baht US$ Baht US$ Baht US$ Baht US$
7.2.1 At voltage level between 22-33 kV 132.93 3.79 4.18 0.12 2.60 0.07 228.17 6.51
7.2.2 At voltage level less than 22 kV 210.00 5.99 4.33 0.12 2.64 0.08 228.17 6.51
Minimum Charge: As for Tariff No. 7.2, the minimum charge shall not be lower than 70% of the maximum demand charge during the last 12-month period ending with the current month. Note:
Public Record Exhibit 6
171

1. If a meter is installed on the low voltage side of a customer’s transformer or PEA’s transformer (only in case of a lower voltage meter is installed on the CT), another 2% must be added to both demand and energy consumption in order to compensate for the transformer’s losses. 2. Tariff No. 7.2 is an optional rate and shall not be able to switch back to Tariff No. 7.1. The customer is obligated to pay for any additional cost of installing and removing any equipment required to meter, and/or any costs as specified by the PEA. Schedule 8: Temporary Service (Applicable provisionally for construction uses, temporary special events, and places without a registration number, including electricity consumption that does not follow the PEA’s Rules and Regulations, through a single Watt-hour meter.)
Baht/kWh US$/kWh
Energy Charge (at All Voltage Level) 6.83 0.19
Note: Customer, classified under this schedule, who desires the use of alternative electricity or who is inspected by the PEA for such electricity consumption, is eligible for a change from the above schedule, for instance, businesses, industries, and households. When a customer reapplies for permanent consumption at the PEA including electricity wiring, installed interior equipment that adheres to PEA standards, and pays for any additional fees, according to PEA regulations, then the customer will be reclassified under schedule 1-7, depending on the case.
Peak: 09:00 am-10:00 pm Monday -Friday and Royal Ploughing Ceremony Day
Off-peak: 10:00 p.m.-09:00 a.m. Monday-Friday and Royal Ploughing Ceremony Day 00:00 a.m.-11:59 p.m. (24 hrs.) Saturday-Sunday, Labor Day, Public Holidays, (except compensation holidays), and the Royal Ploughing Ceremony Day, if it falls on Saturday or Sunday.
Conditions Related to Electricity Tariffs 1. For customers, who applied under Schedules 3, 4, and 5 and have a lagging power factor, a power factor charge of 56.07 Baht/ kVAR/ month will be added to each maximum 15-minute reactive power (kVAR demand) span that exceeds 61.97% of the maximum 15-minute active power (kW demand) span. The fraction, which is less than 0.5 kVAR, is excised and increased to 1 if it is equal to or more than 0.5 kVAR. 2. The electricity tariffs exclude a Value Added Tax (VAT). 3. Monthly Electricity Charge is composed of above electricity tariffs, Fuel Adjustment Charge (Ft), and VAT. THE ABOVE ELECTRICITY TARIFFS ARE EFFECTIVE FROM THE BILLING MONTH OF NOVEMBER 2015 Source: Provincial Electricity Authority. For more information, please contact the Electricity, Business and Tariff Division. Phone: 02-590-9125, 02-590-9127, Fax: 02-590-9133-34, Call Center: 1129 Website: www.pea.co.th, as of July 2016 Last Updated: August 2017
Home
About Us
Why Thailand
Doing Business
Investment Promotion
Public Record Exhibit 6
172

Business Opportunities
Resource Center
THAILAND BOARD OF INVESTMENT Head Office: 555 Vibhavadi-Rangsit Rd., Chatuchak, Bangkok 10900, Thailand Tel.: (+66) 2553 8111, Fax: (+66) 2553 8222, Website: http://www.boi.go.th, E-Mail: [email protected]
© Copyright The Board of Investment of Thailand. All rights reserved. Term of use Source: http://www.boi.go.th/index.php?page=utility_costs
Public Record Exhibit 6
173

Public Record Exhibit 6
174

Public Record Exhibit 6
175

Final determination
Regulated retail electricity prices for 2016–17
May 2016
Public Record Exhibit 6
176
2
We wish to acknowledge the contribution of the following staff to this report:
Dan Barclay, Jennie Cooper, Sarah Duval, Adam Liddy and Wei Fang Lim
© Queensland Competition Authority 2016
The Queensland Competition Authority supports and encourages the dissemination and exchange of information. However, copyright protects this document.
The Queensland Competition Authority has no objection to this material being reproduced, made available online or electronically but only if it is recognised as the owner of the copyright and this material remains unaltered.
Public Record Exhibit 6
177

Queensland Competition Authority Contents
i
Contents
EXECUTIVE SUMMARY III
Impacts on residential customers iii
Impacts on small business customers iv
Impacts on large business customers v
Arrangements for customers on obsolete and transitional tariffs vi
THE ROLE OF THE QCA – TASK, TIMING AND CONTACTS VII
1 INTRODUCTION 1
1.1 The review process 1
2 LEGISLATIVE REQUIREMENTS AND PRICING FRAMEWORK 2
2.1 Legislative requirements 2
2.2 Pricing framework 3
3 NETWORK COSTS 7
3.1 Introduction 7
3.2 Network tariffs for residential, small business and unmetered supply customers 8
3.3 Network tariffs for large business and street lighting customers 13
4 ENERGY COSTS 15
4.1 Wholesale energy costs 15
4.2 Other energy costs 18
4.3 Energy losses 22
4.4 Total energy cost allowances for 2016–17 22
5 RETAIL COSTS 24
5.1 Overview 24
5.2 Approach to estimating retail costs for 2016–17 26
5.3 ACIL's analysis—residential and small business tariffs 27
5.4 Determining efficient total retail cost allowances—residential and small business tariffs 30
5.5 Determining fixed and variable retail cost components—residential and small business tariffs 32
5.6 Assigning fixed and variable retail costs to residential and small business customer tariffs 35
5.7 Large and very large business customer tariffs 37
5.8 Retail cost allowances for 2016–17 38
5.9 Updating the retail cost allowances from year to year 40
6 OTHER ISSUES 41
6.1 Allowances above the efficient costs of supply 41
6.2 Cost pass-through mechanism 49
7 TRANSITIONAL ARRANGEMENTS 52
Public Record Exhibit 6
178

Queensland Competition Authority Contents
ii
7.1 Transitional arrangements for obsolete and transitional tariffs 52
7.2 2016–17 transitional arrangements 57
8 FINAL DETERMINATION 58
8.1 Customer impacts 61
ACRONYMS 66
APPENDIX A : MINISTERIAL DELEGATION AND COVER LETTER 68
APPENDIX B : SUBMISSIONS 74
Submissions to the interim consultation paper 74
Submissions to the draft determination 75
APPENDIX C : RESPONSES TO ADDITIONAL ISSUES RAISED IN SUBMISSIONS 76
APPENDIX D : NETWORK TARIFF STRUCTURES 79
Comparison of Energex and Ergon Energy's tariff structures 79
Ergon Energy tariff structure options 80
APPENDIX E : TRANSITIONAL AND OBSOLETE TARIFFS—CUSTOMER IMPACTS 85
APPENDIX F : BUILD-UP OF PRICES 96
APPENDIX G : GAZETTE NOTICE 102
APPENDIX H : ASSUMPTIONS USED TO DETERMINE CUSTOMER IMPACTS 115
APPENDIX I : SUMMARY OF CONCESSIONAL ARRANGEMENTS FOR ENERGY IN QUEENSLAND 116
APPENDIX J : RETAIL COST ALLOWANCES 117
Deriving retail costs from ACIL's analysis 117
Retail costs for large and very large business customer tariffs 120
Adjusting the fixed retail cost allowance for regulatory fees 121
Other issues raised in submissions 122
APPENDIX K : COST PASS-THROUGH 126
Public Record Exhibit 6
179

Queensland Competition Authority Executive Summary
iii
EXECUTIVE SUMMARY
The Queensland Competition Authority (QCA) has made a final determination of regulated retail electricity
prices (notified prices) to apply in regional Queensland from 1 July 2016 to 30 June 2017. In general, notified
prices are paid by customers who have not entered into a negotiated or market contract with their retailer.
Notified prices are available to residential, small business and large business customers in regional
Queensland. As retail electricity prices in south east Queensland will be deregulated from 1 July 2016,
notified prices will not be available to customers in this region.
We began our review in November 2015 under a delegation from the Minister for Energy and Water Supply.
We appreciate the valuable contribution that stakeholders have made to our review, especially those who
attended workshops and made submissions. While we have not necessarily referred to all arguments or
submissions in this determination, we have carefully considered the issues raised in each submission.
Our approach to setting notified prices for 2016–17 is largely consistent with previous years. In accordance
with the Queensland Government's Uniform Tariff Policy (UTP), we have continued to base notified prices
for residential and small business customers on the costs of supplying electricity in south east Queensland.
We have also continued to base notified prices for large business customers on the lowest cost of supply in
regional Queensland.
We have also undertaken a detailed review of retail costs (which include the costs of customer
administration, call centres, billing and IT systems, and a retail margin) so that our estimates of these costs
are based on the latest information, including observations from competitive retail electricity markets in
Australia.
Our final determination is based on the most up-to-date information available at the time of publication.
As with previous determinations, we have received updated information on the estimated costs of supply
since the publication of the draft determination and have revised our estimates accordingly. In particular,
Energex and Ergon Distribution have provided updated network charges, and ACIL has provided revised
energy cost estimates. Consequently, most notified prices have increased between our draft determination
and final determination. For example, the notified prices for tariff 11 and tariff 20 have both increased
between the draft determination and the final determination. The higher tariff 11 notified price (compared
to the draft determination) is due primarily to higher network and energy costs, while the higher tariff 20
notified price is due primarily to higher retail, energy and network costs.
Impacts on residential customers1
The main retail tariff for residential customers is tariff 11. Many customers on tariff 11 are also on one of
the 'off-peak' or 'controlled load' tariffs (tariffs 31 and 33) for uses such as water heating and pool pumps.
In 2016–17, the annual bill for a typical customer on tariff 11 will increase by 2.8 per cent from $1,457 to
$1,498. For a typical customer on a combination of tariffs 11 and 31 or tariffs 11 and 33, the increases will
be slightly higher (4.8 per cent and 3.1 per cent respectively). However, the impact on individual customers
will vary depending on their consumption. Annual bills for tariff 11 customers with lower consumption than
the typical customer will either decrease or increase by less than 2.8 per cent. Almost one-third of
1 The bill impacts presented are based on typical levels of consumption. The typical customer data was
supplied by Ergon Retail and represents the median customer for all customers on the stated tariff. See Appendix H for further information. Please note that the annual bill amounts in Figure 1 have been rounded to the closest dollar.
Public Record Exhibit 6
180

Queensland Competition Authority Executive Summary
iv
customers on tariff 11 will face lower annual bills in 2016–17 compared to 2015–16. Annual bills for tariff
11 customers with higher consumption than the typical customer will increase by more than 2.8 per cent.
The increase in typical tariff 11 customer bills is primarily due to higher energy costs. Our consultant, ACIL,
advised that the rise in energy costs is driven largely by increasing demand from liquefied natural gas plants,
and higher Renewable Energy Target costs. Some of the impact of higher energy costs has been offset by
a decrease in network costs. For lower consumption customers, the outcome of the review of retail costs
has also helped to offset the impacts of higher energy costs as it has reduced the level of fixed retail costs.
Figure 1 Annual bills for typical residential customers (GST inclusive)
Table 1 Tariff 11 charges (GST exclusive)
2015–16 Final Determination
2016–17 Final Determination
Change (%)
Fixed charge (cents/day) 106.728 89.572 -16.1%
Variable charge (cents/kWh) 22.238 24.610 10.7%
Impacts on small business customers2
In 2016–17, typical customers on the main small business tariff (tariff 20) will face an increase of $2363 or
11.2 per cent in their annual bill. Typical small business customers on the seasonal time-of-use tariff (tariff
22A) will face an increase of $660 or 15.8 per cent. These increases have been driven primarily by higher
energy costs and retail costs. Bill impacts will vary depending on each individual customer's level and
pattern of consumption.
2 The bill impacts presented are based on typical levels and patterns of consumption. The typical customer
data was supplied by Ergon Retail and represents the median customer for all customers on the stated tariff. See Appendix H for further information. Please note that the annual bill amounts in Figure 2 have been rounded to the closest dollar.
3 Please note that this figure does not equal the difference between the annual bill amounts for tariff 20 in Figure 2 ($235), due to rounding of the amounts in Figure 2.
$1,457
$1,744 $1,750
$1,498
$1,828 $1,806
$600
$700
$800
$900
$1,000
$1,100
$1,200
$1,300
$1,400
$1,500
$1,600
$1,700
$1,800
$1,900
T11 T11 + T31 T11 + T33
2015-16 Annual Bill 2016-17 Annual Bill
Public Record Exhibit 6
181

Queensland Competition Authority Executive Summary
v
Figure 2 Annual bills for typical small business customers (GST inclusive)
Impacts on large business customers4 In 2016–17, typical large business customers will face increases in their annual bills of between 11.8 per cent and 12.2 per cent. The increases have been driven primarily by higher energy costs and network costs. Bill impacts will vary depending on each individual customer's level and pattern of consumption.
4 The bill impacts presented are based on typical levels and patterns of consumption. The typical customer
data was supplied by Ergon Retail and represents the median customer for all customers on the stated tariff. See Appendix H for further information. Please note that the annual bill amounts in Figure 3 have been rounded to the closest dollar.
$2,113
$4,186
$2,348
$4,846
$-
$1,000
$2,000
$3,000
$4,000
$5,000
$6,000
T20 T22A
2015-16 Annual Bill 2016-17 Annual Bill
Public Record Exhibit 6
182

Queensland Competition Authority Executive Summary
vi
Figure 3 Annual bills for typical large business customers (GST inclusive)
Arrangements for customers on obsolete and transitional tariffs
Some business customers are supplied under transitional or obsolete tariffs, which include farming and
irrigation tariffs. These tariffs have been made available for several years to allow customers to transition
to standard business tariffs and recoup some of the investments made to suit the level and structure of
transitional or obsolete tariffs. Based on information from Ergon Retail, many customers on these tariffs
may face lower electricity bills if they moved to a standard business tariff, but some customers would face
much higher bills.
We have maintained transitional arrangements for 2016–17. Our general approach in past determinations
has been to increase the charges in each transitional and obsolete tariff in line with the percentage
increases in the standard business tariffs customers would otherwise pay. We have then generally applied
an additional escalation factor to limit charges for transitional and obsolete tariffs falling further below cost
in dollar terms.
Standard business tariffs will increase in 2016–17 so transitional and obsolete tariffs will also need to
increase. Under our general approach in previous determinations, the escalation factors for most of these
tariffs in 2016–17 would be 1.25 or 1.5.
However, given the substantial price increases that customers on transitional and obsolete tariffs have
experienced in recent years and that customers on these tariffs are more than halfway through the
transition to standard business tariffs, we have decided to apply the minimum escalation factor of 1.1. This
means customers on these tariffs will face increases of between 12.3 per cent and 13.2 per cent in 2016–
17 rather than up to 16.8 per cent if the higher escalation factors were applied.
New customers will also continue to be allowed to access transitional tariffs.
$50,609
$181,043
$449,584
$56,639
$203,138
$502,759
$-
$100,000
$200,000
$300,000
$400,000
$500,000
$600,000
T44 T45 T46
2015-16 Annual Bill 2016-17 Annual Bill
Public Record Exhibit 6
183

Queensland Competition Authority The Role of the QCA – Task, Timing and Contacts
vii
THE ROLE OF THE QCA – TASK, TIMING AND CONTACTS
The Queensland Competition Authority (QCA) is an independent statutory authority to promote
competition as the basis for enhancing efficiency and growth in the Queensland economy.
The QCA’s primary role with respect to electricity pricing is to set regulated retail electricity prices in
accordance with the requirements of the delegation from the Minister for Energy and Water Supply
(Appendix A) and the Electricity Act 1994 (the Electricity Act).
Contacts
Enquiries regarding this project should be directed to:
ATTN: Sarah Duval or Adam Liddy Tel (07) 3222 0555 www.qca.org.au/Contact-us
www.qca.org.au
Public Record Exhibit 6
184

Queensland Competition Authority Introduction
1
1 INTRODUCTION
The Queensland Competition Authority (QCA) has received a delegation from the Minister for
Energy and Water Supply (the Minister) to determine regulated retail electricity prices (notified
prices). The delegation specifies that the notified prices we determine will apply to non-market
customers in the Ergon Energy Corporation Limited (Ergon Distribution) distribution area from 1
July 2016 to 30 June 2017 (see Appendix A).
The Queensland Government (the Government) has legislated to remove retail price regulation
in the Energex distribution area (covering south east Queensland) from 1 July 2016. As a result,
notified prices will only apply to customers in Ergon Distribution's distribution area.5
1.1 The review process
On 11 December 2015, we released an interim consultation paper advising interested parties of
the commencement of the review. We received 12 submissions in response (see Appendix B).
On 23 March 2016, we released our draft determination and ACIL's draft reports on the cost of
energy and retail costs. In April 2016, we held workshops in five locations (Brisbane, Bundaberg,
Cairns, Toowoomba and Townsville) to discuss the draft determination, and a webinar hosted by
the Chamber of Commerce and Industry Queensland. We received 70 submissions to the draft
determination (see Appendix B).
This final determination publishes final regulated retail tariffs and prices for 2016–17 and
explains how they were determined. In making our final determination, we have taken into
account the requirements of the Electricity Act 1994 (the Electricity Act) and the delegation,
matters raised in submissions, ACIL's final reports on the cost of energy and retail costs, and our
own investigations.
We appreciate the valuable contribution that stakeholders have made to this process, especially
those who attended workshops and made submissions. While we have not necessarily referred
to all arguments or submissions in this report, we have carefully considered each submission.
Issues raised in submissions that are outside the scope of our review are discussed in
Appendix C.
All non-confidential documents relating to this review are available on our website.6
5 Note that customers in the Essential Energy distribution area in southern Queensland do not have access to
notified prices, although Origin Energy receives a subsidy from the Queensland Government to ensure that non-market customers pay no more than similar customers that have access to notified prices.
6 http://www.qca.org.au/Electricity/Regional-consumers/Reg-Electricity-Prices/In-Progress/Regulated-Electricity-Prices-2016-17.
Public Record Exhibit 6
185

Queensland Competition Authority Legislative requirements and pricing framework
2
2 LEGISLATIVE REQUIREMENTS AND PRICING FRAMEWORK
When we receive a delegation to determine notified prices, we must make the determination in
accordance with our obligations under the Electricity Act. In this chapter, we explain these
obligations, as well as how we decided on the framework we applied to set notified prices for
2016–17.
2.1 Legislative requirements
The Electricity Act does not specify criteria or principles that we must apply when making a price
determination. Rather, we are directed to have regard to various matters. In accordance with
section 90(5) of the Electricity Act, the matters we are required to have regard to in making a
determination are:
the actual costs of making, producing or supplying the goods or services
the effect of the price determination on competition in the Queensland retail electricity
market
any matter required by delegation
any other matter we consider relevant.
When we make a determination, we also have regard to the objects of the Electricity Act, which
are to:
set a framework for all electricity industry participants that promotes efficient, economical
and environmentally sound electricity supply and use
regulate the electricity industry and electricity use
establish a competitive electricity market in line with the national electricity industry reform
process
ensure that the interests of customers are protected
take into account national competition policy requirements.
2.1.1 Key matters we are required to consider by delegation
The delegation sets out additional matters we are required to consider. Consistent with the
approach of previous price determinations, we are required to consider applying the network (N)
plus retail (R) cost build-up methodology and the Queensland Government's uniform tariff policy
(UTP).
When determining the network cost component, we must consider continuing with the same
general approach we applied in the 2015–16 determination. For residential and small business
customer tariffs, this means using Energex's network charges and tariff structures for non–time-
of-use tariffs (i.e. tariffs 11, 20, 31, 33, 41 and 917). Adopting this approach means that network
charges would be below cost, because they would be based on network costs in south east
Queensland, not regional Queensland. This is consistent with the Government's UTP. As stated
7 Tariff 91 applies to unmetered supplies (except street lighting).
Public Record Exhibit 6
186

Queensland Competition Authority Legislative requirements and pricing framework
3
in the delegation, the UTP 'provides that, wherever possible, non-market customers of the same
class should pay no more for their electricity, regardless of their geographic location'.8
The Minister's covering letter clarifies how the Government expects the UTP to apply for
residential and small business customers (small customers):
… [R]egulated prices in regional Queensland for small customers should broadly reflect the
expected prices for customers on standing offers in south east Queensland.9
For small customer time-of-use and seasonal demand tariffs (i.e. tariffs 12A, 14, 22A and 24) we
must also consider basing the network cost component on the price level of Energex's network
charges, while utilising the relevant Ergon Distribution network tariff structures. Under this
approach, network charges would still be below cost, while (because Ergon Distribution's tariff
structures are used) price signals would improve and customers would be encouraged to reduce
usage during peak periods, as pointed out in the delegation.
For large business customer tariffs, we must consider using Ergon Distribution's network charges.
This is the approach we have adopted in previous decisions.
We are also required to consider maintaining transitional arrangements for transitional and
obsolete tariffs, which include farming and irrigation tariffs.
2.2 Pricing framework
The matters we are required to consider according to the Electricity Act and the objects of the
Electricity Act indicate that cost-reflective prices and promoting retail competition are important
guiding principles. Cost reflectivity is important for efficiency and equity reasons. Previous
determinations have also been designed to support retail competition in south east Queensland
and the large business customer segment in regional Queensland.
These principles conflict with the requirement in the delegation to consider the Government's
UTP.
2.2.1 Residential and small business customers
Given that we are required to consider conflicting matters in making our price determination, we
have explored a spectrum of possible pricing approaches. These range from setting fully cost-
reflective prices to basing notified prices on the cost of supply in south east Queensland (our
previous approach).
Cost base
Setting cost-reflective notified prices (in this context, prices that reflect the costs of supplying
customers in each region of Ergon Distribution's area) would avoid the need to subsidise
electricity prices and promote retail competition. However, network costs vary across regional
Queensland. Setting cost-reflective prices would result in notified prices for customers that
varied by region, which would be inconsistent with the Government's UTP. It would also lead to
significant price increases, particularly for customers in western parts of the state and those
supplied by isolated systems.10
8 Section 5(b) of the Minister's delegation (Appendix A to this document). 9 Cover letter of the delegation (Appendix A to this document). 10 A typical tariff 11 customer paying cost-reflective prices in 2015–16 would pay around 120 per cent more in
western Queensland than customers on notified prices in south east Queensland.
Public Record Exhibit 6
187

Queensland Competition Authority Legislative requirements and pricing framework
4
Notified prices could also be set to reflect the lowest costs of supply in regional Queensland11,
which is the approach we have used to set notified prices for large business customers since
2012. This approach would mitigate adverse price impacts for some customers and maintain
uniform tariffs. Compared to our approach in previous determinations, it would improve cost-
reflectivity and reduce the subsidy paid by taxpayers to subsidise electricity prices. However, it
would be inconsistent with the UTP and may result in significant price increases. For example, in
2015–16, the costs of supplying residential customers in the east pricing zone were about 23 per
cent higher12 than in south east Queensland.
At the other end of the spectrum, notified prices could continue to be based on the costs of
supply in south east Queensland. This would be consistent with the UTP and the requirement in
the delegation to consider basing the network cost component on Energex price levels. However,
it would result in customers continuing to pay much less than the cost of supply, potentially
leading to inefficient investment and decision-making, as well as ongoing costs to taxpayers.
Cotton Australia, Ergon Energy Queensland (Ergon Retail), Master Electricians Australia and the
Queensland Farmers' Federation (QFF) supported an approach based on south east Queensland
costs. The Chamber of Commerce and Industry Queensland (CCIQ) considered that notified
prices based on the cost of supply in regional Queensland would be prohibitively expensive for
small business customers. Canegrowers argued that the UTP subsidy should apply to the N
component, and that the R component should be set based on the costs of supply in regional
Queensland, including energy costs.
QCA position
We have decided to base notified prices for residential and small business customers on the cost
of supply in south east Queensland. We consider this reasonable because it is consistent with the
Government's UTP, which provides for notified prices to be based on the costs of supply in south
east Queensland. This approach also avoids the potentially large price increases associated with
the other approaches.
Framework to determine notified prices
To establish an appropriate framework for setting notified prices based on the costs of supply in
south east Queensland, we have considered the Government's policy that notified prices for
small customers in regional Queensland should broadly reflect the expected prices for customers
on standing offers in south east Queensland.13
Customers on standing offers are supplied on a standard retail contract14, as defined under the
National Energy Customer Framework (NECF). In areas where there is retail competition,
customers may opt for a market contract. Market contracts often have different terms and
conditions to standard retail contracts, and prices under market contracts can be lower than
standing offer prices.
Customers who do not, or cannot, opt for market contracts are, by default, supplied
understanding offers. In markets without price regulation, as will be the case in south east
Queensland from 1 July 2016, standing offer prices are set by retailers.
11 Ergon Distribution's east pricing zone, transmission region one. 12 This is the estimated impact in 2015–16 on a typical tariff 11 customer in the Ergon Distribution east pricing
zone (transmission region one) paying cost-reflective notified prices. 13 Cover letter of the delegation (Appendix A to this document). 14 Schedule 1, National Energy Retail Rules.
Public Record Exhibit 6
188

Queensland Competition Authority Legislative requirements and pricing framework
5
Ergon Retail supported setting notified prices based on expected standing offer prices in south
east Queensland, in line with the Government's UTP. However, Canegrowers, Canegrowers Isis,
CCIQ, Cotton Australia and QCOSS argued that notified prices should be set below expected
standing offer prices in south east Queensland. CCIQ and QCOSS argued that the QCA should
base notified prices somewhere between market contract prices and standing offer prices.
Cotton Australia acknowledged that the delegation specified that small customer prices should
be set at standing offer levels under the UTP, but argued that it would be more appropriate to
base prices on the average discounted offer in south east Queensland. Canegrowers Isis argued
that prices should be based on a weighted average of all prices available in south east
Queensland.
QCA position
Our final decision is to determine notified prices based on expected standing offer prices in south
east Queensland. The delegation's cover letter15 makes it clear that setting prices below expected
standing offer prices in south east Queensland, as suggested by some stakeholders, would be
inconsistent with the UTP.
In addition, market contracts generally have different terms and conditions to standard retail
contracts, so their prices are not directly comparable. Like notified prices, standing offer prices
in south east Queensland will apply to customers on standard retail contracts.
We have estimated the costs of supply for each retail tariff using an N+R cost build‐up approach,
where we treat the N (network cost) component as a pass‐through, and determine the R (energy
and retail cost) component.
2.2.2 Large business customers
As noted above, we have previously determined notified prices for large business customers
based on the lowest cost of supplying customers in regional Queensland. This approach has the
benefit of being more cost-reflective than an approach based on south east Queensland costs,
which supports the development of competition among retailers for large business customers in
the lower-cost areas of regional Queensland. It is also consistent with the requirement in the
delegation to consider basing the network cost component on Ergon Distribution's network
charges.
Ergon Distribution, Ergon Retail and Origin Energy supported this approach. Cotton Australia
supported basing all notified prices on south east Queensland costs.
QCA position
Consistent with the requirements in the Minister's delegation, and with previous determinations,
our final decision is to set notified prices for large business customers based on the lowest costs
of supply in regional Queensland, which is Ergon Distribution's east pricing zone, transmission
region one. We have estimated the costs of supply for each retail tariff using an N+R cost build‐
up approach. This is consistent with our approach to setting notified prices for residential and
small business customers, as discussed above. We consider the effect of our decision on
competition in Chapter 6.
15 See Appendix A.
Public Record Exhibit 6
189

Queensland Competition Authority Legislative requirements and pricing framework
6
2.2.3 Metering services charges
While most customers who pay notified prices also pay metering services charges, under the
Electricity Act these charges cannot be included in notified prices.16 For this reason, all prices and
figures quoted in this document exclude metering services charges.
Metering services charges for customers on notified prices can be found on Ergon Retail's
website.17
16 Since 2015–16, the Australian Energy Regulator (AER) has classified metering charges as alternative control
services which are not included in network tariffs. Distributors recover these costs through ACS charges (or distribution non-network charges) that are calculated and levied separately to network tariffs. We consider that the reclassification of metering charges means that they now meet the definition of 'distribution non-network charges' in the Electricity Act. Distribution non-network charges cannot be included in notified prices (s. 90(3)(d) of the Electricity Act).
17 https://www.ergon.com.au/retail/residential/tariffs-and-prices/changes-to-your-bill/what-is-the-metering-services-charge.
Public Record Exhibit 6
190

Queensland Competition Authority Network costs
7
3 NETWORK COSTS
A retailer incurs network costs when electricity is supplied to its customers. These costs are
associated with transporting electricity through the transmission and distribution networks and
account for around 50 per cent of the final cost of electricity for small customers.
As regulated monopoly businesses, Powerlink, Energex and Ergon Distribution earn regulated
revenues that are determined by the Australian Energy Regulator (AER). In addition to recovering
their own distribution network costs, Energex and Ergon Distribution pass Powerlink's
transmission network costs on to customers in network charges that are approved by the AER as
well.
This chapter sets out our decisions on the network charges to be used as the basis of notified
prices for 2016–17. In summary, we have decided to:
base the flat rate retail tariffs and controlled load retail tariffs for residential and small
business customers on Energex’s network tariff structures and prices (consistent with our
previous determinations)
base the time-of-use retail tariffs for residential and small business customers (tariffs 12A and
22A) on Ergon Distribution’s network tariff structures and Energex’s price levels (consistent
with our 2015–16 determination)
base the obsolete time-of-use retail tariff for small business customers (tariff 22) on Energex’s
network tariff structure and prices (consistent with our 2015–16 determination)
base the seasonal time-of-use demand retail tariffs for residential and small business
customers (tariffs 14 and 24) on Ergon Distribution’s network tariff structures and Energex’s
price levels (consistent with our 2015–16 determination)
base all retail tariffs for large business customers on Ergon Distribution’s network tariff
structures and prices (consistent with our previous determinations)
retain retail tariffs 41, 47 and 48.
3.1 Introduction
A retailer incurs network costs when electricity is supplied to its customers. Network costs are
the costs associated with transporting electricity through transmission and distribution
networks.
In the ‘Network plus Retail’ (N+R) cost build-up approach that we use to set notified prices, the
network cost component is treated as a pass-through. To determine the network cost
component to be passed through to retail customers, the QCA must decide:
(a) the level at which network charges should be set (Energex levels or Ergon Distribution
levels)
(b) the network tariff structure on which the network cost component should be based.
Network tariff structures can include, for example, combinations of fixed charges, demand
charges and usage charges.
Public Record Exhibit 6
191

Queensland Competition Authority Network costs
8
3.2 Network tariffs for residential, small business and unmetered supply customers
This section discusses our approach to setting the network cost components of retail tariffs for
residential, small business and unmetered supply customers (excluding street lighting
customers—see Section 3.3).
For the 2016–17 determination, we are only setting notified prices for regional Queensland; in
particular, the delegation requires that we consider:
for residential and small business customer retail tariffs (except tariffs 12A, 14, 22A and 24),
basing the network cost component on Energex network charges and tariff structures
for residential and small business customer time-of-use retail tariffs (tariffs 12A and 22A) and
time-of-use demand retail tariffs (tariffs 14 and 24), basing the network cost component on
Energex network charges, but using the relevant Ergon Distribution network tariff structures.
Adopting the approach proposed in the delegation would be consistent with our approach in the
2015–16 determination. Under this approach, the network cost component of each retail tariff
broadly reflects the costs of supplying customers in south east Queensland, but the network tariff
structures used as the basis for setting those retail tariffs vary with the network cost components
of:
flat rate retail tariffs (retail tariffs with usage charges that do not vary with the time and/or
level of consumption) based on Energex’s network tariff structures
time-of-use and time-of-use demand retail tariffs (retail tariffs with usage and other charge
rates that vary with the time and/or level of consumption) based on Ergon Distribution’s
network tariff structures.
This section explains our decision to continue with this approach in our 2016–17 determination.
We also explain our decision to continue to use Energex network tariff structures for the obsolete
time-of-use retail tariff for small business customers (tariff 22) and to retain tariff 41.
3.2.1 Energex or Ergon Distribution network price levels
In determining the network cost components of regulated retail tariffs, the first issue we must
consider is the level at which network charges should be set (Energex levels or Ergon Distribution
levels).
As discussed in Section 2.2.1, our decision is to base notified prices for residential and small
business customers on south east Queensland costs. Consistent with this decision, we will set
network charges to reflect Energex cost levels. Setting network charges at Energex cost levels
means that customers in regional Queensland will generally pay the same for network services
as customers in south east Queensland.
3.2.2 Energex or Ergon Distribution network tariff structures
The second issue we must consider is whether to use the network tariff structures of Energex or
Ergon Distribution.
There are some key differences between the Energex and Ergon Distribution network tariff
structures, including:
the proportion of costs recovered through fixed charges
Public Record Exhibit 6
192

Queensland Competition Authority Network costs
9
the approach to usage charge rates (e.g. flat usage rates versus three-part inclining block
tariffs)
the applicable time-of-use and demand charging periods (for example, different peak and off-
peak periods)
the methodology for calculating demand charges.
Further information on differences between the network tariff structures is provided in
Appendix D.
The delegation directs us to consider using Energex network tariff structures for the residential
and small business flat rate retail tariffs and controlled load tariffs, and Ergon Distribution
network tariff structures for the residential and small business time-of-use retail tariffs (tariffs
12A and 22A) and time-of-use demand retail tariffs (tariffs 14 and 24).
Consistent with our approach in the 2015–16 determination and with the delegation, we have
decided to continue to use a mix of Energex and Ergon Distribution network tariff structures as
the basis for setting retail tariffs. Ergon Retail, Toowoomba Regional Council, CCIQ, and the
Queensland Consumers’ Association supported this approach.
We consider that using Ergon Distribution’s network tariff structures for the time-of-use and
time-of-use demand retail tariffs (excluding tariff 22, which is an obsolete tariff) would be more
cost-reflective than using Energex’s network tariff structures. We also consider that it is more
important that time-of-use and time-of-use demand retail tariffs reflect Ergon Distribution’s
network tariffs structures, rather than flat rate retail tariffs, as the first-mentioned tariffs send
signals to customers about the costs to retailers that arise due to the time or level of electricity
consumption. As pointed out by the Queensland Productivity Commission (QPC), time-of-use
and time-of-use demand tariffs are more efficient than single rate and inclining block tariffs.18
The delegation also points out that using Ergon Distribution’s network tariff structures for time-
of-use and time-of-use demand retail tariffs would encourage customers to reduce consumption
during peak periods on Ergon Distribution’s network.
Ergon Distribution and Origin were both of the view that we should base all residential and small
business customer retail tariffs on Ergon Distribution’s network tariff structures, on the basis that
it would be a further step towards improving cost-reflectivity. However, this would result in a
change of network tariff structure for residential and small business flat rate retail tariffs, and
controlled load tariffs, as these tariffs were based on Energex’s network tariff structures in the
2015–16 determination. This change would have significant distributional impacts on the
customers who are on these tariffs, with lower-usage customers in particular likely to face
substantially higher bills.19 QCOSS did not support using Ergon Distribution’s network tariff
structure for the main residential flat rate retail tariff (tariff 11), as it considered that the change
in the network tariff structure would create confusion and impact adversely on smaller-usage
customers.
We also note that Ergon Distribution has acknowledged that its inclining block network tariffs
will, over time, need to be phased out in favour of network tariffs that better satisfy the pricing
principles in the National Electricity Rules (NER).20 This suggests that there may be some
uncertainty about the future of these network tariff structures. We consider it would be
18 Queensland Productivity Commission, Electricity Pricing Inquiry, draft report, February 2016, pp. 76–79. 19 See Appendix D for more information on the customer impacts. 20 Ergon Distribution, Tariff Structure Statement 2017–18 to 2019–20, November 2015, p. 36.
Public Record Exhibit 6
193

Queensland Competition Authority Network costs
10
preferable to have more certainty about future network tariff structures before making major
changes that would affect nearly all regional customers.
For the reasons above, we do not agree with the suggestion that we should adopt Ergon
Distribution’s network tariff structures for the flat rate retail tariffs and controlled load tariffs.
Tariff 22
Tariff 22 is an obsolete tariff that is based on an Energex network tariff structure. Consistent
with our 2015–16 determination, we will continue to make this tariff available to customers until
30 June 2017, when it will be replaced by tariff 22A (which is based on the Ergon Distribution
network tariff structure).21 Tariff 22 will also continue to be closed to new regional customers.
Customers may move to tariff 22A (or another retail tariff that suits their needs) earlier than 30
June 2017 if they choose.22
QCA position
Consistent with our draft decision, our final decision is to use:
Energex’s network tariff structures as the basis for setting the network cost components of
flat rate retail tariffs, tariff 22 and controlled load tariffs
Ergon Distribution’s network tariff structures as the basis for setting the network cost
components of time-of-use and time-of-use demand retail tariffs.
3.2.3 Adjusting Ergon Distribution network tariff structures to Energex price levels
As discussed, we have decided to use Ergon Distribution’s tariff structures as the basis for setting
time-of-use and time-of-use demand retail tariffs for residential and small business customers
(excluding tariff 22), while reducing the overall level of prices to Energex levels.
To adjust these network tariff structures to Energex price levels, we have decided to use the
same adjustment process as in our 2015–16 determination. This process involves adjusting:
the residential time-of-use retail tariff (tariff 12A) by adopting the Ergon Distribution usage
charges and reducing the Ergon Distribution fixed charge towards Energex’s price level (as far
as possible)
the small business time-of-use retail tariff (tariff 22A) by adopting the Energex fixed charge
and reducing the Ergon Distribution usage charges
the residential and small business time-of-use demand retail tariffs (tariffs 14 and 24) by
uniformly decreasing the Ergon Distribution fixed and usage charges.
We have adopted different adjustment approaches for the four tariffs to prevent our
adjustments resulting in adjusted network prices being set higher than the levels that may be
approved by the AER.
The only difference from our approach in 2015–16 is in the mechanics of adjusting the Ergon
Distribution network charges to align with Energex price levels. These changes are required due
to changes in data availability and reliability.
21 In our 2015–16 determination, we decided to make tariff 22 available to customers until 30 June 2017 to
mitigate customer impacts and address metering issues. 22 This is subject to customers having appropriate metering in place and meeting the terms and conditions of
their chosen retail tariff.
Public Record Exhibit 6
194

Queensland Competition Authority Network costs
11
Appendix D provides more information on the adjustment approach.
QCA position
Consistent with our draft decision, our final decision is to adjust:
the residential time-of-use retail tariff (tariff 12A) by adopting the Ergon Distribution usage
charges and reducing the Ergon Distribution fixed charge towards Energex’s price level (as far
as possible)
the small business time-of-use retail tariff (tariff 22A) by adopting the Energex fixed charge
and reducing the Ergon Distribution usage charges
the residential and small business time-of-use demand retail tariffs (tariffs 14 and 24) by
uniformly decreasing the Ergon Distribution fixed and usage charges.
3.2.4 New controlled load tariff
In the interim consultation paper, we noted that Ergon Distribution was proposing to introduce
a new controlled load tariff from 1 July 2016. If approved, this tariff would only have been
available in conjunction with the residential time-of-use demand tariff. Ergon Distribution has
subsequently advised that this tariff will not be introduced in 2016–17. Therefore, we have not
created a new retail controlled load tariff.
3.2.5 Removal of tariff 41
In the interim consultation paper, we indicated that we were considering removing tariff 41 on
the basis that Ergon Distribution does not have an equivalent network tariff available for small
business customers with this structure, and fewer than 300 customers are on this tariff.23 Tariff
41 is a low voltage demand tariff that has fixed, usage and demand charges and is based on an
Energex network tariff. While Energex designates this network tariff as a large business customer
network tariff, it is made available to small business customers on a voluntary basis.
Ergon Retail advised that its customers on this tariff would need to transition to other tariffs, and
considered that the tariff should be closed to new customers and phased out by 30 June 2017.
QCA position
Given that our approach is to use Energex tariff structures for flat rate tariffs and that the Energex
tariff is available to small business customers in south east Queensland, our decision is to retain
tariff 41.
3.2.6 Network tariffs and charges for 2016–17
Our final decision is to base regulated retail tariffs for residential, small business and unmetered
supply customers on:
Energex network tariffs and charges for tariffs 11, 20, 31, 33, 41 and 91
Energex network tariffs and charges for obsolete tariff 22, which will be available until 30 June
2017
calculated network tariffs and charges for retail tariffs 12A and 22A, which are based on Ergon
Distribution’s seasonal time-of-use network tariffs. To maintain the uniform tariff policy
23 Based on data from Ergon Retail.
Public Record Exhibit 6
195

Queensland Competition Authority Network costs
12
(UTP), the level of charges has been reduced to a level where regional customers will, on
average, pay the same as they would pay on tariffs 11 and 20
calculated network tariffs and charges for retail tariffs 14 and 24, which are based on Ergon
Distribution’s seasonal time-of-use demand network tariffs. As with tariffs 12A and 22A, the
level of charges has been reduced to a level where regional customers will on average pay
the same as they would pay on tariffs 11 and 20 in south east Queensland.
Our final decision on the network charges to apply to each retail tariff is presented in the
following tables. It should be noted that these tables are based on the draft network tariffs that
Ergon Distribution and Energex have provided to the AER. In the event that the final network
tariffs approved by the AER differ from those submitted by distributors, the QCA will consider
utilising a cost pass-through mechanism.
Table 2 Energex network charges for 2016–17 for retail tariffs 11, 20, 22 (obsolete), 31, 33, 41 and 91 (GST exclusive)
Retail tariff Energex network tariff
code
Fixed chargea c/day
Usage charge (peak) c/kWh
Usage charge (flat or off-
peak)
c/kWh
Demand charge
$/kW/month
Tariff 11—Residential (flat rate)
8400 50.200 11.624
Tariff 20—Business (flat rate)
8500 72.000 12.486
Tariff 22—Business (time-of-use, transitional)
8800 72.000 14.395 9.683
Tariff 31—Night rate (super economy)
9000 6.421
Tariff 33—Controlled supply (economy)
9100 9.686
Tariff 41—Low voltage (demand, obsolete)b
8300 532.100 2.056 24.351
Tariff 91— Unmetered 9600 10.298
a Charged per metering point.
b The kVA equivalent demand charge for tariff 41 is $21.860/kVA/month. A conversion factor of 0.8977 has been used, as advised by Energex.
Table 3 Calculated network charges for 2016–17 for retail tariffs 12A, 14, 22A and 24 (GST exclusive)
Retail tariff Fixed chargea c/day
Usage charge (peak)
c/kWh
Usage charge (flat or off-
peak)
c/kWh
Demand charge (peak)
$/kW/month
Demand charge (off-
peak)
$/kW/month
Tariff 12A—Residential (time-of-use)
61.375 38.375 7.558
Tariff 22A—Business (time-of-use)
72.000 30.462 10.236
Tariff 14—Residential (time-of-use demand)
22.525 3.386 52.885 9.636
Tariff 24—Business (time-of-use demand)
24.540 4.322 71.601 11.765
a Charged per metering point.
Public Record Exhibit 6
196
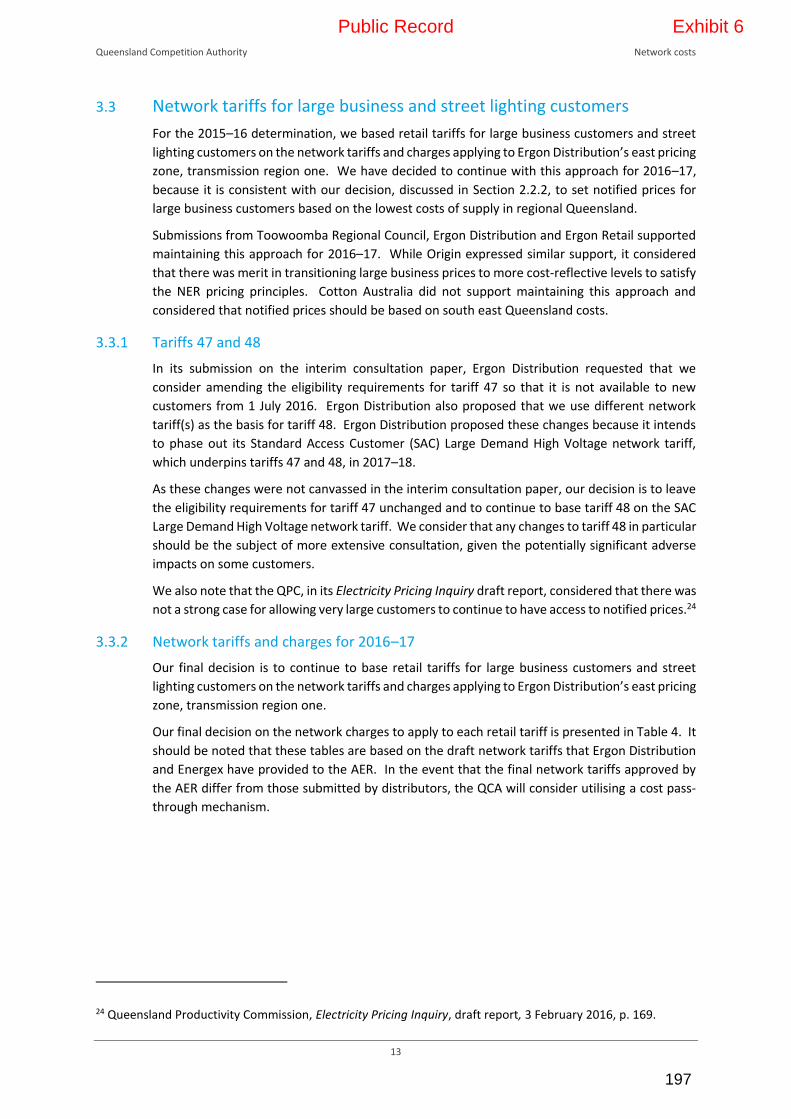
Queensland Competition Authority Network costs
13
3.3 Network tariffs for large business and street lighting customers
For the 2015–16 determination, we based retail tariffs for large business customers and street
lighting customers on the network tariffs and charges applying to Ergon Distribution’s east pricing
zone, transmission region one. We have decided to continue with this approach for 2016–17,
because it is consistent with our decision, discussed in Section 2.2.2, to set notified prices for
large business customers based on the lowest costs of supply in regional Queensland.
Submissions from Toowoomba Regional Council, Ergon Distribution and Ergon Retail supported
maintaining this approach for 2016–17. While Origin expressed similar support, it considered
that there was merit in transitioning large business prices to more cost-reflective levels to satisfy
the NER pricing principles. Cotton Australia did not support maintaining this approach and
considered that notified prices should be based on south east Queensland costs.
3.3.1 Tariffs 47 and 48
In its submission on the interim consultation paper, Ergon Distribution requested that we
consider amending the eligibility requirements for tariff 47 so that it is not available to new
customers from 1 July 2016. Ergon Distribution also proposed that we use different network
tariff(s) as the basis for tariff 48. Ergon Distribution proposed these changes because it intends
to phase out its Standard Access Customer (SAC) Large Demand High Voltage network tariff,
which underpins tariffs 47 and 48, in 2017–18.
As these changes were not canvassed in the interim consultation paper, our decision is to leave
the eligibility requirements for tariff 47 unchanged and to continue to base tariff 48 on the SAC
Large Demand High Voltage network tariff. We consider that any changes to tariff 48 in particular
should be the subject of more extensive consultation, given the potentially significant adverse
impacts on some customers.
We also note that the QPC, in its Electricity Pricing Inquiry draft report, considered that there was
not a strong case for allowing very large customers to continue to have access to notified prices.24
3.3.2 Network tariffs and charges for 2016–17
Our final decision is to continue to base retail tariffs for large business customers and street
lighting customers on the network tariffs and charges applying to Ergon Distribution’s east pricing
zone, transmission region one.
Our final decision on the network charges to apply to each retail tariff is presented in Table 4. It
should be noted that these tables are based on the draft network tariffs that Ergon Distribution
and Energex have provided to the AER. In the event that the final network tariffs approved by
the AER differ from those submitted by distributors, the QCA will consider utilising a cost pass-
through mechanism.
24 Queensland Productivity Commission, Electricity Pricing Inquiry, draft report, 3 February 2016, p. 169.
Public Record Exhibit 6
197

Queensland Competition Authority Network costs
14
Table 4 Ergon Distribution network charges for 2016–17 large business and street lighting customer retail tariffs (GST exclusive)
Retail tariff Ergon Distribution network tariff
codec
Fixed chargea c/day
Usage charge (peak)
c/kWh
Usage charge (flat or off-peak)
c/kWh
Demand charge (peak)
$/kW/month
Demand charge (flat/off-peak) $/kW/month
Tariff 44—over 100 MWh small (demand)
EDSTT1 4568.700 2.201 35.801
Tariff 45—over 100 MWh medium (demand)
EDMTT1 14751.500 2.283 28.422
Tariff 46—over 100 MWh large (demand)
EDLTT1 39607.000 2.467 25.257
Tariff 47—high voltage (demand)
EDHTT1 37183.400 2.078 23.257
Tariff 48—over 4 GWh high voltage (demand)
EDHTT1 37183.400 2.078 23.257
Tariff 50—seasonal time-of-use (demand)
ESTOUDCT1 3822.400 1.779 4.863 54.966 13.257
Tariff 71—street lightingb
EVUT1 0.700 19.445
a Charged per metering point.
b The fixed charge for street lighting applies to each lamp.
c Some Ergon Distribution network tariff codes have a ‘base’, ‘C’ or ‘X’ variant. The base code applies the relevant Alternative Control Service (ACS) regulated metering capital and non-capital charges; the ‘X’ code applies the relevant ACS regulated metering capital charge; and the ‘C’ code does not apply any ACS regulated metering charges.
Public Record Exhibit 6
198

Queensland Competition Authority Energy costs
15
4 ENERGY COSTS
A retailer incurs energy costs when purchasing electricity to meet the electricity demand of its
customers. Energy costs can be split into three general categories:
(1) wholesale energy costs
(2) other energy costs
(a) Renewable Energy Target (RET) costs
(b) National Electricity Market (NEM) participation fees and ancillary services charges
(c) prudential capital costs
(3) energy losses.
As with previous determinations, we have determined energy costs based on advice from our
consultant, ACIL. ACIL has estimated that overall energy costs will increase for all customers in
2016–17, with increases driven primarily by increased wholesale energy costs and Large-scale
Renewable Energy Target (LRET) costs.
An overview of how each energy cost component was calculated is provided below. A more
detailed explanation appears in ACIL's report, which is available on our website.25
4.1 Wholesale energy costs
Retailers incur wholesale energy costs when purchasing electricity from the National Electricity
Market (NEM) to meet the electricity demand of their customers. The NEM is a volatile market
where prices are settled every half hour and can range from –$1000 per MWh to $14,000 per
MWh.26 Retailers use the following strategies to reduce price volatility risk:
pursuing a 'hedging strategy' by purchasing financial derivatives like swaps and options
entering long-term power purchase agreements with generators
investing in their own electricity generators.
In 2015–16, ACIL estimated wholesale energy costs using a hedging strategy approach. We
considered that ACIL's approach was transparent and best reflected the costs retailers incur when
purchasing electricity from the NEM. Hedging strategy approaches have been endorsed by the
Australian Energy Market Commission (AEMC) as best practice27 and have been adopted by other
Australian regulators.
Ergon Retail and QCOSS supported ACIL's hedging strategy approach. Origin Energy raised some
technical concerns with regard to ACIL's approach to estimating contract prices and generating
load profiles. Canegrowers argued that the QCA should base the wholesale energy cost
calculation on the Ergon load profile for all tariffs.
25 http://www.qca.org.au/Electricity/Regional-consumers/Reg-Electricity-Prices. 26 Minimum spot price is defined in clause 3.9.6(b) of the National Electricity Rules. The Market Price Cap is
published by the AEMC every February (http://www.aemc.gov.au/News-Center/What-s-New/Announcements/AEMC-publishes-the-Schedule-of-Reliability-Set-(4)).
27 AEMC, Final Report, Advice on best practice retail price methodology, 27 September 2013.
Public Record Exhibit 6
199

Queensland Competition Authority Energy costs
16
Consistent with previous years, ACIL estimated wholesale energy costs using a hedging strategy
approach. ACIL has provided a detailed explanation of its calculation of wholesale energy costs in
chapter 4 of its report, and addressed issues raised in submissions related to its calculations in
chapter 3 of that report.
ACIL estimated that wholesale energy costs will increase for all retail tariffs. The overall increase
in prices has been driven by an increase in electricity demand from Queensland-based liquefied
natural gas (LNG) projects. The increased activity in LNG production has also resulted in higher
fuel costs for gas-fired generators. ACIL found that the increase in contracted gas prices has more
than doubled the cost of gas-fired generation compared to the beginning of 2015–16.28 Electricity
futures contract prices, which are used in retailer hedging strategies, have increased since the
draft determination, as can be seen in Figure 4 below.
Figure 4 Queensland base futures contract prices
Source: ASX energy data.
The latest electricity forecasts from the Australian Energy Market Operator (AEMO) show
electricity demand from LNG production increasing in the short term, and remaining high for the
remainder of the forecast period (see Figure 5 below).
28 ACIL, Estimated Energy Costs 2016–17 Retail Tariffs, 17 May 2016, p. 6.
$65
$70
$75
$80
$85
$/M
Wh
Draft Determination Post draft determination
Public Record Exhibit 6
200

Queensland Competition Authority Energy costs
17
Figure 5 Historical and forecast Queensland annual electricity demand by sector
Source: Australian Energy Market Operator, National Electricity and Gas Forecasting (medium scenario).29
In addition to increases in demand and fuel costs, ACIL found that increased solar generation is
continuing to reduce daytime demand but has no effect on peak demand30, which is resulting in
the net system load profile (NSLP) becoming peakier and more expensive to hedge. Figure 6
below shows how the NSLP has become peakier over time.
Figure 6 Energex net system load profile
Note: The term 'relative MW' means the loads for each tariff have been scaled so that they sum to one. This removes differences in absolute scale between years, and preserves the relative shape of the profile.
Source: ACIL analysis.
29 Data available at http://forecasting.aemo.com.au/. 30 Peak demand generally occurs between 6:30 pm and 8:30 pm.
0
10
20
30
40
50
60
70
2006 2008 2010 2012 2014 2016 2018 2020 2022 2024 2026 2028 2030 2032 2034
TWh
Residential & commercial Manufacturing Other industries LNG
0.000
0.005
0.010
0.015
0.020
0.025
0.030
0.035
0.040
MW
(re
lati
ve)
2009-10 2010-11 2011-12 2012-13 2013-14 2014-15
Public Record Exhibit 6
201

Queensland Competition Authority Energy costs
18
As a result, ACIL estimated:
Wholesale energy costs for the Ergon Energy NSLP will increase by $9.99 per MWh compared
to 2015–16, which is slightly less than the increase in the Energex NSLP ($11.59 per MWh).
The outcomes are slightly different because the load profile of the Ergon Energy NSLP is less
peaky than the Energex NSLP.
Wholesale energy costs for controlled load tariffs will also increase. Tariff 31 will increase by
$6.21 per MWh compared to 2015–16, while tariff 33 will increase by $5.76 per MWh. The
difference in outcomes is due to the load profile for tariff 33 becoming flatter compared to
previous years, resulting in a smaller increase.
QCA position
We consider that ACIL's methodology adequately takes into account the issues raised in
submissions and is likely to produce the most reliable estimates of the efficient costs of supply.
Retaining the same approach for 2016–17 will also provide certainty to stakeholders.
We accept ACIL's advice on this matter and its wholesale energy cost estimates, which are
provided in Table 5. Consistent with the UTP31, the QCA will apply the Energex NSLP cost estimate
for residential, small business and unmetered tariffs.
Table 5 Estimated wholesale energy costs at the Queensland regional reference node for 2016–17
Settlement class Retail tariff $/MWh % change from 2015–16
Energex NSLP and unmetered supply
11, 12A, 14, 20, 22, 22A, 24, 41, 91
$75.32 18.2%
Energex Controlled Load 9000 31 $42.31 17.2%
Energex Controlled Load 9100 33 $56.15 11.4%
Ergon Energy NSLP and streetlights
44, 45, 46, 47, 48, 50, 71
$65.69 17.9%
Source: ACIL, Estimated Energy Costs for 2016–17, 17 May 2016, p. 22.
4.2 Other energy costs
In addition to wholesale energy costs, we must account for other energy costs that retailers incur
when purchasing electricity from the NEM, which are:
Renewable Energy Target (RET) costs
NEM participation fees and ancillary services charges
prudential capital costs.
4.2.1 Renewable Energy Target costs
The RET scheme, comprised of the Large-scale Renewable Energy Target (LRET) and Small-scale
Renewable Energy Scheme (SRES), provides incentives for the electricity sector to increase
generation from renewable sources and reduce greenhouse gas emissions. The costs of these
31 See section 2.2.1 for further details.
Public Record Exhibit 6
202

Queensland Competition Authority Energy costs
19
incentives are paid by retailers who are required to purchase large-scale generation certificates
(LGCs) and small-scale technology certificates (STCs).
LRET costs
The LRET sets annual targets for the amount of electricity that must be sourced from large-scale
renewable energy projects like wind farms, with an ultimate target of generating 33,000 GWh of
electricity from large-scale renewable sources in 2020.32 Retailers must purchase a set number of
LGCs according to the amount of electricity they have sold to customers in the calendar year.
For the 2015–16 final determination, ACIL estimated LRET costs using a market-based approach.
This approach based LGC prices on forward prices for certificates published by the Australian
Financial Markets Association (AFMA). ACIL used the 2015 renewable power percentage (RPP) for
the first half of the pricing period, and the latest published 2016 LRET target for the second half
of the pricing period.
Ergon Retail supported calculating LRET costs using a market-based approach. However, it
highlighted that the 2014 RET review had suppressed LRET prices during the review period and
considered that ACIL's approach, whereby retailers purchase LGCs over a two-year period, did
not reflect retailer behaviour during the review period. Canegrowers considered that the LRET
allowance should be reduced to reflect the efficient costs of producing large-scale renewable
energy.
ACIL forecast LRET costs using an approach consistent with previous years. A detailed explanation
of its calculations is provided in chapter 4 of its report prepared for the QCA, along with
information on LGC prices and assumptions underpinning the implied RPPs used. Chapter 3 of
ACIL's report addresses issues raised in submissions. ACIL examined market prices over a number
of years and considers that its market-based approach, whereby retailers purchase LGCs over a
two-year period to satisfy their obligations, provides the best estimate of LRET costs for the
purposes of setting notified prices for 2016–17.
ACIL's report shows that there has been a significant increase in forward LGC prices since the
revised 33,000 GWh LRET target was implemented in June 2015 (see Figure 7 below). ACIL
explained that this is due to a hiatus in new renewable energy project construction. As a result,
ACIL forecast that LRET costs for 2016–17 will be $7.83 per MWh for all retail tariffs, an increase
of $3.45 per MWh compared to 2015–16.
32 Section 40, Renewable Energy (Electricity) Act 2000.
Public Record Exhibit 6
203

Queensland Competition Authority Energy costs
20
Figure 7 Large-scale Generation Certificate (LGC) prices
Source: AFMA and ACIL analysis.
QCA position
We remain of the view that ACIL's market-based approach, using the most up-to-date targets and
price information published by AFMA, is likely to produce the most reliable estimate of LRET costs
to be incurred by retailers in 2016–17. Retaining a consistent approach for 2016–17 will also
provide certainty to stakeholders.
We accept ACIL's advice on this matter and its LRET cost estimates, which are outlined in Table 6.
SRES costs
The SRES provides an incentive for individuals and small businesses to install eligible small-scale
renewable energy systems such as solar panel systems, small-scale wind systems, small-scale
hydro systems, solar hot water systems and heat pumps. Customers installing these systems
receive STCs, which retailers must purchase according to the amount of electricity they have sold
to those customers.
For the 2015–16 determination, ACIL estimated SRES costs using the final 2015
small-scale technology percentage (STP) target for the first half of the pricing period and the latest
available non-binding 2016 STP target for the second half of the pricing period. STC prices were
based on the clearing house price.
ACIL estimated SRES costs using the same approach as 2015–16. It forecast a decrease in SRES
costs of $0.60 per MWh compared to 2015–16. This estimate is based on the final 2016 STP target
and the latest available non-binding STP target for 2017.33
33 The final STP for 2016 is lower the non-binding STP used in the 2015–16 final determination. We consider
this difference as part of our cost pass-through mechanism discussed in section 6.2.
$0
$10
$20
$30
$40
$50
$60
$70
$80
$90
2/01
/201
4
2/02
/201
4
2/03
/201
4
2/04
/201
4
2/05
/201
4
2/06
/201
4
2/07
/201
4
2/08
/201
4
2/09
/201
4
2/10
/201
4
2/11
/201
4
2/12
/201
4
2/01
/201
5
2/02
/201
5
2/03
/201
5
2/04
/201
5
2/05
/201
5
2/06
/201
5
2/07
/201
5
2/08
/201
5
2/09
/201
5
2/10
/201
5
2/11
/201
5
2/12
/201
5
2/01
/201
6
2/02
/201
6
2/03
/201
6
2/04
/201
6
$/L
GC
2016 2017
Public Record Exhibit 6
204

Queensland Competition Authority Energy costs
21
QCA position
We remain of the view that ACIL's approach is likely to produce the most reliable estimate of SRES
costs to be incurred by retailers in 2016–17. Retaining a consistent approach for
2016–17 will also provide certainty to stakeholders.
We accept ACIL's advice on this matter and its SRES cost estimates, which are outlined in Table 6.
4.2.2 NEM participation fees and ancillary services charges
NEM participation fees are levied on retailers by the AEMO to cover the costs of operating the
NEM and funding Energy Consumers Australia. Ancillary services charges cover the costs of the
services used by AEMO to manage power system safety, security and reliability.
As with the 2015–16 determination, ACIL used AEMO budget and fee projections to estimate
NEM participation fees for 2016–17. Its ancillary services charges were based on the average
historical costs observed over the preceding 52 weeks.
QCA position
We remain of the view that ACIL's approach is likely to produce the most reliable estimate of NEM
participation and ancillary services costs to be incurred by retailers in 2016–17. Retaining a
consistent approach for 2016–17 will also provide certainty to stakeholders.
We accept ACIL's advice on this matter and its cost estimates, which are outlined in Table 6.
4.2.3 Prudential capital costs
Prudential capital costs are the costs a retailer incurs to provide financial guarantees to AEMO
and to lodge initial margins with hedge providers for futures contracts. These costs must be
accounted for, as futures contracts are relied upon to derive wholesale energy cost estimates.
In the 2015–16 determination, prudential capital costs were considered as part of retail operating
costs, as they were implicitly included in the retail operating cost benchmark we used. However,
as discussed in section 2.3.3 of ACIL's report on retail costs, these costs vary according to the
amount of electricity being purchased by the retailer, as well as the level of volatility in the
electricity market. As such, ACIL considered they should be included in the energy cost allowance.
To avoid double counting, prudential costs have been excluded from the retail cost allowance.
QCOSS supported the QCA's approach to account for prudential capital costs as part of the energy
cost allowance, provided these costs were separated out from retail operating costs.
Canegrowers supported the methodology for estimating prudential operating costs but argued
they should be based on costs for the Ergon NSLP.
As with the 2014–15 determination, ACIL calculated prudential capital costs for 2016–17 in line
with the latest published AEMO requirements and margin requirements for trading in the futures
market.
QCA position
We remain of the view that ACIL's approach is likely to produce the most reliable estimate of
prudential capital costs to be incurred by retailers in 2016–17.
ACIL considered the issues raised by stakeholders. As discussed in section 2.3.3 of ACIL's report
on retail costs, prudential costs were not included within the retail cost allowance, so they were
not double counted. However, ACIL calculated prudential costs based on the Energex NSLP. We
Public Record Exhibit 6
205

Queensland Competition Authority Energy costs
22
consider this appropriate, as under the Government's UTP34 most regional customers will pay
notified prices based on energy costs in south east Queensland.
We accept ACIL's advice on this matter and its prudential capital cost estimates, which are
outlined in Table 6.
4.2.4 Summary of other energy costs for 2016–17
Table 6 sets out other energy costs for 2016–17, which will be added to the wholesale energy
cost components for all retail tariffs.
Table 6 Other energy costs (excluding losses)—all retail tariffs
Cost component $/MWh % change from 2015–16
LRET $7.83 78.8%
SRES $3.74 -13.8%
NEM fees $0.48 2.1%
Ancillary services $0.33 -8.3%
Prudential capital $0.99 naa
Total $13.37 40.0%b
a Prudential capital costs were considered as part of the retail operating cost allowance in 2015–16.
b As other energy costs in 2016–17 includes an additional allowance for prudential capital costs, the percentage change between 2015–16 and 2016–17 is greater than the sum of changes in each individual component of other energy costs.
Note: Totals may not add due to rounding.
Source: ACIL, Estimated Energy Costs for 2016–17, 17 May 2016, p. 26-29.
4.3 Energy losses
Some electricity is lost when it is transported across transmission and distribution networks. As a
result, retailers must purchase sufficient electricity to supply their customers' load and allow for
losses. As with previous determinations, ACIL has accounted for these losses by applying
transmission and distribution loss factors published by AEMO in a manner that aligns with AEMO's
settlement process.
QCA position
We are satisfied with ACIL's approach and accept its loss factor calculations, which are outlined
in Table 7. These losses are based on AEMO's 2016–17 published loss factors.
4.4 Total energy cost allowances for 2016–17
Table 7 summarises energy cost allowances for each retail tariff for 2016–17.
34 See section 2.2.1 for further details.
Public Record Exhibit 6
206
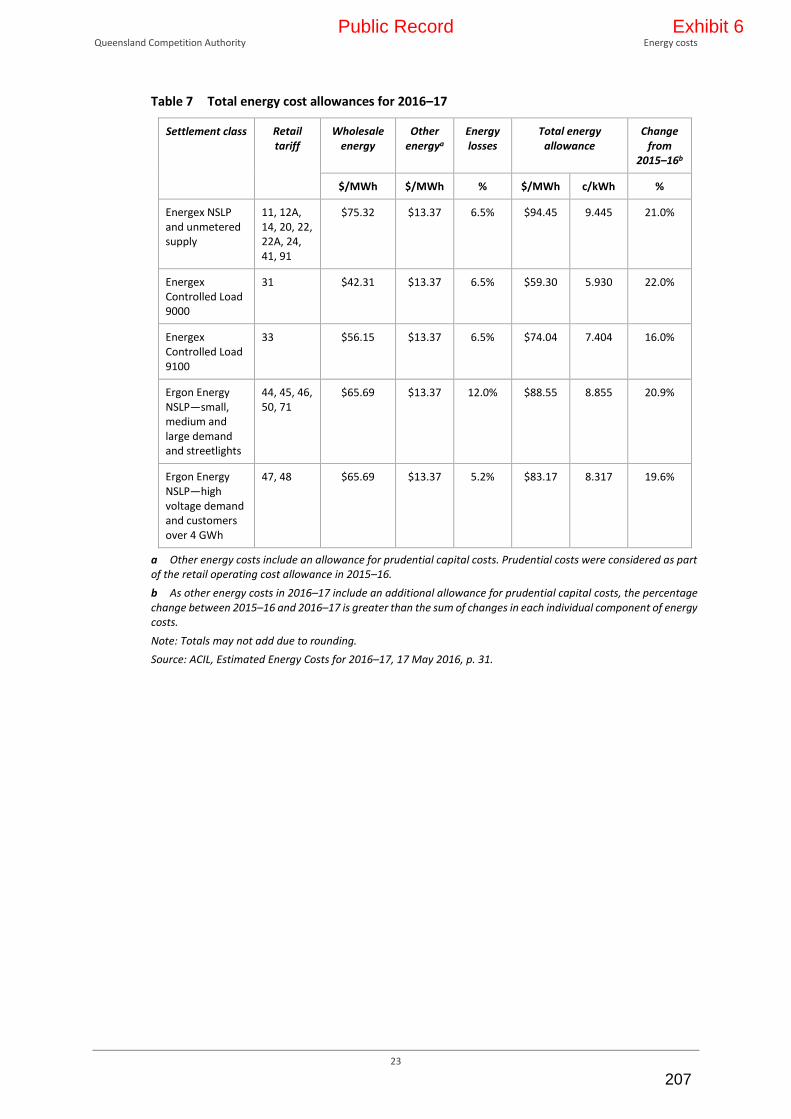
Queensland Competition Authority Energy costs
23
Table 7 Total energy cost allowances for 2016–17
Settlement class Retail tariff
Wholesale energy
Other energya
Energy losses
Total energy allowance
Change from
2015–16b
$/MWh $/MWh % $/MWh c/kWh %
Energex NSLP and unmetered supply
11, 12A, 14, 20, 22, 22A, 24, 41, 91
$75.32 $13.37 6.5% $94.45 9.445 21.0%
Energex Controlled Load 9000
31 $42.31 $13.37 6.5% $59.30 5.930 22.0%
Energex Controlled Load 9100
33 $56.15 $13.37 6.5% $74.04 7.404 16.0%
Ergon Energy NSLP—small, medium and large demand and streetlights
44, 45, 46, 50, 71
$65.69 $13.37 12.0% $88.55 8.855 20.9%
Ergon Energy NSLP—high voltage demand and customers over 4 GWh
47, 48 $65.69 $13.37 5.2% $83.17 8.317 19.6%
a Other energy costs include an allowance for prudential capital costs. Prudential costs were considered as part of the retail operating cost allowance in 2015–16.
b As other energy costs in 2016–17 include an additional allowance for prudential capital costs, the percentage change between 2015–16 and 2016–17 is greater than the sum of changes in each individual component of energy costs.
Note: Totals may not add due to rounding.
Source: ACIL, Estimated Energy Costs for 2016–17, 17 May 2016, p. 31.
Public Record Exhibit 6
207

Queensland Competition Authority Retail costs
24
5 RETAIL COSTS
The second element in the N+R approach, the retail costs component (R), includes retail operating
costs and a retail margin.
In previous decisions, we benchmarked other regulatory decisions to set retail operating costs and
margins. However, we consider it may no longer be appropriate to continue with this approach,
given that many comparable jurisdictions (including NSW and South Australia) have removed
retail price regulation in recent years. We consider it is timely to review these cost components
and have engaged ACIL to undertake a comprehensive review of retail costs based on market
observations and confidential data supplied by electricity retailers.
In summary, we have decided to:
adopt separate retail cost allowances for residential, small business, large business and very
large business customer tariffs
estimate total retail cost allowances for residential and small business customer tariffs based
on benchmarking observations, applied as fixed and variable components
for large and very large business customer tariffs, maintain the 2015–16 retail cost allowances
in real terms.
5.1 Overview
Retail costs include retail operating costs (ROC) and a retail margin.
ROC are the costs associated with services provided by a retailer to its customers, which typically
include customer administration, call centres, corporate overheads, billing and revenue
collection, IT systems, regulatory compliance, and customer acquisition and retention costs
(CARC).
The retail margin represents the return to investors for retailers' exposure to systematic risks
associated with providing retail electricity services. The margin can also include other costs
incurred by retailers, such as depreciation, amortisation, interest payments and tax expenses.
In previous determinations, we estimated allowances for ROC based on publicly reported data
and benchmark observations of other regulatory decisions, predominantly those of IPART. For
the retail margin, we applied an allowance of 5.7 per cent of total costs, which was based on the
retail margin adopted by IPART in its 2013–16 decision on regulated retail electricity prices in
NSW.35
Notwithstanding retailers' preference to maintain our previous approach, we consider it is no
longer preferable to rely on benchmarking of other regulators' decisions to estimate retail costs,
given that many comparable jurisdictions (including NSW and South Australia) have removed
retail price regulation in recent years. Reliance on other regulatory decisions also generates
circularity, which will lead to regulatory error over time. For these reasons, we have conducted
a comprehensive review of this cost component for 2016–17.
35 IPART, Review of regulated retail prices and charges for electricity from 1 July 2013 to 30 June 2016, June
2013, chapters 7 and 8.
Public Record Exhibit 6
208
Queensland Competition Authority Retail costs
25
We engaged ACIL to provide advice on efficient retail costs for our 2016–17 determination. As a
first step, ACIL prepared a methodology paper outlining its proposed approach, which we
released along with our interim consultation paper in December 2015. ACIL also produced a
preliminary report, released with our draft determination in March 2016, and a final report in
May 2016, released with this final determination.
Submissions
Consumer groups (QCOSS and the Queensland Consumers Association) supported a
comprehensive review of retail operating costs and margins. QCOSS noted:
It is timely to undertake a more thorough assessment of these costs as the QCA had previously
used a 2013 IPART estimate as the benchmark. The Victorian market has been deregulated since
2009 and prices in NSW and South Australia have been deregulated more recently. Tariffs and
retailers’ cost structures will have changed since 2013 as retail markets become more mature.36
In contrast, Origin Energy considered the QCA's existing approach to estimating retail costs was
sufficient, if augmented by benchmarking against actual retailer data:
Origin’s preferred approach to determine a representative retailer's costs is to use the current
Queensland retail operating cost benchmark and to escalate this allowance on an annual basis. To
give the QCA confidence in its own benchmark, Origin believes the QCA can construct an indicative
retail operating cost for a representative retailer based on indicative data provided by retailers.37
Ergon Retail also preferred to largely retain the existing approach:
EEQ supports the continuation of the benchmarking approach employed in 2015–16. As ACIL Allen
has clearly stated the intention to use both a benchmarking and bottom-up approach, EEQ
requests the QCA give consideration to the continuing evolution of the regulatory and market
environment. This should include recognition of the characteristics of the retail electricity supply
to regional Queensland when setting prices for 2016–17 and subsequent periods.38
Both Origin and Ergon Retail acknowledged the problems in relying solely on bottom-up retailer
data due to different cost allocation approaches and cost categorisation. Origin noted:
Origin believes that relying on data provided by retailers to determine an appropriate retailer
operating cost is problematic as retailers have different accounting methodologies and how they
allocate costs to electricity and gas customers [sic].
…
We thus believe a benchmarking approach with some comparison to actual costs to assure validity
is the most effective mechanism to determine these costs.39
Similarly, Ergon Retail submitted:
EEQ generally supports ACIL Allen’s approach to estimating retail margin. EEQ does however
acknowledge, and agree with the concerns raised by other market participants, that a bottom-up
approach may have some practical barriers to being an effective method of estimating ROC and
margin. EEQ is also concerned that relying too heavily on a bottom-up methodology for estimating
36 QCOSS, submission to the QCA interim consultation paper, Regulated retail electricity prices 2016–17 p. 4. 37 Origin Energy, submission to the QCA interim consultation paper, Regulated retail electricity prices 2016–17,
29 January 2016, p. 3. 38 Ergon Energy Queensland, submission to the QCA interim consultation paper, Regulated retail electricity
prices 2016–17, 20 January 2016, p. 7. 39 Origin Energy, submission to the QCA interim consultation paper, Regulated retail electricity prices 2016–17,
29 January 2016, p. 3.
Public Record Exhibit 6
209
Queensland Competition Authority Retail costs
26
ROC may distort the estimation of efficient costs. This is true for ROC allowances for both small
and large customers.40
With regard to the retail margin component of retail costs, Origin supported a retail margin based
on a percentage of total costs as previously adopted. Origin considered a margin of at least 5.7
per cent is appropriate.41
The Queensland Consumers Association questioned how the cost of capital would be calculated
and included in any estimates of retail costs and margin. We note that, while this was a
component of IPART's assessment of the retail margin, ACIL's benchmarking approach for 2016–
17 does not hinge on estimates of the cost of capital.42
In response to the draft determination, COTA Queensland supported the new approach to retail
costs. In contrast, CCIQ considered that the QCA should return to the previous approach to
estimating retail costs.
QCOSS and the Queensland Consumer's Association suggested that the benchmark retail cost
values should be derived based on the weighted average of retail costs, weighted toward the
most prominent retailers, by market share. We have considered this proposal and addressed this
matter in section 5.4.2.
The Minister lodged a submission raising concerns about price impacts on small business
customers. The Minister requested that the QCA consider a transitional arrangement for the
updated retail cost estimates for small business customers on the basis that the estimates
represent a step change and will:
…result in a significant price increase at a time when they [small business customers] could
reasonably have expected a more stable outcome.43
This issue is addressed in section 5.6.
Some stakeholders raised specific methodology-related issues regarding ACIL's analysis, which
have been addressed in ACIL's final report. Other issues raised in submissions—and QCA
responses where appropriate—are set out in Appendix J.
5.2 Approach to estimating retail costs for 2016–17
We have considered ACIL's advice and stakeholder feedback when making our final decisions.
ACIL used a combination of bottom-up and benchmarking methods to estimate retail costs,
informed by analysis of publicly available data, observed retail market offers, and detailed
confidential information provided by retailers.
ACIL analysed competitive retail market offers available across several competitive jurisdictions
to derive the implied level of retail costs incurred by retailers. This analysis was conducted on
both flat rate (non-time-of-use) residential tariff offers, and flat rate small business tariff offers.
40 Ergon Energy Queensland, submission to the QCA interim consultation paper, Regulated retail electricity
prices 2016–17, 20 January 2016, p. 10. 41 Origin Energy, submission to the QCA interim consultation paper, Regulated retail electricity prices 2016–17,
29 January 2016, p. 4. 42 Discount rates, using a weighted average cost of capital methodology, are however necessary for estimating
the time value of money associated with amortising discounts (see, ACIL's final report, May 2016), cost pass-through and some components of wholesale energy purchase costs.
43 Minister for Energy and Water Supply, submission to the QCA draft determination, Regulated retail electricity prices 2016–17, 3 May 2016.
Public Record Exhibit 6
210

Queensland Competition Authority Retail costs
27
ACIL estimated the retail costs in each market offer by deconstructing the components of retail
tariffs, and benchmarking the retailer costs. It started with total average customer bills based on
retailer market offers, before deducting network costs and estimated energy purchase costs. The
residual amount reflects the total retail cost component of each tariff.
ACIL normalised the data for known cost differences between jurisdictions, for example, costs
associated with state-based energy efficiency schemes, and the estimated higher costs of smart
metering in Victoria. This normalisation process produced retail cost observations that, as far as
possible, can be compared on a like-for-like basis across retailers and distribution regions.44
While ACIL was engaged to estimate retail costs for small, large and very large business
customers, it was not possible to benchmark competitive market prices available to large and
very large businesses, as retailers tend to develop tailored offers for these customers. As a result,
no useful information is available on competitive market prices for these segments. Our
considerations of retail costs for large and very large business customers are set out at section
5.7.
Nonetheless, significant data is available on market offer prices to residential and small business
customers, which has allowed ACIL to perform useful benchmarking analysis in these market
segments.
To support ACIL's benchmarking analysis, the QCA issued formal information requests under the
Electricity Act to retailers operating in regional Queensland, requiring them to supply cost data.
This data is commercially sensitive and cannot be reproduced here.
The information provided by retailers was not sufficiently robust for ACIL to use it as the primary
basis for estimating efficient retail costs. The data was of varying quality and completeness' and
highlighted significant differences in the way retailers categorise costs. This outcome was not
unexpected and confirms our and ACIL's view that the benchmarking approach should be the
primary method of establishing efficient retail costs, with the bottom-up assessment used to test
the reasonableness of the benchmark market observations.
5.3 ACIL's analysis—residential and small business tariffs
5.3.1 Market data benchmarking
In summary, ACIL's analysis indicates that:
Average total retail costs for residential retail tariffs are close to the QCA's existing allowance.
However, retailers appear to recover more of these costs from the variable component of
retail tariffs than previously assumed.
Average total retail costs are higher for small business customers than for residential
customers. As is the case for residential tariffs, the market data indicates that retailers recover
a greater proportion of retail costs from the variable component of small business tariffs,
compared to our previous assumptions.
There are significant differences in how retailers allocate retail costs between fixed and
variable components. This also differs across customer tariff classes. For example, the data
indicates that the proportion of retail costs that are recovered through the variable
44 For a comprehensive explanation of ACIL's methodology, please see its methodology paper (December
2015), preliminary report (March 2016) and final report (May 2016), which are available on the QCA website: www.qca.org.au.
Public Record Exhibit 6
211
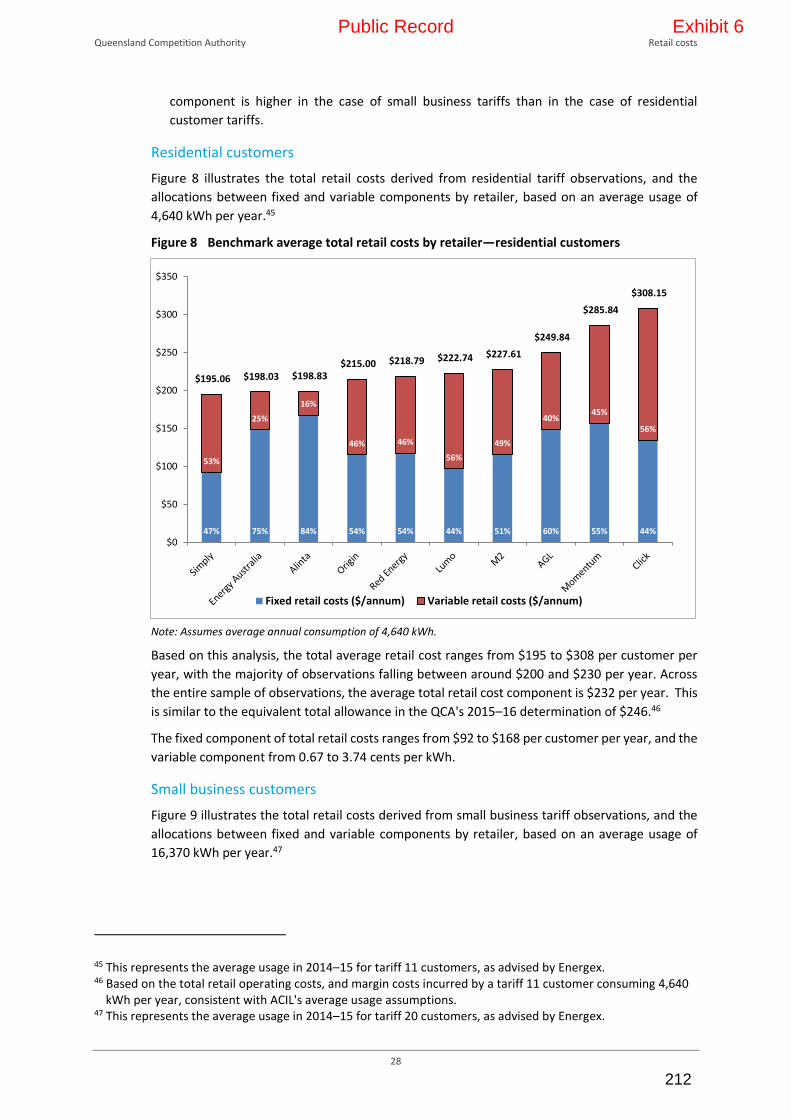
Queensland Competition Authority Retail costs
28
component is higher in the case of small business tariffs than in the case of residential
customer tariffs.
Residential customers
Figure 8 illustrates the total retail costs derived from residential tariff observations, and the
allocations between fixed and variable components by retailer, based on an average usage of
4,640 kWh per year.45
Figure 8 Benchmark average total retail costs by retailer—residential customers
Note: Assumes average annual consumption of 4,640 kWh.
Based on this analysis, the total average retail cost ranges from $195 to $308 per customer per
year, with the majority of observations falling between around $200 and $230 per year. Across
the entire sample of observations, the average total retail cost component is $232 per year. This
is similar to the equivalent total allowance in the QCA's 2015–16 determination of $246.46
The fixed component of total retail costs ranges from $92 to $168 per customer per year, and the
variable component from 0.67 to 3.74 cents per kWh.
Small business customers
Figure 9 illustrates the total retail costs derived from small business tariff observations, and the
allocations between fixed and variable components by retailer, based on an average usage of
16,370 kWh per year.47
45 This represents the average usage in 2014–15 for tariff 11 customers, as advised by Energex. 46 Based on the total retail operating costs, and margin costs incurred by a tariff 11 customer consuming 4,640
kWh per year, consistent with ACIL's average usage assumptions. 47 This represents the average usage in 2014–15 for tariff 20 customers, as advised by Energex.
47% 75% 84% 54% 54% 44% 51% 60% 55% 44%
53%
25%
16%
46% 46%
56%
49%
40%45%
56%
$195.06 $198.03 $198.83 $215.00 $218.79 $222.74 $227.61
$249.84
$285.84
$308.15
$0
$50
$100
$150
$200
$250
$300
$350
Fixed retail costs ($/annum) Variable retail costs ($/annum)
Public Record Exhibit 6
212

Queensland Competition Authority Retail costs
29
Figure 9 Benchmark average total retail costs by retailer—small business customers
Note: Assumes average annual consumption of 16,370 kWh.
Based on this analysis, the total average retail cost ranges from $408 to $781 per customer per
year. Across the complete sample of observations, the average total retail cost component is
$604 per year. The fixed component of total retail costs ranges from $130 to $242 per customer
per year, and the variable component from 1.26 to 3.62 cents per kWh.
This analysis indicates that serving customers on small business tariffs carries higher retail costs
than serving residential customers, on average. Possible reasons for this cost difference include:
different customer risk profiles and potentially a greater likelihood of default for small
business customers—as a result, retailers may require a higher return on their small business
customers
the need for different marketing approaches and customer acquisition and retention
strategies—for example, small businesses may be 'stickier', which might require retailers to
adopt more intensive and costly marketing approaches to win new customers
greater use of manual processes and more individual contact with small business customers
compared to residential customers.
The analysis also suggests that retailers recover a greater proportion of retail costs through
variable charges from small business customers, compared to residential customers. This is not
unexpected, as small businesses typically have a higher usage than residential customers, which
means the fixed component tends to be a smaller proportion of the overall bill than it is for
residential customers.
5.3.2 QCA position
ACIL's analysis presents a range of benchmark retail cost allowances that could be adopted, along
with approaches for allocating these costs to fixed and variable tariff components. Based on
ACIL's analysis, we have adopted the following approach:
49% 51% 40% 27% 30% 38% 31% 20% 21% 24%
51%
49%
60%
73%70%
62% 69%
80% 79%76%
$407.86
$478.47 $484.63 $488.86 $498.48
$546.18
$690.40 $719.26
$746.94 $780.69
$0
$100
$200
$300
$400
$500
$600
$700
$800
$900
Fixed retail costs ($/annum) Variable retail costs ($/annum)
Public Record Exhibit 6
213
Queensland Competition Authority Retail costs
30
(1) Establish an efficient total retail cost amount (inclusive of retail operating costs and
margin), based on ACIL's recommended range of benchmark retail costs.
(2) Determine how the total efficient retail cost allowance should be allocated to the fixed
and variable components of retail tariffs, based on ACIL's analysis of competitive market
data.
(3) Assign a retail cost allowance, and fixed/variable allocation assumption to each regulated
retail tariff.
This approach differs from our previous methodology, and that used by IPART in its 2013–16
determination. However, we consider it is a robust and transparent approach, as it relies heavily
on outcomes observed in competitive retail markets.
Our approach means that the retail margin cannot be isolated from any other component of the
overall total retail cost. However, we do not consider it necessary to estimate an efficient retail
margin, or any other discrete retail cost component. Rather, our approach focuses on estimating
an efficient total level of retail costs, which implicitly includes some retail margin, portions of
which are recovered through fixed and variable charges. The relationship between total retail
costs and the implied retail margin is further explained in ACIL's final report.48
Our approach also means that variable retail costs are recovered as a percentage of underlying
variable costs, similar to the way the retail margin was applied in previous years. The reasons for
this approach, and how it is used to derive variable retail costs, is explained further in Appendix J.
5.4 Determining efficient total retail cost allowances—residential and small business tariffs
ACIL's analysis produced a range of potential efficient total retail cost allowances based on market
data. However, we need to determine point estimates from this data to establish efficient
benchmark retail cost allowances to apply to each regulated retail tariff.
5.4.1 Representative retailer characteristics
We have previously applied a ‘representative retailer’ model when considering retail cost
allowances. This approach established a hypothetical retail entity with specific characteristics,
which could be used to inform our decision on the efficient level of costs. The assumption was
that certain business characteristics, such as scale and integration, are likely to influence overall
retail costs.
However, it is not clear that the representative retailer concept remains useful when establishing
efficient levels of retail costs, for two reasons. First, very few retailers have the characteristics of
the QCA's representative retailer, and benchmarking the costs incurred by these businesses only
is therefore unlikely to deliver robust results. Second, as illustrated in Figures 8 and 9, ACIL's
analysis does not suggest any clear relationship between the overall level of retail costs and
retailer characteristics, particularly in terms of scale. In fact, some of the smaller retailers appear
to have lower retail costs than some larger incumbents.
For these reasons, we do not consider it necessary to strictly observe the previous definition of a
'representative retailer' when determining efficient retail cost allowances. Instead, we consider
it appropriate to include the entire sample of observations from ACIL's analysis, rather than
48 ACIL, Regulated retail prices for 2016-17: Estimating the efficient retailer costs, final report, 13 May 2016.
Public Record Exhibit 6
214
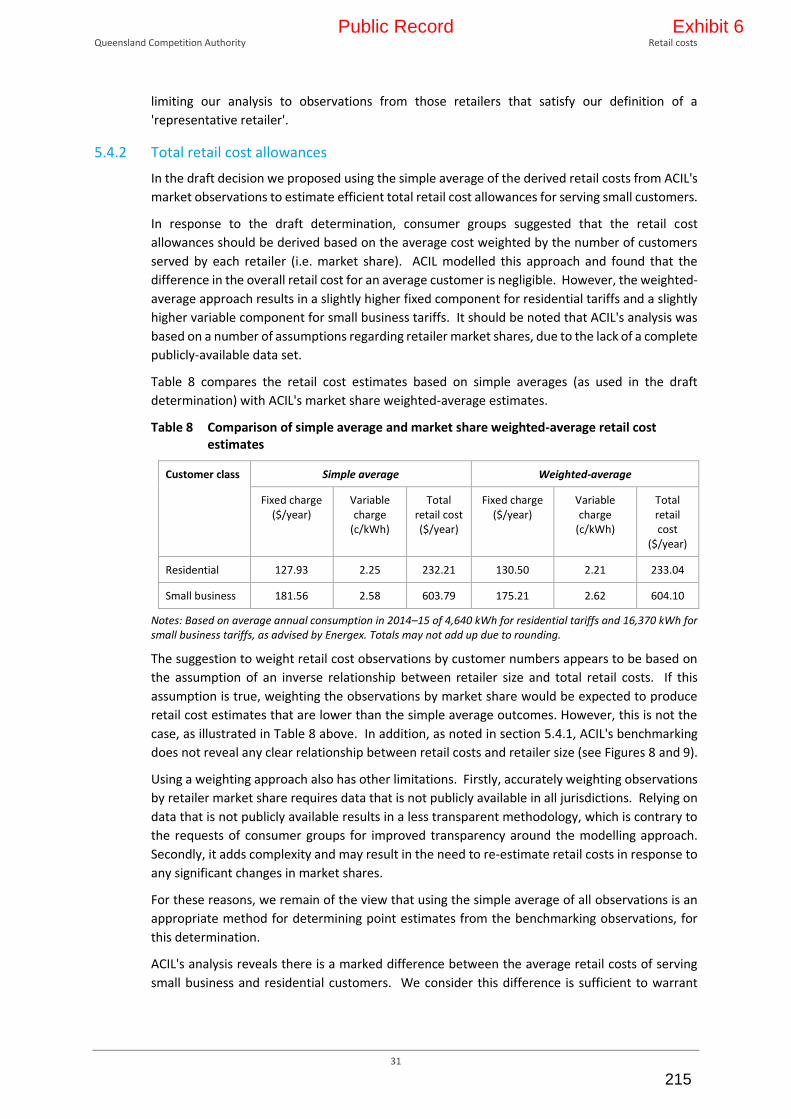
Queensland Competition Authority Retail costs
31
limiting our analysis to observations from those retailers that satisfy our definition of a
'representative retailer'.
5.4.2 Total retail cost allowances
In the draft decision we proposed using the simple average of the derived retail costs from ACIL's
market observations to estimate efficient total retail cost allowances for serving small customers.
In response to the draft determination, consumer groups suggested that the retail cost
allowances should be derived based on the average cost weighted by the number of customers
served by each retailer (i.e. market share). ACIL modelled this approach and found that the
difference in the overall retail cost for an average customer is negligible. However, the weighted-
average approach results in a slightly higher fixed component for residential tariffs and a slightly
higher variable component for small business tariffs. It should be noted that ACIL's analysis was
based on a number of assumptions regarding retailer market shares, due to the lack of a complete
publicly-available data set.
Table 8 compares the retail cost estimates based on simple averages (as used in the draft
determination) with ACIL's market share weighted-average estimates.
Table 8 Comparison of simple average and market share weighted-average retail cost estimates
Customer class Simple average Weighted-average
Fixed charge ($/year)
Variable charge
(c/kWh)
Total retail cost ($/year)
Fixed charge ($/year)
Variable charge
(c/kWh)
Total retail cost
($/year)
Residential 127.93 2.25 232.21 130.50 2.21 233.04
Small business 181.56 2.58 603.79 175.21 2.62 604.10
Notes: Based on average annual consumption in 2014–15 of 4,640 kWh for residential tariffs and 16,370 kWh for small business tariffs, as advised by Energex. Totals may not add up due to rounding.
The suggestion to weight retail cost observations by customer numbers appears to be based on
the assumption of an inverse relationship between retailer size and total retail costs. If this
assumption is true, weighting the observations by market share would be expected to produce
retail cost estimates that are lower than the simple average outcomes. However, this is not the
case, as illustrated in Table 8 above. In addition, as noted in section 5.4.1, ACIL's benchmarking
does not reveal any clear relationship between retail costs and retailer size (see Figures 8 and 9).
Using a weighting approach also has other limitations. Firstly, accurately weighting observations
by retailer market share requires data that is not publicly available in all jurisdictions. Relying on
data that is not publicly available results in a less transparent methodology, which is contrary to
the requests of consumer groups for improved transparency around the modelling approach.
Secondly, it adds complexity and may result in the need to re-estimate retail costs in response to
any significant changes in market shares.
For these reasons, we remain of the view that using the simple average of all observations is an
appropriate method for determining point estimates from the benchmarking observations, for
this determination.
ACIL's analysis reveals there is a marked difference between the average retail costs of serving
small business and residential customers. We consider this difference is sufficient to warrant
Public Record Exhibit 6
215

Queensland Competition Authority Retail costs
32
separate retail cost allowances. This means that typical small business customers will pay a higher
retail cost than typical residential customers on average, compared to 2015–16.
Inflating retail costs to 2016–17 values
ACIL's market observations reflect retail costs from 2015–16 prices. As a result, we need to
consider whether those values should be indexed to 2016–17 dollar terms.
ACIL has proposed that the fixed retail costs be held at the 2015–16 level for 2016–17. ACIL
formed this view after reviewing confidential information provided by retailers, and published
financial results, which suggest that that the expected growth in wages and materials costs in
2016–17 appears to be offset by expected productivity improvements.
No stakeholders commented on this matter.
Our final decision is to accept ACIL's advice that the 2015–16 benchmark retail costs should be
applied without escalation in 2016–17 notified prices. We will need to revisit this issue in the
future (discussed in section 5.9).
5.4.3 QCA position
Our final decision is to establish two separate retail cost allowances to reflect the estimated
efficient costs of supplying residential and small business customers, based on the averages of
ACIL's benchmarking observations. Table 9 sets out the total retail cost allowances for residential
and small business customer tariffs for 2016–17. These are based on the simple average of market
observations derived from ACIL's benchmarking analysis, summarised in Figures 8 and 9.
Table 9 Benchmark average retail costs—residential and small business customers
Customer class Total retail costs ($/annum)
Residential $232.21
Small business $603.79
Note: Based on average annual consumption of 4,640 kWh for residential tariffs and 16,370 kWh for small business tariffs. These averages represent averages across the entire data samples, and do not represent averages of the values depicted in Figures 8 and 9.
5.5 Determining fixed and variable retail cost components—residential and small business tariffs
Having determined an aggregate retail cost amount based on an average level of consumption,
we need to consider whether these costs should be recovered through fixed or variable charges,
or a combination of both.
Generally, the principle of cost reflectivity informs the decision on where the retail cost
allowances should apply in each tariff. If retail costs are mostly fixed, they should generally be
applied to the fixed tariff component; if they are mostly variable (they change with the level of
usage), they should generally apply to the variable tariff components. In previous
determinations, we allocated the retail operating costs allowances to the fixed component of
retail tariffs only, as we had no strong evidence to conclude that these costs varied with energy
usage. The retail margin was applied as a percentage of total costs, which means it had a fixed
and variable component.
Stakeholders expressed mixed views on how retail costs should be allocated between fixed and
variable components. In response to the interim consultation paper, the Queensland Consumers
Association submitted:
Public Record Exhibit 6
216
Queensland Competition Authority Retail costs
33
The Association emphasises the need for these to be accurately and fairly allocated given that they
have major impacts on the bills of different types of consumers and on incentives to change
consumption.
In this regard the Association requests that the review of ROC establish the extend [sic] to which
any significant retail costs, for example financing costs, are volume related and take these into
account when deciding whether to continue to regard all retails costs as fixed and to add them to
the daily charge. 49
In contrast, Toowoomba Regional Council considered that:
…the [retail operating costs] should be a fixed rate for each account and should not be linked with
consumption and hence the variable component. 50
Ergon Retail also considered the majority of retail costs are fixed, stating:
EEQ supports the principle of cost reflectivity, in the application of ROC, to fixed and variable
charges. In EEQ’s view, a majority of the costs included in the QCA’s definition of [retail operating
costs] represent fixed charges. Applying the ROC to the fixed component of notified prices is likely
to be the most appropriate approach. However, consideration should be given to the impact of
fixed charges on customers with low usage, in particular, those who are vulnerable or experiencing
financial hardship. 51
Ergon Retail also noted, in the context of estimating the retail margin, that amortisation and
depreciation should be captured in the fixed retail cost component, rather than the variable
(margin) component. It noted:
Many retailers are reducing the number of acquired assets and instead using service arrangement
for their systems and required assets (e.g. IT systems, buildings, etc). The reclassification of
depreciation and amortisation expenses from retail margin to ROC will assist with future
benchmarking process. 52
Origin Energy also considered that the fixed component should be higher, stating:
Origin does not agree with the proposed rebalancing of the fixed and variable components of the
retail tariff. It does not reflect a true allocation of costs to customers in Queensland and it may
lead to the cross subsidisation between customer segments as retailers attempt to recover fixed
costs.53
The preference for higher fixed charges among retailers is understandable, as it provides greater
revenue certainty, particularly when consumption is declining. It is also understandable that large
customers would prefer a fully fixed retail cost allowance, as this means retail costs would likely
represent a relatively smaller portion of their overall bill.
In practice, fixed and variable retail costs are closely related and dependent on retailer
preferences, as ACIL noted:
The allocation of costs between the two categories may sometimes be arbitrary and for a given
retailer may change over time. A retailer could, for example, invest in IT and increase the level of
49 Queensland Consumers Association, submission on the QCA interim consultation paper, Regulated retail electricity prices for 2016–17, 18 January 2016, p. 2. 50 Toowoomba Regional Council, submission on the QCA interim consultation paper, Regulated retail electricity prices for 2016–17, 17 December 2015, p. 2. 51 Ergon Energy Queensland, submission on the QCA interim consultation paper, Regulated retail electricity
prices for 2016–17, 20 January 2016, p. 9. 52 Ergon Energy Queensland, submission on the QCA interim consultation paper, Regulated retail electricity
prices for 2016–17, 20 January 2016, p. 9. 53 Origin Energy, submission on the QCA draft determination, Regulated retail electricity prices for 2016–17, 20
April 2016, p. 1.
Public Record Exhibit 6
217
Queensland Competition Authority Retail costs
34
automation in the business, which may decrease the fixed retailer cost (the costs to serve a
customer) and increase the variable retailer cost (the return on and of the IT assets).54
In setting its fixed retail cost allowance at the mid-point of the estimated range for its 2013–16
determination, IPART also acknowledged this trade-off between fixed and variable costs:
[Setting the retail operating cost allowance at the mid-point] ... takes account of the fact that
retailers’ capital expenditure decisions are not captured in the methodology used to estimate the
retail margin. If retailers have lower ROC because of higher capital expenditure, then setting ROC
at the low end of the range may understate their total costs given our method for estimating the
retail margin. Further, choosing the lower end of the range may place too much weight on one
retailer’s data, given that the differences across retailers’ data are driven partly by differences in
their reporting and cost allocation methods. 55
5.5.1 Market data benchmarking
Our previous methodology for applying retail costs implies recovery of around 77 per cent of total
retail costs (retail operating costs and margin) through the fixed component for residential tariffs
and around 50 per cent for small business tariffs.56 However, ACIL's analysis indicates the fixed
component is generally smaller on average.
For residential customers, the market data analysis reveals that 45 per cent of retail costs are
recovered through variable charges and 55 per cent through fixed charges, on average. This
allocation is quite different for small business tariffs, where around 30 per cent of costs are
recovered through fixed retail charges, and 70 per cent through variable charges, on average. This
is understandable, as small businesses typically have higher usage than residential customers,
which means the fixed component tends to be a smaller proportion of the overall bill than it is
for residential customers.
ACIL's analysis also reveals differences in how individual retailers recover retail costs from fixed
and variable tariff components. Notwithstanding these differences, there is a clear inverse
relationship between the two components—higher fixed retail costs tend to be offset by lower
variable retail costs and vice versa.
5.5.2 Confidential retailer data—bottom-up analysis
Confidential data supplied by retailers was varied and did not allow us to draw any firm
conclusions on the appropriate allocation of retail costs between fixed and variable components.
However, it has provided some guidance on the likely reasonable range of the fixed retail
component.
ACIL analysed the confidential retailer data and derived a reasonable range for the fixed
component of retail costs for small customers of between $80 and $175 per customer per year.
This range effectively reflects the upper and lower limit of costs that could potentially be treated
as fixed retail costs by a retailer. The lower limit includes only those costs that are typically
considered to be directly related to customer numbers such as call centres, billing and revenue
collection and customer acquisition and retention costs. The upper limit includes those same
costs and others that could be considered fixed, but which retailers may choose to recover
through variable charges. These costs include depreciation, amortisation, tax and interest
54 ACIL, Regulated retail prices for 2016–17: Estimating the efficient retailer costs, final report, 13 May 2016. 55 IPART, Review of regulated retail prices and charges for electricity from 1 July 2013 to 30 June 2016, June
2013, p. 105. 56 Based on 2015–16 tariff 11 notified prices with the average annual usage of 4,640 kWh, and 2015–16 tariff
20 notified prices with annual average usage of 16,370 kWh.
Public Record Exhibit 6
218

Queensland Competition Authority Retail costs
35
payments, which have typically been considered as recovered through the variable retail
component (the retail margin in previous determinations).
The mid-point of the estimated range of the fixed retail cost component derived from the retailer
data is $127.50. This is very close to the average fixed component of residential retail costs
derived from the market data analysis, which supports the validity of the benchmarking
observations.
5.5.3 QCA position
While retailers considered that the fixed component of retail costs should be higher, no new
information or evidence was provided to support this view. On this basis, we consider using the
allocation implied by the average fixed and variable retail cost allowances derived from ACIL's
market observations remains a reasonable approach to allocating total benchmark retail costs.
Details on how the fixed and variable components have been applied are set out in Appendix J.
Adopting the average benchmark allocation between fixed and variable components would see
residential and small business notified prices 'rebalanced' to place greater weight on recovery of
costs through variable charges. For tariff 11 customers, this would result in a reduction in the
fixed daily charge of around 17 cents per day, and an increase in the variable charge of 1.17 cent
per kWh. For small business customers, this would result in a reduction in the fixed daily charge
of around 3.8 cents per day, and an increase in the variable charge of 1.59 cents per kWh.57
The allocation between fixed and variable components has distributional implications for
different customers. Recovering a larger proportion of retail costs from the fixed component will
have a proportionally greater impact on low-usage customers (as fixed costs are a relatively larger
part of their bill), while recovering more costs through the variable component will have a
relatively greater impact on high-usage customers.
5.6 Assigning fixed and variable retail costs to residential and small business customer tariffs
After establishing the total retail cost allowances, and the benchmark allocation between the
fixed and variable components, we then determined the appropriate way to assign these
allowances to each individual retail tariff.
Flat rate tariffs and time-of-use tariffs—tariffs 11, 12A, 20, 22 and 22A
Tariffs 11 and 12A can be accessed by residential customers and small business customers.
However, they can only be accessed by small business customers in conjunction with a primary
small business tariff. Likewise, tariffs 20 and 22 can be accessed by residential customers in some
circumstances. However, the predominant users of tariffs 11 and 12A are residential customers,
and small business customers are the predominant users of tariffs 20 and 22. As such, we have
decided to apply the small business retail cost allowance to tariffs 20, 22 and 22A, and the
residential retail cost to tariffs 11 and 12A.
Demand tariffs—tariffs 14, 24, 41
Tariff 14 is a residential tariff and tariffs 24 and 41 are small business tariffs. We have applied the
corresponding retail cost allowance to each of these tariffs.
57 This represents the impact on the retail cost component only and assumes all other costs are held constant.
Public Record Exhibit 6
219

Queensland Competition Authority Retail costs
36
In previous decisions we applied the retail margin equally (on a percentage basis) to all
components of each retail tariff, including demand charges. We consider this approach remains
appropriate for apportioning variable retail costs to tariff components that are not volume
related, such as demand charges. We have applied the relevant variable retail cost percentage
allocators set out in Table 37, column E (Appendix J) to the demand and usage components of
each of these tariffs.
Controlled load tariffs—tariffs 31 and 33
Tariffs 31 and 33 are available to both residential and small business customers. However, we
note the majority of customers accessing these tariffs are residential, and we have therefore
applied the benchmark retail cost allowance for residential customers.
We previously decided not to apply fixed retail cost allowances to the controlled load retail tariffs,
because we assumed that customers accessing those tariffs would also access another general
supply tariff (e.g. tariff 11 or 20) and pay their fixed retail costs through that tariff.
In 2016–17, we will continue with this approach and apply only a variable retail cost to tariffs 31
and 33.
Unmetered loads—tariff 91
Tariff 91 is available for small unmetered supplies (other than street lighting) as approved by the
distribution business. This tariff is primarily used for loads that are predictable and reasonably
calculated without metering, or where it would not be cost-effective to install a meter. As tariff
91 is intended for small loads, we have applied the small business variable cost percentage
allocator to the usage charge of tariff 91.
In previous decisions, we did not apply a fixed retail cost component to tariff 91, because
customers accessing this tariff were also likely to be supplied under another general supply
business tariff. We have decided to continue this approach in 2016–17.
Transitional arrangement for small business retail costs
As noted in section 5.3, adopting ACIL's analysis means higher retail costs for small business
customers compared with 2015–16. In isolation, the shift from the IPART benchmark to ACIL's
benchmark estimate is responsible for around four percentage points of the overall 11.2 per cent
increase in a typical tariff 20 customer bill in 2016–17. We have considered the suggestion by the
Minister to transition the impact of this change over more than one determination period.
While we previously transitioned the rebalance of tariff 11 after the move away from the
Benchmark Retail Cost Index (BRCI) approach to setting notified prices, that was about removing
a cross-subsidy within the residential customer group, not holding prices below cost for an entire
customer group. We have also previously transitioned the move from some BRCI tariffs to
standard business tariffs, but only where there were very substantial customer impacts.
In contrast, we have not previously transitioned the impacts of changes in individual cost
components, even where those changes have been very substantial. The reasoning behind that
approach has been that transitioning changes in individual cost components would mean setting
prices that are below the actual costs of supply (or further below the actual costs of supply in
regional Queensland).
Transitioning the change in retail costs for small business customers would result in prices being
set at a level that is further below the actual costs of supply in regional Queensland. Setting prices
further below cost will also have an adverse impact on retailers, other than Ergon Retail, that
Public Record Exhibit 6
220

Queensland Competition Authority Retail costs
37
supply small business customers in regional Queensland. Based on information provided by
Ergon Distribution, these retailers supply almost 3,500 small business customers in regional
Queensland. They are likely making a significant loss on these customers, as they do not receive
the Customer Service Obligation (CSO) payment that allows Ergon Retail to provide subsidised
prices; they also cannot transfer these customers back to Ergon Retail.
Further, transitioning the change in retail costs would likely result in notified prices that are lower
than expected standing offer prices in south east Queensland, which would be inconsistent with
the UTP. In addition, it would necessitate a 'catch-up' of costs in 2017–18, which would likely see
notified prices for small business customers increase again, regardless of any increases in actual
underlying costs.
For these reasons, we have decided that the change in the retail cost allowances for small
business should be passed through in full in 2016–17.
5.6.1 QCA position
Our final decision is to apply the total retail cost allowances to the fixed and variable components
of retail tariffs based on the average allocation derived from ACIL's analysis (see Table 8), and the
variable cost percentage allocators set out in Table 38 (Appendix J). Table 39 (Appendix J)
summarises the application of these costs to each retail tariff. Consistent with our previous
determinations, secondary retail tariffs do not attract a fixed retail cost allowance.
5.7 Large and very large business customer tariffs
For the reasons set out in section 5.2, ACIL has advised that there is no compelling evidence that
the retail costs for large and very large business customers should vary from the QCA's previous
allowances.
Stakeholders expressed differing views on the appropriate level of retail costs for large business
customers. Toowoomba Regional Council stated:
Council questions the finding that the costs to serve large and very large customer is higher than
for small and residential customers. In fact, Council believes the opposite to be true. Large and very
large accounts are likely to be controlled by organisations with multiple accounts and hence
availing themselves of electronically issued consolidated invoices. Whereas small and residential
customers are invoiced on paper for each individual account [sic]. Council considers that the cost
to administer a large or very large account would be similar if not less than the cost to administer
a small account, and hence does not support the proposal to continue to charge larger accounts
with a higher ROC. 58
In contrast, Ergon Retail submitted that large customers are more costly to serve than small
customers and supported separate allowances for large customers:
The requirements of large and very large customers often result in more tailored product offerings
and bespoke servicing. This impacts operational activities across multiple functions within a
business including:
Customer administration (call centre specialists and dedicated customer service
representatives)
Trading
Billing and revenue collection
58 Toowoomba Regional Council, submission to the QCA interim consultation paper, Regulated retail electricity
prices 2016–17, 17 December 2015, p. 2
Public Record Exhibit 6
221
Queensland Competition Authority Retail costs
38
CARC. 59
We note Toowoomba Regional Council's suggestion that retail costs should be lower for large and
very large customers. While potential cost savings could be made by consolidating billing for large
customers with multiple accounts, other characteristics of the relationship between a retailer and
large customer may lead to higher costs, as noted by Ergon Retail.
We also note that Frontier Economics previously examined this issue and found that it costs
considerably more to serve large customers than small customers.60 This cost difference was
based on the higher costs of marketing, account management, and pricing of large customer
loads.
5.7.1 QCA position
On balance, we consider there is no conclusive evidence to suggest that the retail cost allowances
for large and very large business customers in 2016–17 should be materially different from those
allowed in 2015–16.
Therefore, our final decision is to base retail costs for large and very large business customers on
our 2015–16 allowances, with the fixed retail components escalated by forecast inflation to
maintain them in real terms. Details on how we have applied retail costs to each pricing
component are set out in Appendix J.
Table 12 sets out our decision on retail cost allowances for each large and very large business
tariff.
5.8 Retail cost allowances for 2016–17
Tables 10 to 12 set out our final decisions on the retail cost allowances for each regulated retail
tariff for 2016–17. Each fixed retail cost component includes an allowance for QCA regulatory
fees, as set out in Table 41 of Appendix J.
59 Ergon Energy Queensland, submission to the QCA interim consultation paper, Regulated retail electricity
prices 2016–17, 20 January 2016, p. 8. 60 Frontier Economics, Retail Operating Costs, report prepared for the Economic Regulation Authority of
Western Australia, February 2012.
Public Record Exhibit 6
222

Queensland Competition Authority Retail costs
39
Table 10 Final determination—retail costs for residential customers and controlled loads for 2016–17 (GST exclusive)
Retail tariff Pricing component
Fixed retail component
(c/day)
Usage (c/kWh) Demand ($/kW/month)
Peak Off-peak/flat Peak Off-peak/flat
T11 35.107 2.376
T12A 35.107 5.392 1.917
T14 35.107 1.447 5.963 1.086
T31 n/a 1.393
T33 n/a 1.927
Table 11 Final determination—retail costs for small business customers for 2016–17 (GST exclusive)
Retail tariff Pricing component
Fixed retail component
(c/day)
Usage (c/kWh) Demand ($/kW/month)
Peak Off-peak/flat Peak Off-peak/flat
T20 49.790 2.807
T22A 49.790 5.108 2.519
T24 49.790 1.762 9.165 1.506
T41 49.790 1.472 3.117
T91 2.527
T22 (transitional) 49.790 3.052 2.448
Table 12 Final determination—retail costs for large business, very large business and street lighting customers for 2016–17 (GST exclusive)
Retail tariff Pricing component
Fixed retail component
(c/day)
Usage (c/kWh) Demand ($/kW/month)
Peak Off-peak/flat Peak Off-peak/flat
T44 492.445 0.668 2.164
T45 1117.230 0.673 1.718
T46 2632.909 0.684 1.527
T47 2372.031 0.628 1.406
T48 2787.627 0.628 1.406
T50 456.956 0.643 0.829 3.322 0.801
T71 n/a 1.711
Public Record Exhibit 6
223

Queensland Competition Authority Retail costs
40
5.9 Updating the retail cost allowances from year to year
A thorough bottom-up and benchmark review of the efficient retail cost allowance represents a
time-consuming and costly exercise, and places a significant reporting burden on electricity
retailers. We consider that the cost of doing this exercise on a yearly basis would most likely
outweigh any incremental benefit over the short term. Rather, we envisage that a thorough
review of retail costs for the 2016–17 determination should produce robust estimates that can
then be updated annually using a defined escalation method.
Any form of annual escalation could not be conducted indefinitely, and a further detailed review
of retail costs would need to be conducted in due course. This would become particularly
important if there were material changes in cost drivers that flowed through to retail costs.
5.9.1 QCA position
With the exception of retail costs for large and very large business customer tariffs, the escalation
of benchmark retail cost allowances is not necessary in 2016–17. For this reason, we have
deferred our consideration of this issue to next year, should we be delegated the task of setting
notified prices.
Public Record Exhibit 6
224
Queensland Competition Authority Other issues
41
6 OTHER ISSUES
This chapter sets out our final decisions on the inclusion of additional allowances above the
estimated efficient costs of supply, and the cost pass-through mechanism. Our final decisions are
to:
provide an allowance for headroom of five per cent of the estimated efficient costs of supply
for all large business customer retail tariffs, consistent with our 2015–16 determination
include a five per cent allowance above the estimated efficient costs of supply in south east
Queensland for all residential and small business customer tariffs, to reflect the difference
between the expected level of market offer prices and standing offer prices in 2016–17
require the negative pass-through of a small over-recovery of Small-Scale Renewable Energy
Scheme (SRES) costs incurred during 2015–16.
6.1 Allowances above the efficient costs of supply
Under section 90(5)(a) of the Electricity Act, we are required to have regard to the effect of our
price determination on competition in the Queensland retail electricity market. We must also
have regard to the objects of the Electricity Act, which include:
(a) establishing a competitive electricity market in line with the national electricity industry
reform process
(b) taking into account national competition policy requirements.
Where it is effective, we consider that competition provides the best means of delivering the
goods and services that customers demand at prices that reflect efficient costs. In previous
determinations, we have included an allowance for 'headroom' to facilitate the development of
retail competition in south east Queensland for residential and small business customers, and in
regional Queensland for large business customers. The headroom allowance is an amount, in
addition to the estimated efficient cost of providing customer retail services, included in notified
prices for the purpose of encouraging customers to engage in the market and seek out more
attractive market offers. Since the 2012–13 determination, we have set this allowance at five per
cent of total estimated efficient costs.
Retail competition in the residential and small business customer market is very limited outside
of south east Queensland. This is largely because the Queensland Government's Uniform Tariff
Policy (UTP) delivers a subsidy to Ergon Retail to supply electricity at notified prices which are, in
most cases, well below the true cost of supply. Other retailers cannot access this subsidy and
therefore typically cannot compete with Ergon Retail's subsidised notified prices. While
headroom has performed the function of encouraging competition in the south east Queensland
market where there is a choice of retailers, the inclusion of headroom in notified prices for small
customers in regional Queensland has been a consequence of the UTP, rather than a means of
promoting competition.
While we are setting notified prices to apply in regional Queensland only, headroom remains a
relevant issue for 2016–17. Firstly, headroom is an important consideration when setting notified
prices for large and very large business customers in the Ergon Distribution area, as many of these
customers have access to competition. This is discussed further in section 6.1.2. In the draft
determination, we applied a headroom allowance of five percent of total costs for large and very
large business customer tariffs, consistent with our approach in previous years.
Public Record Exhibit 6
225

Queensland Competition Authority Other issues
42
Headroom is also a relevant concept when determining the expected level of standing offer prices
for small customers in south east Queensland. Conceptually, headroom can be likened to the
increment of standing offer prices over market offer prices where we assume that market offer
prices are based on the efficient costs of supply. In the draft determination, we considered that
there would likely be differentials between market and standing offer prices in south east
Queensland in 2016–17, and there were no reasons to conclude that those would be any different
to the differentials between market offer prices and notified prices observed in the market in
2015–16. On this basis, we proposed to apply an allowance of five per cent above the estimated
efficient costs of supply, to reflect expected standing offer prices for small customer tariffs.
Submissions
Canegrowers Isis, Canegrowers, Cotton Australia, FNQEUN, QCOSS, and QFF opposed the
inclusion of headroom in regulated retail tariffs on the basis that it increases prices for regional
customers, most of whom do not have access to competitive market offers.
In contrast, Ergon Retail and Origin Energy supported the continued application of a five per cent
headroom allowance for large and very large business customer tariffs.
Ergon Retail supported a standing offer differential of five per cent for small customer tariffs, but
recommended the QCA review this approach in following years as the deregulated market in
south east Queensland matures. The Queensland Consumers Association suggested that the QCA
should consider weighting each observed discount by the retailer's market share when
determining the differential required to establish expected standing offers prices.
QCOSS suggested that the analysis of price differentials should include market offers that are
above the notified price level, which the QCA purposely excluded from the analysis. These issues
are addressed below.
6.1.1 Estimating price differentials in south east Queensland—residential and small business customers
Notwithstanding some stakeholders' opposition to the concept of headroom, the Queensland
Government's definition of the UTP leads the QCA to set 2016–17 notified prices for small
customers in regional Queensland that broadly reflect the expected level of standing offer prices
in south east Queensland (see section 2.2.1). As discussed below, market prices in south east
Queensland reveal that most retailers' best market offers are generally lower than notified prices
in 2015–16, albeit by varying amounts. In essence, these price differentials represent a form of
'headroom' reflecting the amount competed away through conditional and non-conditional
discounts.
The QCA uses an N+R bottom-up approach to derive the estimated efficient costs of supplying
small customers in south east Queensland. In broad terms, this produces price levels that we
would expect to reflect efficient market offer prices. To estimate the expected level of standing
offer prices, it is necessary to add an amount that represents a reasonable expectation of the
difference between expected efficient market offer prices and expected standing offer prices.
Why is there a difference between market and notified prices?
There are a number of possible reasons why notified prices tend to be higher than market offer
prices. In many cases, the difference reflects the fact that the notified price contracts often
provide terms and conditions that are more favourable to the customer. The premium could then
be considered as compensation to the retailer for accepting the additional costs and risks
associated with providing those terms and conditions.
Public Record Exhibit 6
226

Queensland Competition Authority Other issues
43
Through market offers, retailers are able to adopt different terms and conditions designed to
reduce their direct costs or risks, which may enable them to offer a better price or other
incentives to the customer. For example:
Incentivising customers to pay on time can reduce a retailer's bad debt risk, improve its cash
flow position and reduce costs.
Requiring customers to use direct debit payment methods achieves a similar outcome, and
many retailers offer discounts to customers who use it, to reflect the lower risk of default
and bad debts.
Requiring customers to subscribe to online-only (paperless) billing allows retailers to save on
printing and postage costs.
The difference between market and notified prices may also be an indication of differential
pricing strategies, whereby retailers target different customer segments with different prices,
according to their sensitivity to price changes. Standing offer prices will most likely be taken up
by non-price-sensitive customers (e.g. Solar Bonus Scheme and small consumers) and as such will
be set artificially high.
What is an appropriate price differential to apply to efficient costs?
In previous price determinations, when notified prices were also being set for south east
Queensland customers, we estimated the efficient cost of providing customer retail electricity
services and increased that amount by five per cent to reflect the headroom allowance. However,
when setting small customer notified prices for the 2016–17 determination, our aim is to form a
view on the expected price differential between market offers and expected standing offers, and
build that amount onto our estimate of the efficient costs of supply in south east Queensland to
arrive at an expected standing offer price level. We have considered the following matters when
estimating this expected price differential:
the potential effect of deregulation on retail prices
the experience in other deregulated jurisdictions
observed price differentials in the south east Queensland market.
Price deregulation
From 1 July 2016, retail electricity prices will be deregulated in south east Queensland and
retailers will be able to set standing offer prices at levels of their own choosing, rather than using
notified prices. This clearly has the potential to influence the differential between market and
standing offer prices in 2016–17.
There are differing views on the likely effect of price deregulation on standing offer prices in
2016–17. Canegrowers considered that standing offer prices would fall following deregulation,
noting:
the change to price monitoring in SEQ is likely to trigger further changes to prices and innovation
in the value propositions that retailers offer customers connected to the Energex network. It is
likely that 'standing offer prices' in SEQ will be below existing price levels and well below the prices
foreshadowed in QCA's [2016–17] draft determination.61
61 Canegrowers, submission to the QCA Draft Determination Regulated Retail Prices for 2016–17, 21 January
2016, p. 4.
Public Record Exhibit 6
227
Queensland Competition Authority Other issues
44
A contrasting view is that deregulation will lift the constraints on retailers and allow them to
potentially set standing offers that are higher than the notified prices that applied in south east
Queensland in 2015–16. As Canegrowers Isis observed:62
Standing offer prices will most likely be taken up by non-price-sensitive customers (eg. Solar bonus
scheme and small consumers) and as such will be set artificially high.
However, there are countervailing factors that may influence retailers' pricing decisions. First,
the legislative provisions which give effect to price deregulation in south east Queensland from 1
July 2016 include provisions for independent price monitoring, and the option for the Queensland
Government to reinstate retail price regulation if necessary. These factors are likely to moderate
incentives to set standing offer prices in 2016–17 that are significantly higher than the notified
prices that applied in south east Queensland in 2015–16.
Second, there is likely to be some circularity between the notified prices we determine for
regional Queensland, and standing offer prices that eventuate in the deregulated south east
Queensland market in 2016–17. As the Queensland Productivity Commission (QPC) noted:
The QCA’s approach to setting regulated retail electricity prices in regional Queensland based on
the cost of supplying customers in SEQ is also likely to provide a benchmark price for standing
offers in SEQ going forward.63
Therefore, while retailers may have plausible reasons to set their standing offer prices in 2016–
17 at levels above or below the notified prices which applied in south east Queensland in 2015–
16, these reasons do not provide a sufficient basis to predict how standing offer prices might be
set immediately after deregulation.
Experience in other deregulated jurisdictions
Jurisdictional experience of standing offer price movements following retail market deregulation
is mixed. In Victoria, where the electricity retail market was deregulated in 2009, the difference
between market and standing offers has increased considerably in the eight years since
deregulation, reaching up to 18 per cent in some cases.64 This is likely indicative of increased
rivalry in a more mature market, with increased discounting made possible by differential pricing
and a base of price-insensitive or 'sticky' customers remaining on standing offers. In South
Australia and New South Wales (NSW), where the governments have deregulated more recently
(February 2013 and July 2014, respectively), standing offer prices in the early years of
deregulation have been influenced by other factors and are not likely to be representative of
expected outcomes in the south east Queensland market in 2016–17.
When the South Australian retail market was deregulated on 1 February 2013, the South
Australian Government reached an agreement with AGL (the incumbent first tier retailer) to
lower its residential standing offer prices by 9.1 per cent and small business tariffs by 4.5 per cent
following deregulation, and to cap increases in the retail component of the standing offers for
two years.65 Preliminary observations of South Australian market prices from early March 2016,
immediately after the controls on standing offers were lifted, indicate that the difference
62 Canegrowers Isis, Submission to interim consultation paper, 18 January 2016, p. 1. 63 QPC 2016, Electricity pricing inquiry, draft report, 3 February 2016, p. 124. 64 See AER, State of the Energy Market 2015, p. 137. 65 Government of South Australia, Lower prices for South Australia, media release, 18 December 2012.
Available at http://archives.premier.sa.gov.au/images/news_releases/12_12Dec/energyprice.pdf, accessed 19 February 2016.
Public Record Exhibit 6
228

Queensland Competition Authority Other issues
45
between standing offer prices and retailers' cheapest market offer prices for residential customer
tariffs ranges between zero and 20 per cent, with an average of around 8 per cent.66
Similarly, when the NSW retail market was deregulated on 1 July 2014, small customers who were
on a regulated contract were moved to a 'transitional tariff' for up to two years, after which they
would be required to move to a market offer. In the first year of deregulation, the NSW
Government approved arrangements that would see the transitional tariff decrease by at least
1.5 per cent from existing standing offer prices. In the second year, average increases in the retail
component of the transitional tariff were capped at CPI.
Evidence of price differentials in south east Queensland
We also analysed standing offers and market offers available to customers in south east
Queensland using the AER's 'Energy Made Easy' online price comparison facility to reveal the
current price differentials in the market.
Standing offers are basic contracts with regulated terms and conditions. In markets with price
regulation (such as south east Queensland in 2015–16), standing offer prices are the notified
prices. In markets without price regulation, standing offers are set by the retailer. They also tend
to be the benchmark price from which retailers offer discounted market prices.
From our analysis, it is clear that the market offers of most south east Queensland retailers are
materially lower than standing offers set at 2015–16 notified price levels. At the time of our
observations in early February 2016, retailers' best discounts off a typical annual residential bill
based on a flat rate tariff (i.e. a tariff 11 equivalent) ranged from zero to 10.2 per cent67, with an
average of around 5.5 per cent.68
Analysis conducted on offers available to small businesses in south east Queensland yielded
similar results. Based on the sample of market offers available to small businesses on a flat-rate
tariff (i.e. a tariff 20 equivalent), net discounts off a typical annual small business customer bill
are in the range of zero to 10 per cent, with an average of 5.6 per cent. Figures 10 and 11 illustrate
the results of this analysis.
66 QCA analysis of results from https://www.energymadeeasy.gov.au/, accessed on 11 March 2016. Based on
typical annual residential usage of 3,870 kWh and excluding zero-discount offers, except where they are the only tariff offered by the retailer.
67 QCA analysis of data from www.EnergyMadeEasy.com as at 3 February 2016. This analysis assumes a typical annual usage of 3,860 kWh, which is the median tariff 11 consumption in 2014–15 as advised by Energex. Net discounts are calculated as the net impact of one-off sign-up bonuses, conditional and non-conditional discounts, as well as any account establishment or connection fees that might offset some of the headline discount available. The analysis does not take account of those market offers that feature prices higher than the notified prices. These offers have been excluded from our analysis as it is not clear that a significant number of customers would take up these offers.
68 We note that the AER has published market discount analysis in its 2014 and 2015 State of the Energy Market reports which suggest lower average discounts, closer to two per cent. However, we do not have access to the underlying assumptions of this analysis and as such have been unable to replicate these results.
Public Record Exhibit 6
229

Queensland Competition Authority Other issues
46
Figure 10 Discounts available in south east Queensland at February 2016: Residential flat rate tariffs
Note: Discounts are calculated based on the estimated annual bill of a typical customer consuming 3,860 kWh per year.
Figure 11 Discounts available in south east Queensland at February 2016: Small business flat rate tariffs
Note: Discounts are calculated based on the estimated annual bill of a typical customer consuming 6,470 kWh (the median tariff 20 consumption in 2014–15 as advised by Energex) per year.
This analysis is indicative only for illustrating the existence of price differentials in the south east
Queensland market, and has some limitations. Most notable is the constraint created by
regulated prices in 2015–16, which means that retailers' standing offer prices are set at notified
price levels. As a result, the differential between market and standing offer prices can only be
driven by retailers changing their market offer prices. In deregulated markets, retailers are able
0%
1%
2%
3%
4%
5%
6%
7%
8%
9%
10%
11%
Dis
cou
nt
off
20
15
-16
no
tifi
ed p
rice
(%
)
Net discounts (%)
Average discount - All retailers (%)
0%
1%
2%
3%
4%
5%
6%
7%
8%
9%
10%
11%
Dis
cou
nt
off
20
15
-16
no
tifi
ed p
rice
(%
)
Net discounts (%)
Average discount - All retailers (%)
Public Record Exhibit 6
230
Queensland Competition Authority Other issues
47
to change the level of both their standing offer and market offer prices.69 For this reason, we do
not consider it appropriate to use the observed average price differential in 2015–16 as a direct
proxy for the expected price differential in 2016–17. Other limitations of this analysis include:
Point-in-time observations such as these taken from price comparison websites do not
capture market offers that some customers may currently be receiving, but which are no
longer available (or advertised) to new customers.
We do not have sufficient information to determine how many customers are receiving each
market offer, so it is not possible to determine a weighted-average effective discount across
the whole market, which would offer a more representative estimate of the level of price
differentiation in the market.
This analysis is sensitive to the annual usage assumptions, particularly given that most retailers
offer discounts off the usage component only, rather than the whole bill. Usage only discounts
mean that high-usage customers tend to receive discounts that represent a relatively larger
proportion of their overall bill than low-usage customers.
It is also important to note that each individual retailer's capacity to discount is highly dependent
on its own underlying costs. These costs can vary significantly between businesses due to many
factors, including degrees of efficiency, scale, productivity, risk profile, marketing strategies and
other characteristics. We have not attempted to normalise the samples for these differences.
These different characteristics are likely to be major drivers of the variation seen in the level of
discounts across the samples, as illustrated in Figures 10 and 11.
QCA position
Based on the information available, the QCA considers that differentials between market offer
and standing offer prices will prevail in south east Queensland for small customer tariffs in 2016–
17. Ultimately, the size of the differential between market and standing offer prices immediately
following deregulation is uncertain and will likely be the result of individual retailers' pricing
strategies, changes in underlying costs of supply, and other incentives created by the regulatory
and legislative environment.
As we cannot predict the size of the expected price differential with any certainty, we consider it
reasonable to assume it will remain at a level similar to the differential between notified price
standing offers and market offers in the south east Queensland market at the moment.
Analysis of the existing differential between notified price standing offers and retailer market
offers reveals the average level of discounting is around five to six per cent for a typical small
customer's total annual bill. The five per cent headroom allowance applied in 2015–16 has likely
been a major contributor to the existence of this differential, among other factors.
We note the suggestion by the Queensland Consumers Association to establish the standing offer
differential based on the average of discounts available in south east Queensland, weighted by
each retailers' market share. This is not necessary as, in this case, the average observed discounts
are not used as a direct proxy for the expected price differential in the south east Queensland
market in 2016–17. Rather, the analysis of discounts above simply confirms the presence of a
differential between market and standing offers (notified prices). As we have noted, this simple
69 In the absence of temporary price controls or other negotiated outcomes, such as those seen in New South
Wales and South Australia.
Public Record Exhibit 6
231

Queensland Competition Authority Other issues
48
discount analysis has limitations, most notably that the observed differentials are influenced by
regulation which has constrained standing offer price levels in 2015–16.
For the same reason, adopting QCOSS's suggestion to include market offers that are above the
2015–16 notified price level would not lead us to a different conclusion; rather, it would only
change the level of observed average discount.
While stakeholders challenged our analysis and offered alternative approaches intended to
produce a smaller standing offer adjustment, no evidence was provided that differentials
between market and standing offer prices in 2016–17 will be any different to those currently
observed in the market.
On this basis, our final decision is to add an amount above the efficient costs of supply in south
east Queensland that would deliver a similar average price differential in 2016–17, all other things
being constant. We consider that an amount of five per cent of total costs—equal to the
headroom allowance applied in previous years' determinations—is a reasonable estimate of the
amount required to deliver similar price differentials to those observed in 2015–16.
The QCA will consider whether this approach remains appropriate, should it be delegated the
task of setting notified prices at standing offer price levels for 2017–18.
6.1.2 Estimating headroom for large business customer tariffs
In the draft determination we applied a headroom allowance of five per cent to large business
customer notified prices. We considered this appropriate so that notified prices are not an
impediment to the further development of competition in the large customer market in regional
Queensland. This approach was supported by Ergon Retail and Origin Energy.
Since our 2012–13 determination, we have included an allowance for headroom of five per cent
of efficient costs to facilitate and encourage competition in the large customer market in regional
Queensland.
Competition in regional Queensland
While there is very limited competition in the small customer market in regional Queensland,
competition in the large customer segment shows greater promise of developing further,
particularly in areas where notified prices more closely reflect the actual costs of supply.
Competition in this market segment can be supported by applying an appropriate level of
headroom to notified prices with the aim of encouraging customers to engage in the market and
seek out better offers.
The use of a headroom allowance is a generally accepted approach to stimulating competition
and customer engagement in emerging competitive markets. The QPC highlighted the role that
headroom plays in supporting competition in regional Queensland:
Evidence demonstrates that some level of headroom is needed in electricity prices to support the
development of a competitive retail market. Competition is already in effect in certain customer
segments in regional Queensland. The number of large and very large customers on market
contracts is a direct result of competitive market offers made possible through the retail headroom
allowance. Removing the headroom component of notified prices for regional customers would
effectively preclude any further development of regional competition. It also would raise issues
around customers who have already taken up market offers.70
70 QPC 2016, Electricity pricing inquiry, draft report, 3 February 2016, p. 159.
Public Record Exhibit 6
232

Queensland Competition Authority Other issues
49
How much headroom should be included?
It is difficult to assess the impact of more cost-reflective notified prices and the inclusion of
headroom on competition. There has only been a small increase in the proportion of large
regional customers on market contracts over the last few years. As at 30 June 2015, around 28
per cent of large regional customers were supplied under a market contract.
However, in the Ergon Distribution east pricing zone, transmission region one—where notified
prices are based on the estimated efficient costs of supply—the proportion of large customers on
market contracts is higher and has been increasing. In 2012–13, around 44 per cent of large
customers in this area were on market contracts; that number has increased to 47 per cent as of
June 2015. Notwithstanding this increase, some barriers to the development of widespread
competition in the regional large customer market remain:
Setting uniform retail tariffs means that customers in higher-cost areas of regional
Queensland are not paying cost-reflective notified prices and very large customers are paying
a notified price based on a network charge for high-voltage demand customers (rather than
their site-specific network charge).
Many customers are still accessing obsolete and transitional tariffs, which are not cost‐
reflective.
Once customers accept a market contract with a second tier retailer, they are not allowed to
return to Ergon Retail, which may discourage them from accepting a market offer.71
Even if headroom is set at a reasonable level, these barriers will likely continue to limit the extent
to which competition develops throughout regional Queensland in the foreseeable future.
However, we consider that it is appropriate to continue to include an allowance for headroom so
that the level of notified prices does not create a barrier to competition—to the extent possible—
and to encourage customers to engage with the market and actively seek out better offers.
QCA position
In the absence of any further information, or compelling reasons to change the level of headroom,
our final decision is to continue to include an allowance for headroom in notified prices for large
and very large business customers and to maintain the allowance at five per cent of total costs.
6.2 Cost pass-through mechanism
Cost pass-through mechanisms are used by regulators to mitigate the risk that the costs allowed
for in regulated prices are higher or lower than actual efficient costs. Cost pass-through
mechanisms are usually restricted to events that are outside the control of the regulated entity.
Consistent with the Government's stated intent of the UTP, our final decision is to continue to
base notified prices for residential and small business customers on the costs of supply in south
east Queensland. Not allowing a true-up of costs resulting from events that are outside retailers'
control may result in notified prices being out of alignment with south east Queensland costs,
which could deviate from the intent of the UTP.
We applied a cost pass-through mechanism for the first time in our 2014–15 determination to
pass through an under-recovery of costs in 2013–14 associated with the SRES. We also decided
71 This restriction also applies to any future occupants of that premises (e.g. if the premises is sold or occupied
by a new tenant).
Public Record Exhibit 6
233

Queensland Competition Authority Other issues
50
that the mechanism could be used to account for material differences in network charges, in the
event that the charges billed to retailers (usually the AER-approved charges) differed from those
used to set notified prices. However, this application of the mechanism has not been needed to
date.
In the draft determination, we proposed to consider passing through differences in SRES costs,
where the costs provided in the 2015–16 determination were under- or overstated as a result of
differences between the non-binding and binding small-scale technology percentage (STP) for
2016. The approach to calculating SRES costs is set out in detail in Section 4.2.1 and in ACIL's
report on estimating energy costs.
Ergon Retail and Origin Energy supported the continued use of the pass-through mechanism for
differences in SRES costs. No other stakeholders commented on this issue.
Pass through of SRES costs incurred in 2015–16
As discussed in Section 4.2.1, a retailer's SRES liabilities are determined by the STP, which is the
prescribed value that retailers use to determine the number of small-scale technology certificates
(STCs) they must surrender to discharge their SRES liabilities. The STP is set by the Clean Energy
Regulator (CER) and changes from year to year.
Retailers incur SRES liabilities for each calendar year, but notified prices are determined for each
financial year. While the binding STP for the first and second quarters of the prospective financial
year is known when setting notified prices, the binding STP for the third and fourth quarters is
not. To overcome this, ACIL estimates SRES costs using the average of the final STP (for the first
two quarters of the financial year) and the preliminary or 'non-binding' STP (for the last two
quarters of the financial year). Where the final STP for the last two quarters turns out to be
different from the non-binding STP, the SRES allowance provided through notified prices may
under- or overcompensate retailers operating in south east Queensland for their actual SRES
liabilities during a financial year.
Based on the binding STP for 2016, retailers with customers on non-market contracts are likely to
have over-recovered the costs of complying with the SRES in 2015–16. This is because the binding
STP target for the second half of 2015–16 of 9.68 per cent, was lower than the non-binding target
of 9.98 per cent, which was used for setting notified prices in 2015–16.
We estimate that returning these over-recovered SRES costs to customers would reduce the
usage charge for residential and small business tariffs by approximately 0.008 c/kWh (including
the application of the losses, retail margin and headroom that applied in 2015–16). The
calculation of the SRES pass-through amount is set out in more detail in Appendix K. Table 13
presents our assessment of the 2015–16 over-recovered amounts.
Table 13 Total SRES over-recoveries in 2015–16
Settlement class Retail tariff SRES over-recovery
(c/kWh)
Energex NSLP – Residential, small business, unmetered supply and controlled loads
11, 12A, 14, 20, 22, 22A, 24, 41, 91, 31 and 33
0.0077
Ergon Energy – NSLP - SAC demand and street lighting 44, 45, 46, 50, 71 0.0081
Ergon Energy – NSLP - SAC HV, CAC and ICC 47, 48 0.0077
a. Includes allowances for losses, margin and headroom recovered in 2015–16.
Public Record Exhibit 6
234

Queensland Competition Authority Other issues
51
QCA position
Our final decision is to require the negative pass-through of a small over-recovery of 2015–16
SRES costs into 2016–17 notified prices, as set out in Table 13 above.
Although these are relatively small amounts, we consider this pass-through is appropriate given
that the QCA's intent for the pass-through mechanism has always been for it to operate
symmetrically. It also ensures that notified prices are aligned with south east Queensland costs,
which is consistent with the intent of the UTP.
We have previously considered the cost pass-through mechanism could be used to account for
differences in network charges. However, as the final 2015–16 network charges billed to retailers
did not differ from those used to set 2015–16 notified prices, no adjustment is required.
Depending on the regulatory framework that will apply to future price determinations, and
whether any changes are made to the UTP or the subsidy arrangements underpinning it, the pass-
through provisions discussed here may or may not remain appropriate in the future. Therefore,
the QCA cannot commit to the continued availability of a cost pass-through mechanism beyond
this price determination.
Public Record Exhibit 6
235

Queensland Competition Authority Transitional arrangements
52
7 TRANSITIONAL ARRANGEMENTS
The delegation requires that we consider maintaining transitional arrangements for tariffs classed
as transitional or obsolete, which include farming and irrigation tariffs.
For the 2016–17 tariff year, we have decided to:
maintain the transitional arrangements for tariffs classed as transitional or obsolete because
there would be significant price impacts for some customers moving to standard business
tariffs
continue to allow all customers access to transitional tariffs
increase transitional and obsolete tariffs in line with increases in standard business tariffs, and
apply an escalation factor of 1.1 to limit charges for transitional and obsolete tariffs from
falling further below cost in dollar terms.
7.1 Transitional arrangements for obsolete and transitional tariffs
Since 2012–13 the QCA has set notified prices based on a network plus retail costs (N+R)
approach. The introduction of this approach meant that a number of existing retail tariffs did not
align with a network tariff. These included farming and irrigation tariffs.72
In previous determinations, we decided that most of these tariffs should continue to be available
for a transitional period before customers are required to move to standard business tariffs
because some customers would face significant financial impacts if they moved to a standard
business tariff immediately.
The delegation requires that we consider maintaining these transitional arrangements and
continuing to allow all customers access to transitional tariffs. Canegrowers and Cotton Australia
supported retaining transitional and obsolete tariffs.
QCA position
We have decided to maintain transitional arrangements for 2016–17. We consider it appropriate
to maintain these arrangements, as analysis from Ergon Retail (see Appendix E) shows that, while
a significant number of customers on transitional and obsolete tariffs may face lower electricity
bills on standard business tariffs, some customers are paying electricity bills significantly below
their cost of supply and would face significant price impacts if they immediately moved to the
standard business tariffs paid by other businesses in regional Queensland.
7.1.1 Transitional periods
We established transitional periods for each transitional and obsolete tariff in our 2013–14
determination. In subsequent determinations we decided to maintain these periods. Tariffs 20
(large), 21, 22 (small and large), 37, 62, 65 and 66 were made available until 2020 to allow time
72 We note that the QPC is examining issues around transitional and obsolete tariffs as part of its electricity
pricing inquiry, and has made a draft recommendation for the government to develop an industry assistance arrangement to help businesses on transitional and obsolete tariffs to adjust to standard business tariffs. See www.qpc.qld.gov.au for further information on the QPC's electricity inquiry.
Public Record Exhibit 6
236

Queensland Competition Authority Transitional arrangements
53
for businesses to prepare for the transition to standard business tariffs and recoup some of the
value of investments made to suit the level and structure of these tariffs.73
Toowoomba Regional Council supported allowing transitional periods to run their full course to
allow customers to continue to explore options to adapt their operations to standard business
tariffs. Cotton Australia and the QFF did not support transitional and obsolete tariffs being
removed in 2020, with Cotton Australia arguing for transitional tariffs to remain available to
existing customers indefinitely. Cotton Australia highlighted that electricity costs for some of their
members would triple if they were to move to standard business tariffs. The QFF had reservations
about the removal of transitional arrangements in 2020, as it considered farmers were poorly
informed about the transition to new tariffs and there was no transitional program to assist them.
QCA position
We have decided to maintain the existing transitional periods, established in our 2013–14 final
determination. We consider this will provide certainty to businesses and allow them to prepare
for moving to standard business tariffs. We do not propose to remove transitional tariffs earlier
than scheduled as, based on customer impact analysis (see Appendix E), some customers would
experience significant price impacts if they moved to a standard business tariff immediately.
We have decided not to extend existing transitional periods beyond 2020 for two reasons. Firstly,
as explained in previous determinations, we decided on the transitional period by using the
Australian Taxation Office's defined depreciable life of an irrigation pump of 12 years as a starting
point and then reducing it, because we considered that most investments of this type would have
already been partly, if not fully, depreciated. Secondly, indefinitely subsidising prices beyond
already subsidised UTP levels will encourage further uneconomic investment by businesses and
networks.
7.1.2 Access to obsolete tariffs
The delegation requires that we consider continuing to allow all customers access to transitional
tariffs.
In the 2013–14 determination, we decided that all business customers should have access to
transitional tariffs throughout the transitional period, subject to individual tariff terms and
conditions. The transitional tariffs are tariffs 20 (large), 21, 22 (small and large), 62, 65, and 66.74
We made this decision so that all businesses could be treated equitably. In subsequent
determinations, we noted that we would consider closing access to transitional tariffs to new
customers if there was a significant increase in the number of customers accessing transitional
tariffs, and thereby an increase in the subsidy paid by taxpayers. However, as we found no
significant increase, we decided to continue to allow open access.
Origin suggested that access to transitional tariffs should only be available to those customers
who have made investments on the expectation that these tariffs would remain. Cotton Australia
supported transitional tariffs being available to existing customers on transitional tariffs.
73 Tariffs 41 (large) and 43 (large) were made available until 30 June 2015, on the basis that a significant
number of customers would be better off on a standard business tariff. 74 New customers cannot access tariffs classified as obsolete. We made this decision on the basis that they had
been obsolete for some time (tariff 37), or that they would be removed in a shorter timeframe (tariffs 41 (large) and 43 (large), which were removed on 30 June 2015).
Public Record Exhibit 6
237

Queensland Competition Authority Transitional arrangements
54
QCA position
We have decided to continue to allow all business customers to have access to transitional tariffs.
Our analysis shows that there has not been a significant increase in the number of customers
accessing transitional tariffs. We consider that limiting transitional tariff access to customers
based on their expectations at the time of making their investments, as suggested by Origin,
would not be equitable and may prevent customers from moving to a standard business tariff.
7.1.3 Escalation of transitional and obsolete tariffs
Transitional and obsolete tariff charges, unlike other tariffs, are not determined using an N+R
approach. In past determinations, our general approach to setting charges for each transitional
and obsolete tariff was to escalate the charges based on the percentage increase in the charges
in the standard business tariff that customers would otherwise pay. We then applied additional
escalation factors to these increases to limit charges for transitional and obsolete tariffs falling
further below cost in dollar terms.75 Escalation factors of 1.1, 1.25 or 1.5 were applied, depending
on the gap between customer bills under transitional and obsolete tariffs, and corresponding
standard business tariffs. Where most customer bills would likely be impacted by 10 per cent or
less, an escalation factor of 1.1 was applied; where impacts were between 10 per cent and 100
per cent, an escalation factor of 1.25 was applied; and where impacts exceeded 100 per cent, an
escalation factor of 1.5 was applied.
In the 2015–16 determination, the charges in standard business tariffs fell slightly. We
determined that maintaining charges in transitional and obsolete tariffs at their 2014–15 levels
would be sufficient to limit these charges from falling further below cost in dollar terms.
Bundaberg Regional Irrigators Group, Canegrowers and Canegrowers Isis highlighted the impact
of significant price increases in previous years on their members' operations. Canegrowers stated
increases in transitional tariffs would exacerbate what they consider to be an already
unsustainable regulated price structure. Canegrowers Isis highlighted that a recent study had
shown that it was more economical to run a diesel irrigation pump than an electric pump on tariff
22A.
Canegrowers and Cotton Australia stated that further increases in transitional tariffs were
unjustified. Canegrowers and Pioneer Cane Growers Organisation (PCGO) disputed that irrigation
tariffs (tariffs 62, 65 and 66) were below cost. PCGO argued that, as a number of irrigators may
pay less on tariff 20 or 22A, escalation factors were not warranted. Cotton Australia opposed the
escalation of transitional tariffs.
QCA position
We have decided to increase transitional and obsolete tariffs in line with increases in standard
business tariffs, and apply an escalation factor of 1.1 to limit charges for transitional and obsolete
tariffs falling further below cost in dollar terms.
Table 14 maps transitional and obsolete tariffs to small and large customer tariffs and shows the
percentage increase in the standard business tariffs in 2016–17. Unlike previous determinations,
we have used only small business tariff 20 as the basis for escalating small customer transitional
tariffs 21, 62, 65 and 66, rather than the combination of tariff 20 and tariff 22. This is because
75 As any given percentage increase in a higher (such as a standard business tariff) bill will be greater in dollar
terms than the same percentage increase in a smaller (such as a transitional or obsolete tariff) bill. For example, if two bills of $1,000 and $2,000 each increased by 10% to $1,100 and $2,200 respectively, the dollar difference between the two bills would increase from $1,000 to $1,100.
Public Record Exhibit 6
238

Queensland Competition Authority Transitional arrangements
55
tariff 22 is no longer suitable as a benchmark, as it is now an obsolete tariff which customers on
transitional tariffs are not able to access. While small business customers on obsolete and
transitional tariffs also have access to a seasonal time-of-use tariff, tariff 22A, we also do not
consider this to be an appropriate benchmark, as charges under this tariff are adjusted by the
QCA based on the price level of tariff 20.76
Table 14 Alignment of tariffs and underlying cost increases
Standard business tariff Standard business tariff annual bill increase
Transitional or obsolete tariff
Tariff 20 11.2% Tariffs 21, 62, 65, 66
Tariffs 44–46a 12.0%b Tariffs 20 (large), 22 (small and large), 37c
a The most appropriate tariff depends on the customer's demand and voltage requirements.
b This is the average of typical customer bill increases across tariffs 44, 45 and 46. Tariffs 47 and 48 are omitted because only a very small number of customers are on these tariffs, which may skew the results.
c Small customers on tariff 37 will most likely move to tariff 20 or 22A; however, as most customers on this tariff are large, it is aligned with the large customer tariffs for this purpose.
Table 15 summarises the likely percentage impacts on electricity bills for customers on each
transitional and obsolete tariff moving to an equivalent standard business tariff (see Appendix E
for further details). Applying escalation factors consistent with previous determinations would
result in the QCA applying escalation factors of 1.25 or 1.5 to 2016–17 standard business tariff
increases for most transitional and obsolete tariffs.77
76 See Chapter 3. 77 Tariffs 62 and 65 would have an escalation factor of 1.1 under the approach in previous determinations.
Public Record Exhibit 6
239

Queensland Competition Authority Transitional arrangements
56
Table 15 Likely impact on electricity bills for customers on transitional and obsolete tariffs moving to equivalent standard business tariffs in 2015–16
Transitional tariff
Standard business tariff
Percentage of customers who
would experience
reduced bills
Percentage of customers who would
experience less than 10%
increase in bills
Percentage of customers who would experience
10% to 100% increase in
bills
Percentage of customers who would experience
greater than 100% increase
in bills
Tariff 20 (large) Tariff 44 to 46a 8.2% 18.6% 73.2% 0.0%
Tariff 21 Tariff 20 7.0% 9.0% 39.0% 45.0%
Tariff 22 (large) Tariff 44 to 46a 2.3% 5.8% 91.9% 0.0%
Tariff 37 Tariff 20 11.5% 45.5% 39.0% 4.0%
Tariff 22A 59.5% 24.0% 13.0% 3.5%
Tariff 44 to 46a 0.0% 0.0% 100.0% 0.0%
Tariff 62 Tariff 20 29.0% 16.6% 53.8% 0.6%
Tariff 22A 36.2% 13.4% 48.2% 2.2%
Tariff 44 to 46a 2.1% 4.1% 93.8% 0.0%
Tariff 65 Tariff 20 38.9% 20.8% 40.0% 0.3%
Tariff 22A 61.7% 12.2% 24.9% 1.2%
Tariff 44 to 46a 0.0% 1.6% 98.4% 0.0%
Tariff 66 Tariff 20 50.5% 20.3% 29.2% 0.0%
Tariff 22A 73.0% 19.1% 7.8% 0.1%
Tariff 44 to 46a 0.0% 0.0% 100.0% 0.0%
a Standard business tariff determined based on individual customer usage and demand levels.
Note: Ergon Retail data applies a derived demand profile for customers where demand data is unavailable. Cost impacts may be over- or understated for individual customers depending on their unique demand profile.
Source: QCA analysis of Ergon Retail data.
We disagree with suggestions that transitional and obsolete tariffs should not be increased at all,
or that escalation factors are unwarranted. As discussed above, Ergon Retail analysis shows that
while a number of customers may pay lower prices on standard business tariffs, there are some
customers on transitional tariffs, particularly those with higher usage levels, who pay significantly
less than they would pay on standard business tariffs. As standard business tariffs are estimated
to increase in 2016–17, leaving transitional and obsolete tariffs unchanged, and not applying
escalation factors, would result in charges for most of these customers falling further below cost.
This would risk encouraging further uneconomic investment, and leaving customers further away
from standard business tariffs at the end of the transitional period.
Having said that, we acknowledge stakeholders' concerns about price increases in previous years
and the impact that further price increases may have on their businesses. For this reason, we
have decided not to apply the higher escalation factors of 1.25 and 1.5 used previously, and
instead apply only the lower escalation factor of 1.1 to all transitional and obsolete tariffs. We
note that this will result in more customers facing price increases at the end of the transitional
period than if higher escalation factors were applied.
Public Record Exhibit 6
240

Queensland Competition Authority Transitional arrangements
57
As noted by the PCGO, a number of customers on transitional tariffs, especially those with lower
levels of consumption, could pay less by changing to a flat standard business tariff, like tariff 20.
It is possible that some customers could also benefit from time-of-use or demand tariffs.
However, we note that the need to install appropriate meters may be deterring some customers.
We encourage customers on transitional tariffs to contact their retailer about options they may
have to save on their electricity costs.78
7.2 2016–17 transitional arrangements
A summary of transitional arrangements for 2016–17 is provided in Table 16.
Table 16 Transitional arrangements for 2016–17
Obsolete or transitional tariff Period to be retained 2016–17 price increase
Tariff 20 (large)—transitional 4 years 13.2%
Tariff 21—transitional 4 years 12.3%
Tariff 22 (small and large)—transitional 4 years 13.2%
Tariff 37—obsolete 4 years 13.2%
Tariff 62—transitional 4 years 12.3%
Tariff 65—transitional 4 years 12.3%
Tariff 66—transitional 4 years 12.3%
78 We understand Ergon Retail wrote to around 2,000 customers in this situation to encourage them to change
to standard business tariffs and lower their electricity costs. However, less than 100 of those contacted opted to do so.
Public Record Exhibit 6
241

Queensland Competition Authority Final determination
58
8 FINAL DETERMINATION
This chapter sets out our final determination of regulated retail electricity prices (notified prices)
to apply from 1 July 2016 to 30 June 2017, as well as customer impacts.
Under the network plus retail (N+R) approach, retail tariffs are aligned with network tariffs
approved by the AER. For the final determination Energex and Ergon Energy have provided 2016–
17 network tariffs and charges (as submitted to the AER). The network tariffs used to develop
retail tariffs are discussed in Chapter 3.
Chapters 4, 5 and 6 set out our decisions on energy costs, retail costs and other costs, which
comprise the R component of the retail tariff calculation.
Chapter 7 sets out our decisions on notified prices and transitional arrangements for retail tariffs
that have been declared transitional or obsolete.
The regulated retail tariffs and notified prices are published in a tariff schedule, which includes
other information, including the eligibility criteria and terms and conditions for each tariff. The
tariff schedule for 2016–17 is provided in Appendix G.
The following tables set out our final determination of regulated retail tariffs and prices for 2016–
17. All tariffs are presented exclusive of goods and services tax (GST).
Table 17 2016–17 Regulated retail tariffs and prices for residential customers (excl GST)
Retail tariff Fixed chargea
Usage charge (peak)
Usage charge
(flat/off-peak)
Demand charge (peak)
Demand charge
(off-peak)
c/day c/kWh c/kWh $/kW/mth $/kW/mth
Tariff 11 - Residential (flat rate) 89.572 24.610
Tariff 12A - Residential (time-of-use)b
101.306 55.865 19.859
Tariff 14 - Residential (time-of-use demand)c
60.514 14.984 61.790 11.258
Tariff 31 - Night rate (super economy)
14.423
Tariff 33 - Controlled supply (economy)
19.960
a. Charged per metering point.
b. Peak – 3:00pm to 9:30pm (December, January and February); off peak - all other times.
c. Peak demand – 3:00pm to 9:30pm (December, January and February); off peak demand - 3:00pm to 9:30pm (March to November).
Public Record Exhibit 6
242

Queensland Competition Authority Final determination
59
Table 18 2016–17 Regulated retail tariffs and prices for small business and unmetered supply customers, other than street lighting (excl GST)
Retail tariff Fixed chargea
Usage charge (peak)
Usage charge
(flat/off-peak)
Demand charge (peak)
Demand charge
(off-peak/flat)
c/day c/kWh c/kWh $/kW/mth $/kW/mth
Tariff 20 - Business (flat rate) 127.879 25.968
Tariff 22 - Business (time-of-use) (transitional)b
127.879 28.229 22.648
Tariff 22A - Business (time-of-use)c
127.879 47.258 23.303
Tariff 24 - Business (time-of-use demand)d
78.046 16.299 84.804 13.935
Tariff 41 - Low voltage (demand)
610.984 13.615 28.841
Tariff 91 - Unmetered 23.376
a. Charged per metering point.
b. Peak - 7:00am to 9:00pm, weekdays; off-peak - all other times. This tariff is only available to customers who were supplied under Tariff 22 at 30 June 2015.
c. Peak - 10:00am to 8:00pm on weekdays (December, January and February); off-peak - all other times.
d. Peak demand - 10:00am to 8:00pm on weekdays (December, January and February); off peak demand - 10:00am to 8:00pm on weekdays (March to November).
Public Record Exhibit 6
243

Queensland Competition Authority Final determination
60
Table 19 2016–17 Regulated retail tariffs and prices for large business and street lighting customers (excl GST)
Retail tariff Fixed charge
Usage charge (peak)
Usage charge (flat/off-
peak)
Demand charge
(peak)
Demand charge
(off-peak/flat)
c/day c/kWh c/kWh $/kW/mth $/kW/mth
Tariff 44 - Over 100 MWh small (demand)
5314.202 12.302 39.863
Tariff 45 - Over 100 MWh medium (demand)
16662.167 12.393 31.647
Tariff 46 - Over 100 MWh large (demand)
44351.904 12.599 28.123
Tariff 47 - High voltage (demand)
41533.203 11.567 25.896
Tariff 48 - Over 4 GWh high voltage (demand)
41969.578 11.567 25.896
Tariff 50 - Over 100 MWh seasonal time-of-use (demand)a
4493.324 11.832 15.266 61.203 14.761
Tariff 71 - Street lightingb
0.735 31.503
a. Peak demand charged on maximum metered demand exceeding 20 kilowatts on weekdays between 10:00am to 8:00pm in Summer months (December, January and February). Off-peak demand charged on maximum metered demand exceeding 40 kilowatts during non-summer months (March to November). Peak usage charged on all usage in Summer months (December, January and February). Off-peak usage charged on all usage during non-summer months (March to November).
b. The fixed charge for street lighting applies to each lamp.
Table 20 2016–17 Transitional and obsolete regulated retail tariffs and prices (excl GST)
Retail tariff Fixed charge
Min Charge
Usage rate 1b
Usage rate 2c
Usage rate 3d
Usage rate (flat)
Capacity (Up to 7.5kw)
Capacity (Over
7.5kw)
c/day c/day c/kWh c/kWh c/kWh c/kWh $/kW/yr $/kW/yr
Tariff 37a 28.460 20.267 50.691
Tariff 20 (lge) 71.429 34.940
Tariff 21 69.107 46.962 44.124 33.590
Tariff 22 171.670 46.301 16.304
Tariff 62 74.644 44.259 37.427 15.650
Tariff 65 74.644 35.305 19.446
Tariff 66 164.512 18.505 35.888 107.903
a. Tariff 37 became obsolete on 1 July 2007. It is only available to customers taking supply under tariff 37 on 30 June 2007.
b. Tariff 21 – first 100 kWh, tariff 22 – 7am-9pm M-F, tariff 37 – 10:30pm-4:30pm, tariff 62 – 7am-9pm M-F first 10,000kWh, tariff 65 – 12hr peak.
c. Tariff 21 – 101-10,000 kWh, tariff 62 – 7am-9pm M-F over 10,000kWh.
d. Tariff 21 – over 10,000 kWh, tariff 22 – all other times, tariff 37 – 4:30pm-10:30pm, tariffs 62, & 65 – all other times.
Public Record Exhibit 6
244

Queensland Competition Authority Final determination
61
8.1 Customer impacts
Impacts on residential customers79
The main retail tariff for residential customers is tariff 11. Many customers on tariff 11 are also
on one of the 'off-peak' or 'controlled load' tariffs (tariffs 31 and 33) for uses such as water heating
and pool pumps.
In 2016–17, the annual bill for a typical customer on tariff 11 will increase by 2.8 per cent from
$1,457 to $1,498. For a typical customer on a combination of tariffs 11 and 31 or tariffs 11 and
33, the increases will be slightly higher (4.8 per cent and 3.1 per cent respectively). However, the
impact on individual customers will vary depending on their consumption. As Table 21 below
shows, annual bills for tariff 11 customers with lower consumption than the typical customer will
either decrease or increase by less than 2.8 per cent. Almost one-third of customers on tariff 11
will face lower annual bills in 2016–17 compared to 2015–16. Annual bills for tariff 11 customers
with higher consumption than the typical customer will increase by more than 2.8 per cent.
Table 21 Changes in electricity bills in 2016-17 for tariff 11 customers (GST inclusive)
Description Annual consumption
(kWh)
2015-16 Annual Bill
($)
2016-17 Annual Bill
($)
Changes
($)
Changes
(%)
25th Percentile usagea 2055 $931.50 $916.19 -$15.31 -1.6%
Median usageb 4203 $1,456.94 $1,497.67 $40.74 2.8%
75th Percentile usagec 6412 $1,997.30 $2,095.67 $98.37 4.9%
a One quarter of regional Queensland customers will use less electricity than the 25th percentile customer.
b Half of regional Queensland customers will use less electricity than the median customer.
c Three quarters of regional Queensland customers will use less electricity than the 75th percentile customer.
Note: 25th percentile, median and 75th percentile usage data for regional Queensland customers are supplied by Ergon Retail, who calculate these figures based on all their customers on the stated tariff(s). See Appendix H for more information. Totals may not add up due to rounding.
The increase in typical tariff 11 customer bills is primarily due to higher energy costs. Our
consultant, ACIL, advised that the rise in energy costs is driven largely by increasing demand from
liquefied natural gas plants, and higher Renewable Energy Target costs. Some of the impact of
higher energy costs has been offset by a decrease in network costs. For lower consumption
customers, the outcome of the review of retail costs has also helped to offset the impacts of
higher energy costs as it has reduced the level of fixed retail costs.
79 The bill impacts presented are based on typical levels of consumption. The typical customer data was
supplied by Ergon Retail and represents the median customer for all customers on the stated tariff. See Appendix H for further information. Please note that the annual bill amounts in Figure 12 have been rounded to the closest dollar.
Public Record Exhibit 6
245

Queensland Competition Authority Final determination
62
Figure 12 Annual bills for typical residential customers (GST inclusive)
Table 22 Tariff 11 charges (GST exclusive)
2015–16 Final Determination
2016–17 Final Determination
Change (%)
Fixed charge (cents/day) 106.728 89.572 -16.1%
Variable charge (cents/kWh) 22.238 24.610 10.7%
Impacts on small business customers80
In 2016–17, typical customers on the main small business tariff (tariff 20) will face an increase of
$23681 or 11.2 per cent in their annual bill. Typical small business customers on the seasonal
time-of-use tariff (tariff 22A) will face an increase of $660 or 15.8 per cent. These increases have
been driven primarily by higher energy costs and retail costs. Bill impacts will vary depending on
each individual customer's level and pattern of consumption.
80 The bill impacts presented are based on typical levels and patterns of consumption. The typical customer
data is supplied by Ergon Retail and represents the median customer for all customers on the stated tariff. See Appendix H for further information.
81 Please note that this figure does not equal the difference between the annual bill amounts for tariff 20 in Figure 13 ($235), due to rounding of the amounts in Figure 13.
$1,457
$1,744 $1,750
$1,498
$1,828 $1,806
$600
$700
$800
$900
$1,000
$1,100
$1,200
$1,300
$1,400
$1,500
$1,600
$1,700
$1,800
$1,900
T11 T11 + T31 T11 + T33
2015-16 Annual Bill 2016-17 Annual Bill
Public Record Exhibit 6
246

Queensland Competition Authority Final determination
63
Figure 13 Annual bills for typical small business customers (GST inclusive)
Impacts on large business customers82
In 2016–17, typical large business customers will face increases in their annual bills of between
11.8 per cent and 12.2 per cent. The increases have been driven primarily by higher energy costs
and network costs. Bill impacts will vary depending on each individual customer's level and
pattern of consumption.
82 The bill impacts presented are based on typical levels and patterns of consumption. The typical customer
data was supplied by Ergon Retail and represents the median customer for all customers on the stated tariff. See Appendix H for further information. Please note that the annual bill amounts in Figure 14 have been rounded to the closest dollar.
$2,113
$4,186
$2,348
$4,846
$-
$1,000
$2,000
$3,000
$4,000
$5,000
$6,000
T20 T22A
2015-16 Annual Bill 2016-17 Annual Bill
Public Record Exhibit 6
247

Queensland Competition Authority Final determination
64
Figure 14 Annual bills for typical large business customers (GST inclusive)
Arrangements for customers on obsolete and transitional tariffs
Some business customers are supplied under transitional or obsolete tariffs, which include
farming and irrigation tariffs. These tariffs have been made available for several years to allow
customers to transition to standard business tariffs and recoup some of the investments made to
suit the level and structure of transitional or obsolete tariffs. Based on information from Ergon
Retail, many customers on these tariffs may face lower electricity bills if they moved to a standard
business tariff, but some customers would face much higher bills.
We have maintained transitional arrangements for 2016–17. Our general approach in past
determinations has been to increase the charges in each transitional and obsolete tariff in line
with the percentage increases in the standard business tariffs customers would otherwise pay.
We have then generally applied an additional escalation factor to limit charges for transitional
and obsolete tariffs falling further below cost in dollar terms.
Standard business tariffs will increase in 2016–17 so transitional and obsolete tariffs will also need
to increase. Under our general approach in previous determinations, the escalation factors for
most of these tariffs in 2016–17 would be 1.25 or 1.5.
However, given the substantial price increases that customers on transitional and obsolete tariffs
have experienced in recent years and that customers on these tariffs are more than halfway
through the transition to standard business tariffs, we have decided to apply the minimum
escalation factor of 1.1. This means customers on these tariffs will face increases of between
12.3 per cent and 13.2 per cent in 2016–17 rather than up to 16.8 per cent if the higher escalation
factors were applied.
New customers will also continue to be allowed to access transitional tariffs.
$50,609
$181,043
$449,584
$56,639
$203,138
$502,759
$-
$100,000
$200,000
$300,000
$400,000
$500,000
$600,000
T44 T45 T46
2015-16 Annual Bill 2016-17 Annual Bill
Public Record Exhibit 6
248

Queensland Competition Authority Final determination
65
Table 23 Transitional arrangements for 2016–17
Obsolete or transitional tariff Period to be retained 2016–17 price increase
Tariff 20 (large) –transitional 4 years 13.2%
Tariff 21–transitional 4 years 12.3%
Tariff 22 (small and large) –transitional 4 years 13.2%
Tariff 37–obsolete 4 years 13.2%
Tariff 62–transitional 4 years 12.3%
Tariff 65–transitional 4 years 12.3%
Tariff 66–transitional 4 years 12.3%
Public Record Exhibit 6
249

Queensland Competition Authority Acronyms
66
ACRONYMS
A
AEMC Australian Energy Market Commission
AEMO Australian Energy Market Operator
AER Australian Energy Regulator
AFMA Australian Financial Markets Association
B
BRCI Benchmark Retail Cost Index
C
CARC Customer acquisition and retention costs
CPI Consumer Price Index
c/day cents per day
E
Ergon Distribution Ergon Energy Corporation Limited (electricity distribution arm)
Ergon Retail Ergon Energy Queensland (electricity retail arm)
Electricity Act Electricity Act 1994 (Qld)
G
GST Goods and services tax
GWh Gigawatt hour
Government Queensland Government
I
IPART Independent Pricing and Regulatory Tribunal
J
K
kWh Kilowatt hour
kVA Kilovolt Ampere
L
LGC Large-scale generation certificate
LNG Liquefied natural gas
LRET Large-scale Renewable Energy Target
M
Minister Minister for Energy and Water Supply
MWh Megawatt hour
Public Record Exhibit 6
250
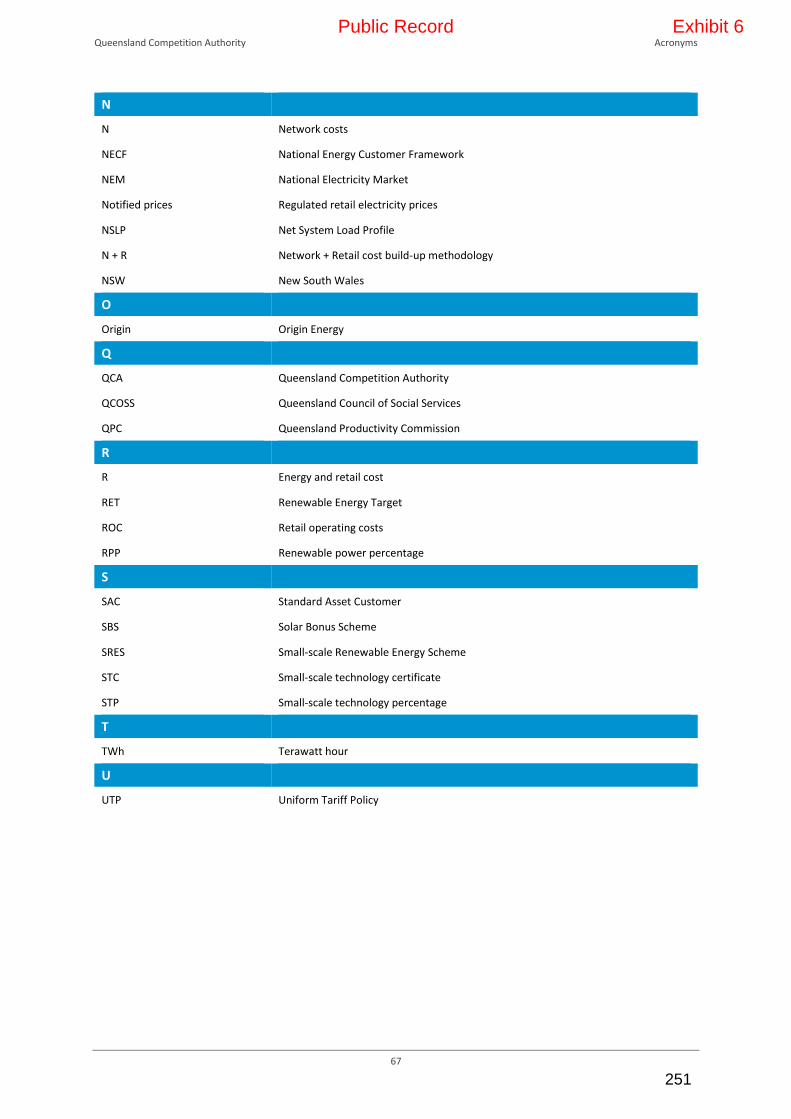
Queensland Competition Authority Acronyms
67
N
N Network costs
NECF National Energy Customer Framework
NEM National Electricity Market
Notified prices Regulated retail electricity prices
NSLP Net System Load Profile
N + R Network + Retail cost build-up methodology
NSW New South Wales
O
Origin Origin Energy
Q
QCA Queensland Competition Authority
QCOSS Queensland Council of Social Services
QPC Queensland Productivity Commission
R
R Energy and retail cost
RET Renewable Energy Target
ROC Retail operating costs
RPP Renewable power percentage
S
SAC Standard Asset Customer
SBS Solar Bonus Scheme
SRES Small-scale Renewable Energy Scheme
STC Small-scale technology certificate
STP Small-scale technology percentage
T
TWh Terawatt hour
U
UTP Uniform Tariff Policy
Public Record Exhibit 6
251

Queensland Competition Authority Acronyms
68
APPENDIX A: MINISTERIAL DELEGATION AND COVER LETTER
Public Record Exhibit 6
252

Queensland Competition Authority Acronyms
69
Public Record Exhibit 6
253

Queensland Competition Authority Acronyms
70
Public Record Exhibit 6
254

Queensland Competition Authority Acronyms
71
Public Record Exhibit 6
255

Queensland Competition Authority Acronyms
72
Public Record Exhibit 6
256

Queensland Competition Authority Acronyms
73
Public Record Exhibit 6
257

Queensland Competition Authority Acronyms
74
APPENDIX B: SUBMISSIONS
Submissions to the interim consultation paper
Organisation
Bundaberg Regional Irrigators Group
Canegrowers
Canegrowers Isis
Cotton Australia
Ergon Energy Corporation Ltd
Ergon Energy Queensland Pty Ltd
Master Electricians Australia
Origin Energy
Queensland Consumers' Association
Queensland Council of Social Services
Queensland Farmers' Federation
Toowoomba Regional Council
Public Record Exhibit 6
258
Queensland Competition Authority Acronyms
75
Submissions to the draft determination
Organisation
AFL Cairns
Australian Chocolate Pty Ltd
Australians in Retirement
Axiom A1 Advice Services
Banora International Group
Big4 Atherton Woodlands Tourist Park
Birdwing Business Solutions
Blazing Saddles
Blenners Transport
Cairns Chamber of Commerce
Cairns Coconut Holiday Resort (G Olholm)
Cairns Coconut Holiday Resort (K Thomas)
Cairns Hockey Association
Cairns Tropical Gardens
Canegrowers
Canegrowers Isis
Chamber of Commerce and Industry
Queensland
Coffee Bean Estate
COTA Queensland
Coral Coast Catering
Cotton Australia
D Hyde
D Simpson
Eaglerider Cairns
Energy Guru
Ergon Energy Corporation Limited (Ergon
Distribution)
Ergon Energy Queensland (Ergon Retail)
Expressway Signs and Printworks
Far North Queensland Electricity Users
Network
Future Investment Group
Genesis Engineering (NQ) Pty Ltd
Golden Boat Chinese Restaurant
Gordon Gould Ipson Architects
H Crossley
Independent Capital Advisers
Kurrimine Beach Holiday Park
Local Government Association of Queensland
M Avolio
M Kitchen
Minister for Energy and Water Supply
Missing Link Pty Ltd
Mission Beach Dive - Mission Beach Dunk
Island Water Taxi
Moeba
Mt Ruby Station
Mungalli Falls Outdoor Education Centre
Natural Resource Assessments Pty Ltd
NQ Exhibitions
Oriental and Gourmet Store
Origin Energy
Pioneer Cane Growers Organisation Limited
Primo Produce
QCOSS
Queensland Consumers Association
Queensland Farmers Federation
Sanreef Pty Ltd
Sarayi Boutique Hotel
Savannah Productions
Sunshine Day Care Centre
T Bowater
T Buzolich
The Jade Cosmetic Clinic
The Reef Retreat - Palm Cove
Thirkell Consulting Engineers
Townsville City Council
Union Jack Hotel
Warrawong Lodge
Wavelength Reef Cruises
Worklife Directions
Confidential submission
Public Record Exhibit 6
259

Queensland Competition Authority Appendix C: Responses to additional issues raised in submissions
76
APPENDIX C: RESPONSES TO ADDITIONAL ISSUES RAISED IN
SUBMISSIONS
In this section we provide responses to a number of additional issues raised in submissions, which were not
addressed in our final decision.
83 http://www.qpc.qld.gov.au/. 84 http://www.qpc.qld.gov.au/. 85 http://www.qpc.qld.gov.au/.
Issue Stakeholder QCA position
The QCA has not complied with monopoly investigation provisions of the Queensland Competition Authority Act 1997 (QCA Act), including having regard to social welfare and equity considerations and economic and regional development issues.
Australians in Retirement
FNQEUN
The QCA determines notified prices under the Electricity Act.
The monopoly investigation provisions of the QCA Act referred to in submissions do not apply when the QCA is determining notified prices.
Specific network tariffs should be introduced to cater for food and fibre producers.
Bundaberg Regional Irrigators Group
Canegrowers
The QCA has no role in setting network tariffs. Network tariffs are established by distributors and approved by the Australian Energy Regulator (AER).
The Queensland Productivity Commission (QPC) is conducting an inquiry into electricity pricing and will make recommendations to the Queensland Government on a range of electricity issues, including those relevant to agricultural customers. Further information can be found on the QPC's website.83
The QCA should recommend the regulated asset base of distributors be revalued.
Bundaberg Regional Irrigators Group
The QCA has no role in determining distributor regulated asset bases. This issue is a matter for the AER and the distribution businesses.
The QPC is conducting an inquiry into electricity pricing and will make recommendations to the Queensland Government on a range of electricity issues, including on network costs. Further information can be found on the QPC's website.84
The QCA should recommend the solar feed-in tariff be funded out of general government revenue.
Bundaberg Regional Irrigators Group
Canegrowers
The QCA has no role in determining how the solar bonus scheme is funded. This is a matter for the Queensland Government and distribution businesses.
We note that the QPC is conducting inquiries into electricity pricing and solar feed-in pricing and will make recommendations to the Queensland Government on a range of issues around solar and its impact on other electricity users. Further information can be found on the QPC's website.85
Public Record Exhibit 6
260

Queensland Competition Authority Appendix C: Responses to additional issues raised in submissions
77
86 http://www.aemc.gov.au/. 87 http://www.qpc.qld.gov.au/. 88 http://www.qpc.qld.gov.au/.
The QCA should investigate the impact of Queensland energy companies gaming the system to maximise their profitability, and adjust all energy cost estimates to compensate for reported generator rebidding behaviour.
Bundaberg Regional Irrigators Group
Canegrowers
ACIL has considered this issue as part of their estimation of energy costs. It is discussed in chapter 3 of ACIL's final report.
The QCA has no role in regulating the conduct of generators in the National Electricity Market. The Australian Energy Market Commission (AEMC) has investigated reports of generator re-bidding, and has made changes to the National Electricity Rules in response. Further information can be found at the AEMC website.86
The QPC is also considering this issue as part of its inquiry into electricity pricing and will make recommendations to the Queensland Government. Further information can be found on the QPC's website.87
There needs to be further investigation into alternative tariffs for irrigated agriculture, including controlled supply options.
Canegrowers Isis The QCA has no role in setting network tariffs or determining customer eligibility for specific network tariffs. Network tariffs, and their eligibility requirements, are established by the distributors and approved by the AER.
Costs for the solar bonus scheme should not be borne by irrigators as they do not have the ability to participate.
Canegrowers Isis The QCA has no role in determining the funding arrangements for the solar bonus scheme. This is a matter for the Queensland Government and distribution businesses.
The allocation of solar bonus scheme costs across tariff classes is determined by distributors and approved by the AER.
The costs of the solar bonus scheme should be paid per connection or from general revenue to prevent large industrial users and irrigators paying a disproportionate amount of its cost.
Canegrowers Isis The QCA has no role in determining the funding arrangements for the solar bonus scheme. This is a matter for the Queensland Government and distribution businesses.
The QCA should write to the Minister for Energy and Water Supply to request changes to the definition of the UTP.
Cotton Australia The Queensland Government is responsible for determining the definition of, and the level of subsidy provided by, the UTP.
The QPC is conducting an inquiry into electricity pricing and will make recommendations to the Queensland Government on a range of issues including the UTP. Further information can be found on the QPC's website.88
The QCA should inform the Queensland Government that it must take into consideration the affordability of electricity.
FNQEUN The QCA must set notified prices in accordance with the requirements of the Electricity Act and the Minister's delegation. Chapter 2 outlines legal requirements for the QCA when determining notified prices under the Electricity Act.
The Government has considered affordability issues through implementing and maintaining the UTP, which subsidises electricity prices for regional customers. The notified prices set by the QCA are consistent with the UTP.
Public Record Exhibit 6
261

Queensland Competition Authority Appendix C: Responses to additional issues raised in submissions
78
89 http://www.qpc.qld.gov.au/. 90 http://www.qpc.qld.gov.au/.
The QPC is the appropriate body to recommend changes to the pricing framework. The QPC is conducting an inquiry into electricity pricing and will make recommendations to the Queensland Government on a range of electricity issues, including the framework under which notified prices are determined. Further information can be found on the QPC's website.89
The requirement for controlled load appliances to be hard-wired to electrical systems should be removed to encourage greater take up of controlled load tariffs.
Master Electricians Australia
The terms and conditions of the controlled load retail tariffs reflect the terms and conditions of the underlying network tariffs.
Network tariffs, and their eligibility requirements, are established by distributors and approved by the AER.
A tariff structure should be introduced to reward users of battery banks for solar PV. This tariff structure could be similar to a maximum demand tariff.
Master Electricians Australia
The QCA has no role in determining the availability, or structure, of demand tariffs. The availability and structure of network tariffs are determined by the distributors and approved by the AER.
We note that the QPC is examining issues around solar PV and battery storage in its inquiries into electricity pricing and solar feed-in pricing and will make recommendations to the Queensland Government. Further information can be found on the QPC's website.90
Any increase in electricity prices will affect the viability of businesses in regional Queensland.
Multiple submissions The QCA must set notified prices in accordance with the requirements of the Electricity Act and the Minister's delegation. Chapter 2 outlines legal requirements for the QCA when determining notified prices under the Electricity Act.
The Government has considered affordability issues through implementing and maintaining the UTP, which subsidises electricity prices for regional customers. The notified prices set by the QCA are consistent with the UTP.
The QCA should show the impacts on bills for a range of customer consumption levels and for different regional centres.
QCOSS
Townsville Water and Waste
The QCA has included bill impacts for customers who use more (75th percentile) than the typical (median) customer, as well as customers who use less (25th percentile). See Appendix H for more information.
The QCA should include metering costs in bill impacts and fact sheets.
QCOSS The QCA provides information to show the impact on customer bills of the QCA's determination on notified prices. As metering charges do not form part of our determination on notified prices (see Chapter 2), and are not determined by the QCA, we do not consider it appropriate to include them in our customer impact analysis.
Public Record Exhibit 6
262

Queensland Competition Authority Appendix D: Network tariff structures
79
APPENDIX D: NETWORK TARIFF STRUCTURES
This appendix provides further information on decisions made in Chapter 3. This appendix compares
Energex and Ergon Distribution network tariff structures and outlines how tariffs are adjusted to make them
consistent with the UTP.
Comparison of Energex and Ergon Energy's tariff structures
Table 24 Comparison of Energex and Ergon Distribution residential and small business customer time-of-use and demand tariffs
Distributor Peak Shoulder Off-peak
Residential (time-of-use)
Energex
(retail tariff 12)
Usage 4 pm–8 pm Mon–Fri
1,044 hours per year
7 am–4 pm, 8 pm–10 pm Mon–Fri
7 am–10 pm weekends
4,431 hours per year
10 pm–7 am every day
3,285 hours per year
Ergon Distribution
(retail tariff 12A)
Usage 3 pm–9:30 pm any day of the week, summera only
585 hours per year
All other times
8,175 hours per year
Residential (time-of-use and demand)
Energex
(to be introduced on 1 July 2016)
Usage Flat usage charge
Demand 4 pm–8 pm weekdays
1,044 hours per year
Ergon Distribution
(retail tariff 14)
Usage Flat usage charge
Demand 3 pm–9:30 pm any day of the week, summera months only
585 hours per year
3 pm–9:30 pm any day of the week, non-summera months
1755 hours per year
Small business (time-of-use)
Energex
(retail tariff 22)
Usage 7 am–9 pm, week days
3,654 hours per year
All other times
5,106 hours per year
Ergon Distribution
(retail tariff 22A)
Usage 10 am–8 pm on summera week days
540 hours per year
All other times
8,120 hours per year
Small business (time-of-use demand)
Energex No network tariff.
Ergon Distribution
(retail tariff 24)
Usage Flat usage charge
Demand 10 am–8 pm on summera weekdays
540 hours per year
10 am–8 pm weekdays in non-summera months
1620 hours per year
a Summer months are December, January and February.
Public Record Exhibit 6
263

Queensland Competition Authority Appendix D: Network tariff structures
80
Table 25 Comparison of Energex and Ergon Distribution non time-of-use tariffs
Type Distributor Fixed Usage
Residential (tariff 11)
Energex c/day Flat rate c/kWh
Ergon Distribution
c/day c/kWh 1st 1,000 kWh/year
c/kWh next 5,000 kWh/year
c/kWh >6,000 kWh/year
Small business (tariff 20)
Energex c/day Flat rate c/kWh
Ergon Distribution
c/day c/kWh 1st 1,000 kWh/year
c/kWh next 19,000 kWh/year
c/kWh >20,000 kWh/year
Small business demand (tariff 41)
Energex c/day Flat rate c/kWh $/kVA/month
Ergon Distribution
No network tariff
Night controlled load (tariff 31)
Energex n/a Flat rate c/kWh
Ergon Distribution
c/day Flat rate c/kWh
Controlled load (tariff 33)
Energex n/a Flat rate c/kWh
Ergon Distribution
c/day Flat rate c/kWh
Unmetered (tariff 91)
Energex n/a Flat rate c/kWh
Ergon Distribution
c/day Flat rate c/kWh
Note: In the Interim Consultation Paper we advised that Ergon Distribution intended to introduce a new controlled load tariff on 1 July 2016. Ergon Distribution has now advised that this tariff will not be introduced in 2016–17.
Ergon Energy tariff structure options
This section outlines the methodology we used in section 3.2.3 to adjust Ergon Distribution network charges
to reflect Energex price levels. Our approach to this task is generally consistent with that taken in the 2015–
16 determination. The only difference in our approach from 2015–16 is that, due to changes in data
availability and reliability, tariffs 11 and 20 have been used as the reference point for Energex price levels.
Establishing network prices
To calculate network prices that reflect Ergon Distribution tariff structures and Energex price levels, we use
information on network charges provided by the distributors and customer usage data provided by Ergon
Retail. Using this data, we then lower charges under the Ergon Distribution network tariff91 to a level where
the average customer pays the same as they would under the equivalent Energex network tariff.
This calculated network tariff is then used as the basis of a retail tariff.
Seasonal time-of-use tariffs
Ergon Distribution has seasonal time-of-use network tariffs for residential and small business customers.
These form the basis of retail tariffs 12A (residential) and 22A (small business). To create retail tariffs that
reflect Ergon Distribution network tariff structures, while broadly reflecting Energex price levels, the QCA
91 The applicable network tariff for Ergon Distribution's east zone, transmission region one.
Public Record Exhibit 6
264
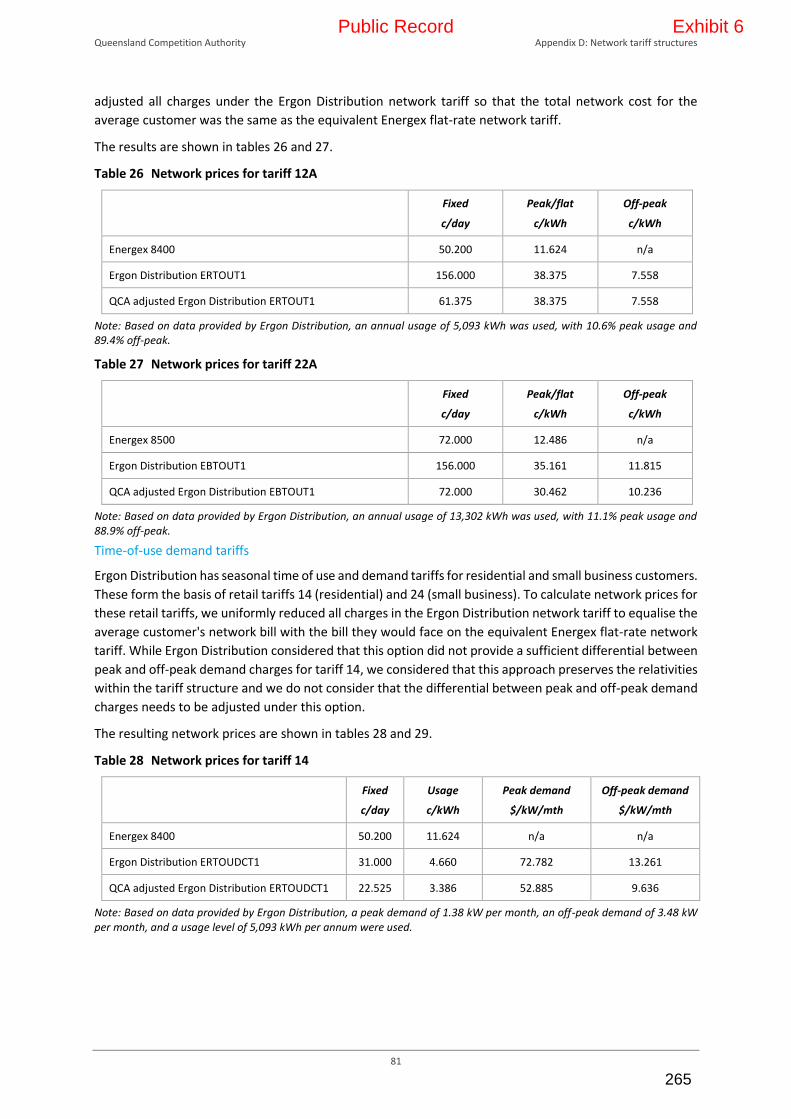
Queensland Competition Authority Appendix D: Network tariff structures
81
adjusted all charges under the Ergon Distribution network tariff so that the total network cost for the
average customer was the same as the equivalent Energex flat-rate network tariff.
The results are shown in tables 26 and 27.
Table 26 Network prices for tariff 12A
Fixed
c/day
Peak/flat
c/kWh
Off-peak
c/kWh
Energex 8400 50.200 11.624 n/a
Ergon Distribution ERTOUT1 156.000 38.375 7.558
QCA adjusted Ergon Distribution ERTOUT1 61.375 38.375 7.558
Note: Based on data provided by Ergon Distribution, an annual usage of 5,093 kWh was used, with 10.6% peak usage and 89.4% off-peak.
Table 27 Network prices for tariff 22A
Fixed
c/day
Peak/flat
c/kWh
Off-peak
c/kWh
Energex 8500 72.000 12.486 n/a
Ergon Distribution EBTOUT1 156.000 35.161 11.815
QCA adjusted Ergon Distribution EBTOUT1 72.000 30.462 10.236
Note: Based on data provided by Ergon Distribution, an annual usage of 13,302 kWh was used, with 11.1% peak usage and 88.9% off-peak.
Time-of-use demand tariffs
Ergon Distribution has seasonal time of use and demand tariffs for residential and small business customers.
These form the basis of retail tariffs 14 (residential) and 24 (small business). To calculate network prices for
these retail tariffs, we uniformly reduced all charges in the Ergon Distribution network tariff to equalise the
average customer's network bill with the bill they would face on the equivalent Energex flat-rate network
tariff. While Ergon Distribution considered that this option did not provide a sufficient differential between
peak and off-peak demand charges for tariff 14, we considered that this approach preserves the relativities
within the tariff structure and we do not consider that the differential between peak and off-peak demand
charges needs to be adjusted under this option.
The resulting network prices are shown in tables 28 and 29.
Table 28 Network prices for tariff 14
Fixed
c/day
Usage
c/kWh
Peak demand
$/kW/mth
Off-peak demand
$/kW/mth
Energex 8400 50.200 11.624 n/a n/a
Ergon Distribution ERTOUDCT1 31.000 4.660 72.782 13.261
QCA adjusted Ergon Distribution ERTOUDCT1 22.525 3.386 52.885 9.636
Note: Based on data provided by Ergon Distribution, a peak demand of 1.38 kW per month, an off-peak demand of 3.48 kW per month, and a usage level of 5,093 kWh per annum were used.
Public Record Exhibit 6
265

Queensland Competition Authority Appendix D: Network tariff structures
82
Table 29 Network prices for tariff 24
Fixed
c/day
Usage
c/kWh
Peak demand
$/kW/mth
Off-peak demand
$/kW/mth
Energex 8500 72.000 12.486 n/a n/a
Ergon Distribution EBTOUDCT1 31.000 5.460 90.448 14.862
QCA adjusted Ergon Distribution EBTOUDCT1 24.540 4.322 71.601 11.765
Note: Based on data provided by Ergon Distribution, a peak demand of 2.9 kW per month, an off-peak demand of 6.02 kW per month, and a usage level of 13,302 kWh per annum were used.
Non time-of-use tariffs
As discussed in Chapter 3, the QCA examined the impact of using Ergon Distribution's inclining block tariff
(IBT) structure as the basis for flat-rate retail tariffs 11 and 20. For the purposes of this assessment, we
calculated network prices by uniformly reducing all charges in the Ergon Distribution network tariff to
equalise the total network revenue recovered by Ergon Distribution under an inclining block tariff with the
network revenue it would have otherwise recovered under a flat rate tariff.
The resulting network prices and charts demonstrating the impact on consumers are shown below.
Table 30 Network prices for tariff 11
Fixed
c/day
Flat/first blocka
c/kWh
Second blockb
c/kWh
Third blockc
c/kWh
Energex 8400 50.200 11.624 n/a n/a
Ergon Distribution ERIBT1 156.000 4.768 11.146 14.904
QCA adjusted Ergon Distribution ERIBT1 107.814 3.295 7.703 10.300
a. All usage under Energex network tariff, usage of less than 2.74 kWh per day under Ergon Distribution network tariff
b. Usage greater than 2.74 kWh per day and less than 16.43 kWh per day (Ergon Distribution network tariff only)
c. All usage above 16.43 kWh per day (Ergon Distribution network tariff only)
Public Record Exhibit 6
266

Queensland Competition Authority Appendix D: Network tariff structures
83
Figure 17 Impact on tariff 11 customers adopting Ergon Distribution inclining block tariff structure
Table 31 Network prices for tariff 20
Fixed
c/day
Flat/first blocka
c/kWh
Second blockb
c/kWh
Third blockc
c/kWh
Energex 8500 72.000 12.486 n/a n/a
Ergon Distribution EBIBT1 156.000 5.180 13.454 17.078
QCA adjusted Ergon Distribution EBIBT1 122.492 4.067 10.564 13.410
a. All usage under Energex network tariff, usage of less than 2.74 kWh per day under Ergon Distribution network tariff
b. Usage greater than 2.74 kWh per day and less than 54.76 kWh per day (Ergon Distribution network tariff only)
c. All usage above 54.76 kWh per day (Ergon Distribution network tariff only)
-10.0%
0.0%
10.0%
20.0%
30.0%
40.0%
50.0%
60.0%
70.0%
0 1,500 3,000 4,500 6,000 7,500 9,000 10,500 12,000 13,500 15,000 16,500 18,000 19,500
0
2,000
4,000
6,000
8,000
10,000
12,000
Ch
ange
s in
an
nu
al b
ill (
%)
kWh/year
Nu
mb
er o
f cu
sto
me
rs
# Customers (RHS) % Change in Annual Bill
3699.06 kWh/annum
44% of customersworse off with T11 IBT
Public Record Exhibit 6
267

Queensland Competition Authority Appendix D: Network tariff structures
84
Figure 18 Impact on tariff 20 customers adopting Ergon Distribution inclining block tariff structure
-10.0%
-5.0%
0.0%
5.0%
10.0%
15.0%
20.0%
25.0%
30.0%
35.0%
40.0%
0 1,750 3,500 5,250 7,000 8,750 10,500 12,250 14,000 15,750 17,500 19,250 21,000 22,750 24,500
0
500
1,000
1,500
2,000
2,500
3,000
3,500
4,000
4,500
5,000
Ch
ange
s in
an
nu
al b
ill (
%)
kWh/year
Nu
mb
er o
f cu
sto
me
rs
# Customers (RHS) % Change in Annual Bill
45.1 % of customersworse off under T20 IBT
5126.72 kWh/annum
Public Record Exhibit 6
268

Queensland Competition Authority Appendix E: Transitional and obsolete tariffs—customer impacts
85
APPENDIX E: TRANSITIONAL AND OBSOLETE TARIFFS—CUSTOMER
IMPACTS
In Chapter 7 we discuss our decision on arrangements for customers on transitional and obsolete retail
tariffs. This appendix contains the analysis of bill impacts for customers moving from their transitional or
obsolete 2015–16 tariff to an alternative 2015–16 standard business tariff.
The customer impacts are calculated on an individual tariff basis. As some customers are supplied under
multiple tariffs, the overall impact to an individual customer may be a combination of the impacts shown
below.
Tariff 21
Tariffs 21 is a declining block tariff that aligns with tariff 20 for small business customers. Figure 19 below
shows the distribution of potential impacts for existing customers moving to this standard business tariff.
Figure 19 Change in electricity bills for small business customers on tariff 21 moving to tariff 20
Source: Ergon Retail
0%
5%
10%
15%
20%
25%
30%
35%
40%
45%
50%
Pro
po
rtio
n o
f C
ust
om
ers
Cost Impact (%)
Public Record Exhibit 6
269
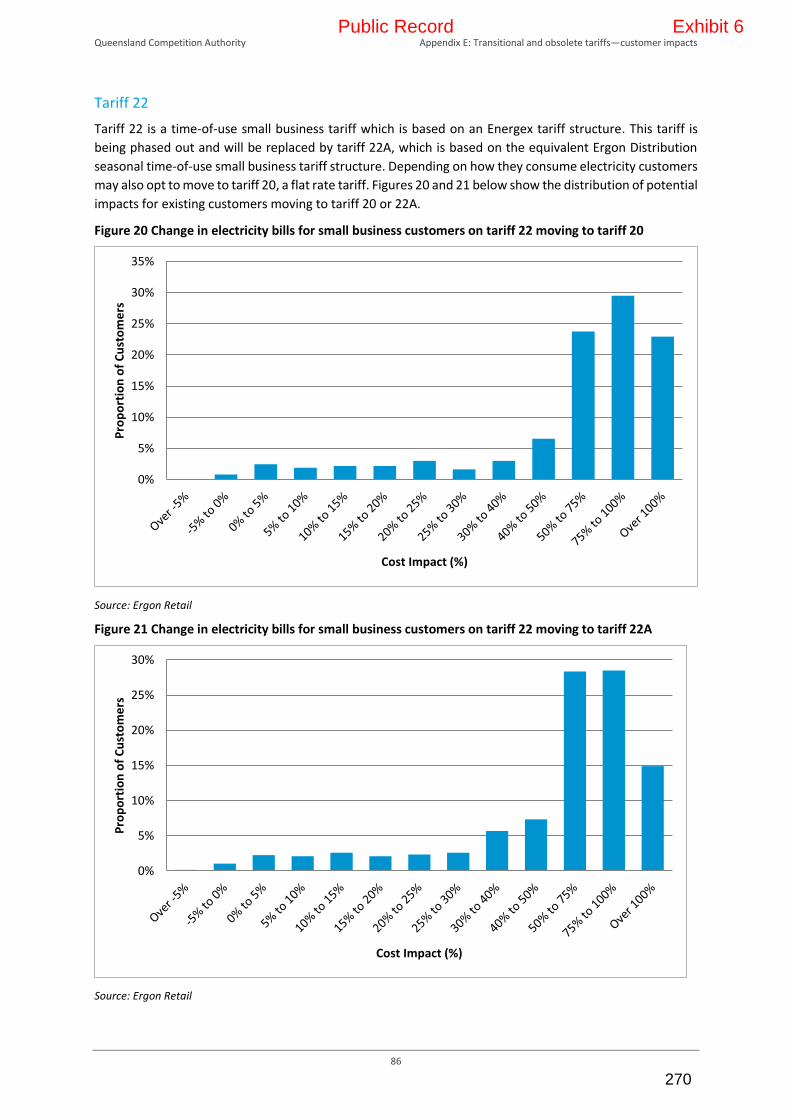
Queensland Competition Authority Appendix E: Transitional and obsolete tariffs—customer impacts
86
Tariff 22
Tariff 22 is a time-of-use small business tariff which is based on an Energex tariff structure. This tariff is
being phased out and will be replaced by tariff 22A, which is based on the equivalent Ergon Distribution
seasonal time-of-use small business tariff structure. Depending on how they consume electricity customers
may also opt to move to tariff 20, a flat rate tariff. Figures 20 and 21 below show the distribution of potential
impacts for existing customers moving to tariff 20 or 22A.
Figure 20 Change in electricity bills for small business customers on tariff 22 moving to tariff 20
Source: Ergon Retail
Figure 21 Change in electricity bills for small business customers on tariff 22 moving to tariff 22A
Source: Ergon Retail
0%
5%
10%
15%
20%
25%
30%
35%
Pro
po
rtio
n o
f C
ust
om
ers
Cost Impact (%)
0%
5%
10%
15%
20%
25%
30%
Pro
po
rtio
n o
f C
ust
om
ers
Cost Impact (%)
Public Record Exhibit 6
270

Queensland Competition Authority Appendix E: Transitional and obsolete tariffs—customer impacts
87
Tariff 37
Tariff 37 is a business time-of-use tariff that aligns with tariff 20 or 22A for small business customers and
one of tariffs 44 to 48 for large business customers. Figures 22–24 below show the distribution of potential
impacts for existing customers moving to these standard business tariffs.
Figure 22 Change in electricity bills for small business customers on tariff 37 moving to tariff 20
Source: Ergon Retail
Figure 23 Change in electricity bills for small business customers on tariff 37 moving to tariff 22A
Source: Ergon Retail
0%
5%
10%
15%
20%
25%
Pro
po
rtio
n o
f C
ust
om
ers
Cost Impact (%)
0%
5%
10%
15%
20%
25%
30%
35%
40%
Pro
po
rtio
n o
f C
ust
om
ers
Cost Impact (%)
Public Record Exhibit 6
271

Queensland Competition Authority Appendix E: Transitional and obsolete tariffs—customer impacts
88
Figure 24 Change in electricity bills for large business customers on tariff 37 moving to one of tariffs 44 to 48
Note: For this analysis Ergon Retail has applied a derived demand profile for customers where demand data is unavailable. Therefore individual cost impacts may be over- or under-stated for individual customers depending on their unique demand profile.
Source: Ergon Retail
0%
5%
10%
15%
20%
25%
30%
35%
40%
45%
50%
Pro
po
rtio
n o
f C
ust
om
ers
Cost Impact (%)
Public Record Exhibit 6
272
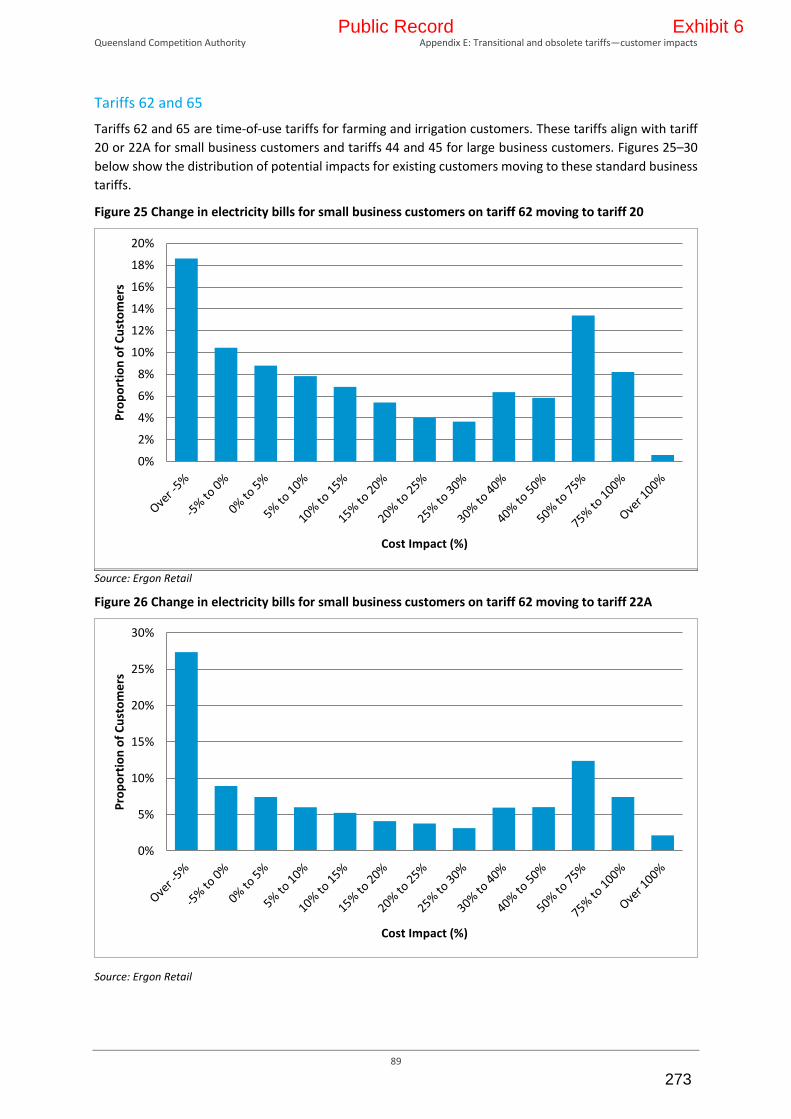
Queensland Competition Authority Appendix E: Transitional and obsolete tariffs—customer impacts
89
Tariffs 62 and 65
Tariffs 62 and 65 are time-of-use tariffs for farming and irrigation customers. These tariffs align with tariff
20 or 22A for small business customers and tariffs 44 and 45 for large business customers. Figures 25–30
below show the distribution of potential impacts for existing customers moving to these standard business
tariffs.
Figure 25 Change in electricity bills for small business customers on tariff 62 moving to tariff 20
Source: Ergon Retail
Figure 26 Change in electricity bills for small business customers on tariff 62 moving to tariff 22A
Source: Ergon Retail
0%
2%
4%
6%
8%
10%
12%
14%
16%
18%
20%
Pro
po
rtio
n o
f C
ust
om
ers
Cost Impact (%)
0%
5%
10%
15%
20%
25%
30%
Pro
po
rtio
n o
f C
ust
om
ers
Cost Impact (%)
Public Record Exhibit 6
273

Queensland Competition Authority Appendix E: Transitional and obsolete tariffs—customer impacts
90
Figure 27 Change in electricity bills for large business customers on tariff 62 moving to tariff 44 or 45
Note: For this analysis Ergon Retail has applied a derived demand profile for customers where demand data is unavailable. Therefore, individual cost impacts may be over- or under-stated for individual customers depending on their unique demand profile.
Source: Ergon Retail
Figure 28 Change in electricity bills for small business customers on tariff 65 moving to tariff 20
Source: Ergon Retail
0%
5%
10%
15%
20%
25%P
rop
ort
ion
of
Cu
sto
me
rs
Cost Impact (%)
0%
5%
10%
15%
20%
25%
Pro
po
rtio
n o
f C
ust
om
ers
Cost Impact (%)
Public Record Exhibit 6
274

Queensland Competition Authority Appendix E: Transitional and obsolete tariffs—customer impacts
91
Figure 29 Change in electricity bills for small business customers on tariff 65 moving to tariff 22A
Source: Ergon Retail
Figure 30 Change in electricity bills for large business customers on tariff 65 moving to tariff 44 or 45
Note: For this analysis Ergon Retail has applied a derived demand profile for customers where demand data is unavailable. Therefore, individual cost impacts may be over- or under-stated for individual customers depending on their unique demand profile.
Source: Ergon Retail
Tariff 66
Tariff 66 is a flat-rate tariff for irrigation customers. This tariff aligns with tariff 20 or 22A for small business
customers and tariffs 44 and 45 for large business customers. Figures 31–33 below show the distribution of
potential impacts for existing customers moving to these standard business tariffs.
0%
10%
20%
30%
40%
50%
60%P
rop
ort
ion
of
Cu
sto
me
rs
Cost Impact (%)
0%
5%
10%
15%
20%
25%
30%
35%
Pro
po
rtio
n o
f C
ust
om
ers
Cost Impact (%)
Public Record Exhibit 6
275

Queensland Competition Authority Appendix E: Transitional and obsolete tariffs—customer impacts
92
Figure 31 Change in electricity bills for small business customers on tariff 66 moving to tariff 20
Source: Ergon Retail
Figure 32 Change in electricity bills for small business customers on tariff 66 moving to tariff 22A
Source: Ergon Retail
0%
5%
10%
15%
20%
25%
30%
35%
40%
45%P
rop
ort
ion
of
Cu
sto
me
rs
Cost Impact (%)
0%
10%
20%
30%
40%
50%
60%
70%
Pro
po
rtio
n o
f C
ust
om
ers
Cost Impact (%)
Public Record Exhibit 6
276

Queensland Competition Authority Appendix E: Transitional and obsolete tariffs—customer impacts
93
Figure 33 Change in electricity bills for large business customers on tariff 66 moving to tariff 44 or tariff 45
Note: For this analysis Ergon Retail has applied a derived demand profile for customers where demand data is unavailable. Therefore, individual cost impacts may be over- or under-stated for individual customers depending on their unique demand profile
Source: Ergon Retail
0%
5%
10%
15%
20%
25%
30%
35%
40%
45%
Pro
po
rtio
n o
f C
ust
om
ers
Cost Impact (%)
Public Record Exhibit 6
277
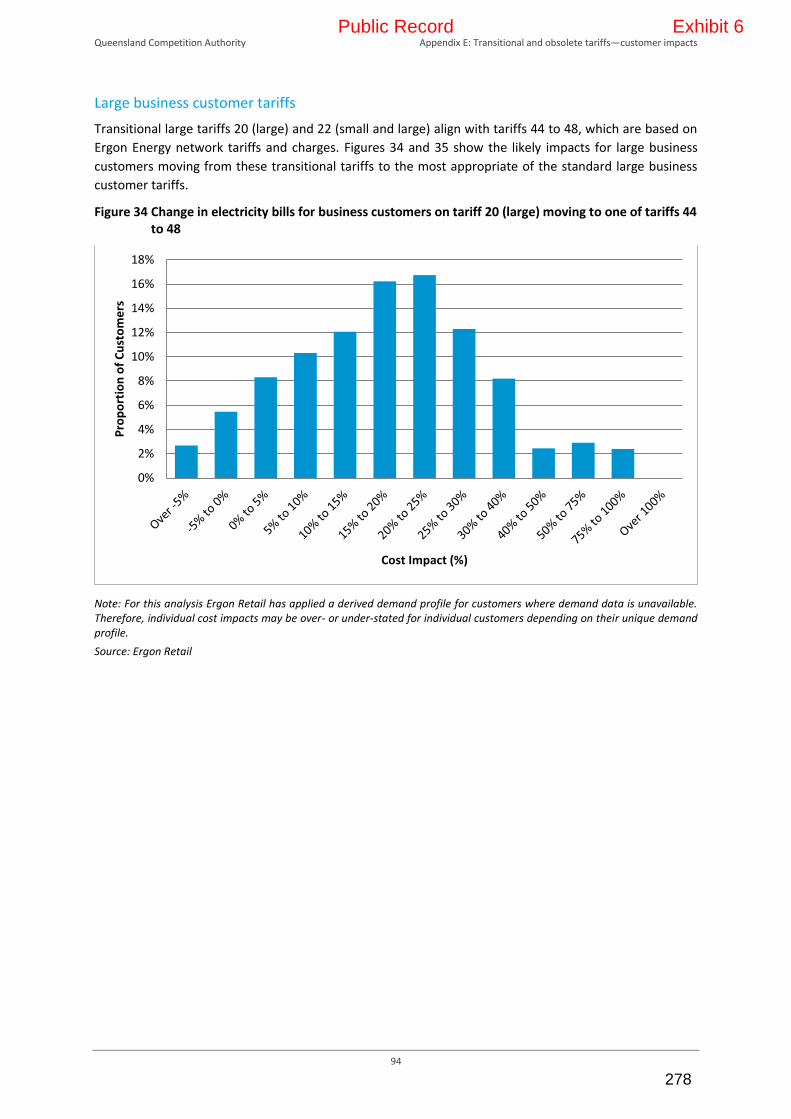
Queensland Competition Authority Appendix E: Transitional and obsolete tariffs—customer impacts
94
Large business customer tariffs
Transitional large tariffs 20 (large) and 22 (small and large) align with tariffs 44 to 48, which are based on
Ergon Energy network tariffs and charges. Figures 34 and 35 show the likely impacts for large business
customers moving from these transitional tariffs to the most appropriate of the standard large business
customer tariffs.
Figure 34 Change in electricity bills for business customers on tariff 20 (large) moving to one of tariffs 44 to 48
Note: For this analysis Ergon Retail has applied a derived demand profile for customers where demand data is unavailable. Therefore, individual cost impacts may be over- or under-stated for individual customers depending on their unique demand profile.
Source: Ergon Retail
0%
2%
4%
6%
8%
10%
12%
14%
16%
18%
Pro
po
rtio
n o
f C
ust
om
ers
Cost Impact (%)
Public Record Exhibit 6
278

Queensland Competition Authority Appendix E: Transitional and obsolete tariffs—customer impacts
95
Figure 35 Change in electricity bills for business customers on tariff 22 (small and large) moving to one of tariffs 44 to 48
Note: For this analysis Ergon Retail has applied a derived demand profile for customers where demand data is unavailable. Therefore, individual cost impacts may be over- or under-stated for individual customers depending on their unique demand profile.
Source: Ergon Retail
0%
5%
10%
15%
20%
25%
30%
Pro
po
rtio
n o
f C
ust
om
ers
Cost Impact (%)
Public Record Exhibit 6
279

Queensland Competition Authority Appendix F: Build-up of prices
96
APPENDIX F: BUILD‐UP OF PRICES
Table 32 Regulated retail tariffs and prices for residential customers (GST exclusive)
Tariff Tariff component Fixeda
(c/day)
Peak usage
(c/kWh)
Off-peak/flat
usage
(c/kWh)
Peak demand
($/kW/month)
Off-peak/flat demand
($/kW/month)
Tariff 11
(flat rate)
Network 50.200 11.624
Energy 9.445
Fixed Retail 35.107
Variable Retail 2.376
Standing offer adjustment
4.265 1.172
SRES cost pass-through
-0.0077
Total 89.572 24.610
Tariff 12A
(time-of-use)
Network 61.375 38.375 7.558
Energy 9.445 9.445
Fixed Retail 35.107
Variable Retail 5.392 1.917
Standing offer adjustment
4.824 2.661 0.946
SRES cost pass-through
-0.0077 -0.0077
Total 101.306 55.865 19.859
Tariff 14
(time-of-use demand)
Network 22.525 3.386 52.885 9.636
Energy 9.445
Fixed Retail 35.107
Variable Retail 1.447 5.963 1.086
Standing offer adjustment
2.882 0.714 2.942 0.536
SRES cost pass-through
-0.0077
Total 60.514 14.984 61.790 11.258
Public Record Exhibit 6
280
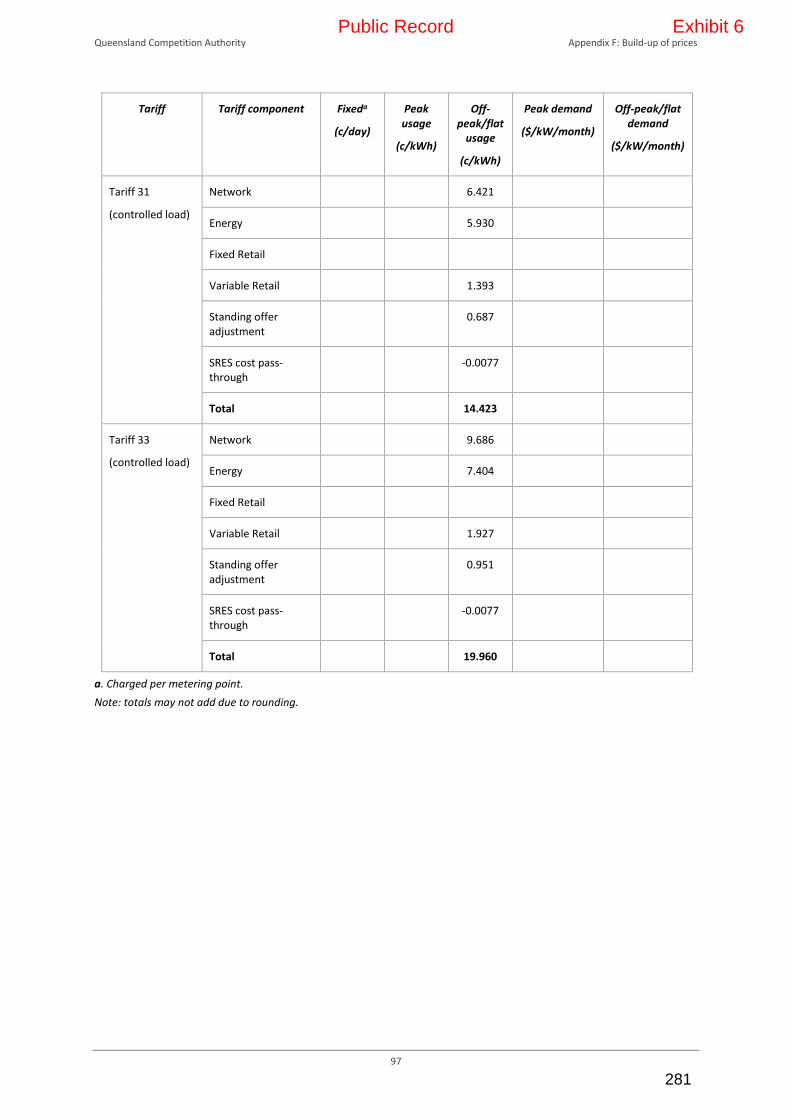
Queensland Competition Authority Appendix F: Build-up of prices
97
Tariff Tariff component Fixeda
(c/day)
Peak usage
(c/kWh)
Off-peak/flat
usage
(c/kWh)
Peak demand
($/kW/month)
Off-peak/flat demand
($/kW/month)
Tariff 31
(controlled load)
Network 6.421
Energy 5.930
Fixed Retail
Variable Retail 1.393
Standing offer adjustment
0.687
SRES cost pass-through
-0.0077
Total 14.423
Tariff 33
(controlled load)
Network 9.686
Energy 7.404
Fixed Retail
Variable Retail 1.927
Standing offer adjustment
0.951
SRES cost pass-through
-0.0077
Total 19.960
a. Charged per metering point.
Note: totals may not add due to rounding.
Public Record Exhibit 6
281

Queensland Competition Authority Appendix F: Build-up of prices
98
Table 33 Regulated retail tariffs and prices for small business and unmetered supply customers, except street lighting customers (GST exclusive)
Tariff Tariff component Fixeda
(c/day)
Peak usage
(c/kWh)
Off-peak/flat
usage
(c/kWh)
Peak demand
($/kW/month)
Off-peak/flat demand
($/kW/month)
Tariff 20
(flat rate)
Network 72.000 12.486
Energy 9.445
Fixed Retail 49.790
Variable Retail 2.807
Standing offer adjustment
6.089 1.237
SRES cost pass-through
-0.0077
Total 127.879 25.968
Tariff 22
(time-of-use - obsolete)
Network 72.000 14.395 9.683
Energy 9.445 9.445
Fixed Retail 49.790
Variable Retail 3.052 2.448
Standing offer adjustment
6.089 1.345 1.079
SRES cost pass-through
-0.0077 -0.0077
Total 127.879 28.229 22.648
Tariff 22A
(time-of-use)
Network 72.000 30.462 10.236
Energy 9.445 9.445
Fixed Retail 49.790
Variable Retail 5.108 2.519
Standing offer adjustment
6.089 2.251 1.110
SRES cost pass-through
-0.0077 -0.0077
Total 127.879 47.258 23.303
Tariff 24
(time-of-use demand)
Network 24.540 4.322 71.601 11.765
Energy 9.445
Fixed Retail 49.790
Variable Retail 1.762 9.165 1.506
Public Record Exhibit 6
282

Queensland Competition Authority Appendix F: Build-up of prices
99
Tariff Tariff component Fixeda
(c/day)
Peak usage
(c/kWh)
Off-peak/flat
usage
(c/kWh)
Peak demand
($/kW/month)
Off-peak/flat demand
($/kW/month)
Standing offer adjustment
3.716 0.776 4.038 0.664
SRES cost pass-through
-0.0077
Total 78.046 16.299 84.804 13.935
Tariff 41
(low voltage - demand)
Network 532.100 2.056 24.351
Energy 9.445
Fixed Retail 49.790
Variable Retail 1.472 3.117
Standing offer adjustment
29.094 0.649 1.373
SRES cost pass-through
-0.0077
Total 610.984 13.615 28.841
Tariff 91
(unmetered)
Network 10.298
Energy 9.445
Fixed Retail
Variable Retail 2.527
Standing offer adjustment
1.114
SRES cost pass-through
-0.0077
Total 23.376
a. Charged per metering point.
Note: totals may not add due to rounding.
Public Record Exhibit 6
283

Queensland Competition Authority Appendix F: Build-up of prices
100
Table 34 Regulated retail tariffs and prices for large business and street lightning customers (GST exclusive)
Tariff Tariff component Fixeda
(c/day)
Peak usage
(c/kWh)
Off-peak/flat
usage
(c/kWh)
Peak demand
($/kW/month)
Off-peak/flat demand
($/kW/month)
Tariff 44
(over 100 MWh small (demand))
Network 4568.700 2.201 35.801
Energy 8.855
Fixed Retail 492.445
Variable Retail 0.668 2.164
Headroom 253.057 0.586 1.898
SRES cost pass-through
-0.0081
Total 5314.202 12.302 39.863
Tariff 45
(over 100 MWh medium (demand))
Network 14751.500 2.283 28.422
Energy 8.855
Fixed Retail 1117.230
Variable Retail 0.673 1.718
Headroom 793.437 0.591 1.507
SRES cost pass-through
-0.0081
Total 16662.167 12.393 31.647
Tariff 46
(over 100 MWh large (demand))
Network 39607.000 2.467 25.257
Energy 8.855
Fixed Retail 2632.909
Variable Retail 0.684 1.527
Headroom 2111.995 0.600 1.339
SRES cost pass-through
-0.0081
Total 44351.904 12.599 28.123
Tariff 47
(high voltage (demand))
Network 37183.400 2.078 23.257
Energy 8.317
Fixed Retail 2372.031
Variable Retail 0.628 1.406
Headroom 1977.772 0.551 1.233
Public Record Exhibit 6
284

Queensland Competition Authority Appendix F: Build-up of prices
101
Tariff Tariff component Fixeda
(c/day)
Peak usage
(c/kWh)
Off-peak/flat
usage
(c/kWh)
Peak demand
($/kW/month)
Off-peak/flat demand
($/kW/month)
SRES cost pass-through
-0.0077
Total 41533.203 11.567 25.896
Tariff 48
(over 4 GWh high voltage (demand))
Network 37183.400 2.078 23.257
Energy 8.317
Fixed Retail 2787.627
Variable Retail 0.628 1.406
Headroom 1998.551 0.551 1.233
SRES cost pass-through
-0.0077
Total 41969.578 11.567 25.896
Tariff 50
(over 100 MWh time-of-use and demand)
Network 3822.400 1.779 4.863 54.966 13.257
Energy 8.855 8.855
Fixed Retail 456.956
Variable Retail 0.643 0.829 3.322 0.801
Headroom 213.968 0.564 0.727 2.914 0.703
SRES cost pass-through
-0.0081 -0.0081
Total 4493.324 11.832 15.266 61.203 14.761
Tariff 71
(street lighting)
Network 0.700 19.445
Energy 8.855
Fixed Retail
Variable Retail 1.711
Headroom 0.035 1.501
SRES cost pass-through
-0.0081
Total 0.735 31.503
a. Charged per metering point.
Note: totals may not add due to rounding.
Public Record Exhibit 6
285
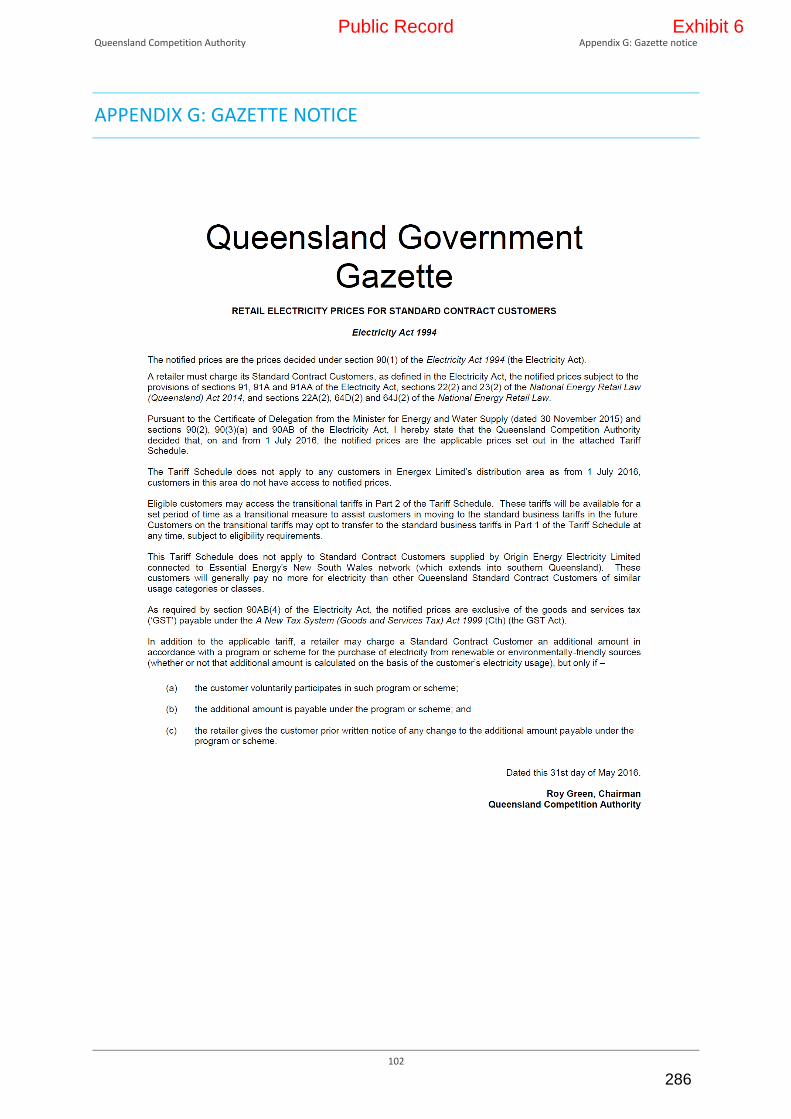
Queensland Competition Authority Appendix G: Gazette notice
102
APPENDIX G: GAZETTE NOTICE
Public Record Exhibit 6
286
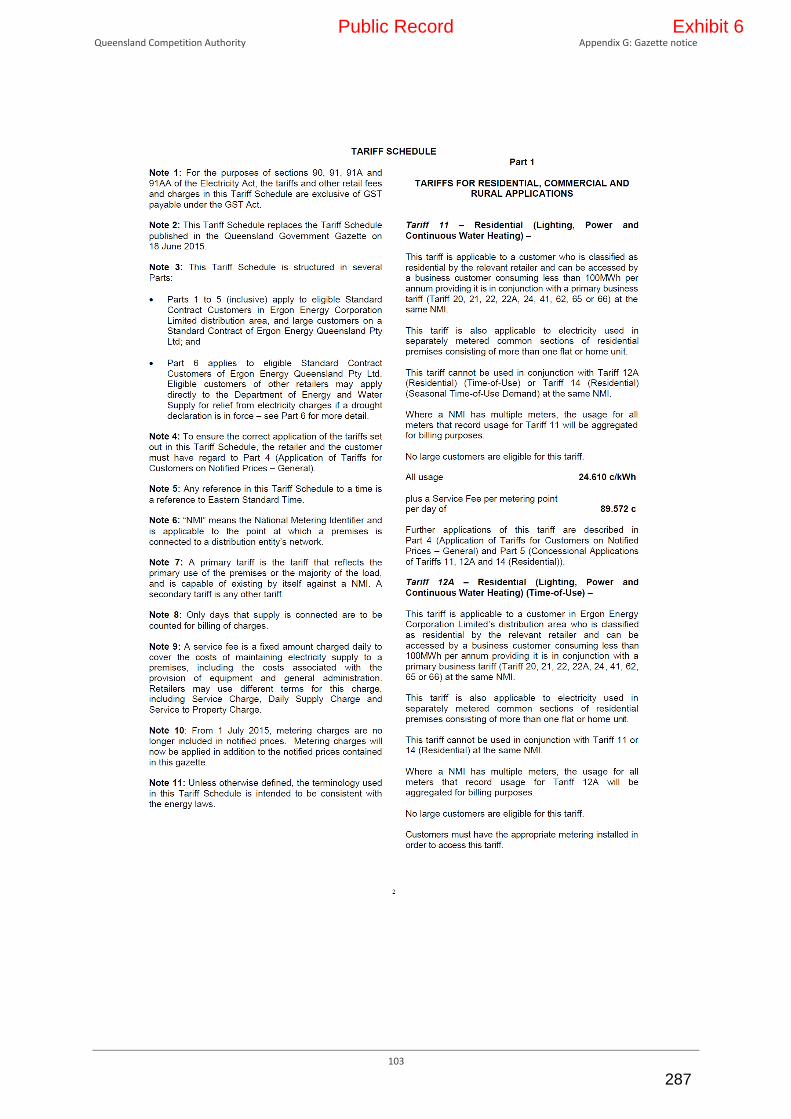
Queensland Competition Authority Appendix G: Gazette notice
103
Public Record Exhibit 6
287

Queensland Competition Authority Appendix G: Gazette notice
104
Public Record Exhibit 6
288

Queensland Competition Authority Appendix G: Gazette notice
105
Public Record Exhibit 6
289

Queensland Competition Authority Appendix G: Gazette notice
106
Public Record Exhibit 6
290
Queensland Competition Authority Appendix G: Gazette notice
107
Public Record Exhibit 6
291

Queensland Competition Authority Appendix G: Gazette notice
108
Public Record Exhibit 6
292

Queensland Competition Authority Appendix G: Gazette notice
109
Public Record Exhibit 6
293

Queensland Competition Authority Appendix G: Gazette notice
110
Public Record Exhibit 6
294
Queensland Competition Authority Appendix G: Gazette notice
111
Public Record Exhibit 6
295
Queensland Competition Authority Appendix G: Gazette notice
112
Public Record Exhibit 6
296

Queensland Competition Authority Appendix G: Gazette notice
113
Public Record Exhibit 6
297

Queensland Competition Authority Appendix G: Gazette notice
114
Public Record Exhibit 6
298

Queensland Competition Authority Appendix H: Assumptions used to determine customer impacts
115
APPENDIX H: ASSUMPTIONS USED TO DETERMINE CUSTOMER
IMPACTS
Typical customer figures are based on the annual consumption of the median customer on each tariff in
regional Queensland in the most recent tariff year (2014–15). The median customer is the middle customer
in terms of consumption out of all customers on each tariff. As such, approximately half of all customers
will use less electricity than the typical figure, and half will use more.
Stakeholders requested the QCA provide a range of bill impacts for residential customers. For this final
determination the QCA has provided tariff 11 bill impacts for the 25th and 75th percentile customers. One
quarter of customers will use less electricity than the 25th percentile customer, while three quarters of
customers will use less electricity than the 75th percentile customer.
Ergon Retail provides these figures to the QCA.
Stakeholders noted that the typical customer figures provided by Ergon Retail appear lower than those on
the Australian Energy Regulator's Energy Made Easy website. The reason for the discrepancy is that the
Energy Made Easy website uses average consumption figures based on a survey of 4,000 customers across
Australia in 2014, while Ergon Energy uses actual consumption figures from their customer base of over
700,000 electricity customers in regional Queensland.
Retail tariff Consumption
(kWh per year)
Demand threshold
(kW per month)
Demand
(kW per month)
Peak usage
(%)
Off-peak usage
(%)
Tariff 11 25th percentile
(all customers)
2,055
Tariff 11 median
(all customers)
4,203
Tariff 11 75th percentile
(all customers)
6,412
Tariff 11 median
(for customers who also have Tariff 31)
4,372
Tariff 31 median 1,792
Tariff 11 median
(for customers who also have Tariff 33)
3,989
Tariff 33 median 1,666
Tariff 12A median 4,915 10.6% 89.4%
Tariff 20 median 6,422
Tariff 221 median 26,970 48.7% 51.3%
Tariff 22A median 15,169 11.1% 88.9%
Tariff 44 median 258,396 30 61
Tariff 45 median 991,944 120 232
Tariff 46 median 2,328,684 400 494
Tariff 47 median 3,338,364 400 803
Tariff 48 median 7,670,400 400 1,304
1. Obsolete tariff
Source: Ergon Retail
Public Record Exhibit 6
299

Queensland Competition Authority Appendix I: Summary of concessional arrangements for energy in Queensland
116
APPENDIX I: SUMMARY OF CONCESSIONAL ARRANGEMENTS FOR
ENERGY IN QUEENSLAND
Concession Name Eligibility Criteria Annual Amount
Electricity Rebate Customers with a Pensioner Concession Card issued by either Centrelink or Department of Veterans’ Affairs, a Department of Veterans’ Affairs Gold Card (and recipient of the War Widow Pension or special rate TPI Pension) or a Queensland Government Seniors Card.
$320.97
Reticulated Natural Gas Rebate
As for Electricity Rebate. $68.56
Medical Cooling and Heating Electricity Concession Scheme
Queensland residents with a qualifying medical condition requiring cooling or heating to prevent the decline of symptoms, who reside at their principal place of residence which has an air-conditioning unit.
$320.97
Home Energy Emergency Assistance Scheme
Customers must either hold a current, eligible concession card, or have a base income of no more than the Commonwealth Government’s maximum income rate for part-age pensioners, or be on their retailer’s hardship program or payment plan.
Up to $720 per household per year for a maximum of two consecutive years.
Electricity Life Support Concession Scheme
Customers must be medically assessed in accordance with the eligibility criteria determined by Queensland Health. In addition, oxygen concentrators must be provided rent-free by Queensland Health to persons who hold an eligible concession card and meet the eligibility criteria of the Medical Aids Subsidy Scheme. Kidney dialysis machines must be provided rent-free by Queensland Health to persons based on clinical needs and supplied through Queensland hospitals.
$653.72 per year for each oxygen concentrator;
$437.76 for each kidney dialysis machine.
Drought relief Certain farmers who use electricity for irrigation pumping during periods of very low or no water availability.
The fixed electricity charge is waived for Ergon Energy customers, and reimbursed by the Department of Energy and Water Supply for customers of other retail entities.
Note: Information current as of April 2016 and is provided as a guide only. Full details are available from: http://www.dews.qld.gov.au/energy-water-home/electricity/rebates.
Public Record Exhibit 6
300

Queensland Competition Authority Appendix J: Retail cost allowances
117
APPENDIX J: RETAIL COST ALLOWANCES
This appendix provides details on how we have derived the retail cost allowances for 2016–17 notified prices, as set out in Chapter 5. Three issues are addressed here:
(1) deriving the final retail cost allowances from the results of ACIL's benchmarking analysis,
specifically:
(a) determining benchmark total retail cost allowances
(b) determining the benchmark allocations between fixed and variable retail cost components
(c) applying these allocations to fixed and variable components of retail tariffs
(2) estimating retail costs allowances for large and very large customer tariffs
(3) adjusting fixed retail costs for regulatory fees.
This appendix also addresses a number of retail-cost-related matters raised in response to our draft
determination.
Deriving retail costs from ACIL's analysis
Total retail cost allowances for small customer tariffs
We have taken the average of all total retail cost observations derived from ACIL's benchmarking analysis,
in each sample, for small business tariffs and residential tariffs. These averages represent averages across
all data points in each sample (residential and small business); they do not represent averages of the total
retail costs depicted in Figures 8 and 9 (Chapter 5). The total average retail cost allowances used to set our
retail costs are set out in Table 35.
Table 35 Benchmark average retail costs—residential and small business customers
Customer class Fixed retail costs
($/annum)
Variable retail costs
($/annum)
Total retail costs
($/annum)
Fixed costs
(as a % of total retail
costs)
Variable costs
(as a % of total retail
costs)
Residential $127.93 $104.28 $232.21 55% 45%
Small business $181.56 $422.23 $603.79 30% 70%
Note: Based on average annual consumption of 4,640 kWh for residential tariffs and 16,370 kWh for small business tariffs, as advised by Energex.
Allocation between fixed and variable retail components
After deciding on the total benchmark retail cost allowance, we then determine how that should be applied
to retail tariffs.
ACIL's analysis reveals differences in how individual retailers recover retail costs from fixed and variable
tariff components. For residential tariffs, the amount of total retail costs recovered through fixed charges
ranges from 44 to 84 per cent across the sample. For small business tariffs, the allocation appears more
biased toward recovery through variable components, with between 20 and 51 per cent of total retail costs
recovered through fixed charges. Table 36 illustrates this variability across retailers' observations.
Public Record Exhibit 6
301

Queensland Competition Authority Appendix J: Retail cost allowances
118
Table 36 Percentage of total retail costs recovered through fixed and variable components
Retailer Residential tariffs Small business tariffs
Fixed (%) Variable (%) Fixed (%) Variable (%)
Simply 47% 53% 27% 73%
Energy Australia 75% 25% 24% 76%
Alinta 84% 16% 51% 49%
Origin 54% 46% 30% 70%
Red Energy 54% 46% 21% 79%
Lumo 44% 56% 40% 60%
M2 51% 49% 20% 80%
AGL 60% 40% 38% 62%
Momentum 55% 45% 31% 69%
Click 44% 56% 49% 51%
Minimum 44% 16% 20% 49%
Maximum 84% 56% 51% 80%
Notes: Based on ACIL's benchmarking analysis. These values represent the average recovery of retail costs from fixed and variable components, derived from the average of all market prices offered by each retailer.
This variation in how individual retailers recover their retail costs could be due to, among other things:
underlying cost structures—for example, outsourcing of functions such as billing, customer service and
energy trading could result in a different cost structure to a retailer that performs these functions in-
house
actual energy purchase costs—which are a function of the retailer's exposure to the spot market, its
appetite for risk and its hedging strategy
accounting and reporting policies—including capitalisation policies (for example, some retailers treat
depreciation and amortisation as fixed costs, while others consider them variable costs) and different
marketing strategies (for example, electing to offer discounts off fixed daily charges and usage
charges, or usage charges alone).
Using the market observations, ACIL derived estimated benchmark allocations between fixed and variable
components based on the mathematical relationship between the size of the two components. These
relationships were derived using regression analysis which establishes a line of best fit through each
normalised sample. These relationships are discussed further in ACIL's final report.
We have not needed to use the regression relationships derived by ACIL to determine the variable retail
component, as our final decision applies the average fixed and variable allocation that corresponds to the
average total retail cost based on ACIL's benchmarking analysis. These are the implied allocations that
correspond to the average retail costs in Table 37.
Applying fixed and variable retail components to small customer retail tariffs
After deciding on the benchmark allocation of the total retail cost allowance to fixed and variable
components, each component must be allocated to retail tariff components.
Public Record Exhibit 6
302
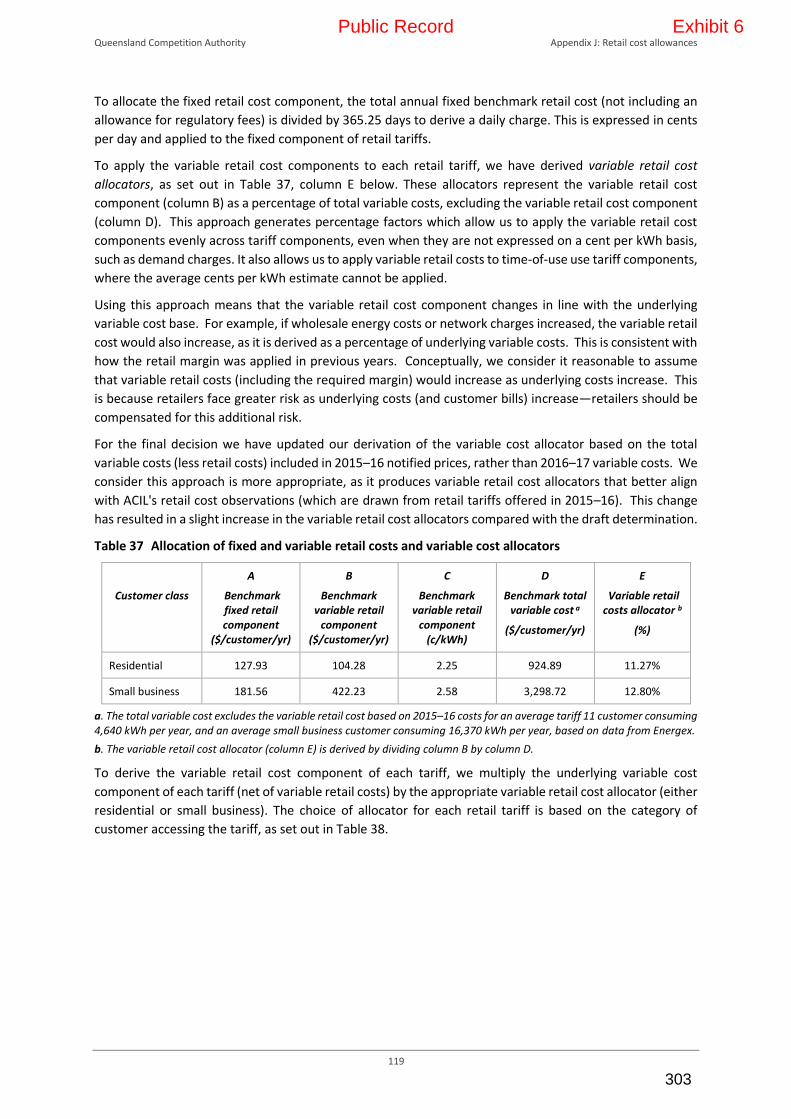
Queensland Competition Authority Appendix J: Retail cost allowances
119
To allocate the fixed retail cost component, the total annual fixed benchmark retail cost (not including an
allowance for regulatory fees) is divided by 365.25 days to derive a daily charge. This is expressed in cents
per day and applied to the fixed component of retail tariffs.
To apply the variable retail cost components to each retail tariff, we have derived variable retail cost
allocators, as set out in Table 37, column E below. These allocators represent the variable retail cost
component (column B) as a percentage of total variable costs, excluding the variable retail cost component
(column D). This approach generates percentage factors which allow us to apply the variable retail cost
components evenly across tariff components, even when they are not expressed on a cent per kWh basis,
such as demand charges. It also allows us to apply variable retail costs to time-of-use use tariff components,
where the average cents per kWh estimate cannot be applied.
Using this approach means that the variable retail cost component changes in line with the underlying
variable cost base. For example, if wholesale energy costs or network charges increased, the variable retail
cost would also increase, as it is derived as a percentage of underlying variable costs. This is consistent with
how the retail margin was applied in previous years. Conceptually, we consider it reasonable to assume
that variable retail costs (including the required margin) would increase as underlying costs increase. This
is because retailers face greater risk as underlying costs (and customer bills) increase—retailers should be
compensated for this additional risk.
For the final decision we have updated our derivation of the variable cost allocator based on the total
variable costs (less retail costs) included in 2015–16 notified prices, rather than 2016–17 variable costs. We
consider this approach is more appropriate, as it produces variable retail cost allocators that better align
with ACIL's retail cost observations (which are drawn from retail tariffs offered in 2015–16). This change
has resulted in a slight increase in the variable retail cost allocators compared with the draft determination.
Table 37 Allocation of fixed and variable retail costs and variable cost allocators
Customer class
A
Benchmark fixed retail component
($/customer/yr)
B
Benchmark variable retail
component ($/customer/yr)
C
Benchmark variable retail
component (c/kWh)
D
Benchmark total variable cost a
($/customer/yr)
E
Variable retail costs allocator b
(%)
Residential 127.93 104.28 2.25 924.89 11.27%
Small business 181.56 422.23 2.58 3,298.72 12.80%
a. The total variable cost excludes the variable retail cost based on 2015–16 costs for an average tariff 11 customer consuming 4,640 kWh per year, and an average small business customer consuming 16,370 kWh per year, based on data from Energex.
b. The variable retail cost allocator (column E) is derived by dividing column B by column D.
To derive the variable retail cost component of each tariff, we multiply the underlying variable cost
component of each tariff (net of variable retail costs) by the appropriate variable retail cost allocator (either
residential or small business). The choice of allocator for each retail tariff is based on the category of
customer accessing the tariff, as set out in Table 38.
Public Record Exhibit 6
303
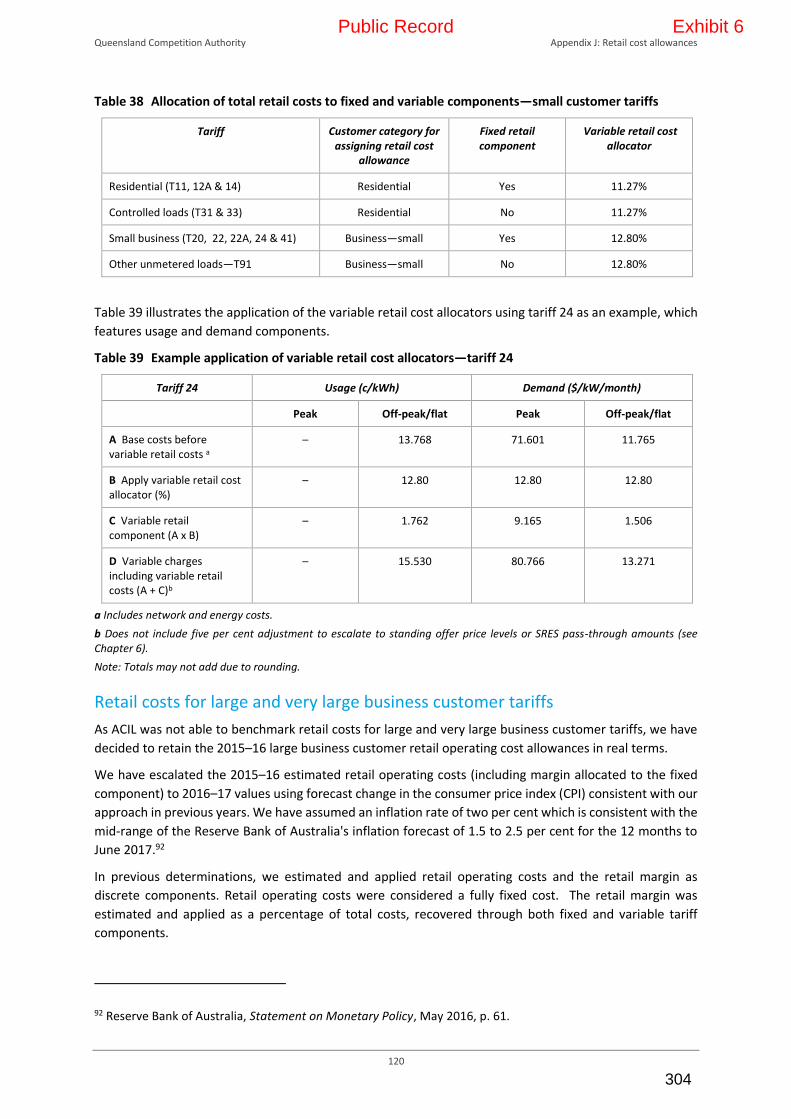
Queensland Competition Authority Appendix J: Retail cost allowances
120
Table 38 Allocation of total retail costs to fixed and variable components—small customer tariffs
Tariff Customer category for assigning retail cost
allowance
Fixed retail component
Variable retail cost allocator
Residential (T11, 12A & 14) Residential Yes 11.27%
Controlled loads (T31 & 33) Residential No 11.27%
Small business (T20, 22, 22A, 24 & 41) Business—small Yes 12.80%
Other unmetered loads—T91 Business—small No 12.80%
Table 39 illustrates the application of the variable retail cost allocators using tariff 24 as an example, which
features usage and demand components.
Table 39 Example application of variable retail cost allocators—tariff 24
Tariff 24 Usage (c/kWh) Demand ($/kW/month)
Peak Off-peak/flat Peak Off-peak/flat
A Base costs before variable retail costs a
– 13.768 71.601 11.765
B Apply variable retail cost allocator (%)
– 12.80 12.80 12.80
C Variable retail component (A x B)
– 1.762 9.165 1.506
D Variable charges including variable retail costs (A + C)b
– 15.530 80.766 13.271
a Includes network and energy costs.
b Does not include five per cent adjustment to escalate to standing offer price levels or SRES pass-through amounts (see Chapter 6).
Note: Totals may not add due to rounding.
Retail costs for large and very large business customer tariffs
As ACIL was not able to benchmark retail costs for large and very large business customer tariffs, we have
decided to retain the 2015–16 large business customer retail operating cost allowances in real terms.
We have escalated the 2015–16 estimated retail operating costs (including margin allocated to the fixed
component) to 2016–17 values using forecast change in the consumer price index (CPI) consistent with our
approach in previous years. We have assumed an inflation rate of two per cent which is consistent with the
mid-range of the Reserve Bank of Australia's inflation forecast of 1.5 to 2.5 per cent for the 12 months to
June 2017.92
In previous determinations, we estimated and applied retail operating costs and the retail margin as
discrete components. Retail operating costs were considered a fully fixed cost. The retail margin was
estimated and applied as a percentage of total costs, recovered through both fixed and variable tariff
components.
92 Reserve Bank of Australia, Statement on Monetary Policy, May 2016, p. 61.
Public Record Exhibit 6
304

Queensland Competition Authority Appendix J: Retail cost allowances
121
To apply a methodology consistent with that applied to small customer tariffs, the retail operating cost
(ROC) allowance (including margin allocated to the fixed component) is taken as the fixed retail cost
component and the variable component is equal to the margin of 5.7 per cent that we applied in 2015–16.
To allocate the variable component across the total variable costs we have used a variable retail cost
allocator of 6.0445 per cent of total variable costs, excluding variable retail costs. This allocator represents
the percentage required to establish a variable retail cost component equal to 5.7 per cent of total variable
costs, including the variable retail cost.
Fixed retail costs will be applied in the same way as in previous determinations, as set out in Table 40. All
large and very large business tariffs will include both fixed and variable retail cost components, except tariff
71 (street lighting) which is considered a secondary tariff and attracts a variable retail cost only.
Table 40 Allocation of total retail costs to fixed and variable components—large business customer tariffs
Tariff Customer category for assigning retail cost
allowance
Fixed retail component
Variable retail cost allocator
Tariffs 44, 45, 46, 47 & 50 Business—large Yes 6.0445%
Tariff 71 Business—large No 6.0445%
Tariff 48 Business—very large Yes 6.0445%
Adjusting the fixed retail cost allowance for regulatory fees
We have previously included an allowance for the regulatory fees that we charge retailers to recover the
costs of performing our regulatory functions in the electricity industry. These fees are legitimate costs
incurred by retailers in Queensland. Regulatory fees are charged to retailers on the basis of customer
numbers and are therefore applied to the fixed component of retail tariffs only.
As not all jurisdictions have equivalent regulatory fees, ACIL has adjusted the observed benchmark retail
allowances to exclude any regulatory fees applying in each jurisdiction. For this reason, it is appropriate to
add the QCA's regulatory fees back into the benchmark retail estimates.
For 2016–17, we are estimating the costs of supply in south east Queensland for residential and small
business customers, and the costs of supply in regional Queensland for large and very large business
customers. Consistent with previous determinations, we have determined the 2016–17 allowances for
regulatory fees as follows:
for residential and small business customers, an allowance of $0.297 per customer, which was
calculated by dividing the total fees estimated to be paid by retailers operating in south east
Queensland by the total number of customers they supply93
for large and very large business customers, an allowance of $2.071 per customer, which was
calculated by dividing the fees estimated to be paid by Ergon Retail by the number of customers that
Ergon Retail supplies.94
Table 41 sets out our final decision on the regulatory fee allowances for 2016–17 notified prices.
93 The total fee estimate for south east Queensland retailers is $417,615 and the number of customers in south
east Queensland is 1,407,927 (based on AER data as at 31 December 2015). 94 The total fee estimate for Ergon Retail is $1,454,125 and the number of customers supplied by Ergon Retail is
701,977 (based on AER data as at 31 December 2015).
Public Record Exhibit 6
305

Queensland Competition Authority Appendix J: Retail cost allowances
122
Table 41 Regulatory fees for 2016–17 retail cost allowances
Customer/tariff category Retail tariffs Regulatory fees ($ per customer per year)
Residential 11, 12A & 14 $0.297
Small business (< 100 MWh per year) 20, 22, 22A, 24 & 41 $0.297
Large business (100 MWh—4 GWh per year) 44, 45, 46, 47 & 50 $2.071
Very large business (> 4 GWh per year) 48 $2.071
Note: Regulatory fees are not applied to tariffs 31, 33, 71 and 91 for the reasons discussed in Chapter 5 and this appendix.
Other issues raised in submissions
Stakeholders raised a number of issues regarding retail costs in response to the QCA's draft determination,
which are addressed below. Issues relating specifically to ACIL's methodology have been addressed by ACIL
in its final report (May 2016), while the remaining issues have been addressed either below or in Chapter
5.
Table 42 Specific issues raised in submissions on the draft determination
Issue Stakeholder QCA response
The QCA's benchmark retail costs fail to recognise the costs of maintaining and supplying standard customers in Queensland.
Adopting the QCA’s draft approach could lead to an under-recovery of retail costs by a retailer which could have a negative impact on competition and the willingness of retailers to engage in the market.
Origin Energy The QCA is required to set notified prices based on expected standing offer prices in SEQ.
While retail costs have been derived from observed market offer prices, the QCA has applied a standing offer adjustment of five per cent to bring overall prices to an estimated standing offer price level.
Origin would expect retail operating costs (including customer acquisition and retention costs) and margin to be set separately to encourage new entrants, competition and business efficiencies in the Ergon network.
Origin supports a retail margin based on a calculation of total costs as previously utilised by the QCA. It has been widely recognised that each of these elements need to be estimated to provide an efficient build-up of costs for an energy retailer.
Origin Energy As the benchmark retail costs are based on competitive market offers, the allowances include some amount of CARC and margin. It is not clear why these allowances would need to be separately identified to facilitate competition and business efficiencies.
Headroom is applied separately to notified prices for large customers to encourage competition in regional Queensland.
Origin does not agree with the proposed rebalancing of the fixed and variable components of the retail tariff. The rebalancing does not reflect a true allocation of costs to customers in Queensland and it may lead to the cross subsidisation between customer segments as retailers attempt to recover fixed costs.
Origin Energy The allocation between fixed and variable costs is based on the average allocation observed in market prices across four competitive jurisdictions, including south east Queensland.
The QCA has not received any further information from retailers detailing specifically how retail costs should be allocated between fixed and variable components.
There is no one-size-fits-all approach. Ultimately, the QCA needs to estimate a value for these costs. Costs, and the allocation of those costs, differ markedly between retailers. Therefore, using the average allocation is a more reasonable approach than using the costs and
Public Record Exhibit 6
306

Queensland Competition Authority Appendix J: Retail cost allowances
123
Issue Stakeholder QCA response
allocations that align with any particular retailer.
The market offers selected by ACIL are the lowest in the market and thus there is a statistical bias. Costs to supply a standard customer in Ergon’s region are likely to be higher.
Origin Energy The QCA is required to set notified prices for small customers based on expected standing offer prices in south east Queensland. This means the QCA must consider costs of serving customers in south east Queensland, not regional Queensland.
ACIL has applied all conditional and unconditional discounts and product offers in the calculation of total electricity bills. These are likely to reflect the lowest cost to serve and are not reflective of the costs of supplying the market as a whole.
Origin Energy While retail costs have been derived from observed market offer prices, the QCA has applied a standing offer adjustment of five per cent to bring overall prices to an estimated standing offer price level.
The accuracy of the benchmarking approach hinges on ACIL’s ability to estimate the wholesale costs of an efficient retailer. Notwithstanding some directional offsetting of error between wholesale and retail cost estimates it seems like an unnecessary complication to base an estimate of efficient operating costs upon a consultant’s modelled wholesale prices
Origin Energy The QCA refers to ACIL's final report, May 2016.
Retail cost and margin allowances need to cover a retailer’s risk-weighted investment in order to entice them to the market. The QCA’s approach effectively limits future market entry to retailers able to compete at below the cost to serve and margin requirement inferred from the average of the lowest priced market offers.
Origin Energy Notified prices for large and very large business customers include a headroom allowance as means of facilitating competition.
Notified prices for small customers are not being set based on costs in regional Queensland. They are set in accordance with the UTP and are not intended to be set at a level that would directly encourage competition in the small customer market in regional Queensland at this time.
The QCA uses the allocation implied by the average fixed and variable retail cost allowances derived from ACIL’s market offer observations. Origin does not support this approach and believes ACIL’s analysis of the fixed and variable components of market offers is not representative of a retailer’s true allocation of costs.
Origin Energy The allocation is based on ACIL's observations of actual prices in competitive markets. No further evidence been provided to the QCA to support the assertion that the allocation is not representative.
There is no one-size-fits-all approach. Ultimately, the QCA needs to estimate a value for these costs. Costs, and the allocation of those costs, differ markedly between retailers. Therefore, using the average allocation is a more appropriate approach than using the costs and allocations that align with any particular retailer.
The high degree of variability in the characteristics of retailers and their customers may not reflect the allocation of an efficient retailer supplying regional Queensland customers. EEQ requests the QCA review this allocation in future price determinations.
Ergon Retail As above.
EEQ supports the QCA’s position that it would not be beneficial to conduct a bottom-up review of retail costs on an annual basis and that annual cost increases should be calculated using a defined escalation method. EEQ also supports the QCA’s
Ergon Retail The QCA will consider the matter of escalating retail cost allowances in the course of determining 2017–18 notified prices, should it be delegated that role.
Public Record Exhibit 6
307
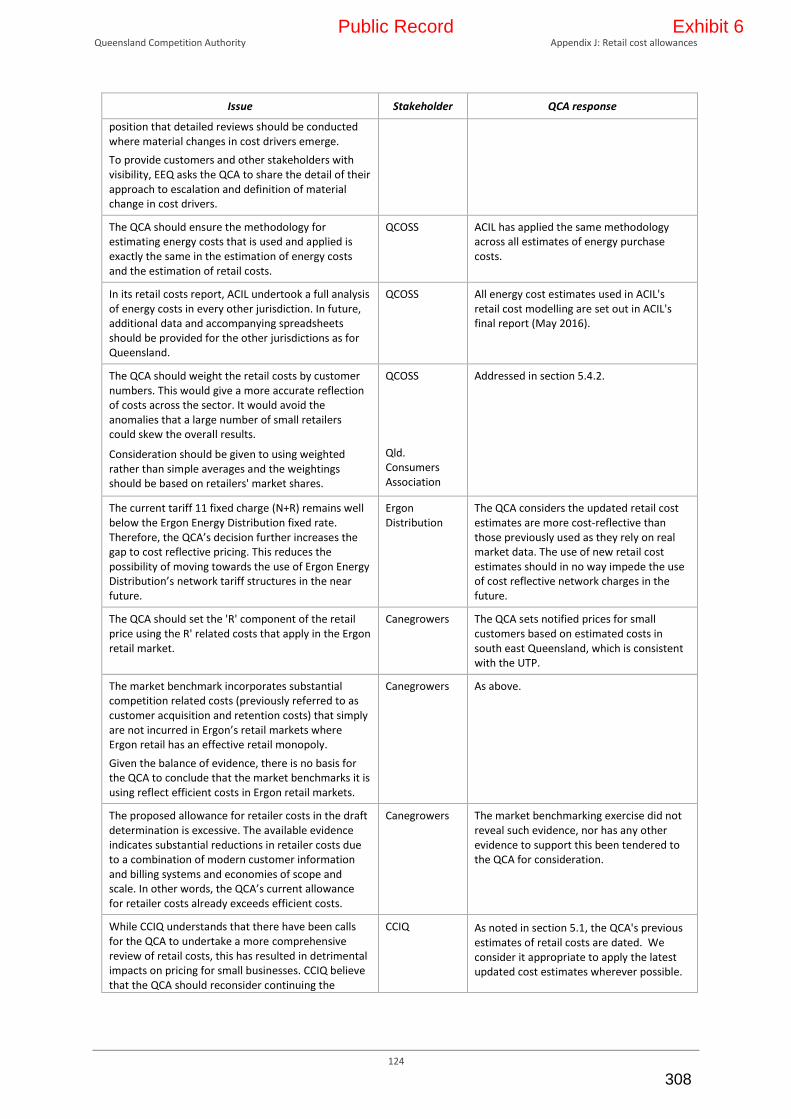
Queensland Competition Authority Appendix J: Retail cost allowances
124
Issue Stakeholder QCA response
position that detailed reviews should be conducted where material changes in cost drivers emerge.
To provide customers and other stakeholders with visibility, EEQ asks the QCA to share the detail of their approach to escalation and definition of material change in cost drivers.
The QCA should ensure the methodology for estimating energy costs that is used and applied is exactly the same in the estimation of energy costs and the estimation of retail costs.
QCOSS ACIL has applied the same methodology across all estimates of energy purchase costs.
In its retail costs report, ACIL undertook a full analysis of energy costs in every other jurisdiction. In future, additional data and accompanying spreadsheets should be provided for the other jurisdictions as for Queensland.
QCOSS All energy cost estimates used in ACIL's retail cost modelling are set out in ACIL's final report (May 2016).
The QCA should weight the retail costs by customer numbers. This would give a more accurate reflection of costs across the sector. It would avoid the anomalies that a large number of small retailers could skew the overall results.
Consideration should be given to using weighted rather than simple averages and the weightings should be based on retailers' market shares.
QCOSS
Qld. Consumers Association
Addressed in section 5.4.2.
The current tariff 11 fixed charge (N+R) remains well below the Ergon Energy Distribution fixed rate. Therefore, the QCA’s decision further increases the gap to cost reflective pricing. This reduces the possibility of moving towards the use of Ergon Energy Distribution’s network tariff structures in the near future.
Ergon Distribution
The QCA considers the updated retail cost estimates are more cost-reflective than those previously used as they rely on real market data. The use of new retail cost estimates should in no way impede the use of cost reflective network charges in the future.
The QCA should set the 'R' component of the retail price using the R' related costs that apply in the Ergon retail market.
Canegrowers The QCA sets notified prices for small customers based on estimated costs in south east Queensland, which is consistent with the UTP.
The market benchmark incorporates substantial competition related costs (previously referred to as customer acquisition and retention costs) that simply are not incurred in Ergon’s retail markets where Ergon retail has an effective retail monopoly.
Given the balance of evidence, there is no basis for the QCA to conclude that the market benchmarks it is using reflect efficient costs in Ergon retail markets.
Canegrowers As above.
The proposed allowance for retailer costs in the draft determination is excessive. The available evidence indicates substantial reductions in retailer costs due to a combination of modern customer information and billing systems and economies of scope and scale. In other words, the QCA’s current allowance for retailer costs already exceeds efficient costs.
Canegrowers The market benchmarking exercise did not reveal such evidence, nor has any other evidence to support this been tendered to the QCA for consideration.
While CCIQ understands that there have been calls for the QCA to undertake a more comprehensive review of retail costs, this has resulted in detrimental impacts on pricing for small businesses. CCIQ believe that the QCA should reconsider continuing the
CCIQ As noted in section 5.1, the QCA's previous estimates of retail costs are dated. We consider it appropriate to apply the latest updated cost estimates wherever possible.
Public Record Exhibit 6
308

Queensland Competition Authority Appendix J: Retail cost allowances
125
Issue Stakeholder QCA response
previous approach of using the Queensland retail operating cost benchmark.
Public Record Exhibit 6
309

Queensland Competition Authority Appendix K: Cost pass-through
126
APPENDIX K: COST PASS‐THROUGH
This appendix provides further information about how the SRES pass-through amounts presented in section
6.2 were calculated.
First, we recalculated the actual cost of SRES compliance during 2015–16, in dollars per megawatt hour
($/MWh), based on the binding STP for the 2016 calendar year, using the same approach as ACIL. We then
subtracted the SRES allowance included in 2015–16 notified prices from the actual 2015–16 SRES cost. This
revealed an SRES over-recovery of $0.06 per MWh (0.006 c/kWh), as shown in Table 43.
Table 43 2015–16 SRES over-recovery for all settlement classes
Period
STP (%)a
Clearing House Pricea
($/MWh)
SRES cost
($/MWh)
2015–16 average
SRES cost
($/MWh) Binding Non-binding
2015–16 Final determination allowance
1 Jul–31 Dec 2015 11.71% $40.00 $4.684 $4.34
1 Jan–30 Jun 2016 9.98% $40.00 $3.992
2015–16 Actual cost
1 Jul– 31 Dec 2015
11.71% $40.00 $4.684 $4.28
1 Jan–30 Jun 2016 9.68% $40.00 $3.872
Over-recovery in 2015–16 (before losses, margin and headroom) $0.06
a Published by the Clean Energy Regulator.
Next, we made an adjustment to the over-recovery to account for network losses to determine the SRES
liabilities based on energy acquired. In the 2015–16 determination, we applied a loss factor to energy
purchase costs for each settlement class to reflect transmission and distribution losses for each settlement
class. We applied the same network loss factors to the over-recovered SRES amounts calculated above,
consistent with the 2015–16 determination.
To restore the real values of the over-recovered amounts, we made an adjustment to reflect the time-value
of money for retailers over that 12-month period, proxied by a nominal weighted-average cost of capital of
8.47 per cent.95 Finally, we applied the retail margin of six per cent96 and a headroom allowance of five per
cent (which reflect the allowances applying in the year the over-recovery was incurred) to arrive at the final
SRES pass-through amounts. The result is three discrete pass-through amounts, which are applied at the
final stage of the build-up of 2016–17 notified prices, according to the relevant underlying network tariff
class.
The calculations and pass-through amounts to apply to each settlement class are set out in Table 44.
95 Estimated in accordance with the QCA's weighted average cost of capital methodology. 96 A retail margin of 6.0445 per cent of total costs (excluding the margin) is equivalent to the 2015–16 retail
margin of 5.7 per cent of total costs (including the margin).
Public Record Exhibit 6
310

Queensland Competition Authority Appendix K: Cost pass-through
127
Table 44 SRES pass-through amounts for 2016–17 by settlement class
Energex NSLP—Residential, small business, unmetered supply and controlled load 9000 and 9100
Base SRES over-recovery in 2015–16 (c/kWh) 0.0060
+ Energy losses (total loss factor) 1.0650
+ Time value of money (%) 8.47%
Total over-recovery before application of retail margin and headroom ($2016–17 c/kWh) 0.0069
+ 2015–16 Retail margin (%) 6.0445%
+ Headroom allowance (%) 5%
SRES pass-through 2016–17 (c/kWh) –0.0077
Ergon Energy NSLP - Small, medium and large SAC demand and street lighting
Base SRES over-recovery in 2015–16 (c/kWh) 0.0060
+ Energy losses (total loss factor) 1.1230
+ Time value of money (%) 8.47%
Total over-recovery before application of retail margin and headroom ($2016–17 c/kWh) 0.0073
+ 2015–16 Retail margin (%) 6.0445%
+ Headroom allowance (%) 5%
SRES pass-through 2016–17 (c/kWh) –0.0081
Ergon Energy NSLP—High-voltage demand and customers over 4 GWh (SAC HV, CAC and ICC)
Base SRES over-recovery in 2015–16 (c/kWh) 0.0060
+ Energy losses (total loss factor) 1.0660
+ Time value of money (%) 8.47%
Total over-recovery before application of retail margin and headroom ($2016–17 c/kWh) 0.0069
+ 2015–16 Retail margin (%) 6.0445%
+ Headroom allowance (%) 5%
SRES pass-through 2016–17 (c/kWh) –0.0077
Public Record Exhibit 6
311

No. Company’s name Address Phone number Website
1
Hung Thinh Trading &
Construction Co., ltd
186 Giang Vo Street, Ba Dinh district, Hanoi,
Vietnam 043 8561381
2
Xuan HoaTrading & Service
Co., ltd
350 Buoi Street, Ba Dinh district, Hanoi,
Vietnam 043 8347524
3 Thanh Tu Co., ltd
D5/25 Lang Ha street, Ba Dinh district, Hanoi,
Vietnam 043 5638454
4 Nam Cuong Corporation
70 Linh Lang street, Ba Dinh district, Hanoi,
Vietnam 043 7663511http://namcuong.com.vn
5 Minh Quan JSC
158 Tran Duy Hung street, Cau Giay district,
Hanoi, Vietnam 043 7845157
6
Nam Thanh Trading and
Investment Consultancy JSC
21/199 Truong Chinh street, Dong Da district,
Hanoi, Vietnam 043 5635 793 http://www.cotanagroup.vn
7 Ngoc Bich Trading Co., ltd
260 Lang street, Dong Da district, Hanoi,
Vietnam 043 8531 303
8 Thinh Vuong Trading Co., ltd
890 Lang street, Dong Da district, Hanoi,
Vietnam 043 7751 070
9 Dang Dao co., ltd
43 Lang street, Dong Da district, Hanoi,
Vietnam 043 8531 620
10 Vinh Phuc Trade Co., ltd
P404B, 105 Lang Ha street, Dong Da district,
Hanoi, Vietnam 043 5623 011
11 Nhan Luat Co., ltd
9 Lang street, Dong Da district, Hanoi,
Vietnam 043 5145 862 http://nhanluat.com.vn
12
Binh Minh Production, Trading,
Import & Export Co., ltd
2 Lang Ha street, Dong Da district, Hanoi,
Vietnam 043 8353 303
13 Phu Minh Co., ltd
49 Vu Ngoc Phan street, Cau Giay district,
Hanoi, Vietnam 043 7730 650
Examples of Rod in coils agents and retailer in Vietnam
Public Record Exhibit 9
312

14 Dong Do Material Co., ltd
59 Nguyen Hong street, Ba Dinh district,
Hanoi, Vietnam 043 7763 310
15 Constrenxim Co., ltd
2 Nguyen Hong street, Ba Dinh district, Hanoi,
Vietnam 091 3343 877
16 Thanh Do Co., ltd 39 Tay Son, Dong Da district, Hanoi, Vietnam 043 5332 927
17
Ha Minh Services And Trading
JSC
20 Hoang Ngoc Phach street, Ba Dinh district,
Hanoi, Vietnam 043 8311 026
18
Hong Duong Engineering and
Trading Co., ltd
79B Vu Ngoc Phan street, Cau Giay district,
Hanoi, Vietnam 043 7762 865
19 C&T Material JSC
Room 706, 115 Le Duan street, Dong Da
district, Hanoi, Vietnam 043 9426 538
20
Kim Khi Trading & Processing
Co., ltd
621 Tam Trinh street, Hoang Mai district,
Hanoi, Vietnam 043 6450 856
21 Xuan Phuong Trading Co., ltd
52 Tam Trinh street, Hoang Mai district,
Hanoi, Vietnam 043 6451 017
22
Vinh Cat Material &
Construction Co., ltd
459 Tam Trinh street, Hoang Mai district,
Hanoi, Vietnam 043 6337 344
23 Viet Anh Trading Co., ltd
394 Minh Khai street, Hai Ba Trung district,
Hanoi, Vietnam 043 8626 789
24
Investment Construction
Trading I JSC
605 Minh Khai street, Hai Ba Trung district,
Hanoi, Vietnam 043 8621 374
25 Minh Phuong Trading Co., ltd
261 Vong street, Hai Ba Trung district, Hanoi,
Vietnam 043 8697 077
26 Minh Phuong Trading Co., ltd
221 Vong street, Hai Ba Trung district, Hanoi,
Vietnam 043 8697 077
27 Hong Ha Material Co., ltd
482 Minh Khai street, Hai Ba Trung district,
Hanoi, Vietnam 043 6333 750
28
Hanoi Construction Material
JSC
205 Ba Trieu street, Ha Ba trung district,
Hanoi, Vietnam 043 9760 303 http://www.cmchanoi.com.vn
29
Delta Civil Engineering
Construction Co., ltd
183 Ba Trieu street, Ha Ba trung district,
Hanoi, Vietnam 043 8217 885
Public Record Exhibit 9
313

30
TanCo Consulting and Trading
JSC
55 Lac Trung street, Hai Ba Trung district,
Hanoi, Vietnam 043 6362 414 http://tanco.com.vn
31 Thi Huong Trading Co., ltd
6 Tan Ap street, Ba Dinh district, Hanoi,
Vietnam 043 7165 325
32
Toan Dat Constrcution &
Trading JSC
32 Cau Tien – Giai Phong street, Hai Ba Trung
district, Hanoi, Vietnam 043 6414 726
33 Hanoi Steel & Trading Co., ltd
Km14, QL 6, Phu Lam Ward, Ha Dong district,
Hanoi, Vietnam 02433 504 735 http://thephanoi.com.vn
34 Hiep Huong Trading JSC
3 Vien May lane, Cau Giay district, Hanoi,
Vietnam 043792133 http://hiephuong.com.vn
35 Minh Duc Steel & Iron Co., ltd
10 M2 TT6 Bac Linh Dam, Dai Tu street,
Hoang Mai district, Hanoi, Vietnam 02439653333 http://satthepxaydung.com
36 Dai Ly Thep (agency)
204 Ho Tung Mau street, Bac Tu Liem district,
Ha Ni city, Vietnam 0123.623.6868 http://dailythep.com
37
Hai Phong Transportation &
Supplies Co., ltd
388 Le Thanh Tong street, Ngo Quyen district,
Hai Phong city, Vietnam 0313 750 534
38 Song Thin Co., ltd
1A Ton Duc Thang street, Le Chan district, Hai
Phong city, Vietnam 0313 701 290
39 MISCO Co., ltd
23 Le Thanh Tong street, Ngo Quyen district,
Hai Phong city, Vietnam 0313 767 451
40
Viet Han Industrial
Transportation & Supplies Co.,
ltd
42 Ho Sen street, Le Chan district, Hai Phong
city, Vietnam 0313 739 808
41 Thai Hung Trading JSC
10/5 Gia Sang street, Thai Nguyen province,
Vietnam 0280 3855 276 http://www.thaihung.vn
42 Thanh Hung Co., ltd
50 Phan Dinh Phung street, Vinh city, Nghe An
province, Vietnam 038 3841 519
43
Hanoi Construction
Corporation (CT 6)
205 Le Duan street, Vinh city, Nghe An
province, Vietnam 038 3844 737 http://www.hancorp.com.vn
44
Hoang Long Steel Import
Export Co., ltd
557/5 Huong Lo 3 street, Binh Tan district, Ho
Chi Minh, Vietnam 0286065402616 http://satthephoanglong.com
45 Tan Thanh Loi Co., ltd
629 Hung Vuong Highway, Cam Ranh city,
Khanh Hoa province, Vietnam 05803857681 http://thepxaydung.bizz.vn/
Public Record Exhibit 9
314

46 Ngoc Linh Co., ltd
212 Ky Dong distric, Thanh Khe district, Da
Nang, Vietnam 02363725858 http://www.ngoclinhdn.com.vn
47
Hoang Viet Construction Steel
Co., ltd
121A Kenh19-5, Tan Phu district, Ho Chi Minh,
Vietnam 0866576779 http://thephoangviet.com
48
Nguyen Phat Steel Trading Co.,
ltd
9/11 Phung Chi Kien street, Tan Phu district,
Ho Chi Minh, Vietnam 0838473749 http://thepnguyenphat.com
49 Ngoc Chinh Steel Co., ltd
264/40A Le Van Quoi street, Binh Tan district,
Ho Chi Minh, Vietnam 0902 835 379 http://thepngocchinh.bizz.vn
50 Haminco Co., ltd
34, 882 street, 9 district, Ho Chi Minh,
Vietnam 0904 411 822 http://haminco.com.vn
51
Van Vinh Trading, Service and
Manufacturing Co., ltd
20/5 Khu pho 2, 12 district, Ho Chi Minh,
Vietnam 0837156690 http://vanvinh.com.vn
52 Nhat Truong Vinh Co., ltd
Lot 1, 1A street, Tan Tao Industrial Zone, Binh
Tan district, Vietnam 028 37547000 http://ntv.com.vn
53 Nguyen Thinh Co., ltd
1A Highway, Dien Ban district, Quang Nam
province, Vietnam 0235 3715757 http://nguyenthinhvlxd.com
54
Son Tra Trading,
Manufacturing and
Construction Co., ltd
5/10 Khu pho 1, Bien Hoa city, Dong Nai
province, Vietnam 0251 3829041 http://satthepsontra.bizz.vn
55 Kho Vinh Tam Co., ltd
K71/9 Tran Khanh Du street, Ngu Hanh Son
district, Da Nang, Vietnam 0236 3922889 http://khoivinhtam.com.vn
56 Hoa Loi Steel Co., ltd
557/35/9 Huong Lo 3 street, Binh Tan district,
Ho Chi Minh, Vietnam 0902534377 http://www.thephoaloi.vn
57 Van Thanh Cong Co., ltd
412 Group 5, 2 Neighborhood, Bien Hoa city,
Dong Nai province, Vietnam 0251 3899962 http://vanthanhcong.bizz.vn
58 Ha Noi Industrial Steel Co., ltd
53 Warehouse, Long Bien district, Ha Noi,
Vietnam 024 85892918 http://www.thepcongnghiep.com.vn
59
Tuan Phat Steel Trading,
Import Export Co., ltd
48/8 Me Linh street, Binh Thanh district, Ha
Noi, Vietnam 028 54274048 http://www.tuanphatsteel.com
60 Truong Son Steel JSC
110 Hoa Cuc street, Phu Nhuan district, Ho
Chi Minh, Vietnam 028 35173804 http://truongsonsteel.vn/
61 Tan Hung Steel JSC
1.5 Lane, Dau 2 Village, Hoai Duc district, Ha
Noi, Vietnam 024 22213826 http://www.theptanhung.com.vn
Public Record Exhibit 9
315

62 Minh Tu Co., ltd
Tra Noc Industrial Zone, O Mon district, Can
Tho province, Vietnam 0292 3861500 http://www.minhtu.com.vn
63 Phuoc Loc Thanh BBS JSC
299F6, Song Giong Group, 2 district, Ho Chi
Minh, Vietnam 028 37430658 http://www.minhtu.com.vn
64
Thai Hoang Hung Investment
Trading JSC
68 Nguyen Hue street, 1 district, Ho Chi Minh,
Vietnam 028 62883067 http://thaihoangsteel.com
65 Bao Tin Steel Co., ltd
100 Tran Thi Co street, 12 district, Ho Chi
Minh, Vietnam 028 62593033 http://www.thepbaotin.com/
66
Mai Khoa Steel Import Export
Co., ltd
1016 Truong Sa street, 3 district, Ho Chi Minh,
Vietnam 028 39310958 http://www.maikhoasteel.com
67
Phuong Hoang Diêu Steel Co.,
ltd
3 Group, Dinh Hoa ward, Thu Dau Mot
district, Binh Duong, Vietnam 0274 3884809 http://www.thepphuonghoangdieu.com
68
Viet Nhat Steel Trading &
Manufacturing Co., ltd
205 Nguyen Duy Trinh, 2 district, Ho Chi
Minh, Vietnam 028 37430844 http://www.tonthepvietnhat.com
69 Viet Tin Steel Co., ltd
107, Map no.13, Da Hoi Group, Chau Khue
ward, Tu Son district, Bac Ninh, Vietnam 0932283783 http://thepviettin.bizz.vn
70
Tan Quang Material &
Construction JSC
8, 10 Doan Ke Thien street, Cau Giay district,
Hanoi, Vietnam 024 37644234 http://tanquangsteel.com.vn/
71
Vu Gia VNT Investment
Trading Co., ltd
4/23/2A, 3 street, 5 group, Thu Duc district,
Ho Chi Minh, Vietnam 028 37267150 http://www.thepvugia.com
72 Thanh Loi Co., ltd
78 Ngo Quyen street, 10 district, Ho Chi Minh,
Vietnam 028 39573966 http://thanhloisteel.com
73 An Phu JSC
42 Truong Chinh street, Dong Da district,
Hanoi, Vietnam 02436285648 http://thepanphu.com
74 Sai Gon Steel Trading Co., ltd
685/13H Xo Viet Nghe Tinh street, Binh Thanh
district, Ho Chi Minh, Vietnam 028 62586459 http://thepsaigon.vn
75 Hai Long Steel Co., ltd
112/12 An Nhon street, Di An Town, Ho Chi
Minh, Vietnam 028 62702334 http://tonthephailong.com
76
Kim Ngan Steel Investment,
Import Export Co., ltd
82/15 Huynh Van Nghe street, Tan Binh
district, Ho Chi Minh, Vietnam 028 66706868 http://tonthephailong.com
Public Record Exhibit 9
316

77 Thu Duc Steel JSC
Km9, Hanoi Highway, Thu Duc district, Ho Chi
Minh, Vietnam 028 38969612 http://www.thepthuduc.com.vn/
78 Dang Nguyen Steel Co., ltd
20B/8, Binh Thung 2 street, Di An Town, Binh
Duong, Vietnam 0274 3772628
http://satthepdangnguyen.blogspot.co
m
79 Thuan Loi Steel Co., ltd
240 Thoai Ngoc Hau street, Tan Phu district,
Ho Chi Minh, Vietnam 0909037678 http://www.thuanloisteel.com
80 Thuy Si Steel & Investment JSC
61 Nguyen Phuoc Tan street, Cam Le district,
Da Nang, Vietnam 0236 2816146 http://thuysisteel.com.vn
Public Record Exhibit 9
317