The Impact of Industry Collaboration on Academic Research Output: A Dynamic Panel Data Analysis
39
The Impact of Industry Collaboration on Research: Evidence from Engineering Academics in the UK ∗ Albert Banal-Estanol Mireia Jofre-Bonet Cornelia Meissner † August 2010 Abstract We study the impact of university-industry research collaborations on academic output, in terms of productivity and direction of research. We report findings from a longitudinal dataset on all the researchers from the engineering departments in the UK in the last 20 years. We control for the endogeneity caused by the dynamic nature of research and the existence of reverse causality. Our results indicate that researchers with industrial links publish significantly more. Productivity, though, is higher for low levels of industry involvement. Moreover, growing ties with the industry skew research towards a more applied approach. Keywords: industry-science links, research collaborations, basic vs. applied re- search. JEL codes: O3, L31, I23 ∗ The authors express their gratitude to Michael Ben-Gad, Ines Macho-Stadler, Alistair McGuire, Gabriel Montes-Rojas, Markus Perkmann, Dan Peled, Jo Seldeslachts and seminar participants at City University, University of Sheffield, Univeristy of Munich, DRUID conference (Copenhagen), Jornadas de Economía Industrial (Reus), ASSET conference (Istambul) and MOVE workshop on R&D and Technology Tranfer (Barcelona) for helpful comments and criticisms and the Engineering and Physical Sciences Research Council, the National Science Foundation and the European Patent Office for providing the data. We also thank Kamil Dabrowski for excellent research assistance. Financial support from the Pump priming fund at City and ESRC research grant RES-000-22-2806 is gratefully acknowledged. † Banal-Estañol: Universitat Pompeu Fabra and City University ([email protected]). Jofre- Bonet: City Univeristy ([email protected]). Meissner: City Univeristy ([email protected]). 1
Transcript of The Impact of Industry Collaboration on Academic Research Output: A Dynamic Panel Data Analysis

The Impact of Industry Collaboration on Research:
Evidence from Engineering Academics in the UK∗
Albert Banal-Estanol Mireia Jofre-Bonet Cornelia Meissner†
August 2010
Abstract
We study the impact of university-industry research collaborations on academic
output, in terms of productivity and direction of research. We report findings from
a longitudinal dataset on all the researchers from the engineering departments in
the UK in the last 20 years. We control for the endogeneity caused by the dynamic
nature of research and the existence of reverse causality. Our results indicate that
researchers with industrial links publish significantly more. Productivity, though,
is higher for low levels of industry involvement. Moreover, growing ties with the
industry skew research towards a more applied approach.
Keywords: industry-science links, research collaborations, basic vs. applied re-
search. JEL codes: O3, L31, I23
∗The authors express their gratitude to Michael Ben-Gad, Ines Macho-Stadler, Alistair McGuire,
Gabriel Montes-Rojas, Markus Perkmann, Dan Peled, Jo Seldeslachts and seminar participants at City
University, University of Sheffield, Univeristy of Munich, DRUID conference (Copenhagen), Jornadas de
Economía Industrial (Reus), ASSET conference (Istambul) and MOVE workshop on R&D and Technology
Tranfer (Barcelona) for helpful comments and criticisms and the Engineering and Physical Sciences
Research Council, the National Science Foundation and the European Patent Office for providing the
data. We also thank Kamil Dabrowski for excellent research assistance. Financial support from the
Pump priming fund at City and ESRC research grant RES-000-22-2806 is gratefully acknowledged.†Banal-Estañol: Universitat Pompeu Fabra and City University ([email protected]). Jofre-
Bonet: City Univeristy ([email protected]). Meissner: City Univeristy ([email protected]).
1

1 Introduction
In a modern economy it is essential to transform scientific research into competitive ad-
vantages. In the US, extensive collaboration between universities and industry and the
ensuing transfer of scientific knowledge has been viewed as one of the main contributors
to the successful technological innovation and economic growth of the past three decades
(Hall, 2004). At the same time, the insufficient interaction between universities and firms
in the EU is, according to a report of the European Commission (1995) itself, one of
the main factors for the poor commercial and technological performance of the EU in
high-tech sectors.
Nowadays, increasing the transfer of knowledge from universities to industry is a pri-
mary policy aim in most developed economies. In the 1980s, spurred by the so-called
competitiveness crisis, the US introduced a series of structural changes in the intellectual
property regime accompanied by several incentive programs, designed specifically to pro-
mote collaboration between universities and industry (Lee, 2000).1 Almost 30 years on,
many elements of the US system of knowledge transfer have been emulated in many other
parts of the world.2
The increased incentives (and pressures) to collaborate with industry have controver-
sial side effects on the production of scientific research itself. Nelson (2004) argues that
industry involvement might delay or suppress scientific publication and the dissemination
of preliminary results, endangering the “intellectual commons” and the practices of “open
1As documented by Poyago-Theotky et al. (2002) the US passed during the 1980s: (i) the Bayh-Dole
act (1980) that allowed universities to own and license patents emanting from federally funded research;
(ii) the National Cooperative Research Act (1984) that reduced antitrust penalties from engaging in
research joint ventures; (iii) the Omnibus and Trade and Competitiveness Act (1988) that established
the Advanced Technology Program, which supports collaborative research projects in generic technolo-
gies. During this decade, the National Science Foundation also substantially increased the funding for
University-Industry Cooperative Research Centers.2The UK Government, for example, published in 1993 a White Paper on Science, Engineering and
Technology, which set out a strategy to improve welfare by exploiting the UK strengths in science and
engineering.
2

science” (Dasgupta and David, 1994). Florida and Cohen (1999) claim that industry col-
laboration might come at the expense of basic research: growing ties with industry might
be affecting the choice of research projects, “skewing” academic research from a basic
towards an applied approach.
Faculty contributing to knowledge and technology transfer, on the other hand, main-
tain that industry collaboration complements their own academic research by securing
funds for graduate students and lab equipment, and by providing them with ideas for
their own research (Lee, 2000). Financial rewards might even have a positive impact
on the production of basic research because basic and applied research efforts might be
complementary (Thursby et al., 2007) or because they might induce a selection of riskier
research programmes (Banal-Estañol and Macho-Stadler, 2010).3
These claims bring forward two questions for empirical research: (1) Does collaboration
with industry affect researchers’ productivity in terms of publication rates? (2) Does
collaboration with industry shift the focus away from basic research? Previous research
has investigated these questions using patents and licensing and the formation of start-
up companies as measures of industry collaboration (see Geuna and Nesta, 2006, and
Baldini, 2008, for recent reviews).4 Many papers, however, have stressed the relatively
small role of the commercialisation of intellectual property rights relative to other channels
of knowledge transfer. Collaborative links through joint research, consulting or training
arrangements are far more important transmission channels for the industry than patents,
licenses and spin-offs (Cohen et al. 2002). Academics believe that patents account for
less than 10% of the knowledge transferred from their labs (Agrawal and Henderson,
2002). Contract research or joint research agreements are far more widespread (D’Este
and Patel, 2007), especially in Europe (Geuna and Nesta, 2006). Possibly due to the
3This debate has now reached society at large. Many public channels, including the BBC (through the
BBC Radio 4 programme ‘In Business’, October 13, 2005), The Guardian (August 5, 2005 and January
27, 2007), The Observer (April 4, 2004), have addressed the consequences of increased university-industry
collaborations.4A different strand of literature has studied the effects of university spillovers and industry-science
links on firm performance (Jaffe, 1989, Cassiman et al. 2008).
3

lack of comparable data, though, we still know very little about the impact of more
collaborative forms of university-industry interactions.
To fill this gap, we compiled a unique, longitudinal dataset containing academic re-
search output (publications), research funds and patents for all the academics that were
employed at all the Engineering Departments of 40 major UK universities between 1985
and 2007. We concentrate on the engineering sector, as it has traditionally been associ-
ated with applied research and industry collaboration and it contributes substantially to
industrial R&D (Cohen et al. 2002). Comparing the effect of grants with and without
industry partners, we can identify the individual impact of industrial collaboration on
academic productivity. Following the academics over time we are also able to control for
individual characteristics, potential reverse causality problems, and the dynamic effect of
publications. Moreover, since our dataset contains the majority of academic engineers in
the UK, our results are not driven by the most successful researchers, those at a single
university, or academic inventors alone.
As a first contribution, we uncover two countervailing effects in the impact of collab-
orative research on academic research output. Researchers with no industry involvement
are predicted to publish less than those with a small degree of collaboration. Nevertheless,
higher levels of industry involvement negatively affect research productivity. Therefore,
the existence of industry partners is positive but the intensity of industry collaboration is
negative. The predicted publication rate of an academic with an average level of collab-
oration is higher than that of an academic with no collaborative funding. But, for higher
levels of collaboration, the predicted number of publications turns out to be lower, and
can even be lower than for those with no funding at all.
We show that it is key to take into account the inherent endogeneity problems caused
by the dynamic effects and the existence of reverse causality. As shown by previous
papers (e.g. Arora et al. 1998, Agrawal and Henderson, 2002), past, present and future
publications are correlated. If one does not include past publications in the regression,
industry collaboration would capture the positive effects of past productivity and it would
appear to be unambiguously good. But if one includes lags of the dependent variable, there
4

are endogeneity problems. Further, successful, productive researchers are better placed
to attract interest from industry. Industry collaboration can be the consequence, and
not just the cause, of high numbers of publications. We therefore use a dynamic panel
data estimation method in which the lagged dependent variable and other endogenous
variables are instrumented for.
Our results bolster empirical evidence from previous surveys and cross-sectional studies
by establishing a causal relationship between collaborative research and academic output.
Some survey studies suggest that industry involvement is linked to higher academic pro-
ductivity (e.g. Gulbrandsen and Smeby, 2005).5 Once controlling for endogeneity, we
still find supportive evidence for the positive impact of the presence of collaboration on
research output. The negative effect of the intensity of collaboration is also consistent
with other survey results (Blumenthal et al., 1986) and cross-section empirical evidence
(Manjarres-Henriquez et al., 2009). We are only aware of one (two-period) panel study
that is able to control for individual characteristics: Goldfarb (2008) documents a de-
crease in the academic output from 1981-1987 to 1988-1994 for the average researcher in
a sample of 221 university researchers repeatedly funded by the NASA.6
The second main contribution of this paper is to show that industry collaboration has a
negative effect on the number of basic research articles while it increases the more applied
type of research publications. These results are consistent with the “skewing” effect of
industry involvement on direction and focus of research pointed out by questionnaire data
studies. Blumenthal et al. (1986) and Gulbrandsen and Smeby (2005), for example, report
that the choices of research topics of academics whose research is supported by industry
were biased by their commercial potential. Instead, the empirical papers using patenting
and licensing as measures of industry involvement fail to find evidence of a negative effect
of patenting on the number of basic publications (Breschi et al., 2008; Calderini et al.
2007; Hicks and Hamilton, 1999; Thursby and Thursby, 2002, 2007; van Looy et al.,
5As argued by Blumenthal et al. (1986), “the most obvious explanation for this observed relation [...]
is that companies selectively support talented and energetic faculty who were already highly productive”.6The NASA, despite not being an industrial partner, is a very programmatic, mission-oriented gov-
ernment agency.
5

2006).7 We believe that our findings are the first to firmly establish the presence of a
“skewing” effect.
The third contribution of this study is to compare and separate out the effects of
collaboration sponsored through research grants with industrial partners from the effects
of patenting. After controlling for the dynamic nature of the publication process and the
endogeneity of partnerships with the industry, we find that patenting does not hinder or
delay the publication of research results but does not affect it positively either. These
findings diverge from most recent empirical studies suggesting a positive relationship be-
tween patenting and publication rates (Azoulay et al., 2009; Breschi et al., 2008; Calderini
et al. 2007; Fabrizio and DiMinin, 2008; Stephan et al., 2007; van Looy et al., 2005).8
Our results are most consistent with those of Agrawal and Henderson (2002), who found
that patenting did not affect publishing rates of 236 scientists in two MIT departments
in a 15-year panel, and those of Goldfarb et al. (2009) who report similar results for the
effect of licensing on the number of publications for 57 inventors at Stanford University
in an 11-year panel.
The paper is organised as follows. In section 2 we describe the dataset and intro-
duce our empirical strategy. Section 3 presents our main results, discussing in detail the
problem of endogeneity. Section 4 discusses and concludes.
7Thursby and Thursby (2002), for example, conclude that changes in the direction of faculty research
seem to be relatively less important than other factors in explaining the increased licensing activity.
Thursby and Thursby (2007), as Hicks and Hamilton (1999) earlier, find no systematic change in the
proportion of publications in basic versus applied journals between 1983 and 1999.8Fabrizio and DiMinin (2008), for instance, found a positive effect of researchers’ patent stocks on
publication counts in a sample of 166 academic inventors as compared to a matched set of non-patenting
scientists. Azoulay et al. (2009) observe that both the flow and the stock of scientists’ patents are
positively related to subsequent publication rates without comprising the quality of the published research.
6

2 Empirical Strategy
2.1 Data
We created a unique longitudinal dataset containing demographic characteristics, publi-
cations, research funds and patents for all researchers employed at the Engineering De-
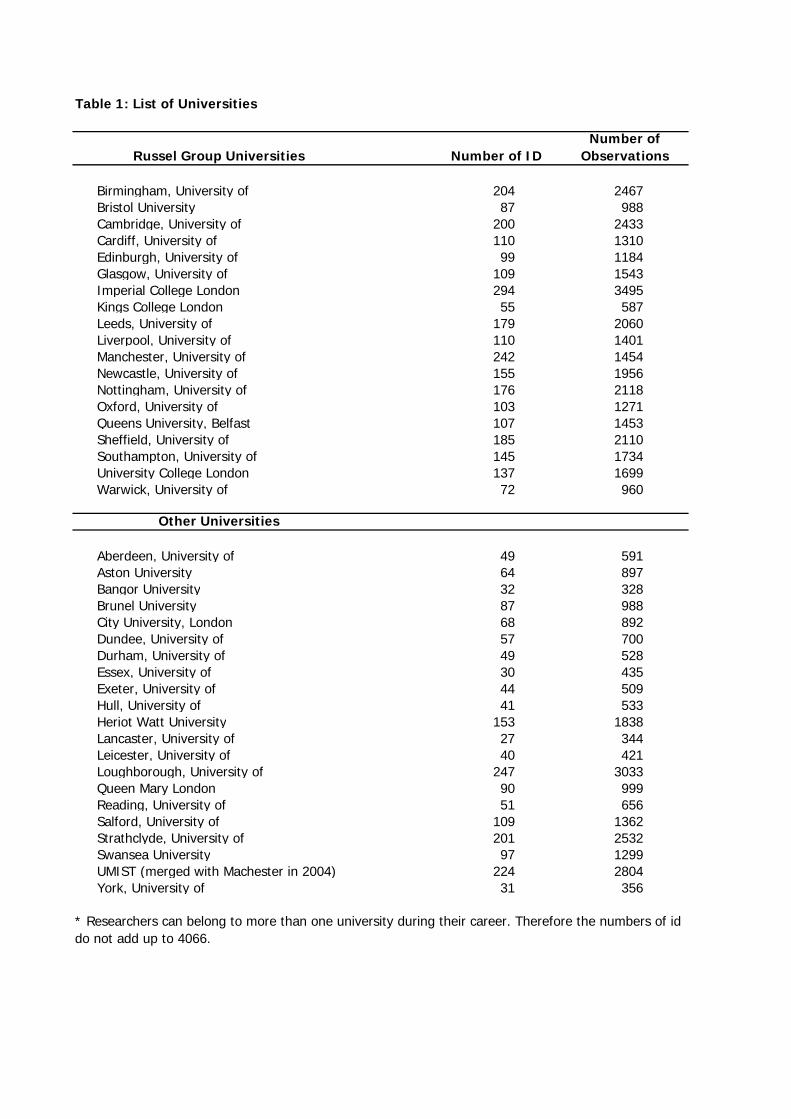
partments of 40 major UK universities between 1985 and 2007 (see Table 1 for a list of
universities). Starting from all universities with engineering departments in the UK, we
discarded those for which university calendars providing detailed staff information were
available for less than five years. Our final sample contains 40 major universities, includ-
ing all the 19 universities that are members of the prestigious Russell Group, a coalition of
research intensive UK universities, as well as 21 comprehensive universities and technical
institutions.
We retrieved names and academic ranks of university researchers from university cal-
endars.9 We focused on academic staff carrying out both teaching and research and did
not consider research officers or teaching assistants. Whenever possible, we obtained full
names (first and last name), when not possible, we had to record last names with the two
initials of the first name. We followed the researchers’ career paths between the different
universities in our dataset.10 Academics leave (and join or rejoin) our dataset at different
stages in their career, when they move to (or from) abroad, industry, departments other
than engineering (e.g. chemistry, physics, computer science), or universities not part of
our dataset. In total we collected 7,707 individuals, 5,172 of which remain in our dataset
for six years or more. They represent the basis for our data collection and enable us to
retrieve information on publications, research funds and patents.
9University calendars and prospectuses are available through the British Library, which by Act of
Parliament is entitled to receive a free copy of every item published in the United Kingdom. This data
was supplemented with information from the Internet Archive. The Internet Archive is a not-for-profit
organisation maintaining a free Internet library, committed to offering access to digital collections. Their
collection dates back to 1996 and enabled us to retrieve information from outdated Internet sites.10This was done by matching names and subject areas and checking websites of the researchers.
7

Publications. Data on publications was derived from the ISI Science Citation Index
(SCI). The number of publications in peer-reviewed journals even if not the only measure
is the best recorded and the most accepted measure for research output as publications
are essential in gaining scientific reputation and for career advancements (Dasgupta and
David, 1994). We collected information on all the articles published by researchers in
our database while they were employed at one of the 40 institutions in our sample. Most
entries in the SCI database include detailed address data that allowed us to identify
institutional affiliations and unequivocally assign articles to individual researchers.11
Research funds. The information on industry collaborations are based on grants given
by the Engineering and Physical Sciences Research Council (EPSRC), the main UK gov-
ernment agency for funding research in engineering and the physical sciences. Each award
holds information on research collaborators, and grants with one or more industry partner
are considered “collaborative grants”. As defined by the EPSRC, “Collaborative Research
Grants are grants led by academic researchers, but involve other partners. Partners gen-
erally contribute either cash or ‘in-kind’ services to the full economic cost of the research.”
The EPSRC encourages research in collaboration with the industry. As a result, around
35% of EPSRC grants presently involve partners from industry. The volume of EPSRC
grants with industry partners cannot be taken as a proxy for direct funding from the
industry. But, since the EPSRC is by far the largest provider of funding for research in
engineering (amounting to around 50% of overall funding), these mediated partnerships
allow for a very comprehensive (and homogeneous) insight into the dynamics of university-
industry collaborations. Our database contains information on start year and duration of
the grant, total amount of funding, names of principal investigators and coinvestigators,
institution of the principal investigators (the grant receiving institution), and names of
partner organisations. Data on these grants is available from 1986 onwards.
11Publications without address data had to be ignored. However, we expect this missing information
to be random and to not affect the data systematically.
8

Patents. Patent data was obtained from the European Patent Office (EPO) database.
We collected those patents that identify the aforementioned researchers as inventors and
were filed while they were employed at one of the 40 institutions. We not only consider
patents filed by the universities themselves but also those assigned to third parties, e.g.
industry or government agents. The filing date of a patent was recorded as representing
the closest date to invention. Since the filing process can take several years, we were
only able to include patents awarded by 2007, hence filed before 2005.12 The EPO covers
only a subsample of patents filed with the UK Intellectual Property Office (UKIPO).
Nevertheless, those patents that are taken to the EPO may probably be those with higher
economic potential and/or quality (Maurseth and Verspagen, 2002).
Sample. Limited information on patents and grants reduced our sample period to
1986-2004. We further excluded all inactive researchers (those with neither publications,
patents or funds during the entire sample period). This left us with a final sample con-
sisting of 4,066 individuals, with 44,722 year observations, 75,380 publications, 29,347
research projects, and 1,828 patents.
2.2 Variables and Descriptive Statistics
In this section we define the variables used to estimate our models. We created measures
of research output, research collaboration, patents, and time variant and time invariant
control variables. Russell Group universities are considered research intensive institutions
and attract most of the UK’s research funding, we therefore display all summary statistics
separately for researchers at universities belonging to the Russell Group and for researchers
that are not.12Just like previous studies (see e.g. Fabrizio and DiMinin, 2008), data construction requires a manual
search in the inventor database to identify the entries that were truly the same inventor and to exclude
others with similar or identical names. This was done comparing address, title and technology class for
all patents potentially attributable to each inventor. The EPO database is problematic in that many
inventions have multiple entries. It was therefore necessary to compare priority numbers to ensure that
each invention is only included once in our data.
9

Research output. As a measure of research output, we consider the normal count
of publications (the number of publications for which the researcher is an author) in
accordance with the majority of studies on industry collaboration. However, publication
counts might be misleading for articles with a large number of authors and may not
reflect a researcher’s effective productivity. We therefore additionally obtain the “co-
author-weighted” count of publications for which we weight a publication associated to
an academic by the inverse of the publication’s number of coauthors.13
To investigate the question whether researchers with links to industry publish articles
of lower quality we use the “impact-factor-weighted” sum of publications (with the weights
being the impact attributed to the publishing journal) as an additional proxy of academic
publishing activity. To do so, we use the SCI Journal Impact Factor (JIF), a measure
of importance attribution based on the number of citations a journal receives to adjust
for relative quality. Though not a direct measure for quality, the JIF represents the
importance attributed to a particular article by peer review. As the JIF of journals
differs between years, and journals are constantly added to the SCI, we collected JIFs
for all the years 1985-2007, to capture all SCI journals and to allow for variation in the
impact factor.
Figure 1 shows that the average number of publications per staff was rising continu-
ously over the sample period, in both the Russell Group and the Non-Russell Group of
universities.14 Table 2 shows the all-time averages and the differences between the two
groups of universities and it shows that the average number of publications per member
of staff per year is significantly higher for the elite Russell Group of universities (1.67 vs.
1.10). The difference in publications between the Russell Group universities and the rest
stays significant even after we take into account the number of coauthors (0.61 vs. 0.42)
or we adjust for quality (1.77 vs. 0.97).
13Formally, the coauthor weighted count of a researcher i in year t is given byPPubit
p=11
Coaitp, where
Pubit is his number of publications in that year and Coaitp is the number of coauthors of an article p.14Several papers have documented a trend towards increasing multi-coauthorship (see Katz and Martin,
1997), but, even after we control for the number of coauthors we still find that the publication count has
at least tripled between 1985 and 2007.
10

As an indicator of the direction of research we use the Patent board (formerly CHI)
classification (version 2005), developed by Narin et al. (1976) and updated by Kimberley
Hamilton for the National Science Foundation (NSF). Based on cross-citations matrices
between journals, it characterises the general research orientation of journals, distinguish-
ing between (1) applied technology, (2) engineering and technological science, (3) applied
and targeted basic research, and (4) basic scientific research. Godin (1996) and van Looy
et al. (2006) reinterpreted the categories as (1) applied technology, (2) basic technology,
(3) applied science, and (4) basic science; and grouped the first two as “technology” and
the last two as “science”. Due to the applied character of engineering science, categories
1 and 2 represent 27% and 46% of all publications whereas category 4 only represents 7%
of the articles in our sample.
Collaborative research and patents. Principal investigators and coinvestigators on
sponsored projects are understood to contribute to the research project and benefit from
generated outcomes. To account for the participation of all investigators, we divided the
total monetary income from the research grants between the principal investigator (PI)
and her named coinvestigator(s). Although we include coinvestigators as beneficiaries of
the grant, we positively discriminated PIs by assigning them half of the grant value and
splitting the remaining 50% amongst their coinvestigators. PIs are assigned a major part
of the grant as they are expected to be responsible for the leadership of the research and
to profit most from a successful partnership. We additionally spread the grant value over
the whole award period, i.e., if the grant is 2 years we split it equally across those 2
years, if it is over 3 or more years, the first and the last years (which are assumed to not
represent full calendar years) receive 25% each, the remaining 50% is split equally across
the intermediate years.15 This is done in order to account for the ongoing benefits and
implications of a project and to mitigate against the effect of focusing all the funds at the
15Formally, if Fundi,s,d,f is the monetary value of a grant f received by researcher i with start year s
and duration d, the value of the grant assigned to a year t is: (i) for d = 1, Fundi,s,d,f when t = s; (ii) for
d = 2,Fundi,s,d,f
2 when t = s and t = s+ 1; and, (iii) for d > 2, Fundi,s,d,f2(d−1) when t = s and t = s+ d− 1and Fundi,s,d,f
d−1 when s < t < s+ d− 1.
11

start of the project.
We use a 5-year window to calculate the stock of “accumulated” collaboration to better
capture the “permanent” profile of an academic. We constructed two time-variant dummy
variables, which allow for a differential effect for researchers who received funding that
did not involve industry collaboration, and for researchers who collaborated with industry
in the 5 years preceding the publication. Since our objective is to evaluate not only the
influence of the existence of industry partners but also the intensity of collaboration
activity, we also compute the fraction of funds with one or more industry partners over
all EPSRC funds.
Figure 2 reports the percentage of industry collaboration and shows that the two
groups of universities do not seem to differ much. Table 2 reveals that these differences,
no matter how small, are still significant and on average the percentage of industry col-
laboration is slightly higher (33% vs. 31%) for Russell Group universities. Figure 2 gives
evidence of a sudden increase in industry partnerships in the mid-1990s and a stagna-
tion in recent years, which affected all UK universities equally. This might imply severe
changes in funding allocation through the UK research councils following the government’s
White Papers from 1991 and 1993, which outlined changes in the structure of funding and
higher education.
As mentioned above, we aim to separate the effect of patenting from the effect of
industry collaboration. To measure the impact of academic patenting on timing and rate
of publications, we use the number of patents filed during the same year and the two
years preceding the publication. Researchers in Europe, unlike the US, cannot benefit
from a “grace period” and hence they have to withhold any publication related to the
patent until the patent is filed. Publications might be released once the patent is filed.
We therefore expect a lag of up to 2 years between invention and publication in a journal.
We can see from Table 2 that the average number of patents differs significantly between
the two groups of universities (0.04 vs. 0.03). The values are very small for both groups
but the average number of patents filed by researchers has increased substantially over
the past 20 years and in particular after 1995 (from 0.03 in 1985 to 0.06 in 2003).
12

Control Variables. Research productivity and collaborative activity might be linked
to the researchers’ personal attributes such as sex, age, education and academic rank.
Some of these attributes, however, do not vary over time and therefore they do not play a
role in the dynamic variation, which is the focus of this paper. Academic rank is the only
time-variant observable characteristic in our dataset. Thus we incorporate information
on the evolution of researchers’ academic status from lecturer to senior lecturer, reader
and professor into our analysis. Lecturer and senior lecturer correspond to the assistant
professor in the US, whereas reader would be equivalent to associate professor. Year
dummies are included in all regressions to control for time effects in our panel.
Interaction Variables. The effect of industry collaboration on research output might
additionally differ for different types of academics. We therefore interact our measures of
industry collaboration with several categories of individuals in some of our models.
Firstly, since the descriptive statistics above show significant differences between the
two types of universities, we interact membership to the Russell Group with the mea-
sures of industry collaboration. Most of the previous literature on the impact of industry
collaboration (e.g. Agrawal and Henderson, 2002, Thursby and Thursby, 2007) only use
data on researchers at top universities (in terms of research or patents). However, the
benefits and costs of collaborative projects differ depending on the institutional culture
(Owen-Smith and Powell, 2001; Levin and Stephan, 1991) and might therefore lead to
differential impact of industry collaboration on publication outputs. For the UK, Geuna
(1997) finds that universities with small science, engineering or medical departments pub-
lish fewer papers and receive less grants than other universities, but that a larger share
of these grants comes from industry.
Secondly, several papers have argued that the most able researchers, which in this
paper we label as stars, may differ considerably from the rest of academia in that they are
more able to combine academic and commercial research. Publication stars are not only
found to collaborate more with industry, but they also produce more patents (Zucker and
Darby, 1996; Stephan et al. 2007). However, they also have plenty more opportunities
to conduct their research and do not need to adjust to specific societal needs (Goldfarb,
13

2008). We hence expect the impact of industry collaboration to differ for these stars.
As stars we define all those researchers that are on the top 25 percentile of research
productivity, with an average of 2 or more articles per year.
Thirdly, the impact of industry partnerships on the publication behaviour of senior
academics, who have more experience and an established network of research partners,
may differ from that of younger researchers, who pursue publications to further their
career (Dasgupta and David, 1994). The changes in university culture and the increasing
emphasise on collaboration, however, have been recent developments and it might be that
researchers at the start of their career best adjust to these new requirements. We therefore
create a binary variable that determines whether the researcher is at the start (lecturer
or senior lecturer) or at a later stage of her career (reader or professor).
2.3 Empirical Model
We base our empirical specification on the implicit assumption that the utility of an acad-
emic in a given year depends on her academic reputation and status, which are determined
by the stream of academic research output (past and present publications in peer-reviewed
journals), on the amount of research grants generated (research council funds), and on
commercial output (number of patents). Publications, grants and patents are directly
linked to how much time or effort the academic devotes to research, to collaboration with
industry, and to teaching and other activities. The time devoted to collaboration with
the industry may pose a trade-off for academic research output, as it might provide new
ideas but also crowd out time for research.
The optimal time allocation problem for the academic consists of choosing the utility
maximising fraction of time she devotes to each activity. The associated first-order con-
ditions involve first derivatives of the utility function with respect to the time devoted
to research and to collaboration with industry. Thus, for any utility function which is
not linear in publications, the first order conditions define an implicit function by which
publications can be expressed as a function of the relative time dedicated to collaborate
with industry. This function will of course be conditional to time-variant and invariant
14

socio-demographic characteristics of the academic, and past publications.
To estimate how collaboration with the industry affects research output, we estimate a
dynamic model where current publications are influenced not only by past publications but
also by the degree of collaboration with industry. We choose a specification that allows
current publications to be affected by the existence and the intensity of collaborative
funding. To do so, we include a dummy for having had any type of EPSRC past funding
in the last five years, another dummy for having had EPSRC funding with industry
partners, and then a variable that measures which fraction of the overall funding was
joint with industry. By including a dummy (intercept) and a continuous variable (slope),
we intend to capture the trade-off of industry collaboration on publications described
above.16
Accordingly, we formulate our reduced form equations as:
ln yit = β0+Pj=1,2
αj ln yi,t−j+β1fit+β2indfit+β3 ln indintit+P
k=1,2,3
γkpit−1−k+δx0it+μi+vit
where yit represents academic i’s research output at time t, β0 a constant, fit is an indicator
variable for having received any kind of EPSRC funds; indfit is an indicator variable for
having received EPSRC funding with industry partners; indintit measures the intensity
of the collaboration with industry; pit, are indicator variables for having filed patents;
and xit is a vector time-variant explanatory variables including tenure rank. Note that
the constant and the two dummies need not be collinear as they are not exclusive. The
parameters β0, β1, and β2 capture the incremental effect of different sources of funding. An
academic with no funding at all will only have a constant term equal to β0, one academic
with non-industrial EPSRC β0 + β1, and, one academic with EPSRC grants with the
industry β0 + β1 + β2. Since the distribution of grants and academic research output
has been found to be highly skewed (D’Este and Fontana, 2007), we take logarithms of
both measures. The error term contains two sources of error: the academic i’s fixed effect
term μi, and a disturbance term vit. Thus, our specification corrects for the fact that
16A specification with an intercept and a linear term fits our data better because the researchers
with no collaborative grants at all are substantially different from those with a very small percentage of
collaborative grants.
15

industry collaboration, patents, past publications and academic rank may be endogenous.
Publishing, being a professor or getting a lot of industry funds, for example, are correlated
with having a high cognitive ability, which is unobserved.
Still, although the fixed idiosyncratic disturbances μi are uncorrelated across individ-
uals, they create autocorrelation of the errors over time. To ensure consistency and to
solve the fixed effects induced autocorrelation of our estimates, we estimate these models
using the GMM based Arellano-Bond estimator (Arellano and Bond 1991; Blundell and
Bond 1998). In brief, this estimator treats the model as a system of equations — one for
each time period — where the predetermined and endogenous variables in first differences
are instrumented with suitable lagged variables. To further improve the efficiency of our
estimates, we use the two-step GMM based on taking deeper lags of the dependent vari-
able as additional instruments, as described in Roodman (2006). The two-step standard
errors tend to be downward biased and we therefore calculate Windmeijer corrected stan-
dard errors (Windmeijer, 2005). We treat the lagged number of publications, the number
of patents, the variables for the degree of industry collaboration, the collaboration dum-
mies and the academic rank as endogenous. The year dummies are treated as exogenous
and are used as instruments. Finally, we use department size as an additional exogenous
instrument.
We also report GLS with fixed effects, and GMM estimations treating industry col-
laboration and/or patents as exogenous variables in order to illustrate the importance of
correcting for reverse causality of industry collaboration and past realisations of research
output when trying to estimate the true impact the former on the latter.
3 Empirical Results
In this section we present our estimates on the impact of industry collaboration on re-
search productivity. We first introduce our main results, comparing the estimates of our
benchmark model with those of alternative regression models. Then, we show how the
impact of research collaboration and patents on research productivity differs across types
16

of researchers. Finally, we show how robust results are if we use alternative measures of
research productivity.
3.1 Main Results
Table 3 reports the estimates of research productivity measured as the total number of
publications using four different model specifications. While the first model uses a GLS
with fixed effects estimator, specifications 2, 3 and 4 are estimated using two-step differ-
ence GMM. In specification 2 industry collaboration and patents are treated as exogenous
explanatory variables. In the third column, industry collaboration terms are instrumented
as endogenous variables while patents are still considered exogenous. Finally, in the fourth
model, which we consider to be our benchmark, all the explanatory variables except for
the year dummies are treated as endogenous. For all GMM specifications, we report
the Arellano-Bond test and the Sargan/Hansen test at the bottom of the table. In the
following paragraphs we present the main results grouping them in themes for clarity.
Baseline and past publications: In all specifications, the exponent of the estimate of
the constant term can be considered as the “baseline” productivity prediction, i.e. the
expected number of publications for a lecturer who does not have any previous funding
or previous patents. This baseline prediction for the number of publications ranges from
1.57 articles per year in the GLS specification to 1.36 in the benchmark GMM model
(1.57 and 1.36 are the antilogs of 0.453 and 0.308, respectively). Note that the baseline
number of publications decreases when we include the logarithm of the lagged number of
publications (GMM columns). We interpret this fact as an indication that the constant
term in the GLS specification was capturing the omitted lagged publications’ effect.
The strong statistical significance of the lagged publications in the GMM specifications
in Table 3 shows that it is important to take into account the dynamic nature of the
publication process and thus use GMM as opposed to GLS. In all GMM specifications,
the coefficients associated with the lagged publications are positive and, although the first
lag is insignificant, the second lag is highly significant throughout. Because we have taken
logarithms of both the dependent variable and its lagged terms, we can interpret these
17

coefficients as elasticities. Thus, according to benchmark specification results, increasing
by 100% (i.e. doubling) the number of publications two years prior will increase the
expected number of current publications by 4.95%.
Having had funding: As expected, the existence of any funding in the last five years
enhances research productivity in all four specifications. In the GLS specification the “had
some funding” coefficient is significant and equals 0.0309, indicating that if an academic
had received funding she publishes, on average, around 3% more articles than if she
had not received any funding at all. If we take into account the dynamic nature of
the publishing process but not the fact that industry collaboration and patents may
be endogenous (second column’s specification), funding does not have any significant
impact on the number of publications. However, as soon as we take into consideration
that funding and collaboration are endogenous (columns three and four), the coefficient
becomes significant again.
Having collaborated with industry: More importantly, if some of this past funding
involved partners from industry, the average number of publications increases by a further
4% in the GLS regression. As a result, an academic collaborating with industry would
publish 7% more articles than one who did not receive any funding at all. As in the
previous case, in the benchmark specification, in which we take into consideration the
dynamics and the endogeneity problems (column four), the coefficient is larger.
Intensity of industry collaboration: The coefficient associated with this variable can be
interpreted as an elasticity as we measured it as the logarithm of the fraction of EPSRC
grants with the industry. Although it is insignificant for the first two specifications, this
elasticity is significant and negative in the last two specifications. Thus, there is a discrete
positive impact of collaborating with industry, but the more an academic collaborates with
industry, the less she publishes.
To summarise, and drawing from the benchmark specification in the last column, a
lecturer without funding in the last five years is predicted to publish 1.36 articles per year.
If she had obtained funding but did not collaborate she would be predicted to publish 14%
more publications or up to 1.57 publications. If part of the funding had been with industry
18

partners, she would see her publications increase by an additional 11%, up to 1.78. Thus,
having collaborated with industry would mean that she is expected to publish 25% more
than if she had not received any funding at all. However, as the level of collaboration
with industry increases, by say 10%, the predicted number of publications decreases by
2.66%.
In Figure 3 we illustrate the impact of industry collaboration on publications with a
plot of the predicted number of publications for a lecturer with no patents for different
levels of intensity of industry collaboration. The levels of collaboration with industry
range from 0% to 100%, i.e., from no funding involving industry partners to all funding
involving industry partners. A lecturer collaborating with industry is expected to publish
1.78 publications in a given year, but the larger the intensity of her collaboration with
industry, the less she is expected to publish. At 33% of funds in collaboration with
industry, or the sample average, the predicted number of publications is still above 1.57,
and thus higher than if she did not collaborate with industry. At 38.5% of collaboration
intensity, the predicted number of publications matches exactly the number for non-
collaborative funding. Finally, if the percentage of her collaborative funding is 81.8%,
the predicted number of publications is lower than if she had not received any grants in
the previous 5 years. At even higher levels of collaboration intensity she is expected to
publish less than 1.36 articles per year.
Patents: Consistent with the recent literature, filing a patent in the current year, and
in each of the two previous observation periods increases the number of publications in
the GLS specification (column one). The number of current patents and those in the year
before the last (t and t− 2) increase the number of articles by about 2% each. However,
when we correct for the dynamic effect of publications using GMM, the signs turn nega-
tive. If we assume that past publications and rank are endogenous and collaboration and
patenting exogenous (column two), the coefficients associated to patents are all insignif-
icant. When we add industry collaboration to the set of endogenous variables, current
and past patents are significant and have a negative effect on publications (column three).
Finally, in our fourth -benchmark- specification which also takes into account the endo-
19

geneity of patents, all patent variables are insignificant. The release of patents hence has
no influence on publications as soon as we correct for endogeneity.
Academic Rank: We can also observe differences between the GLS and the GMM
specifications with respect to the effect of academic rank. In the GLS regression, later
career stages are associated with higher number of publications. All senior ranks (senior
lecturer, reader and professor) publish significantly more than the omitted junior category
(lecturer). Moreover, being a professor has a stronger effect than being a reader, which
in turn has a stronger effect than being a senior lecturer. In the GMM regressions, on the
other hand, the effect of being a professor is lower than that of being a senior lecturer or
a reader, although it is still significantly positive. Readers seem to be those who publish
most, followed by senior lecturers, professors and lecturers, respectively. Hence, after
allowing for endogeneity of research output, which is linked to tenure promotion, we find
evidence for reduced productivity over the career life-cycle (Levin and Stephan, 1991).
Goodness of fit: With respect to goodness of fit of the GMM models, the Arellano-
Bond tests (reported at the bottom of Table 3) do not reject the null that there is absence
of second (or higher) order correlation of the disturbance terms of our specifications,
which is required for consistency of our estimates. The Sargan and Hansen tests are also
insignificant suggesting that the models do not suffer from over-identification.
3.2 Differences across Academics
In Table 4 we present the estimates of model specifications that interact researchers’
characteristics with our variables of interest, that is, industry collaboration and patents.
For simplicity, we present the main and interacted effects estimates in two columns. The
first column of each block (main effect) corresponds to the researchers in the groups
described in the column header, the second column (interaction effect) corresponds to the
estimates of the comparison group.
In the first specification we separate out the effects of academics belonging to the elite
group of universities (Russell Group) from the academics at other universities. Despite
the dissimilarities in terms of descriptive statistics, the effect of industry collaboration
20

on publications does not differ significantly between the two groups of universities in our
sample. The estimates and the levels of significance for the Russell Group academics do
not differ substantially from those in our benchmark model in column four of Table 3
except for the estimates associated to the number of filed patents. For academics at a
Russell Group university the estimates for the patent variables turn negative and the effect
of the number of patents filed the previous year becomes significant (-0.201, equivalent
to a reduction of 20% in publications). Although statistically not significantly different,
the effect of patents is more positive for academics at universities that are not members
of the Russell Group.
The second block of regressions presents the estimates of the effect of industry collab-
oration and patents for the star researchers, academics in the top 25 percentile in terms
of average publication numbers, which in our sample is an average of 2 or more publica-
tions per year. As in the previous regression, we observe that the estimates for stars are
similar to the average estimated in the benchmark model in Table 3. The estimates for
the academics not categorised as stars do not differ from the non-stars significantly ei-
ther. Hence, both regressions suggest that the effect of knowledge transfer on publication
productivity does not differ by the level of prestige, whether that of the academic or that
of the university.
Looking at the third block of results, we can see that the coefficients for senior staff
(readers and professors) are larger than in the benchmark model and that they differ
significantly from the coefficients for junior academics (lecturers and senior lecturers).
Firstly, the impact of having received funding on the number of articles is more posi-
tive for senior academics (0.390, equivalent to an increase of 39% of the constant) as is
collaboration with industry (0.163 equivalent to a further 16%). Also, the effect of the
intensity of a researcher’s involvement in collaborative research is more negative than that
of the benchmark (elasticity of -0.729). Junior staff on the other hand benefit less from
research funding, which indicates that less experienced members of staff are less able to
transform funding into research output in terms of publications. Their number of publi-
cations, however, decreases far slower as the fraction of grants involving industry partners
21

increases.
3.3 Weighted Number of Publications
Table 5 contains the estimates of variations of the benchmark model as a robustness check
exercise. Instead of the natural count of publications, we model the number of publications
weighted by the number of coauthors and the quality of the publishing journal.
All the coefficients have the same sign as in the benchmark regression in Table 3. Their
magnitude, however, is smaller and some of the effects of funding and collaboration become
insignificant. Receipt of funding, with and without the industry, does not significantly
affect the number of publications if they are weighted by the number of coauthors. The
intensity of collaboration still has a significant and negative effect. Therefore, industry
collaboration has a more damaging effect on coauthor weighted publication counts than
in the normal count of publications.
Instead, if publications are weighted by the impact factor, the intercepts associated
with receipt of funding and collaboration are positive and significant. The coefficients are
very similar to those of the benchmark regression in Table 3. The estimate of the intensity
of collaboration is rather, much smaller and insignificant. Therefore, collaboration with
industry increases is better in terms of quality of the publications.
Interestingly, when weighting publications by the number of coauthors, professors
no longer publish more than lecturers. Academics tend to publish with an increased
number of coauthors as they progress in the academic rank and although the count of
publications is significantly greater, the weighted average is not. Nevertheless, when
adjusting publications by quality, the effect of the professor dummy again becomes positive
and significant.
3.4 Basicness of Publications
We now disaggregate our results using the patent board classification index. Table 6
reports the estimates for the impact of collaboration and patents on the count of publi-
cations in each of the four categories of research journals, “applied technology”, “basic
22
technology”, “applied science” and “basic science”. The first category is considered the
most applied and the last one the most basic.
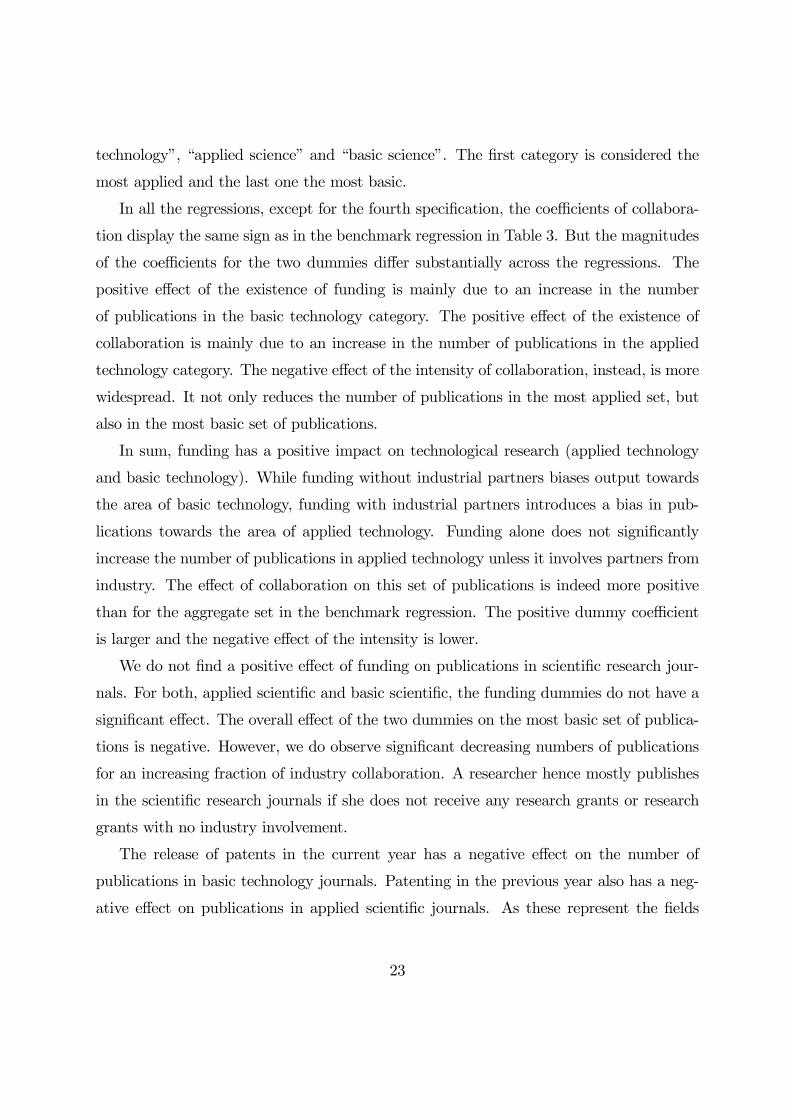
In all the regressions, except for the fourth specification, the coefficients of collabora-
tion display the same sign as in the benchmark regression in Table 3. But the magnitudes
of the coefficients for the two dummies differ substantially across the regressions. The
positive effect of the existence of funding is mainly due to an increase in the number
of publications in the basic technology category. The positive effect of the existence of
collaboration is mainly due to an increase in the number of publications in the applied
technology category. The negative effect of the intensity of collaboration, instead, is more
widespread. It not only reduces the number of publications in the most applied set, but
also in the most basic set of publications.
In sum, funding has a positive impact on technological research (applied technology
and basic technology). While funding without industrial partners biases output towards
the area of basic technology, funding with industrial partners introduces a bias in pub-
lications towards the area of applied technology. Funding alone does not significantly
increase the number of publications in applied technology unless it involves partners from
industry. The effect of collaboration on this set of publications is indeed more positive
than for the aggregate set in the benchmark regression. The positive dummy coefficient
is larger and the negative effect of the intensity is lower.
We do not find a positive effect of funding on publications in scientific research jour-
nals. For both, applied scientific and basic scientific, the funding dummies do not have a
significant effect. The overall effect of the two dummies on the most basic set of publica-
tions is negative. However, we do observe significant decreasing numbers of publications
for an increasing fraction of industry collaboration. A researcher hence mostly publishes
in the scientific research journals if she does not receive any research grants or research
grants with no industry involvement.
The release of patents in the current year has a negative effect on the number of
publications in basic technology journals. Patenting in the previous year also has a neg-
ative effect on publications in applied scientific journals. As these represent the fields
23

of research most closely related to the invention of new technology and hence patenting
activity, the negative signs could indeed confirm the secrecy hypothesis and a crowding
out of publications in favour of patents.
4 Discussion and Conclusion
This paper studies the effects of research collaborations, a knowledge transmission chan-
nel that does not necessarily involve commercialisation. As argued by many authors,
research collaborations, contract research, consultancy, and conferences are far more im-
portant channels of knowledge transfer than patents, licenses and spin-offs. They are,
however, more difficult to measure empirically and even more difficult to compare across
institutions and time. Here, we have focused on the effects of research collaborations using
homogeneous information on grants awarded by the EPSRC, the by far most important
funder of research in engineering sciences in the UK. By comparing individuals who are
involved in industry collaboration mediated through these grants with researchers who do
not receive funding or do not partner with industry, we are able to identify the effects of
collaboration on research productivity.
Our main results for this panel indicate that, on average, researchers benefit from
collaborating with industry. Researchers with no industry involvement are shown to pub-
lish less than those with a small degree of collaboration. Nevertheless, higher levels of
industry involvement negatively affect research productivity in terms of number of publi-
cations. Still, the publication rate of an academic with an average level of collaboration
is higher than that of an academic with no collaborative funding. But for higher levels
of collaboration, the predicted number of publications turns out to be lower. There are,
therefore, two countervailing effects: the presence of industry partners is associated with
a higher degree of academic research output but the intensity of industry collaboration
decreases academic productivity.
We show that the impact of excessive diversion from academic activity through indus-
try collaboration can be seriously underestimated when an inadequate estimation method
24

is used. As documented in previous research (e.g. Arora et al. 1998, Agrawal and Hender-
son, 2002), past, present and future publications are correlated. Thus, including lags of
the dependent variable creates endogeneity and biases the estimates. Further, successful,
productive researchers are better placed to attract interest from industry. Industry col-
laboration and patents can be the consequence, and not just the cause, of high numbers
of publications. We therefore use a dynamic panel data estimation method in which the
lagged dependent variable and other endogenous variables are instrumented for.
Without controlling for the dynamic effects, both the existence and the intensity of
industry collaboration would appear to enhance the number of publications. But as col-
laboration and past publications are correlated, the positive effects of past publications
would be wrongly attributed to collaboration. When this dynamic effect of the publica-
tions is taken into account, the intensity of collaboration no longer enhances academic
productivity. Still, if one assumes that collaboration is exogenous, its effect is very small
and insignificant. This could be caused by a correlation between industry collaboration
and other unobserved time variant factors, such as accumulated ability or experience,
which also enhance academic productivity. Once we instrument the industry collabora-
tion, the negative effect of the intensity grows stronger and becomes significant.
To estimate the effect of patents it is again crucial to take into account both the
dynamic effect of publications and the endogeneity problem. In a standard fixed effects
regression, patents would have a positive and significant impact on the number of publi-
cations. This result would be consistent with the more recent evidence on patents (e.g.
Fabrizio and DiMinin, 2008, and Azoulay et al., 2009). This positive effect disappears
in the dynamic panel data models because the patents no longer capture parts of the
effect of past publications. If one considers patents exogenous to publications, the num-
ber of patents even has a negative and significant impact on the count of publications.
This significance is not confirmed once we control for endogeneity. Indeed, it is possible
that patents are positively correlated to an unobserved factor, such as consultancy ac-
tivity, which is also negatively correlated with publications. Correcting for endogeneity,
the patents do not predict publication rates, as already found in Agrawal and Henderson
25

(2002) and Goldfarb et al. (2009).
Our findings suggest that encouraging universities to collaborate moderately with
industry is a beneficial policy. A small degree of industry collaboration not only facilitates
the transfer of basic knowledge and accelerates the exploitation of new inventions, but also
increases academic productivity. Collaboration, though, promotes applied research and
discourages basic research. Collaboration unambiguously increases the publications in
the most applied set of journals while it decreases those in the most basic set. Therefore,
collaboration might need to be discouraged if basic research output is the desired objective.
We use a large uniquely created longitudinal dataset containing the academic career
of the majority of academic engineers in the UK. We concentrate on the Engineering
sector because it has traditionally been associated with applied research and industry
collaboration and it contributes substantially to industrial R&D (Cohen et al. 2002). In
other less applied fields, collaboration might generate fewer ideas for further research and
therefore the impact of industry collaboration might be worse. But, the time actually
spent collaborating with the industry might also be lower.
Ours can only be a first step in the research of other channels of knowledge transfer.
We expect researchers with a high proportion of collaborative EPSRC grants to also have a
high proportion of contract research. But it is not clear whether our results would change if
the intensity of industry collaboration was measured as the proportion of contract research
with respect to total research funding. With more information on different channels
of knowledge transfer, we would be better able to make comparisons. Here we have
already shown that research collaborations have more impact on research productivity
than patents. Further, it might also be interesting to tackle interactions between different
knowledge transfer channels. We know very little on whether collaboration channels
complement or substitute each other. Consultancy, for example, might have a positive
effect on research if it is complemented by collaboration in research. Of course, this is
only a conjecture and a challenging task for future research.
26

References
[1] Agrawal, A., and R. Henderson, 2002, “Putting patents in context: Exploring knowl-
edge transfer from MIT”, Management Science 48, 44-60.
[2] Arellano, M., and S. Bond, 1991, “Some tests of specification for panel data: Monte
Carlo evidence and an application to employment equations”, Review of Economic
Studies 58, 277-297.
[3] Arellano, M. and O. Bover, 1995, “Another Look at the Instrumental-Variable Esti-
mation of Error-Component Models”, Journal of Econometrics 68, 29-52.
[4] Arora, A., P. David and A. Gambardella, 1998, “Reputation and Competence in
Publicly Funded Science: Estimating the Effects on Research Group Productivity”,
Annales d’Économie et de Statistique 49-50, 163-198.
[5] Azoulay, P., W. Ding and T. Stuart, 2009, “The Impact of Academic Patenting on
the Rate, Quality, and Direction of (Public) Research”, The Journal of Industrial
Economics, 57(4), 637-676.
[6] Baldini, N., 2008, “Negative effects of university patenting: Myths and grounded
evidence”, Scientometrics, 75 (2), 289—311.
[7] Banal-Estañol, A., and I. Macho-Stadler, 2010, “Scientific and Commercial Incen-
tives in R&D: Research vs. Development?”, Journal of Economics and Management
Strategy, forthcoming.
[8] Blumenthal, D., M. Gluck, K.S. Louis, M.A. Stoto, and D. Wise, 1986, “University-
industry Research Relationships in Biotechnology: Implications for the University”,
Science 13 June, 232, no. 4756, 1361 - 1366.
[9] Blundell, R. and S. Bond. 1998, “Initial conditions and moment restrictions in dy-
namic panel data models”, Journal of Econometrics 87, 11-143.
27

[10] Breschi, S., F. Lissoni and F. Montobbio, 2008, “University patenting and scientific
productivity. A quantitative study of Italian academic inventors”, European Man-
agement Review 5, 91-110.
[11] Calderini, M., C. Franzoni, and A. Vezzulli, 2007, “If star scientists do not patent:
an event history analysis of scientific eminence and the decision to patent in the
academic world”, Research Policy 36, 303-319.
[12] Cassiman, B., R. Veugelers and P. Zuniga, 2008, “In search of performance effects of
(in)direct industry science links”, Industrial and Corporate Change, 17(4) 611-646.
[13] Cohen, W.M., R.R. Nelson and J.P. Walsh, 2002, “Links and Impacts: The Influence
of Public Research on Industrial R&D”, Management Science 48, 1-23.
[14] Dasgupta, P. and David, P.A., 1994, “Toward a new economics of science” Research
Policy 23 (5), 487—521.
[15] D’Este P. and R. Fontana, 2007, "What drives the emergence of entrepreneurial
academics? A study on collaboration research partnerships in the UK", Research
Evaluation 16(4), 257-270.
[16] D’Este P. and P. Patel, 2007, "University—industry linkages in the UK: What are the
factors underlying the variety of interactions with industry?", Research Policy 36,
1295-1313.
[17] European Commission, 1995, “Green Paper on Innovation”, Luxemburg.
[18] Fabrizio, K. and A. DiMinin, 2008, “Commercializing the Laboratory: Faculty
Patenting and the Open Science Environment”, Research Policy 37, 914-931.
[19] Florida, R. and W.M. Cohen, 1999, “Engine or Infrastructure? The University Role
in Economic Development” In: Branscomb, L.M., Kodama, F., Florida, R. (Eds.),
Industrializing Knowledge: University–Industry Linkages in Japan and the United
States. MIT Press, London, 589–610.
28

[20] Geuna, A., 1997, “Allocation of funds and Research Output: The Case of UK Uni-
versities”, Revue d’Economie Industrielle 79, 143-162.
[21] Geuna, A. and L. Nesta, 2006, “University patenting and its effects on academic
research: The emerging European evidence”, Research Policy, 35(6), 790-807.
[22] Godin, B., 1996, “Research and the practice of publication in industries”, Research
Policy 25, 587-606.
[23] Goldfarb, B., 2008, “The effect of government contracting on academic research:
Does the source of funding affect scientific output?”, Research Policy 37, 41-58.
[24] Goldfarb, B., G. Marschke, and A. Smith, 2009, “Scholarship and inventive activity
in the university: complements or substitutes?’, Economics of Innovation and New
Technology, 18 (8), 743-756.
[25] Gulbrandsen, M. and J.C. Smeby, 2005, “Industry Funding and University Professors’
Research Performance”, Research Policy 34, 932-950.
[26] Hall, B., 2004, “University-Industry Research Partnerships in the United States”, in
Contzen, Jean-Pierre, David Gibson, andManuel V. Heitor (eds.), Rethinking Science
Systems and Innovation Policies, Proceedings of the 6th International Conference on
Technology Policy and Innovation, Purdue University Press.
[27] Hicks, D., and K. Hamilton, 1999, “Does University-Industry Collaboration Ad-
versely Affect University Research?”, Issues in Science and Technology, 74-75.
[28] Jaffe, A., 1989, “The Real Effects of Academic Research”, The American Economic
Review, 79 (5) 957-70.
[29] Katz, J., and B. Martin, 1997, “What is research collaboration?”, Research Policy
26, 1—18.
[30] Lee, Y. S., 2000, “The sustainability of university-industry research collaboration:
An empirical assessment”, The Journal of Technology Transfer, 25(2), 111-133.
29

[31] Levin, S.G. and P. Stephan, 1991, “Research Productivity Over the Life Cycle: Evi-
dence for Academic Scientists”, The American Economic Review, 81 (1), 114-132
[32] Manjarres-Henriquez, L., Gutierrez-Gracia, A., Carrion-Garcia, A., and Vega-Jurado,
J., 2009, “The effects of university—industry relationships and academic research on
scientific performance: Synergy or substitution?” Research in Higher Education, 50
(8), 795-811.
[33] Maurseth, P., and B. Verspagen, 2002, “Knowledge Spillovers in Europe: A Patent
Citations Analysis”, Scandinavian Journal of Economics, 104(4) 531-45.
[34] Narin, F., G. Pinski, and H. Gee, 1976, “Structure of the Biomedical Literature,”
Journal of the American Society for Information Science, 25-45.
[35] Nelson, R., 2004, “The market economy, and the scientific commons”, Research
Policy, 33(3), 455-471.
[36] Owen-Smith, J., and W. Powell, 2001, “To Patent or Not: Faculty Decisions and
Institutional Success at Technology Transfer”, The Journal of Technology Transfer,
26(1-2), 99-114.
[37] Poyago-Theotoky, J., J. Beath and D. Siegel, 2002. “Universities and Fundamental
Research: Reflections on the Growth of University-Industry Partnerships”, Oxford
Review of Economic Policy, 18(1), 10-21.
[38] Roodman, D., 2006, “How to Do xtabond2: An Introduction to "Difference" and
"System" GMM in Stata”, Working Paper 103. Center for Global Development,
Washington.
[39] Stephan, P., S. Gurmu, A.J. Sumell and G. Black, 2007, “Who’s Patenting in the
University?”, Economics of Innovation and New Technology 61, 71-99.
[40] Thursby, J., and M. Thursby, 2002, “Who is Selling the Ivory Tower: the Sources of
Growth in University Licensing”, Management Science 48, 90-104.
30

[41] Thursby, J., and M. Thursby, 2007, “Patterns of Research and Licensing Activity of
Science and Engineering Faculty”, in Ehrenberg, R. and P. Stephan, eds., Science
and the University, Madison: University of Wisconsin Press.
[42] Thursby, M., J. Thursby, and S. Mukherjee, 2007, “Are there Real Effects of Licens-
ing on Academic Research? A Life Cycle View”, Journal of Economic Behavior &
Organization 63(4), 577-598.
[43] van Looy B., K. Debackere, J. Callaert, 2006, “Publication and Patent Behaviour of
academic researchers: conflicting, reinforcing or merely co-existing”, Research Policy
35, 596-608.
[44] Windmeijer, F., 2005, “A Finite Sample Correction for the Variance of Linear Effi-
cient Two-Step GMM Estimators”, Journal of Econometrics 126, 25-51.
[45] Zucker, L., and M. Darby, 1996, “Star scientists and institutional transformation:
Patterns of invention and innovation in the formation of the biotechnology industry”,
Proceedings of the National Academy of Sciences 93, 12709—12716
31

.51
1.5
22.
53
Ave
rage
Num
ber o
f Pub
licat
ions
1985 1990 1995 2000 2005year
Non-Russel Group Russel Group lb/ub
Average Number of Publications
Figure 1: Average number of publications per faculty member.
0.2
.4.6
Ave
rage
% o
f Ind
ustry
Col
labo
ratio
n
1985 1990 1995 2000 2005year
Non-Russel Group Russel Group lb/ub
Average % of Industry Collaboration (EPSRC)
Figure 2: Average percentage degree of industry collaboration based on EPSRC funds.
32

0 10 20 30 40 50 60 70 80 90 1001.0
1.1
1.2
1.3
1.4
1.5
1.6
1.7
1.8
1.9
2.0
Collaboration
Publications
Figure 3: Predicted number of publications for any degree of industry collaboration.
33
Russel Group Universities Number of IDNumber of
Observations
Birmingham, University of 204 2467Bristol University 87 988Cambridge, University of 200 2433Cardiff, University of 110 1310Edinburgh, University of 99 1184Glasgow, University of 109 1543Imperial College London 294 3495Kings College London 55 587Leeds, University of 179 2060Liverpool, University of 110 1401Manchester, University of 242 1454Newcastle, University of 155 1956Nottingham, University of 176 2118Oxford, University of 103 1271Queens University, Belfast 107 1453Sheffield, University of 185 2110Southampton, University of 145 1734University College London 137 1699Warwick, University of 72 960
Other Universities
Aberdeen, University of 49 591Aston University 64 897Bangor University 32 328Brunel University 87 988City University, London 68 892Dundee, University of 57 700Durham, University of 49 528Essex, University of 30 435Exeter, University of 44 509Hull, University of 41 533Heriot Watt University 153 1838Lancaster, University of 27 344Leicester, University of 40 421Loughborough, University of 247 3033Queen Mary London 90 999Reading, University of 51 656Salford, University of 109 1362Strathclyde, University of 201 2532Swansea University 97 1299UMIST (merged with Machester in 2004) 224 2804York, University of 31 356
Table 1: List of Universities
* Researchers can belong to more than one university during their career. Therefore the numbers of id do not add up to 4066.

ComparisonVariable Mean Std.Dev. Min Max Mean Std.Dev. Min Max Mean Diff. (Non-Russel - Russel)
Dependent Variables
Number of publications 1.07 2.10 0 41 1.57 2.56 0 37 0.497 (0.021)***
Number of co-author weighted publications 0.41 0.76 0 11.58 0.59 0.92 0 12.27 0.171 (0.007)***
Number of Impact Factor weighted publications 0.89 2.64 0 69.59 1.52 3.85 0 73.96 0.624 (0.029)***
Number of citation weighted publications 9.42 33.01 0 1747 16.59 49.78 0 2445 7.175 (0.379)***
Number of applied technological publications (Level 1) 0.18 0.56 0 11 0.25 0.69 0 12 0.073 (0.006)***
Number of basic technological publications (Level 2) 0.41 1.07 0 17 0.62 1.37 0 24 0.203 (0.011)***
Number of applied scientific publications (Level 3) 0.22 0.95 0 22 0.34 1.23 0 26 0.118 (0.010)***
Number of basic scientific publications (Level 4) 0.06 0.41 0 17 0.12 0.59 0 15 0.062 (0.005)***
Explanatory Variables
EPSRC funds in £1000 60.1 163.9 0 7569 78.7 225.8 0 11400 18.591 (1.762)***
Fraction of EPSRC funds with industry collaboration 29.9% 38.7% 0.0% 100.0% 31.1% 38.3% 0.0% 100.0% 0.012 (0.004)***
Fraction of 5 year accumulated EPSRC funds with industry collaboration 23.4% 33.4% 0.0% 100.0% 24.6% 33.2% 0.0% 100.0% 0.012 (0.004)***
Number of patents 0.30 0.23 0 11 0.04 0.27 0 9 0.014 (0.002)***
The total number of observations for Russel Group is 42091 (3431 academics); for Non-Russel Group it is 28066 (2269 academics).
Standard errors in parentheses; * significant at 10%; ** significant at 5%; *** significant at 1%
Inactive Staff -or those having no publications and no EPSRC funds- are excluded
Table 2: Descriptive Statistics
Non-Russel Group Russel Group

(1) GLS (2) GMM (3) GMM (4) GMMFixed effects Instrumenting for
publications and rankInstrumenting for
publications, rank and industry collaboration
Instrumenting for the full set
(benchmark)
Constant 0.453*** 0.357*** 0.312*** 0.308***[0.0153] [0.0412] [0.0476] [0.0453]
Lagged Dependent VariableLn (publications)t‐1 0.0918 0.0195 0.0419
[0.0900] [0.0798] [0.0709]Ln (publications)t‐2 0.0510*** 0.0480*** 0.0495***
[0.0115] [0.0118] [0.0115]Collaborative Research
Had some fundingt‐1 0.0309** 0.0170 0.174** 0.135**[0.0126] [0.0208] [0.0701] [0.0640]
Had some funding with Industryt‐1 0.0412*** ‐0.00804 0.130* 0.108*[0.0157] [0.0231] [0.0664] [0.0625]
Ln (fraction of acumulated funding with Industry)t‐1 0.00319 ‐0.0115 ‐0.301** ‐0.266**
[0.0350] [0.0492] [0.132] [0.126]Patents Filed
# Patents t 0.0262** ‐0.0545 ‐0.105* 0.0516[0.0120] [0.0676] [0.0608] [0.0470]
# Patents t‐1 0.00996 ‐0.160 ‐0.261** ‐0.0359[0.0128] [0.140] [0.126] [0.0477]
# Patents t‐2 0.0237* ‐0.0857 ‐0.149 0.0394[0.0137] [0.170] [0.158] [0.0549]
Academic RankSenior Lecturert‐1 0.0724*** 0.226*** 0.198*** 0.194***
[0.0154] [0.0489] [0.0479] [0.0456]Readert‐1 0.149*** 0.321*** 0.296*** 0.316***
[0.0234] [0.0727] [0.0742] [0.0711]Professort‐1 0.184*** 0.216*** 0.174** 0.140*
[0.0267] [0.0708] [0.0763] [0.0718]Controlled by Years Yes Yes Yes Yes
Number of observations 34086 34086 34086 34086Number of ids 4066 4066 4066 4066
R^2 0.020Number of Instruments 198 297 347
AR(1) test z (p‐value) 0.0000 0.0000 0.0000AR(2) test z (p‐value) 0.8853 0.3366 0.4706Sargan test p‐value 0.0616 0.1851 0.2754
Standard errors in parentheses*** p<0.01, ** p<0.05, * p<0.1
Table 3: Regressions of the number of publications on industry collaboration

Russell Group Effect Non Russell Group Stars Effect Non Stars Seniors Effect Juniors
Constant 0.313*** 0.265*** 0.313***[0.0444] [0.0721] [0.0468]
Lagged Dependent VariableLn (publications)t‐1 0.0204 0.0648 0.061
[0.0600] [0.0595] [0.0710]Ln (publications)t‐2 0.0532*** 0.0544*** 0.0589***
[0.0116] [0.0117] [0.0119]Collaborative Research
Had some fundingt‐1 0.129* 0.0243 0.404 ‐0.297 0.390*** ‐0.193**[0.0733] [0.0791] [0.405] [0.419] [0.0910] [0.0757]
Had some funding with Industryt‐1 0.119* 0.00471 0.190** ‐0.087 0.163* ‐0.0176[0.0718] [0.111] [0.0904] [0.108] [0.0951] [0.132]
Ln (fraction of acumulated funding with Industry)t‐1 ‐0.253* ‐0.063 ‐0.660*** 0.476** ‐0.729*** 0.637**[0.145] [0.212] [0.215] [0.235] [0.194] [0.262]
Patents Filed# Patents t ‐0.0534 0.0687 0.0592 ‐0.226* 0.0521 0.0384
[0.105] [0.111] [0.0381] [0.137] [0.0570] [0.101]# Patents t‐1 ‐0.201* 0.161 0.024 ‐0.0967 ‐0.00913 ‐0.0112
[0.108] [0.110] [0.0342] [0.127] [0.0609] [0.0911]# Patents t‐2 ‐0.0128 0.061 ‐0.0598* ‐0.0996 0.102 ‐0.023
[0.110] [0.117] [0.0307] [0.139] [0.0956] [0.118]Academic Rank
Senior Lecturert‐1 0.198*** 0.171***[0.0455] [0.0433]
Readert‐1 0.310*** 0.229***[0.0703] [0.0683]
Professort‐1 0.160** 0.148**[0.0702] [0.0676]
Controlled by Years Yes Yes YesNumber of observations 34086 34086 34086
Number of ids 4066 4066 4066Number of Instruments 501 500 347
AR(1) test z (p‐value) 0.0000 0.0000 0.0000AR(2) test z (p‐value) 0.1886 0.4881 0.4620Sargan test p‐value 0.5517 0.3924 0.3169
Standard errors in parentheses*** p<0.01, ** p<0.05, * p<0.1
(1) GMM ‐ Interaction with Russell Group (2) GMM ‐ Interaction with Stars (3) GMM ‐ Interaction with Seniors
Table 4: Regressions of the number of publications on industry collaboration with interactions

Table 5: Regressions of the weighted number of publications
(1) GMM (2) GMMpublications weighted
by number of coauthors
publications weighted by journal impact
factor
Constant 0.200*** 0.174***[0.0285] [0.0360]
Lagged Dependent VariableDependent Variablet‐1 0.00679 0.0838
[0.0727] [0.0727]
Dependent Variablet‐2 0.0550*** 0.0569***
[0.0114] [0.0145]Collaborative Research
Had some fundingt‐1 0.0567 0.131**
[0.0393] [0.0593]
Had some funding with Industryt‐1 0.0489 0.103*
[0.0388] [0.0559]
Ln (fraction of acumulated funding with Industry)t‐1 ‐0.166** ‐0.115
[0.0774] [0.115]Patents Filed
# Patents t 0.0161 0.00443
[0.0391] [0.0603]
# Patents t‐1 ‐0.032 ‐0.0238
[0.0409] [0.0537]
# Patents t‐2 0.029 0.066
[0.0376] [0.0566]Academic Rank
Senior Lecturert‐1 0.0867*** 0.162***
[0.0263] [0.0388]
Readert‐1 0.191*** 0.256***
[0.0446] [0.0639]
Professort‐1 0.0266 0.248***
[0.0429] [0.0678]Controlled by Years Yes Yes
Number of observations 34086 34086Number of ids 4066 4066
Number of Instruments 348 366AR(1) test z (p‐value) 0.0000 0.0000AR(2) test z (p‐value) 0.1821 0.7342Sargan test p‐value 0.1273 0.2028
Standard errors in parentheses*** p<0.01, ** p<0.05, * p<0.1

(1) GMM (2) GMM (3) GMM (4) GMM
Applied technology Basic technology Applied science Basic science
Constant 0.0563 0.0608 0.0579 0.0712*[0.0712] [0.0919] [0.0578] [0.0423]
Lagged Dependent VariableDependent Variablet‐1 0.0588*** 0.123*** 0.0873** 0.0601
[0.0215] [0.0234] [0.0339] [0.0436]Dependent Variablet‐2 0.0014 0.0554*** 0.0691*** 0.0571**
[0.0178] [0.0175] [0.0250] [0.0286]Collaborative Research
Had some fundingt‐1 0.0547 0.159** 0.0344 ‐0.0347[0.0558] [0.0709] [0.0523] [0.0370]
Had some funding with Industryt‐1 0.115** 0.0279 0.0261 0.0151[0.0502] [0.0634] [0.0454] [0.0286]
Ln (fraction of acumulated funding with Industry)t‐1 ‐0.151* ‐0.108 ‐0.132** ‐0.0983**
[0.0790] [0.0975] [0.0662] [0.0436]Patents Filed
# Patents t 0.0671 ‐0.289** ‐0.0106 0.065[0.0706] [0.124] [0.0895] [0.0539]
# Patents t‐1 0.00334 0.0329 ‐0.0284** ‐0.00239[0.0101] [0.0270] [0.0130] [0.0134]
# Patents t‐2 ‐0.00332 0.00904 ‐0.0293 ‐0.000169[0.0314] [0.0617] [0.0479] [0.0508]
Academic RankSenior Lecturert‐1 0.0528 0.136*** 0.0891*** 0.00728
[0.0374] [0.0477] [0.0295] [0.0200]Readert‐1 0.00248 0.222** 0.0966* 0.0666*
[0.0692] [0.0952] [0.0552] [0.0363]Professort‐1 ‐0.000987 0.134 0.0759 0.0415
[0.0880] [0.115] [0.0554] [0.0346]Controlled by Years Yes Yes Yes Yes
Number of observations 14695 14695 14695 14695Number of ids 3187 3187 3187 3187
Number of Instruments 104 104 104 104AR(1) test z (p‐value) 0.0000 0.0000 0.0000 0.0000AR(2) test z (p‐value) 0.7846 0.6441 0.7365 0.3960Sargan test p‐value 0.7576 0.5284 0.7824 0.2926
Standard errors in parentheses*** p<0.01, ** p<0.05, * p<0.1
Table 6: Regressions of the number of publications in each category