Outcome Evaluation and Indicative Impact Assessment of the ...
Upload
khangminh22Category
view
0download
0
OUTCOME ASSESSMENT OF FACIAL ORTHOPEDICS WITH TAPING FOR CLEFT LIP DEFORMITIES USING 3D STEREOPHOTOGRAMMETRY
by
Peter Mankowski
M.D.C.M., McGill University, 2016 M.Sc., University of Alberta, 2012 B.Sc., University of Alberta, 2010
A THESIS SUBMITTED IN PARTIAL FULFILLMENT OF THE REQUIREMENTS FOR THE DEGREE
MASTER OF SCIENCE
In
THE FACULTY OF GRADUATE AND POSTDOCTORAL STUDIES
(Craniofacial Sciences)
The University of British Columbia
(Vancouver)
May 2020
©Peter Mankowski, 2020

ii
The following individuals certify that they have read, and recommend to the Faculty of Graduate and Postdoctoral Studies for acceptance, the thesis entitled: Outcome assessment of facial orthopedics with taping for cleft lip deformities using 3D stereophotogrammetry
submitted by Peter Mankowski in partial fulfillment of the requirements for
the degree of Master in Science
in Craniofacial Sciences
Examining Committee:
Dr. Siddharth Vora, Dentistry Supervisor
Dr. Angelina Loo, Dentistry Supervisory Committee Member
Dr. Cindy Verchere, Surgery Supervisory Committee Member
Dr. Denise Laronde, Dentistry Additional Examiner
Additional Supervisory Committee Members:
Dr. Douglas Courtemanche, Surgery Supervisory Committee Member

iii
Abstract Background: Prior to operative correction of a cleft lip, presurgical orthopaedics (PSO) with facial taping is used to improve pre-maxillary and soft tissue alignment. Two commercially available taping systems, Dynacleft and 3MTM taping are used at the British Columbia Children’s Hospital for this purpose. The aim of this study was to evaluate 3MTM and Dynacleft tape, for their ability to impact nasolabial shape during the treatment of the cleft lip deformity.
Methods: A retrospective cohort study of 93 cleft lip +/- palate patients (69 unilateral, 24 bilateral) that had received either Dynacleft or 3MTM facial taping was conducted. 3D stereophotogrammetry images were obtained at three time-points: prior to treatment, after receiving taping but prior to surgery and after surgical repair. 3D photos were annotated with landmarks on the nasolabial region using 3DMD Vultus software. The landmarks were then used in conventional morphometric analysis with previously validated facial measurements to describe and compare the two cohorts at each stage. Geometric morphometrics using Procrustes ANOVA analysis was also conducted to compare the nasolabial shape between the two taping groups. Unilateral cleft patients were additionally compared by their presenting cleft severity using both morphometric analyses to evaluate the impact of presenting severity on cleft outcomes.
Results: Both taping devices demonstrated progressive improvement in multiple facial metrics after taping and after surgery. Although variability in the degree of improvement was noted in the evaluated facial metrics after pre-surgical orthopedics between the two taping groups, no differences were found between these metrics after surgery. ANOVA comparison of the nasolabial region after Procrustes analysis also found no significant difference between the two taping cohorts after surgical cleft lip repair (p-value =0.57). Unilateral cleft patients classified as severe at presentation had residual facial shape differences after lip repair compared to milder presenting clefts (p-value=0.005)
Conclusions: PSO with facial taping reduces the cleft facial deformity prior to surgical correction across multiple facial measurements. However, both 3M and Dynacleft taping devices result in similar facial alignment post-operatively suggesting either can be successfully utilized and that differences prior to surgery have limited influence on the post-operative result.

iv
Lay summary
One of the first treatments that cleft lip and/or palate patients receive is called pre-surgical orthopedics. This is when early molding using tape and orthopedic appliances placed in the mouth are used to align and improve their facial shape to make it easier to do the surgery to close their lip. During these treatments, 3D images of the cleft patients can be taken to follow their facial growth and outcomes. We can also use these images to measure their facial shape and symmetry in response to the treatments they receive. Our research project uses this technology to compare cleft lip treatments being used at the British Columbia Children’s Hospital. In this study we compared two lip tapes, 3MTM and Dynacleft and found both similarly improved cleft patient face shape.

v
Preface This dissertation is original, unpublished, independent work by the author, P. Mankowski. This research project was designed by Dr. Vora, Dr. Loo and Dr. Mankowski. The project arose as an extension of a previous research initiative by Dr. Loo investigating caregiver’s preferences for pre-surgical orthopaedic tape used in the pre-surgical treatment of cleft lip patients. The goal of this project was to provide objective evaluation of the outcomes of these tapes on the facial shape quantification. The images utilized in this study were collected as part of the routine patient care by Dr. Loo. Dr. Mankowski was the primary data curator and conducted all image manipulation and data analysis and was also responsible for writing this thesis in in entirety and presenting the findings at research events. Dr. Vora served as the primary supervisor of this project. His contributions included significant data review and guidance. Additionally, his lab provided the technology required to conduct this project and he contributed significant editorial support to the thesis. Chapter 1, Figure 1 was used with permission from the applicable resource and is modified from the original work of Dr. Vora. Dr. Loo, Dr. Verchere and Dr. Courtemanche served as the supervisorial committee members for this project offering significant directional support and oversaw the objectives of this project. Their guidance included significant formative feedback. This project received ethics approval from the UBC research ethics board. Approval provided to application H18-01513 for ethics certificate: CL±P 3D morphometrics.

vi
Table of Contents
Abstract ................................................................................................................................................................ iii
Lay summary ......................................................................................................................................................... iv
Preface ................................................................................................................................................................... v
Table of Contents .................................................................................................................................................. vi
List of Tables ....................................................................................................................................................... viii
List of Figures ........................................................................................................................................................ ix
Acknowledgements ................................................................................................................................................ x
1. Introduction .......................................................................................................................................................1 1.1 Orofacial clefting and thesis overview ...........................................................................................................1 1.2 CL±P Embryology ..........................................................................................................................................3 1.3 Genetics .......................................................................................................................................................3 1.4 Environmental factors ..................................................................................................................................4 1.5 Cleft classification .........................................................................................................................................4 1.6 Treatments Overview ...................................................................................................................................5 1.7 Pre-surgical orthopedics ...............................................................................................................................6
1.7.1 The role of pre-surgical orthopedics (PSO) .............................................................................................7 1.8 Primary lip repair surgery..............................................................................................................................8
1.8.1 Post-operative care ...............................................................................................................................9 1.9 CL±P treatment outcomes .......................................................................................................................... 10 1.10 3D Imaging analysis in CL±P patients and validation .................................................................................. 10 1.11 3D imaging of Pre-surgical orthopaedics ................................................................................................... 12 1.12 Project design and significance ................................................................................................................. 13
1.12.1 Hypothesis ........................................................................................................................................ 14 1.12.2 Study goals and objectives................................................................................................................. 14 1.12.3 Project significance ........................................................................................................................... 15
2. Methods ........................................................................................................................................................... 16 2.1 Overview .................................................................................................................................................... 16 2.2 Data collection ........................................................................................................................................... 17
2.2.1 Patient record review & image collection ............................................................................................ 17 2.3 Landmark selection and conventional analysis template ............................................................................. 19 2.4 Image processing and landmarking ............................................................................................................. 25 2.5 Error calculations ........................................................................................................................................ 27 2.6 Conventional morphometrics...................................................................................................................... 27
vii
2.7 Geometric morphometrics .......................................................................................................................... 30 2.8 Fluctuating asymmetry analysis .................................................................................................................. 31
3. Results .............................................................................................................................................................. 34 3.1 Unilateral dataset ....................................................................................................................................... 34
3.1.1 Error Calculations ................................................................................................................................ 36 3.1.2 Analysis of Unilateral Clefts using Conventional Morphometrics .......................................................... 38 3.1.3 Analysis of Unilateral Clefts using Geometric Morphometrics .............................................................. 51 3.1.4 Unilateral cleft asymmetry analysis ..................................................................................................... 52
3.2 Analysis of Bilateral Clefts using Conventional Morphometrics .................................................................... 54 3.2.1 Bilateral conventional morphometrics ................................................................................................. 55 3.2.2 Analysis of Bilateral Clefts using Geometric Morphometrics ................................................................. 63
4. Discussion ........................................................................................................................................................ 65 4.1 PSO Lip Taping ............................................................................................................................................ 65 4.2 Cleft severity .............................................................................................................................................. 66 4.3 Cleft PSO protocol ...................................................................................................................................... 67 4.4 Bilateral cohort ........................................................................................................................................... 68 4.5 Limitations ................................................................................................................................................. 69 4.6 Future directions ........................................................................................................................................ 73
Literature cited..................................................................................................................................................... 76
Appendices .......................................................................................................................................................... 83

viii
List of Tables Table 1. Unilateral cleft lip landmark list. .................................................................................. 20 Table 2. Bilateral cleft lip landmark list. ..................................................................................... 21 Table 3. Unilateral and bilateral cleft lip conventional morphometric metric lists. .................... 23 Table 4. Unilateral CL±P patient cohort demographics and clinical features. ............................. 35 Table 5. Unilateral CL±P patient image error calculations of conventional morphometric analysis measurements using MAD and REM. ........................................................................................ 37 Table 6. Unilateral cleft patient Procrustes ANOVA error analysis between imaging replicates. 37 Table 7. Conventional morphometric evaluation of patient response to PSO treatment by tape and protocol comparison. ......................................................................................................... 49 Table 8. Conventional morphometric evaluation of patient response to PSO treatment by two cleft severity classifications. ...................................................................................................... 50 Table 9. Assessment of unilateral cleft patient response with pre-surgical orthopaedics .......... 51 Table 10. Geometric morphometric overall shape analysis of unilateral cleft lip patients by Procrustes ANOVA. ................................................................................................................... 52 Table 11. Geometric morphometric asymmetry analysis of unilateral cleft lip patients by Procrustes ANOVA. ................................................................................................................... 53 Table 12. Bilateral CL±P patient cohort demographics and clinical features. ............................. 54 Table 13. Geometric morphometric overall shape and asymmetry analysis of bilateral cleft lip patients by Procrustes ANOVA. ................................................................................................. 64

ix
List of Figures Figure 1. Overview of the classification of clefts. ......................................................................... 2 Figure 2. Cleft lip and palate treatment overview and timeline. .................................................. 6 Figure 3. PSO taping systems: 3M (left) and Dynacleft (right). ................................................... 14 Figure 4. Schematic demonstrating the overview of the methodology used to compare PSO cleft taping devices by two morphometric analyses. ......................................................................... 15 Figure 5. 3dMD stereophotogrammetry facial images and camera system................................ 18 Figure 6. Annotated 3D stereophotogrammetry image of a CL±P patient demonstrating landmark positions at three orientations. ................................................................................. 26 Figure 7. Four conventional morphometric measurements used to evaluate facial shape of cleft lip patients. ............................................................................................................................... 29 Figure 8. Landmark regions subjected to geometric morphometric facial analysis. ................... 31 Figure 9. Boxplots of the metric nostril width ratio for unilateral cleft patients at each treatment stage by comparative groups. ................................................................................................... 39 Figure 10. Boxplots of the metric columellar angle for unilateral cleft patients at each treatment stage by comparative groups. ................................................................................................... 41 Figure 11. Boxplots of the metric lateral lip height ratio for unilateral cleft patients at each treatment stage by comparative groups.................................................................................... 43 Figure 12. Boxplots of the columellar length ratio for unilateral cleft patients at each treatment stage by comparative groups. ................................................................................................... 45 Figure 13. Summary of statistical comparisons both between tape types at each stage and between stages of treatment. ................................................................................................... 46 Figure 14. Boxplots of the four evaluated conventional morphometric metrics from unilateral cleft patients classified by the unilateral cleft lip severity index. ............................................... 47 Figure 15.Boxplots of the metric nostril width ratio for bilateral cleft patients at each treatment stage by comparative groups. ................................................................................................... 56 Figure 16. Boxplots of the metric columellar angle for bilateral cleft patients at each treatment stage by comparative groups. ................................................................................................... 58 Figure 17. Boxplots of the metric columellar length ratio for bilateral cleft patients at each treatment stage by comparative groups.................................................................................... 60 Figure 18. Boxplots of the metric lateral lip height ratio for bilateral cleft patients at each treatment stage by comparative groups.................................................................................... 62

x
Acknowledgements I would like to offer my gratitude to the UBC plastic surgery residency program which has provided me the opportunity to seek out a MSc during my clinic training years. I would also like to thank the CIP program who has provided me with a platform to seek out the skills and knowledge that I specifically believe will support my future as a clinician scientist within the field of plastic surgery. I would also like to thank Dr. Vora for guiding me through this program at each step. Additionally, thank you to Dr. Loo who graciously trusted me with this project and for all of the help provided by her clinical staff, in particular, Marjorie. Finally, thank you from my plastic surgery mentors Dr. Verchere, Dr. Courtemanche and Dr. Macadam all of whom helped ensure this project would become a success.
1
1. Introduction 1.1 Orofacial clefting and thesis overview
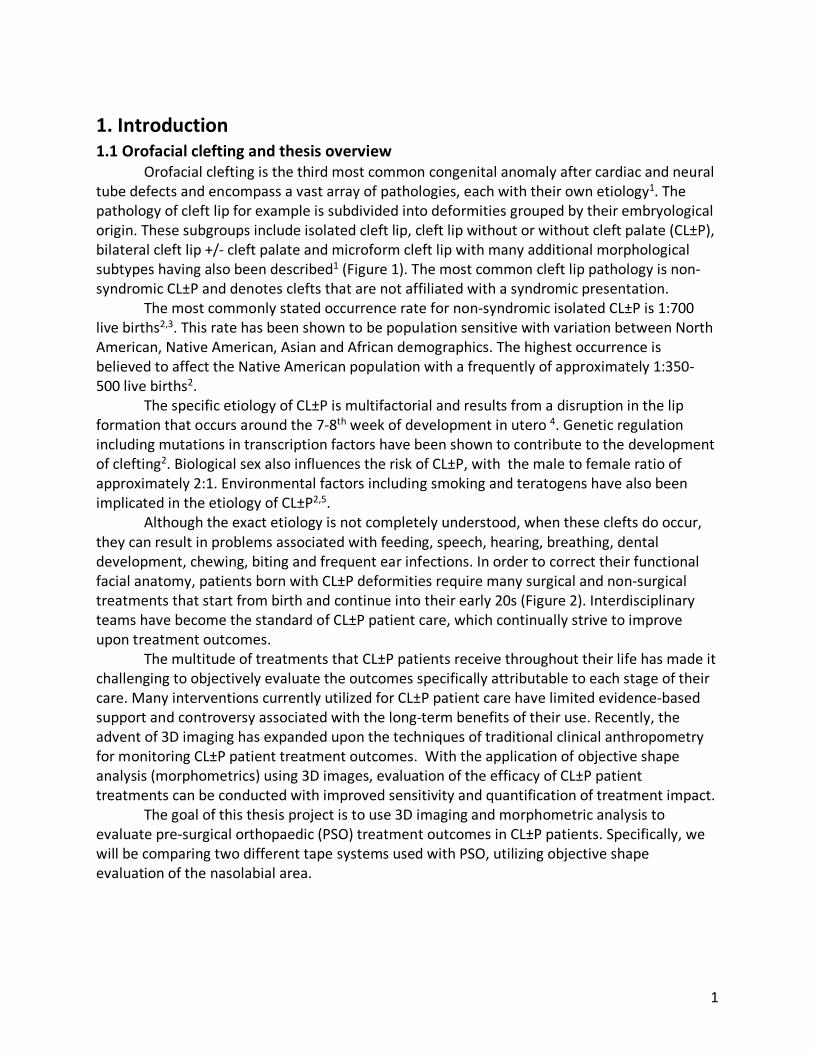
Orofacial clefting is the third most common congenital anomaly after cardiac and neural tube defects and encompass a vast array of pathologies, each with their own etiology1. The pathology of cleft lip for example is subdivided into deformities grouped by their embryological origin. These subgroups include isolated cleft lip, cleft lip without or without cleft palate (CL±P), bilateral cleft lip +/- cleft palate and microform cleft lip with many additional morphological subtypes having also been described1 (Figure 1). The most common cleft lip pathology is non-syndromic CL±P and denotes clefts that are not affiliated with a syndromic presentation.
The most commonly stated occurrence rate for non-syndromic isolated CL±P is 1:700 live births2,3. This rate has been shown to be population sensitive with variation between North American, Native American, Asian and African demographics. The highest occurrence is believed to affect the Native American population with a frequently of approximately 1:350-500 live births2.
The specific etiology of CL±P is multifactorial and results from a disruption in the lip formation that occurs around the 7-8th week of development in utero 4. Genetic regulation including mutations in transcription factors have been shown to contribute to the development of clefting2. Biological sex also influences the risk of CL±P, with the male to female ratio of approximately 2:1. Environmental factors including smoking and teratogens have also been implicated in the etiology of CL±P2,5.
Although the exact etiology is not completely understood, when these clefts do occur, they can result in problems associated with feeding, speech, hearing, breathing, dental development, chewing, biting and frequent ear infections. In order to correct their functional facial anatomy, patients born with CL±P deformities require many surgical and non-surgical treatments that start from birth and continue into their early 20s (Figure 2). Interdisciplinary teams have become the standard of CL±P patient care, which continually strive to improve upon treatment outcomes.
The multitude of treatments that CL±P patients receive throughout their life has made it challenging to objectively evaluate the outcomes specifically attributable to each stage of their care. Many interventions currently utilized for CL±P patient care have limited evidence-based support and controversy associated with the long-term benefits of their use. Recently, the advent of 3D imaging has expanded upon the techniques of traditional clinical anthropometry for monitoring CL±P patient treatment outcomes. With the application of objective shape analysis (morphometrics) using 3D images, evaluation of the efficacy of CL±P patient treatments can be conducted with improved sensitivity and quantification of treatment impact.
The goal of this thesis project is to use 3D imaging and morphometric analysis to evaluate pre-surgical orthopaedic (PSO) treatment outcomes in CL±P patients. Specifically, we will be comparing two different tape systems used with PSO, utilizing objective shape evaluation of the nasolabial area.

2
Figure 1. Overview of the classification of clefts. Schematic representation of involved anatomy of various orofacial clefts demonstrating classification based on progressive involvement of the lip and palate. a) normal anatomy b) microform cleft lip c) unilateral cleft lip d) unilateral cleft lip and palate e) bilateral cleft lip and palate f) cleft palate only. Figure originally published in Richman et al. (2001) and reused with permission1.

3
1.2 CL±P Embryology During the 4th to 8th weeks of embryological development, key cranial prominences arise
around the stomodeum (primitive mouth) which eventually give rise to all the structures of the face. These prominences are the frontonasal prominence (FNP), maxillary prominences (MXP) and mandibular prominences. A medial nasal process (MNP) develops within the FNP, which gives rise to the structures in the middle of the nose, upper lip, anterior maxilla and primary palate. The maxillary prominence grows medially towards the MNP and merges with it to form the upper lip around the 6th week of gestation. The merging process is dependent on mesodermal tissue penetration, tissue proliferation, seam formation, mesenchymal bridging and merging of the remaining furrow. If any step in this process is delayed or impaired, a cleft lip can ensue4. Variations in CL±P presentations arise from arrested development of the MXP and MNP at the anatomic region of the philtrum3. This impairment can occur on one side or both creating a unilateral or bilateral cleft lip respectively4. Left sided unilateral cleft lips are approximately twice as prevalent as right sided clefts6. The exact etiology of this variation of laterality is unclear, but is thought to associated with a slower development of the left sided facial artery7.
The etiology and embryology associated with a cleft palate are considered unique to the process affiliated with CL±P4. As development continues, the MXP initiates the formation of the secondary palate around the 7-8th week of gestation. Two palatine shelves extend medially from the MXP and initially develop downward, flanking the tongue. Once the tongue descends out of the path of development the palatal shelves elevate and fuse to form the secondary palate. Then, the secondary palate meets the primary palate and the nasal septum superiorly to separate the nasal and oral cavities into the ninth week of gestation4,8,9. The severity of the cleft palate is reflected by how early in development the growth disturbance occurs. It should be noted that a cleft palate can occur without the presence of a cleft lip and vice versa. 1.3 Genetics
The etiology of CL±P deformities is multifactorial. Twin studies initially demonstrated a genetic contribution to CL±P development with an increased concordance of unilateral CL±P found between monozygotic twins compared to dizygotic twins (30-60% vs 1-5% respectively)2. Yet, the majority of CL±P presentations are isolated non-syndromic events without associated craniofacial abnormalities2. Early identification of the specific genetic factors responsible for clefting was limited by the complexity of the developmental process and the low rates of recurrence within affected families2.
With the improvement of genetic technologies, ongoing investigation of the genetic etiology of CL±P continues to be a priority, in order to improve both prevention efforts and prognostic abilities. Numerous genes are now associated with cleft lip and palate including transcription factors, signaling molecules and growth factors4. Candidate gene studies have implicated TGF-alpha (transforming growth factor – alpha), interferon regulatory factor 6 (IRF6), fibroblast growth factor receptor 2 (FGFR2) and SUMO1 (a ubiquitin-like modifier family member) in the development of CL±P2. Genetic linkage studies have additionally supported MSX1, FGFR1, FGF8 and BMP4 as important contributors2. Genome wide studies have suggested a region in 10q25 and a candidate gene- VAX1, to be significantly associated with

4
CL±P2. Recent applications of genome wide linkage studies have allowed for identification of specific loci associated with CL±P and improve the understanding of the etiological variants2. 1.4 Environmental factors
Beyond genetic regulation, environmental factors have been implicated in the development of CL±P. Numerous teratogens have been shown to elevate the risk of CL±P including anti-epileptic drugs, thalidomide, retinoids and dioxins. Additionally, maternal smoking and maternal alcohol consumption have been shown to increase the risk of CL±P4. These teratogens are believed to disrupt normal development at specific stages necessary to complete normal midface fusion. Interestingly, the quantity of exposure of these agents necessary to disrupt development is variable. The relative risk of CL±P significantly increases after a threshold consumption of twenty cigarettes per day or four drinks per day is reached4,5,10.
Other maternal factors such as folate deficiency and zinc deficiency also have been linked to the etiology of CL±P. Daily folate acid supplementation throughout pregnancy has been shown to help prevent the development of CL±P11,12. Additional risk factors include maternal stress, obesity, infection and ionizing radiation2,4. Some evidence suggesting low socioeconomic status is linked to the incidence of CL±P indicating that unaccounted for environmental factors also influence the development of this pathology. However, socioeconomic status may be a confounding factor ultimately reflecting maternal nutritional status4. 1.5 Cleft classification
The initial presenting morphology of a cleft lip guides the treatment trajectory and the interventions necessary for successful care. Clinicians must respond to the unique anatomical disruptions that occurs for each patient in order to restore all effected functions such as speech, aesthetics and oral competence. Thus, an understanding of the structures involved in a cleft and its degree of deformity helps to define their treatment goals. Classification systems have therefore been proposed in attempt to clearly describe the cleft and for prognostication purposes.
The majority of cleft classifications are based on either the anatomical structures involved or the embryological origin of the cleft13. One of the earliest classification systems used to subtype CL±P presentations is the Veau classification which categorized cleft lip and palate morphology into four distinct groups3. Another widespread classification scheme is the Kernahan and Stark system which allow for standardized documentation of a patient’s cleft anatomy and facilitates accurate communication between heath care practitioners13.
Unfortunately, many cleft classifications have experienced a decline in their use due to their inability to predict clinical outcomes, multiple inaccuracies or lack of simplicity. While these classifications can be used to document a patient’s specific cleft anatomy, they do not necessarily dictate clinical care. Some clinicians have advocated for classification systems that are structured around the concept of cleft severity as opposed to cleft anatomy, to more effectively provide a prognosis. Cleft lip severity has been shown to be linked to post-surgical aesthetics and the subsequent need for secondary procedures such as rhinoplasty and scar revisions14. In this context, severity is usually defined by the degree of deviation away from facial symmetry. Fisher et al. conducted a study to expand upon the definition of cleft severity

5
using direct anthropometry and demonstrated that columellar deviation and nostril width ratio were highly correlated with the perceived CL±P deformity15 (See methods, Figure 7). These two metrics therefore may be used as objective indicators of the pre-surgical cleft state15.
Recently Campbell et al., proposed a new classification scheme in attempt to increase the ability to quantify pre-operative cleft lip severity and correlate this metric with post-operative outcomes14. Their assessment tool categorized patients with unilateral clefts based on the progressive involvement of the nose and lip, as they are incorporated into the deformity14. Grade 1 patients have less than 50% of their upper lip involved in the deformity. Grade 2 patients have more than 50% upper lip involvement while the nasal floor remains intact. Finally Grade 3 and grade 4 patients both display clefts that involves the nasal floor but are segregated by a nostril width ratio of less than 2 or more than 2, respectively14. Interestingly their cleft severity index utilizes both anatomic involvement as well as anthropometric measurements (nostril width ratio) to define severity. Incorporating nostril width ratio into the evaluation scale is beneficial. It can be measured both pre and post-operatively providing a reproducible metric for analysis. This metric was shown to have high interrater reliability between both surgeons and laypersons alike, in its correlation with visual assessment of cleft severity14. 1.6 Treatments Overview
After the diagnosis of CL±P, patients are initiated on a treatment trajectory by specialized interdisciplinary cleft care tams that continues through the first few decades of their lives and includes numerous surgical and orthodontic interventions 16-18 (Figure 2). During this treatment course, CL±P patients on average receive 8 surgical procedures19. Early interventions include pre-surgical orthopaedics (PSO) or naso-alveolar molding (NAM) for early soft tissue manipulation prior to lip repair and palate repair. When patients are old enough to speak, they are evaluated for the need for surgical procedures that improve their speech capability and treat the CL±P affiliated speech defect, such as velopharyngeal insufficiency20. Later, patients often undergo alveolar bone grafting, orthognathic surgery and secondary rhinoplasty procedures to optimize their function and facial aesthetics20. Additional interventions including dental orthodontics and scar revision procedures may be carried out until a satisfactory result is achieved20.
Numerous interventions are associated with each stage of cleft care which is further complicated by the variability of how these procedures are administered. Many protocols exist that vary by procedure order and by which surgical procedures are actively utilized. This lack of standardization has likely arisen due to the numerous controversies in cleft care. Many aspects of cleft care lack quality evidence and conflicting data is present within the CL±P literature. As a result, practitioners often develop their own beliefs based on personal experience, training and institution as practices. It has resulted in the great heterogeneity of treatment protocols around the world. Some controversy examples include: the use of pre-surgical orthopedics (PSO; see below), the timing of nasal procedures, early or late bone grafting, and which surgical repairs produce the optimal aesthetic outcomes. Other examples include whether or not to repair the alveolar cleft early by alveolar bone graft and the benefits of conducting an additional gingivoperiosteoplasty for early repair of the periosteum across the cleft to facilitate boney healing21. Conflicting opinions exist on these surgical steps leaving the long-term benefits that they provide, in question. These inconsistencies make it difficult to analyze current cleft

6
treatment protocols. It is essential for patients to remain on well-defined protocols during their treatment so that that clear objective endpoints and outcomes can be used to provide evidence towards intervention superiority.
An overview schematic demonstrating a possible overview for the CL±P patient treatment trajectory is demonstrated in figure 2. A complete description of the numerous CL±P interventions at each stage of treatment that are currently being utilized is beyond the scope of this project. Our focus is on evaluating the outcomes associated with the early interventions associated with cleft lip repair, with particular attention to the role of PSO prior to surgical repair of the cleft.
Figure 2. Cleft lip and palate treatment overview and timeline.
1.7 Pre-surgical orthopedics Pre-surgical orthopedics is a term used to describe devices that are designed to narrow
dimensions of a cleft and realign the boney maxillary segments prior to the surgical lip repair 16,20,21. . Originally introduced by McNeil and developed by Burston, now multiple appliances are available for this purpose and vary in their construction22,23. Options include intra-oral acrylic plates, pinned metal retains or medical taping devices.
Lip taping is one of the simplest and least expensive methods for pre-surgical soft tissue manipulation in anticipation of a primary lip repair20. A piece of tape is placed across the cleft lip segment to facilitate “tissue creep” and offers some limited mobilization of the alveolar segments (Figure 3). The tape allows for the forces of the facial and lip muscles to be distributed across the cleft and the front of the pre-maxilla. This taping does not interfere with feeding and can be continued up until the time of primary lip repair20. Taping alone must be

7
used with discretion as it can result in the collapse of the maxillary segments in both unilateral and bilateral cleft lip +/- palate patients.
Beyond lip taping, PSO devices can be broadly grouped into three categories: active appliances, passive appliances and nasoalveolar molding (NAM) appliances16. Active devices can consist of serial sequential acrylic plates (MacNeil method) or a pinned spring-loaded device (Latham device) worn up until the time of surgery that facilitate a direct reduction of the cleft dimensions16. Passive appliances are created by either manipulating a plating device or through sequential sculpting of an appliance (Hotz appliance) that is placed intra orally to encourage growth in the direction of reducing the cleft 16,21. In the case where an alveolar plate also contains a nasal stent, the devices is referred to as nasoalveolar molding (NAM). NAM is utilized when manipulation of the nares is targeted, in addition to the cleft lip. Lip taping can also be used in combination with an appliance to further address the complexity of a specific pathology. An example of this would be to apply both lip taping and nasoalveolar molding to recreate the forces of a lip adhesion procedure (a surgery where the lip is superficially closed prior to formal cleft lip repair) with the additional benefits of the appliance in situ24.
Of available PSO devices, nasoalveolar molding (NAM) has become one of the most widely accepted techniques due to the evidence that it is associated with improving nasal appearance and reduces the need for secondary nasal revision25. Introduced by Grayson et al., literature provided by Dr. Grayson and his associates continues to support this method with multiple studies demonstrating that NAM reduces the need for alveolar bone grafting, limits premaxillary growth disturbances and lengthens the deficient columella26-28.
Apart from the ability to reduce the dimensions of the cleft deformity, use of PSO devices may provide numerous additional benefits. This includes facilitating intra-oral feeding, improving maxillary growth, improved nasal tip projection, facilitating surgical repair and repositioning of the premaxilla when used in treating unilateral CL±P and bilateral CL±P patients24. Other benefits attributed to PSO include restoring oral function by repositioning the maxillary-mandibular relationships and correcting the position of the palatal shelves16. Occasionally the use of PSO is continued up until the time of palatal repair24. When PSO is not utilized, a lip-adhesion surgery can be offered as an alternative two stage approach and a more definitive repair can then be performed at an older age. However, lip-adhesion is a technique rarely utilized today20. 1.7.1 The role of pre-surgical orthopedics (PSO)
PSO as a clinical practice is highly controversial 21,29 and the long-term benefits of this practices remain in question. Additionally, with numerous appliances available and each with an associated claim of superior tissue manipulation, clinicians are faced with the challenging task of identifying which PSO treatments are in fact effective.
Existing literature has been successful at demonstrating that when cleft teams incorporate PSO into their treatment algorithm, they can clearly note a reduction in the inter-cleft segment of their patients21,24. This reduction in the inter-cleft segment has been demonstrated repeatedly by multiple methods of evaluation and has been supported by surgeons to facilitate an easier repair when compared to an unmanipulated defect16,21,24. However, the claim of improved surgical repair remains unsubstantiated. Furthermore, an initial improvement in the cleft dimension pre-operatively has yet to be associated with long term benefits30. The inter-center randomized Dutchcleft trials found no difference in maxillary
8
arch dimensions following lip closure with or without the use of the use of PSO 31. The ability for PSO to improve patient feeding or growth has also remained unfounded 32. Additionally, multiple systematic reviews have failed to support the benefit of PSO, although the validity of these studies has been questioned29,33,34. Alzain et al., produced a comprehensive list of proposed advantages and disadvantages of PSO which demonstrates that there is a body of evidence both in favor and against the ability of PSO to have a significant impact on patient growth, speech, feeding and ease of surgical repair24. Other outcomes associated with the use of these devices claimed by PSO proponents include guiding palatal growth, improved nasolabial aesthetics and a reduction in the need of secondary procedures29.
Of the currently employed PSO techniques, support for the use of pre-surgical nasoalveolar molding (NAM) is possibly most validated. In a study evaluating the long-term effectiveness of NAM, noted improvement in unilateral cleft lip patients was associated with the use of this pre-surgical device35. NAM is specifically linked to providing columellar lengthening, a reduction of alar asymmetry and increase nasal tip projection24. Additionally, NAM was been shown to improve surgical outcomes by providing a reduction in both the hard and soft palate deformity36. There is evidence suggesting that these improvements are of variable permanence. Relapse in the nasal shape and height has been reported to occur by up to 20% when compared to the pre-surgical state within 1 year post lip repair37,38. Furthermore, it has been argued that patients who are selected to receive NAM usually have increased cleft severity and therefore their surgical outcomes are confounded by their pre-surgical morphology39. A recent review evaluating the use of NAM noted inconsistencies within the literature on the benefits that NAM provides, but suggest that a positive trend in NAM outcomes remains present40. 1.8 Primary lip repair surgery
The surgical treatment of unilateral CL±P has evolved in an effort to continually improve facial aesthetics and scar placement. As previously mentioned the treatment of cleft lip and cleft palate is usually conducted at two different time points with cleft lip correction occurring as one of the first procedures at approximately 3 months of age20.
While there are numerous described techniques for cleft lip repair, an overview of the most common techniques will be described here41. These techniques can be grouped into three broad categories, the straight-line technique (e.g. Rose-Thompson), the triangular flap technique (e.g. Tennison-Randel) and the rotation advancement technique (e.g. Millard)41. The key goals of these techniques are to provide upper lip lengthening to the deficient cleft side while producing a cosmetically pleasing scar that approximates the appearance of the contralateral unaffected philtrum. The use of these techniques varies by institution and is dependent on the training and experience of individual cleft care teams.
The Rose-Thompson technique is a straight-line technique, one of the earliest methods of surgical repair3. This repair was based on excising the cleft tissue in an ellipse fashion followed by a straight-line closure which provided a minor lengthening of the upper lip in attempt to match the contralateral philtrum. The limitation of this technique is that it produces a short upper lip with a notched vermillion border and nasal manipulation must be accomplished by a secondary procedure41.
Subsequently, more complex triangular flap techniques that utilize geometry and soft tissue measurements have arisen, in order to further optimize post-operative facial symmetry.

9
The Tennison-Randel technique introduced a single Z-plasty at the edge of the cutaneous vermillion junction which similarly allows upper lip lengthening42. While this method avoids the short upper lip produced by the straight-line technique, the resulting Z-shaped scar placed across the philtrum is often highly visible41.
The Millard technique uses a rotating advancement flap to obliterate the cleft deformity. Since its introduction, this repair method has become one of the most commonly utilized techniques in North America43,44. Critics of this techniques claim that the resulting scar fails to produce a symmetrical appearance as the rotation of the flap crosses onto the philtrum3. The extended Mohler repair similarly utilizes a midline philtral incision like the Millard technique but includes a modification at the superior portion to include the columella and provide further lip height3.
Finally, the Fisher anatomic subunit repair incorporates elements from all three techniques3,41,45. For the Fischer repair, 2 small triangles are utilized, one above the lip vermillion and one within it, allowing for improved approximation and minimizing of the resulting scar due to its placement within the philtiral column41,45. Currently, the Fischer and Millard techniques remain popular choices within a field that continues to display variability between treating phyisicians46. In addition to repair of the lip, most cleft surgeons undertake some form of primary cleft rhinoplasty at the same time. 1.8.1 Post-operative care
Immediately after the primary lip repair, patients are usually monitored for a short period of surveillance, pain control and feeding observation47. Some practitioners may place initial restrictions in bottle feeding to ensure protection of the healing surgical site47. Scar management can be initiated almost immediately. The utilization of PSO like devices such as lip taping, stenting and nasal elevators have been employed to varying degrees to maintain adequate lengthening along the scar and prevent a cosmetically unappealing outcome. Taping, scar massage and sun avoidance are additional methods for improving scar outcomes3.
After completion of the primary lip repair, patients proceed to primary palate repair usually scheduled to occur at 9 months to 12 months of age. Afterwards, these patients proceed through the treatment protocol which includes speech assessment, surgical correction of velopharyngeal insufficiency as needed and secondary revision procedures depending on the resulting growth, scarring and accuracy of the initial interventions3. Treatment planning ensues in a systematic process as these patients continue to grow under close surveillance by the cleft care team, with the goal of always restoring anatomic form and function.
As the outcome changes with growth and development, aesthetics can be revisited and scar revisions conducted as needed. Unlike the primary procedures of the lip and palate, secondary procedures can vary in timing depending on patient preferences and deformity severity. In the case when a revision procedure is indicated, careful examination of all affected lip structures including skin, mucosa and muscle is require to effectively diagnose the deformity being treated. Suboptimal outcomes that can occur after primary repair include: vermillion notching, scar contracture, mucosa thickening, short lip or white roll mismatch. Many of these outcomes can be improved upon through scar excisions with tissue re-approximation using appropriate geometrical principles3.

10
1.9 CL±P treatment outcomes Cleft teams are encouraged to continually evaluate their treatment outcomes in order
to remain at the forefront of patient cleft care21. The complexity of the care provided to CL±P patients introduces numerous variables at each stage of treatment that require objective evaluation and scientific review in order to be continually optimized. Each stage of treatment must be critically appraised in addition to the overall outcomes that arise after a patient completes all planned interventions.
Due to the numerous interventions that these patients undergo, many unique outcomes have been evaluated to identify the impact that individual steps of care have on these patients. These include patient occlusion, aesthetics, speech, facial measurements, feeding and growth24,31. Additional secondary goals affiliated with the CL±P repair include restoration of dental and oral function, improved hearing, minimizing facial differences and obtaining social acceptability. These numerous study outcomes have been used to demonstrate that optimizing even a single intervention within the trajectory of cleft care can markedly impact a patient in multiple ways.
Of all CL±P patient therapeutic interventions, providing support for the use of PSO as a treatment has been particularly challenging. Factors such as the PSO protocol, cohort heterogeneity, chosen surgical techniques, and the operator experience are just a few of compounding aspects of cleft care that make it challenging to isolate the benefits of PSO and individual PSO interventions (e.g. tape, plate, nasal stent etc.)16. Papadopoulos et al. noted that the majority of the literature on PSO outcomes is composed of inappropriately designed studies, poorly described patient populations and the absence of a valid control group for comparision29. Clearly reported outcome measures and adequate follow up evaluations are also missing29. Additionally, few studies stratify their analysis by cleft severity with more serve cleft having been shown to have less favorable long term growth and development48. As a result, the diversity of PSO protocols is vast and each is created based on the clinical beliefs of the individual treating team.
A recent meta-analysis demonstrated that outcome measures for evaluating the impact of PSO include: cephalometric measurements (facial and dentoalveolar changes), visual analogue scales (facial aesthetics), formal feeding assessment tools, video fluoroscopy, speech recordings, language tests and formal speech pathologist evaluations29. In the same meta-analysis, it was found that there were no significant differences in any of the evaluated outcomes between patients treated with and without PSO except for one metric. The dentoalveolar measurement, MTC angle (a metric of alveolar curvature), was found to be marginally smaller in PSO treatment individuals. It is important to note however, that none of the RCTs included within the study evaluated nasal or facial anatomy measurements within the maxillary region, such as the dimensions of the nose or the shape of the lips. Instead metrics were specific to the mandible position and dental alignment29. 1.10 3D Imaging analysis in CL±P patients and validation
In the last ten years, technological advances in imaging have provided a platform for re-evaluation of the efficacy of PSO. Even though these previously discussed studies failed to support a longitudinal benefit for PSO, the technique continues to be utilized and supported by clinicians implying that perceived benefits exist, even without resounding evidence.
11
The need for a diagnostic tool capable of accurately measuring and quantifying soft tissue anatomy has increased as the direct result of the desire to objectively quantify the impact of individual treatments on facial development. In a review by Thierens et al., many different imaging modalities have been incorporated into the assessment of CL±P patients to rise to this demand49. Specifically, clinical anthropometry, dental casts, facial casts, cephalometric radiographs, clinical facial photographs, 3D surface imaging, computed tomography (CT) and cone-beam CT have all been previously utilized. Of these diagnostic tools, 3D surface imaging has become particularly praised for its lack of ionizing radiation, rapid image acquisition and reliability, which facilitates ease of capturing a 3D facial image. These images when taken serially, can create a patient profile that can be subject to anthropomorphic evaluation and serve to document anatomical growth over time. Some of the noted weakness of the technology are its expensive acquisition and maintenance costs which have limited its application to supported academic locations49,50.
As a novel technique, the validation of 3D imaging for facial analysis was first required. At the time of its introduction, traditional anthropometry was the previous standard for evaluation of facial dimension and shape51. Directly measuring linear distances, ratios or angles along a patient’s face allowed for the identification of dysmorphology and was often a critical component of diagnostic evaluation and surgical planning51. In a comparison between direct anthropometry and 3D stereophotogrammetry of linear facial metrics for 20 healthy patients, it was found that values measured by 3D imaging were highly precise and within 1mm of values measured directly51. Additionally, the 3D measured values were also highly reliable and correlated with directly measured values with a mean Pearson’s coefficient of 0.9151. Additional work has supported the reliability and accuracy of 3D facial imaging52,53. Even in the unrepaired CL±P patient population, persistently high reliability with mean measurement variation remaining at less than 1 mm for measurements obtained from 3D images when compared against direct anthropometry53.
For subjective evaluation of CL±P patient aesthetics, 3D imaging again has been found to be comparable to standard 2D photography. In a study asking lay people to rate facial aesthetics of post-operative lip repair CL±P patients using visual analogue scales, higher interrater reliability was noted with the 3D image set54. Raters also noted that they felt the 3D images provided more information than the 2D images although were likely harder to evaluate54. Yet, 3D imaging is not without the weaknesses of standard 2D photography. Images should be taken of patients with natural facial expression from a standard distance and position. Involuntary facial expressions in young patients can increase the variability of measurements obtained from image evaluation, especially in the nasolabial region55. With a trained photographer and clinical time, the variability attributed to facial expression however can be reduced to <1 mm in all regions of the face55.
Since the validation of 3D images for evaluating CL±P facial morphology, the use of this technique has experienced a rapid increase. A systematic review in 2018 identified a total of 33 studies published specifically utilizing 3D surface imaging for the evaluation of CL±P patients49. These studies were subclassified based on the specific technology utilized, with 22 studies incorporating stereophotogrammetry, 6 studies using structured light-based imaging and 3 studies using laser-based imaging49. These studies were then classified by their method of assessment used to evaluate the 3D images as either objective or subjective analysis. The

12
majority of studies utilized objective evaluation (17) in the form of linear distances, angles of measurement or volume analysis between facial images. Six studies incorporated morphometric multivariate analysis into their methodology to allow for composite shape assessment. All studies, except 2, incorporated into this review were published within the last decade demonstrating the rapid and recent increase in use of 3D imaging for soft tissue evaluation49. A secondary systematic review was conducted to more specifically identify the individual analysis methodologies applied to 3D images obtained from the CL±P population50. This review identified 15 studies that met their criteria and proceeded to accurately describe the method of soft tissue quantification that was employed for comparison of the utilized 3D image dataset50. All studies reviewed utilized images before and after a select surgical intervention to evaluate the specific effect of that procedure on soft tissue (e.g. lip repair, rhinoplasty, bone grafting etc.). Studies looking at primary lip repair, secondary revisions and Lefort I advancements were all highlighted50. Interesting only 2 studies specifically looking at the impact of nasoalveolar molding56,57. The studies again reinforce the growing application of 3D imaging as a way of objectively evaluating CL±P patient outcomes. Unfortunately, they demonstrated a vast degree of heterogeneity which prevents a formal meta-analysis from being conducted and consolidate the current understanding of quantitative soft tissue changes in this population. Studies that have incorporated evaluation of CL±P soft tissue using 3D imaging have generally utilized methodologies that rely on placement of landmarks (homologous, semi-landmarks or quasi-landmarks)50. Landmark placement cannot be protected from a component of operator bias as it requires an individual to annotate key, anatomic positions to facilitate comparison and computation metrics for evaluation. The intra class correlation between measurements produced from individual landmarking sessions for the same operator was found to be 0.68 - 0.97 depending on the facial region58. Thierens et al., argues that a 3D anthropometric mask could serve as an alternative method to alleviate operator bias, however, image assessment would then require highly trained personnel to conduct this type of analysis and would limit the accessibility of this type of methodology50. Nevertheless, with future study guidelines and improved homogeneity of quantification methodologies, 3D imaging analysis could prove to be the future gold standard of evaluation of the therapeutic effects of procedures introduced to the CL±P population50. 1.11 3D imaging of Pre-surgical orthopaedics
Using 3D imaging, numerous studies have described the morphological subsequent to PSO use. Singh et al., used 3D images to compared cleft patients after PSO and lip repair to a control group by principle component analysis59. CL±P patients were found to have smaller surface area dimensions at the columella, lower lip and labial tubercle compared to the non-cleft patients59. Yamada et al., used 3D images to compare CL±P patients at presentation and after 3 months of PSO treatment with a Hotz device60. Their work demonstrated a reduction in the alveolar cleft width and the nostril width after three months of PSO treatment60. Chou et al., used weekly obtained 3D images of presurgical NAM treated CL±P patients to attribute specific improvements in the cleft deformity with the individual stages of NAM treatment56. Serial improvements in nostril dimensions were found after using an alveolar NAM device and then again after introducing the nasal stent component56. Yilmaz et al. used 3D image analysis

13
to demonstrate that PNAM was associated with improvements in nasal and lip symmetry by restoring cleft nostril and lip heights 61. Mancini et al., similarly demonstrated improvements in nasal projection, columella length and nasal symmetry after the use of PNAM62. The application of 3D imaging for CL±P patient facial analysis has effectively demonstrated that select PSO therapies do in fact alter the shape of the CL±P deformity prior to primary lip repair. 1.12 Project design and significance
The use of 3D imaging for assessment of PSO and PNAM treatment has proven to be a valuable tool for improving the evidence supporting the use of these devices. One PSO strategy, lip taping, has almost entirely replaced the need to conduct a lip adhesion procedure63. Caregivers are taught to place an adherent tape across the cleft segment to facilitate alveolar ridge remodeling and soft tissue mobilization63. Negative side effects of this approach include skin irritation and the need for caregivers to continually reapply the tape should it become dislodged63. Currently, two lip taping therapies are employed at the BC Children’s Hospital: 3M Blenderm surgical taping (3M tape) and Dynacleft taping in combination with PSO/PNAM. Although both are utilized, it remains unclear if either taping therapy is superior (Figure 3).
The 3M Blenderm surgical tape is a simple, water proof, hypoallergenic occlusive plastic tape that is flexible and easily manipulated. This product has been historically utilized for its cost effectiveness and ease of use by clinical practitioners. To improve the tape adhesion and protect the skin, Duoderm dressing can be placed on either end of the lip. Dynacleft tape is a newer tape that has more recently been incorporated into the BCCH cleft team practice. The Dynacleft tape boasts an asymmetrical design with a large adhesive paddle and a small elastic component that crosses the cleft. The design is thought to improve adhesion to the patient resulting in a product that does not fall off during patient feedings and normal facial movements. While the cost of Dynacleft tape is significantly higher than the 3M product, the improved compliance with the product is believed to require less professional adjustments and improved cleft lip repair outcomes64.

14
Figure 3. PSO taping systems: 3M (left) and Dynacleft (right).
To compare the impact of both PSO tapes on facial shape, standardized 3D stereophotogrammetry photography scans were obtained at three different stages of treatment. These 3D images were subjected to morphometric evaluation allowing for objective measures of improvement in soft tissue alignment 65. The purpose of this investigation is to determine if the Dynacleft taping system results in similar facial anatomic outcomes compared to the conventional 3M™ taping system, in its ability to improve the CL±P deformity. 1.12.1 Hypothesis
It is hypothesized that there will be a difference between the two taping types, 3M and Dynacleft, in their ability to influence measurements of facial shape after primary lip repair in both unilateral and bilateral cleft patients by morphometric evaluation.
The null hypothesis is that there is no difference in facial shape measurements between the two taping types after lip repair by morphometric evaluation. 1.12.2 Study goals and objectives 1. Evaluate pre-surgical and post-surgical outcomes in patients treated with either Dynacleft or 3MTM tape using 3D imaging and anthropometric measurements. 2. Assess soft tissue facial shape within the CL±P population during the early stages of their cleft lip treatment using two different morphometric techniques. 3. Evaluate secondary variables of interest (cleft severity and PSO treatment protocol) using 3D imaging to determine how these factors influence facial anthropometric measurements.

15
This study is a retrospective review to evaluate the anatomic outcomes of CL±P patients that received PSO treatment and subsequent surgical repair. A schematic overview of the project design is presented in Figure 4.
Figure 4. Schematic demonstrating the overview of the methodology used to compare PSO cleft taping devices by two morphometric analyses.
1.12.3 Project significance This study aims to quantitatively compare two PSO taping methods to assess the direct impact these systems have on facial symmetry following surgical treatment. Ideally, this work will facilitate improved interdisciplinary management of cleft lip repair influencing both pre-surgical orthopedic care and surgical outcomes. We hope that this project will also highlight the use of 3D imaging and morphometric evaluation using landmarking and serve as a foundational tool set for future interdisciplinary studies focused on treatment outcomes. We additionally hope to reinforce the use of morphometrics as an objective outcomes assessment tool within plastic surgery and subspecialized areas including breast, pediatrics and aesthetics. Our application of 3D facial imaging will also reinforce the importance such records for future clinical research.

16
2. Methods 2.1 Overview
Images of patients born with either a unilateral or bilateral cleft lip +/- palate were obtained using 3D stereophotogrammetry at three separate times in their treatment course. The first image was obtained at primary presentation to the orthodontics clinic (before treatment, Stage 1), the second image was obtained after completion of their pre-surgical orthopaedic treatment (Stage 2), and the third after primary lip repair (Stage 3). Once the images were collected, they were manually landmarked using imaging processing software (3dMD Vultus). Over 30 landmarks were placed onto each individual image. The list of landmarks used was derived from the literature. These landmarks can be used to compute specific facial measurements that have been correlated with surgeon rankings of post-operative outcomes including facial aesthetics and presenting cleft severity15,65. A subset of the images was landmarked twice to allow for single operator reliability and error assessment (Mean absolute difference and relative error magnitude) of the landmarking process.
Two methods of analysis will be performed using these annotated facials meshes to quantify specific characteristics of the CL±P facial deformity and the response to PSO and surgical treatments. These two morphometric methods of evaluation will be used to demonstrate if the degree of improvement in cleft morphology using either tape is similar and will be compared statistically.
The first analysis method is conventional morphometrics which will include the use of linear distances, angles and ratio measured from the 3D facial meshes at all three time points. These measurements include previously validated facial metrics associated with improved aesthetics post repair such as nostril width ratio and columellar angle modified from the methodology of Mercan et al.65 (See methods, Figure 7). Conventional morphometrics remains clinically relevant due to its ability to provide easily comprehensible measurements used to describe the trajectory of the CL±P deformity and its response to treatment.
To conduct conventional morphometric analysis of the image, linear distances, angles and ratio were then calculated using the landmarked images by the processing software for each image. These measurements were then imported into R software for statistical analysis. Descriptive analysis and statistical comparison between treatment types and treatment stages was then performed.
The second method of analysis is geometric morphometrics (GM) which utilizes the annotated landmarks of the facial meshes to create a configuration which represents the overall face. This method allows for comparison of overall facial shape between treatment groups at each stage of cleft care. GM analysis can also be used to conduct a symmetry analysis and compare the degree of facial symmetry both within and between treatment cohorts. Together, the use of these two methods of analysis may create a wholistic picture of for the quantification of cleft facial shape and change that occurs as a result of PSO facial taping and surgical therapy. Each technique provides a different set of information and has its own benefits with respect to its ability to quantify differences between the groups of interest.
To conduct geometric morphometric analysis of the image, the coordinate sets of the landmarked images were also imported into R software. The dataset of the coordinate

17
information was then appropriately organized to facilitate overall shape geometric analysis. All right sided unilateral cleft patients were mirrored to ensure coordinates reflected comparable, left sided cleft patients. Then the dataset was subjected to Procrustes superimposition, a statistical process were the orientation and rotation of all images is corrected to their centroid size to allow for comparability between individual landmark sets. Afterwards, statistical analysis by Procrustes ANOVA (facial shape variability assessment of the zeroed coordinates) was performed to identify which treatment factors were statistically associated significant with overall shape variation.
Finally, using the coordinate data, symmetry analysis of the Procrustes distances was also performed. This allowed for comparison between treatment stages and taping types to identify if there was a difference in the overall magnitude of asymmetry between the groups and between the cleft and non-cleft sides of the face. This analysis was performed using object symmetry assessment of the face by Procrustes ANOVA.
Further information for each step is provided within each subsection of the methods. 2.2 Data collection 2.2.1 Patient record review & image collection
Prior to record review, ethics approval was obtained through the University of British Columbia (# H18-01513). All images utilized in this study were obtained by craniofacial orthodontist Dr. A. Loo. As part of her routine care for the treatment of CL±P patients, Dr. Loo uses a 3D stereophotogrammetry camera to obtain images of her patients at each clinical visit. Specifically, a 3dMDtrio system - 3dMD (Atlanta, Georgia, USA) is used to take multiple images of the face from ear-to-ear, that are then generated into a continuous polygon facial mesh map without stitching. This system is composed of 3 modular photography units that capture images in 1.5 milliseconds and renders a map in approximately 9 seconds66. The resulting 3D image of the face is stored in a .tsb file format that includes both the 3D polygon map and its associated color texture, which together can be opened as a 3D manipulatable image66 (Figure 5). Prior to use, the camera is calibrated daily using a 3dMD calibration board that corrects for subject distance and white balance

18
Dr. Loo’s records consists of ~ 10 years of documented images. During this retrospective review, these clinical records were analyzed for all patients diagnosed with an orofacial cleft treated under her care that met the study inclusion criteria. Inclusion for this study required: 1) patients had at least one 3dMD image taken during their treatment (either pre-treatment, post PSO/NAM or post-surgery), 2) clear documentation of the pre-surgical orthopaedics received by the patient was available and 3) Image quality was sufficient for landmarking analysis. Exclusion criteria for the study was also defined as 1) the orofacial cleft present was not externally visible (e.g. isolated cleft palate), 2) the patient was formally diagnosis with a syndrome associated with their CL±P and 3) patient images had multiple issues preventing reliable landmarking. Syndromic CL±P patients were excluded as it was believed that that their facial morphology may significantly differ from the non-syndromic CL±P patients and therefore may confound the analysis. After a list of patients that met the criteria was created, the following clinical information was extracted from the electronic records of each patient: sex, cleft diagnosis (side, type, palatal involvement), age of patient at each photo, pre-surgical orthopaedics received (tape, nasal stent, obturator, plate, formal NAM) and orthodontist. The 3D images of each patient for each stage of treatment were also collected. These images were screened for their quality, patient positioning and facial expression. If multiple images from the same time point were available, the photo with the most neutral expression was selected (i.e. eyes open, mouth closed, face forward, no animation). Additionally, all potential photo problems were recorded such as facial secretions, drool, low image quality, poor lighting, open mouth and crying.
Figure 5. 3dMD stereophotogrammetry facial images and camera system. Images obtained using a 3dMD stereophotogrammetry system consists of both a 3D polygon mesh and a colored texture overlay that can be stored together as a tsb. file. A) Examples of a yellow polygon facial mesh and its associated colored texture map. B) Visual demonstration of a 3dMD camera system assembled and ready for use with patient positioned. Images have been obtained from 3dMD (http://www.3dmd.com/static-3dmd_systems/) and reused with permission.

19
After the images were extracted from the clinical records of the study population, they were visualized and landmarked using 3dMDvultus (3dMDvultus, Atlanta, Georgia). 2.3 Landmark selection and conventional analysis template Prior to the landmarking process, a review of the literature was conducted to identify relevant studies that provided complete landmark sets for the purpose of analyzing CL±P patients62,65,67. The majority of these landmarks were based on biologically defined facial points (e.g. inner canthus) with clear definitions. Mercan et al., also presented a list of landmarks that allowed for calculation of a set of specific anthropometric measurements that were found to correlate with plastic surgeon perceptions of cleft severity and aesthetics65. The comprehensive landmark list was edited for duplicates, resulting in a total of 44 landmarks used for annotating unilateral cleft patients. The definitions of these landmarks were compared between studies to ensure consistency (Table 1). A total of 46 landmarks were included in the final bilateral landmark list (Table 2). These included landmarks from the unilateral set, along with duplicated cleft landmarks around the nasolabial area.
Linear distances, angles and ratios were obtained directly from 3dMDvultus. To do this, an analysis template was created that utilized the previously defined landmarking sets to compute a set of anthropometric measurements from each facial mesh. These measurements have been previously supported in the literature to evaluate surgical outcomes in the CL±P patient population15,65. The definite list of metrics anthropomorphic metrics calculated using the landmarks can be found in table 3 for both unilateral and bilateral patients.

20
Table 1. Unilateral cleft lip landmark list.
Landmark name Label Description GNATHION GN most anterior point of midline chin (on
lateral view) TRAGION_NONCLEFT T_N Most superior point of tragus attachment TRAGION_CLEFT T_C Most superior point of tragus attachment GLABELLA G Midline point between inferior horizontal
of brows MID_ENDOCANTHION_POINT MEN midpoint between endo canthi ENDOCANTHION_NONCLEFT EN_N medial canthus, contralateral to cleft ENDOCANTHION_CLEFT EN_C medial canthus, ipsilateral to cleft EXOCANTHION_NONCLEFT EX_N lateral canthus, contralateral to cleft EXOCANTHION_CLEFT EX_C lateral canthus, ipsilateral to cleft SELION SEL most posterior depression along
the nasal root (lateral view), this equivalent to the soft tissue nasion.
NOSTRIL_LATERAL_NONCLEFT nos_latN most lateral point of nostril rim NOSTRIL_MEDIAL_NONCLEFT nos_medN most medial point of nostril rim NOSTRIL_LATERAL_CLEFT nos_latC most lateral point of nostril rim NOSTRIL_MEDIAL_CLEFT nos_medC most medial point of nostril rim NOSTRIL_SUPERIOR_NONCLEFT nos_supN most superior point of nostril rim NOSTRIL_INFERIOR_NONCLEFT nos_infN most inferior point of nostril rim NOSTRIL_SUPERIOR_CLEFT nos_supC most superior point of nostril rim NOSTRIL_INFERIOR_CLEFT nos_infC most inferior point of nostril rim ALAR_NONCLEFT AL_N supra-medial alar base insertion site ALAR_CLEFT AL_C supra-medial alar base insertion site COLUMELLA_APEX CA columellar apex, horizontal midpoint of
columellar in line with superior nostril rim
COLUMELLA_MIDPOINT CM columellar midpoint NASALE_TIP PRN most anterior point of nose tip (on lateral
view) ALAR_CURVATURE_CLEFT AC_C most lateral point on external curvature
of alar rim ALAR_CURVATURE_NONCLEFT AC_N most lateral point on external curvature
of alar rim COLUMELLA_HEIGHT_NONCLEFT CL_N mid soft tissue triangle aligned with
columellar edge COLUMELLA_HEIGHT_CLEFT CL_C mid soft tissue triangle on columellar
edge COLUMELLA_CLEFT_EDGE CE_C edge of columellar base on noncleft side COLUMELLA_NONCLEFT_EDGE CE_N edge of columellar base on cleft side

21
Landmark name Label Description SUBALAR_POINT_NONCLEFT SA_N Inferio-lateral alar base insertion point SUBALAR_POINT_CLEFT SA_C Inferio-lateral alar base insertion point SUBNASALE SN mid columellar base CRISTA_PHILTRI_NONCLEFT CPH_N cupid's bow vermillion point CRISTA_PHILTRI_NONCLEFT_white_roll CPH_Nwr cupid's bow white roll point CRISTA_PHILTRI_CLEFT CPH_C cupid's bow vermillion point CRISTA_PHILTRI_CLEFT_white roll CPH_Cwr cupid's bow white roll point NOORDOFF_point NP Noordoff's point on vermillion NOORDOFF_point_white_roll NPwr Noordoff's point on white roll WET_DRY_JUNCTION_CLEFT WDJ_C wet to dry junction inferior to cleft
cupids bow WET_DRY_JUNCTION_NONCLEFT WDJ_N wet to dry junction inferior to noncleft
cupids bow WET_DRY_JUNCTION_NOORDOFF WDJ_NP wet to dry junction inferior to Noordoff’s
point LABIALE INFERIUS LI inferior midpoint of lip along vermillion CHEILION_NONCLEFT CHL_N commissure CHEILION_CLEFT CHL_C commissure
Table 2. Bilateral cleft lip landmark list.
Landmark name Label Description ALAR_CURVATURE_LEFT AC_L most lateral point on external
curvature of alar rim ALAR_CURVATURE_RIGHT AC_R most lateral point on external
curvature of alar rim ALAR_LEFT AL_L supra-medial alar base insertion site ALAR_RIGHT AL_R supra-medial alar base insertion site COLUMELLAR_APEX CA columellar in line with superior
nostril rim COLUMELLAR_EDGE_LEFT CE_L edge of columellar base on left side COLUMELLAR_EDGE_RIGHT CE_R edge of columellar base on right side CHELION_LEFT CHL_L commissure CHELION_RIGHT CHL_R commissure COLUMELLA_HEIGHT_LEFT CL_L mid soft tissue triangle aligned with
columellar edge COLUMELLA_HEIGHT_RIGHT CL_R mid soft tissue triangle on columellar
edge COLUMELLAR_MIDPOINT CM columellar midpoint CRISTA_PHILTRI_LEFT CPH_L cupid's bow vermillion point CRISTA_PHILTRI_CLEFT_white_roll CPH_Lwr cupid's bow white roll point

22
Landmark name Label Description CRISTA_PHILTRI_RIGHT CPH_R cupid's bow vermillion point CRISTA_PHILTRI_RIGHT_white roll CPH_Rwr cupid's bow white roll point CUPID’S_MIDPOINT CUP cupid's bow vermillion point CUPID’S_MIDPOINT_white_roll CUP_wr cupid's bow white roll point ENDOCANTHION_LEFT EN_L medial canthus, left ENDOCANTHION_RIGHT EN_R medial canthus, right EXOCANTHION_LEFT EX_L lateral canthus, left EXOCANTHION_RIGHT EX_R lateral canthus, right GLABELLA G Midline point between inferior
horizontal of brows GNATHION GN most anterior point of midline chin
(on lateral view) LABIALE INFERIUS LI inferior midpoint of lip along
vermillion MID_ENDOCANTHION_POINT MEN midpoint between endo canthi NOSTRIL_LATERAL_LEFT nos_latL most lateral point of nostril rim NOSTRIL_LATERAL_RIGHT nos_latR most lateral point of nostril rim NOSTRIL_MEDIAL_LEFT nos_medL most medial point of nostril rim NOSTRIL_MEDIAL_RIGHT nos_medR most medial point of nostril rim NOSTRIL_SUPERIOR_LEFT nos_supL most superior point of nostril rim NOSTRIL_SUPERIOR_RIGHT nos_supR most superior point of nostril rim NOORDOFF_point_left NP_L Noordoff's point on vermillion NOORDOFF_point_right NP_R Noordoff's point on vermillion NOORDOFF_point_white_roll_left NPwr_L Noordoff's point on white roll NOORDOFF_point_white_roll_right NPwr_R Noordoff's point on white roll NASALE_TIP PRN most anterior point of nose tip (on
lateral view) SUBALAR_POINT_LEFT SA_L Inferio-lateral alar base insertion
point SUBALAR_POINT_RIGHT SA_R Inferio-lateral alar base insertion
point SELION SEL most posterior depression along
the nasal root (lateral view) SUBNASALE SN mid columellar base WET_DRY_JUNCTION_CUPID WDJ_CM wet to dry junction inferior to cupids
bow midpoint WET_DRY_JUNCTION_LEFT WDJ_L wet to dry junction inferior left crista
philtri WET_DRY_JUNCTION_NOORDOFF_LEFT WDJ_NPL wet to dry junction inferior to
Noordoff’s point WET_DRY_JUNCTION_NOORDOFF_RIGHT WDJ_NPR wet to dry junction inferior to
Noordoff’s point

23
Landmark name Label Description WET_DRY_JUNCTION_RIGHT WDJ_R wet to dry junction inferior right
crista philtri Table 3. Unilateral and bilateral cleft lip conventional morphometric metric lists.
Unilateral cleft measurements
Landmarks Bilateral cleft measurements
landmarks
Nasal tip projection SN to PRN Nasal tip projection SN to PRN Nasal bridge Length SEL to PRN Nasal bridge length SEL to PRN Columella length, cleft CE_C to CL_C Columella length, left CE_L to CL_L Columella length, noncleft
CE_N to CL_N Columella length, right CE_R to CL_R
Nasal Aperture width, noncleft
SA_N to CE_N Nasal aperture width, left
SA_L to CE_L
Nasal Aperture width, cleft
SA_C to CE_C Nasal aperture width, right
SA_R to CE_R
Nostril width, maximum
AC_N to AC_C Nostril width, maximum AC_R to AC_L
Nostril width, Inner base
AL_C to AL_N Nasal length, left SA_L to PRN
Columellar width CE_N to CE_C Nasal length, right SA_R to PRN nostril width, cleft Nos_latC to
nos_medC Nostril width, inner base AL_L to AL_R
nostril width, noncleft Nos_latN to nos_medN
Columellar width CE_R to CE_L
lip width CHL_N to CHL_C nostril width, right Nos_latR to nos_medR
medial lip height, noncleft
SN to CPH_Nwr medial lip height, left SN to CPH_Lwr
medial lip height, cleft SN to CPH_Cwr medial lip height, right SN to CPH_Rwr lateral lip height, cleft SA_C to CPH_Cwr lateral lip height, right SA_R to CPH_Rwr lateral lip length, cleft CHL_C to CPH_C lateral lip height, left SA_L to CPH_Lwr lateral lip length, noncleft
CHL_N to CPH_N lateral lip length, left CHL_L to CPH_L
lateral lip height, noncleft
SA_N to CPH_Nwr lateral lip length, right CHL_R to CPH_R
cupids bow width CPH_N to CPH_C cupid's bow width CPH_L to CPH_R vermillion height, noncleft
CPH_N to WDJ_N Nasal base columellar angle, left
AL_L to SN to PRN
vermillion height, medial cleft
CPH_C to WDJ_C Nasal base columellar angle, right
AL_R to SN to PRN

24
Unilateral cleft measurements
Landmarks Bilateral cleft measurements
landmarks
vermillion height, lateral cleft
NP to WDJ_NP columellar angle See methods for calculation
nostril width ratio Nos_latC to Nos_medC/nos_latN to nos_medN
nostril width ratio Nos_latL to Nos_medL/nos_latR to nos_medR
Nasal base columellar angle, cleft
PRN to SN to AL_C columellar length ratio CE_L to CL_L/CE_R to CL_R
Columellar angle See methods for calculation
medial lip height ratio CPH_Rwr to SN/CPH_Lwr to SN
Nasal base columellar angle, cleft
PRN to SN to AL_C lateral lip height ratio CPH_Rwr to SA_R/CPH_Lwr to SA_L
Columellar length ratio CE_C to CL_C/CE_N to CL_N
lateral lip length ratio CPH_R to CHL_R/CPH_L to CPL_L
nostril height ratio Nos_infC to nos_supC/nos_infN to nos_infN
lip to nose width ratio
CHL_L to CHL_R/AC_L to AC_R
medial lip height ratio CPH_Cwr to SN/CPH_Nwr to SN
lateral lip height ratio CHL_N to CPH_N/ CHL_C to NP
Lip to nose width ratio CHL_N to CHL_C/AC_N to AC_C
See Table 1 and 2 for the full landmark names associated with each landmark abbreviation.

25
2.4 Image processing and landmarking Landmarks were manually placed on the images by a single operator (P.M.). The 3dMDvultus program allows for facial mesh rotation and translation so that each landmark can be accurately placed at its defined biological location (Figure 6). After the placement of each landmark, the lateral, superior and inferior views of the placement were checked to ensure accuracy. Once all patients at each stage of treatment for both the unilateral and bilateral cleft patients landmarked, the X,Y,Z cartesian coordinates were exported for further analysis. 3dMDvultus also calculated and exported anthropometric measurements of interest. For the unilateral dataset, 44 landmarks previously selected based on literature review were used to calculate 34 metrics (distances, angles and ratios) from each facial image for conventional morphometric analysis. All facial ratios were calculated as cleft side/non-cleft side except for lateral lip height ratio (non-cleft/cleft). A few landmarks were inconsistency placed on the images: tragus (R/L) and cleft inferior nostril. The tragus landmarks were difficult to place due to either the 3D facial image ending anterior to the ear or due to poor resolution of this region. Therefore, these two landmarks were eliminated from further analysis. The cleft inferior nostril landmark was eliminated do to the fact that complete cleft patients did not have this landmark being that their cleft included the inferior nasal sill. Therefore, instead of only including this landmark in the incomplete cleft images, it was also removed from further analysis for consistency between image comparisons. For the bilateral dataset, 47 landmarks were selected based on literature review and from annotation of the unilateral landmark set previously used. Because of the increased complexity of a bilateral cleft, additional landmarks were required to properly annotate the images. A few landmarks originally utilized in the unilateral dataset were not appropriate or applicable to the bilateral morphology and were resultantly removed. These landmarks were used to calculate 31 metrics from each facial image for conventional morphometric analysis. Again, the tragus landmarks were removed from subsequent analysis (see above).
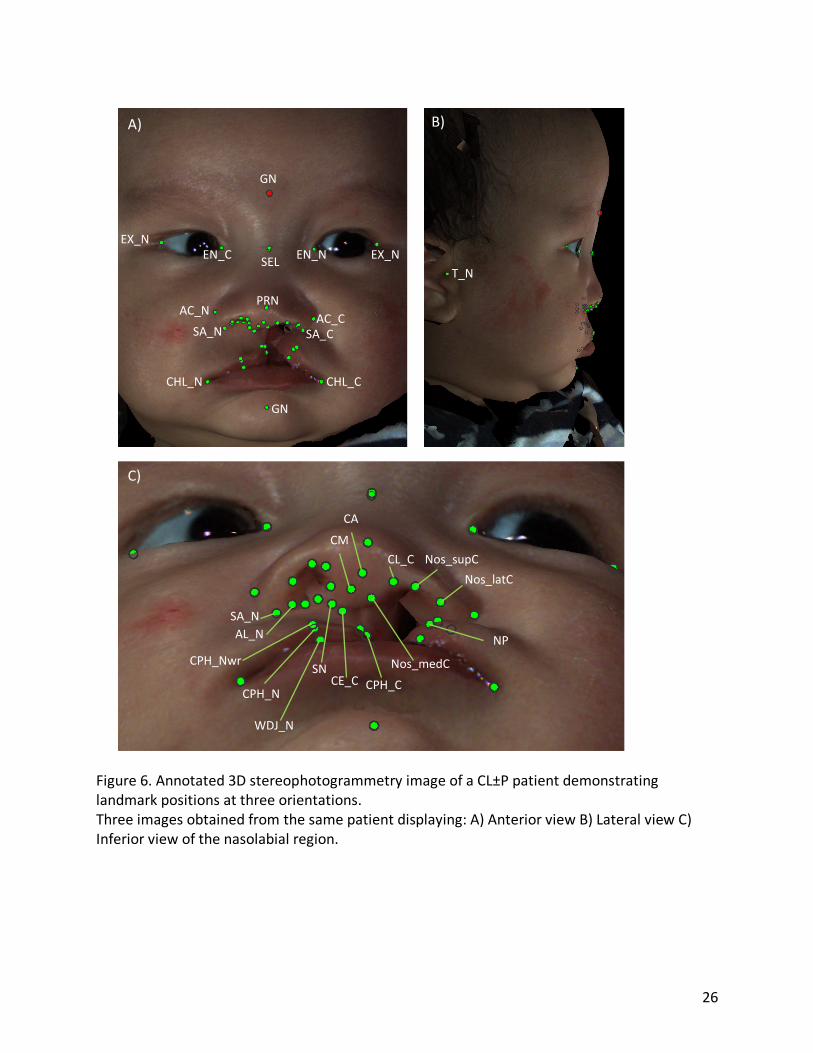
26
Figure 6. Annotated 3D stereophotogrammetry image of a CL±P patient demonstrating landmark positions at three orientations. Three images obtained from the same patient displaying: A) Anterior view B) Lateral view C) Inferior view of the nasolabial region.
EX_NEX_N
GN
EN_NEN_C SEL
PRN
GN
CHL_CCHL_N
AC_CAC_NSA_N SA_C
T_N
NP
Nos_latCNos_supCCL_C
CACM
Nos_medCCE_C
SNCPH_C
CPH_N
AL_NSA_N
CPH_Nwr
WDJ_N
A) B)
C)

27
2.5 Error calculations To evaluate intra-operator error and landmarking reliability, the entire image dataset
was landmarked twice. This was done 6 months after the initial landmarking to prevent operator familiarity and bias.
Fidelity is defined as the inter-rater reliability, or the variation attributed to the differences found between individual observers. Since only one operator was involved in the landmarking of these images, no fidelity evaluation was performed. Similarly, accuracy is defined as the inter-method reliability and is used to test a method of evaluation against a gold standard. An example of this would be to compare measurements obtained from digital 3D stereophotogrammetry images to measurements obtained from direct facial measurements. Since only one method of landmarking (digitally) was conducted within this study, no accuracy evaluation was performed.
Precision or intra-rater reliability is defined as the magnitude of difference between repeated measurements by the same observer51. Methods for evaluating the precision of landmarking by 3D stereophotogrammetry have been previously described51,53. Weinberg et al., described two measurements of precision which include the mean absolute difference (MAD) and relative error magnitude (REM) of measured values68. MAD is calculated as the average of absolute differences between two sets of measurements for all images. MAD can be used to then calculate the REM by dividing the MAD value by the grand mean value of a measurement across all images. Both the MAD and REM were calculated for the duplicated image data set for all analyzed anthropometric measurements to specifically demonstrate the precision of the conventional morphometric methodology.
One additional measurements of error, Dahlberg error, have been previously utilized for quantifying the error associated with linear measurements and angles15. Dahlberg error is metric that assesses random error and has predominantly been utilized in cephalometric studies69. Dahlberg error can be challenging to interpret as there is no acceptable value range for which the calculated error can be deemed noncontributory. However, it does provide a quantified measurement of error of each evaluated metric to facilitate relative comparisons.
Finally, another method for evaluating the error attributable to landmarking precision and reliability involves landmarking the digital images multiple times and then subjecting the dataset to geometric morphometric analysis with Procrustes superimposition and ANOVA analysis based on the landmark replication.59 If the resulting difference in procrustean forms is found to statistically insignificant between landmarking occasions, the error can be deemed to insignificantly contribute to the overall shape analysis. To do this the entire unilateral image dataset was landmarked twice and subjected to a geometric morphometric analysis with ANOVA comparison. 2.6 Conventional morphometrics
The goal of the conventional morphometric analysis was to evaluate how different types of pre-surgical lip tape alters specific facial measurements. Here, R statistical software was used to conduct the morphometric analysis of the landmarked images. Descriptive statistics of the demographic features measured within the cohort were summarized including age at each stage, tape type, cleft type and cleft side. The entire image dataset was categorized first by treatment stage (i.e. stage 1, 2 and 3) and then by one of three comparison groups of interest:

28
taping type, cleft severity and PSO protocol. These subgroup comparisons were designed to evaluate both the primary research question (i.e. differences between tape types) and the additional secondary factors of interest (i.e. differences between cleft severity and PSO treatment protocol). Tape type referred to patients received either Dynacleft tape or 3M tape.
The anthropometric measurements of nostril width ratio and columellar angle have been previously correlated with cleft severity15, however, a classification system with objective parameters for grading cleft severity using both these two metrics has not yet been validated. Campbell et al., described a four-grade severity index that incorporated only nostril width ratio but not columellar angle. Therefore, to define severity within our populations, two systems were used: a de novo definition of cleft severity and the Campbell et al., Unilateral Cleft Severity Index (UCSI). For the de novo system, the metrics nostril width ratio and columellar angle were calculated for each patient and patients resultantly categorized as severe if either value was greater than the 50th percentile for the cohort. For the Campbell et al., system, clefts were first classified as incomplete (grade 1 and 2) and complete (grade 3 and 4). Complete clefts were then defined as grade 3 if the measured nostril width ratio at stage 1 was < 2.0 and grade 4 if the nostril width ratio was > 2.0. The incomplete clefts (grade 1 and 2) could not be separated into their respective severity grades, as their cleft height was not measured during the landmarking process and therefore during the morphometric analysis they remained as a pooled group. Finally, for the third comparison PSO protocol, patients were categorized as having received PNAM (plate with nasal component) in conjunction with their lip taping or as having received PSO only therapies (isolated plate without nasal stent).
Statistical analysis was conducted to identify the mean and standard deviation of all measured anthropometric measurements by taping group, cleft severity and PSO protocol. T-test statistics of unequal variance were used to compare mean measurement values within treatment stages between comparison groups. Paired t-test statistics were used to compare mean measurement values between two treatment stages within the same comparison group (e.g. same taping). This process was repeated for all between-stage comparisons and within-stage comparisons. Statistical significance was defined by the alpha value of 0.05 for all performed comparisons.
Four conventional metrics were used to highlight the differences between the cohort groups (e.g. tape type, severity, PSO protocol): nostril width ratio, columellar angle, lateral lip height ratio and columellar length ratio (Figure 7). These metrics have been previously linked to visual perceptions of cleft lip severity and aesthetic outcomes when evaluated by surgeons15,65. Nostril width ratio (NWR) represents a measurement of the proportional difference between the cleft and non-cleft nostril width (Figure 7A). The measurement of columellar angle was calculated from two measured metrics (Figure 7C). The angle from the alar insertion point to the columellar base to the nasal tip was measured on both the right and left sides of the face. To determine the columellar deviation, these angles were averaged between both the noncleft and the cleft side. Then, the more acute angle of the two measured angles was subtracted from the average of the two. Resulting, this would determine the deviation of the columella from the midline location defined by the two cleft sides relative to the nostril base. The lateral lip height ratio (LLHR) is the ratio between cleft and non-cleft side subalar point (lowest point on the lateral alar insertion) to the crista philtra (Figure 7B). For this metric, a large deviation away from 1.0 occurs in an unrepaired cleft patient, where the lateral lip height of cleft side is

29
shortened. The columellar length ratio (CLR) is a metric obtained from two linear distances obtained from either side of the columella (Figure 7D), using landmarks based from the posterior lateral border of the columella to the soft tissue triangle where the columellar merges into the nasal tip. The ratio of these two distances demonstrates the severity of the nasal depression. A large deviation away from 1.0 usually indicates a lengthen columella on the non-cleft side in response to a depressed and deviated nasal tip towards the affected cleft side.
Figure 7. Four conventional morphometric measurements used to evaluate facial shape of cleft lip patients. Four previously validated conventional morphometrics that correlate with aesthetic improvement of the cleft lip anomaly after surgical correction as demonstrated by Mercan et al. and Mancini et al.62,65. Individual treatment responses to PSO and surgical lip repair were also assessed. To do this, the difference between the stage 2 value for each conventional metric was subtracted from the stage 1 value for every patient. The treatment response to primary lip repair was also calculated by subtracting the stage 3 values for each metric from the stage 2 value. Only patients with images at all three treatment stages were used for this sub-analysis. Statistical comparison between stage 1-2 and stage 2-3 improvements were compared between treatment factors (i.e. tape type, severity, PSO protocol) using t-tests of unequal variance. A subgroup analysis of patients with delta values less than zero between stages 1 and 2 was done to identify patients with no improvement from PSO treatment. The percentage of patients with no improvement in at least one metric was used to determine the failure rate of the PSO treatment. The bilateral dataset was then subjected to the same analysis process as the unilateral data. Since these patients processed two orofacial clefts, facial metrics could not be calculated as cleft side/non-cleft side. Therefore, ratios were tabulated as larger value/smaller value. A facial ratio of 1 represents perfect bilateral symmetry.

30
Unlike the unilateral data, cleft severity and PSO protocol were not utilized for subgroup analysis for the bilateral patients. No facial metrics have been demonstrated to be indicative of cleft severity in the bilateral CL±P population and therefore categorization could not be reliably performed. Furthermore, no comparison for PSO protocol could be used as all patients received PNAM during their treatment in conjunction with their lip taping. Instead, comparative analysis between unilateral and bilateral patients was conducted to profile variation within the selected facial metrics depending on the presenting cleft anatomy. Conventional morphometric comparison was only performed between taping type and as a comparison between bilateral and unilateral CL±P patients. 2.7 Geometric morphometrics
The goal of geometric morphometric (GM) analysis was to evaluate the impact of the tape type on the overall facial shape of the CL±P patients as they progressed through their treatment. GM Procrustes ANOVA is a type of analysis that evaluates the variation of overall landmark shape between categorical subgroups. In doing so, this method allows for comparison between treatment subgroups to determine if the overall facial shape is significantly different depending on the type of taping received.
In order to conduct the GM analysis within the R software, the coordinate data was organized into an array and subset into three facial regions: nose, nasolabial and columella (Figure 8). Using these three regions, we then performed Procrustes superimposition and ANOVA analysis (see below). All right sided cleft images were first mirrored by multiplying the x coordinate for each landmark by -1, so that the coordinates from each individual patient would correspond to a left unilateral cleft and allow for shape comparison. Then generalized Procrustes analysis (GPA) was carried out to produce a set of Procrustes coordinates.
GPA is a is a superimposition method wherein each image is first scaled to their unit “centroid size”, calculated as the squared root of their summed squared distance from each landmark to the geometric mean70. Then the images are translated to share a common centroid and rotated to align using an iterative alignment process that minimizes the distances between all corresponding homologous landmarks70. The result produces a set of new “Procrustes coordinates” where the variation in position, shape and orientation has been removed to allow for true shape comparisons.

31
Figure 8. Landmark regions subjected to geometric morphometric facial analysis. Three separate facial regions were initially subjected to GM analysis prior to selection of the nasolabial landmark as the focus region. A) nose B) nasolabial C) columella. Blue landmarks define the nasal region. Red landmarks define the columellar region. Yellow landmarks define the lip region. Green landmarks were excluded from the GM analysis.
After GPA, the Procrustes coordinates were then subjected to Procrustes ANOVA using
the procD.lm function provided by the Geomorph package within R. Procrustes ANOVA is a function that allows for the quantification of the relative amount of shape variation attributable to categorical factors and can be used to create a model of shape variation71. The Procrustes ANOVA analysis utilizes the sum-of-squared Procrustes distances produced from the superimposition, and forms the basis of an analysis of variance as opposed to a covariance matrix. Similar to regression modeling, p-values of significance can then be assigned to each factor incorporated into the ANOVA model to evaluate its ability to influence the shape variation, as reflected by the Procrustes distances. For the purposes of the ANOVA modeling, 999 iterations were performed for significance testing with a sum of squares type of I (sequential). An F distribution was used as the effect type. This process of Procrustes ANOVA modeling was performed repeatedly to identify the best model capable of representing the variation within the Procrustes distances. In a sequential manner, categorical factors such as tape type, PSO protocol, and cleft severity were added to the model and their significance was evaluated. This process was repeated for all three facial region landmark subsets and values of significance were assigned to each evaluated factor. This methodology was applied similarly to both the bilateral and the unilateral datasets. 2.8 Fluctuating asymmetry analysis
After determining if overall facial shape was influence by tape type by GM analysis, the influence of tape type on the magnitude of facial asymmetry was assessed. To do this, fluctuating asymmetry (FA) analysis was conducted to determine if significant facial asymmetry was present within the cohorts. FA refers to the random deviations from bilateral symmetry and can be used to quantify developmental instability. If asymmetry is present, comparisons can then be made between categorical subgroups to determine if the degree of facial

32
asymmetry is influenced by the treatments that the CL±P patients received. Specifically, the goal of this analysis was to quantify if facial asymmetry remained present after primary lip repair (Stage 3) once the cleft deformity was closed, and if the two tapes influenced the resulting magnitude of this asymmetry.
It is important to note that two types of asymmetry have been described for this purpose, matching asymmetry and object asymmetry. Matching asymmetry is used when two objects can be superimposed on one another and the shapes compared. This is commonly applied for bilaterally symmetric anatomy that is not defined by a midpoint such as comparing a pair of wings. Object symmetry refers to bilateral symmetry that is defined by a midline plane such as a face. In this instance, the symmetry is calculated relative to this midline without actually placing a midline plane, by assessing the shape variation of superimposing mirror images. For both methodologies, the basis of symmetry quantification involves the use of a landmarked dataset that can be subjected to Procrustes superimposition. After superimposition of the images, the resulting Procrustes distances can be compared using similar mathematical principles of the Procrustes ANOVA (as above), only that the comparison is done between objects sides (i.e. cleft and non-cleft) to produce a statistical conclusion as to whether the sides themselves are different in shape. For the CL±P study population, object symmetry is the more appropriate method of evaluation. The majority of the CL±P pathology involves midlines structures (nose, lips and philtrum) and paired landmarks position adjunct to the midline can be used to evaluate the degree of asymmetry between two sides of a face without define the mid-face plane. The function, bilat.symmetry in the R package Geomorph is specifically designed for the purpose of evaluating population asymmetry. Using a subset of paired landmarks, after completing Procrustes superimposition, the function compares the asymmetry attributable to individuals and sides using Procrustes ANOVA to conclude if significant asymmetry is attributable to the population (p-value<0.05).
While the function bilat.symmetry allows for a conclusion as to whether significant asymmetry is present, it cannot quantify it or assign treatment modalities or demographic variables associated with asymmetry. To overcome this, quantification of the overall magnitude of asymmetry present have been described72. Using this method allows for comparing the amount of asymmetry between treatment cohorts and identifies if a marked degree of asymmetry is attributable to an individual subpopulation. To do this, a population of images was first segmented into their left and right sides based on their landmarks. Next, the right sided coordinates were mirrored (as above) onto the left side. Afterwards, all landmarks were subjected to Procrustes superimposition so that the left side of the face was aligned with the right side and new Procrustes coordinates were obtained72. The Procrustes distance is then obtained by subtracting the Procrustes coordinates of the left from the right side of the face. These Procrustes values are summed and squared for each image. The result is a set of values that represent the FA for each population. Subsequently, Levene’s test can be applied to test for differences in variation and to conclude if a difference in FA is present. To do this, the previously obtained squared sums are separated into the two populations to be compared (e.g. tape type)72. The square sums are averaged for each population and then the mean is subtracted from each squared sum value within the population. These values are then transformed into their absolute value to create two data sets that can be subjected to t-test

33
analysis to compare their means. The result provides a p-value and a conclusion of significance as to whether the degree of asymmetry is markedly different between the two populations72.
Using the methods described above, we first conducted an asymmetry analysis to evaluate if bilateral asymmetry was present within the CL±P patient cohort at stage 3 for both the bilateral and unilateral cohorts. Only stage 3 was evaluated as both stage 1 and stage 2 contain unrepaired cleft lips and a formal analysis was not required to evaluate presence of asymmetry. Furthermore, stages 1 and 2 images do not contain symmetrically paired landmarks that can be used to facilitate asymmetry analysis.
After a formal asymmetry assessment. The magnitude of FA was evaluated between relevant comparison groups. These comparison groups were identified by the GM analysis. If the GM analysis confirmed statistical significance in overall shape by Procrustes ANOVA comparison of a categorical variable, these two populations where subjected to overall asymmetry analysis. This included comparing the magnitude of asymmetry between taping types, PSO protocols and cleft severity for the unilateral cleft patient population.

34
3. Results 3.1 Unilateral dataset
This retrospective study reviewed CL±P patients who presented to the office of Dr. A. Loo from 2008 to 2019. A total of 69 unilateral cleft patients was identified for the purposes of the review with at least one 3D image obtained during their care at one of the three time points: stage 1 (pre-treatment), stage 2 (post presurgical orthopaedics) and stage 3 (post lip repair). From this cohort of 69 patients, at total of 171 images were obtained. Not all patients had images from all three stages. Additionally, on review of each image, some were excluded if the face was deemed to be animated or artifacts interfered with the quality of the images. Factors that resulted in exclusion of images included excessive crying, drooling or facial animation that markedly differing from a resting position. In total, 62 images from stage 1, 53 images from stage 2 and 56 images from stage 3 were obtained. Within this cohort, 41 of the patients had images for all three treatment stages presenting a total of 123 images. A breakdown of image representation within the unilateral cohort is provided in the appendix (Appendix C).
The demographic and clinical information obtained from the CL±P patient records is summarized in Table 4. We had marginally larger number of males than females included in the study (55%). Ethnicity was inconsistently reported and not included in the analysis. The majority of clefts were complete (72%) and were diagnosed as cleft lip and palate (69%) which is slightly higher prevalence than the 54% reported by epidemiological review. This selection bias is likely created by the exclusion of cleft patients that did not receive PSO/NAM from being recruited in this study73. Of the typing systems, more patients received 3M tape (71%) compared to the Dynacleft tape (29%) as Dynacleft tape had been incorporated into clinical practice more recently compared to the 3M tape. A total of 4 unilateral cleft patients received Dynacleft tape initially and then transitioned to 3M tape. For analysis purposes, these patients were grouped with their initially assigned treatment (i.e. Dynacleft). The average age of patients by stage was: 22.3 days for stage 1, 110.2 days for stage 2 and 189.7 days for stage 3.
Patients were also categorized by the secondary objective variables of cleft severity and PSO treatment protocol (PNAM vs. non-PNAM, Table 4). A slightly higher amount of Dynacleft treated patients had a severe presenting cleft lip morphology (65.0%) than the 3M treated cohort (52.2%) although this difference was not statistically significant (p-value=0.34). The Dynacleft treated cohort additionally had a higher number of patients who received PNAM treatment (71.4%) compared to the 3M cohort (60.4%) although this was also noted to be non-statistically significant (p-value=0.063, Table 4).

35
Table 4. Unilateral CL±P patient cohort demographics and clinical features.
3M Tape Dynacleft tape P-value Patients 47 22
Age (mean ± std days)
Stage 1 (62 images) 22.5 ±19.4 22.1 ± 20.4 0.97 Stage 2 (53 images) 105.7 ±29.5 131.8 ± 89.6 0.59 Stage 3 (56 images) 202.9 ± 308.6 167.0 ± 82.2 0.52
Sex
Male 23 16 0.063
Female 24 6
Cleft diagnosis
Cleft Lip +/- Palate 33 19 0.147 Cleft Lip and Alveolus 14 3
Cleft type
Unilateral complete 31 18 0.093 Unilateral incomplete 16 4
Cleft side
Left 32 16 0.696 Right 15 6
Cleft severity Non-severe 22 7 0.335 Severe 24 13 PSO protocol PNAM 26 15 0.063 PSO only 17 6
Statistical tests were performed to compare the demographic features between the patients that received the two taping types. T-test of unequal variance were used to compare the mean ages of at each stage of treatment between the taping cohorts. Chi-squared statistics were used to determine associations between the categorical variables and tape type.

36
Patients were then categorized based on the severity of their initial cleft morphology. Patients were labelled as having a severe cleft morphology at presentation if their NWR was greater than 2.2 (50th percentile) or their columellar angle was greater than 13.1 degrees (50th percentile). Patients with values below these cut off points were classified as “non-severe.” Using the de novo severity classification, a total of 27 patients were labeled as non-severe and the remaining 37 as severe. Patients were also classified using the UCSI (see Methods). Patients lacking a stage 1 image could not be classified based on presenting severity. Finally, the unilateral cohort was also categorized based on PSO treatment protocol that they recieved. A total of 41 patients were placed into the PNAM group as their PSO strategy included the use of a nasal targeted treatment device for any period of time during their care (e.g. nasal stent). The remaining 23 patients were categorized into the PSO only treatment group.
The duration of PSO treatment was calculated for each patient by calculating the number of days between their stage 1 and stage 2 treatment visits. Patients treated with 3M tape had on average 81.5 ± 24.3 days of PSO treatment. Dynacleft treated patients had on average 93.3 ±14.8 days of PSO treatment. No statistically difference was found in the duration of PSO treatment between these two tape types (p-value =0.07). The minimal duration of PSO treatment was 40 days for the 3M treated cohort and 76 days for the Dynacleft treated cohort. 3.1.1 Error Calculations The mean absolute difference (MAD) and the relative error magnitude (REM) values were obtained for each measurement calculated at each treatment stage. A summary of the preformed error measurements for all conventional morphometric measured utilized in the comparative analysis is presented in Table 5. For distance measurements, the average MAD was 0.96 ± 0.25 mm and the average REM was 0.13 . For angle measurements the average MAD was 6.80 ± 1.29 degrees and the average REM was 0.072. The metric associated with the highest degree of error utilized in the comparative analysis was the cleft side columellar length with a REM of 0.22. This measurement was used to calculate the columellar length ratio.
For all conventional morphometric measurements not utilized in the comparative analysis, the MAD, REM and Dahlberg error were also calculated between intra-observer landmarking (Appendix D). The REM for these remaining measurements ranged from 0.052 to 0.38 (Appendix D). To ensure that landmarking error did not contribute significantly to GM shape analysis, the entire unilateral dataset was landmarked twice and then subjected to Procrustes ANOVA analysis comparing landmark replicates. No difference was found in overall nasolabial shape between the two dataset replicates (Table 6, p-value = 0.28).

37
Table 5. Unilateral CL±P patient image error calculations of conventional morphometric analysis measurements using MAD and REM.
Mean SD Mean Absolute difference (MAD)
Relative error magnitude (REM)
Dahlberg Error
Distances (mm) Columella length, cleft 5.55 1.89 1.21 0.22 1.23 Columella length, noncleft 4.35 0.95 0.74 0.17 0.70 Nostril width, cleft 10.12 2.85 1.06 0.11 1.23 Nostril width, noncleft 6.23 1.52 0.60 0.096 0.70 Lateral lip height, cleft 13.27 3.95 1.22 0.092 1.38 Lateral lip height, noncleft 10.77 2.13 0.91 0.084 1.42 Angles (degrees) Nasal base columellar angle, noncleft 86.15 10.70 5.89 0.068 5.86 Nasal base columellar angle, cleft 101.69 12.21 7.71 0.076 7.48
Table 6. Unilateral cleft patient Procrustes ANOVA error analysis between imaging replicates.
Df SS MS Rsq F Z P-value Duplicate 1 0.11 0.11 0.0026 1.14 0.56 0.28 Stage 1 10.37 10.37 0.24 108.02 7.68 0.001 Residuals 337 32.34 0.906 0.76 Total 339 42.82
Terms utilized in the Procrustes ANOVA analysis have been italicized. Duplicate represents a comparison between two separate rounds of landmarking of the entire image dataset. Stage represents comparisons between the 3 treatment stages regardless of duplicate. DF= degrees of freedom. SS = sum of squares. MS = mean squares. Rsq= R2 or variance. F= F-score. Z = Z-score.

38
3.1.2 Analysis of Unilateral Clefts using Conventional Morphometrics The 34 metrics obtained from the landmarked unilateral cleft cohort were averaged between taping type at each stage. This allowed for comparison between tapes at a specific treatment time point. The extensive list of compared metrics by tape type at each stage is provided in appendix A. Of these metrics, we focused on those which are associated with post-operative aesthetics and a successful lip repair62,65: nostril width ratio (NWR), columellar angle (CA), columellar length ratio and lateral lip height ratio. These four metrics were also compared at each treatment stage based on the de novo cleft severity classification groups and by PSO protocol (PNAM vs. PSO). Nostril width ratio Within the 3M treatment cohort, nostril width ratio (NWR) was found to be 2.15 ±0.92, 1.68 ± 0.73, 1.09 ± 0.24 for stages 1 through 3 respectively (mean ± SD) . Using a paired t-test analysis, a significant reduction in the mean NWR from stage 1 to 2 and stages 2 to 3 was found (p-value<0.01) suggesting a progressive improvement towards NWR symmetry (Figure 9A, purple bars).
For the Dynacleft treatment cohort NWR was found to be 2.22 ± 0.64, 1.79 ± 0.47, 1.25 ± 0.40 for stages 1 through 3 respectively (Figure 9A, grey bars). Using a paired t-test analysis, no significant reduction in the mean NWR from stage 1 to 2 was found (p-value=0.17). However, a statistically significant reduction was noted between stages 2 and 3.(p-value <0.01). Therefore, no significant improvement in NWR was found after the PSO treatment, but an improvement was noted after primary lip repair. NWR was then compared between the tape types at each treatment stage. Using an unpaired t-test of unequal variance, no statistical difference was found between the NWR mean values for any of the treatment stages by tape type (stage 1 p-value = 0.73, stage 2 p-value = 0.54, stage 3 p-value = 0.14), suggesting a similar ability to improve the metric and progressively decrease NWR (Figure 13, row one). NWR was also evaluated at each treatment stage between two other demographic categories, cleft severity and by PNAM treatment. While a statistical difference was noted at stage 1 (p-value <0.01) and stage 2 (p-value<0.01) between non-severe and severe clefts, no difference was found at stage 3 (p-value = 0.16) between severity types (Figure 9B). When NWR was evaluated at each treatment stage by PNAM protocol, no statistical difference was noted between PSO treated patients and PNAM treated patients at any of the treatment stages (stage 1 p-value = 0.23, stage 2 p-value = 0.80, stage 3 p-value = 0.29) (Figure 9C).

39
Figure 9. Boxplots of the metric nostril width ratio for unilateral cleft patients at each treatment stage by comparative groups. Nostril width ratios were calculated from landmarked unilateral cleft images and organized by comparison groups: A) taping type, B) cleft severity and C) PSO protocol. Black lines within the boxplots demonstrated population medians for each subgroup. Red dotted lines demark a ratio of 1.0 which represents bilateral symmetry. Asterisks denote statistical significance between comparison groups within an individual treatment stage.
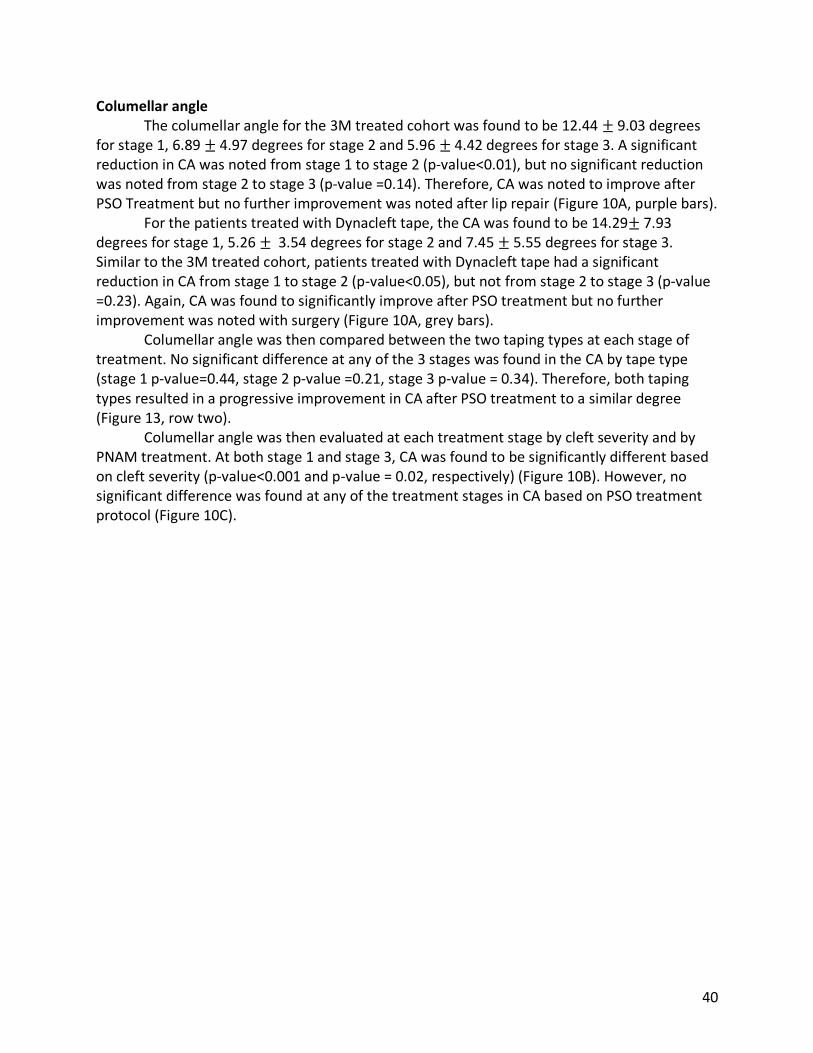
40
Columellar angle The columellar angle for the 3M treated cohort was found to be 12.44 ± 9.03 degrees for stage 1, 6.89 ± 4.97 degrees for stage 2 and 5.96 ± 4.42 degrees for stage 3. A significant reduction in CA was noted from stage 1 to stage 2 (p-value<0.01), but no significant reduction was noted from stage 2 to stage 3 (p-value =0.14). Therefore, CA was noted to improve after PSO Treatment but no further improvement was noted after lip repair (Figure 10A, purple bars). For the patients treated with Dynacleft tape, the CA was found to be 14.29± 7.93 degrees for stage 1, 5.26 ± 3.54 degrees for stage 2 and 7.45 ± 5.55 degrees for stage 3. Similar to the 3M treated cohort, patients treated with Dynacleft tape had a significant reduction in CA from stage 1 to stage 2 (p-value<0.05), but not from stage 2 to stage 3 (p-value =0.23). Again, CA was found to significantly improve after PSO treatment but no further improvement was noted with surgery (Figure 10A, grey bars).
Columellar angle was then compared between the two taping types at each stage of treatment. No significant difference at any of the 3 stages was found in the CA by tape type (stage 1 p-value=0.44, stage 2 p-value =0.21, stage 3 p-value = 0.34). Therefore, both taping types resulted in a progressive improvement in CA after PSO treatment to a similar degree (Figure 13, row two).
Columellar angle was then evaluated at each treatment stage by cleft severity and by PNAM treatment. At both stage 1 and stage 3, CA was found to be significantly different based on cleft severity (p-value<0.001 and p-value = 0.02, respectively) (Figure 10B). However, no significant difference was found at any of the treatment stages in CA based on PSO treatment protocol (Figure 10C).
41
Figure 10. Boxplots of the metric columellar angle for unilateral cleft patients at each treatment stage by comparative groups. Columellar angles were calculated from landmarked unilateral cleft images and organized by comparison groups: A) taping type, B) cleft severity and c) PSO protocol. Black lines within the boxplots demonstrated population medians for each subgroup. Y-axis units = degrees. Asterisks denote statistical significance between comparison groups within an individual treatment stage.
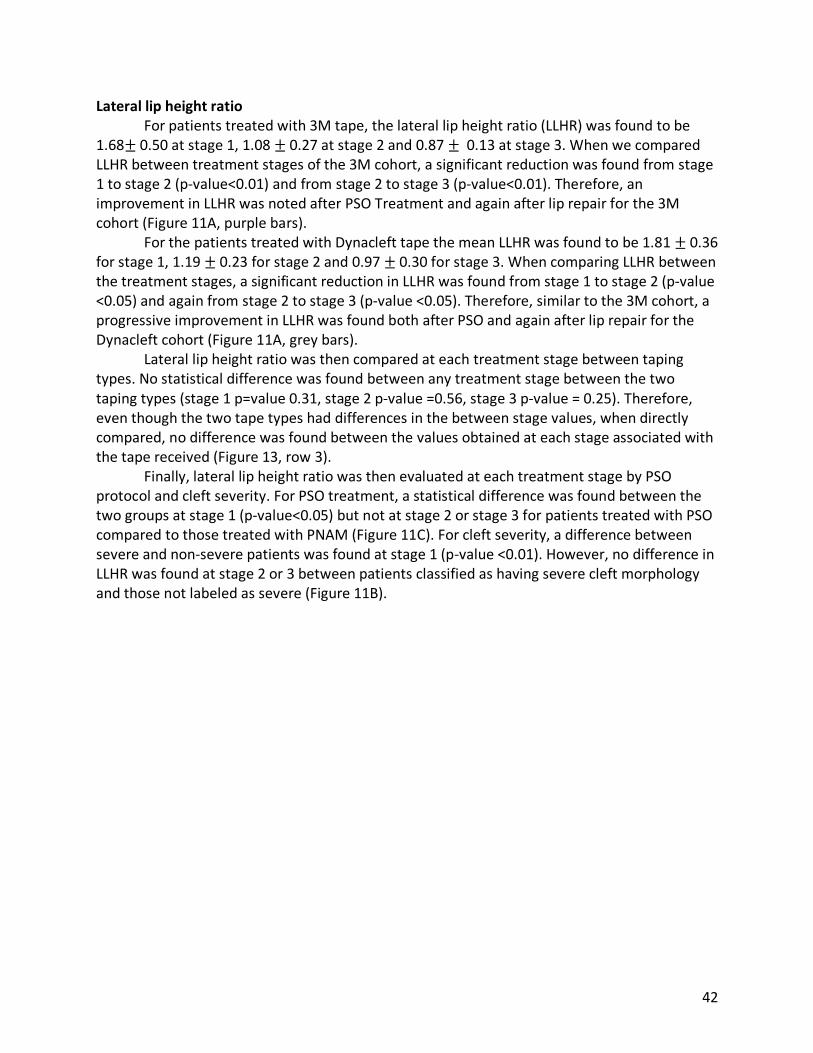
42
Lateral lip height ratio For patients treated with 3M tape, the lateral lip height ratio (LLHR) was found to be 1.68± 0.50 at stage 1, 1.08 ± 0.27 at stage 2 and 0.87 ± 0.13 at stage 3. When we compared LLHR between treatment stages of the 3M cohort, a significant reduction was found from stage 1 to stage 2 (p-value<0.01) and from stage 2 to stage 3 (p-value<0.01). Therefore, an improvement in LLHR was noted after PSO Treatment and again after lip repair for the 3M cohort (Figure 11A, purple bars). For the patients treated with Dynacleft tape the mean LLHR was found to be 1.81 ± 0.36 for stage 1, 1.19 ± 0.23 for stage 2 and 0.97 ±0.30 for stage 3. When comparing LLHR between the treatment stages, a significant reduction in LLHR was found from stage 1 to stage 2 (p-value <0.05) and again from stage 2 to stage 3 (p-value <0.05). Therefore, similar to the 3M cohort, a progressive improvement in LLHR was found both after PSO and again after lip repair for the Dynacleft cohort (Figure 11A, grey bars). Lateral lip height ratio was then compared at each treatment stage between taping types. No statistical difference was found between any treatment stage between the two taping types (stage 1 p=value 0.31, stage 2 p-value =0.56, stage 3 p-value = 0.25). Therefore, even though the two tape types had differences in the between stage values, when directly compared, no difference was found between the values obtained at each stage associated with the tape received (Figure 13, row 3). Finally, lateral lip height ratio was then evaluated at each treatment stage by PSO protocol and cleft severity. For PSO treatment, a statistical difference was found between the two groups at stage 1 (p-value<0.05) but not at stage 2 or stage 3 for patients treated with PSO compared to those treated with PNAM (Figure 11C). For cleft severity, a difference between severe and non-severe patients was found at stage 1 (p-value <0.01). However, no difference in LLHR was found at stage 2 or 3 between patients classified as having severe cleft morphology and those not labeled as severe (Figure 11B).

43
Figure 11. Boxplots of the metric lateral lip height ratio for unilateral cleft patients at each treatment stage by comparative groups. Lateral lip height ratios were calculated from landmarked unilateral cleft images and organized by comparison groups: A) taping type, B) cleft severity and c) PSO protocol. Black lines within the boxplots demonstrated population medians for each subgroup. Red dotted lines demark a ratio of 1.0 which represents bilateral symmetry. Asterisks denote statistical significance between comparison groups within an individual treatment stage.

44
Columellar length ratio For patients treated with 3M tape, the columellar length ratio (CLR) was found to be 1.72 ± 0.67 for stage 1, 1.35 ± 0.50 for stage 2 and 1.00 ± 0.19 for stage 3. A significant improvement in CLR was found from stage 1 to stage 2 (p-value <0.01) after PSO therapy and from stage 2 to stage 3 (p-value <0.01). Therefore, CLR was noted to improve with PSO therapy using 3M tape and additional improvement was found after surgery (Figure 12A, grey bars). For the patients treated with the Dynacleft tape, The CLR was found to be 2.09 ± 0.49 for stage 1, 1.14 ± 0.15 for stage 2 and 1.13 ± 0.53 for stage 3. A significant improvement in the metric was seen both after PSO treatment (p-value<0.01) and after surgery (p-value<0.01). Therefore, the Dynacleft cohort demonstrated a progressive improvement in CLR at both stages of treatment (Figure 12A, purple bars). The columellar length ratio was then compared at each treatment stage between the two taping types. A statistical difference was found in the CLR between the two taping types at both stage 1 and stage 2 (stage 1 p-value< 0.05, stage 2 p-value <0.05, stage 3 p-value = 0.34). This suggests that there were differences in CLR present between the two taping cohorts at presentation that did not normalize until after lip repair surgery (Figure 13, row 4). Finally, CLR was compared at each stage of treatment by PSO protocol and by cleft severity. For cleft severity, a significant difference in CLR was found at stage 1 (p-value<0.01) and stage 2 (p-value = 0.029) but not at stage 3 (Figure 12B). Therefore, severe and non-severe clefts expressed differences in their CLR until they completed their surgical lip repair. For PSO protocol, no significant difference was found between PSO treated and PNAM treated patients at any of the treatment stages (Figure 12C). A summary of the statistical comparisons performed by taping tape of all four anthropometric measurements is presented in Figure 13. Although no differences were found within each treatment stage between taping tapes, the trajectory of improvement varied by taping type. The 3M treated cohort was found to have greater improvements between the first and second stages more often than the Dynacleft cohort. For one evaluated metric (NWR), the Dynacleft treated patients show no improvement until after primary lip repair.

45
Figure 12. Boxplots of the columellar length ratio for unilateral cleft patients at each treatment stage by comparative groups. Columellar length ratios were calculated from landmarked unilateral cleft images and organized by comparison groups: A) taping type, B) cleft severity and c) PSO protocol. Black lines within the boxplots demonstrated population medians for each subgroup. Red dotted lines demark a ratio of 1.0 which represents bilateral symmetry. Asterisks denote statistical significance between comparison groups within an individual treatment stage.

46
Figure 13. Summary of statistical comparisons both between tape types at each stage and between stages of treatment. Summary of comparisons performed between tape products at the same stage. Significant differences between tapes are shown by purple arrows and non-significant differences by grey arrows. Paired t-test comparisons were performed between stages for comparison between the same tape product. Significant improvements (change towards symmetry) between stages are shown by green arrows, non-significant improvements are shown by grey dashed lines. Metric improvements were categorized as after PSO (improved by stage 2), after surgery (improved by stage 3) or progressive (minimal improvements after stage 2 and 3).

47
Cleft Severity using the Unilateral Cleft Lip Severity Index Similar to the de novo cleft severity evaluation, the four conventional morphometric measurements were also used to compare patients categorized using the Unilateral Cleft Severity Index (UCSI). T-test analysis were performed between the three severity groups (i.e. grade 1 & 2 and grade 3, grade 3 and grade 4). For nostril width ratio, a significant difference was found at stage 1 between grade 3 and grade 4 patients (p-value<0.05) and at stage 2 between grade 3 and 4 patients but not at stage 3 (p-value<0.05, Figure 14A). For columellar angle, a significant difference was found at stage 1 between grades 3 and 4 (p-value<0.05) and at stage 2 between grades 1 & 2 and grade 3 patients (p-value<0.05, Figure 14B). For lateral lip height ratio, no statistical differences were noted between the grade comparisons at the three treatment stages (Figure 14C). For columellar length ratio a single significant difference was noted between grades 1&2 and 3 at stage 1 (p-value=0.02, Figure 14D). Similar to the de novo severity assessment, a progressive reduction in all 4 measurements was noted with treatment stage advancement.
Figure 14. Boxplots of the four evaluated conventional morphometric metrics from unilateral cleft patients classified by the unilateral cleft lip severity index. Boxplot comparison of four conventional morphometric values calculated from landmarked unilateral cleft images and organized by the unilateral cleft lip severity index (Campbell et al.). A) Nostril width ratio B) Columellar angle, C) Lateral lip height ratio and D) Columellar length ratio. Black lines within the boxplots demonstrated population medians for each subgroup. Red dotted lines demark a ratio of 1.0 which represents bilateral symmetry. Asterisks denote statistical significance between comparison groups within an individual treatment stage.

48
Treatment response to pre-surgical orthopaedics When the four conventional metrics were used to evaluate improvement response between the tape types after pre-surgical orthopaedics, only columellar length ratio was found to be significantly different by tape type (p-value <0.05, Table 7). Of the two tape types, Dynacleft showed a greater improvement in columellar length ratio compared to the 3M tape. Appendix F displays boxplot comparisons of the response to treatment between the tape types for the four metrics.
When the four conventional metrics were evaluated for the amount of metric improvement after PSO between the two treatment protocols (PSO vs. PNAM), no differences were found for all four metrics (Table 7). Appendix G displays boxplot comparisons between the PSO protocols for the four metrics.
When the four conventional metrics were evaluated to compare improvement between the USCI classified groups, significant differences by ANOVA analysis after PSO treatment for two of the metrics between cleft severity grades. The amount of improvement in the metrics columellar length ratio and nostril width ratio differed significantly between patients classified by the USCI (p-values <0.05 and p-value<0.01 respectively, Table 8). Grade 4 patients had a much greater improvement in both their NWR and CLR compared to the two other severity groups. For both of these metrics, a significant difference in improvement was also found after primary lip repair between cleft severity grades. Again, grade 4 patients had a much greater improvement in these two of the metrics compared to the other severity groups (p-values <0.05 and p-value<0.05 respectively, Table 8). Appendix H displays boxplot comparisons between the USCI grades for the four metrics.

49
Table 7. Conventional morphometric evaluation of patient response to PSO treatment by tape and protocol comparison. Mean PSO
improvement P-value Mean surgery
improvement P-value
Tape NWR 3M 0.44 0.23 0.55 0.15 Dynacleft 0.21 0.78 CA 3M 4.57 0.64 1.53 0.022 Dynacleft 5.97 -2.36 LLHR 3M 0.46 0.32 0.23 0.68 Dynacleft 0.67 0.30 CLR 3M 0.40 0.023 0.36 0.45 Dynacleft 0.90 0.28 Protocol NWR PSO 0.20 0.15 0.63 0.80 PNAM 0.48 0.58 CA PSO 3.71 0.66 2.19 0.30 PNAM 4.88 0.0024 LLHR PSO 0.35 0.26 0.27 0.66 PNAM 0.52 0.32 CLR PSO 0.15 0.08 0.27 0.35 PNAM 0.53 0.41
Treatment response was calculated for each conventional metric as the averaged differences in values between stage 1 and 2 (PSO response) and between stage 2 and 3 (surgery response). Bolded p-values represent statistically significant comparisons (alpha<0.05).

50
Table 8. Conventional morphometric evaluation of patient response to PSO treatment by two cleft severity classifications.
Mean PSO improvement
P-value Mean surgery improvement
P-value
UCSI NWR Grade 1&2 0.11 0.0083 0.31 0.0020 Grade 3 0.15 0.34 Grade 4 0.68 0.85 CA Grade 1&2 3.91 0.10 -0.79 0.83 Grade 3 -0.42 2.81 Grade 4 8.35 -0.0063 LLHR Grade 1&2 0.34 0.12 0.22 0.62 Grade 3 0.60 0.27 Grade 4 0.82 0.26 CLR Grade 1&2 0.087 0.025 0.19 0.047 Grade 3 0.74 0.17 Grade 4 0.68 0.49
Treatment response was calculated for each conventional metric as the difference in values between stage 1 and 2 (PSO response) and between stage 2 and 3 (surgery response). For the de novo severity comparisons p-values are reported from t-test comparisons between the two severity groups. For the Unilateral cleft severity index groups (UCSI) p-values are reported from analysis of variance (ANOVA) testing with bolded p-values represent statistically significant comparisons (alpha<0.05).

51
The percentage of patients that did not have an improvement (i.e. the difference between stage 1 and 2 was less than 0) in their conventional facial metrics after PSO treatment varied from 2.9% to 17.4% of patients depending on the evaluated metrics (Table 9). The highest proportion of patients with no improvement between stage one and two was 17.9% for CA. A total of 27.5% of the unilateral cohort of patients had at least one facial metric that did not improve after PSO treatment (Table 9). The median and range of the delta values that were less and zero for each metric between stage 1 and stage 2 is summarized in Table 9. Table 9. Assessment of unilateral cleft patient response with pre-surgical orthopaedics Metric Number of patients
without improvement Median delta value between stage 1 & 2
Range
Total Patients 19/69 (27.5%) Nostril width ratio 11/69 (15.9%) -0.11 -0.01 to -0.72 Columellar angle 12/69 (17.4%) -1.25 degrees -0.80 to -12.9 Lateral lip height ratio 2/69 (2.9%) -0.055 -0.11 to -0.45 Columellar length ratio 10/69 (14.5%) -0.37 -0.1 to -0.84
Median metric values were calculated from the patients that had no improvement in the four evaluated metrics from stage 1 to stage 2. Range is reported from maximum to minimum delta values between stage 1 and stage 2. Total patients = patients with at least one of the four metrics that did not show any improvement. 3.1.3 Analysis of Unilateral Clefts using Geometric Morphometrics Geometric morphometric (GM) analysis was performed to evaluate overall shape differences with the dataset was first modularized into 3 regions: nose, nasolabial and columella. Initial analysis performed between these 3 regions found similar results and therefore, the nasolabial region was selected to represent the results as it included the largest number of landmarks. Procrustes superimposition and Procrustes ANOVA were performed in a step-wise modelling fashion and terms were incorporated into the model if they were found to be statistically significant factors influencing facial shape. Terms that failed to significantly contribute were eliminated. Models were constructed using images from the same stage unless differences attributable to treatment stage were being analyzed. All Procrustes ANOVA evaluations by stage have been summarized in Table 10. Tape type (3M vs Dynacleft) failed to have a significant contribution to overall shape when evaluated at stage 1, indicating that the two groups were similar in their overall shape at presentation. However, no differences were found between tapes types at stages 2 or at stage 3. Other than tape type, “sex” failed to significantly contribute to the model at any of the three treatment stages. Terms that were found to significantly influence the nasolabial shape of the unilateral cleft cohort included “protocol,”, “severity” and “severity” (Campbell et al.)14. All of these terms were found to significantly influence facial shape at all three treatment stages except for

52
“protocol”. The term “protocol” was only found to be a significant influencer of face shape at stages 1 and 3 but not at stage 2 (Table 10). Table 10. Geometric morphometric overall shape analysis of unilateral cleft lip patients by Procrustes ANOVA.
Coordinate region Stage Procrustes ANOVA variables P-value Nose Lip 1, 2 & 3 Sex
Stage 0.813 0.001*
Nose lip 1 Tape Protocol Severity Severity (Campbell)
0.522 0.021* 0.001* 0.003*
Nose lip 2 Tape Protocol Severity Severity (Campbell)
0.388 0.110 0.001* 0.001*
Nose lip 3 Tape Protocol Severity Severity (Campbell)
0.569 0.031* 0.006* 0.005*
Procrustes ANOVA variables represent the categorical comparisons evaluated for their overall impact on nasolabial shape. Protocol refers to patients having received PNAM or PSO only. Severity refers to patients whom were labelled severe at presentation or not. Severity (Campbell) refers to patients whom were labelled using the Unilateral Cleft Severity Index as grade 1&2, grade 3 or grade 4 Significant variables have their p-value marked by an asterisk. Presented statistical modelling was completed using either Severity or Severity (Campbell). 3.1.4 Unilateral cleft asymmetry analysis Using GA object asymmetry assessment, a significant degree of asymmetry was found between the cleft and non-cleft sides of the face after primary lip repair (p-value =0.002). To evaluate if the magnitude of this stage 3 asymmetry was influenced by the clinical factors of interest (e.g. tape type, cleft severity), the magnitude of asymmetry was then quantified. Using Levene’s tests, tape type did not significantly impact the magnitude of asymmetry present (p-value = 0.23). The comparison groups for cleft severity and PSO protocol also demonstrated no statistical difference in the resulting magnitude of facial asymmetry (p-value =0.69 and 0.23 respectively). This data indicates that cleft severity and PSO protocol influence overall facial shape during treatment but do not influence the resulting degree of post-operative facial asymmetry (Table 11). It should be noted that this asymmetry seen at stage 3 may not be greater than those expected in a control – noncleft population, which our study is missing.

53
Table 11. Geometric morphometric asymmetry analysis of unilateral cleft lip patients by Procrustes ANOVA. Fluctuating Asymmetry Analysis Coordinate region Stage Comparison Asymmetry p-value Nose lip 3 Side 0.002* Magnitude of overall asymmetry assessment Coordinate region Stage Comparison Levene’s p-value Nose lip 3 Tape 0.23 Nose lip 3 Protocol 0.69 Nose lip 3 Severity 0.27
Asymmetry evaluation by Procrustes ANOVA was first performed at stage 3 to identify is significant asymmetry present post lip repair by facial side (cleft vs. noncleft). Then the magnitude of the identified asymmetry was then evaluated using a Levene’s test to determine if the presented categorical variables influences the overall resulting degree of asymmetry. Tape refers to having received 3M tape or Dynacleft tape. Protocol refers to patients having received PNAM or PSO only. Severity refers to patients whom were labelled severe at presentation or not. Significant variables have their p-value marked by an asterisk.

54
3.2 Analysis of Bilateral Clefts using Conventional Morphometrics A total of 24 bilateral cleft patients were incorporated into the study. This cohort of patients consisted of 61 3D facial images obtained from three stages of treatment: Stage 1 (pre-treatment), Stage 2 (post pre-surgical orthopaedics) and Stage 3 (post primary lip repair). The 61 obtained images were categorized into 21 stage 1 images, 22 stage 2 images and 18 stage 3 images. Within this cohort, 9 patients (37.5%) were treated using Dynacleft tape and 15 patients (62.5%) using 3M tape. Demographic characteristics of the bilateral cleft lip cohort has been summarized in table 12. The majority of patients within the bilateral cohort were diagnosed with bilateral cleft lip and palate (83.3%). Similar representation of incomplete (45.8%) and complete (54.2%) bilateral cleft lip patients were incorporated into the review population. Similar representation of sex was also incorporated into the review with 45.8% of the cohort being female and 54.2% being male. Table 12. Bilateral CL±P patient cohort demographics and clinical features.
3M Tape Dynacleft tape P-value Number 15 9 Sex
Female 8 3 0.60 Male 7 6 Age (mean ± std days) Stage 1 19.8 ± 9.6 20.5 ± 11.9 0.89 Stage 2 123.9 ± 24.4 139 ± 34.3 0.32 Stage 3 166.8 ± 36.2 166.5 ± 54.4 0.99 Cleft diagnosis Cleft Lip and Palate 12 8 0.50 Isolated Cleft Lip 2 0 Cleft Lip and Alveolus 1 1 Cleft type Bilateral complete 7 4 1.0 Bilateral incomplete 8 5
Statistical tests were performed to compare the demographic features between the patients that received the two taping types. T-test of unequal variance were used to compare the mean ages of at each stage of treatment between the taping cohorts. Chi-squared statistics were used to determine associations between the categorical variables and tape type.

55
3.2.1 Bilateral conventional morphometrics
The 31 metrics obtained from the landmarked bilateral cleft cohort were averaged between taping type at each stage. The list of compared metrics by tape type at each stage is provided in appendix B. Similar to our analysis of unilateral cleft lip patients, we focused on the NWR, CA, LLHR and CLR. However, these metrics have not been identified or validated for bilateral cleft lip patients and therefore comparisons were also made between the bilateral and unilateral cohorts for each of these metrics to profile their unique trajectory within bilateral cleft patients. Nostril width ratio For the bilateral CL±P patient cohort, patients who received 3M tape were found to have an average NWR of 1.39 ±0.38, 1.18± 0.17 and 1.16± 0.12 at stage 1, 2 and 3 respectively (Figure 15A, purple bars). Patients treated with Dynacleft tape were found to have a NWR of 1.25± 0.24, 1.20 ± 0.23, 1.17 ± 0.12 at stage 1, 2 and 3 respectively (Figure 15A, grey bars). No statistical difference in the NWR was found at each stage of treatment between tape types (stage 1 p-value =0.35, stage 2 p-value =0.81, stage 3 p-value =0.78). The NWR of the bilateral CL±P patients was then compared to the unilateral CL±P patient cohort. For bilateral patients, NWR was found to be 1.33± 0.32 at stage 1, 1.19± 0.19 at stage 2 and 1.16± 0.12 at stage 3 (Figure 15B, dark blue bars). For unilateral CL±P patients, NWR was found to be 2.16 ±0.86, 1.71±0.67 and 1.14± 0.30 for stages 1, 2 and 3 (Figure 15B, light blue bars) respectively. By t-test comparison, a significant difference in the NWR was found between unilateral and bilateral CL±P patients at stages 1 (p-value<0.01) and stages 2 (p-value<0.01) but no significant difference was found for stage 3.

56
Figure 15.Boxplots of the metric nostril width ratio for bilateral cleft patients at each treatment stage by comparative groups. Nostril width ratios were calculated from landmarked bilateral cleft images and organized by comparison groups: A) taping type, B) comparison to unilateral dataset. Black lines within the boxplots demonstrated population medians for each subgroup. Red dotted lines demark a ratio of 1.0 which represents bilateral symmetry. Asterisks denote statistical significance between comparison groups within an individual treatment stage.

57
Columellar angle For bilateral cleft patients treated with 3M tape, columellar angle (CA) was found to be 13.41 ±8.86 degrees at stage 1, 6.34 ± 5.12 degrees at stage 2 and 5.82 ± 4.40 degrees at stage 3 (Figure 16A, purple bars). Comparatively, for bilateral cleft patients treated with Dynacleft tape, columellar angle was found to be 11.88 ±8.42 degrees at stage 1, 4.29± 3.55 degrees at stage 2 and 5.39± 4.74 degrees at stage 3 (Figure 16A, grey bars). By t-test comparison no statistical difference was found between the two tapes at any of the treatment stages (stage 1 p-value =0.55, stage 2 p-value =0.71, stage 3 p-value =0.72). The CA was then compared between the bilateral and unilateral CL±P patients. For bilateral cleft lip patients, the CA was found to be 12.90± 8.67 degrees, 5.56± 4.67 degrees and 5.66 ± 4.50 degrees at stages 1, 2 and 3 respectively (Figure 16B, dark blue bars). For the unilateral cleft lip patients, the CA was found to be 12.17± 8.04 degrees, 6.68± 4.53 degrees and 6.22± 4.40 degrees at stages 1, 2 and 3 respectively (Figure 16B, light blue bars). No statistical difference was found between the unilateral and bilateral patient CA at any of the three treatment stages (stage 1 p-value =0.73, stage 2 p-value =0.42, stage 3 p-value =0.67).

58
Figure 16. Boxplots of the metric columellar angle for bilateral cleft patients at each treatment stage by comparative groups. Columellar angles were calculated from landmarked bilateral cleft images and organized by comparison groups: A) taping type, B) comparison to unilateral dataset. Black lines within the boxplots demonstrated population medians for each subgroup. Asterisks denote statistical significance between comparison groups within an individual treatment stage.
A)
B)

59
Columellar length ratio Columellar length ratio (CLR) was evaluated in the bilateral CL±P patient cohort in a similar fashion to the unilateral patient cohort. First the metric was compared between tape types. For bilateral patients, CLR for 3M treated patients was 1.27 ±0.13 for stage 1, 1.13± 0.09 for stage 2 and 1.16± 0.10 for stage 3 (Figure 17A, purple bars). For patients treated with Dynacleft tape, CLR was 1.17± 0.11 for stage 1, 1.35± 0.40 for stage 2 and 1.10 ±0.08 for stage 3 (Figure 17A, grey bars). When t-test comparisons between the two tape types were performed at each stage of treatment, no statistical difference was found (stage 1 p-value =0.23, stage 2 p-value =0.96, stage 3 p-value =0.17). CLR was additionally compared between the unilateral and bilateral cleft patient cohorts. For bilateral cleft patients, CLR Was found to be 1.22 ±0.13 at stage 1, 1.24± 0.31 at stage 2 and 1.14± 0.09 at stage 3 (Figure 17B, dark blue bars). For unilateral cleft patients, CLR was found to 1.80± 0.66 at stage 1, 1.31 ±0.45 at stage 2 and 1.04± 0.33 at stage 3 (Figure 17B, light blue bars). When t-test comparisons were performed at each treatment stage, CLR was found to only significantly differ between the unilateral and bilateral patient cohorts at stage 1 (p-value<0.001).
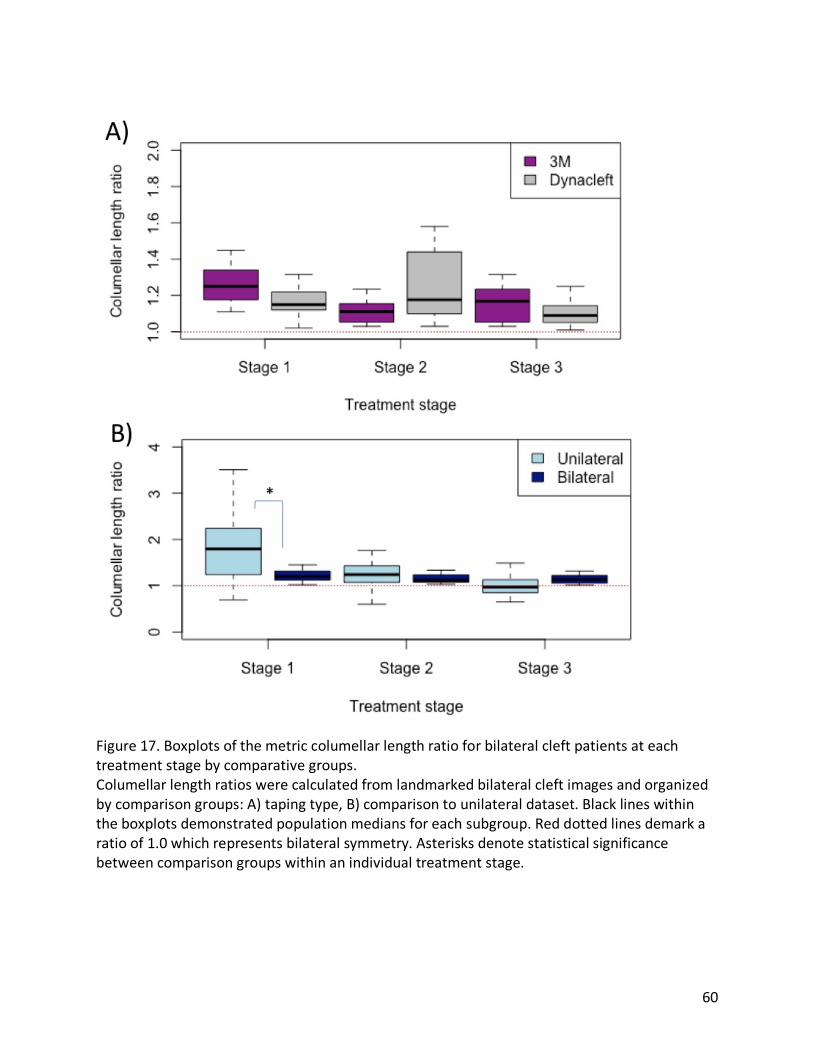
60
Figure 17. Boxplots of the metric columellar length ratio for bilateral cleft patients at each treatment stage by comparative groups. Columellar length ratios were calculated from landmarked bilateral cleft images and organized by comparison groups: A) taping type, B) comparison to unilateral dataset. Black lines within the boxplots demonstrated population medians for each subgroup. Red dotted lines demark a ratio of 1.0 which represents bilateral symmetry. Asterisks denote statistical significance between comparison groups within an individual treatment stage.

61
Lateral lip height ratio For bilateral patients treated with 3M tape, LLHR was found to be 1.46± 0.48 at stage 1, 1.26± 0.14 at stage 2 and 1.12± 0.11 at stage 3 (Figure 18A, purple bars). For patients treated with Dynacleft tape, the mean LLHR was 1.35± 0.51 at stage 1, 1.38± 0.38 at stage 2 and 1.1±2 0.08 at stage 3 (Figure 18A, grey bars). Statistical comparison between the two tape at each stage of treatment found no significant difference between tape type (stage 1 p-value =0.64, stage 2 p-value =0.37, stage 3 p-value =0.99). LLHR was then compared between the bilateral and the unilateral patient cohorts. For the bilateral patients, LLHR was found to be 1.41 ±0.48 at stage 1, 1.32± 0.48 at stage 2 and 1.12± 0.10 at stage 3 (Figure 18B, dark blue bars). For the unilateral CL±P patients, LLHR was found to be 1.71± 0.53 at stage 1, 1.13± 0.32 at stage 2 and 0.89± 0.18 at stage 3 (Figure 18B light blue bars). T-test comparisons between the bilateral and unilateral patients found that LLHR was significantly difference between the two cohorts at stages 1 (p-value>0.02) and stage 3 (p-value<0.001).
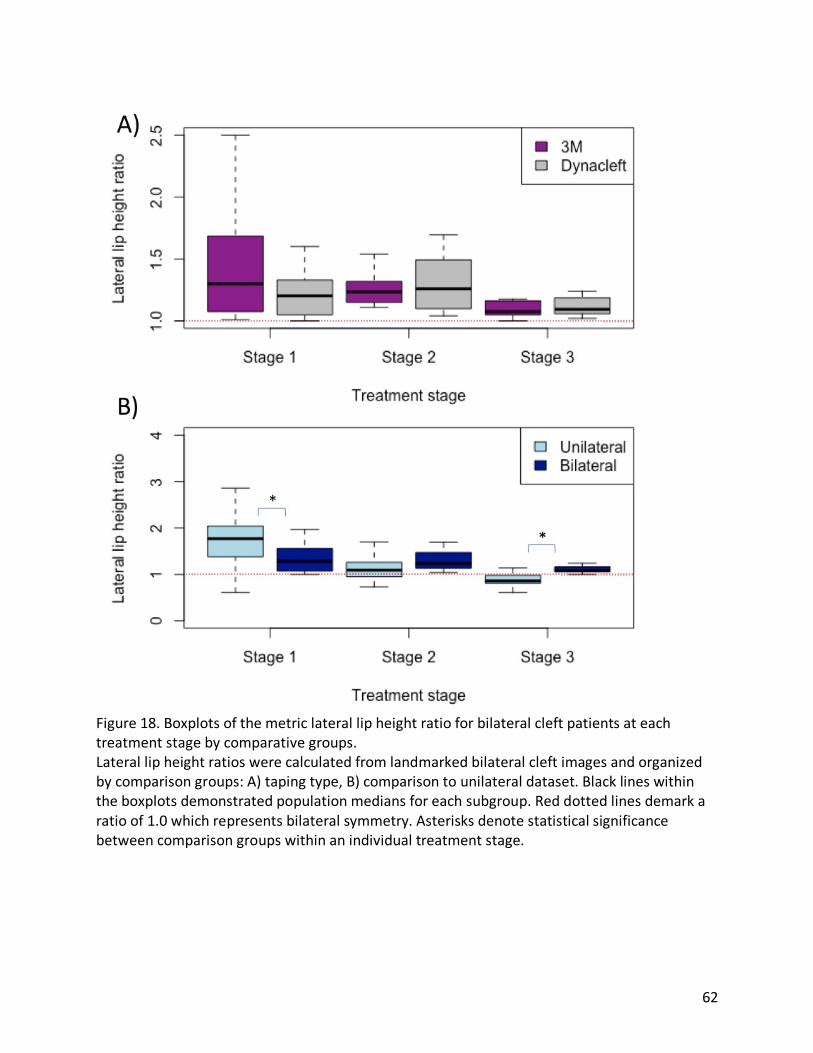
62
Figure 18. Boxplots of the metric lateral lip height ratio for bilateral cleft patients at each treatment stage by comparative groups. Lateral lip height ratios were calculated from landmarked bilateral cleft images and organized by comparison groups: A) taping type, B) comparison to unilateral dataset. Black lines within the boxplots demonstrated population medians for each subgroup. Red dotted lines demark a ratio of 1.0 which represents bilateral symmetry. Asterisks denote statistical significance between comparison groups within an individual treatment stage.

63
3.2.2 Analysis of Bilateral Clefts using Geometric Morphometrics Geometric morphometric analysis was then conducted to analyze variation in the overall bilateral CL±P patient facial shape. In a similar fashion to the unilateral cohort, a subset of nasolabial landmarks was used utilized and subjected to Procrustes superimposition and Procrustes ANOVA step-wise modelling. Terms were incorporated into the model if they were found to be statistically significant factors influencing facial shape. These statistical analyses were performed using images from the same stage unless differences attributable to treatment stage were being analyzed. All Procrustes ANOVA evaluations for the bilateral CL±P patient cohort have been summarized in Table 13 and organized by treatment stage. Stage was found to significantly contribute to overall shape when the entire cohort was evaluated indicate a significant difference in facial shape is present between stages 1, 2 and 3 (p-value =0.001). Categorical factors were then analyzed at each treatment stage. Tape type failed to demonstrate a statistically significant influence on the overall facial shape of the bilateral cleft patients at any of the treatment stages (p-value = 0.34 stage 1, p-value =0.78 stage 2, p-value =0.55 stage 3). Additionally, the term “diagnosis” was evaluated and found to have no influence on overall shape outcome. The term “Cleft Type” (i.e. complete vs. incomplete clefts) was found to significantly influence facial shape at stage 1 (p-value <0.05) but not at stage 2 or 3. Using object asymmetry evaluation after Procrustes superimposition, no significant shape difference was found between the bilateral sides of the face suggest good symmetry being present (p-value =0.15). Additionally, since no factors demonstrated a significant contribution to facial shape at stage 3 and no significant asymmetry was detected, no terms were evaluated to see if they significantly impacted the degree of facial asymmetry.

64
Table 13. Geometric morphometric overall shape and asymmetry analysis of bilateral cleft lip patients by Procrustes ANOVA.
Coordinate region Stage Procrustes ANOVA variables P-value Nose Lip 1, 2 & 3 Sex
Stage 0.93 0.001*
Nose Lip 1 Tape Diagnosis Cleft type
0.34 0.07 0.003*
Nose Lip 2 Tape Diagnosis Cleft type
0.78 0.09 0.23
Nose Lip 3 Tape Diagnosis Cleft type
0.55 0.36 0.13
Asymmetry assessment by Procrustes ANOVA Coordinate region Stage Comparison P-value Nose 3 Side 0.15
Procrustes ANOVA variables represent the categorical comparisons evaluated for their overall impact on nasolabial shape. Tape refers to having received 3M tape or Dynacleft tape. Diagnosis refers to the diagnosis of cleft lip and palate, isolated cleft lip or cleft lip and alveolus. Cleft type refers to the presence of an incomplete or a complete cleft lip. For the asymmetry assessment, a comparison for the presence of asymmetry was evaluated comparing the right and left sides of the face. Significant variables have their p-value marked by an asterisk.

65
4. Discussion Morphometric evaluation of 3D facial images can be used to quantify and objectively document the measurement outcomes of CL±P patients. Here, unilateral and bilateral CL±P patients, have been subjected to two types of morphometric analyses to compare treatment outcomes between differing taping strategies used for pre-surgical orthopaedics (PSO). 4.1 PSO Lip Taping Comparing 3M and Dynacleft lip taping was the primary objective of this investigation. Both tapes have been successfully utilized as a PSO adjuvant. However, Dynacleft has a higher cost compared to the 3M tape. At the time of this study, individual strips of Dynacleft tape cost 3.86 CAD for the unilateral cleft tape and 5.00 CAD for the bilateral cleft tape. Patient’s require approximately 230.00 CAD worth of Dynacleft taping products for their 90-day PSO treatment interval. Conversely, an individual roll of 3M tape costs 1.50 CAD and a 3M treated patient will required about 3-4 rolls of tape over a similar period. In the province of British Columbia, Canada where this study was conducted, these tape costs are incurred by the cleft team.
The greater cost of Dynacleft tape is was believed to be justifiable considering the potential benefits of Dynacleft taping. Although possibly biased, the manufactures of Dynacleft tape claim that the taping device does not interfere with feeding, maximizes baby comfort and that the strips themselves expand and contract with movement ensuring optimal treatment74. Smith et al. also lists the benefits of Dynacleft tape when used with a nasal elevator which include less labor intensity, less expensive than alternative PNAM devices and a reduced need for subsequent nasal revisions75.
Evidence supporting Dynacleft tape’s superiority is limited. The manufacturers cite a single comparative study by Monasterio et al., that supports the use of the Dynacleft system (tape with nasal elevator) to be as effective as PNAM at reducing the cleft width and columellar angle after PSO treatment76. Interestingly though, they measured both nostril width ratio and nasal height ratio for the both PNAM and Dynacleft system treated patients but did not report if there was a statistical difference between the two cohorts, only that minor differences between the groups were noted. Additionally, within the Dynacleft taping brochure, two articles are provided supporting the use of a nasal elevator but do not address the tape type itself. A study directly comparing Dynacleft tape against similar available devices has yet to be conducted.
Here, using four validated anthropometric values for CL±P outcome assessment, we compared Dynacleft and 3M tape at three stages of treatment. Conventional morphometrics of both unilateral and bilateral CL±P patients found no statistically significant differences in these metrics at treatment stages 2 or 3 between the two tape types. Therefore, no differences were found after being treated with the PSO tape or after primary surgical lip repair. Regardless of the tape type, it can be concluded that the four metrics tend to normalize with each treatment stage. The GM evaluation was then used to further support that no differences in facial shape are attribute due PSO tape selection. By GM analysis, overall facial shape was not significantly different at all three stages between the 3M and Dynacleft cohorts. Therefore, by two methods of morphometric analysis, both tapes are appropriate for reducing the cleft deformity and can be used interchangeably for PSO treatment protocols.

66
It is important to note that the trajectory of the anthropometric measurements and the rate that they improved within each taping cohort did differ. While no statistical difference was found at each treatment stage between tape types, the degree of improvement between stages 1 to 2 and then stages 2 to 3 did differ by tape (See results Table 7. For one metric, columellar length ratio, the amount of metric improvement between stage 1 and stage 2 was found to be significantly larger for Dynacleft treated patients. This difference in the ability of the two tapes to improve this facial metric provides some evidence in favor of the using Dynacleft tape as a more efficacious option in PSO treatment prior to surgical repair.
Our data demonstrates similar treatment outcomes with two commercially available taping devices. This result is consistent with the heterogeneity of currently utilized CL±P PSO treatments. A survey-based study investigating caregiver preferences towards both taping products is in progress, where CL±P patients were randomized to either taping product and their guardians completed surveys on their experiences during the PSO treatment period. Results from that study will provide further subjective support that may validate tape selection in the context of their equivocal impact on facial shape. 4.2 Cleft severity In addition to comparing taping types, the 3D image cleft cohort was used to evaluate other factors that are predicted to be highly influence outcomes of CL±P treatment: cleft severity and PSO treatment protocol.
Clinicians have used multiple different classification systems for categorizing cleft morphology13. Anthropometric measurements have also been incorporated into these classification systems as they help to objectively define cleft morphology. For example, Campbell et al. created a 4-tiered classification of unilateral cleft lip patients that included nostril width ratio for severity stratification, the Unilateral Cleft Severity Index (UCSI)14. In additional to the Campbell et al. classification , we utilized these metrics to also create a de novo binary classification system for assessment of cleft severity.
Using the UCSI classification system, significant differences between the severity grades were found for 3 of the 4 evaluated metrics at stage 1, as expected. After PSO treatment (stage 2) only two of the metrics were significantly different between the severity grades, columellar angle and nostril width ratio. By stage 3 however, all significant differences between the UCSI gradings were no longer present. For the most part, result of this classification system parallel that of the de novo system and demonstrate that by conventional morphometric analysis, both severe and mild cleft morphologies improve with PSO and surgical treatment to achieve similar metric values.
One difference seen when using the de novo classification was that at stage 3 post lip repair, columellar angle was noted to be different between the severe and non-severe cleft cohorts. However, no difference was found after the completion of PSO (at stage 2). Our stage three images are collected months after completion of the primary lip repair and it is possible that the nasal manipulation produced from the PSO treatment had relapsed. In a study by Liou et al. it was found that nasal asymmetry that was corrected by primary lip repair, significantly relapsed within the first-year after lip repair38. Therefore, patients within the severe group may in fact may have worst outcomes due to their initial presenting morphology and resulting

67
relapse. A longer patient follow-up may allow for future assessment of nasal shape changes in the context of growth and development post lip repair.
Treatment response was then measured by evaluating the degree of improvement of the four evaluated metrics for each patient. Using the de novo system, the degree of metric improvement was found to be significantly greater for the severe patients for all four measurements after PSO treatment. Similarly, grade 4 patients classified by the UCSI had a significantly greater improvement in all four evaluated metrics compared to at least one other severity grade after PSO treatment. Clearly, these patients required a greater degree of metric normalization prior to proceeding with their lip repair. However, the severe patients also had a greater amount of metric improvement attributable to surgical lip repair, with significant differences for two of the metrics: nostril width ratio and the columellar length ratio by both classification systems. By looking at response to treatment, it is clear that the presenting cleft severity influences the degree of facial manipulation needed to normalize facial shape and achieve a desired outcome.
The prognostic role of cleft severity on facial shape outcomes has been previously supported. In a small study of 24 patients, Peltomaki et al., demonstrated that patients whom present with larger cleft dimensions have reduced maxillary growth than patients with smaller clefts48. Similarly, Chiu et al., demonstrated that a larger cleft correlates with reduced maxillary protrusion77,78. The degree of clefting has also been associated with a greater need for secondary revision procedures79. Fisher supported the use of facial metrics to correlate with perception of cleft severity15. Most recently, Mercan et al., effectively correlated preoperative severity with the metrics of anthropometric measurements columellar angle, nostril width ratio and lateral lip height ratio and found these metrics to be predictors of post-operative appearance as ranked by both plastic surgeons65. Our study aligns with these conclusions, reinforcing the importance of cleft lip severity and influence in facial outcomes. Furthermore, these findings support the use of classifications that incorporate anthropometric definitions of cleft severity and its prognostic implications. Future correlation of these metrics with patient reported outcomes and rankings of cleft severity will help to further validate the use of these measurements as a tool for assessing cleft patients. 4.3 Cleft PSO protocol Of all the available PSO strategies, the use of PNAM has been highly supported as an effective method for optimizing the cleft morphology prior to surgical repair25. Additionally, some evidence exists suggesting that long term improvement in nasal symmetry can be attributable to PNAM use80. Therefore, PNAM may be the best approach for clinicians who utilize PSO, even when PSO as a whole remains controversial. To evaluate the impact of PNAM on CL±P patient facial shape by conventional and geometric analysis, the unilateral CL±P patient cohort was grouped into two categories: PNAM and PSO (non-PNAM) treated patients.
When the 4 traditional morphometric measures were used to evaluate the differences between PNAM treated and PSO treated unilateral CL±P patients, no statistical differences were found between the two groups at stage 2 or stage 3. Therefore, these four metrics were unable to identify differences between the PNAM and PSO treated individuals.

68
This was further assessed by evaluating the response to PSO and PNAM treated individuals by determining the degree of improvement of the 4 evaluated metrics after orthopaedic treatment (See results, Table 9). For lateral lip height ratio, a significantly greater improvement was found for PNAM treated individuals compared to patients treated with only PSO. However, additional shape variation may still be present between these two cohorts, that was not accounted for by these conventional morphometric measurements. When we performed, geometric morphometric analysis with Procrustes ANOVA, it was found that the overall facial shape was significantly different at both stage 1 and stage 3 between patients treated with PNAM compared to those treated with PSO. The presence of a significant difference at stage 1 is possibly an example of confounding by indication. A difference is present because the clinical treating team likely choses to incorporate PNAM into to the care of patients who possess nasal deformities at presentation resulting in a selection bias. Therefore, the GM analysis effectively identified the variation in presenting CL±P morphology responsible for influencing clinician’s decision making as to proceed with PNAM or PSO treatment strategies. Interestingly, while no statistical difference in treatment protocol was found between the two cohorts at stage 2, a difference is noted at stage 3 post lip repair. The difference seen after lip repair may indicate that the outcomes of the PNAM treated individuals are in fact different than the PSO treated cohort. In order to specifically identify these variations in facial shape attributable to either PSO or PNAM treatment, future analysis utilizing a partial least squared method or heat mapping is needed. 4.4 Bilateral cohort Evaluation of a cohort of bilateral cleft patients was also performed using both conventional and geometric morphometrics. At all three treatments stages, no differences in these evaluated metrics was found between tape types. Then, when the bilateral cohort was subjected to GM shape analysis to assess the role of tape type on over all facial shape, no difference was noted as a result of the taping received. These results reinforce the conclusions obtained from the unilateral cohort, that both 3M and Dynacleft are equivalently effective opinions for PSO therapy. Conventional morphometric analysis of bilateral patient cohort highlighted multiple nuances associated with the morphology of these patients. Firstly, it was noted that unlike the unilateral patient population, the evaluated facial metrics showed minimal improvement as the patients proceeded through the treatment stages as bilateral patients display an innate degree of symmetry even in the context of their clefts. Resultantly, for bilateral patients a significant reduction in these metrics does not occur after PSO therapy or surgical lip repair. Arguably, this limits the application of conventional morphometric analysis in the bilateral cleft patient population used here. Importantly, additional metrics especially in the anterior-posterior dimension, may be needed to identify differences between bilateral cleft patients that result from the interventions they receive. In the presence of two clefts, the paired morphology on the right and left sides of the face prevents standardization of the cleft morphology against the non-cleft morphology and the metrics themselves remain relative consistent through treatment. Previous work by Bugaighis el at., suggests the nose to lip width ratio is a more appropriate metric for evaluating improvements in bilateral cleft lip patients81. This metric

69
specifically standardizes the reduction in the total nose width against the mouth with as patients receive successive treatment. However, this metric is limited by the dynamic nature of the mouth. Many patients are unable to hold a neutral face during the obtainment of the 3D images, especially patients less than 3 months of age. Therefore, the nose-mouth width ratio was highly variable within our study population and not utilized as a metric for evaluation. Secondly, as the anthropometric measurements used here demonstrated limited variability within the bilateral patient cohort, they are unlikely to be effective at separating patients based on the severity of their morphology. Defining bilateral cleft lip patients as severe or non-severe has remained a challenge within the pediatric plastic surgery community. Historically, all bilateral cleft patients have been categorized into a single group for the purpose of most classification systems13. However, it is likely that variation in the bilateral patient morphology is present and does influence treatment outcomes. For example, asymmetric bilateral clefts, incomplete or complete bilateral clefts likely have unique facial shape outcomes82. However, in order to demonstrate this through conventional morphometric assessment, the metrics being utilizes must be sensitive to the anatomical variation of these different morphologies.
Finally, our ability to conduct extended asymmetry analysis of the bilateral cleft patient population was limited. Ideally, treatment factors such as cleft type (complete vs incomplete) could be assessed to see if they influence the overall facial asymmetry remaining in bilateral cleft lip patients after their primary lip repair (stage 3). However, when the asymmetry analysis was conducted, no statistically significant asymmetry was detected within the entire bilateral stage 3 treatment population. Therefore, further stratification of the asymmetry evaluation by clinical factors (i.e. Taping received, cleft type etc.) is not possible as the shape analysis suggests the absence of asymmetry in post-operative bilateral cleft lip patients. Our belief is not that no asymmetry is present, but that the methodology is unable to detect the asymmetry due the heterogeneity of the treatment cohort. For unilateral cleft patients, patients’ images can be reflected and oriented allowing for standardization and comparability (i.e. all clefts on the same side). For bilateral patients, the cleft morphology can be varied in its asymmetry. For example, two patients within the cohort may have a left complete and right incomplete presentation while the other has a right microform and a left incomplete cleft. This variable cannot be standardized and when the shapes are superimposed upon one another through Procrustes superimposition, the resulting cohort is highly variable on both sides suggestive of being bilaterally symmetrical. The only way to overcome this heterogeneity of presentation would be to standardize the presenting morphologies into isolated groups for evaluation. Unfortunately, our sample size of bilateral patients in this study is too small to allow for shape evaluation to be performed by each morphological subgroup.
4.5 Limitations Study Power
While this study has been able to profile the outcomes attributable to two PSO taping products, possible targets for future optimization include a larger sample size and additional subgroup analyses. Our sample size of 69 unilateral cleft patients is larger than most published stereophotogrammetry studies which usually encompasses approximately 20-30 patients. However, this population was heterogenous in nature as not all patients had images from all

70
three treatment stages. For the purposes of this study, it was decided to conduct the analysis using this larger heterogenous cohort after a preliminary analysis of the 41 patients with complete image sets produced similar conclusions outcomes by conventional morphometrics by tape type for the 4 evaluated metrics (Appendix F). Therefore, to increase the study population size, the larger cohort was utilized. This study size aligns with the initial power calculations that targeted a sample size of 33 for each tape cohort in order to detect a minimum difference of 0.25 in nostril width ratio (power = 0.80). However, in order to evaluate outcomes associated with various additional treatments or morphological combinations (e.g. Dynacleft with PNAM), larger sample sizes would still be needed facilitate effective subgroup analysis. As 3D image acquisition becomes increasing utilized as a method for documenting patient care, the ability to conduct larger studies utilizing this methodology will increase83. Treatment response and compliance Treatment efficacy was evaluated by determining the proportion of patients that did not demonstrate any improvement in their conventional facial metrics between stage 1 and stage 2. It was found that 27.5% of unilateral cleft patients had at least one facial metric that did not improve with PSO treatment. This lack of improvement may be reflective of multiple factors. It is possible that these patients where non-compliant with the PSO treatment and did not follow appropriate recommendations (e.g. not reapplying tape after being dislodged). It is also possible that the error associated with landmarking and the analysis of these images has also resulted in calculating a negative change in the facial metrics between the two stages. This is particularly likely in the cases where marginal improvement occurred but the resulting landmark variably produces a negative delta value. Finally, treatment ineffectiveness is a third possibility for patients that showed no improvement. Even with adequate treatment compliance, it is possible that the efficacy of their assigned PSO tape or adjuvants failed to significantly alter their facial morphology for a particular facial metric or in certain individuals. With these three possible explanations, it is reasonable to accept that approximately one third of patients had no improvement with taping. In the future, a study design where patient treatment compliance is monitored could improve the ability to associate a particular cause with a lack of improvement. Additionally, obtaining more stages of 3D images during their PSO treatment with a greater follow up period could improve the ability to assess the trajectory of the metric changes.
The limited follow up of 3D imaging studies is a common weakness and it has yet to be clearly shown that CL±P patients that were not treated using PSO differ in their long-term facial outcomes. In response to this, Morioka et al. is currently conducting a 20 year longitudinal study of a cohort of more than 150 cleft patients using serial 3D imaging to allow for documentation of patient facial anatomy throughout the individual stages of treatment83. By incorporating 3D imaging into routine patient visits, cleft teams will be the able to use these images to create a database of CL±P patient anatomy throughout their care that can be subjected to future analysis and review. This ideally will also allow for isolating the outcomes attributable to cleft care from the facial changes that arise from patient growth and development. Imaging Error

71
Another challenge faced within this study is the young age of the patients targeted for evaluation by 3D stereophotogrammetry. Patient tolerance while having their images taken is often highly variable and the quality of the images obtained can be lowered by facial movement. Additionally, if non-neutral facial expressions are incorporated into the study they have the potential to bias the shape analysis and create outliers within the dataset limiting the ability to effectively evaluated facial shape55. The stage 1 images were particularly susceptible to this phenomenon as the majority of these patients were only approximately 20 days old at the time that these images where obtained and their tolerance with image acquisition was limited. By focusing on the nasolabial region for the purpose of geometric analysis, landmarks associated with lower lip animation could be excluded ensuring that overall facial shape assessment was not influenced by dynamic facial expressions.
The error associated with morphometric assessment of 3D imaging may influence the ability to detect differences between comparison groups. The accuracy and fidelity of craniofacial landmarking has been previously validated in the CL±P population. Wong et al., compared digital landmarking by 3D images to physical anthropometric and found the accuracy of using 3D images to be remarkedly high, validating the use of these images for measurement evaluation51. Fidelity between observers for the majority of measurements was high with mean error being less than 1mm and Pearson’s correlation being greater than 0.8. Cupid bow measurements and vermillion heights were comparability less reliable between observers which is thought to have occurred due to the subtle anatomic details that define these locations making them more challenging to consistently landmark51.
In this study, the relative error magnitude (REM) was calculated for all conventional morphometric measurements to determine the variability attributable to these metrics between landmarking sessions. The average REM of all the metrics at all treatment stages was noted to be 0.14. This is marginally higher than the previously reported intrarater proportional difference of 0.1 by Tse et al.,53 However, the region of the superior lip vermillion was found to have consistently high REM values above this average. Although these landmarks were not utilized in our conventional morphometric analysis, three metrics, vermillion height noncleft, vermilion height medial cleft and vermillion height lateral cleft all had a calculated REM measurement of greater than 0.20. This is likely indicative of the difficulty associated with placing landmarks on the wet – dry mucosa transition point of the superior lip which is challenging to consistency identify due to the image quality and poor lighting of this region. Furthermore, as the patients themselves often have non-neutral lip position, consistent measurements of this region are dependent on patient positioning and has been an ongoing region of difficulty51,52. Tse et al., also found proportional differences of greater than 0.25 specifically in this region and attributed the error to be the result of measuring small regions53. The metric “columellar length, cleft side” was the only conventional metric used in our morphometric assessment of taping tapes that had a REM value greater than 0.20. This likely occurred due to the difficultly of identifying the columellar height in stage 1 cleft patients. Due to the nasal tip depression and columella deviation, the soft tissue triangle that marks the transition point between the alar and the columella is poorly defined increasing the error when landmarking this location.
Two possible approaches to reducing the REM associated with landmark measurements is by improving imaging quality or by reducing landmarking error. Optimizing 3D image

72
acquisition is an essential component of improving the ability of 3D images to report objective and reliable outcome metrics. As noted by Brons et al., patient positioning and poor imaging standardization can greatly influence the consistency of the subsequently extracted measurements55. In order to minimize these inconsistencies, a few techniques for image acquisition should be adopted. Firstly, routine practices as recommended by the manufacture are necessary. This includes daily white balance checks and appropriate camera calibration for patient distance and lighting. Secondly, the imagine acquisition process should be standardized between patients as much as possible. Consistency in patient position and region of image capture is essential. It is also of paramount importance that patients adopt a neutral face, mouth closed, head upright, eyes open with relaxed musculature. For younger patients, caregivers should do their best to hold them with their face angled toward the camera set up. Sleeping, crying, drooling or non-cooperative patients jeopardize the utility of a particular image as their altered facial appearance confounds any measurements obtained from it. Since the camera is capable of obtaining the image within milliseconds, it is recommended that the images continue to be collected until a high quality is obtained. Finally, the camera operator must ensure consistency in their ability to obtain an image of the entire face. Images should as a minimum accurately capture up to the location of the posterior ear with an associated high-quality texture map of this region. The ear itself can provide an anchoring location for cephalometric measurements and to ensure the longevity of the images for future morphometric analysis, maximizing the area of facial capture is essential. The methodology of morphometric analysis that is applied to the patients may vary as new, more sensitive and improve methods are developed. Therefore, to ensure that the images remain applicable to these methods of analysis, optimizing their quality and maximizing their region of capture in a standardized and reliable fashion will insure the images are useable in the future.
The second method for minimizing REM is to improve the landmarking methodology and consistency. Within this study all landmarks were manually placed by a single operator. While manual landmarking is the most commonly used technique for this process the incorporation of pseudo-landmarks or automated landmarks could reduce the variability associated with landmark placement. To produce pseudo-landmarks, a small set of manually placed landmarks are first needed. Then, landmarking software using pre-defined geometry can assign additional landmarks based on the position of the first set to provide more data points. The benefit of this process is that it removes the responsibility of the landmarked to manually locate poorly defined landmarks that lack obviously morphological characteristics. For example, improved accuracy for placing the mid-canthal point is likely to occur if it is generated from the bilateral inner canthal points as opposed to being placed by an operator using visual assessment. Automated landmarking is another recent approach to increase the throughput of the landmarking process. As image datasets continue to grow and study sample sizes increase, operators will for forced to manually landmark hundreds of facial images. This large volume will undoubtedly produce a high degree of variability in landmark position. Automated landmarking using a software interface to identify a set of landmark positions based on a few anchored points allowing the entire image is landmarked simultaneously. Arguably, the weakness of this method arises when atypical morphology is inaccurately perceived by the landmarking software. However, this methodology could potentially increase access to landmarking based

73
methodologies by overcoming the limitations of expertise necessary for the landmarking of images. Control Cohort Obtaining a control group of 3D facial images for comparison purposes was not possible within this study. Currently, all children being treated at the BCCH subjected to some degree of pre-surgical orthopaedics as this is the standard of care of the interdisciplinary cleft care team. Therefore, there is no dataset of images of non-PSO treated CL±P patients obtainable within our patient population that could serve as a control group for PSO validation. Additionally, a control group of non-cleft patients are required for comprehensive comparisons especially of asymmetry. However, such images of non-cleft patients that lack a presenting craniofacial pathology and have no indication to present for clinical evaluation at an appropriately comparable age to the CL±P patient population (i.e. less than 1 year old), are not routinely available. It is possible to consider the use of the large web-based 3D facial norm dataset known as Facebase84. Facebase is a craniofacial research initiative that contains information from over 3500 individuals for the purposes of control group access84. However, the youngest patients that have been incorporated into this dataset are 3 years of age which again is much older than our target population. In the future, obtaining a direct patient control for our patient population would be of value. One option for possible control groups would be to actively recruit newborn babies without facial clefts to present for 3D imaging. Patients without orofacial clefts could best serve as a comparative group to a post stage 3 (post lip repair) shape comparison. This approach has been previously utilized within the literature85,86. However, the appropriateness of this control group has come into question due to a usual disparity in the ages between these two groups. Another possible control group would be to recruit CL±P patients that are being treated without PSO for 3D imaging. However, access to non-PSO treated individuals is limited at our center. As the standard of care for many treatment centers in North America is to incorporate PSO, 3D images would only be obtainable from an establishment that has not incorporated these practices into their routine care. Multicenter studies including institutions that do not routinely incorporate PSO into their care (e.g. United Kingdom centers) may be able to overcome this limitation. While the goal of this project was not to validate the efficacy of PSO as a whole, additional evidence for early orthopedic intervention remains of value. 4.6 Future directions
Using a combination of conventional and geometric morphometrics, the analysis conducted here has allowed for comparison of shape outcomes associated with PSO lip taping. Additionally, we have been able to compare PSO treatment protocols and cleft severity as secondary factors associated with influencing with these outcomes associated treatments. However, while geometric shape analysis has allowed for evaluation of shape outcomes, it does not indicate which of two compared groups is associated with a superior shape. While it has been possible to show that cleft severity and PSO treatment protocol result in significant differences in shape outcomes by GM analysis, it does not conclude if PNAM or non-severe cleft patients have better shape outcomes. A claim of superiority must be supported by additional conventional morphometric data.

74
Possible techniques to demonstrate shape superiority for future research include either principle component analysis or using visualization techniques. Principle component analysis is an additional geometric methodology that allows for evaluating the axis of shape variability67,87. In doing so, further localization of a shape variation can be performed to describe the shape variability between the two groups and the associated site-specific shape differences attributable to particular treatments. This methodology may provide insight into the shape differences attributable to “cleft side” in our geometric analysis which currently suggests a landmarking bias is present depending on the presenting laterality of the cleft. Alternatively, visualization techniques such as wireframe mapping or heat mapping can be used to produce images that demonstrate where shape variability is present within a particular patient cohort. Heat maps in particular have been previously utilized to study the cleft patient population and effectively highlight residual areas of asymmetry88,89. By visualizing the shape differences between our evaluated patient comparison groups, we will be able to further support which particular treatment most successfully align with clinical treatment is of value to both the clinical care team and patient population. Another possible future direction would be to increase the sensitivity of the morphometric analysis to identify shape variation. The number of landmarks for example could be increased to account for scar placement or a greater anatomical region in order to account for a greater variation within the shape analysis. Automated landmarking has more recently arisen to minimize the labor intensity of the landmarking process and improve the accessibility of this technique beyond highly trained experts90.
Deformational surface analysis of the 3D images is an additional morphometric approach for composite shape analysis using facial imagery. Using this method, images are minimally landmarked providing anchoring points. Then using these points, images can be superimposed upon one another and surface vectors can be computed across the entirety of an image. These vectors allow for quantification of the difference between superimposed images, with the option of assessing multiple parameters (such as magnitude, angle of deformation etc.) for each individual in the cohort. Importantly, this method is not confined by the sparse landmarking used in conventional and geometric morphometric techniques. It is also possible to assign an objective asymmetry “score” which can be further used for statistical analyses. This methodology can also facilitate visualization and produce a detailed facial map demonstrating composite magnitudes of facial shape91,92. These comprehensive facial maps could be used to demonstrate the regions of residual asymmetry and be used to direct treatment goals. Apart from the above directions which are optimizations of this research study, it is also important to address the future applications of 3D imaging analysis for CL±P patients. Recent systematic reviews have demonstrated that the study of CL±P outcomes are rapidly expanding due to the application of 3D imaging49,50. This technology provides a platform for clinicians to evaluate their own outcomes and to objectively associate specific inventions to measurements of facial shape. Midface growth and restriction due to iatrogenic scarring is an area of future focus that could be effectively evaluated using the technology of 3D imaging based morphometric analysis. Also, while not addressed here, outcomes associated with the variation in the multitude of surgical procedures currently practiced for primary lip repair could be conducted using this methodology93. Different stages of treatment, (rhinoplasty, secondary revisions, orthognathic surgeries etc.) are also candidate targets of future work. As noted by

75
Thierens et al., the ultimate goal of this research is to provide the foundation of future cross-comparison studies to improve evidence-based support of CL±P interventions and allow for guideline construction for nonsurgical and surgical CL±P treatments50.

76
Literature cited
1. Richman JM, Vora SR. Craniofacial Defects and Cleft Lip and Palate. eLS: John Wiley & Sons, Ltd; 2017.
2. Dixon MJ, Marazita ML, Beaty TH, Murray JC. Cleft lip and palate: understanding genetic and environmental influences. Nat Rev Genet. 2011;12(3):167-178.
3. Rodriguez ED, Losee JE, Neligan PC, ClinicalKey F. Plastic Surgery: Volume 3: Craniofacial, Head and Neck Surgery and Pediatric Plastic Surgery. 4th ed. Philadelphia: Elsevier [Imprint]; 2017.
4. Bernheim N, Georges M, Malevez C, De Mey A, Mansbach A. Embryology and epidemiology of cleft lip and palate. B ENT. 2006:11.
5. Shaw GM, Wasserman CR, Lammer EJ, et al. Orofacial clefts, parental cigarette smoking, and transforming growth factor-alpha gene variants. American journal of human genetics. 1996;58(3):551.
6. Nagase Y, Natsume N, Kato T, Hayakawa T. Epidemiological analysis of cleft lip and/or palate by cleft pattern. Journal of maxillofacial and oral surgery. 2010;9(4):389-395.
7. Hirayama K. Anatomical studies on the development of the facial artery and its distribution in the cleft lip of the human fetus. Part 1 development of the facial artery in the human fetus on the latter stage of pregnancy. Medical Journal of Kagoshima University. 1971;1:295-316.
8. Bender PL. Genetics of cleft lip and palate. Journal of pediatric nursing. 2000;15(4):242-249.
9. Merritt L. Part 1. Understanding the embryology and genetics of cleft lip and palate. Advances in neonatal care. 2005;5(2):64-71.
10. Romitti PA, Lidral AC, Munger RG, Daack-Hirsch S, Burns TL, Murray JC. Candidate genes for nonsyndromic cleft lip and palate and maternal cigarette smoking and alcohol consumption: evaluation of genotype-environment interactions from a population-based case-control study of orofacial clefts. Teratology. 1999;59(1):39-50.
11. van Rooij IA, Ocké MC, Straatman H, Zielhuis GA, Merkus HM, Steegers-Theunissen RP. Periconceptional folate intake by supplement and food reduces the risk of nonsyndromic cleft lip with or without cleft palate. Preventive medicine. 2004;39(4):689-694.
12. Millacura N, Pardo R, Cifuentes L, Suazo J. Effects of folic acid fortification on orofacial clefts prevalence: a meta-analysis. Public health nutrition. 2017;20(12):2260-2268.
13. Allori AC, Mulliken JB, Meara JG, Shusterman S, Marcus JR. Classification of cleft lip/palate: then and now. The Cleft Palate-Craniofacial Journal. 2017;54(2):175-188.
14. Campbell A, Restrepo C, Deshpande G, et al. Validation of the Unilateral Cleft Lip Severity Index for Surgeons and Laypersons. Plastic and Reconstructive Surgery - Global Open. 2017;5(9):e1479.
15. Fisher DM, Tse R, Marcus JR. Objective measurements for grading the primary unilateral cleft lip nasal deformity. Plastic and reconstructive surgery. 2008;122(3):874-880.
16. Esenlik E. Presurgical Infant Orthopedics for Cleft Lip and Palate: A Review. Jurnalul de Chirurgie. 2015;11(1).

77
17. Chigurupati R, Heggie A, Bonanthaya K. Cleft lip and palate: an overview. Oral and Maxillofacial Surgery Oxford: Wiley-Blackwell. 2010:945-972.
18. Vasan N. Management of children with clefts of the lip or palate: an overview. The New Zealand dental journal. 1999;95(419):14-20.
19. McIntyre JK, Sethi H, Schonbrunner A, Proudfoot J, Jones M, Gosman A. Number of Surgical Procedures for Patients With Cleft lip and Palate From Birth to 21 Years Old at a Single Children's Hospital. Annals of plastic surgery. 2016;76 Suppl 3:S205-208.
20. Nahai FR, Williams JK, Burstein FD, Martin J, Thomas J. The management of cleft lip and palate: pathways for treatment and longitudinal assessment. Paper presented at: Seminars in plastic surgery2005.
21. Cash AC. Orthodontic treatment in the management of cleft lip and palate. Cleft Lip and Palate. Vol 16: Karger Publishers; 2012:111-123.
22. McNeil C. Orthodontic procedures in the treatment of congenital cleft palate. The Dental Record. 1950;70:126-132.
23. Fry WK, Burston W. Treatment of the Cleft Palate: Scientific Symposium:(a) The Development of Cleft Lip and Palate: Held at the Royal College of Surgeons of England on 24th July 1959. Annals of the Royal College of Surgeons of England. 1959;25(3):225.
24. Alzain I, Batwa W, Cash A, Murshid ZA. Presurgical cleft lip and palate orthopedics: an overview. Clinical, cosmetic and investigational dentistry. 2017;9:53.
25. Grayson BH, Garfinkle JS. Early cleft management: the case for nasoalveolar molding. American journal of orthodontics and dentofacial orthopedics : official publication of the American Association of Orthodontists, its constituent societies, and the American Board of Orthodontics. 2014;145(2):134-142.
26. Santiago PE, Grayson BH, Cutting CB, Gianoutsos MP, Brecht LE, Kwon SM. Reduced need for alveolar bone grafting by presurgical orthopedics and primary gingivoperiosteoplasty. The Cleft palate-craniofacial journal. 1998;35(1):77-80.
27. Cutting C, Grayson B, Brecht L, Santiago P, Wood R, Kwon S. Presurgical columellar elongation and primary retrograde nasal reconstruction in one-stage bilateral cleft lip and nose repair. Plastic and reconstructive surgery. 1998;101(3):630-639.
28. Grayson BH, Cutting C, Wood R. Preoperative columella lengthening in bilateral cleft lip and palate. Plastic and reconstructive surgery. 1993;92(7):1422-1423.
29. Papadopoulos MA, Koumpridou E, Vakalis M, Papageorgiou S. Effectiveness of pre-surgical infant orthopedic treatment for cleft lip and palate patients: a systematic review and meta-analysis. Orthodontics & craniofacial research. 2012;15(4):207-236.
30. Shaw WC, Brattstrom V, Molsted K, Prahl-Andersen B, Roberts CT, Semb G. The Eurocleft study: intercenter study of treatment outcome in patients with complete cleft lip and palate. Part 5: discussion and conclusions. The Cleft palate-craniofacial journal : official publication of the American Cleft Palate-Craniofacial Association. 2005;42(1):93-98.
31. Prahl C, Kuijpers-Jagtman AM, van't Hof MA, Prahl-Andersen B. A randomized prospective clinical trial of the effect of infant orthopedics in unilateral cleft lip and palate: prevention of collapse of the alveolar segments (Dutchcleft). The Cleft palate-craniofacial journal. 2003;40(4):337-342.
78
32. Bessell A, Hooper L, Shaw WC, Reilly S, Reid J, Glenny AM. Feeding interventions for growth and development in infants with cleft lip, cleft palate or cleft lip and palate. Cochrane Database of Systematic Reviews. 2011(2).
33. Uzel A, Alparslan ZN. Long-term effects of presurgical infant orthopedics in patients with cleft lip and palate: a systematic review. The Cleft Palate-Craniofacial Journal. 2011;48(5):587-595.
34. Grayson BH. Discussion: Limited evidence for the effect of presurgical nasoalveolar molding in unilateral cleft on nasal symmetry: a call for unified research. Plastic and reconstructive surgery. 2013;131(1):75e.
35. Clark SL, Teichgraeber JF, Fleshman RG, et al. Long-term treatment outcome of presurgical nasoalveolar molding in patients with unilateral cleft lip and palate. The Journal of craniofacial surgery. 2011;22(1):333.
36. Retnakumari N, Divya S, Meenakumari S, Ajith P. Nasoalveolar molding treatment in presurgical infant orthopedics in cleft lip and cleft palate patients. Archives of Medicine and Health Sciences. 2014;2(1):36.
37. Pai BC-J, Ko EW-C, Huang C-S, Liou EJ-W. Symmetry of the nose after presurgical nasoalveolar molding in infants with unilateral cleft lip and palate: a preliminary study. The Cleft palate-craniofacial journal. 2005;42(6):658-663.
38. Liou EJ-W, Subramanian M, Chen PK, Huang CS. The progressive changes of nasal symmetry and growth after nasoalveolar molding: a three-year follow-up study. Plastic and reconstructive surgery. 2004;114(4):858-864.
39. Broder HL, Flores RL, Clouston S, et al. Surgeon’s and caregivers’ appraisal of primary cleft lip treatment with and without nasoalveolar molding: A prospective multicenter pilot study. Plastic and reconstructive surgery. 2016;137(3):938.
40. van der Heijden P, Dijkstra PU, Stellingsma C, van der Laan BF, Korsten-Meijer AG, Goorhuis-Brouwer SM. Limited evidence for the effect of presurgical nasoalveolar molding in unilateral cleft on nasal symmetry: a call for unified research. Plastic and reconstructive surgery. 2013;131(1):62e-71e.
41. Meara JG, Andrews BT, Ridgway EB, Raisolsadat M-A, Hiradfar M. Unilateral cleft lip and nasal repair: techniques and principles. Iranian journal of pediatrics. 2011;21(2):129.
42. Randall P. A triangular flap operation for the primary repair of unilateral clefts of the lip. Plastic and reconstructive surgery. 1959;23(4):331-347.
43. Millard Jr R. Refinements in rotation-advancement cleft lip technique. Plastic and Reconstructive Surgery. 1964;33(1):26-38.
44. Sitzman TJ, Girotto JA, Marcus JR. Current surgical practices in cleft care: unilateral cleft lip repair. Plastic and reconstructive surgery. 2008;121(5):261e-270e.
45. Fisher DM. Unilateral cleft lip repair: an anatomical subunit approximation technique. Plastic and reconstructive surgery. 2005;116(1):61-71.
46. Roberts JM, Jacobs A, Morrow B, Hauck R, Samson TD. Current Trends in Unilateral Cleft Lip Care: A 10-Year Update on Practice Patterns. Annals of plastic surgery. 2019.
47. Katzel EB, Basile P, Koltz PF, Marcus JR, Girotto JA. Current surgical practices in cleft care: cleft palate repair techniques and postoperative care. Plastic and reconstructive surgery. 2009;124(3):899-906.
79
48. Peltomäki T, Vendittelli BL, Grayson BH, Cutting CB, Brecht LE. Associations between severity of clefting and maxillary growth in patients with unilateral cleft lip and palate treated with infant orthopedics. The Cleft palate-craniofacial journal. 2001;38(6):582-586.
49. Thierens LAM, De Roo NMC, De Pauw GAM, Brusselaers N. Assessment modalities of non-ionizing three-dimensional images for the quantification of facial morphology, symmetry, and appearance in cleft lip and palate: a systematic review. International journal of oral and maxillofacial surgery. 2018;47(9):1095-1105.
50. Thierens LAM, De Roo NMC, De Pauw GAM, Brusselaers N. Quantifying Soft Tissue Changes in Cleft Lip and Palate Using Nonionizing Three-Dimensional Imaging: A Systematic Review. Journal of oral and maxillofacial surgery : official journal of the American Association of Oral and Maxillofacial Surgeons. 2018;76(10):2210.e2211-2210.e2213.
51. Wong JY, Oh AK, Ohta E, et al. Validity and reliability of craniofacial anthropometric measurement of 3D digital photogrammetric images. The Cleft palate-craniofacial journal : official publication of the American Cleft Palate-Craniofacial Association. 2008;45(3):232-239.
52. De Menezes M, Rosati R, Ferrario VF, Sforza C. Accuracy and reproducibility of a 3-dimensional stereophotogrammetric imaging system. Journal of Oral and Maxillofacial Surgery. 2010;68(9):2129-2135.
53. Tse R, Booth L, Keys K, et al. Reliability of nasolabial anthropometric measures using three-dimensional stereophotogrammetry in infants with unrepaired unilateral cleft lip. Plastic and reconstructive surgery. 2014;133(4):530e-542e.
54. Stebel A, Desmedt D, Bronkhorst E, Kuijpers MA, Fudalej PS. Rating nasolabial appearance on three-dimensional images in cleft lip and palate: a comparison with standard photographs. European journal of orthodontics. 2015;38(2):197-201.
55. Brons S, Darroudi A, Nada R, et al. Influence of involuntary facial expressions on reproducibility of 3D stereophotogrammetry in children with and without complete unilateral cleft lip and palate from 3 to 18 months of age. Clinical oral investigations. 2019;23(3):1041-1050.
56. Chou PY, Hallac RR, Ajiwe T, et al. The role of Nasoalveolar molding: A 3D Prospective analysis. Scientific reports. 2017;7(1):9901.
57. Singh GD, Levy-Bercowski D, Santiago PE. Three-dimensional nasal changes following nasoalveolar molding in patients with unilateral cleft lip and palate: geometric morphometrics. The Cleft palate-craniofacial journal. 2005;42(4):403-409.
58. Othman SA, Ahmad R, Merican AF, Jamaludin M. Reproducibility of facial soft tissue landmarks on facial images captured on a 3D camera. Australian orthodontic journal. 2013;29(1):58.
59. Singh GD, Levy-Bercowski D, Yáñez MA, Santiago PE. Three-dimensional facial morphology following surgical repair of unilateral cleft lip and palate in patients after nasoalveolar molding. Orthodontics & craniofacial research. 2007;10(3):161-166.
60. Yamada T, Mori Y, Mishima K, Sugahara T. Nasolabial and alveolar morphology following presurgical orthopaedic treatment in complete unilateral clefts of lip, alveolus and

80
palate. Journal of cranio-maxillo-facial surgery : official publication of the European Association for Cranio-Maxillo-Facial Surgery. 2003;31(6):343-347.
61. Yilmaz RBN, Çakan DG. Nasolabial Morphology Following Nasoalveolar Molding in Infants With Unilateral Cleft Lip and Palate. Journal of Craniofacial Surgery. 2018;29(4):1012-1016.
62. Mancini L, Gibson TL, Grayson BH, Flores RL, Staffenberg D, Shetye PR. Three-Dimensional Soft Tissue Nasal Changes After Nasoalveolar Molding and Primary Cheilorhinoplasty in Infants With Unilateral Cleft Lip and Palate. The Cleft Palate-Craniofacial Journal. 2019;56(1):31-38.
63. Pool R. Tissue mobilization with preoperative lip taping. Operative Techniques in Plastic and Reconstructive Surgery. 1995;2(3):155-158.
64. Vinson L. The effect of dynacleft® on cleft width in unilateral cleft lip and palate patients. Journal of Clinical Pediatric Dentistry. 2017;41(6):442-445.
65. Mercan E, Oestreich M, Fisher DM, et al. Objective Assessment of the Unilateral Cleft Lip Nasal Deformity Using Three-Dimensional Stereophotogrammetry: Severity and Outcome. Plastic and reconstructive surgery. 2018;141(4):547e-558e.
66. Static-3dMD Systems. 2020; http://www.3dmd.com/static-3dmd_systems/. Accessed February 25, 2020.
67. Manyama M, Larson JR, Liberton DK, et al. Facial morphometrics of children with non-syndromic orofacial clefts in Tanzania. BMC Oral Health. 2014;14(1):93.
68. Weinberg SM, Scott NM, Neiswanger K, Brandon CA, Marazita ML. Digital three-dimensional photogrammetry: evaluation of anthropometric precision and accuracy using a Genex 3D camera system. The Cleft palate-craniofacial journal. 2004;41(5):507-518.
69. Kim H-Y. Statistical notes for clinical researchers: Evaluation of measurement error 2: Dahlberg's error, Bland-Altman method, and Kappa coefficient. Restorative dentistry & endodontics. 2013;38(3):182-185.
70. Rohlf FJ. Shape statistics: Procrustes superimpositions and tangent spaces. Journal of classification. 1999;16(2):197-223.
71. Goodall C. Procrustes methods in the statistical analysis of shape. Journal of the Royal Statistical Society: Series B (Methodological). 1991;53(2):285-321.
72. Zelditch ML, Swiderski DL, Sheets HD. Geometric morphometrics for biologists: a primer. Academic Press; 2012.
73. Jensen BL, Kreiborg S, Dahl E, Fogh-Andersen P. Cleft lip and palate in Denmark, 1976-1981: epidemiology, variability, and early somatic development. Cleft Palate J. 1988;25(3):258-269.
74. Dynacleft System. 2020; https://www.craniorehab.com/DynaCleft. Accessed February 12, 2020.
75. Smith KS, Henry BT, Scott MA. Presurgical Dentofacial Orthopedic Management of the Cleft Patient. Oral and maxillofacial surgery clinics of North America. 2016;28(2):169-176.
76. Monasterio L, Ford A, Gutierrez C, Tastets ME, Garcia J. Comparative study of nasoalveolar molding methods: nasal elevator plus DynaCleft(R) versus NAM-Grayson in patients with complete unilateral cleft lip and palate. The Cleft palate-craniofacial

81
journal : official publication of the American Cleft Palate-Craniofacial Association. 2013;50(5):548-554.
77. Chiu Y-T, Liao Y-F. Is cleft severity related to maxillary growth in patients with unilateral cleft lip and palate? The Cleft palate-craniofacial journal. 2012;49(5):535-540.
78. Chiu Y-T, Liao Y-F, Chen PK-T. Initial cleft severity and maxillary growth in patients with complete unilateral cleft lip and palate. American journal of orthodontics and dentofacial orthopedics. 2011;140(2):189-195.
79. Henkel K-O, Gundlach K, Saka B. Incidence of secondary lip surgeries as a function of cleft type and severity: one center's experience. The Cleft palate-craniofacial journal. 1998;35(4):310-312.
80. Grayson BH, Santiago PE, Brecht LE, Cutting CB. Presurgical nasoalveolar molding in infants with cleft lip and palate. The cleft palate-Craniofacial journal. 1999;36(6):486-498.
81. Bugaighis I, Mattick CR, Tiddeman B, Hobson R. 3D asymmetry of operated children with oral clefts. Orthodontics & craniofacial research. 2014;17(1):27-37.
82. Yuzuriha S, Oh AK, Mulliken JB. Asymmetrical bilateral cleft lip: Complete or incomplete and contralateral lesser defect (minor-form, microform, or mini-microform). Plastic and reconstructive surgery. 2008;122(5):1494-1504.
83. Morioka D, Mandrano N, Fujimoto H, et al. Longitudinal follow-up of individuals with cleft lip using three-dimensional stereophotogrammetry. Journal of Craniofacial Surgery. 2018;29(5):1261-1265.
84. Brinkley JF, Fisher S, Harris MP, et al. The FaceBase Consortium: a comprehensive resource for craniofacial researchers. Development. 2016;143(14):2677-2688.
85. Kuijpers MA, Desmedt DJ, Nada RM, Bergé SJ, Fudalej PS, Maal TJ. Regional facial asymmetries in unilateral orofacial clefts. European journal of orthodontics. 2015;37(6):636-642.
86. Bell A, Lo T-WR, Brown D, et al. Three-dimensional assessment of facial appearance following surgical repair of unilateral cleft lip and palate. The Cleft Palate-Craniofacial Journal. 2014;51(4):462-471.
87. Bugaighis I, O’higgins P, Tiddeman B, Mattick C, Ben Ali O, Hobson R. Three-dimensional geometric morphometrics applied to the study of children with cleft lip and/or palate from the North East of England. The European Journal of Orthodontics. 2010;32(5):514-521.
88. Dadáková M, Cagáňová V, Dupej J, Hoffmannová E, Borský J, Velemínská J. Three-dimensional evaluation of facial morphology in pre-school cleft patients following neonatal cheiloplasty. Journal of Cranio-Maxillofacial Surgery. 2016;44(9):1109-1116.
89. Desmedt DJ, Maal TJ, Kuijpers MA, Bronkhorst EM, Kuijpers-Jagtman AM, Fudalej PS. Nasolabial symmetry and esthetics in cleft lip and palate: analysis of 3D facial images. Clinical oral investigations. 2015;19(8):1833-1842.
90. Li M, Cole JB, Manyama M, et al. Rapid automated landmarking for morphometric analysis of three-dimensional facial scans. Journal of Anatomy. 2017;230(4):607-618.
91. Al-Rudainy D, Ju X, Mehendale FV, Ayoub A. Longitudinal 3D assessment of facial asymmetry in unilateral cleft lip and palate. The Cleft Palate-Craniofacial Journal. 2019;56(4):495-501.

82
92. Al-Rudainy D, Ju X, Stanton S, Mehendale FV, Ayoub A. Assessment of regional asymmetry of the face before and after surgical correction of unilateral cleft lip. Journal of Cranio-Maxillofacial Surgery. 2018;46(6):974-978.
93. Adetayo AM, James O, Adeyemo WL, Ogunlewe MO, Butali A. Unilateral cleft lip repair: a comparison of treatment outcome with two surgical techniques using quantitative (anthropometry) assessment. Journal of the Korean Association of Oral and Maxillofacial Surgeons. 2018;44(1):3-11.

83
Appendices Appendix A: Raw conventional morphometric measurements of the unilateral dataset by tape type. Metric Stage Tape Mean Std P-value Columellar angle 1 3M 12.44 8.87 0.48
Dynacleft 14.29 7.93
2 3M 6.89 4.96 0.21
Dynacleft 5.26 3.54
3 3M 5.97 4.35 0.34
Dynacleft 7.45 5.55
Columellar length cleft 1 3M 6.52 2.22 0.10
Dynacleft 7.40 1.69
2 3M 5.50 1.49 0.55
Dynacleft 5.31 0.71
3 3M 4.49 0.95 0.16
Dynacleft 5.22 1.94
Columellar length non cleft
1 3M 4.03 0.92 0.02
Dynacleft 3.57 0.48
2 3M 4.23 0.90 0.02
Dynacleft 5.70 0.64
3 3M 4.62 1.04 0.52
Dynacleft 4.87 1.41
Columellar length ratio 1 3M 1.72 0.68 0.02
Dynacleft 2.09 0.49
2 3M 1.35 0.51 0.05
Dynacleft 1.14 0.15
3 3M 0.99 0.19 0.34
Dynacleft 1.27 0.53
Columellar width 1 3M 3.93 0.87 0.85
Dynacleft 3.97 0.73
2 3M 4.07 0.81 0.69
Dynacleft 4.16 0.67
3 3M 4.06 0.79 0.54
Dynacleft 3.90 0.97
Cupid bow width 1 3M 7.54 1.36 0.12
Dynacleft 7.05 0.96
2 3M 8.45 1.86 0.50
Dynacleft 8.76 1.21

84
Metric Stage Tape Mean SD P-value
3 3M 7.76 1.81 0.08
Dynacleft 6.85 1.71
Lateral lip height cleft 1 3M 15.27 4.21 0.19
Dynacleft 16.98 4.48
2 3M 12.31 3.00 0.19
Dynacleft 13.26 1.89
3 3M 10.03 1.42 0.41
Dynacleft 10.64 2.88
Lateral lip height non cleft
1 3M 9.37 1.54 0.27
Dynacleft 10.74 4.84
2 3M 11.96 4.19 0.33
Dynacleft 11.23 1.15
3 3M 11.69 1.94 0.49
Dynacleft 11.37 1.41
Lateral lip height ratio 1 3M 1.68 0.51 0.32
Dynacleft 1.81 0.58
2 3M 1.14 0.35 0.56
Dynacleft 1.19 0.21
3 3M 0.87 0.13 0.25
Dynacleft 0.97 0.27
Lateral lip length cleft 1 3M 23.30 4.56 0.12
Dynacleft 24.80 2.82
2 3M 12.42 2.17 0.13
Dynacleft 11.53 1.95
3 3M 20.80 3.08 0.50
Dynacleft 21.51 3.27
Medial lip length cleft 1 3M 13.54 3.14 0.22
Dynacleft 12.43 2.57
2 3M 16.30 2.63 0.93
Dynacleft 16.39 3.96
3 3M 16.11 2.02 0.64
Dynacleft 15.73 2.98
Lateral lip length ratio 1 3M 1.68 0.51 0.52
Dynacleft 1.78 0.58
2 3M 1.11 0.35 0.31
Dynacleft 1.19 0.21
3 3M 0.87 0.13 0.29
Dynacleft 0.95 0.27

85
Metric Stage Tape Mean Std P-value Lip nose width ratio 1 3M 1.13 0.14 0.00
Dynacleft 1.03 0.08
2 3M 1.09 0.11 0.80
Dynacleft 1.10 0.90
3 3M 1.09 0.12 0.67
Dynacleft 1.07 0.12
Lip width 1 3M 31.85 4.30 0.42
Dynacleft 30.89 4.06
2 3M 31.04 3.04 0.78
Dynacleft 31.31 2.84
3 3M 29.75 3.41 0.31
Dynacleft 28.73 3.32
Medial lip height cleft 1 3M 5.43 2.02 0.83
Dynacleft 5.27 2.99
2 3M 6.88 2.05 0.17
Dynacleft 6.28 0.98
3 3M 9.90 1.62 0.29
Dynacleft 9.32 1.93
Medial lip height non cleft
1 3M 8.73 1.23 0.18
Dynacleft 9.81 3.09
2 3M 10.17 2.32 0.58
Dynacleft 10.45 1.19
3 3M 10.16 1.52 0.35
Dynacleft 9.72 1.61
Medial lip height ratio 1 3M 0.63 0.23 0.07
Dynacleft 0.53 0.16
2 3M 0.68 0.16 0.01
Dynacleft 0.60 0.06
3 3M 0.98 0.14 0.89
Dynacleft 0.97 0.21
Nasal base columellar angle cleft
1 3M 82.46 12.21 0.62
Dynacleft 81.04 9.12
2 3M 91.46 9.15 0.95
Dynacleft 91.31 6.27
3 3M 93.79 7.47 0.07
Dynacleft 88.80 9.45
Metric Stage Tape Mean Std P-value

86
Nasal base columellar angle non cleft
1 3M 102.45 14.66 0.56
Dynacleft 105.06 15.75
2 3M 99.70 11.33 0.82
Dynacleft 99.02 8.76
3 3M 97.56 10.33 0.86
Dynacleft 98.09 10.61
nasal bridge 1 3M 15.68 2.29 0.10
Dynacleft 16.48 1.36
2 3M 17.51 2.35 0.28
Dynacleft 18.25 2.04
3 3M 18.98 2.65 0.73
Dynacleft 19.15 1.10
Nasal length cleft 1 3M 18.17 2.25 0.03
Dynacleft 19.46 1.93
2 3M 18.69 1.91 0.22
Dynacleft 19.42 1.80
3 3M 16.30 1.37 0.71
Dynacleft 16.10 1.99
Nasal length non cleft 1 3M 13.50 1.42 0.86
Dynacleft 13.54 0.68
2 3M 15.24 1.37 0.73
Dynacleft 15.43 1.77
3 3M 15.40 1.56 0.37
Dynacleft 15.06 1.13
Nasal tip 1 3M 8.45 1.01 0.10
Dynacleft 7.92 1.12
2 3M 9.60 1.85 0.36
Dynacleft 10.00 1.35
3 3M 9.75 1.26 0.76
Dynacleft 9.87 1.30
Nostril width base 1 3M 20.08 3.44 0.07
Dynacleft 21.80 3.10
2 3M 18.81 2.65 0.44
Dynacleft 19.32 1.77
3 3M 15.33 2.72 0.58
Dynacleft 14.78 3.57
Nostril width cleft 1 3M 15.18 4.12 0.07
Dynacleft 16.97 2.94
Metric Stage Tape Mean Std P-value

87
2 3M 13.00 2.63 0.18
Dynacleft 13.87 1.72
3 3M 9.32 1.72 0.55
Dynacleft 9.89 3.76
Nostril width max 1 3M 28.14 2.66 0.01
Dynacleft 29.94 2.33
2 3M 28.50 2.15 0.97
Dynacleft 28.48 1.93
3 3M 27.43 2.20 0.43
Dynacleft 26.84 2.68
Nostril width non cleft 1 3M 6.16 1.31 0.09
Dynacleft 6.69 0.96
2 3M 7.55 2.60 0.36
Dynacleft 7.00 1.51
3 3M 7.83 1.49 0.77
Dynacleft 7.69 1.70
Nose width cleft 1 3M 11.49 3.16 0.12
Dynacleft 12.62 2.24
2 3M 9.75 2.45 0.15
Dynacleft 10.88 2.09
3 3M 7.50 1.51 0.19
Dynacleft 8.19 1.87
Nose width non cleft 1 3M 5.83 1.40 0.86
Dynacleft 5.88 1.02
2 3M 6.37 1.71 0.80
Dynacleft 6.24 1.50
3 3M 7.04 1.30 0.57
Dynacleft 6.80 1.51
Nose width ratio 1 3M 2.15 0.94 0.73
Dynacleft 2.22 0.64
2 3M 1.68 0.73 0.54
Dynacleft 1.79 0.48
3 3M 1.09 0.24 0.14
Dynacleft 1.25 0.40
Vermillion height lateral cleft
1 3M 2.49 0.62 0.47
Dynacleft 2.37 0.52
Metric Stage Tape Mean Std P-value

88
2 3M 2.72 0.64 0.55
Dynacleft 2.83 0.52
3 3M 3.30 1.05 0.71
Dynacleft 3.18 1.12
Vermillion height medial cleft
1 3M 2.56 0.77 0.58
Dynacleft 2.78 0.15
2 3M 3.08 2.16 0.78
Dynacleft 3.21 0.98
3 3M 3.78 1.28 0.73
Dynacleft 3.64 1.46
Vermillion height non cleft
1 3M 3.16 0.52 0.41
Dynacleft 3.43 1.30
2 3M 3.56 1.78 0.57
Dynacleft 3.39 0.40
3 3M 3.90 1.04 0.76
Dynacleft 4.01 1.28

89
Appendix B: Raw conventional morphometric measurements of the bilateral dataset by tape type. Metric Stage Tape Mean SD P-value Nasal Tip projection
1 3M Dyna
7.69 8.74
1.28 4.16
0.59
2 3M Dyna
8.90 10.2
1.10 1.68
0.095
3 3M Dyna
10.3 10.2
1.7 1.7
0.95
Nasal bridge length
1 3M Dyna
16.16 17.37
2.06 2.63
0.32
2 3M Dyna
19.39 18.89
2.02 2.61
0.66
3 3M Dyna
19.83 18.74
1.79 2.22
2.78
Columellar length left
1 3M Dyna
3.23 2.57
1.27 0.39
0.23
2 3M Dyna
4.17 4.84
1.03 1.31
0.26
3 3M Dyna
4.36 4.64
1.83 1.46
0.71
Columellar length right
1 3M Dyna
3.97 3.03
2.43 0.76
0.41
2 3M Dyna
4.67 4.14
1.33 1.33
0.40
3 3M Dyna
4.94 4.67
1.91 1.39
0.72
Nasal aperture L 1 3M Dyna
9.973 10.740
3.22 2.20
0.6515
2 3M Dyna
12.23 12.42
2.27 2.21
0.87
3 3M Dyna
8.6 9.61
2.67 2.03
0.372
Nasal aperture R 1 3M Dyna
12.28 13.82
4.53 9.26
0.72
2 3M Dyna
12.34 11.65
2.91 1.34
0.4589
3 3M Dyna
9.24 8.773
4.09 1.35
0.739
Nasal aperture Max
1 3M Dyna
30.67 28.55
2.30 5.62
0.36
2 3M Dyna
31.47 34.41
3.21 1.75
0.1813

90
Metric Stage Tape Mean SD P-value 3 3M
Dyna 29.52 29.84
2.64 2.406
0.79
Nasal length L 1 3M Dyna
17.42 17.88
2.49 2.87
0.721
2 3M Dyna
18.40 19.37
1.94 2.22
0.35
3 3M Dyna
15.58 16.85
2.01 2.04
0.21
Nasal length R 1 3M Dyna
18.17 17.76
2.80 3.77
0.80
2 3M Dyna
18.27 18.95
1.81 1.97
0.46
3 3M Dyna
16.43 15.85
2.05 1.68
0.52
Nostril width inner base
1 3M Dyna
22.40 22.30
4.01 4.73
0.97
2 3M Dyna
22.45 23.02
3.17 2.63
0.66
3 3M Dyna
17.91 18.24
3.12 3.30
0.83
Columellar width 1 3M Dyna
4.224 4.78
1.09 0.99
0.42
2 3M Dyna
4.093 4.213
0.601 0.88
0.75
3 3M Dyna
5.142 4.504
0.774 0.687
0.083
Nostril width R 1 3M Dyna
12.33 12.06
3.93 6.77
0.92
2 3M Dyna
10.18 10.57
1.87 1.13
0.55
3 3M Dyna
9.34 8.84
1.66 1.17
0.466
3 3M Dyna
20.87 23.52
1.79 2.14
0.014
Medial lip height L
1 3M Dyna
4.71 4.92
2.61 2.16
0.8899
2 3M Dyna
6.84 7.084
1.02 1.63
0.73
3 3M Dyna
7.942 8.28
1.60 1.16
0.607
Medial lip height R
1 3M Dyna
5.92 7.312
1.99 4.35
0.53

91
Metric Stage Tape Mean SD P-value 2 3M
Dyna 6.87 7.12
1.06 1.122
0.626
3 3M Dyna
7.671 8.260
1.379 1.538
0.412
Lateral lip height L
1 3M Dyna
12.75 14.85
4.15 5.5
0.371
2 3M Dyna
11.5 11.4
2.35 2.22
0.923
3 3M Dyna
10.873 11.508
1.619 1.86
0.4591
Lateral lip height R
1 3M Dyna
13.55 22.33
4.07 4.73
0.973
2 3M Dyna
12.125 23.02
3.169 2.63
0.66
3 3M Dyna
11.12 18.24
3.122 3.300
0.832
Lateral lip length R
1 3M Dyna
21.70 19.92
3.96 5.71
0.45
2 3M Dyna
18.76 18.12
3.25 4.38
0.738
3 3M Dyna
18.71 17.66
2.70 2.39
0.40
Lateral lip length L
1 3M Dyna
21.41 23.08
3.23 3.06
0.25
2 3M Dyna
19.48 19.71
2.86 3.77
0.887
3 3M Dyna
17.31 18.51
1.89 1.571
0.16
Cupid bow width 1 3M Dyna
8.182 8.506
1.31 1.61
0.657
2 3M Dyna
9.256 10.65
1.722 2.644
0.238
3 3M Dyna
4.764 6.678
1.48 2.525
0.085
Nasal base col angle L
1 3M Dyna
96.86 105.95
27.637 12.29
0.472
2 3M Dyna
100.5 97.49
8.26 2.528
0.211
3 3M Dyna
88.98 89.99
5.18 5.44
0.6963
Nasal base col angle R
1 3M Dyna
87.33 93.58
10.24 8.58
0.314

92
Metric Stage Tape Mean SD P-value 2 3M
Dyna 98.48 97.06
8.49 7.34
0.693
3 3M Dyna
89.62 88.78
6.57 6.36
0.786
Columellar deviation
1 3M Dyna
19.33 16.51
7.96 6.34
0.54
2 3M Dyna
17.50 18.63
5.26 4.36
0.61
3 3M Dyna
14.90 14.24
4.20 4.50
0.75
Nostril width ratio
1 3M Dyna
0.88 0.967
0.35 0.17
0.49
2 3M Dyna
1.056 1.019
0.25 0.211
0.723
3 3M Dyna
0.964 0.996
0.173 0.193
0.718
Columellar length ratio
1 3M Dyna
0.92 0.96
0.18 0.26
0.8019
2 3M Dyna
0.9227 1.246
0.18 0.50
0.1404
3 3M Dyna
0.87 0.9988
0.083 0.125
0.032
Medial lip height ratio
1 3M Dyna
1.41 1.24
0.52 0.53
0.61
2 3M Dyna
1.011 1.023
0.12 0.117
0.84
3 3M Dyna
0.979 1.005
0.112 0.166
0.7117
lateral lip height ratio
1 3M Dyna
1.143 0.8788
0.456 0.29
0.121
2 3M Dyna
0.915 0.870
0.271 0.247
0.7092
3 3M Dyna
1.015 0.9250
0.122 0.124
0.1448
Nose to mouth width ratio
1 3M Dyna
1.078 1.071
0.114 0.095
0.885
2 3M Dyna
1.063 1.065
0.0988 0.070
0.9526
3 3M Dyna
1.0040 1.061
0.078 0.096
0.194

93
Metric Stage Tape Mean SD P-value Lateral lip length ratio
1 3M Dyna
1.028 0.966
0.213 0.09511
0.5005
2 3M Dyna
0.97 0.926
0.141 0.0706
0.6023
3 3M Dyna
1.08 0.956
0.114 0.0958
0.05143
Appendix C. Unilateral cleft cohort 3D image representation. 3M tape Dynacleft tape Patients with 3 stages of images 31 10 Patients with < 3 stages of images 16 11
Stage 1 & 2 6 1 Stage 1 & 3 5 4 Stage 2 & 3 3 1 Stage 1 only 3 2 Stage 2 only 0 1 Stage 3 only 0 2
Unilateral cleft patients categorized by how many 3D images were available within their records for morphometric analysis. Patients with less than 3 images were subcategorized by their combination of images available.

94
Appendix D. Intra-observer image landmarking error of facial measurements for unilateral cleft patients.
Mean SD Mean Absolute difference (MAD)
Relative error magnitude (REM)
Dahlberg Error
Distances (mm) Nasal tip projection 9.29 1.31 0.79 0.085 0.73 Nasal bridge length 17.43 2.47 1.26 0.073 1.11 Nasal aperture width, noncleft 6.93 1.66 1.04 0.15 1.21 Nasal aperture width, cleft 12.93 3.99 1.09 0.084 1.24 Nasal width, maximum 28.22 2.43 0.63 0.022 0.75 Nasal width, inner base 18.43 3.72 0.97 0.053 1.03 Nasal length, noncleft 14.69 1.48 0.86 0.059 0.82 Nasal length, cleft 17.69 2.28 0.93 0.052 0.91 Columellar width 4.07 0.76 0.62 0.15 0.54 Lip width 30.35 3.99 1.57 0.052 2.15 Medial lip height, noncleft 9.61 1.56 0.80 0.083 0.89 Medial lip height, cleft 7.01 2.55 0.83 0.12 0.99 Lateral lip length, cleft 20.36 4.81 1.65 0.081 2.51 Lateral lip length, noncleft 13.53 2.98 1.27 0.094 1.68 Cupids bow width 7.55 1.60 1.11 0.15 1.12 Vermillion height, noncleft 3.53 1.82 1.04 0.29 1.74 Vermillion height, medial cleft 2.98 1.42 1.14 0.38 1.36 Vermillion height, lateral cleft 3.00 2.65 1.03 0.35 2.59

95
Appendix E. Conventional morphometric tape comparison using only patients with 3 stages of imaging. Boxplot comparison of four conventional morphometric values calculated from landmarked unilateral cleft images and organized by taping group: A) Nostril width ratio B) Columellar angle, C) Lateral lip height ratio and D) Columellar length ratio. Black lines within the boxplots demonstrated population medians for each subgroup. Red dotted lines demark a ratio of 1.0 which represents bilateral symmetry. Asterisks denote statistical significance between comparison groups within an individual treatment stage.

96
Appendix F. Conventional morphometric comparison of treatment response by tape type. Boxplot comparison of four conventional morphometric values calculated from landmarked unilateral cleft images and organized by taping group: A) Nostril width ratio B) Columellar angle, C) Lateral lip height ratio and D) Columellar length ratio. Black lines within the boxplots demonstrated population medians for each subgroup. Red lines demark a ratio of 1.0 which represents bilateral symmetry. Asterisks denote statistical significance between comparison groups within an individual treatment stage.

97
Appendix G. Conventional morphometric comparison of treatment response by PSO treatment protocol. Boxplot comparison of four conventional morphometric values calculated from landmarked unilateral cleft images and organized by PSO treatment protocol A) Nostril width ratio B) Columellar angle, C) Lateral lip height ratio and D) Columellar length ratio. Black lines within the boxplots demonstrated population medians for each subgroup. Red lines demark a ratio of 1.0 which represents bilateral symmetry. Asterisks denote statistical significance between comparison groups within an individual treatment stage.

98
Appendix H. Conventional morphometric comparison of treatment response by UCSI classification. Boxplot comparison of four conventional morphometric values calculated from landmarked unilateral cleft images and organized by UCSI grading A) Nostril width ratio B) Columellar angle, C) Lateral lip height ratio and D) Columellar length ratio. Black lines within the boxplots demonstrated population medians for each subgroup. Red lines demark a ratio of 1.0 which represents bilateral symmetry. Asterisks denote statistical significance between comparison groups within an individual treatment stage.
Copyright © 2022 FDOKUMEN