Adventure tourism: opportunities and management challenges for SADC destinations

Origins and Destinations – Social Security ClaimantDynamics
M I C H A E L N O B L E * S I N Y I C H E U N G * * G E O RG E S M I T H †
A B S T R AC TThis article briefly reviews American and British literature on welfaredynamics and examines the concepts of welfare dependency and ‘depen-dency culture’ with particular reference to lone parents. Using UK benefitdata sets, the welfare dynamics of lone mothers are examined to explorethe extent to which they inform the debates. Evidence from HousingBenefits data show that even over a relatively short time period, there issignificant turnover in the benefits-dependent lone parent populationwith movement in and out of income support as well as movement intoother family structures. Younger lone parents and owner-occupiers tendto leave the data set while older lone parents and council tenants aremost likely to stay. Some owner-occupier lone parents may be relativelywell off and on income support for a relatively short time between separa-tion and a financial settlement being reached. They may also represent amore highly educated and highly skilled group with easier access to thelabour market than renters. Any policy moves paralleling those in theUnited States to time limit benefit will disproportionately affect older loneparents.
As Walker and Ashworth (1994) forcefully argue, the ‘time dimension’ hasoften been neglected in the analysis of poverty. Cross-sectional data (evenrepeated cross-sectional studies) may easily give the impression of a staticposition, where those in poverty at any one time remain in that positionlong-term. This, in turn, may help to feed the belief in the inevitability oflong-term ‘welfare dependency’. With the increasing availability ofincome panel data, longitudinal cohort studies and the growing use ofadministrative data during the 1980s, a research response (mainly in the
Jnl Soc. Pol., 27, 3, 351–369 Printed in the United Kingdom 351© 1998 Cambridge University Press
AcknowledgementsWe are grateful to the Joseph Rowntree Foundation, which funded this research.* Lecturer, Department of Applied Social Studies and Social Research, University of Oxford** Lecturer, Oxford Brookes University† Research Lecturer, Department of Applied Social Studies and Social Research, University of Oxford

United States) has been to focus on the question of ‘welfare dynamics’,that is the extent to which those on ‘welfare’ (here used in its Americansense as a synonym for the social assistance benefit AFDC – Aid forFamilies with Dependent Children) stay put or move on over time (Baneand Ellwood, 1983, 1994; Ellwood, 1988; Pavetti, 1993).
Two sets of questions underpin this debate: first the apparentlystraightforward descriptive account of length of time on, and movementinto and out of welfare; and second, the main reasons for any such move-ments. The critical policy backdrop to this debate in the United States hasbeen changing social norms, with the growing expectation that lone par-ents should do paid work and that the role of welfare should no longer be(if it ever was) simply to offer income maintenance but to actively encour-age a return to paid work (Waldfogel, 1996; Bane, 1997). This ‘encour-agement’ has taken an increasingly aggressive stance, seen for examplein the imposition of fixed time limits to welfare receipt, first on a state bystate basis between 1992 and 1996 and later nationally through thePersonal Responsibility and Work Opportunity Reconciliation Act 1996. Thelatter reinforces the now time limited nature of ‘welfare’ by replacingAFDC with TANF – ‘Temporary Aid for Needy Families’ – from July 1997.
U S W E L FA R E D Y N A M I C S
There is no question that the US ‘welfare dynamics’ research and debatehas significantly influenced, or at least interacted with, policy develop-ments in the US. While the move to temporary or fixed term ‘safety net’benefits does not necessarily follow from the research findings on welfaredynamics, there is no doubt that they have been used to argue that thosewho stay on welfare beyond a certain point in time (for example, two orfive years) are likely to become long-term dependants, where welfarebecomes ‘a way of life’. Welfare in the US has indeed been changed funda-mentally, and research has in part helped to ease open this Pandora’s box,even if the research argument for time limited protection formed onlypart of a package of much wider reforms (Bane and Ellwood, 1994).
The debate on welfare and ‘welfare dependency’ in Britain has beenheavily influenced by American debate and terminology, as if both the bene-fit structures and the underlying social and economic conditions were effec-tively the same. Rather obviously they are not, though there are enoughsimilarities to make it possible to slide from one set of policy arrangementsto the other, without always seeing the join. But we need to be very sure ofthe findings and more importantly the implications drawn from ‘welfaredynamics’ research, as emphasis on ‘welfare-to-work’ and the possible timelimiting of benefit moves rapidly up the policy agenda in Britain.
352 Michael Noble, Sin Yi Cheung and George Smith

What do the US studies show? Bane and Ellwood (1994) used data fromthe Panel Study of Income Dynamics (PSID), a sample of 5,000 familiesfollowed from 1968 to 1988. The very long-time frame of this studyreduces the problems of measuring incomplete spells (either at start – ‘leftcensored’, or at conclusion – ‘right censored’), a problem for shorter-rangestudies. On the other hand, the study uses annual sampling points andthis has the effect of ‘smoothing out’ the dynamics – underestimating thelevel of exits from and entries to ‘welfare’ (i.e., AFDC).
Their findings are at first sight paradoxical – while more than half of allspells on welfare last less than 2 years and only 14 per cent last 10 yearsor more, 48 per cent of welfare recipients at any particular point in timewill be on for 10 years or more (Bane and Ellwood, 1994). The analogy iswith short and long-stay patients in a hospital, where the former may bemuch more numerous over time but at any one point in time occupy asmall number of beds, while the latter occupy more beds but with littleturnover.
Pavetti (1993) in her work on welfare dynamics made use of theNational Longitudinal Survey of Youth, 1979–89 (NLSY). This containsmonthly rather than annual sampling points. The analysis suggests thatthe effect of using monthly data is to increase substantially the ‘exit prob-abilities’ in the first years. Conversely the returns to welfare are signifi-cantly higher. Similarly, as would be expected, total time on welfare isslightly less for the monthly NSLY data. While 70 per cent of those begin-ning a spell of welfare will be on welfare for a total of 2 years or less, 38per cent of lone mothers on welfare at any point in time will spend over 8years or more on welfare. These data lead Pavetti to conclude that onegroup makes short-term use of welfare and then moves on, anothergroup makes quite frequent exits and entrances (the ‘cyclers’), while athird remains more or less settled on welfare for the period studied.
One of the criticisms made of analysis based on monthly data sweeps isthat the short time frame could overestimate dynamics because of‘administrative churning’ – that is interruptions in receipt of benefitcaused by the administrative system itself, e.g., when there is a delay inprocessing reports of changed circumstances (Pavetti, 1993). However,Blank and Ruggles (1992) using the Survey of Income and ProgramParticipation (SIPP) for 1986 and 1987, which also has monthly sam-pling points, found that factors such as increased earnings lifting theclaimant above the benefit level rather than ‘administrative churning’explained the ‘exits’.
Greenberg (1993) made use of four state based AFDC administrativesets from Washington, California, Vermont and Minnesota. These data
Social Security Claimant Dynamics 353

tend to suggest a similar pattern to the national data with more than 50per cent exiting within 12 months. However where they contain infor-mation about total time on welfare, this tends to show a smaller propor-tion of the total group being on welfare for very long periods than isshown in the national studies. Part of the difference may be the result ofstatistical techniques used to deal with uncompleted spells. BothGreenberg (1993) and Pavetti (1993) draw attention to the effect ofintroducing welfare time limits, pointing out that the research on dynam-ics does not suggest any obvious threshold point beyond which staying onwelfare becomes ‘a way of life’.
AFDC is a benefit for parents, primarily, though not exclusively, loneparents. Bane and Ellwood’s (1994) estimate of the main reasons forceasing to receive this benefit suggests that nearly a third left becausethey married – only 25 per cent left to go into employment. However,other estimates based on monthly rather than annual data show muchhigher exits for work related reasons. Pavetti’s (1993) estimates foryoung women in the NLSY sample give a figure of 46 per cent exiting towork, and just 11 per cent because of changes in family status. Resultsfrom other studies suggest that reasons for exits from welfare differsharply according to the sample, the time period and the age group stud-ied. The methods used to identify reasons may also be important.1.Contrary to the ‘New Right’ view of AFDC recipients being ‘careerclaimants’, most want to enter the labour market and stay there (Pavetti,1993). What stops them is inadequate educational attainment and basicskills, the presence of very young children and where they live (Pavetti,1993); and critically, as Blank (1997) argues, access to secure employ-ment paying well enough to lift them permanently clear of the welfare‘envelope’.
W E L FA R E D Y N A M I C S I N B R I TA I N
Most studies in the US have tended to rely on self-report data obtainedfrom long-term panel surveys. Until the advent of the British HouseholdPanel Survey (BHPS) such data has been scarce in the UK.
Since the first wave of the BHPS in 1991, two types of dynamics studyhave emerged. The first, usually referred to as ‘poverty dynamics’ looks atthe movement in and out of low income and is exemplified by a series ofstudies emerging from the ESRC Research Centre on Micro-social Changeat Essex (Jarvis and Jenkins, 1995, 1996). These studies do not specifi-cally look at receipt of benefit but focus on low income in general. Otherstudies have used BHPS data specifically to look at the dynamics of benefitreceipt (Ashworth and Walker, 1994). There are problems with panel
354 Michael Noble, Sin Yi Cheung and George Smith

data for this kind of analysis, in particular in respect of response and attri-tion bias which may disproportionately affect the marginal groups onlow incomes (see e.g., Taylor, 1994 in respect of the BHPS Survey).
Researchers at the Centre for Research in Social Policy (CRSP) atLoughborough have begun to look at samples of administrative data as abasis for exploring income support dynamics (Ashworth et al., 1995;Shaw et al., 1996). Unlike AFDC, income support is available to a widerrange of people than parents. However, the initial findings broadly reflectthe US literature. Among most groups there is a significant degree ofmovement but with some claimants being recipients for much longerperiods. For lone parents, they find that those in possession of a drivinglicence, those living in an area of low unemployment and those aged over40 are significantly more likely to leave income support while those witha child under 5 are less likely to leave.
T H E D Y N A M I C S O F H O U S I N G B E N E F I T A N D C O U N C I L TA X B E N E F I T
C L A I M A N T S
In this article we present preliminary evidence on British ‘welfare dynam-ics’ using longitudinal administrative data for the entire claimant popula-tion in a particular district. It is not sample data and is not thereforeprone to sampling error. There are no issues of response or attrition bias,though there may be problems of claimants leaving the area – an issue towhich we return later. Though the data contains all types of householdwe concentrate on lone parents. The data allows us to distinguish female-headed and male-headed lone parent households. At any time point 94.5per cent of lone parents are lone mothers. In this article we focus on theorigins and destinations of lone mothers.
The study is based on data from the local authority housingbenefit/council tax benefit (HB/CTB) system of a large town in the northwest of England. We have been extracting HB data from this authority atintervals since 1988. However, there have been some changes in the dataset in the past which make comparisons over time difficult. Thus fromApril 1988 to 31 March 1990 the data represented those in receipt ofhousing benefit for rent and/or housing benefit for general rates. In April1990 the replacement of general rates by the community charge (a localtax) meant that the data set became a housing benefit/community chargebenefit data set. In April 1993, the community charge was replaced bycouncil tax. Since the introduction of council tax we have been taking reg-ular extracts of the data to build up a time series. For administrative rea-sons the extracts are taken in February and July each year. This meansthat we have consistent extracts from July 1993 to July 1996 (seven cuts).
Social Security Claimant Dynamics 355
The HB/CTB data set is very comprehensive.2 It contains full details oflone parents who claim means-tested income support and housing bene-fit – this will include most renters whether in local authority or in othertenures. It will include those in ‘bed and breakfast’ accommodation or inhostels. It also includes owner-occupiers as they have an obligation topay council tax, and, if on income support, will be entitled to council taxbenefit to cover their obligation. Similarly, it will contain details of loneparents who, while not entitled to income support, are in low-paid workor otherwise on a low income and therefore claim either HB or CTB orboth. It will not include lone parents claiming income support who live inother people’s households – for example, with their parents, though froma parallel study in another area we have very strong evidence that thisgroup is very small. There may also be some claimants who have a num-ber of ‘non-dependants’ living with them whose deemed contribution tohousing costs may extinguish their entitlement to HB/CTB. However,comparisons with census data again show that such groups are not likelyto be large.
One of the assumptions about lone parents being part of a ‘dependencyculture’ is that they obtained, by virtue of their status, a ‘fast track’ routeinto council housing (under the Housing Act 1985 Part III) (Young,1993).3 Any lone parents on income support who have obtained accom-modation in this way will appear on the HB/CTB data, as they will havebecome renters.
The data set contains considerable information about claimants. Forexample, it holds the date of birth of claimant, any partner, dependentchildren and non-dependants. It also contains information on incomesources and amounts for those claimants not on income support. There isinformation on tenure, rent payable, HB received and similar informationon council tax liability.
An important feature is that we are able to distinguish lone parentsreceiving income support (denoted ‘IS’) from those also present on thedata set with incomes above income support levels but still low enough toqualify for some housing or council tax benefit (denoted ‘non-IS’ for ‘non-income-support’ cases). This distinction introduces a further refinementinto the notion of ‘welfare dependency’. The original formulation appearsto have its origins in the US where the term ‘welfare dependency’ is usedto characterise ‘habitual’ receipt of AFDC (Murray, 1984; Jencks, 1992).In the British context, welfare or benefit dependency could be translatedas dependence on IS – the nearest equivalent to AFDC. However, statefinancial assistance and therefore ‘dependence’ can be played out in moresubtle ways in Britain. Lone parents on IS may be receiving a small
356 Michael Noble, Sin Yi Cheung and George Smith

amount of benefit as a ‘top up’ to other income, perhaps from part-timeearnings. Such people will not be ‘dependent’ on IS for most of theirincome. Further, there are those not on income support, who still receivemost of their income from the state through other benefits such as inca-pacity and/or disability benefits. Other lone parents in low-paid work willbe receiving state assistance through Family Credit along with HousingBenefit/Council Tax Benefit. In our data, 82 per cent of the ‘non-IS’ groupof low-income lone parents are in fact in low-paid work, while the rest arein receipt of some kind of disability or incapacity benefit.
When commentators and politicians in Britain talk of moving lone par-ents from ‘welfare’ to ‘work’ as a solution to ‘welfare dependency’, theyare usually equating ‘welfare’ with income support, and treating ‘in workbenefits’ (the combination of Family Credit, HB and CTB) as part of amachinery to ease the transition into work – even though for manyclaimants this clutch of means-tested benefits may still represent themajority of their income. The administrative data allow us to explorewhether this latter ‘dependent’ group differs from those who leave thedata set altogether.
The technique we use is ‘tracking forwards and backwards’ to test thestability of the groups on the data sets between two time points. In orderto control for possible seasonal variations, for example in the local labourmarket, we have selected two equivalent time points – July 1993 and July1996. If we consider claimants’ characteristics such as age, numbers ofchildren and housing tenure, we can begin to construct hypotheses aboutthe likelihood of their escape from benefit or, alternatively, entry into orlength of time spent on benefit.
Table 1 shows the numbers of lone mothers on the HB/CTB data set atJuly 1993 and three years later. The picture that emerges is of an increasein overall numbers of just under 10 per cent over the three-year period.However, as noted elsewhere (Noble and Smith, 1996), the apparentlygradual increase obscures the true position. The overall numbers disguisethe turnover of claimants even over this short period. The analysis wehave used hitherto made use of the fact that claims had unique referencenumbers and, at least in the short term, a comparison of claim referencenumbers tells us something about this turnover.4 However, the HB/CTBdata are in fact much more powerful for tracking claimant careers; eachperson on the data set is given a unique ‘person number’ whether s/he bechild or adult, claimant or partner. This is held in a ‘dictionary’ and,according to the local authority, is retained ‘for life’. A person leaving thedata set and re-entering at some time in the future is said to be allocatedthe same reference number. Whether this is, in fact, the case remains to
Social Security Claimant Dynamics 357

be seen. What is clear is that it is possible, over relatively short timescales, to track individuals when their status changes as well as observingthem enter or leave the data set.
We therefore work with a data set which is ‘person’ based rather than‘claim’ based. This enables us to chart individual claiming careers. Thissection of the article reports initial findings from the analysis. We beginby profiling the lone mothers at each time point. We then look at lonemother claimants in July 1996 and track them back to July 1993.Second, we look at lone mother claimants in July 1993 and look at theirwhereabouts on the data set in July 1996. In both cases we can examinethe intermediate time points but these are not reported in this article.
P RO F I L E O F L O N E M O T H E R S , J U L Y 1 9 9 3 A N D J U L Y 1 9 9 6
Table 2 shows the age profiles of the lone mothers at each of the timepoints. In both years the mean age of the IS claimants is lower than thatof their non-IS counterparts. Moreover only 9 per cent of non-IS lonemothers were under 25 whereas between 16 and 21 per cent of ISclaimants were under 25. However the number of teenage claimants inboth groups is very small indeed (and declining for IS claimants).
At both time points IS claimants had 1.9 children on average – slightlymore than the non-IS group (1.7 at both time points). Table 3 shows thedistributions of children:
At both time points a smaller percentage of non-IS lone mothers hadchildren under 5 than those on IS. Thus in 1996, whereas 38 per cent ofthose on IS had at least one child under five only 28 per cent of the non-ISclaimants were in a similar position. This difference is maintained whenwe control for age of the mother.
Because of incomplete data we know little about the economic activityof the non-IS lone mothers in 1993. However, by 1996 much more com-prehensive data was available both on hours worked and earnings; 80per cent of the 1996 non-IS lone mothers were in work. The remainderwas either receiving widows’ benefits or incapacity benefit which tookthem above the IS threshold. Those in paid work were earning £93 aweek on average and working 24 hours a week. Of earner lone mothers,
358 Michael Noble, Sin Yi Cheung and George Smith
TABLE 1. Lone mothers on the HB/CTB data set
On income support On HB/CTB onlyand HB/CTB (IS) (non-IS) Total
July 1993 2,937 984 3,921July 1996 3,123 1,159 4,283

90 per cent were receiving family credit and this amounted, on average,to £59.60 per week in July 1996.
O R I G I N S A N D D E S T I N AT I O N S
Figure 1 shows the origins of the 1996 lone mothers and the destinationsof the 1993 lone mothers. The figure tells a number of stories.
If we take those on IS in 1993, we find that only 1,433 of the lone mothers are still present on the data set as IS claimants – just under 50 percent of the original stock. A further 26 per cent have left the data set alto-gether, 9 per cent have become non-IS lone mothers, while a further 16per cent remain on the data set, but not in lone parent households. The‘optimistic’ hypothesis is that 9 per cent have moved into low-paid workwhile 26 per cent have moved into higher paid jobs/more prosperous rela-tionships. It is possible, however, that some of the latter will have left thestudy area.
What of the 16 per cent who remain on the data set in another capacity?Table 4 shows their destinations in 1996, and illustrates the complexity oftheir ‘dynamics’. The majority (268 – 57 per cent) continue to claim assingle non-pensioners. Most of these remain on IS – their dependent chil-dren have simply ‘grown up’ or gone away; 35 five per cent have acquired
Social Security Claimant Dynamics 359
TABLE 2. Age profile of lone mothers on HB/CTB and income support
Mean age of Claimants Number of Number claimant under 25 % teenage claimants
IS non-IS IS non-IS IS non-IS IS non-IS
July 1993 2,937 984 31.7 34.4 21.1 8.9 62 2July 1996 3,123 1,159 32.5 33.8 16.3 9.0 48 7
TABLE 3. Distribution of children in lone mother families July 1993/July 1996
IS lone mothers non-IS lone mothers% %
1993 1996 1993 1996
One child families 46.5 43.4 54.8 51.3Two children families 32.0 34.0 32.4 35.4Families with three or more children 21.5 22.6 12.8 13.3
n 2,937 3,123 984 1,159

partners. Some have then continued to be the ‘claimant’ while others havebecome partners (of claimants). In 89 cases (55 per cent of those whohave acquired partners) there is a continued claim for IS as a couple withchildren.
As Figure 1 shows, non-IS lone mothers in 1993 have even less stability,with only 28 per cent remaining in the same capacity 3 years on. Thoughthere is a small downward shift to IS – 12 per cent, the majority – 50 percent, leave the data set altogether, perhaps as a result of obtaining betterjobs/higher wages or perhaps by partnering someone not on HB/CTB.
If we look at the ‘inflow’ picture, we find only 46 per cent of the 1996IS lone mothers were in the same position 3 years earlier; 29 per centwere not on the data set at all. Twenty per cent of the inflow, however,comes from people on the data set in 1993 in other capacities than lonemothers; 298 (46 per cent) were single claimants, mostly on income sup-port. A further 254 (39 per cent) were claiming as couples – 78 per centof whom were on income support. The rest were either dependent chil-dren (30) or non-dependants (70) in other people’s households (mostlikely to be their family of origin).
360 Michael Noble, Sin Yi Cheung and George Smith
TABLE 4. Where are they now? Destinations of 1993 IS lone mothers whoremain in receipt of benefit in 1996, but not as lone parents
Income Support?
Status No Yes Total
Claimant Household Single pensioner 25 25type Couple pensioner 1 2 3
Single non-pensioner 34 234 268Couple non-pensioner 2 1 3Couple parent 26 12 38
Total 63 274 337
Partner Household Couple pensioner 4 4type Couple non-pensioner 1 11 12
Couple parent 26 77 103Total 27 92 119
Non-dependant Household Single pensioner 2 2type Single non-pensioner 2 4 6
Couple non-pensioner 2 2Lone parent 2 1 3
Total 4 9 13
Note: household type classified by benefit category: only ‘parent’ categories contain dependentchildren.

‘ J O I N E R S ’ A N D ‘ L E AV E R S ’The overall picture is one of significant movement over the 3 year period.Over this relatively short time period, there is significant turnover even inthe most ‘dependent’ lone mother population – that is, lone mothers onincome support.
The administrative data allows us to examine these movements on andoff welfare in more detail. Thus we can distinguish two types of joiner andleaver – ‘internal’ and ‘external’. Claimants who change their benefit status but remain within the data set are typically moving into or out oflow-paid work. If a lone mother on IS in 1993 is still on the data set in1996, but not in receipt of IS, she will typically have left IS eligibility bymoving into work. But she will still be on the data set because her earn-ings are low enough to enable her to remain eligible for help with herrent and/or council tax. Some lone parents change their benefit statusand their household status. Often the one may be the result of the other.Thus a lone parent on IS in 1993 may appear on the data set as a partnerof a claimant of non-IS housing benefit in 1996, as a result of forming arelationship with someone who is in low-paid work. Those we have
Social Security Claimant Dynamics 361
Not on data
IS(2,937)
nonIS HB/CTB(984)
on datain othercapacity
161553
494
non ISHB/CTB (1,159)
on datain othercapacity (IS+NS)
IS (3,123)
Not on data
Time 7 ( July 1996)Time 1 ( July 1993)
101
469
270
118
1433
765
457
919
271
Figure 1. Lone mother dynamics: July 1993 – July 1996

termed ‘internal’ leavers or joiners in this article have, however, simplychanged their benefit status. They merit further study for the handle theymay give on the transitions into or out of benefit.
Those lone parents on IS in 1993 who have left the data set entirely by1996 also repay further study. Provided they have not left the area, theymay represent lone parents who have obtained better paid jobs and whocannot sustain a claim even to non-IS housing benefit/council tax bene-fit. Alternatively, they may have entered into relationships where theirnew partner is in employment with earnings taking them out of thehousing benefit/council tax benefit envelope. We have termed suchclaimants ‘external’ leavers and their counterparts ‘external’ joiners.
Are external leavers/ joiners likely to have left the area covered by thehousing benefit/council tax data – that is, have they moved from the borough? The housing benefit/council tax benefit data comprise house-holders; migration data for the area in question from the 1991 censusindicates that the migration rate for households with dependent childrenis 6.87 per cent per annum. We further know that 77 per cent of annualhousehold migration for the study area is within borough. The migrationrate out of borough (and thus off the data set) is, therefore, likely to bearound 1.6 per cent per annum. Moreover, although we can only specu-late, it is possible that, for lone parents on means-tested benefits, themigration rate out of borough is even smaller. It is, for example, knownthat migration rates for council tenants are lower than for other tenures,and distances moved are less (Coleman and Salt, 1992). For those owner-occupiers with mortgages, a move out of borough while retaining IS sta-tus is almost impossible as Building Societies will be reluctant to grantnew mortgages to claimants. Put another way, it is highly likely that themajority of external ‘leavers’ (and indeed ‘joiners’) are true exits from andentrants to benefit rather than people simply moving into or out of thearea, without changing their benefit status.
I N T E R N A L J O I N E R S / L E AV E R S
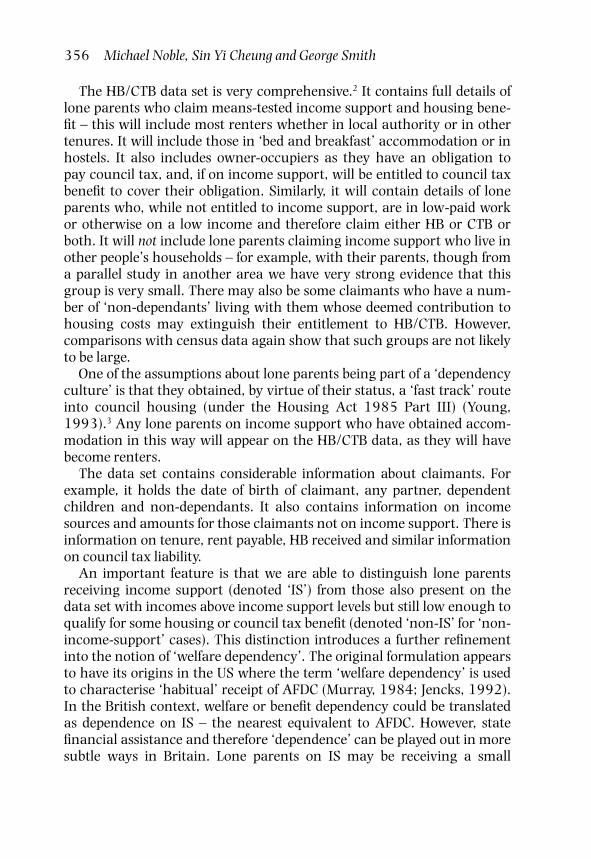
Returning to those who move within the data set at the two time points,we can offer a detailed profile and begin to construct some hypotheses.The data show differences between the groups in terms of age and num-bers of children, and, particularly important, housing tenure.
The mean age of the ‘internal joiners’ is just over 34 years, whereas themean age of the ‘internal leavers’ is 33 years. There are marked tenure dif-ferences between the two groups summarised in Table 5. Owner-occupiersaccount for 20 per cent of the ‘leavers’, but for only 8.5 per cent of the‘joiners’.
362 Michael Noble, Sin Yi Cheung and George Smith
E X T E R N A L J O I N E R S / L E AV E R S
If we consider the ‘external’ leavers and joiners, we find that the meanage of both leavers and joiners is around 31 years (leavers 30.2, joiners30.6).
Both external leavers and joiners have 1.8 children, with 17.6 per centof leavers as compared to 18.5 per cent of joiners having three or morechildren. Both groups have around 50 per cent of their children under 5.The most surprising characteristic of the external joiners is their tenurepattern. Nearly 42 per cent are private tenants compared with 27 percent of external leavers. This may well be due to the increasing tendencyin the study area (as in many other areas) for the local authority to usenomination rights over housing association property (which features as‘private tenancy’ in the data) for new allocations of social housing.
W H O S TAY S – W H O G O E S ?Having described some of the movement patterns, we next examine whichfactors in the data best explain these dynamics. We look at the 1993 ISclaimants to identify the factors which appear to promote or restrict move-ment to non-IS status (i.e., predominantly into low-paid work); and alsothe factors which explain escape from the benefit data set entirely (eitherinto higher paid work or new non-claiming relationships or both).
Using logistic regression we model which lone mothers remain on ISand which leave. If we look at the lone mothers on the data set as ISclaimants in July 1993, examine their characteristics at that time and lookat their position in July 1996 we can create a series of models which incor-porate the following factors: the benefit status of lone mothers in July1996, their age in July 1993, total number of dependent children, havingchildren under the age of 5, tenure and age when they had their first child.
Information on the claimants’ age and the age of their eldest depen-dent child was available in our data. Whilst there may be older childrenwho might have left home, for the younger lone mothers at least, this
Social Security Claimant Dynamics 363
TABLE 5. Tenure of ‘internal leavers’ and ‘internal joiners’
‘Internal joiners’ ‘Internal leavers’% %
Owner-occupier 8.5 20.4Private tenant 28.8 20.4Council tenant 62.7 59.2
Total (n) 100 (118) 100 (270)

would allow us to derive the age of the mother when the first child wasborn. As Figure 2 shows, the average age when they had their first childis 22.9 years; 31 per cent had their first child below the age of 20; andonly 8.4 per cent below 18; though we cannot, from these data, distin-guish teenagers who were married when they had their first child fromthose who were lone mothers at that time. To test the hypothesis that‘once’ teenage mothers were less likely to escape IS than those who hadtheir first child at an older age, we created a binary variable of ‘onceteenage mothers’ (i.e., teenagers when they had their first child) andexamined their chances of leaving IS compared with lone mothers whowere older when they had their first child.
In the following logistic regression analysis, both claimants’ presentage and the number of dependent children are treated as continuousvariables. ‘Once’ teenage mothers and ‘currently having children underfive’ are represented by binary variables. ‘Housing tenure’ consists ofthree categories: owner-occupiers, private tenants and council tenants.The logistic regression findings are presented in two sections: first we lookat the odds of exiting the data entirely as compared to remaining on IS(that is, external leavers); second, we examine the odds of exiting IS tonon-IS lone mother status as against remaining on IS (that is, internalleavers). Those lone parents remaining on the data set in some othercapacity, e.g. as partners in couples, were excluded from these analyses.
364 Michael Noble, Sin Yi Cheung and George Smith
1,200
1,000
800
600
400
200
0
Freq
uen
cy
Age when having first child
15.0 20.0 25.0 30.0 35.0 40.0 45.017.5 22.5 27.5 32.5 37.5 42.5
Std. Dev = 5.52Mean = 22.9N = 2,918
Figure 2. Age of parent when having first child

Table 6 summarises the results for ‘external leavers’. In Model 1 wecontrol for the number of dependent children and the number of childrenunder 5. As expected, the number of dependent children has a negativeeffect on the chance of leaving income support. Having children underthe age of 5, however, is shown to increase the chance of coming offincome support. The addition of tenure in Model 2 suggests that both pri-vate tenants and council tenants are less likely to leave IS in 1996 com-pared with owner-occupiers. In Model 3, we also control for the age oflone parents in July 1993. Current age again is shown to be a significantfactor; the older the lone parent, the less likely it is that she will come offincome support.
It should be noted that the effect of having children under 5 was con-siderably reduced after controlling for claimants’ age. This indicates thathaving children under 5 and claimant’s age are highly correlated. Inother words, younger lone parents have younger children, and they aremore likely to have children under the age of 5. That lone parents withchildren under 5 are apparently more likely to leave IS may simply be areflection of their age, which makes it more likely that they will form newrelationships.
These results can be transformed into ‘odds ratios’. With each year’sincrease in age, the odds of coming off benefit are 0.96:1, indicating agreater likelihood of older lone parents remaining on income support.Although the age effect may appear to be small, this accumulates overthe years. For example, the odds of a 10-year increase in age are 0.66:1.
Social Security Claimant Dynamics 365
TABLE 6. Logistic Regression on exiting data (external leavers) in July 96
Variables Model 1 Model 2 Model 3 Model 4
Constant –.69 (.09) –.17 (.15) .95 (.28) 1.17 (.26)Number of dependent children –.17 (.04) –.17 (.04) –.13 (.04) –.11 (.04)Having children under 5 .33 (.08) .34 (.09) .06 (.11)Tenure:
owner-occupier (base) 1 1 1private tenant –.39 (.15) –.50 (.15) –.49 (.15)council tenant –.68 (.13) –.79 (.14) –.78 (.14)
Age –.03 (.01) –.04 (.01)Teenage mothers –.17 (.11)Model Chi-Square 29.89 (2) 58.77 (4) 81.24 (5) 80.99 (5)
(degrees of freedom)
N 2,573 2,573 2,573 2,556
Figures in parentheses after the parameter estimates give the standard errors. Significant parameterestimates are shown in bold.
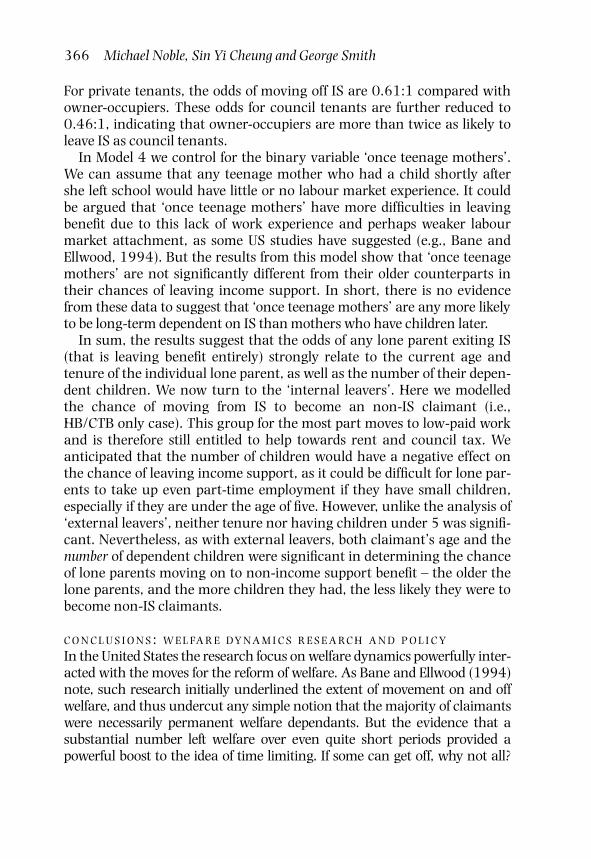
For private tenants, the odds of moving off IS are 0.61:1 compared withowner-occupiers. These odds for council tenants are further reduced to0.46:1, indicating that owner-occupiers are more than twice as likely toleave IS as council tenants.
In Model 4 we control for the binary variable ‘once teenage mothers’.We can assume that any teenage mother who had a child shortly aftershe left school would have little or no labour market experience. It couldbe argued that ‘once teenage mothers’ have more difficulties in leavingbenefit due to this lack of work experience and perhaps weaker labourmarket attachment, as some US studies have suggested (e.g., Bane andEllwood, 1994). But the results from this model show that ‘once teenagemothers’ are not significantly different from their older counterparts intheir chances of leaving income support. In short, there is no evidencefrom these data to suggest that ‘once teenage mothers’ are any more likelyto be long-term dependent on IS than mothers who have children later.
In sum, the results suggest that the odds of any lone parent exiting IS(that is leaving benefit entirely) strongly relate to the current age andtenure of the individual lone parent, as well as the number of their depen-dent children. We now turn to the ‘internal leavers’. Here we modelledthe chance of moving from IS to become an non-IS claimant (i.e.,HB/CTB only case). This group for the most part moves to low-paid workand is therefore still entitled to help towards rent and council tax. Weanticipated that the number of children would have a negative effect onthe chance of leaving income support, as it could be difficult for lone par-ents to take up even part-time employment if they have small children,especially if they are under the age of five. However, unlike the analysis of‘external leavers’, neither tenure nor having children under 5 was signifi-cant. Nevertheless, as with external leavers, both claimant’s age and thenumber of dependent children were significant in determining the chanceof lone parents moving on to non-income support benefit – the older thelone parents, and the more children they had, the less likely they were tobecome non-IS claimants.
C O N C L U S I O N S : W E L FA R E DY N A M I C S R E S E A RC H A N D P O L I C Y
In the United States the research focus on welfare dynamics powerfully inter-acted with the moves for the reform of welfare. As Bane and Ellwood (1994)note, such research initially underlined the extent of movement on and offwelfare, and thus undercut any simple notion that the majority of claimantswere necessarily permanent welfare dependants. But the evidence that asubstantial number left welfare over even quite short periods provided apowerful boost to the idea of time limiting. If some can get off, why not all?
366 Michael Noble, Sin Yi Cheung and George Smith

The 1996 welfare reform legislation in the United States, as Bane (1997)notes, ‘does indeed “end welfare as we know it”. There is no politically feas-ible way of going back to the old structure, with its guarantees of assistanceand the federal regulation of state programs.’
Before introducing such radical shifts in welfare policy in Britain, weneed much more information on welfare dynamics, who stays and whogoes, as well as the major reasons. And we may need to chart a difficultcourse between the simple belief in welfare dependency at one extreme,and at the other, that all can be easily lifted off benefit with the right mixof incentives and pressures.
Thus the preliminary data we have presented here show that thestereotype of the lone parent on IS as a young, perhaps teenage, mother isnot supported – at least for this geographical area. Moreover, even over arelatively short time period, we find that there is significant turnover inthe lone parent population with movement in and out of IS as well asmovement into other family structures. By looking at lone parents whomigrate from being IS claimants of HB/CTB to non-IS claimants and viceversa (‘internal’ leavers and joiners) we can derive a profile of the loneparent who obtains a low-paid job. By examining the ‘external’ leaverswe can describe the lone parent who leaves benefit entirely.
By modelling the benefit statuses of the 1996 lone parents it seemsthat, over the time frame examined, younger lone parents and owner-occupiers will tend to leave the data set while older lone parents
Social Security Claimant Dynamics 367
TABLE 7. Logistic regression on exiting IS to NS (internal leavers) July 1996
Variables Model 1 Model 2 Model 3 Model 4
Constant –1.32 (.12) –1.13 (.20) –.88 (.24) –.02 (.51)Number of dependent children –.15 (.06) –.15 (.06) –.14 (.06) –.14 (.06)Having children under 5 .01 (.12)Tenure:
owner-occupier (base) 1private tenant –.30 (.21)council tenant –.18 (.19)
Age –.01 (.01)* –.01 (.01)Teenage mothers –.08 (.14)
Model Chi-Square 7.78 (2) 9.74 (3) 12.24 (2) 11.16 (3)(degrees of freedom)
N 2,172 2,172 2,172 2,157
Figures in parentheses after the parameter estimates give the standard errors. Significant parameterestimates are shown in bold.* It is significant as the parameter estimate is –.014 with a standard error of .007.

and council tenants are most likely to stay. The data do not contain information to allow investigation into the reasons for this. We can, how-ever, formulate hypotheses for testing by social survey.
It is possible that younger lone parents are less dislocated from thelabour market and find it easier to obtain work than older lone parents.Younger lone parents may also be more likely to obtain partners in workand thus leave the data set altogether. Although migration ‘out of bor-ough’ is very small for lone parents as a whole, it may be that any suchmigration is concentrated among these younger parents.
Some owner-occupier lone parents on IS may be relatively ‘better off ’and on IS for a short time between separation from their partner and afinancial settlement being reached. They also may represent a morehighly educated and highly skilled group with easier access to the labourmarket than renters. To some extent this reflects earlier research. ThusErmisch, Jenkins and Wright (1990) used data from the 1980 BritishWomen and Employment Survey to calculate that for women conceivingtheir first child before marriage and marrying young there was a higherprobability of marital breakdown but also a higher probability of remar-riage; the duration of lone parenthood was comparatively short. Forwomen marrying later in life, the risk of marital breakdown was lower,but the duration of lone parenthood longer. However, that study focuseson ‘entry’ to and ‘exit’ from lone parenthood, in contrast to our focus on‘entry’ and ‘exit’ in relation to work and benefits.
However, the parallel reminds us that the obverse of the younger, possi-bly better-off short stay IS lone parent could be the older less qualified lonemother living in rented property with limited recent contact with the jobmarket and possibly a stronger orientation to family and children. It couldbe this group which would be most affected by any shifts in entitlement tobenefit, time limiting or moves towards ‘workfare’.
N O T E S1 Thus, Bane and Ellwood, and Pavetti use a ‘hierarchy’ of reasons that gives precedence to
changes in marital status, if both work and relationship changes are recorded coincident withexit from welfare.
2 Approximately a quarter of the town’s total population is accounted for by the HB/CTB system,and almost 100 per cent of some groups such as lone parents.
3 This belief led directly to a curtailment of the homelessness provisions in that part of the 1985Act (Housing Act 1996).
4 In the long run analysis based on claim reference numbers can be misleading. When a coupleseparates but both remain on benefit, one of them is given a new claim reference number.Moreover, in time claim reference numbers may be reissued.
368 Michael Noble, Sin Yi Cheung and George Smith

R E F E R E N C E SK. Ashworth and R. Walker (1994), ‘Measuring claimant populations: time fractals and social secu-
rity’, in N. Buck, J. Gershuny, D. Rose and J. Scott (eds.), Changing Households. The BritishHousehold Panel Survey 1990–1992, ESRC Research Centre on Micro-social Change, Colchester.
K. Ashworth, S. Middleton and R. Walker (1995), Income Support Dynamics: Evidence fromAdministrative Data, Centre for Research in Social Policy, Loughborough.
M. J. Bane and D. T. Ellwood (1983), The Dynamics of Dependence: The Routes to Self-Sufficiency Reportto the US Department of Health and Human Services, Urban Systems Research and Engineering,Cambridge, MA.
M. J. Bane and D. T. Ellwood (1994), Welfare Realities: From Rhetoric to Reform. Harvard UniversityPress, Cambridge, MA.
M. J. Bane (1997),’ Welfare as we might know it’, The American Prospect, Jan.–Feb. 30, 47–53.R. Blank and P. Ruggles (1992), Multiple Program Use in a Dynamic Context: Data from the SIPP, The
Urban Institute, Washington DC.R Blank (1997), It Takes a Nation: A New Agenda for Fighting Poverty. Princeton University Press,
Princeton.D. Coleman and J. Salt (1992), The British Population: Patterns Trends and Processes, Oxford
University Press, Oxford.D. T. Ellwood (1988), Poor Support: Poverty in the American Family, Basic Books, New York.J. Ermisch, S. Jenkins and R. E. Wright, (1990), ‘Analysis of the dynamics of lone parenthood: socio-
economic influences on entry and exit rates,’ in E. Duskin (ed.), Lone Parent Families: The EconomicChallenge, Organisation for Economic Co-operation and Development, Paris.
M. Greenberg (1993), Beyond Stereotypes: What State AFDC Studies on Length of Stay Tell Us AboutWelfare as a “Way of Life”, Center for Law and Social Policy, Washington DC.
S. Jarvis and S. Jenkins (1995), Do the Poor Stay Poor? New Evidence about Income Dynamics from theBritish Household Panel Survey, ESRC Research Centre on Micro-social Change, Colchester.
S. Jarvis and S. Jenkins (1996), Changing Places: Income Mobility and Poverty Dynamics in Britain,ESRC Research Centre on Micro-social Change, Colchester.
C. Jencks (1992), Rethinking Social Policy: Race, Poverty, and the Underclass, Harper Perennial, New York.C. Murray (1984), Losing Ground: American Social Policy 1950–1980, Basic Books, New York.M. Noble and G. Smith (1996), ‘Two nations? Changing patterns of income and wealth in two con-
trasting areas, in J. Hills (ed.), New Inequalities Cambridge University Press, Cambridge.L. A. Pavetti (1993), The Dynamics of Welfare and Work: Exploring the Process by which Women Work
their Way Off Welfare, JFK School of Government Harvard University, Cambridge, MA.A. Shaw, R. Walker, K. Ashworth, S. Jenkins and S. Middleton (1996), Moving Off Income Support:
Barriers and Bridges, DSS Research Report No. 53, HMSO, London.B. Taylor (1994), ‘Sample characteristics, attrition and weighting’, in N. Buck, J. Gershuny, D. Rose
and J. Scott (eds.), Changing Households The British Household Panel Survey 1990–1992, ESRCResearch Centre on Micro-social Change, Essex.
J. Waldfogel (1996) What do We Expect Lone Mothers to Do? Competing Agendas for Welfare Reform inthe United States, LSE STICERD, London.
R. Walker with K. Ashworth (1994) Poverty Dynamics: Issues and Examples Avebury, Aldershot.Sir George Young, quoted in The Guardian, 8 October 1993.
Social Security Claimant Dynamics 369
Copyright © 2022 FDOKUMEN