Not only the butterflies: managing ants on road verges to benefit Phengaris (Maculinea) butterflies
Upload
independentCategory
view
1download
0
Molecular Ecology (2012) 21, 3433–3444 doi: 10.1111/j.1365-294X.2012.05613.x
Lack of genetic differentiation between monarchbutterflies with divergent migration destinations
JUSTINE I . LYONS,* 1 AMANDA A. PIERCE,* 1 SETH M. BARRIBEAU,† ELEANORE D.
STERNBERG,* ANDREW J. MONGUE* and JACOBUS C. D E ROODE*
*Department of Biology, 1510 Clifton Road, Atlanta, GA 20322, USA, †Experimental Ecology, Institute of Integrative Biology,
ETH Zurich, Universitatstrasse 16, Zurich 8092, Switzerland
Corresponde
E-mail: jdero1These autho
� 2012 Black
Abstract
Monarch butterflies are best known for their spectacular annual migration from eastern
North America to Mexico. Monarchs also occur in the North American states west of the
Rocky Mountains, from where they fly shorter distances to the California Coast. Whether
eastern and western North American monarchs form one genetic population or are
genetically differentiated remains hotly debated, and resolution of this debate is
essential to understand monarch migration patterns and to protect this iconic insect
species. We studied the genetic structure of North American migratory monarch
populations, as well as nonmigratory populations in Hawaii and New Zealand. Our
results show that eastern and western migratory monarchs form one admixed population
and that monarchs from Hawaii and New Zealand have genetically diverged from North
American butterflies. These findings suggest that eastern and western monarch
butterflies maintain their divergent migrations despite genetic mixing. The finding that
eastern and western monarchs form one genetic population also suggests that the
conservation of overwintering sites in Mexico is crucial for the protection of monarchs in
both eastern and western North America.
Keywords: Columbus hypothesis, conservation, gene flow, microsatellite, migration, monarch
butterfly
Received 8 December 2011; revision received 21 March 2012; accepted 28 March 2012
Introduction
Each year, a wide variety of animals—including mam-
mals, birds, fish and insects—undergo long-distance
seasonal migrations to escape deteriorating habitats, col-
onize new resources and avoid predation, competition
and parasitism (Dingle 1972, 1996; Alerstam et al. 2003;
Alerstam 2006; McKinnon et al. 2010; Altizer et al. 2011;
Fricke et al. 2011). Some of the most spectacular animal
migrations involve the directed movement of millions
of individuals across distances that span whole conti-
nents or hemispheres (Alerstam et al. 2003). Animal
migration has great relevance to species persistence,
ecosystem functioning and conservation biology (Bow-
lin et al. 2010), yet the mechanisms by which animals
nce: Jacobus C. de Roode, Fax: +1-404-727-2880;
[email protected] contributed equally to this work.
well Publishing Ltd
navigate between their seasonal migration sites are still
unclear (Alerstam 2006).
Many migratory species consist of populations that
utilize varying breeding sites and migratory destina-
tions, and such variation may have important conse-
quences for the genetic structuring of these populations
(Haig et al. 1997). On the one hand, divergent migra-
tory pathways and destinations may result in decreased
opportunities for genetic mixing, and hence result in
genetic divergence, which in some cases may result in
speciation. For example, noctule bats—which migrate
between hibernating and nursing sites—are genetically
differentiated with respect to overwintering sites and
migration direction (Petit & Mayer 2000). Similarly,
beluga whales migrate between wintering sites in arctic
pack ice and summering grounds in arctic and subarctic
offshore waters, and genetic analysis has shown consid-
erable levels of genetic differentiation between belugas
using different summering grounds (O’Corry-Crowe

1
EasternNorth America
32
Western NorthAmerica
Hawaii
4 5 6
New Zealand
7
Fig. 1 Map showing the location and migratory patterns of
sampled populations. Numbers represent the sample sites as
follows: 1-St. Marks, FL; 2-Pismo Beach, CA; 3-Santa Barbara,
CA; 4-Kauai, Hawaii; 5-Oahu, Hawaii; 6-Maui, Hawaii; 7-
Christchurch, New Zealand. The eastern North America popu-
lation migrates between eastern North America and its Mexi-
can overwintering site. The western North America population
migrates to the California Pacific Coast and is believed to be
geographically separated from the eastern monarchs by the
Rocky Mountains (indicated in the dashed line). The Hawaii
and New Zealand populations are nonmigratory.
3434 J . I . LYONS E T A L.
et al. 1997). On the other hand, the use of common
breeding or overwintering grounds may result in a lack
of genetic divergence, even when populations experi-
ence different selection pressures during part of their
life. As one example, red-billed quelea birds in southern
Africa undergo long-distance migrations in response to
seasonal patterns of rain fall and grass seed production.
Although different groups of birds move in north-
westerly or south-easterly direction (Dallimer & Jones
2002), there is no genetic differentiation between these
groups, probably because of genetic mixing that occurs
when these birds recolonize the same areas in the fol-
lowing season (Dallimer et al. 2003).
Monarch butterflies (Danaus plexippus) in different
geographic areas have different migration strategies
and thereby provide a suitable system to test the effects
of divergent migration pathways on population differ-
entiation. Monarchs are best known for their autumnal
migration from eastern North America to Mexico; hun-
dreds of millions of monarchs escape freezing tempera-
tures and dying larval food plants in eastern North
America, overwinter in the Oyamel fir forests of the
Mexican Transverse Neovolcanic Range, and then remi-
grate to eastern North America in the spring (Urquhart
1976; Urquhart & Urquhart 1977, 1978; Brower 1995).
Allozyme analyses have indicated that these migrating
monarchs form a large panmictic population, because of
the genetic mixing of butterflies at the Mexican over-
wintering sites (Eanes & Koehn 1978).
Monarch migration has captured the imagination of
thousands of citizens, many of whom have helped to
track the migratory routes that monarchs use on their
way to their Mexican overwintering sites (Urquhart &
Urquhart 1977, 1978; Brower 1995). The exact mecha-
nisms by which eastern North American monarchs nav-
igate to these sites remains a puzzle, although polarized
light and circadian rhythms appear to be involved (Froy
et al. 2003; Reppert et al. 2004; Zhu et al. 2008a,b; Mer-
lin et al. 2009; Zhan et al. 2011).
Monarch butterflies also occur in western North
America (Urquhart & Urquhart 1977; Tuskes & Brower
1978; Brower 1995; Dingle et al. 2005). These monarchs
overwinter in Eucalyptus and Monterey Pine groves
along the Californian Pacific Coast and are believed to
be geographically separated from the eastern monarch
butterflies by the Rocky Mountains (Fig. 1). Owing to
their different overwintering sites, eastern monarchs
may fly up to 2500 km to reach the Mexican Oyamel fir
forests, while western monarchs generally reach the
California Coast by flying <500 km.
Monarch butterfly migration has been the subject of
decades’ worth of research and has inspired large num-
bers of North American citizens. However, it is still
unknown whether the different migratory pathways and
destinations of eastern and western monarchs depend
on—or have resulted in—genetic divergence of these
butterflies, and disagreement on the occurrence and
amount of gene flow is ongoing (Urquhart & Urquhart
1977; Shephard et al. 2002; Brower & Pyle 2004; Mon-
archWatch 2011). In particular, Monarch Watch, an
acclaimed educational outreach and citizen science
research programme proclaims that ‘Contact between
eastern and western Monarchs is minimal suggesting
that there is little exchange, or what scientists call gene
flow, between these populations’ (MonarchWatch 2011).
This belief is widely held (e.g. Zhan et al. 2011), and fed-
eral regulations prohibit the shipment of monarchs
across the continental divide. In contrast, limited genetic
studies and flight observations of monarch butterflies in
Rocky Mountain passes have led some authors to chal-
lenge the claim that eastern and western monarchs form
distinct genetic populations (Urquhart & Urquhart 1977;
Shephard et al. 2002; Brower & Pyle 2004).
Although monarch butterflies are best known for
their North American migration, they also form numer-
ous nonmigratory populations around the world. It is
believed that monarch butterflies have a Central American
origin and recently colonized locations scattered around
� 2012 Blackwell Publishing Ltd

BUTTERFLY MIGRATION AND POPULATI ON ST RUCTURE 3435
the world by cross-Pacific and -Atlantic dispersal fol-
lowing the introduction of larval food plants (Vane-
Wright 1993; Clarke & Zalucki 2004; Zalucki & Clarke
2004). Some locations, including the Hawaiian islands
and New Zealand, were probably colonized as recently
as the last 170 years (Zalucki & Clarke 2004). This rapid
expansion of monarch butterflies to new locations
around the world suggests great dispersal ability, and
also indicates that there may be extensive gene flow
between different populations, including those with
diverging migration destinations.
Here, we set out to determine whether eastern and
western North American butterflies are genetically dif-
ferentiated from each other. This is not only necessary
to elucidate the genetics of monarch migration, but is
also essential for monarch butterfly conservation. Mon-
arch migration has been coined an endangered phe-
nomenon, mostly because of the illegal deforestation of
monarch overwintering sites in Mexico (Brower & Mal-
colm 1991). If eastern and western monarchs indeed
form one genetic population, the protection of Mexican
overwintering sites will not only be crucial for monarch
migration in eastern North America, but also for migra-
tion in western North America (Brower & Pyle 2004).
Materials and methods
Microsatellite development
We developed 17 polymorphic microsatellite markers to
test whether eastern and western North American but-
terflies are genetically differentiated on the basis of
these neutral genetic markers. Polymorphic microsatel-
lite repeats were identified from a monarch expressed
sequence tag database (Zhu et al. 2008a) and Primer 3
(Rozen & Skaletsky 2000) was used to design primers
based on the contigs containing the repeats. Forward
primers were fluorescently labelled on the 5¢ end with
6-FAM or HEX (see Table 1 for primer sequences and
amplification details).
For PCR, genomic DNA was extracted from a 0.5 mm
section of butterfly thorax (female butterflies) or abdo-
men (male butterflies) using the DNeasy Blood and Tis-
sue Kit from Qiagen (Valencia, CA, USA) and
quantified using a Nanodrop 2000. We extracted DNA
from females from the thorax rather than the abdomen
to avoid the possibility of extracting male DNA in
sperm transferred to the female abdomen. PCR was car-
ried out in 15 lL multiplex reactions using the Type-It
Microsatellite PCR kit (Qiagen). Each reaction contained
0.2 lM of each primer and 20–50 ng DNA template.
Thermal cycling reactions for multiplex amplifications
consisted of an initial 5 min at 95 �C, followed by 28
cycles of 30 s at 95 �C, 90 s at the primer-specific
� 2012 Blackwell Publishing Ltd
annealing temperature (see Table 1), and 30 s at 72 �C.
A final step of 30 min at 60 �C was included to com-
plete any partial polymerizations. Amplified DNA was
genotyped on an ABI 3100 genetic analyzer (Perkin
Elmer, Applied Biosystems, Foster City, CA, USA) at
the Cancer Genomics Shared Resource (CGSR; Atlanta,
GA, USA) and alleles were scored using Genemarker
v.4.0 (SoftGenetics LLC., State College, PA, USA).
Monarch butterfly collections
Our main interest was to estimate genetic differentia-
tion between eastern and western North American
monarch butterflies. However, to ensure that our
microsatellite markers are able to detect population
genetic differentiation we included nonmigratory mon-
arch butterflies from Hawaii and New Zealand in our
analysis. Monarch populations in Hawaii and New
Zealand were established within the last 170 years, and
are thought to originate from North America through
trans-Pacific dispersal (Vane-Wright 1993; Zalucki &
Clarke 2004). Therefore, the inclusion of Hawaiian and
New Zealand populations ensures that our markers are
able to detect subtle and newly formed population
structure. We obtained 100 monarch butterflies from
St. Marks, FL (76 in October 2009; 24 in October 2010),
a migration stopover of monarchs on their way to
Mexico (Urquhart & Urquhart 1978). We also collected
100 monarch butterflies from the two biggest Califor-
nian overwintering sites in Pismo Beach (50 in Febru-
ary 2009; 34 February 2010) and Santa Barbara (12 in
November 2009; four in November 2010). Finally, we
obtained 46 butterflies from nonmigratory populations
in Hawaii (15, 15 and 16 from Oahu, Kauai and Maui
respectively in November 2009) and 16 nonmigratory
butterflies from New Zealand (Christchurch, January
2011).
Microsatellite analyses
We determined the genotype of each of the 262 butter-
flies at each of the 17 microsatellite loci. We then used
the software Arlequin 3.5.1.2 (Excoffier & Lischer 2010)
to calculate observed and expected heterozygosity at
each microsatellite locus in each of four monarch popu-
lations: eastern North America, western North America,
Hawaii and New Zealand (thus grouping sites in
western North America and Hawaii). We also used Ar-
lequin to calculate deviations from Hardy–Weinberg
equilibrium for each locus in each population (a total of
68 statistical tests), and used a sequential Bonferroni
correction (Rice 1989) to determine whether observed
and expected heterozygosity levels were significantly
different (a = 0.05). As shown in the results and
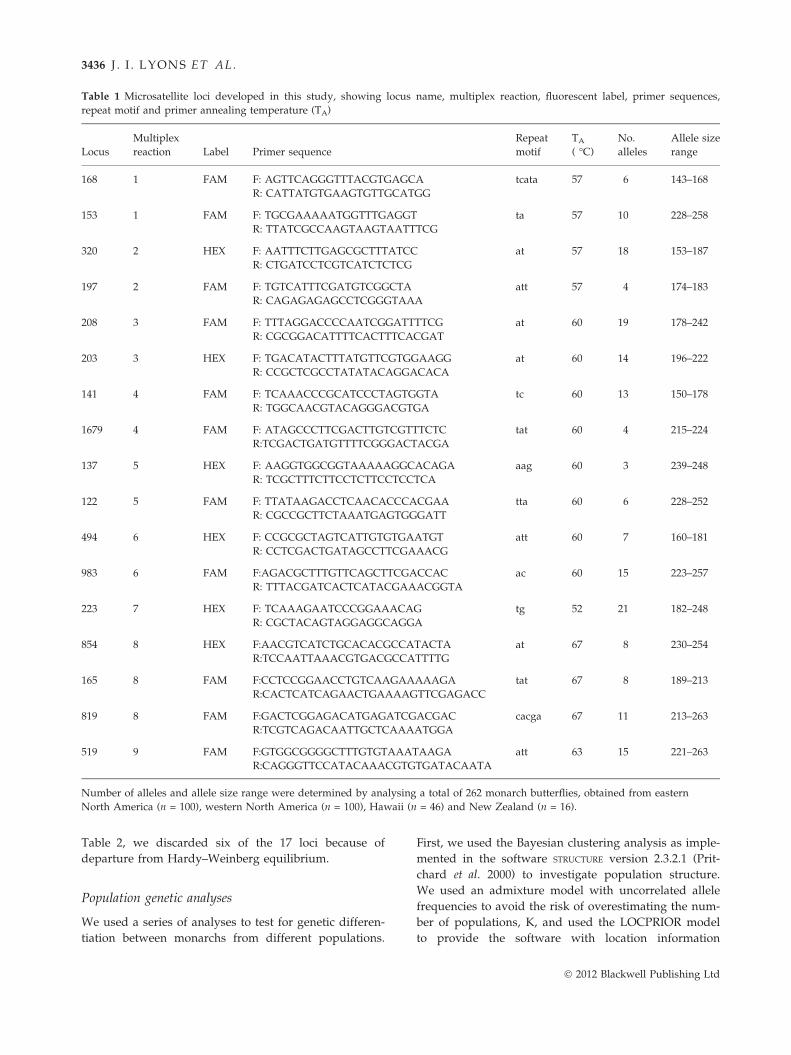
Table 1 Microsatellite loci developed in this study, showing locus name, multiplex reaction, fluorescent label, primer sequences,
repeat motif and primer annealing temperature (TA)
Locus
Multiplex
reaction Label Primer sequence
Repeat
motif
TA
( �C)
No.
alleles
Allele size
range
168 1 FAM F: AGTTCAGGGTTTACGTGAGCA
R: CATTATGTGAAGTGTTGCATGG
tcata 57 6 143–168
153 1 FAM F: TGCGAAAAATGGTTTGAGGT
R: TTATCGCCAAGTAAGTAATTTCG
ta 57 10 228–258
320 2 HEX F: AATTTCTTGAGCGCTTTATCC
R: CTGATCCTCGTCATCTCTCG
at 57 18 153–187
197 2 FAM F: TGTCATTTCGATGTCGGCTA
R: CAGAGAGAGCCTCGGGTAAA
att 57 4 174–183
208 3 FAM F: TTTAGGACCCCAATCGGATTTTCG
R: CGCGGACATTTTCACTTTCACGAT
at 60 19 178–242
203 3 HEX F: TGACATACTTTATGTTCGTGGAAGG
R: CCGCTCGCCTATATACAGGACACA
at 60 14 196–222
141 4 FAM F: TCAAACCCGCATCCCTAGTGGTA
R: TGGCAACGTACAGGGACGTGA
tc 60 13 150–178
1679 4 FAM F: ATAGCCCTTCGACTTGTCGTTTCTC
R:TCGACTGATGTTTTCGGGACTACGA
tat 60 4 215–224
137 5 HEX F: AAGGTGGCGGTAAAAAGGCACAGA
R: TCGCTTTCTTCCTCTTCCTCCTCA
aag 60 3 239–248
122 5 FAM F: TTATAAGACCTCAACACCCACGAA
R: CGCCGCTTCTAAATGAGTGGGATT
tta 60 6 228–252
494 6 HEX F: CCGCGCTAGTCATTGTGTGAATGT
R: CCTCGACTGATAGCCTTCGAAACG
att 60 7 160–181
983 6 FAM F:AGACGCTTTGTTCAGCTTCGACCAC
R: TTTACGATCACTCATACGAAACGGTA
ac 60 15 223–257
223 7 HEX F: TCAAAGAATCCCGGAAACAG
R: CGCTACAGTAGGAGGCAGGA
tg 52 21 182–248
854 8 HEX F:AACGTCATCTGCACACGCCATACTA
R:TCCAATTAAACGTGACGCCATTTTG
at 67 8 230–254
165 8 FAM F:CCTCCGGAACCTGTCAAGAAAAAGA
R:CACTCATCAGAACTGAAAAGTTCGAGACC
tat 67 8 189–213
819 8 FAM F:GACTCGGAGACATGAGATCGACGAC
R:TCGTCAGACAATTGCTCAAAATGGA
cacga 67 11 213–263
519 9 FAM F:GTGGCGGGGCTTTGTGTAAATAAGA
R:CAGGGTTCCATACAAACGTGTGATACAATA
att 63 15 221–263
Number of alleles and allele size range were determined by analysing a total of 262 monarch butterflies, obtained from eastern
North America (n = 100), western North America (n = 100), Hawaii (n = 46) and New Zealand (n = 16).
3436 J . I . LYONS E T A L.
Table 2, we discarded six of the 17 loci because of
departure from Hardy–Weinberg equilibrium.
Population genetic analyses
We used a series of analyses to test for genetic differen-
tiation between monarchs from different populations.
First, we used the Bayesian clustering analysis as imple-
mented in the software STRUCTURE version 2.3.2.1 (Prit-
chard et al. 2000) to investigate population structure.
We used an admixture model with uncorrelated allele
frequencies to avoid the risk of overestimating the num-
ber of populations, K, and used the LOCPRIOR model
to provide the software with location information
� 2012 Blackwell Publishing Ltd

Table 2 Observed (Ho) and expected (He) heterozygosity at
each locus within each of four populations, as determined by
analyses in Arlequin 3.5.1.2 (Excoffier & Lischer 2010)
Locus
Eastern
North
America
Western
North
America Hawaii
New
Zealand
Ho He Ho He Ho He Ho He
168 0.74 0.64 0.64 0.60 0.72 0.59 0.19 0.18
153 0.56 0.67 0.57 0.68 0.52 0.66* 0.44 0.42
320 0.58 0.88* 0.63 0.88* 0.78 0.75 0.13 0.13
197 0.28 0.36 0.33 0.37 0.46 0.42 0.50 0.39
208 0.55 0.76* 0.36 0.76* 0.26 0.65* 0.44 0.46
203 0.67 0.78 0.78 0.82 0.48 0.65 0.63 0.53
141 0.50 0.63 0.53 0.70 0.65 0.63 0.31 0.37
1679 0.51 0.61 0.41 0.63* 0.43 0.56 0.31 0.51
137 — — 0.05 0.05 — — — —
122 0.02 0.04 0.01 0.03 0.30 0.27 — —
494 0.29 0.28 0.32 0.32 — — — —
983 0.49 0.77* 0.34 0.79* 0.33 0.50 0.31 0.61
223 0.27 0.88* 0.37 0.81* 0.14 0.66* 0.07 0.54*
854 0.30 0.59* 0.35 0.59* 0.37 0.66* 0.31 0.28
165 0.36 0.56* 0.18 0.48* 0.17 0.51* 0.38 0.51
819 0.79 0.85 0.77 0.83 0.63 0.66 0.69 0.66
519 0.83 0.80 0.84 0.80 0.65 0.67 0.81 0.68
Loci for which observed and expected hererozygosities are
significantly different are indicated with asterisks; significance
was determined using an a of 0.05 and a sequential Bonferroni
correction (Rice 1989). Loci for which at least three populations
were in Hardy–Weinberg equilibrium were used for
subsequent analyses and are indicated in grey shading. Dashes
indicate monomorphic loci.
BUTTERFLY MIGRATION AND POPULATI ON ST RUCTURE 3437
(eastern North America, western North America,
Hawaii and New Zealand) for each butterfly. We did
the latter to ensure that STRUCTURE would be able to
detect subtle population structure. We started simula-
tions with K = 7, to reflect the seven sample locations
(Fig. 1), and then ran simulations for K values of 6, 5,
4, 3, 2 and 1. For each K, we ran multiple simulations
to check for consistency between runs, using 100 000
burn-ins and 200 000 MCMC runs after burn-in. We
then used log likelihood (Pritchard et al. 2000) and
delta K (Evanno et al. 2005) to determine the most
likely number of genetic populations present.
We also used FST and RST statistics (Holsinger & Weir
2009) to measure genetic differentiation between
monarch populations. These statistics are frequently
used to measure genetic differentiation, with levels of 0
indicating that individuals belong to the same panmic-
tic population, and values higher than 0 indicating
genetic differentiation. RST was developed as a more
suitable statistic for microsatellite markers, based on its
dependence on a stepwise mutation model (Slatkin
1995) instead of the infinite alleles model that underlies
� 2012 Blackwell Publishing Ltd
FST statistics (Balloux & Lugon-Moulin 2002). However,
because neither of these mutation models perfectly
reflect natural mutation rates of microsatellites, studies
on microsatellites often report both measures (Balloux
& Lugon-Moulin 2002), and we followed this practice.
We calculated pairwise FST and RST values between the
four populations using the software Genepop version
4.1.0 (Rousset 2008), using the 11 microsatellite markers
that were in Hardy–Weinberg in at least three out of
four populations (see results and Table 2). To ensure
that our estimates were not affected by the potential
occurrence of null alleles, we recalculated FST and RST
values using corrected allele frequencies as determined
by the software MICROCHECKER, version 2.2.3 (Van Oo-
sterhout et al. 2004). Overall, statistics based on cor-
rected and uncorrected allele frequencies were almost
identical (see results), and resulted in identical conclu-
sions.
Permutation tests (using 10 000 permutations), as
implemented in the ‘Population comparisons’ calcula-
tions in Arlequin 3.5.1.2 (Excoffier & Lischer 2010) were
used to determine significance of pairwise FST and RST
values (uncorrected values were used). We also used
FST and RST values to determine whether populations
that are separated by greater geographic distances are
genetically more differentiated (isolation by distance).
We analysed the correlation between geographic dis-
tance and measures of genetic differentiation using
Mantel tests implemented in the vegan library (version
2.0-2) in the statistical package R (version 2.13.0). We
ran Mantel tests on both corrected and uncorrected FST
and RST measures, using 10 000 permutations.
To compare relative levels of genetic diversity
between populations, we calculated genetic diversity
(using the value 1-Qinter) and allelic richness in each
population using Genepop version 4.1.0 (Rousset 2008).
Furthermore, to understand the relative magnitude of
within- and between-population genetic diversity, we
carried out a locus by locus analysis of molecular vari-
ance (Excoffier et al. 1992) using Arlequin 3.5.1.2 (Excof-
fier & Lischer 2010). In this analysis, we combined
eastern and western North American populations to
compare genetic variation among geographic groups
(North America vs. Hawaii vs. New Zealand), and com-
pared this to the variation among populations within
groups (i.e. variation among eastern and western North
America) as well as genetic variation within popula-
tions (i.e. variation within eastern North America,
western North America, Hawaii and New Zealand). We
again used 10 000 permutations.
Finally, we used the computer software POWSIM 4.1
(Ryman & Palm 2006) to determine the statistical power
with which significant genetic differentiation could be
determined using our microsatellite markers and

Table 3 Pairwise FST and RST values
between the four studied monarch but-
terfly populations, as calculated in
Genepop version 4.1.0 (Rousset 2008)
Western North
America
Hawaii New Zealand
Eastern North
America
FST: 0.0012 (0.0009)
RST: )0.003 ()0.0006)
FST: 0.0401 (0.0388)*
RST: 0.0662 (0.0607)*
FST: 0.1858 (0.1856)*
RST: 0.1810 (0.1789)*
Western North
America
FST: 0.0456 (0.0435)*
RST: 0.0557 (0.0511)*
FST: 0.1753 (0.1745)*
RST: 0.1787 (0.1790)*
Hawaii FST: 0.1750 (0.1714)*
RST: 0.0873 (0.0861)*
Values in parentheses are based on corrected allele and genotypes frequencies as
determined by the software MICRO-CHECKER, version 2.2.3 (Van Oosterhout et al. 2004).
Asterisks denote values that are significantly different from 0. The values of pairwise
differentiation between eastern and western North America are not significantly different
from 0 (P = 0.20 for FST; P = 0.43 for RST).
3438 J . I . LYONS E T A L.
observed allele frequencies. We restricted these analyses
to eastern and western North America only (as these
were the only populations between which we did not
detect genetic differentiation; see results), and simulated
the sampling of 100 individuals into two populations
based on a random drawing of alleles that occurred at
the observed overall frequency in eastern and western
North America (as determined by MICROCHECKER-cor-
rected allele frequencies). Simulations were carried out
using a series of dictated FST values, and 60–200 runs
for each value. Statistical power was then determined
as the proportion of simulations for which Fisher’s
exact and Chi-square tests showed a significant
deviation from 0 (i.e. significant genetic differentiation).
Note that this software is set up for power calculations
on the basis of FST values only, so we were not able to
calculate power on the basis of RST values. However,
because FST and RST values were very similar in our
study (see Table 3), and because FST calculations pro-
vided slightly higher estimates of eastern–western
genetic differentiation than did RST calculations (see
Table 3), the power calculations on the basis of FST val-
ues provide a conservative estimate of power to detect
Pro
port
ion/
popu
latio
n
0.0
0.2
0.4
0.6
0.8
1.0
Eastern North America Wes
Fig. 2 Inferred genetic proportion of individual butterflies to each o
populations to reflect the seven sample locations (Fig. 1A). Bayesian
ern–western North America (indicated in red), Hawaii (orange) and
by vertical bars.
genetic differentiation using our genetic markers and
sample sizes.
Results
A total of six out of 17 loci were out of Hardy–
Weinberg equilibrium in at least two of the four popu-
lations, and we excluded these loci from subsequent
analyses (see Table 2 for details). Of the remaining 11
loci, nine were in Hardy–Weinberg equilibrium in all
populations, and two were in Hardy–Weinberg equilib-
rium in three out of four populations.
Clustering analyses in STRUCTURE suggested that
our monarch butterflies most likely form three geneti-
cally distinct populations: eastern + western North
America, Hawaii, and New Zealand (Figs 2 and S1,
Supporting information). Thus, we found no significant
genetic differentiation between eastern and western
North American butterflies. Additionally, neither the
Hawaiian Islands nor the two Californian overwintering
sites are genetically distinguishable. This lack of genetic
structure is unlikely to be an artefact of our microsatel-
lite markers because these markers clearly pick up the
tern North America Hawaii NZ
f three genetic populations. Analyses were started with seven
analysis suggests that there are three genetic populations: east-
New Zealand (NZ; yellow). Individual monarchs are indicated
� 2012 Blackwell Publishing Ltd

BUTTERFLY MIGRATION AND POPULATI ON ST RUCTURE 3439
genetic differentiation of Hawaiian and New Zealand
monarchs from each other and from North American
monarchs (Fig. 2). Our results are unaltered when
excluding the populations for which two of the 11 loci
are out of Hardy–Weinberg equilibrium (Fig. S2, Sup-
porting information).
We confirmed our results by calculating genetic dif-
ferentiation using FST and RST statistics. We first calcu-
lated pairwise genetic differentiation using the same 11
loci that we used for genetic structure analysis using
Genepop version 4.1.0 (Rousset 2008). We then calcu-
lated pairwise FST and RST values based on corrected
genotype and allele frequencies as obtained by the soft-
ware MICROCHECKER (Van Oosterhout et al. 2004). For
both uncorrected and corrected allele frequencies, both
FST and RST values were much lower for the compari-
son between eastern and western North America than
for any of the other comparisons (Table 3). Indeed,
population comparison calculations in Arlequin (Excof-
fier & Lischer 2010) suggest that the low FST and RST val-
ues calculated for the eastern–western North American
0.00
0.05
0.10
0.15
0.20
Geographic distance (1000 km)
FS
T
(A)
Western−Hawaii
Eastern−Western
Eastern−Hawaii
Hawaii−NZ
Western−NZ
Eastern−NZ
2 4 6 8 10 12 14
(B
Fig. 3 Isolation by distance. There is a strong pattern of isolation by
genetic distance, whether based on FST (panel A: r = 0.85, P = 0.040)
corrected FST and RST values. Similar results were obtained for uncorr
0.2
0.3
0.4
0.5
0.6
0.7
Gen
etic
div
ersi
ty
Easte
rn
Wes
tern
Hawaii NZ
(A)
Fig. 4 Measures of genetic diversity for eastern North America, west
(A) Genetic diversity (using the value 1-Qinter, the interindividual di
North America and tended to decrease with increasing distance from
western North America and significantly lower in New Zealand. Erro
� 2012 Blackwell Publishing Ltd
comparison are not significantly different from 0, sug-
gesting a lack of genetic differentiation between these
populations (Table 3). In contrast, our analyses suggest
that all other pairwise FST and RST values are signifi-
cantly different from 0, suggesting significant genetic
differentiation between monarchs in North America,
Hawaii and New Zealand (Table 3). Moreover, butter-
flies were more differentiated from each other when
they were farther apart geographically (Fig. 3), suggest-
ing that greater geographic distances reduce levels of
gene flow.
To study genetic diversity within and between popu-
lations, we first used the 11 microsatellite loci to calcu-
late genetic diversity (using the value 1-Qinter) and
allelic richness in each population using Genepop ver-
sion 4.1.0 (Rousset 2008). Levels of genetic diversity
were similar in eastern (0.515) and western (0.535)
North America and were slightly lower in Hawaii
(0.464) and New Zealand (0.339; Fig. 4A); however,
although genetic diversity appeared to be lower in New
Zealand than in the other populations, this was margin-
RST
2 4 6 8 10 12 14
0.00
0.05
0.10
0.15
0.20
Geographic distance (1000 km)
)
Western−Hawaii
Eastern−Western
Eastern−Hawaii
Hawaii−NZ
Western−NZ
Eastern−NZ
distance demonstrated by a correlation between geographic and
or RST (panel B: r = 0.95, P = 0.039). Note that the graphs show
ected values (FST: r = 0.85, P = 0.042; RST: r = 0.95, P = 0.037).
2
3
4
5
6
Alle
lic r
ichn
ess
Easte
rn
Wes
tern
Hawaii NZ
(B)
ern North America, Hawaii, and New Zealand (NZ) monarchs.
versity within populations) was highest in eastern and western
North America. (B) Allelic richness was highest in eastern and
r bars show ±1 SE across 11 loci.

Table 4 Results of analysis of molecular variance (AMOVA) comparing samples from four populations (eastern North America, wes-
tern North America, Hawaii and New Zealand)
Source of variation d.f. Sum of squares
Variance
components
Percentage
variation P-value
Among groups 2 57.95 (5386) 0.257 (24.41) 8.52 (9.33) 0.00000 (0.00000)*
Among populations within groups 1 3.835 (257) 0.0054 (0.09767) 0.18 (0.037) 0.21017 (0.44379)
Among individuals within populations 520 1434.9 (123360) 2.759 (237.23) 91.31 (90.64) 0.00000 (0.00098)*
Total 523 1496.7 (129002) 3.022 (261.74) 100 (100)
In this analysis, eastern and western North America were grouped into the same group (North America) while Hawaii and New
Zealand formed their own groups. The analysis was carried out based on FST and RST values; results for the latter are shown in
parentheses. Significant P-values, as based on permutation tests in Arlequin 3.5.1.2 (Excoffier & Lischer 2010), are indicated with
asterisks.
3440 J . I . LYONS E T A L.
ally nonsignificant (F1,42 = 3.10, P = 0.085). Allelic rich-
ness showed a similar and significant pattern, being
highest—and similar—in eastern and western North
America, and significantly lower in New Zealand
(Fig. 4B; F3,40 = 3.19, P = 0.034). Our results thus
showed similar levels of genetic diversity in eastern
and western North America, and a clear trend of
decreasing genetic diversity and allelic richness with
increasing distance from North America (Fig. 4A, B).
This is consistent with the hypothesis that monarch but-
terflies colonized the Pacific Ocean in a stepwise fashion
from an origin in North America (Vane-Wright 1993).
Analysis of molecular variance (AMOVA) further con-
firmed a lack of genetic differentiation between eastern
and western North America (Table 4). In particular,
although a significant amount of genetic variation
(8.52% and 9.33% for FST- and RST-based calculations,
respectively) was explained by different groups
(i.e. genetic variation between North America, Hawaii
and New Zealand), a mere and nonsignificant amount
of variation (0.18% and 0.037% for FST- and RST-based
calculations, respectively) was explained by the North
American east–west division (Table 4). This result was
0.0
0.2
0.4
0.6
0.8
1.0
FST
Sta
tistic
al p
ower
0.00 0.01 0.02 0.03 0.04 0.05
(A) (B
Fig. 5 Statistical power to detect significant population genetic differ
as the proportion of POWSIM 4.1 (Ryman & Palm 2006) simulations for
nificant deviation from 0 (i.e. significant genetic differentiation). Verti
detected with more than 80% probability.
confirmed when carrying out an analysis of molecular
variance on the North American populations only,
which again showed that only a minimal amount of
variation was explained by the North American east–
west division (0.17% and 0.023% for FST- and RST-based
calculations, respectively).
Finally, power calculations using the software POWSIM
(Ryman & Palm 2006) suggest that our microsatellite
markers and sample sizes (100 butterflies from both
eastern and western North America) have sufficient sta-
tistical power to detect significant population differenti-
ation on the basis of FST values as low as 0.0025
(Fig. 5). Thus, the lack of genetic differentiation
between eastern and western North American butter-
flies is unlikely to be the result of inadequate molecular
markers or sample sizes, and is more likely to reflect
genetic mixing between these butterflies.
Discussion
Our analyses suggest that eastern and western North
American monarch butterflies form one panmictic pop-
ulation. These results are surprising, because these
FST
0.00 0.01 0.02 0.03 0.04 0.05
0.0
0.2
0.4
0.6
0.8
1.0
Sta
tistic
al p
ower
)
entiation as a function of FST. Statistical power was determined
which Fisher’s exact (A) and Chi-square tests (B) showed a sig-
cal dashed lines indicate that FST values as low as 0.0025 can be
� 2012 Blackwell Publishing Ltd

BUTTERFLY MIGRATION AND POPULATI ON ST RUCTURE 3441
monarchs inhabit different areas of North America,
migrate varying distances, and overwinter at different
sites in Mexico and along the Pacific Coast, respectively.
Our results suggest that North American monarchs
form an admixed population, and that eastern and
western migratory pathways are maintained despite
genetic panmixia. These results suggest that migratory
differences do not require—or result in—substantial
genome-wide genetic differentiation as picked up by
neutral genetic markers and may instead be driven by
two alternative mechanisms.
First, despite a lack of genetic differentiation of neu-
tral genetic markers, eastern and western monarchs
may show genetic divergence of particular genes that
are involved in migration and that are under strong
selection. Such a scenario was suggested for European
willow warblers, which occur as populations that either
migrate from northern Scandinavia to eastern and
southern Africa or from southern Scandinavia to
western Africa: despite morphological divergence, these
birds did not display divergence of mitochondrial and
microsatellite DNA (Bensch et al. 1999). Second, diver-
gent migration may not be subject to genetic differentia-
tion, but may instead be based on differential gene
expression based on varying and seasonally changing
environmental conditions (Liedvogel et al. 2011). Such a
scenario has been suggested for North American popu-
lations of Mexican free-tailed bats, which are not geneti-
cally differentiated despite their varying migration
routes and overwintering sites in Mexico (Russell et al.
2005). The recently sequenced genome of the monarch
butterfly (Zhan et al. 2011) will be a valuable source for
testing these alternative hypotheses. In particular, rese-
quencing the genomes of migratory and nonmigratory
butterflies will allow for the identification of genomic
regions that are associated with migratory behaviours
and for the detection of differences in these regions
between eastern and western North American butter-
flies. In addition, next-generation sequencing of the
transcriptome of eastern and western migratory butter-
flies may reveal differential expression of genes result-
ing in divergent migrations; such an approach has
already revealed differential expression of genes in
breeding and migratory monarchs in eastern North
American monarchs (Zhu et al. 2008a,b, 2009).
Although our results did not show genetic differentia-
tion between eastern and western North American but-
terflies, we found that Hawaiian and New Zealand
monarch butterflies are differentiated from North
American butterflies. Our data suggest a decrease in
genetic diversity and allelic richness with increasing
distance from North America, which is consistent with
the hypothesis that monarch butterflies colonized the
Pacific Ocean from an origin in North America (Vane-
� 2012 Blackwell Publishing Ltd
Wright 1993; Shephard et al. 2002; Zalucki & Clarke
2004). Our results on genetic differentiation and isola-
tion-by-distance then suggest that long-distance dis-
persal of monarch butterflies is followed by a loss of
connectivity from the source population.
Until now, the question of genetic mixing of eastern
and western North American butterflies had been unre-
solved, partly because of low levels of polymorphism of
genetic markers in previous studies (Brower & Boyce
1991; Brower & Jeansonne 2004). However, the lack of
genetic differentiation between eastern and western
monarchs are consistent with a study on allozymes
(Shephard et al. 2002) as well as a series of observa-
tional studies (Brower & Pyle 2004). In particular,
western monarchs have been observed to fly in south-
easterly directions and to follow migratory pathways
that are—when extrapolated—consistent with overwin-
tering sites in Mexico (Dingle et al. 2005). Moreover,
population sizes of overwintering western and eastern
monarchs are generally correlated (Vandenbosch 2007).
Finally, an overabundance of remigrating western mon-
archs and a lack of eastern spring remigrants in 1996
coincided with a westward shift of spring wind pat-
terns and a corresponding shift of the northward spring
migration of song birds (Brower & Pyle 2004), suggest-
ing that eastern and western monarchs do at least occa-
sionally intermix.
Genetic mixing of eastern and western monarch pop-
ulations does not invalidate the claim that eastern and
western monarchs are subject to different selection pres-
sures (Brower et al. 1995; Altizer & Davis 2010; Altizer
et al. 2011). Although our results suggest that eastern
and western butterflies form one panmictic population,
genetic exchange is probably subject to strong seasonali-
ty, occurring during the overwintering and spring remi-
gration of these butterflies. This exchange is followed
by a long breeding season during which there may be
ample opportunity for natural selection to favour those
genotypes that best suit eastern and western habitats
(Dingle 1972; Altizer & Davis 2010). For example, east-
ern and western North American butterflies have diver-
gent wing morphology, which is likely the result of
differential selection (Altizer & Davis 2010). Moreover,
strong selection may favour different genotypes at
important genetic loci that go undetected with
approaches based on neutral markers such as microsat-
ellites (Bensch et al. 1999; Liedvogel et al. 2011). Until
such differential selection is better understood, our
results do not warrant a relaxation of the current regu-
lations to restrict the human-facilitated movements of
eastern and western monarchs (Brower et al. 1995). In
addition, previous work has shown that western butter-
flies are subject to more virulent protozoan parasites
than eastern butterflies (De Roode et al. 2008; De Roode

3442 J . I . LYONS E T A L.
& Altizer 2010). Thus, even if eastern and western mon-
arch butterflies are genetically similar across their full
genome, cross-continental shipments of monarchs may
result in the unwanted transfer of virulent parasites
(Brower et al. 1995).
Our findings have strong relevance to the conserva-
tion of the spectacular migration of monarch butterflies.
Monarch butterfly migration is at risk (Brower & Mal-
colm 1991), partly because of the illegal deforestation of
Mexican monarch butterfly overwintering sites. It is
well known that there are many more butterflies in
eastern than western North America, and it has been
suggested that the western subpopulation requires
influxes from eastern North America for its survival
(Brower & Pyle 2004). Our results support this hypothe-
sis, by suggesting that eastern and western monarchs
form one genetic population. As such, the conservation
of Mexican overwintering sites may be essential not
only to protect eastern monarch migration, but also to
conserve monarchs and their migration in western
North America.
Acknowledgements
We thank B. Ballister, D. Cook, D. Frey and R. Rarick for help
with monarch butterfly collections, the De Roode lab, S. Altiz-
er, A. Brower, E. Caldera and N. Gerardo for helpful com-
ments and R. Gillespie as well as three anonymous reviewers
for their helpful and constructive comments to improve this
manuscript. This work was supported by NSF grant DEB-
1019746 to JCdR and an Emory SIRE grant to AM.
References
Alerstam T (2006) Conflicting evidence about long-distance
animal navigation. Science, 313, 791–794.
Alerstam T, Hedenstrom A, Akesson S (2003) Long-distance
migration: evolution and determinants. Oikos, 103, 247–260.
Altizer S, Davis AK (2010) Populations of monarch butterflies
with different migratory behaviors show divergence in wing
morphology. Evolution, 64, 1018–1028.
Altizer S, Bartel R, Han BA (2011) Animal migration and
infectious disease risk. Science, 331, 296–302.
Balloux F, Lugon-Moulin N (2002) The estimation of
population differentiation with microsatellite markers.
Molecular Ecology, 11, 155–165.
Bensch S, Andersson T, Akesson S (1999) Morphological and
molecular variation across a migratory divide in
willow warblers, Phylloscopus trochilus. Evolution, 53, 1925–1935.
Bowlin MS, Bisson IA, Shamoun-Baranes J et al. (2010) Grand
challenges in migration biology. Integrative and Comparative
Biology, 50, 261–279.
Brower LP (1995) Understanding and misunderstanding the
migration of the monarch butterfly (Nymphalidae) in North
America: 1857–1995. Journal of the Lepidopterists’ Society, 49,
304–385.
Brower AVZ, Boyce TM (1991) Mitochondrial DNA variation
in monarch butterflies. Evolution, 45, 1281–1286.
Brower AVZ, Jeansonne MM (2004) Geographical populations
and ‘‘subspecies’’ of new world monarch butterflies
(Nymphalidae) share a recent origin and are not
phylogenetically distinct. Annals of the Entomological Society of
America, 97, 519–523.
Brower LP, Malcolm SB (1991) Animal migrations: endangered
phenomena. American Zoologist, 31, 265–276.
Brower LP, Pyle RM (2004) The interchange of migratory
monarchs between Mexico and the western United States,
and the importance of floral corridors to the fall
and spring migrations. In: Conserving Migratory Pollinators
and Nectar Corridors in Western North America (ed. Nabhan
GP), pp. 144–166. University of Arizona Press, Tucson,
Arizona.
Brower LP, Fink LS, Brower AV et al. (1995) On the dangers of
interpopulational transfers of monarch butterflies. BioScience,
45, 540–544.
Clarke AR, Zalucki MP (2004) Monarchs in Australia: on the
winds of a storm? Biological Invasions, 6, 123–127.
Dallimer M, Jones PJ (2002) Migration orientation behaviour of
the red-billed quelea Quelea quelea. Journal of Avian Biology,
33, 89–94.
Dallimer M, Jones PJ, Pemberton JM, Cheke RA (2003) Lack of
genetic and plumage differentiation in the red-billed quelea
Quelea quelea across a migratory divide in southern Africa.
Molecular Ecology, 12, 345–353.
De Roode JC, Altizer S (2010) Host-parasite genetic interactions
and virulence-transmission relationships in natural
populations of monarch butterflies. Evolution, 64, 502–514.
De Roode JC, Yates AJ, Altizer S (2008) Virulence-transmission
trade-offs and population divergence in virulence in a
naturally occurring butterfly parasite. Proceedings of the
National Academy of Sciences, USA, 105, 7489–7494.
Dingle H (1972) Migration strategies of insects. Science, 175,
1327.
Dingle H (1996) Migration: The Biology of Life on the Move.
Oxford University Press, Oxford.
Dingle H, Zalucki MP, Rochester WA, Armijo-Prewitt T (2005)
Distribution of the monarch butterfly, Danaus plexippus (L.)
(Lepidoptera : Nymphalidae), in western North America.
Biological Journal of the Linnean Society, 85, 491–500.
Eanes WF, Koehn RK (1978) Analysis of genetic structure in
the monarch butterfly, Danaus plexippus L. Evolution, 32, 784–
797.
Evanno G, Regnaut S, Goudet J (2005) Detecting the number of
clusters of individuals using the software STRUCTURE: a
simulation study. Molecular Ecology, 14, 2611–2620.
Excoffier L, Lischer HEL (2010) Arlequin suite ver 3.5: a new
series of programs to perform population genetics analyses
under Linux and Windows. Molecular Ecology Resources, 10,
564–567.
Excoffier L, Smouse PE, Quattro JM (1992) Analysis of
molecular variance inferred from metric distances among
DNA haplotypes – application to human mitochondrial
DNA restriction data. Genetics, 131, 479–491.
Fricke HC, Hencecroth J, Hoerner ME (2011) Lowland-upland
migration of sauropod dinosaurs during the late Jurassic
epoch. Nature, 480, 513–515.
� 2012 Blackwell Publishing Ltd

BUTTERFLY MIGRATION AND POPULATI ON ST RUCTURE 3443
Froy O, Gotter AL, Casselman AL, Reppert SM (2003)
Illuminating the circadian clock in monarch butterfly
migration. Science, 300, 1303–1305.
Haig SM, GrattoTrevor CL, Mullins TD, Colwell MA (1997)
Population identification of western hemisphere shorebirds
throughout the annual cycle. Molecular Ecology, 6, 413–427.
Holsinger KE, Weir BS (2009) Genetics in geographically
structured populations: defining, estimating and interpreting
F(ST). Nature Reviews Genetics, 10, 639–650.
Liedvogel M, Akesson S, Bensch S (2011) The genetics of
migration on the move. Trends in Ecology & Evolution, 26,
561–569.
McKinnon L, Smith PA, Nol E et al. (2010) Lower predation
risk for migratory birds at high latitudes. Science, 327, 326–
327.
Merlin C, Gegear RJ, Reppert SM (2009) Antennal circadian
clocks coordinate sun compass orientation in migratory
monarch butterflies. Science, 325, 1700–1704.
MonarchWatch (2011) Available at: http://www.monarchwatch.
org/biology/westpop.htm.
O’Corry-Crowe GM, Suydam RS, Rosenberg A, Frost KJ, Dizon
AE (1997) Phylogeography, population structure and
dispersal patterns of the beluga whale Delphinapterus leucas
in the western Nearctic revealed by mitochondrial DNA.
Molecular Ecology, 6, 955–970.
Petit E, Mayer F (2000) A population genetic analysis of
migration: the case of the noctule bat (Nyctalus noctula).
Molecular Ecology, 9, 683–690.
Pritchard JK, Stephens M, Donnelly P (2000) Inference of
population structure using multilocus genotype data.
Genetics, 155, 945–959.
Reppert SM, Zhu HS, White RH (2004) Polarized light helps
monarch butterflies navigate. Current Biology, 14, 155–158.
Rice WR (1989) Analyzing tables of statistical tests. Evolution,
43, 223–225.
Rousset F (2008) GENEPOP‘007: a complete re-implementation
of the GENEPOP software for Windows and Linux.
Molecular Ecology Resources, 8, 103–106.
Rozen S, Skaletsky HJ (2000) Primer3 on the WWW for general
users and biologist programmers. In: Bioinformatics Methods
and Protocols: Methods in Molecular Biology (eds Krawetz S,
Misener S), pp. 365–386. Humana Press, Totowa, New Jersey.
Russell AL, Medellın RA, McCracken GF (2005) Genetic
variation and migration in the Mexican free-tailed bat
(Tadarida brasiliensis mexicana). Molecular Ecology, 14, 2207–
2222.
Ryman N, Palm S (2006) POWSIM: a computer program for
assessing statistical power when testing for genetic
differentiation. Molecular Ecology Notes, 6, 600–602.
Shephard JM, Hughes JM, Zalucki MP (2002) Genetic
differentiation between Australian and North American
populations of the monarch butterfly Danaus plexippus (L.)
(Lepidoptera: Nymphalidae): an exploration using allozyme
electrophoresis. Biological Journal of the Linnean Society, 75,
437–452.
Slatkin M (1995) A measure of population subdivision based
on microsatellite allele frequencies. Genetics, 139, 457–462.
Tuskes PM, Brower LP (1978) Overwintering ecology of the
monarch butterfly, Danaus plexippus L., in California.
Ecological Entomology, 3, 141–153.
� 2012 Blackwell Publishing Ltd
Urquhart FA (1976) Found at last: the monarch’s winter home.
National Geographic, 150, 161–173.
Urquhart FA, Urquhart NR (1977) Overwintering areas and
migratory routes of the monarch butterfly (Danaus p.
plexippus, Lepidoptera: Danaidae) in North America, with
special reference to the western population. Canadian
Entomologist, 109, 1583–1589.
Urquhart FA, Urquhart NR (1978) Autumnal migration routes
of the eastern population of the monarch butterfly (Danaus p.
plexippus L.; Danaidae; Lepidoptera) in North America to the
overwintering site in the Neovolcanic Plateau of Mexico.
Canadian Journal of Zoology, 56, 1759–1764.
Van Oosterhout C, Hutchinson WF, Wills DPM, Shipley P
(2004) MICRO-CHECKER: software for identifying and
correcting genotyping errors in microsatellite data. Molecular
Ecology Notes, 4, 535–538.
Vandenbosch R (2007) What do monarch population time
series tell us about eastern and western population mixing?
Journal of the Lepidopterists’ Society, 61, 28–31.
Vane-Wright RI (1993) The Columbus hypothesis: an
explanation for the dramatic 19th century range expansion
of the monarch butterfly. In: Biology and Conservation of the
Monarch Butterfly (eds Malcolm SB, Zalucki MP), pp. 179–
187. Natural History Museum of Los Angeles County, Los
Angeles, California.
Zalucki MP, Clarke AR (2004) Monarchs across the Pacific: the
Columbus hypothesis revisited. Biological Journal of the
Linnean Society, 82, 111–121.
Zhan S, Merlin C, Boore JL, Reppert SM (2011) The monarch
butterfly genome yields insight into long-distance migration.
Cell, 147, 1171–1185.
Zhu H, Casselman A, Reppert SM (2008a) Chasing migration
genes: a brain expressed sequence tag resource for summer
and migratory monarch butterflies (Danaus plexippus). PLoS
One, 1, e1345.
Zhu H, Sauman I, Yuan Q et al. (2008b) Cryptochromes define a
novel circadian clock mechanism in monarch butterflies that
may underlie sun compass navigation. PLoS Biology, 6, e4.
Zhu HS, Gegear RJ, Casselman A, Kanginakudru S, Reppert
SM (2009) Defining behavioral and molecular differences
between summer and migratory monarch butterflies. BMC
Biology, 7, 14.
The authors of this paper have diverging interests in hostpara-
site interactions, insect ecology and evolution, animal behavior,
molecular biology and monarch butterflies. For this paper, the
authors combined their interests to understand the genetic dif-
ferentiation of North American migratory butterfly popula-
tions.
Supporting information
Additional supporting information may be found in the online
version of this article.
Fig. S1 Inferred genetic proportion of individual butterflies to
each of seven (K = 7), 4 (K = 4) or 3 (K = 3) assumed popula-
tions. Analyses were started with seven populations to reflect

3444 J . I . LYONS E T A L.
the seven sample locations (see Fig. 1). Bayesian analysis sug-
gest that there are three genetic populations: eastern + western
North America, Hawaii, and New Zealand (NZ). Individual
monarchs are indicated by vertical bars.
Fig. S2 Inferred genetic proportion of individual butterflies to
each of three (K = 3) assumed populations. The analysis was
based on the nine loci for which each population was in
Hardy–Weinberg equilibrium and the two loci for which three
populations were in Hardy–Weinberg equilibrium; for the lat-
ter loci, we excluded the data for the single populations that
were not in Hardy–Weinberg equlibrium (Western North
America for locus 1679; Hawaii for locus 153). Individual mon-
archs are indicated by vertical bars.
Please note: Wiley-Blackwell are not responsible for the content
or functionality of any supporting information supplied by the
authors. Any queries (other than missing material) should be
directed to the corresponding author for the article.
Data accessibility
Microsatellite data uploaded as online supplemental material.
� 2012 Blackwell Publishing Ltd
Copyright © 2022 FDOKUMEN