Origin of Mexican Nahuas (Aztecs) according to HLA genes and their relationships with worldwide...
9
Molecular Immunology 44 (2007) 747–755 Origin of Mexican Nahuas (Aztecs) according to HLA genes and their relationships with worldwide populations Gilberto Vargas-Alarcon a,1 , Juan Moscoso b,1 , Jorge Martinez-Laso b , Jose Manuel Rodriguez-Perez a , Carmina Flores-Dominguez a , Juan Ignacio Serrano-Vela b , Almudena Moreno b , Julio Granados c , Antonio Arnaiz-Villena b,∗ a Department of Physiology and Grupo de Estudio de Genomica y Proteomica en Enfermedades Cardiovasculares, Instituto Nacional de Cardiologia Ignacio Chavez, 14080 Mexico City, Mexico b Department of Immunology, Hospital 12 de Octubre, Hospital Clinico San Carlos, Universidad Complutense, Madrid, Spain c Department of Immunology and Rheumatology, Instituto Nacional de Ciencias Medicas y Nutricion Salvador Zubiran, Mexico City, Mexico Received 28 February 2006; accepted 11 April 2006 Available online 12 June 2006 Abstract A Nahua Aztec isolated group from Morelos State (Mexico) was studied for their HLA profile. The relationship with other Amerindians and worldwide populations was studied by using 13,818 chromosomes and calculating Nei’s chord genetic distances (DA), neighbor-joining dendrograms and correspondence multidimensional values. Three new HLA extended haplotypes were found in our group: A * 30–B * 49–DRB1 * 1001–DQB1 * 0501 (the most frequent one in this population), A * 02–B * 52–DRB1 * 1402–DQB1 * 0301 and A * 68–B * 61–DRB1 * 1602–DQB1 * 0303. Both genetic distances and correspondence analyses clearly show that our Nahua isolated group is genetically close to some of the most ancient groups living in Mexico (Mayans, Zapotecans, Mixtecans). This suggests that Nahua language (Nahuatl) may have been imposed to scattered groups throughout Mexico; otherwise Aztecs may have been living in Mexico long before their postulated immigration in the XII century AD. © 2006 Elsevier Ltd. All rights reserved. Keywords: Amerindians; HLA; Mexicas; Mexico; Nahua; Aztecs 1. Introduction Nahuas are composed by nowadays Mexican ethnic groups who speak Nahuatl. There was a migration about XII–XIII century AD from a northern people probably coming from nowadays Arizona or New Mexico areas, and specifically from a city called Aztlan. These people called themselves Aztecs, but they changed the name at departure calling them- selves “Mexitin” or “Mexicas”; they spoke Nahuatl (Navarrete- ∗ Corresponding author at: Departamento de Immunologia, Facultad de Medicina, Universidad Complutense de Madrid, Avda. Complutense s/n, 28040 Madrid, Spain. Tel.: +34 913941632. E-mail address: [email protected] (A. Arnaiz-Villena). URL: http://chopo.pntic.mec.es/biolmol. 1 These authors contributed equally to this work and the order of authorship is arbitrary. Linares, 1998). They were initially agriculturalists, but south- wards they learned hunter-gathering when passing through the Chichimecan territory, close to the nowadays USA bor- der (Sonora dessert) (Fig. 1). They also had cultural and the- oretically genetic relationships with Chichimecans. In their southwards way they also met Toltecs with whom they also had close relationships. Later, they managed to seize eth- nic groups belonging to the main autochthonous Mexican cultures, like Mayan, Mixtecan, Zapotecan and others. They also founded Tenochtitlan at the Chapultepc woods in what is nowadays Mexico City around 1323 AD (Lopez-Lujan, 1983). At the arrival of the Spanish Hernan Cortes with a small group of people (Arnaiz-Villena et al., 2000) 1519 AD they had a sophisticated society centred in a very heavily populated Tenochtitlan. Spanish attacks and Spanish borne diseases fin- ished with the Mexican (Nahua) Empire. 0161-5890/$ – see front matter © 2006 Elsevier Ltd. All rights reserved. doi:10.1016/j.molimm.2006.04.014
-
Upload
independent -
Category
Documents
-
view
3 -
download
0
Transcript of Origin of Mexican Nahuas (Aztecs) according to HLA genes and their relationships with worldwide...
A
ad
A
gg©
K
1
wcnfAs
MM
i
0d
Molecular Immunology 44 (2007) 747–755
Origin of Mexican Nahuas (Aztecs) according to HLA genesand their relationships with worldwide populations
Gilberto Vargas-Alarcon a,1, Juan Moscoso b,1, Jorge Martinez-Laso b,Jose Manuel Rodriguez-Perez a, Carmina Flores-Dominguez a,
Juan Ignacio Serrano-Vela b, Almudena Moreno b,Julio Granados c, Antonio Arnaiz-Villena b,∗
a Department of Physiology and Grupo de Estudio de Genomica y Proteomica en Enfermedades Cardiovasculares,Instituto Nacional de Cardiologia Ignacio Chavez, 14080 Mexico City, Mexico
b Department of Immunology, Hospital 12 de Octubre, Hospital Clinico San Carlos, Universidad Complutense, Madrid, Spainc Department of Immunology and Rheumatology, Instituto Nacional de Ciencias Medicas y Nutricion Salvador Zubiran, Mexico City, Mexico
Received 28 February 2006; accepted 11 April 2006Available online 12 June 2006
bstract
A Nahua Aztec isolated group from Morelos State (Mexico) was studied for their HLA profile. The relationship with other Amerindiansnd worldwide populations was studied by using 13,818 chromosomes and calculating Nei’s chord genetic distances (DA), neighbor-joiningendrograms and correspondence multidimensional values.
Three new HLA extended haplotypes were found in our group: A*30–B*49–DRB1*1001–DQB1*0501 (the most frequent one in this population),* * * * * * * *
02–B 52–DRB1 1402–DQB1 0301 and A 68–B 61–DRB1 1602–DQB1 0303.Both genetic distances and correspondence analyses clearly show that our Nahua isolated group is genetically close to some of the most ancientroups living in Mexico (Mayans, Zapotecans, Mixtecans). This suggests that Nahua language (Nahuatl) may have been imposed to scatteredroups throughout Mexico; otherwise Aztecs may have been living in Mexico long before their postulated immigration in the XII century AD.
2006 Elsevier Ltd. All rights reserved.
Lwtdos
eywords: Amerindians; HLA; Mexicas; Mexico; Nahua; Aztecs
. Introduction
Nahuas are composed by nowadays Mexican ethnic groupsho speak Nahuatl. There was a migration about XII–XIII
entury AD from a northern people probably coming fromowadays Arizona or New Mexico areas, and specifically
rom a city called Aztlan. These people called themselvesztecs, but they changed the name at departure calling them-elves “Mexitin” or “Mexicas”; they spoke Nahuatl (Navarrete-
∗ Corresponding author at: Departamento de Immunologia, Facultad deedicina, Universidad Complutense de Madrid, Avda. Complutense s/n, 28040adrid, Spain. Tel.: +34 913941632.
E-mail address: [email protected] (A. Arnaiz-Villena).URL: http://chopo.pntic.mec.es/biolmol.
1 These authors contributed equally to this work and the order of authorships arbitrary.
hncai1
ghTi
161-5890/$ – see front matter © 2006 Elsevier Ltd. All rights reserved.oi:10.1016/j.molimm.2006.04.014
inares, 1998). They were initially agriculturalists, but south-ards they learned hunter-gathering when passing through
he Chichimecan territory, close to the nowadays USA bor-er (Sonora dessert) (Fig. 1). They also had cultural and the-retically genetic relationships with Chichimecans. In theirouthwards way they also met Toltecs with whom they alsoad close relationships. Later, they managed to seize eth-ic groups belonging to the main autochthonous Mexicanultures, like Mayan, Mixtecan, Zapotecan and others. Theylso founded Tenochtitlan at the Chapultepc woods in whats nowadays Mexico City around 1323 AD (Lopez-Lujan,983).
At the arrival of the Spanish Hernan Cortes with a small
roup of people (Arnaiz-Villena et al., 2000) 1519 AD theyad a sophisticated society centred in a very heavily populatedenochtitlan. Spanish attacks and Spanish borne diseases fin-shed with the Mexican (Nahua) Empire.

748 G. Vargas-Alarcon et al. / Molecular I
FrD
mosPspGPPC
stt
FNh
MA
i(V1oecsp
2
2
satipsusosAlM(KC
2
ig. 1. Inset: postulated Mexicas immigration into Mexico. Figure shows theelatively isolated little town where Aztec samples were taken from: Santoomingo Ocotitlan.
However, nowadays there are Nahuatl language speakers inany parts of Mexico (Fig. 2). There are many Nahuatl-speaking
riginated groups at the city southern area and in many othertates such as Morelos, Puebla, Hidalgo, Tlaxcala, San Luisotosi, Jalisco, Guerrero, Oaxaca, Veracruz and Chiapas. Con-idering the linguistic classification, we can contemplate fouropulation groups: (a) West Nahuatl, from Toluca, Michoacan,uerrero and Morelos; (b) Central Nahuatl, from Mexico City,uebla and Tlaxcala; (c) Septentrional Nahuatl, from San Luisotosi; (d) East Nahuatl, from Puebla, Veracruz, Oaxaca andentral America.
This may be due to an extension of the original group and sub-equent isolation or to language imposition (Nahuatl). It belongso the Uto-Aztecan family (with 25 different extant languages),hat is also spoken by groups living in Mexico, Arizona and New-
ig. 2. Black spots: “Nahuatl proper” language speaking groups. Dotted spots:ahuatl language related groups (from north to south: Papagos, Pimas, Tepe-uanes, Yaquis, Mayos, Tarahumaras, Guajiros, Coras and Huicholes).
fshlDs(Ia
2
wsDl1w
mmunology 44 (2007) 747–755
exico, like Hopi, Pima, Tarahumara, Shosone and Comanchemerindians.In the present work, we aim to study the HLA profile of Mex-
cas or Nahuatl speaking people from Santo Domingo OcotitlanMorelos, Fig. 1) and relating it with other Amerindians (Arnaiz-illena et al., 2000; Vargas-Alarcon et al., 2006; Infante et al.,999; Kostyu and Amos, 1981) and worldwide populations inrder to establish degrees of genetic relatedness with differ-nt populations. The problem of differentiation between Mexi-as coming from nowadays Arizona and Mexico and Nahuatl-peaking groups will also be addressed by studying the HLArofile of our Nahuatl-speaking sample from Morelos (Fig. 1).
. Materials and methods
.1. Population samples
We studied 85 unrelated healthy individuals from a Nahuatl-peaking and relatively isolated group. They were HLA class Ind class II typed and they were living in Santo Domingo Ocoti-lan village (Morelos State, Mexico). Each individual was bornn Santo Domingo Ocotitlan area, had a Mexican Amerindianhysical appearance and their four grandparents were born in theame area and spoke Nahuatl. The origin of all other populationssed for comparisons are detailed in Table 1: 13,818 chromo-omes were studied in total, including populations from differentrigins (Caucasoids, Orientals, Negroids, Polynesians, Microne-ians, Na-Dene, Eskimos and Amerindians). In particular, themerindian group includes groups belonging to the following
inguistic families: Macro-Mixteco (Mixtecans, Zapotecans andazatecans), Macro-Maya (Mixe and Mayans), Macro-Yuma
Seris), Andean (Quechuans and Aymaras), Chibcha (Arsario,ogi, Arhuaco and Cayapa), Arawak (Wayu), and Ge Panoaribe (Xavantes, Mataco and Toba).
.2. HLA typing and DNA sequencing
HLA class I (A and B) and class II (DRB1 and DQB1) alleleamilies typing was performed by polymerase chain reaction-equence specific oligonucleotide (PCR-SSO) reverse dot blotybridization (Amplicor, Hoffmann La Roche, Basel, Switzer-and) (according to IMGT/HLA version 2.6, July 2004). HLA-RB1 and DQB1 high-resolution typing was done by DNA
equencing in a Perkin-Elmer 310 automated DNA sequencerFoster City, CA, USA). The sequences were analyzed using theMGT/HLA sequence database (http://www.ebi.ac.uk/imgt/hla/lign.html).
.3. Statistical analyses
Statistical analyses were performed with Arlequin v2.0 soft-are kindly provided by Schneider (Schneider et al., 2000). In
ummary, this program calculated HLA-A, -B, -DRB1, and -
QB1 allele frequencies, Hardy–Weinberg equilibrium and theinkage disequilibrium (D′; also named LD) (Imanishi et al.,992b); their level of significance (P) for 2 × 2 comparisonsas determined (Mattiuz et al., 1970). In addition, the most

G. Vargas-Alarcon et al. / Molecular Immunology 44 (2007) 747–755 749
Table 1Populations included in the analysis
ID Population N Reference ID Population N Reference
1 Nahuas 85 Present study 36 Khalk Mongolians 202 Munkhbat et al. (1997)2 Aymaras 102 Arnaiz-Villena et al. (2005) 37 Tuvinians 197 Martinez-Laso et al. (2001)3 Quechuans 80 Martinez-Laso et al. (2006) 38 Khoton Mongolians 85 Munkhbat et al. (1997)4 Mazatecans 89 Arnaiz-Villena et al. (2000) 39 Germans 295 Imanishi et al. (1992a)5 Mayans 132 Gomez-Casado et al. (2003) 40 Sardinians 91 Imanishi et al. (1992a)6 Seri 100 Petzl-Erler et al. (1997) 41 Italians 284 Imanishi et al. (1992a)7 Mixe 55 Petzl-Erler et al. (1997) 42 French 179 Imanishi et al. (1992a)8 Mixtecans 103 Petzl-Erler et al. (1997) 43 Spaniards 176 Martinez-Laso et al. (1995)9 Zapotecans 75 Petzl-Erler et al. (1997) 44 Spanish Basques 80 Martinez-Laso et al. (1995)
10 Mexican Mestizos 99 Vargas-Alarcon et al.(unpublished data)
45 Algerians 102 Arnaiz-Villena et al. (1997)
11 Wayu 112 Yunis et al. (1994) 46 Berbers (Souss) 98 Izaabel et al. (1998)12 Arhuaco 123 Yunis et al. (1994) 47 Moroccans 98 Gomez-Casado et al. (2000)13 Kogi 67 Yunis et al. (1994) 48 Albanians 65 Arnaiz-Villena et al. (unpub-
lished data)14 Arsario 20 Yunis et al. (1994) 49 Macedonians 172 Arnaiz-Villena et al. (2001)15 Cayapa 100 Titus-Trachtenberg et al.
(1994)50 Cretans 135 Arnaiz-Villena et al. (1999)
16 Xavantes 74 Cerna et al. (1993) 51 Ashkenazi Jews 80 Martinez-Laso et al. (1996)17 Guarani 32 Petzl-Erler et al. (1997) 52 Non-Ashkenazi Jews 80 Martinez-Laso et al. (1996)18 Toba Pilaga 19 Cerna et al. (1993) 53 Lebanese NS 59 Clayton and Lonjou (1997)19 Mataco Wichi 49 Cerna et al. (1993) 54 Lebanese KZ 93 Clayton and Lonjou (1997)20 Eastern Toba 135 Cerna et al. (1993) 55 Moroccan Jews 94 Roitberg-Tambur et al. (1995)21 Jaidukama 39 Arnaiz-Villena et al.
(unpublished data)56 Danish 124 Imanishi et al. (1992a)
22 Eskimos 35 Grahovac et al. (1998) 57 Chuvashians 82 Arnaiz-Villena et al. (2003)23 Athabaskans 124 Monsalve et al. (1998) 58 Russians 200 Kapustin et al. (1999)24 Tlingit 53 Imanishi et al. (1992a) 59 Western Samoa 102 Gao et al. (1992b)25 Nivkhs 32 Grahovac et al. (1998) 60 Madang 65 Gao et al. (1992a)26 Udegeys 23 Grahovac et al. (1998) 61 Rabaul 60 Gao et al. (1992a)27 Koryaks 92 Grahovac et al. (1998) 62 New Caledonia 65 Gao et al. (1992a)28 Chukchi 59 Grahovac et al. (1998) 63 Fiji 57 Gao et al. (1992a)29 Kets 22 Grahovac et al. (1998) 64 Papua New Guinea 57 Gao et al. (1992a)30 Evenks 35 Grahovac et al. (1998) 65 Central Desert (Aboraus) 152 Lester et al. (1995)31 Singapore Chinese 71 Imanishi et al. (1992a) 66 Ainu 50 Bannai et al. (1996)32 Buyi 70 Imanishi et al. (1992a) 67 Yuendumu 119 Lester et al. (1995)33 Manchu 50 Geng et al. (1995) 68 Cape York 80 Gao et al. (1992c)3 693
A eprese
fa1tiwptHasmbprrpBt
raqssLglab
3
3(
4 Koreans 100 Imanishi et al. (1992a)5 Japanese 493 Imanishi et al. (1992a)
total of 13,818 chromosomes were analyzed and geographical locations are r
requent complete haplotypes were deduced from: (1) the 2, 3,nd 4 HLA loci haplotype frequencies (Arnaiz-Villena et al.,997); (2) the previously described haplotypes in other popula-ions (Imanishi et al., 1992a); (3) haplotypes if they appearedn two or more individuals and if the alternative haplotypeas well defined (Imanishi et al., 1992a). In order to comparehenotype and haplotype HLA frequencies with other popula-ions, the reference tables of the 11th and 12th InternationalLA Workshops were used (Imanishi et al., 1992c; Clayton
nd Lonjou, 1997) (see also Table 1). Dendrograms were con-tructed from the allelic frequencies using the neighboring (NJ)ethod (Saitou and Nei, 1987) by using the genetic distances
etween populations (DA) (Nei, 1972). DISPAN software, com-rising the programs GNKDST and TREEVIEW was run. Cor-espondence analysis in n-dimensions and its bi-dimensional
epresentation was carried out using the VISTA v5.02 com-uter program (http://www.forrest.psych.unc.edu) (Young andann, 1996). Correspondence analysis consists of a geometricechnique that may be used for displaying a global view of theHe
Kimberley 82 Gao et al. (1992c)
nted in Gomez-Casado et al. (2003).
elationships among populations according to HLA (or other)llele frequencies. This methodology is based on the allelic fre-uency variance among populations and on the display of atatistical visualization of differences. The heterozygosity analy-is was carried out using the “Bottleneck Program” (Cornuet anduikart, 1996) to compare the observed and expected heterozy-osity at HLA-A, -B, -DRB1, and -DQB1 loci assuming that alloci fit the infinity allele model (IAM) (Kimura and Crow, 1964)nd mutation-drift equilibrium following formulations devisedy Shriver et al. (1993).
. Results
.1. Characteristic HLA allele frequencies of the NahuasAztec) population compared to other populations
The expected and observed genotype frequency values forLA-A, -B, -DRB1, and -DQB1 loci were in Hardy–Weinberg
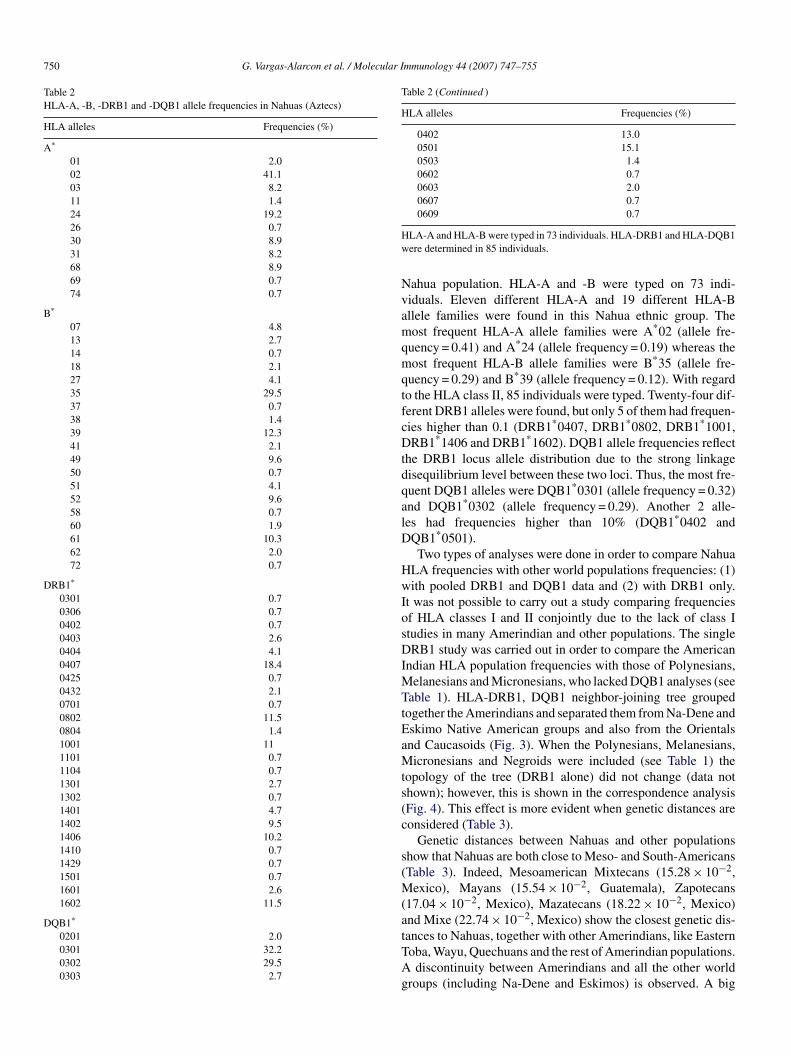
quilibrium. Table 2 shows the HLA frequencies found in our
750 G. Vargas-Alarcon et al. / Molecular Immunology 44 (2007) 747–755
Table 2HLA-A, -B, -DRB1 and -DQB1 allele frequencies in Nahuas (Aztecs)
HLA alleles Frequencies (%)
A*
01 2.002 41.103 8.211 1.424 19.226 0.730 8.931 8.268 8.969 0.774 0.7
B*
07 4.813 2.714 0.718 2.127 4.135 29.537 0.738 1.439 12.341 2.149 9.650 0.751 4.152 9.658 0.760 1.961 10.362 2.072 0.7
DRB1*
0301 0.70306 0.70402 0.70403 2.60404 4.10407 18.40425 0.70432 2.10701 0.70802 11.50804 1.41001 111101 0.71104 0.71301 2.71302 0.71401 4.71402 9.51406 10.21410 0.71429 0.71501 0.71601 2.61602 11.5
DQB1*
0201 2.00301 32.20302 29.50303 2.7
Table 2 (Continued )
HLA alleles Frequencies (%)
0402 13.00501 15.10503 1.40602 0.70603 2.00607 0.70609 0.7
Hw
NvamqmqtfcDtdqalD
HwIosDIMTtEaMts(c
s(M(atTAg
LA-A and HLA-B were typed in 73 individuals. HLA-DRB1 and HLA-DQB1ere determined in 85 individuals.
ahua population. HLA-A and -B were typed on 73 indi-iduals. Eleven different HLA-A and 19 different HLA-Bllele families were found in this Nahua ethnic group. Theost frequent HLA-A allele families were A*02 (allele fre-
uency = 0.41) and A*24 (allele frequency = 0.19) whereas theost frequent HLA-B allele families were B*35 (allele fre-
uency = 0.29) and B*39 (allele frequency = 0.12). With regardo the HLA class II, 85 individuals were typed. Twenty-four dif-erent DRB1 alleles were found, but only 5 of them had frequen-ies higher than 0.1 (DRB1*0407, DRB1*0802, DRB1*1001,RB1*1406 and DRB1*1602). DQB1 allele frequencies reflect
he DRB1 locus allele distribution due to the strong linkageisequilibrium level between these two loci. Thus, the most fre-uent DQB1 alleles were DQB1*0301 (allele frequency = 0.32)nd DQB1*0302 (allele frequency = 0.29). Another 2 alle-es had frequencies higher than 10% (DQB1*0402 andQB1*0501).Two types of analyses were done in order to compare Nahua
LA frequencies with other world populations frequencies: (1)ith pooled DRB1 and DQB1 data and (2) with DRB1 only.
t was not possible to carry out a study comparing frequenciesf HLA classes I and II conjointly due to the lack of class Itudies in many Amerindian and other populations. The singleRB1 study was carried out in order to compare the American
ndian HLA population frequencies with those of Polynesians,elanesians and Micronesians, who lacked DQB1 analyses (see
able 1). HLA-DRB1, DQB1 neighbor-joining tree groupedogether the Amerindians and separated them from Na-Dene andskimo Native American groups and also from the Orientalsnd Caucasoids (Fig. 3). When the Polynesians, Melanesians,icronesians and Negroids were included (see Table 1) the
opology of the tree (DRB1 alone) did not change (data nothown); however, this is shown in the correspondence analysisFig. 4). This effect is more evident when genetic distances areonsidered (Table 3).
Genetic distances between Nahuas and other populationshow that Nahuas are both close to Meso- and South-AmericansTable 3). Indeed, Mesoamerican Mixtecans (15.28 × 10⁻²,
exico), Mayans (15.54 × 10⁻², Guatemala), Zapotecans17.04 × 10−2, Mexico), Mazatecans (18.22 × 10⁻², Mexico)nd Mixe (22.74 × 10⁻², Mexico) show the closest genetic dis-
ances to Nahuas, together with other Amerindians, like Easternoba, Wayu, Quechuans and the rest of Amerindian populations.discontinuity between Amerindians and all the other worldroups (including Na-Dene and Eskimos) is observed. A big

G. Vargas-Alarcon et al. / Molecular Immunology 44 (2007) 747–755 751
F Amerb ping.
gwmG
3a
ma
iow(
aDawDDwDqDDn
ig. 3. Neighbor-joining dendrogram showing relatedness between Nahuas andetween populations (DA) were calculated by using HLA-DRB1–DQB1 genoty
enetic distance is observed between Nahuas and Guarani thanith other non-Amerindian population (Athabaskans). This factay be due to the low number of HLA typings in this particularuarani population (Table 3).
.2. HLA-A, -B, -DRB1 and -DQB1 linkage disequilibriumnalysis in Nahuas compared to other populations
Associations between different HLA loci were estimated. Theost probable two loci haplotype combinations (A–B, B–DRB1
nd DRB1–DQB1) were calculated (data not shown).The 17 most frequent extended haplotypes are depicted
n Table 4. Nahua extended HLA haplotypes have beenbtained for the first time, allowing their comparisonith the previously reported ones in other populations
Table 4 and its footnote). DRB1*0407–DQB1*0302 was
mcpM
indians, Na-Dene, Eskimo, Asian and European populations. Genetic distancesData from other populations were taken from references detailed in Table 1.
ssociated with A*24–B*61 and A*68–B*35 meanwhileRB1*1402–DQB1*0301 was associated with A*2–B*52
nd A*31–B*27. DRB1*1001–DQB1*0501 was associatedith A*30–B*49, DRB1*0802–DQB1*0402 with A*2–B*35,RB1*1406–DQB1*0301 with A*24–B*39, DRB1*1602–QB1*0301 with A*2–B*35, DRB1*1602–DQB1*0303ith A*68–B*61, DRB1*0404–DQB1*0302 with A*3–B*13,RB1*0407–DQB1*0301 with A*2–B*35. The most fre-uent extended HLA haplotype A*30–B*49–DRB1*1001–QB1*0501 (7.5%) and also A*02–B*52–DRB1*1402–QB1*0301 and A*68–B*61–DRB1*1602–DQB1*0303 haveot been found in any other Amerindian population; the rest
ost frequent extended HLA haplotypes have Amerindianharacteristics and have been found in other Amerindianopulations. Two of them have been also found in Bari and inaori population.

752 G. Vargas-Alarcon et al. / Molecular Immunology 44 (2007) 747–755
F onga reprei rred to
4
eppswisApteeaT(al(thfiDD-qMAe
gqifimnnaattpHrTbngt(lhAtf
ig. 4. Correspondence analysis showing a global view of the relationship amccording to HLA-DRB1 allele frequencies in n dimensions (bi-dimensionalnterpretation of the references to colour in this figure legend, the reader is refe
. Discussion
The analysis of the HLA allelic diversity in various humanthnic groups can yield insights into the evolution of HLAolymorphism as well as into the migration patterns of humanopulations. These studies may also be used for epidemiologicaltudies (HLA and disease) and for constructing a transplantationaiting list in relatively isolated ethnic groups. The HLA system
s bearer of the largest allelic polymorphism of all human geneticystems. However, several studies of HLA alleles in Nativemericans have shown that these populations present a limitedolymorphism in this system as compared to Caucasian popula-ions (Vargas-Alarcon et al., 2000, 2001, 2006; Fernandez-Vinat al., 1997). The present study was made in a isolated Nahuathnic group from Mexico; this study confirms this limited class Ind class II polymorphism in Mexican Amerindian population.he polymorphism was more restricted in the class I alleles
HLA-A and HLA-B). Even though, we detected 11 HLA-And nineteen HLA-B alleles. Only two HLA-A “allele fami-ies” (HLA-A*02 and -A*24) and three HLA-B “allele families”HLA-B*35, -B*39 and -B*61) presented frequencies higherhan 10%. This number of alleles may have been higher if aigher resolution typing had been done. On the other hand,ve HLA-DRB1 alleles (HLA-DRB1*0407, -DRB1*0802, -RB1*1001, -DRB1*1406 and -DRB1*1602) and five HLA-QB1 alleles (HLA-DQB1*0301, -DQB1*0302, -DQB1*0402,
DQB1*0501) presented frequencies higher than 10%. High fre-
uency of these alleles has been previously described in Mexicanestizos (De Leo et al., 1997) and in some other Mexicanmerindian groups (Arnaiz-Villena et al., 2000; Gomez-Casadot al., 2003; Petzl-Erler et al., 1997; Vargas-Alarcon et al., 2006).
(
ra
Amerindian, Na-Dene, Eskimo, Asian, European and Polynesian populationssentation). Colours represent an approximate grouping of populations. (Forthe web version of the article.)
It is well known that HLA alleles are inherited throughenerations as a block (haplotypes) due to the linkage dise-uilibrium among neighboring HLA loci. They might be orig-nated by admixture of two populations with very differentrequencies for the particular alleles involved in the result-ng linkage disequilibrium (Degos and Dausset, 1974). They
ay be the reflection of the founder effect and the mecha-isms of maintenance of HLA haplotypes may be forced byatural selection advantages, similar to those that maintain link-ge disequilibrium (Dausset and Svejggard, 1977): a set oflleles contained within the HLA haplotype may be advan-ageous for a population to cope with antigens within a par-icular environment for starting an immune response. In theresent study, we reported for the first time the Nahuas extendedLA haplotypes, allowing their comparison with previously
eported ones in other populations (Table 4 and its footnote).welve of the 17 extended haplotypes reported in Nahuas haveeen also found in other Amerindians and 3 of them haveot been previously found. DRB1*0407–DQB1*0302 haplotypeives rise to four of the most frequent haplotypes in combina-ion with A*24–B*61, A*68–B*35, A*2–B*39 and A*68–B*39Table 4). These haplotypes account for 8% of the total hap-otypes. DRB1*1402–DQB1*0301 gives rise to three frequentaplotypes in combination with A*2–B*52, A*31–B*27 and*2–B*40 (Table 4). These haplotypes account for 6.0% of
he total haplotypes. DRB1*0407–DQB1*0302 haplotype wasound in Bari, Mazatecan and other Amerindian populations
Arnaiz-Villena et al., 2000; Petzl-Erler et al., 1997).The neighbor-joining and genetic distances analyses corrobo-ate previous studies suggesting that the Amerindians show a rel-tive homogeneity as opposed to other First Native Amerindian

G. Vargas-Alarcon et al. / Molecular Immunology 44 (2007) 747–755 753
Table 3Genetic distances (DA) between Nahuas and other populations (×102)obtained by using HLA-DRB1 allele frequencies (see Table 1 for populationidentifications)
Population DA (%) Population DA (%)
Mixtecans 15.28 Lebanese KZ 57.47Mayans 15.54 Moroccan Jews 58.07Zapotecans 17.04 Germans 58.53Eastern Toba 17.44 Ashkenazi Jews 58.77Mazatecans 18.22 Spaniards 58.78Wayu 19.11 Moroccans 58.78Mixe 22.74 Chukchi 59.36Quechuas 24.54 Koreans 60.39Mexican Mestizos 26.68 Ainu 60.50Arsario 28.62 Japanese 60.64Arhuaco 28.87 Berbers (Souss) 60.79Xavantes 29.20 Algerians 61.06Toba Pilaga 30.14 Koryaks 63.20Kogi 30.91 Manchu 63.55Aymaras 31.34 Sardinians 67.17Cayapa 31.38 Buyi 67.31Mataco Wichi 31.65 Danish 67.42Seri 35.83 Nivkhs 68.36Jaidukama 36.33 Singapore Chinese 69.05Athabaskans 50.11 Khoton Mongolians 70.14Guarani 51.00 Rabaul 72.88Non-Ashkenazi Jews 51.18 Madang 74.14Albanians 51.19 Spanish Basques 74.55Tlingit 52.51 Chuvashians 76.35Tuvinians 52.83 Western Samoa 79.66Lebanese NS 53.06 Fiji 81.95Eskimos 53.19 New Caledonia 82.11Khalk Mongolians 53.42 Cape Cork 82.91Macedonians 53.86 Yuendumu 85.48Cretans 54.88 Papua New Guinea 85.77French 55.72 Central Desert (Aboraus) 85.88Udegeys 56.26 Evenks 88.13RI
gFNg(taenssrbMtt(aaTg
Table 4The 17 most frequent extended HLA-A, -B, -DRB1, -DQB1 haplotypes in theNahuas (Aztec) populations
Haplotype HF (%) Possible origin
A*30–B*49–DRB1*1001–DQB1*0501a 7.5 NewA*02–B*35–DRB1*0802–DQB1*0402b 6.1 AmerindianA*24–B*39–DRB1*1406–DQB1*0301c 5.4 AmerindianA*02–B*35–DRB1*1602–DQB1*0301d 5.4 AmerindianA*24–B*61–DRB1*0407–DQB1*0302e 3.4 AmerindianA*02–B*52–DRB1*1402–DQB1*0301f 2.7 NewA*68–B*61–DRB1*1602–DQB1*0303f 2.0 NewA*31–B*27–DRB1*1402–DQB1*0301g 2.0 AmerindianA*03–B*13–DRB1*0404–DQB1*0302h 2.0 AmerindianA*02–B*35–DRB1*0407–DQB1*0301i 2.0 AmerindianA*68–B*35–DRB1*0407–DQB1*0302j 2.0 Amerindian
Other minor frequent haplotypes in Nahuas are: A2–B39–DRB1*0407–DQB1*0302 (1.3%); A2–B52–DRB1*1406–DQB1*0501 (1.3%); A68–B39–DR0407–DQB1*0302 (1.3%); A24–B18–DRB1*1301–DQB1*0603 (1.3%);A1–B41–DRB1*1401–DQB1*0503 (1.3%) and A2–B40–DRB1*1402–DQB1*0301 (1.3%). References: de Pablo et al. (2000), Arnaiz-Villena et al.(2000), Arnaiz-Villena et al. (2005), Gomez-Casado et al. (2003), Hollenbachet al. (2001), Alaez et al. (2002), Imanishi et al. (1992a), Clayton and Lonjou(1997) and Lazaro et al. (1999).
a Not found in any other population.b Found in Aymaras (10.4%); Peruvian Indians (with low resolution HLA-
DRB1 allele, 9.6%); Mayans (8.4%); Mixtecans (6%); Seri (4.5%); Zapotecans(3%) and Mixe (1.5%).
c Found in Mixtecans (3%); Maori (3%).d Found in Zapotecans (4%); Terena Indians (2.3%); Warao (2.9%) and Bari
(10.9%) HLA-A, -B, -DR by using generic typing.e Found in Mixtecans (4%); Bari (0.3%) where the B61 allele is found as B40
and Inuit (9.8 %).f Not found in any other population.g Found in Seri Indians (2.3%).h Found in Seri (0.9%) and Japanese (0.8%) for HLA-A, -B, -DR generic
typing.i Found in Seri (18.2%); Mayans (10.6%); Mixtecans (3%); Mazatecans
(2.5%); Aymaras (1.8%) and Peruvian Indians (with low resolution HLA-DRB1a
igfi
dMNS(gTiigt
HLA polymorphism in the Amerindian populations, which show
ussians 57.18 Kets 90.20talians 57.21 Kimberley 95.26
roups such as North American Na-Dene and Eskimo groups.igs. 3 and 4 show that Amerindians cluster separately froma-Dene and Eskimo North American Indians. These data sug-est that Amerindians are less related to the Na-Dene speakingAthabaskan) and Eskimo groups than among themselves andhat Amerindian is a more homogeneous group which have
different origin from Na-Dene and Eskimo groups. How-ver, the genetic relatedness among Amerindian alleles doesot correlate with the linguistic groups. Nahuatl language, clas-ified within the Uto-Aztecan family, is one of many examplesince the Nahuas from Santo Domingo Ocotitlan are geneticallyelated to Mayan, Mixtecan and Zapotecan Amerindians in aidimensional analysis, according to our data (Table 3). Theayans are thought to be related to the oldest recorded Cen-
ral American civilization, the Olmecs, which, are thought to behe Mayan’s precursors, not only culturally but also geneticallyGomez-Casado et al., 2003). On the other hand, the Mixtecannd Zapotecan belonging to the Oto-Manguean linguistic family
n also among the eldest Mexican inhabitants (Scheffler, 1992).he different evolutionary rate of genes and languages does notive a gene-language correlation when microgeographical stud-aAa
llele, 1.7%).j Found in Mixtecans (6%); Seri Indians (4.5%) and Mayans (2.3%).
es are performed; only when large, geographically extendedroups of populations are used and corrections (sometimes arti-cial) are applied, some correlation is found.
An important problem is how to explain the dispersal of nowa-ays Nahuatl speaking people (considered as the immigrantexicas in the XII century AD, Figs. 1 and 2) (Scheffler, 1992;avarrete-Linares, 1998). Our isolated sample from Morelostate is genetically close to the ancient Mexican inhabitantsliving there before Christ) particularly according to Nei’s Chordenetic distances (Table 3) and correspondence analysis (Fig. 4).here are two most plausible explanations (among others): (1)
mmigrant Mexicas imposed their language to some ancientnhabitants or (2) Mexicas did not immigrate or did not immi-rate (being an anciently established Mexican group) in recentimes as proposed (Navarrete-Linares, 1998).
In summary, the present study corroborates the restricted
relative homogeneity and cluster separately from other Firstmerican Natives. In spite of this homogeneity, the language
nd genetics do not correlate in Amerindians.

7 ular I
A
NS2dgal
R
A
A
A
A
A
A
A
B
C
C
C
D
D
D
d
F
G
G
G
G
G
G
G
H
I
I
I
I
I
K
K
54 G. Vargas-Alarcon et al. / Molec
cknowledgements
This work was supported in part by grants from the Consejoacional de Ciencia y Tecnologia, Mexico D.F., Mexico; thepanish Ministerio de Educacion (PM-1999-0023 and BMC-001-1299); Fundacion Mutua Madrilena Automovilista; Fun-acion de Estudios geneticos y linguısticos. The authors arerateful to the study participants. Institucional Review Boardpproval was obtained for all sample collections. We would alsoike to thanks Prof. M. Serrano-Rios for his crucial help.
eferences
laez, C., Infante, E., Pujol, J., Duran, C., Navarro, J.L., Gorodezky, C., 2002.Molecular analysis of HLA-DRB1, DQA1, DQB1, DQ promoter polymor-phism and extended class I/class II haplotypes in the Seri Indians fromNorthwest Mexico. Tiss. Antigens 59, 388–396.
rnaiz-Villena, A., Dimitroski, K., Pacho, A., Moscoso, J., Gomez-Casado, E.,Silvera-Redondo, C., Varela, P., Blagoevska, M., Zdravkovska, V., Martinez-Laso, J., 2001. HLA genes in Macedonians and the sub-Saharan origin ofthe Greeks. Tiss. Antigens 57, 118–127.
rnaiz-Villena, A., Iliakis, P., Gonzalez-Hevilla, M., Longas, J., Gomez-Casado,E., Sfyridaki, K., Trapaga, J., Silvera-Redondo, C., Matsouka, C., Martinez-Laso, J., 1999. The origin of Cretan populations as determined by charac-terization of HLA alleles. Tiss. Antigens 53, 213–226.
rnaiz-Villena, A., Martinez-Laso, J., Gomez-Casado, E., Diaz-Campos, N.,Santos, P., Martinho, A., Breda-Coimbra, H., 1997. Relatedness amongBasques, Portuguese, Spaniards, and Algerians studied by HLA allelic fre-quencies and haplotypes. Immunogenetics 47, 37–43.
rnaiz-Villena, A., Martinez-Laso, J., Moscoso, J., Livshits, G., Zamora, J.,Gomez-Casado, E., Silvera-Redondo, C., Melvin, K., Crawford, M.H., 2003.HLA genes in the Chuvashian population from European Russia: admix-ture of Central European and Mediterranean populations. Hum. Biol. 75,375–392.
rnaiz-Villena, A., Siles, N., Moscoso, J., Zamora, J., Serrano-Vela, J.I., Gomez-Casado, E., Castro, M.J., Martinez-Laso, J., 2005. Origin of Aymaras fromBolivia and their relationship with other Amerindians according to HLAgenes. Tiss. Antigens 65, 379–390.
rnaiz-Villena, A., Vargas-Alarcon, G., Granados, J., Gomez-Casado, E., Lon-gas, J., Gonzales-Hevilla, M., Zuniga, J., Salgado, N., Hernandez-Pacheco,G., Guillen, J., Martinez-Laso, J., 2000. HLA genes in Mexican Mazatecans,the peopling of the Americas and the uniqueness of Amerindians. Tiss. Anti-gens 56, 405–416.
annai, M., Tokunaga, K., Imanishi, T., Harihara, S., Fujisawa, K., Juji, T.,Omoto, K., 1996. HLA class II alleles in Ainu living in Hidaka District,Hokkaido, northern Japan. Am. J. Phys. Anthropol. 101, 1–9.
erna, M., Falco, M., Friedman, H., Raimondi, E., Maccagno, A., Fernandez-Vina, M., Stastny, P., 1993. Differences in HLA class II alleles of iso-lated South American Indian populations from Brazil and Argentina. Hum.Immunol. 37, 213–220.
layton, J., Lonjou, C., 1997. Allele and haplotype frequencies for HLAloci in various ethnic groups. In: Charron, D. (Ed.), Genetic Diversityof HLA. Functional and Medical Implications. EDK, Paris, pp. 665–820.
ornuet, J.M., Luikart, G., 1996. Description and power analysis of two tests fordetecting recent population bottlenecks from allele frequency data. Genetics144, 2001–2014.
ausset, J., Svejggard, A., 1977. HLA and disease. Population genetics andevolution of the HLA system. In: Terasaki, P.I. (Ed.), HistocompatibilityTesting. Munksgaard, Copenhagen, pp. 280–292.
egos, L., Dausset, J., 1974. Human migrations and linkage disequilibrium ofHLA system. Immunogenetics 1, 195–210.
e Leo, C., Castelan, N., Lopez, M., Gonzalez, N., Weckmann, A.L., Melin-Aldana, H., Vargas-Alarcon, G., Bordes, J., Alarcon-Segovia, D., Granados,J., Ramirez, E., Lisker, R., 1997. HLA class I and class II alleles and haplo-
K
L
mmunology 44 (2007) 747–755
types in Mexican mestizos established from serological typing of 50 families.Hum. Biol. 69, 809–818.
e Pablo, R., Beraun, Y., Nieto, A., Calzada, J.E., Rementeria, M.C., Sanz,L., Lopez-Nevot, M.A., Martin, J., 2000. HLA class I and class II alleledistribution in the Peruvian population. Tiss. Antigens 56, 507–514.
ernandez-Vina, M.A., Lazaro, A.M., Marcos, C.Y., Nulf, C., Raimondi, E.,Haas, E.J., Stastny, P., 1997. Dissimilar evolution of B-locus versus A-locusand class II loci of the HLA region in South American Indian tribes. Tiss.Antigens 50, 233–250.
ao, X., Bhatia, K., Trent, R.J., Serjeantson, S.W., 1992a. HLA-DR,DQnucleotide sequence polymorphisms in five Melanesian populations. Tiss.Antigens 40, 31–37.
ao, X., Veale, A., Serjeantson, S.W., 1992b. HLA class II diversity in Australianaborigines: unusual HLA-DRB1 alleles. Immunogenetics 36, 333–337.
ao, X., Zimmet, P., Serjeantson, S.W., 1992c. HLA-DR,DQ sequence poly-morphisms in Polynesians, Micronesians, and Javanese. Hum. Immunol.34, 153–161.
eng, L., Imanishi, T., Tokunaga, K., Zhu, D., Mizuki, N., Xu, S., Geng, Z.,Gojobori, T., Tsuji, K., Inoko, H., 1995. Determination of HLA class IIalleles by genotyping in a Manchu population in the northern part of Chinaand its relationship with Han and Japanese populations. Tiss. Antigens 46,111–116.
omez-Casado, E., del Moral, P., Martinez-Laso, J., Garcia-Gomez, A., Allende,L., Silvera-Redondo, C., Longas, J., Gonzalez-Hevilla, M., Kandil, M.,Zamora, J., Arnaiz-Villena, A., 2000. HLA genes in Arabic-speaking Moroc-cans: close relatedness to Berbers and Iberians. Tiss. Antigens 55, 239–249.
omez-Casado, E., Martinez-Laso, J., Moscoso, J., Zamora, J., Martin-Villa, M., Perez-Blas, M., Lopez-Santalla, M., Lucas, G.P., Silvera, C.,Lowy, E., Arnaiz-Villena, A., 2003. Origin of Mayans according toHLA genes and the uniqueness of Amerindians. Tiss. Antigens 61, 425–436.
rahovac, B., Sukernik, R.I., O’hUigin, C., Zaleska-Rutczynska, Z., Blagitko,N., Raldugina, O., Kosutic, T., Satta, Y., Figueroa, F., Takahata, N., Klein, J.,1998. Polymorphism of the HLA class II loci in Siberian populations. Hum.Genet. 102, 27–43.
ollenbach, J.A., Thomson, G., Cao, K., Fernandez-Vina, M., Erlich, H.A.,Bugawan, T.L., Winkler, C., Winter, M., Klitz, W., 2001. HLA diversity,differentiation, and haplotype evolution in Mesoamerican Natives. Hum.Immunol. 62, 378–390.
manishi, T., Akaza, T., Kimura, A., Tokunaga, K., Gojobori, T., 1992a. Alleleand haplotype frequencies for HLA and complement loci in various ethnicgroups. In: Tsuji, K., Aizawa, M., Sasazuki, T. (Eds.), HLA 1991. OxfordUniversity Press, Oxford, pp. 1065–1220.
manishi, T., Akaza, T., Kimura, A., Tokunaga, K., Gojobori, T., 1992b. Estima-tion of allele and haplotype frequencies for HLA and complement loci. In:Tsuji, K., Aizawa, M., Sasazuki, T. (Eds.), HLA 1991. Oxford UniversityPress, Oxford, pp. 76–79.
manishi, T., Akaza, T., Kimura, A., Tokunaga, K., Gojobori, T., 1992c. Geneticrelationships among various human populations indicated by MHC polymor-phisms. In: Tsuji, K., Aizawa, M., Sasazuki, T. (Eds.), HLA 1991. OxfordUniversity Press, Oxford, pp. 627–632.
nfante, E., Olivo, A., Alaez, C., Williams, F., Middleton, D., de la, R.G., Pujol,M.J., Duran, C., Navarro, J.L., Gorodezky, C., 1999. Molecular analysis ofHLA class I alleles in the Mexican Seri Indians: implications for their origin.Tiss. Antigens 54, 35–42.
zaabel, H., Garchon, H.J., Caillat-Zucman, S., Beaurain, G., Akhayat, O.,Bach, J.F., Sanchez-Mazas, A., 1998. HLA class II DNA polymorphismin a Moroccan population from the Souss, Agadir area. Tiss. Antigens 51,106–110.
apustin, S., Lyshchov, A., Alexandrova, J., Imyanitov, E., Blinov, M., 1999.HLA class II molecular polymorphisms in healthy Slavic individuals fromNorth-Western Russia. Tiss. Antigens 54, 517–520.
imura, M., Crow, J., 1964. The number of alleles that can be maintained in a
finite population. Genetics 49, 725–738.ostyu, D., Amos, B., 1981. Mysteries of the Amerindians. Tiss. Antigens 16,111.
azaro, A.M., Moraes, M.E., Marcos, C.Y., Moraes, J.R., Fernandez-Vina, M.A.,Stastny, P., 1999. Evolution of HLA-class I compared to HLA-class II poly-

ular I
L
L
M
M
M
M
M
M
M
N
N
P
R
S
SS
S
T
V
V
V
Y
G. Vargas-Alarcon et al. / Molec
morphism in Terena, a South-American Indian tribe. Hum. Immunol. 60,1138–1149.
ester, S., Cassidy, S., Humphreys, I., Bennett, G., Hurley, C.K., Boettcher, B.,McCluskey, J., 1995. Evolution in HLA-DRB1 and major histocompatibilitycomplex class II haplotypes of Australian aborigines. Definition of a newDRB1 allele and distribution of DRB1 gene frequencies. Hum. Immunol.42, 154–160.
opez-Lujan, L., 1983. Los Mexicas, ultimos senores de Mesoamerica. GranEnciclopedia de Espana y America. Espasa-Calpe/Argantonio, Madrid.
artinez-Laso, J., de Juan, D., Martinez-Quiles, N., Gomez-Casado, E.,Cuadrado, E., Arnaiz-Villena, A., 1995. The contribution of the HLA-A,-B, -C and -DR, -DQ DNA typing to the study of the origins of Spaniardsand Basques. Tiss. Antigens 45, 237–245.
artinez-Laso, J., Gazit, E., Gomez-Casado, E., Morales, P., Martinez-Quiles,N., Alvarez, M., Martin-Villa, J.M., Fernandez, V., Arnaiz-Villena, A., 1996.HLA DR and DQ polymorphism in Ashkenazi and non-Ashkenazi Jews:comparison with other Mediterraneans. Tiss. Antigens 47, 63–71.
artinez-Laso, J., Sartakova, M., Allende, L., Konenkov, V., Moscoso, J.,Silvera-Redondo, C., Pacho, A., Trapaga, J., Gomez-Casado, E., Arnaiz-Villena, A., 2001. HLA molecular markers in Tuvinians: a population withboth Oriental and Caucasoid characteristics. Ann. Hum. Genet. 65, 245–261.
artinez-Laso, J., Siles, N., Moscoso, J., Zamora, J., Serrano-Vela, J.I., Ira-Cachafeiro, J., Castro, M.J., Serrano-Rios, M., Arnaiz-Villena, A., 2006.Origin of Bolivian Quechua Amerindians: their relationship with otherAmerican Indians and Asians according to HLA genes. Eur. J. Med.Genet.
attiuz, P.L., Ihde, D., Piazza, A., Ceppelini, R., Wodmer, W.F., 1970. Newapproaches to the population genetics and segregation analysis of theHLA system. Histocompatibility Testing. Ed. Munksgaard, Copenhagen,pp. 193–206.
onsalve, M.V., Edin, G., Devine, D.V., 1998. Analysis of HLA class I and classII in Na-Dene and Amerindian populations from British Columbia, Canada.Hum. Immunol. 59, 48–55.
unkhbat, B., Sato, T., Hagihara, M., Sato, K., Kimura, A., Munkhtuvshin,
N., Tsuji, K., 1997. Molecular analysis of HLA polymorphism in Khoton-Mongolians. Tiss. Antigens 50, 124–134.avarrete-Linares, F., 1998. La migracion de los Mexicas. Consejo Nacionalpara la Cultura y las Artes, Mexico D.F.
ei, M., 1972. Genetic distances between populations. Am. Nat. 106, 283.
Y
mmunology 44 (2007) 747–755 755
etzl-Erler, M.L., Gorodezky, C., Layrisse, Z., et al., 1997. Anthropology reportfor the Latin-American Region: Amerindian and admixture populations. In:Charron, D. (Ed.), Genetic Diversity of HLA. Functional and Medical Impli-cations. EDK, Paris, pp. 337–345.
oitberg-Tambur, A., Witt, C.S., Friedmann, A., Safirman, C., Sherman, L.,Battat, S., Nelken, D., Brautbar, C., 1995. Comparative analysis of HLApolymorphism at the serologic and molecular level in Moroccan and Ashke-nazi Jews. Tiss. Antigens 46, 104–110.
aitou, N., Nei, M., 1987. The neighbor-joining method: a new method forreconstructing phylogenetic trees. Mol. Biol. Evol. 4, 406–425.
cheffler, L., 1992. Los indigenas Mexicanos. Panorama, Mexico D.F.chneider, S., Roessli, D., Excoffier, L., 2000. ARLEQUIN: A Software for
Population Genetics Database Analysis, v.2.0. Genetics and Biometry Lab-oratories, Department of Anthropology, University of Geneva.
hriver, M.D., Jin, L., Chakraborty, R., Boerwinkle, E., 1993. VNTR allelefrequency distributions under the stepwise mutation model: a computer sim-ulation approach. Genetics 134, 983–993.
itus-Trachtenberg, E.A., Rickards, O., De Stefano, G.F., Erlich, H.A., 1994.Analysis of HLA class II haplotypes in the Cayapa Indians of Ecuador: anovel DRB1 allele reveals evidence for convergent evolution and balancingselection at position 86. Am. J. Hum. Genet. 55, 160–167.
argas-Alarcon, G., Gamboa, R., Zuniga, J., Hernandez-Pacheco, G., Ramos-Kuri, M., Castillo, E., Gomez-Casado, E., Martinez-Laso, J., Arnaiz-Villena,A., Granados, J., 2000. HLA-DR4 allele frequencies on Indian and Mestizopopulation from Mexico. Hum. Immunol. 61, 341–344.
argas-Alarcon, G., Hernandez-Pacheco, G., Gamboa, R., Zuniga, J., Flores,C., Gomez-Casado, E., Martinez-Laso, J., Granados, J., Arnaiz-Villena, A.,2001. Polymorphism and distribution of HLA-DR2 alleles in Mexican pop-ulations. Hum. Immunol. 62, 286–291.
argas-Alarcon, G., Hernandez-Pacheco, G., Moscoso, J., Perez-Hernandez, N.,Murguia, L.E., Moreno, A., Serrano-Vela, J.I., Granados, J., Arnaiz-Villena,A., 2006. HLA genes in Mexican Teeneks: HLA genetic relationship withother worldwide populations. Mol. Immunol. 43, 790–799.
oung, F.W., Bann, C.M., 1996. A visual statistics system. In: Stine, R.A., Fox,J. (Eds.), Statistical Computing Environments for Social Researches. Sage
Publications, London, pp. 207–236.unis, J.J., Ossa, H., Salazar, M., Delgado, M.B., Deulofeut, R., de la, H.A., Bing,D.H., Ramos, O., Yunis, E.J., Yunis, E.J., 1994. Major histocompatibilitycomplex class II alleles and haplotypes and blood groups of four Amerindiantribes of northern Colombia. Hum. Immunol. 41, 248–258.