ORGANIZATIONAL FORM AND EFFICIENCY: THE COEXISTENCE OF FAMILY TAKAFUL AND LIFE INSURANCE IN MALAYSIA
16
122 JOURNAL OF GLOBAL BUSINESS AND ECONOMICS JULY 2011. VOLUME 3. NUMBER 1 ORGANIZATIONAL FORM AND EFFICIENCY: THE COEXISTENCE OF FAMILY TAKAFUL AND LIFE INSURANCE IN MALAYSIA Norashikin Ismail Senior Lecturer, UiTM Segamat, Johor, Malaysia Prof. Dr. Datuk Syed Othman Alhabshi Professor of Takaful, International Centre for Education in Islamic Finance (INCEIF) Prof. Obiyathulla Bacha Professor of Finance, International Centre for Education in Islamic Finance (INCEIF) ABSTRACT After 25 years in operation, it is time that takaful industry is evaluated in terms of its performance. One of the issues that has impact on efficiency is organization form. There have been two conflicting opinions on this issue. Eling & Luhnen (2010) opined that mutual form is efficient than stock form but Brockett (2005) concluded the opposite. This paper provides an empirical study on the relationship between efficiency and organizational structure for takaful operators in Malaysian dual financial system. A sample of 19 firms is chosen over the period 2004-2009. The selection of inputs and outputs are based on flow approach consistent with Leverty and Grace (2009). The study employed non parametric approach that is Data Envelopment Analysis (DEA) with input orientation measurement to estimate the technical efficiency for both industries. This study applied constant return to scale (CRS) and variable return to scale (VRS) to separate the scale efficiency from the technical efficiency. A Mann Whitney test is employed to examine any significant difference in efficiency between takaful and insurance industry. The findings indicate that there is a significant difference in technical efficiency between takaful industry and insurance industry. It is found that takaful has lower technical efficiency than conventional insurance. Importantly, it shows the organization form has an influence on the efficiency. Finally, the study found that the conventional insurers have higher scale efficiency than takaful industry. Field of research: Efficiency, Organization structure and Data Envelopment Analysis (DEA) ---------------------------------------------------------------------------------------------------------------------------------- 1.0 INTRODUCTION An important issue in financial services sector is efficiency. It evaluates the performance of firms in comparison to those firms adopting the best practice firms. This paper investigates efficiency and organization form in the Malaysian dual insurance system. Interestingly, the Malaysian insurance industry involved two different organizational forms. The takaful operators are similar to mutual form which is owned by policyholders whereas the insurance firms refer to stock form owned by stockholders. In Malaysia, the life insurance is considered as main source of revenue whose total premium has increased by 4% from RM 7234.7million in 2008 to RM7524.4million in 2009. It is noted that performance of Family Takaful industry is better than life insurance if the revenue efficiency and cost efficiency (Cummins, Weiss, Xie & Zie, 2010). Furtherlion over the same period. This indicates that
Transcript of ORGANIZATIONAL FORM AND EFFICIENCY: THE COEXISTENCE OF FAMILY TAKAFUL AND LIFE INSURANCE IN MALAYSIA

122 JOURNAL OF GLOBAL BUSINESS AND ECONOMICS
JULY 2011. VOLUME 3. NUMBER 1
ORGANIZATIONAL FORM AND EFFICIENCY: THE COEXISTENCE OF FAMILY
TAKAFUL AND LIFE INSURANCE IN MALAYSIA
Norashikin Ismail
Senior Lecturer, UiTM Segamat, Johor, Malaysia
Prof. Dr. Datuk Syed Othman Alhabshi
Professor of Takaful, International Centre for Education in Islamic Finance (INCEIF)
Prof. Obiyathulla Bacha
Professor of Finance, International Centre for Education in Islamic Finance (INCEIF)
ABSTRACT
After 25 years in operation, it is time that takaful industry is evaluated in terms of its performance. One
of the issues that has impact on efficiency is organization form. There have been two conflicting opinions
on this issue. Eling & Luhnen (2010) opined that mutual form is efficient than stock form but Brockett
(2005) concluded the opposite. This paper provides an empirical study on the relationship between
efficiency and organizational structure for takaful operators in Malaysian dual financial system. A
sample of 19 firms is chosen over the period 2004-2009. The selection of inputs and outputs are based on
flow approach consistent with Leverty and Grace (2009). The study employed non parametric approach
that is Data Envelopment Analysis (DEA) with input orientation measurement to estimate the technical
efficiency for both industries. This study applied constant return to scale (CRS) and variable return to
scale (VRS) to separate the scale efficiency from the technical efficiency. A Mann Whitney test is
employed to examine any significant difference in efficiency between takaful and insurance industry. The
findings indicate that there is a significant difference in technical efficiency between takaful industry and
insurance industry. It is found that takaful has lower technical efficiency than conventional insurance.
Importantly, it shows the organization form has an influence on the efficiency. Finally, the study found
that the conventional insurers have higher scale efficiency than takaful industry.
Field of research: Efficiency, Organization structure and Data Envelopment Analysis (DEA)
----------------------------------------------------------------------------------------------------------------------------------
1.0 INTRODUCTION
An important issue in financial services sector is efficiency. It evaluates the performance of firms in
comparison to those firms adopting the best practice firms. This paper investigates efficiency and
organization form in the Malaysian dual insurance system. Interestingly, the Malaysian insurance
industry involved two different organizational forms. The takaful operators are similar to mutual form
which is owned by policyholders whereas the insurance firms refer to stock form owned by
stockholders. In Malaysia, the life insurance is considered as main source of revenue whose total
premium has increased by 4% from RM 7234.7million in 2008 to RM7524.4million in 2009. It is noted
that performance of Family Takaful industry is better than life insurance if the revenue efficiency and
cost efficiency (Cummins, Weiss, Xie & Zie, 2010). Furtherlion over the same period. This indicates that
123 JOURNAL OF GLOBAL BUSINESS AND ECONOMICS
JULY 2011. VOLUME 3. NUMBER 1
the rate of growth of takaful industry in terms of contribution or premium is much faster than the
insurance industry.
The modern theory of firm elaborates the agency theory in the organization structure by highlighting the
separation of ownership and control. Jensen and Meckling (1976) pointed that costs and revenue are
potentially affected by agency costs as well as production process and operating environment. In the
insurance industry, agency cost rose from an excessive operating cost and lost revenue due to
conflicting interest among the stakeholders. Agency theory arguments have led to development of
hypotheses about organizational form, based on the observation that stock ownership and mutual
ownership have comparative advantage in dealing with different types of agency cost. Cummin and Zi
(1998) found that mutual form ownership is more effective in controlling owner customer conflicts
because owners are the policyholders and hence mutual companies are more efficient than stock
companies. Similarly, Eling & Luhnen (2009) opined mutual company is more efficient than stock form
company. On the other hand, Brocket, Copper, Golden, Rosseau & Wang (2005) posit stock form is more
efficient than mutual company.
With these two opinions, it has raised doubt on the issue of efficiency for Malaysian Takaful industry in
comparison with conventional insurance. Does the efficiency issue relate to different organization forms
in Malaysia? It is noted that issues relating to insurance efficiency have always been discussed. However,
little empirical study on the relationship between efficiency and organizational form has been
conducted in the Malaysia. The first study is done by Norma, Shabri, Rosylin, Jarita & Rahim (2006) who
investigated the efficiency of eleven life insurers and one Takaful operator, Takaful Nasional over the
period 2002 to 2005. They found that pure efficiency for Takaful Nasional is below industry average
whereas scale efficiency change is equivalent to industry average. However, it is not complete study to
evaluate takaful efficiency with only one takaful operator compared to eleven life insurers.
Therefore, it is important to conduct a comprehensive study on two different organizational forms that
exist in Malaysian insurance industry namely takaful industry and conventional insurance industry. In
general, the aim of study is to investigate the relationship between efficiency and organization form
found in Malaysian Takaful industry in comparison to conventional insurance industry. Specifically, this
study is to measure the technical efficiency for takaful industry and insurance industry. The major
contribution of this study is to indicate the position of takaful industry in terms of level of efficiency.
Henceforth, it would assist the regulators to take steps and efforts to improve the takaful efficiency if it
lacks behind the conventional insurance industry. The second contribution is to provide a signal for
takaful operators to move forward in capturing larger market share. Currently, takaful industry
constitutes 15% of whole insurance industry in terms of total assets.
2.0 EFFICIENCY
Efficiency is described as evaluation of the relationship between inputs and outputs in the production
process. Efficiency measurement is a technique used to examine the performance of firms by computing
the relative efficiency of each firm. Then, individual efficiency score of each firm is compared to the best
practice efficient frontiers consisting of the most efficient firms in the industry. It is found the frontier
methodologies are superior compare to traditional techniques such as financial ratio (Eling & Luhnen,
2010). Following to the rapid growth of takaful industry, this study attempts to test efficiency structure
hypotheses by comparing the efficiency of takaful industry and insurance industry in Malaysia.
According to managerial hypothesis, it predicts that stock ownership will be dominant in the lines of
insurance where managers must be given a relative large amount of discretion in pricing and

124 JOURNAL OF GLOBAL BUSINESS AND ECONOMICS
JULY 2011. VOLUME 3. NUMBER 1
underwriting. While, the expense preference hypothesis predicts that mutual firms will face higher costs
than stock firms after controlling for other firm characteristic. Both of these hypotheses are supporting
the stock form ownership.
There are various types of efficiency such as cost, technical, revenue and profit. Technical efficiency is
defined as the ratio of input usage of fully efficient firm producing the same output to input usage of the
firm under consideration (Cummins, Weiss, Xie & Zie, 2010). From technical efficiency, it indicates the
ability of firm’s to obtain maximum output from a given level of inputs. Besides that, Cummins, Weiss,
Xie & Zie (2010) elaborate cost efficiency as the ratio of the cost of fully efficient firms with the same
output quantities and input prices to the given firm’s actual cost. This implies that cost efficiency
measures the ability of insurance firms to utilize the inputs in optimal proportion given their respective
prices. Revenue efficiency is defined as the ratio of revenue of given firm to ratio of fully efficient firm
with same input vector and output prices ((Cummins, Weiss, Xie & Zie, 2010). Profit efficiency is defined
as the optimal profits earned by firm when firms are operated at fully efficient level by looking at the net
impact of the revenue efficiency and cost efficiency (Cummins, Weiss, Xie & Zie, 2010). Furthermore,
the scale efficiency is estimated by looking at the difference of technical efficiency using constant return
to scale (CRS) and variable return to scale (VRS). The scale efficiency is related to output volumes which
mainly refer to scale economies.
In Malaysia, Shazali Mansur & Alias Kadam (2000) examined the productivity and efficiency for 12 life
insurance firms from year 1987 to 1999. The study has adopted Data Envelopment Analysis (DEA) to
measure technical efficiency and Malmquist Index for productivity. The findings show that average
technical efficiency is considered high with 72.6% over sample period. Barros, Nektarious & Assaf (2010)
analysed 71 insurers operated in the Greek insurance industry over the period 1994 to 2003. They
employed using two stages Data Envelopment Analysis (DEA).They found that overall technical
inefficiency is 12% whereby the gap inefficiency recorded at 5% in 1994 and increased to 24% in 2003.
The main findings indicate the majority of insurance companies are operated on declining efficiency
after 1997. This is due the inadequacies in management, scale and technology.
Fecher (1993) analysed 84 life insurers and 243 non life insurers in French insurance industry for the
period 1984-1989 using parametric approach and non parametric approach, DEA. The main findings
reveal a high correlation between parametric and non parametric results and wide dispersion in the rate
of inefficiency across companies. The results show life and non life have average efficiency of 50% and
30% respectively. This dispersion can be reduced when controlling for variation in scale, ownership,
distribution, reinsurance and claims ratio. In this context, this study highlights the technical efficiency
and scale efficiency only by using the Data Envelopment Analysis (DEA).
3.0 ORGANIZATIONAL FORM
Cummins, Weiss and Zi (1999) examined 206 stock insurers and 211 mutual insurers in U.S over the
period 1981 to 1990. They adopted DEA and Malmquist Index to estimate cost and technical efficiency.
The main findings reveal that stock cost frontier dominates mutual cost frontier. It is shown that firms
with different organizational forms have comparative advantage in minimizing production costs and
agent costs. Similarly, Brocket, Copper, Golden, Rosseau & Wang (2005) found a significant difference
between stock form and mutual form. Interestingly, stock companies are more efficient than mutual
company which is consistent with the expense preference hypothesis. This is because the mutual
companies are not successful in minimizing costs and its failure to choose optimal input mix.

125 JOURNAL OF GLOBAL BUSINESS AND ECONOMICS
JULY 2011. VOLUME 3. NUMBER 1
Jeng & Lai (2005) examined three unique organizational forms of Japanese non life insurance industry
namely keiretsu firms, non specialized independent firms (NSIF) and specialized independent firms (SIF).
The authors attempt to examine the efficiency differences among organizational form by using cross
frontier method and the RAM version of DEA. The results found that keiretsu and independent firms are
equally efficient. The Keiretsu cost frontier dominates the NSIF cost frontier for both keiretsu and NSIF
outputs. This implies NSIF to be less successful than keiretsu in choosing the cost combination of inputs.
The NSIF is having lack advantage in the specialization effect. Fukuyama (1997) investigates 25 life
insurers in Japan over the period 1988 to 1993. The author employed Data Envelopment Analysis (DEA).
The findings found that mutual and stock companies possess identical technologies. It has shown that
the productive efficiency and productivity performance differ across two ownership types and different
economic condition.
Gardner and Grace (1993) investigate 561 life insurers in US for six years starting from 1985 to 1990. The
author employed Distribution free approach (DFA) to estimate firm efficiency and found the average
efficiency within range of 26% to 47% at different significant level. The main findings indicate no
significant relationship between organizational form and efficiency. This implies that mutual or stock is
not related to efficiency. In addition, Cummins and Zi (1998) analysed 445 life insurers in U.S from year
1988 to 1992. The author employed parametric approach and non parametric approach to estimate
cost, technical and allocative efficiency. They found no significant difference in efficiency between stock
and mutual.
Looking at above mentioned studies, it is questionable whether the organization form has an implication
on the efficiency issue in the Malaysia. So, this study attempts to explore the relationship between
efficiency and organization form.
4.0 THEORETICAL FRAMEWORK
4.1 INPUT AND OUTPUT RELATIONSHIP IN INSURANCE (FLOW APPROACH)

126 JOURNAL OF GLOBAL BUSINESS AND ECONOMICS
JULY 2011. VOLUME 3. NUMBER 1
4.2 CONCEPTUAL FRAMEWORK OF TAKAFUL EFFICIENCY STUDY
5.0 METHODOLOGY
5.1 SAMPLE
A sample of 18 firms comprising of 7 takaful operators, 4 life insurer and 7 composite insurers are
chosen for this study. The financial data are gathered from the annual report including the financial
statements and balance sheet. The study employed a pooled cross section and time series data over the
period 2004 to 2009. Essentially, companies included as sample should have a positive value for all
inputs and output for efficiency measurement. In consistent with Leverty & Grace (2009), the flow
approach is technique used to select inputs and outputs. The reason is because it is direct goal
technique in which firm in which firm manager’s balance maintaining short term paying ability and
preserving long term ability to meet its fiduciary responsibilities against earning a reasonable financial
return1. In addition, Brocket, Copper, Golden, Rousseau & Wang (2005) prove that the financial
intermediary approach is better for evaluation of efficiency. It is noted that the flow approach is
modification of financial intermediation approach.
______________ 1
Leverty & Grace (2009), ‘The robustness of output measures in property-liability insurance efficiency studies, Journal of
Banking & Finance,

127 JOURNAL OF GLOBAL BUSINESS AND ECONOMICS
JULY 2011. VOLUME 3. NUMBER 1
There are three inputs used in this study consisting of management expenses, labour costs and invested
assets. The selection of management expenses and labour costs are in accordance with Bikker &
Leuvensteinijn (2008), Cummins & Rubio Misas (2006) whereas the invested asset is chosen similar to
Barros & Obijiaku (2007). For outputs, gross income and investment income are chosen in this study in
accordance with Hwang & Kao (2008), Barros & Obijiaku (2007), Boonyasai (2002), Diacon (2002),
Greene and Segal (2004), Hao (2007),Yao, Han & Feng (2007), Klumpes (2004) and Hao & Chou (2005).
5.2 RESEARCH METHOD
Frontier efficiency measurement namely Data Envelopment Analysis (DEA) is selected to estimate the
efficiency level for both industry. DEA is non parametric approach with linear programming to measure
the relationship of produced goods and services (outputs) to assigned resources (inputs) and determine
the efficiency score as an optimization result . The application of DEA is also consistent with the
numerous researchers like Fukuyama (1997), Cummin (1999) Diacon (2001), Brockett (2005) and
Cummins & Rubio Misas (2006) and Eling & Luhnen (2008). The main strength of DEA is its capability to
capture the interplay between multiple inputs and outputs. Furthermore, it does not require specifying
the functional form or distributional forms for error which seems to more flexible than econometric
approach. Technical efficiency with an input orientation measure is an appropriate technique to be used
in DEA model where the inputs are minimized to produce the same outputs. Technically, the constant
return to scale (CRS) is applied with the assumption that all firms are operating at an optimal scale. In
addition, the variable return to scale (VRS) is also applied to separate the measurement of scale
efficiency from technical efficiency.
DEA efficiency analysis for this study will be carried out using DEA Excel Solver conducted by Zhu (2002) .
Using the duality in linear programming, one can derive an equivalent envelopment form of this
problem for constant return to scale (CRS):
minθ,λθ subject to
- yi + Yλ ≥ 0
θ xi - Xλ ≥ 0
λ ≥ 0 (1)
Where θ is a scalar and is a N x 1 vector of constraints. This envelopment form involves fewer
constraints than the multiplier form (K +M < N +1), and hence is generally the preferred form to solve.
The estimated value of θ obtained is the efficiency score for the each of N firms or DMU. The estimate
will satisfy the restriction θ ≤ 1 with a value of θ =1 indicating a technically efficient insurer according to
the Farrell (1957) definition. The linear programming must be solved N times, once for each DMU or firm
to derive a set of N technical efficiency scores.
______________ 2
Brockett, Cooper, Goldern, Rousseau & Wang (2005), ‘ Financial Intermediary versus Production Approach to Efficiency of
Marketing Distribution Systems and Organizational Structure of Insurance Companies’, The Journal of Risk and Insurance Vol.
72, No.3, pp 393-412 3
Eling & Luhnen (2010), ‘Frontier Efficiency Methodologies to Measure Performance in the Insurance Industry: Overview,
Systematization and Recent Development’, The Geneva Paper, Vol.35,pp 217-265. 3
Joe Zhu (2003). Quantitative Model for Performance Evaluation and Benchmarking: Data Envelopment Spreadsheets and DEA
Excel Solver, Kluwer Academic Publishers. Massachusetts: USA 4
Joe Zhu (2002). Quantitative Model for Performance Evaluation and Benchmarking: DEA with Spreadsheet and DEA Excel
Solver. Kluwer Academic Publishers.
128 JOURNAL OF GLOBAL BUSINESS AND ECONOMICS
JULY 2011. VOLUME 3. NUMBER 1
The CRS linear programming problem can be easily modified to account for variable returns to scale
(VRS) by adding the convexity constraint N 1 = 1 to (Eq. 1) to provide:
minθ,λθ subject to
- yi + Yλ ≥ 0
θ xi - Xλ ≥ 0
N 1′ λ = 1
λ ≥ 0
The convexity constraints (N 1 λ = 1) ensures that an inefficient firm is benchmarked against firms of
similar size and the projected point of firm on the DEA frontier will be a convex combination of observed
firm.
Since the sample size is small, a Mann Whitney test is used to determine any significant difference in the
technical efficiency values between takaful operators and insurance companies.
6.0 DISCUSSION OF FINDINGS
The input orientation in DEA model is applied to estimate the technical efficiency score for 19 firms over
the period 2004 to 2009. The estimation of technical efficiency is conducted with the constant return to
scale (CRS) and variable return to scale (VRS) assumption.
6.1 ESTIMATION LEVELS OF TECHNICAL EFFICIENCY (TE)
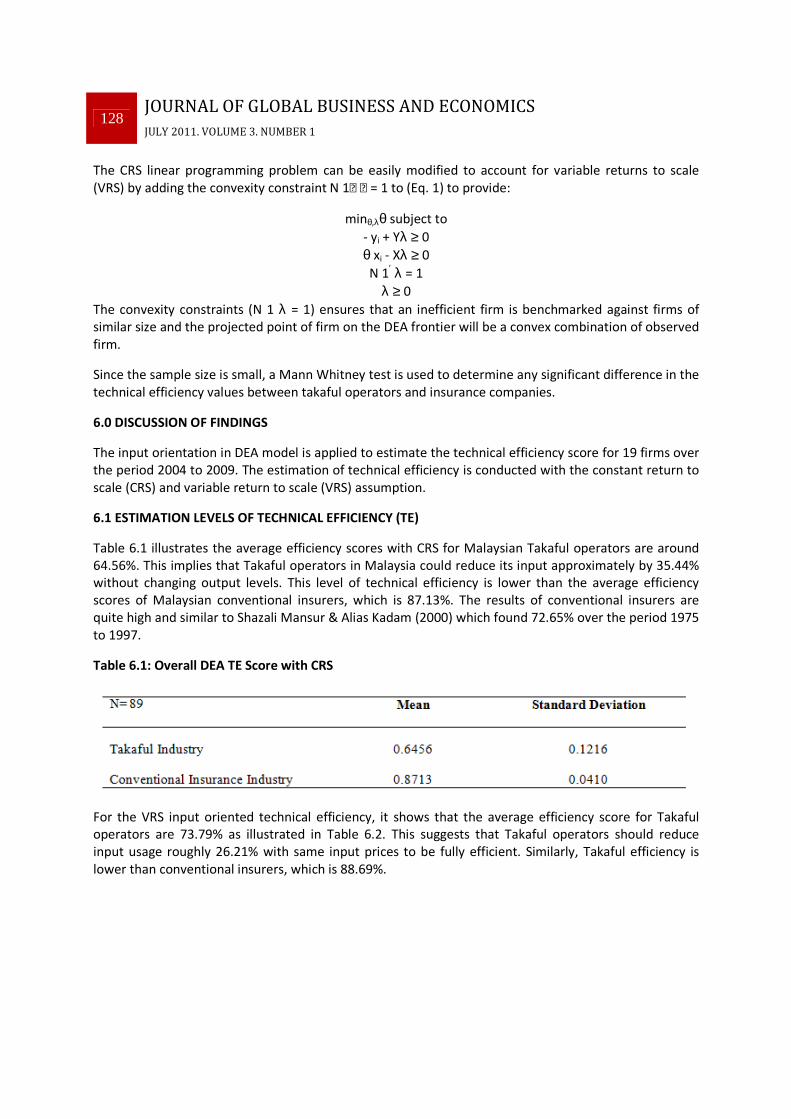
Table 6.1 illustrates the average efficiency scores with CRS for Malaysian Takaful operators are around
64.56%. This implies that Takaful operators in Malaysia could reduce its input approximately by 35.44%
without changing output levels. This level of technical efficiency is lower than the average efficiency
scores of Malaysian conventional insurers, which is 87.13%. The results of conventional insurers are
quite high and similar to Shazali Mansur & Alias Kadam (2000) which found 72.65% over the period 1975
to 1997.
Table 6.1: Overall DEA TE Score with CRS
For the VRS input oriented technical efficiency, it shows that the average efficiency score for Takaful
operators are 73.79% as illustrated in Table 6.2. This suggests that Takaful operators should reduce
input usage roughly 26.21% with same input prices to be fully efficient. Similarly, Takaful efficiency is
lower than conventional insurers, which is 88.69%.

129 JOURNAL OF GLOBAL BUSINESS AND ECONOMICS
JULY 2011. VOLUME 3. NUMBER 1
Table 6.2: Overall DEA TE Score with VRS
It seems that average efficiency with VRS is higher than CRS for both takaful industry and insurance
industry. The rationale of subscribing VRS is based on the difficulty for Takaful operators to operate at
optimal scale if using CRS. Under CRS, it assumes that an increase in use of inputs will result to the same
proportion increase in outputs. This is not the case for Malaysian takaful industry which seems not
perfect market competition with the regulations is governed by Bank Negara Malaysia (BNM). One of
the advantages of VRS is that it enables us to separate the measurement of scale efficiency from the
pure technical efficiency.
Even though the efficiency results of Takaful industry is lower than conventional insurance for CRS and
VRS, it is still acceptable. The fact is the conventional insurance has been in the market for more than
hundred years. But, the Takaful industry is already in existence for about 25 years which is too short
period.
6.2 AVERAGE TAKAFUL AND INSURANCE EFFICIENCY OVER TIME
The Figure 6.1 plots the technical efficiency trend of Malaysian Takaful industry and conventional
insurance from 2004 to 2007. The results show that the technical efficiency of Malaysian Takaful
industry has increased from 46.34% in 2004 to 72.17% in 2009. However, the technical efficiency for
conventional insurance industry has declined from 93.87% to 84.60% over the same period. This
indicates the participation of more takaful operators has negative impact to conventional insurance
industry. It implies a good indication for Takaful industry to grow further and strengthen the Islamic
finance industry in terms of efficiency.
Figure 6.2 exhibits the technical efficiency trend of Malaysian Takaful industry and conventional
insurance from year 2004 to 2007 under VRS assumption. It shows that the technical efficiency of
Malaysian Takaful industry has slightly increased from 71.99% in 2004 to 75.25% in 2009. Similarly, the
technical efficiency for conventional insurance industry has shown slightly increased from 83.33% in
2004 to 88.86% in 2009. Overall, the trend technical efficiency for conventional insurance industry is
higher than takaful industry over the period 2004 to 2009.

130 JOURNAL OF GLOBAL BUSINESS AND ECONOMICS
JULY 2011. VOLUME 3. NUMBER 1
Figure 6.1: DEA Technical Efficiency Trend of Takaful and Insurance Industry
Figure 6.2: DEA Technical Efficiency Trend of Takaful and Insurance Industry
131 JOURNAL OF GLOBAL BUSINESS AND ECONOMICS
JULY 2011. VOLUME 3. NUMBER 1
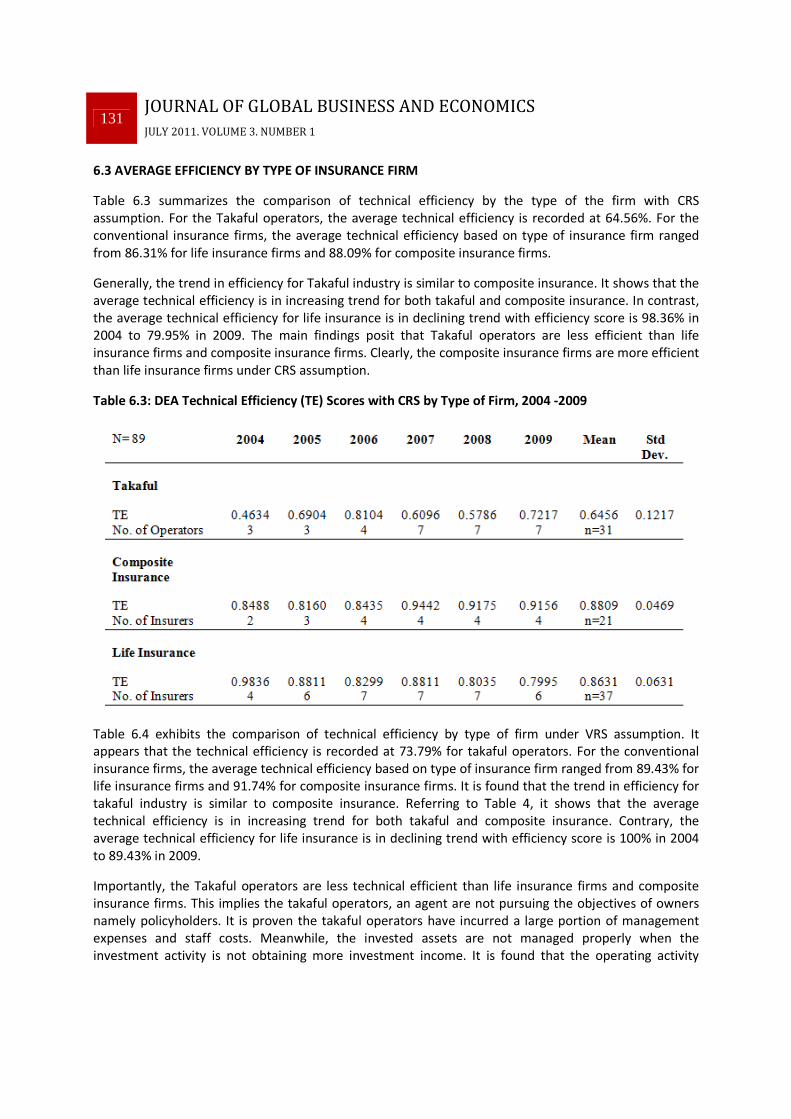
6.3 AVERAGE EFFICIENCY BY TYPE OF INSURANCE FIRM
Table 6.3 summarizes the comparison of technical efficiency by the type of the firm with CRS
assumption. For the Takaful operators, the average technical efficiency is recorded at 64.56%. For the
conventional insurance firms, the average technical efficiency based on type of insurance firm ranged
from 86.31% for life insurance firms and 88.09% for composite insurance firms.
Generally, the trend in efficiency for Takaful industry is similar to composite insurance. It shows that the
average technical efficiency is in increasing trend for both takaful and composite insurance. In contrast,
the average technical efficiency for life insurance is in declining trend with efficiency score is 98.36% in
2004 to 79.95% in 2009. The main findings posit that Takaful operators are less efficient than life
insurance firms and composite insurance firms. Clearly, the composite insurance firms are more efficient
than life insurance firms under CRS assumption.
Table 6.3: DEA Technical Efficiency (TE) Scores with CRS by Type of Firm, 2004 -2009
Table 6.4 exhibits the comparison of technical efficiency by type of firm under VRS assumption. It
appears that the technical efficiency is recorded at 73.79% for takaful operators. For the conventional
insurance firms, the average technical efficiency based on type of insurance firm ranged from 89.43% for
life insurance firms and 91.74% for composite insurance firms. It is found that the trend in efficiency for
takaful industry is similar to composite insurance. Referring to Table 4, it shows that the average
technical efficiency is in increasing trend for both takaful and composite insurance. Contrary, the
average technical efficiency for life insurance is in declining trend with efficiency score is 100% in 2004
to 89.43% in 2009.
Importantly, the Takaful operators are less technical efficient than life insurance firms and composite
insurance firms. This implies the takaful operators, an agent are not pursuing the objectives of owners
namely policyholders. It is proven the takaful operators have incurred a large portion of management
expenses and staff costs. Meanwhile, the invested assets are not managed properly when the
investment activity is not obtaining more investment income. It is found that the operating activity

132 JOURNAL OF GLOBAL BUSINESS AND ECONOMICS
JULY 2011. VOLUME 3. NUMBER 1
namely as underwriting is not gaining more premium or contribution. There is possibility a higher agency
cost was involved in the management expenses and staff cost. Eventually, higher cost stems from
agency cost instead of gaining more income from underwriting and investment activity. Overall, the
technical efficiency under VRS is higher than CRS for all types of firm.
Table 6.4: DEA Technical Efficiency (TE) Scores with VRS by Type of Firm, 2004 -2009
Table 6.5: ANOVA Result between DEA TE and Organization Form for CRS
A statistical test of ANOVA in Table 6.5 shows there was a significant difference in the level of technical
efficiency (F=18.541, df =1,11, p=0.002) for all type of insurance firms. This technical efficiency is based
on CRS assumption. The strength of a relationship between technical and type of insurance is analysed
again using Mann Whitney Test.
133 JOURNAL OF GLOBAL BUSINESS AND ECONOMICS
JULY 2011. VOLUME 3. NUMBER 1
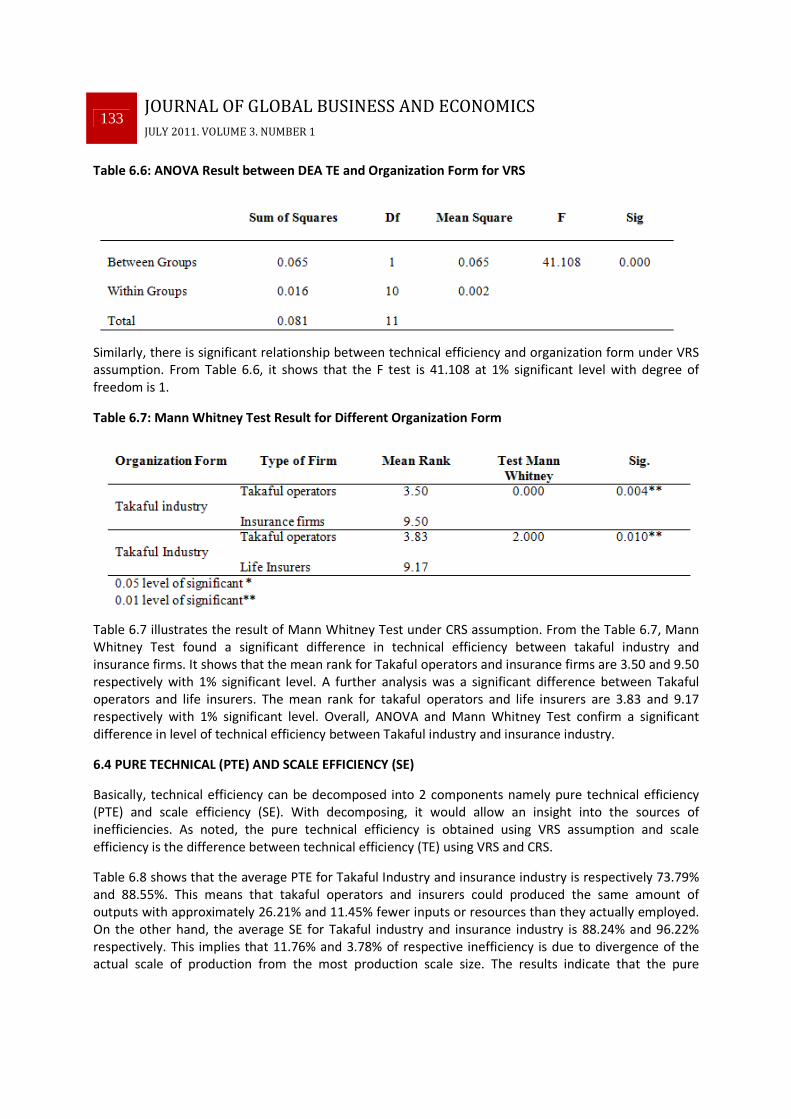
Table 6.6: ANOVA Result between DEA TE and Organization Form for VRS
Similarly, there is significant relationship between technical efficiency and organization form under VRS
assumption. From Table 6.6, it shows that the F test is 41.108 at 1% significant level with degree of
freedom is 1.
Table 6.7: Mann Whitney Test Result for Different Organization Form
Table 6.7 illustrates the result of Mann Whitney Test under CRS assumption. From the Table 6.7, Mann
Whitney Test found a significant difference in technical efficiency between takaful industry and
insurance firms. It shows that the mean rank for Takaful operators and insurance firms are 3.50 and 9.50
respectively with 1% significant level. A further analysis was a significant difference between Takaful
operators and life insurers. The mean rank for takaful operators and life insurers are 3.83 and 9.17
respectively with 1% significant level. Overall, ANOVA and Mann Whitney Test confirm a significant
difference in level of technical efficiency between Takaful industry and insurance industry.
6.4 PURE TECHNICAL (PTE) AND SCALE EFFICIENCY (SE)
Basically, technical efficiency can be decomposed into 2 components namely pure technical efficiency
(PTE) and scale efficiency (SE). With decomposing, it would allow an insight into the sources of
inefficiencies. As noted, the pure technical efficiency is obtained using VRS assumption and scale
efficiency is the difference between technical efficiency (TE) using VRS and CRS.
Table 6.8 shows that the average PTE for Takaful Industry and insurance industry is respectively 73.79%
and 88.55%. This means that takaful operators and insurers could produced the same amount of
outputs with approximately 26.21% and 11.45% fewer inputs or resources than they actually employed.
On the other hand, the average SE for Takaful industry and insurance industry is 88.24% and 96.22%
respectively. This implies that 11.76% and 3.78% of respective inefficiency is due to divergence of the
actual scale of production from the most production scale size. The results indicate that the pure

134 JOURNAL OF GLOBAL BUSINESS AND ECONOMICS
JULY 2011. VOLUME 3. NUMBER 1
technical inefficiency is major source of technical inefficiency even though the scale inefficiency is
contributing part of inefficiency. The findings are contrary to Norma, Shabri, Rosylin, Jarita & Rahim
(2006) for Malaysian life insurance which concluded that efficiency change is largely contributed by scale
efficiency rather than pure technical efficiency. This finding posits that the technical inefficiency
exhibited by takaful operators and insurers in this sample stem from underutilisation or wastage of
inputs. Overall, the PTE and CE for Takaful industry is lower than the insurance industry.
Table 6.8: Pure Technical Efficiency (PTE) and Scale Efficiency for 2004 to 2009

135 JOURNAL OF GLOBAL BUSINESS AND ECONOMICS
JULY 2011. VOLUME 3. NUMBER 1
7.0 CONCLUSION
It is revealed a significant difference in efficiency was found between Takaful industry and insurance
industry. This is proven that takaful industry is less efficient than insurance industry for CRS and VRS
assumption. In addition, Takaful industry has lower PTE and SE than insurance industry. Therefore, it
confirms that the organization form has direct implication on the efficiency. This is consistent with
managerial hypothesis and expense preference hypothesis as stated by Cummins, Weiss and Zi (1999).
Both hypotheses predict mutual form namely takaful industry in this study is not effective in controlling
the agency conflict and incurring higher agency cost than insurance industry. The tendency of higher
agency cost is found when the takaful operators are incurring higher management expenses and staff
cost. Furthermore, the lower investment income implies takaful operators are not invested their assets
well resulting to lower investment performance. It confirms the agency problem is existence in the
takaful industry. Importantly, the findings of this study is in accordance with Brocket, Copper, Golden,
Rosseau & Wang (2005) who concluded stock form is efficient than mutual form. Finally, it is essential to
conduct other forms of efficiency namely cost and profit efficiency for clear picture and comprehensive
study of efficiency.
REFERENCES
Abdul Kadar, Adams & Hardwick (2009). The Cost Efficiency of Takaful Insurance Companies. Geneva
Paper on Risk and Insurance: Issues & Practice (1),161
Barros, Nektarious & Assaf (2010). Efficiency in the Greek Insurance Industry. European Journal of
Operational Research’, 205, 431-436.
Barros & Obijiaku (2007). Technical Efficiency of Nigerian insurance companies. Working paper No.18.
Department of Economics, Institute of Economics and Business Administration (IESG). Technical
University of Lisbon.
Bikker & Leuvensteijn (2008). Competition and Efficiency in the Dutch life Insurance industry. Applied
Economics, .40 (16), 2063- 2084.
Boonyasai (2002). The effect of Liberalisation and Deregulation on Life Insurer Efficiency. Working paper,
No.2, Centre for Risk Management and Insurance Research, Georgia State University, Atlanta.
Brockett, Cooper, Golden, Rousseau & Wang (2005). Financial Intermediary versus Production Approach
to Efficiency of Marketing Distribution Systems and Organizational Structure of Insurance
Companies. The Journal of Risk and Insurance, 72(3), 393-412
Chou & Hau (2005). The Estimation of Efficiency for life Insurance Industry: The Case in Taiwan. Journal
of Asian Economics, 16, 847-860.
Cummin & Rubio Misas (2006). Deregulation, Consolidation & Efficiency: Evidence from the Spanish
Insurance Industry. Journal of Money, Credit and Banking, .38 (2), 323-355.
Cummin, Weiss, Xie & Zi (2010). Economies of scope in Financial Services: A DEA Efficiency Analysis of
the U.S insurance industry. Journal of Banking and Finance, 34, 1525-1539.

136 JOURNAL OF GLOBAL BUSINESS AND ECONOMICS
JULY 2011. VOLUME 3. NUMBER 1
Cummins & Banker (2010). Performance Measurement in the Financial Services Sector: Frontier
Methodologies and other innovative techniques. Journal of Banking and Finance, 34, 1413-1416.
Cummin & Zi (1998). Comparison of frontier efficiency methods: An application to the U.S life insurance
industry. Journal of Productivity Analysis, 10 (2), 131-152.
Cummins, Weiss & Zi (1999). Organizational Form and Efficiency: The coexistence of stock and mutual
property liability insurers, Management Science 45 (9), 1254-1269.
Diacon (2001). The efficiency of UK General insurance companies. Working paper, Centre for Risk &
Insurance Studies, University of Nottingham.
Eling & Luhnen (2010). Frontier Efficiency Methodologies to Measure Performance in the Insurance
Industry: Overview, Systematization and Recent Development. The Geneva Paper, 35, 217-265.
Fetcher, Perelman & Pestieau (1993). Productive performance of the French insurance industry. Journal
of Productivity Analysis 4(1-2), 77-93.
Fukuyama (1997). Investigating productive efficiency and productivity change of non life insurance
companies in Japan. Pacific Basin Finance Journal, 5(4), 481-509.
Gardner & Greece (1993). X- efficiency in the U.S life insurance industry. Journal of Banking and Finance,
17, 497-510.
Greene & Segal (2004). Profitability and efficiency in the U.S life insurance industry. Journal of
Productivity Analysis, 21 (3), 229 – 247.
Hao (2007). Efficiency Test on Taiwan life Insurance Industry using X-efficiency Approach. Information
and Management Sciences 18(1), 37-48.
Hao & Chou (2005). The estimation of efficiency for life insurance industry: The Case in Taiwan. Journal
of Asia Economics, 16 (5), 847-860.
Hwang & Kao (2008). Efficiency Decomposition in Two stage Data envelopment Analysis: An Application
to Non Life Insurance Companies in Taiwan. European Journal of Operational Research 185 (1),
418 - 429.
Jeng & Lai (2005). Ownership structure, agency costs, specialization and efficiency: An analysis of
Keiretsu and Independent insurers in the Japanese nonlife insurance industry. Journal of Risk
and Insurance 72 (1), 105- 158.
Joe Zhu (2003). Quantitative Model for Performance Evaluation and Benchmarking: Data Envelopment
Analysis with Spreadsheet and DEA Excel Solver. Kluwer Academic Publishers. Massachusetts.
USA
Klumpes, (2004).Performance benchmarking in financial services: Evidence from the UK Life Insurance
Industry. Journal of Business, 77 (2), 257-274.
Leverty & Grace (2009). The Robustness of Output measures in Property- Liability Insurance Efficiency
Studies. Journal of Banking & Finance,

137 JOURNAL OF GLOBAL BUSINESS AND ECONOMICS
JULY 2011. VOLUME 3. NUMBER 1
Norma, Shabri, Rosylin, Jarita & Rahim (2006).Measuring Efficiency of Insurance and Takaful Companies
in Malaysia Using Date Envelopment Analysis (DEA). Review of Islamic Economics, 10(2), 5-26.
Shazali Mansur & Alias Kadam (2009). Productivity and Efficiency Performance of the Malaysian Life
Insurance Industry. Jurnal Ekonomi Malaysia 34 (2000), 93-105.
Yao, Han & Feng (2007). On Technical Efficiency of China Insurance Industry after WTO accession. China
Economic Review 18 (1), 66-86.