Organizational culture and good governance in the public sector
454
ORGANIZATIONAL CULTURE AND GOOD GOVERNANCE IN THE PUBLIC SECTOR: THE CASE OF PROVINCIAL ADMINISTRATION IN THAILAND By OURATHAI YOSINTA A thesis submitted to the University of Birmingham for the degree of DOCTOR OF PHILOSOPHY International Development Department School of Government and Society College of Social Sciences University of Birmingham September 2016
-
Upload
khangminh22 -
Category
Documents
-
view
1 -
download
0
Transcript of Organizational culture and good governance in the public sector

ORGANIZATIONAL CULTURE
AND GOOD GOVERNANCE
IN THE PUBLIC SECTOR: THE CASE
OF PROVINCIAL ADMINISTRATION
IN THAILAND
By
OURATHAI YOSINTA
A thesis submitted to the University of Birmingham
for the degree of
DOCTOR OF PHILOSOPHY
International Development Department
School of Government and Society
College of Social Sciences
University of Birmingham
September 2016

University of Birmingham Research Archive
e-theses repository This unpublished thesis/dissertation is copyright of the author and/or third parties. The intellectual property rights of the author or third parties in respect of this work are as defined by The Copyright Designs and Patents Act 1988 or as modified by any successor legislation. Any use made of information contained in this thesis/dissertation must be in accordance with that legislation and must be properly acknowledged. Further distribution or reproduction in any format is prohibited without the permission of the copyright holder.
ABSTRACT
This research investigated the relationship between organizational culture and
public sector performance management. The research was based on a study of
the promotion of good governance in the Thai public sector through the
implementation of the performance agreement (PA) scheme, using Key
Performance Indicators (KPIs). The scheme had faced numerous challenges,
perceived to be influenced by organizational culture. It had been assumed that
a transformational shift in the organizational culture of the civil service, in the
direction of market-based or new public management (NPM) values, was required
in order to secure improved performance. The research aimed to explore how
organizational culture influences civil service performance and identify
other organizational factors that may also influence civil service performance in
the provincial administration of Thailand.
The research used a mixed methods approach of questionnaire surveys and
semi-structured interviews, based on the Competing Values Framework (CVF).
Questionnaire surveys were carried out with 480 civil servants within 16
provinces. Semi-structured interviews – in-depth and focus group – were
conducted within four provinces. A distinction was made between the low and
high KPI scoring provinces.
The findings of the research suggest that there was no dominant type of culture in
the low and high KPI scoring provinces. Instead, a strong culture was found to be
important in gaining high KPI scores, supported by participative leadership and
appropriate management. Leadership style appeared to influence whether
the public services performed to a high level, which seemed to be achieved through
a balance between task focussed and people focussed. Therefore, a
transformational cultural shift may not be required, but instead more effective
leadership and management.

DEDICATION
I dedicate this to my mother and father;
Aura & Pong Yosinta
Who love, support and pray everyday for me
and make me able to achieve my study and have honour
Along with all respected
Teachers

DECLARATION
I declare that this thesis, which I submit to the University of
Birmingham in consideration of the award for the degree of Doctor of
Philosophy, is my original research work. No portion of the thesis has
been submitted to other Universities or institutions.
ACKNOWLEDGEMEANTS
My ultimate dream to achieve my PhD study would not have been possible, if I do
not have great sources of encouragement from several persons throughout my
studying period.
Firstly, I am heartily thankful to my supervisors, Adrian Campbell and Fiona
Nunan, whose continuous support and guidance throughout the study period at the
University of Birmingham have enabled me to develop my understanding of the
subject. I am deeply grateful for the impressive professionalism and kindness of
Adrian, who has provided helpful suggestions for the content of my research and
resourceful material. Additionally, I give greatest thanks to Fiona, my second
supervisor, who always provides a great deal of feedback on my work, clarifies
dilemmas arising from understanding research, and is completely patient and
supportive on my writing.
I would like to thank my friend, Jutharath Voraprateep, who made this research
possible in particular statistical analysis. Additionally, my friends on the 10th floor
of the Muirhead Tower, room 1030, especially Yogi, Mattias, Philipp, Eimi,
Mohamed, Sherry, Minie, Saban and other supportive friends who are not named
here.
I am deeply indebted to the Royal Thai government for the provision of the full
scholarship for the study at doctoral level. Moreover, I would like to thank the
Office of the Public Sector Development Commission (OPDC), who gave me a
great opportunity to study PhD, do my research, and support me during the
fieldwork in Thailand. I would like to express my gratitude to executives at the
OPDC, especially Thosaporn Sirisumphand, Avoot Wannvong, Tusanee Dusitsutirat,
Nakornkate Suthapreda, Darat Boripanthakul and Kanita Soodkangwal. I am also
thankful to my colleagues at the OPDC, particularly Usa Panyawadee, Nicha
Sathornkich, Sunee Makpol, Natchaya Kruehongsa, Narinthorn Seschote,
Boonyanee Pansamrit, Peerasak Nondapawraya and Porntip Leeragomesmas.
I am also grateful to the Provincial Governors of the 16 provinces that granted
access for the processes of data collection in the provinces. I am additionally in
gratitude to the chiefs of the provincial agencies that collaborated and took part in
this research as well as the contact persons who facilitated, coordinated, and
arranged for collecting data. I am especially grateful to all those in the provincial
agencies who gave their time to this research as respondents to questionnaire
surveys and interviews.
I would like to thank Lynne Round and Helen Joinson for proofreading of parts of
my thesis.
Last but not least I wholeheartedly thank my parents, Pong and Aura Yosinta, for
allowing me to study abroad, get an opportunity to learn wide world and
continuously support. My older sister, Phayom Yosinta, for being supportive and
suggesting.

TABLE OF CONTENTS
CHAPTER 1 INTRODUCTION .............................................................. 1
1.1 Research problem ............................................................................. 1
1.2 Why Thailand? ................................................................................. 5
1.3 Aims and objectives of the study ..................................................... 6
1.4 Research questions ........................................................................... 7
1.5 Theoretical underpinnings ................................................................ 8
1.6 Research method, design and methodology ..................................... 9
1.6.1 Research method ........................................................................... 9
1.6.2 Research design and methodology ............................................. 9
1.7 Summary ........................................................................................ 10
1.7.1 Key findings and implications .................................................. 10
1.7.2 Limitations ................................................................................... 14
1.8 Structure of the thesis ..................................................................... 16
CHAPTER 2 LITERATURE REVIEW ................................................ 19
2.1 Introduction .................................................................................... 19
2.2 Pursuing good governance ............................................................. 20
2.2.1 Initiatives in pursuing good governance .................................. 20
2.2.2 Interpretation of good governance .......................................... 21
2.2.3 Implementation of good governance through performance
measurement ......................................................................................... 24
2.3 Determinants of performance ......................................................... 25
2.3.1 Performance management system (PMS) ............................... 25
2.3.2 Nature of performance management in the public sector...... 29
2.3.3 Determinants affecting performance ........................................ 30
2.4 Organizational culture .................................................................... 38
2.4.1 Definition of organizational culture ......................................... 38
2.4.2 Correlation between strong culture and performance ............ 44
2.4.3 Theories and empirical studies of organizational culture ...... 48
2.4.4 Development of analytical framework .................................... 59
2.5 Summary ........................................................................................ 62

CHAPTER 3 CULTURE AND GOOD GOVERNANCE IN
THAILAND ......................................................................................... .....63
3.1 Introduction .................................................................................... 63
3.2 Background .................................................................................... 64
3.2.1 General information on Thailand ............................................. 64
3.2.2 Politics .......................................................................................... 65
3.2.3 Provincial administration ........................................................... 69
3.3 Culture and values .......................................................................... 70
3.3.1 Thai national culture and values ............................................... 70
3.3.2 Values of the Thai public sector ............................................... 79
3.4 Development of good governance in Thailand .............................. 81
3.4.1 Civil service reform before 2002 .............................................. 82
3.4.2 Civil service reform after 2002 ................................................. 84
3.5 Performance agreement (PA) in provincial administration ............ 92
3.6 Summary ........................................................................................ 99
CHAPTER 4 RESEARCH DESIGN AND METHODOLOGY ........ 101
4.1 Introduction .................................................................................. 101
4.2 Research philosophy .................................................................... 101
4.3 Research design ............................................................................ 103
4.4 Research methodology ................................................................. 109
4.4.1 Selection of research method .................................................. 109
4.4.2 Sampling cases .......................................................................... 119
4.5 Research approach........................................................................ 132
4.6 Data collection.............................................................................. 134
4.7 Data analysis and Interpretation ................................................... 138
4.7.1 Quantitative data analysis ........................................................ 138
4.7.2 Qualitative data analysis .......................................................... 140
4.8 Research ethics ............................................................................. 142
4.9 Summary ...................................................................................... 145
CHAPTER 5 RESEARCH FINDINGS: QUANTITATIVE DATA . 146
5.1 Introduction .................................................................................. 146
5.2 Respondents to the questionnaire survey ..................................... 147
5.3 Overall organizational culture profile of the provincial cases ..... 149
5.3.1 Overall organizational culture profile of 16 provinces ........ 149
5.3.2 Organizational culture profile of senior managers and
practitioners ......................................................................................... 153
5.3.3 Organizational culture profiles by sex, age and
organizations ....................................................................................... 157
5.4 Comparison of organizational culture profiles between the low and
high KPI scoring provinces ................................................................ 162
5.4.1 Comparison of organizational culture profiles between the
low and high KPI scoring provinces ................................................ 162
5.4.2 Comparison of organizational culture profiles between senior
managers in the low and high KPI scoring provinces ................... 164
5.4.3 Comparison of organizational culture profiles between
practitioners in the low and high KPI scoring groups ................... 167
5.5 Description of job satisfaction based on the provincial cases ...... 170
5.5.1 Overall job satisfaction in 16 provinces ................................ 170
5.5.2 Comparison of job satisfaction between the low and high KPI
scoring provinces ................................................................................. 172
5.5.3 Comparison of job satisfaction between senior managers in the
low and high KPI scoring provinces .................................................. 174
5.5.4 Comparison of job satisfaction between practitioners in the low
and high KPI scoring groups .............................................................. 175
5.6 Summary ...................................................................................... 177
CHAPTER 6 RESEARCH FINDINGS: QUALITATIVE DATA .... 179
6.1 Introduction .................................................................................. 179
6.2 Leadership .................................................................................... 180
6.2.1 The contribution of work or information .................................. 181
6.2.2 Prior support from leaders ......................................................... 184
6.2.3 Support from leaders during the process .................................. 186
6.2.4 The use of the leaders’ authority ............................................... 190
6.2.5 The leaders’ consideration of performance-related reward ..... 192

6.3 Human resources and reward ....................................................... 193
6.3.1 Recruitment of the responsible persons for the KPIs ............... 194
6.3.2 Assumptions on PA .................................................................... 198
6.3.3 Characteristics of team of Provincial Governor’s Office ........ 201
6.3.4 Training and meetings ................................................................ 202
6.3.5 Rotation of personnel ................................................................. 205
6.3.6 Pressure of work ......................................................................... 207
6.3.7 Performance-related pay (PRP) ................................................. 211
6.3.8 Recommendations to improve the criteria of incentive
allocation .............................................................................................. 220
6.4 Performance, outputs and outcomes............................................. 226
6.4.1 Capabilities of individuals and teams ....................................... 227
6.4.2 Promulgation of PA in each fiscal year .................................... 231
6.4.3 Factors influencing performance ............................................... 232
6.4.4 Advantages and disadvantages in achieving high and low KPI
scores .................................................................................................... 240
6.4.5 Outputs and outcomes of PA ..................................................... 244
6.4.6 Recommendations for PA .......................................................... 248
6.5 Summary ...................................................................................... 250
CHAPTER 7 DISCUSSION OF ORGANIZATIONAL CULTURE
AND GOOD GOVERNANCE .............................................................. 252
7.1 Introduction .................................................................................. 252
7.2 Cultural determinants of performance.......................................... 252
7.2.1 The hierarchy culture ................................................................. 253
7.2.2 The clan culture .......................................................................... 260
7.2.3 The market culture ..................................................................... 269
7.2.4 The adhocracy culture ................................................................ 275
7.3 Crosscutting themes ..................................................................... 279
7.4 Typical characteristics of the low and high KPI scoring
provinces ............................................................................................ 287
7.5 Summary ...................................................................................... 293

CHAPTER 8 CONCLUSION ............................................................... 295
8.1 Introduction .................................................................................. 295
8.2 Conclusions and implications....................................................... 295
8.2.1 Conclusions of the research ....................................................... 295
8.2.2 Implications of attainment of good governance at the provincial
administration ...................................................................................... 302
8.3 Contributions to theory................................................................. 304
8.3.1 Analytical framework ................................................................ 307
8.3.2 Particularity of study focus ........................................................ 307
8.3.3 Conclusions of theoretical contribution .................................... 308
8.4 Reflections on the research .......................................................... 310
8.4.1 Development of analytical framework ..................................... 310
8.4.2 Research design and methods .................................................... 312
8.5 Policy implication and recommendations .................................... 313
8.5.1 Recommendations for the incentive scheme ............................ 314
8.5.2 Recommendations for the overall implementation of the PA
scheme .................................................................................................. 315
8.6 Limitations of the research ........................................................... 316
8.6.1 Survey limitations ...................................................................... 316
8.6.2 Interview limitations .................................................................. 317
8.6.3 Overall limitations ...................................................................... 319
8.7 Recommendations for future research.......................................... 320
8.8 Summary ...................................................................................... 322
Appendix 1: The definitions of governance and good governance .... 324
Appendix 2: The definitions of nine key components of good
governance .............................................................................................. 351
Appendix 3: The definitions of performance, performance
management and performance measurement .................................... 358
Appendix 4: The definitions of organizational culture ....................... 367
Appendix 5: The Organizational Culture Assessment Instrument
(OCAI) ..................................................................................................... 373
Appendix 6: The KPIs within each dimension of performance
evaluation framework between fiscal year B.E. 2550 (2007) and B.E.
2554 (2011) and KPI host agencies ....................................................... 377
Appendix 7: Provincial administration ................................................ 382
Appendix 8: Questionnaire survey, Guideline of semi-structured
interviews, and Coding of the qualitative data .................................... 393
Appendix 9: Consent form for interviews ............................................ 405
Appendix 10: Coding information of the surveys and the
interviews ................................................................................................ 411
Appendix 11: Organizational culture profiles of 16 provinces .................. 413
Appendix 12: Respondents to the interviews ....................................... 416
REFERENCES ....................................................................................... 417
LIST OF FIGURES
Figure 1 An illustration to approach the literature review structure ................... 19
Figure 2 The relationship between the values in the Competing Values
Framework (CVF) ................................................................................. 50
Figure 3 Organizational Culture Profile .............................................................. 53
Figure 4 The Competing Values Framework of Organizational Culture (CVF) 53
Figure 5 The analytical framework of the study ................................................. 58
Figure 6 Development process of analytical framework .................................... 60
Figure 7 Overall development of good governance in Thailand based on the
legislation and plans ............................................................................... 82
Figure 8 The major legislation and plans following the civil service reform in
2002 for delivering good governance in Thailand ................................ 85
Figure 9 The four dimensions of the performance evaluation framework in relation
to the key components of good governance ............................................ 91
Figure 10 The structure of provincial administration .......................................... 93
Figure 11 The process of creating performance agreement (PA) in the Thai public
sector ..................................................................................................... 96
Figure 12 The guideline of creating performance agreement (PA) in the provincial
administration ........................................................................................ 97
Figure 13 Summary of the constraints in the process of PA in the Thai public
sector ..................................................................................................... 99
Figure 14 Public sector culture in Thailand based on a balance between
bureaucratic culture, political culture, and national culture ................ 100
Figure 15 Sampling diagram for questionnaire survey ..................................... 123
Figure 16 Sampling diagram for interview ....................................................... 129
Figure 17 Summary of the overall research design and methodology .............. 132
Figure 18 Process of getting access to the surveys ........................................... 136
Figure 19 Process of getting access to the interviews ....................................... 137
Figure 20 Overall organizational culture profile of the 16 provinces ............... 150
Figure 21 Comparison of the now and preferred culture mean score of the 16
provinces ............................................................................................. 150
Figure 22 Overall organizational culture profile of the senior managers in
the 16 provinces .................................................................................. 154
Figure 23 Overall organizational culture profile of the practitioners in the 16
provinces ............................................................................................. 154
Figure 24 Comparison of the current culture profiles of the senior managers
and practitioners in the 16 provinces ................................................. 156
Figure 25 Comparison of the current culture mean scores of the senior
managers and practitioners in the 16 provinces ................................. 156
Figure 26 Comparison of the preferred culture profiles the senior managers and
practitioners in the 16 provinces ........................................................ 156
Figure 27 Comparison of the preferred culture mean scores of the senior
managers and practitioners in the 16 provinces ................................. 156
Figure 28 Comparison of the current culture profile between the sexes in the 16
provinces ............................................................................................. 158
Figure 29 Comparison of the preferred culture profile between the sexes in the
16 provinces ........................................................................................ 158
Figure 30 Comparison of the current culture profiles between the low and high
KPI scoring provinces ......................................................................... 162
Figure 31 Comparison of the preferred culture profiles between the low and high
KPI scoring provinces ......................................................................... 162
Figure 32 Comparison between the current cultural profiles of the senior
managers in the low and high KPI scoring provinces ....................... 165
Figure 33 Comparison of the current culture mean scores of the senior
managers in the low and high KPI scoring provinces ....................... 165
Figure 34 Comparison between the preferred cultural profiles of the senior
managers in the low and high KPI scoring provinces ........................ 165
Figure 35 Comparison of the preferred culture mean scores of the senior
managers in the low and high KPI scoring provinces ....................... 165
Figure 36 Comparison of the current mean scores of the practitioners in the low
and high KPI scoring provinces .......................................................... 167
Figure 37 Comparison of the current culture profiles of the practitioners in the
low and high KPI scoring provinces ................................................... 167
Figure 38 Comparison of the preferred culture mean scores of the practitioners
in the low and high KPI scoring provinces ......................................... 167
Figure 39 Comparison of the preferred culture profiles of the practitioners in the
low and high KPI scoring provinces ................................................... 167
Figure 40 The respondents’ information illustrated in brackets after each quote
............................................................................................................. 180
Figure 41 Leadership influence in the system of performance agreement (PA)
............................................................................................................. 181
Figure 42 Human resources and reward influence to the system of PA ........... 194
Figure 43 Performance, outputs and outcomes in the system of PA................. 227
Figure 44 The hierarchy culture and performance delivering good governance 253
Figure 45 The clan culture and performance delivering good governance ....... 261
Figure 46 The market culture and performance delivering good governance .. 269
Figure 47 The adhocracy culture and performance delivering good governance . 275
Figure 48 Summary of the research contribution .............................................. 306

LIST OF TABLES
Table 1 Definitions of the nine key components of good governance ................ 23
Table 2 The purpose of the four dimensions of the performance evaluation
framework at the provincial administration from 2004 to 2011 ........... 89
Table 3 The assessment framework of the provincial administration ................. 90
Table 4 Range of scores for determining the provinces for further study ......... 124
Table 5 Selection of provinces for survey ......................................................... 124
Table 6 List of the 10 provincial agencies selected and the proportion of
participants for the surveys ................................................................. 125
Table 7 Summary of the samples for the questionnaire survey ........................ 126
Table 8 Summary of provinces, agencies and participants for the interviews ...... 130
Table 9 Types of data used in the study ............................................................ 134
Table 10 Total number and percentage of respondents in the questionnaire
surveys ................................................................................................ 148
Table 11 Comparison of mean scores between the now and preferred
organizational culture in 16 provinces ................................................ 150
Table 12 Mean scores of now and preferred cultural types in the 16 provinces
............................................................................................................. 151
Table 13 Statistical significance of organizational cultures in 16 provinces .... 152
Table 14 Comparison organizational culture between the senior managers and
practitioners in 16 provinces .............................................................. 155
Table 15 Comparison of mean scores and statistical significance of
organizational culture by sex in 16 provinces ..................................... 158
Table 16 Comparison of mean scores and statistical significance of
organizational culture by age in 16 provinces .................................... 159
Table 17 Comparison of organizational culture between the ages by Multiple
Comparisons test .................................................................................... 159
Table 18 Statistical significance of organizational culture between 10
organizations in 16 provinces ............................................................ 160
Table 19 Comparison of mean scores of organizational culture by organizations
in 16 provinces .................................................................................... 161
Table 20 Comparison of mean scores of organizational cultures between the low
and high KPI scoring provinces .......................................................... 163
Table 21 Statistical significance of organizational cultures between the low and
high KPI scoring provinces ................................................................. 163
Table 22 Statistical significance of the current and preferred cultures of the
senior managers between the low and high KPI scoring provinces ... 166
Table 23 Statistical significance of the current and preferred cultures of the
practitioners between the low and high KPI scoring provinces ............. 168

Table 24 Statistical significance of organizational cultures between senior
managers and practitioners in each provincial group (the low and high
KPI scoring groups) ............................................................................ 169
Table 25 Overall job satisfaction in 16 provinces ............................................. 171
Table 26 Mean scores and statistical significance of job satisfaction between the
senior managers and practitioners in the 16 provinces ...................... 172
Table 27 Mean scores and statistical significance of job satisfaction between low
and high KPI scoring provinces............................................................ 173
Table 28 Mean scores and statistical significance of job satisfaction between the
senior managers in the low and high KPI scoring provinces ............... 174
Table 29 Mean scores and statistical significance of job satisfaction between the
practitioners in the low and high KPI scoring groups........................ 176
Table 30 Comparison of the typical characteristics between the low and high
KPI scoring provinces ......................................................................... 288
LIST OF ABBREVIATIONS
Abbreviation Definitions
CNS Council for National Security
CVF Competing values framework
E-SAR Electronic self assessment report
GG Good governance
H High KPI scoring provinces
HR Human resource
HRM Human resource management
IDV Individual index values
KPIs Key performance indicators
L Low KPI scoring provinces
LTO Long-term orientation index
MAS Masculinity index
NPM New public management
NCPO National Council for Peace and Order
OCAI Organizational culture assessment instrument
OPDC Office of the Public Sector Development Commission
PA Performance agreement
PDC Public Sector Development Commission
PM Performance management
PMS Performance management system
PRP Performance-related pay
UAI Uncertainty avoidance index
1
CHAPTER 1
INTRODUCTION
1.1 Research problem
Public sector reform is closely associated with attempts to improve governance
(Fukuyama, 2013). Since the early 1980s, the terms ‘governance’ and ‘good governance’
have gained significant attention in development discourse (Weiss, 2000), particularly
in public administration. The problems of poor governance such as corruption, waste,
abuse of power and the exploitation of public means for private ends (Jreisat 2004 cited
in Chakrabarty and Chand, 2012; Leftwich, 1993; OECD, 2001) in aid recipient
countries have been a concern for aid donors, particularly international organizations
such as the United Nations Economic and Social Commission for Asia and the Pacific
(UNESCAP), the United Nations Development Program (UNDP), and the Organization
for Economic Co-operation and Development (OECD) (OECD, 2001; UNDP, 1997;
UNESCAP, 2009). Consequently, the concept of ‘good governance’ has become an
initial aid condition and approach to reform programmes demanded by many donors
(Arkadie, 2012; Smith, 2007), especially programmes related to performance
measurement for delivering good governance.
Several developing countries (e.g. Argentina, Indonesia and Thailand) and developed
countries (e.g. the USA, Netherlands and the UK) have attempted to apply performance
measurement programmes to public sector reform and introduce good governance
(Dooren, Bouckaert and Halligan, 2015; Hood, 2007; Painter, 2012). However, the
implementation of public reform or good governance is not simple in practice.

2
Achieving public sector reform needs an understanding of organizational culture, such
as which culture or values are important (Talbot, 2010). Increased understanding of
public sector organizational culture may help to describe the outcomes of the reform
process in terms of appropriateness and inappropriateness between organizational
culture and the objectives of reform (Parker and Bradley, 2000). A number of scholars
(e.g. Andrews, 2013; Grindle, 1997; Wiratchaniphawan, 2004) suggest that culture,
such as values and attitudes, is an important determinant influencing public sector
reform and good governance. For example, resistance to change appears to occur when
change is not compatible with the strong values of organizations (Yukl, 2010).
Organizational culture is considered an informal authority shaping the assumptions,
values, attitudes and behaviour of an organization’s members (Andrews, 2013; Helmke
and Levitsky, 2004; Robbins, 2005; Schwartz and Davis, 1981), and an ‘invisible hand’
in public sector management (Rong and Hongwei, 2012, p. 47). Therefore, culture is
perceived to be something that influences performance (Armstrong and Baron, 1998),
enabling and inhibiting attempts to improve the performance of organizations,
particularly the performance of public organizations – the results of an act such as
efficiency, effectiveness, and responsiveness (Boyne et al., 2006). The implication is
that organizational culture might influence the performance (management) of the civil
service in the specific context of new public management and the promotion of good
governance.
There are a number of empirical studies that have investigated the relationship between
organizational culture and public sector reform in several countries, for example in
Qatar (Al-Kuwari, 2002), the USA (New York) (Moon, 2000), Ghana (Owusu, 2012),

3
India (Quirk, 2002), and Thailand (Jingjit, 2008). There has been relatively little
examination of how organizational culture influences good governance and the
performance of the civil service. Previous studies have tended to focus on organizational
culture and on some components of good governance, such as effectiveness, but this
study investigates a wider range of components of good governance and incorporates an
element of management and leadership as well as culture, whereas previous studies have
tended to ignore this distinction.
Studying Thailand, the provincial administration in particular, brings out new evidence
about the relationship between organizational culture and good governance. Thailand is
an interesting case because the Thai public sector reform has promoted good governance
through a performance measurement programme known as the performance agreement
(PA). After a major reform of the Thai public sector in 2002, legislation and several
plans were promulgated for encouraging good governance in the public sector,
particularly the Royal Decree on Criteria and Procedures for Good Governance B.E.
2546 (2003). The Decree ordered that all government agencies must be committed to PA
from the fiscal year B.E. 2547 (2004) onwards. Regarding PA at the provincial
administration level, 75 provinces1 in four regions have committed to PA.
However, promoting good governance through the PA scheme with Key Performance
Indicators (KPIs) in the Thai public sector has been no simple task. The promotion of
this scheme has struggled with the existing embedded traditional culture of bureaucracy,
1 The study focuses on only 75 provinces into 18 provincial clusters in four regions that engaged PA
between 2007 and 2011, while the 76th province established in 2011, Bueng Kan, is not included.

4
which could be an obstacle to driving good governance (Sirisamphan, 2009). This can
apparently be observed through the promotion of the PA scheme from fiscal year B.E.
2547 (2004) to date 2. Some scholars claim that there are various challenges for the PA
scheme, particularly at a provincial level, with relevance to culture, such as values on
rewards (Sathornkich, 2013), and a control system forcing implementation of the KPIs
(Srimai, 2015). The government agencies at the provincial administration level, who
have a close connection to the citizens in the area, appear to have a significant impact
on improving citizens’ quality of life and responding to their needs (Sathornkich, 2010).
Thus, the provincial level plays a significant part in the reform mechanism. There are
some studies on the civil service’s culture at a similar level, such as Moon (2000), the
city government agencies were studied about motivation and organizational
commitment. However, there are not many studies on the civil service’s culture at the
provincial level because research has tended to focus on other levels such as state,
organizations, ministries, departments and projects (Al-Kuwari, 2002; Owusu, 2012;
Parker and Bradley, 2000; Quirk, 2002).
Many studies of the Thai public sector’s culture (e.g. Jingjit, 2008; Jingjit and Fotaki,
2010; Phookpan, 2012; Pimpa, 2012) focus on the central government agencies (e.g.
ministries, departments, agencies) rather than provincial agencies. Although a few
studies (e.g. Sathornkich, 2010; Srimai, 2015; Srimai, Damsaman and Bangchokdee,
2011) examine, for instance, performance management system (PMS) and PA at the
provincial level, they do not highlight the correlation between organizational culture and
2 The performance agreement (PA) has been promoted in the Thai civil service from fiscal year 2004 to
the present.

5
good governance. Therefore, the current study examines the civil service’s culture at the
provincial administration level in terms of the relationship between organizational
culture and good governance, both whether and how organizational culture influences
the attainment of good governance as measured by PMS in the Thai public sector.
1.2 Why Thailand?
There are many countries that have employed the concept of good governance in the
public sector through performance measurement as stated in Section 1.1. Thailand may
be one of the most interesting cases, particularly among developing countries. This is
for three main reasons. Firstly, Thailand has a long experience of public sector reform
and since 2002 the programme is recognized as the largest public sector reform in the
history of Thailand. This is the initiative to promote good governance through PA. Since
the fiscal year B.E. 2547 (2004), the Thai civil service has been committed to PA; hence,
many government officials have long experience of PA and can share information about
performance measurement.
Secondly, Thailand has a unique culture that is different from other countries, especially
Southeast Asian countries in that Thailand is the only country in Southeast Asia that
was never colonized by a European power (CountryWatch, 2016). Therefore, the
country has a self-contained cultural uniqueness free from external pressure (Shor,
1960). Moreover, the nation’s cultural uniqueness is derived from the influence of
Buddhism and from a mixture of cultural influences from several countries such as
India, China, and Cambodia (Ministry of Foreign Affairs of the Kingdom of Thailand,
2013).

6
Thirdly, the study of the Thai public sector presents an opportunity to explore the
relationship between organizational culture (e.g. attitudes, values and assumptions) and
the achievement of good governance in the civil service. In this respect, the case of
Thailand may be a learning opportunity for other countries, particularly developing
countries, in terms of raising awareness of the relationship between organizational
culture and performance (good governance) in the public sector.
1.3 Aims and objectives of the study
Much literature and many studies on organizational culture and performance have
suggested that organizational culture is an important factor inhibiting or enabling the
performance of organizations, especially in the public sector. This research aims to
investigate whether and how organizational culture influences the attainment of good
governance as viewed through PMS in the Thai public sector.
To achieve the research aims, there are three main objectives of the research:
(1) Examine whether there is a relationship between organizational culture and good
governance
The relationship between organizational culture and good governance used in this
research was considered through the four types of culture based on the CVF model
and the nine key components of good governance in terms of how each type of culture
influences performance and delivers each key component of good governance.

7
(2) Examine the organizational culture of the civil service at the level of provincial
administration to ascertain any cultural differences between high and low KPI
scoring provinces
Organizational cultures of the low and high KPI scoring provinces were compared by
developing organizational culture profiles based on the OCAI and statistical analysis
acquired from the questionnaire survey. The qualitative data acquired form semi-
structured interviews were also compared between both provincial groups. The overall
cultural differences between the provincial groups was considered, based on the
comparison of the results from the questionnaire surveys and the semi-structured
interviews.
(3) Examine civil servants’ perceptions of their experience relating to the PA scheme,
and give officials opportunities to voice their views.
The interviews were carried out with the senior managers and practitioners. Participants
were able to express their experiences, opinions, feelings and knowledge (Patton, 1990)
on the PA scheme. The use of semi-structured interviews enabled a flexible interview
environment because participants could share their views without controlled orientation.
1.4 Research questions
To achieve the research objectives stated above, two main research questions are
employed as follows:
(1) How does organizational culture influence civil service performance?
(2) What other organizational factors influence civil service performance?
8
1.5 Theoretical underpinnings
Several studies have explored the relationship between organizational culture and a
variety of other factors (Cameron and Quinn, 2011). Different scholars have used
different theoretical models to study organizational culture. However, this study used
the Competing Values Framework (CVF), of which the Organizational Culture
Assessment Instrument (OCAI) is the main instrument (Cameron and Quinn, 2011) –
the CVF was originally developed by Quinn and Rohrbaugh (1983). The CVF has been
used because of four main reasons. Firstly, the CVF allows the measurement of
organizational culture in terms of different dimensions but has broad implications
compared to other models because it can integrate most organizational culture
dimensions, particularly value dimension related to effectiveness (Yu and Wu, 2009).
This can facilitate a comparison of the four types of culture between the provincial cases
such as between the low and high KPI scoring provinces, and between the senior
managers and practitioners in each group.
Secondly, the CVF provides empirical validity and reliability due to the standard
questions in the OCAI (Cameron and Quinn, 2011), which has been used by many
empirical studies (e.g. Howard, 1998; Ralston et al., 2006). Thirdly, the CVF allows
researchers to use multiple methods in a single study, which can be seen from many
empirical studies (e.g. Jingjit, 2008; Parker and Bradley, 2000; Phookpan, 2012). This
enables triangulation, where the weaknesses of one method are offset by the strengths
of another method (Jick, 1979). Finally, the CVF is considered to be an appropriate
model to explore the culture of the public sector and to study cross-cultural research.
Jingjit and Fotaki (2010) emphasize that the CVF is appropriate to investigate the extent

9
of bureaucratic culture or hierarchy model. The CVF has been used to study cross-
cultural research in various countries, for instance Asian countries such as China, Hong
Kong, Japan, Vietnam and Thailand (Kwan and Walker, 2004; Yu and Wu, 2009). The
CVF is, therefore, used to measure the Thai public sector with regards to which types
of culture influence the performance of the civil service. The discussion of the
advantages of the CVF can be found in Chapter Two (Section 2.4.3).
1.6 Research method, design and methodology
1.6.1 Research method
This study employed mixed methods – quantitative methods (questionnaire survey) and
qualitative methods (semi-structured interview). Using mixed methods not only helps
to seek clarification of the research findings (Darlington and Scott, 2002; Hesse-Biber,
2010), but also helps to overcome the misinterpretation of data from a single method in
studying organizational culture. A quantitative method (questionnaire survey) was
employed to examine the existing and preferred culture in the civil service. Its findings
were also used as the basis for follow-up interviews. A qualitative method (semi-
structured interview) was used to elicit in-depth and detailed information about the
officials’ perspectives on the PA scheme.
1.6.2 Research design and methodology
The study carried out a questionnaire survey of 16 provinces and semi-structured
interviews based on the case studies of four provinces. There are a total of 75 provinces
in Thailand (over the period 2007-2011) and 35 provincial agencies per province. Thus,
the selection of cases was conducted through a combination of sampling techniques –
10
multi-stage, stratified and purposive samplings – which were employed for selecting the
appropriate samples for the surveys and interviews. The case study design is discussed
in detail in Chapter Four.
The study also used a comparative study design for comparing organizational culture
between the 16 provinces and between the low and high KPI scoring provinces. A
comparative study allows the researcher to distinguish between two or more cases which
reflects theories about contrasting findings (Bryman, 2012). In this study, it is not only
employed to compare the similarities and differences of each finding – the survey and
interview findings – but also used to compare between both sources of findings for
seeking convergence and clarification of the overall result.
1.7 Summary
1.7.1 Key findings and implications
The key findings and implications are illustrated based on the research questions:
1) ‘How does organizational culture influence civil service performance?’ and 2) ‘What
other organizational factors influence civil service performance?’
The findings of this study were acquired from the questionnaire surveys with 307
participants and from the semi-structured interviews with 33 participants. The findings
suggest that strong culture is the key determinant influencing civil service performance
and good governance rather than a particular type of culture. The quantitative data
analysis revealed that with regard to the four types of culture (clan, market, hierarchy,
and adhocracy) there were statistically significant differences between the low and high

11
KPI scoring provinces, although not in terms of the different types of culture but rather
in terms of the strength of each type – higher performing cases were stronger on
hierarchy, clan, market and adhocracy cultures rather than being skewed towards one.
The small difference between the four types of culture may derive from two reasons.
Firstly, the officials had performed the KPIs under the same work environment (the PA
scheme). Alvesson and Sveningsson (2016) state that organizational climate is one of
the indicators affecting the management initiative or results and outcomes of
organizations. Secondly, there was the deep rooted culture in the Thai public sector
acquired from the national culture because national culture is a source of organizational
culture (Brown, 1998). It is important to note that changing views of the ideal model of
public organizations are that a new public management (NPM) perspective might have
predicted a shift toward market culture on the part of the higher performing cases, while
lower performing cases would be expected to be more hierarchical (see Parker and
Bradley, 2000, p. 131).
The qualitative data analysis appeared to confirm that differences in performance could
be accounted for by strong culture (see the definition of strong culture in Chapter Two,
section 2.4.2). There were different typical characteristics between the low and high KPI
scoring provinces in order to generate a different degree of strong culture, including
leadership, individuals’ characteristics, reward systems and others such as task and goal-
orientation, trust of the team of the Provincial Governor’s Office, and meetings with the
executives (see typical characteristics of the low and high KPI scoring provinces in
Chapter Seven, section 7.4). In this respect, the existence of a strong culture matters for
generating high performance – the ‘strong culture equals high performance’ equation
12
(Brown, 1998, p. 229) – and delivers on good governance, particularly effectiveness,
participation, efficiency, accountability and responsiveness (see cross-cutting themes in
Chapter Seven, section 7.3).
Besides strong culture, there were other organizational factors influencing performance
in the civil service, particularly leadership (strategies and style) and management
arrangements. The role of the leaders was to introduce clear policies to staff members,
generate commitment among individuals and encourage the officials to pursue goals in
the same direction. These characteristics of participative leadership are important for
the creation of stability of operation, job satisfaction and a flexible working environment
in order to create efficiency and effectiveness of work, participation and accountability
of the officials. Therefore, leadership plays a significant role in the development of
effective culture and the effective management of the organizations, especially in the
public sector (Kim, 2014; Parry and Proctor-Thomson, 2003), particularly a
participative leadership style. The data also suggested that the leaders’ managerial ways
in terms of task management, human resource management (HRM) and reward
management played a crucial role in determining achievement in high scores of
performance evaluation and good governance. Reward management seems to be one of
the most important elements of concern to many officials, for which fairness and equity
of reward allocation by leaders are anticipated for generating participation and
accountability. Participative leadership could enable the staff to perceive fairness from
their superiors (Huang et al., 2010).

13
The findings of previous studies (e.g. Jingjit and Fotaki, 2010; Parker and Bradley,
2000; Selaratana, 2009) have suggested that organizational culture is an important factor
in either facilitating or hindering attempts to improve the performance or effectiveness
of organizations, particularly in public organizations. However, the findings of this study
suggest that there should be a distinction between culture types and strength of culture,
and that leadership and management strategies (e.g. regarding task management, human
resources and reward systems) explain such variations and that this may be a key factor
in determining performance. This suggests that the style of leadership and management
may be more important in securing reform objectives than a change from one type of
culture to another – the public sector may remain hierarchical but hierarchy can be
managed participatively.
In addition, the findings of this study suggest that performance can be improved through
immediate managerial or leadership actions and may not depend on underlying cultural
characteristics that, by definition, can only be altered in the long term, if at all. Changing
the way the civil service is managed may be more effective than seeking to change the
civil service culture as a whole. This is consistent with the idea proposed by many
scholars (e.g. Brown, 1998; Deal and Kennedy, 1982; Fernandez and Rainey, 2006;
Kim, 2014; Lorsch, 1986; Nica, 2013; Schraeder, Tears and Jordan, 2005) who stated
that organizational culture can be changed by leadership (top managers) and
management (top management). Alvesson and Sveningsson (2008) pointed out that
organizational culture is very difficult to change, but it is possible to manage by top
management (e.g. using sufficient skills and resources) and by senior managers’ actions
(e.g. influencing some values and meanings under a certain environment).
14
1.7.2 Limitations
A number of challenges were encountered regarding data reliability and validity, which
can be viewed in three major dimensions: surveys, interviews and overall. The surveys
face some challenges, such as using a five-point scale on the OCAI questionnaire may
have led to a small range of scores for the researcher to compare between the four types
of culture. However, the use of the five-point scale on the Likert scales provides validity
and reliability regarding the correlation between scale score in the same quadrant,
obtaining information about attitudes and assumptions; and facilitating respondents for
answering a simple scale rather than 100 points (Quinn and Spreitzer, 1991;
Vanderstoep and Johnson, 2009; De Vaus, 2002). The other challenge was the non-
completion of questionnaires. Some participants did not answer some of the questions in
the questionnaire. This may derive from a difficulty in getting access to the senior
managers due to sending the questionnaires by post. The researcher had no opportunity
to provide an explanation of the questionnaires or to encourage completion. Another
problem was the partial lack of attentiveness when answering the questionnaires by
some respondents because they might not have recognized the benefits of the research.
For example, some participants left a note on their questionnaire, saying that they did
not see any results of research brought to adaptation in practice.
The interview challenges consist of at least three aspects: retrospective data and
translation problems. This study viewed good governance through the lens of the PA
scheme, in which the participants were asked to look back on PA in previous years.
Consequently, gathering data was viewed as a retrospective study. Culture is something
that has been accumulated for a long time and it is difficult to change (Hofstede et al.,
15
1990; Rong and Hongwei, 2012; Schein, 2004). In terms of the problem of translation,
the interviews were conducted in the Thai language because the interviewees were
Thais. Thus, it was time-consuming for translation from Thai to English.
Regarding the overall limitations, the researcher is one of the officials of the Office of
the Public Sector Development Commission (OPDC), which is the central agency
responsible for the PA scheme. Some respondents may have been cautious by answering
the questions in ways that would favour the interests of the OPDC, while they might
conceal some genuine information. Contrary to this, the researcher could obtain access
to the provincial agencies and secure cooperation from many provincial agencies.
In addition, the other limitation is that this study was a piece of research on the
relationship between organizational culture and good governance in the particular
context of the Thai public sector. The findings are not representative of the relationship
between organizational culture and good governance in the public sectors of other
countries. This is because each country has a particular context. For example, the same
management actions in the civil service of a neighbouring country to Thailand with a
different civil service culture might attain different results.

16
1.8 Structure of the thesis
This study consists of eight chapters, which are structured as follows:
Chapter One provides an overview of the study. It includes eight sections: research
problem; why Thailand; aims and objectives of the study; research questions; theoretical
underpinnings; research method, design and methodology; summary and structure of
the thesis.
Chapter Two sets out the conceptual framework for guiding the design of the data
collection and analysis and answering the research questions. It focuses on three main
aspects: pursuing good governance, determinants of performance, and organizational
culture. The chapter presents the development of the theoretical framework based on the
concepts of good governance, the major determinants of performance, and
organizational culture in order to set a basis for the data analysis and discussion in
particular in Chapters Five, Six and Seven.
Chapter Three presents the background, culture and values, development of good
governance in Thailand, and provincial administration and performance agreement
(PA). After providing general information on Thailand and its politics, the Thai culture
and values that influence the civil service’s implementation of public sector reform,
particularly the promotion of good governance, are offered. Regarding good governance
in Thailand, special focus is put on the development of good governance and its
promotion through PA. In the section on provincial administration and PA, it offers
information about the provinces and important provincial agencies relevant to PA.
17
Chapter Four presents the research design and methodology. It describes in detail the
research philosophy, research design, research methodology, research approach, data
collection, data analysis and interpretation, and research ethics. These give an insight
into the application of the conceptual and analytical frameworks for data collection and
data analysis.
Chapter Five presents the research findings of the quantitative data analysis of the results
from the questionnaire surveys. It sets out three major aspects: the overall organizational
culture profiles of the 16 provinces; comparison of the organizational culture profiles
between the low and high KPI scoring provinces; and the description of job satisfaction
based on the provincial cases.
Chapter Six presents the empirical findings of the qualitative data analysis acquired
from the semi-structured interviews, including in-depth interviews with the senior
managers and focus group interviews with the practitioners. The chapter demonstrates
the key factors of performance that deliver good governance categorized into three
groups: leadership; human resources (HR) and reward; and performance, outputs, and
outcomes.
Chapter Seven discusses the empirical findings acquired from the quantitative and
qualitative data analysis. All the results are compared and combined together to
summarize the overall findings of the study. The discussion of this chapter is based
on three main aspects: cultural determinants of performance, cross-cutting themes and
typical characteristics of the low and high KPI scoring provinces.

18
Chapter Eight summarises the key findings of the study. The important issues are
presented, including conclusions and implications, contributions to theory, reflection on
the research, policy implications and recommendations, and limitations of the research.
Finally, recommendations for further research are made.

19
CHAPTER 2
LITERATURE REVIEW
2.1 Introduction
This chapter reviews the existing literature on good governance, performance and
organizational culture in the public sector (see Figure 1). The purpose of the chapter is
to develop an analytical framework for guiding the design of the data collection and
analysis, and answering the research questions.
2.2 Pursuing good governance
2.2.1 Initiatives in pursuing good governance
2.2.2 Interpretation of good governance
2.2.3 Implementation of good governance
through performance measurement
2.3 Determinants of performance
2.3.1 Performance management system
(PMS)
2.3.2 Nature of performance management in
the public sector
2.3.3 Determinants affecting performance
2.4 Organizational culture
2.4.1 Definition of organizational culture
2.4.2 Correlation between strong culture
and performance
2.4.3 Theories and empirical studies of
organizational culture
2.4.4 Development of analytical framework
Existing literature
Objectives of the section:
Understand the reasons for pursuing
good governance
Understand definition of good
governance, key components, and
the relationship between good
governance and performance
Understand implementation of good
governance through performance
measurement
Objectives of the section:
Understand the purposes of PMS with
relevance to good governance
Identify difficulties of performance
management delivering good governance
in the public sector
Identify determinants affecting
performance delivering good governance
Objectives of the section:
Understand meaning of organizational
culture
Understand the relationship between
strong culture and performance
delivering good governance
Develop analytical framework of
the study
Figure 1 An illustration to approach the literature review structure

20
2.2 Pursuing good governance
2.2.1 Initiatives in pursuing good governance
The concept of good governance has received significantly increased attention from
many countries around the world since 1989 when the World Bank published the report
on ‘Sub-Saharan Africa: From crisis to sustainable growth’ (World Bank, 1989). This
report raised the issue of a crisis of governance in Africa, namely a lack of good
governance (e.g. accountability, transparency and rule of law). In other words, poor
governance is apparent when ‘the manner in which power is exercised in the
management of a country’s economic and social resources for development’ (World
Bank, 1994, p. xiv) is not carried out properly. Mazower (2013, p. 370) stated that (bad)
government is considered as ‘the chief enemy of (good) governance’ and the concept
of governance is used in the context of de-emphasising the State, namely prevalent
intervention by international agencies in the public administration of countries around
the world. Consequently, the quality of governance in aid recipient countries has been a
concern for aid donors such as international organizations. This can be observed through
efforts in promoting good governance by several international organizations such as the
United Nations Economic and Social Commission for Asia and the Pacific
(UNESCAP), United Nations Development Program (UNDP) and Organization for
Economic Co-operation and Development (OECD) (OECD, 2001; UNDP, 1997;
UNESCAP, 2009). The idea behind good governance is to oppose ‘bad governance’
such as corruption, waste, abuse of power and exploitation of public means for private
ends (Jreisat 2004 cited in Chakrabarty and Chand, 2012; Leftwich, 1993; OECD,
2001). Attempts at introducing good governance are also seen as implementation of the

21
‘rules of the game’, i.e. the effectiveness of the State is in setting up the rules and
ensuring their transparent and predictable application (Arkadie, 2012, p. 54) .
The concept of good governance has become an initial aid condition and approach to
reform programmes of many donors (Smith, 2007). An obvious example is the
economic crisis in Southeast Asian countries3 in 1997, which led to the introduction of
substantial governance reforms (Arkadie, 2012; Wijayati, Hermes and Holzhacker,
2015). Bowornwathana (2000) claimed that the economic crisis in the Asian region
could be an opportunity to compel Asian countries to undertake administrative reform
based on good governance.
2.2.2 Interpretation of good governance
One of the foremost challenges is the difficulty of the interpretation of good governance,
as it was simply not clear what ‘good governance’ means (Sundaram and Chowdhury,
2012). This is consistent with the idea of ‘good enough governance’ proposed by
Grindle (2004, 2007), who argues that ‘good governance’ provides little guidance about
what/when/how things need to be done in the real world in practice. This shows that
implementing good governance requires an understanding of the concept and how it is
accomplished in practice (Grindle, 2010).
In the administrative sense, a number of scholars tend to suggest that good governance
refers to the principle or the concept of public management or public service reform or
3 The economic crises affected the East Asian countries, including Thailand, Indonesia, Malaysia,
Japan, South Korea, Philippines, and Taiwan (Shabbir and Rehman, 2016).
22
the new public management (NPM) paradigm based on at least nine key components:
effectiveness, efficiency, participation, accountability, transparency, responsiveness,
equity, rule of law and consensus oriented (Agere, 2000; World Bank, 1992; OECD,
2001; Rhodes, 1996; Commonwealth Secretariat, 2010; UN, 2006, 2015; UNESCAP,
2009). Here good governance is seen as a means approach, whilst it becomes an end in
itself when its key components are addressed satisfactorily (Agere, 2000). For example,
achieving the key components of good governance contributes to the corrective roles of
the government organizations, such as increasing efficient and accountable
management; raising transparency of the policy framework; enhancing the participation
of all sectors in society; and obtaining elite public services (World Bank, 1992; Cheema
and Popovski, 2010; Commonwealth Secretariat, 2010). The next section discusses the
key components of good governance in the context of public sector management and
reform. The detailed definitions of governance and good governance are shown in
Appendix 1.
Key components of good governance
Many international organizations and scholars define different meanings of the key
components of good governance (see Appendix 2). Table 1 summarizes the definitions
of the nine key components of good governance in the sense of the public sector, which
can be considered in three crucial points overarching the definitions or components.
Firstly, the main purposes of efficiency and effectiveness appear to be congruent,
namely producing results that meet the needs of society with the best use of resources.
Secondly, accountability is considered as a cornerstone of good governance by several
scholars (e.g. McNeil and Malena, 2010; UNDP, 1997). This is because it focuses on

23
the government organizations’ responsibilities for their activities and decisions that
impact on stakeholders. Moreover, the four elements of good governance –
transparency, participation, rule of law and equity – emphasize the rights of stakeholders
in society.
Table 1 Definitions of the nine key components of good governance
Component Definition
Efficiency
Processes and institutions produce results or management efficiency that meet the
needs of society while making the best use of the resources at their disposal. It
also covers the sustainable use of natural resources and the protection of the
environment. (UNDP, 1994a, p. 5; UNESCAP, 2009, p. 3)
Effectiveness Processes and institutions produce results that meet the needs of society while
making the best use of resources. (UNDP, 1994a, p. 5; UNESCAP, 2009, p. 3)
Accountability
Accountability is the heart/prerequisite/key requirement of good governance. The
governmental institutions, private sector and civil society organizations have to be
responsible and answerable for their actions, activities and decisions to the public
and to their institutional stakeholders. (World Bank, 1994, p. 12; UN, 2006, p. 10;
UNESCAP, 2009, p. 3)
Transparency
Transparency is built on there being accessible information, such as public
knowledge, policies, and strategies of government, which all citizens who are
concerned with them can access with enough information to understand and
monitor them. (Agere, 2000, p. 7; Commonwealth Secretariat, 2010, p. 12;
UNDP, 1994a, p. 5)
Participation
Participation is generated based upon a recognition that people, both men and
women, should have a voice in decision making, either directly or through
legitimate intermediate institutions or representatives, such as taking decisions on
public policy and sharing control over resources and institutions that affect their
lives. (Agere, 2000, p. 9; UNDP, 1994a, p. 5; UNESCAP, 2009, p. 2)
Rule of law
Rule of law signifies a legal framework that is fair and enforced impartially, such
as full protection of human rights, which the clear or uniform laws are required to
apply through objective, and independent judiciary. (UNDP, 1994a, p. 5;
UNESCAP, 2009, p. 2)
Equity
All members in a society (all genders, classes, races, educational qualifications,
religious and political beliefs) have opportunities to improve or maintain their
well-being. They have a stake in it and are not excluded from the mainstream of
society. (UNDP, 1994a, p. 5; UNESCAP, 2009, p. 3)
Responsiveness Responsiveness refers to institutions and processes trying to serve all stakeholders
within a reasonable timeframe. (UNDP, 1994a, p. 5; UNESCAP, 2009, p. 2)
Consensus
oriented
Consensus oriented is associated with many viewpoints of actors in a given
society. Good governance mediates differing interests to reach a broad consensus
on what is in the best interests of the whole community, where possible and how
this can achieve the goals of such development. (UNDP, 1994a, p. 5; UNESCAP,
2009, p. 3)

24
Good governance and performance
As good governance became more closely associated with administrative reform and
new public management (NPM) in the 1990s (see Greiling, 2005), so it came to be seen
increasingly in terms of performance. Performance measurement came to be seen as an
essential component of good governance and a means of bringing it about
(see Mimba, Helden and Tillema, 2007). Greiling (2005) argued that performance
measurement was an important instrument for enhancing the accountability, effectiveness
and efficiency of public service, the reason being its ability to influence the behaviour
of employees (Dooren, Bouckaert and Halligan, 2015).
2.2.3 Implementation of good governance through performance measurement
Performance measurement has featured in many internationally-supported good
governance programmes (World Bank, 1994; 2002; Kaufmann, Kraay and Mastruzzi,
2008), for example in Latin America (e.g. Bolivia, Chile and Argentina), Southern
Africa (e.g. Zimbabwe) and Southeast Asia (e.g. Indonesia, China, Vietnam and
Thailand) (Barbarie, 1998; Brushett, 1998; Marcel, 1998; OPDC, 2003a; Painter, 2012).
Developed countries have also used performance measurement for public service
reform, for instance the USA, Germany, France, Norway and the UK (Dooren,
Bouckaert and Halligan, 2015; Hood, 2007; Peters and Savoie, 1995).
However, the implementation of performance measurement programmes is not a
panacea for achieving good governance in practice, which can be held back by societal
or institutional factors such as a lack of desire for reforms or consensus orientation on
change; difficulty in getting access to public information; lack of participation by civil

25
society (e.g. NGOs, and consumer groups); and inefficient judicial processes (e.g.
reluctance to punish corrupt officials) (Charoenserbsakul and Sombatpeam, 2014;
Nikomborirak, 2007; Sundaram and Chowdhury, 2012). In other words, there may be a
vicious circle whereby a lack of good governance makes it difficult to implement good
governance.
2.3 Determinants of performance
2.3.1 Performance management system (PMS)
Having established that performance measurement is a key component or key condition
of good governance. In practice, it is necessary to consider the ambiguity of the term
‘performance’. The term ‘performance’ can portray both an act and the result of an act
(Houldsworth and Jirasinghe, 2006). Many scholars (e.g. Dooren, Bouckaert and
Halligan, 2015; Houldsworth and Jirasinghe, 2006; Kearney and Berman, 1999;
Williams, 1998) agree that performance is an act, which refers to the programme,
strategy, management, activity and action of organizations in order to achieve the
outcomes of activities or programmes or something intended; and to change or improve
individuals’ contributions and organizations’ overall success (see definitions of
performance in Appendix 3: 3.1). Meanwhile, performance is the result of an act, which
focuses on ‘productivity’ or ‘effectiveness’ (Kearney and Berman, 1999; Talbot, 2010).
In the public sector, performance refers to outputs (quantity and quality of services);
efficiency (cost per unit of outputs); effectiveness (achievement of formal objectives);
responsiveness (measures of satisfaction); and democratic outcomes (Boyne et al.,
2006). Therefore, the citizens’ expectations regarding the performance measurement

26
and reporting outputs of the government’s activities are increased (Halachmi, 2005;
Houldsworth and Jirasinghe, 2006; Kearney and Berman, 1999).
Purpose of performance management system (PMS)
Performance management (PM) is considered as the strategy, approach, system,
method, range of practices, and processes applied in order to deliver success, create a
shared vision of, or connect the organization’s aims amongst people, enhance a target
person or group’s performance, and generate performance information for making
decisions (e.g. Armstrong and Baron, 1998; Fletcher, 1993; Houldsworth and
Jirasinghe, 2006; Moores, 1994; Moynihan, 2008) (see definitions of performance
management (PM) in Appendix 3: 3.2). PM is considered by some to be a central
element of NPM (Gianakis, 2002 cited in Greiling, 2005) in order to improve
performance in the public sector.
Several scholars (e.g. Cooke, 2003; Moores, 1994; Moynihan, 2008; Williams, 1933;
Williams, 1998) suggest that there are two main objectives of PM: improving
organizational performance (tasks or activities) and improving human resources. Firstly,
PM facilitates the improvement of performance in terms of setting goals, increasing
integrated management, and providing performance information (e.g. feedback). Goal
setting can facilitate accountability and participation (e.g. the employees’ commitment)
to the organizations (Improvement and Development Agency, 2002; Moynihan, 2008;
Varma, Budhwar and DeNisi, 2008; Wood and Locke, 1990 cited in Willaims, 1998).
27
In terms of improving human resources, PM enables the improvement of employee
communication (e.g. communicating the organizations’ objectives to the members),
generates employees’ commitment (e.g. brings involvement and organizational
commitment as well as job satisfaction), and identifies the required training (Armstrong
and Baron, 1998; Fletcher, 1993; Moores, 1994). It is seen that participation and job
satisfaction can be generated by PM.
Performance measurement
Performance measurement is defined as an instrument of control, a spur of appropriate
action, and a form of output steering (Brignall, 1993; Bruijn, 2007; Jackson, 1995) (see
Appendix 3: 3.3). It is not only an essential component of PM (Julnes, 2006 cited in
Julnes et al., 2007), but can also have a beneficial effect on public organizations (Bruijn,
2007). Performance measurement is a source of performance information used in order
to improve organizational performance (e.g. setting work goals, determining performance
standards, assigning and evaluating work, providing feedback) and improving
individual performance (e.g. determining training and development needs, distributing
rewards) (Varma, Budhwar and DeNisi, 2008, Fletcher, 1993). In this respect,
performance measurement or performance assessment can identify any potential
problems and facilitate possible change (Osborne et al., 1993). Phusavat et al. (2009)
stated that performance measurement is an instrument of management used in order to
deliver good governance, such as accountability and transparency.
However, there are various challenges of performance measurement such as the
difficulty of measuring performance in terms of outputs and outcomes, and a problem

28
of receiving genuine information. One of the most important challenges of performance
measurement in the public sector appears to be a complexity of measuring outputs and
a difficulty of preventing undesirable outcomes produced by the application of
performance measures (Jackson, 1989). Other scholars (e.g. Bruijn, 2007; Glaser, 2007;
Halachmi, 2005; Kotler and Lee, 2007) argue that the public sector’s performance can
be measured in the same way as that of the private sector, namely products and services
(e.g. unit costs of services delivered, and certain quality or standards of services),
viewed as outputs in the form of quantitative and qualitative factors that can be
measured. Meanwhile, the performance of public organizations can be measured by
outcomes such as goal achievement and response to citizens (e.g. citizens’ satisfaction
with service delivery) (Glaser, 2007, Kotler and Lee, 2007).
The public sector reforms need to use information acquired from performance
(indicators) measurement or performance appraisal for making improvements (Jackson,
1989; Hatry, 1996 cited in Julnes, 2007; Moynihan, 2008). Therefore, measuring
performance requires people to tell the truth about their activities and tasks. The
likelihood of useless, false information may be influenced by the design of the control
system (focus on measures rather than performance, for example); a lack of coherence
between the measured value and the real value; unknown importance of the underlying
phenomenon; too many indicators; and the reward system of the organization (Dooren,
Bouckaert and Halligan, 2015; Neely, 1998 cited in Houldsworth and Jirasinghe, 2006;
Murphy and Denisi, 2008). A solution to this problem may be understanding the nature
of performance management in the public sector.

29
2.3.2 Nature of performance management in the public sector
The difficulty of performance management in the public sector in delivering good
governance can be considered in relation to two aspects: 1) the differences between
public and private organizations; and 2) the complicated performance management of
the public organizations themselves.
The differences between public and private organizations
Performance management in the public sector appears to be more problematic than in
the private sector. This is because the nature of the public sector has multiple objectives,
diversity of stakeholders, emphasis on policy, administration or leadership, and socio-
political environments (Behn, 1991; Dooren, Bouckaert and Halligan, 2015; Jackson,
1995; Mimba, Helden and Tillema, 2007). The prime purpose of public organizations is
to serve the citizens’ needs and deliver actual value or public value, whilst the prime
purpose of private companies is to meet customers’ needs in terms of value and
satisfaction in order to make profits for the owners of the business (Alford, 2001;
Chakrabarty and Chand, 2012; Kotler and Lee, 2007). Public service management is,
therefore, a complex area of management activity (Harrow and Willcocks, 1990).
The complicated performance management of the public organizations themselves
There have been attempts to introduce new public management (NPM) for public sector
management and reforms, for example increasing the focus on organizational objectives
and goals, enhancing the efficiency of government, stretching effectiveness of scarce
public resources, and increasing the responsiveness of government to citizens (Eakin,
Eriksen and Eikeland, 2011; Harrow and Willcocks, 1990; Hughes, 1998; Parker and
30
Bradley, 2000). In other words, bureaucratic organizations have been encouraged to
shift from control mechanisms (hierarchical structures) to market-based mechanisms
such as performance indicators and greater flexibility (Parker and Bradley, 2000).
However, public sector management seems to retain the features of traditional public
administration (hierarchical model) such as determining by top-down performance
management, having a high degree of centralization, and highlighting bureaucratic
processes (Bratton et al., 2007; Hughes, 1998, 2007; Moynihan and Pandey, 2005;
Talbot, 2010). Armstrong and Baron (1998b) stated that control orientation may inhibit
performance rather than enhance performance. Other scholars (e.g. Holmes and Shad,
1995 cited in Hughes, 2007) claimed that using control or authority may facilitate the
managers in terms of building support in the broader community, matching authority
and responsibility to improved performance and increased accountability and
transparency through the need to report on results. Although performance management
is associated with NPM and with a flattening of organizational structures in the public
sector, it may also be facilitated by traditional hierarchical public administration due to
its focus on accountability. Good governance and hierarchy are not necessarily
contradictory principles.
2.3.3 Determinants affecting performance
A number of scholars (e.g. Armstrong and Baron, 1998; Bazeley and Richards, 2000;
Boyne, 2003 cited in Moynihan and Pandey, 2005; Campbell et al., 1993 cited in
Williams, 1998) have suggested that there are at least seven determinants influencing
organizational performance: personnel factors, motivation factors, leadership factors,
management styles and strategic management, team factors, system factors, and

31
contextual (situational) factors. This study focuses on three key elements – job
satisfaction, motivation and leadership – that play a crucial role in performance in the
specific context of performance measurement delivering good governance.
1) Job satisfaction
Job satisfaction is generally defined as an individual’s affective reactions to a job based
upon a range of expectations and preferences associated with the individuals’ feelings
about intrinsic and extrinsic job elements (Fields, 2002). A number of scholars (e.g.
Cranny, Smith and Stone, 1992; Fields, 2002; Greenberg and Baron, 2003) have
suggested that there are several key aspects to measuring job satisfaction such as pay,
promotion, supervision, co-workers, and the work itself. These elements are under the
rubric of two major elements: intrinsic and extrinsic. Job satisfaction is, therefore,
important in affecting organizational performance. It is associated with the individual’s
positive or negative attitudes towards their work, which attitudes are related to
organizational behaviour, job performance, and voluntary turnover (Greenberg and
Baron, 2003).
A number of empirical studies on job satisfaction tend to suggest that the staff members’
job satisfaction is associated with leadership (see Ashraf, Farooq and Din, 2014; Wong
and Laschinger, 2012) and motivation or pay (see Green and Heywood, 2008; Judge et
al., 2010; Stringer, Didham and Theivananthampillai, 2011). For example, Ashraf,
Farooq and Din (2014) explored the correlation between leadership culture and job
satisfaction and work commitment, which revealed that job satisfaction and work
commitment facilitate organizations in accomplishing their goals, in which leadership
32
styles can influence employee performance and job satisfaction. In particular
participative leadership, rather than directive leadership, increases job satisfaction and
work commitment. Regarding the relationship between job satisfaction and pay, Green
and Heywood (2008) studied performance-related pay (PRP) and stated that PRP is
associated with enhanced pay satisfaction, but it seems to negatively affect job
satisfaction. Stringer, Didham and Theivananthampillai (2011) argued that extrinsic
motivation is not associated with pay satisfaction and negatively associated with job
satisfaction, but intrinsic motivation is positively associated with both pay and job
satisfaction. This is because extrinsic motivation makes some employees concerned
about fairness, particularly the employees who often make comparisons with others or
feel that pay does not reflect their effort. In this respect, pay or extrinsic motivation
could be negatively or positively associated with the individuals’ satisfaction, whereas
it seems to negatively affect job satisfaction. However, intrinsic motivation appears to
be positively associated with pay and job satisfaction.
2) Motivation
Motivation is a key element in increasing productivity and job satisfaction (Wilson,
2010). In particular, intrinsic motivation appears to have a more significant impact on
performance than extrinsic motivation (Armstrong, 1990; McKenna and Beech, 2002).
Intrinsic motivation refers to several elements such as giving greater recognition,
additional job flexibility, opportunities to gain more responsibility, higher exposure to
senior management, a sense of fulfilment (e.g. the individuals pride in achievement),
satisfaction of social needs, and opportunities to increase skills (Armstrong, 1990;
Fletcher, 1993; Ingraham, Joyce and Donahue, 2003; McKenna and Beech, 2002).

33
Intrinsic motivation has a significant impact on the individuals’ job dissatisfaction as
well as on withdrawal and turnover (Greenberg and Baron, 2003). Extrinsic motivation
refers to elements such as working conditions, opportunities for promotion and
enhanced status, and performance-related pay (PRP) (Armstrong, 1990; McKenna and
Beech, 2002).
Using a financial reward seems to be more popular in practice than a non-monetary
reward, although intrinsic motivation is the more significant element affecting
performance than extrinsic motivation. This can be seen in the context of PMS, in which
performance-related pay (PRP) is the most famous of the motivational approaches
(Hatry, 2007). The use of financial reward may bring significant motivational power as
it symbolizes several intangible goals, although it may have no intrinsic meaning
(Armstrong, 1990). PRP has many merits, such as motivating the existing staff for
greater performance, attracting and maintaining high performers, and achieving cost
effectiveness (Fletcher, 1993; Gerhart and Trevor, 2008). Moreover, motivation can
lead to being market oriented in terms of reward based achievement (Zammuto and
Krakower, 1991). Similarly, Helmke and Levitsky (2004) pointed out that motivation is
important to shaping organizational culture (informal institutions) and pursuing goal
achievement. This implies that management of motivation can shape organizational
culture.
There are a variety of challenges to using PRP within the appraisal system, for example
disappointment (e.g. people receive fewer benefits on PRP than they anticipated); a
problem of equity (e.g. people are concerned about unfair discrimination and equal

34
opportunities); distortion of appraisal consequences; and different reward preferences
amongst employees of different ages (e.g. one incentive system is applied to all people)
(Fletcher, 1993; Murphy and Denisi, 2008). Although such motivation, especially
financial reward, has both negative and positive effects, at least it motivates and helps
to retain employees, particularly high performing human capital (Moynihan and Pandey,
2005; Price, 2011).
However, using money is only partly an incentive (Ingraham, Joyce and Donahue, 2003;
Moores, 1994); correlation between PRP and high levels of organizational performance
cannot be proved. Therefore, organizations should decide which forms of incentive
(monetary or non-monetary rewards) are appropriate. If organizations consider using
PRP, they need to recognize when the appropriate pay format is used and the staff are
impartially rewarded (Pfeffer, 1998 cited in Price, 2011). This is because the nature of
the incentives employed needs to be considered due to this complexity (Leroch, 2014).
In particular, whenever money comes into the phenomenon, anxiety appears to follow
(Hatry, 2007).
In conclusion, motivation is vital to performance in terms of enhancing effectiveness
(increasing productivity and pursuing goal achievement), accountability (increasing
responsibility), equity (fairness of reward), and rule of law (appropriate form of reward).
3) Leadership
Leadership is one of the most important determinants affecting organizational
performance, particularly leadership style and strategic management. The existing

35
literature (e.g. Improvement and Development Agency, 2002; Armstrong and Baron,
2005; Dooren, Bouckaert and Halligan, 2015; Gill, 2006) suggested that leadership
styles should be a driver of organizations; provide resources and resolve problems;
motivate employees; shape culture; and respond to change. This is compatible with the
idea proposed by Cameron and Quinn (2011) that leadership style in four types of
culture should express the following characteristics (see more detail in section 2.4.3):
Clan culture: facilitator, mentor, team builder, and parent-figure
Adhocracy culture: innovator, entrepreneur, risk taker and visionary
Market culture: hard driver, competitor, and producer
Hierarchy culture: coordinator, monitor, and organizer
The leaders who are drivers can make decisions, set direction (the organizations’
mission, vision and values), provide guidance and communicate these to the
organizations’ members (Improvement and Development Agency, 2002, Dooren et al.,
2015). Similarly, the characteristics of leaders that are desired by the employees consist,
for example, of paying attention to tasks, providing a clear and attractive mission, and
communicating vision and values, which facilitate better performance of tasks (Gill,
2006; Moynihan and Pandey, 2005). Kultahti, Edinger and Brandt (2013) stated that
young people, in particular Generation Y who were born between 1981-2000, seem to
expect more from their leaders than the older generations.
The team building style of leadership is seen as crucial for performance in terms
of generating commitment; creating teamwork and managing teams by meetings;
motivating employees and shaping culture. When generating commitment, the

36
employees need the managers to use managerial authority and power for issuing
commands in order to gain involvement (Francesco and Gold, 1998; Gill, 2006). This is
compatible with the idea that generating coordination needs to be promoted by the leader
designing the structures and standards (Mintzberg and Westley, 1992; Thompson, Zald
and Scott, 2007).
In terms of motivating the employees and shaping culture, the managers can motivate
the employees by stimulating and inspiring them to perform their tasks, for instance by
explaining about goals and the importance of work in order to persuade staff to achieve
goals (Gill, 2006; Williams, 1998). Huang et al. (2010) stated that the intrinsic
motivation of individuals is associated with participative leadership. Effective
leadership can shape their organization’s culture, such as by promoting desired values
through strategies and programme goals and combining the messages, actions,
and attitudes deliver to people around the leader themselves (Improvement and
Development Agency, 2002; Kearney and Berman, 1999). Bratton et al. (2007) argued
that achieving transformation relies 70 - 90 percent on leadership and only 10 - 30
percent on management. Therefore, poor leadership (e.g. lack of capacity to manage and
having outdated policies of HRM) may lead to many problems (e.g. lack of trust, high
rate of staff turnover, deficient morale) (Commonwealth Secretariat, 2010).
Leadership style may thus have a significant influence on motivation and performance.
There are diverse types of leadership styles defined by many scholars (e.g. Armstrong
and Baron, 1998; Chakrabarty and Chand, 2012; Dooren, Bouckaert and Halligan, 2015;
Williams and Huber, 1986), from which two predominant types of management style

37
are found: authoritarian (control) style and participative style. These styles focus on
different purposes and have different levels of difficulty for change.
The control management style involves authority, rules and regulations (Armstrong and
Baron, 1998; Dooren, Bouckaert and Halligan, 2015). The managers who have an
authoritarian style appear to have a highly centralized management approach, which
may take longer to shift and therefore improve performance in the context of
performance measurement (Jackson, 1989). Contrary to this, the participative style
focuses on the employees, which is seen through much evidence, for instance a greater
concern with the employees’ needs; a greater confidence in staff willingness and
responsibility; a greater extent of people’s involvement in organizational planning and
decision making (Williams and Huber, 1986). These derive from the process of
discussing, analysing problems, and consulting between the managers and staff, through
which their suggestions and opinions are taken into account in the consensus on what to
do and how it is to be achieved (Francesco and Gold, 1998; Gill, 2006). Gill (2006)
found that the participative style was not confined to Western managers but could also
be found among Southeast Asian managers.
Many scholars (e.g. Bratton et al., 2007; Jackson, 1989; Williams and Huber, 1986) tend
to agree that the participative style is more effective than the authoritarian style in terms
of improving a managers’ ability for making decisions; facilitating change by
participation due to enhancing people’s voices on a policy or course of action;
empowering people through a positive relationship (e.g. satisfaction, motivation, and
participation); and receiving a high level of achievement by the acknowledgement of
38
people’s goals and reduction of turnover. On the other hand, authoritarian style may be
threatened by various challenges and may fail to deliver on the potential advantages for
enhancing performance (Jackson, 1989). Moynihan (2008) claimed that an authoritarian
style can contribute to meeting requirements and enforcement, although the managers
may not generate the positive outcomes that the central government or elected officials
or policymakers anticipate from reform.
In summary, leadership is one of the most significant determinants influencing the
performance of the public organizations in delivering good governance, particularly in
terms of the leaders being a driver, team builder, and organizer or coordinator. These
determinants can influence performance as well as good governance, such as by
generating participation (creating team and involvement), being consensus oriented
(open to the employees’ opinions), effectiveness (being a driver), and efficiency (managing
resources). Moreover, the existing literature suggests that leadership is related to shaping
culture such as securing resources and related elements (hierarchy culture), solving
problems (hierarchy and adhocracy cultures), and coaching (clan culture). A
participative leadership style, rather than an authoritarian leadership style, seems to be
positively associated with performance.
2.4 Organizational culture
2.4.1 Definition of organizational culture
Defining the term ‘organizational culture’ is a difficult task because it requires the
definition of the terms ‘organization’ and ‘culture’ (Brown, 1998). According to some
opinions in the literature, the definitions of culture may be classified into two broad
39
directions: objective entity or a variable and metaphor (Alvesson and Sveningsson,
2008; Brown, 1998; Cameron and Quinn, 2011; Senior and Fleming, 2006). Schein
(1990, p. 111; 2004, p. 17), on the other hand, uses three levels to describe culture,
including observable artefacts, values and basic underlying assumptions. Deal and
Kennedy (1988, p. 107-108) describe four cultural types, including the work-hard and
play-hard culture; the process culture; the bet-your company culture; and the tough-guy
and macho culture. Culture is defined as ‘the integrated pattern of human behaviour that
includes thought, speech, action, and artefacts and depends on man’s capacity for
learning and transmitting knowledge to succeeding generations’ (Deal and Kennedy,
1988, p. 4).
It can be concluded that culture is a property of a human group or a system of shared
meaning held by an organization’s members which significantly differs from other
organizations (Robbins, 2005; Schein, 1991; Senior and Fleming, 2006). Others
(Eldridge, 1973; Kotter and Heskett, 1992; Schwartz and Davis, 1981) have suggested
that culture refers to a pattern of beliefs, values, attitudes, assumptions, expectations,
and ways of behaving shared among members of an organization. There are many
definitions of culture that broadly follow this approach, which are set out in Appendix 4: 4.1.
The formulation of Hofstede et al. (1990) serves to integrate the various dimensions of
organizational culture as follows:

40
‘The organizational/corporate culture construct: it is (1) holistic, (2) historically
determined, (3) related to anthropological concepts, (4) socially constructed, (5)
soft, and (6) difficult to change.’ (Hofstede et al., 1990, p. 286)
This definition reflects various dimensions of organizational culture that are of
relevance to other scholars’ opinions (see Appendix 4:4.2). Firstly, culture can reflect
the overall picture of an organization in terms of a sense of identity of the organization’s
members (Robbins, 2005). Secondly, the culture of an organization is formed by long-
term historical heritage viewed as an ‘invisible hand’4 in public management (Rong and
Hongwei, 2012, p. 47). Culture is, thus, difficult to change; Helmke and Levitsky (2004,
p. 732) stated that culture is viewed as an informal institution and change would be an
‘extremely lengthy’ process.
Thirdly, culture is related to both social and anthropological areas, which can be
interpreted as ‘organizations have cultures’ or ‘organizations are cultures’ (Cameron
and Quinn, 2011). Fourthly, culture can be understood as soft attributes that can affect
organizational performance (Hofstede et al., 1990). Many studies (e.g. Adenan et al.,
2013; Parker and Bradley, 2000; Yetano and Matsuo, 2015) suggest that the implication
of organizational culture does not only influence individuals’ attitudes, norms and
behaviour, but also performance. Finally, organizational culture is difficult to change
because there is a diversity of values and meanings dominating the group and group
members value stability (Alvesson and Sveningsson, 2008; Schein, 2004). Here it is
4 Culture comprises both invisible elements (e.g. beliefs, values, attitudes, norms, and assumptions) and
visible elements (e.g. annual report, products, technology, symbols, and systems) (Brown, 1998, Dick
and Ellis, 2006, McEwan, 2001, Schein, 1990).
41
important to note that the issue of cultural change seems to be controversial and is
continually debated among scholars. Some scholars (e.g. Kotter and Heskett, 1992;
Schein, 2004; Schwartz and Davis, 1981) pointed out that an organization’s culture is
difficult to understand, and hard to change. Other scholars (e.g. Brown, 1998; Deal and
Kennedy, 1982; Fernandez and Rainey, 2006; Lorsch, 1986; Nica, 2013; Schraeder,
Tears and Jordan, 2005) argued that leadership (top managers) and management (top
management) can facilitate the change of organizational culture. For example,
Schraeder, Tears and Jordan (2005) stated that although changing the organizational
culture of the public sector organizations is a long-term endeavour, it is possible to
change it by leaders’ recognition of issues related to employees, i.e. training and leading
by example to guide officials through complicated dynamics. The difficulties of
changing organizational culture in the public sector may derive from several aspects.
Conflict between the culture of the public sector and NPM – NPM requires the public
sector to achieve greater outcomes, efficiency and flexibility, but the values of
bureaucratic or hierarchical culture continue to remain – is one of difficulties for
changing the culture of the public sector organizations (Parker and Bradley, 2000).
Moreover, the constraints of the personal system in the public sector are more prevalent
than in the private sector, namely the inability to punish poorly performing managers
and to reward good managers (Nica, 2013).
Nature of organizational culture in the public sector
In terms of the framework developed by Cameron and Quinn (2011), the organizational
culture of the public sector tends to be closer to hierarchy and clan than to market and
adhocracy cultures. Hierarchy is seen as intrinsic to bureaucratic culture (Handman,

42
1993). This is because, by their nature, public organizations exist in the context of
written rules and regulations for accountability (the external conduct code) and
unwritten ethics and habits of the organizational system (inner thinking characteristics
such as morals and values) (Rong and Hongwei, 2012). This means that, in the public
sector, leadership has a particular significance as an important element in determining
public organizations’ culture, such as norms and values in terms of decision making
(Christiensen et al., 2007). In bureaucracies, legal authority and appointments to
positions are the keys to success and power (Dick and Ellis, 2006). Thus, the hierarchy
culture seems to be embedded in the public sector and seems to be difficult to change,
for example the cultures of several government agencies are often affected by the norms
and values of the parent ministries (Christiensen et al., 2007). The hierarchy culture may
be a challenge to public sector reform, for example reform requires power redistribution
(Dooren, Bouckaert and Halligan, 2015) and political decentralization is important in
attempting public sector reform in developing countries (Polidano and Hulme, 1999).
Edwards (1999) argues that bureaucratic hierarchy provides advantages in order to attain
good governance such as transparency, accountability and equity. Ashraf, Farooq and
Din (2014) suggest that leadership culture (hierarchy culture) provides both positive and
negative effects on employees’ performance and job satisfaction, i.e. participative
leadership positively affects the group and cultural development department while
directive leadership negatively affects employees’ behaviour.
Clan culture may also, by its nature, tend to be associated with the public sector. It refers
to the degree of employee cohesion and commitment (Cameron and Quinn, 2011).

43
A degree of commitment is seen as strong culture5 in order to enhance an organization’s
success (Luhman and Cunliffe, 2013). Clan culture (human resource) positively
correlates to the performance of organizations in terms of the outcomes (Eisend,
Evanschitzky and Gilliland, 2016) and job satisfaction (Lovas, 2007). Thus, Rong and
Hongwei (2012, p. 48) suggest that the public sector in modern society should establish
a ‘people-oriented’ management such as legitimate individual interests and personal
capabilities. This raises the question of whether there is a general civil service culture.
To this extent why some organizations operate well and why and how such
organizations defy norms (Owusu, 2012). Understanding organizational culture
provides many advantages, such as encouraging effectiveness of the public services,
developing effective strategies in increasing job satisfaction, and generating policy
proposals (e.g. clear reward system, management development and change) in the public
services (Harrow and Willcocks, 1990; Westhuizen, Pacheco and Webber, 2012).
By contrast, the market and adhocracy cultures appear to be less characteristic of public
organizations, although there have been many efforts to create these cultures in the
public sector through NPM and, specifically, performance measurement, performance-
related pay (PRP), and flexible organizational culture (seen as adhocracy culture)
(Whorton and Worthley, 1981). Generating the market and adhocracy cultures in public
organizations is not a simple task. For example, Jingjit (2008) explored organizational
culture in the Thai public sector and suggested that there has been a modest shift towards
the market and adhocracy cultures and away from the hierarchy and clan cultures during
the period of public sector reform, and Phookpan (2012) has argued that in the Thai
5 Strong culture is discussed later in section 2.4.2.

44
public sector the market and adhocracy cultures can be generated by external forces and
through integration reform. Although the market culture is based on private sector
techniques and values (Dooren, Bouckaert and Halligan, 2015), Moriarty and Kennedy
(2002 cited in Radnor and McGuire, 2004) suggest that performance measurement can
be used as a surrogate for market pressure (given that government organizations perform
their tasks without market competition).
2.4.2 Correlation between strong culture and performance
While organizational cultures may be classified according to different types, there is
also the question of the strength which the culture’s values are adhered to. Some claim
that a strong culture enables organizations to achieve performance (e.g. Brown, 1998;
Deal and Kennedy, 1982; Kotter and Heskett, 1992; Robbins, 2005), such that ‘strong
cultures cause strong performance...strong performance can help to create strong
cultures’ (Kotter and Heskett, 1992, p. 18) and ‘good performance is a strong culture’
(Kandula, 2006 cited in Ehtesham, Muhammad and Muhammad, 2011, p. 79). The term
‘strong culture’ is broadly defined by scholars, as in the following examples:
‘Strong culture is frequently employed to refer to companies in which beliefs and values
are shared relatively consistently throughout an organization’ (Brown, 1998, p. 226)
‘...the existence of a strong culture implies a commonly understood perspective on
how organizational life should happen, with most organizational members
subscribing to it’ (Senior and Fleming, 2006, p. 177)
45
‘...organizations can be presumed to have strong culture because of a long shared history
or because they have shared important intense experiences’ (Schein, 1990, p. 111)
‘In strong culture, the organization’s core values are both intensely held and widely
shared’ (Robbins, 2005, p. 488)
These definitions imply that strong culture refers to shared values, beliefs and history
throughout an organization. Here a high degree of sharing can contribute to a greater
commitment and be the glue which holds the organization together (Robbins, 2005;
Senior and Fleming, 2006). On the other hand, weak culture refers to having no
dominant pervasive culture and the presence of several different cultures existing
(Senior and Fleming, 2006). It may influence performance through conflict between the
different cultures and the reduced motivation of employees (Ehtesham, Muhammad and
Muhammad, 2011; Senior and Fleming, 2006).
A strong culture may play a key role in at least three ways. Firstly, strong culture
facilitates goal alignment, in which people share the organization’s core values and
share the same basic assumptions (Brown, 1998; Robbins, 2005). A clear goal leads
people to pursue the same direction, to generate initiative, energy and enthusiasm
(Brown, 1998). These attributes can contribute to greater results of organizational
performance due to a high degree of collaboration (e.g. people know the goals of the
corporation), and a high level of effective and quick communication (Brown, 1998; Deal
and Kennedy, 1982). A strong culture facilitates the process of commitment and control,
which ensures that the employees’ values and beliefs are consolidated (Senior and
Fleming, 2006). Christiensen et al. (2007) claimed, however, that over strong cultures

46
may be inflexible and too self-focused in public organizations, which may lead to
resistance against democratic control and low levels of adaptation to the environment;
such culture is seen to be associated with strong authoritarian leaders and it is often
negative for both the internal and external environment.
Secondly, strong cultures appear to have merits in relation to human resources in terms
of enhancing the level of employee motivation, reducing the rate of employee turnover,
and increasing behavioural consistency (Brown, 1998; Christiensen et al., 2007;
Robbins, 2005). Strong cultures generate high levels of employee motivation and make
people feel part of an organization (e.g. sharing their view on how the organization
should work, and participating in decision making) (Brown, 1998; Christiensen et al.,
2007). Therefore, strong cultures can reduce employee turnover levels and increase
behavioural consistency among the members of an organization (Robbins, 2005).
Finally, a strong culture enables the employees to learn from the organizations’ past, for
instance interpreting issues and events from past experience, making decisions on new
challenges based on precedents, and promoting self-understanding and social cohesion
through shared knowledge of the past (Brown, 1998).
In this context, strong cultures can facilitate the creation of the market culture (pursuing
goals) and clan culture (having strong loyalty and low turnover), both of which can be
considered as a source of delivering good governance through effectiveness and
participation. On the other hand, a strong culture could be a significant barrier to any
effort when people pay insufficient attention to diverse strengths and the backgrounds
that people can bring to the organization (McKenna and Beech, 2002). Similarly, Rainey
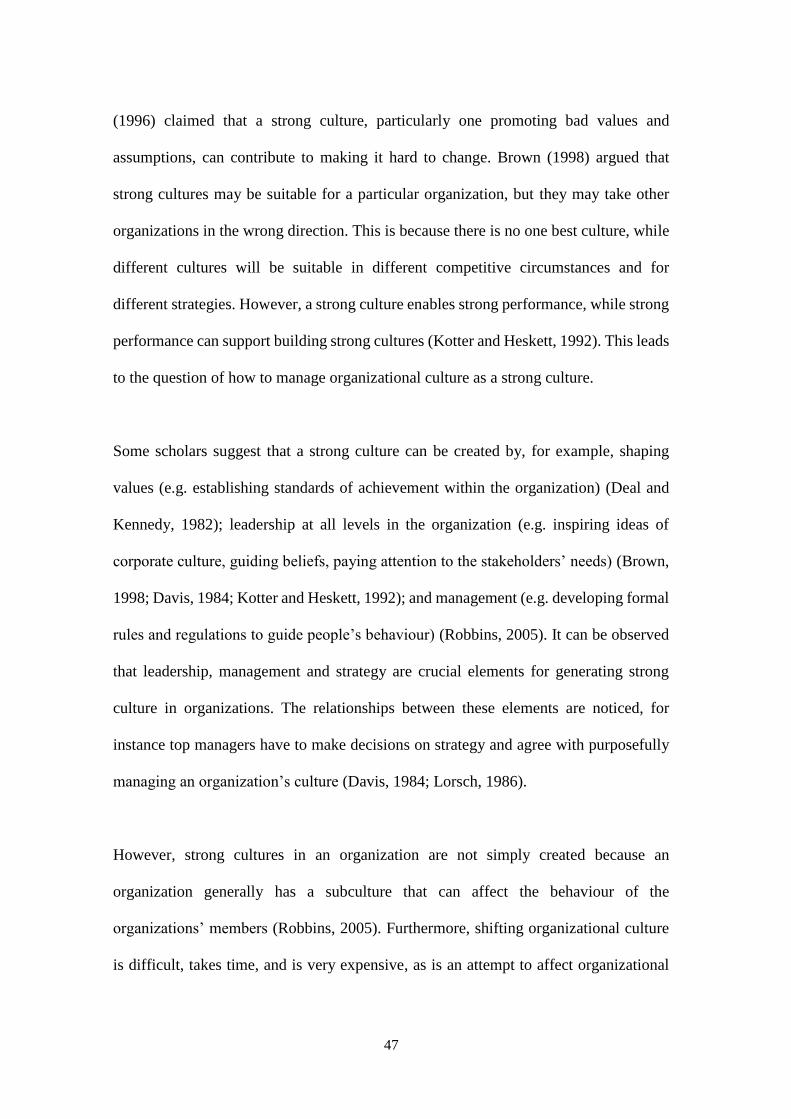
47
(1996) claimed that a strong culture, particularly one promoting bad values and
assumptions, can contribute to making it hard to change. Brown (1998) argued that
strong cultures may be suitable for a particular organization, but they may take other
organizations in the wrong direction. This is because there is no one best culture, while
different cultures will be suitable in different competitive circumstances and for
different strategies. However, a strong culture enables strong performance, while strong
performance can support building strong cultures (Kotter and Heskett, 1992). This leads
to the question of how to manage organizational culture as a strong culture.
Some scholars suggest that a strong culture can be created by, for example, shaping
values (e.g. establishing standards of achievement within the organization) (Deal and
Kennedy, 1982); leadership at all levels in the organization (e.g. inspiring ideas of
corporate culture, guiding beliefs, paying attention to the stakeholders’ needs) (Brown,
1998; Davis, 1984; Kotter and Heskett, 1992); and management (e.g. developing formal
rules and regulations to guide people’s behaviour) (Robbins, 2005). It can be observed
that leadership, management and strategy are crucial elements for generating strong
culture in organizations. The relationships between these elements are noticed, for
instance top managers have to make decisions on strategy and agree with purposefully
managing an organization’s culture (Davis, 1984; Lorsch, 1986).
However, strong cultures in an organization are not simply created because an
organization generally has a subculture that can affect the behaviour of the
organizations’ members (Robbins, 2005). Furthermore, shifting organizational culture
is difficult, takes time, and is very expensive, as is an attempt to affect organizational

48
change as a whole (Deal and Kennedy, 1982; Kotter and Heskett, 1992). Alternatively,
management can change organizational culture through top management and senior
managers’ actions (Alvesson and Sveningsson, 2008). This implies that strong cultures
may be generated by management and leadership – styles and strategies. These may take
shorter periods of time than efforts to change organizational culture because culture is
difficult to change (Hofstede et al., 1990; Schwartz and Davis, 1981) and it can be stable
over time (Kotter and Heskett, 1992).
2.4.3 Theories and empirical studies of organizational culture
There have been many efforts to understand organizational culture through several
concepts and models, such as the organizational iceberg (Andrews, 2013, p. 44; French
and Bell, 1990, 1999 cited in Senior and Fleming, 2006, p. 138-139); the levels models
(Schein, 1990; 2004); seven characteristics of organizational culture (Robbins, 2005);
and Denison’s organizational culture model and the Competing Values Framework
(CVF) (Cameron and Quinn, 2011). In particular, the CVF appears to be one of the most
widely used models for studying organizational culture. It has attracted considerable
attention in many empirical studies (e.g. Al-Kuwari, 2002; Grabowski et al., 2015;
Jingjit, 2008; Parker and Bradley, 2001; Phookpan, 2012). It has proved useful as a
significant approach to organizational effectiveness compared with other models. The
current study focuses on the CVF models, although other studies on organizational
culture in the public sector (e.g. Claver et al., 1999; Moon, 2000; Quirk, 2002) used
other concepts and models. The reasons why the CVF is selected for investigating
organizational culture and good governance in the current study are discussed through
the next topic regarding what is the CVF; comparison of the CVF/OCAI to other crucial

49
organizational culture models; and identified gaps in the literature and the analytical
framework of this study.
What is the CVF?
The Competing Values Framework (CVF) was initially developed by Quinn and
Rohrbaugh (1983) as a consequence of research conducted on the key indicators of
effective organizations. Since its development, the CVF has been broadly used in the
field of organizational culture studies to diagnose and facilitate change in organizational
culture (Cameron and Quinn, 2011). The CVF comprises a set of organizational
effectiveness indicators. Figure 2 illustrates two core dimensions: control versus
flexibility, and an internal versus external orientation (Cameron and Quinn, 2011). From
these two dimensions, four core categories of culture can be sorted: clan, adhocracy,
market, and hierarchy models. Alternatively, Quinn and Rohrbaugh (1983) represent the
CVF through three value dimensions: organizational focus (internal versus external
emphasis), organizational structure (control versus flexibility emphasis), and
organizational means and ends (process versus outcomes).
The Organizational Culture Assessment Instrument (OCAI) is probably the most often
employed instrument for assessing organizational culture based on the CVF. The OCAI
allows researchers to diagnose culture through the assessment of ‘core values,
shared assumptions, and common approaches to work’ (Heritage, Pollock and Roberts,
2014, p. 1).

50
Figure 2 The relationship between the values in the Competing Values Framework (CVF)
Source: Cameron and Quinn (2011, p. 39) Quinn and Rohrbaugh (1983, p. 369)
The OCAI comprises four core culture types and orientation of the organization based
on the four core culture types as follows:
The hierarchy (control) culture: The hierarchy culture is a characteristic of
bureaucracy in order to create stable, efficient, highly consistent products and
services (Cameron and Quinn, 2011). This is because hierarchy culture has a
clear organizational structure, standardized rules and procedures, strict control,
and well defined responsibilities (Yu and Wu, 2009). This implies that the
hierarchy culture can deliver efficiency, effectiveness, accountability and rule of
law (criteria of performance-related pay).
The market (compete) culture: The market culture focuses on transactions with
external constituencies such as suppliers, customers, and regulators, in which
competitive focus, task focus, and result focus are created within the
organizations (Cameron and Quinn, 2011). This reflects that the market culture
Ex
tern
al F
ocu
s an
d D
iffe
ren
tiat
ion
Flexibility and Discretion
Stability and Control
Inte
rnal
Fo
cus
and
In
teg
rati
on
Clan
(Collaborate)
Adhocracy
(Create)
Hierarchy
(Control)
Market
(Compete)
HUMAN RELATIONS MODEL OPEN SYSTEM MODEL
INTERNAL PROCESS MODEL RATIONAL GOAL MODEL
Means: Cohesion, morale
Ends: Human resource development
Means: Flexibility, readiness
Ends: Growth, resource acquisition
Means: Introduction management,
communication
Ends: Stability, control
Means: Planning, goal setting
Ends: Productivity, efficiency
Output
Quality

51
can lead to effectiveness and responsiveness (customer preferences of public
services).
The clan (collaborate) culture: The clan culture is to share values and goals,
cohesion, participation, individuality, and a sense of ‘we-ness’, in which the
organizations’ success is generated by the internal climate and employee (e.g.
teamwork, participation, and consensus) (Cameron and Quinn, 2011, p. 46, 48).
The clan culture tends to increase participation, consensus orientation,
accountability, transparency (the clear criteria of reward allocation), and equity
(fairness of reward allocation).
The adhocracy (create culture): The adhocracy culture is ad hoc in that it refers
to something temporary, specialized, and dynamic, of which the main goal is to
foster adaptability, flexibility, and creativity in an uncertain atmosphere
(Cameron and Quinn, 2011). Cameron and Quinn also state that this culture can
produce effectiveness.
These four culture types are organized into six key dimensions of the OCAI:
1) dominant characteristics, 2) organizational leadership, 3) management of employees,
4) organization glue, 5) strategic emphases and 6) criteria of success. Each dimension
consists of four alternatives (A, B, C and D) that reflect the four culture types (clan,
adhocracy, market and hierarchy cultures respectively) (see Appendix 5: 5.1). In each
dimension, the participants are asked to distribute 100 points among the four
alternatives, depending on how similar the alternative is to their organization by giving
the higher number of points to the alternative that is the most similar to their
organization. Meanwhile, in these dimensions, they are required to provide answers in

52
the ‘Now’ column in the first time (an organization’s current culture) and in the second
time complete the ‘Preferred column’ (culture that should be developed for the future)
(see Appendix 5:5.1). After the OCAI is completed by the participants, the OCAI
worksheet is used for scoring the OCAI (see Appendix 5:5.2).
Tachateerapreda (2009) claimed that using a five-point Likert scale for the OCAI can
facilitate the respondents, decreasing confusion caused by a variety of scales. The
validity and reliability of using the Likert scale for assessing organizational culture are
asserted by Quinn and Spreitzer (1991). They stated that the Likert scale leads to
establishing convergent validity because a significant correlation between the scale
scores from the same quadrant were seen. Furthermore, several scholars agree that the
use of the five-point Likert scales provide many benefits, for example creating reliability
by multi-items indicators (De Vaus, 2002); being appropriate for attitude questions by
providing adequate response alternatives (Vanderstoep and Johnson, 2009); and
generating willingness by the respondents due to the easy items (the five-point Likert
scale) rather than the hard ones (100 points) (Babbie, 1990).
Figure 3 shows how the scores of now and preferred cultures acquired from the OCAI
are used to construct an organizational profile. This reflects the overall picture of the
organization’s culture through the four quadrants, in which the higher scores reflect the
stronger culture that forms the core aspects of the organization’s culture.
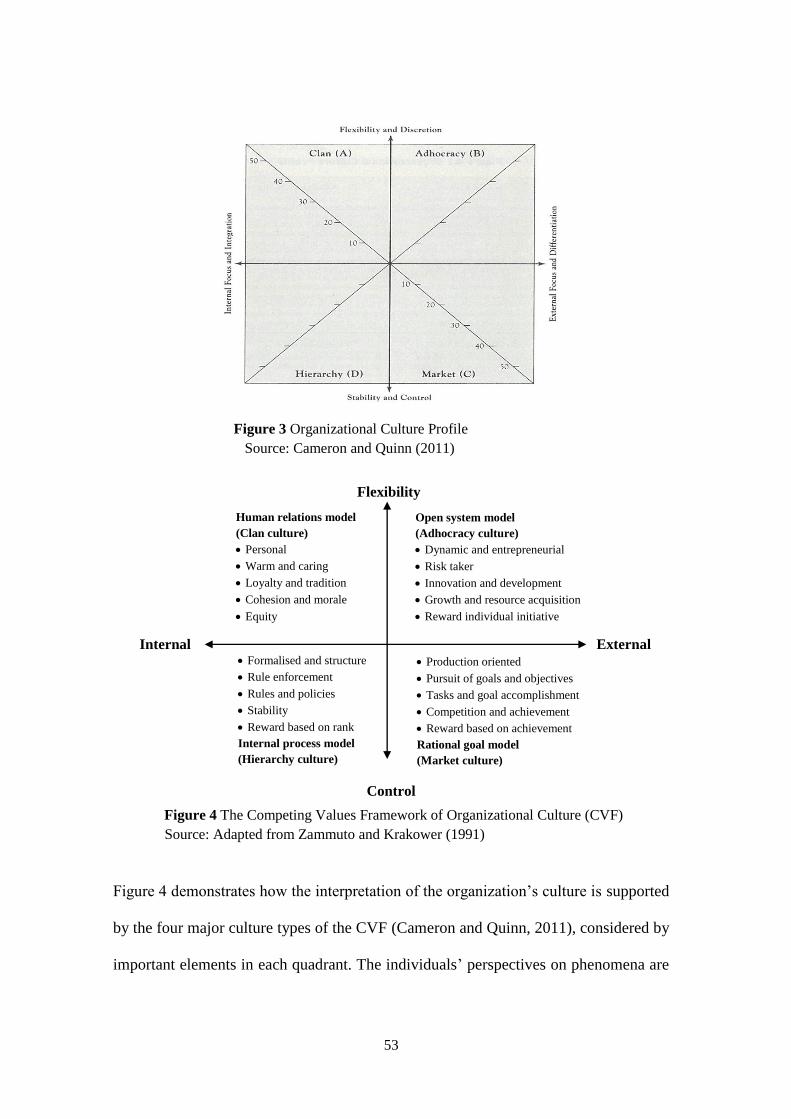
53
Figure 3 Organizational Culture Profile
Source: Cameron and Quinn (2011)
Figure 4 The Competing Values Framework of Organizational Culture (CVF)
Source: Adapted from Zammuto and Krakower (1991)
Figure 4 demonstrates how the interpretation of the organization’s culture is supported
by the four major culture types of the CVF (Cameron and Quinn, 2011), considered by
important elements in each quadrant. The individuals’ perspectives on phenomena are
Human relations model
(Clan culture)
Personal
Warm and caring
Loyalty and tradition
Cohesion and morale
Equity
Open system model
(Adhocracy culture)
Dynamic and entrepreneurial
Risk taker
Innovation and development
Growth and resource acquisition
Reward individual initiative
Production oriented
Pursuit of goals and objectives
Tasks and goal accomplishment
Competition and achievement
Reward based on achievement
Rational goal model
(Market culture)
Formalised and structure
Rule enforcement
Rules and policies
Stability
Reward based on rank
Internal process model
(Hierarchy culture)
Control
External
Internal
Flexibility

54
interpreted to understand the attainment of good governance, such as a high cooperation
level reflecting participation of members of an organization.
Comparison of the CVF/OCAI to other crucial organizational culture models
There are diverse types of models measuring organizational culture developed by
scholars as stated earlier. Among these models, Denison’s organizational culture model
seems to be the most similar to the CVF, which includes four traits of organizational
cultures: involvement, consistency, adaptability, and mission (Denison and Mishra,
1995). The four traits of the Denison model appear to be more complex than the CVF
and its sub-dimensions have been challenged by some researchers (e.g. Wang et al.,
2006 cited in Yu and Wu, 2009).
However, the CVF and OCAI are criticized in terms of scale, for example Yu and Wu
(2009) claimed that using only two or three dimensions of the CVF is insufficient
to measure organizational culture. Other models seem to contain more items for
measuring organizational culture, for example the Organizational Culture Profile,
includes 54 questions in nine dimensions (O'Reilly, Chatman and Caldwell, 1991);
the Multidimensional Model of Organizational Culture, includes 135 questions in six
dimensions (Hofstede et al., 1990); and the organizational Culture Inventory, includes
120 items in three dimensions (Cooke and Rousseau, 1988). Furthermore, the OCAI
appears to focus on limited evidence of psychometric suitability and has a weak criterion
validity when it is employed to assess ideal culture (Heritage, Pollock and Roberts,
2014).
55
However, the CVF and OCAI have various merits compared with the above models.
Firstly, the CVF and OCAI allow the organizations measuring organizational culture
to enhance organizational effectiveness and identify the existing and preferred
organizational cultures in order to promote cultural change (Cameron and Quinn, 2011;
Heritage, Pollock and Roberts, 2014; Rojas, 2000). This is because the CVF can
integrate most organizational culture dimensions, particularly the value dimension
relevant to effectiveness (Yu and Wu, 2009). Secondly, the CVF and OCAI have few
dimensions for measuring organizational culture but broad implications compared to
other models. In other words, the CVF and OCAI are likely to be less complex, but the
benefits are broader through interpretation. Thirdly, the CVF and OCAI provide
empirical validity and reliability in terms of the standard questions in the OCAI
(Cameron and Quinn, 2011), which has been used for much empirical research (e.g.
Howard, 1998; Ralston et al., 2006).
Fourthly, the CVF and OCAI allow the researchers to use multiple methods in a single
study, as seen from several empirical studies (Jingjit, 2008). Fifthly, the CVF is
considered an appropriate method for examining the extent of bureaucratic culture
(hierarchy model) within the public sector (Jingjit and Fotaki, 2010; Parker and Bradley,
2001). This is consistent with the idea of Rojas (2000) that the CVF can provide benefits
for research in the non-profit sector. Finally, the OCAI is one of the most extensively
employed as an appropriate instrument in cross-cultural research in many countries,
particular Asian countries such as China, Hong Kong, Japan, Vietnam and Thailand
(Kwan and Walker, 2004; Yu and Wu, 2009).

56
Identified gap in the literature and developed analytical framework of the study
Although the extensively used OCAI has proven beneficial as an approach to studying
the effectiveness of organizations, particularly in the public sector, the six key
dimensions of the OCAI seem to allow the researcher to learn little about the employees’
job satisfaction and the feature of reward. This is for two main reasons.
Firstly, the items of reward and job satisfaction matter in a particular context such as the
programme of performance evaluation that is focused on the current study. At a
minimum, some association between culture and motivation is inevitable (Pheysey,
1993) as well as between culture and job satisfaction (Lovas, 2007; Lund, 2003). The
correlations between reward and job satisfaction are equally significant and should be
considered. Reward is crucial in terms of enhancing the job satisfaction level and
organizational commitment, and promoting organizational effectiveness, particularly
financial reward (Moon, 2000). Rewarding achievement is often seen as one of the
purposes of a programme of performance management (Moores, 1994). Regarding job
satisfaction, it is important to measure how employees feel about working conditions,
such as how interesting their work is, reasonable workload, and pay and promotion
(Lam, 1994). Such a programme of performance evaluation, viewed as a control system,
may affect people’s job satisfaction. Here it is important to note that the employees’
satisfaction is significantly stronger in conditions of a high level of autonomy (Jong,
2016) and measuring job satisfaction is different from organizational culture, namely
organizational culture is descriptive, while job satisfaction is evaluative (Robbins,
2005).
57
Secondly, the OCAI is viewed as a standard instrument for assessing organizational
culture, but it does not show what works or what is more effective. This is consistent
with the idea proposed by Talbot (2010) that the CVF model was not a multidimensional
performance model at all. Similarly, Jingjit and Fotaki (2010) state that the complexity
of organizational culture means that is not simple to cover all aspects in a single study.
Therefore, the six key dimensions of the OCAI do not sufficiently accommodate the
aspects of reward and job satisfaction. Although Heritage, Pollock and Roberts (2014)
claimed that the OCAI demonstrates a significant relationship with job satisfaction in
voluntary organizations, this may not hold for other types of organization where intrinsic
motivation plays less of a role than in the voluntary sector. Jingjit and Fotaki (2010) and
Parker and Bradley (2001) used the item of organizational reward in the form of
promotion, based on the idea of Zammuto and Krakower (1991), whilst Parker and
Bradley (2001) used the item of job satisfaction for the questionnaire.
According to the reasons as stated above, the analytical framework of the current study
was developed. Figure 5 illustrates the analytical framework of the study that combines
the six key dimensions of the OCAI based on the CVF (Cameron and Quinn, 2011) –
the CVF was originally developed by Quinn and Rohrbaugh (1983) – and the items of
organizational reward in the form of promotion and job satisfaction (Jingjit and Fotaki,
2010; Parker and Bradley, 2001; Zammuto and Krakower, 1991). The eight key
dimensions can be used to conduct questionnaire surveys and semi-structured interviews
in the context of PA. These may elicit information regarding implementing good
governance through the lens of PA.
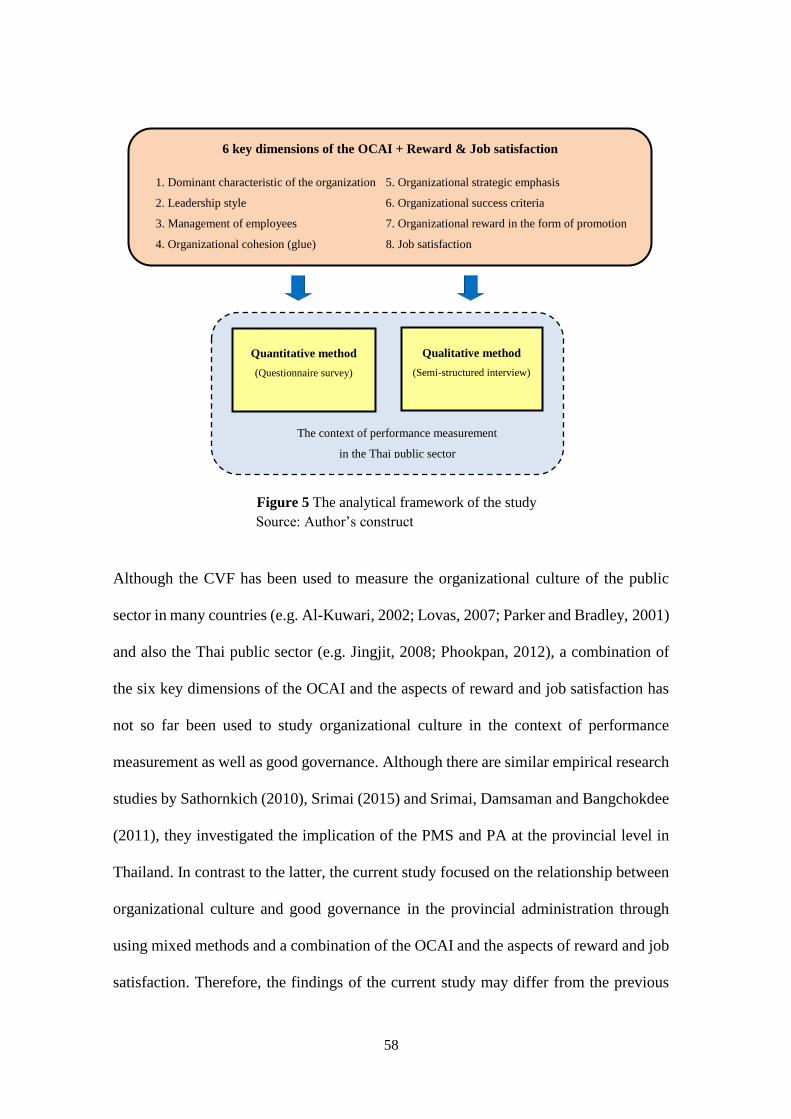
58
Figure 5 The analytical framework of the study
Source: Author’s construct
Although the CVF has been used to measure the organizational culture of the public
sector in many countries (e.g. Al-Kuwari, 2002; Lovas, 2007; Parker and Bradley, 2001)
and also the Thai public sector (e.g. Jingjit, 2008; Phookpan, 2012), a combination of
the six key dimensions of the OCAI and the aspects of reward and job satisfaction has
not so far been used to study organizational culture in the context of performance
measurement as well as good governance. Although there are similar empirical research
studies by Sathornkich (2010), Srimai (2015) and Srimai, Damsaman and Bangchokdee
(2011), they investigated the implication of the PMS and PA at the provincial level in
Thailand. In contrast to the latter, the current study focused on the relationship between
organizational culture and good governance in the provincial administration through
using mixed methods and a combination of the OCAI and the aspects of reward and job
satisfaction. Therefore, the findings of the current study may differ from the previous
6 key dimensions of the OCAI + Reward & Job satisfaction
1. Dominant characteristic of the organization 5. Organizational strategic emphasis
2. Leadership style 6. Organizational success criteria
3. Management of employees 7. Organizational reward in the form of promotion
4. Organizational cohesion (glue) 8. Job satisfaction
The context of performance measurement
in the Thai public sector
Quantitative method
(Questionnaire survey)
Qualitative method
(Semi-structured interview)

59
study. Receiving quantitative data allows the researcher to compare values that affect
performance based good governance by the OCAI based on the CVF. The quantitative
data may be more valid or reliable (Goddard, Mannion and Smith, 1999) due to being
based on a structured approach. Furthermore, the study obtained qualitative data through
in-depth and focused group interviews. These results are compared and combined in
order to assess the validity of the findings.
2.4.4 Development of analytical framework
The theoretical and conceptual frameworks are important in order to contribute practical
and analytical frameworks – how to collect data and analyze collected data. There are
three main phases to develop analytical frameworks: review of literature; assessment of
theoretical and conceptual approaches; and practical and analytical framework, as
demonstrated in Figure 6.
The first phase was a review of the literature on three key features: good governance,
performance and organizational culture focused on the context of public administration.
The existing literature suggested that the concept of good governance is considered to
be a condition of aid donors, especially international organizations, in order to
encourage performance management in the public sector. Performance management is
not simple in practice because there is an organizational culture, which is viewed as a
key determinant that can both enable and inhibit its success.

60
Figure 6 Development process of analytical framework
The second phase was an assessment of theoretical and conceptual approaches on good
governance, performance and organizational culture. The evidence suggested that good
governance is viewed as a concept for public management and reform. In addition, the
concept of performance is related to PMS. Particularly, the stage of performance review
included performance measurement, performance assessment, performance evaluation,
and performance appraisal. The CVF developed by Quinn and Rohrbaugh (1983) is
considered to be one of the most important models for analysing organizational culture,
and for enhancing organizational effectiveness and facilitating change.
Assessment Theoretical
& Conceptual
Approaches
Good Governance
Practical and Analytical
Frameworks
6 key dimensions of the OCAI +
Reward & Job satisfaction
9 key components of Good Governance in
relevance to performance
Determinants of Performance
Review of Literature
Performance
Organizational
Culture
A concept for Public
Management & Reform
PMS
Organizational Theories
Competing Values
Framework (CVF)
Performance review
Performance measurement
Performance assessment
Performance evaluation
Performance appraisal
A key determinant
affect performance
focused
A key condition
leads to performance
management focused
Good
Governance
In the context of public
administration In the context of public
administration
- Efficiency - Rule of law
- Effectiveness - Equity
- Accountability - Responsiveness
- Transparency - Consensus
- Participation oriented
- Job satisfaction
- Leadership
- Motivation
8 key dimensions on organizational culture
for the surveys and the interviews
1. Dominant characteristic of the organization
2. Leadership style
3. Management of employees
4. Organizational cohesion (glue)
5. Organizational strategic emphasis
6. Organizational success criteria
7. Organizational reward in the form
of promotion
8. Job satisfaction

61
These theoretical and conceptual approaches led to the development of practical and
analytical frameworks in the third phase. The principle of good governance consists of
at least nine key components, and the components can be used as a means or an end for
public management and reform. Regarding PMS as focused on performance
measurement, determinants of performance are identified in three main categories, and
these can lead to a consideration of what determinants affect performance that delivers
good governance. In terms of organizational culture, the OCAI is a crucial instrument
based on the CVF model, and comprises six key dimensions: dominant characteristics
of the organization, leadership style, management of employees, organizational
cohesion, organizational strategic emphasis, and organizational success criteria
(Cameron and Quinn, 2011). The six key dimensions were combined with the
dimensions of reward in the form of promotion and job satisfaction (Jingjit and Fotaki,
2010; Parker and Bradley, 2000; Zammuto and Krakower, 1991). This is because these
attributes are important in the context of performance evaluation. Therefore, the total
number of key dimensions used for the surveys and the interviews was eight.

62
2.5 Summary
This chapter has aimed to develop the analytical framework for the study of the
relationship between organizational culture and good governance in the civil service.
Constructing the analytical framework required understanding of three main topics:
pursuing good governance, determinants of performance, and organizational culture.
The concept of good governance in the public administrative sense comprises at least
nine key components. There are few empirical studies that have investigated
comprehensive components of good governance in a single study, particularly
the relationship between organizational culture and performance related to good
governance. In contrast, this research focuses on all components of good governance
through the PA scheme. In addition, some empirical studies used the OCAI with the
aspect of reward or job satisfaction, but this research integrated both reward and job
satisfaction in a single study.

63
CHAPTER 3
CULTURE AND GOOD GOVERNANCE
IN THAILAND
3.1 Introduction
Having considered the impact of organizational culture on performance in the previous
chapter, the present chapter considers the national cultural context and its influence on
good governance and civil service performance. The purpose of this chapter is to discuss
Thai culture and values, and the development of good governance in Thailand. It begins
with a background (section 3.2), which sets out general information on Thailand, its
politics and provincial administration. This is followed by section 3.3, which considers
Thai culture and values (drawing on the framework of Hofstede), and the values of the
Thai public sector. Section 3.4 considers good governance in Thailand, including civil
service reforms before and after 2002. Section 3.5 focuses on the performance
agreement (PA) in provincial administration. This comprises the structure of provincial
administration and the government agencies relevant to PA, monetary incentive,
creating PA, and challenges of PA. The chapter ends with an attempt to draw these
strands together to provide an overview of good governance and civil service reform in
the Thai political and cultural context.
64
3.2 Background
3.2.1 General information on Thailand
Thailand is situated in Southeast Asia and is bordered by Myanmar (Burma), Laos
People’s Democratic Republic, Cambodia and Malaysia. Thailand was formerly known
as ‘Siam’ and was renamed ‘Thailand’ in 1939 (NESDB, 2006). It consists of four
regions, North, Central plain, Northeast and South and is divided into 76 provinces and
the capital Bangkok, which is a special administrative area. The total population of
Thailand is around 65.73 million people6 (Department of Provincial Administration,
2015). The major ethnic group is Thais, who make up about 80 percent of the population
(Ministry of Foreign Affairs of the Kingdom of Thailand, 2013). The second largest
ethnic group is Chinese, which is about 10 percent. The vast majority of Thais are
Buddhist, about 90 percent of the population, and the remaining 10 percent comprises,
for example, Muslim, Christian, and Hindu (National Statistical Office, 2010).
Thailand is the only country in Southeast Asia that was never colonized by European
powers such as Great Britain and France (CountryWatch, 2016). As a result it has a
self-contained political system and a high degree of cultural uniqueness (Shor, 1960).
Stability has been assisted by the country’s relative homogeneity and, perhaps, the
pacifying role of the Monarchy. Democratization is seen as being based on good
governance, the rule of law, human rights, transparency, and accountability (Ministry
of Foreign Affairs of the Kingdom of Thailand, 2013).
6 The statistical population of Thailand on the 31st December 2015 was given by Department of Provincial
Administration’s promulgation on the 4th February 2016.
65
3.2.2 Politics
Thailand was ruled by an absolute monarchy before the country’s politics were
transformed to a constitutional monarchy by a bloodless coup in 19327 (Baker and
Phongpaichit, 2014; CountryWatch, 2016; Hewison, 1997a). Thailand is a constitutional
monarchy, in which sovereign power belongs to the Thai people and the King rules as
the head of state in relation to the country’s Constitution (Royal Thai Consulate-
General, 2016). The country’s administration is conducted by a prime minister as head
of a parliamentary government and the cabinet that the prime minister forms, which is
relatively similar to the United Kingdom (Royal Thai Consulate-General, 2016;
Tourism Authority of Thailand, 2016). The Thai government is based on a
parliamentary system headed by the prime minister, who is elected through an open vote
by members of the House of Representatives. Thailand’s political system has been
dominated by several significant factors, particularly the monarchy, military,
constitution, business groups and religion (Hewison, 1997a; McCargo, 2012;
Selaratana, 2009).
The institution of the monarchy was established in Thailand in the 13th century.
Although Thailand’s politics have been based on the constitutional monarchy since
1932, the institution of the monarchy appears to play a significant role in Thai politics,
as observed from the following evidence:
7 Revolution converts absolute monarchy to constitutional monarchy on 24th June 1932 (Baker and
Phongpaichit, 2014).

66
‘...The Thais view the King as sacred and as a spiritual leader who serves as a symbol
of unity...Because of this, the monarch remains above all conflicting political
groups. Support of the monarchy remains an indispensable-source of political
legitimacy. A political leader or regime, even a popularly elected government,
would not be truly legitimized without the King’s blessing’ (Surin, 1992 cited in
Hewison, 1997b, p. 61).
Likewise, Hewison (1997b) emphasizes that the monarchy’s influence on Thai politics
is ‘crucial to political stability’ and ‘the sole source of unity and strength’ in the nation.
The social and political crises were often solved by the monarch’s intervention
(Maisrikrod, 1999). Maisrikrod also stated that the monarchy is important as a primary
source of Thai values and culture.
Regarding the military, Thailand’s politics are inevitable in relevance to a history of
military interventions. Chai-Anan Samudavnija (1997 cited in Maisrikrod, 1999)
claimed that political power under military regimes should be replaced by a strong civil
society. Nevertheless, the power of the military has not been diluted in Thai politics.
The dominance of military coups was portrayed between 1947 and 1992, namely this
was a period characterized by coups, attempted coups and various protests (Baker and
Phongpaichit, 2014; CountryWatch, 2016). Thereafter, there were various military
coups, for example in September 2006 by the Council for National Security (CNS) – the
government of Thaksin Shinawatra was overthrown by a coup (Baker and Phongpaichit,
2014; CountryWatch, 2016). In 2014, a coup was launched by National Council for

67
Peace and Order (NCPO)8 led by Prayut Chan-o-cha, the Prime Minister from 2014 to
date (The Secretariant of the House of Representatives, 2016). The reason for the junta
provided by NCPO was the prolonged political deadlock and protests, various violent
situations, and the ineffective performance of the caretaker government of Yingluck
Shinawatra9 (Royal Thai Government, 2014). It is important to note that the drafting of
successive constitutions of the Kingdom of Thailand often occurs after a military coup.
Since the peaceful transformation in 1932, Thailand has had a total number of 19
existing constitutions of the Kingdom of Thailand (The Secretariat of the House of
Representatives, 2016), including the Constitution of the Kingdom of Thailand (Interim)
Act B.E. 2557 (2014) that has been in use so far. However, the latest draft Constitution
of the Kingdom of Thailand B.E. 2559 (2016) was approved through a constitution
referendum on 7th August 2016 by 61.35 percent 10 (Office of The Election Commission
of Thailand, 2016).
The other factor that has influenced Thailand’s politics is business groups, the power of
private sector capitalists11 (Handley, 1997). Christensen (1993 cited in Hewison, 1997a)
stated that several business groups, such as organized business, industrialists, urban
8 The National Council for Peace and Order (NCPO) took control of the national administration on the
22nd May 2014 promulgated on the 24th May 2014, which was led by Prayut Chan-o-cha, head of
NCPO. (The Secretariant of the House of Representatives, 2016) 9 Yingluck Shinawatra was the first female prime minister of Thailand and Thaksin’s sister, viewed as a
puppet of her older brother. (from: http://www.bbc.co.uk/news/world-asia-pacific-13723451
Accessed: 28 March 2016) 10 The Constitution of the Kingdom of Thailand B.E. 2559 was carried on by the government of Prayut
Chan-o-cha. 11 Wealth became a central determinant of policy and political position...For example, post-Prem
government period, the Stock Exchange of Thailand (SET)- the participation of a huge number of
middle- and upper-class investors- was a strong determinant of political behaviour (Handley, 1997,
p. 94, 113).
68
bankers, provincial elites and the rural majority, have sought opportunities from political
systems for their own benefits. The most distinct example is the case of former Prime
Minister Thaksin Shinawatra who possessed the biggest telecommunications empire in
Thailand. Moreover, businessmen at the local level are likely to influence local politics.
They are not only rich but also powerful and attempt to participate in local politics,
where some of them use their power position for their own benefits in order to use
money in the political system in rural areas, such as using money for obtaining votes
(Selaratana, 2009). In Thailand, the interaction between businessmen and politicians can
contribute to purchasing opportunities and favours. The same is true for many Southeast
Asian countries where the relationship between big businesses and public servants can
also be linked to political control (Mutebi, 2008).
In addition, the correlation between Thailand’s politics and the sangha 12 has been
described as a ‘continuous dialogue’ because the sangha is considered as an instrument
of state power and legitimation (McCargo, 2012). For example, a few hundred pro-
Thaksin ‘redshirt’ monks participated in the protests in 2010. By contrast, there was a
movement of monks (e.g. the Santi Asoke, V. Vajiramedhi) to the other political side
called the People’s Alliance for Democracy (PAD), a ‘yellowshirt’ royalist grouping.
The monks’ involvement in politics plays a significant role because the majority of
Thais (over 90 percent) are Buddhists (Royal Thai Consulate-General, 2016). The Thai
people’s character and personality is therefore shaped by their belief in Buddhism such
as politeness, modesty and tolerance (Kusy, 1991).
12 Sangha refers to a community of monks, including Theravada (or Hinayana or lesser vehicle) and
Mahayana (or greater vehicle) (Kusy, 1991).

69
The development of Thailand’s politics has been very volatile because of the
interactions of the factors highlighted earlier. It can therefore be observed that there is a
linkage between the political system and the bureaucratic system. Politics appears to
play a significant role in the civil service reform in Thailand. This point is emphasized
by the research findings of Chula Unisearch (2005) who argued that the attitudes and
behaviours of politicians, government officers, and related persons in bureaucracy have
a strong impact on the characteristics of the responses to the context of change of the
Thai civil service. Politics is not the only crucial factor affecting civil service
implementation, however, there is also the influence of the culture and values of Thais
discussed in section 3.3.
3.2.3 Provincial administration
The state administration of Thailand is divided into three levels: central administration,
provincial administration, and local administration, in accordance with the State
Administration Act B.E. 2534 (1991) (Office of the Council of State, 1991). At
the provincial level, a province is administered by a Governor who is a permanent civil
servant and appointed by the Ministry of Interior (Sopchokchai, 2001). The Governor
performs their duties in collaboration with 2-3 Vice Governors (Mektrairat, 2007).
Administration at the provincial level, the policies and primary executions, are based on
the regional offices of ministries and departments, whose authority and certain decision-
making responsibilities are authorized to the agencies in a province (Sopchokchai, 2001;
UN, 1997).
70
Provincial administration comprises 75 provinces with Bangkok Metropolitan Area and
was increased to 76 provinces in 2011 when the 76th province, Bueng Kan, was
established 13 (The Secretariant of the House of Representatives, 2011). Provincial
administration is important because the government agencies are relatively close to the
citizens in the area in terms of increasing citizens’ well-being and responding to citizens’
needs and problems (Sathornkich, 2010). The provinces’ performance has a significant
impact on the citizens in the provinces (Srimai, 2015).
3.3 Culture and values
The characteristics of Thai national culture and values appear to influence the reforms
of Thai public organizations (Pimpa, 2012). This section discusses Thai national culture
and values acquired from the existing literature and many empirical studies and also
discusses the culture of the Thai public sector.
3.3.1 Thai national culture and values
The construction of Thai national culture is significantly correlated with geographic,
economic, demographic and political national indicators (Hofstede, 1981), including
historical reasons, religion and monarchy. Several Asian countries such as India, China,
and Cambodia have dominated the foundation of Thai culture (Thailand, 2013). In
particular, India influenced Thai culture in terms of religion (Charnnarong, 2013). The
dominant role of Buddhism is a consequence of religious movement seen as Theravada
13 Bueng Kan is the 76th province of Thailand, in accordance with the Act establishing Changwat Bueng
Kan B.E. 2554 (2011) promulgated on 11th March B.E. 2554 (2011) (The Secretariat of the House of
Representatives, 2011). Thus, Bueng Kan was not included for performance agreement between 2007
and 2011 used for this study.

71
Buddhist society, which has a significant impact on Thais’ folklore and identifies the
national culture in Thailand (Evans, 1998; Reynolds, 2006). Moreover, the monarchy
has influenced Thai culture because the King is believed to be ‘Saksit’ (metaphysically
powerful) (Evans, 1998). This can be observed through the statement ‘the Monarchy is
an institution of worship. Any transgression to the Monarchy either openly or secretly
is a misdemeanor according to the Constitution’ (Ministry of Culture, 2013, p. 1).
Understanding a nation’s culture and values is necessary because these can contribute
to grasping the values and behaviour of the people in that country. Such a statement is
emphasized by some scholars (e.g. Hofstede, 2001; Rokeach, 1970) who argue that the
national culture14 can shape the value systems of the main group of the population and
stabilize over long periods in history. Likewise, Komin (1990) stated that a system of
values becomes a guide to people’s behaviour found in every culture. Here the
discussion of Thai culture and values is considered by Hofstede’s national cultural
dimensions, with particular studies related to Thai culture and values.
Relevance of Hofstede and particular studies on Thai culture and values
Hofstede (2001, p. 1) proposed five cultural dimensions: power distance, uncertainty
avoidance, individualism and collectivism, masculinity and femininity, and long-term
and short-term orientation. Alternatively, Komin (1990) proposed that the Thai national
characteristics comprise nine value orientations: the ego, grateful relationship, smooth
interpersonal relationship, flexibility and adjustment, religio-psychical orientation,
14 The pattern of national culture is known as ‘national character’ or ‘social factor’ (Hofstede, 2001,
Rokeach, 1970).

72
education and competence, interdependence, fun-pleasure, and achievement-task.
Regarding national values, Hofstede et al. (2010) stated that a country’s values are
strong and not easily changed because they are related to the structure and functioning
of its institutions – the basic elements of society such as the family, the school, and the
community. Komin (1990) claimed that values may change or become stable to
constitute national characteristics.
However, other scholars (e.g. Chevrier, 2003; Pimpa, 2012) have criticized Hofstede’s
interpretation of culture. Chevrier (2003) claimed that Hofstede employed a quantitative
study based on North American values, which might not be useful in a cross-cultural
project involving members of different cultural backgrounds, such as Asian and
European. Pimpa (2012) also argued that Hofstede’s cultural dimensions may lack
validity in a society where subculture is strong, such as religion and belief, race and
ethnicity, and geopolitical factors. Meanwhile, Hofstede’s cultural dimensions are used by
many empirical studies (e.g. Pimpa, 2012; Selaratana, 2009). The five cultural
dimensions proposed by Hofstede (1991) can be explained as follows:
(1) Power distance
Power distance refers to the distribution of interpersonal influence in a culture and the
degree of inequality in power between a more powerful individual and a less powerful
one (Hofstede, 2001). According to Hofstede’s exploring of power distance differences
in 50 countries, power distance in Thailand is categorized in the group of high power
distance value countries. Country power distance index values in Thailand are 64, from
a range of between 104 for Malaysia and 11 for Australia, meaning inequality in Thai
73
society is normal. Komin (1990) argued that existential inequality among Thai
employees can be accepted, which is different from American culture that has smaller
power distance (a higher degree of equality among its people). In Thailand, inequality
has been seen in different dimensions of society, for example, gender, education,
economics, social status and opportunities (Selaratana, 2009).
Moreover, inequality in Thai society may be derived from other values such as
‘Bunkhun’ (goodness or usefulness) and hierarchy. ‘Bunkhun’ builds on personal
motivations, and on affiliation and security (Mulder, 1994). Hierarchy in Thai society
is based on a folk-Buddhist conception of karma, incarnation and ranking according to
accumulated merit (Hanks, 1962). Hierarchy in Thailand is also based on age and
gender. Thai people usually use the prefixes ‘phii’ (meaning elder) and ‘nong’ (meaning
younger) when they speak to others (Sparkes, 1998). The age hierarchy is also expressed
through the common belief that ‘roojak thee soong thee tam’ (knowing your place and
liking it), which means that Thai people have to place themselves in a proper hierarchy
(Maisrikrod, 1999, p. 404). For gender hierarchy, according to Buddhist scripture and
practice, men are able to become monks and accumulate merit more than women who
are associated with the mundane and materialism. Women in Thai society are associated
with being duty-bound to be responsible for their parents and family, although this has
faded in modern Thai society (Benedict, 1943 cited in Pimpa, 2012; Sparkes, 1998).
Such features reflect why hierarchical systems are relatively strong in Thai society, and
that Thai bureaucrats frequently accept existential inequality, which places a strong
value on relationships, and accept authority and special privileges (Komin, 1990).

74
(2) Individualism and collectivism
From Hofstede’s study on individual index values (IDV) for 76 countries, individualism
in Thailand is ranked between 58th and 63rd, which is classified as a low level
individualism and tends to be a collectivistic society. Thailand is characterized as a
collectivistic country, in which ‘people from birth onwards are integrated into strong,
cohesive in-groups, which throughout people’s lifetime continue to protect them in
exchange for unquestioning loyalty’ (Hofstede, 1991, p. 51). Thus, Thailand is a strong
relationship society with cohesive in-groups (Hofstede, 1984). Hofstede pointed out that
IDV scores in almost all wealthy countries were high, while almost all poor countries
had low scores. However, Thai society has been shifting from collectivism
to more individualism in recent years as the country’s economy became wealthier
(Hofstede, 1999).
Many scholars (e.g. Benedict, 1943 cited in P. H. C., 1953; Embree, 1950; Klausner,
1997; Phillips, 1965) agree that Thais are characterized as individualistic, which is
different from the first research of Hofstede in the 1980s. However, his research
findings during the following decades found that Thais were individualistic. Thais are
individualistic, self-centred, highly independent from others, and prefer working
alone and lack social groups, which is different from other countries, such as
those in Western Europe, America and Japan (Embree, 1950; Phillips, 1965;
Wiratchaniphawan, 1987). The current generation of Thais tend to accept other cultures,
in particular those of Western countries, and deviate from traditional culture (NESDB,
2013), which contributes to more individualistic behaviour among younger generations
in the Thai public sector (Pimpa, 2012).
75
Moreover, Thais’ individualism may be derived from other factors such as type of
family (extended family or nuclear family), the circumstances of the case, and belief in
Buddhism. Children from a nuclear family may learn to think of themselves as ‘I’ which
reflects their individual characteristics (Hofstede, Hofstede and Minkov, 2010). For the
circumstances of the case, Komin (1998) illuminated that individuals’ behaviour is
motivated by ‘I’ and ‘me’, namely ‘I’ and ‘Bunkhun’ (grateful relationship) will
demonstrate sincere, honest, reliable, stable and predictable behavior. Contrary to this,
is ‘me’ motivated behaviour, seen as selfish, opportunistic, unreliable, irresponsible, and
unpredictable. Regarding Buddhism, it is an important part in influencing individualism
in Thai society (Pipat, 2013a). For example, it focuses on attainment of enlightenment
only through an individual’s effort (Podhisita, 1998). This sense is based on the law of
‘karma’ through the proverb ‘do good, receive good; do evil, receive evil’ or ‘Tham
bun’ (merit-making), which demonstrates that ‘karma’ and ‘Tham bun’ depend on
individuals (Pipat, 2013a).
Individualism may lead to many disadvantages, such as regularity (rules and regulations
ignored) and patronage systems (individuals’ benefits focused). Lack of rules and
regulations may occur when people choose to ignore them as a consequence of a low
social sanction (Klausner, 1997; Vichit-Vadakan, 2012). It has been recognized that
Thai relationships are built on patronage systems, which reflects through the concept of
‘Phu Num - Phu Tam’ (leader-follower), ‘Luk Phii - Luk Nong’ (boss-subordinate) and
‘Phu Yai - Phu Noi’ (elder-younger) and may be based on reciprocal benefits in order
to facilitate corruption (Wiratchaniphawan, 1987). This may affect the relationships
between boss and employees in the work-place in terms of work behaviour and

76
progression of position level in an organization. Moreover, patronage systems may lead
to the relationship orientation in the pattern of ‘Kraeng cai’ (to be considerate, to feel
reluctant) (Komin, 1990) in order to reluctant to argue with superiors when staff have
different views from their superiors (Wiratchaniphawan, 1987). This situation in Thai
social life may be called ‘Choei-choei’ (indifferent, stable) (Pipat, 2013a).
(3) Masculinity and femininity
Differences between the sexes is a dimension of societal culture in which behaviours
are considered in terms of ‘masculinity’ and ‘femininity’ (Hofstede, 1991, p. 80-81). The
findings of Hofstede’s study on masculinity in 50 countries suggested that Thailand is
classified as a feminine country where people in society are supposed to be modest,
tender and concerned with the quality of life (Hofstede, 1991). Thailand scores 34 on
the masculinity index (MAS) values (rank 44th), which is the lowest rank of masculinity
among the Asian countries, compared to the Asia average of 53 and the world average
of 50. Hofstede explains that masculinity is unlike individualism and is unrelated to the
degree of economic development of a country, and can be found in both rich and poor
countries. Hofstede also states that feminine cultures may provide more opportunities
for mutual help and social contacts in the work-place.
In the context of Thailand, masculinity was dominated by Buddhism, for example,
women are born because of bad karma and cannot attain enlightenment as men can
(Pipat, 2013b). Furthermore, there is a traditional Thai concept that a man is ‘Chang
Tao Na’ (the front legs of the elephant, leader) and the woman is ‘Chang Tao Lung’ (the
rear legs of the elephant, follower) (Pimpa, 2012). This may be an obstruction to the
77
development of women as well as to acceptance in Thai society. However, this
idea has slightly faded away in modern Thai organizations. Meanwhile, Thai men, as
in many other societies, are expected to be the leader in most circumstances, nonetheless
some men will be recognized as ‘Toot’ (unmanly men) (Pimpa, 2012).
(4) Uncertainty avoidance
The dimension of uncertainty avoidance describes the extent to how people in one
society feel about uncertain or unknown situations (Hofstede, 1991). Hofstede stated
that it is the cultural heritage of societies that is transferred through basic institutions
such as family, school and state, which reflects the collectively held values of the
members in a particular society in terms of tolerance of ambiguity and acceptance of
risks. In the results of Hofstede’s study on the uncertainty avoidance index (UAI) value
for 50 countries, Thailand is indicated in the middle score with about 64 and ranked 30th
(Hofstede, 2001). This implies that Thai society may have a low level of tolerance for
uncertainty.
It is reasonable that Thais make an effort to minimize the level of uncertainty, such as
with strict rules, regulations, laws and policies for adaptation and implementation
(Pimpa, 2012). Komin (1990) claimed that Thailand is not a law-oriented country, but
one where practice, principles and laws are ever-adjustable to suit people and existing
situations. For instance, Thai government officials might be lenient on law infringement
that relates to individuals of good connection or money in order to generate a problem
of corruption, this characteristic being referred to as ‘flexibility and adjustment’, and
demonstrates how Thais may be unpredictable, non-committal, irresponsible and

78
opportunistic. In addition, Thai organizations attempt to control and eliminate the
unexpected in achieving their ultimate goal (Pimpa, 2012). Pimpa pointed out that this
perspective is expressed through one of the traditional concepts in Thailand ‘Cha Cha
Dai Pla Lem Ngam’ (Do thing slowly and make sure you get a beautiful big knife). This
concept reflects the Thai way of management, that Thais will not take risk in any
activities, if the quality and practices are uncertain. The implication is that Thai society
seems to be high in uncertainty avoidance and may infrequently accept change and be
risk averse.
(5) Long-term and short-term orientation
The fifth dimension is based on the teaching of Confucius, which describes cultures on
long-term and short-term orientations (Hofstede, 2001). Short-term orientation includes
respect for tradition, personal stability, saving face and reciprocation of greeting, while
long-term orientation comprises respect for persistence, thrift, having a sense of shame
and ordering relationship by status (Hofstede, 1991). Thailand has long-term orientation
(LTO) index values of 56 and is ranked 8th of 23 countries (Hofstede, 2001). Hofstede
maintained that East Asian countries seem to be more oriented towards traditions and
saving face than are Western countries.
Long-term results are often predicted by the development of economies, societies and
politics. For example, the government and departments rarely had any long-term
planning before the economic crisis in 1997 but this situation changed after public sector
reform in 2002. All Thai government agencies are expected to not only do strategic
planning in the long-term period (four years), but also in the short-term period (one year),

79
which emphasizes responsiveness to change. This implies that Confucian values are
associated with economic growth, as argued by Hofstede. Furthermore, the concept of
long-term orientation in Thailand is associated with Buddhism, especially the law of
karma. Thais believe in ‘Tham bun’ (merit-making) such as religious activities (e.g.
giving food and offerings to monks, supporting temples, etc.) and social activities (e.g.
taking care of aged parents, helping the poor, etc.) that can bring about a better life in
the future or incarnation (Pipat, 2013a). Here, implications of belief in the result of
activities and being felt in the next life are influential for long-term aspirations.
3.3.2 Values of the Thai public sector
A review of the literature on politics and organizational culture in the Thai public sector
(e.g. Mutebi, 2008; Selaratana, 2009) suggests that there is a linkage between political
culture and bureaucratic culture in Thailand. The development of Thai bureaucracy is
considered to be based upon a self-developed bureaucracy because it was not shaped by
Western ideas as a colony (Shor, 1960). This reflects the uniqueness of Thai bureaucracy
and a correlation with politics. In the nineteenth century, the dominant feature of the
political structure was bureaucratic nobility (Wyatt, 1968). This reflects how the
hierarchical nature of bureaucracy contributes to the importance of only a small group
of people at the top (Rig, 1966 cited in Ockey, 2004).
The relationship between the bureaucracy and the three branches of power is inevitable.
Ockey (2004) illuminated that the law-making process involves bureaucrats when the
parliament leaves bureaucrats to develop bills relating to specific procedures and
regulations. Regarding the administrative branch, Ockey explained that the politicians’
80
plans may be hindered without the active encouragement of bureaucrats. However, the
relationship between the bureaucrats and politicians may lead to opportunities for
patronage. Thai bureaucracy always respects the judicial branch, particularly elected
politicians, who were elected to check the activities under the 1997 constitution.
Wiratchaniphawan (2004) explained the development of government officials’ values
from 1932 to 2003 through a categorization of four periods: values of ‘king’ (Sukhothai
to Ayutthaya), values of ‘phraya’15 (Rattanakosin before 1932), values of ‘phraya’
(1932 - 1957), and values of ‘businessmen’ (1958 - 2003). This suggests a legacy of
tension between monarchical and bourgeois concepts of the state that may be reflected
in the bureaucracy, and which also explains the latter’s close identification with the
King. The original word for civil servant in Thai is ‘kharatchakan’, in which ‘kha’
signifies servant and ‘ratchakan’ means affairs of the King (Jingjit, 2008, p. 67).
Wiratchaniphawan also proposed several characteristics of civil servants that influence
the development of the Thai public sector, particularly public sector reform. He stated
that the Thai government’s values that affect national development consist of internal
and external systems. The internal system derives from the officials themselves or
human nature related to negative sides, including illegal use of authority, values like a
boss, individualism and conservatism.
15 A collection of genealogies of major noble families begun by Phraya Rattanakun in 1920, the official
genealogy of the royal family, and the genealogies of the families of the mothers of the Bangkok
kings. (Neher, 1979, p. 43)
81
The external system refers to environment factors such as economics, social, politics,
administration, and family, which lead to patronage systems, favourite convenience and
laziness, and favourite adulation. In particular, the patronage system seems to be deep-
rooted in the Thai bureaucracy. Almost 41% of people who become Thai civil servants
have always been the elite, who have relationship with civil servants, military, police
and other government officials (Tjiptoherijanto, 2012). However, patron-client,
superior-subordinate relations, have been found not only in Thailand but in other
Southeast Asian countries (Pye, 1999). Many scholars (e.g. Charoenserbsakul and
Sombatpeam, 2014; Wiratchaniphawan, 2004) agree that the officials’ values are crucial
elements that determine the success or otherwise of Thai public sector reform. The next
section discusses Thai public sector reform through many efforts, particularly
introducing good governance.
3.4 Development of good governance in Thailand
The debate on governance development in Thailand needs to be traced back to the story
of the Thai civil service reform before and after 2002. There was much legislation and
many plans issued as part of the reform even prior to 2002, as well as after, as shown in
Figure 7. The next section discusses how good governance has been developed in the
Thai civil service both before and after 2002.

82
Figure 7 Overall development of good governance in Thailand based on the legislation and plans
Source: Author’s construct adapted from Sathornkich (2010), Tamronglak (2014) and OPDC (2012)
3.4.1 Civil service reform before 2002
A review of literature on the Thai civil service and good governance (e.g. Nikomborirak,
2007; OPDC, 2012; Sathornkich, 2010; Suthapreda, 2013) suggests that the Thai civil
service reform was a consequence of the economic crisis of 1997, called ‘Tom Yam
Goong Crisis’ 16 (Niratpattanasai, 1999). Thai authorities sought the International
Monetary Fund’s (IMF) help to rescue the economy (Bullard, Bello and Mallhotra,
1998; IMF, 1997-1999). Conditionality appears to have been a key driver for
introducing reform programmes in the Thai public sector, including the civil service
reform (see Thailand Letter of Intent 1997-1999) (IMF, 1997-1999). However the
rationale was not only imposed externally. Many public agencies in Thailand have
16 The 1997 Asian crisis is called by some people ‘Tom Yam Goong’, sour & spicy prawn soup - Thai
style (Niratpattanasai, 1999).
Royal Decree on
Criteria and
Procedures for
Good Governance,
B.E. 2546 (2003)
Public Sector
Development
Strategy B.E. 2546
- B.E. 2550
(2003-2007)
Thai Constitution
B.E. 2540 (1997)
The Eight National
Economic and
Social Development
Plan B.E. 2540 -
B.E. 2544
(1997 - 2001)
2002
Before 2002 After 2002
Regulation of
the Office of
Prime Minister
on Good
Governance
B.E. 2542
(1999)
State
Administration
Act (Volume 5) of
B.E. 2545 (2002)
Section 3/1
The Ninth National
Economic and
Social Development
Plan B.E. 2545 -
B.E. 2549
(2002 - 2006)
Thai Constitution
B.E. 2550 (2007)
The tenth National
Economic and Social
Development Plan
B.E. 2550 - B.E. 2554
(2007 - 2011)
The eleventh National
Economic and Social
Development Plan
B.E. 2555 - B.E. 2559
(2012 - 2016)
Public Sector Development
Strategy B.E. 2551 - B.E.
2555 (2008 - 2012)
Public Sector Development
Strategy B.E. 2556- B.E.
2561(2013 - 2018)
1997 1999 2003 After 2007

83
increasingly paid attention to good governance and performance because they anticipate
that it can contribute to solving problems of inefficiency, corruption, and nepotism
(Nikomborirak, 2007; OPDC, 2012).
The Office of the Civil Service Commission (OCSC)17 was the main central agency
that propelled the implementation of the reform (Chula Unisearch, 2005; OCSC, 2016).
This is because OCSC has the authority to make proposals and advise the Council of
Ministers on civil service management systems, public personnel administration, and
improvement of administrative procedures and processes under Section 8 of the Civil
Service Act of 1992. Many reform programmes were therefore launched by the OCSC
to introduce, for example, performance measurement (1994), the project of
Administrative Renewal (AR) (1998-1999) and the Public Sector Efficiency and
Effectiveness Enhancement Scheme18 (2001) (Sathornkich, 2010). The main objectives
of the programmes were to enhance the effectiveness, efficiency and accountability of
the civil service, and financial incentives were made available to achieve these.
However, implementation of the programmes has faced several challenges, such as
resistance from government officials for whom Western concepts such as the Balanced
Scorecard (BSC), were not simple to comprehend; some civil servants seemed to lack
knowledge about how to develop KPIs and performance targets and performance
17 The OCSC is a central government agency under the Prime Minister’s Office which has roles and
responsibilities to advise the public sectors (e.g. managing human resources, protecting the civil
service’s merit system practices), and evaluate environment and quality of life for government
officials based on the principle of good governance in order to benefit the people and the nation’s
sustainable development (OCSC, 2016). 18 The cabinet approved the Public Sector Efficiency and Effectiveness Enhancement Scheme on
the 3rd April 2001 (Sathornkich, 2010).

84
analysis skills; and reward systems seemed to be controversial in terms of the eligibility
of individuals to receive rewards, fairness of reward allocation in an organization, and
limited budgeting processes and allocation of rewards (Sathornkich, 2010).
3.4.2 Civil service reform after 2002
For Thai civil service reform the period after 2002 may be considered as a golden age
of good governance. Many key pieces of legislation and plans were enacted to promote
the principles of good governance: Thai Constitution B.E. 2550 (2007); State
Administration Act (Volume 5) B.E. 2545 (2002) Section 3/1; Royal Decree on Criteria
and Procedures for Good Governance B.E. 2546 (2003); the National Economic and
Social Development Plans: 9th B.E. 2545 - B.E. 2549 (2002 - 2006), 10th B.E. 2550 - B.E.
2554 (2007 - 2011), and 11th B.E. 2555 - B.E. 2559 (2012 - 2016); and Public Sector
Development Strategic plan: B.E. 2546 - B.E. 2550 (2003 - 2007), B.E. 2551 - B.E.
2555 (2008 - 2012) and B.E. 2556 - B.E. 2561 (2013 - 2018) (shown earlier in Figure
7). These have been continuously improved in order to promote the principles of good
governance in the country. In this era, the Office of the Public Sector Development
Commission (OPDC)19 was the main host organization (OPDC, 2003a). Its main roles
and responsibilities were, for example, to serve the Public Sector Development
Commission (PDC); analyze policy issues as assigned; monitor and evaluate the
implementation of the structural reform plans of ministries and departments; and
provide advice and suggestions to other government agencies aiming to meet the goals
19 The Office of the Public Sector Development Commission (OPDC) is a non-departmental
government agency under the Office of the Prime Minister established on 3rd October 2002, in
accordance with Section 71/9 of the State Administration Act (Volume 5) B.E. 2545 (2002) (OPDC,
2003a).
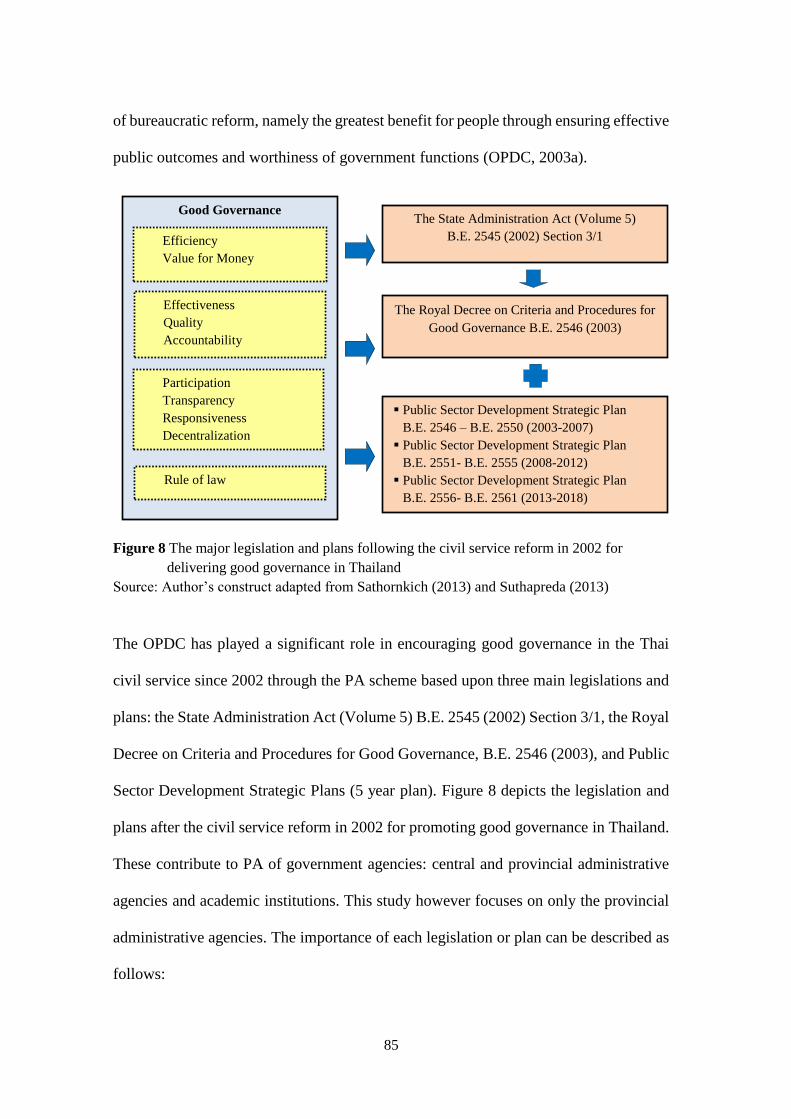
85
of bureaucratic reform, namely the greatest benefit for people through ensuring effective
public outcomes and worthiness of government functions (OPDC, 2003a).
Figure 8 The major legislation and plans following the civil service reform in 2002 for
delivering good governance in Thailand
Source: Author’s construct adapted from Sathornkich (2013) and Suthapreda (2013)
The OPDC has played a significant role in encouraging good governance in the Thai
civil service since 2002 through the PA scheme based upon three main legislations and
plans: the State Administration Act (Volume 5) B.E. 2545 (2002) Section 3/1, the Royal
Decree on Criteria and Procedures for Good Governance, B.E. 2546 (2003), and Public
Sector Development Strategic Plans (5 year plan). Figure 8 depicts the legislation and
plans after the civil service reform in 2002 for promoting good governance in Thailand.
These contribute to PA of government agencies: central and provincial administrative
agencies and academic institutions. This study however focuses on only the provincial
administrative agencies. The importance of each legislation or plan can be described as
follows:
Good Governance
The Royal Decree on Criteria and Procedures for
Good Governance B.E. 2546 (2003)
Efficiency
Value for Money
Effectiveness
Quality
Accountability
Participation
Transparency
Responsiveness
Decentralization
Rule of law
The State Administration Act (Volume 5)
B.E. 2545 (2002) Section 3/1
Public Sector Development Strategic Plan
B.E. 2546 – B.E. 2550 (2003-2007)
Public Sector Development Strategic Plan
B.E. 2551- B.E. 2555 (2008-2012)
Public Sector Development Strategic Plan
B.E. 2556- B.E. 2561 (2013-2018)

86
State Administration Act (Volume 5) of 2002 Section 3/1
The Public Administration Act of 2002 states two main objectives (OPDC, 2003b).
Firstly, public administration must undertake the greatest public benefit by achieving
results-based implementation, efficiency, value-for-money, work process and cycle time
reduction, rightsizing and decentralization. Secondly, all government agencies must
implement their duties based on the principles of good governance such as ensuring
budget allocation in relation to the principles of increasing public participation,
disclosing information, and monitoring and evaluating performance. These contribute
to creating the Royal Decree on Criteria and Procedure for Good Governance B.E. 2546
(2003) as a guideline on public administration, directives and administrative procedures
and government officers’ practices (OPDC, 2008b).
Royal Decree on Criteria and Procedures for Good Governance, B.E. 2546 (2003)
The Royal Decree on Criteria and Procedures for Good Governance B.E. 2546 (2003)
consists of nine major parts that prescribe the criteria and procedures for good
governance (OPDC, 2003b). The first part is good governance, which refers to the
administration required to meet seven targets: (1) responsiveness; (2) results-based
management; (3) effectiveness and value for money; (4) lessening unnecessary steps of
work; (5) reviewing missions to meet changing situations; (6) providing convenient and
favourable services; and (7) regular evaluation. Furthermore, the eighth part in the
Decree identifies the target concerning performance evaluation, for example the
government agencies must ‘establish, under the rules, procedures and period as
specified by PDC, an independent inspection committee in order to evaluate the
performance of duties of the government agency related to the result of the mission,

87
quality of service, pleasure of customers, and value for money’ (OPDC, 2003b, p. 12).
This is a vital reason leading all government agencies to performance evaluation, which
has been managed by the OPDC from 2003 to date.
Public Sector Development Strategic Plans
The OPDC has created the public sector development strategic plans (5-year plan).
There have been three plans from B.E. 2545 (2002) to the present, including B.E. 2546 -
B.E. 2550 (2003 - 2007), B.E. 2551 - B.E. 2555 (2008 - 2012), and B.E. 2556 - B.E.
2561 (2013-2018) (OPDC, 2003a, 2008a, 2015). The public sector development
strategic plan B.E. 2546 - B.E. 2550 (2003 - 2007)20 gave priority to the four key goals:
‘service quality improvement, rightsizing, a high performance management relevant to
the national budget, international standard work capacity and responsiveness to the
democratic government’ (OPDC, 2008b, p. 16). Seven major strategies were identified
to accomplish these goals: (1) re-engineer work processes; (2) restructure the framework
and administration of public organizations; (3) reform financial and budgetary systems;
(4) review the human resource management and compensation systems; (5) change
management paradigms, culture and values; (6) modernize the public sector through e-
government system development; and (7) enlist public participation in the work of the
government systems (OPDC, 2003a, p. 85).
The public sector development strategic plan B.E. 2551 - B.E. 2555 (2008-2012) states
that ‘the Thai public sector system will strive to ensure the well-being of the citizens
20 The public sector development strategic plan B.E. 2546 - B.E. 2550 (2003-2007) was approved by the
cabinet resolution of 19th May 2003 (OPDC, 2008b).

88
and to maintain the national interest through high capability on the part of its officials,
who will have the capacity to learn and to adjust and respond to change, while at the
same time exhibiting strong ethical values and operating under the principle of good
governance’ (OPDC, 2008a, p. 3). It is comprised of four key strategies: (1) leveraging
service and performance to respond to the sophisticated, diverse, and changing
expectations and needs of citizens; (2) re-engineering work processes to achieve an
integrated approach that generates coordination, networking, and public participation; (3)
moving towards a high capability organization with professional manpower ready to
learn, to innovate, and to adjust to shifting situations; and (4) creating an effective self-
monitoring system to ensure transparency, confidence, and cognizance of accountability.
In the provincial administrative agencies, the assessment framework between 2008 and
2012 included four main dimensions: (1) effectiveness of mission, (2) quality of service,
(3) efficiency of performance, and (4) organizational development.
The current public sector development strategic plan B.E. 2556 - B.E. 2561 (2013-2018)
emphasizes alignment in accordance with the strategy of the country (OPDC, 2013b).
The seven strategies of the current public sector development plan broadly fall
under three pillars, to include organizational excellence (service excellence, high
performance organization, public value, and integration); sustainable development
(collaboration and integrity); and moving towards becoming international (readiness for
ASEAN B.E. 2558) (Charoensuk, 2014; OPDC, 2013b). The performance evaluation
framework from 2004 to 2011 comprised four dimensions: effectiveness of mission,
quality of service, efficiency of performance and organizational development. The
purpose of each dimension are explained in Table 2.

89
Table 2 The purpose of the four dimensions of the performance evaluation framework
at the provincial administration from 2004 to 2011
Dimension 1 Effectiveness of mission Dimension 2 Quality of service
Focused on the end results to be
delivered by provinces and provincial
clusters. Each one had to specify its
strategic plan and targets, giving primary
importance to the greatest benefits to the
public, to the needs and interests of the
people, and to economic and social
prosperity.
Focused on the findings that had to be taken
into account of citizen surveys on the quality
of public sector service delivery. Each
province had to improve the quality of its
services, emphasizing responsiveness to
citizens’ interests, public participation,
prevention of corruption, and an increased
level of transparency.
Dimension 3 Efficiency of performance Dimension 4 Organizational development
Focused on the standardization of process
improvement. For example, each
province was expected to improve the
efficiency of its budget management
process, reduce costs, and maximize the
usage of energy.
Focused on human resource development,
quality management, information technology
management, and regulatory management.
The emphasis in this dimension was on
internal development, which was the key
enabling factor for the achievement of
ministry strategies.
Source: Adapted from OPDC (2008a, p. 2-53 - 2-54)
The assessment framework of the provincial administration was changed in 2012, so
that four dimensions are categorized into two main perspectives: external and internal
perspectives (Sathornkich, 2013). The external perspective consists of dimensions of
effectiveness and service quality, while the internal perspective comprises dimensions
of efficiency and organizational development.

90
Table 3 The assessment framework of the provincial administration
Perspectives
Dimensions
Fiscal Year
B.E. 2556
(2013)
B.E. 2557
(2014)
B.E. 2558
(2015)
B.E. 2559
(2016)
External Effectiveness 60% 60% 65% 70%
Service quality 10% 10% 10% 10%
Internal Efficiency 15% 10% 10% 10%
Organizational
development
15% 20% 15% 10%
Total (%) 100% 100% 100% 100%
Source: OPDC (2012, 2014, 2015) and Mangkarothai (2016)
Table 3 reflects that the percentage of each dimension varies in each fiscal year. PA of
the fiscal year B.E. 2559 (2016) focuses on dimensions of effectiveness of over 70%.
The KPIs within each dimension have been changed in each fiscal year. The reasons are
based on the government’s important policies and consistency between the strategy
of the country and of provincial clusters 21 and provincial development plans
(Mangkarothai, 2016; OPDC, 2015). The guidelines of PA for the provincial
administration in the current fiscal years are set out in the next section. However,
although the performance evaluation framework was changed in 2012, it has been used
to date. The four dimensions and the key concept of delivering good governance have
been maintained.
21 Provincial cluster refers to 18 provincial clusters (included total 75 provinces) created based on the
area-based approach (e.g. potential, development requirement, and benefit of that area) and
participatory governance approach (e.g. consultation and public hearing process for provincial
development planning), in accordance with the State Administration Act 2007 and the Integrated
Provincial Planning and Clustering Decree 2008 (promulgated on 25 December 2008) (Ministry of
Interior, 2010, OPDC, 2008b).

91
Figure 9 shows the relationship between the four dimensions of the performance
evaluation framework and the key components of good governance, with each
dimension including many KPIs that reflect the key components of good governance.
For example, dimension 1 includes a menu of KPIs such as quality of tourism and
preparation for good agricultural practice (GAP) for the provincial clusters and
provinces. They can make the decision to choose some of the KPIs, around 1-5, based
on their action plans.
Figure 9 The four dimensions of the performance evaluation framework in relation to the key
components of good governance
Source: Author’s construct adapted from OPDC (2008b, 2015)
The provincial members of the clusters need to cooperate to achieve the KPIs as part of
the overall result of the provinces. Meanwhile, the provinces have to perform their own
chosen KPIs. From dimensions 2 to 4, they consist of compulsory indicators for
all provinces. Each dimension comprises the KPIs as follows: dimension 2, e.g.
satisfaction of services and prevention of corruption; dimension 3, e.g. expenditure of
GG components:
Effectiveness
Accountability
GG components:
Efficiency
GG components:
Rule of law
Exte
rnal
Dim
ensi
on
In
tern
al
Dim
ensi
on
GG components:
Participation
Transparency
Responsiveness
Accountability
Equity
Consensus
Oriented
Dimension 1
Effectiveness
of Mission
Dimension 2
Quality of
Service
Dimension 3
Efficiency of
Performance
Dimension 4
Organizational
Development
92
budget and reduction of process time of services; and dimension 4, e.g. quality of
public management (see detail of the KPIs in Appendix 6).
3.5 Performance agreement (PA) in provincial administration
There are 75 provinces that committed to PA between B.E. 2547 (2004) and
B.E. 2554 (2011). The total number of provinces that engaged with PA has been 76
since 2012. It is important to note that the study considered information on PA of 75
provinces into 18 provincial clusters between B.E. 2550 (2007) and B.E. 2554 (2011)
for sampling appropriate provinces for the study (see Appendix 7: 7.1). This is because
the results of PA represent the most up-to-date information at the time of carrying out
the current study. Moreover, the information solicited was based on the same
performance evaluation framework.
Figure 10 depicts that there are three main types of government agencies at provincial
administration level with relevance to PA: the central government agencies, provincial
agencies and local government agencies. The current study focuses on the agencies that
are related to PA at the provincial level: the central government agencies at provincial
administration level and the provincial agencies (see Appendix 7: 7.2).

93
Figure 10 The structure of provincial administration
Source: OPDC (2013a, 2010) and Mektrairat (2007)
Note: The structure focuses on the agencies in relevance to PA as the KPI host
Governor
Central government
agencies at the provincial
administration
(40-300 agencies depending on
size of provinces)
Local administrative
agencies
Provincial government
agencies
Provincial Governor's Office
Provincial Administration Office
Provincial Community
Development Office
Provincial Office of Public Works
and Town and Country Planning
Provincial Cultural Office
Provincial Land Office
Provincial Agricultural and
Cooperatives Office
Provincial Agricultural Extension
Office
Provincial Cooperative Office
Provincial Fisheries Office
Provincial Livestock Office
Provincial Public Health Office
Provincial Office of
Commercial Affairs
Provincial Industry Office
Provincial Labour Office
Provincial Employment Service
Office
Provincial Social Security
Office
Provincial Labour Protection
Office
Provincial Natural Resources
and Environment Office
Provincial Social Development
and Human Security Office
Provincial Office of
Buddhism
Provincial Statistical Office
Provincial Military Recruiting
Office
Provincial Police Office
Provincial Land Transport
Office
Provincial Office of
Comptroller General
Provincial Prison
Provincial Office of Tourism
and Sport
Provincial Office of Energy
Provincial Local
Administration Office
Provincial Office of Disaster
Prevention and Mitigation
Provincial Legal Execution
Provincial Probation Office
Provincial Agricultural Land
Reform Office Provincial Relation Office
Vice Governor
(2-3 persons)

94
The number of central government agencies at provincial administration differs and
depends on the size of the provinces (Mektrairat, 2007). Meanwhile, the provincial
agencies are established in all provinces, except for the Provincial Office of Tourism
and Sport (31 provinces and provincial cluster) and the Provincial Prison (50 provinces)
(OPDC, 2013a). The total number of key agencies who are often appointed to be KPI
hosts in a province comprise at least 35 provincial agencies as illustrated in Figure 10.
The Provincial Governor’s Office is the main provincial agency established in every
province and that is responsible as a secretariat of the Governor and a coordinator
among the agencies within a province.
The provincial agencies are not the only crucial part in implementing PA in the province,
but also the central government agencies at provincial administration level. The variety
of agencies in a province appears to contribute to several challenges for implementing
PA. For example, the officers of the central agencies at provincial administration level
are appointed, promoted and relocated by their parent ministries or departments
(Sathornkich, 2010). Consequently, the provincial Governor frequently copes with
various challenges of integrated collaboration in the provinces such as a lack of
efficiency and a deficient unity (The Secretariat of the House of Representatives, 2015).
The provincial agencies in each province are required to perform the provincial KPIs as
main or second KPI host agencies, while they are allocated responsibilities depending
on the correlation between their main tasks and the KPIs. In each KPI host agency, the
chief of agencies or managers of departments are viewed as the KPI director (senior
managers), whilst the agencies’ members who are responsible for the KPIs are viewed

95
as data collectors (practitioners). The KPI host agencies are required to monitor and
assess their performance and generate self-assessment reports (SAR) at the ends of the
sixth, ninth and twelfth months depending upon agreement. These reports are required
to be delivered to the OPDC by official document and online report called electronic
self-assessment report (e-SAR). At the end of the fiscal year, provincial performance is
evaluated by the team of the OPDC and outsourced to dependent inspectors at sites in
terms of the correlation between their self-assessment report and their genuine
performance. Then the results of PA of all provinces are offered to the Public Sector
Development Commission (PDC) for approval.
Monetary incentive
Allocations of monetary reward to the provinces are based on the organization’s PA
results (or scores) and the total salary paid to officials within an organization (OPDC,
2009; Sathornkich, 2013). It is a one-time payment, and is not included in salary-based
pay and will not be forwarded to the retirement pension plan (Sathornkich, 2013). The
eligible organizations are those that achieve performance scores of more than 3.00 from
total scores of 5.00, while the eligible individuals are those who contribute to the
achievements in their respective organizations.

96
Creating performance agreement (PA) in provincial administration
The procedures for creating performance agreement (PA) in the Thai public sector and
in the provincial administration are described in this section. Figure 11 demonstrates
the process of creating PA in the Thai public sector.
Figure 11 The process of creating performance agreement (PA) in the Thai public sector
Source: Sathornkich (2013)
The process of PA consists of three main steps: strategy formulation, performance
agreement implementation, and performance measurement. In the current study, this
process is seen as PA or performance evaluation or performance measurement because
such terms as ‘performance assessment’, ‘performance evaluation’, ‘performance
review’, ‘performance management’, and ‘performance appraisal’ refer to the process
where the work performance of an employee is assessed (Vallance and Fellow, 1999).
Strategy
Formulation
Performance
Agreement
Implementation
Performance
Measurement
Terms of
Reference
- SWOT analysis
- Vision
- Strategic issues
- Goals
- KPIs & their targets
- Strategies
- Signing of PAs
- Putting PAs
into practice
Self-assessment reports (at
the ends of the sixth, ninth
and twelfth months after the
signing of each PA)
Outputs
of PM
The cluster’s and each
agency’s and province’s
strategies
Performance
agreement of each
agency/province
- SARs of each province
- Performance scores
of each agency/province
Outcomes
of PM
1) Performance-based rewards
2) Comprehended PM and the PDCA Cycle, resulting in high performance scores
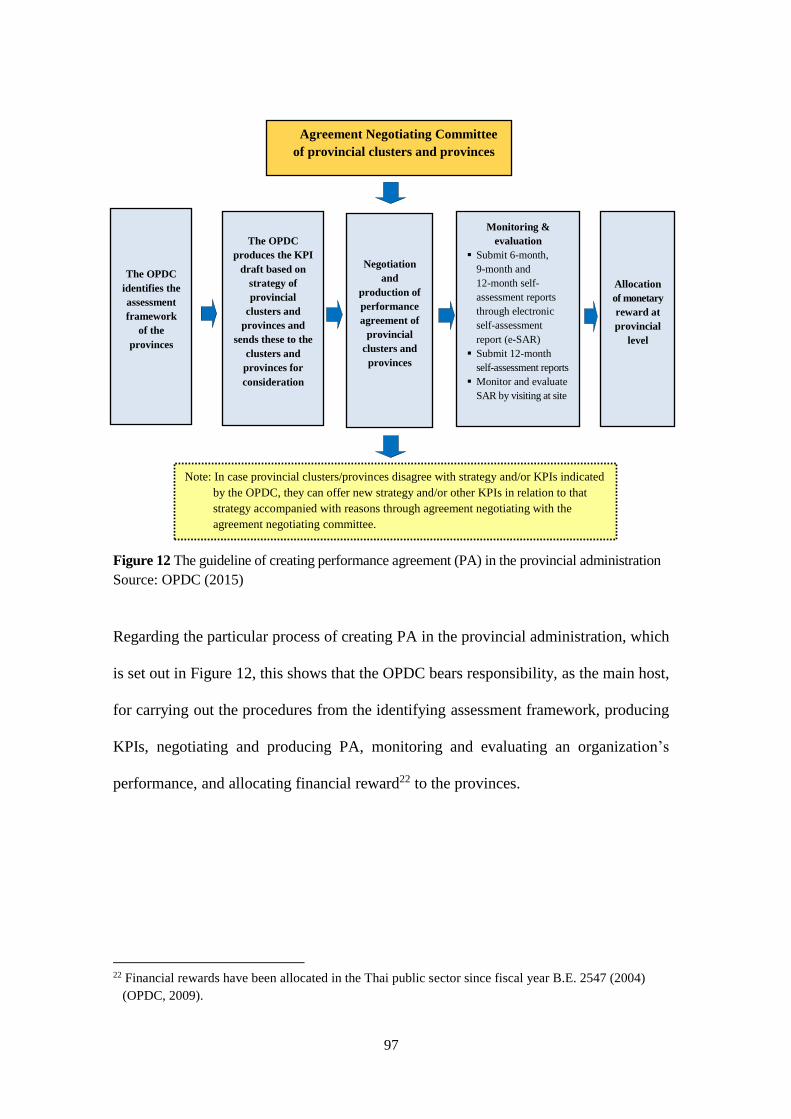
97
Figure 12 The guideline of creating performance agreement (PA) in the provincial administration
Source: OPDC (2015)
Regarding the particular process of creating PA in the provincial administration, which
is set out in Figure 12, this shows that the OPDC bears responsibility, as the main host,
for carrying out the procedures from the identifying assessment framework, producing
KPIs, negotiating and producing PA, monitoring and evaluating an organization’s
performance, and allocating financial reward22 to the provinces.
22 Financial rewards have been allocated in the Thai public sector since fiscal year B.E. 2547 (2004)
(OPDC, 2009).
Agreement Negotiating Committee
of provincial clusters and provinces
The OPDC
identifies the
assessment
framework
of the
provinces
The OPDC
produces the KPI
draft based on
strategy of
provincial
clusters and
provinces and
sends these to the
clusters and
provinces for
consideration
Negotiation
and
production of
performance
agreement of
provincial
clusters and
provinces
Monitoring &
evaluation
Submit 6-month,
9-month and
12-month self-
assessment reports
through electronic
self-assessment
report (e-SAR)
Submit 12-month
self-assessment reports
Monitor and evaluate
SAR by visiting at site
Allocation
of monetary
reward at
provincial
level
Note: In case provincial clusters/provinces disagree with strategy and/or KPIs indicated
by the OPDC, they can offer new strategy and/or other KPIs in relation to that
strategy accompanied with reasons through agreement negotiating with the
agreement negotiating committee.

98
Challenges of PA in provincial administration
This section sets out the challenges of PA in the provincial administration. Some
scholars (e.g. Sathornkich, 2013; Srimai, 2015) revealed that there are problems in the
context of PA at the provincial level in Thailand. Figure 13 shows the constraints in the
process of PA in the Thai public sector. This is the result of research on the impacts of
PA and incentives for improving work efficiency proposed by the National Institute of
Development Administration (2008 cited in Sathornkich, 2013). It can be seen that there
are two major categories of PA constraints, personnel factors and environment and system
factors, at play. Personnel factors may include inappropriate skills, issues about pay (lack
of trust in reward management) and transparency. Regarding environment and system
factors, these refer to characteristics such as inefficient work coordination, insufficient
budget/resources and inaccurate performance evaluation.
Furthermore, Srimai (2015) suggested that two main problems occur in implementing
PA at the provincial level. Firstly, PA are seen as a control system and have contributed
to the provinces’ view that they were being forced to be accountable for the KPIs and
targets that are uncontrolled. Meanwhile, using control systems was affected by a lack
of available data and management information system (MIS). Secondly, PA and its KPIs
and its targets are considered to produce several problems, for instance some KPIs were
difficult to understand and were unachievable.

99
Figure 13 Summary of the constraints in the process of PA in the Thai public sector
Source: National Institute of Development Administration (2008 cited in Sathornkich, 2013)
3.6 Summary
Thailand presents a very specific configuration of politics, national culture and values,
which differs from other Southeast Asian countries, perhaps as a result of never having
been colonized. A diverse range of determinants have influenced its culture, including
monarchy, religion (Buddhism), and a mixed-culture acquired from neighbouring
countries (India, China, and Cambodia). As stated earlier, a review of literature
suggested that the public sector culture may be based on a balance between three factors:
political culture, national culture, and bureaucratic culture (e.g. the civil service culture)
as shown in Figure 14.
Effort Performance
Constraints:
- inappropriate skills
- weak targets
- inefficient work coordination
Constraints:
- inaccurate performance evaluation
- insufficient budget/resource
- transparency
Personal Goals
Reward/Outcome
Constraints:
- no limitation on effort
- strict management
- already at high performance
Constraints:
- unvalued outcomes
- conflict with other rewards
- value on other rewards
- lack of trust in reward management
In the context of Performance Agreement (PA)

100
Figure 14 Public sector culture in Thailand based on a balance between bureaucratic culture,
political culture, and national culture
Source: Author’s construct
Political culture can influence the national culture (Hofstede, 1981) and bureaucratic
culture – political influence can dominate the civil service (Nikomborirak, 2007).
Meanwhile, the national culture has a strong impact on the civil service bureaucratic
culture, such as shaping the value systems and behaviour of a major groups of the
population, and officials (Hofstede, 2001; Komin, 1990; Rokeach, 1970). Thus,
bureaucracy is viewed as the heart of a nation’s state machinery (Nikomborirak, 2007).
Bureaucratic
culture
Political
culture
National
culture
Public sector
culture
101
CHAPTER 4
RESEARCH DESIGN AND METHODOLOGY
4.1 Introduction
The purpose of this chapter is to present the research design and methodology
underpinning this study, which includes the collection and analysis of data to answer
the research questions. The chapter is structured into eight sections. It starts with
research philosophy in section 4.2, and then discusses research design in section 4.3.
There follows research methodology in section 4.4, including a discussion on
quantitative research, qualitative research, and mixed-methods, and sampling cases. The
research approach is discussed in section 4.5 and then data collection in section 4.6. It
moves on to data analysis and interpretation in section 4.7, regarding quantitative and
qualitative data analysis. The next section (4.8) discusses research ethics. The final
section (4.9) provides a conclusion to the chapter.
4.2 Research philosophy
This study aimed to examine the relationship between organizational culture and good
governance that is viewed through the lens of the PA scheme. The study is therefore
concerned with organizational culture, which can be viewed as ‘objective reality’
(Denscombe, 2010b, p. 119) and ‘objective social entities’ (Bryman, 2012, p. 32, 34).
Organizational culture is viewed as objective reality, i.e. ‘something an institution is’
(Christiensen et al., 2007, p. 43). Meanwhile, organizational culture is also considered
as objective entity in that it has cognitive (to do with thinking), affective (to do with
feeling) and behavioural characteristics (Senior and Fleming, 2006, p. 141). The

102
implication is that organizational culture – the pattern of, for example, beliefs, values,
and behaviour identified by theorists (Brown, 1998) – can be understood by
postpositivist and constructivist (interpretivist) approaches. A postpositivist approach
allows a researcher to start with a theory, then gather data that either refutes or supports
the theory; the postpositivist assumption holds true more for quantitative research than
for qualitative research (Creswell, 2014). Phillips and Burbules (2000) stated that
postpositivism demonstrates the thinking after positivism. Positivism is based on
ontological assumptions about the nature of social reality and epistemological
assumptions about how best to create knowledge about social reality (Denscombe,
2010b).
In contrast, an interpretivist approach – known as constructivism (Gray, 2004), is often
applied in qualitative research. Interpretivist or constructivist approaches enable
researchers to understand meanings of the world from the participants’ perspectives
and through their experiences of the situation being studied (Creswell, 2014). For
example, qualitative research can use open-ended questions to elicit opinions from the
participants (Crotty, 1998 cited in Creswell, 2014). Creswell (2014) also states that
constructivist researchers typically address the specific context in studying culture and
they attempt to understand the meanings of phenomena by their interpretation rather
than by starting with a theory.
In the study of organizational culture, it is valid and useful to employ a dual approach,
combining postpositivist and interpretivist approaches. A philosophical underpinning
for the current study seems to be closest to the pragmatic approach, which focuses on
103
mixed methods to understand the problem (Creswell, 2014; Johnson, Onwuegbuzie and
Turner, 2007; Mertens and Hesse-Biber, 2012). This philosophy leads the current study
to both deductive and inductive approaches. The deductive process starts with theories
and is usually associated with quantitative research, whilst the inductive process
contributes to developing theories and is usually associated with qualitative research
(Bryman, 2012).
The deductive approach is represented through an analytical framework, in Chapter Two
section 2.4.3, which draws on the CVF or the OCAI and previous studies to guide the
collection of data using both quantitative and qualitative methods. The theoretical
approach also enables the analysis of data, namely analyzing quantitative data based on
the CVF or the OCAI and analyzing qualitative data based on theory. The inductive
approach is employed in analyzing qualitative data by coding based on data. The mixed
methods research is discussed in section 4.4.1.
4.3 Research design
Research design is a prior stage before identifying any specific method. Its function is
‘to ensure that the evidence obtained enables us to answer the initial question as
unambiguously as possible’ (De Vaus, 2001, p. 9). Gorard (2013) emphasizes that the
generated evidence should be based on the research questions. Therefore, the selection
of an appropriate research design for this study was based on the research questions and
cautiously considered the advantages of each type of research design. There are diverse
types of research design provided by scholars. This section focuses on five dominant
104
research designs, comprising experimental, cross-sectional, longitudinal, case study and
comparative designs (Bryman, 2012, p. 45).
Experimental design
Experimental design is concerned with establishing a causal relationship between
variables (Shuttleworth, 2008). Two variables are focused on: the independent variable
(the cause/intervention) and the dependent variable (outcome) (De Vaus, 2001). The
research questions or hypotheses are tested (Gray, 2004). The context within the
experiment being conducted means it should be possible to assign subjects to conditions,
which is important for the rigour of the experimental design (Gray, 2004; De Vaus,
2001). The experimental design is perhaps not appropriate for examining organizational
culture – underlying assumptions (Schein, 1990) – as it is complex and also due to the
diverse opinions of people in a phenomenon being studied.
Cross-sectional design
Cross-sectional designs are probably the most broadly employed designs in social
research (De Vaus, 2001), as they are often seen as survey designs (Bryman, 2012).
They emphasize a snapshot of a population at a single point in time, establish more
than one case, provide quantitative data and examine relationships between variables
(Bryman, 2012). Such cross-sectional designs are useful to describe changes over time
(Gorard, 2013). A cross-sectional design allows participants to recall details about
a past situation that is being studied, which is consistent with this study in that it requires
participant recall about the PA scheme between 2007 and 2011. However, its feature is
not based on random allocation (De Vaus, 2001), but it is a snapshot sample that is

105
established at a fixed point in chronological time (Kaplan, 1997). This is perhaps not
applicable to this study, as it requires selection of potential participants in each level –
province, agency, and individual – by a combination of multi-stage, stratified and
purposive sampling relevant to the research questions.
Longitudinal design
Longitudinal design is slightly different from cross-sectional design (Bryman, 2012),
namely because cross-sectional design data is gathered in a single time period whilst
longitudinal design data is collected for two or more time periods (Menard, 2008).
It refers to the study of change and development over time (Gray, 2004) by the
comparison of the difference between samples over a long period. However, this
research does not focus on distinguishing organizational culture over a long period of
time but on the comparison of organizational culture between two different groups – the
low and high KPI scoring provinces – in a single period of time. Therefore, longitudinal
design is perhaps far from the answer for the research questions in this study.
Case study design
Case study design contributes to generating knowledge of an individual, group, and
organization and to understand complex social phenomena, in particular the nature of
the case in question (Bryman, 2012; Yin, 2002). The case study can help to answer
‘how’ and ‘what’ questions (Yin, 2002). This is compatible with the research question
of this study. Case study design has been extensively used in empirical studies of
organizational culture, for example Phookpan (2012), and Adenan et al. (2013). Many
features of case study design are close to examining the relationship between

106
organizational culture and performance (good governance) of public organizations.
Firstly, case study is a useful design for studying organizations, particularly public
organizations (Hakim, 1987). Secondly, case study design can elicit information on
various issues of an organization (e.g. organizational performance, policy analysis, and
relationships between different organizations) (Bryman, 1989; Gray, 2004; Geertz, 1973
cited in Stark and Torrance, 2005), and provide in-depth and detailed information of a
case and of causal relationships between subjects and issues (Brewerton and Millward,
2001; Gray, 2004; Kumar, 2011; Patton, 1990).
Thirdly, case study design allows researchers to employ multiple methods and data
sources to collect data within a single study (Bryman, 1989; Hakim, 1987; Kumar, 2011;
Stark and Torrance, 2005). Here the case study approach is associated with a variety of
evidence such as documents, interviews and observations (Yin, 2002). This may make
it difficult to interpret data because it produces a massive amount of evidence (a volume
of documentation), which makes data analysis time-consuming and difficult (Brewerton
and Millward, 2001; Gray, 2004; Yin, 2002). Moreover, the case study design has been
criticized by scholars in terms of a lack of rigour and a difficulty in providing scientific
generalization (Yin, 2002). A lack of rigour in the case study is concerning because it
does not follow systematic procedures and may influence the direction of the findings
and conclusions (De Vaus, 2001; Yin, 2002). In challenging the scope for scientific
generalization, the case study design is not statistical, instead it is analytical (Johansson,
2003). This may make it hard to accept that a single case can be representative of the
wider population. However, Bryman (1989) and Yin (2002) argued that using multiple
case studies can enhance the range of cases of the same issue or phenomenon.
107
Comparative design
Comparative design is established based on a systematic process, to explore similarities
and differences between two or more cases at the same time (Berg-Schlosser, 2001;
Bryman, 2012; Dixon, Bouma and Atkinson, 1987; May, 2010; Warwick and Osherson,
1973). This is consistent with the purpose of this study, which requires comparison of
organizational culture, particularly between the high and low KPI scoring provinces.
Comparative design is not only used to compare the characteristics of two or more cases,
but allows the use of more or less identical methods such as case studies and statistical
analysis (Berg-Schlosser, 2001; Bryman, 2012). This may lead to theories about
contrasting findings (Bryman, 2012).
In the context of cultural study, comparative design is widely used to describe and
understand culture because it can explain, for example, people’s relations, cultural
impediments to implementing policy and how good the results are (Hantrais, 2009; May,
2010). Although comparative design provides several advantages, such as facilitating
the comparison of two or more cases, generating theory, and allowing researchers to use
multiple methods, some scholars (e.g. Dyer and Wilkins, 1991 cited in Bryman, 2012;
May, 2010; Warwick and Osherson, 1973) claim that comparative study in cross-
cultural research is concerned with meaning-equivalence (e.g. a specific concept for a
particular culture, a result of a questionnaire’s validity, and problems of translation) and
losing the researchers’ attention of the specific context.
108
Selection of research design
Each type of research design has different purposes and advantages. I cautiously
considered which types of research designs are suitable for answering the research
questions of this study. A review of the literature on research design suggests that case
study and comparative designs are closest for enabling the examination of the
relationship between organizational culture and performance in the Thai civil service.
The case study design was chosen based on three main reasons. Firstly, it is appropriate
to study the performance of the public organizations. This can be observed through
a number of empirical studies on organizational culture that used the case study
approach, including in particular case studies of the Thai public sector (e.g. Jingjit and
Fotaki, 2010; Pimpa, 2012). Secondly, it allows researchers to elicit the views of people
in a particular phenomenon being studied in breadth (by surveys) and in-depth and
in detail (by interviews). For example, surveys through multiple cases provide
an important alternative to random sampling and facilitate generalization (Hakim,
1987); and provide a basis for a combination of qualitative and quantitative approaches
(Bryman, 1988; Darlington and Scott, 2002). Thirdly, it permits triangulation and greater
validity of research findings.
Comparative design has been selected for three main reasons. Firstly, it facilitates
analysis of many cases in a single study - in this case cultural determinants of
performance could only be assessed through the study of low and high KPI scoring
provinces. Secondly, it can help researchers to understand the culture of an organization
through in-depth measurement at the individual level in different places against
a common framework, which is useful for a topic such as culture where all values are

109
relative (Hantrais, 2009). Thirdly, the comparative study enables researchers to compare
the findings obtained from both quantitative and qualitative sources for an overall
conclusion (Harkness, Vijver and Mohler, 2003).
4.4 Research methodology
4.4.1 Selection of research method
A research method is a technique for collecting data with relevance to a specific
instrument, such as a self-completion questionnaire and a semi-structured interview
schedule (Bryman, 2001). There are three main categories of data collection method:
quantitative, qualitative and mixed methods. Selecting research methods should be
determined by the hypotheses or research questions (Matthews and Ross, 2010), which
means researchers can use more than one data collection method in a single study. This
section discusses the appropriate choice of methods employed for collecting data to
address the research questions.
Quantitative methods
Quantitative methods refer to collecting data based on systematic and standardized
designs (Kumar, 2011). Quantitative methods provide quantifiable data, such as
numerical data and name codes (Blaikie, 2000; Kumar, 2011; Matthews and Ross,
2010). Using quantitative methods provides advantages in three main aspects: collection
of data, analysis of data and reliability of data.
For collecting data, it allows researchers to measure the responses of a large number of
people and to generalize based on the findings (Patton, 1990). It follows conventional
110
standards of reliability and validity, which is different from qualitative research as this
is often focused on a single context (Burns, 2000). Bryman (2001) claimed that
quantitative research draws on the view of positivism that a standard device based
on the principles of the scientific methods can apply to all phenomena, but in fact
phenomena in the investigation is different in the real world in practice because
of different contexts. Bryman also argued that quantitative research emphasizes
administering research instruments to subjects or controlling situations to determine
their effects. For instance, survey respondents may answer questions by using their
knowledge, sense of similarity and importance in their everyday life. Collecting data in
the context of a cultural and behavioural study appears to be a controversial issue.
A critical theorist, Jurgen Habermas, claimed that social research based on the scientific
model is inappropriate to study the behaviour of people (Hall and Hall, 1996). Likewise,
Hakim (1987) stated that qualitative research is more appropriate to study individuals’
attitudes, motivations and behaviour than quantitative research, because it provides
descriptive reports of individuals’ perceptions, attitudes, beliefs, views and feelings.
Although many scholars have criticized the use of quantitative research for studying
culture and behaviour, many empirical studies (e.g. Jingjit, 2008; Parker and Bradley,
2000) used quantitative methods, particularly questionnaire surveys, whilst qualitative
methods (interview) were perhaps used to eliminate the weaknesses of the questionnaire
surveys.
111
Regarding analyzing data, quantitative research is based on standardized measures in
order to facilitate the analysis of data in the form of statistical analysis, for example
answering research questions or testing hypotheses by comparison and statistical
aggregation of the data (Matthews and Ross, 2010; Patton, 1990).
The most commonly employed quantitative method is surveys. There are two main types
of survey research: self-completion questionnaire (supervised, postal, and internet) and
structured interview (face to face and telephone) (Bryman, 2012). The questionnaire is
probably one of the most broadly used methods in surveys (Gray, 2004; Matthews and
Ross, 2010). A questionnaire is a written list of questions where respondents provide
answers based on their interpretation (Kumar, 2011), which produces many types of
data, such as behavioural and attitudinal data (Brewerton and Millward, 2001). This
confirms that questionnaire surveys may be used for studying culture.
There are four types of questionnaires: self-completion (no researcher present), self-
completion in a group (with researcher present), interview (face to face), and interview
by telephone (Hall and Hall, 1996). Self-completion questionnaires are perhaps
appropriate for examining organizational culture in terms of eliminating interviewer
effects (e.g. bias from the interviewer asking questions in different ways); facilitating
respondents to complete a questionnaire as the respondents wish; and being cheaper
and quicker than interviews (Bryman, 1989, 2012). Moreover, self-completion questionnaires
enable researchers to collect data from potential respondents over a wide geographical
area (Kumar, 2011). It is therefore appropriate for the current study, which requires data
to be collected from many public organizations in four regions of Thailand.
112
Qualitative methods
Qualitative research differs from quantitative research in many aspects, such as the
construction of method, research strategy, and data analysis. Qualitative research tends
to rely on little theory and, as a result, it permits the researcher to employ unstructured
and non-sequential conduct with little usage of theory and no hypotheses (Bryman,
1989; Kumar, 2011). Qualitative research frequently starts with defining very general
concepts, in contrast with quantitative research that begins with theories and concepts
(Brannen, 1992; Bryman, 1988). Qualitative research is flexible regarding research
strategy because it allows researchers to use different types of data collection
approaches, methodologies and philosophies (McQueen and Knussen, 2002). For data
analysis, qualitative research does not rely on statistics, but rather on context and the
interpretation of observations involving individuals’ perception of situations in order to
capture individual definitions, descriptions, and meaning of events (Bryman, 1989;
Burns, 2000). Thus, qualitative methods are appropriate to explore meanings of people
in a phenomenon being studied in various aspects such as stories, accounts, and
individual’s values, attitudes, beliefs, feelings, perceptions and behaviour (Blaikie,
2000; Burns, 2000; Hakim, 1987; Kumar, 2011; Matthews and Ross, 2010).
Qualitative research has many merits. For example, it can help researchers to
increasingly understand participants’ perspectives or processes of social life through
investigating in-depth and in detail within a small number of people and cases (Hakim,
1987; McQueen and Knussen, 2002; Patton, 1990). Although qualitative methods
decrease generalizability (Patton, 1990), they can explain contexts and inform more
structured or quantitative studies (Hakim, 1987; McQueen and Knussen, 2002).

113
However, qualitative methods have been criticized in terms of reliability and validity.
Qualitative research relies on the researchers’ skills and abilities, which is not
acknowledged in quantitative research (McQueen and Knussen, 2002). The researchers
can carry out research based on their own cultural assumptions and data (Brannen, 1992)
because it is possible that the flexibility and lack of control in qualitative studies makes
it difficult to check the researchers’ bias (Kumar, 2011). Nevertheless, scholars have
proposed various ways to ensure the reliability and validity of qualitative methods, such
as enhancing the skill, competence, sensitivity, integrity and rigour of the researcher
doing fieldwork. Bryman (2012) suggests that qualitative research can be conducted
based on criteria to assess research in a similar way to quantitative research. For
example, using several strategies can contribute to external reliability (e.g. using more
than one observer and integrating identification). Moreover, qualitative methods may be
combined with quantitative methods. Using several methods can enabling checking of
result, or triangulation – combining more than one method, data source, or observer in
the study of social phenomena (Bryman, 2012; Patton, 1990; 2002).
Among the three sources, interviewing is a major instrument in qualitative research.
Interviewing allows researchers to elicit information, opinions, feelings, values,
attitudes and the meanings that underpin people’s lives and behaviours by asking
questions on the issues being studied (Bryman, 1989; Corbetta, 2003; Gray, 2004;
Matthews and Ross, 2010; Patton, 1987). Hence, interviewing is appropriate for
studying organizational culture. Other advantages of interviewing are that it may lead
to predictions of change through oral history, talking and respondents’ suggestions (Hall

114
and Hall, 1996); and it can be combined with other approaches in a multi-method design,
such as questionnaires and observation (Brewerton and Millward, 2001).
There are three major forms of interview: structured, unstructured and semi-structured
(Burns, 2000). Firstly, structured interviews involve a prescribed set of questions, which
an interviewer asks in the same wording and order of questions as specified in the
interview schedule (Brewerton and Millward, 2001; Bryman, 2012; Kumar, 2011).
Therefore, structured interviews provide uniform information that facilitates the
comparability of data (Kumar, 2011). Participants tend to be controlled more than in
unstructured interviews, where they are free to tell their story in their own way
(Matthews and Ross, 2010, p. 220). Structured interviews may be inflexible to elicit
perspectives of people in the project being studied and may be far from getting
information to answer the research questions of the current study.
Secondly, unstructured interviews focus on a wide area of discussions and enable
participants to answer questions within their own frame of reference (Matthews and
Ross, 2010; May, 2010). Therefore, unstructured interviews allow flexibility for
researchers to order content, structure and questions as they wish (Kumar, 2011). The
researchers may be challenged, for example by getting deviating data from the
interviewees’ perspective or their understanding of the topic (Bryman, 1988); leading to
a chance of losing the desired issues; being time-consuming due to interviewees’ being
free to give answers; and requiring high level of interviewing skill of researchers
(Brewerton and Millward, 2001).

115
Thirdly, semi-structured interviews incorporate elements of both quantifiable and
qualifiable, fixed-choice responding and the facility in describing in greater detail
(Kumar, 2011). This helps the researcher to explore, and probe in more depth
information by asking additional questions to solicit greater detail and understanding of
the interviewees’ point of view (Brewerton and Millward, 2001; Bryman, 2001; Gray,
2004). Using semi-structured interviews provides many merits, such as being flexible
and having a more natural conversation than with a structured interview (Hall and Hall,
1996); seeking elaboration and clarification on the data provided (May, 2010); and
ensuring validity due to the use of open-questions to receive the respondents’ real
perception (Burns, 2000). Therefore, semi-structured interviews are the closest for
receiving a variety of perspectives from respondents on the PA scheme, because
interview circumstances may be flexible and they can share their experiences without
controlled orientation.
There are two main forms of interviewing: in-depth and focus group interviews. In-
depth interviews provide an understanding of the interviewee’s underlying point of view
by using open-ended questions, listening to and recording the answers, which provides
in-depth detail of the interviewees’ values, attitudes, perception of their environment
and their experience (Burns, 2000). Using in-depth interviews facilitates the collection
of information from people who are experts on their own experience (Hall and Hall,
1996). This seems to be close to the intent of the current study, which focuses on senior
managers who have a lot of experience of bureaucracy and performance evaluation
schemes, such as the chief of the agencies. Focus group interviews enable researchers
to understand ‘why people feel the way they do’ (Bryman, 2001, p. 338) by exploring

116
people’s opinions, beliefs, values, attitudes, discourses and understandings of issues as
being valid in their own right (Brewerton and Millward, 2001). Focus group interviews
should be neither too large nor too small (eight to ten people) (Kumar, 2011). Using
focus groups may be a useful tool for identifying issues regarding how practitioners
think and how they perform the PA scheme.
Mixed methods
Mixed methods research focuses on collecting, analyzing and mixing both qualitative
and quantitative methods in a single study, known as a research design (Creswell and
Clark, 2007). The combination of qualitative and quantitative approaches in a single
study provides a range of different types of data by using different methods in order to
generate a well-integrated picture of what is happening in the area of interest and to get
a better understanding of the research questions than could be acquired from either
approach alone (Creswell and Clark, 2007; Matthews and Ross, 2010).
Darlington and Scott (2002) state that there are five main purposes of using mixed
methods: triangulation, complementarity, development, initiation and expansion. In
particular, triangulation is often seen in a number of pieces of literature on mixed
methods. Triangulation is to compare and integrate data collected from using more than
one method in a single study by seeking convergence of results in order to understand
the research problem and enhance the credibility of the research findings (Creswell and
Clark, 2007; Darlington and Scott, 2002; Hesse-Biber, 2010; Patton, 2002). However,
using triangulation has various challenges, such as a high requirement of effort and
expertise, difficulty in integrating evidence produced and contradiction between
117
quantitative and qualitative results (Brannen, 1992; Creswell and Clark, 2007;
Darlington and Scott, 2002). The different data generated by both quantitative and
qualitative approaches should not be considered as a problem, but needs further work
that may provide a better understanding of what is happening. Brannen (1992) also
suggested that differences in findings are not expected to be consistent but they are seen
to be complementary.
Some scholars (e.g. Bryman, 1988; Darlington and Scott, 2002) propose that there are
at least three types of mixed methods: (1) qualitative then quantitative – qualitative
methods produce hypotheses to test quantitatively or to develop research instruments;
(2) quantitative then qualitative – quantitative methods provide statistically representative
data that provides a basis for the sampling of cases and comparison groups that form
the intensive study and are then followed up by more in-depth analysis using qualitative
methods; and (3) qualitative and quantitative concurrently – both approaches are given
equal emphasis, which results in two separate but linked studies and integrates the
methods in the one study. This is done by using triangulation, complementarity,
combination of qualitative and quantitative.
Among the three types of mixed methods, quantitative then qualitative appears to be the
most appropriate approach to the current study, which is related to a large number of
cases or people. Using a quantitative approach can also facilitate the selection of the
interesting cases for the interview approach, which can be called quantitative then
qualitative.
118
Selection of research method
As stated earlier, a review of the literature on research methods suggests that the
combination of quantitative and qualitative methods in the same study allows access to
different levels of reality (Bryman, 1989; Patton, 1990), particularly in ethnographic
studies of organizational culture. In this area, qualitative methods are not the only
approach employed, but quantitative methods can also be used in mixed-methods. Thus,
it can be observed that many organizational culture studies have used mixed-methods,
for example Zammuto and Krakower (1991), Ehtesham et al. (2011), Hofstede (1990),
Parker and Bradley (2000), Al-Kuwari (2002), and Jingjit and Fotaki (2010). This
research focuses on investigating organizational culture and civil service performance
of the provincial administration in Thailand. The use of quantitative methods is
considered to be appropriate for a wide geographical area and collected data can be
analyzed by statistical methods and compared. Meanwhile, using qualitative methods
enable the eliciting of underlying assumption, by definition, of life. Here the strength of
one method offsets the weakness in the other method (Blaikie, 2010). Thus, a mixed
methods approach is closest for answering the research questions.
Using a self-completion questionnaire survey, known as a major instrument of the
quantitative method, provides many benefits for this study. Firstly, it permits the
researcher to measure the reactions of a large number of people or to collect data over a
wide geographical area by using a limited set of questions in order to attain a
generalizable set of findings (Kumar, 2011; Patton, 2001). This facilitates the study of
organizational culture among civil servants across 75 provinces in four regions of
Thailand. The self-completion questionnaires (post) can eliminate interviewer effects,

119
such as biases and pressure from the interviewer (Bryman, 2012). Secondly, the standard
questions of the OCAI have been extensively used by many empirical studies on
organizational culture (e.g. Howard, 1998; Ralston et al., 2006). Thirdly, quantitative
findings can be replicated and retested (Kumar, 2011) due to being based on structured
features. Finally, the quantitative method can be used to develop the qualitative phase,
which helps to identify groups of particular interest in order to undertake in-depth
analysis using qualitative methods (Darlington and Scott, 2002).
Regarding qualitative methods, a semi-structured interview is considered suitable for
the current study for three main reasons. Firstly, it elicits information in order to
understand several issues in-depth and in detail with a small number of people and cases
(Patton, 2002), for example, feelings, beliefs, values, attitudes, perceptions and
experiences (Kumar, 2011). Secondly, it is a flexible approach that permits the
participants to talk about topics or a set of questions in their own way (Matthews and
Ross, 2010). Moreover, it can be used in conjunction with other research techniques,
such as surveys, to follow up issues (Gray, 2004), in particular important sources of
required information. This facilitates a combination between the semi-structured
interview and questionnaire survey in this study.
4.4.2 Sampling cases
Sampling is an important procedure because it determines representative samples of a
wider population about which generalizations will be made (Bryman, 2012; Gray, 2004;
Warwick and Osherson, 1973). The objective of this study was to generate findings of
relevance to the civil servants (senior managers and practitioners) in the provincial
120
administration of Thailand as a whole. The findings of this research would represent the
overall picture of the relationship between organizational culture and performance in
delivering good governance within the PA scheme, particularly at the provincial level
in Thailand.
There are two main techniques of sampling: probability or random sampling and non-
probability or non-random or purposive sampling (Denscombe, 2010a; Gray, 2004;
Kemper, Stringfield and Teddie, 2003). Probability sampling is primarily employed in
quantitative research and is associated with representative samples (a cross-section of
the population) (Denscombe, 2010a; Teddlie and Yu, 2007). Meanwhile purposive
sampling is primarily used in qualitative research and is associated with exploratory
samples (a way to the discovery of new ideas or theories). By using mixed methods
several sampling techniques can be used or it can combine probability and purposive
sampling together according to the research question being studied (Kemper, Stringfield
and Teddie, 2003).
This study requires sampling at several levels – province, agency and individual.
However, each level requires the use of different approaches, which can be seen as a
case for using mixed methods (Teddlie and Yu, 2007). Therefore, a combination of
probability and purposive samplings was the closest technique of sampling for this
study. Three techniques of sampling were used in this study, including multi-stage
sampling, stratified sampling and purposive sampling. Multi-stage sampling involves
selecting samples in a sequence of stages, which allows researchers to reduce the sample
by selecting a random sample from the previously selected cluster (Denscombe, 2010a;

121
Kemper, Stringfield and Teddie, 2003). In the multi-stage sampling, stratified random
and purposive samplings were used. There are two reasons for using stratified sampling:
(1) this study has clear information on the population and sampling frame and (2) this
study has performance evaluation scores that enables the researcher to select the
samples. Denscombe (2010a) states that stratified random sampling can be used when
there is a known population, a sampling frame (a list of all items in the population) and
a process of random selection. In addition, using stratified sampling provides many
advantages. For example, it can ensure that the results of the sample are distributed
based on the same stratifying criterion, removing the risk of inadequate representation
of the sample, increasing precision by reducing sampling error, saving fieldwork costs
by reducing sample size and allowing the researcher to use various stratifying criteria
(Bryman, 2012; Sapsford and Jupp, 2006).
In summary, the multi-stage technique was used in this study, in which each stage in
this technique was used in different type of sampling. Collecting data for this study
started with a questionnaire survey and then used the survey findings for selecting
interview samples known as quantitative then qualitative methods. Thus, the description
of sampling starts with sampling for the questionnaire survey and then sampling for the
interview.
Sampling for the questionnaire survey
A purpose of sampling in quantitative research is to represent a generalization of
a population (Creswell and Clark, 2007). Thus, this study cautiously considered
the samples for the questionnaire survey. Figure 15 shows a sampling diagram for

122
questionnaire survey, which uses a combination of techniques – multi-stage, stratified
and purposive samplings were used. The sampling frames – information about the
research population (Denscombe, 2010a) – are necessary for sampling at each level. In
summary, the intended samples of this study involved:
Provincial level: of 75 provinces in four regions at the provincial administration
level in Thailand that engaged with the PA scheme between 2007 and 2011.
Agency level: of 35 provincial agencies who were KPI host agencies in each province.
Individual level: officials in each KPI host agency who were responsible for
KPI(s) between 2007 and 2011 (at least one year of experience), including chiefs
of agencies, viewed as director of KPIs or senior managers and other officials
viewed as data collectors or practitioners.
Provincial level
The population of this study was from 75 provinces in four regions of Thailand from which
the samples were selected by purposive sampling. The provinces were selected based on
using performance evaluation scores or KPI scores in five fiscal years between 2007 and
2011 approved by the PDC, using stratified random sampling. According to the distribution
of the KPI scores, it was not a normal distribution, namely left skewness23 – the score is
clustered at the high end (right-hand side of a graph) (Pallant, 2010, p. 57). Therefore, a
median was used as the cut-off point to divide the sample into two groups (Pallant, 2010, p.
89), the low and high KPI scoring provinces. There are two main steps in using the median
to select the low and high KPI scoring provinces to be representatives of each region.
23 The skewness value provides an indication of the symmetry of the distribution (Pallant, 2010, p. 57).

123
Figure 15 Sampling diagram for questionnaire survey
Key: mean purposive sampling; mean stratified sampling.
Note: The process of sampling is under the multi-stage sampling; 1) Provincial level: ‘Low’ and ‘High’ mean low and high KPI scoring provinces respectively 2) Agency level: N,
C, NE and S mean provincial codes in each region and number 1,2 and 3,4 mean low and high KPI scoring provinces respectively; List of 10 agencies is shown in Table 6
In the context of multi-stage sampling
Thailand
Provincial level
Northern region
(17 provinces)
Central region
(25 provinces)
North-eastern
region
(19 provinces)
Southern region
(14 provinces)
Low
(2 provinces)
High
(2 provinces)
Agency level Individual level
Low
(2 provinces)
High
(2 provinces)
Low
(2 provinces)
High
(2 provinces)
Low
(2 provinces)
High
(2 provinces)
N1: 10 agencies
N2: 10 agencies
N3: 10 agencies
N4: 10 agencies
C1: 10 agencies
C2: 10 agencies
C3: 10 agencies
C4: 10 agencies
NE1: 10 agencies
NE2: 10 agencies
NE3: 10 agencies
NE4: 10 agencies
S1: 10 agencies
S2: 10 agencies
S3: 10 agencies
S4: 10 agencies
1 Senior manager &
2 Practitioners per agency
N2: 10 agencies
1 Senior manager &
2 Practitioners per agency
N2: 10 agencies
1 Senior manager &
2 Practitioners per agency
N2: 10 agencies
1 Senior manager &
2 Practitioners per agency
N2: 10 agencies 1 Senior manager &
2 Practitioners per agency
N2: 10 agencies
1 Senior manager &
2 Practitioners per agency
N2: 10 agencies
1 Senior manager &
2 Practitioners per agency
N2: 10 agencies
1 Senior manager &
2 Practitioners per agency
N2: 10 agencies
Grey boxes White boxes
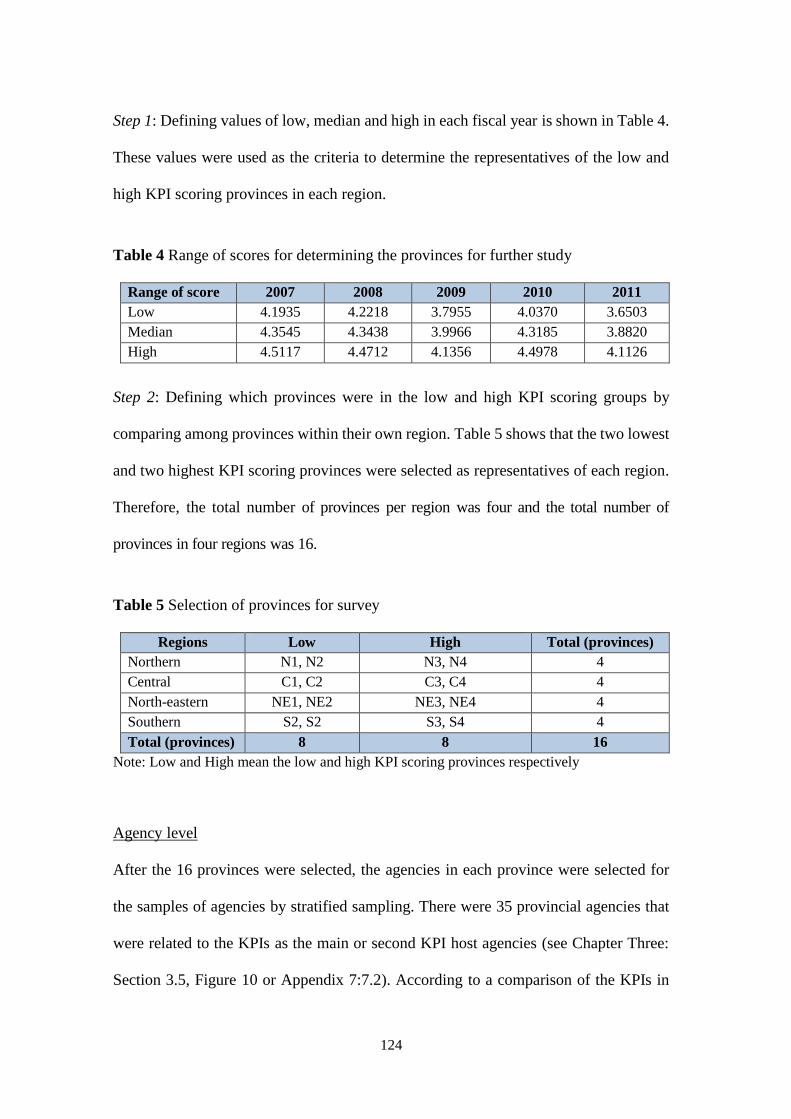
124
Step 1: Defining values of low, median and high in each fiscal year is shown in Table 4.
These values were used as the criteria to determine the representatives of the low and
high KPI scoring provinces in each region.
Table 4 Range of scores for determining the provinces for further study
Range of score 2007 2008 2009 2010 2011
Low 4.1935 4.2218 3.7955 4.0370 3.6503
Median 4.3545 4.3438 3.9966 4.3185 3.8820
High 4.5117 4.4712 4.1356 4.4978 4.1126
Step 2: Defining which provinces were in the low and high KPI scoring groups by
comparing among provinces within their own region. Table 5 shows that the two lowest
and two highest KPI scoring provinces were selected as representatives of each region.
Therefore, the total number of provinces per region was four and the total number of
provinces in four regions was 16.
Table 5 Selection of provinces for survey
Regions Low High Total (provinces)
Northern N1, N2 N3, N4 4
Central C1, C2 C3, C4 4
North-eastern NE1, NE2 NE3, NE4 4
Southern S2, S2 S3, S4 4
Total (provinces) 8 8 16
Note: Low and High mean the low and high KPI scoring provinces respectively
Agency level
After the 16 provinces were selected, the agencies in each province were selected for
the samples of agencies by stratified sampling. There were 35 provincial agencies that
were related to the KPIs as the main or second KPI host agencies (see Chapter Three:
Section 3.5, Figure 10 or Appendix 7:7.2). According to a comparison of the KPIs in
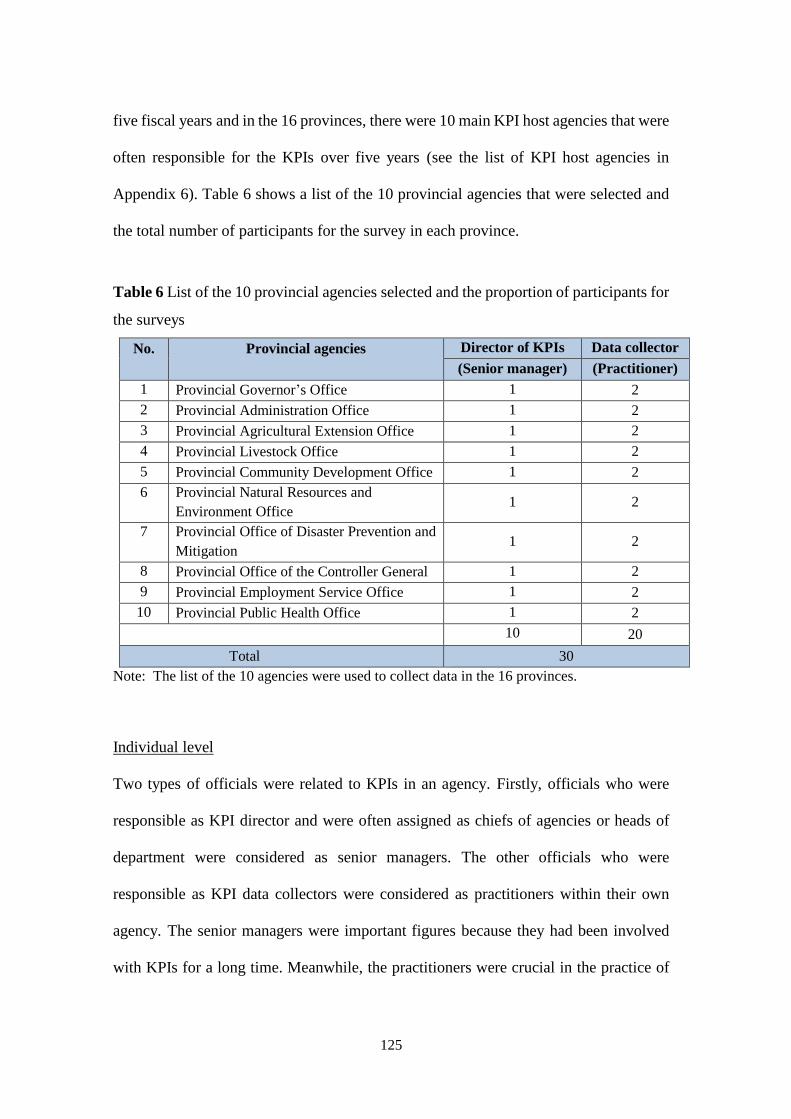
125
five fiscal years and in the 16 provinces, there were 10 main KPI host agencies that were
often responsible for the KPIs over five years (see the list of KPI host agencies in
Appendix 6). Table 6 shows a list of the 10 provincial agencies that were selected and
the total number of participants for the survey in each province.
Table 6 List of the 10 provincial agencies selected and the proportion of participants for
the surveys
No.
Provincial agencies
Director of KPIs Data collector
(Senior manager) (Practitioner)
1 Provincial Governor’s Office 1 2
2 Provincial Administration Office 1 2
3 Provincial Agricultural Extension Office 1 2
4 Provincial Livestock Office 1 2
5 Provincial Community Development Office 1 2
6 Provincial Natural Resources and
Environment Office 1 2
7 Provincial Office of Disaster Prevention and
Mitigation 1 2
8 Provincial Office of the Controller General 1 2
9 Provincial Employment Service Office 1 2
10 Provincial Public Health Office 1 2
10 20
Total 30
Note: The list of the 10 agencies were used to collect data in the 16 provinces.
Individual level
Two types of officials were related to KPIs in an agency. Firstly, officials who were
responsible as KPI director and were often assigned as chiefs of agencies or heads of
department were considered as senior managers. The other officials who were
responsible as KPI data collectors were considered as practitioners within their own
agency. The senior managers were important figures because they had been involved
with KPIs for a long time. Meanwhile, the practitioners were crucial in the practice of

126
the KPIs because the KPIs were related to their tasks and they also directly delivered
services to citizens in the provinces. In each agency, there were at least one senior
manager and two practitioners who were responsible for an agency’s KPI. Therefore,
the proposed participants were three per agency, including one senior manager and two
practitioners (see Table 6) and were selected by stratified sampling from the selected
agencies.
In summary, the samples for the questionnaire survey comprised 16 provinces and each
province consisted of 10 provincial agencies. The participants in each agency included
one senior manager and two practitioners, with 30 participants per province. The total
number of proposed participants for the survey was 480 (see Table 7).
Table 7 Summary of the samples for the questionnaire survey
Regions Code of
provinces
Type of
group
No. of
agencies
No. of participants
per agency
Total
(10 agencies x
3 participants) Senior
managers
Practitioners
Northern N1 L 10 1x10 2x10 30
N2 L 10 1x10 2x10 30
N3 H 10 1x10 2x10 30
N4 H 10 1x10 2x10 30
Central C1 L 10 1x10 2x10 30
C2 L 10 1x10 2x10 30
C3 H 10 1x10 2x10 30
C4 H 10 1x10 2x10 30
North-
Eastern
NE1 L 10 1x10 2x10 30
NE2 L 10 1x10 2x10 30
NE3 H 10 1x10 2x10 30
NE4 H 10 1x10 2x10 30
Southern S1 L 10 1x10 2x10 30
S2 L 10 1x10 2x10 30
S3 H 10 1x10 2x10 30
S4 H 10 1x10 2x10 30
Total (No.) 16 16 160 160 320 480
Note: 1) Table 7 shows the proposed number of participants.
2) L and H mean the low and high KPI scoring provinces respectively.

127
Sampling for interviews
The main purpose of sampling in qualitative research is to select individuals or sites that
can provide the necessary information (Creswell and Clark, 2007). Before a discussion
on interview samples and sampling size, it is important to note that the survey findings
were used for considering the interview samples through purposive sampling. Figure 16
shows a sampling diagram for interview, where a combination of techniques was used
in the same way as the sampling for the survey. The characteristics of the interview
samples in each level included:
Provincial level: The provinces that were selected as the interview sample were
acquired from the data analysis from the 16 provinces where the questionnaire
survey was carried out. The criteria for selecting the provinces included. Firstly,
the provinces had to have a survey response from the Provincial Governor’s Office.
Secondly, they were not the non-variant provinces, such as a special area identified
as having insurgency or unique geography (e.g. a lot of high mountains resulting in
difficult transportation).
Agency level: The agencies that were considered for selection as the interview
sample were required to be within the 10 provincial agencies in the provinces
selected for interview. The agencies were different in each province and depended
on the survey findings. The results of the survey provided the criteria for selecting
the agencies included. Firstly, the mean scores of the 10 agencies were compared
in their own provinces based on the results of the statistically significant
differences of the four culture types. Secondly, the agencies that were considered
for the sample had to undertake three complete questionnaires from one senior
manager and two practitioners.
128
Individual level: Two types of officials were selected as participants of the
interview, including senior manager and practitioner. The proposed characteristics
of the participants comprised (1) senior managers who were KPI directors and had
experience with KPI(s) and (2) practitioners who were responsible for KPIs with
at least one year of experience. They were considered whether they had completed
the questionnaire survey or not.
Provincial level
The survey findings were analyzed with SPSS (Independent-Sample t-Test), the
statistically significant differences of four culture types between the high and low KPI
scoring provinces, and were used to select the interview samples. The survey findings
revealed that four types of culture between both groups had significant differences,
namely clan and market, hierarchy and adhocracy respectively. Thus, eight provinces in
each group, low and high groups, were compared by the mean score within their group
based on the four culture types as stated earlier. The four provinces were selected for
interviews by stratified sampling, including two low and two high KPI scoring provinces
(see Figure 16).
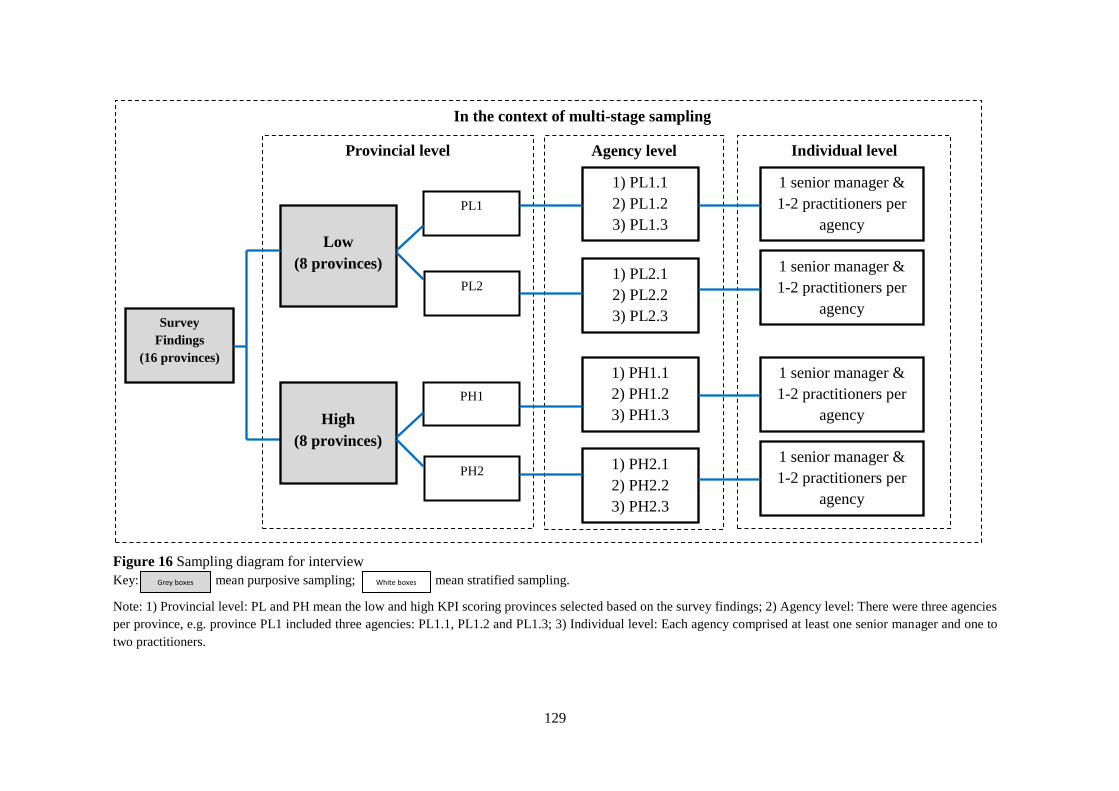
129
Figure 16 Sampling diagram for interview
Key: mean purposive sampling; mean stratified sampling.
Note: 1) Provincial level: PL and PH mean the low and high KPI scoring provinces selected based on the survey findings; 2) Agency level: There were three agencies
per province, e.g. province PL1 included three agencies: PL1.1, PL1.2 and PL1.3; 3) Individual level: Each agency comprised at least one senior manager and one to
two practitioners.
In the context of multi-stage sampling
Survey
Findings
(16 provinces)
Provincial level
Low
(8 provinces)
PL1
PL2
Agency level Individual level
PH1
PH2
High
(8 provinces)
1) PL1.1
2) PL1.2
3) PL1.3
1) PL2.1
2) PL2.2
3) PL2.3
1) PH1.1
2) PH1.2
3) PH1.3
1) PH2.1
2) PH2.2
3) PH2.3
1 senior manager &
1-2 practitioners per
agency
1 senior manager &
1-2 practitioners per
agency
1 senior manager &
1-2 practitioners per
agency
1 senior manager &
1-2 practitioners per
agency
Grey boxes White boxes
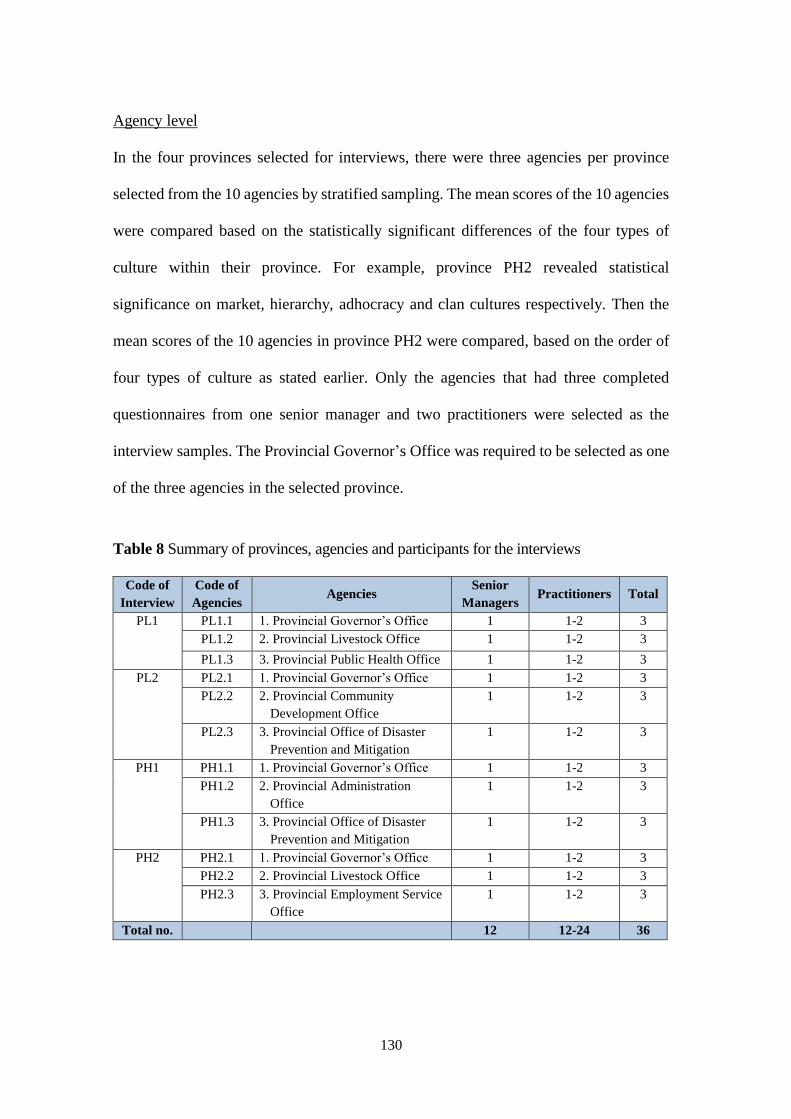
130
Agency level
In the four provinces selected for interviews, there were three agencies per province
selected from the 10 agencies by stratified sampling. The mean scores of the 10 agencies
were compared based on the statistically significant differences of the four types of
culture within their province. For example, province PH2 revealed statistical
significance on market, hierarchy, adhocracy and clan cultures respectively. Then the
mean scores of the 10 agencies in province PH2 were compared, based on the order of
four types of culture as stated earlier. Only the agencies that had three completed
questionnaires from one senior manager and two practitioners were selected as the
interview samples. The Provincial Governor’s Office was required to be selected as one
of the three agencies in the selected province.
Table 8 Summary of provinces, agencies and participants for the interviews
Code of
Interview
Code of
Agencies Agencies
Senior
Managers Practitioners Total
PL1 PL1.1 1. Provincial Governor’s Office 1 1-2 3
PL1.2 2. Provincial Livestock Office 1 1-2 3
PL1.3 3. Provincial Public Health Office 1 1-2 3
PL2 PL2.1 1. Provincial Governor’s Office 1 1-2 3
PL2.2 2. Provincial Community
Development Office
1 1-2 3
PL2.3 3. Provincial Office of Disaster
Prevention and Mitigation
1 1-2 3
PH1 PH1.1 1. Provincial Governor’s Office 1 1-2 3
PH1.2 2. Provincial Administration
Office
1 1-2 3
PH1.3 3. Provincial Office of Disaster
Prevention and Mitigation
1 1-2 3
PH2 PH2.1 1. Provincial Governor’s Office 1 1-2 3
PH2.2 2. Provincial Livestock Office 1 1-2 3
PH2.3 3. Provincial Employment Service
Office
1 1-2 3
Total no. 12 12-24 36

131
In conclusion, three agencies per province were selected by stratified sampling to be
representatives of the 10 agencies in their provinces. The total number of agencies were
12. The list of agencies in each province is shown in Table 8.
Individual level
Two types of officials were selected for the interviews by stratified sampling, including
at least one senior manager and one to two practitioners. The selection of senior
managers and practitioners was considered based on the criteria as stated earlier. The
proportion of senior manager and practitioners per agency was one and one to two
respectively. Thus, the total number of proposed participants was 36 in the four
provinces (see Table 8). In-depth and focus group interviews were carried out with
senior managers and practitioners respectively.
In summary, sampling for the interviews combined three techniques, multi-stage,
stratified and purposive sampling together, the same as the sampling for the survey
questionnaire. Sampling for the interviews was based on the survey findings and
required representatives from the low and high KPI scoring provinces, thus this stage
was viewed as purposive sampling. However, stratified sampling was used at the level
of province, agency and individual. The total number of provinces selected for the
interviews was four provinces, including two low and two high KPI scoring provinces.
In each province, three agencies were selected, one of them being the Provincial
Governor’s Office. The total number of agencies was 12, with one senior manager and
one to two practitioners per each agency. Thus, the total number of proposed participants
for the interviews was up to 36.

132
4.5 Research approach
According to the discussions of research design and methodology in section 4.3 and 4.4
respectively, the overall research approach was summarized as shown in Figure 17.
There are six steps as follows:
Figure 17 Summary of the overall research design and methodology
Source: Author’s construct
Step 1 Development of research approach: This phase focuses on the literature on
research design and methodology. The literature suggests that case study and
comparative designs are relatively associated with this kind of study, whilst mixed
methods are closest for answering the research questions.
Literature Review
Case Study
(1) Development
of research
approach
Comparative
Study
Survey
findings
conclusion
(5) Interview
data analysis Compare & contrast
between high and low
KPI scoring provinces
Application of
research
approach
Application of
research
approach
Analysis of
Survey Data
(6) Overall
conclusion
(4) Semi-
Structured
Interviews based
on survey
findings
(2) Self-
completion
questionnaire
survey
16 provinces in
4 regions
(3) Survey data
analysis
Compare & contrast
between high and low
KPI scoring provinces
Analysis of
Interview
Data
Identification of
interview cases
by survey
findings
Interview
findings
conclusion
Conclusion
of findings
Conclusion
of findings
Focus Group
(Practitioners)
In-depth
(Senior managers)
In-depth
(Senior managers)
Focus Group
(Practitioners)
133
Step 2 Self-completion questionnaire survey: In the 16 provinces that were selected from
a total number of 75 provinces in four regions, data was collected from senior managers
and practitioners by post. The provinces included eight low and eight high KPI scoring
provinces.
Step 3 Survey data analysis: The data collected from the questionnaire surveys was
analyzed in Excel and SPSS (Version 21). The data was compared and contrasted
between the low and high KPI scoring provinces based on the organizational culture
profile. The survey findings were used to consider which provinces should be selected
for the interview samples as discussed in section 4.4.2.
Step 4 Semi-structured interviews based on survey findings: The semi-structured
interviews were carried out with the four provinces selected based on the survey
findings. In-depth and focus group interviews were conducted with senior managers and
practitioners respectively.
Step 5 Interview data analysis: The interview data was compared and contrasted
between low and high KPI scoring provinces, such as between senior managers and
practitioners, between senior managers in both groups, and between practitioners in both
groups.
Step 6 Overall conclusion: Triangulation and complementarity were used. The findings
obtained from the surveys and interviews were compared and contrasted with the theory

134
and literature to summarize convergence, divergence and clarification of the overall
results.
4.6 Data collection
This study was carried out by collecting data from both primary and secondary sources
as demonstrated in Table 9.
Table 9 Types of data used in the study
Primary sources Secondary sources
Quantitative Self-completion questionnaire
surveys by post
Performance evaluation scores
of provincial administration
between 2007 and 2011
Qualitative Interviews with civil servants,
including senior managers and
practitioners at sites
-
Performance evaluation scores of provincial administration between 2007 and 2011,
sourced from the OPDC, were the secondary quantitative data sources that were used as
a prior step to sampling for the questionnaire surveys. The main sources of this study
were primary quantitative and qualitative data that were collected in the field, at the
provincial level of Thailand. The primary quantitative data source was collected from
questionnaire surveys by post, whilst the primary qualitative data source was collected
with senior managers and practitioners by semi-structured interviews at sites.
135
Getting access to data collection
I am a staff member of the Office of the Public Sector Development Commission
(OPDC), a central government agency. I have been responsible for the monitoring and
evaluation of performance in the provincial administration for five years. Therefore, the
OPDC connection and my personal connections through my coordinating work helped
me to get access to the provinces selected for the study. Moreover, I have colleagues,
including the OPDC staff who are appointed to take responsibility for the provincial
administration, who enabled the data collection in terms of providing relevant
information (e.g. contact details of the provinces’ coordinators) and suggestions (e.g. how
to approach the provinces).
Getting access to questionnaire surveys
Quantitative data was created by using self-completion questionnaire surveys (see
questionnaire in Appendix 8:8.1). The surveys were carried out in three main steps as
shown in Figure 18. The first step was selecting 16 provinces as stated earlier in section
4.4.2. The second step was informal contact with two groups: the OPDC staff and the
provincial coordinators. Brief information on the research was provided to the OPDC
staff face to face because the staff were responsible for the selected provinces. They
gave me contact details of provincial coordinators and suggestions about the provinces.
Then, provincial coordinators were contacted by phone to explain about the research
before the formal contact was processed.

136
Figure 18 Process of getting access to the surveys
The final step was formal contact. The official letters with 10 sets of questionnaires were
sent by post to the selected provinces. The provinces’ Governors were asked to agree,
and if they did then the Governors would appoint the Provincial Governor’s Office to
distribute the 10 sets of questionnaires to the 10 agencies on the list attached. Attached
to each set of questionnaires was an envelope with stamp to help the agency send the
completed questionnaires back to me. In an agency, one senior manager and
two practitioners were asked to answer questionnaires and the total number of
questionnaires per agency was three. The proposed number of questionnaires per
province was 30. It is important to note that all questionnaires were coded before
distribution in order to facilitate data analysis.
Procedure
Described brief research information
to relevant OPDC staff face to face &
the provincial coordinators
by phone
Sent the official letters to
Governors for agreement to send 10
sets of questionnaires by post
(30 questionnaires per province)
Step 2: Informal contact
Step 3: Formal contact
Step 1: Selection of 16 provinces Selected 16 provinces to be the
representatives of 75 provinces
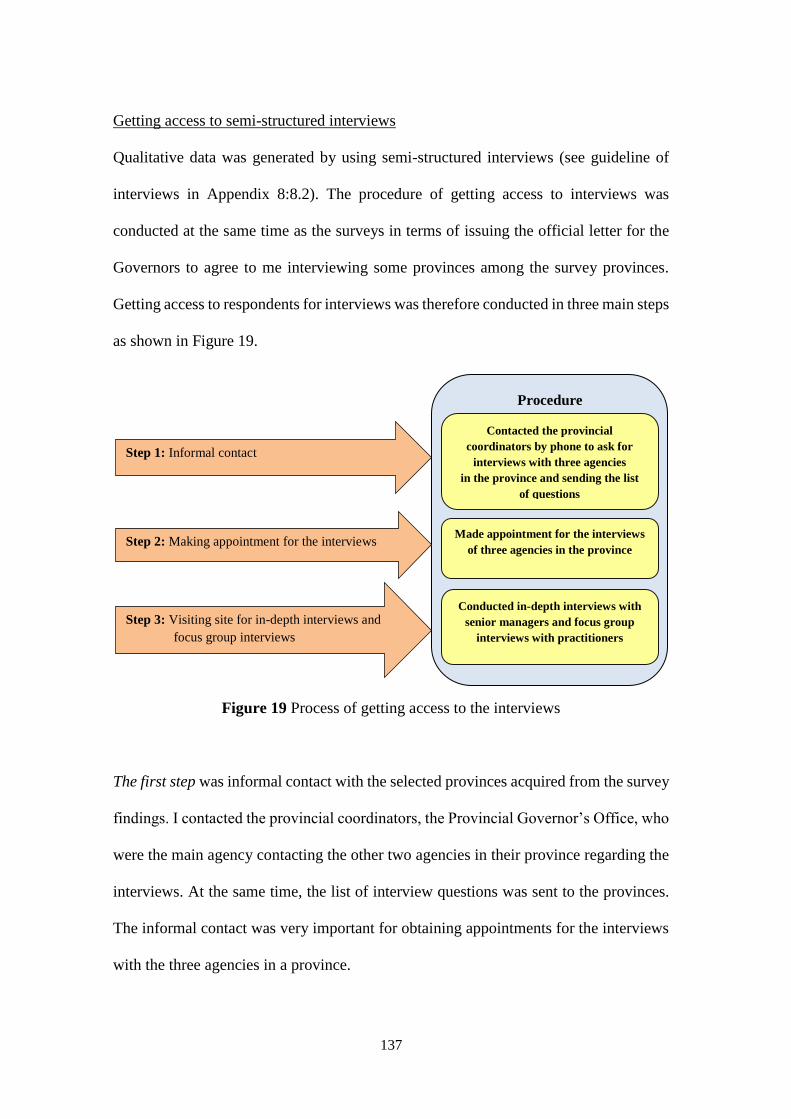
137
Getting access to semi-structured interviews
Qualitative data was generated by using semi-structured interviews (see guideline of
interviews in Appendix 8:8.2). The procedure of getting access to interviews was
conducted at the same time as the surveys in terms of issuing the official letter for the
Governors to agree to me interviewing some provinces among the survey provinces.
Getting access to respondents for interviews was therefore conducted in three main steps
as shown in Figure 19.
Figure 19 Process of getting access to the interviews
The first step was informal contact with the selected provinces acquired from the survey
findings. I contacted the provincial coordinators, the Provincial Governor’s Office, who
were the main agency contacting the other two agencies in their province regarding the
interviews. At the same time, the list of interview questions was sent to the provinces.
The informal contact was very important for obtaining appointments for the interviews
with the three agencies in a province.
Procedure
Conducted in-depth interviews with
senior managers and focus group
interviews with practitioners
Made appointment for the interviews
of three agencies in the province Step 2: Making appointment for the interviews
Step 3: Visiting site for in-depth interviews and
focus group interviews
Contacted the provincial
coordinators by phone to ask for
interviews with three agencies
in the province and sending the list
of questions
Step 1: Informal contact

138
The second step was making appointments with the provinces, and they were contacted
through the provincial coordinators from the Provincial Governor’s Office. The date and
the venue for the interviews were discussed with the province in order to obtain a time
schedule for the interviews of the three agencies.
The final step was to visit the site for the interviews, and in-depth interviews were
conducted with senior managers in each agency, one by one. Meanwhile, focus group
interviews were conducted once per province with practitioners, ranging from three
to six persons, who were representatives from each agency and were responsible for
KPI(s) with at least one year’s experience. The duration for visiting each province was
around one to two days.
4.7 Data analysis and Interpretation
The analysis of the data was undertaken based on the research approach, namely
quantitative and qualitative research.
4.7.1 Quantitative data analysis
Quantitative data was analyzed with SPSS because it allows researchers to generate
descriptive statistics (e.g. percentages and frequencies) and to test for significant
differences (May, 2010; De Vaus, 2002). The quantitative data acquired from the
questionnaire surveys in this study was not only analyzed with SPSS (Version 21), but
also the organizational culture profiles of the OCAI and Excel. These instruments were
used together to increase the validity of the analysis. There are three main steps to the
analysis. They are as follows:

139
Step 1: This step was to prepare the data for analysis. The 374 complete questionnaires
were classified for data analysis, in which incomplete questionnaires – questionnaires
with more than 20% (38) questions not answered – were eliminated (8.13%). The
selected questionnaires were analyzed by compiling data in the worksheet of Excel for
scoring the OCAI (see Appendix 5:5.2). The A, B, C, and D scores in each question was
entered into the excel file in the ‘Now’ and ‘Preferred’ columns.
Step 2: This step was to analyze the data from step 1, which was divided into two types:
organizational culture profiles and SPSS analysis. Firstly, the average scores in step 1
were constructed for an organizational culture profile (see Figure 3 in Chapter Two)
(Cameron and Quinn, 2011) as per the following stages:
1) The ‘Now’ column was used as a prior step. The average scores for each alternative
(A, B, C, and D) were plotted on the organizational culture profile in which each
quadrant within the profile shows four culture types: clan, adhocracy, hierarchy,
and market cultures.
2) The points in each quadrant were connected to form a four-sided figure in
a kite-like shape. This profile creates a current picture of your organizational culture.
3) The ‘Preferred’ column was plotted on the same form. The points used a dot line
for comparison between preferred and current cultures.
Excel was used to calculate the score and plot the graph of the organizational culture
profiles. Secondly, the data was analyzed with SPSS, and the analyses included
descriptive statistics, Independent-Sample t-Test, and One-way ANOVA. The analyses
were chosen by considering the purpose of the analyses.

140
Step 3: This step was to analyze the last section of the questionnaire, the assessment of
job satisfaction, which was separated from the previous steps. The quantitative data
obtained from this section was analyzed with SPSS, and in particular, generating
descriptive statistics and Independent-Sample t-Test.
4.7.2 Qualitative data analysis
Analysis of qualitative data generally begins with coding. Coding is an analytical
process of organizing raw data, creating and assigning categories to selected relevant
data (Dey, 1993; Neuman, 2013). There are several forms of coding, including with
themes, topics, concepts and meanings, and they help researchers to focus on the
essential issues of the research (Burns, 2000; Creswell and Clark, 2007). Boyatzis
(1998) suggested that there are three main ways to develop themes and codes, including
theory-driven, prior data or prior research driven, and inductive or data-driven. Burns
(2000) also suggested that huge amounts of qualitative data, such as interview
transcripts and field notes, have to be managed and organized, and software can provide
advantages. In the current study, the interview data was analyzed by coding based on
using theory-driven and inductive or data-driven approaches, and NVivo (version 10)
was used to this end. NVivo is a software package, which is a tool to help the researcher
with recording, linking ideas in several dimensions, and searching for the patterns in the
data. It also helps with generating ideas and with creating and exploring documents and
nodes where the data is coded, browsed, and linked in order to eliminate rigid divisions
between data and interpretation (Richards, 1999).

141
The analysis of the interview data in this study was divided into three main steps:
transcription, coding by using a theory-driven approach and coding by using a data-
driven approach (see Appendix 8: 8.3). These steps are explained below:
Step 1 Transcription: The recorded verbal communications were transcribed. The
interviews were carried out in the Thai language because the interviewees were Thais.
Thus, the transcription was conducted in the Thai language and analyzed with NVivo.
It is important to note that the summary of the interview data was sent to the interviewees
for confirmation of validity before the coding of the qualitative data proceeded.
Step 2 Coding using a theory-driven approach: Coding was based on the following eight
key themes of organizational culture: dominant characteristics of the organization,
leadership style, management of employees, organizational cohesion, organizational
strategic emphasis, organizational success criteria, organizational motivation, job
satisfaction and others.
Step 3 Coding using a data-driven approach: This step involves scanning the entire raw
data or field-notes to create categories and subcategories called ‘open coding’ (Strauss,
1987). The categories can be guided by the research questions (Neuman, 2013) or found
in the initial or emerging research questions, which may have to be redefined and
reformulated at the final stage of the qualitative data analysis (Dey, 1993). In this study,
creating categories, thus, was undertaken based on the actual interview data focused on
the interview questions within each theme. The additional codes or new ideas for the
categories emerged from the participants’ perspectives on implementing PA for

142
delivering good governance. Axial coding is used in this step, which is when the
researcher codes more intensively around a single category (Strauss, 1987).
4.8 Research ethics
Ethical considerations matter in the conduct of social research and are focused on the
protection of the participants and the integrity of the inquiry (May, 2010). Therefore,
this research is concerned with ethical issues throughout the process. This section
discusses the ethical issues of the research based on pragmatic issues.
Approval for ethical review
Ethical clearance was approved by the Humanities and Social Sciences Ethical Review
Committee before this research was carried out in the field. This ensured that the
research design, methodology and instruments used in the research, such as
questionnaires, interview guides and consent forms were reviewed in accordance with
the ethical review procedure of the University of Birmingham.
Being a civil servant of the central agency
I am a staff member of the Office of Public Sector Development Commission (OPDC),
which is the main central government agency responsible for the PA scheme. I used the
OPDC connection to get access to the provinces selected. This may be a sensitive issue
for some officials, for example they might feel under pressure from leaders (e.g. the
Provincial Governor and chief of agencies) to take part in the process of collecting data.
I explained participants that the provided information would be presented in the overall
picture and their personal information were anonymous, which might increase their
143
willingness to be interviewed. At the provincial level, permission to undertake the
research is sought from the Provincial Governor and then cascaded to chief of agencies
within a province, following the official procedure of bureaucracy. This permission will
provide authorisation to undertake research in the province but will not come with any
guarantees or pressure for officials in provincial agencies to participate in the research.
Sending and collecting questionnaires by post, where the envelope and stamp were
provided for the participants to send their questionnaires back to me, is not only to
preserve the anonymity of the respondents, but also to reduce the perceived risk of
pressure on the respondents from their leaders. The targeted participants in the agencies
in each province are independent and have the right to make a decision on whether to
participate even though their leaders have agreed that the research can take place in the
province.
Informed consent of research participants
The rationale, purpose and methods of the research were informed to all participants.
The official letters were issued by the OPDC and sent to the Provincial Governor for
agreement to access data sources by questionnaire surveys and interviews. The letter
would be cascaded to related agencies and individuals. Questionnaire surveys were
one-page for research information (in Thai language). Respondents had the right to
decide whether to participate or not in the surveys because the questionnaires were sent
by post. Regarding interviews, all the participants were also provided with a consent
form (see Appendix 9). A summary of the interview findings (in Thai language) was
sent to the participants by electronic mail (email) to ensure the validity of the data that
they provided. If the participants needed to give any feedback for more accuracy and

144
balance of the research findings, they would be able to do that by sending their feedback
to the researcher within two weeks from the date the email was sent by the researcher.
Then, the approved interview data was analyzed.
Confidentiality and anonymity
The issues of confidentiality and anonymity were relevant to this research. Thus, the
identities of all provinces, organizations and participants were protected. Questionnaire
surveys were coded by using numbers and variable codes such as N1 and N2, and only
the researcher and my supervisors know about the code. Regarding the interviews, the
participants were informed that note taking and audio recordings were used during
interviews. However, note taking and recordings did not identify the contributors by
name. The interviews used numbers and variable codes in the same way as the
questionnaires. Using numbers and variable codes for the questionnaires and the
interviews was not only to protect the confidentiality and anonymity of all the data
provided by the participants, but was also useful for the process of data analysis.
Moreover, all the participants were clearly informed about the publishing of the research
findings through the consent form and no outputs included any list of provinces agencies
and participants’ names.
145
4.9 Summary
The objectives of this study are to investigate the relationship between organizational
culture and good governance in the provincial administration of Thailand. This was
explored through civil servants’ perspectives on implementing the PA scheme. To
achieve these objectives, a combination of case study and comparative designs were
used. Mixed methods, quantitative and qualitative methods, were employed in order to
use self-completion questionnaire surveys and semi-structured interviews (in-depth and
focus group interviews).
Using mixed methods for this study involved multi-techniques of sampling in both
surveys and interviews, namely multi-stage, stratified and purposive samplings. The
surveys were carried out with the 16 provinces selected from 75 provinces, and they
include 10 provincial agencies with 30 participants per province. The total number of
proposed participants for the surveys was 480. Meanwhile, the interviews were carried
out with four provinces selected from the survey findings, and comprised three agencies
with around nine participants per province. The total number of proposed participants
of the interviews was 36. In terms of data analysis and interpretation, the survey data
was analyzed by using three instruments: organizational culture profiles, Excel, and
SPSS. The interview data was analyzed using NVivo.
146
CHAPTER 5
RESEARCH FINDINGS: QUANTITATIVE DATA
5.1 Introduction
This chapter reports the empirical findings from the analysis of the quantitative data
acquired from the questionnaire surveys based on the 16 provinces. The questionnaire
surveys were analyzed through the organizational culture profile of the OCAI and using
Excel and SPSS (Version 21). The purpose of the analysis was to examine the
relationship between organizational culture and good governance, as defined in the Thai
civil service performance agreement (PA).
The chapter is structured into four main sections. Section 5.2 reports the respondents’
responses to the questionnaire surveys. Section 5.3 focuses on the overall organizational
culture profile of the provincial cases. Section 5.4 provides a comparison of the
organizational culture profiles between the low and high KPI scoring provinces.
A description of job satisfaction based on the provincial cases is presented in Section
5.5. The final section (5.6) is the conclusion of the chapter.
It is important to note that the questionnaire survey findings as presented here have been
translated from Thai to English – the translation procedures were based on literature on
the OCAI (translated in Thai)24 and professional translation in both Thai and English.
24 There are some PhD theses that used the OCAI by translation from English to Thai such as Jingjit
(2008) and Tachateerapreda (2009).
147
That coding was used to ensure anonymity. The coding information of the surveys is
shown in Appendix 10: 10.1.
5.2 Respondents to the questionnaire survey
The questionnaire survey was conducted with a good response rate of 72.29 % –347
officials from the proposed respondents of 480 (100%) took part in the survey. From the
347 completed questionnaires25 , 308 (88.76%) were analysed. General information
about the respondents was categorized by sex, age, position, organization, experience
of KPI host, position on KPI host and consent for interview (if needed) and is presented
in Table 10.
Respondents were evenly divided by gender, with men and women both around 50%.
The majority of the respondents were over 30 years old – almost 50% were aged 51 or
over. In terms of their position level, over 50% of the respondents were at a professional
level 26 . A small proportion (3.06%) came from low level ‘employees’ positions.
Regarding the provincial agencies, six agencies out of ten responded with over 10%
(10.71% - 11.36%), while the other four agencies’ percentages varied between 6.82%
and 9.42%.
25 Only fully completed questionnaires were considered for quantitative analysis. Those with
unanswered sections were excluded as were those where multiple questionnaires appeared to have
been filled in by the same hand. 26 Office of the Civil Service Commission (OCSC) classifies position of officials into four main
categories: executive, managerial, knowledge worker, and general. Knowledge worker positions
include practitioner, professional, senior professional, expert, and advisory level (www.ocsc.go.th).
Moreover, position of government employees (e.g. government permanent employees) are under the
responsibility of the OCSC.
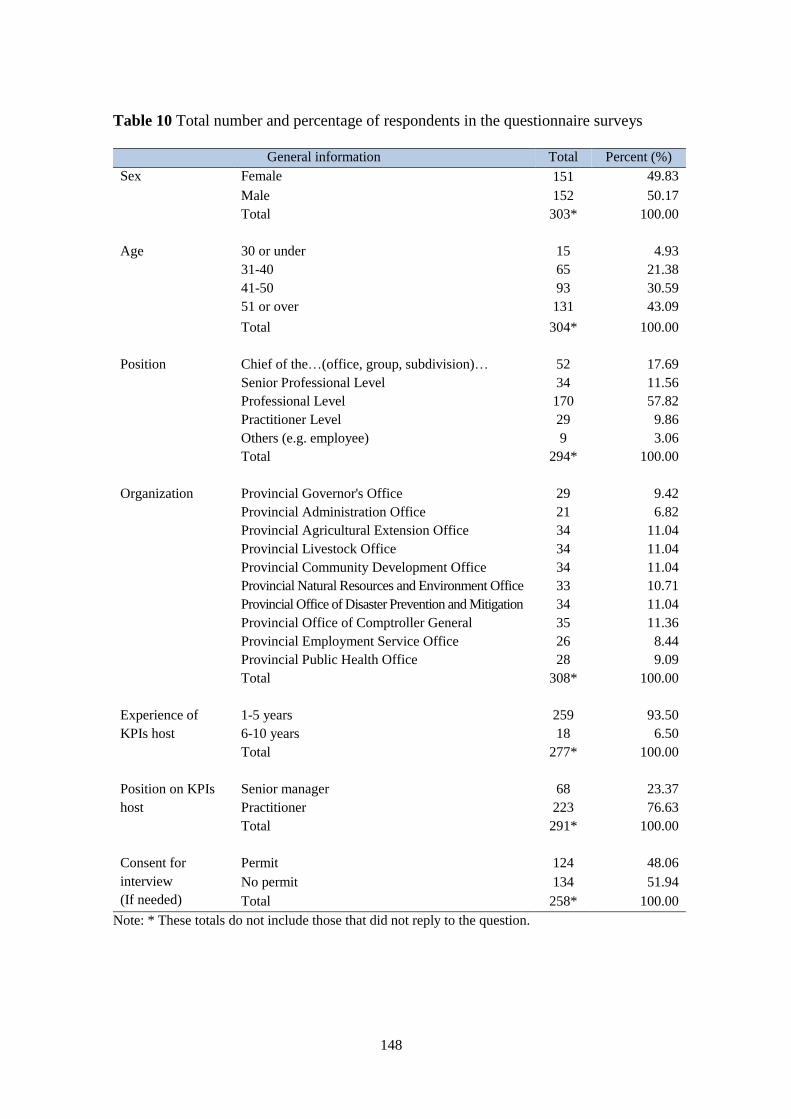
148
Table 10 Total number and percentage of respondents in the questionnaire surveys
General information Total Percent (%)
Sex Female 151 49.83
Male 152 50.17
Total
303* 100.00
Age
30 or under 15 4.93
31-40 65 21.38
41-50 93 30.59
51 or over 131 43.09
Total
304* 100.00
Position
Chief of the…(office, group, subdivision)… 52 17.69
Senior Professional Level 34 11.56
Professional Level 170 57.82
Practitioner Level 29 9.86
Others (e.g. employee) 9 3.06
Total
294* 100.00
Organization Provincial Governor's Office 29 9.42
Provincial Administration Office 21 6.82
Provincial Agricultural Extension Office 34 11.04
Provincial Livestock Office 34 11.04
Provincial Community Development Office 34 11.04
Provincial Natural Resources and Environment Office 33 10.71
Provincial Office of Disaster Prevention and Mitigation 34 11.04
Provincial Office of Comptroller General 35 11.36
Provincial Employment Service Office 26 8.44
Provincial Public Health Office 28 9.09
Total
308* 100.00
Experience of
KPIs host
1-5 years 259 93.50
6-10 years 18 6.50
Total
277* 100.00
Position on KPIs
host
Senior manager 68 23.37
Practitioner 223 76.63
Total
291* 100.00
Consent for
interview
(If needed)
Permit 124 48.06
No permit 134 51.94
Total 258* 100.00
Note: * These totals do not include those that did not reply to the question.
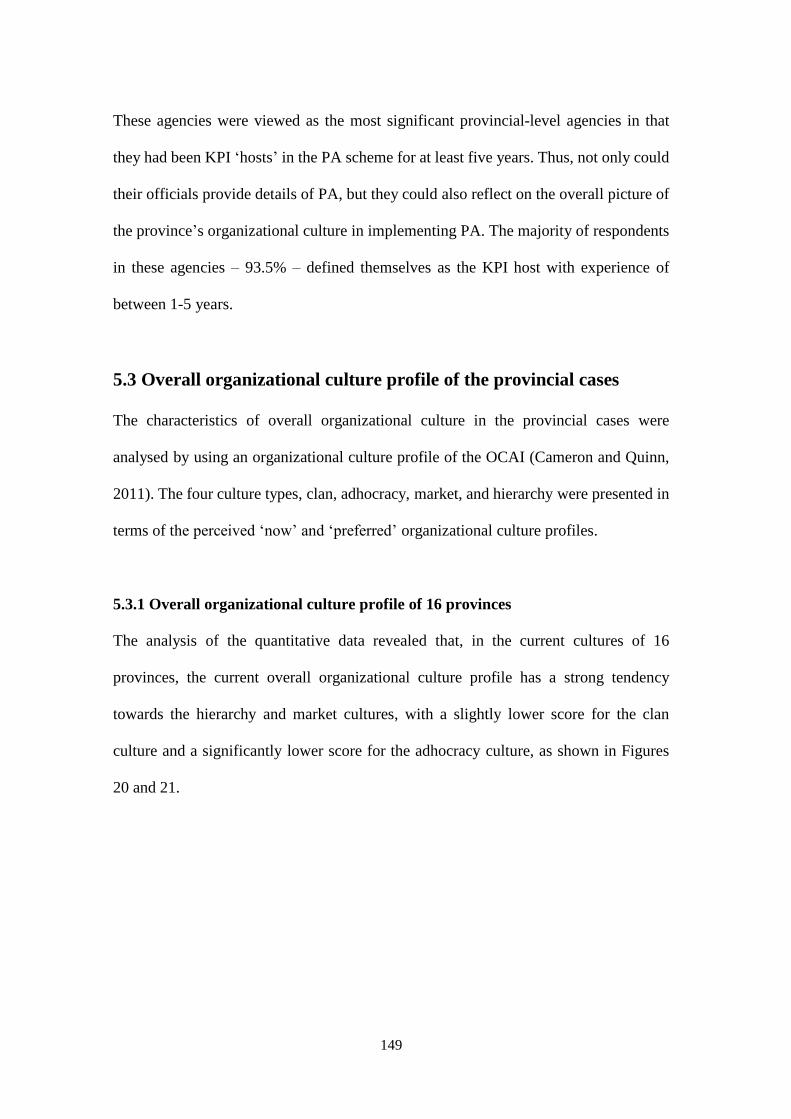
149
These agencies were viewed as the most significant provincial-level agencies in that
they had been KPI ‘hosts’ in the PA scheme for at least five years. Thus, not only could
their officials provide details of PA, but they could also reflect on the overall picture of
the province’s organizational culture in implementing PA. The majority of respondents
in these agencies – 93.5% – defined themselves as the KPI host with experience of
between 1-5 years.
5.3 Overall organizational culture profile of the provincial cases
The characteristics of overall organizational culture in the provincial cases were
analysed by using an organizational culture profile of the OCAI (Cameron and Quinn,
2011). The four culture types, clan, adhocracy, market, and hierarchy were presented in
terms of the perceived ‘now’ and ‘preferred’ organizational culture profiles.
5.3.1 Overall organizational culture profile of 16 provinces
The analysis of the quantitative data revealed that, in the current cultures of 16
provinces, the current overall organizational culture profile has a strong tendency
towards the hierarchy and market cultures, with a slightly lower score for the clan
culture and a significantly lower score for the adhocracy culture, as shown in Figures
20 and 21.
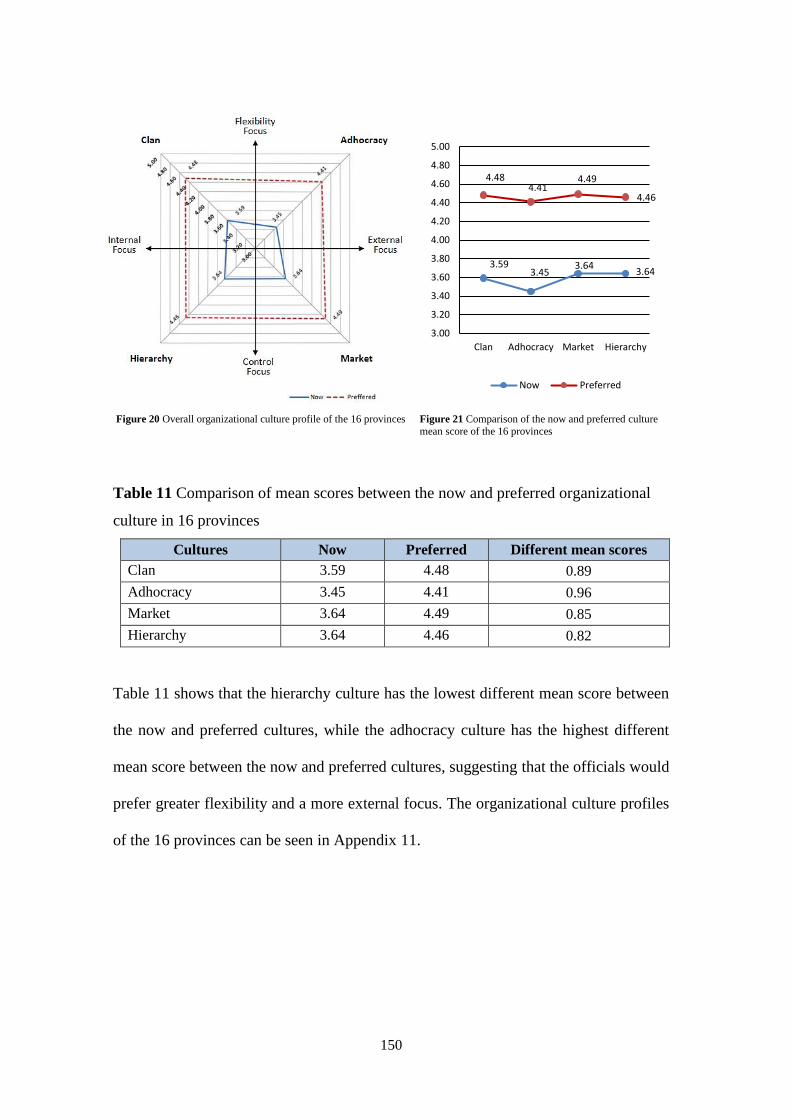
150
Table 11 Comparison of mean scores between the now and preferred organizational
culture in 16 provinces
Cultures Now Preferred Different mean scores
Clan 3.59 4.48 0.89
Adhocracy 3.45 4.41 0.96
Market 3.64 4.49 0.85
Hierarchy 3.64 4.46 0.82
Table 11 shows that the hierarchy culture has the lowest different mean score between
the now and preferred cultures, while the adhocracy culture has the highest different
mean score between the now and preferred cultures, suggesting that the officials would
prefer greater flexibility and a more external focus. The organizational culture profiles
of the 16 provinces can be seen in Appendix 11.
3.593.45
3.643.64
4.484.41
4.49
4.46
3.00
3.20
3.40
3.60
3.80
4.00
4.20
4.40
4.60
4.80
5.00
Clan Adhocracy Market Hierarchy
Now Preferred
Figure 21 Comparison of the now and preferred culture
mean score of the 16 provinces Figure 20 Overall organizational culture profile of the 16 provinces

151
Table 12 Mean scores of now and preferred cultural types in the 16 provinces
No. Province
(Coded)
No. of
questionnaire
Now Preferred
Clan Adhc. Market Hier. Clan Adhc. Market Hier.
1. N1 14 3.74 3.59 3.81 3.74 4.60 4.52 4.60 4.59
2. N2 23 3.35 3.31 3.48 3.40 4.61 4.48 4.58 4.55
3. N3 15 3.84 3.65 3.93 4.01 4.53 4.40 4.52 4.50
4. N4 20 3.50 3.51 3.60 3.65 4.45 4.39 4.41 4.44
5. C1 21 3.56 3.40 3.63 3.67 4.24 4.25 4.31 4.19
6. C2 22 3.42 3.18 3.36 3.45 4.24 4.20 4.31 4.27
7. C3 13 3.79 3.57 3.78 3.76 4.34 4.20 4.31 4.23
8. C4 26 3.66 3.48 3.76 3.74 4.66 4.58 4.60 4.62
9. NE1 19 3.47 3.33 3.47 3.57 4.45 4.41 4.40 4.48
10. NE2 22 3.65 3.47 3.70 3.78 4.60 4.55 4.68 4.62
11. NE3 23 4.02 3.83 4.02 3.98 4.69 4.60 4.70 4.68
12. NE4 11 3.55 3.47 3.62 3.56 4.56 4.44 4.49 4.49
13. S1 19 3.41 3.29 3.43 3.35 4.44 4.40 4.39 4.40
14. S2 20 3.35 3.34 3.46 3.42 4.41 4.35 4.44 4.42
15. S3 24 3.69 3.50 3.72 3.75 4.42 4.40 4.46 4.43
16. S4 16 3.52 3.46 3.61 3.47 4.43 4.31 4.46 4.38
Total 308 3.59 3.45 3.64 3.64 4.48 4.41 4.49 4.46
Note: 1) The 16 provinces were coded (see chapter four for coding explanation).
2) Adhc. means adhocracy and Hier. means hierarchy
Table 12 shows the mean scores of now and preferred organizational culture in the 16
provinces. The provinces of N3 and NE3 present the highest mean score, whilst the
lowest scores are those of provinces N2, C2, NE1, S1, and S2. It is important to note
that C2 did not receive the questionnaire responses from the Provincial Governor’s
Office and S2 is a particular province that is located in a special area marked by
insurgency. Therefore, these may be seen as exceptional compared to other provinces
and they might also have presented problems in terms of getting access to targeted
respondents. Consequently, the provinces N2 and NE1 were selected to represent the
low KPI scoring provinces, whilst N3 and NE3 were selected to represent the high KPI
scoring provinces for the interviews.
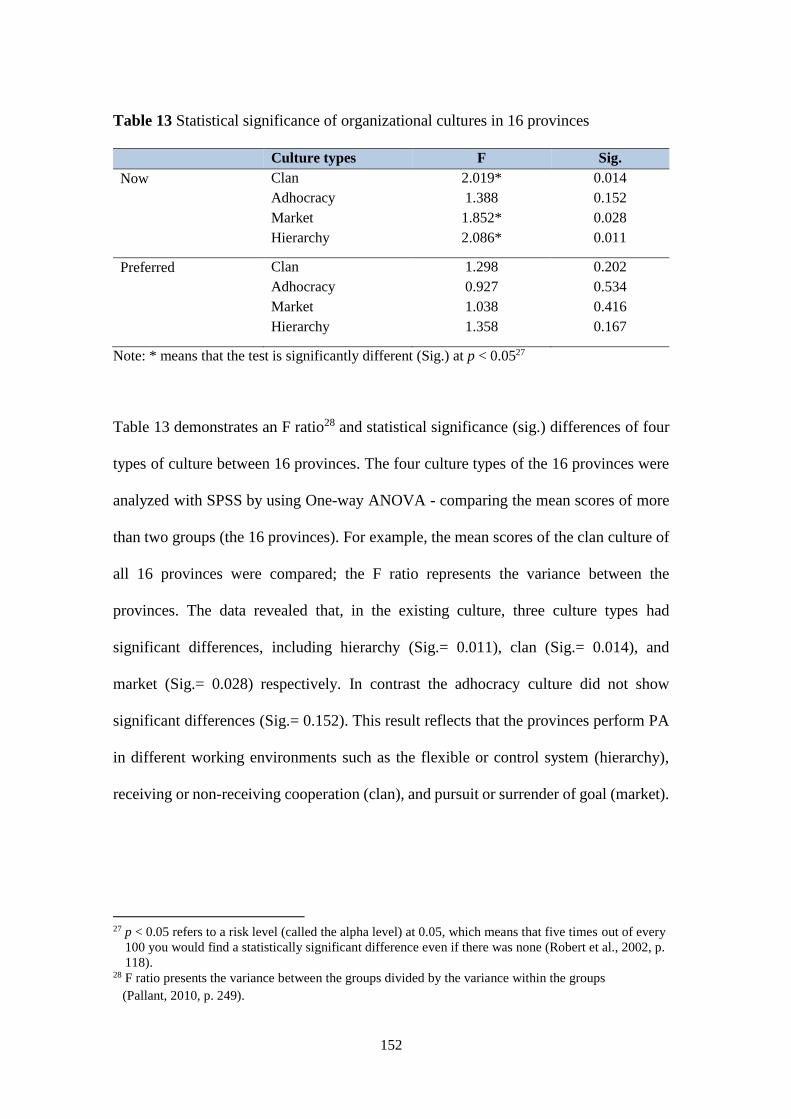
152
Table 13 Statistical significance of organizational cultures in 16 provinces
Culture types F Sig.
Now Clan 2.019* 0.014
Adhocracy 1.388 0.152
Market 1.852* 0.028
Hierarchy 2.086* 0.011
Preferred Clan 1.298 0.202
Adhocracy 0.927 0.534
Market 1.038 0.416
Hierarchy 1.358 0.167
Note: * means that the test is significantly different (Sig.) at p < 0.0527
Table 13 demonstrates an F ratio28 and statistical significance (sig.) differences of four
types of culture between 16 provinces. The four culture types of the 16 provinces were
analyzed with SPSS by using One-way ANOVA - comparing the mean scores of more
than two groups (the 16 provinces). For example, the mean scores of the clan culture of
all 16 provinces were compared; the F ratio represents the variance between the
provinces. The data revealed that, in the existing culture, three culture types had
significant differences, including hierarchy (Sig.= 0.011), clan (Sig.= 0.014), and
market (Sig.= 0.028) respectively. In contrast the adhocracy culture did not show
significant differences (Sig.= 0.152). This result reflects that the provinces perform PA
in different working environments such as the flexible or control system (hierarchy),
receiving or non-receiving cooperation (clan), and pursuit or surrender of goal (market).
27 p < 0.05 refers to a risk level (called the alpha level) at 0.05, which means that five times out of every
100 you would find a statistically significant difference even if there was none (Robert et al., 2002, p.
118). 28 F ratio presents the variance between the groups divided by the variance within the groups
(Pallant, 2010, p. 249).
153
The significant difference of the hierarchy culture between 16 provinces implies that
there are different degrees of flexibility in implementing PA among the provinces. The
significant difference of the clan culture reflects that there are perhaps differences in
some aspects such as cooperation, participation, teamwork, interpersonal relationships,
and horizontal communication.
Regarding the significant differences of the market culture, it seems to be the case that
the provinces have different characteristics, for example competition, orientation of
tasks and goal achievement, and emphasis on reward based accomplishment.
Meanwhile, the adhocracy culture does not vary across provinces, which reflects the
degree to which the provinces tend to focus on internal orientation rather than external
orientation. This may derive from the influence of the hierarchy culture that tends to
create a structured environment, such as detailed instructions and close supervision.
Consequently, the subordinates are likely to have working limitations such as on making
their own decisions and generating their ideas, including having no resistance for
change. In terms of the preferred organizational culture, it was found that all four
culture types were not statistically significant, namely hierarchy (Sig.= 0.167), clan
(Sig.= 0.202), market (Sig.= 0.416), and adhocracy (Sig.= 0.534).
5.3.2 Organizational culture profile of senior managers and practitioners
The overall organizational culture profiles, the current and preferred cultures, of the senior
managers and practitioners in the 16 provinces are shown in Figures 22 and 23. The senior
managers and practitioners tend to perform based on control focus in both orientations,
namely internal focus (hierarchy culture) and external focus (market culture). This implies

154
that the officials have slightly shifted their culture from the hierarchy culture to the market
culture, although the hierarchy culture is still embedded in the public sector. In other words,
the market culture can be created in the context of PA.
Table 14 shows the different organizational culture between the senior managers and
practitioners in the now and preferred cultures. The four culture types of both senior
managers and practitioners in the 16 provinces were analyzed with SPSS by using
Independent-Samples t-Test - comparing the mean scores between two different groups
(senior managers and practitioners). For example, the mean scores of the clan culture of
the senior managers and of the practitioners in the 16 provinces were compared; the t-
value represents the variance between the senior managers and practitioners. The mean
scores of the now and preferred cultures of the senior managers were higher than for the
practitioners in all four types of culture. The hierarchy culture is the most different in
the now culture. This implies that the senior managers emphasised a control focus such as
policy, regulation, and monitoring the progress of tasks, to a greater extent than did the
Figure 23 Overall organizational culture profile
of the practitioners in the 16 provinces
Figure 22 Overall organizational culture profile
of the senior managers in the 16 provinces

155
practitioners. Regarding the statistically significant differences of the existing and
preferred cultures between the senior managers and practitioners in the 16 provinces,
the data revealed that only the hierarchy culture had a significant difference (Sig.= 0.028),
while the other culture types – market (Sig.= 0.071), adhocracy (Sig.= 0.108), and clan
(Sig.= 0.126) – were not significant.
Table 14 Comparison organizational culture between the senior managers and
practitioners in 16 provinces
Cultures Senior
managers Practitioners
Different t Sig.
(2-tailed) mean scores
Now Clan 3.68 3.55 0.13 1.534 0.126
Adhocracy 3.55 3.41 0.14 1.611 0.108
Market 3.76 3.60 0.16 1.611 0.071
Hierarchy 3.78 3.59 0.19 2.203* 0.028
Preferred Clan 4.62 4.44 0.18 2.297* 0.022
Adhocracy 4.54 4.36 0.18 2.729* 0.007
Market 4.61 4.44 0.17 2.834* 0.005
Hierarchy 4.59 4.42 0.17 2.778* 0.006
Note: * means that the test is significantly different (Sig.) at p < 0.05
The officials in higher positions (senior managers) – mostly older people – tend to
support a more bureaucratic culture than other officials (practitioners) – younger people
(see section 5.3.3 where this is discussed in detail). In the preferred cultures,
it was revealed that all four culture types were significantly different – adhocracy
(Sig.= 0.007), hierarchy (Sig.= 0.006), market (Sig.= 0.005), and clan (Sig.= 0.022)
respectively. It is possible that there are different desires for change in the working
environment, such as practitioners may prefer more flexibility while senior managers
may require monitoring of progress.

156
The comparison of organizational culture profiles between the senior managers and
practitioners revealed that the mean scores of four culture types of the senior managers
were higher than those of the practitioners in both the current and preferred cultures.
Figures 24 and 25 reveal that, in the current culture, the hierarchy culture had the biggest
difference between the senior managers and practitioners. This implies that the senior
managers were more likely to focus on control systems involving giving commands and
requiring monitoring of progress; in contrast the practitioners were more likely to focus
on greater flexibility.
3.68
3.55
3.76 3.78
3.55
3.41
3.60
3.59
3.10
3.20
3.30
3.40
3.50
3.60
3.70
3.80
3.90
4.00
Clan Adhocracy Market Hierarchy
Senior manager Practitioner
4.62
4.54
4.614.59
4.44
4.36
4.44
4.42
4.20
4.25
4.30
4.35
4.40
4.45
4.50
4.55
4.60
4.65
4.70
Clan Adhocracy Market Hierarchy
Senior manager Practitioner
Figure 24
Figure 26
Figure 27 Comparison of the current culture profiles of
the senior managers and practitioners in the 16 provinces
Figure 25
Figure 24 Comparison of the current culture profiles of
the senior managers and practitioners in the 16 provinces Figure 25 Comparison of the current culture mean scores of
the senior managers and practitioners in the 16 provinces
Figure 26 Comparison of the preferred culture profiles of
the senior managers and practitioners in the 16 provinces
Figure 27 Comparison of the preferred mean scores of
the senior managers and practitioners in the 16 provinces
157
In the preferred culture, the clan and market cultures are not greatly different between
both groups as shown in Figures 26 and 27. Furthermore, the adhocracy culture, in the
preferred culture, showed the highest difference between both groups (see Figures 26
and 27), which is consistent with the statistical significant differences in Table 14.
5.3.3 Organizational culture profiles by sex, age and organizations
This section reports the organizational culture profiles by comparison of sex, age and
organizations. As a consequence, the section is divided into three topics. The detail of
sex, age and organizations are demonstrated earlier in Table 10.
Comparison of organizational culture profiles by sex
The comparison of the organizational culture profiles revealed that males have higher
mean scores than females in four culture types in both the current and preferred cultures,
as shown in Figures 28 and 29. In particular, the hierarchy culture, in the current culture,
was the only culture type that has significant differences between male and female
(Sig.= 0.0382) as demonstrated in Table 15. This implies that male officials tend to focus
on control orientation (e.g. policy, regulation, seniority and command) more so than
female officials. Here we should note that the senior managers tended to be older men,
who might be expected to adhere to a bureaucratic culture. Regarding the preferred
culture, it was found that the clan and market cultures had the highest mean scores in
both the male and female groups (see Figure 29).
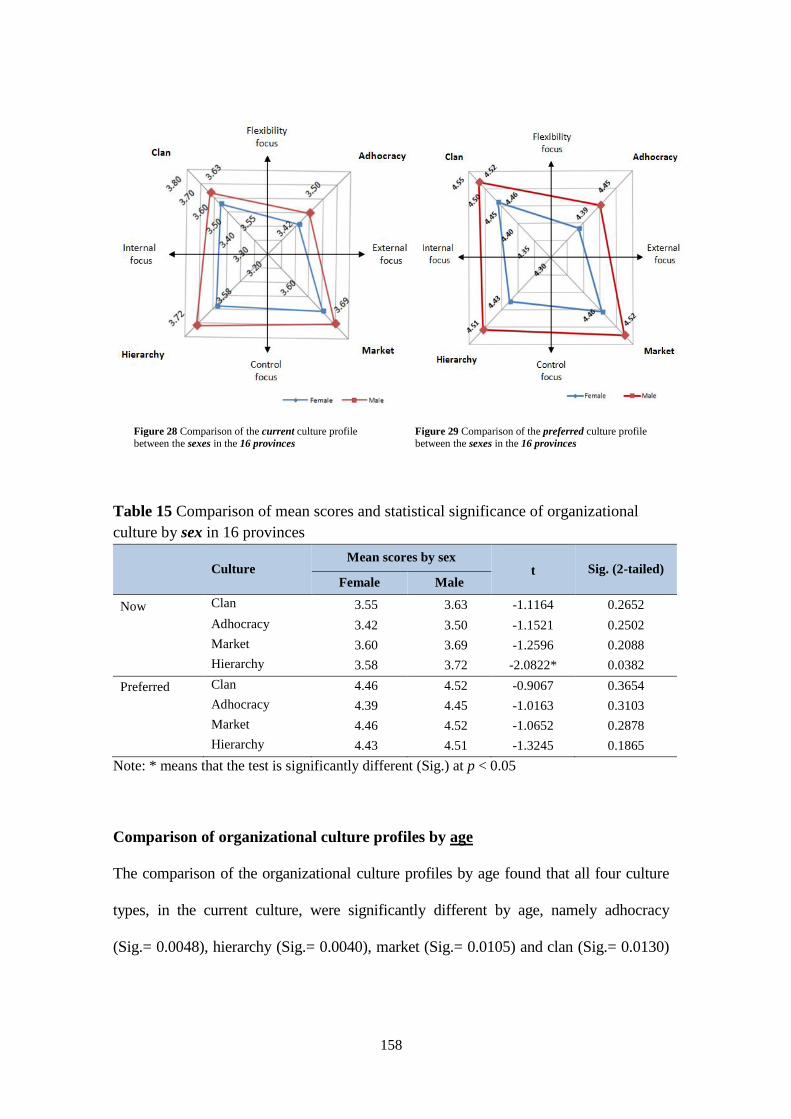
158
Table 15 Comparison of mean scores and statistical significance of organizational
culture by sex in 16 provinces
Culture Mean scores by sex
t Sig. (2-tailed) Female Male
Now Clan 3.55 3.63 -1.1164 0.2652
Adhocracy 3.42 3.50 -1.1521 0.2502
Market 3.60 3.69 -1.2596 0.2088
Hierarchy 3.58 3.72 -2.0822* 0.0382
Preferred Clan 4.46 4.52 -0.9067 0.3654
Adhocracy 4.39 4.45 -1.0163 0.3103
Market 4.46 4.52 -1.0652 0.2878
Hierarchy 4.43 4.51 -1.3245 0.1865
Note: * means that the test is significantly different (Sig.) at p < 0.05
Comparison of organizational culture profiles by age
The comparison of the organizational culture profiles by age found that all four culture
types, in the current culture, were significantly different by age, namely adhocracy
(Sig.= 0.0048), hierarchy (Sig.= 0.0040), market (Sig.= 0.0105) and clan (Sig.= 0.0130)
Figure 29 Comparison of the preferred culture profile between the sexes in the 16 provinces
Figure 28 Comparison of the current culture profile
between the sexes in the 16 provinces

159
respectively (see Table 16). On the contrary, the four culture types in the preferred
culture were not significantly different between the ages.
Table 16 Comparison of mean scores and statistical significance of organizational
culture by age in 16 provinces
Culture 30 or under 31-40 41-50 51 or
over F Sig.
Now Clan 3.42 3.42 3.57 3.71 3.6526* 0.0130
Adhocracy 3.31 3.27 3.42 3.58 4.3937* 0.0048
Market 3.56 3.48 3.60 3.77 3.8096* 0.0105
Hierarchy 3.45 3.46 3.63 3.77 4.5249* 0.0040
Preferred Clan 4.46 4.42 4.48 4.53 0.5145 0.6726
Adhocracy 4.36 4.35 4.39 4.47 0.7837 0.5038
Market 4.45 4.43 4.49 4.52 0.4112 0.7451
Hierarchy 4.44 4.40 4.46 4.50 0.6100 0.6090
Note: * means that the test is significantly different (Sig.) at p < 0.05
Table 17 Comparison of organizational culture between the ages by Multiple Comparisons test
Culture Age 30 or under 31-40 41-50 51 or over
Clan 30 or under - - 0.00513 - 0.15238 - 0.28870
31-40 0.00513 - - 0.14725 - 0.28357*
41-50 0.14725 - - 0.13631
51 or over 0.13631 -
Adhocracy 30 or under - 0.10814 - 0.26914
31-40
- 0.15430 - 0.31529*
41-50 - -0.16100
51 or over -
Market 30 or under
- 0.21236
31-40
- 0.29734*
41-50
- 0.17672*
51 or over -
Hierarchy 30 or under
- 0.32337
31-40
- 0.31385*
41-50
-0.14119
51 or over -
Note: (1) The results in Table 18 are based on the current culture analysed
(2) * refers to the pairwise test at p = 0.05

160
This reflects that the officials in the different age ranges tend to operate in different
culture styles when implementing PA. This was emphasized by the SPSS analysis,
multiple comparison test as shown in Table 17. It revealed that there were differences
in all the culture types between officials in the older generation – age 51 years old or
over – and the younger generation – between age of 31-40 years old. In particular, the
market culture was different between the age of 51 or over and the two age ranges – 31-
40 and 41-50.
Comparison of organizational culture profiles by organizations
The comparison of organizational culture at the organizational level revealed an
interesting finding, which was that only the clan culture showed significant differences
in the current culture as shown in Table 18. On the other hand, all four culture types in
the preferred culture were significantly different, namely clan (Sig.= 0.0019), market
(Sig.= 0.0047), adhocracy (Sig.= 0.0056) and hierarchy (Sig.= 0.005) respectively.
Table 18 Statistical significance of organizational culture between 10 organizations
in 16 provinces
Culture F Sig.
Now Clan 1.960* 0.0437
Adhocracy 1.776 0.0722
Market 1.124 0.3456
Hierarchy 1.018 0.4257
Preferred Clan 3.001 0.0019
Adhocracy 2.658 0.0056
Market 2.715 0.0047
Hierarchy 2.697 0.0050
Note: * means that the test is significantly different (Sig.) at p < 0.05

161
In terms of the mean scores seen in Table 19, the differences of the clan culture between
10 provincial agencies reflect that factors such as commitment, participation, and
teamwork are different in each organization. This may be a crucial element leading to
different results of PA in each level of agency and the overall result of a province, as
well as the attainment of delivering good governance.
Table 19 Comparison of mean scores of organizational culture by organizations in 16
provinces
Organizations Now Preferred
Clan Adhc. Market Hier. Clan Adhc. Market Hier.
1. Provincial
Governor's Office 3.52 3.40 3.65 3.67 4.59 4.51 4.63 4.55
2. Provincial
Administration
Office
3.38 3.24 3.46 3.55 4.09 4.05 4.10 4.10
3. Provincial
Agricultural
Extension Office
3.62 3.39 3.65 3.72 4.55 4.39 4.56 4.55
4. Provincial
Livestock Office 3.61 3.45 3.70 3.65 4.26 4.16 4.29 4.27
5. Provincial
Community
Development
Office
3.85 3.68 3.78 3.78 4.68 4.60 4.63 4.60
6. Provincial Natural
Resources and
Environment Office
3.50 3.37 3.51 3.57 4.47 4.43 4.47 4.48
7. Provincial Office
of Disaster
Prevention and
Mitigation
3.61 3.58 3.75 3.74 4.55 4.56 4.60 4.63
8. Provincial Office
of Comptroller
General
3.63 3.44 3.64 3.66 4.62 4.50 4.60 4.56
9. Provincial
Employment
Service Office
3.75 3.65 3.78 3.64 4.41 4.38 4.37 4.35
10. Provincial Public
Health Office 3.32 3.26 3.45 3.38 4.46 4.41 4.46 4.36
Note: Adhc. means adhocracy and Hier. means hierarchy

162
5.4 Comparison of organizational culture profiles between the low
and high KPI scoring provinces
5.4.1 Comparison of organizational culture profiles between the low and high
KPI scoring provinces
The comparison of the organizational culture profiles between the low and high KPI
scoring provinces revealed that the mean scores of four culture types of the high KPI
scoring provinces were all higher than those the low KPI scoring provinces, as shown
in Figures 30 and 31.
Figure 30 demonstrates that the market and clan cultures had the most different mean
scores of the current culture between the low and high KPI scoring provinces. This can
also be seen in Table 20. Meanwhile, in the preferred culture, the clan culture has the
lowest different mean scores between both provincial groups (see Figure 31). This
implies that the market and clan cultures are the most significant factors for achievement
in PA recognized by the officials. This finding was emphasized by the SPSS analysis
Figure 30 Comparison of the preferred culture profiles
between the low and high KPI scoring provinces
Figure 31 Comparison of the current culture profiles
between the low and high KPI scoring provinces Figure 30 Comparison of the current culture profiles between
the low and high KPI scoring provinces
Figure 31 Comparison of the preferred culture profiles
between the low and high KPI scoring provinces

163
that four culture types, in the current culture, had statistically significant differences,
particularly the clan and market cultures as shown in Table 21.
Table 20 Comparison of mean scores of organizational cultures between the low and
high KPI scoring provinces
Culture types Low
scoring provinces
High
scoring provinces
Different
mean
scores
Now Clan 3.48 3.71 0.23
Adhocracy 3.35 3.56 0.21
Market 3.53 3.77 0.24
Hierarchy 3.54 3.75 0.21
Preferred Clan 4.45 4.52 0.07
Adhocracy 4.39 4.44 0.05
Market 4.46 4.51 0.05
Hierarchy 4.43 4.49 0.06
Table 21 Statistical significance of organizational cultures between the low and high
KPI scoring provinces
Culture types t Sig. (2-tailed)
Now Clan -3.220* 0.001
Adhocracy -3.046* 0.003
Market -3.382* 0.001
Hierarchy -3.063* 0.002
Preferred Clan -1.243 0.215
Adhocracy -0.749 0.454
Market -0.818 0.414
Hierarchy -0.893 0.373
Note: * means that the test is significantly different (Sig.) at p < 0.05
Table 21 demonstrates that all types of culture in the current culture were significantly
different, namely market and clan (Sig.= 0.001), hierarchy (Sig.= 0.002) and adhocracy
(Sig.= 0.003) respectively. This reflects that there are statistically significant differences
of organizational culture between the low and high KPI scoring provinces, especially
164
the clan and market cultures. This suggests that performance rests on a combination of
hard and soft factors. Market culture alone cannot deliver performance, it also needs
elements of clan culture. Regarding preferred culture, the survey revealed that there
were not significant differences between the low and high KPI scoring provinces. This
suggests that it is not that there are differences in values between the high and low
scoring provinces, but differences in their ability to put those values into practice,
suggesting differences in management rather than in the underlying cultural profile.
5.4.2 Comparison of organizational culture profiles between senior managers in
the low and high KPI scoring provinces
According to the comparison of the existing cultures between the senior managers in the
low and high KPI scoring provinces, it was found that the high KPI scoring provinces
had higher mean scores in all culture types than the low KPI scoring provinces. The
hierarchy and market cultures had the highest mean scores, whilst the adhocracy culture
had the lowest mean scores in both provincial groups as shown in Figures 32 and 33.
This implies that the senior managers in both provincial groups implement their work
in orientation of control focus, in which internal (hierarchy) and external (market)
focuses are emphasized. In this respect, it reflects that the different degrees of the
hierarchy and market cultures emphasized by the senior managers may contribute to
different results of PA at the levels of agency and province. It is important to note that
a high degree of hierarchy does not mean a negative impact on performance because it
depends on how the senior managers use their authority, as this might either enable or
inhibit performance.

165
The comparison of the preferred culture between the senior managers in both provincial
groups, as shown in Figures 34 and 35 revealed that the clan and market cultures of the
high KPI scoring provinces were higher than the hierarchy and adhocracy cultures,
whilst their adhocracy and hierarchy cultures were lower than low KPI scoring
provinces. This implies that the senior managers in the high KPI scoring provinces
4.594.55
4.59
4.594.65
4.53
4.64
4.58
4.20
4.30
4.40
4.50
4.60
4.70
4.80
Clan Adhocracy Market Hierarchy
Low High
3.57
3.45
3.63
3.68
3.82
3.67
3.92 3.91
3.10
3.20
3.30
3.40
3.50
3.60
3.70
3.80
3.90
4.00
Clan Adhocracy Market Hierarchy
Low High
Figure 32
Figure 34 Comparison of the preferred culture mean scores of
the senior managers in the low and high KPI scoring provinces
Figure 33
Figure 35 Comparison between the preferred cultural profiles of the senior managers in the low and high KPI
scoring provinces
Figure 32 Comparison between the current cultural profiles of
the senior managers in the low and high KPI scoring provinces
Figure 33 Comparison of the current culture mean scores of
the senior managers in the low and high KPI scoring provinces
Figure 34 Comparison between the preferred cultural profiles of
the senior managers in the low and high KPI scoring provinces
Figure 35 Comparison of the preferred culture mean scores of
the senior managers in the low and high KPI scoring provinces
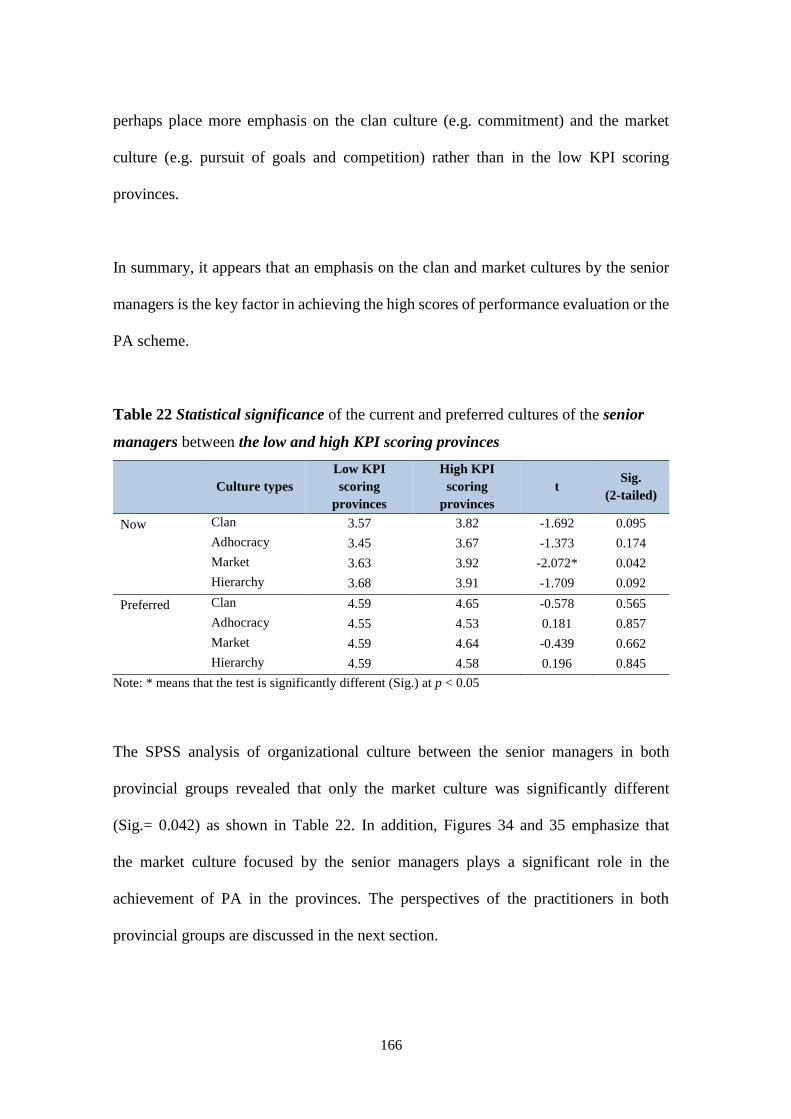
166
perhaps place more emphasis on the clan culture (e.g. commitment) and the market
culture (e.g. pursuit of goals and competition) rather than in the low KPI scoring
provinces.
In summary, it appears that an emphasis on the clan and market cultures by the senior
managers is the key factor in achieving the high scores of performance evaluation or the
PA scheme.
Table 22 Statistical significance of the current and preferred cultures of the senior
managers between the low and high KPI scoring provinces
Culture types
Low KPI
scoring
provinces
High KPI
scoring
provinces
t Sig.
(2-tailed)
Now Clan 3.57 3.82 -1.692 0.095
Adhocracy 3.45 3.67 -1.373 0.174
Market 3.63 3.92 -2.072* 0.042
Hierarchy 3.68 3.91 -1.709 0.092
Preferred Clan 4.59 4.65 -0.578 0.565
Adhocracy 4.55 4.53 0.181 0.857
Market 4.59 4.64 -0.439 0.662
Hierarchy 4.59 4.58 0.196 0.845
Note: * means that the test is significantly different (Sig.) at p < 0.05
The SPSS analysis of organizational culture between the senior managers in both
provincial groups revealed that only the market culture was significantly different
(Sig.= 0.042) as shown in Table 22. In addition, Figures 34 and 35 emphasize that
the market culture focused by the senior managers plays a significant role in the
achievement of PA in the provinces. The perspectives of the practitioners in both
provincial groups are discussed in the next section.
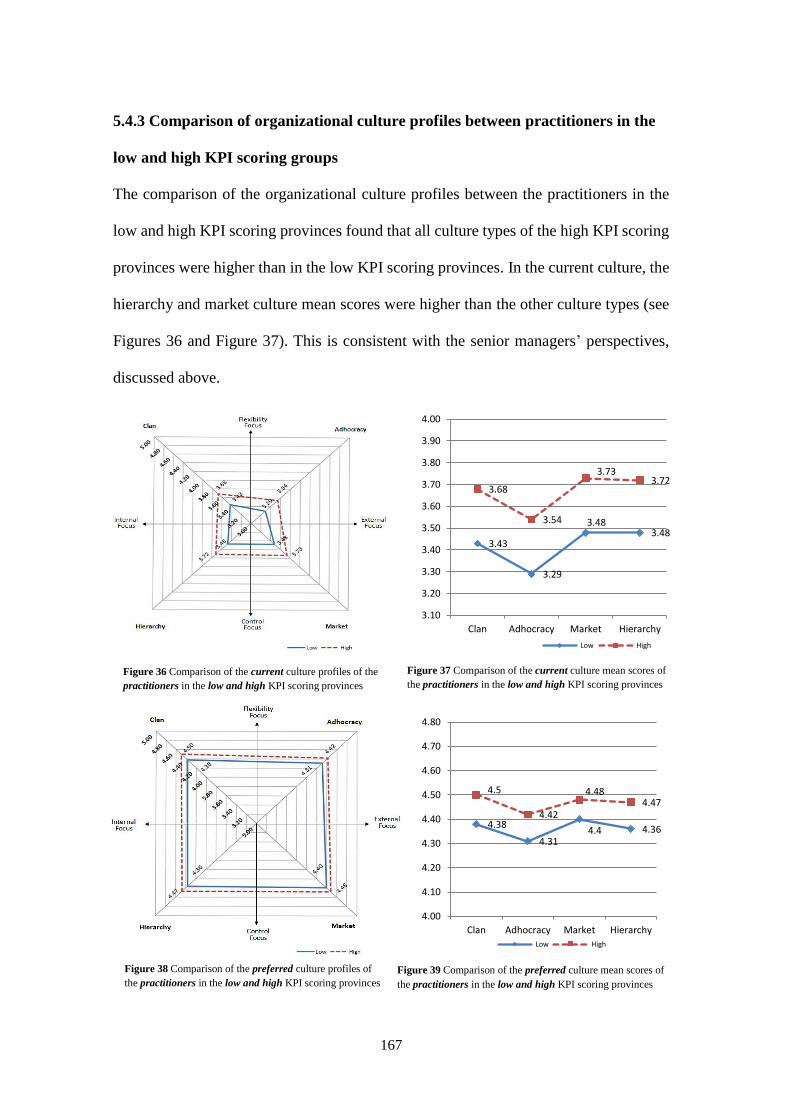
167
5.4.3 Comparison of organizational culture profiles between practitioners in the
low and high KPI scoring groups
The comparison of the organizational culture profiles between the practitioners in the
low and high KPI scoring provinces found that all culture types of the high KPI scoring
provinces were higher than in the low KPI scoring provinces. In the current culture, the
hierarchy and market culture mean scores were higher than the other culture types (see
Figures 36 and Figure 37). This is consistent with the senior managers’ perspectives,
discussed above.
3.43
3.29
3.483.48
3.68
3.54
3.733.72
3.10
3.20
3.30
3.40
3.50
3.60
3.70
3.80
3.90
4.00
Clan Adhocracy Market Hierarchy
Low High
4.38
4.314.4 4.36
4.5
4.42
4.484.47
4.00
4.10
4.20
4.30
4.40
4.50
4.60
4.70
4.80
Clan Adhocracy Market Hierarchy
Low High
Figure 37 Comparison of the preferred culture profiles of
the practitioners in the low and high KPI scoring provinces
Figure 39 Comparison of the current culture profiles of the
practitioners in the low and high KPI scoring provinces
Figure 38 Comparison of the current culture mean scores of
the practitioners in the low and high KPI scoring provinces
Figure 36 Comparison of the preferred mean scores of the
practitioners in the low and high KPI scoring provinces
Figure 36 Comparison of the current culture profiles of the
practitioners in the low and high KPI scoring provinces
Figure 37 Comparison of the current culture mean scores of
the practitioners in the low and high KPI scoring provinces
provinces
Figure 38 Comparison of the preferred culture profiles of
the practitioners in the low and high KPI scoring provinces
provinces
Figure 39 Comparison of the preferred culture mean scores of
the practitioners in the low and high KPI scoring provinces

168
Regarding the preferred culture, it was found that the organizational culture profiles of
the practitioners in both provincial groups hardly differed from each other. They appear
to perform their work with an internal and control system orientation (see Figure 38), in
which the clan and market cultures had the highest mean scores (see Figure 39). The
practitioners in the high KPI scoring provinces appear to work based on the clan culture
and the market culture. In particular, the clan culture shows the most different score
(0.12) between the low and high KPI scoring provinces, whilst the market culture has
not much different score (0.08).
Table 23 Statistical significance of the current and preferred cultures of the practitioners
between the low and high KPI scoring provinces
Culture types Low
scoring group
High
scoring group t
Sig.
(2-tailed)
Now Clan 3.43 3.68 -3.067* 0.002
Adhocracy 3.29 3.54 -3.055* 0.003
Market 3.48 3.73 -3.087* 0.002
Hierarchy 3.48 3.72 -2.922* 0.004
Preferred Clan 4.38 4.50 -1.558 0.121
Adhocracy 4.31 4.42 -1.340 0.182
Market 4.40 4.48 -1.089 0.277
Hierarchy 4.36 4.47 -1.381 0.169
Note: * means that the test is significantly different (Sig.) at p < 0.05
Table 23 shows that all four culture types in the current culture were significantly
different between the practitioners in the two provincial groups, in which the clan and
market culture were the same and had the highest values of Sig. 0.002. On the other
hand, all four culture types in the preferred culture were not significantly different. This
implies that the practitioners in the high KPI scoring group employ greater cooperation,
participation, and team work (clan), as well as have a greater goal achievement and
competition (market).
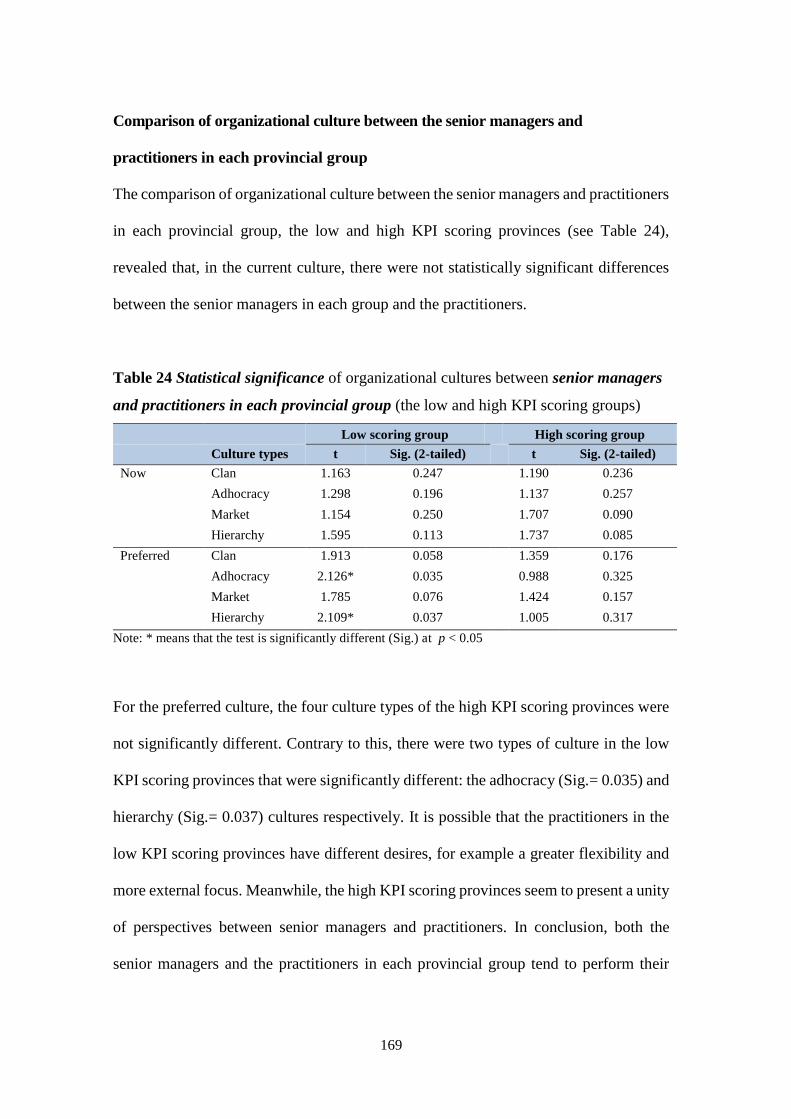
169
Comparison of organizational culture between the senior managers and
practitioners in each provincial group
The comparison of organizational culture between the senior managers and practitioners
in each provincial group, the low and high KPI scoring provinces (see Table 24),
revealed that, in the current culture, there were not statistically significant differences
between the senior managers in each group and the practitioners.
Table 24 Statistical significance of organizational cultures between senior managers
and practitioners in each provincial group (the low and high KPI scoring groups)
Low scoring group High scoring group
Culture types t Sig. (2-tailed) t Sig. (2-tailed)
Now
Clan 1.163 0.247
1.190 0.236
Adhocracy 1.298 0.196
1.137 0.257
Market 1.154 0.250
1.707 0.090
Hierarchy 1.595 0.113
1.737 0.085
Preferred
Clan 1.913 0.058
1.359 0.176
Adhocracy 2.126* 0.035
0.988 0.325
Market 1.785 0.076
1.424 0.157
Hierarchy 2.109* 0.037
1.005 0.317
Note: * means that the test is significantly different (Sig.) at p < 0.05
For the preferred culture, the four culture types of the high KPI scoring provinces were
not significantly different. Contrary to this, there were two types of culture in the low
KPI scoring provinces that were significantly different: the adhocracy (Sig.= 0.035) and
hierarchy (Sig.= 0.037) cultures respectively. It is possible that the practitioners in the
low KPI scoring provinces have different desires, for example a greater flexibility and
more external focus. Meanwhile, the high KPI scoring provinces seem to present a unity
of perspectives between senior managers and practitioners. In conclusion, both the
senior managers and the practitioners in each provincial group tend to perform their

170
work in similar cultures to each other. In other words, the cultural differences between
occupational groups within provinces are less significant than the differences between
the organizational cultures of the different provinces.
5.5 Description of job satisfaction based on the provincial cases
The assessment of job satisfaction, the second part of the questionnaire survey, consists
of 10 questions with a five-point Likert scale – ratings from strongly disagree (1) to
strongly agree (5). This part reports overall job satisfaction and the comparison between
the low and high KPI scoring provinces in terms of the senior managers and
practitioners.
5.5.1 Overall job satisfaction in 16 provinces
From the SPSS analysis, it was found that the overall job satisfaction of the provincial
cases was categorized at the level of ‘Agree’ – a mean score between 3.63 and 4.19 (see
Table 25). This implies that the officials at the provincial administration level are
relatively satisfied with their job in the context of PA and that they are able to express
their views on issues affecting their work.

171
Table 25 Overall job satisfaction in 16 provinces
Questions Mean Level of
satisfaction
1. You feel committed to the organization and its work, you
are not just working for the money. 4.19
Agree
2. Your job gives you the freedom to choose your own
method of working. 3.82
Agree
3. You get a feeling of accomplishment from the work you
are doing. 3.98
Agree
4. The amount of responsibility given you is not excessive. 3.63 Agree
5. What you are doing well in the job receives recognition. 3.89 Agree
6. Your supervisor supports your career development. 3.89 Agree
7. You get the attention paid to suggestions you make from
your supervisor. 3.94
Agree
8. You get on well with colleagues. 4.07 Agree
9. You have no concerns about the style of management. 3.73 Agree
10. The pursuit of organizational targets does not put you
under excessive pressure. 3.82
Agree
Note: Level of job satisfaction
5 Strongly agree 4.21 - 5.00 2 Disagree 1.81 - 2.60
4 Agree 3.41 - 4.20 1 Strongly disagree 1.00 - 1.80
3 Neither agree nor disagree 2.61 - 3.40
Comparing the job satisfaction between the senior managers and practitioners in 16
provinces, it was found that the mean scores acquired from the senior managers were
higher than from the practitioners for all questions (see Table 26). There were two
questions, however, that showed significant differences: question 2 (Sig.= 0.042) and
question 9 (Sig.= 0.047). The scores for question 2 – ‘Your job gives you the freedom
to choose your own method of working’ – reflects that the officials, especially the
practitioners, tend to work in a structured or controlled environment, for example with
low flexibility and limited creative possibilities. In other words, they are likely to work
in a high hierarchy model/low adhocracy model. Meanwhile, the scores for question 9
–‘You have no concerns about the style of management’– implies that the officials,
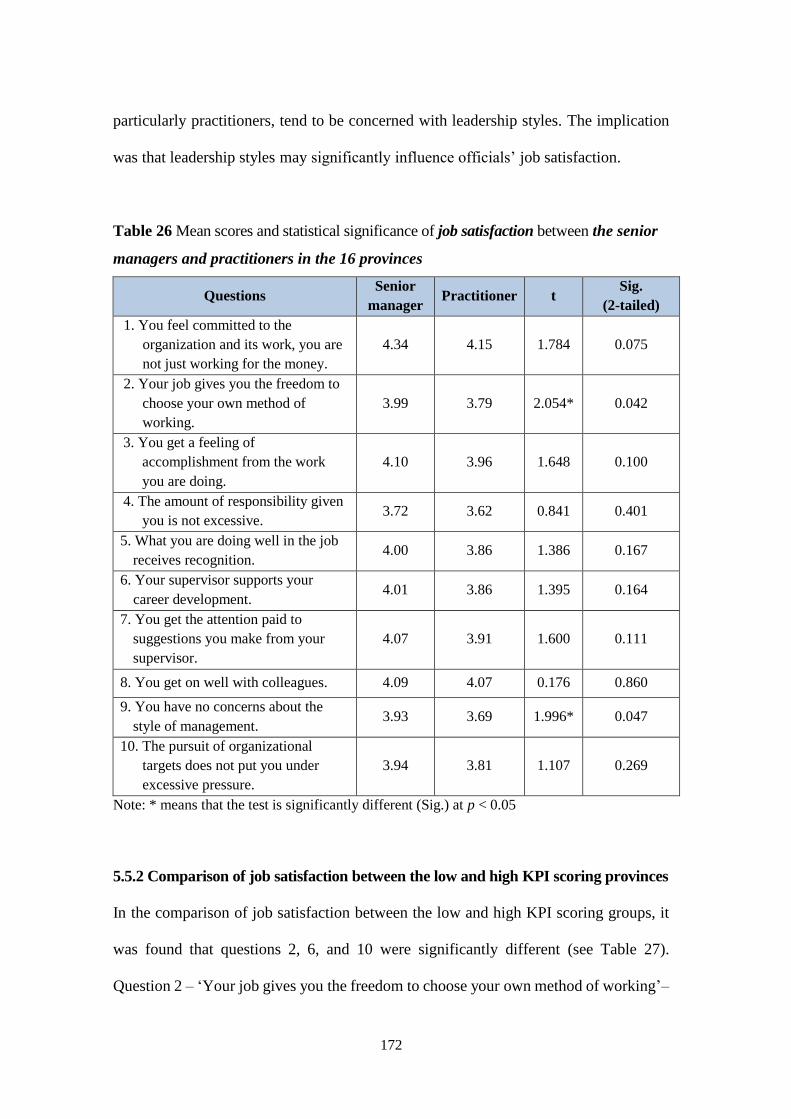
172
particularly practitioners, tend to be concerned with leadership styles. The implication
was that leadership styles may significantly influence officials’ job satisfaction.
Table 26 Mean scores and statistical significance of job satisfaction between the senior
managers and practitioners in the 16 provinces
Questions Senior
manager Practitioner t
Sig.
(2-tailed)
1. You feel committed to the
organization and its work, you are
not just working for the money.
4.34 4.15 1.784 0.075
2. Your job gives you the freedom to
choose your own method of
working.
3.99 3.79 2.054* 0.042
3. You get a feeling of
accomplishment from the work
you are doing.
4.10 3.96 1.648 0.100
4. The amount of responsibility given
you is not excessive. 3.72 3.62 0.841 0.401
5. What you are doing well in the job
receives recognition. 4.00 3.86 1.386 0.167
6. Your supervisor supports your
career development. 4.01 3.86 1.395 0.164
7. You get the attention paid to
suggestions you make from your
supervisor.
4.07 3.91 1.600 0.111
8. You get on well with colleagues. 4.09 4.07 0.176 0.860
9. You have no concerns about the
style of management. 3.93 3.69 1.996* 0.047
10. The pursuit of organizational
targets does not put you under
excessive pressure.
3.94 3.81 1.107 0.269
Note: * means that the test is significantly different (Sig.) at p < 0.05
5.5.2 Comparison of job satisfaction between the low and high KPI scoring provinces
In the comparison of job satisfaction between the low and high KPI scoring groups, it
was found that questions 2, 6, and 10 were significantly different (see Table 27).
Question 2 – ‘Your job gives you the freedom to choose your own method of working’–
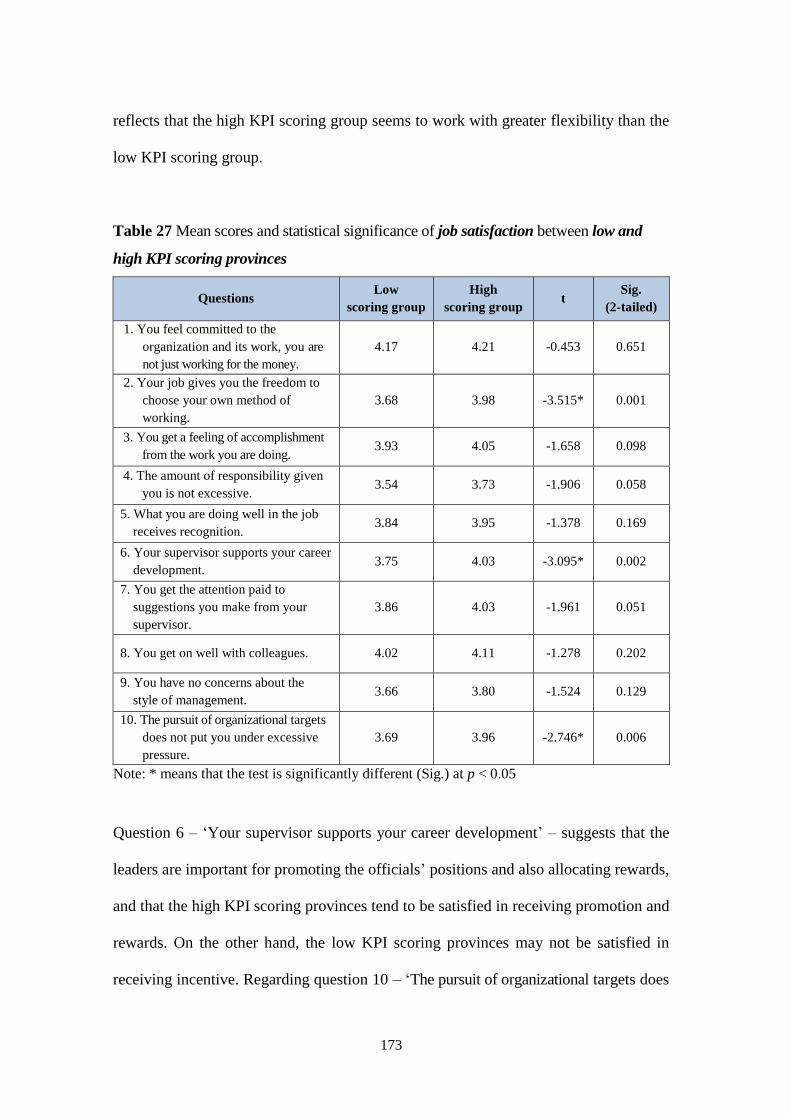
173
reflects that the high KPI scoring group seems to work with greater flexibility than the
low KPI scoring group.
Table 27 Mean scores and statistical significance of job satisfaction between low and
high KPI scoring provinces
Questions Low
scoring group
High
scoring group t
Sig.
(2-tailed)
1. You feel committed to the
organization and its work, you are
not just working for the money.
4.17 4.21 -0.453 0.651
2. Your job gives you the freedom to
choose your own method of
working.
3.68 3.98 -3.515* 0.001
3. You get a feeling of accomplishment
from the work you are doing. 3.93 4.05 -1.658 0.098
4. The amount of responsibility given
you is not excessive. 3.54 3.73 -1.906 0.058
5. What you are doing well in the job
receives recognition. 3.84 3.95 -1.378 0.169
6. Your supervisor supports your career
development. 3.75 4.03 -3.095* 0.002
7. You get the attention paid to
suggestions you make from your
supervisor.
3.86 4.03 -1.961 0.051
8. You get on well with colleagues. 4.02 4.11 -1.278 0.202
9. You have no concerns about the
style of management. 3.66 3.80 -1.524 0.129
10. The pursuit of organizational targets
does not put you under excessive
pressure.
3.69 3.96 -2.746* 0.006
Note: * means that the test is significantly different (Sig.) at p < 0.05
Question 6 – ‘Your supervisor supports your career development’ – suggests that the
leaders are important for promoting the officials’ positions and also allocating rewards,
and that the high KPI scoring provinces tend to be satisfied in receiving promotion and
rewards. On the other hand, the low KPI scoring provinces may not be satisfied in
receiving incentive. Regarding question 10 – ‘The pursuit of organizational targets does

174
not put you under excessive pressure’ – it illustrates that the high KPI scoring group is
likely to be more enthusiastic to pursue tasks and goal achievement than the low KPI
scoring provinces.
5.5.3 Comparison of job satisfaction between senior managers in the low and high
KPI scoring provinces
The views of senior managers’ job satisfaction in both the low and high KPI scoring
groups were found not to be significantly different (see Table 28). It can be observed
that questions 4 and 10, where the low KPI scoring group provided a higher mean score
than the high one, present the t value – t indicates the difference of the mean score
between two groups of variables – with positive values.
Table 28 Mean scores and statistical significance of job satisfaction between the
senior managers in the low and high KPI scoring provinces
Questions
Low
scoring
group
High
scoring
group
t Sig.
(2-tailed)
1. You feel committed to the organization and
its work, you are not just working for the
money.
4.30 4.39 -0.598 0.552
2. Your job gives you the freedom to choose
your own method of working. 3.86 4.13 -1.671 0.099
3. You get a feeling of accomplishment from
the work you are doing. 4.05 4.17 -0.922 0.360
4. The amount of responsibility given you is
not excessive.* 3.78 3.65 0.645 0.521
5. What you are doing well in the job receives
recognition. 3.97 4.03 -0.350 0.727
6. Your supervisor supports your career
development. 3.97 4.06 -0.467 0.642
7. You get the attention paid to suggestions
you make from your supervisor. 4.03 4.13 -0.638 0.526
8. You get on well with colleagues. 4.03 4.16 -0.859 0.393

175
Questions
Low
scoring
group
High
scoring
group
t Sig.
(2-tailed)
9. You have no concerns about the style of
management. 3.92 3.94 -0.079 0.937
10. The pursuit of organizational targets does
not put you under excessive pressure.* 3.95 3.94 0.049 0.961
Note: * means questions where the mean scores of the low KPI scoring provinces are higher than the other ones.
Question 4 (t = 0.645) – ‘The amount of responsibility given you is not excessive’–
implies that the senior managers in the low KPI scoring provinces tend not to be
concerned about the demands of work. On the contrary, the senior managers in the low
KPI scoring provinces may have lower accountability or pay less attention to the PA
than in the high KPI scoring provinces. Question 10 (t = 0.049) – ‘The pursuit of
organizational targets does not put you under excessive pressure’ – reflects that the senior
managers in the low KPI scoring provinces are likely to be less enthusiastic about PA.
This may derive from getting less attention or pressure from higher executives. In this
respect, it implies that leadership is important for implementing PA, particularly paying
attention.
5.5.4 Comparison of job satisfaction between practitioners in the low and high KPI
scoring groups
The comparison of job satisfaction between the practitioners in low and high KPI
scoring provinces is demonstrated in Table 29. It revealed that questions 2, 4, 6, and 10
had significant differences. Question 2 (Sig.= 0.002) – ‘Your job gives you the freedom
to choose your own method of working’ – suggests that the practitioners in the high KPI
scoring provinces perhaps performs their work in a more flexible environment.
Furthermore, they tend to be positive thinking regarding work of relevance to PA, as
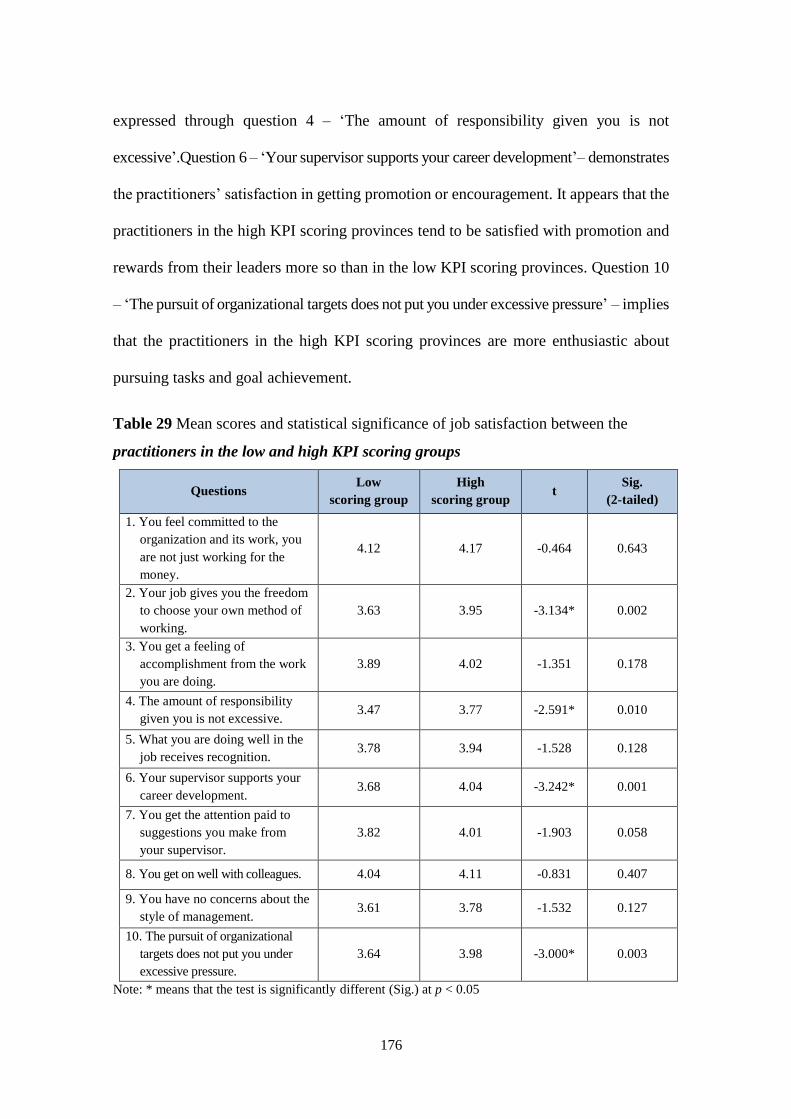
176
expressed through question 4 – ‘The amount of responsibility given you is not
excessive’.Question 6 – ‘Your supervisor supports your career development’– demonstrates
the practitioners’ satisfaction in getting promotion or encouragement. It appears that the
practitioners in the high KPI scoring provinces tend to be satisfied with promotion and
rewards from their leaders more so than in the low KPI scoring provinces. Question 10
– ‘The pursuit of organizational targets does not put you under excessive pressure’ – implies
that the practitioners in the high KPI scoring provinces are more enthusiastic about
pursuing tasks and goal achievement.
Table 29 Mean scores and statistical significance of job satisfaction between the
practitioners in the low and high KPI scoring groups
Questions Low
scoring group
High
scoring group t
Sig.
(2-tailed)
1. You feel committed to the
organization and its work, you
are not just working for the
money.
4.12 4.17 -0.464 0.643
2. Your job gives you the freedom
to choose your own method of
working.
3.63 3.95 -3.134* 0.002
3. You get a feeling of
accomplishment from the work
you are doing.
3.89 4.02 -1.351 0.178
4. The amount of responsibility
given you is not excessive. 3.47 3.77 -2.591* 0.010
5. What you are doing well in the
job receives recognition. 3.78 3.94 -1.528 0.128
6. Your supervisor supports your
career development. 3.68 4.04 -3.242* 0.001
7. You get the attention paid to
suggestions you make from
your supervisor.
3.82 4.01 -1.903 0.058
8. You get on well with colleagues. 4.04 4.11 -0.831 0.407
9. You have no concerns about the
style of management. 3.61 3.78 -1.532 0.127
10. The pursuit of organizational
targets does not put you under
excessive pressure.
3.64 3.98 -3.000* 0.003
Note: * means that the test is significantly different (Sig.) at p < 0.05
177
In summary, the assessment of job satisfaction from the practitioners’ perspectives
revealed that the practitioners in the high KPI scoring provinces tend to perform their
work with positive thinking on the demands of work, pursuit of tasks and goal
accomplishment and in more flexible circumstances. Moreover, they appear to be
satisfied with the allocation of promotion and rewards from the leaders more so than the
low KPI scoring provinces. This may contribute to the different results for PA between
the high and low KPI scoring provinces.
5.6 Summary
The comparison of organizational culture between the low and high KPI scoring
provinces revealed that all four culture types had statistically significant differences –
market and clan, hierarchy and adhocracy cultures respectively. This implies that there
are different organizational cultures between both provincial groups. In particular,
the market culture (e.g. pursuit of goals and competition) and the clan culture
(e.g. collaboration, teamwork, the leaders’ attention and commitment) were higher in
the high KPI scoring provinces. From the perspectives of the senior managers in both
groups, the market culture was the only culture type that had significant differences.
This suggests that the provinces where the senior managers emphasize the market
culture (e.g. stimulating employees to pursue goals) could attain PA. Regarding the
perspectives of the practitioners, it was revealed that all four culture types were
significantly different. This implies that staff in both groups perform tasks in different
cultures in order to achieve different results of PA. The officials in the high KPI scoring
provinces tend to implement PA with a greater positive orientation and greater
enthusiasm. It is important to note that the senior managers in each group (low or high

178
KPI scoring provinces) do not have such different cultures as the practitioners, as seen
from the results of the comparison of cultures between the senior managers in each
group and the practitioners in each group.
The assessment of job satisfaction found that the overall picture of job satisfaction was at
the level ‘agree’. This suggests that officials are broadly satisfied with implementing the
work related to PA. The comparison of job satisfaction between the low and high KPI
scoring provinces revealed that the high KPI scoring provinces tended to work by
pursuing goal achievement, in a more flexible environment, and with a greater level of
satisfaction in promotion and rewards compared with the other provinces. The senior
managers in the high KPI scoring provinces seem to be more accountable and enthusiastic
on tasks and goal accomplishment. Meanwhile, the practitioners in the high KPI scoring
provinces appear to incline towards positive thinking about working, be more flexible,
satisfied with reward allocation and promotion, and work with clear goals.

179
CHAPTER 6
RESEARCH FINDINGS: QUALITATIVE DATA
6.1 Introduction
This chapter reports on the findings of the qualitative data analysis acquired from the
in-depth and focus group interviews with Thai civil servants in the provincial cases; two
low and two high KPI scoring provinces. The total number of respondents for the
interviews was 33; 15 senior managers and 18 practitioners (a detailed list of
respondents can be found in Appendix 12). As mentioned in Chapter Two, section 2.4.4,
the interview data were collected within eight key themes. According to the analysis of
the interview data, the key determinants achieving performance agreement (PA)
delivering good governance can be categorized into three groups: leadership; human
resources (HR) and reward; and performance, outputs and outcomes.
The chapter is, therefore, structured into four main sections. The first section 6.2 focuses
on leadership in terms of the contribution of work or information, the prior support from
leaders, the support from leaders during the process, the use of leaders’ authority, and
leaders’ consideration of performance related reward. The second section 6.3 discusses
HR and reward, which highlights recruitment of those responsible for the KPIs,
assumptions on PA, characteristics of the team of Provincial Governor’s Office, training
and meetings, rotation of personnel, demand of work, performance-related pay, and
recommendations to improve the criteria of incentive allocation. The third section 6.4
concerns performance, outputs and outcomes, including capabilities of individuals and
teams, promulgation of PA in each fiscal year, factors influencing performance,

180
advantages and disadvantages of achieving high and low KPI scores, outputs and
outcomes of PA, and recommendations for PA. The final section 6.5 provides
conclusions for the chapter. Section 6.2 - 6.4 set out the perspectives of the civil servants
on what determines attainment of PA in the provincial administration. The officials’
perspectives on PA between the low and high KPI scoring provinces are also compared.
The respondents’ information is included in brackets after each quote indicating the
level of the officials (senior manager or practitioner), position (the particular senior
manager), date of interview and interview code respectively as shown in Figure 40. The
respondents were not identified by name to ensure anonymity. The interview data were
analysed by using computer software – NVivo version 10.
Figure 40 The respondents’ information illustrated in brackets after each quote
6.2 Leadership
Leadership appears to be one of the most significant determinants influencing
performance of the provinces, judging from the terms extensively mentioned by many
respondents; for example: leaders’ attention, support and use of authority. To structure
these responses it is useful to consider leadership in terms of which stage of the process
it is applied. Three main stages may be identified: input (contribution to the actual task
of work or information and prior support); processes (support from leaders during the
“……………………………..” (Senior manager/Practitioner, Position, Date of interviews: PH1)
Provincial name: the letter “P” indicates province, “H” indicates
high KPI scoring group; and “1” indicates province number
Position was indicated where the
respondent was a senior manager

181
process, and the use of leaders’ authority); and outputs or outcomes (the leaders’
consideration of performance-related reward). These stages are shown in Figure 41.
Figure 41 Leadership influence in the system of performance agreement (PA)
6.2.1 The contribution of work or information
The majority of the respondents perceived that leadership was one of the most crucial
elements influencing the process of PA. The executives’ style, particularly the Governor
or Vice Governor, was viewed as a priority in achieving the KPIs. One of the
interviewees explained that the leaders’ style reflected their background, whether they
were career officials or politicians. These attributes were associated with paying
attention to performing well in the KPIs. An example of this idea is:
Outputs/Outcomes Inputs Processes
1. Support from leaders
during the process
Other facilities required for
support (e.g. openness of
communication,
decentralization)
Coordinating the agencies
Generating collaboration
and accountability
Mentoring the agencies
2. The use of the leaders’
authority
Creating collaboration
Monitoring progress of
the KPIs
Solving problems
1. The contribution of work
or information
The leaders’ attention
to the KPIs
A clear policy by the
leaders
2. Prior support from
leaders
Resources (e.g. budget,
materials, equipment)
The leaders’
consideration of
performance-related
reward
Fairness
Equity
Consciousness of
workforce
182
“Different Governors give different levels of attentiveness. If we had the Governor from
the field of politics, he might not pay much attention to the KPIs. On the other hand, the
Governor from the field of bureaucracy perhaps paid more attention to the KPIs due to
pressure from the leaders.” (Senior manager, Chief of human resource management
group, Provincial Governor’s Office, 24 July 2014: PH2)
The executives who came from a bureaucratic background tended to give more attention
to the KPIs in order for the provinces to achieve a high score in PA, resulting in clear
policies related to the KPIs. This can be seen from some practitioners’ views that:
“Having a clear policy enabled us to do our job properly.” (Practitioner, Provincial
Governor’s Office, 24 July 2014: PH2)
“Policies should be introduced to the officials in order to create mutual understandings,
which will make the officials perform the KPIs in the same direction.” (Practitioner,
Provincial Livestock Office, 24 July 2014: PH2)
“The chiefs of the agencies were the main people who introduced the clear policy to the
subordinates. For example, the leaders required the subordinates to compete the KPI
results with others agencies.” (Practitioner, Provincial Governor’s Office, 13 August
2014: PH1)
The practitioners’ preference for clear policies from above may derive from a basic
assumption of Thais. As discussed in Chapter three they generally prefer to avoid

183
uncertainty and value security and therefore they tend to perform their work based on
directions or commands from superiors rather than making decisions by themselves. It
can be observed that the practitioners in the high KPI scoring provinces seem to be more
concerned with clear policies than the low KPI scoring provinces. Conversely, the
executives in the low KPI scoring provinces appeared to not pay much attention to the
KPIs. It can be seen from the perspective of one of the interviewees that:
“In the year that the leaders did not pay attention and support the subordinates for
performing the KPIs, the overall KPI scores at the provincial level might be low.
However, the KPI scores of the provinces were still maintained because the middle
managers were the main responsible persons driving the KPIs.” (Senior manager, Chief
of Strategy for Province Development Group, Provincial Governor’s Office, 22 July
2014: PL2)
This reflects how the leaders – Governors – in the low KPI scoring provinces tend to be
less attentive to the KPIs. It also implies that the front line managers are important in
achieving PA in the provinces. In this respect, implementation of PA in the low KPI
scoring provinces is perhaps more of a challenge in achieving high KPI scores than for
the high KPI scoring provinces, particularly in the fiscal year where their leaders in both
levels of province and agency do not pay attention to KPIs.

184
6.2.2 Prior support from leaders
According to respondents those leaders who pay attention to the KPIs also tend to
provide support with resources such as budget, materials and equipment for the agencies
in the provinces, initiated through meetings:
“In the meetings, the Governor or Vice Governor played an important role. If they paid
attention to the KPIs, they could support the team, drive the resource requirements, and
solve the problems. Most importantly, the meetings must take place regularly.” (Senior
manager, Chief of human resource management group, Provincial Governor’s Office,
13 August 2014: PH1)
The respondents argued that the problems of limited resources could be resolved by
the executives as indicated by the following statement:
“I think that leadership was important in terms of management of the limited resources
such as human, materials, equipment. The Governor’s authority assisted partnership
work and resource sharing between agencies.” (Senior manager, Chief of Provincial
Livestock Office, Provincial Livestock Office, 24 July 2014: PH2)
Where such support (especially budgetary support) was lacking, the executives,
particularly the Governor or Vice Governor, were criticized by the officials. One of the
senior managers claimed that a significant challenge in determining achievement in the
KPIs was such deficiency, as stated below:

185
“Our problem was a lack of resources, materials and equipment. For example, we often
used our own cars to do off site tasks. We did not receive budget in accordance with the
amount of jobs assigned. Sometimes, we had to pay in advance before we could claim
the expenses.” (Senior manager, Chief of Provincial Livestock Office, Provincial
Livestock Office, 24 July 2014: PH2)
This reflects the degree to which resource management of a province is based on
centralization by the Governor. With regard to the KPI host agency chiefs, on the
contrary, they argued that they provided many resources for their employees. One of the
senior managers in the high KPI scoring provinces pointed out that he provided several
resources for the staff such as budget, materials and equipment as stated below:
“I supported the subordinates by allocating the resources (budget, materials, and
equipment) for them. For example, they received travel expenses and daily subsistence
allowance.” (Senior manager, Chief of Provincial Livestock Office, Provincial
Livestock Office, 24 July 2014: PH2)
Here it is possible that the chiefs of agencies in the high KPI scoring provinces may
provide more support for their employees than the low scoring provinces. Here
leadership is important in terms of being a facilitator, a leadership style in the clan
culture, for achieving the KPIs in the context of PA.

186
6.2.3 Support from leaders during the process
Much of the evidence suggested that the low KPI scoring provinces received less
encouragement from their leaders. Senior managers claimed that the executive provided
little support for achieving the KPIs. They also asked for increasing participation by the
Governor, for instance openness to the officials’ opinions, and decentralization to the
level of the practitioners as the following statement indicates:
“The support we required from the Governor was an opportunity to share ideas. If he
ran the office solely by his own opinion and he did not listen to anyone, his subordinates
might be scared to share ideas.” (Senior manager, Chief of Provincial Office of Disaster
Prevention and Mitigation, Provincial Office of Disaster Prevention and Mitigation, 22
July 2014: PL2)
“Efficiency to perform the KPIs was generated when the officials had an opportunity to
give an opinion on the tasks and to participate in determining on methods of work…
The support we wanted was decentralization at practitioner level… delegation of work
or a clear devolution.” (Senior manager, Chief of Provincial Livestock Office,
Provincial Livestock Office, 29 July 2014: PL1)
These statements confirm that leadership matters in terms of mutual respect and
empowering employees. This attribute can be observed as limited in some provinces in
the low KPI scoring provinces. However, one of the senior managers in the low KPI
scoring provinces argued that there were various opportunities to share ideas between
the practitioners and their superiors, but some practitioners were perhaps lacking in

187
confidence in sharing opinions with the executives as indicated in the following
statement:
“In the meetings between several KPI host agencies…the practitioners discussed the
problems related to KPIs which led to solving problems. On the other hand, it was found
that in the meeting with the executives, practitioners did not feel comfortable raising the
problems or sharing ideas.” (Senior Manager, Chief of Provincial Office of Disaster
Prevention and Mitigation, Provincial Office of Disaster Prevention and Mitigation, 22
July 2014: PL2)
This implies that Thai civil servants are hesitant about providing negative feedback to
their superiors. It may be a pattern of Thais’ values called ‘Kraeng cai’, meaning to be
considerate and to feel reluctant. This value may be a barrier to improving performance
in public service by generating a patronage system as the officials may neglect to give
different opinions, for example, when they found the leaders’ decisions to be wrong.
The patronage system is seen to survive in Thai bureaucracy, despite ‘New Public
Management’ (NPM) having been introduced through the PA scheme. However, a
respondent who raised the issue of the patronage system perceived that the KPIs could
contribute to greater effectiveness and transparency in public service as stated below:
“The patronage system was still deep-rooted in Thai bureaucracy. It was essential in
some situations. However, it was viewed as a barrier of using the Western’s concept
promoted by the OPDC. We recognized that the concepts such as organized-working

188
procedure could create transparency.” (Senior manager, Chief of Strategy for Province
Development Group, Provincial Governor’s Office, 13 August 2014: PH1)
In addition, the respondents revealed that moral support from leaders, particularly chief
of the Provincial Governor’s Office and the chief of the main KPI host agencies, was
important to attain PA, for example being a coordinator, being a team builder (e.g.
generating collaboration), being a hard driver (e.g. stimulating enthusiasm) and being a
mentor (e.g. creating accountability). Being a coordinator between the agencies was a
leadership style found in the provinces as shown in the following example:
“I worked as a secretary of the team driving the KPIs, the team of the Provincial
Governor’s Office. My main role was to coordinate between the agency chiefs and the
chief of group/division/subdivision/section. I liaised with them through both formal and
informal communications. Informal communications help cut back the red tape. A good
relationship with other agencies is required.” (Senior manager, Chief of Provincial
Governor’s Office, Provincial Governor’s Office, 28 July 2014: PL1)
The senior managers of the Provincial Governor’s Office appear to be the key feature
communicating with other agencies through formal and informal contact, with the
Provincial Governor’s Office in the low KPI scoring provinces perhaps preferring
informal communication. It is important to note that being a coordinator is considered
as a leadership style in the hierarchy culture.
189
Moreover, a team builder was a leadership style mentioned by the respondents. They
revealed that the chiefs of the agencies, particularly in the high KPI scoring provinces,
tend to generate collaboration and accountability among officials through meetings.
This idea is illustrated by the following account:
“I informed the subordinates by the monthly meetings that we had to collaborate to
work towards the KPIs. Monitoring the progress of the KPIs was required through the
meetings. If the result of the KPIs was not close to the targets, we had to accelerate our
team performance.” (Senior manager, Chief of Provincial Employment Service Office,
Provincial Employment Service Office, 23 July 2014: PH2)
The implication of regular meetings between the senior managers and the practitioners
is important because the leaders play many roles such as team builder (clan culture),
monitor (hierarchy culture), and hard driver (market culture) in the single stage. The
leader can create cooperation and participation among the individuals when considered
as team builder. Meanwhile, the leaders can stimulate enthusiasm and accountability
through monitoring the progress of the KPIs, viewed as monitor and hard driver at the
same time. It is important to note that there is a linkage between the clan, hierarchy and
market cultures in the context of PA, which implies there is a positive correlation in
accomplishing the high KPI scores. In addition, being a mentor seemed to be a crucial
leadership style in order to achieve PA, particularly for the chiefs of the agencies. They
played a significant role in recommending and creating accountability among the
employees as stated below:

190
“I would give recommendation and create accountability among the officials…. If there
were any complaints from the public or service users, I could transfer my staff to a more
appropriate position.” (Senior manager, Deputy Governor, Provincial Administration
Office, 13 August 2014: PH1)
In conclusion, in the process of PA, leadership is not only important in terms of concrete
support as stated in the earlier section, but also abstract support such as opening
opportunities for sharing opinions; as well as being coordinator, team builder, hard
driver, and mentor. This support would contribute towards generating, for example,
consensus orientation, participation, accountability and effectiveness in the public
agencies. The evidence suggests that the senior managers in the high KPI scoring
provinces tend to be good team builders, hard drivers and mentors rather than in the low
KPI scoring provinces.
6.2.4 The use of the leaders’ authority
The respondents perceived that using the Governor’s authority was essential for a
smooth operation, monitoring progress of the KPIs, and solving problems related to
KPIs. These features are elucidated by the following accounts:
“If the leaders, the Governor or Vice Governor, paid attention and monitored the KPIs,
meetings might not be needed as the leaders could give orders to their subordinates
directly and the agencies’ progress in the KPIs could be generated by an informal
conversation between the leaders and the chiefs of the agencies. When the chiefs of the
agencies paid great attention and follow-up on the progress, it created respect and good

191
cooperation.” (Senior manager, Chief of Provincial Governor’s Office, Provincial
Governor’s Office, 28 July 2014: PL1)
“We had to use the Governor’s authority because he is as the key figure who gave orders
to all agencies and then the provincial agencies had to participate.” (Senior manager,
Chief of Provincial Office of Disaster Prevention and Mitigation, Provincial Office of
Disaster Prevention and Mitigation, 22 July 2014, PL2)
“The most important factor was the leaders, Governor or Vice governor, who
understood and saw KPIs as priorities. The leaders were the main person who managed
all agencies such as monitoring the progress of the tasks. They, in turn, would have to
pay attention to their work because a bureaucratic culture depends on the
leader.”(Senior manager, Chief of Strategy for Province Development Group,
Provincial Governor’s Office, 13 August 2014: PH1)
“Using the Governor’s authority across the province could help solving problems for
the officials. Although the jobs were not perfectly finished, but at least the jobs were
done.” (Practitioner, Provincial Livestock Office, 24 July 2014: PH2)
The data suggest that using position power – top-down authority – is strong in both
the low and high KPI scoring provinces. The executives’ authority seems to be
a significant element determining commitment to the KPIs, namely generating
collaboration, participation and accountability in achieving the KPIs among the
agencies.

192
However, the ways in which authority was used seem different. In the low KPI scoring
provinces, the leaders tend to use authority based on command – a more authoritarian
leadership style. The respondents commonly mention how ‘the leaders gave orders to
the agencies or the subordinates’ for creating cooperation and participation. On the other
hand, the leaders in the high KPI scoring provinces appear to use authority based more
on understanding and attentiveness – a more participative leadership style. Statements
such as ‘the leaders understood, gave priority to the KPIs, resolved the problems’ are
often voiced by respondents in the high KPI scoring provinces.
6.2.5 The leaders’ consideration of performance-related reward
The annual reward budget of a province is linked with the overall result it attains in PA.
The respondents perceived that leadership involved consideration of incentive
allocation. The Governor and chiefs of agencies had a certain authority to decide
people’s reward-based performance because the reward was cascaded from the
provinces to agencies and individuals respectively. The data suggested that individuals
expected incentive allocation by the leaders to be fair. Many respondents perceived that
the incentive was a potential motivator:
“The leaders should ensure fairness of allocation of rewards to subordinates such as
bonus and credit claiming. This could motivate the officials to achieve in the KPI goals,
especially at practitioner level.” (Senior manager, Chief of Provincial Employment
Service Office, Provincial Employment Service Office, 23 July 2014: PH2)
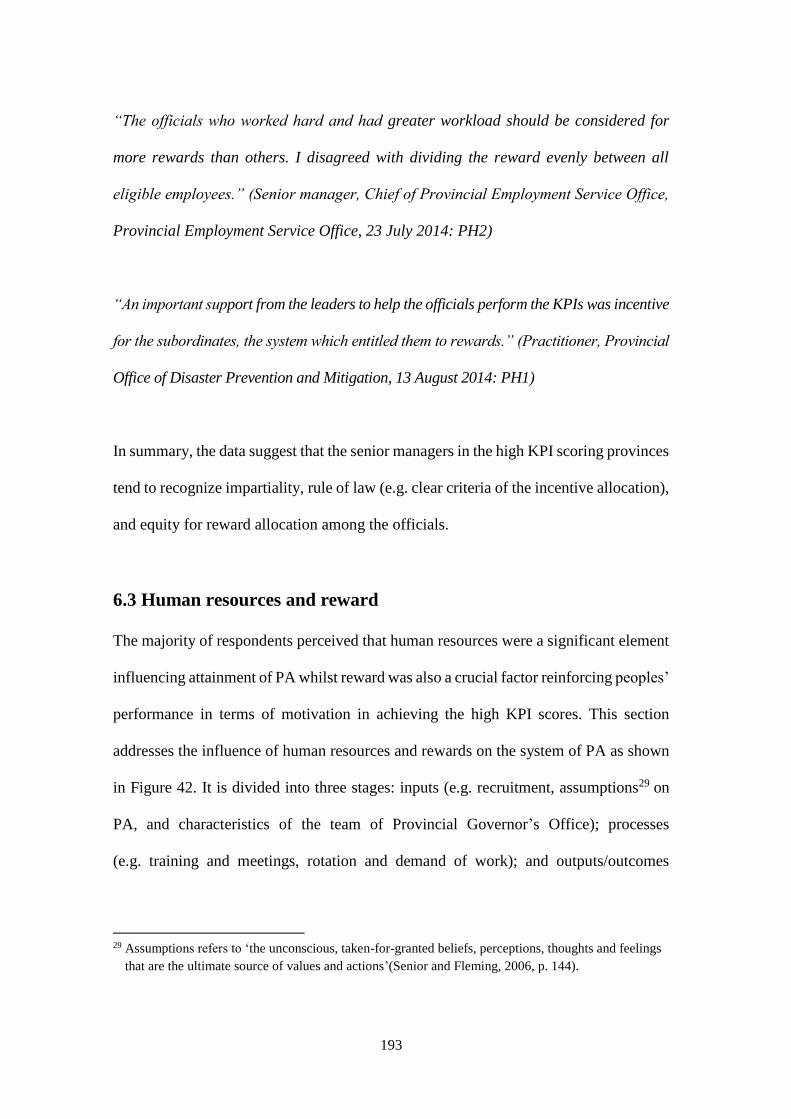
193
“The officials who worked hard and had greater workload should be considered for
more rewards than others. I disagreed with dividing the reward evenly between all
eligible employees.” (Senior manager, Chief of Provincial Employment Service Office,
Provincial Employment Service Office, 23 July 2014: PH2)
“An important support from the leaders to help the officials perform the KPIs was incentive
for the subordinates, the system which entitled them to rewards.” (Practitioner, Provincial
Office of Disaster Prevention and Mitigation, 13 August 2014: PH1)
In summary, the data suggest that the senior managers in the high KPI scoring provinces
tend to recognize impartiality, rule of law (e.g. clear criteria of the incentive allocation),
and equity for reward allocation among the officials.
6.3 Human resources and reward
The majority of respondents perceived that human resources were a significant element
influencing attainment of PA whilst reward was also a crucial factor reinforcing peoples’
performance in terms of motivation in achieving the high KPI scores. This section
addresses the influence of human resources and rewards on the system of PA as shown
in Figure 42. It is divided into three stages: inputs (e.g. recruitment, assumptions29 on
PA, and characteristics of the team of Provincial Governor’s Office); processes
(e.g. training and meetings, rotation and demand of work); and outputs/outcomes
29 Assumptions refers to ‘the unconscious, taken-for-granted beliefs, perceptions, thoughts and feelings
that are the ultimate source of values and actions’(Senior and Fleming, 2006, p. 144).
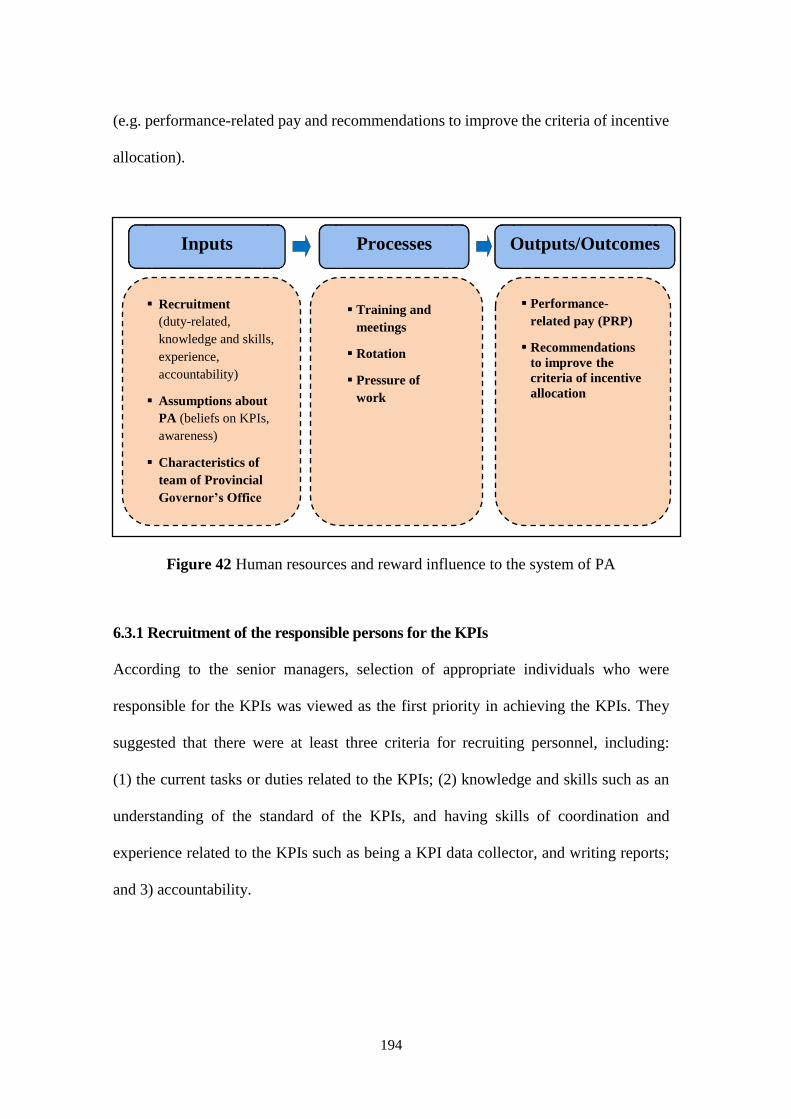
194
(e.g. performance-related pay and recommendations to improve the criteria of incentive
allocation).
Figure 42 Human resources and reward influence to the system of PA
6.3.1 Recruitment of the responsible persons for the KPIs
According to the senior managers, selection of appropriate individuals who were
responsible for the KPIs was viewed as the first priority in achieving the KPIs. They
suggested that there were at least three criteria for recruiting personnel, including:
(1) the current tasks or duties related to the KPIs; (2) knowledge and skills such as an
understanding of the standard of the KPIs, and having skills of coordination and
experience related to the KPIs such as being a KPI data collector, and writing reports;
and 3) accountability.
Outputs/Outcomes
Inputs
Recruitment
(duty-related,
knowledge and skills,
experience,
accountability)
Assumptions about
PA (beliefs on KPIs,
awareness)
Characteristics of
team of Provincial
Governor’s Office
Processes
Performance-
related pay (PRP)
Recommendations
to improve the
criteria of incentive
allocation
Training and
meetings
Rotation
Pressure of
work
195
Firstly, the primary qualification of those responsible was to have the existing tasks or
duties related to the KPIs, as one of the interviewees stated that:
“Recruitment of responsible persons for the KPIs was considered by their duties related
to KPIs.” (Senior manager, Chief of Strategy for Province Development Group,
Provincial Governor’s Office, 13 August 2014: PH1)
Secondly, the staff responsible were required to have knowledge, skills and experience
related to the KPIs, particularly an understanding of the standard of the KPIs and having
coordination ability. These were essential in terms of building trust, introducing
knowledge and communicating with related agencies and people. These points are
illustrated by the following comments:
“In the Provincial Governor’s Office, the appropriate responsible persons had to have
skills in coordination, using both formal and informal communications. Moreover, they
had to have knowledge and understanding of the KPIs they had been assigned for.”
(Chief of human resource management group, Provincial Governor’s Office, 13 August
2014: PH1)
“Understanding and knowledge of the KPIs were necessary because it involved the
reliability in introducing the KPIs to other officials. Furthermore, experience of working
on the KPIs was also considered.” (Senior manager, Chief of Provincial Community
Development Office, Provincial Community Development Office, 22 July 2014: PL2)

196
It appeared that the low KPI scoring provinces were more challenged in terms of inter-
agency communication, as indicated by the following quote:
“Working on the KPIs required officials who had a specific skill of coordination. In
fact, a number of officials did not like to liaise with other people. So, they did not feel
comfortable performing the KPIs and preferred to do easier jobs.” (Practitioner,
Provincial Public Health Office, 28 July 2014: PL1)
Accomplishing PA requires coordination and participation – collectivism – among the
agencies in the provinces, especially the Provincial Governor’s Office and main KPI
host agencies and individualist officials were less able to deliver this.
A number of respondents revealed that recruitment of appropriate staff performing the
KPIs was problematic due to a limited number of personnel. This challenge was
extensively mentioned by the senior managers as follows:
“The agencies that had a large number of the officials were able to recruit appropriate
responsible persons of the KPIs while other agencies were not able to due to the limited
number of personnel. As a result, they had to recruit the general service officers to do
the jobs. For example, the Provincial Governor’s Office assigned government
employees to perform the KPIs, while the officials had little involvement.” (Senior
manager, Chief of human resource management group, Provincial Governor’s Office,
24 July 2014: PH2)

197
“We did not have the right to recruit the responsible people for the KPIs because we were
able to recruit only the existing personnel.” (Senior manager, Chief of Provincial
Administration Office, Provincial Administration Office, 13 August 2014: PH1)
“Our organization is a small one, so I did not have right to recruit the responsible
personnel.” (Senior manager, Chief of Provincial Office of Disaster Prevention and
Mitigation, Provincial Office of Disaster Prevention and Mitigation, 22 July 2014: PL2)
Both the low and high KPI scoring provinces appeared to have a lack of personnel. This
problem may lead some agencies in the provinces to use temporary employees for
performing the KPIs, when in fact it should be the duty of genuine officials.
Thirdly, the data suggested that accountability was the other crucial qualification of
the responsible staff for PA. It was found that achieving PA was related to the officials
who were devoted in working to achieve the KPIs, which determined individual
accountability as one of the respondents stated that:
“When budget was not allocated to help achieve the KPIs, we could still succeed by
working in partnership between agencies, with our devoted team of staff to do the best
we could.” (Senior manager, Chief of Strategy for Province Development Group,
Provincial Governor’s Office, 13 August 2014: PH1)
This implies that accomplishment of PA requires a combination of accountability of the
staff and collaboration between agencies in the provinces. It also reflects the situation

198
that although the high KPI scoring provinces did not always get support from the
superiors in terms of budget, they could achieve high KPI scores due to a better
combination of staff accountability and agency participation.
6.3.2 Assumptions on PA
The data suggested that individuals’ assumptions such as negative or positive beliefs
influenced the officials’ behaviour and performance in accomplishing PA. The senior
managers in the high KPI scoring provinces revealed that there were some officials who
believed that the KPIs were not their actual tasks or responsibilities as illustrated below:
“I thought that the KPIs were not our main responsibility….We recognized that working
on the KPIs was sometimes enforced by the executives…On the contrary, the
accomplishment of the KPIs might derive from the officials’ conscience.” (Senior
manager, Chief of human resource management group, Provincial Governor’s Office,
24 July 2014: PH2)
“A number of officials believed that the province meant the Provincial Governor’s
Office, not including the other 33 agencies in the province. Thus, they thought that the
KPIs of the province had to be responsible by the Provincial Governor’s Office.”
(Senior manager, Chief of Strategy for Province Development Group, Provincial
Governor’s Office, 13 August 2014: PH1)
“The commencement of the KPIs was believed by several officials that was the OPDC’s
KPIs and was not the province’s tasks or their own tasks. Consequently, they did not

199
see a connection between the KPIs and their line of work. Moreover, they thought that
the result of the KPIs did not affect their routine jobs, so they could choose to do or not
depending on themselves.” (Senior manager, Chief of human resource management
group, Provincial Governor’s Office, 13 August 2014: PH1)
Although the PA scheme has been promoted for over a decade, some people seem to
have questions about it such as who is the owner of the KPIs (e.g. OPDC or Provincial
Governor’s Office), and whether the KPIs are really linked with their routine tasks or
provincial strategies. The implication is that some officials perform the KPIs simply
because they are instructed or required to do so, but without any willingness on their
own part.
Employees’ assumptions about the KPIs appeared to influence performance in terms
of commitment, accountability, participation and collaboration. This is further
illustrated by the following quotes:
“Personnel had to believe that the KPIs were a part of their tasks. If they did not have
positive attitudes to do the jobs, it might lead to getting the low KPI scores.” (Senior
manager, Chief of Provincial Employment Service Office, Provincial Employment
Service Office, 23 July 2014: PH2)
“We could achieve high KPI scores if our personnel paid great attention, had careful
planning and cooperation, and worked well with each other.” (Senior manager, Chief

200
of Strategy for Province Development Group, Provincial Governor’s Office, 22 July 2014:
PL2)
“Fortunately, the officials in our province had work ethics and carried out their
responsibility to achieve the KPIs.” (Senior manager, Deputy Governor, Provincial
Administration Office, 13 August 2014: PH1)
The implication of the individuals’ assumptions such as conscientious, positive attitudes
and responsibility are important for the success of PA, particularly accountability.
However, some respondents claimed that thought had to be given to how individual
accountability was generated. One of the interviewees explained that:
“Personnel’s awareness and accountability on KPIs were a crucial factor…. However,
the official’s accountability could be categorized into two aspects. The first was they
might be pressured by their superiors into achieving high KPI scores. The other was
their conscience, which sometimes goes against Thais’ free thinking nature. In other
words, they do not like enforcement.” (Senior manager, Chief of human resource
management group, Provincial Governor’s Office, 24 July 2014: PH2)
Here the accountability of people appears to be created by the leaders’ authority and the
officials’ own conscience. The data suggests that it would be better if individual
accountability were created by the personnel’s conscience than by enforcement and
hierarchy culture (control-orientation).
201
In addition, individuals’ assumptions regarding collaboration and teamwork at the level
of provinces and agencies were also referred to as necessary for high scores. The
respondents stated that:
“We thought that participation and teamwork between the agencies were the most
important factors obtaining achievement of the KPIs.” (Practitioner, Provincial
Governor’s Office and Provincial Livestock Office, 24 July 2014: PH2)
“Collaboration of the officials in the internal and external organizations contributed to
our province’s accomplishment in the KPIs. If we communicated with each other and
we were in agreement about KPIs, we could resolve the problems and also monitor the
jobs.” (Practitioner, Provincial Community Development Office, 22 July 2014: PL2)
6.3.3 Characteristics of team of Provincial Governor’s Office
A number of officials perceived that the characteristics of the team of Provincial
Governor’s Office were a key factor in determining achievement in the KPIs. This team
was important not only as a facilitator of the process of PA, but also as a mentor for the
agencies in their provinces. The interviewees elucidated that:
“Fortunately, our province had a competent team of Provincial Governor’s Office as a
good coach. We could contact the coordinator at the Provincial Governor’s Office
whenever we had problems related to the KPIs.” (Practitioner, Provincial Governor’s
Office, 24 July 2014: PH2)
202
“One of the crucial roles that engaged the KPIs was being a mentor for the agencies
because a few problems occurred when the responsible persons for the KPIs, internal
and external agency, were changed and the standard of the KPIs were changed. As a
coordinator in the central agency, we had to support them.” (Senior manager, Chief of
Strategy for Province Development Group, Provincial Governor’s Office, 13 August
2014, PH1)
6.3.4 Training and meetings
The majority of respondents perceived that they did not have much training relevant to
the KPIs, but they had had meetings instead of training. There were at least four types
of meetings that were commonly mentioned by the interviewees: (1) central government
meetings; (2) provincial meetings, for example on the introduction of the KPIs and
allocation of responsibilities, and monitoring progress of the KPIs over the period of 6,
9, and 12 months; (3) external meetings between the main and second KPI host agencies;
and (4) the internal meetings of the KPI host agencies. These are illustrated in the
following statements:
“We did not have the actual trainings related to the KPIs, but we had various kinds of
the meetings such as introduction of standard of the KPIs, the meetings of the central
government by the OPDC, and the meetings for monitoring progress of the KPIs in the
period of 6, 9, and 12 months. So, we had the total number of the provincial meetings
about 3-4 times per fiscal year.” (Practitioner, Provincial Office of Disaster Prevention
and Mitigation, 13 August 2014: PH1)

203
“Although we did not have much training of the KPIs, we had several patterns of the
meetings. For example, the meetings to report the progress of the KPIs to the Governor
which could stimulate the KPI host agencies to be enthusiastic. The meetings of the
central government through the VDO conferences were organized by the OPDC. The
provincial meetings between the KPI host agencies for monitoring progression of the
KPIs (3-4 times per year were organized by the Provincial Governor’s Office.” (Senior
manager, Chief of Provincial Governor’s Office, Provincial Governor’s Office, 28 July
2014: PL1)
The meetings are a significant element in the system of PA in terms of introducing
policies and standards of the KPIs for the officials, allocation of responsibilities,
integrating collaboration among the agencies and monitoring progress of the KPIs. The
implication is that provinces that had regular meetings tended to achieve in the KPIs.
Nevertheless, there were several challenges to the training based on internal and external
factors. An internal factor was the individuals themselves such as participants’
attentiveness during training:
“The officials sometimes did not pay attention to the whole meeting, the introduction of
standard of the KPIs through the VDO conferences by the OPDC. They would
concentrate mainly on their own KPIs and might leave the meeting after it moved on to
the next KPIs.” (Practitioner, Provincial Office of Disaster Prevention and Mitigation,
13 August 2014: PH1)

204
“I think that nobody wanted to attend the training of the KPIs. The responsible persons
themselves did not want to be trained. As a result, the training was useless. Hence, the
leaders should assign the appropriate persons to attend the training.” (Practitioner,
Provincial Livestock Office, 28 July 2014: PL1)
External factors such as the lack of introductory knowledge received from the training
to others, and the limited budget were likely to be important barriers to getting training
as illustrated by the followings examples:
“I thought that the training sessions reflected the weakness of the bureaucracy. There
was not much training available. We wanted our organization’s members to be more
knowledgeable…. The persons who attended the training courses might not cascade
their knowledge to others. They saw the training as their own personal development
rather than being a representative of the agency.” (Senior manager, Deputy Governor,
Provincial Administration Office, 13 August 2014: PH1)
“We were deficient in budget for the training related to the KPIs for the personnel, so
we could organize only the meetings within our organization.” (Practitioner, Provincial
Governor’s Office, 24 July 2014: PH2)
“We needed the training, but we did not have a budget. If the OPDC allocated the
budget in the training, it would help us. Actually, we would like to invite the professional
of the OPDC to introduce knowledge of the KPIs, but we had a problem with the
budget.” (Practitioner, Provincial Governor’s Office, 13 August 2014: PH1)

205
The respondents also suggested that the training should be relevant to the KPIs in terms
of topics and accessible language:
“The topic of the training should depend on the type of KPIs….The OPDC should
organize the regional training at a province which is the centre of the region where the
other provinces in the region could attend.” (Practitioner, Provincial Governor’s
Office, 13 August 2014: PH1)
“It was important that the training courses of the KPIs should be delivered in simple
language, easy to understand, by real professionals such as university lecturers.”
(Practitioner, Provincial Public Health Office, 22 July 2014: PL1)
“The trainings, such as a day workshop at least once a year, would be more useful than
attending several meetings.” (Practitioner, Provincial Office of Disaster Prevention
and Mitigation, 13 August 2014: PH1)
6.3.5 Rotation of personnel
As stated earlier, training was necessary to perform the KPIs, particularly in the
provinces where responsible persons for the KPIs were frequently relocated. Rotation
of personnel caused problems in terms of the need for the new people to understand the
system, and the need to reprocess the data and write new reports:
206
“If the staff members who were responsible for the KPIs were rotated frequently, the
new ones had to spend a lot of time trying to figure out the existing KPI system.” (Senior
manager, Chief of human resource management group, Provincial Governor’s Office,
13 August 2014: PH1)
“Rotation of the responsible persons for the KPIs was a problem that we were frequently
confronted with. We had to restart the whole process with the replaced personnel.”
(Practitioner, Provincial Governor’s Office, 24 July 2014: PH2)
“The previous personnel responsible for the KPIs did not leave the documents behind
when he moved to another workplace, resulting in lost documents during the transfer.
So, the new one had to review the jobs again and the team of Provincial Governor’s
Office had to support them.” (Senior manager, Chief of Strategy for Province
Development Group, Provincial Governor’s Office, 22 July 2014: PL2)
High KPI scoring provinces seem to have not found rotation to be much of a problem,
apparently due to staff not being interested in relocation (which suggests that problems
with rotation were a symptom of lower motivation in the low KPI scoring provinces):
“Some officials who were placed in an office far away from their hometown might not
want to devote to their tasks and spent more efforts in finding a way to be relocated in
their hometown. However, the officials in this province were different from others
because they did not want to relocate. Therefore, they paid attention to their work.”
(Senior manager, Chief of human resource management group, Provincial Governor’s
Office, 13 August 2014: PH1)

207
“Fortunately, the officials within our province do not relocate very often. They had been
here for a long time, so they had a good relationship to each other. Consequently, our
province had good collaboration.” (Senior manager, Chief of Provincial Office of
Disaster Prevention and Mitigation, 13 August 2014: PH1)
Agencies in the high KPI scoring provinces appear to have a higher degree of
collaboration on the KPIs than the low KPI scoring provinces and may also have a lower
rate of rotation of people.
6.3.6 Pressure of work
The overwhelming pressure of work was viewed as an important challenge in
performing the KPIs, particularly at the level of practitioners. They elucidated that
workload within the tight timeframe perhaps influenced quality of work and
introduction of knowledge to other people. These features are illustrated by the
followings statements:
“The proportion of jobs influenced the performance on KPIs. I had an experience
working in a province where the workload was manageable. Thus, I had time to refine
my work. In this province, in contrast, I was responsible for a lot of workload with tight
deadlines which had affected the quality of my work.” (Practitioner, Provincial
Employment Service Office, 24 July 2014: PH2)
“It was difficult to perform jobs within the tight timeframe because we were
overwhelmed. Consequently, we could not finish the jobs on time and they could have

208
low quality. It looked like we could achieve the outputs, but we were not sure about the
outcomes. ” (Practitioner, Provincial Livestock Office, 24 July 2014: PH2)
“I had a lot of work to do, so I did not have much time to cascade my knowledge of the
KPIs to the new responsible persons while the new ones did not have time for studying.”
(Practitioner, Provincial Employment Service Office, 24 July 2014: PH2)
These data imply that several practitioners were struggling with overwhelming pressure
of work on tight deadlines in the context of PA. Thus, the organizational skill of officials
was important in getting jobs done as well as maintaining work-life balance. The
evidence suggests that the practitioners in the high KPI scoring provinces tend to finish
their tasks on the tight deadline although they are likely pressured by the strict
timeframe. Moreover, ability to cope with pressure of work is likely to be associated
with the officials’ job satisfaction performing the KPIs.
There were at least three causes of overwhelming pressure of work, which were
commonly mentioned by the interviewees: (1) assignment of tasks by the leaders or
additional tasks from their own routine jobs; (2) non-dispersive work (work that could
not be delegated); and (3) limited number of personnel.
“A cause of the officials’ bias to perform the KPIs might start from the leaders, for
example, the leaders’ decision in selecting certain people whose work dealt with the
KPIs resulted in unequal workload distribution in the organization while the reward

209
was spread evenly.” (Senior manager, Chief of Provincial Livestock Office, Provincial
Livestock Office, 24 July 2014: PH2)
“Some agencies had to do a lot of jobs related to the KPIs because the KPIs were
sometimes not dispersed to others.” (Practitioner, Provincial Office of Disaster
Prevention and Mitigation, 22 July 2014: PL2)
“The Provincial Governor’s Office had a limited number of officials to work with the
KPIs. We had to be responsible for every task of the province issued from the central
government. We were the central agency of the province and we worked as the secretary
of the Governor. Thus, we had a lot of jobs to do and work towards tight deadlines.”
(Senior manager, Chief of Provincial Governor’s Office, Provincial Governor’s Office,
28 July 2014: PL1)
“Our organization had a limitation on number of officials. There were only 10 officials
while the rest of the staff were temporary employees. Some employees were not very
motivated and dedicated as they wanted to seek a better job elsewhere.” (Senior
manager, Chief of Provincial Employment Service Office, Provincial Employment
Service Office, 24 July 2014: PH2)
It may be noted that the leaders played a key role in distribution of responsibilities. In
other words, the individuals’ workload could be increased or reduced by management
decisions. An overwhelming work burden could become a cause of job dissatisfaction
210
among officials. This may be part of a more general trend whereby officials’ attitudes
on performing the KPIs may be shaped by the managers:
“A number of officials might have bias doing the KPIs. I would explain to them in the
initial step that everyone was important in working on the KPIs and that we had to work
as a team.” (Senior manager, Chief of Provincial Livestock Office, Provincial Livestock
Office, 24 July 2014: PH2)
It has been noted that the managers in the high KPI scoring provinces appear to
emphasise what employees viewed as a participative leadership style, whereas the
leaders in the low KPI scoring provinces less so. This is emphasized by one of the
practitioners in a low KPI scoring province:
“I had to work on KPI alongside my main job description. It was assigned by the leaders
and I had to do it no matter how tight the deadlines were. Some officials might not be
willing to do it. It was a burden. It was a duty….It was important for the leaders to make
sure that the officials had an understanding about the importance of the KPIs and how
to delegate the duties appropriately.” (Practitioner, Provincial Community
Development Office, 22 July 2014: PL2)
This statement reflects that the subordinates in the low KPI scoring provinces tend to
have job dissatisfaction. This is because leaders may not focus on the staff by ensuring
understanding and allocating appropriate responsibilities. Also, people in the low KPI

211
scoring provinces tend to work based on the leaders’ directives (authoritarian leadership
style) without being motivated beyond this.
Other officials appeared to be neither satisfied nor dissatisfied about demand of work
related to the KPIs. They perceived that they could cope with their workload because
some KPIs were continuously performed for several fiscal years. Thus, these KPIs were
viewed as their routine jobs. Furthermore, they could do their jobs following on the
standard of the KPIs as elucidated by one of the practitioners that:
“Performing tasks related to the KPIs was not too overwhelming for me. Working with
KPIs had become a routine to me because I have worked on the KPIs for several
years.… The new responsible one for the KPIs might find it difficult to hit the ground
running.” (Practitioner, Provincial Office of Disaster Prevention and Mitigation, 13
August 2014: PH1)
The implication of some KPIs is perhaps viewed by the practitioners as their routine job.
This assumption may contribute to a lack of enthusiasm achieving goals of the KPIs
(market culture). They may perhaps focus on how to please their superiors rather than
on high quality of public service and how to find techniques in getting high KPI scores.
6.3.7 Performance-related pay (PRP)
There were a variety of perspectives on performance-related pay (PRP) focused on the
criteria of incentive allocation. The data suggested that the respondents’ options on the

212
criteria of incentive allocation can be divided into three aspects: agree, disagree, and
neither agrees nor disagrees, including suggestions on reward.
Agreement with the criteria of incentive allocation
The officials perceived that financial reward was a motivational tool for performing the
KPIs. Many interviewees seemed to agree with the criteria of the incentive allocation in
terms of enhancing motivation, stating that:
“I agreed to maintain the criteria of reward based on result of the KPIs because the
financial incentive was a motivation for people. However, the criteria should be
adjusted to be more appropriate for the officials.” (Practitioner, Provincial Livestock
Office, 24 July 2014: PH2)
“The financial reward was a motivation for the officials in working on the KPIs.
Although they were not rewarded, they still performed their tasks. However, it was better
to provide the reward.” (Senior manager, Chief of human resource management group,
Provincial Governor’s Office, 13 August 2014: PH1)
“I agreed with the criteria of incentive allocation because it was at the heart of working
between the superiors and subordinates. If we did not have the incentive, the officials’
morale for working might be decreased and they might perform the tasks with
unhappiness. For instance, the leaders might get only the jobs done, but the
subordinates might not put their heart and soul into it.” (Senior manager, Chief of

213
Provincial Community Development Office, Provincial Community Development
Office, 22 July 2014: PL2)
A number of the respondents agreed that the criteria of reward allocation, particularly
financial reward, can engender enthusiasm of the practitioners. Thus, they agreed that
the criteria of the incentive allocation should be maintained, but that improvements were
needed. It was noticeable that people in the low KPI scoring provinces tended to be
more concerned about financial rewards than the high KPI scoring provinces. The
motivation of some officials in the low KPI scoring provinces might even be dependent
on reward allocation. On the contrary, people in the high KPI scoring provinces are
likely to focus on the tasks more than reward.
Disagreement with the criteria of incentive allocation
On the other hand, some respondents disagreed with the criteria of incentive allocation,
particularly at the level of the provinces. There are four main reasons that people
disagree with the criteria of incentive allocation: (1) the limitation of people related to
the KPIs; (2) unfairness of reward allocation; (3) a small amount of reward; and (4)
fabrication of evidence in order to attain high KPI scores.
Firstly, selection of the tasks and people related to the KPIs appeared to be limited. It
was also viewed as a cause of argument and disharmony in the level of the provinces
and agencies as stated below:
214
“I disagreed with the criteria of incentive allocation in the level of provinces.... In fact,
there were various tasks of the provinces, but some tasks were selected as the KPIs.
Hence, the other officials whose tasks were not associated with the KPIs might get less
reward than others.” (Senior manager, Chief of Provincial Livestock Office, Provincial
Livestock Office, 24 July 2014: PH2)
“The money issue usually causes an argument… When the responsible persons of the
KPIs were eligible for the reward allocation, some agencies might want to be in charge
disregarding the nature of their work which was not relevant to that specific KPI. The
amount of rewards for each agency might vary resulting in the officials’ morale being
undermined. This also affected the unity of the organisation.” (Senior manager, Chief
of human resource management group, Provincial Governor’s Office, 13 August 2014:
PH1)
“The criteria of incentive allocation by the OPDC indicated that only the officials
involved with the KPIs could receive the reward. Actually, the provinces had several
tasks that were not evaluated as the KPIs. So, it was not fair for various officials who
worked on other tasks… It was sometimes found that the responsible persons for the
KPIs did not perform the tasks of the KPIs because they gained the same rate of reward
as others.” (Practitioner, Provincial Governor’s Office, 28 July 2014: PL1)
Secondly, the criteria of incentive allocation were a concern for officials in terms of
unfairness of reward allocation such as the Provincial Governor’s Office getting a higher
reward; the challenge of inter-personnel reward allocation; the different numbers of

215
officials in the provinces and agencies; the limitation on the central government staff at
the provincial administration getting rewards:
“From my experience working for several provinces, the fairness in allocating the
reward was quite a challenge. For example, there were several provinces that the
Provincial Governor’s Office claimed for more incentive allocation than others…
Although there were the standard criteria of reward allocation by the OPDC, The
Governor’s Office made a decision on the proportion of reward for all agencies
involved.” (Senior manager, Chief of Provincial Employment Service Office, Provincial
Employment Service Office, 23 July 2014: PH2)
“Generally, the Provincial Governor’s Office managed the reward allocation for all
agencies in the province. Consequently, the Governor’s office was likely to be criticised
about transparency of reward allocation.” (Senior manager, Chief Provincial Livestock
Office, Provincial Livestock Office, 28 July 2014: PL1)
This implies that the Provincial Governor’s Office appears to influence allocation of
reward in the provinces. Many provinces tend to have a problem of transparency
regarding reward allocation by the Provincial Governor’s Office. This may lead to a
lack of trust regarding the team of the Provincial Governor’s Office, which may be a
problem performing the KPIs in the provinces.

216
If the criteria of the incentive allocation were not clear, a different reward allocation
could be found at the inter-personnel level such as between responsible and non-
responsible ones and between the superiors and the employees as explained below:
“A problem of reward allocation was that the officials who were not responsible for the
KPIs as their tasks did not directly involve with the KPIs felt they gained less incentive
than the responsible ones. This might lead to disagreement among the staff.”
(Practitioner, Provincial Employment Service Office, 24 July 2014: PH2)
“A problem of incentive allocation was the leaders. If the leader gained much more
reward than the subordinates, it might bring disharmony in the agency.” (Senior
manager, Chief of Provincial Public Health Office, Provincial Public Health Office, 28
July 2014: PL1)
“Difference in getting a financial reward between the officials might lead to a loss of
trust in each other.” (Senior manager, Chief Provincial Administration Office,
Provincial Administration Office, 13 August 2014: PH1)
Moreover, the different number of officials in the level of provinces and agencies
appeared to be a challenge of the reward allocation in a province, and could lead to
perceptions of unfairness:
“When I worked in a small province with less staff members, the reward was distributed
among a small group of officials. Consequently, the proportion of the reward was much
217
bigger. In my current job, it is a bigger province with more staff members, the
proportion of the reward, as a result, is very small. ” (Practitioner, Provincial
Employment Service Office, 24 July 2014: PH2)
“The reward distribution system is not fair. For example, the agencies with a large
number of officials worked hard, but each one gained a little reward because it had to
be divided between so many people. Meanwhile, the others with a small number of
officials had a smaller workload, but each one received a bigger portion.” (Senior
manager, Chief of Provincial Public Health Office, Provincial Public Health Office, 28
July 2014: PL1)
“There were three levels of the officials: chief executive, middle managers, and first-
line officers. Some agencies had a large number of middle managers and a small
number of first-line officers. When the reward was divided evenly according to the
number of officials, the officials in middle management positions might receive even less
reward than those first-line officers. Thus, the criteria should be revised. The current
criteria might be the cause of disharmony, and jealousy among the officials which would
affect cooperation in the future.” (Practitioner, Provincial Livestock Office, 24 July 2014:
PH2)
In addition, a problem of perceptions of unfairness of reward allocation was found among
the central government agencies working alongside the provincial administration. This
seems to derive from the criteria of incentive allocation indicated by the OPDC, namely
218
the central agencies at the provincial administration had to receive reward from their
parent ministries or departments. This idea is illustrated by one of the officials stating:
“The provinces could achieve in the KPIs by cooperation of the central government
agencies in the region. However, these agencies could not get the incentive from the
provinces as the OPDC indicated. They had to get the incentive from the central
government.” (Senior manager, Chief of Strategy for Province Development Group,
Provincial Governor’s Office, 13 August 2014: PH1)
As stated earlier, unfairness of the criteria of reward allocation may lead to a discrepancy
between the amount of rewards in the levels of provinces, agencies and individuals,
which may undermine the workforce’s morale in performing the KPIs, losing trust
between the agencies, and decreasing collaboration among the agencies. It is important
to note that the senior managers in the high KPI scoring provinces seem to show concern
regarding equity of the incentive allocation, which indicates a good signal in terms of
the reward management.
Thirdly, a small amount of the financial reward played a significant effect on
performance in terms of people’s motivation. These points are set out below:
“These days, the reward was less. Therefore, the officials were less motivated.” (Senior
manager, Chief of Provincial Community Development Office, Provincial Community
Development Office, 22 July 2014: PL2)

219
“We had less incentive in comparison with the local government agencies. Their annual
reward was 4-5 times of their salary. In contrast, the provincial agencies received much
less reward.” (Senior manager, Chief of Strategy for Province Development Group,
Provincial Governor’s Office, 22 July 2014: PL2)
This implies that people in the low KPI scoring provinces tend to focus on amount of
the financial reward more than the high KPI scoring provinces. The lower KPI scoring
provinces perhaps demonstrate a higher degree of individualism and consequently a
greater focus on extrinsic motivation, such as money.
Fourthly, some officials mentioned that the possibility of sanctions or high incentives
could lead to attempts to fabricate performance data in order to receive high scores in
some agencies or provinces. One of the respondents suggested:
“The result of performance evaluation might provide either strong punishment or high
incentive. These might lead the officials in attempting to fabricate the evidence.” (Senior
manager, Chief of Provincial Public Health Office, Provincial Public Health Office, 28
July 2014: PL1)
Not all respondents were concerned with the criteria of incentive allocation:
“Some officials were likely to pay little attention to how much financial reward was
allocated for them.” (Practitioner, Provincial Public Health Office, 28 July 2014: PL1)
220
6.3.8 Recommendations to improve the criteria of incentive allocation
In terms of recommendations for improvement of the criteria of the incentive allocation,
officials suggested that reward should be improved in terms of (1) providing for the
clearer criteria of the reward allocation; (2) increasing the amount of the financial
reward; (3) generating new forms of incentive; (4) other suggestions and cancellation of
reward. These features are explained as follows.
Firstly, the majority of interviewees suggested that the criteria of incentive allocation
should be changed to provide clearer criteria. Particularly, it should be clear about the
different amount of reward between responsible and non-responsible persons for the
KPIs; the different number of officials in the level of provinces and agencies; the
different amount of reward between the main and second KPI host agencies; and the
different amount of reward between the senior managers and practitioners, including
other related suggestions. These ideas are illustrated below:
“The criteria of reward allocation should be clearer between the officials involved and
not involved with the KPIs. Some kinds of tasks were not selected as the KPIs, but the
tasks were, perhaps, the important tasks of the provinces. Hence, the officials who
performed these tasks should be considered for the incentive as well as the responsible
ones for the KPIs.” (Practitioner, Provincial Governor’s Office, 13 August 2014: PH1)
“The criteria of incentive allocation should be considered in terms of the number of
officials in each KPI host agency because it might lead to complaints about different
221
rewards among the agencies.” (Senior manager, Chief of Provincial Governor’s Office,
Provincial Governor’s Office, 28 July 2014: PL1)
“I think the main KPI host agencies deserved to have more reward than the secondary
host agencies because they worked harder.” (Practitioner, Provincial Livestock Office,
28 July 2014: PL1)
“The criteria of reward between the senior managers and practitioners should be
improved. It should not be much different.” (Senior manager, Chief of Provincial
Community Development Office, Provincial Community Development Office, 22 July
2014: PL2)
The senior managers in the low KPI scoring provinces appear to be more dissatisfied
with the criteria of reward allocation than the high KPI scoring provinces, perhaps
because their motivation is more dependent on extrinsic rewards. Some senior managers
claimed that they should receive the same rate or higher rate of reward than the
practitioners as indicated in the following statements:
“I think the criteria of incentive allocation were not fair for the leaders. In the past, the
leaders received more financial reward than the subordinates. These days the
subordinates received much more than the leaders. In fact, the KPIs would not have
been achieved without the support from the leaders. Hence, reward allocation should
be at least the same proportion between the leaders and practitioners.” (Senior
222
manager, Chief of Provincial Employment Service Office, Provincial Employment
Service Office, 24 July 2014: PH2)
“I agree with the criteria of reward by the OPDC, but I think the reward for the leaders–
Governor, Vice Governor, and chiefs of the agencies – seemed to be less than the
practitioners. As a result, the leaders’ morale might be decreased. Thus, the reward
allocation for the leaders should be increased.” (Senior manager, Chief of Provincial
Governor’s Office, Provincial Governor’s Office, 28 July 2014: PL1)
The perceived inequity of the reward allocation between the senior managers and
practitioners could affect leaders’ motivation regarding the KPIs and have knock-on
effects in terms of their staff’s motivation.
Some officials offered recommendations for improving the criteria of reward allocation.
For example, dispersion of the KPIs for more agencies and individuals, and using other
forms of the criteria of reward allocation. The respondents suggested that:
“Working in the KPIs should be dispersed for more officials. Exactly, there were only a
few officials doing the KPIs in the agency… The criteria of reward should be improved
and clearer.” (Senior manager, Chief of Provincial Livestock Office, Provincial
Livestock Office, 28 July 2014: PL1)
“The money reward should be divided into two parts. The first part provided to the
agencies for developing their work. The other part was allocated based on the OPDC’s
223
criteria such as proportion of 30:70 or 50:50. The first proportion, 30 or 50 percent,
was allocated to every official in the province as a gift of participation. The second
proportion, 70 or 50, was allocated to only the officials who were responsible for the
KPIs.” (Senior manager, Chief of Strategy for Province Development Group, Provincial
Governor’s Office, 13 August 2014: PH1)
Secondly, several respondents revealed that the current financial reward seemed to be
not much for the motivation of people. They suggested that one of the ways of improving
rewards was to increase the amount of money. The officials elucidated that:
“The only change that I needed was to increase amount of the financial reward. It would
be more of a motivation for the officials to do their jobs.” (Practitioner, Provincial
Community Development Office, 22 July 2014: PL2)
“The amount of the reward should be increased more than the present.” (Senior
manager, Chief of Provincial Governor’s Office, Provincial Governor’s Office, 28 July
2014: PL1)
“We needed more incentive by the central government... The leaders – Governor, Vice
Governor, and chiefs of the agencies – had to be responsible for the KPI failure by, for
example, being transferred if they failed to achieve the KPI targets.” (Senior manager,
Chief of Provincial Administration Office, Provincial Administration Office, 13 August
2014: PH1)
224
Thirdly, some respondents suggested that new forms of incentives should be considered
such as promoting to a higher position, increasing salary, receiving training, learning
from best practices at home or abroad:
“The characteristics of the reward should be varied such as being promoted to a higher
position, getting training, having official visits to other organisations in the country or
overseas. The reward criteria have to be clear. Like the pay rise system, the percentage
of the reward allocation must be clearly stated.” (Senior manager, Chief of human
resource management group, Provincial Governor’s Office, 22 July 2014: PL2)
“I disagreed with the financial reward because it was not much. The feature of the
reward should be changed from the financial reward to better resources for agencies
such as a government agency vehicle or equipment for working.” (Senior manager,
Chief of Provincial Livestock Office, Provincial Livestock Office, 24 July 2014: PH2)
“The new forms of the reward should be created when the officials could achieve the
KPIs, for example, providing 4-5 times of the salary reward, giving better welfare, and
promoting to a higher position... Without the right motivation, the officials might refuse
to work on KPIs in the future.” (Senior manager, Chief of Strategy for Province
Development Group and Chief of human resource management group, Provincial
Governor’s Office, 22 July 2014: PL2)
These ideas reflect that a number of the officials seem to require the central government,
the OPDC, to review the financial reward and consider new forms of the reward. It might

225
contribute to more motivation in implementing the KPIs, although, as noted above, high
performing provinces were not primarily concerned with rewards. This does not mean
that increasing rewards might not positively impact on the motivation of lower
performing provinces.
Finally, the interviewees recommended other issues suggesting that the leaders’
explanation regarding reward allocation was required. This may enhance understanding
between the employees and may prevent disharmony about monetary reward. One of
the practitioners stated that:
“In our province, 3-5 meetings were organised to come up with the best criteria for
reward allocation. The leaders proposed different formulas to the officials to consider
and voted for the best one. The officials took part in the process.” (Practitioner,
Provincial Employment Service Office, 24 July 2014: PH2)
In addition, there were a few suggestions about whether the financial reward should be
cancelled altogether because of the complicated allocation of the reward, especially in
the level of provinces and agencies:
“The financial reward should not be abolished. We know there have been problems with
the reward allocation criteria. We should aim to resolve the issue and create a better
system.” (Practitioner, Provincial Livestock Office, 24 July 2014: PH2)
226
“We created several formulas for payment calculation of financial reward to the
agencies…It was difficult and complicated and it might be better without the money
reward. The officials who were responsible for the KPIs sometimes received the same
reward as those who were not responsible. As a result, their morale to do the tasks was
destroyed. Then, I had to call for a meeting to explain how the reward was allocated. I
think it’s probably better to abolish the reward system.” (Senior manager, Chief of
Provincial Livestock Office, Provincial Livestock Office, 24 July 2014: PH2)
However, one of the respondents argued that cancellation of the reward might contribute
to a lack of enthusiasm in performing the KPIs in the civil servants. He recommended
that new improved alternatives for the reward allocation should be considered as
follows:
“Abolition of the reward allocation might lead to lack of motivation and enthusiasm
among the officials to do the jobs. The OPDC had to develop new criteria for incentive
allocation based on the KPIs.” (Senior manager, Chief of human resource management
group, Provincial Governor’s Office, 13 August 2014: PH1)
6.4 Performance, outputs and outcomes
This section reports on the data related to performance, outputs and outcomes in
the process of PA. There are three stages of the system of PA as shown in Figure 43,
including inputs (capabilities of individuals and teams, and promulgation of PA in each
fiscal year); processes (factors to influence performance); and outputs and outcomes

227
(advantages and disadvantages in getting high and low KPI scores, opinions on outputs
and outcomes of PA, and recommendations for PA).
Figure 43 Performance, outputs and outcomes in the system of PA
6.4.1 Capabilities of individuals and teams
The officials’ competencies were a significant element in achieving the KPIs, including
collaboration, teamwork, potential of the team of the Provincial Governor’s Office, and
potential of the KPI host agencies. It was found that collaboration between the agencies
and officials plays a crucial impact on attainment of the KPIs as stated below:
“We could achieve KPI goals, if we receive cooperation from the officials within our
agency. A meeting concerning the announcement of policy was important in creating
recognition and corrective performance among the officials, particularly the level of the
practitioners.” (Senior manager, Chief of Provincial Employment Service Office,
Provincial Employment Service Office, 24 July 2014, PH2)
Outputs/Outcomes
Inputs
1. Capabilities of individuals
and teams
Collaboration
Teamwork
Potential of the team of
Provincial Governor’s Office
Potential of the KPI host
agencies (e.g. enthusiasm,
responsibilities, sharing
information)
Processes
1. Advantages and
disadvantages in
achieving high and low
KPI scores
Achieving high KPI
scores
Achieving low KPI scores
2. Opinions on outputs and
outcomes of PA
Agreed
Disagreed
Neither agreed nor
disagreed
3. Recommendations for
PA
Factors to influence
performance
Understanding of
standard of the KPIs
Transparency to
perform the KPIs
Experience from
previous years
Meeting-related
performance
Attributes of
provinces (e.g. size,
culture)
2. Promulgation of PA in each
fiscal year
List of the KPIs
Time frame of performance
evaluation

228
“We could not get collaboration from some agencies, particularly the central
government in provinces because they did not receive benefits and believed that they
were overwhelmed by their routine jobs.” (Senior manager, Chief Provincial
Governor’s Office, Provincial Governor’s Office, 28 July 2014: PL1)
This implies that achieving PA is found in the provinces with a high degree of cohesion
or participation – characterized by collectivism or strong clan culture. In the low KPI
scoring provinces, there appears to be a low level of collaboration between the agencies,
particularly the central government agencies at the provincial administration – and a
leaning towards individualism. The data suggested that the officials in the low KPI
scoring provinces tended to focus on their routine jobs rather than the KPIs. On the other
hand, people in the high KPI scoring provinces tended to be conscientious because the
chiefs of agencies introduced clear policies and created recognition of the tasks among
the staff as the first priority.
Many respondents referred to teamwork, which was viewed in terms of integrated
collaboration in the provinces – achieving the KPIs in each agency leading the overall
PA result of the provinces. One of the respondents elucidated that:
“The crucial factors for success are working as a team or integrated agencies as the
OPDC suggested. Establishment of stages for discussion, communication, and
monitoring through meetings was important to accomplish KPI targets.” (Senior

229
manager, Chief of human resource management group, Provincial Governor’s Office,
22 July 2014, PL2)
Here it suggests that teamwork can be created by good communication, discussion, and
monitoring progress of the KPIs. PA probably serves to strengthen partnership or
collectivism in terms of pursuing achievement in the overall PA result of the provinces.
The officials also commonly mentioned the significant role of the team of Provincial
Governor’s Office, which directly affects the officials’ performance implementing the
KPIs. The practitioners illustrated that the Governor’s Office team was viewed as
a mentor for the agencies regarding the KPIs and was sometimes responsible for
performing the KPIs when some KPI host agencies did not take responsibilities for
their KPIs:
“Fortunately, the agencies in our province trusted the team of Provincial Governor’s
Office in terms of our professionalism and transparency.” (Senior manager, Chief of
Strategy for Province Development Group, Provincial Governor’s Office, 13 August
2014: PH1)
“I had experience working in three provinces. If the key figure from the Provincial
Governor’s Office was not competent, assigning work to other agencies without any
guidelines, the agencies could not do a good job.” (Practitioner, Provincial
Employment Service Office, 24 July 2014: PH2)

230
“We received low KPI scores because when we assigned the KPIs to some agencies,
they claimed they did not have a responsible person. We, the Provincial Governor’s
Office, then had to be accountable for those assigned KPIs. We had to do everything
ourselves.” (Senior manager, Chief of human resource management group, Provincial
Governor’s Office, 22 July 2014: PL2)
The data suggested that the Governor’s Office team in the high KPI scoring provinces
tended to perform better than the low KPI scoring provinces. This can be observed in
the lower level of inter-agency collaboration in the low KPI scoring provinces.
“All KPI host agencies had to be conscientious of their own KPIs when the Governor
paid attention to the KPIs. They were expected to report the progress of the KPIs with
the Governor through the meetings.” (Practitioner, Provincial Governor’s Office, 13
August 2014: PH1)
“The KPI host agencies might raise their problems of the KPIs in the meetings. If the
other agencies had any information and recommendations, the problems might be
resolved.” (Senior Manager, Chief of Provincial Livestock Office, Provincial Livestock
Office, 24 July 2014: PH2)
“The persons involved with the KPIs were invited to attend the meetings and share with
us the problems they were facing, for example, why we could not reach the targets of
the KPIs. This discussion might lead to resolving problems and achieving the goals of

231
the KPIs.” (Senior manager, Chief of Provincial Community Development Office,
Provincial Community Development Office, 22 July 2014: PL2)
The meetings seem to be a significant element shaping the KPI host agencies’
performance in approaching the goals of the KPIs such as monitoring progress of the
KPIs, sharing ideas, and solving the problems. The senior managers in the high KPI
scoring provinces appear to highlight the communication between the officials more
than those in the low KPI scoring provinces. This can be observed through having
formal meetings with the Governor and solving the problems together.
6.4.2 Promulgation of PA in each fiscal year
Some respondents revealed that the delay of the promulgation of PA in each fiscal year
could have an impact on civil servants’ performance on the KPIs. For example, a delay
during introduction of the KPI lists perhaps led to various challenges such as a delay in
planning tasks and a delay in collecting data, especially the KPIs based on the processes
of the tasks. One of the interviewees stated that:
“In the past, an announcement of the list of KPIs was made quite early on, so we could
plan the tasks at the beginning of the fiscal year and could achieve over 50% of the total
number of KPIs in six months. On the other hand, at present, we could not perform the
tasks on time because the delay in an announcement of the list of KPIs, particularly the
KPIs which emphasised on the process of the jobs. This might lead to output fabrication
to achieve the targets of KPIs.” (Senior manager, Chief of Strategy for Province
Development Group, Provincial Governor’s Office, 13 August 2014: PH1)

232
The implication of the promulgation of performance evaluation significantly influences
performance on the KPIs. The data suggest that the delay in introducing PA perhaps
contributes to fabrication of the outputs.
6.4.3 Factors influencing performance
This section summarises the factors influencing performance under five categories:
(1) understanding the standard of the KPIs, (2) transparency to perform the KPIs,
(3) experience from previous years, (4) meetings-related performance, and
(5) attributes of the provinces.
(1) Understanding the standard of the KPIs
The officials responsible for the KPIs require understanding of the standards of the KPIs
viewed as a prior element to performing the KPIs. The officials illustrated that:
“A clear standard of the KPIs could contribute to the practitioners’ satisfaction. The
KPIs were viewed as a plan for working.” (Senior manager, Chief of Provincial
Livestock Office, Provincial Livestock Office, 29 July 2014: PL1)
“We found that our staff had a problem of the understanding of the standard of KPIs. The
practitioners sometimes could not understand what they were expected to do through the
KPIs.” (Practitioner, Provincial Governor’s Office, 13 August 2014: PH1)
A clear standard in the KPIs was seen to be essential, particularly for the practitioners.
The data suggested that an unclear standard of the KPIs led to diversity of interpretation
233
among people. The attributes of the KPIs perceived by the individuals influenced
attainment of the KPIs. For example, over-challenging targets may contribute to
operational problems, lower motivation and fabrication of evidence:
“The targets of KPIs were sometimes too challenging and not achievable. If we could
not get the highest score at 5, we might be blamed by the leaders. So, we had to find any
possible ways to achieve high KPI scores.” (Practitioner, Provincial Employment
Service Office, 24 July 2014: PH2)
This suggests that setting targets of the KPIs that are too challenging can influence
performance of people and use of techniques in achieving high KPI scores. However,
there were some officials who argued that performing the KPIs did not seem to be
difficult, especially some KPIs implemented for many fiscal years as the following
account:
“When working with the same KPIs for several years, the problems have been resolved.
The KPIs for food safety, for example, have been done for many years and it is not too
difficult anymore.” (Senior manager, Chief of Provincial Public Health Office,
Provincial Public Health Office, 28 July 2014: PL1)
(2) Transparency to perform the KPIs
The data suggested that using the same standard of the KPIs – changing only KPI targets –
for several fiscal years might contribute to resolving some problems with public
services. On the contrary, the practitioners may learn to employ techniques in achieving
234
high scores from these KPIs. This may create a challenge to transparency as the
following statement suggests:
“There were several methods approaching maximum score at 5… Some KPIs were not
much different from the previous year. The responsible persons have learned the
techniques of how to achieve high scores.” (Senior manager, Chief of Provincial Office
of Disaster Prevention and Mitigation, Provincial Office of Disaster Prevention and
Mitigation, 22 July 2014: PL2)
Transparency performing the KPIs is perhaps a challenge of PA in the provinces. Some
respondents revealed that the problem of transparency could be seen throughout the
process of PA such as selection of the tasks to assess as KPIs, collecting data and
evidences for the KPIs, and reporting information to the assessors. These issues are
illustrated by the following accounts:
“A number of provinces selected only tasks they knew they could achieve the high scores
of KPIs.” (Practitioner, Provincial Livestock Office, 28 July 2014: PL1)
“It was possible that some provinces chose not to include certain information if it made
the scores lower.” (Practitioner, Provincial Office of Disaster Prevention and
Mitigation, 22 July 2014: PL2)
“Some provinces hired consultants, the educational institutions, to do the KPIs because
they had the budget to do so.” (Senior manager, Chief of Provincial Governor’s Office,
Provincial Governor’s Office, 28 July 2014: PL1)
235
“We learned from the other provinces how they received high scores of the KPIs and
also studied the standard of the KPIs.” (Practitioner, Provincial Public Health Office,
28 July 2014: PL1)
The officials in the low KPI scoring provinces seem to provide much evidence regarding
the problem of transparency performing the KPIs. It implies that the officials in the low
KPI scoring provinces perhaps attempt to use some shortcut techniques to achieving
high KPI scores, but not with success.
(3) Experience from previous years
Some provinces claimed that they achieved the high KPI scores by drawing on
experience from previous years. They pointed out that they learned information
regarding the KPIs in the previous fiscal year, especially the problems of the KPIs and
the targets of the KPIs. The respondents stated that:
“We used last year’s information to compare and improve our performance. We used
the KPI to improve our agency and our team.” (Practitioner, Provincial Employment
Service Office, 24 July 2014: PH2)
“The targets of the KPIs in the last year were compared with the present one.”
(Practitioner, Provincial Governor’s Office, 28 July 2014: PL1)

236
“Reviewing the result of performance and then the plans were designed for working of
the KPIs.” (Practitioner, Provincial Office of Disaster Prevention and Mitigation, 13
August 2014: PH1)
“We reviewed information of the KPIs by documents and discussion. The team of
responsible persons and chiefs of the agencies would be invited to participate through
the meetings.” (Practitioner, Provincial Governor’s Office, 24 July 2014: PH2)
(4) Meetings-related performance
The meetings appear to be an important opportunity for discussing and planning the
targets of the KPIs in the current year. The respondents perceived that achieving the
KPIs derived from the meetings because it was a stage for exchanging ideas and
monitoring progress of the KPIs, enabling understanding, and generating participation
and accountability. Furthermore, the meetings were an opportunity to strengthen morale
by informing the result of performance appraisal of the provinces. These factors are
elucidated below:
“The meetings could enhance understanding, accountability, and participation for the
officials in order to achieve the KPIs.” (Senior Manager, Chief of Provincial Livestock
Office, Provincial Livestock Office, 29 July 2014: PL1)
“An advantage of the meetings was to emphasise the officials’ duties to the KPIs. The
responsibilities would be created and then they had to perform their best.” (Senior
237
Manager, Chief of Provincial Office of Disaster Prevention and Mitigation, Provincial
Office of Disaster Prevention and Mitigation, 13 August 2014: PH1)
“The Provincial Governor’s Office hosted regular meetings to exchange ideas. The
results of the meetings could encourage the officials to improve and solve problems
related to the KPIs.” (Practitioner, Provincial Livestock Office, 28 July 2014: PL1)
“The meetings were important in terms of monitoring the progress of the KPIs in the
period of 6, 9, and 12 months.” (Practitioner, Provincial Office of Disaster Prevention
and Mitigation, 13 August 2014: PH1)
“We would report the result of performance evaluation of the province by the monthly
meetings. The KPI host agencies were recognized.” (Senior Manager, Chief of
Provincial Governor’s Office, Provincial Governor’s Office, 28 July 2014: PL1)
(5) Attributes of the provinces
A number of respondents revealed that the attributes of the provinces such as size of
area and number of districts were significant in determining performance of the
agencies:
“One of the factors contributing to getting a high score in the provinces was the size of
provincial area. It was easier and quicker to collect data in smaller provinces.” (Senior
manager, Chief of human resource management group, Provincial Governor’s Office,
24 July 2014: PH2)

238
“It might be easier to achieve KPIs in smaller provinces. However, if a smaller amount
of budget was allocated to those provinces, they might not be able to do a good job.”
(Senior manager, Chief of human resource management group, Provincial Governor’s
Office, 13 August 2014: PH1)
“Each province has a different characteristic…. A large province consists of 25 districts
while a small one consists of 8 districts. It might be more difficult for the large
province.” (Senior manager, Chief of Provincial Office of Disaster Prevention and
Mitigation, Provincial Office of Disaster Prevention and Mitigation, 13 August 2014:
PH1)
These statements imply that a small provincial area and a small number of districts may
be advantages in terms of time management such as quicker data collection and saving
time in communication between the agencies. On the contrary, it can be noticed that the
larger provinces probably receive a higher rate of budget allocation than the smaller
provinces.
Moreover, the respondents declared that specific characteristics of the provinces such
as tourist and non-tourist provinces, diversity of cultures for working and diversity of
demography might influence performance in the KPIs. These ideas are illustrated by the
KPI host agencies responsible for reducing the number of accidents on the roads as
follows:
239
“Some provinces with less tourist attractions could achieve high KPI scores without
having to do anything much as the number of accidents was low anyway. On the
contrary, a province with many tourist attractions would have a higher number of
accidents, especially during the holidays.” (Senior manager, Chief of Provincial Office
of Disaster Prevention and Mitigation, Provincial Office of Disaster Prevention and
Mitigation, 13 August 2014: PH1)
“The culture of working in each province was different. I had the experience working
in a province where I had an add-on task to organize the meetings, welcome the guests,
and look after important delegates. So, I did not have much time to generate the new
ideas about how to improve the jobs. In the current province, I had more time to create
my jobs.” (Senior manager, Chief of Provincial Office of Disaster Prevention and
Mitigation, Provincial Office of Disaster Prevention and Mitigation, 13 August 2014:
PH1)
In addition, the interviewees revealed that they had to confront external factors such as
the government’s policies and a delayed budget allocation from the central government.
For example, the government provided the policy of buying the first new car with the
government’s support in taxes. This conflicted with the target of the KPI that required
reducing the number of accidents on the roads. These ideas are illustrated by the
following examples:

240
“The allocation of the budget from the central government was sometimes delayed. It
might affect the provinces to do the jobs.” (Senior manager, Chief of Provincial
Administration Office, Provincial Administration Office, 13 August 2014: PH1)
“In 2011-2012, the number of accidents was increased due to the policy of the first new
car...The government policy conversed with practice and also decreasing budget.”
(Practitioner and senior manager, Chief of Provincial Office of Disaster Prevention and
Mitigation, Provincial Office of Disaster Prevention and Mitigation, 13 August 2014:
PH1)
6.4.4 Advantages and disadvantages in achieving high and low KPI scores
The respondents perceived that achieving high or low KPI scores had advantages and
disadvantages to the officials at three levels: provinces, agencies and individuals. These
results tended to lead to various effects in terms of feeling, reward and effectiveness of
tasks. Meanwhile, some argued that these scores did not have any influence.
Advantages in achieving high KPI scores
The majority of interviewees declared that achieving high KPI scores seemed to bring
many benefits for them such as a good feeling (e.g. self-esteem, proud, trust and
prestige), and a high level of reward. The effective upon the individuals’ feelings was
commonly mentioned by the respondents, particularly self-esteem as follows:
“The agencies gained trust between each other. The practitioners gained self-esteem
and were proud to maintain the targets of the KPIs.” (Senior manager, Chief of

241
Provincial Community Development Office, Provincial Community Development
Office, 22 July 2014: PL2)
“Admittedly, we compared our results of the KPIs with other provinces’ performance.
We were held in high esteem when we managed to achieve higher scores.” (Senior
manager, Chief of human resource management group, Provincial Governor’s Office,
13 August 2014: PH1)
“The province was developed due to the KPIs, I was proud of working for the KPIs
because this province was my hometown. Furthermore, the team of Provincial
Governor’s Office also created an environment of collaboration.” (Practitioner,
Provincial Employment Service Office, 24 July 2014: PH2)
“I don’t think receiving a financial reward is the main focus these days, but getting high
scores seemed to acquire prestige from other provinces because it reflected the result
of collaboration in the provinces.” (Senior manager, Chief of Strategy for Province
Development Group, Provincial Governor’s Office, 13 August 2014: PH1)
Some officials were intrinsically motivated regarding the KPIs. While others might be
motivated by the financial reward linked to the result of the KPI scores:
“The financial reward was calculated based on the KPI scores of the provinces. If we
got the high scores, we could get a large amount of money.” (Senior manager, Chief of

242
Provincial Office of Disaster Prevention and Mitigation, Provincial Office of Disaster
Prevention and Mitigation, 22 July 2014: PL2)
“When the annual bonus budget from the central government was cut, the officials lost
their interest in performing KPIs as they were not motivated by the incentive.” (Senior
manager, Chief of Provincial Employment Service Office, Provincial Employment
Service Office, 23 July 2014: PH2)
Disadvantages in getting low KPI scores
Achieving a low KPI score was reported by officials as having an emotional impact
(disappointment, self-respect), a financial impact (loss of anticipated reward) and (for
senior managers) loss of professional reputation.
“If the agency gained the low score, it might be viewed that the agency did not pay
attention to the KPIs. This could lead to a loss of reputation of the agency, reduction of
collaboration between the agencies.” (Senior manager, Chief of Provincial Community
Development Office, Provincial Community Development Office, 22 July 2014: PL2)
“Getting the low score could influence the feeling of the staff and the allocation of the
financial reward because amount of reward was linked with the scores of the KPIs.”
(Practitioner, Provincial Livestock Office, 24 July 2014: PH2)
243
“If we received a low score, it reflected the competency of the organization’s executive.
It implied that the leaders could not manage the subordinates.” (Senior manager, Chief
of Provincial Public Health Office, Provincial Public Health Office, 28 July 2014: PL1)
“Getting the low score could reflect several aspects of the organization such as
teamwork, the actual problems on the tasks, and competency of solving the problems.
The organization might be closely scrutinised.” (Senior manager, Chief of Provincial
Livestock Office, Provincial Livestock Office, 28 July 2014: PL1)
Achieving low KPI scores seemed to reflect the degree of collaboration and teamwork
(participation) and competencies of HRM and solving the problems (effectiveness). The
respondents also revealed that achieving low KPI scores could produce both positive
and negative effects as indicated in the following statement:
“Getting the low score could have two effects. Firstly, it could stimulate the officials’
enthusiasm to work. Secondly, moral support of the officials could be decreased.”
(Practitioner, Provincial Livestock Office, 24 July 2014: PH2)
Meanwhile, there were some respondents that tended to believe that getting high or low
KPI scores was not likely to affect them:
“I think that getting a low score did not affect the agency.” (Senior manager, Chief of
Provincial Office of Disaster Prevention and Mitigation, Provincial Office of Disaster
Prevention and Mitigation, 13 August 2014: PH1)
244
“If we gained a low score of the KPIs, there was no punishment. So, it was only the
recognition of getting a low score.” (Senior manager, Chief of Provincial
Administration Office, Provincial Administration Office, 13 August 2014: PH1)
Such lack of concern might reflect weak promotion of the KPIs by management or may
just be a symptom of traditional bureaucratic culture in which work is done only because
policy, command or the possibility of sanction requires it, or both.
6.4.5 Outputs and outcomes of PA
Agreement with outputs and outcomes of PA
The majority of respondents perceived that having the KPIs contributed to performance
by setting targets, encouraging collaboration between agencies or individuals,
encouraging readiness for change, and responding to citizens’ needs, all of which meant
that work was different from before:
“Performance evaluation and KPIs were very useful. In the past, we did not have any
targets or objectives. The KPIs helped us set a clear focus in our work.” (Senior
manager, Chief of human resource management group, Provincial Governor’s Office,
13 August 2014: PH1)
“In the past, each agency worked independently. Now, several agencies are accountable
for the same KPIs. Thus, we learned to collaborate.” (Senior manager, Chief of
Provincial Office of Disaster Prevention and Mitigation, Provincial Office of Disaster
Prevention and Mitigation, 13 August 2014: PH1)

245
“There were a lot of changes in the public service from 2003 when we had the principle
of good governance. The officials were to respond to the changes and the needs of the
public more quickly.” (Senior manager, Chief of Strategy for Province Development
Group, Provincial Governor’s Office, 22 July 2014: PL2)
As stated earlier, the respondents appear to agree that PA can contribute several
advantages, for example pursuing targets of achievement (market culture), generating
collaboration (clan culture), and responding to needs of citizens (adhocracy culture),
and in particular, improvement of many agencies who directly deliver public services to
citizens. One of the respondents explained as follows:
“There were several types of public services that distinctly improved. For example,
services of land transport office, revenue office, and public health hospitals.”(Senior
manager, Chief of Strategy for Province Development Group, Provincial Governor’s
Office, 13 August 2014: PH1)
A number of interviewees revealed that one advantage of PA appeared to be its use of a
concrete and transparent criteria of performance measurement:
“The use of KPI scores was concrete, transparent, and fair to measure the performance
and outcomes.” (Senior manager, Chief of Provincial Livestock Office, Provincial
Livestock Office, 28 July 2014: PL1)

246
Furthermore, high KPI scores seemed to confirm that the administration was achieving
development objectives:
“The high score could reflect that the tasks were well done. If the tasks were efficient,
our province would be developed although we might not gain the reward.”
(Practitioner, Provincial Employment Service Office, 24 July 2014: PH2)
“Basically, getting high scores reflected that we could perform the tasks with efficiency
and effectiveness. This might contribute to better allocation of budget for development
of the provinces, solving problems, and responding to the local citizens’ needs.” (Senior
manager, Chief of Provincial Livestock Office, Provincial Livestock Office, 28 July
2014: PL1)
Disagreement with outputs and outcomes of PA
On the contrary, others disagreed with outputs and outcomes of PA. They argued that
the results of the KPIs might not accurately reflect the performance or efficiency of the
civil service. For example, not all the tasks of the provinces were selected to be the KPIs
which meant there were some officials not related to the KPIs. Meanwhile, the result of
any assessment had to consider the process of achieving scores and transparency as
illustrated below:
“I believed that the KPIs demonstrated around 5-10% of the actual performance
because the rest of the performance indicated in the KPI report was fabricated to get
247
high scores.” (Senior manager, Chief of human resource management group,
Provincial Governor’s Office, 24 July 2014: PH2)
“The tasks selected for the KPIs did not reflect all the mission statements of the
province.” (Senior manager, Chief of Strategy for Province Development Group,
Provincial Governor’s Office, 13 August 2014: PH1)
One of these officials nonetheless accepted that the KPI score could reflect the outputs
and outcomes of performance:
“The KPI score might reflect efficiency of work. Although we primarily did it to keep
ourselves in the job, the work we did was based on the actual tasks.” (Practitioner,
Provincial Employment Service Office, 24 July 2014: PH2)
Another official provided additional information, that PA may reflect outputs and
outcomes of performance if there were standards of assessment:
“The performance evaluation could reflect the efficiency of the organisation if the
information obtained in the evaluation was correct.” (Senior manager, Chief of
Provincial Governor’s Office, Provincial Governor’s Office, 28 July 2014: PL1)
248
6.4.6 Recommendations for PA
Respondents suggested that PA should be improved in terms of the service provide by
the central government, specially the OPDC, particularly in terms of setting the KPIs
and the criteria of incentive allocation:
“The performance evaluation should be prepared at least a year in advance to be in
accordance with the budget proposal.” (Senior manager, Chief of Strategy for Province
Development Group, Provincial Governor’s Office, 22 July 2014: PL2)
This may decrease pressure on the provinces regarding the timeframe for performance
of the KPIs. Furthermore, the OPDC was likely required to provide opportunities for
sharing ideas and more supporting factors (e.g. manual books of the KPIs) as follows:
“There should be a face-to-face discussion between host agencies and the OPDC
instead of the existing time consuming telephone or memo correspondence.”
(Practitioner, Provincial Governor’s Office, 13 August 2014: PH1)
“I would like to have more manuals on how to do the KPIs. There is a lot of information
and I don’t think I have a great depth of understanding yet.” (Practitioner, Provincial
Governor’s Office, 28 July 2014: PL1)
Significantly, a number of officials indicated that the pattern of setting the KPIs should
shift from top-down to bottom-up:
249
“The KPIs were established in a top-down manner. Consequently, the KPIs were not
viewed as a part of the officials’ tasks. Thus, these KPIs should be characterised in a
bottom-up process and linked with the provincial developing plan.”(Senior manager,
Chief of human resource management group, Provincial Governor’s Office, 13 August
2014: PH1)
Here, the officials appear to perceive that they work in a controlled system or chain of
command. They tend to require change from hierarchy (e.g. policies, and commands) to
participation (e.g. a voice to generate the KPIs). In addition, some officials suggested
that the PA scheme should be abolished. This idea is elucidated below:
“The reason why performance evaluation should be abolished was that the officials were
required to comply with government policies as well as the superiors’ command. They
were not likely to have freedom of thought.”(Senior manager, Chief of Provincial
Employment Service Office, Provincial Employment Service Office, 23 July 2014: PH2)
This implies that some officials disagreed with performing the KPIs because it involved
excessive control. Other officials argued that PA scheme should be maintained further,
but that the methods should be revised as follows:
“Performance evaluation should be maintained, but a new method is required. The KPIs
need to be in accordance with the regular tasks. It should be better than working without
any KPIs at all.” (Practitioner, Provincial Livestock Office, 28 July 2014: PL1)

250
6.5 Summary
This chapter reports the results of the qualitative data analysis divided into three
categories: (1) leadership; (2) human resources and reward; and (3) performance,
outputs and outcomes.
The data suggested that leadership was one of the most significant elements influencing
the system of PA. The attentiveness of the leaders to the KPIs tended to bring clear
policy and supports, including the use of the executives’ authority encouraging the
employees. The leaders in the high KPI scoring provinces tend to pay more attention to
the KPIs as well as more support for the practitioners than the low KPI scoring
provinces. The evidence suggested that the ways in which the executives use authority
are different between the high and low KPI scoring provinces. The participative
leadership style – people focused – was found in the high KPI scoring provinces, whilst
the authoritarian leadership style – control focused – was seen in the low KPI scoring
provinces. Regarding leadership-related reward allocation, the leaders in the high KPI
scoring provinces appeared to be concerned with fairness of reward (equity) and clear
criteria of the incentive allocation (rule of law) rather than the low KPI scoring
provinces. In this respect, it is possible that the practitioners in the high KPI scoring
provinces tend to have greater job satisfaction and more flexibility. The mixed cultures
can be observed in the context of PA, such as a combination of hierarchy and clan
culture, and a combination of hierarchy and market culture. It can be noted that some
leaders, particularly in the high KPI scoring provinces, tend to slightly shift management
style from the hierarchy culture to the market or clan culture.
251
Human resources and reward were viewed as significant determinants influencing
attainment of PA. The characteristics of personnel who were responsible for the KPIs
played a crucial impact on performance. The appropriate characteristics required were
good knowledge and skills, experience and accountability, including positive attitudes
to the KPIs and participation. Reward is a crucial element that can enable or inhibit
success in achieving the KPIs. This appeared to be more characteristic in the low KPI
scoring provinces where people tended to focus on receiving a reward more than those
in the high KPI scoring provinces. This implies that intrinsic motivation among officials
in the low KPI scoring provinces appears to be lower than the high KPI scoring
provinces.
In terms of performance, outputs and outcomes, the evidence suggested that
collaboration among agencies and individuals is a key determinant in achieving high
KPI scores. It seemed that the low KPI scoring provinces had a lower level of
cooperation than the high KPI scoring provinces or a higher degree of individualism.
This reflects that collectivism or a clan culture is required for accomplishing PA. For
outputs and outcomes of PA, a diversity of opinion was found among the officials. The
majority of people agreed that performing the KPIs contributed to focusing on goal
achievement (efficiency and effectiveness), generated integrated collaboration
(participation), and delivered concrete results of performance (transparency), although
there were some doubts about design and assessment in practice.

252
CHAPTER 7
DISCUSSION OF ORGANIZATIONAL CULTURE
AND GOOD GOVERNANCE
7.1 Introduction
This chapter discusses the empirical findings acquired from the results of the
quantitative data (Chapter 5) and the qualitative data (Chapter 6). The chapter is
structured into four main sections. The first section is cultural determinants of
performance, for which the variables (e.g. behaviour, attitudes, knowledge and practice
of the civil servants) in the system of performance agreement (PA) are viewed through
four cultural types – hierarchy, clan, market, and adhocracy cultures. The discussion of
each culture type is based around three aspects: key themes of the culture types from the
CVF, different attributes of performance between the low and high KPI scoring
provinces, and relevant components of good governance. The second section focuses on
crosscutting themes as stated in the previous topic, namely what are the important
features that make differences between the low and high KPI scoring provinces. The
third section draws the different sets of findings together to highlight typical
characteristics of the low and high KPI scoring provinces.
7.2 Cultural determinants of performance
Whilst the quantitative data, based on the OCAI provided a profile of the organizational
culture of the Thai civil service, the differences in the cultural profiles of high and low
KPI scoring provinces were not so different as to make the OCAI profile a reliable
predictor of performance in PA. The qualitative data has, therefore, been used to
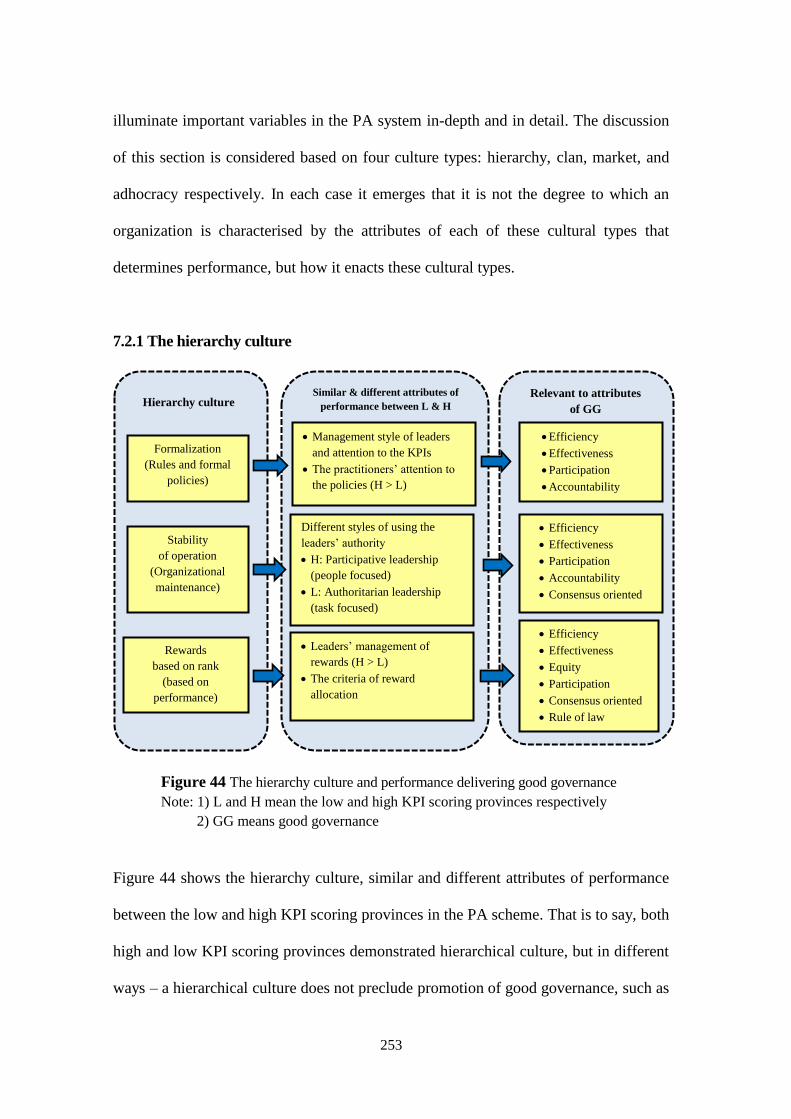
253
illuminate important variables in the PA system in-depth and in detail. The discussion
of this section is considered based on four culture types: hierarchy, clan, market, and
adhocracy respectively. In each case it emerges that it is not the degree to which an
organization is characterised by the attributes of each of these cultural types that
determines performance, but how it enacts these cultural types.
7.2.1 The hierarchy culture
Figure 44 The hierarchy culture and performance delivering good governance
Note: 1) L and H mean the low and high KPI scoring provinces respectively
2) GG means good governance
Figure 44 shows the hierarchy culture, similar and different attributes of performance
between the low and high KPI scoring provinces in the PA scheme. That is to say, both
high and low KPI scoring provinces demonstrated hierarchical culture, but in different
ways – a hierarchical culture does not preclude promotion of good governance, such as
Hierarchy culture
Formalization
(Rules and formal
policies)
Stability
of operation
(Organizational
maintenance)
Similar & different attributes of
performance between L & H
groups
Relevant to attributes
of GG
Different styles of using the
leaders’ authority
H: Participative leadership
(people focused)
L: Authoritarian leadership
(task focused)
Efficiency
Effectiveness
Participation
Accountability
Consensus oriented
Leaders’ management of
rewards (H > L)
The criteria of reward
allocation
Efficiency
Effectiveness
Equity
Participation
Consensus oriented
Rule of law
Rewards
based on rank
(based on
performance)
Management style of leaders
and attention to the KPIs
The practitioners’ attention to
the policies (H > L)
Efficiency
Effectiveness
Participation
Accountability
254
participation, efficiency and effectiveness through the PA scheme. The implication is
that within a given culture there is still managerial discretion as to how that culture will
be enacted in terms of management style.
Formalization (Rules and formal policies)
The data suggested that the civil servants at the provincial level tended to perform their
work based upon formal policies and the superiors’ command, particularly the Governor
or Vice Governor and the chiefs of the agencies. This is because the Governor is the top
executive in the provinces with centralized power, which this power is viewed as the
leaders’ position power to control over policy and rules (Williams and Huber, 1986).
The findings of the quantitative and qualitative data analysis suggested that formalization
was differently applied in high and low KPI scoring provinces. The quantitative data
showed that of the four culture types, the hierarchy culture has the highest mean score
in all 16 provinces but was significantly different between both provincial groups in
relation to management style and the importance given to the KPIs. The background of
the leaders significantly determines characteristics of leadership, especially attention to
the KPIs. For example, one of respondents indicated that:
“Different Governors give different levels of attentiveness. If we had the Governor from
the field of politics, he might not pay much attention to the KPIs. On the other hand, the
Governor from the field of bureaucracy perhaps paid more attention to the KPIs due to
pressure from the leaders.” (Senior manager, Chief of human resource management
group, Provincial Governor’s Office, 24 July 2014: PH2)

255
This implies that a Governor from the political sphere was seen to pay less attention to
the KPIs than those from a background as career officials, reflecting the degree to which
the relationship between politics and bureaucracy, politics and political environment are
crucial dilemmas for public sector management (Ingraham, Joyce and Donahue, 2003),
i.e. influence in relocation and promotion of the executives of the provinces, as
explained in Chapter 3.
The practitioners in the high KPI scoring provinces seemed to focus on the policy rather
than the low KPI scoring provinces. People in the high KPI scoring provinces frequently
mentioned term ‘clear policy’ from Governor, as the following example:
“Having a clear policy enabled us to do our job properly.” (Practitioner, Provincial
Governor’s Office, 24 July 2014: PH2)
This reflects that the degree to which Thai civil servants tend towards uncertainty
avoidance (Hofstede, 2001) as noted in Chapter Three, and therefore appropriate clear
instructions, rules and policies from their superiors, aligning with what Cameron and
Quinn (2011) refer to as a control orientation, focusing on efficiency. The difference
between the low and high KPI scoring provinces regarding control appears to lie not
in any difference in policies or underlying values but in the degree to which individual
senior managers chose to focus on control and efficiency as well as individual
practitioners.

256
Stability of operation (organizational maintenance)
Although the results of quantitative data analysis revealed that the hierarchy culture in
the high KPI scoring provinces was higher than the low KPI scoring provinces. This
might have been expected to negatively affect performance, whereas the reverse has
occurred. The previous section has emphasised that hierarchical culture in the form of
clear directives from above may be suited to the Thai administrative culture of high
uncertainty avoidance. However the data also shows that hierarchical culture may be
enacted via different leadership styles.
The qualitative data suggested that there were different leadership styles between the
low and high KPI scoring provinces. The leadership style in the high KPI scoring
province seemed to be characterised by participative style. This can be observed through
regularly attending meetings and paying more attention of leaders – meetings are seen
as the opportunities to aligning support and discussing problems between leaders and
staff. One of senior managers in the high KPI scoring province stated that:
“In the meetings, the Governor or Vice Governor played an important role. If they paid
attention to the KPIs, they could support the team, drive the resource requirements, and
solve the problems. Most importantly, the meetings must take place regularly.” (Senior
manager, Chief of human resource management group, Provincial Governor’s Office,
13 August 2014: PH1)

257
On the other hand, a more authoritarian style was found in the low KPI scoring
provinces, where the attributes of sharing ideas between leaders and staff appeared to
be limited. This can be seen from one of senior managers indicated that:
“The support we required from the Governor was an opportunity to share ideas. If he
ran the office solely by his own opinion and he did not listen to anyone, his subordinates
might be scared to share ideas.” (Senior manager, Chief of Provincial Office of Disaster
Prevention and Mitigation, Provincial Office of Disaster Prevention and Mitigation, 22
July 2014: PL2)
In this respect, leaders in the hierarchy culture can influence organizational performance
through using participative and authoritarian ways. The different leadership styles
contribute to different results of performance. A participative style that is people-
focused can bring social stability to the organization through staff motivation and
willingness to take responsibility; reduces turnover; and delivers a high level of
achievement (Francesco and Gold, 1998; Gill, 2006; Williams and Huber, 1986).
Participative leadership is associated with improved performance through both
motivational (e.g. increasing intrinsic motivation) and exchanged-based (e.g. treating
fairness for employees) mechanisms (Huang et al., 2010). The idea that attributes of
good governance such as accountability, participation, efficiency and effectiveness are
generated by a participative style is not necessarily new, for example Bratton et al.
(2007) and Jackson (1989) agree that a participative style is more effective than the
authoritarian style. The authoritarian style – task focused – relies on authority, rules,
regulations, command and centralization (Armstrong and Baron, 1998; Dooren,

258
Bouckaert and Halligan, 2015; Jackson, 1989) that usually assign tasks while neglecting
the needs of staff in order to create controlling and centralized orientation (Williams and
Huber, 1986). People in the low KPI scoring provinces tended to work in a less flexible
organizational.
The findings suggested that some executives, particularly the leaders in the high KPI
scoring provinces, were able to move from directive style – asking the staff members to
follow rules and procedures (Francesco and Gold, 1998) – to participative style –
making decisions based on discussion and collective analysis of problems between the
managers and staff (Francesco and Gold, 1998; Gill, 2006). This is despite the more
usual view, for example, that of Gill (2006) that managers in Southeast Asian incline
towards a directive style30 rather than participative style.
The importance of leadership style for performance may be seen in the survey responses
regarding job satisfaction (question 9: You have no concerns about the style of
management) suggested that the practitioners in the 16 provinces tended to be concerned
with leadership style. For example, one of respondents stated that:
“I think that leadership was important in terms of management of the limited resources
such as human, materials, equipment. The Governor’s authority assisted partnership
work and resource sharing between agencies.” (Senior manager, Chief of Provincial
Livestock Office, Provincial Livestock Office, 24 July 2014: PH2)
30 Directive style refers to managers provide specific guidance, set deadlines for completion of work,
and ask staff to follow rule and procedure (Francesco and Gold, 1998; Gill, 2006).

259
Rewards based on rank
One priority for provinces implementing PA was to provide financial incentives to those
directly responsible for attaining the KPI outputs, seen as rewards based on performance
rather than rewards based on rank (seniority). In the context of PA, rewarding in the
hierarchy culture is associated with leaders’ management of rewards and the criteria of
reward allocation.
The qualitative data showed that senior managers in the high KPI scoring provinces
tended to put more effort into the management of reward than did their equivalents in
the low KPI scoring provinces, for example, generating understanding about the criteria
of reward and voting for the appropriate criteria of reward. These ideas are indicated by
respondents that:
“...I had to call for a meeting to explain how the reward was allocated...” (Senior
manager, Chief of Provincial Livestock Office, Provincial Livestock Office, 24 July
2014: PH2)
“... The leaders proposed different formulas to the officials to consider and voted for
the best one. The officials took part in the process.” (Practitioner, Provincial
Employment Service Office, 24 July 2014: PH2)
Although rewards are important for motivation towards achieving goals (Gill, 2006;
Williams and Huber, 1986), the leaders’ management of the reward system has a greater
motivational significance than the actual reward itself. Besides the importance of leader

260
for rewarding, the criterion of reward is crucial in determining performance of civil
servants, which should be under the rule of law. As it was, the majority of respondents
appeared to be in favour of reconsideration of the criteria of reward allocation. This is
because, for example, a strong monetary reward may incentivise distortion of evidence
(transparency) about the attainment of high KPI scores while a weak monetary reward
may lead to a low level of motivation (participation).
7.2.2 The clan culture
The findings from both quantitative and qualitative data suggested that the clan culture
has a significant impact on the civil service’s performance. The quantitative data
revealed that the clan and market cultures were where the most significant differences
between the low and high KPI scoring provinces were located. This is compatible with
the qualitative data that there are three major elements of clan culture – personnel issues,
cohesion and teamwork, and equity of rewards that influenced performance of the
provinces. Figure 45 shows the relationship between the clan culture and performance,
similar and different attributes of performance between the low and high KPI scoring
provinces, and performance in terms of KPIs (good governance).

261
Figure 45 The clan culture and performance delivering good governance
Note: 1) L means the low KPI scoring provinces and H means the high KPI scoring provinces
2) GG means good governance
Personnel issues
Many respondents mentioned human resource (HR) issues as a factor that influenced
performance in getting high KPI score at the levels of the provinces and agencies. This
is because the clan culture comprises cohesion, commitment and capability of the
employees (Zammuto and Krakower, 1991) that enable high performance in the PA
system. However, there were several challenges relevant to individuals’ performance,
particularly the senior managers’ concern in the individuals’ assumptions about the
KPIs, relocation of the responsible persons for the KPIs, and trust in the team of
Provincial Governor’s Office.
Personnel issues
Clan culture
Cohesion
and teamwork
Equity
of rewards
Level of coordination between the
agencies and people in the provinces
(H > L)
The individuals’ positive assumptions
performing the KPIs (H > L)
Fairness and impartiality of rewards (H >L)
Extrinsic reward focused (H < L)
Eligible persons and motivation of
individual focused (H > L)
Participation
Effectiveness
Accountability
Transparency
Participation
Accountability
Effectiveness
Equity
Similar & different attributes of
performance between L & H
groups
Relevant to
attributes of GG
The senior managers’ concern in the
staff’s assumptions to the KPIs (H > L)
Rate of relocation of the responsible
persons for the KPIs (H < L)
Level of trust in the team of Provincial
Governor’s Office (H > L)
262
For the individuals’ assumptions regarding the KPIs, the data suggested that the leaders
in the high KPI scoring provinces referred extensively to staff’s views about the KPIs
and about their communication about this with staff. This reflects how the managers in
the high KPI scoring provinces tended to be participative or people focused in style –
which may lead to have a greater confidence in staff motivation, responsibility and
involvement and a reduced rate of turnover (Williams and Huber, 1986). This is consistent
with the views of a respondent in the high KPI scoring provinces who said that:
“Fortunately, the officials within our province do not relocate very often. They had been
here for a long time, so they had a good relationship to each other. Consequently, our
province had good collaboration.” (Senior manager, Chief of Provincial Office of
Disaster Prevention and Mitigation, 13 August 2014: PH1)
Such characteristics as a low rate of staff turnover, high commitment, and high loyalty
of the employees are associated with organizations that have a strong culture (Gay, 1997
and Legge, 1989 cited in McKenna and Beech, 2002, p.16; Robbins, 2005). Overall it
seems reasonable to conclude that a strong culture was found in the high KPI scoring
provinces rather than the low KPI scoring provinces and that it was attributed to better
leadership.
Another personnel-related issue was degree of trust in the team of Provincial Governor’s
Office. The data suggested that the team of the Provincial Governor’s Office in the high
KPI scoring provinces appeared to gain more trust by the agencies and staff in the
provinces than the low KPI scoring provinces through, for example, taking
responsibility, demonstrating professionalism (e.g. having and introducing knowledge
263
of the KPIs) and transparency of reward allocation. The team of Governor’s Office is
the central agency in the provinces who leads other agencies, viewed as group leadership
(Parry and Proctor-Thomson, 2003). A lack of trust in this team may lead to loss of
collaboration in the provinces. The individuals’ trust is the basis of developing an
organizational culture (Price, 2011) such the clan culture.
There were other personal issues such as limitation of number of the officials, over
pressure of work, relocation of the responsible persons for the KPIs, and a lack of
training. The issue of pressure of work seems to be a particular concern of many
respondents. The result of assessment of job satisfaction (question 4: The amount of
responsibility given you is not excessive) acquired from the quantitative data analysis
showed that there were not significantly different views on pressure of work between
senior managers in the low and high KPI scoring provinces. However, it was clearly
observed that the low KPI scoring provinces had higher mean scores than the high KPI
scoring provinces. It is possible that senior managers in the low KPI scoring provinces
tended not to be concerned with pressure of work or they perhaps did not pay so much
attention to the KPI. On the other hand, there were significantly different views on
pressure of work between practitioners in the low and high KPI scoring provinces (Sig.=
0.010). The qualitative data suggested that the practitioners in the high KPI scoring
provinces tended to perform their work with commitment, even though they had to cope
with overwhelming work in a tight timeframe or pressure from superiors. It is possible
that a higher commitment of the practitioners contributes to achieving higher KPI scores
in an agency and in a province respectively. Here, the clan culture may derive from
264
internal accountability – accountability of bureaucrats to superiors who have assigned
jobs for them (Drüke, 2007; Moynihan, 2008) or the hierarchy culture.
The data suggested that several problems relevant to HR were perhaps resolved by the
ways senior managers played their role. For example, overwhelming work pressure and
declining the problems can be resolved by managers through the allocation of
appropriate responsibilities or through strengthening the culture (e.g. inspiring and
building teams).
Cohesion and teamwork
The overall achievement in PA of the provinces derives from various sectors,
particularly the KPI host agencies in the provinces and their staff members. The majority
of respondents perceived that collaboration or teamwork is a crucial factor in achieving
high KPI scores. This can be seen from many respondents who broadly mentioned terms
‘collaboration’, ‘teamwork’, and ‘potential of team of Provincial Governor’s Office’.
The quantitative data suggested that the high KPI scoring provinces had a higher mean
score of the clan culture than the other ones. In other words, a higher commitment, that
is a characteristic of stronger clan culture (Deal and Kennedy, 1988), appeared to be
seen in the high KPI scoring province than the low KPI scoring provinces. The different
degree of strength of the clan culture seemed to derive from meetings with the leaders,
with the meetings perhaps glue that held the organizations together.
Furthermore, the individuals’ positive assumptions on the KPIs or the PA scheme were
a key indicator in determining a degree of collaboration or strong (clan) culture in the
265
provinces. Brown (1998) and Davis (1984) state that strong or shared beliefs and values
among staff of an organization make for strong cultures. This implies that individuals’
assumptions are important for creating strong culture in order to generate high
performance (Brown, 1998). The qualitative data suggested that people in the high KPI
scoring provinces tended to have more positive assumptions performing the KPIs than
the low KPI scoring provinces. They perceived the advantages of the KPIs, for example
in enhancing the integrated coordination between the agencies in the provinces.
Similarly, the research finding of Sathornkich (2010) revealed that coordination among
the agencies and participation among the executives at the provincial level in Thailand
have been enhanced in the PA system. By contrast, some officials in the low KPI scoring
provinces appeared to have negative attitudes in implementing the KPIs.
Thus, in the context of PA, the clan culture (collaboration and teamwork) is perhaps a
key element in achieving high KPI scores because high collaboration can contribute to
strong culture – sharing the same basic assumptions e.g. goal alignment (Brown, 1998).
This is perhaps surprising given that many scholars (e.g. Benedict, 1943; Embree, 1950;
Klausner, 1997; Phillips, 1966) argue that Thais are characterized as individualistic, for
example they seem to prefer working alone.
Equity of the rewards
Equity of the reward focuses on individuals’ views on rewards in terms of fairness and
impartiality. The qualitative data suggested that respondents in the high KPI scoring
provinces tended to perceive a higher degree of fairness in the KPI-related reward
allocation than the low KPI scoring provinces. This is consistent with the quantitative

266
data acquired from assessment of job satisfaction (question 6: Your supervisor supports
your career development), which revealed that the staff in the high KPI scoring
provinces had a higher mean score of job satisfaction in terms of promotion and reward
allocation than the low KPI scoring provinces. People in the high KPI scoring provinces
may be more satisfied in benefiting from the reward scheme rather than people in the
low KPI scoring provinces.
The qualitative data showed that less reward satisfaction among people in the low KPI
scoring provinces may derive from emphasizing more on external motivator such as
financial reward more than being task focused. This can be seen from a senior manager
in a low KPI scoring province who stated that:
“...If we did not have the incentive, the officials’ morale for working might be decreased
and they might perform the tasks with unhappiness... These days, the reward was less.
Therefore, the officials were less motivated.” (Senior manager, Chief of Provincial
Community Development Office, Provincial Community Development Office, 22 July
2014: PL2)
This reflects that people in the low KPI scoring provinces tend to focus on their own
benefits, known as individualism, than being task focused. People are concerned with
external motivation, which may lead to lose motivation for working when they do not
receive rewards. Here, it is consistent with Stringer, Didham and Theivananthampillai
(2011) who found that extrinsic motivators are negatively associated with job
satisfaction, especially some people who are concerned with fairness and who often
267
compare their rewards with others or feel that their pay is not appropriate for their
attempt. This can be seen below:
“We had less incentive in comparison with the local government agencies... In contrast,
the provincial agencies received much less reward.” (Senior manager, Chief of Strategy
for Province Development Group, Provincial Governor’s Office, 22 July 2014: PL2)
On the other hand, people in the high KPI scoring provinces appeared to be more task
focused and people focused, as stated by the senior managers in the high KPI scoring
provinces that:
“The financial reward was a motivation for the officials in working on the KPIs.
Although they were not rewarded, they still performed their tasks...” (Senior manager,
Chief of human resource management group, Provincial Governor’s Office, 13 August
2014: PH1)
“The provinces could achieve in the KPIs by cooperation of the central government
agencies in the region. However, these agencies could not get the incentive from the
provinces as the OPDC indicated...” (Senior manager, Chief of Strategy for Province
Development Group, Provincial Governor’s Office, 13 August 2014: PH1)
This reflects that the practitioners in the high KPI scoring provinces tended to focus on
task achievement even though they do not receive the rewards, whilst the practitioners
in the low KPI scoring provinces tended to lose their motivation for working in the year

268
without annual bonus. The senior managers in the high KPI scoring provinces tended to
be concerned with fairness among the eligible persons and the practitioners’ motivation
performing the KPIs.
As stated earlier, the data suggest at least three main aspects. Firstly, fairness of rewards
is associated with individuals’ job satisfaction, but not motivation. Unfairness of reward
allocation between those responsible for the KPIs might generate disharmony at the
level of provinces, agencies, and individuals. Price (2011) stated that high commitment
of people occurs when they feel that they are impartially rewarded (equity). Secondly,
extrinsic motivation appears to be negatively associated with people’s performance, for
example, people may lose morale when they are rewarded less than their expectation; it
may lead to a problem of equity, and distortion of appraisal results or the objective of
overall performance (Fletcher, 1993; Murphy and Denisi, 2008). As a result of monetary
reward being a sensitive issue (Price, 2011), many scholars (e.g. Armstrong, 1990;
McKenna and Beech, 2002; Moon, 2000) suggest that intrinsic motivation factors
provide a greater positive impact on performance than extrinsic motivation. Hence,
using intrinsic reward seems to be a more sustainable source of motivation than extrinsic
reward because it is associated with individuals’ feeling, such as pride, satisfaction of
social needs and opportunities to increase skills (Armstrong, 1990; Fletcher, 1993;
Ingraham, Joyce and Donahue, 2003; McKenna and Beech, 2002). Thirdly, leadership
is important to manage reward in terms of fairness because leaders are associated with
reward power to motivate people for achieving goals as well as punishments
(Armstrong, 1990; Gill, 2006; Williams and Huber, 1986).

269
7.2.3 The market culture
The quantitative data suggested that the market culture was the most significantly
different between the high and low KPI scoring provinces at the same level as clan
culture. The high KPI scoring provinces tended to have a greater mean score than the low
KPI scoring provinces. The qualitative data revealed that there are three different
characteristics of the market-oriented value between both groups: pursuit of goals,
competition and achievement, and rewards based on achievement as shown in Figure 46.
Figure 46 The market culture and performance delivering good governance
Note: 1) L means the low KPI scoring provinces and H means the high KPI scoring provinces
2) GG means good governance
Pursuit of goals
The qualitative data suggested that the market culture in the provinces was generated
through three key elements: pursuit of the KPI targets by the meetings, pressure from
the superiors, and the individuals’ consciousness. The high KPI scoring provinces
tended to have a higher degree of pursuing the KPI targets than the low KPI scoring
provinces. One practitioner in a high KPI scoring province stated that:
Market culture
Pursuit of goals
Competition and
achievement
Rewards based on
achievement
Efficiency
Effectiveness
Participation
Accountability
Similar & different attributes of
performance between L & H
groups
Relevant to
attributes of GG
groups Degree of pursuing the KPI targets
through frequent meetings with the
executives (H > L)
Level of pressure by the superiors (H < L)
Level of the individuals’
conscientiousness (H > L)
A tendency of competitive-orientated
model (H > L)
Agreement and disagreement on
performance-related pay (PRP)
• Efficiency
• Effectiveness
• Responsiveness

270
“The meetings were important in terms of monitoring the progress of the KPIs in the
period of 6, 9, and 12 months.” (Practitioner, Provincial Office of Disaster Prevention
and Mitigation, 13 August 2014: PH1)
Many respondents perceived that the meetings with the executives were important
opportunities to monitor progress of the KPIs whether at the level of provinces or
agencies. Some provinces and agencies attempted to compare their results with others,
while other provinces and agencies attempted to pursue goal achievement. In addition,
the KPIs appeared to improve several types of public service, particularly a quick
response to the needs of citizens. This corresponds to the idea that the market culture
can bring customer focused orientation (Cameron and Quinn, 2011). These data reflect
that responsiveness and efficiency can be generated in the context of PA. In other words,
PA or performance management can contribute to being focused on outputs and
outcomes focused.
Some respondents took the view that there was excessive pressure from superiors to
pursue the goals and objectives of the KPIs. The quantitative data – question 10 ‘The
pursuit of organizational targets does not put you under excessive pressure’ – revealed
a wide variation between the low and high KPI scoring provinces (Sig.= 0.006). The
high KPI scoring provinces had higher mean score than the low KPI scoring provinces.
The implication is that people in the high KPI scoring provinces perhaps worked in a
more flexible environment than did in the low KPI scoring provinces, perhaps reflecting
the more participative or people focused leadership style found in the higher scoring
provinces.

271
Regarding individuals’ conscientiousness, the qualitative data revealed that the senior
managers and practitioners in the high KPI scoring provinces tended to perform their
work with more conscientiousness than the low KPI scoring provinces. For instance,
one senior manager in a high KPI scoring province stated that:
“...the accomplishment of the KPIs might derive from the officials’ conscience.” (Senior
manager, Chief of human resource management group, Provincial Governor’s Office,
24 July 2014: PH2)
Competition and achievement
The quantitative data revealed that the market culture between the low and high KPI
scoring provinces were significantly different (Sig.= 0.001) with the highest different
mean scores (0.24). Only the market culture had significant differences between the
senior manager in both groups (Sig.= 0.042), whilst the market culture was the most
significantly different (Sig.= 0.002) between the practitioners in both groups as well as
the clan culture. This is compatible with the qualitative data that a tendency of
competitive-orientated model seemed to characterise the high KPI scoring provinces.
One of the practitioners in the high KPI scoring provinces stated that:
“The chiefs of the agencies were the main people who introduced the clear policy to the
subordinates. For example, the leaders required the subordinates to compete the KPI
results with others agencies.” (Practitioner, Provincial Governor’s Office, 13 August
2014: PH1)
272
Here the practitioners perceived that leaders are important in generating the market
culture through decisions and management practices. In this context, the leaders are
viewed as competitive and hard drivers (Cameron and Quinn, 2011). The senior
managers in the high KPI scoring provinces tended to do more than the others to
‘accelerate’ staff enthusiasm. One senior manager in the high KPI scoring provinces
stated that:
“I informed the subordinates by the monthly meetings... If the result of the KPIs was not
close to the targets, we had to accelerate our team performance.” (Senior manager,
Chief of Provincial Employment Service Office, Provincial Employment Service Office,
23 July 2014: PH2)
It is possible that people in the high ones tended to perform their work based on
competitive-oriented models in order to receive efficiency and effectiveness. The
implication is that the PA scheme can generate a market culture in public organizations.
This in consistent with the view of Kennedy (2000 cited in Radnor and McGuire, 2004)
that public organizations perform their tasks without market competition, therefore
performance measurement is often employed as a substitute for market pressures.
However, it is important to note that the market culture in the context of PA is supported
by hierarchy culture. In other words, strength of the market culture seems to be
generated by leadership, although a degree of the market culture between the low and
high KPI scoring provinces are not much different in the PA scheme. Similarly, the
results of previous studies on organizational culture in the Thai public sector revealed

273
that the market culture is slightly increased in overview of post-reform in the Thai public
sector (Jingjit, 2008; Phookpan, 2012).
Rewards based on achievement
The results of PA are linked with the annual bonus allocation from the central
government. This criteria is compatible with the principle of the market culture that
reward is based on achievement or payment by result (McKenna and Beech, 2002;
Zammuto and Krakower, 1991). McKenna and Beech (2002) state that the reward
system is used as a change mechanism to generate a more pronounced performance-
oriented culture. However, the findings of this study appeared to show little influence
of result-based rewards. This can be seen from different views of people on
performance-related pay (PRP) in the PA scheme.
Some officials agreed with PRP due to enhancing motivation of staff in performing the
KPIs. This can be observed through views of some respondents in the high KPI scoring
provinces indicated that:
“I agreed to maintain the criteria of reward based on result of the KPIs because the
financial incentive was a motivation for people...” (Practitioner, Provincial Livestock
Office, 24 July 2014: PH2)
“The financial reward was a motivation for the officials in working on the KPIs...”
(Senior manager, Chief of human resource management group, Provincial Governor’s
Office, 13 August 2014: PH1)

274
This implies that monetary reward can contribute to motivation; Helmke and Levitsky
(2004) state that motivation is crucial to shape organizational culture to pursue their goal
accomplishment. On the contrary, other officials disagreed with PRP, for example, the
limited number of people related to the KPIs, small amount of financial reward, and
distortion of evidence in achieving high KPI score, as the following example:
“I disagreed with the criteria of incentive allocation...there were various tasks of the
provinces, but some tasks were selected as the KPIs...” (Senior manager, Chief of
Provincial Livestock Office, Provincial Livestock Office, 24 July 2014: PH2)
In this respect, providing financial rewards based on achievement in high performance
evaluation appears to remain ambiguous either in the high or low KPI scoring provinces.
Using financial reward or PRP in the context of PMS remains a controversial issue as
the relationship between PRP and high organizational performance cannot be proved
(Bevan and Thompson, 1991 cited in Fletcher, 1993; Institute of Personnel
Management, 1992). Although Fletcher (1993) and Murphy and Denisi (2008) claim
that there are several challenges of PRP, Moynihan and Pandey (2005) and Price (2011)
point out that at least it motivates and retains high performing people. Armstrong (1990)
suggests that the incentives can lead to achieving performance when the pay system
provides appropriate incentives and the value of the rewards is consistent with the
individuals’ needs. It is possible that the appropriate incentive with relevance to the
officials’ needs may lead to enhanced performance such as in participation and
accountability of the individuals performing the KPIs as well as the appropriate ways of
management of reward by the leaders.

275
7.2.4 The adhocracy culture
The quantitative data suggests that the adhocracy culture was significantly different
between the low and high KPI scoring provinces (Sig.= 0.003) although it had not much
different comparing with other culture types. Similarly, the results of assessment of job
satisfaction (question 2 ‘Your job gives you the freedom to choose your own method of
working’) revealed that the adhocracy culture between the 16 provinces had significant
differences (Sig.= 0.042). The presence of the characteristics of adhocracy culture were
not reflected in the qualitative data analysis. However, they can be observed through
three main aspects: dynamic (response to external change), risk taker (decision of
solving problem-related the KPIs), and the reward individual initiative issue as shown
in Figure 47.
Figure 47 The adhocracy culture and performance delivering good governance
Note: 1) L means the low KPI scoring provinces and H means the high KPI scoring provinces
2) GG means good governance
Similar & different attributes of
performance between L & H
groups
Relevant to
attributes of GG
groups Dynamic
(Response to
external change)
Risk taker
(Decision of solving
problem-related
the KPIs)
Reward individual
initiative issue
Competencies to cope with the
external challenge-related the KPIs
(H > L)
Quicker responses to citizens’ needs
Degree of the leaders’ response to
the problems relevant to the KPIs
(H > L)
Flexibility of working (H > L)
Efficiency
Effectiveness
Responsiveness
Effectiveness
Responsiveness
Participation
Effectiveness
Adhocracy culture
groups
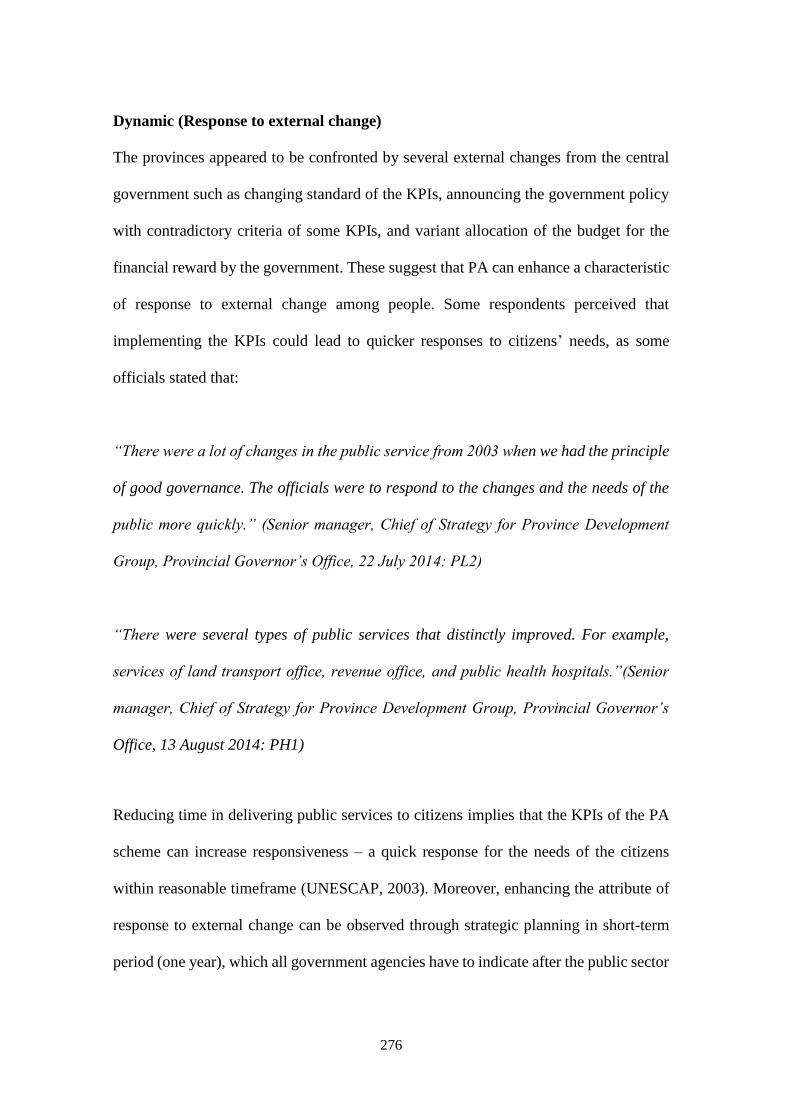
276
Dynamic (Response to external change)
The provinces appeared to be confronted by several external changes from the central
government such as changing standard of the KPIs, announcing the government policy
with contradictory criteria of some KPIs, and variant allocation of the budget for the
financial reward by the government. These suggest that PA can enhance a characteristic
of response to external change among people. Some respondents perceived that
implementing the KPIs could lead to quicker responses to citizens’ needs, as some
officials stated that:
“There were a lot of changes in the public service from 2003 when we had the principle
of good governance. The officials were to respond to the changes and the needs of the
public more quickly.” (Senior manager, Chief of Strategy for Province Development
Group, Provincial Governor’s Office, 22 July 2014: PL2)
“There were several types of public services that distinctly improved. For example,
services of land transport office, revenue office, and public health hospitals.”(Senior
manager, Chief of Strategy for Province Development Group, Provincial Governor’s
Office, 13 August 2014: PH1)
Reducing time in delivering public services to citizens implies that the KPIs of the PA
scheme can increase responsiveness – a quick response for the needs of the citizens
within reasonable timeframe (UNESCAP, 2003). Moreover, enhancing the attribute of
response to external change can be observed through strategic planning in short-term
period (one year), which all government agencies have to indicate after the public sector

277
reform in 2002 as well as the scheme of PA. These data suggest that the attribute of
responsiveness to external change can be generated through the PA scheme. This may
lead the civil service to have greater efficiency, effectiveness and responsiveness of
public service delivery. However, the previous studies investigated about organizational
culture of the Thai public sector revealed that the adhocracy culture has been slightly
increased after the public sector reform in Thailand (Jingjit, 2008; Phookpan, 2012). A
weak attribute of the adhocracy culture may derive from traditional concepts in Thailand
‘Cha Cha Dai Pla Lem Ngam’ (Do things slowly and make sure you get a beautiful big
knife) (Pimpa, 2012, p. 37). This national culture probably determines leadership style
and individuals’ characteristics in the Thai public sector. Furthermore, the limited
number of civil servants coming from younger generation who are familiar with the
concept of organizational change (Pimpa, 2012) may contribute to a low level of the
adhocracy culture in the Thai civil service.
However, some leaders appear to shift their style and management from administration
to management on variety of unexpected challenges related to the KPIs. Likewise, the
research findings discovered by Sathornkich (2010) revealed that the PMS creates a shift
in working culture of the executives at the provincial level from bureaucratic
administration to managerial one. Nevertheless, Hofstede (2001) claimed that the
characteristics of response to external change or taking risks are not much observed
among Thais due to their characteristic of uncertainty avoidance. This feature is
reasonable in that Thais held the limited values of tolerance of ambiguity and acceptance
of risk in order to minimize uncertainty by strict rules, regulations, laws and policies for
implementation (Pimpa, 2012).
278
Risk taker (Decision of solving problem-related the KPIs)
Although the attribute of risk taker is not widely seen in Thai society, the qualitative
data suggested that the PA scheme seemed to generate the characteristic of risk taker in
the Thai public organizations. Particularly, the chiefs of the agencies and the front line
managers had to take action as a risk taker for solving problems related to the KPIs such
as relocation of the responsible persons for the KPIs. The data suggested that the senior
managers in the high KPI scoring provinces tended to express a higher degree of
response to the problems relevant to the KPIs than the low KPI scoring provinces. The
implication is that PA probably changes the leadership style from traditional
bureaucracy to business sector such as a risk taker. Although the characteristic of risk
taker – advice and problem-solving – is important for maintaining smooth operations
and organizational maintenance through advice and problem-solving.
Reward individual initiative issue
Some may consider that it is difficult to find the attribute of innovation in the public
sector, because it is a characteristic found in the private sector (Kimberly and
Pouvoueville, 1993 cited in Talbot, 2010). The quantitative data suggested a factor that
influenced creativity of people is a control focus, namely a lack of flexibility for
working. The result of assessment of job satisfaction obtained from the quantitative data
analysis – question 2 ‘Your job gives you the freedom to choose your own method of
working’– suggested that there was significant difference between the low and high KPI
scoring provinces (Sig.= 0.001). The high KPI scoring provinces had higher mean score
than the low KPI scoring provinces. This implies that people in the high KPI scoring
provinces tend to have more flexible circumstances for performing the KPIs. This is

279
consistent with the qualitative data that leaders in the high KPI scoring provinces incline
towards participative style; in contrast leaders in the low KPI scoring provinces appear
to have an authoritarian style. It is therefore possible that people in the low ones tend to
have a lower degree of creativity, whilst staff in the high KPI scoring provinces perhaps
have more of a climate of creativity. McKenna and Beech (2002) point out that a climate
of creativity is one aspect of organizational functioning derived from a strong culture.
The PA scheme probably helps to increase innovation in the public organization because
performance measurement can encourage innovation in the public sector (Williams,
1933; Williams, 1998).
7.3 Crosscutting themes
According to the previous section, ‘effectiveness’ was the most extensively mentioned
characteristic by respondents who performed the KPIs and then ‘participation’,
‘efficiency’ and ‘accountability and responsiveness’ respectively. These views seem to
be consistent with Greiling (2005) that performance measurement is a crucial instrument
increasing effectiveness, efficiency and accountability of the public organizations.
Moreover, it is also consistent with the purpose indicated in the performance evaluation
framework for the fiscal year 2007-2011 in four key dimensions: effectiveness of
mission, service quality, efficiency of performance and organizational development.
(1) Effectiveness
The performance evaluation framework stated that the aspect of effectiveness is the
main purpose of PA, the highest weight (%) of 50 comparing with the other three
dimensions. It was stated as the first dimension of the performance evaluation
280
framework (see Table 3 in Chapter Three) – the effective mission, namely the goal of
achieving in the KPIs relevant to the action plans of the agencies. The qualitative data
suggested that effectiveness was generated from implementing the KPIs or performance
evaluation. There were four major factors influencing effectiveness in the Thai civil
service: the reward system, leadership, the individuals’ characteristics and the meetings.
The reward system
In the context of PMS, performance-related pay (PRP) has a significant impact on the
motivation of individuals (Hatry, 2007). As stated earlier, PRP may influence
performance of some people in pursuing goals of the KPIs. Measurement of goal
achievement is one of the indicators to present effectiveness (Osborne et al., 1993). This
implies that the reward system may influence effectiveness. However, using rewards for
generating effectiveness of performance is concerned with misinterpretation on the
incentives’ objectives by officials. Some officials tend to focus on making benefit as a
business rather than producing outputs and outcomes of the public services. In other
words, people being measured tend to manage the measure rather than the performance,
viewed as ‘measurement dysfunction’ (Neely, 1998 cited in Houldsworth and
Jirasinghe, 2006, p. 27). Thus, the reconsideration of the incentive system in the PA
scheme was recommended by a number of respondents, particularly pay format and
fairness of reward. Peters and Savoie (1995) stated that effectiveness can be created
when a clear set of reward is identified and satisfactory to civil servants.
281
Leadership
Leadership is a key feature influencing high performance in order to achieve
effectiveness in the organizations. The evidence suggested that three main dimensions
related to leadership were involved: task management, HRM and reward management.
The executives who led the organizations by a participative leadership style tended to
focus on people in order to achieve tasks. The managers who focused on task management
tended to manage organizations based on task and goal-oriented achievement and solving
problems related to the KPIs. Here, Blake and Mouton (1981) state that leadership style
as either ‘concern for people’ or ‘concern for task’ can be simultaneously interrelated.
For HRM, the leaders played a crucial role on the issues of HR, such as solving problems
of staff members’ relocation and being concerned with people’s morale. Poor leadership
may contribute to many problems such as lack of trust, high rate of staff turnover and
deficient morale (Commonwealth Secretariat, 2010). Moreover, the leaders who could
produce effectiveness in the organizations tended to have strategies for reward
management and enable fairness and equity of the reward allocation among the officials.
In this respect, it implies that management style and approach (e.g. task, human
resource, and reward) are important for achieving effectiveness.
The individuals’ characteristics
The data suggested that the effectiveness of civil service is perhaps dominated
by individuals’ characteristics, for instance assumptions, coordination, competitive-
orientation, response to external change and initiative. Particularly, the individuals’
assumptions seemed to be a crucial element leading to effectiveness, including
assumptions on the KPIs and on the rewards. People who had positive attitudes or beliefs
282
in performing the KPIs tended to express conscientiousness and attention to the tasks
related to the KPIs in order to create strong culture. On the other hand, wrong
assumptions, such as beliefs that the KPIs are not their responsibility, of the staff
members can lead to an inappropriate culture (weak culture) that negatively affects
performance (Armstrong, 1990).
The meetings
The meetings seemed to be the other essential factor that significantly influenced the
staff members’ performance (effectiveness). Performance review meetings with leaders
can build effective team and manage the team (Moores, 1994; Platt, 1999). The findings
suggested that the communication between the executives and officials through the
meetings had a significant impact on, for example, aligning provincial orientation,
enhancing understanding related to the KPIs, generating collaboration, encouraging
resources, monitoring progress of the KPIs, pursuing goals and increasing morale. Here,
it suggests that a meeting is an important technique to manage team (Moores, 1994),
particularly formal meetings with the executives, and teamwork enables people to
accomplish tasks together (Armstrong and Baron, 1998).
2) Participation
Participation was extensively mentioned by the respondents as the second aspect of
good governance. The attribute of participation is one of the important elements under
the second dimension of performance evaluation framework – the quality of public
sector service delivery, which it is concerned with improvement of public service
delivery as well as public participation. The evidence suggested that three main

283
categories led to participation in the provinces: leadership and reward system, loyalty
or warm and caring, and the individuals’ characteristics.
Leadership and reward system
Leadership is a major force to create commitment to and involvement with productivity
of organizations (Blake and Mouton, 1981). A team builder is a leadership type in the clan
culture (Cameron and Quinn, 2011). Building a team is viewed as generating
participation through sharing their ideas for the formulation of a policy or course of
action (Williams and Huber, 1986). Thus, participative leadership style tend to generate
participation. Besides leadership style, rewarding is a technique from the private sector
that is used to create participation in the public sector (Peters and Savoie, 1995).
However, rewards appear to be a sensitive issue for maintaining organizational
performance when fairness is not assured as stated earlier sections. This is because
motivation of the officials, particularly in performance appraisal, may be destroyed due
to unfair discrimination (Fletcher, 1993; Ryan and Pointon, 2007).
Loyalty or warm and caring
A high level of participation appears to be created when organizations (the provinces)
encourage loyalty or warmth and caring of staff (Cameron and Quinn, 2011). In the
context of PA, loyalty of officials in a province is viewed through rate of relocation. As
stated earlier that the high KPI scoring provinces tend to have a higher degree of loyalty
as a result of the low rate of relocation. The high rate of turnover not only derives from
the officials themselves, such as moving to their hometown, but also from leadership.
A cause of high rate of staff turnover and lack of trust may derive from poor leadership
284
(Commonwealth Secretariat, 2010), in the PA scheme, either the executives or the team
of Provincial Governor’ Office.
The data suggest that some people still work in a province because it is their hometown,
as a practitioner indicated that:
“The province was developed due to the KPIs, I was proud of working for the KPIs
because this province was my hometown...” (Practitioner, Provincial Employment
Service Office, 24 July 2014: PH2)
In addition, the KPIs perhaps generate sense of unity in the provinces regarding
integrated collaboration in the provinces for achieving the overall result of PA, as one
of senior managers stated that:
“In the past, each agency worked independently. Now, several agencies are accountable
for the same KPIs. Thus, we learned to collaborate.” (Senior manager, Chief of
Provincial Office of Disaster Prevention and Mitigation, Provincial Office of Disaster
Prevention and Mitigation, 13 August 2014: PH1)
In this context, it implies that the PA scheme can generate sense of ownership among
the agencies within a province or participation. Participation (e.g. sharing opinions and
making decision) can be created when people feel part of an organization, which is
viewed as an important element of strong culture (Brown, 1998; Christiensen et al.,
2007).
285
The individuals’ characteristics
The findings of this study also suggested that participation in the provinces seemed to
be generated by the individuals’ attentiveness and conscientiousness in implementing
the KPIs. This implies that participation in the provinces is generated by the individuals’
characteristics. On the contrary, participation of people in the provinces is probably
created by the process of PA itself as stated earlier.
3) Efficiency
Efficiency of public organizations was often referred to through the evidence with
reference to leadership and control system, reward system and other factors (e.g. the
meetings, competitive-oriented, and response to external change). Efficiency of
performance was under the third dimension of performance evaluation framework
focused on the standardization of process improvement. For example, the agencies are
anticipated to improve budget management process, reduce costs, maximize the usage
of energy, and achieve a reducing process time of services.
Leadership and control system
Bratton et al. (2007) suggest that a participative leadership style is more effective than
an autocratic leadership style. Participative leadership tends to be people focused and
encourage participation among people, which may lead to improvement in efficiency
because officials at lower levels have greater participation, viewed as decentralization
(World Bank, 1992). Regarding control system, it is seen as hierarchical and market
orientations in the CVF. Although Cameron and Quinn (2011) state that the leaders who
focus on hierarchical values are often to be a monitor in order to generate efficiency,
286
Armstrong and Baron (1998) claim that control orientation may inhibit performance
rather than facilitate performance. For market values, leaders are viewed as a hard driver
in order to generate productivity and efficiency of organizations (Cameron and Quinn,
2011). In this respect, it implies that participative and authoritarian styles can be
simultaneously created for achieving high performance.
The reward system
The majority of respondents perceived that fairness of reward allocation can lead to
efficiency of performance regarding job satisfaction, but in terms of motivation there
are different views between officials. Although the use of rewards system is ambiguous
about can financial reward motivate people in performing the KPIs, some respondents
stated that receiving financial reward contributed to morale for achieving the KPIs such
as reducing process time of services. This may lead to achieve good services reflects
that efficiency is generated (Jackson, 1995).
Other factors
Efficiency of performance appears to be generated through the meetings because they
provide the opportunities to accelerate staff in pursuing goal achievement. The
competitive-orientation is sometimes emphasized by some executives, in fact, the purpose
of the PA scheme emphasizes on target achievement rather than competitive-orientation.
This is because each province has different provincial strategies in order to have
different the KPIs in the first dimension, although other dimensions are compulsory (see
Chapter Three, section 3.4.2). Thus, the overall result of PA of each province cannot be
compared, but some provinces seem to desire comparison with other provinces. In the
287
context of PA, the market culture regarding goal achievement is perhaps generated in
order to create efficiency of the Thai civil service, as in the idea of Cameron and Quinn
(2011) that efficiency is the end of the market culture.
4) Accountability and Responsiveness
Accountability – a sense of responsibility on the part of staff – in the context of PA was
often mentioned in relation to internal accountability such as responsibilities on job
assigned by the leaders (e.g. being the responsible persons as the KPI host), and on the
results anticipated (e.g. achieving goals of the KPIs). Internal accountability is important
for responsibilities of a certain job and for achieving results desired (Ryan and Pointon,
2007). Meanwhile, responsiveness was found in the agencies who deliver public services
in terms of responding to needs of the citizens within reasonable timeframe (UNESCAP,
2009). Moreover, low level of responsiveness was found when the leaders tend to lack a
characteristic of taking action on the problems related to the KPIs. This can be seen as a
lack of response to vital need of stakeholders (Dooren, Bouckaert and Halligan, 2015)
such as staff, other agencies and the citizens.
7.4 Typical characteristics of the low and high KPI scoring provinces
This section discusses the typical characteristics of the low and high KPI scoring provinces.
As stated earlier, the typical characteristics of each provincial group can be divided into four
categories: leadership, individuals’ characteristics, reward system and others (e.g. task and
goal-oriented, trust of the team of Provincial Governor’s Office, and meetings with the
executives). Table 30 demonstrates the comparison of the typical characteristics between
the low and high KPI scoring provinces as in the following explanation.

288
Table 30 Comparison of the typical characteristics between the low and high KPI
scoring provinces
Typical
characteristics
Low
KPI scoring provinces
High
KPI scoring provinces
1. Leadership Authoritarian leadership style Participative leadership style
2. Individuals’
characteristics
Negative assumptions to the KPIs
Low collaboration
Slow response to external
change
Positive assumptions to the KPIs
High collaboration
Quick response to external
change
3. Reward system Extrinsic motivation
Management of rewards based
individualistic view
Intrinsic motivation
Management of rewards based
collective view
4. Others Low degree of the market-
oriented cultural model
Low trust of the team of
Provincial Governor’s Office
Informal meetings without
the executives
High degree of the market-
oriented cultural model
High trust of the team of
Provincial Governor’s Office
Formal meetings with the
executives
1) Leadership
Leadership styles significantly dominate performance of the civil service in different
ways, particularly participative and authoritarian styles. Participative style was found in
the high KPI scoring provinces, whilst authoritarian style was found in the low KPI
scoring provinces. Participative style seemed to lead to high performance rather than the
authoritarian style because of greater concern with the individuals’ needs, greater
willingness and responsibility, and greater involvement in planning and making
decisions (Williams and Huber, 1986). Many scholars (e.g. Bratton et al., 2007; Jackson,
1989) appear to agree that participative style is more effective than authoritarian style.
This implies that participative leadership style (people focused) can lead to higher
performance. It is possible that the employees in the high KPI scoring provinces tend to
have higher job satisfaction and more flexible circumstances. These characteristics refer
289
to strong culture in terms of high consistency and employees’ motivation (Brown, 1998;
Christiensen et al., 2007).
On the one hand, people in the low KPI scoring provinces who performed tasks under
the authoritarian style tended to have less flexibility because they worked based on the
executives’ command and policies. The implication of high performance would be
generated when the control system – the hierarchical-oriented value – is perhaps shifted
to greater flexibility or external focus such as clan or adhocracy or market orientations.
Brown (1998, p. 229) suggests that ‘strong culture equals high performance’.
2) The individuals’ characteristics
Three typical characteristics of the individuals in the low and high KPI scoring
provinces were different: assumptions, collaboration and response to external change.
The data suggested that the staff members in the high KPI scoring provinces tended to
have positive assumptions performing the KPIs in order to work based on attentiveness
and conscientiousness. Meanwhile, people in the low KPI scoring provinces seemed to
have negative attitudes to the KPIs. This may lead to a different level of collaboration
between both groups. In other words, negative or weak culture may demotivate staff to
perform their work (Ehtesham, Muhammad and Muhammad, 2011). Therefore, higher
collaboration between the agencies and officials was found in the high KPI scoring
provinces. This reflects that the high KPI scoring provinces have stronger culture than
the low KPI scoring provinces because a high degree of staff members commitment is
seen in strong culture (Luhman and Cunliffe, 2013; Robbins, 2005). Moreover, strong
culture in the high KPI scoring provinces may derive from high cohesion or good
290
relationship due to less relocation among the officials, viewed as high loyalty. These
imply that strong culture has a significant impact on high performance to deliver good
governance because strong culture ensures greater commitment, increases behavioural
consistency, and ensures people point to the same direction (Robbins, 2005; Senior and
Fleming, 2006). This is different from the idea proposed by some scholars (e.g. Klausner,
1997; Hofstede, 1999; Phillips, 1966) that Thais are characterized as being individualistic.
In addition, the data suggested that the high KPI scoring provinces tended to have
quicker response to change such as solving problems related to the KPIs than the low
ones. This reflects that the high ones demonstrate higher degree of the adhocracy
culture. However, the adhocracy culture seems to be limited in the Thai civil service.
This may derive from the national culture such as low level of tolerance for uncertainty,
attempt to control and eliminate the unexpected achievement (Hofstede, 2001; Pimpa,
2012). Moreover, the limited presence of the younger generation, who tend to appreciate
the Western concepts such as organizational change and management (Pimpa, 2012),
in the Thai public sector is perhaps a significant impact for the limited adhocracy
culture. It is possible that limited adhocracy culture is a challenge for change, for
example resistance to the public reform such PA in promoting good governance in the
Thai public sector.
3) The reward system
The findings of this study suggested that two major issues of the reward system were
different between the low and high KPI scoring provinces, including extrinsic and
intrinsic motivation, and management of reward based collective view or individualistic

291
view. The extrinsic motivation seemed to have a significant effect on performance of
people in the low KPI scoring provinces, particularly perceptions of fairness.
Meanwhile, the officials in the high KPI scoring provinces appeared to be motivated by
the intrinsic motivator such as attentiveness and conscientiousness. This reflects a strong
culture existing in the high KPI scoring provinces rather than the low KPI scoring
provinces. Furthermore, such intrinsic motivation does not only have a crucial impact
on performance (Armstrong, 1990; McKenna and Beech, 2002), but also does not create
the problems related to PRP or merit pay (Fletcher, 1993).
Regarding the management of rewards, the leaders in the high KPI scoring provinces
tended to manage rewards based on a collective approach, namely involving all eligible
persons, and being concern with fairness and equity. On the other hand, the leaders in
the low KPI scoring provinces appeared to be concerned with their own benefits as was
the team of the Provincial Governor’s Office that seemed to be criticised by other
agencies in the provinces about transparency of the reward allocation. These reflect the
management of rewards in the low KPI scoring provinces tending to be based on an
individualistic approach or their own benefits. In this context, the sustainability of high
performance of the public organization requires an increase in strong culture –
behavioral consistency (Robbins, 2005) – such as conscientiousness of people, rather
than an appeal to individual self-interest, contrary to the argument made by Gill (2006).

292
4) Others (e.g. Task and goal-oriented, trust of the team of the Provincial Governor’s
Office, and the meetings with the executives)
Besides characteristics stated earlier, there were other characteristics that were different
between the low and high KPI scoring provinces, including degree of market-oriented
cultural model, trust in the team of the Provincial Governor’s Office, and the formal
meetings with the executives. People in the high ones tended to have higher degree of
task and goal achievement, viewed as the attribute of the market-oriented value as well
as strong culture – the employees held values and beliefs together and pointed in the
same orientation (Robbins, 2005; Senior and Fleming, 2006). On the other hands, the
officials in the low KPI scoring provinces appeared to have a lower degree of the market
model or weak culture – no dominant pervasive culture (Senior and Fleming, 2006). The
leaders seemed to be a key feature stimulating the agencies and the employees approaching
to the market culture or a strong culture in the context of PA.
Furthermore, it was found that the team of the Provincial Governor’s Office in the high
KPI scoring provinces seemed to have a higher degree of trust, especially transparency,
among the other agencies in the provinces than did the low KPI scoring provinces.
Regarding the meetings with the executives, the high KPI scoring provinces tended to
have formal meetings with the executives, whilst the low KPI scoring provinces broadly
mentioned informal contact and informal meetings without the executives. The formal
meetings with the executives seemed to have a significant effect on civil service
performance because the meetings are the opportunities for pursuing the KPI targets,
getting support, and solving problems related to the KPIs.

293
7.5 Summary
The findings acquired from the quantitative and qualitative data analysis suggested that
organizational culture is perhaps not the key variable dominating performance in
the provincial administration. However, leadership (e.g. attentiveness to the KPIs,
leadership style) and management (e.g. tasks, human resources and reward) were the
key determinants in influencing performance. The findings of the quantitative data
analysis suggested that the existence of hierarchy, clan, market and adhocracy cultures
in the 16 provinces does not differ significantly in terms of organizational culture
profiles. The qualitative data analysis revealed that organizational culture – underlying
assumptions of people to the KPIs or the PA scheme – influenced high performance at
the provincial level. These were demonstrated through three key determinants:
leadership style, individuals’ characteristics, and reward system.
The participative leadership style (people focused) appeared to play a significant role in
high performance. This tended to ensure willingness to perform the KPIs, low rate of
relocation of the employees, and high commitment because they have opportunities for
participation such as sharing ideas, discussing plans and making decisions with superiors.
For the individuals’ characteristics, the positive assumptions (e.g. attitudes and beliefs)
of people to the KPIs seemed to have a significant impact in performing the KPIs
because they tend to work based on high degree of attentiveness, conscientiousness, and
collaboration. Regarding the reward system, there are two major aspects concerned by
the officials: the clear criteria of reward allocation and management of reward,
particularly the issues related to fairness and equity of reward allocation. The evidence
suggested that leadership and management approaches were important to manage these

294
challenges in order to achieve high performance to deliver good governance at the
provincial level, especially effectiveness, participation, efficiency and accountability
and responsiveness.
Achieving high scores of performance evaluation at the provincial level seemed to
derive from differences between provinces in terms of the strength of culture. The
indicators were seen through differences of the typical characteristics between the low
and high KPI scoring provinces, including leadership, individuals’ characteristics and
reward system. Although the four culture types acquired from the quantitative data
analysis were significantly different between the low and high KPI scoring provinces,
they were not much different and seemed to be relatively uniform in terms of culture
types based on assumptions implementing PA. The differences of four culture types
between both groups appeared to express the differences of strong culture rather than
the culture types themselves.
In summary, the types of organizational culture are perhaps not the key variable
influencing attainment of PA in delivering good governance, but leadership style and
the ways of management appear to be the significant factors to influence performance
of the Thai civil service and do so in a way that encourages a stronger culture, rather
than a culture of a different type (the findings do not, for example, show a shift from
hierarchical to market culture). The implication is that the CVF is a neutral (i.e. non-
evaluative) device for the study of organizational culture, but it does not bring out the
characteristics of high as opposed to low performance.
295
CHAPTER 8 CONCLUSION
8.1 Introduction
This chapter draws conclusions and sets out the implications of the overall results found
in the study. The chapter is organized into seven sections. It begins with Section 8.2,
conclusions and implications, which focuses on the conclusions of the research, and the
implications of attainment of good governance in the provincial administration. It follows
with Section 8.3, contributions to theory, of which there are three aspects: analytical
framework, particularity of study focus and conclusions of theoretical contribution.
Section 8.4, reflections on the research, is concerned with the development of the
analytical framework and research design and methods. In section 8.5, policy implications
and recommendations are offered, including the recommendations for the incentive
scheme and for the overall implementation of PA. Then it moves on to Section 8.6,
limitations of the research. There follow recommendations for future research, which are
provided in Section 8.7. Finally, the conclusion of the chapter is presented in Section 8.8.
8.2 Conclusions and implications
8.2.1 Conclusions of the research
The conclusions of this study are set out based on the research questions of ‘how does
organizational culture influence civil service performance’ and ‘what other organizational
factors influence civil service performance’. To answer these questions, the results of the
quantitative data analysis (Chapter Five) and the qualitative data analysis (Chapter Six)
are compared for the conclusion of the overall result of the study.

296
How does organizational culture influence civil service performance?
This study considers performance in two aspects: an action and the result of an act
of organizations (Houldsworth and Jirasinghe, 2006), namely the civil service
implementation of the PA scheme (an action) and the outcomes of the programme or
achieving good governance (the result of an act). Regarding organizational culture, it is
viewed through the four types of culture (hierarchy, clan, market and adhocracy
cultures) based on the CVF. As stated in Chapter Five, the quantitative data revealed
that there was a significant difference in the culture scores between the low and high
KPI scoring provinces. However, there was not much difference in terms of culture
types between both groups, rather in terms of the strength of each component of the
culture. This may derive from the fact that the officials had performed the KPIs under
the same environment (the PA scheme). Furthermore, the embedded root of culture in
the Thai public sector was acquired from the national culture, because national culture
is a source of organizational culture (Brown, 1998). It was not so much that the high and
low scoring provinces had different types of culture, but that the culture was enacted by
management in different ways.
For example, there are several characteristics in the hierarchy culture that give the
provinces different degrees of strong culture, including introducing clear policies by
the leaders, leadership style, and the leaders’ management of the reward system. The
higher level of strong culture is perhaps seen more in the high KPI scoring provinces
than in the low KPI scoring provinces. Many officials in the high KPI scoring provinces
tended to focus on introducing clear policies by leaders to ensure that they work
properly. This leads to a strong culture where people share the same assumptions and

297
agree what goals to pursue (Brown, 1998). This also reflects that Thais attempt to
minimize uncertainty by strict rules, regulations and policies (Pimpa, 2012). It may
derive from Thai value called ‘uncertainty avoidance’ (Hofstede, 2001). Moreover,
leadership style was one of the most important elements in generating a strong culture
in terms of a high degree of employee commitment (Luhman and Cunliffe, 2013;
Robbins, 2005). The data suggested that the participative style was found in the high
KPI scoring provinces more so than in the low KPI scoring provinces. In particular,
participative style appeared to positively affect performance by ensuring the
individuals’ participation in such areas as sharing ideas, discussing problems and
making decisions (Francesco and Gold, 1998; Gill, 2006; Williams and Huber, 1986).
In addition, the data demonstrated that the leaders’ management of the reward system
had a significant impact on performance in terms of fairness and equity. Reward is
important to motivate the staff members to achieve goals (Gill, 2006; Williams and
Huber, 1986). It is possible that the satisfaction of reward allocation leads to increased
level of loyalty and reduced rate of turnover, which means a strong culture (Rainey,
1996). In this respect, a strong hierarchy culture may provide positive effects on
promoting good governance such as efficiency, effectiveness (achievement of goals),
participation (high official commitment), accountability, equity (reward allocation to
eligible officials), being consensus oriented (making decisions based on staff opinions)
and rule of law (criteria of reward allocation).
Regarding the clan culture, the qualitative data suggested that the positive assumptions
of the staff performing the KPIs, low rate of relocation of the officials and high

298
commitment of the agencies and people in the provinces tended to influence the
attainment of high KPI scores. These characteristics are seen as a strong culture, and are
found in the high KPI scoring provinces rather than the low KPI scoring provinces. This
is consistent with the quantitative data, which showed that characteristics of a clan
culture were the most significantly different between the low and high KPI scoring
provinces. A strong clan culture is perhaps needed in order to achieve high results of
performance evaluation and deliver good governance such as participation (low rate of
staff turnover leading to high involvement), accountability (responsibilities based on
positive assumptions), effectiveness (high commitment), and transparency and equity
(reward allocation).
The market culture, such as the pursuit of goals and rewards based achievement, is
important to generate strong culture in the provinces. This is because the achievement
of goals and level of staff motivation are important elements in order to generate a strong
culture (Brown, 1998). The data revealed that the characteristics of pursuing goals and
reward based achievement were based on leaders’ management and conscientiousness
of staff. In the high KPI scoring provinces, people tended to have a higher propensity of
pursuing KPI targets by meeting with superiors, and because of the individuals’
conscientiousness. This contributes to enhanced efficiency, effectiveness and responsiveness
in the provinces. On the other hand, staff in the low KPI scoring provinces tended to
have more pressure from leaders to pursue goals, which meant greater inflexibility for
working. Regarding reward based achievement, the officials in the high KPI scoring
provinces tended to focus on task achievement rather than reward, in contrast with the
low KPI scoring provinces. Satisfaction of reward is associated with the participation
299
and accountability of officials to perform the KPIs because the staff feel a greater sense
of attainment by being rewarded based on their performance (Peters and Pierre, 2007).
However, Armstrong and Baron (1998) and Bevan and Thompson (1991 cited in Fletcher,
1993) argue that performance-related pay (PRP) is not a guaranteed motivator associated
with the high performance of organizations. Organizational effectiveness could be
improved without PRP (Institution of Personnel Management, 1992). In summary,
a strong market culture could lead the provinces to achieve good governance such as
efficiency, effectiveness and responsiveness (by pursuing goals); participation and
accountability (by satisfaction of fair reward).
Although the adhocracy culture is less observed in the context of PA, the data suggested
that it could be seen through the characteristics of response to external change, decision
making when solving problems related to the KPIs, and the issue of rewarding individual
initiative. The evidence demonstrated that people in the high KPI scoring provinces
tended to have positive assumptions about the KPIs in order to attempt to cope with
problems related to KPIs and give a quicker response to the needs of the citizens. The
data also suggested that the PA scheme contributed to a shift of leadership style from
administration to management (e.g. risk taker and visionary leadership). Moreover, the
indicator suggested that reward could lead to a reduction of the individuals’ initiatives
for new products and services, particularly issues of flexibility of working environment.
In this respect, a strong adhocracy culture could contribute to efficiency, effectiveness
and responsiveness.

300
In summary, strong culture is important in order to achieve high performance in the civil
service and deliver good governance because of the ‘strong culture equals high
performance’ equation (Brown, 1998, p. 229). In the context of the PA scheme, strong
culture of the four culture types seems to positively impact on the performance of the
civil service and the delivery of good governance, such as efficiency and effectiveness
of performance, participation of the agencies and officials, accountability of the
employees, and responsiveness for delivering public services. However, the data
suggested that the civil service’s culture was not the key variable influencing
performance delivering good governance. Beyond a strong culture, leadership and the
ways of management appear to be the most important key elements in determining
achievement in the PA scheme and good governance in the provinces. In particular, a
participative leadership style and the ways of management such as tasks, human
resources, and rewards, are important. These factors are described in the answer to the
next research question.
What other organizational factors influence civil service performance?
Existing literature (e.g. Armstrong and Baron, 1998; Bazeley and Richards, 2000;
Boyne, 2003 cited in Moynihan and Pandey, 2005; Campbell et al., 1993 cited in
Williams, 1998) suggests that the performance of organizations is dominated by at least
seven factors, including personnel, motivated, leadership, management styles and
strategic management, team, system, and contextual (situational) and organizational
culture. According to the findings of this study, the individuals’ characteristics
(assumptions and motivation) and leadership (style and management) are major
determinants influencing the performance of the civil service. Leadership style,

301
particularly participative style, played a crucial role in the employees’ assumptions and
behaviour. This is because a participative style focuses on people’s participation, such
as offering opinions, discussing issues between the managers and staff, planning and
making decisions (Francesco and Gold, 1998; Gill, 2006; Williams and Huber, 1986).
Thus, a participative leadership style may lead to stability of operation, job satisfaction
and a flexible working environment in order to generate efficiency and effectiveness of
work, participation and the accountability of the officials. The participative leadership
style is associated with enhancing performance (Huang et al., 2010). However, Gill
(2006) argued that Southeast Asian countries have a directive leadership style rather
than a participative style. This implies that authoritarian style is a certain element
influencing the performance of the civil service, namely a high degree of centralization
and difficulty for change in the context of performance measurement (Jackson, 1989).
Regarding the ways of management, the way a leader managed things such as tasks,
human resources and rewards were important in determining achievement in high scores
of performance evaluation and good governance. The evidence suggested that task
management, such as monitoring progress of the KPIs and solving problems, was a
crucial element in order to accomplish tasks and goals. This can lead to efficiency and
effectiveness of performance. In terms of HRM, the managers’ decisions appeared to be
the key feature to shape the individuals’ assumptions and motivation regarding the KPIs,
by maintaining satisfaction and raising morale. Leadership is associated with shaping
the organizational culture needed for achieving effectiveness in the public sector (Parry
and Proctor-Thomson, 2003). The issue of rewards appeared to concern various
officials, particularly fairness and equity of reward allocation. The managers were,

302
therefore, expected to reward the eligible staff with impartiality and equity through the
clear criteria of reward allocation and management of reward. Participative leadership
helped to reassure staff regarding fairness (Huang et al., 2010). HRM and reward
management can lead to the attainment of good governance such as participation and
accountability. Achieving the good performance of organizations is associated with the
capacity for managing incentive for their employees (Grindle, 1997).
For the individuals’ characteristics, there were different typical characteristics for the
officials in the low and high KPI scoring provinces, including the officials’ assumptions
(e.g. attitudes and beliefs) to the KPIs, a degree of collaboration between agencies and
officials in the provinces, and response to external change. In addition, the data
suggested that other factors could influence the performance of the civil service such as
market-oriented value, trust of the team of the Provincial Governor’s Office and
meetings with executives.
8.2.2 Implications of attainment of good governance at the provincial administration
Good governance in this study is viewed through the lens of the PA scheme in the
provincial cases. The findings suggested that attainment in good governance requires
changing leadership (e.g. attentiveness and style) and management actions (e.g. tasks,
human resources and rewards) with the aim of generating and maintaining a strong
culture.
The evidence showed that a participative leadership style tended to encourage the
performance of the civil service at the provincial level. A participative style was more

303
often found in the high KPI scoring provinces than the low KPI scoring provinces. In
addition, an authoritarian leadership style was found in the low KPI scoring provinces.
This result is consistent with the idea that a participative leadership style is more
effective than an authoritarian style (Bratton et al., 2007; Jackson, 1989; Williams and
Huber, 1986). For example, a participative style contributes to improving a managers’
ability (e.g. making decisions); facilitating change by participation (e.g. enhancing
people’s voices on a policy or course of action); and emphasizing the employees’
involvement (e.g. planning and decision making). As a consequence, a participative
style can bring about high performance of the civil service because it enhances the
confidence of the individuals’ with regards to willingness and responsibility (Williams
and Huber, 1986). Therefore, the leaders of the government agencies should consider
shifting leadership style from an authoritarian style to a participative style. This may
contribute to a high performance that delivers good governance in the civil service,
particularly in the provincial administration.
The findings also suggested that management actions were important for dominating the
performance of the public organizations in the context of the PA, especially HRM and
reward allocation. For HRM, recruitment of people who were responsible for the KPIs
was essential for achieving PA. The appropriate responsible officials were required to
have such qualities as knowledge and skills, experience, accountability and positive
assumptions to the KPIs. Regarding reward, the evidence showed that monetary reward
did little in terms of effective motivation but that perceived unfairness in rewards was a
strong de-motivator.

304
In conclusion, the findings of this study suggested that performance can be improved
through immediate leadership or managerial actions. Performance may not depend on
underlying cultural characteristics that, by definition, can only be altered in the long
term. Changing the ways the civil service is managed may be more effective than
seeking to change the civil service culture as a whole.
8.3 Contributions to theory
This research was based on the assumption that a fundamental cultural change would be
needed in the civil service in order to attain high performance on KPIs and deliver the
government’s good governance objectives. Accordingly it was assumed that those
provinces which had scored high on KPIs would have a different cultural profile from
those with low scores. This was part of the rationale for adopting the OCAI as a research
instrument, in order to measure the anticipated cultural difference between high and low
scoring provinces.
In terms of the OCAI, and in line with the NPM perspective on which much
contemporary performance management thinking is based, it was assumed or expected
that the quantitative results would show that high scoring provinces had a less
hierarchical and more market-oriented culture than the low-scoring provinces. This
would then confirm the prevailing assumption that in the public sector hierarchical
thinking is the old and market thinking is the new.
In practice, the results presented a different picture. Although there were variations
between the OCAI cultural profiles of high and low scoring provinces, the overall

305
profiles of each group, in terms of the relative proportions of the four cultures, was
strikingly similar. The scoring on the OCAI was not on a zero-sum basis and this may
have meant that differences were understated. However, it was significant that high
scoring provinces came out higher than low scoring provinces on all four quadrants.
Therefore, it was true that high scoring provinces had a high score also for market
culture, but they also scored higher on hierarchy and clan as well.
These results suggest that it was not a transformational cultural shift that was required
but more effective leadership or management within the culture concerned – engaging
with and using elements of all four cultural types. This has been referred to as strong
culture, by which is meant a culture which has been more effectively mobilised or one
in which the leadership or management style is working through, rather than in spite of,
the organizational culture. The qualitative data brought out the differences between
high and low scoring provinces in terms of management or leadership style. It was not
so much whether the culture was hierarchical or clan or market oriented but how the
leaders or managers engaged with and balanced these characteristics. Thus the high KPI
scoring provinces were hierarchical in terms of making clear top-down decisions about
the approach to be adopted, but then followed this us with participatory implementation
with considerable investment of management effort, so that employees felt involved.
This tends to reject the implied contradiction between hierarchy and participation and
suggested that, in Thai public sector culture, a combination of these was more effective.
By contrast, the low KPI scoring provinces tended to be characterised by laissez-faire
leadership that relied on a combination of targets and financial incentives, the latter
made ineffective through perceived unfairness of distribution.

306
To some extent the findings confirmed the Blake and Mouton (1981) distinction
between concern for the task and concern for people – in the high KPI scoring provinces
the two were balanced whereas in the low KPI scoring provinces the people aspect was
neglected. Overall the findings suggest that high performing public services are likely
to be attained through a balanced approach that draws on different elements of the
culture in a way that is personalised and responsive to staff expectations, rather than
a wholesale transformation towards a culture exclusively focused on outputs.
Figure 48 Summary of the research contribution
Source: The author’s construct
Therefore, this study has offered new knowledge on the relationship between
organizational culture and good governance in the public sector, particularly in the
provincial administration in Thailand. It provides contributions to theory in the areas of
Theoretical knowledge on
organizational culture +
Performance + Governance
1. Analytical framework
6 key dimensions of the OCAI +
Reward & Job satisfaction
3. Conclusions of theoretical contribution
3.1 Key variables of performance: leadership
& management
3.2 Solution of current debate on changing culture
3.3 Linkage between organizational culture,
performance & good governance
2. Particularity of study focus
2.1 Relationship between organizational
culture & good governance
2.2 Provincial administration in
Thailand
307
organizational culture, performance and governance, which is divided into three major
dimensions: analytical framework, particularity of study focus, and conclusions of
theoretical contribution (see Figure 48).
8.3.1 Analytical framework
A review of the literature suggests that many empirical studies (e.g. Howard, 1998;
Jingjit and Fotaki, 2010; Parker and Bradley, 2000; Ralston et al., 2006) used the
standard questions of the OCAI. Some of these studies used the OCAI and including the
issue of reward (Jingjit and Fotaki, 2010) or the OCAI and job satisfaction (Parker and
Bradley, 2000, 2001). There are not many studies that integrate all the attributes of
organizational culture together in the questionnaire surveys, including the six key
dimensions of the OCAI, reward and job satisfaction in a single study. However, the
analytical framework of this study used a combination of these attributes in both
questionnaire surveys and also adapted them for interviews. The comprehensive multi-
dimension of organizational culture for the study is not only a potential tool for gathering
more potential information and answering the research questions, but also for creating
a new analytical framework for studying organizational culture. The results of this study
may provide new knowledge and a greater understanding of the relationship between
organizational culture and good governance in the public sector.
8.3.2 Particularity of study focus
There are two particular aspects of this study. Firstly, many studies explored the
relationship between organizational culture and various variables such as performance,
effectiveness and management (Cameron and Quinn, 2011). Nevertheless, there are
not many empirical studies which examine the relationship between organizational
308
culture and good governance. The previous studies tend to examine organizational
culture and some components of good governance, such as effectiveness, but not all
components of good governance. In contrast, this study not only investigates the
relationship between organizational culture and good governance, but also focuses on
the comprehensive components of good governance.
Secondly, several empirical studies on organizational culture in the Thai public sector
(e.g. Jingjit and Fotaki, 2010; Phookpan, 2012) focused on the central government
agencies rather than the provincial administration. There are a few studies
(e.g. Sathornkich, 2010; Srimai, 2015; Srimai, Damsaman and Bangchokdee, 2011) that
highlighted the provincial administration in Thailand, but they explored other aspects
such as PMS and PA. Therefore, the findings of this study may offer a new knowledge
on theories and concepts relevant to organizational culture, performance and
governance. The findings of this study propose new knowledge on the relationship
between organizational culture and good governance, particularly in the public sector in
a developing country.
8.3.3 Conclusions of theoretical contribution
The findings of this study suggested that organizational culture was not the key variable
influencing performance delivering good governance in the civil service, but leadership
and the ways of management. This is different from the implication of the previous
studies’ findings (e.g. Jingjit and Fotaki, 2010; Parker and Bradley, 2000) that
organizational culture can either enable or inhibit the possibility of improving the
performance or effectiveness of the organizations, especially the public organizations.
309
Moreover, the findings of the study offer an answer to the existing debate regarding ‘can
organizational culture be managed and changed?’ (Alvesson and Sveningsson, 2008,
p. 40). There are a number of scholars (e.g. Kotter and Heskett, 1992; McKenna and
Beech, 2002; Schein, 2004; Schwartz and Davis, 1981) who have suggested that
organizational culture is difficult to change. Contrary to this, other scholars (e.g. Brown,
1998; Deal and Kennedy, 1982; Lorsch, 1986) seem to agree that top management can
change organizational culture, namely by the backing of the top managers in the
organizations. Alvesson and Sveningsson (2008) stated that cultural change is very
difficult, but cultural change can be accomplished by a combination of many ingredients
such as leadership and performance appraisal, particularly top management (e.g.
planning, allocating resources, making decisions, and paying attention). In this context,
the findings of this study suggested that achieving high performance and delivering
good governance may not depend on change in organizational culture as a whole,
because it may be difficult to change and take a long time for change to occur. In fact,
organizational culture can be improved by an immediate change of leadership style and
the ways of management, which may take time for change in the short term.
In addition, many scholars (e.g. Brown, 1998; Christiensen et al., 2007; Robbins, 2005)
seem to agree that strong culture has a significant impact on the performance of
organizations. Nevertheless, there are not many existing studies that make suggestions
about the relationship between strong cultures in the particular context of PA (good
governance) in the public sector. The findings of this study may provide new evidence
about the correlation between strong culture and good governance that is viewed through
PA. The results of the study suggested that strong culture was influential in getting high

310
KPI scores as well as delivering good governance. The evidence also revealed that
strong culture was generated under appropriated leadership style and ways of
management. Thus, leadership style and the style or strategies of management were the
key factors to creating strong culture in the organizations. In summary, strong culture
can influence high performance delivering good governance, and the creation and
maintenance of a strong culture requires continual support in terms of leadership style
and managerial decisions.
8.4 Reflections on the research
This section discusses the reflections of the study. Reflection refers to ‘the process of
internally examining and exploring an issues of concern, triggered by an experience,
which creates and clarifies meaning in terms of self, and which results in a changed
conceptual perspective’ (Boyd and Fales, 1983, p.100). Therefore, the reflections in this
section focus on the processes and issues that the study is concerned with, particularly
development of analytical framework, research design and methods.
8.4.1 Development of analytical framework
At the start the research topic focused on only two key variables: organizational culture
and good governance. After reviewing the existing literature on performance
management, ‘performance’ was added as the other crucial variable. In particular,
performance measurement system (PMS) was focused on because good governance in
this study was viewed through the lens of PA, which is based on PMS. A review of
the literature on ‘performance’ refers to many concepts such as performance appraisal,
performance assessment, performance evaluation, and performance management

311
(Vallance and Fellow, 1999). These terms may be used as synonyms in this research, in
particular performance evaluation is often used for PA.
I began with developing an understanding of the term ‘good governance’, regarding
definition, components of good governance and research on good governance. After a
review of the literature, I found that the extent of good governance should be addressed
through the topic of ‘pursuing good governance’, including initiative, interpretation and
importance of good governance. Regarding the variables of performance, my intention
was to focus on three aspects of performance: definition of performance management
system (PMS); nature of performance management; and determinants affecting
performance in delivering good governance. In terms of organizational culture, this step
was complicated because it was related to seeking a theory for developing the theoretical
framework of the study.
Identification of a theory on organizational culture was not straightforward. I spent a lot
of time looking at matching theories, i.e. Competing Values Framework (CVF) and
Denison’s organizational culture model, and then attempted to develop a theoretical
framework for the study. However, a combination of theories appeared to be too
complex and not suitable for answering the research questions. Thereafter, each theory
was cautiously considered by comparing its advantages and disadvantages, which is in
accordance with the supervisors’ recommendations. Finally, the CVF was selected
because it provided many advantages, as discussed in Chapter Two.
312
In summary, developing the analytical framework of the study was carefully viewed
throughout the process based upon self-directed academic research (e.g. a review of
literature and analytical thinking), learning from practice (e.g. comparing and matching
theories), and facilitating professionals (e.g. suggestions of the researchers’ supervisors).
I am, therefore, confident that the development of the analytical framework of the study
based on the three key aspects can contribute to answering the research questions with
validity and reliability of the research findings.
8.4.2 Research design and methods
Regarding research design, I started with only a case study approach. This is because
I viewed Thailand as a case study, which may help to identify appropriate cases for the
sample in the levels of provinces, agencies, and individuals. After an in-depth review of
the literature on comparative study, I recognized that a comparative study was necessary
for examining the differences of organizational culture between the high and low KPI
scoring provinces. Consequently, the research design of the study employed a
combination of the case study and comparative study, as explained in detail in Chapter
Four.
When developing the research methods of this study, I began with a review of the
existing literature, including quantitative methods, qualitative methods, mixed methods,
triangulation and previous studies with relevance to the relationships between
organizational culture and a variety of factors. As a consequence of a review of the
literature, I had a clear opinion on research methods (see details in Chapter Four). This
contributed to the use of mixed methods in the study, for two main reasons. Firstly, each
313
method has strengths and weaknesses in itself. Secondly, examining organizational
culture is viewed as a study of the underlying assumptions of staff members in the
organizations. Thus, qualitative methods such as interviews are required because they
can provide in-depth details of social life, such as values, beliefs and perceptions
(Kumar, 2011). Meanwhile, using quantitative method such as questionnaire surveys
can facilitate the study of the wider population (Gill and Johnson, 2002), which is
suitable for this study as it studied a wide geographical area.
Working with research design and methods in this study was not simple because of using
multiple research designs and mixed methods. Therefore, I attempted to explain research
design and methodology through flowcharts with descriptions, as showed in Chapter
Four. The most difficult area of research design and methods seemed to be the use of
the findings acquired from the quantitative data analysis for selecting the potential cases
for the interviews. The researcher had to analyze the data collected from the
questionnaire surveys in the field immediately after it was gathered31. The selection of
cases for the interviews was carried out after the results of the questionnaire survey were
completed.
8.5 Policy implication and recommendations
The findings of the study suggested two major aspects for policy implication and
recommendations: recommendations for the incentive scheme and recommendations for
the overall implementation of PA.
31 The analysis of questionnaire survey in the fieldwork was concerned about validity. Thus, the results
of data analysis was approved by the professional of statistics such SPSS for recommendations.
314
8.5.1 Recommendations for the incentive scheme
The majority of respondents extensively mentioned about the criteria of incentive
allocation. Many challenges were found in the linkage between PA results and reward,
such as fairness and equity of reward allocation; limited amounts of monetary reward;
limitations of the central government in the regions in getting rewards;
and different numbers of officials in the provinces and agencies leading to inequity
of reward allocation. Improvements to the criteria of the incentive allocation were
suggested by some respondents as follows:
1) Reconsidering the criteria of reward allocation by the central government to
improve it and make it clearer
2) Increasing the amount of the financial reward
3) Generating new forms of incentive
4) Other suggestions such as cancellation of the monetary reward system and
maintaining the reward system
Monetary reward, which is recognized as performance-related pay (PRP), is the most
popular of motivational approaches (Hatry, 2007). However, PRP has various
limitations, such as disappointment, a problem of equity and fabrication of appraisal
evidence (Fletcher, 1993; Murphy and Denisi, 2008). In this respect, the policy maker,
both at the level of central government and in the provinces, should be concerned
with how to use appropriate incentive allocation for reaching the ultimate goals of
performance.

315
8.5.2 Recommendations for the overall implementation of the PA scheme
The respondents also recommended how to improve many aspects of the PA scheme,
such as suggestions for the OPDC, setting the KPIs, and other suggestions. These can
be explained as follows:
1) The OPDC seemed to be expected by the civil servants to do such things as revising
the policy and time frame of PA, opening communication for sharing ideas,
choosing a team of advisers for the KPIs from the OPDC staff, and building an
assessment team from the OPDC staff. This reflects the view that the central
government is seen as the policy maker and needs to be concerned about making
clear policies, being open for participation, and consulting.
2) Some respondents suggested that pattern of setting the KPIs should be changed
from top-down to bottom-up management. This implies that the officials’
participation – taking part in making decisions on setting criteria of the KPIs with
the OPDC – is required in the process of setting KPIs.
3) Other recommendations on PA were found, for example some officials suggested
that the PA scheme should be cancelled because it seemed to be a control system
based on command and policy. However, other people claimed that the PA scheme
should be maintained further but the management needed reconsideration.
In summary, there are a variety of perspectives on the overall picture of the PA scheme.
However, the evidence suggested that a significant number of civil servants tended to
require reconsideration of the PA scheme. Thus, the recommendations as stated earlier
should be considered because these might influence the attainment of performance in
316
delivering good governance in the civil service, especially at the provincial
administration.
8.6 Limitations of the research
There are some challenges in this study regarding the effect on reliability and validity.
It can be considered in three dimensions: surveys, interviews and overall.
8.6.1 Survey limitations
The use of questionnaire surveys in this study found two major challenges. Firstly, using
the five-point scale of the OCAI questionnaire may lead to a difficulty of interpretation
by the researcher regarding a close range of scores of the four culture types. However,
using the five-point scale of the Likert scales provides validity and reliability as follows:
1) Having validity in terms of generating a significant correlation of the scale scores
from the same quadrant rather than hundred-scale (Quinn and Spreitzer, 1991)
2) Offering information about opinions, attitudes, and assumptions within a set of
questions and providing reliable indicators (Vanderstoep and Johnson, 2009; De
Vaus, 2002)
3) Facilitating respondents in answering questions due to it being easier than hundred-
scale (Vanderstoep and Johnson, 2009).
Secondly, the other challenge is answering the questionnaire, which comprises two
crucial problems as follows:

317
1) Getting access to the proposed respondents is difficult, especially senior managers
who may make decisions by passing on the questionnaires for completion (Gray,
2004)
2) Inadequate attention may have been paid by some in answering the questionnaires,
for example questions on some questionnaires were found to be in the same hand
writing and seemed to be written by only one individual (e.g. continuously ticked on
the same scale in many questions by using the single pen); and some questions on a
questionnaire had missing data (e.g. did not tick on the questions in the section of
assessment of organization). The number of such questionnaires and action take
were discussed in Section 4.7.1.
A lack of attention to answering the questionnaires may derive from an idea that the
respondents might not recognize the benefits of the research. For example, some
participants put a note on the questionnaire, saying that they did not see any results
of research brought to adaptation in practice. This may lead to getting incomplete
questionnaires. Nevertheless, the incomplete questionnaires were carefully considered
for the potential quantitative data analysis. For example, the incomplete answers of
the questions in the assessment of organizational culture section were cautiously
considered.
8.6.2 Interview limitations
The limitations of the interviews comprise two main challenges. Firstly, the study aimed
to investigate the relationship between organizational culture and good governance at
the provincial level, which is viewed through the PA scheme between 2007 and 2011.

318
It was not a longitudinal study that was examined over this period. The participants
were, therefore, asked to recall their experiences of PA in previous years. This is seen
as retrospective study and may influence the recall process of the respondents about the
details of implementing PA. However, the culture is something that has accumulated for
a long time based on the history and traditions of the organization (McKenna and Beech,
2002). It is also difficult to change (Hofstede et al., 1990; Rong and Hongwei, 2012;
Schein, 2004). Moreover, the PA scheme was ongoing during the field work process
(2014) and to the present day. Thus, the civil servants are familiar with implementing
PA and could answer the questions.
Secondly, a limitation of translation, which was time-consuming. The interviews were
conducted in the Thai language because the interviewees were Thais. Thus, it took a lot
of time for the process of translation, although only some important sections were
translated. For accuracy of translation from Thai to English, it was cautiously
undertaken to ensure validity of the findings. Therefore, the interview data was
summarized in Thai and then sent to the participants for confirmation or correction.
Moreover, translation of the interview data – particularly the important information in
quotations in Chapter Six – was reviewed by a professional in both Thai and English in
order to ensure the validity of the translation.

319
8.6.3 Overall limitations
The overall study consisted of three challenges. Firstly, during the process of the study,
there was a nation-wide political movement32, which provided some problems for the
study. For example, it was difficult to process correspondence, namely the OPDC who
issued the official letters changed their workplace. The other problem was
getting limited attentiveness from some officials when answering questionnaires and
participating in the interviews. For example, some provincial agencies had to have
a meeting with the new government. This may have had an effect on getting responses
to the questionnaires, although this was helped by using a technique suggested by
Vanderstoep and Johnson (2009) of putting a specific date in bold for when to return the
questionnaire survey. As well as the surveys, the responses of the interviews also
seemed to be affected.
Secondly, the other limitation was the researcher. The researcher is one of the staff
members of the OPDC, which is the central government agency and responsible for the
PA scheme. Some participants may have been careful to provide information that could
cause either favour or disfavour from the OPDC. Contrary to this, being a staff member
of the OPDC may be of merit in getting access to the information sources.
Thirdly, the study was a piece of research focused on the relationship between
organizational culture and good governance in the particular context of the Thai public
sector. Therefore, the findings are not representative of the relationship between
32 The study processed collecting data in the fieldwork in the same time of the political movement, The
Thai military coup declared a coup on 24 May 2014.

320
organizational culture and good governance in all countries. The culture of public
sectors in each country has a particular context. For example, the same management
actions in the civil service of a neighbouring country to Thailand with a different civil
service culture might attain different results.
8.7 Recommendations for future research
1) Replication of research with other provincial case studies and study on central
government agencies
The provincial cases of this study were selected by stratified sampling based on the
scores of PA between 2007 and 2011. This is because this information was complete
and updated during the period of study (2014). After this period, the performance
evaluation frame and number of provinces were changed. It is possible that some
variables were changed in the context of PA. This would be interesting for future
studies in replicating research.
Moreover, this study does not interview central government agencies that have been
committed to PA due to the focus on the provincial agencies. It would be interesting to
study the central agencies’ perspectives. This may lead to receiving more understanding
on the relationship between organizational culture and good governance in the Thai civil
service.
2) The relationship between leadership style and/or management and strong culture
According to the findings of this study, the evidence suggested that leadership style and
management actions were the key variables to influencing performance delivering good
321
governance in the Thai civil service. Furthermore, a strong culture was the other
important element dominating high performance, which was encouraged by leadership
and management. For further research, it would be interesting to examine the
relationship between leadership style and/or management and strong culture.
3) Incentive scheme: how to improve incentives to be more appropriate?
From the findings, it was obviously observed that many civil servants were concerned
with monetary incentive, especially the fairness of reward allocation. Therefore, there
would be opportunities for future studies to build upon the research results. The future
research may examine how to improve incentives in a more appropriate manner. This
may provide many merits such as getting a greater understanding of the officials’ needs;
getting information about which kinds of motivations should be used – intrinsic or
extrinsic motivators; and achieving good governance in the civil service.
4) Study corporate governance in the private sector
This study focused on good governance in the public sector, which does not highlight
good corporate governance in the private sector. However, a study on good corporate
governance in the private sector would be interesting for future research. For example,
the issues are related to regulations of institutions, the framework of laws and relevant
conditions required by the corporate sector (World Bank, 1994). This is because the
private sector is important to the nation’s affairs, such as implementation of the public
sector.

322
5) Impacts and consequences of implementing good governance on the national citizens
This study focused on the organizational culture of the civil service as a consequence of
the civil services’ perspectives on PA or good governance. The study appears to explore
only the dimensions of the public sector that deliver services to citizens. However, it
does not study the results of implementing good governance in the civil service. It would
be interesting for future research to study the impacts and consequences of implementing
good governance. In this respect, the citizens’ perspectives may lead to more
understanding on the outcomes or actual results of PA or implementing performance
based good governance. This would not only improve or find more appropriate policies
related to good governance, but also help to meet the ultimate goals of citizens’ needs.
8.8 Summary
This study aimed to examine the relationship between organizational culture and
performance or good governance in the provincial administration in Thailand. There were
two research questions: how does organizational culture influence civil service
performance; and what other organizational factors influence civil service performance.
In the study, performance or good governance was viewed through perspectives of the
civil service’ implementation of the PA scheme and attainment of good governance.
Meanwhile, organizational culture was considered through eight key themes:
1) Dominant characteristic of the organization, 2) Leadership style, 3) Management of
employees, 4) Organizational cohesion (glue), 5) Organizational strategic emphasis,
6) Organizational success criteria, 7) Organizational reward in the form of promotion, and
8) Job satisfaction. These are viewed through perspectives of the civil servants who have
committed PA between 2007 and 2011 with at least one year of experience. These

323
perspectives are interpreted through the CVF, including the four types of culture –
hierarchy, clan, market and adhocracy.
The findings of the study suggest that there are not much different types of culture
between the low and high KPI scoring provinces, but different strength of culture types.
A strong culture is generated by participative leadership style and management
approach. Therefore, leadership and the ways of management are the key variable
influencing performance in order to achieve good governance. This is different from the
previous studies showing that organizational culture is a crucial factor in facilitating or
obstructing attempts to improve organizational effectiveness or performance. However,
the findings of the study are from just one piece of work, which examined in particular
the public sector in the provincial administration of Thailand. It is, therefore, not
representative of the relationship between organizational culture and good governance
in the public sector of all countries. This is because each country has its own particular
context of the public sector’s culture along with other different factors.
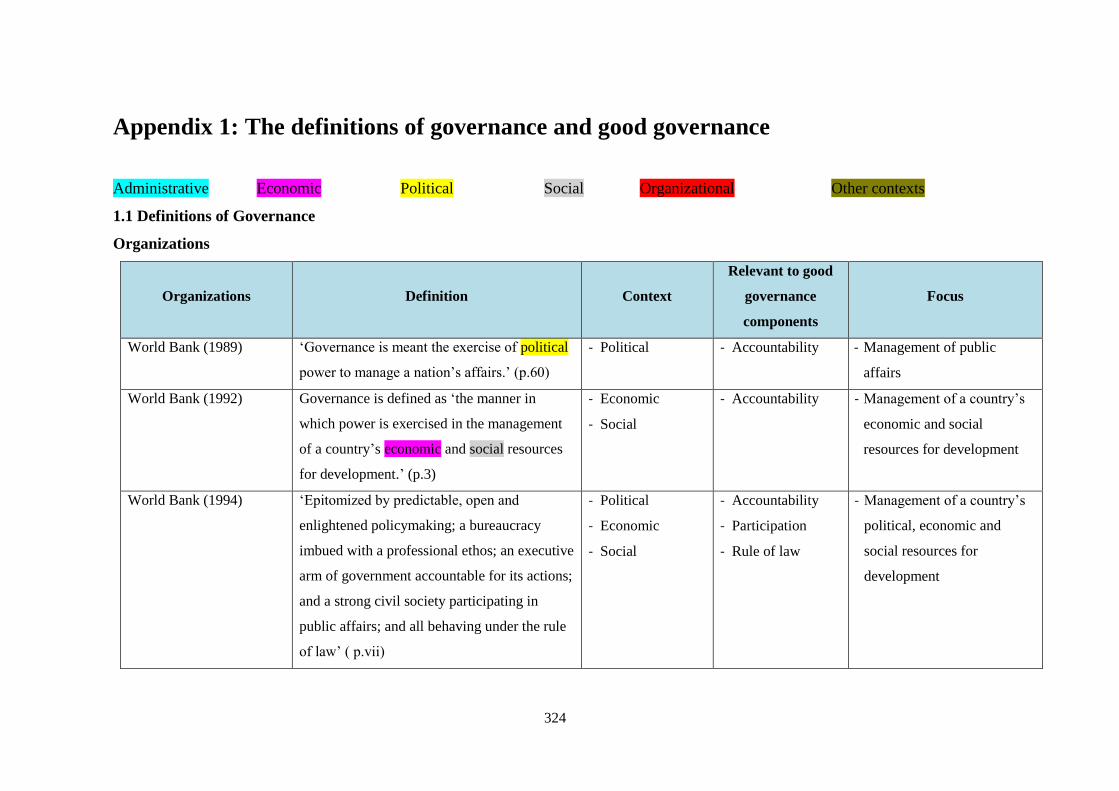
324
Appendix 1: The definitions of governance and good governance
Administrative Economic Political Social Organizational Other contexts
1.1 Definitions of Governance
Organizations
Organizations Definition Context
Relevant to good
governance
components
Focus
World Bank (1989) ‘Governance is meant the exercise of political
power to manage a nation’s affairs.’ (p.60)
- Political - Accountability - Management of public
affairs
World Bank (1992) Governance is defined as ‘the manner in
which power is exercised in the management
of a country’s economic and social resources
for development.’ (p.3)
- Economic
- Social
- Accountability - Management of a country’s
economic and social
resources for development
World Bank (1994) ‘Epitomized by predictable, open and
enlightened policymaking; a bureaucracy
imbued with a professional ethos; an executive
arm of government accountable for its actions;
and a strong civil society participating in
public affairs; and all behaving under the rule
of law’ ( p.vii)
- Political
- Economic
- Social
- Accountability
- Participation
- Rule of law
- Management of a country’s
political, economic and
social resources for
development

325
Organizations Definition Context
Relevant to good
governance
components
Focus
Governance as ‘the manner in which power is
exercised in the management of a country’s
political, economic and social resources for
development.’ (p.xiv)
United Nation (UN, 2006) ‘Governance is an organizing concept that
guides administrators as administrative
practices shift from the bureaucratic State to
what is called the “hollow State”.’ (p. 2)
- Organizational
- Administrative
Shifting public administration
for development
United Nation (UN, 2015) ‘….governance is considered “good” and
“democratic” to the degree in which a
country’s institutions and processes are
transparent...’ (website, p.1)
- Organizational
- Transparency - Democracy
- Transparency of a country’s
institutions and processes
United Nations
Development Program
(UNDP, 1994b)
‘Governance can be seen as ‘the exercise of
economic, political, and administrative
authority to manage a country’s affairs at all
levels. It comprises mechanisms, processes,
and institutions, through which citizens and
groups articulate their interests, exercise their
- Economic
- Political
- Administrative
- Rule of law
- Accountability
- Management of a country’s
affairs

326
Organizations Definition Context
Relevant to good
governance
components
Focus
legal rights, meet their obligations, and
mediate their differences.’ (p.2-3)
United Nations
Development Programme
(UNDP, 1997)
‘UNDP believes that building the capacity for
governance is central to sustainable human
development. We aim to be an impartial
partner to governments, to civil society and to
the private sector - creating opportunities for
interacting to find people - centered solutions
for the long term.’ (website, p.1)
- Social - Participation
- Transparency
- Accountability
- Effectiveness
- Equity
- Rule of law
- Sustainable human
development
- Partiality of partners
United States Government
Accountability Office
(GAO, 2005)
‘Governance as ‘the collective policies and
oversight mechanisms in place to establish and
maintain sustainable and accountable
organizations that achieve their missions while
demonstrating stewardship over
resources.’(p.11)
- Organizational - Accountability - Collective policies
- Oversight mechanisms
- Sustainable and accountable
organizations
Economic and Social
Commission for Asia and
the Pacific (UNESCAP,
2009)
‘The process of decision-making and the
process by which decisions are implemented
(or not implemented). Governance can be used
in several contexts such as corporate
- Corporate
governance
- International
governance
- Accountability - Process of decision-making
- Process of implementation

327
Organizations Definition Context
Relevant to good
governance
components
Focus
governance, international governance,
national governance and local governance.’
(p.1)
- National
governance
(Administrative)
- Local governance
Institute On Governance
(Canada) (2015)
‘Governance determines who has power, who
makes decisions, how other players make their
voice heard and how account is
rendered....Governance in the public sector
needs to take into account legal and
constitutional accountability and
responsibilities.’ (p.1)
- Administrative - Accountability
- Rule of law
- Who has power
- Who make decisions
- How other players make
their voice heard
- How account is rendered
- Taking account legal
- Constituting accountability
and responsibility
The Commission on
Global Governance (cited
in Weiss, 2000)
‘Governance as the sum of the many ways
individuals and institutions, public and
private, manage their common affairs.’ (The
Commission on Global Governance cited in
Weiss, 2000, p.795-6)
- Organizational
- Individual
- Public
(Administrative)
- Private
Management of affairs of
individual, institutions, public,
and private
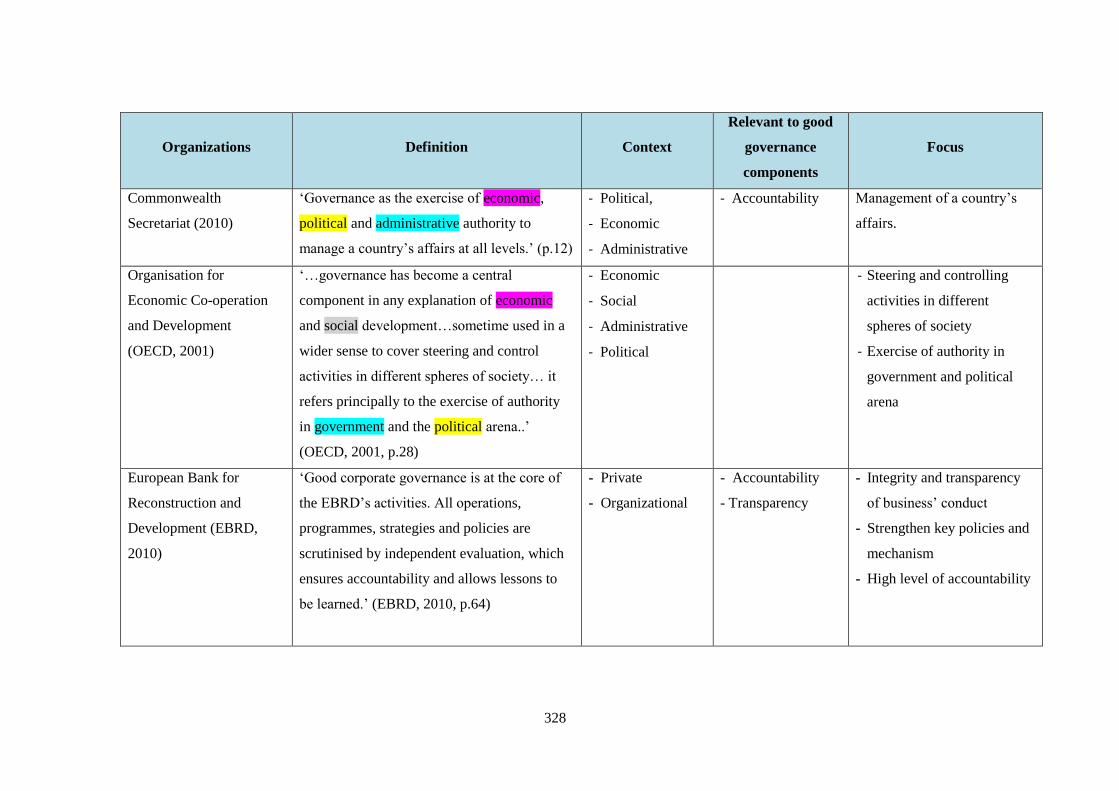
328
Organizations Definition Context
Relevant to good
governance
components
Focus
Commonwealth
Secretariat (2010)
‘Governance as the exercise of economic,
political and administrative authority to
manage a country’s affairs at all levels.’ (p.12)
- Political,
- Economic
- Administrative
- Accountability Management of a country’s
affairs.
Organisation for
Economic Co-operation
and Development
(OECD, 2001)
‘…governance has become a central
component in any explanation of economic
and social development…sometime used in a
wider sense to cover steering and control
activities in different spheres of society… it
refers principally to the exercise of authority
in government and the political arena..’
(OECD, 2001, p.28)
- Economic
- Social
- Administrative
- Political
- Steering and controlling
activities in different
spheres of society
- Exercise of authority in
government and political
arena
European Bank for
Reconstruction and
Development (EBRD,
2010)
‘Good corporate governance is at the core of
the EBRD’s activities. All operations,
programmes, strategies and policies are
scrutinised by independent evaluation, which
ensures accountability and allows lessons to
be learned.’ (EBRD, 2010, p.64)
- Private
- Organizational
- Accountability
- Transparency
- Integrity and transparency
of business’ conduct
- Strengthen key policies and
mechanism
- High level of accountability
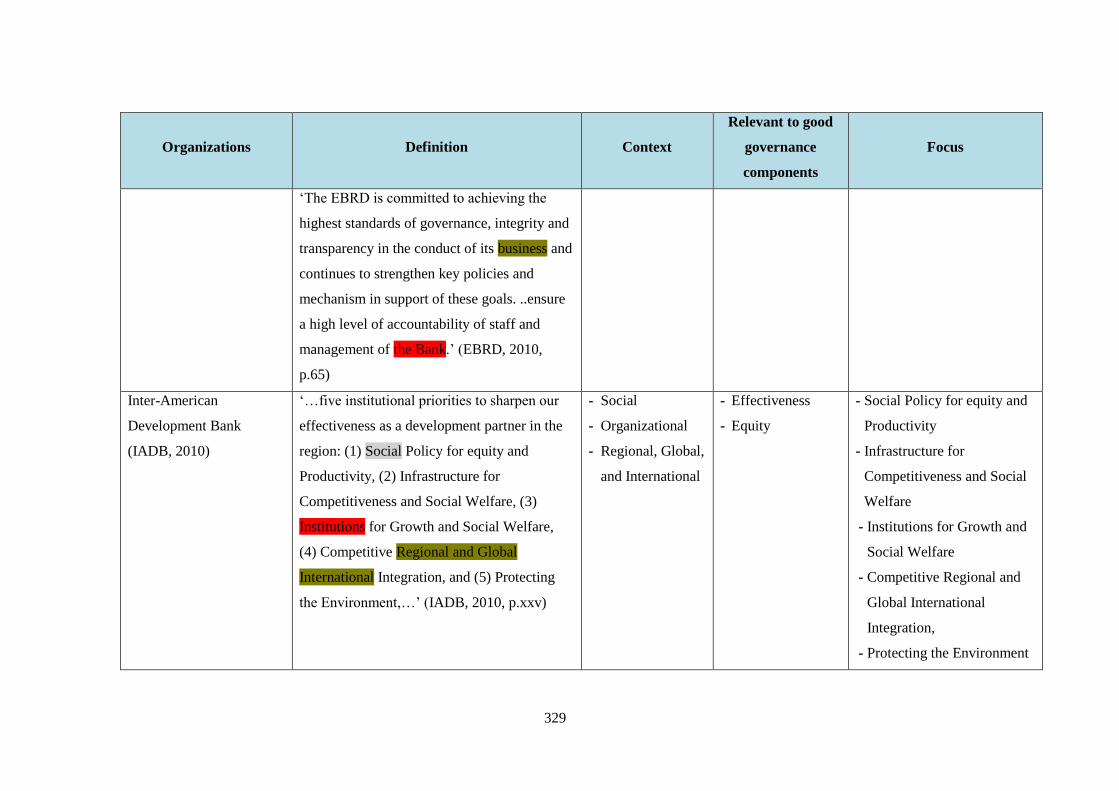
329
Organizations Definition Context
Relevant to good
governance
components
Focus
‘The EBRD is committed to achieving the
highest standards of governance, integrity and
transparency in the conduct of its business and
continues to strengthen key policies and
mechanism in support of these goals. ..ensure
a high level of accountability of staff and
management of the Bank.’ (EBRD, 2010,
p.65)
Inter-American
Development Bank
(IADB, 2010)
‘…five institutional priorities to sharpen our
effectiveness as a development partner in the
region: (1) Social Policy for equity and
Productivity, (2) Infrastructure for
Competitiveness and Social Welfare, (3)
Institutions for Growth and Social Welfare,
(4) Competitive Regional and Global
International Integration, and (5) Protecting
the Environment,…’ (IADB, 2010, p.xxv)
- Social
- Organizational
- Regional, Global,
and International
- Effectiveness
- Equity
- Social Policy for equity and
Productivity
- Infrastructure for
Competitiveness and Social
Welfare
- Institutions for Growth and
Social Welfare
- Competitive Regional and
Global International
Integration,
- Protecting the Environment
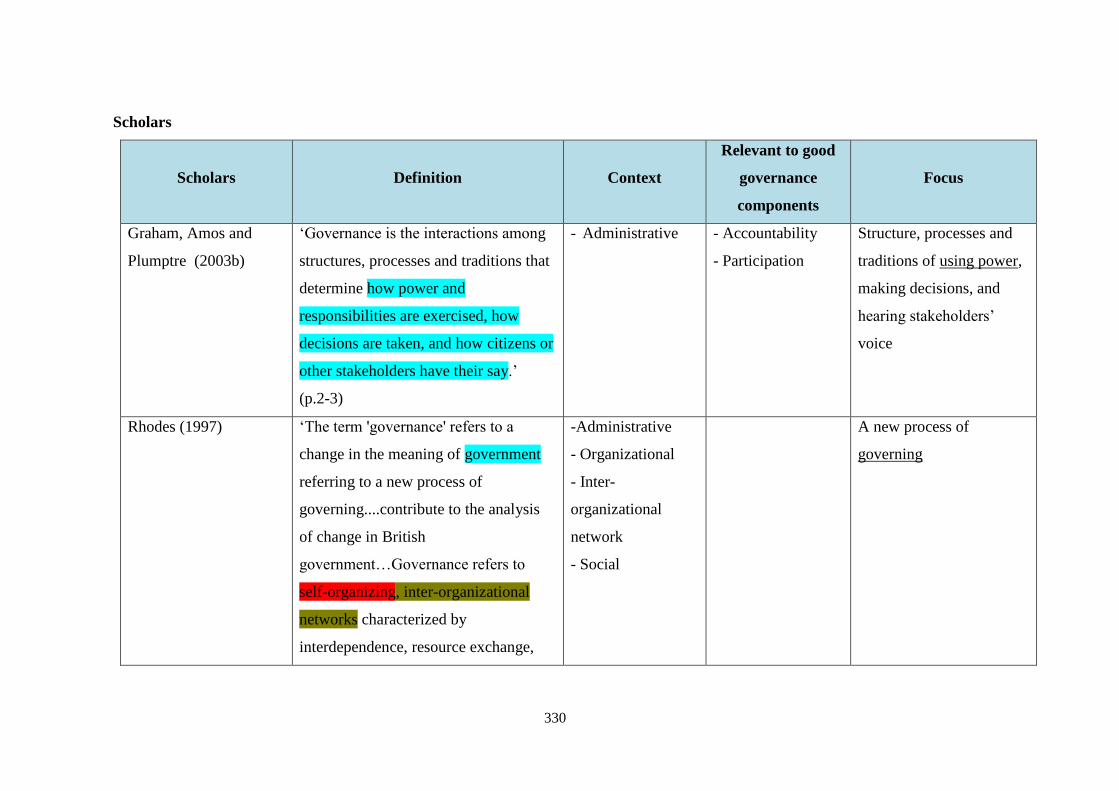
330
Scholars
Scholars Definition Context
Relevant to good
governance
components
Focus
Graham, Amos and
Plumptre (2003b)
‘Governance is the interactions among
structures, processes and traditions that
determine how power and
responsibilities are exercised, how
decisions are taken, and how citizens or
other stakeholders have their say.’
(p.2-3)
- Administrative - Accountability
- Participation
Structure, processes and
traditions of using power,
making decisions, and
hearing stakeholders’
voice
Rhodes (1997) ‘The term 'governance' refers to a
change in the meaning of government
referring to a new process of
governing....contribute to the analysis
of change in British
government…Governance refers to
self-organizing, inter-organizational
networks characterized by
interdependence, resource exchange,
-Administrative
- Organizational
- Inter-
organizational
network
- Social
A new process of
governing

331
Scholars Definition Context
Relevant to good
governance
components
Focus
rules of the game and significant
autonomy from the state.' (Rhodes,
1997, p.15)
‘Governance signifies a change in the
meaning of government, referring to a
new process of governing; or a changed
condition of ordered rule; or the new
method by which society is governed.’
(p.46)
Stoker (1998) ‘Governance is ultimately concerned
with creating the conditions for ordered
rule and collective action.’ (Stoker,
1998, p.17)
- Administrative - Rule of law
- Participation
Creating the conditions
for ordered rule and
collective action
Pierre and Peters (2000) ‘Governance as structure and
process….four common governance
arrangements that have existed
historically as well as at present:
- Administrative - Participation - Structure and process
of steering and
coordination

332
Scholars Definition Context
Relevant to good
governance
components
Focus
hierarchies, markets, networks and
communities….governance as the
process of steering and coordination…’
(p.14)
- Arrangement of
hierarchies, markets,
networks and
communities
Hulme, Savoia and Sen
(2015)
‘Governance is the effectiveness of
rules, policies and the functioning of
public bodies that affect the lives of the
members of a community.’ (p.86)
- Administrative - Effectiveness The effectiveness of rules,
policies and the
functioning of public
bodies
Frederickson and Smith.
(2003)
‘Governance refers to the lateral and
inter-institutional relations in
administration in the context of the
decline of sovereignty, the decreasing
importance of jurisdictional borders and
a general institutional fragmentation.’
(p.222)
- Organizational
- Administrative
The lateral and inter-
institutional relations in
administration
Fukuyama (2013) ‘Governance is about the performance
of agents in carrying out the wishes of
- Administrative The performance of
agents

333
Scholars Definition Context
Relevant to good
governance
components
Focus
principals, and not about the goals that
principals set.’ (Fukuyama ,2013,
p.350)
Kjær (2004) ‘Governance is the act or manner of
governing; the office or function of
governing….to govern is ‘to rule or
control with authority….to be
government (p.3)…..In the field of
public administration and public policy,
it involves the public sector functioned
best when it was apolitical, structured
as a hierarchy, and based on a system
of merit-recruitment and promotion
(p.4)…Governance refers to something
broader than government and it is about
steering and the rules of the game.’
(p.7)
- Administrative - Manner of governing
- Function of governing
(structure, recruitment,
promotion)

334
Scholars Definition Context
Relevant to good
governance
components
Focus
Kooiman (2003) Governance can be seen as the totality
of theoretical conceptions on
governing. (p.4)
- Academic Theories and concept
Hirst (2000 cited in UN,
2006, p.4)
‘Governance can be generally defined
as the means by which an activity or
ensemble of activities is controlled or
directed, such that it delivers an
acceptable range of outcomes according
to some established standard.’ (p.4)
- Administrative Controlling activities for
acceptable outcomes
Lee (2003) ‘Governance refers to changes in the
role, structure and operation process of
the government, or the way social
problems are resolved (p.3)….
Governance as a mechanism for
resolving common problems…
Governance as a mechanism for
resolving public problems, and
- Administrative Changes in the role,
structure and operation
process of the government
for resolving public
problems
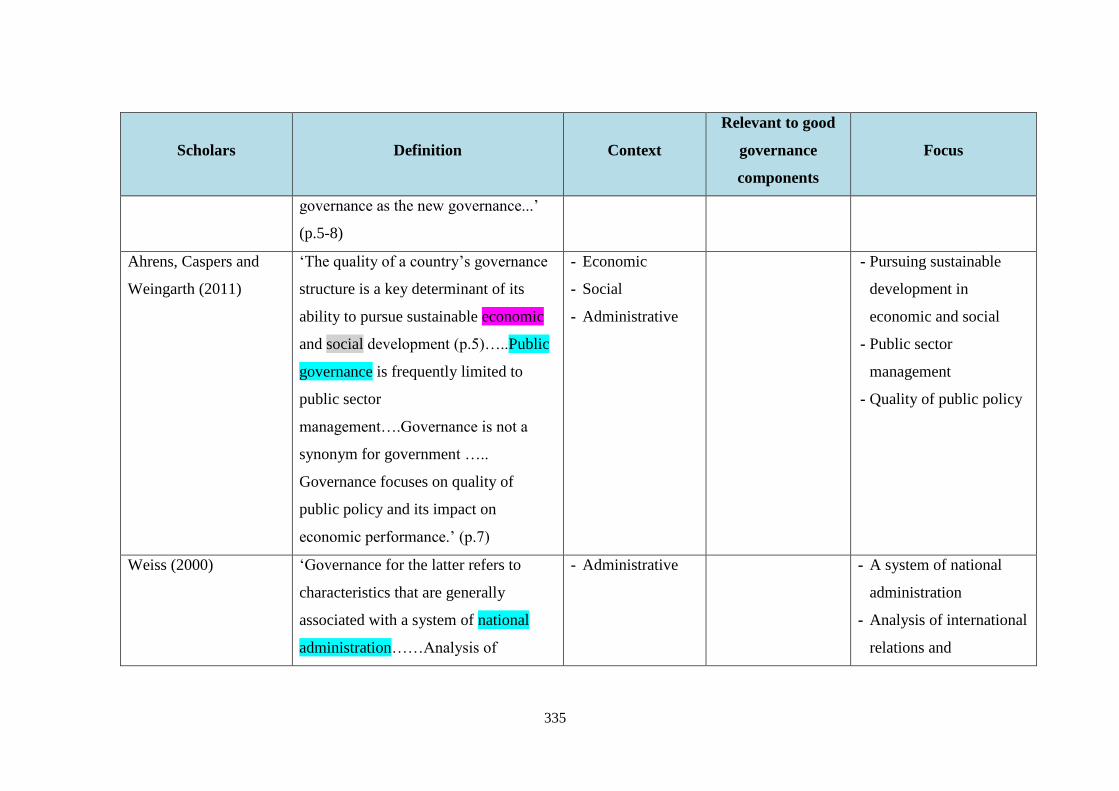
335
Scholars Definition Context
Relevant to good
governance
components
Focus
governance as the new governance...’
(p.5-8)
Ahrens, Caspers and
Weingarth (2011)
‘The quality of a country’s governance
structure is a key determinant of its
ability to pursue sustainable economic
and social development (p.5)…..Public
governance is frequently limited to
public sector
management….Governance is not a
synonym for government …..
Governance focuses on quality of
public policy and its impact on
economic performance.’ (p.7)
- Economic
- Social
- Administrative
- Pursuing sustainable
development in
economic and social
- Public sector
management
- Quality of public policy
Weiss (2000) ‘Governance for the latter refers to
characteristics that are generally
associated with a system of national
administration……Analysis of
- Administrative - A system of national
administration
- Analysis of international
relations and
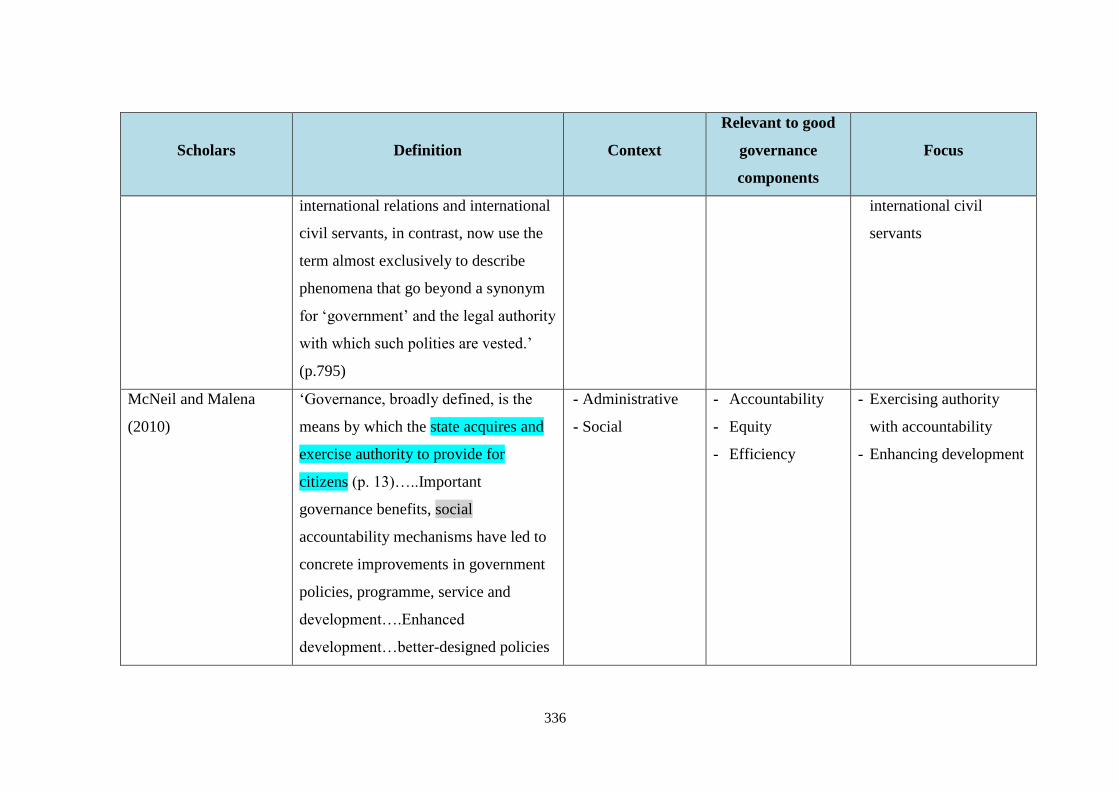
336
Scholars Definition Context
Relevant to good
governance
components
Focus
international relations and international
civil servants, in contrast, now use the
term almost exclusively to describe
phenomena that go beyond a synonym
for ‘government’ and the legal authority
with which such polities are vested.’
(p.795)
international civil
servants
McNeil and Malena
(2010)
‘Governance, broadly defined, is the
means by which the state acquires and
exercise authority to provide for
citizens (p. 13)…..Important
governance benefits, social
accountability mechanisms have led to
concrete improvements in government
policies, programme, service and
development….Enhanced
development…better-designed policies
- Administrative
- Social
- Accountability
- Equity
- Efficiency
- Exercising authority
with accountability
- Enhancing development

337
Scholars Definition Context
Relevant to good
governance
components
Focus
budget and plan…increased
resources…more equitable public
spending and services…greater
efficiency, less waste….better
development result.’ (p. 16)
Zhenglai and Guo
(2002)
‘In political science, ‘governance’
refers to the activity and process of
public authority for the realization of
public interest….Government focuses
on itself, while governance focuses on
society as a whole…. Governance
could also have good governance and
bad governance.’ (p.16)
- Political
- Administrative
- Social
The activity and process
of public authority for the
realization of public
interest
Cheema and Popovski
(2010)
‘Governance is the process of
interaction between three sets of actors
– the state, civil society, and the private
sector- in making political,
- Administrative
- Political
- Economic
- Social
The process of interaction
between three sets of
actors – the state, civil

338
Scholars Definition Context
Relevant to good
governance
components
Focus
administrative, economic, and social
decisions that affect citizens.’ (p. 8)
- Private sector society, and the private
sector
Chaudhry et al. (2009) ‘Governance is the instrument of
political, economic and administrative
authorities to manage a nation's affairs.’
(p.338)
- Political
- Economic
- Administrative
The instrument of
management for politics,
economic, and
administration
Lynn, Heinrich and Hill
(2000)
‘Governance generally refers to the
means for achieving direction, control,
and coordination of wholly or partially
autonomous individuals or
organizations on behalf of interests to
which they jointly contribute.’ (p. 235)
- Economic
- Public sector
- Social
- Administrative
The means for achieving
direction, control, and
coordination

339
1.2 Definitions of Good Governance
Organizations
Organizations Definition Context Relevant to good
governance components
World Bank (1992) ‘Good governance is an essential
complement to sound economic policies.
Efficient and accountable management by the
public sector and a predictable and
transparent policy framework are critical to
the efficiency of markets and governments,
and hence to economic development.’ (p.v)
- Economic
- Administration
- Accountable
- Transparency
- Efficiency
United Nations Development
Programme (UNDP, 1997)
‘Good governance has many attributes. It is
participatory, transparent and accountable. It
is effective in making the best use of
resources and is equitable. And it promotes
the rule of law.’ (website, p.1)
- Administrative - Participation
- Transparency
- Accountability
- Effectiveness
- Equity
- Rule of law
United Nation (UN, 2006) ‘According to the World Bank, good
governance entails sound public sector
management (efficiency, effectiveness and
- Administrative - Efficiency
- Effectiveness
- Accountability
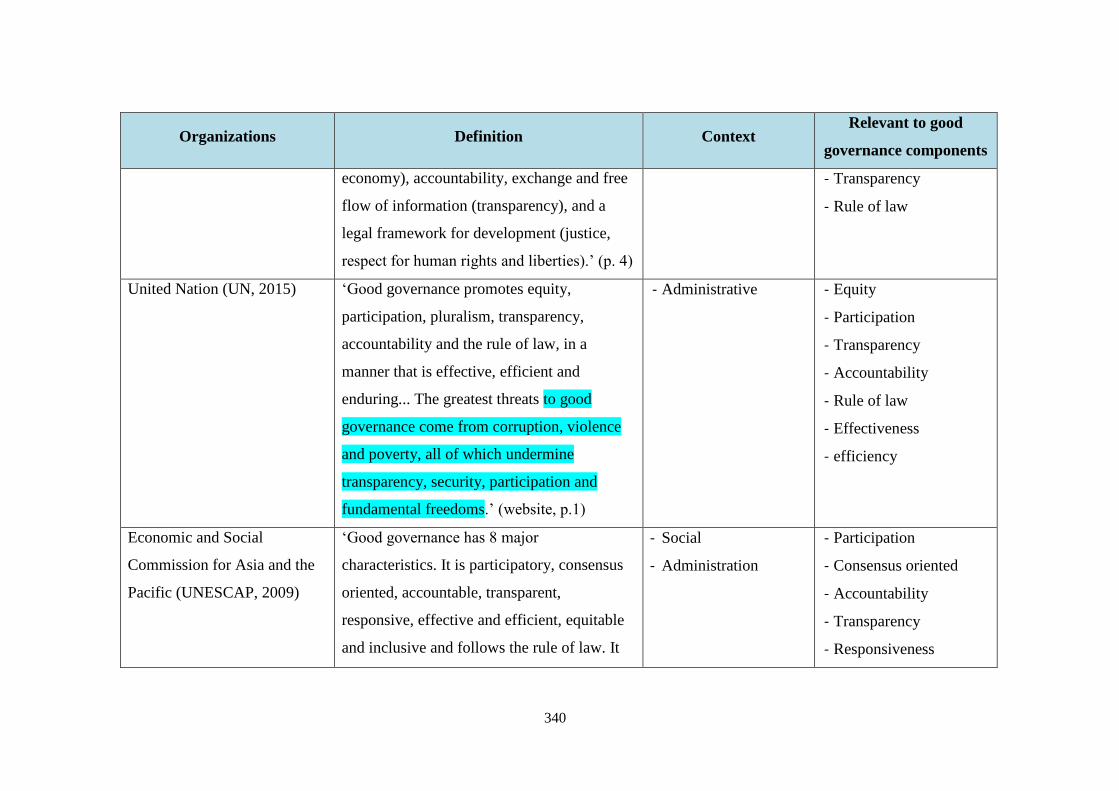
340
Organizations Definition Context Relevant to good
governance components
economy), accountability, exchange and free
flow of information (transparency), and a
legal framework for development (justice,
respect for human rights and liberties).’ (p. 4)
- Transparency
- Rule of law
United Nation (UN, 2015) ‘Good governance promotes equity,
participation, pluralism, transparency,
accountability and the rule of law, in a
manner that is effective, efficient and
enduring... The greatest threats to good
governance come from corruption, violence
and poverty, all of which undermine
transparency, security, participation and
fundamental freedoms.’ (website, p.1)
- Administrative - Equity
- Participation
- Transparency
- Accountability
- Rule of law
- Effectiveness
- efficiency
Economic and Social
Commission for Asia and the
Pacific (UNESCAP, 2009)
‘Good governance has 8 major
characteristics. It is participatory, consensus
oriented, accountable, transparent,
responsive, effective and efficient, equitable
and inclusive and follows the rule of law. It
- Social
- Administration
- Participation
- Consensus oriented
- Accountability
- Transparency
- Responsiveness
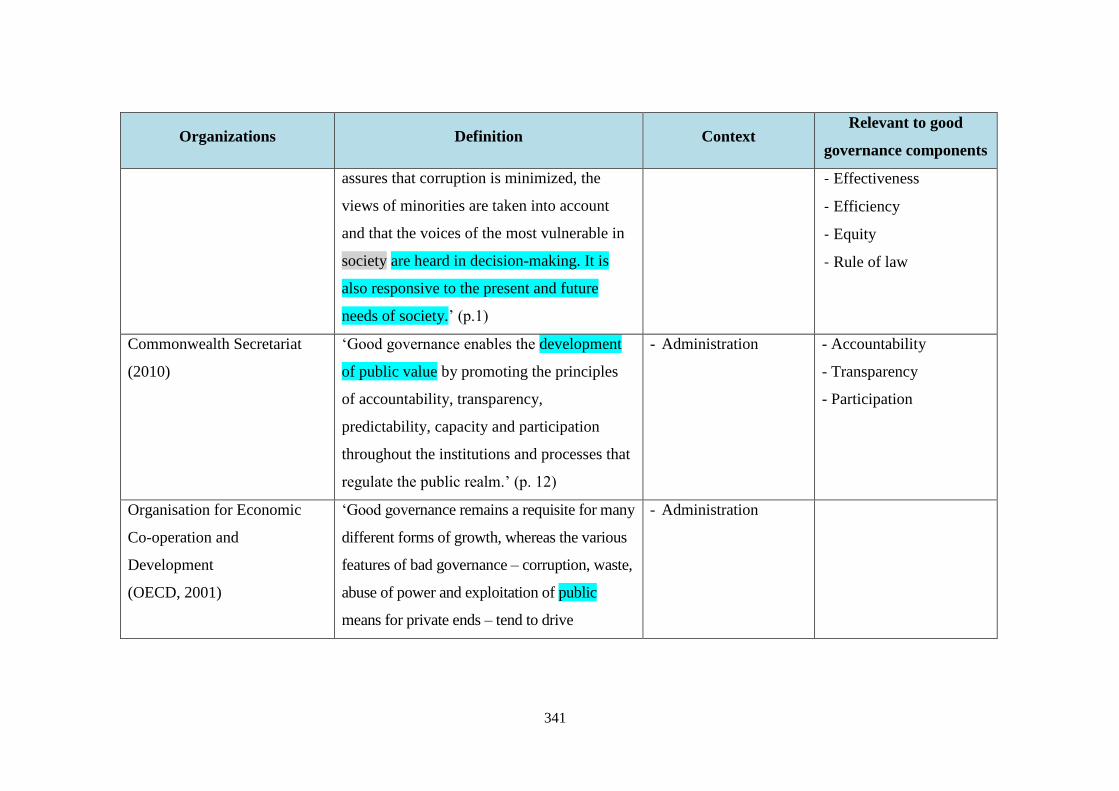
341
Organizations Definition Context Relevant to good
governance components
assures that corruption is minimized, the
views of minorities are taken into account
and that the voices of the most vulnerable in
society are heard in decision-making. It is
also responsive to the present and future
needs of society.’ (p.1)
- Effectiveness
- Efficiency
- Equity
- Rule of law
Commonwealth Secretariat
(2010)
‘Good governance enables the development
of public value by promoting the principles
of accountability, transparency,
predictability, capacity and participation
throughout the institutions and processes that
regulate the public realm.’ (p. 12)
- Administration - Accountability
- Transparency
- Participation
Organisation for Economic
Co-operation and
Development
(OECD, 2001)
‘Good governance remains a requisite for many
different forms of growth, whereas the various
features of bad governance – corruption, waste,
abuse of power and exploitation of public
means for private ends – tend to drive
- Administration
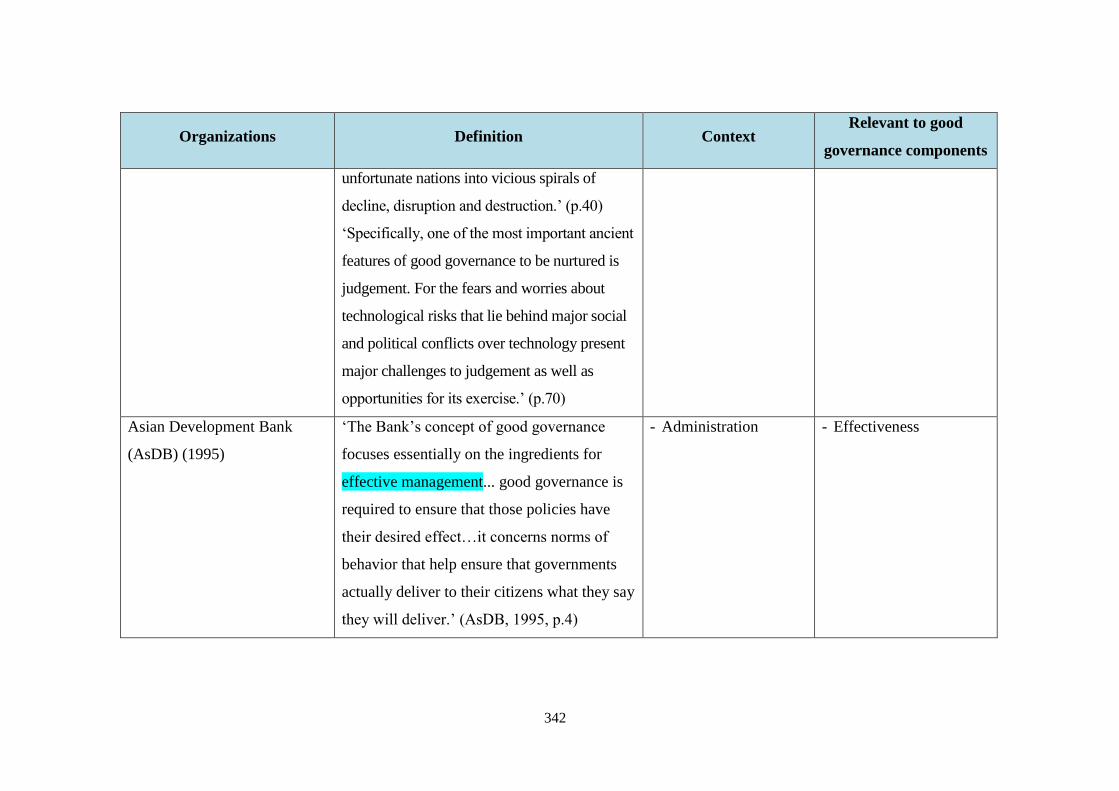
342
Organizations Definition Context Relevant to good
governance components
unfortunate nations into vicious spirals of
decline, disruption and destruction.’ (p.40)
‘Specifically, one of the most important ancient
features of good governance to be nurtured is
judgement. For the fears and worries about
technological risks that lie behind major social
and political conflicts over technology present
major challenges to judgement as well as
opportunities for its exercise.’ (p.70)
Asian Development Bank
(AsDB) (1995)
‘The Bank’s concept of good governance
focuses essentially on the ingredients for
effective management... good governance is
required to ensure that those policies have
their desired effect…it concerns norms of
behavior that help ensure that governments
actually deliver to their citizens what they say
they will deliver.’ (AsDB, 1995, p.4)
- Administration - Effectiveness
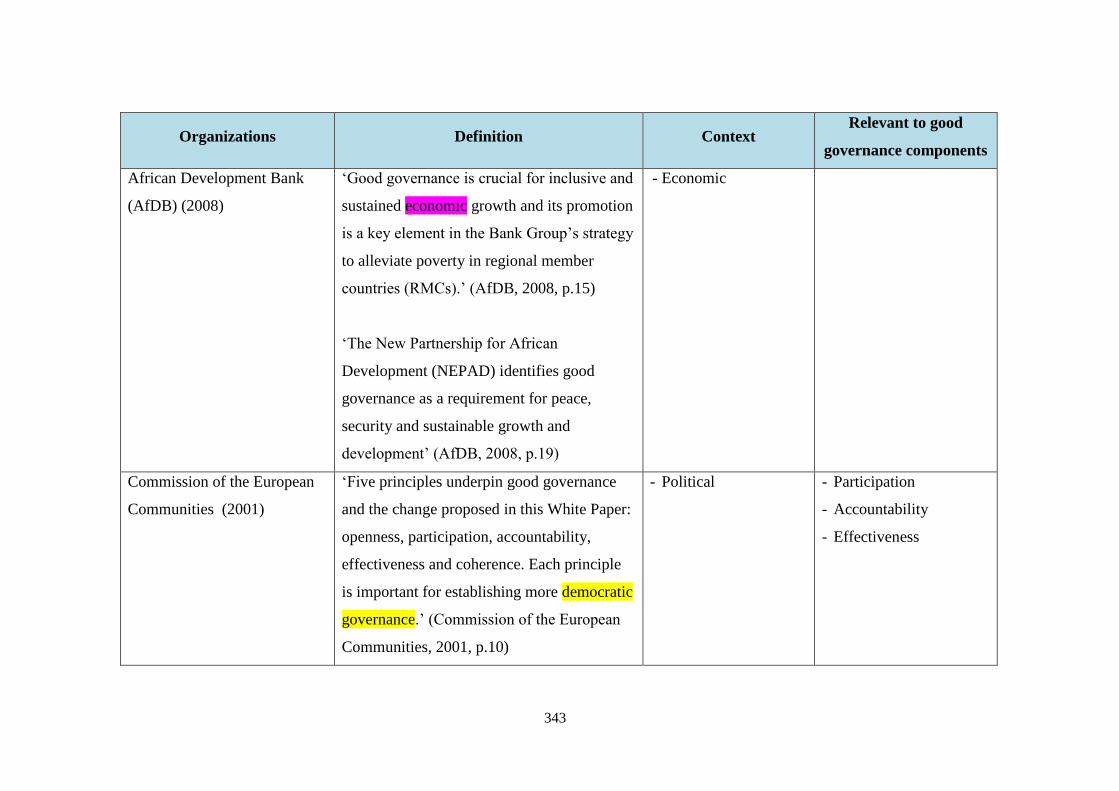
343
Organizations Definition Context Relevant to good
governance components
African Development Bank
(AfDB) (2008)
‘Good governance is crucial for inclusive and
sustained economic growth and its promotion
is a key element in the Bank Group’s strategy
to alleviate poverty in regional member
countries (RMCs).’ (AfDB, 2008, p.15)
‘The New Partnership for African
Development (NEPAD) identifies good
governance as a requirement for peace,
security and sustainable growth and
development’ (AfDB, 2008, p.19)
- Economic
Commission of the European
Communities (2001)
‘Five principles underpin good governance
and the change proposed in this White Paper:
openness, participation, accountability,
effectiveness and coherence. Each principle
is important for establishing more democratic
governance.’ (Commission of the European
Communities, 2001, p.10)
- Political - Participation
- Accountability
- Effectiveness

344
Scholars
Scholars Definition Context Relevant to good
governance components
Graham, Amos and
Plumptre
(2003)
‘Good governance principles warrant elaboration.
First, these principles represent an ideal that no
society has fully attained or realized. Supporters
attribute economic success and social stability to
their governance policies.’ (p.7)
- Economic
- Social
- Administrative
Rhodes (1997) 'Good governance' marries the NPM to the
advocacy of liberal democracy.’ (p.50)
- Administration
- Political
Leftwich (1993) ‘An efficient public service, an independent
judicial system and legal framework to enforce
contracts; the accountable administration of public
funds; an independent public auditor, responsible
to a representative legislature; respect for the law
and human rights at all levels of government; a
pluralistic institutional structure, and a free press.’
(p.610)
- Administrative
- Institution
(organizational)
- Systematic
- Political
- Rule of law
- Accountability
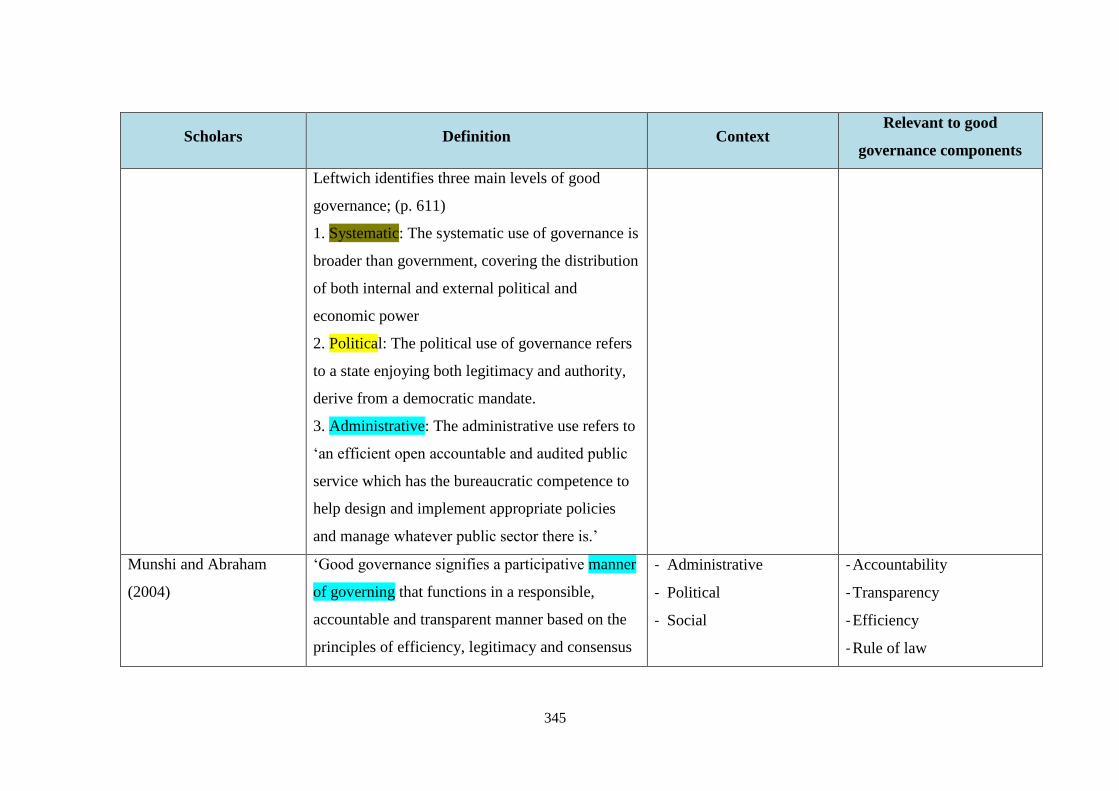
345
Scholars Definition Context Relevant to good
governance components
Leftwich identifies three main levels of good
governance; (p. 611)
1. Systematic: The systematic use of governance is
broader than government, covering the distribution
of both internal and external political and
economic power
2. Political: The political use of governance refers
to a state enjoying both legitimacy and authority,
derive from a democratic mandate.
3. Administrative: The administrative use refers to
‘an efficient open accountable and audited public
service which has the bureaucratic competence to
help design and implement appropriate policies
and manage whatever public sector there is.’
Munshi and Abraham
(2004)
‘Good governance signifies a participative manner
of governing that functions in a responsible,
accountable and transparent manner based on the
principles of efficiency, legitimacy and consensus
- Administrative
- Political
- Social
- Accountability
- Transparency
- Efficiency
- Rule of law

346
Scholars Definition Context Relevant to good
governance components
for the purpose of promoting the rights of
individual citizens and the public interest, thus
indicating the exercise of political will for
ensuring the material welfare of society
and sustainable development with social justice.’
(p.51-52)
- Consensus oriented
- Participation
Hirst (2000 cited in UN,
2006, p.4)
‘Good governance means creating an effective
political framework conducive to private economic
action: stable regimes, the rule of law, efficient
State administration adapted to the roles that
Governments can actually perform and a strong
civil society independent of the State.’ (p.4)
- Political
- Economic
- Administration
- Social
- Effectiveness
- Rule of law
- Efficiency
Grindle (2010) ‘‘....good governance agenda as a condition
necessary for development....Good governance, in
fact, may even be a consequence of development. ’
(p.13)
- Political
- Economic
Chaudhry et al. (2009) Good governance can be defined with the
following features: (Chaudhry et al., 2009, p.339)
- Administrative
- Social
- Participation
- Transparency

347
Scholars Definition Context Relevant to good
governance components
- Good governance is mutually supportive and
cooperative relationships between government,
society, and the private sector.
- Good governance is defined as control of all, or
some combination of, the following elements:
contribution, transparency of decision-making,
accountability, rule of law, predictability.
- Good governance is normative in origin. The
values that provide the foundation for
governance are the values postulated by the
defining characters and institutions.
- Private sector
- Institutional
(organizational)
- Accountability
- Rule of law
Bowornwathana (2000) ‘The objective of good governance is to strengthen
the institutions of civil society, and to transform
government into more open, responsive,
accountable, and democratic system.’ (p. 401)
- Institutional
(organizational)
- Social
- Administration
- Political
- Responsiveness
- Accountability
Lartey and Sastry (2010) ‘Good governance as Anti-corruption tool.’ (p.2) - Administrative
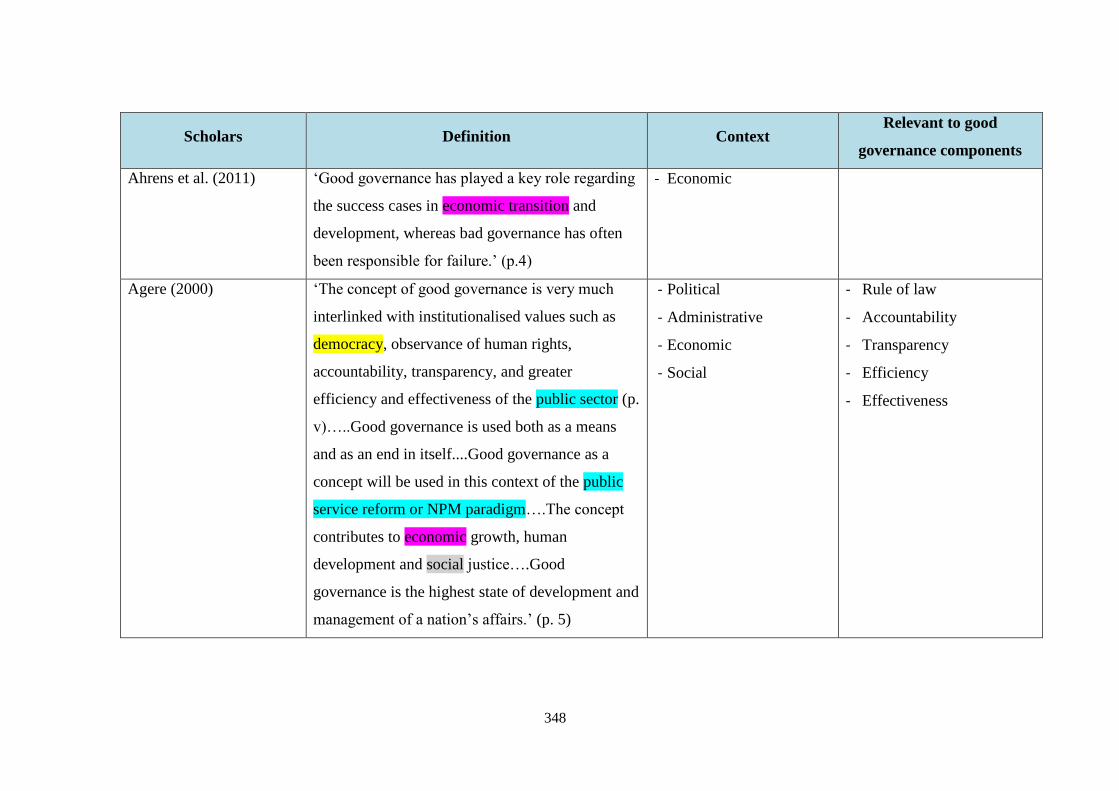
348
Scholars Definition Context Relevant to good
governance components
Ahrens et al. (2011) ‘Good governance has played a key role regarding
the success cases in economic transition and
development, whereas bad governance has often
been responsible for failure.’ (p.4)
- Economic
Agere (2000) ‘The concept of good governance is very much
interlinked with institutionalised values such as
democracy, observance of human rights,
accountability, transparency, and greater
efficiency and effectiveness of the public sector (p.
v)…..Good governance is used both as a means
and as an end in itself....Good governance as a
concept will be used in this context of the public
service reform or NPM paradigm….The concept
contributes to economic growth, human
development and social justice….Good
governance is the highest state of development and
management of a nation’s affairs.’ (p. 5)
- Political
- Administrative
- Economic
- Social
- Rule of law
- Accountability
- Transparency
- Efficiency
- Effectiveness

349
Scholars Definition Context Relevant to good
governance components
Zhenglai and Guo (2002) ‘Good governance is the management process that
maximizes public interest…The essential
characteristics of good governance are the
cooperative management of public life by both
government and citizens, and the new relationship
between political state and civil society, and the best
political situation involving public and private actors
and governmental and civil organizations’ (p.17)
- Administrative
- Political
- Social
Smith, B. C. (2007) ‘Good governance agenda is assessed for its
contribution to development and the cost to society
of bad governance (p. x)….The three political
attributes of good governance that occur in the
governance agenda of international and agencies
require changes in political action and organization.’
(p. xi)
- Social
- Political
- Organizational

350
Scholars Definition Context Relevant to good
governance components
Weiss (2000) ‘…actions to foster good governance concentrate on
attenuating two undesirable characteristics that had
been prevalent earlier: the unrepresentative character
of governments and the inefficiency of non-market
systems.’ (p.801)
- Administrative - Efficiency
Sundaram and
Chowdhury (2012)
‘… the good governance agenda has defined
policy reform goals for developing countries that
are widely supported in many developing
countries and, especially, internationally.’ (p. 9)
- Administrative

351
Appendix 2: The definitions of nine key components of good governance
Sources Efficiency Effectiveness Accountability Transparency Participation Rule of law Equity Responsiveness Consensus
oriented
World Bank
(1994,
p.12,29,42)
‘Accountability is at
the heart of good
governance and has
to do with holding
governments
responsible for their
actions.’ (p.12)
‘Transparency is
important for
specific public
programs, such as
the divestiture of
state-owned
enterprises, which
will quickly forfeit
public confidence
if privatization is
not seen as an
open process.’
(p.29)
‘Participation is
intrinsic to good
governance….
Measures at the
national level to
improve the
effectiveness and
efficiency of
government have
direct parallels at the
micro level as well.
Transparency enables
people affected by
development plans to
know the options
available to them.’
(p.42)

352
Sources Efficiency Effectiveness Accountability Transparency Participation Rule of law Equity Responsiveness Consensus
oriented
United Nations
Development
Programme
(UNDP, 1994a,
p. 5)
‘Processes and institutions
produce results that meet needs
while making the best use of
resources.’ (p. 5)
‘Decision-makers in
government, the
private sector and
civil society
organisations are
accountable to the
public, as well as to
institutional
stakeholders. This
accountability
differs depending
on the organisation
and whether the
decision is internal
or external to an
organisation.’ (p. 5)
‘Transparency is
built on the free
flow of
information.
Processes,
institutions and
information are
directly accessible
to those concerned
with them, and
enough
information is
provided to
understand and
monitor them.’
(p. 5)
‘All men and women
should have a voice in
decision-making,
either directly or
through legitimate
intermediate
institutions that
represent their
interests. Such broad
participation is built on
freedom of association
and speech, as well as
capacities to
participate
constructively.’ (p. 5)
‘Legal
frameworks
should be fair
and enforced
impartially,
particularly the
laws on human
rights.’ (p. 5)
‘All men and
women have
opportunities
to improve or
maintain their
well-being.’
(p. 5)
‘Institutions and
processes try to
serve all
stakeholders.’
(p. 5)
‘Good
governance
mediates
differing
interests to
reach a broad
consensus on
what is in the
best interests
of the group
and, where
possible, on
policies and
procedures.’
(p. 5)
United Nations
Economic and
Social
Commission for
Asia and the
Pacific
(UNESCAP,
2009, p. 2-3)
‘Good governance means that
processes and institutions
produce results that meet the
needs of society while making
the best use of resources at their
disposal. The concept of
efficiency in the context of good
governance also covers the
sustainable use of natural
‘Accountability is a
key requirement of
good governance.
Not only
governmental
institutions but also
the private sector
and civil society
organizations must
‘Participation by both
men and women is a
key cornerstone of
good governance.
Participation could be
either direct or through
legitimate intermediate
institutions or
representatives. It is
‘Good
governance
requires fair
legal
frameworks that
are enforced
impartially. It
‘A society’s
well being
depends on
ensuring
that all its
members feel
that they
have a stake
in it and do
‘Good
governance
requires that
institutions
and processes
try to serve all
stakeholders
within a
reasonable
‘There are
several actors
and as many
view
points in a
given society.
Good
governance

353
Sources Efficiency Effectiveness Accountability Transparency Participation Rule of law Equity Responsiveness Consensus
oriented
resources and the protection of
the environment.’ (p.3)
be accountable to
the public and to
their institutional
stakeholders. Who
is accountable to
whom varies
depending on
whether decisions
or actions taken are
internal or external
to an organization
or institution. In
general an
organization or an
institution is
accountable to those
who will be affected
by its decisions or
actions.
Accountability
cannot be enforced
without
transparency and
the rule of law.’
(p.3)
important to point out
that representative
democracy does not
necessarily mean that
the concerns of the
most vulnerable in
society would be taken
into consideration in
decision making.
Participation needs to
be informed and
organized. This means
freedom of association
and expression on the
one hand and an
organized civil society
on the other hand.’
(p.2)
also requires
full protection
of human rights,
particularly
those of
minorities.
Impartial
enforcement of
laws requires an
independent
judiciary and an
impartial and
incorruptible
police force.’
(p.2)
not feel
excluded
from the
mainstream
of society.
This requires
all
groups, but
particularly
the most
vulnerable,
have
opportunities
to improve or
maintain
their well
being.’ (p.3)
timeframe.’
(p.2)
requires
mediation of
the different
interests in
society to
reach a broad
consensus
in society
on what is
in the best
interest of
the whole
community
and how
this can be
achieved. It
also requires
a broad and
long-term
perspective
on what is
needed for
sustainable
human

354
Sources Efficiency Effectiveness Accountability Transparency Participation Rule of law Equity Responsiveness Consensus
oriented
development
and how to
achieve the
goals of such
development.
This can only
result from an
understanding
of the
historical,
cultural and
social contexts
of a given
society or
community.’
(p.3)
United Nation
(UN, 2006,
p.10)
‘Accountability is
one of the
prerequisites of
democratic or good
governance. It
entails holding
elected or appointed
officials charged
‘…transparency,
that is, unfettered
access to timely
and reliable
information on
decisions and
performance,…’
(p. 10)
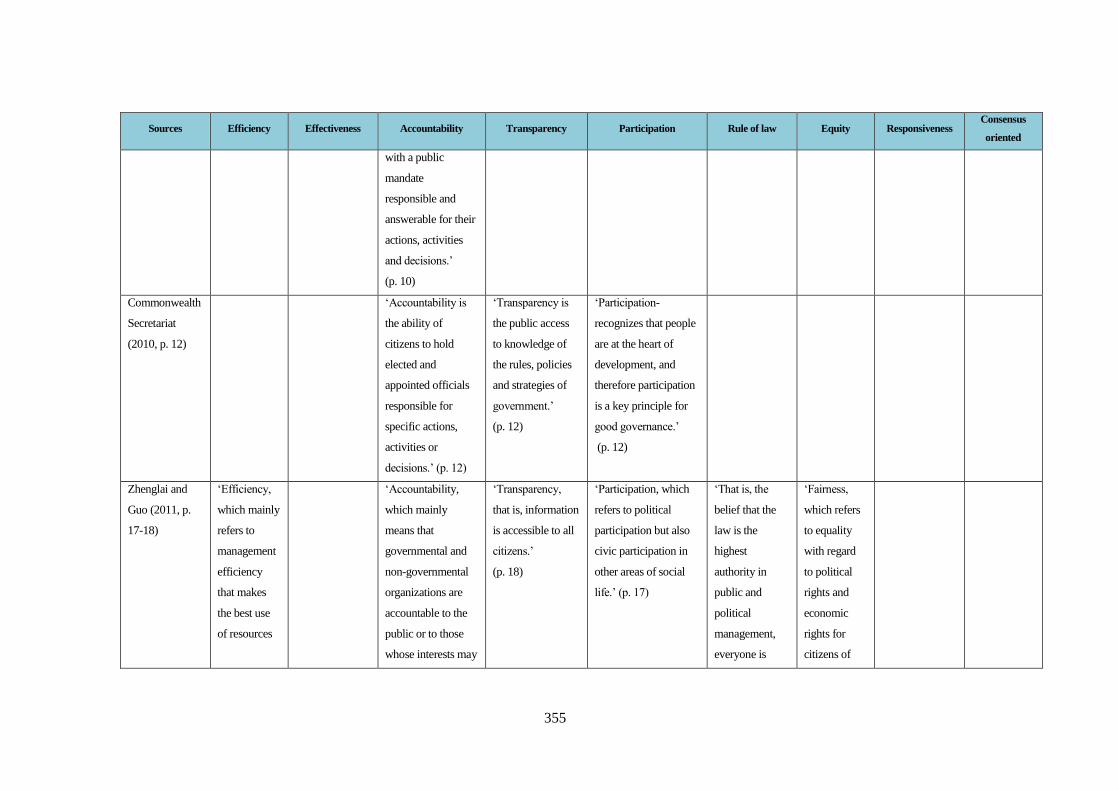
355
Sources Efficiency Effectiveness Accountability Transparency Participation Rule of law Equity Responsiveness Consensus
oriented
with a public
mandate
responsible and
answerable for their
actions, activities
and decisions.’
(p. 10)
Commonwealth
Secretariat
(2010, p. 12)
‘Accountability is
the ability of
citizens to hold
elected and
appointed officials
responsible for
specific actions,
activities or
decisions.’ (p. 12)
‘Transparency is
the public access
to knowledge of
the rules, policies
and strategies of
government.’
(p. 12)
‘Participation-
recognizes that people
are at the heart of
development, and
therefore participation
is a key principle for
good governance.’
(p. 12)
Zhenglai and
Guo (2011, p.
17-18)
‘Efficiency,
which mainly
refers to
management
efficiency
that makes
the best use
of resources
‘Accountability,
which mainly
means that
governmental and
non-governmental
organizations are
accountable to the
public or to those
whose interests may
‘Transparency,
that is, information
is accessible to all
citizens.’
(p. 18)
‘Participation, which
refers to political
participation but also
civic participation in
other areas of social
life.’ (p. 17)
‘That is, the
belief that the
law is the
highest
authority in
public and
political
management,
everyone is
‘Fairness,
which refers
to equality
with regard
to political
rights and
economic
rights for
citizens of

356
Sources Efficiency Effectiveness Accountability Transparency Participation Rule of law Equity Responsiveness Consensus
oriented
for public
interests.’
(p. 18)
be affected by their
decisions.’ (p. 18)
equal before the
law, and
enforcement of
laws should be
impartial.’
(p. 17)
different
genders,
class, races,
educational
qualifications,
and religious
and political
beliefs.’
(p. 18)
Agere (2000, p.
7,109 )
Good and services have been
delivered on time with limited
cost…expenditures have been
reduced…clients have been
satisfied with the service….the
quality of service has improved
and objectives have been
achieved at less cost. (p. 109)
‘Accountability is
defined as holding
responsible elected
or appointed
individuals and
organizations
charged with a
public mandate to
account for specific
actions, activities or
decisions to the
public from whom
they derive their
authority.’ (p.7)
‘Transparency is
broadly defined as
public knowledge
of the policies of
government and
confidence in its
intentions.’ (p.7)
‘Participation is
defined as a process
whereby stockholders
exercise influence
over public policy
decisions, and share
control over resources
and institutions that
affect their lives,
thereby providing a
check on power of
government.’ (p.9)
‘The rule of
law ensures
that all
institutions of
the nation are
subjected to the
laws of the
country, strict
code of
conduct,
accountability
and transparent
procedures...It
calls for a
nation to have
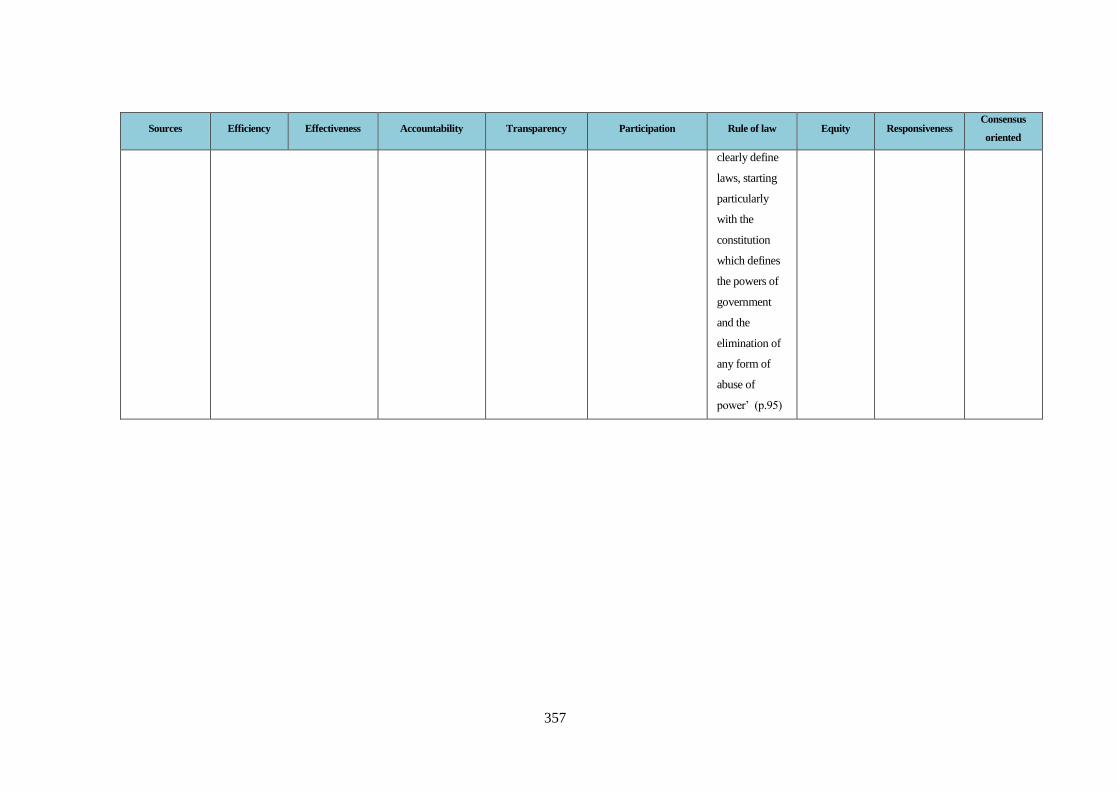
357
Sources Efficiency Effectiveness Accountability Transparency Participation Rule of law Equity Responsiveness Consensus
oriented
clearly define
laws, starting
particularly
with the
constitution
which defines
the powers of
government
and the
elimination of
any form of
abuse of
power’ (p.95)

358
Appendix 3: The definitions of performance, performance management
and performance measurement
3.1 Definitions of Performance
Performance = Means and Performance = End
Sources Definition Interpretation
Dooren et al. (2015) ‘Performance as a concept: Performance is conceptualized with attention to
both the quality of actions and the quality of achievements, it may be
typified as sustainable results… refers to the productive organization, that
is, an organization that has the capacity to perform and converts this
capacity into results- outputs and outcomes. ...performance indicators may
cover the whole value chain from inputs over outputs to outcomes.’ (p.3-4)
‘Performance as an agenda: The term 'performance' expresses a programme
of change and improvement, which is promoted by a group of like-minded
actors that is usually only loosely coupled...these group of actors sharing a
performance agenda are called performance movement… Measuring
performance is systematically collecting data by observing and registering
performance-related issues for some performance purpose.’ (p.5,7)
Quality of actions and
achievement
Programme of change and
improvement

359
Sources Definition Interpretation
‘Performance as outputs and outcomes of activities: Performance is thus
about maximizing profit for society...A complex and dynamic system of
political representation, fuelled by interests, power, ideology and political
judgment, determines what society values… Alternatively, performance is
seen as the realization of public values. Values and performance are
distinct concepts, and all public values can lead to performance. Beside
efficiency and effectiveness, successful practices of for instance
participation or innovation could also be seen as dimensions of
performance.’ (p. 22,23,29)
Maximizing profit for society
or public values
Kearney and Berman
(1999)
‘Performance in this context is defined as managing public programs for
outcomes. Managers use public resources and mandates to ensure that their
programs meet public objectives and expectations. The meaning of the term
performance is similar to that of the term productivity… However,
performance is broader than some narrow meanings of productivity
(efficiency, for example).’ (p. 1-2)
Management for
achievement/outcomes
Institute of Personnel
Management (1992)
‘…the cult of ‘performance’ characterised by the search for strategies to
improve the contribution of individuals to the overall success of
organizations.’ (p.1)
Strategies for improvement of
individuals’ contribution and
the organizations’ overall
success

360
Sources Definition Interpretation
Houldsworth and
Jirasinghe (2006)
‘…an act and the result of an act. In recent years, the term has also evolved in
the direction of referring to an accomplishment of something that is desired or
intended.’ (p. 16)
An act and the result of an act,
and accomplishment of
something that is desired or
intended
Williams (1998) ‘Performance is defined as: The record of outcomes produced on a specified
job function or activity during a specified time period.’ (Bernadin et al., 1995,
p. 470-1 cited in Williams, 1998, p.75)
Outcomes of job or activities
produced
Lebas (1995) ‘Performance is about capability and the future.’ (p. 26)
‘Performance is about deploying and managing well the components of the
causal model(s) that lead to the timely attainment of stated objectives within
constraints specific to the firm and to the situation. Performance is therefore
case specific and decision-maker specific.’ (p. 29)
Capability and the future
Deploying and managing
components of the causal
model(s)
Bernardin (1993) ‘Performance is defined as the record of outcomes produced on a specified
job function or activity during a specified time period.’ (p. 379)
The record of outcomes

361
3.2 Definitions of Performance management (PM)
Performance = Means and Performance = End
Sources Definition Interpretation
Armstrong and Baron
(1998)
‘Performance management is a strategic and integrated approach to
delivering sustained success to organizations by improving the performance
of the people who work in them and by developing the capabilities of teams
and individual contributors.’ (p. 7)
A strategic and integrated approach
to delivering sustained success by
improving people’s performance and
developing teams and individual’s
capabilities
Fletcher (1993) ‘…an approach to creating a shared vision of the purpose and aims of the
organization, helping each individual employees to understand and
recognise their part in contributing to them, and thereby managing and
enhancing the performance of both individuals and the organization.’
(Fletcher and Williams in IPM, 1992 cited in Fletcher, 1993, p. 35)
An approach to creating a shared
vision of the purpose and aims of the
organization
Varma, Budhwar and
DeNisi (2008)
‘Performance management is usually described as the system through
which organizations set work goals, determine performance standards,
assign and evaluate work, provide performance feedback, determine
training and development needs, and distribute rewards.’ (p.15)
A system to set goals, determine
performance, evaluate work, provide
feedback, determine development
needs
Pritchard and
Diazgranados (2008)
‘Performance management is defined as a range of practices an
organization engages in to enhance the performance of a target person or
A range of practices an organization
engages in to enhance a target person
or group’s performance
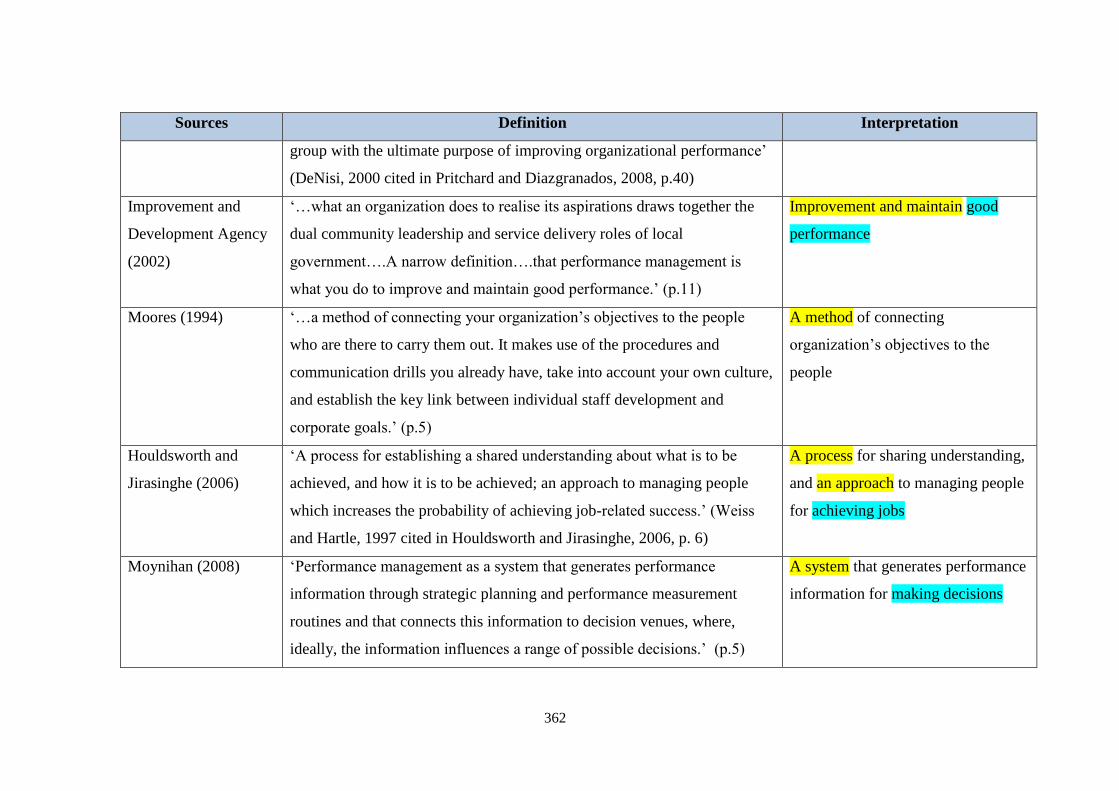
362
Sources Definition Interpretation
group with the ultimate purpose of improving organizational performance’
(DeNisi, 2000 cited in Pritchard and Diazgranados, 2008, p.40)
Improvement and
Development Agency
(2002)
‘…what an organization does to realise its aspirations draws together the
dual community leadership and service delivery roles of local
government….A narrow definition….that performance management is
what you do to improve and maintain good performance.’ (p.11)
Improvement and maintain good
performance
Moores (1994) ‘…a method of connecting your organization’s objectives to the people
who are there to carry them out. It makes use of the procedures and
communication drills you already have, take into account your own culture,
and establish the key link between individual staff development and
corporate goals.’ (p.5)
A method of connecting
organization’s objectives to the
people
Houldsworth and
Jirasinghe (2006)
‘A process for establishing a shared understanding about what is to be
achieved, and how it is to be achieved; an approach to managing people
which increases the probability of achieving job-related success.’ (Weiss
and Hartle, 1997 cited in Houldsworth and Jirasinghe, 2006, p. 6)
A process for sharing understanding,
and an approach to managing people
for achieving jobs
Moynihan (2008) ‘Performance management as a system that generates performance
information through strategic planning and performance measurement
routines and that connects this information to decision venues, where,
ideally, the information influences a range of possible decisions.’ (p.5)
A system that generates performance
information for making decisions

363
Sources Definition Interpretation
Williams (1998) ‘Performance management is no single thing…focuses on the individual
and which, for the most part, is essentially an evolutionary extension of
traditional appraisal practice…’ (p.1)
Focusing on individual and appraisal
Cooke (2003) ‘… perspectives on PM: as a system of managing organizational
performance, as a system of employee performance, and as a system of
integrating the two.’ (p.90)
A system of managing organizational
performance and a system of
employee performance
Buchner (2007) ‘PM has been defined as management’s systematic application of processes
aimed at optimizing human performance in an organization.’ (Warren,
1982 cited in Buchner, 2007, p. 61)
‘A process for establishing a shared understanding about what is to be
achieved, and how it is to be achieved, and an approach to managing
people that increases the probability of achieving success.’ (Weiss and
Hartle, 1997, p. 3 cited in Buchner, 2007, p. 61)
A management through systematic
application
A process for establishing a shared
understanding
Holloway (1999) ‘PM can be defined as the managerial work needed to ensure that the
organization’s top-level aims (sometimes expressed as ‘Vision’ and
‘Mission’ statements) and objectives are attained.’ (p. 240)
The managerial work to ensure
attainment of the organization’s aims
and objectives
Osborne et al. (1993) ‘Performance management- the process of ensuring that: The process of ensuring process and
result of performance assessment

364
Sources Definition Interpretation
- performance assessment is an integral part of any programme from its
outset;
- its component parts are understandable to those gathering the data on
performance and to those analysing and using it;
- the results of performance assessment are used to inform all levels of
programme planning and implementation; and
- the performance assessment process is oriented toward enabling and
improving performance in the future.’ (p. 4)
Busi and Bititci (2006) ‘Performance management is defined as the use of performance
measurement information to effect positive change in organizational
culture, systems and processes, by helping to set agreed-upon performance
goals, allocating and prioritising resources, informing managers to either
confirm or change current policy or programme directions to meet those
goals, and sharing results of performance in pursuing those goals.’
(Amaratunga and Baldry, 2002 cited in Busi and Bititci, 2006, p. 14)
The use of performance
measurement information to meet
goals
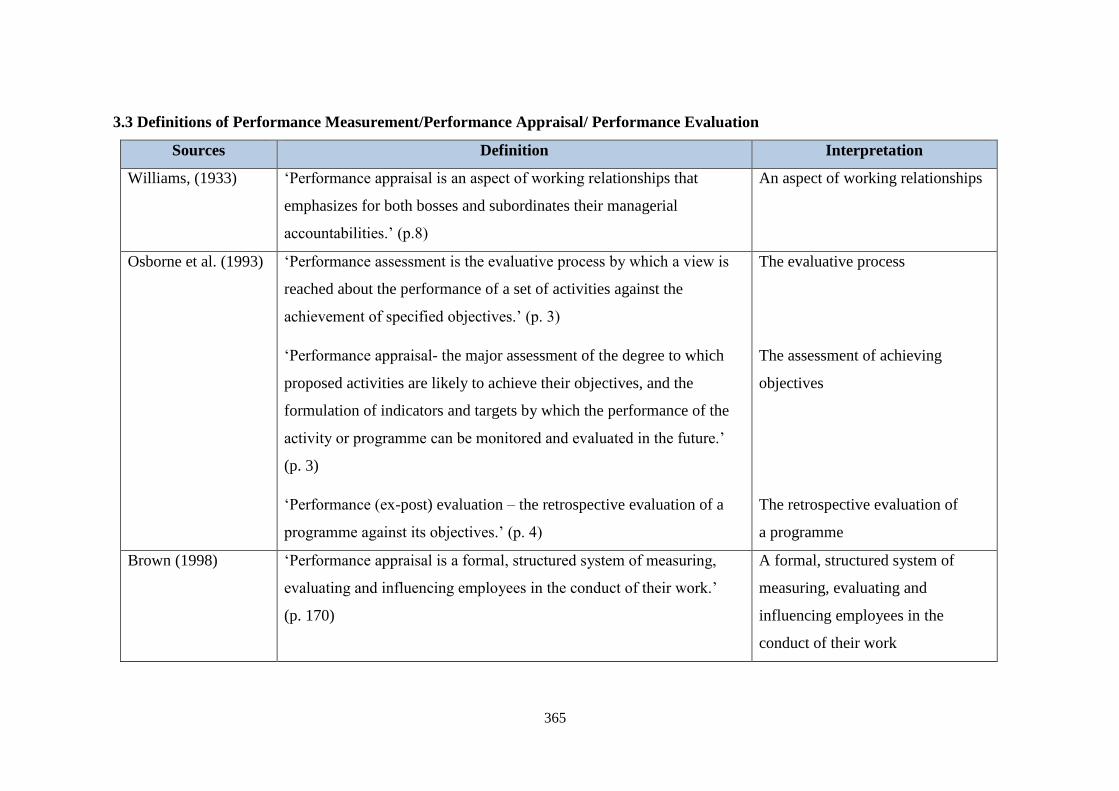
365
3.3 Definitions of Performance Measurement/Performance Appraisal/ Performance Evaluation
Sources Definition Interpretation
Williams, (1933) ‘Performance appraisal is an aspect of working relationships that
emphasizes for both bosses and subordinates their managerial
accountabilities.’ (p.8)
An aspect of working relationships
Osborne et al. (1993) ‘Performance assessment is the evaluative process by which a view is
reached about the performance of a set of activities against the
achievement of specified objectives.’ (p. 3)
‘Performance appraisal- the major assessment of the degree to which
proposed activities are likely to achieve their objectives, and the
formulation of indicators and targets by which the performance of the
activity or programme can be monitored and evaluated in the future.’
(p. 3)
‘Performance (ex-post) evaluation – the retrospective evaluation of a
programme against its objectives.’ (p. 4)
The evaluative process
The assessment of achieving
objectives
The retrospective evaluation of
a programme
Brown (1998) ‘Performance appraisal is a formal, structured system of measuring,
evaluating and influencing employees in the conduct of their work.’
(p. 170)
A formal, structured system of
measuring, evaluating and
influencing employees in the
conduct of their work
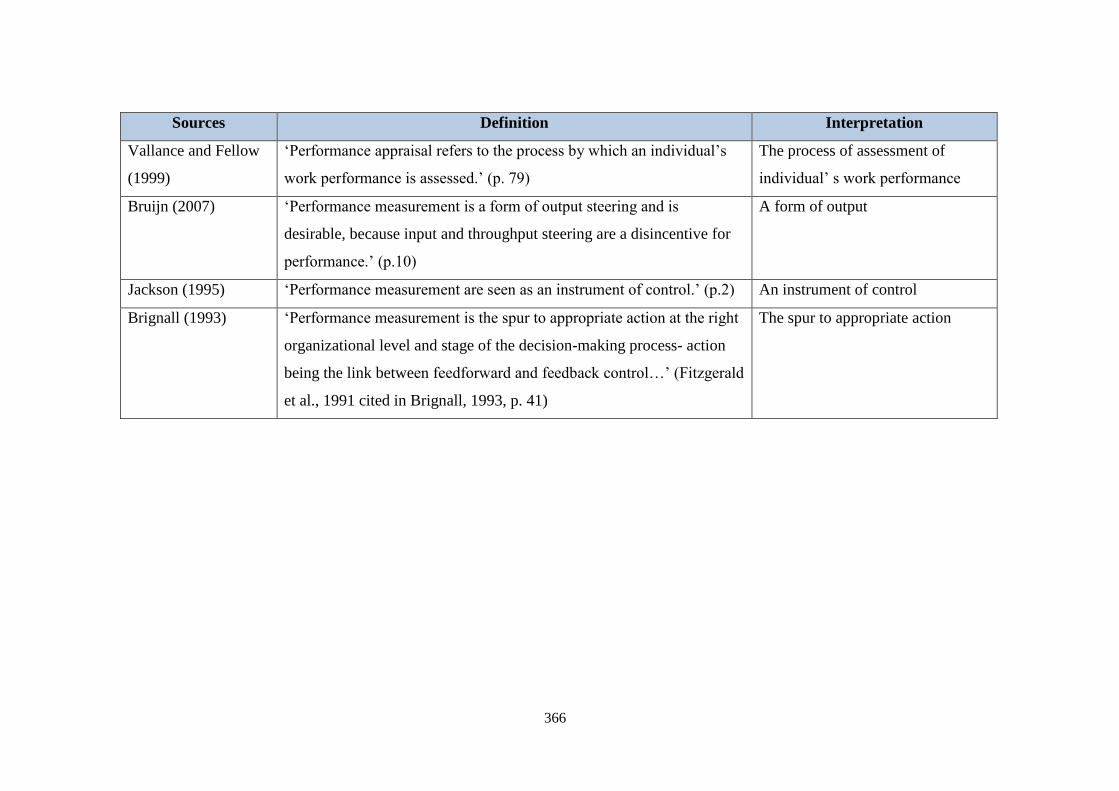
366
Sources Definition Interpretation
Vallance and Fellow
(1999)
‘Performance appraisal refers to the process by which an individual’s
work performance is assessed.’ (p. 79)
The process of assessment of
individual’ s work performance
Bruijn (2007) ‘Performance measurement is a form of output steering and is
desirable, because input and throughput steering are a disincentive for
performance.’ (p.10)
A form of output
Jackson (1995) ‘Performance measurement are seen as an instrument of control.’ (p.2) An instrument of control
Brignall (1993) ‘Performance measurement is the spur to appropriate action at the right
organizational level and stage of the decision-making process- action
being the link between feedforward and feedback control…’ (Fitzgerald
et al., 1991 cited in Brignall, 1993, p. 41)
The spur to appropriate action

367
Appendix 4: The definitions of organizational culture
4.1 Definitions of Culture
Scholars Definitions Interpretation
Schein (1990) ‘Culture can now be defined as (a) a pattern of basic assumptions, (b)
intended, discovered, or developed by a given group, (c) as it learns to cope
with its problems of external adaptation and internal integration, (d) that has
worked well enough to be considered valid and, therefore (e) is to be taught
to new members as the (f) correct way to perceive, think, and feel in
relation to those problems.’ (p. 111)
Aa pattern of basic assumptions
Schein (2004) ‘The culture of a group can now be defined as a pattern of shared basic
assumptions that was learned by a group as it solved its problems of
external adaptation and internal integration, that has worked well enough to
be considered valid and, therefore, to be taught to new members as the
correct way to perceive, think, and feel in relation to those problems.’
(p.17)
A pattern of shared basic
assumptions
Hofstede (1984) ‘…culture as ‘the collective programming of the mind which distinguishes
the members of one human group from another.’ (p. 21)
The programme of mind
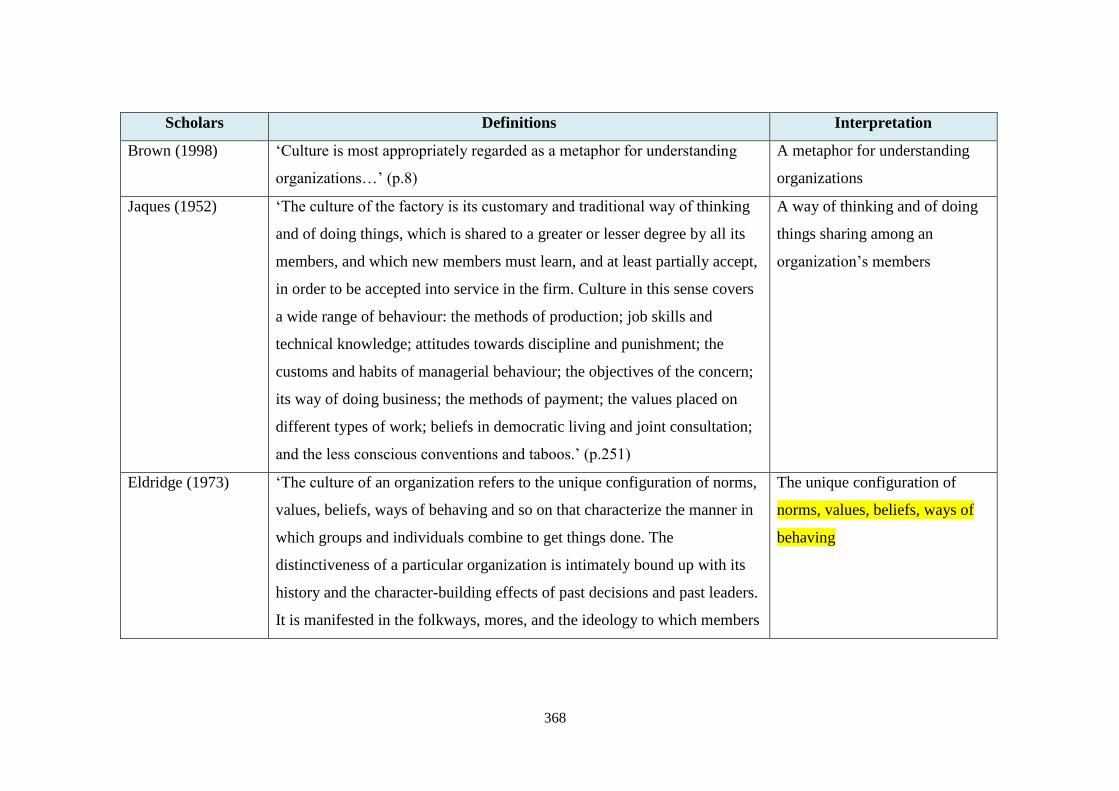
368
Scholars Definitions Interpretation
Brown (1998) ‘Culture is most appropriately regarded as a metaphor for understanding
organizations…’ (p.8)
A metaphor for understanding
organizations
Jaques (1952) ‘The culture of the factory is its customary and traditional way of thinking
and of doing things, which is shared to a greater or lesser degree by all its
members, and which new members must learn, and at least partially accept,
in order to be accepted into service in the firm. Culture in this sense covers
a wide range of behaviour: the methods of production; job skills and
technical knowledge; attitudes towards discipline and punishment; the
customs and habits of managerial behaviour; the objectives of the concern;
its way of doing business; the methods of payment; the values placed on
different types of work; beliefs in democratic living and joint consultation;
and the less conscious conventions and taboos.’ (p.251)
A way of thinking and of doing
things sharing among an
organization’s members
Eldridge (1973) ‘The culture of an organization refers to the unique configuration of norms,
values, beliefs, ways of behaving and so on that characterize the manner in
which groups and individuals combine to get things done. The
distinctiveness of a particular organization is intimately bound up with its
history and the character-building effects of past decisions and past leaders.
It is manifested in the folkways, mores, and the ideology to which members
The unique configuration of
norms, values, beliefs, ways of
behaving

369
Scholars Definitions Interpretation
defer, as well as in the strategic choices made by the organizations as a
whole.’ (p.89)
Schwartz and Davis
(1981)
‘Culture….is a pattern of beliefs and expectations shared by the
organizations’ members. These beliefs and expectations produce norms that
powerfully shape the behavior of individuals and groups in the
organization.’ (p.33)
A pattern of beliefs and
expectations shared by the
organizations’ members
Lorsch (1986) ‘By culture I mean the shared beliefs top managers in a company have
about how they should manage themselves and other employees, and how
they should conduct their business(es). These beliefs are often invisible to
the top managers but have a major impact on their thoughts and actions.’
(p.95)
The shared beliefs top managers
in a company
Pheysey (1993) ‘A culture is thus a way of seeing that is common to many people (Usually
there are sub-cultures, or ways of seeing by minorities also.) Culture itself
is subject to transformation. Managers may deliberately seek to change it.’
(p. 3)
A way of seeing that is common
to many people
Pheysey (1993) An organizational culture includes commonly held values, but also
common beliefs and attitudes. It prescribes ‘the way we do things here’.
However, it is possible to change the prescription... methods of cultural
transformation are described as well as types of culture. (p. xiii)
Common values, beliefs and
attitudes

370
Scholars Definitions Interpretation
Christensen et al.
(2007)
‘Culture is something an institution is.’ (p.43) Something an institution is
Dick and Ellis
(2006)
‘Culture is therefore concerned with the symbolic aspects of life—that is, it
is concerned with understanding how certain events and visible signs are
invested with meaning… Culture is a collective phenomenon, because it is
shared by people who live in the same social environment.’ (p.185).
The symbolic aspects of life and
a collective phenomenon
Ellis and Dick
(2003)
‘Culture takes as its focus those shared aspects of behaviour and thinking
that bind the members of an organization together.’ (p.175)
Aspects of behaviour and
thinking binding an
organization’s members together
McEwan (2001) ‘Culture is defined as an integrated system of learned behaviour patterns,
characteristic of the members of any given society.’ (p.324)
An integrated system of learned
behaviour patterns and
characteristic of the members of
any given society
Morgan (1943) Shared values, shared beliefs, shared meaning, shared understanding, and
shared sense making are all different ways of describing culture. (p.138)
Sharing beliefs, meaning,
understanding, and sense making
Deal and Kennedy
(1982)
‘Culture, as Weber’s New Collegiate Dictionary defines it, is the integrated
pattern of human behaviour that includes thought, speech, action, and
artefacts and depends on man’s capacity for learning and transmitting
knowledge to succeeding generations.’ (p.4)
The integrated pattern of human
behaviour through speech,
action, and artefacts
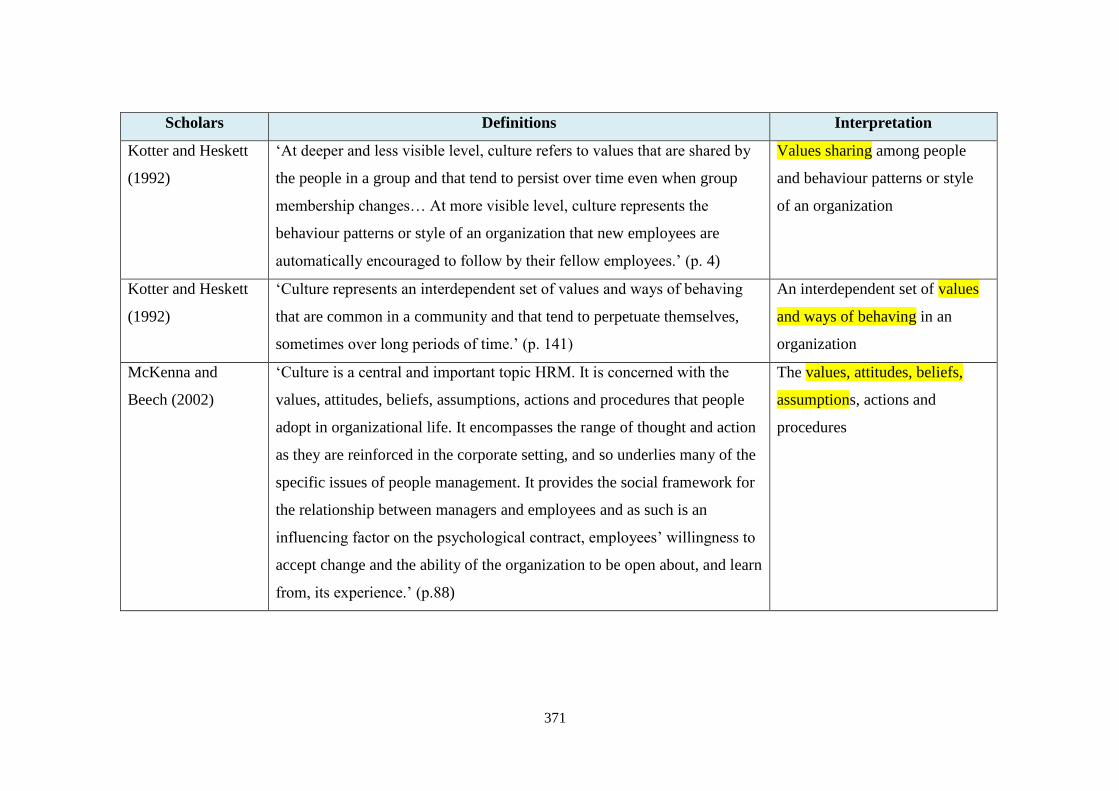
371
Scholars Definitions Interpretation
Kotter and Heskett
(1992)
‘At deeper and less visible level, culture refers to values that are shared by
the people in a group and that tend to persist over time even when group
membership changes… At more visible level, culture represents the
behaviour patterns or style of an organization that new employees are
automatically encouraged to follow by their fellow employees.’ (p. 4)
Values sharing among people
and behaviour patterns or style
of an organization
Kotter and Heskett
(1992)
‘Culture represents an interdependent set of values and ways of behaving
that are common in a community and that tend to perpetuate themselves,
sometimes over long periods of time.’ (p. 141)
An interdependent set of values
and ways of behaving in an
organization
McKenna and
Beech (2002)
‘Culture is a central and important topic HRM. It is concerned with the
values, attitudes, beliefs, assumptions, actions and procedures that people
adopt in organizational life. It encompasses the range of thought and action
as they are reinforced in the corporate setting, and so underlies many of the
specific issues of people management. It provides the social framework for
the relationship between managers and employees and as such is an
influencing factor on the psychological contract, employees’ willingness to
accept change and the ability of the organization to be open about, and learn
from, its experience.’ (p.88)
The values, attitudes, beliefs,
assumptions, actions and
procedures
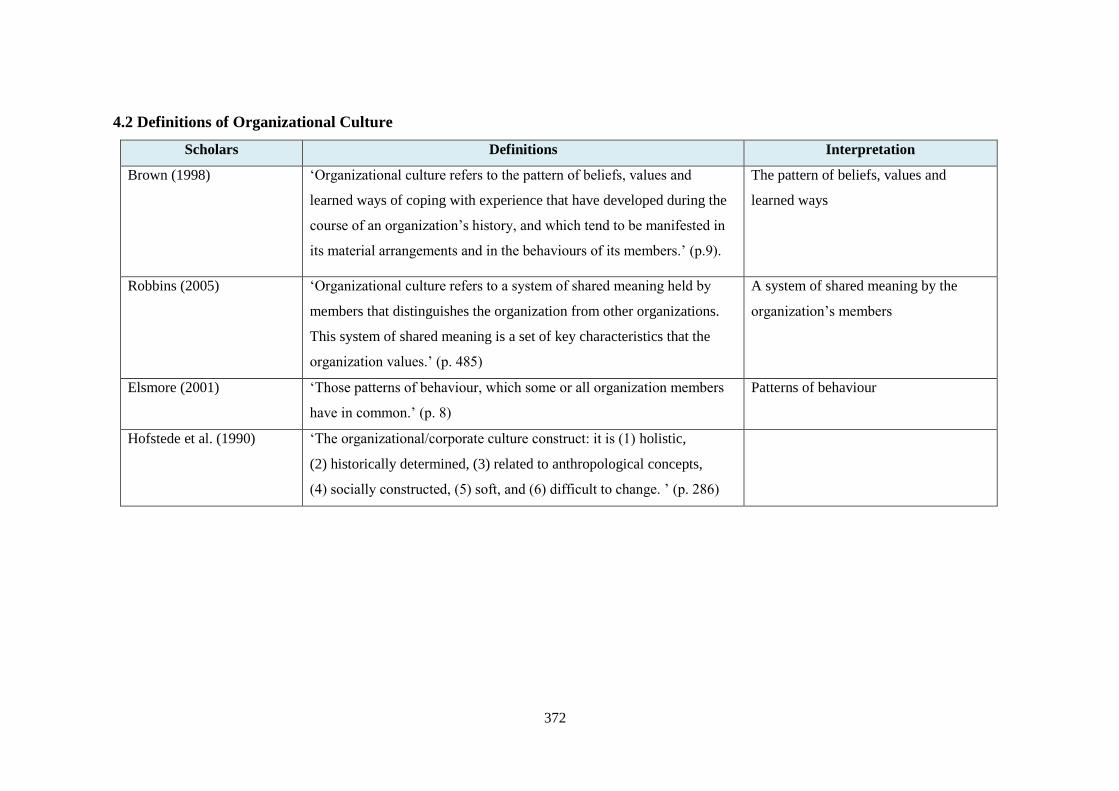
372
4.2 Definitions of Organizational Culture
Scholars Definitions Interpretation
Brown (1998) ‘Organizational culture refers to the pattern of beliefs, values and
learned ways of coping with experience that have developed during the
course of an organization’s history, and which tend to be manifested in
its material arrangements and in the behaviours of its members.’ (p.9).
The pattern of beliefs, values and
learned ways
Robbins (2005) ‘Organizational culture refers to a system of shared meaning held by
members that distinguishes the organization from other organizations.
This system of shared meaning is a set of key characteristics that the
organization values.’ (p. 485)
A system of shared meaning by the
organization’s members
Elsmore (2001) ‘Those patterns of behaviour, which some or all organization members
have in common.’ (p. 8)
Patterns of behaviour
Hofstede et al. (1990) ‘The organizational/corporate culture construct: it is (1) holistic,
(2) historically determined, (3) related to anthropological concepts,
(4) socially constructed, (5) soft, and (6) difficult to change. ’ (p. 286)


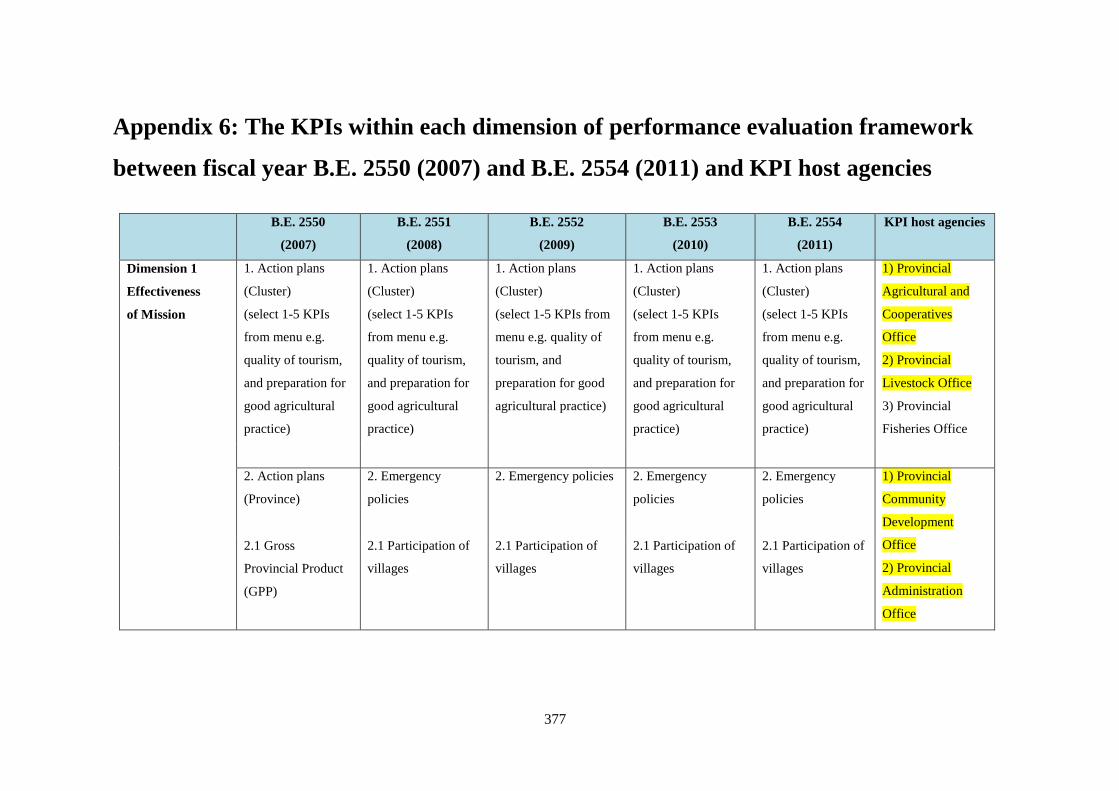
377
Appendix 6: The KPIs within each dimension of performance evaluation framework
between fiscal year B.E. 2550 (2007) and B.E. 2554 (2011) and KPI host agencies
B.E. 2550
(2007)
B.E. 2551
(2008)
B.E. 2552
(2009)
B.E. 2553
(2010)
B.E. 2554
(2011)
KPI host agencies
Dimension 1
Effectiveness
of Mission
1. Action plans
(Cluster)
(select 1-5 KPIs
from menu e.g.
quality of tourism,
and preparation for
good agricultural
practice)
1. Action plans
(Cluster)
(select 1-5 KPIs
from menu e.g.
quality of tourism,
and preparation for
good agricultural
practice)
1. Action plans
(Cluster)
(select 1-5 KPIs from
menu e.g. quality of
tourism, and
preparation for good
agricultural practice)
1. Action plans
(Cluster)
(select 1-5 KPIs
from menu e.g.
quality of tourism,
and preparation for
good agricultural
practice)
1. Action plans
(Cluster)
(select 1-5 KPIs
from menu e.g.
quality of tourism,
and preparation for
good agricultural
practice)
1) Provincial
Agricultural and
Cooperatives
Office
2) Provincial
Livestock Office
3) Provincial
Fisheries Office
2. Action plans
(Province)
2. Emergency
policies
2. Emergency policies 2. Emergency
policies
2. Emergency
policies
1) Provincial
Community
Development
Office
2) Provincial
Administration
Office
2.1 Gross
Provincial Product
(GPP)
2.1 Participation of
villages
2.1 Participation of
villages
2.1 Participation of
villages
2.1 Participation of
villages

378
B.E. 2550
(2007)
B.E. 2551
(2008)
B.E. 2552
(2009)
B.E. 2553
(2010)
B.E. 2554
(2011)
KPI host agencies
2.2 Alleviation of
poverty
2.2 Community
empowerment
2.2 Monitor
emergency policies
2.2 Monitor
emergency policies
2.2 Monitor
emergency policies
2.3 Project on
provincial strategies
2.3 Management of
wellbeing
2.4 Quality of
wellbeing plan
2.5 Expenditure of
wellbeing project
2.6 Alleviation of
poverty
3. Management of
natural resources
and environment
3. Management of
natural resources and
environment
3. Management of
natural resources and
environment
3. Management of
natural resources and
environment
3. Management of
natural resources
and environment
1) Provincial
Natural Resources
and Environment
Office
3.1 Problem of drug 3.1 Problem of drug 3.1 Alleviation of
poverty
3.1 Alleviation of
poverty
3.1Alleviation of
poverty
2) Provincial
Office of Disaster
Prevention and
Mitigation
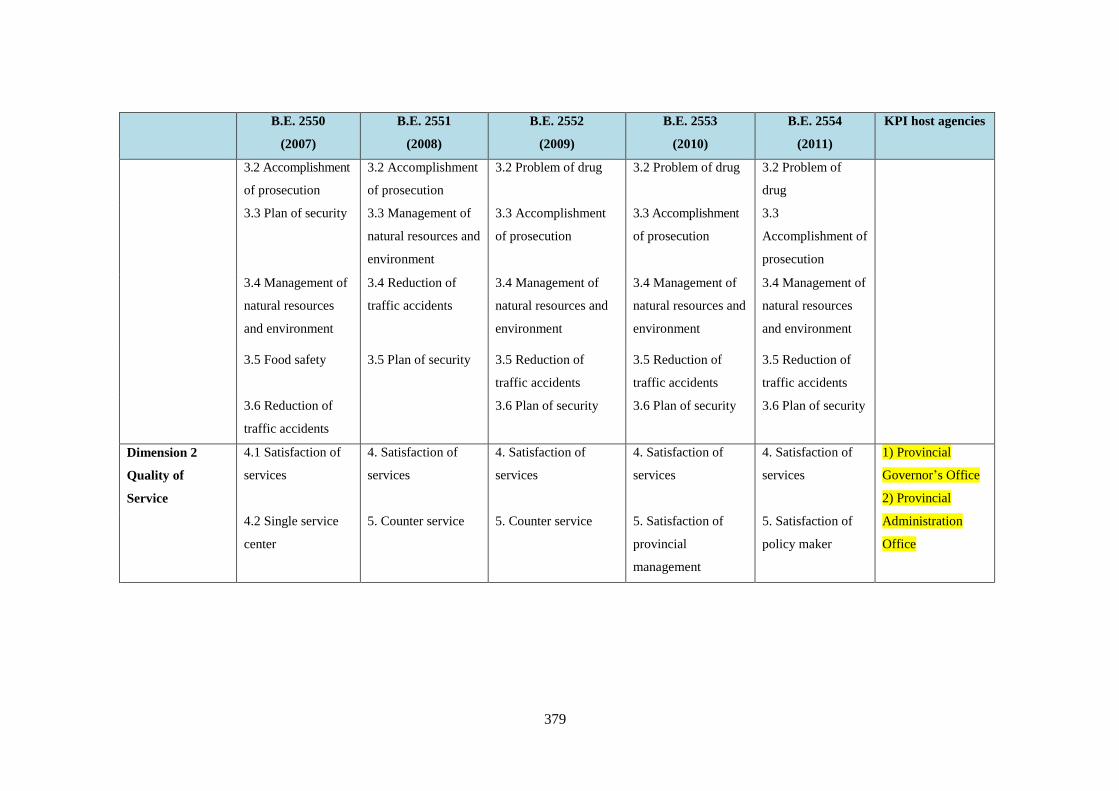
379
B.E. 2550
(2007)
B.E. 2551
(2008)
B.E. 2552
(2009)
B.E. 2553
(2010)
B.E. 2554
(2011)
KPI host agencies
3.2 Accomplishment
of prosecution
3.2 Accomplishment
of prosecution
3.2 Problem of drug 3.2 Problem of drug 3.2 Problem of
drug
3.3 Plan of security 3.3 Management of
natural resources and
environment
3.3 Accomplishment
of prosecution
3.3 Accomplishment
of prosecution
3.3
Accomplishment of
prosecution
3.4 Management of
natural resources
and environment
3.4 Reduction of
traffic accidents
3.4 Management of
natural resources and
environment
3.4 Management of
natural resources and
environment
3.4 Management of
natural resources
and environment
3.5 Food safety 3.5 Plan of security 3.5 Reduction of
traffic accidents
3.5 Reduction of
traffic accidents
3.5 Reduction of
traffic accidents
3.6 Reduction of
traffic accidents
3.6 Plan of security 3.6 Plan of security 3.6 Plan of security
Dimension 2
Quality of
Service
4.1 Satisfaction of
services
4. Satisfaction of
services
4. Satisfaction of
services
4. Satisfaction of
services
4. Satisfaction of
services
1) Provincial
Governor’s Office
2) Provincial
Administration
Office
4.2 Single service
center
5. Counter service 5. Counter service 5. Satisfaction of
provincial
management
5. Satisfaction of
policy maker

380
B.E. 2550
(2007)
B.E. 2551
(2008)
B.E. 2552
(2009)
B.E. 2553
(2010)
B.E. 2554
(2011)
KPI host agencies
5. Participation for
opinion
6. Participation for
opinion
6. Participation 6. Counter service 6. Counter service
6.1 Information
services
7. Information
services
7. Prevention of
corruption
7. Satisfaction of
policy maker
7. Prevention of
corruption
6.2 Prevention of
corruption
8. Prevention of
corruption
8. Information services 8. Prevention of
corruption
9. Citizens'
complaint
Dimension 3
Efficiency
of Performance
7. Expenditure of
budget
9. Energy save 9. Internal audit 10. Reduction of
process time
of services
8. Reduction of
process time
of services
1) Provincial
Public Health
Office
2) Provincial
Employment
Service Office
8. Energy save 10. Reduction of
process time
of services
10. Energy save 11. Expenditure of
budget
9. Expenditure of
budget
3) Provincial Land
Office
4) Provincial
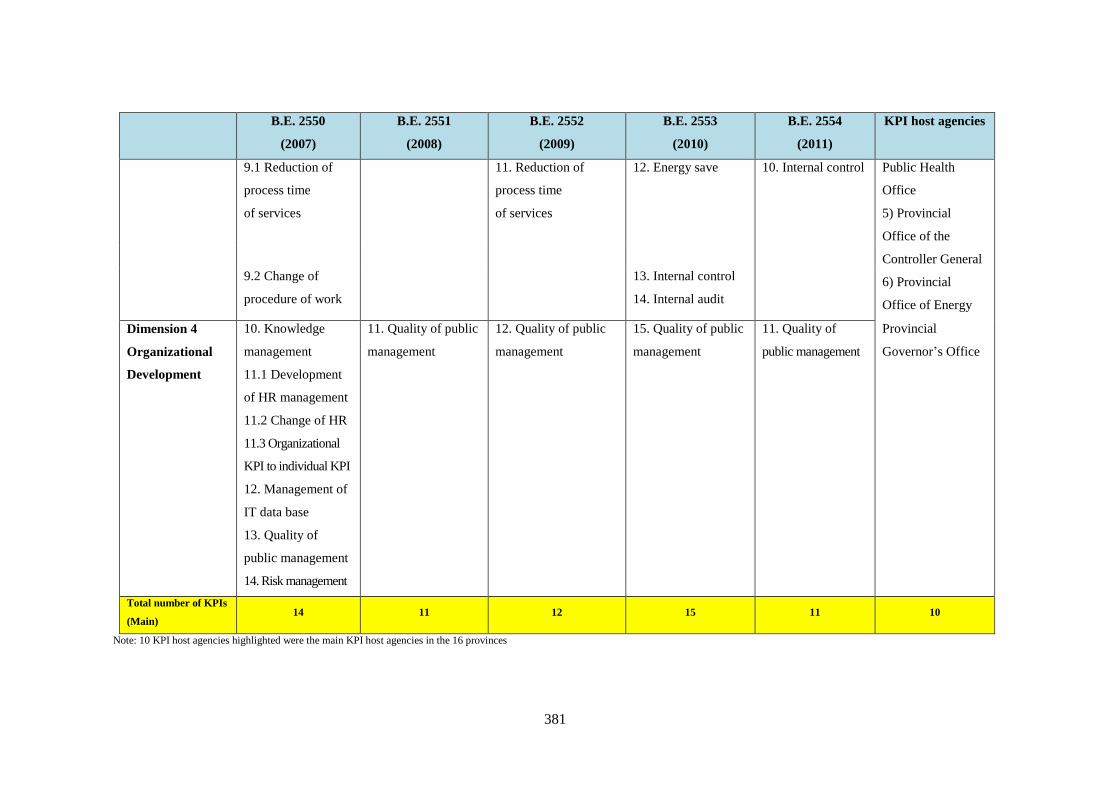
381
B.E. 2550
(2007)
B.E. 2551
(2008)
B.E. 2552
(2009)
B.E. 2553
(2010)
B.E. 2554
(2011)
KPI host agencies
9.1 Reduction of
process time
of services
11. Reduction of
process time
of services
12. Energy save 10. Internal control Public Health
Office
5) Provincial
Office of the
Controller General
6) Provincial
Office of Energy
9.2 Change of
procedure of work
13. Internal control
14. Internal audit
Dimension 4
Organizational
Development
10. Knowledge
management
11.1 Development
of HR management
11.2 Change of HR
11.3 Organizational
KPI to individual KPI
12. Management of
IT data base
13. Quality of
public management
14. Risk management
11. Quality of public
management
12. Quality of public
management
15. Quality of public
management
11. Quality of
public management
Provincial
Governor’s Office
Total number of KPIs
(Main) 14 11 12 15 11 10
Note: 10 KPI host agencies highlighted were the main KPI host agencies in the 16 provinces


417
REFERENCES
Adenan, H., Hashim, D.M., Jamaludin, A. and Sa'ari, H. (2013) ‘Entrepreneur's
knowledge sharing behavior: Case study at private university colleges in
Malaysia’ Proceedings of the International Conference on Innovation and
Entrepreneurship. Jordan, 4-5 March. Available at: http://connection.
ebscohost.com (Accessed: 8 May 2016).
Agere, S. (2000) Promoting good governance : principles, practices and perspectives.
London: Commonwealth Secretariat.
Al-Kuwari, H.M.S. (2002) Hospital organizational structures, culture, change and
effectiveness: The case of Hamad Medical Corporation in Qatar. PhD Thesis.
Brunel University.
Alford, J. (2001) ‘The imlications of publicness for strategic management theory’, in
Johnson, G. and Scholes, K. (eds) Exploring public sector strategy. Harlow:
Financial Times Prentice Hall, pp. 1-16.
Alvesson, M. and Sveningsson, S. (2008) Changing organizational culture: Cultural
change work in progress. London: Routledge.
Alvesson, M. and Sveningsson, S. (2016) Changing organizational culture: Cultural
change work in progress. 2nd edn. London: Routledge.
Andrews, M. (2013) The limits of institutional reform in development: Changing rules
for realistic solutions. New York: Cambridge University Press.
Arkadie, B.V. (2012) ‘Good governance and donors’, in Sundaram, J.K. and
Chowdhury, A. (ed.) Is good governance good for development. London:
Bloomsbury Academic.
Armstrong, M. (1990) A handbook of human resource management. London: Kogan
Page.
Armstrong, M. and Baron, A. (1998) Performance management: The new realities.
London: Institute of Personnel and Development.
Armstrong, M. and Baron, A. (2005) Managing performance: Performance
management in action. London: Institute of Personnel and Development.
Ashraf, A.A., Farooq, U. and Din, S.M.U. (2014) An investigation to the leadership
culture fit and its impact on job satisfaction and work commitment, World
Applied Science, 31 (4), pp. 427-438.
Babbie, E. (1990) Survey research methods. 2nd edn. California: Wadsworth.
Baker, C. and Phongpaichit, P. (2014) A history of Thailand. 3rd edn. Port Melbourne:
Cambridge University Press.
Barbarie, A. (1998) ‘Indonesia’s national evaluation system’, in Mackay, K. (ed.)
Public sector performance – the critical role of evaluation: Selected proceedings
from a World Bank Seminar. Washington D.C.: World Bank, pp. 72-84.
Bazeley, P. and Richards, L. (2000) The NVivo qualitative project book. London: Sage.

418
Behn, R.D. (1991) Leadership counts: Lessons for public managers from the
Massachusetts welfare, training, and employment program. Massachusetts:
Harvard University Press.
Benedict, R. (1943) Thai culture and behavior: An unpublished war time study, The
Far Eastern Quarterly, 12 (2), pp. 240-241.
Berg-Schlosser, D. (2001) ‘Comparative studies: Method and design’, in Smelser, N.J.
and Baltes, P.B. (ed.) International Encyclopedia of the Social and Behavioral
Sciences. Oxford: Pergamon, pp. 2427-2433.
Blaikie, N. (2000) Desining social research: The logic of anticipation. Cambridge: Polity
Press.
Blaikie, N. (2010) Design social research: The logic of anticipation. 2nd edn.
Cambridge: Polity Press.
Blake, R.R. and Mouton, J.S. (1981) Management by Grid principles or
situationalism: Which?, Group and Organization Studies, 6 (4), pp. 439-455.
Bowornwathana, B. (2000) Governance reform in Thailand: Questionable
assumptions, uncertain outcomes, Governacne: An International of Policy and
Administration, 13 (3), pp. 393-408.
Boyatzis, R.E. (1998) Transforming qualitative information: Thematic analysis and
code development. London: Sage.
Boyd, E.M. and Fales, A.W. (1983) Reflective learning: Key to learning from
experience, Journal of Humanistic Psychology, 23 (2), pp. 99-117.
Boyne, G.A., Meier, K.J., O’Toole Jr., L.J. and Walker, R.M. (ed.) (2006) Public
service performance: Perspectives on measurement and management.
Cambridge: Cambridge University Press.
Brannen, J. (1992) Mixing methods: Qualitative and quantitative research. Hants:
Ashgate.
Bratton, J., Callinan, M., Forshaw, C. and Sawchuk, P. (2007) Work and
organizational behaviour. Basingstoke Palgrave: Macmillan.
Brewerton, P. and Millward, L. (2001) Organizational research methods: A guide for
students and researchers. London: Sage.
Brignall, S. (1993) ‘Performance measurement and change in local government: A
general case and a childcare application’, in Jackson, P.M. (ed.) Measures for
success in the public sector: A public finance foundation reader. London:
CIPFA, pp. 41-50.
Brown, A. (1998) Organizational culture. Harlow: Pearson Education.
Bruijn, H.d. (2007) Managing performance in the public sector. 2nd edn. New York:
Routledge.
Brushett, S. (1998) ‘Evaluation capacity development in Zimbabwe’, in Mackay, K.
(ed.) Public sector performance – the critical role of evaluation: Selected
proceedings from a World Bank Seminar. Washington D.C.: World Bank, pp. 85-93.
Bryman, A. (1988) Quantity and quality in social research. London: Routledge.
419
Bryman, A. (1989) Research methods and organization studies. New York:
Routledge.
Bryman, A. (2001) Social research methods. Oxford: Oxford University Press.
Bryman, A. (2012) Social research methods. 4th edn. New York: Oxford University Press.
Bullard, N., Bello, W. and Mallhotra, K. (1998) Taming the tigers: The IMF and the
Asian crisis, Third World Quarterly, 19 (3), pp. 505-555.
Burns, R.B. (2000) Introduction to research methods. 4th edn. London: Sage.
Cameron, K.S. and Quinn, R.E. (2011) Diagnosing and changing organizational
culture based on the Competing Values Framework. 3rd edn. San Francisco:
Jossey-Bass.
Chakrabarty, B. and Chand, P. (2012) Public Administration in a Globalizing World:
Theories and Practices. New Delhi: Sage.
Charnnarong, N. (2013) Culture and religion. Bangkok: Ramkhamhaeng University.
Charoenserbsakul, P. and Sombatpeam, P. (2014) Thai public sector reform B.E. 2558
(การปฏรประบบราชการไทย พ.ศ. 2558 จะไปถงไหน...จะไดอะไรและพวกเราจะมสวนรวมไดอยางไร), Official
Journal 59 (October-December B.E. 2557) (วารสารขาราชการ ส านกงานคณะกรรมการขาราชการ
พลเรอน), 1, pp. 13-17.
Charoensuk, A. (2014) Service level agreement (SLA). Bangkok: Office of the Public
Sector Development Commission.
Cheema, G.S. and Popovski, V. (2010) Building trust in government: Innovations in
governance reform in Asia. New York: United Nations University Press.
Chevrier, S. (2003) Cross-cultural management in multinational project groups,
Journal of World Business, 38, pp. 141-149.
Christiensen, T., Lægreid, P., Roness, P.G. and Røvik, K.A. (2007) Organization
theory and the public sector: Instrument, culture and myth. London: Routledge.
Chula Unisearch, C.U. (2005) Project of assessment of efficiency and achievement in
strategic development plans of integrated provinces (โครงการการประเมนประสทธภาพ
และผลสมฤทธของแผนยทธศาสตรการพฒนาจงหวดแบบบรณาการ). Bangkok: Damrong Rajanubhap,
Office of the Permanent Secretary for Interior Ministry of Interior.
Claver, E., Llopis, J., Gascó, J.L., Molina, H. and Conca, F.J. (1999) Public
administration: From a bureaucratic culture to a citizen-oriented culture,
International Journal of Public Sector Management, 12 (5), pp. 455-464.
Commonwealth Secretariat (2010) Commonwealth good governance 2010/11.
Cambridge: Nexus Strategic Partnerships.
Consulate-General, R.T. (2016) Thailand in brief. Available at: http://www.thaiembassy.
org/chennai/en/services/4192 (Accessed: 25 March 2016).
Cooke, F.L. (2003) Managing employee performance: Design and implementation in
organisations, Human Resource Management Journal, 13 (1), pp. 90-91.
Cooke, R.A. and Rousseau, D.M. (1988) Behavioral norms and expectations: A
quantitative approach to the assessment of organizational culture, Group and
Organization Studies, 13 (3), pp. 245-273.

420
Corbetta, P. (2003) Social research: Theory, methods and techniques. London: Sage.
CountryWatch. (2016) Thailand: Country briefing. Available at:
http://countrybriefing. countrywatch.com/home/countryreview?CountryID=170
(Accessed: 25 March 2016).
Cranny, C.J., Smith, P.C. and Stone, E.F. (1992) Job satisfaction: How people feel
about their jobs and how it affects their performance. New York: New
Lexington Press.
Creswell, J.W. (2014) Research design: Qualitative, quantitative, and mixed methods
approaches. 4th edn. Los Angeles: Sage.
Creswell, J.W. and Clark, V.L.P. (2007) Designing and conducting mixed methods
research. Thousand Oaks: Sage.
Culture, M.o. (2013) The do’s and don’ts according to Thai culture. Available at:
http://www.m-culture.go.th (Accessed: 9 October 2013).
Darlington, Y. and Scott, D. (2002) Qualitative research in practice: Stories from the
field. Buckingham: Open University Press.
Davis, S.M. (1984) Managing corporate culture. Massachusetts: Ballinger.
Deal, T.E. and Kennedy, A.A. (1982) Corporate cultures: The rites and rituals of
corporate life. London Addison-Wesley
Deal, T.E. and Kennedy, A.A. (1988) Corporate cultures: The rites and rituals of
corporate life. Harmondsworth: Penguin.
Denison, D.R. and Mishra, A.K. (1995) Toward a theory of organizational culture and
effectiveness, Organization Science, 6 (2), pp. 204-223.
Denscombe, M. (2010a) The good research guide for small-scale social research
projects. 4th edn. Berkshire: Open University Press.
Denscombe, M. (2010b) Ground rules for social research: Guidelines for good
practice. Berkshire: Open University Press.
Department of Provincial Administration (2015) Official statistics registration systems.
Available at: http://stat.bora.dopa.go.th/stat/ (Accessed: 23 March 2016).
De Vaus, D. (2001) Research design in social research. London: Sage.
De Vaus, D. (2002) Surveys in social research. 5th edn. London: Routledge.
Dey, I. (1993) Qualitative data analysis: A user-friendly guide for social scientists.
London: Routledge.
Dick, P. and Ellis, S. (2006) Introduction to organizational behaviour. 3rd edn. London
McGraw-Hill Education.
Dixon, B.R., Bouma, G.D. and Atkinson, G.B.J. (1987) A handbook of social science
research: A comprehensive and practical guide for students. Oxford: Oxford
University Press.
Dooren, W.V., Bouckaert, G. and Halligan, J. (2015) Performance management in the
public sector. 2nd edn. London: Routledge.
Drüke, H. (2007) ‘Can E-governance make public governance more accountable?’, in
Shah, A. (ed.) Public sector governance and accountability series: Performance
accountability and combating corruption. Washington D.C.: World Bank, pp. 59-88.
421
Eakin, H., Eriksen, S. and Eikeland, Per-Ove. (2011) Public sector reform and
governance for adaptation: Implications of new public management for adaptive
capacity in Mexico and Norway, Environmental Management, 47, pp. 338-351.
Edwards, C. (1999) ‘Public service culture’, in Rose, A. and Lawton, A. (ed.) Public
services management. Harlow: Financial Times/Prentice Hall, pp. 278-294.
Ehtesham, U.M., Muhammad, T.M. and Muhammad, S.A. (2011) Relatrionship
between organizational culture and performance management practices: A case
of University in Pakistan, Journal of Competitiveness, 3 (4), pp. 78-86.
Eisend, M., Evanschitzky, H. and Gilliland, D.I. (2016) The influence of
organizational and national culture on new product performance, Journal of
Innovation Management, 33 (3), pp. 260-276.
Eldridge, J.E.T. (1973) Sociology and industrial life, London: Nelson.
Embree, J.F. (1950) Thailand - a loosely structured social system, American
Anthropology, 52 (2), pp. 181-193.
Evans, G. (1998) ‘Political cults in East and Southeast Asia’, in Trankell, I.-B. and
Summers, L. (ed.) Facet of power and its limitations: Political culture in
Southeast Asia. Uppsala: Uppsala University.
Fernandez, S. and Rainey, H.G. (2006) Managing successful organizational change in
the public sector, Public Organization Review, 66 (2), pp. 168-176.
Fields, D.L. (2002) Taking the measure of work: A guide to validated scales for
organizational research and diagnosis. Thousand Oaks: Sage.
Fletcher, C. (1993) Appraisal: Routes to improved performance. London: Institute of
Personnel Management.
Francesco, A.M. and Gold, B.A. (1998) International organizational behaviour: Text,
case, readings and skills. New Jersey: Prentice Hall.
Fukuyama, F. (2013) What is governance, Governance: An International Journal of
Policy, Administration, and Institutions, 26 (3), pp. 347-368.
Gerhart, B. and Trevor, C.O. (2008) ‘Merit pay’, in Varma, A.;Budhwar, P.S. and
DeNisi, A. (ed.) Performance management systems: A global perspective.
London: Routledge.
Gill, J. and Johnson, P. (2002) Research methods for managers. London: Sage.
Gill, R. (2006) Theory and practice of leadership. London: Sage.
Glaser, M.A. (2007) ‘Networks and collaborative solutions to performance
measurement and improvement in Sub-Saharan Africa’, in Shah, A. (ed.) Public
sector governance and accountability series: Performance accountability and
combating corruption. Washington, D.C.: World Bank, pp. 89-134.
Goddard, M., Mannion, R. and Smith, P.C. (1999) Assessing the performance of NHS
hospital trusts: The role of ‘hard’ and ‘soft’ information, Health Policy, 48. pp.119-134.
Gorard, S. (2013) Research design: Creating robust approaches for the social
sciences. London: Sage.
422
Government, R.T. (2014) National broadcast by general Prayut Chan-O-Cha, Head of
the National Council for Peace and Order, on 30 May 2014 Available at:
http://www.thaigov.go.th/en/speech-2/item/83656-national-broadcast-by-
general-prayut-chan-o-cha-head-of-the-national-council-for-peace-and-
order.html (Accessed: 26 March 2016).
Grabowski, L., Neher, C., Crim, T. and Mathiassen, L. (2015) Competing Values
Framework application to organizational effectiveness in voluntary organizations:
A case study, Nonprofit and Voluntary Sector Quarterly, 44 (5), pp. 908-923.
Gray, D.E. (2004) Doing research in the real world. London: Sage.
Green, C. and Heywood, J.S. (2008) Does performance pay increase job satisfaction?,
Economica, 75, pp. 710-728.
Greenberg, J. and Baron, R.A. (2003) Behavior in organizations: Understanding and
managing the human side of work. 8th edn. New Jersey: Pearson Education.
Greiling, D. (2005) Performance measurement in the public sector: The German
experience, Performance Measurement and Performance Management, 54 (7),
pp. 551-567.
Grindle, M.S. (1997) Divergent culture? When public organizations perform well in
developing countries, World Development, 25 (4), pp. 481-495.
Grindle, M.S. (2004) Good enough governance: Poverty reduction and reform in
developing countries, Governance: An International Journal of Policy, 17 (4),
pp. 525-546.
Grindle, M.S. (2007) Good Enough Governance Revisited, Development Policy
Review, 25 (5), pp. 553-574.
Grindle, M.S. (2010) ‘Good governance: The inflation of an idea’, in Secondary,
Grindle, M.S. (Ed.) HKS Faculty Research Working Paper Series, RWP10-023.
Kennedy School of Government: Harvard University. Available at:
https://dash.harvard.edu/bitstream/handle/1/4448993/Grindle_GoodGovernance.
pdf?sequence=1 (Accessed: 4 February 2013).
Hakim, C. (1987) Research design: Strategies and choices in the design of social
research. London; Boston: Allen and Unwin.
Halachmi, A. (2005) Performance measurement is only one way of managing
performance, Performance Measurement and Performance Management, 54 (7),
pp. 502-516.
Hall, D. and Hall, I. (1996) Practical social research: Project work in the community.
Hampshire: Macmillan.
Handley, P. (1997) ‘More of the same?: Politics and business, 1987-96’, in Hewison,
K. (ed.) Political change in Thailand: Democracy and participation. London:
Routledge, pp. 94-113.
Handman, M. (1993) The bureaucratic culture pattern and political revolutions,
American Journal of Sociology, 39 (3), pp. 301-313.
423
Hanks, L.M. (1962) Merit and power in the Thai social order, American
Anthropologist, 64 (6), pp. 1247-1261.
Hantrais, L. (2009) International comparative research: Theory, methods and
practice. Hamshire: Palgrave Macmillan.
Harkness, J.A., Van de Vijver, F.J.R. and Mohler, P.Ph. (2003) Cross-cultural survey
methods. New Jersy: John Wiley and Sons.
Harrow, J. and Willcocks, L. (1990) Public services management: Activities,
initiatives and limits to learning, Journal of Management Studies, 27 (3),
pp. 281-304.
Hatry, H.P. (2007) ‘Emerging developments in performance measurement’, in Julnes,
P.d.L.;Berry, F.S.;Aristigueta, M.P. and Yang, K. (eds) International handbook
of practice-based performance management. London: Sage, pp. 3-23.
Helmke, G. and Levitsky, S. (2004) Informal institutions and comparative politics:
A research agenda, American Political Science Association, 2 (4), pp. 725-740.
Heritage, B., Pollock, C. and Roberts, L. (2014) Validation of the Organizational
Culture Assessment Instrument, Public Library of Science (PLOS ONE), 9 (3),
pp. 1-10.
Hesse-Biber, S.N. (2010) Mixed methods research: Merging theory with practice.
New York: The Guilford Press.
Hewison, K. (1997a) ‘Introduction: Power, oppositions and democratisation’, in Hewison,
K. (ed.) Political change in Thailand : Democracy and participation. London: Routledge.
Hewison, K. (1997b) ‘The monarchy and democratisation’, in Hewison, K. (ed.)
Political change in Thailand : Democracy and participation. London: Routledge.
Hofstede, G. (1981) Culture and organizations, International Studies of Management
and Organization, 10 (4), pp. 15-41.
Hofstede, G. (1984) National Culture Revisited, Asia Pacific Journal of Management,
2 (1), pp. 22-28.
Hofstede, G. (1990) Measuring Organizational Cultures: A Qualitative and
Quantitative Study Across Twenty Cases, Administrative Science Quarterly, 35 (2),
pp. 286-316.
Hofstede, G. (1991) Cultures and organizations: Software of the mind. London:
McGraw-Hill.
Hofstede, G. (1999) Problems remain, but theories will change: The universal and the
specific in 21st-century global management, Organizational Dynamics, 28 (1),
pp. 34-44.
Hofstede, G. (2001) Culture’s consequences: Comparing values, behaviors,
institutions, and organizations across nations. Thousand Oaks: Sage.
Hofstede, G., Hofstede, G.J. and Minkov, M. (2010) Cultures and organizations:
Software of the mind: Intercultural cooperation and its importance for survival.
London: McGraw-Hill.
424
Hofstede, G., Neuijen, B., Ohayv, D.D. and Sanders, G. (1990) Measuring
organizational cultures: A qualitative and quantitative study across twenty cases,
Administrative Science Quarterly, 35 (2), pp. 286-316.
Hood, C. (2007) Public service management by numbers: Why does it vary? Where
has it come from? What are the gaps and the puzzles?, Public Policy and
Management, 27 (2), pp. 95-102.
Houldsworth, E. and Jirasinghe, D. (2006) Managing and measuring employee
performance. London: Kogan Page.
Howard, L.W. (1998) Validating the competing values model as a representation of
organizational cultures, The international Journal of organizational analysis,
6 (3), pp. 231-250.
Huang, X., Iun, J., Liu, A. and Gong, Y. (2010) Does participative leadership enhance
work performance by inducing empowerment or trust? The differential effects on
managerial and non-managerial subordinates, Journal of Organizational
behavior, 31, pp. 122-143.
Hughes, O.E. (1998) Public management and administration: An introduction. 2nd edn.
Basingstoke: Macmillan.
Hughes, O.E. (2007) ‘Performance: A new public management perspective’, in Julnes,
P.de L.;Berry, F.S.;Aristigueta, M.P. and Yang, K. (eds) International handbook
of practice-based performance management. London: Sage, pp. 45-61.
IMF. (1997-1999) Thailand letter of intent. Available at: http://www.imf.org
(Accessed: 31 March 2016).
Improvement and Development Agency (2002) Making performance management
work : A practical guide. London: Improvement and Development Agency.
Ingraham, P.W., Joyce, P.G. and Donahue, A.K. (2003) Government performance:
Why management matters. Baltimore: Johns Hopkins University Press.
Institute of Personnel Management (1992) Performance management in the UK:
An analysis of the issues. London: Institute of Personnel Management.
Jackson, P.M. (1989) ‘The management of performance in the public sector’, in
Jackson, P.M. (ed.) Measures for success in the public sector: A public finance
foundation reader. London: CIPFA, pp. 27-32.
Jackson, P.M. (1995) ‘Introduction: Reflections on performance measurement in
public service organizations’, in Jackson, P.M. (ed.) Measures for success in the
public sector: A public finance foundation reader. London: CIPFA, pp. 1-18.
Jick, T.D. (1979) Mixing Qualitative and Quantitative Methods: Triangulation in
Action, Administrative Science Quarterly, 24, pp. 602-611.
Jingjit, R. (2008) Analysis of organizational culture and outcomes of public
management reform based on the competing values framework: The case of the
Thai civil service. PhD Thesis. University of Manchester.
Jingjit, R. and Fotaki, M. (2010) Confucian ethics and the limited impact of the new
public management reform in Thailand, Journal of Business Ethics, 97, pp. 61-73.
425
Johansson, R. (2003) ‘Case study methodology’ The international Conference
Methodologies in Housing Research. Stockholm, 22-24 September. Available at:
http://www.psyking.net/HTMLobj-3839/Case_Study_Methodology-
Rolf_Johansson_ver_2.pdf (Accessed: 22 July 2016).
Johnson, R.B., Onwuegbuzie, A.J. and Turner, L.A. (2007) Toward a definition of
mixed methods research, Journal of Mixed Methods Research, 1 (2), pp. 112-133.
Jong, J. (2016) The role of performance feedback and job autonomy in mitigating the
negative effect of role ambiguity on employee satisfaction, Public Performance
and Management Review, pp. 1-21.
Judge, T.A., Piccolo, R.F., Podsakoff, N.P., Shaw, J.C. and Rich, B.L. (2010) The
relationship between pay and job satisfaction: A meta-analysis of the literature,
Journal of Vocational Behavior, 77, pp. 157-167.
Julnes, P. de L. (2007) ‘Can performance measurement support program performance
improvement and accountability’, in Julnes, P.de L.; Berry, F.S.; Aristigueta,
M.P. and Yang, K. (eds) International handbook of practice-based performance
management. London: Sage, pp. 65-78.
Julnes, P.de L., Berry, F.S., Aristigueta, M.P. and Yang, K. (2007) International
handbook of practice-based performance management. London: Sage.
Kaplan, E.H. (1997) Snapshot samples, Socio-Economics, 31 (4), pp. 281-291.
Kaufmann, D., Kraay, A. and Mastruzzi, M. (2008) Governance matters VII:
Aggregate and individual governance indicators. Available at:
http://documents.worldbank. org/ curated/en/598851468149673121/
pdf/WPS4978.pdf (Accessed: 8 May 2016).
Kearney, R.C. and Berman, E.M. (ed.) (1999) Public sector performance:
Management, motivation and measurement. Colorado: Westview Press.
Kemper, E.A., Stringfield, S. and Teddie, C. (2003) ‘Mixed methods sampling
strategies in social science research’, in Tashakkori, A. and Teddlie, C. (eds)
Handbook of mixed methods in social and behavioral research. Thousand Oaks: Sage
Kim, H. (2014) Transformational leadership, organizational clan culture,
organizational affective commitment, and organizational citizenship behavior:
A case of South Korea’s public sector, Public Organization Review, 14,
pp. 397-417.
Klausner, W.J. (1997) Thai culture in transition. Bangkok: The Siam Society.
Komin, S. (1990) Culture and work-related values in Thai organizations, International
Journal of Psychology, 25 (3-6), pp. 681-704.
Komin, S. (1998) ‘The world view through Thai value systems’, in Pongsapich, A.
(ed.) Traditional and Changing Thai World View. Bangkok: Chulalongkorn
University Press.
Kotler, P. and Lee, N. (2007) Marketing in the public sector: A roadmap for improved
performance. New Jersey: Wharton School Publishing.
Kotter, J.P. and Heskett, J.L. (1992) Corporate culture and performance. London: Free Press.
426
Kultalahti, S., Edinger, P. and Brandt, T. (2013) ‘Expectations for leadership -
generation Y and innovativess in the limelight’, in Secondary, Kultalahti, S.,
Edinger, P. and Brandt, T. (eds.) The proceeding of the 9th European conference
on management leadership and governance. Klagenfurt, 14-15 November.
Available at: https://books.google.co.uk (Accessed: 8 May 2016).
Kumar, R. (2011) Research methodology: A step-by-step guide for beginners. 3rd edn.
London: Sage.
Kusy, F. (1991) Thailand. London: Cadogan.
Kwan, P. and Walker, A. (2004) Validating the competing values model as a
representation of organizational culture through inter-institutional comparisons,
Organizational Analysis, 12 (1), pp. 21-37.
Lam, S.S.K. (1994) Quality management and job satisfaction: An empirical study,
International Journal of Quality and Reliability Management, 12 (4), pp. 72-78.
Leftwich, A. (1993) Governance, democracy and development in the third world.
Third World Quarterly, 14 (3), pp. 605-622.
Leroch, M.A. (2014) Culture at work: How culture affects workplace behaviors,
International Journal of Manpower, 35 (1/2), pp. 133-146.
Lorsch, J.W. (1986) Managing culture: The invisible barrier to strategic change,
California Management Review, 28 (2), pp. 95-109.
Lovas, L. (2007) Relationship of organizational culture and job satisfaction in the
public sector, Studia Psychologica, 49, pp. 215-221.
Luhman, J.T. and Cunliffe, A.L. (2013) Key concepts in organization theory.
London: Sage.
Lund, D.B. (2003) Organizational culture and job satisfaction, Journal of Business and
Industrial Marketing, 18 (3), pp. 219-236.
Maisrikrod, S. (1999) Joining the values debate: The peculiar case of Thailand,
Sojourn, 14 (2), pp. 402-413.
Mangkarothai, T. (2016) Guideline of performance agreement of clusters and
provinces, Fiscal year B.E. 2559 (2016), and opening for opinions and
suggestions (แนวทางการจดท าค ารบรองการปฏบตราชการประจ าปของจงหวด/กลมจงหวด ประจ าปงบประมาณ
พ.ศ. 2559 และรบฟงความคดเหนและขอเสนอแนะ). Bangkok: Office of the Public Sector
Development Commission.
Marcel, M. (1998) ‘Lessons from Chile’, in Mackay, K. (ed.) Public sector
performance – the critical role of evaluation: Selected proceedings from a World
Bank Seminar. Washington D.C.: World Bank, pp. 67-71.
Matthews, B. and Ross, L. (2010) Research methods: A practical guide for the social
sciences. Essex: Pearson Education.
May, T. (2010) Social research: Issues, methods and process. 4th edn. Berkshire: Open
University Press.
Mazower, M. (2013) Governing the world: The history of an idea, 1815 to the present.
London: Penguin.

427
McCargo, D. (2012) The changing politics of Thailand's Buddhist order, Critical
Asian Studies, 44 (4), pp. 627-642.
McEwan, T. (2001) Managing values and beliefs in organisations. Harlow: Financial
Times Prentice Hall.
McKenna, E. and Beech, N. (2002) Human resource management: A concise analysis.
Harlow: Financial Times Prentice Hall.
McNeil, M. and Malena, C. (2010) Demanding good governance: Lessons from social
accountability initiatives in Africa. Washington, D.C.: World Bank
McQueen, R. and Knussen, C. (2002) Research methods for social science: A practical
introduction. Harlow: Peason Education.
Mektrairat, N. (2007) Recommendation and guideline for development of provincial
administration (ขอเสนอแนวทางการพฒนาระบบบรหารราชการสวนภมภาค). Available at:
www.opdc.go.th (Accessed: 8 June 2016).
Menard, S. (2008) ‘Introduction: Longitudinal research design and analysis’, in
Menard, S. (ed.) Handbook of longitudinal research design, measurement, and
analysis. Sandiego: Elsevier.
Mertens, D.M. and Hesse-Biber, S. (2012) Triagulation and mixed methods research:
Provocative positions, Journal of Mixed Methods Research, 6 (6), pp. 75-79.
Miller, R.L., Acton, C., Fullerton, D.A. and Maltby, J. (2002) SPSS for social
scientists. Hampshire: PAlgrave Macmillan.
Mimba, N.P.S.H., Van Helden, G.J. and Tillema, S. (2007) Public sector performance
measurement in developing countries: A literature review and research agenda,
Journal of Accounting and Organizational Change, 3 (3), pp. 192-210.
Ministry of Culture (2013) The do’s and don’ts according to Thai culture. Available at:
http://www.m-culture.go.th (Accessed: 9 October 2013).
Ministry of Foreign Affairs of the Kingdom of Thailand (2013) Thailand today.
Available at: http://www.mfa.go.th/main/en/ (Accessed: 23 September 2013).
Ministry of Interior (2010) Strengthening inclusive planning and economic decision-
making for environmentally sustainable pro-poor development: Poverty
environment initiative (PEI) framework in Thailand. Bangkok: Government of
Thailand, Ministry of Interior.
Mintzberg, H. and Westley, F. (1992) Cycles of organizational change, Strategic
Mangement Journal, 13, pp. 39-59.
Moon, M.J. (2000) Organizational commitment revisited in new public management
motivation, organizational culture, sector, and managerial level, Public
Performance and Management Review, 24 (2), pp. 177-194.
Moores, R. (1994) Managing for high performance: A practical guide. London:
The Industrial Society.
Moynihan, D.P. (2008) The dynamics of performance management: Constructing
information and reform. Washington, D.C.: Georgetown University Press.

428
Moynihan, D.P. and Pandey, S.K. (2005) Testing how management matters in an era
of government by performance management, Journal of Public Administration
Research and Theory, 15 (3), pp. 421-439.
Mulder, N. (1994) Inside Thai society: An interpretation of everyday life. Bangkok:
Duangkamol Press.
Murphy, K.R. and Denisi, A. (2008) ‘A model of the appraisal process’, in Varma, A.;
Budhwar, P.S. and DeNisi, A. (eds) Performance management systems: A global
perspective. London: Routledge.
Mutebi, A.M. (2008) Explaining the failure of Thailand's anti-corruption regime,
Development and Change, 39 (1), pp. 147-171.
National Statistical Office (2010) Statistical data. Available at: http://service.nso.go.th/nso/
nso_center/project/search_center/23project-th.htm (Accessed: 2 October 2013).
Neher, C.D. (ed.) (1979) Modern Thai politics from village to nation. Cambridge:
Schenkman Pulbishing Company.
NESDB. (2006) Thailand in brief. Available at: http://www.nesdb.go.th (Accessed:
2 October 2013).
NESDB. (2013) The fifth National Economic and Social Development Plan
(1982 - 1986). Available at: http://www.nesdb.go.th/Default.aspx?tabid=87
(Accessed: 31 October 2013).
Neuman, W.L. (2013) Social research methods: Qualitative and quantitative
approaches. 7th edn. Harlow: Pearson.
Nica, E. (2013) Organizational culture in the public sector, Economic, Management,
and Financial Market, 8 (2), pp. 179-184.
Nikomborirak, D. (2007) Civil service reform and the quest for better governance: The
Thai experience, TDRI Quarterly Review, March 2007, pp. 3-7.
Niratpattanasai, K. (1999) Evolution of Thai management post-crisis. Available at:
http://www.apmforum.com/columns/thai23.htm (Accessed: 10 April 2016).
O’Reilly, C.A., Chatman, J. and Caldwell, D.F. (1991) People and organizational
culture: A profile comparison approach to assessing person-organization fit, The
Academy of Management Journal, 34 (3), pp. 487-516.
Ockey, J. (2004) State, bureaucracy and polity in modern Thai politics, Journal of
Contemporary Asia, 34 (2), pp. 143-162.
OCSC. (2016) Roles and responsibilities. Available at: http://www.ocsc.go.th
(Accessed: 1 April 2016).
OECD. (2001) Governance in the 21st century. Paris: OECD.
Office of the Council of State (1991). State of Administration Act B.E. 2534 (1991)
(พระราชบญญตระเบยบบรหารราชการแผนดน พ.ศ. 2534). Available at:
https://www.moac.go.th/ download/ledit%20001.pdf (Accessed: 7 April, 2016)
Office of the Election Commission of Thailand (2016) Official results of the
constitution referendum (ผลการลงประชามตอยางเปนทางการ). Available at:
http://www.ect.go.th/ th/?page_id=8583 (Accessed: 16 August 2016).

429
OPDC (2003a) Annual report B.E. 2546 (2003). Bangkok: Office of the Public Sector
Development Commission.
OPDC (2003b) Royal Decree On Criteria and Procedures for Good Governance, B.E.
2546 (2003). Bangkok: Office of the Public Sector Development Commission.
OPDC (2008a) Annual report B.E. 2551(2008). Bangkok: Office of the Public Sector
Development Commission.
OPDC (2008b) Public Sector Development Strategic Plan B.E. 2551- B.E. 2555.
Bangkok: Office of the Public Sector Development Commission.
OPDC (2009) Criteria, methods and forms for incentive allocation for fiscal year B.E.
2551 (2008). Bangkok: Office of the Public Sector Development Commission.
OPDC. (2012) Good governance. Bangkok: Cabinet and Royal Gazette Publishing Office.
OPDC (2013a) The central government agencies at provincial administration and the
provincial agencies categorized based on ministries and departments
(ราชการบรหารสวนกลางในภมภาคและราชการบรหารสวนภมภาค จ าแนกตามกระทรวงและกรม). Bangkok:
Office of the Public Sector Development Commission.
OPDC (2013b) Thai public sector development strategic plan B.E. 2556 - B.E. 2561
(แผนพฒนายทธศาสตรการพฒนาระบบราชการไทย พ.ศ. 2556 - พ.ศ. 2561). Bangkok: Office of the
Public Sector Development Commission.
OPDC (2014) Performance assessment manual of of provincial administration, Fiscal
year B.E. 2557 (2014) (คมอการประเมนผลการปฏบตราชการตามค ารบรองการปฏบตราชการของจงหวด
ประจ าปงบประมาณ พ.ศ. 2557). Bangkok: Office of the Public Sector Development
Commission.
OPDC (2015) Provincial performance assessment manual, fiscal year B.E. 2558
(2015)(คมอการประเมนผลการปฏบตราชการตามคารบรองการปฏบตราชการของจงหวด ประจ าปงบประมาณ
พ.ศ. 2558). Bangkok: Office of the Public Sector Development Commission.
Osborne, S., Bovaird, T., Tricker, M. and Waterston, P. (1993) Performance
management in complex public programmes. Birmingham Public Sector
Management Research Centre.
Owusu, F.Y. (2012) Organizational culture and public sector reforms in a post-
Washington consensus era: Lessons from Ghana’s good reformers, Progress in
Development Studies, 12 (2&3), pp. 135-151.
Painter, M. (2012) ‘Poor governance for development in China and Vietnam’, in
Sundaram, J.K. and Chowdhury, A. (eds) Is good governance good for
development? London: Bloomsbury Academic.
Pallant, J. (2010) SPSS survival manual: A step by step guide to data analysis using
SPSS. 4th edn. Berkshire: McGraw-Hill.
Parker, R. and Bradley, L. (2000) Organizational culture in the public rector: Evidence
from six organizations, International Journal of Public Sector Management, 13
(2), pp. 125-141.
430
Parker, R. and Bradley, L. (2001) Organizational culture in the public sector.
Available at: http://unpan1.un.org/intradoc/groups/public/documents/apcity/unpan
006307.pdf (Accessed: 10 June 2013).
Parry, K.W. and Proctor-Thomson, S.B. (2003) Leadership, culture and performance:
The case of the New Zealand public sector, Journal of Change Management, 3
(4), pp. 376-399.
Patton, M.Q. (1987) How to use qualitative methods in evaluation. Newbury Park: Sage.
Patton, M.Q. (1990) Qualitative evaluation and research methods. 2nd edn. Newbury
Park, Calif.: Sage Publications.
Patton, M.Q. (2001) Qualitative Research and Evaluation Methods. 3rd edn. Thousand
Oaks: Sage.
Patton, M.Q. (2002) Qualitative research and evaluation methods. 3rd edn. Thousand
Oaks: Sage.
Peters, B.G. and Pierre, J. (ed.) (2007) Handbook of public administration. London: Sage.
Peters, B.G. and Savoie, D.J. (1995) Governance in a changing environment.
Montreal: McGill-Queen’s University Press.
P.H. C. (1953) Thai culture and behavior: An unpublished war time study, The Far
Eastern Quarterly, 12 (2), pp. 240-241.
Pheysey, D.C. (1993) Organizational cultures: Types and transformations. London:
Routledge.
Phillips, D.C. and Burbules, N.C. (2000) Postpositivism and educational research.
Lanham, Md.: Rowman and Littlefield.
Phillips, H.P. (1965) Thai peasant personality: The patterning of interpersonal
behavior in the village of Bang Chan. Los Angeles: University of California Press.
Phillips, H.P. (1966) Thai peasant personality: The patterning of interpersonal behavior
in the village of Bang Chan, American Anthropology, 68 (3), pp. 793-794.
Phookpan, P. (2012) An analysis of organisational culture of integrated public
organizations: The case of Thailand. PhD Thesis. University of Manchester.
Phusavat, K., Anussornnitisarn, P., Helo, P. and Dwight, R. (2009) Performance
measurement: Roles and challenges, Industrial Management and Data System,
109 (5), pp. 646-664.
Pimpa, N. (2012) Amazing Thailand: Organizational Culture in the Thai Public Sector,
International Business Research, 5 (11), pp. 35-41.
Pipat, K.P. (2013a) Buddhism and Thai world view. Available at: http://kulavir.weebly.com/
ilc2150-thai-ways.html (Accessed: 3 November 2013).
Pipat, K.P. (2013b) Gender and sexuality in Thai buddhism. Available at:
http://kulavir.weebly.com/uploads/7/9/8/0/7980705/gendersexual_discrimination
-updated.pdf (Accessed: 3 November 2013).
Platt, C.S. (1999) ‘Humanizing public administration’, in Kearney, R.C. and Berman,
E.M. (eds) Public sector performance: Management, motivation and
measurement. Colorado: Westview Press, pp. 45-56.
431
Podhisita, C. (1998) ‘Buddhism and Thai world view’, in Pongsapich, A. (ed.)
Traditional and changing Thai world view. Bangkok: Chulalongkorn University Press.
Polidano, C. and Hulme, D. (1999) Public management reform in developing
countries: Issues and outcomes, Public Management: An International Journal
of Research and Theory, 1 (1), pp. 121-132.
Price, A. (2011) Human resource management. 4th edn. Hampshire: Cengage Learning.
Pye, L.W. (1999) Civil, social capital, and civil society: Three powerful concepts for
explaining Asia, Journal of Interdisciplinary History, xxix (4), pp. 763-782.
Quinn, R.E. and Rohrbaugh, J. (1983) A spatial model of effectiveness criteria:
Towards a competing values approach to organizational analysis, Management
Science, 29 (3), pp. 363-377.
Quinn, R.E. and Spreitzer, G. (1991) The psychometrics of the competing values
culture instrument and an analysis of the impact of organizational culture on
quality of life. Emerald.
Quirk, A.J. (2002) Bureaucratic culture and new public management: a case study of
Indira Mahila Yojana in Uttar Pradesh. PhD thesis. Durham University.
Radnor, Z. and McGuire, M. (2004) Performance management in the public sector:
Fact or fiction?, International Journal of Productivity and Performance
Management, 53 (3), pp. 245-260.
Rainey, H.G. (1996) ‘Building an effective organizational culture’, in Perry, J.L. (ed.)
Handbook of public administration. 2nd edn. San Francisco: Jossey-Bass, pp. 51-156.
Ralston, D.A., Terpstra-Tong, J., Terpstra, R.H., Wang, X. and Egri, C. (2006)
Today’s state-owned enterprises of China: Are they dying dinosaurs or dynamic
dynamos?, Strategic Management Journal, 27 (9), pp. 825-834.
Reynolds, C.J. (2006) Seditious histories: Contesting Thai and Southeast Asian pasts.
Singapore: University of Washington Press.
Rhodes, R.A.W. (1996) The new governance: Governing without government,
Political Studies, 44 (4), pp. 652-667.
Richards, L. (1999) Using NVivo in qualitative research. London: Sage.
Robbins, S.P. (2005) Organizational behavior. New Jersey: Prentice Hall International.
Rojas, R.R. (2000) A review of models for measuring organizational effectiveness
among for-profit and nonprofit organizations, Nonprofit Management and
Leadership, 11 (1), pp. 97-104.
Rokeach, M. (1970) A theory of organization and change. San Francisco: Jossey-Bass.
Rong, T. and Hongwei, S. (2012) Transformations of organizational culture in the
public sector, Cross-Cultural Communication, 8 (4), pp. 46-52.
Royal Thai Consulate-General (2016). Thailand in brief. Available at:
http://www.thaiembassy.org/chennai/en/services/4192 (Accessed: 25 March 2016).

432
Royal Thai Government (2014). National broadcast by General Prayut Chan-O-Cha,
Head of the National Council for Peace and Order, on 30 May 2014. Available
at: http://www.thaigov.go.th/en/speech-2/item/83656-national-broadcast-by-
general-prayut-chan-o-cha-head-of-the-national-council-for-peace-and-
order.html. (Accessed: 26 March, 2016).
Ryan, A.J. and Pointon, J. (2007) ‘Reward and performance management’, in
Beardwell, J. and Claydon, T. (eds) Human resource management:
A contemporary approach. Essex: Pearson Education Limited, pp. 487-522.
Sapsford, R. and Jupp, V. (2006) Data collection and analysis. 2nd edn. London: Sage.
Sathornkich, N. (2010) Development and Implementation of a performance
management system that efficiently and effectively drives Thai public sector
development. PhD Thesis. University of Manchester.
Sathornkich, N. (2013) ‘Monitoring framework in Thailand: Status, challenges, and
good practices’ 3rd M and E network forum: Establishing on effective M and E
system for development results: Key considerations from international
experience. Phillippines, 6-8 November. Available at: https://wpqr4.adb.org/lotusquickr/
cop-mfdr/PageLibrary482571AE005630C2.nsf/0/FED353BC3B07 8EDD 48257
C6300268B85/$file/4b%20Monitoring%20Framework,%20Thailand%202_Nicha
%20Sathornkich.pdf (Accessed: 8 May 2016).
Schein, E. (1991) ‘What is culture?’, in Frost, P.J.;Moore, L.F.; Louis, M.R.; Lundberg,
C.C. and Martin, J. (eds) Reframing organizational culture. London: Sage.
Schein, E.H. (1990) Organizational culture, American Psychologist, 45 (2), pp. 109-119.
Schein, E.H. (2004) Organizational culture and leadership. 3rd edn. San Francisco:
Jossey-Bass.
Schraeder, M., Tears, R.S. and Jordan, M.H. (2005) Organizational culture in public
sector organizations: Promoting change through training and leading by example,
Leadership and Organization Development Journal, 26 (5/6), pp. 429-502.
Schwartz, H. and Davis, S.M. (1981) Matching corporate culture and business
strategy, Organizational Dynamics, 10, pp. 30-48.
Selaratana, S. (2009) Accountability in the Thai public sector. PhD thesis. University
of Glasgow.
Senior, B. and Fleming, J. (2006) Organizational change. 3rd edn. Harlow: Financial
Times Prentice Hall.
Shabbir, M.S. and Rehman, A.K. (2016) The impact of financial crises and economic
growth of East Asian countries Journal of Internet Banking and Commerce,
21 (1), pp. 1-13.
Shor, E.L. (1960) The Thai bureaucracy, Administrative Science Quarterly, 5 (1),
pp. 66-86.
Shuttleworth, M. (2008) Research design. Available at: http://explorable.com/quasi-
experimnetal-design (Accessed: 9 April 2013).
Sirisamphan, T. (2009) Good governance (การบรหารกจการบานเมองทด). Bangkok: S. Asia
Press (1989) Co.,Ltd.

433
Smith, B.C. (2007) Good governance and development. Basingstoke: Palgrave Macmillan.
Sopchokchai, O. (2001) Good local governance and anti-corruption through people’s
participation: A case of Thailand. Bangkok: Office of Civil Service Commission.
Sparkes, S. (1998) ‘Political cults in East and Southeast Asia’, in Trankell, Ing-Britt.
and Summers, L. (eds) Facet of power and its limitations: Political culture in
Southeast Asia. Uppsala: Uppsala University.
Srimai, S. (2015) Performance agreement in Thai public sectors: A call for
reconsideration at the provincial level, International Journal of Productivity and
Management, 64 (5), pp. 625-639.
Srimai, S., Damsaman, N. and Bangchokdee, S. (2011) Performance measurement,
organizational learning and strategic alignment: an exploratory study in Thai
public sector, Measuring Business Excellence, 15 (2), pp. 57-69.
Stark, S. and Torrance, H. (2005) Case study in Bridget Somekh and Cathy Lewin
research methods in the social sciences. London: Sage.
Strauss, A.L. (1987) Qualitative analysis for social scientists. Cambridge: Cambridge
University Press.
Stringer, C., Didham, J. and Theivananthampillai, P. (2011) Motivation, pay
satisfaction, and job satisfaction of front-line employees, Qualitative Research in
Accounting and Management, 8 (2), pp. 161-179.
Sundaram, J.K. and Chowdhury, A. (2012) ‘Introduction: Governance and
development’, in Sundaram, J.K. and Chowdhury, A. (eds) Is good governance
good for development?. London: Bloomsbury Academic.
Suthapreda, V.D. (2013) ‘Driving forces of good governance in ASEAN’ Asean
Executive Governance Program, Bangkok, 26-31 August. Available at:
http://www.opdc.go.th (Accessed: 8 May 2016).
Tachateerapreda, S. (2009) The influence of organizational culture on development
and stategic change: A case study of Small-and-Medium-Sized enterprises in
Northeast Thailand. PhD Thesis. Ramkhamhaeng University.
Talbot, C. (2010) Theories of performance: Organizational and service improvement
in the public domain. Oxford: Oxford University Press.
Tamronglak, A. (2014) Thai administrative reform and innovation: From bureaucracy
to governance. Available at: http://www.pspa.ph/files/PSPA2014/
Tamronglak_Thai %20Administrative%20Reform%20and%20Innovation.pdf
(Accessed: 3 April 2016).
Teddlie, C. and Yu, F. (2007) Mixed methods sampling: A typology with samples,
Journal of Mixed Methods Research, 1 (1), pp. 77-100.
The Secretariat of the House of Representatives (2011) Act Establishing Changwat
Bueng Kan B.E. 2554 (2011) (พระราชบญญตตงจงหวดบงกาฬ พ.ศ. 2554). Available at:
http://dl.parliament.go.th/handle/lirt/17060 (Accessed: 6 April 2016).

434
The Secretariat of the House of Representatives (2015) Provincial administration:
Which answer is appropriate and international for Thailand
(การบรหารราชการสวนภมภาค ตอบโจทยแบบไหนใหเหมาะกบประเทศไทยและเปนสากล). Bangkok:
Academic Focus, The Secretariat of the House of Representatives.
The Secretariat of the House of Representatives (2016) Constitution of the Kingdom of
Thailand Available. Available at: http://library2.parliament.go.th/
giventake/thaicons.html (Accessed: 27 March 2016).
The Secretariat of the House of Representatives (2016) Database of the library of
parliament. Available at: http://library2.parliament.go.th/giventake/ncpo.html
(Accessed: 26 March 2016).
Thompson, J.D., Zald, M.N. and Scott, W.R. (2007) Organizations in action: Social
science bases of administration. 5th edn. New Brunswick: Transaction
Publishers.
Tjiptoherijanto, P. (2012) Civil service reforms in Thailand: Political control and
corruption, Working Paper in Economics and Business, II (1), pp. 1-8.
Tourism Authority of Thailand (2016) Economics and politics. Available at:
http://www.tourismthailand. org/About-Thailand/Economy-Politic
(Accessed: 26 March 2016).
UN (1997) Administrative reforms: Country profiles of five Asian countries. Available
at: https://publicadministration.un.org/publications/content/PDFs/E-Library%20
Archives/1997%20Administrative%20Reforms_Country%20Profiles%20of%20
Five%20Asian%20Countries.pdf United Nations (Accessed: 6 April 2016).
UN (2006) Definition of basic concepts and terminologies in governance and public
administration. New York: United Nation.
UN (2015) Governance. Available at: http://www.un.org/en/globalissues/governance/
(Accessed: 10 November 2015).
UNDP. (1994a) Governance for sustainable human development: A UNDP policy
document. Available at: http://mirror.undp.org/magnet/policy/chapter1.htm
(Accessed: 1 February 2013).
UNDP (1994b) Good governance - and sustainable human development. Available at:
http://www.undp.org (Accessed: 1 February 2013).
UNDP (1997) Governance for sustainable human development: A UNDP policy
document United Nations Development Programme. Available at:
http://www.undp.org (Accessed: 1 February 2013).
UNESCAP. (2003) What is good governance?. Available at: http://www.unescap.org
(Accessed: 30 June 2013).
UNESCAP (2009) What is good governance?. Available at: http://www.unescap.org/
resources/what-good-governance (Accessed: 30 October 2015).
Vallance, S. and Fellow, H. (1999) Performance appraisal in Singapore, Thailand and
the Philippines: A cultural perspective, Australia Journal of Public
Administration, 58 (3), pp. 78-95.
435
Vanderstoep, S.W. and Johnson, D.D. (2009) Methods for everyday life: Blending
qualitative and quantitative approaches. San Francisco: Jossey-Bass.
Varma, A., Budhwar, P.S. and DeNisi, A. (2008) Performance management systems:
A global perspective. London Routledge.
Vichit-Vadakan, J. (2012) Analysis character of Thailand: The root of the problem
and prosperity (บทวเคราะหลกษณะนสยของคนไทย!!รากเหงาของความเจรญและปญหาทงมวลของประเทศไทย).
Available at: http://omg-rabbit.myfri3nd.com/blog/2012/01/12/entry-1 (Accessed:
30 October 2013).
Warwick, D.P. and Osherson, S. (1973) Comparative research methods. New Jersy:
Prentice-Hall.
Weiss, T.G. (2000) Governance, good governance and global governance: conceptual
and actual challenges, Third World Quarterly, 21 (5), pp. 795-814.
Westhuizen, D.W.V.D., Pacheco, G. and Webber, D.J. (2012) Culture, participative
decision making and job satisfaction, The International Journal of Human
Resource Management, 23 (13), pp. 2661-2679.
Whorton, J.W. and Worthley, J.A. (1981) A perspective on the challenge of public
management: Environmental paradox and organizational culture, Academic of
Management Review, 6 (3), pp. 357-361.
Wijayati, N., Hermes, N. and Holzhacker, R. (2015) ‘Corporate governance and
corruption: A comparative study of Southeast Asia’, in Holzhacker, R.L.;Wittek,
R. and Woltjer, J. (eds) Decentralization and governance in Indonesia. London:
Springer.
Williams, J.C. and Huber, G.P. (1986) Human behavior in organizations. 3rd edn.
Cincinnati: South-Western Publishing.
Williams, M.R. (1933) Performance appraisal in management. London Heinemann.
Williams, R.S. (1998) Performance management : Perspectives on employee
performance. London: International Thomson Business.
Wilson, F.M. (2010) Organizational behaviour and work: A critical introduction. 3rd
edn. Oxford: Oxford University Press.
Wiratchaniphawan, W. (1987) Analysis of behaviour of Thais to obstruct development
of rural area (วเคราะหอปนสยของคนไทย 30 ประการทเปนอปสรรคตอการพฒนาชนบท). Available at:
http://www.pattanakit.net (Accessed: 31 October 2013).
Wiratchaniphawan, W. (2004) The Thai government officials’ values under the
administrative reform era (คานยมของขาราชการไทยในยคปฏรประบบราชการ). Bangkok:
Nititham.
Wong, C.A. and Laschinger, H.K.S. (2012) Authentic leadership, performance, and
job satisfaction: The mediating role of empowerment, Journal of Advanced
Nursing, 64 (4), pp. 947-959.
World Bank (1989) Sub-Saharan Africa from crisis to sustainable growth.
Washington, D.C.: World Bank.
World Bank (1992) Governance and development. Washington, D.C.: World Bank.

436
World Bank (1994) Governance: The World Bank’s experience. Available at:
http://documents.worldbank.org/curated/en/711471468765285964/pdf/multi0pag
e.pdf (Accessed: 1 May 2013).
World Bank (2002) Country policy and institutional assessment 2002 assessment
questionnaire. Available at: http://siteresources.worldbank.org/ IDA/ Resources/
CPIA2002.pdf (Accessed: 7 May 2016).
Wyatt, D.K. (1968) Family politics in Nineteenth Century Thailand, Journal of
Southeast Asian History, 9 (2), pp. 208-228.
Yetano, A. and Matsuo, T. (2015) Are changes effective in performance management?
An analysis of Japanese agencies, International Journal of Public Administration,
38,pp. 573-585.
Yin, R.K. (2002) Case study research design and methods. 3rd edn. Thousand Oaks: Sage.
Yu, T. and Wu, N. (2009) A review of study on the Competing Values Framework,
International Journal of Business and Management, 4 (7), pp. 37-42.
Yukl, G. (2010) Leadership in organizations. 7th edn. Upper Saddle River, New
Jersey: Prentice Hall.
Zammuto, R.F. and Krakower, J.Y. (1991) Quantitative and qualitative studies of
organizational culture, Research in Organizational Change and Development, 5,
pp. 83-114.