
Is ‘Good’ governance good for business? A cross-national analysis of firms in African countries
15
Is ‘Good’ governance good for business? A cross-national analysis of firms in African countries § Paul Valentin Ngobo a, *, Maurice Fouda b a Professor of Management, Institut d’Administration des Entreprises (IAE), Laboratoire Orle ´anais de Gestion (LOG), Faculte ´ de Droit, Economie and Gestion, Rue de Blois – B.P. 6739, 45067 Orleans Cedex 2, France b Professor of Management, ESSEC DOUALA, France 1. Introduction Some firms are more profitable than others are and many possible explanations have been put forward to explain these differences. Industry (e.g. concentration), corporate (e.g. scope economies) and firm (e.g. resources and capabilities) specific factors have all been identified as possible drivers of these differences (e.g. McGahan & Porter, 1997; Rumelt, 1991). The industry and firm perspectives have enhanced our understanding of the drivers of firm strategies and performance. However, these perspectives have treated the national context as something that is external to firm strategies and performance. While institutional factors may be assumed to be constant in developed economies, they may not be in countries that undergo economic and political changes. Research has appeared that looks at firm differences in performance across countries (e.g. Hawawini, Subramanian, & Verdin, 2004; Makino, Isobe, & Chan, 2004). While these studies show that country effects matter in firm performance, they examined primarily the relative influence of country versus industry/firm effects. Studies regarding the performance effects of country factors have concerned European (Hawawini et al., 2004) and Asian companies (Makino et al., 2004). Still, to the best of our knowledge, a detailed assessment of the impact of a country’s institutions on firm profitability in other contexts is nonexistent in the current literature. A new entrant within the domain of institutional factors is the concept of (public) good governance. Good governance became important in the early 1990s when international aid agencies realized that poor governance across many developing countries was a major obstacle to their economic development. It has a normative aspect as underlying this notion is the idea that there is a better way to manage a country. This implies fair legal frameworks, transparency, accountability, participation of men and women, and so on. In this perspective, the institutions of the European and North-American countries are viewed as the standards by which the institutions of other countries must be compared. In this paper, we retain the definition of good governance, suggested by the World Bank (see Kaufmann et al., 2006), as the traditions and institutions by which authority in a country is exercised. They include: (1) the process by which governments are selected, monitored, and replaced (e.g. democracy), (2) the capacity of the government to effectively formulate and imple- ment sound policies, and (3) the respect of citizens and the state for Journal of World Business 47 (2012) 435–449 A R T I C L E I N F O Keywords: Good governance Institutions Profitability Risk Africa A B S T R A C T Good governance can reduce uncertainty, transaction, search and production costs, and ultimately affect firm performance. In this paper, we explore the link between good governance and the profitability of individual firms in African countries. We employ the governance indices developed at the World Bank and assemble a sample of companies from 21 countries over four years. Contrary to prior research that found a negative association between institutional development and profitability, our evidence shows that an improvement of good governance in countries currently with low levels of governance ratings has greater positive effects on the firm profitability than a similar improvement in countries with relatively higher ratings of good governance. Good governance reduces the variability of the company’s profitability, leading to high-return and low-risk investments. Finally, we find that the role of good governance depends upon the country’s income level. When the income level is lower, an improvement in public governance is more likely to impact firm performance than when the income level is relatively higher. Good governance is more important for the stability of the profitability of firms in countries with higher levels of good governance ratings than lower ratings. ß 2011 Elsevier Inc. All rights reserved. § This paper has benefited from the comments and suggestions of the anonymous reviewers of the Journal of World Business. * Corresponding author. Tel.: +33 238 494 508; fax: +33 238 494 816. E-mail addresses: [email protected] (P.V. Ngobo), [email protected] (M. Fouda). Contents lists available at ScienceDirect Journal of World Business jo u r nal h o mep age: w ww.els evier .co m/lo c ate/jwb 1090-9516/$ – see front matter ß 2011 Elsevier Inc. All rights reserved. doi:10.1016/j.jwb.2011.05.010
-
Upload
univ-angers -
Category
Documents
-
view
4 -
download
0
Transcript of Is ‘Good’ governance good for business? A cross-national analysis of firms in African countries
Journal of World Business 47 (2012) 435–449
Is ‘Good’ governance good for business? A cross-national analysis of firms inAfrican countries§
Paul Valentin Ngobo a,*, Maurice Fouda b
a Professor of Management, Institut d’Administration des Entreprises (IAE), Laboratoire Orleanais de Gestion (LOG), Faculte de Droit, Economie and Gestion,
Rue de Blois – B.P. 6739, 45067 Orleans Cedex 2, Franceb Professor of Management, ESSEC DOUALA, France
A R T I C L E I N F O
Keywords:
Good governance
Institutions
Profitability
Risk
Africa
A B S T R A C T
Good governance can reduce uncertainty, transaction, search and production costs, and ultimately affect
firm performance. In this paper, we explore the link between good governance and the profitability of
individual firms in African countries. We employ the governance indices developed at the World Bank
and assemble a sample of companies from 21 countries over four years. Contrary to prior research that
found a negative association between institutional development and profitability, our evidence shows
that an improvement of good governance in countries currently with low levels of governance ratings
has greater positive effects on the firm profitability than a similar improvement in countries with
relatively higher ratings of good governance. Good governance reduces the variability of the company’s
profitability, leading to high-return and low-risk investments. Finally, we find that the role of good
governance depends upon the country’s income level. When the income level is lower, an improvement
in public governance is more likely to impact firm performance than when the income level is relatively
higher. Good governance is more important for the stability of the profitability of firms in countries with
higher levels of good governance ratings than lower ratings.
� 2011 Elsevier Inc. All rights reserved.
Contents lists available at ScienceDirect
Journal of World Business
jo u r nal h o mep age: w ww.els evier . co m/lo c ate / jwb
1. Introduction
Some firms are more profitable than others are and manypossible explanations have been put forward to explain thesedifferences. Industry (e.g. concentration), corporate (e.g. scopeeconomies) and firm (e.g. resources and capabilities) specificfactors have all been identified as possible drivers of thesedifferences (e.g. McGahan & Porter, 1997; Rumelt, 1991). Theindustry and firm perspectives have enhanced our understandingof the drivers of firm strategies and performance. However, theseperspectives have treated the national context as something that isexternal to firm strategies and performance. While institutionalfactors may be assumed to be constant in developed economies,they may not be in countries that undergo economic and politicalchanges.
Research has appeared that looks at firm differences inperformance across countries (e.g. Hawawini, Subramanian, &Verdin, 2004; Makino, Isobe, & Chan, 2004). While these studiesshow that country effects matter in firm performance, they
§ This paper has benefited from the comments and suggestions of the anonymous
reviewers of the Journal of World Business.
* Corresponding author. Tel.: +33 238 494 508; fax: +33 238 494 816.
E-mail addresses: [email protected] (P.V. Ngobo),
[email protected] (M. Fouda).
1090-9516/$ – see front matter � 2011 Elsevier Inc. All rights reserved.
doi:10.1016/j.jwb.2011.05.010
examined primarily the relative influence of country versusindustry/firm effects. Studies regarding the performance effectsof country factors have concerned European (Hawawini et al.,2004) and Asian companies (Makino et al., 2004). Still, to the bestof our knowledge, a detailed assessment of the impact of acountry’s institutions on firm profitability in other contexts isnonexistent in the current literature.
A new entrant within the domain of institutional factors is theconcept of (public) good governance. Good governance becameimportant in the early 1990s when international aid agenciesrealized that poor governance across many developing countrieswas a major obstacle to their economic development. It has anormative aspect as underlying this notion is the idea that there isa better way to manage a country. This implies fair legalframeworks, transparency, accountability, participation of menand women, and so on. In this perspective, the institutions of theEuropean and North-American countries are viewed as thestandards by which the institutions of other countries must becompared.
In this paper, we retain the definition of good governance,suggested by the World Bank (see Kaufmann et al., 2006), as thetraditions and institutions by which authority in a country isexercised. They include: (1) the process by which governments areselected, monitored, and replaced (e.g. democracy), (2) thecapacity of the government to effectively formulate and imple-ment sound policies, and (3) the respect of citizens and the state for
P.V. Ngobo, M. Fouda / Journal of World Business 47 (2012) 435–449436
the institutions that govern economic and social interactionsamong them (e.g. rule of law). While the concept of goodgovernance is widely studied in the public administration andinternational law areas, research linking good (public) governancewith firm performance is scarce (Ring, Bigley, Khanna, & D’Aunno,2005; Uhlenbruck, Rodriguez, Doh, & Eden, 2006).1 This issurprising since good governance has become an importantsubject for both scholars and public policy organizations.Underlying this interest is the assumption that good governancedrives economic prosperity (Knack & Keefer, 1995; Mauro, 1995),assures a transparent environment for the conduct of public affairs,promotes free market policies, justice and rule of law, and therespect for the civil rights. Many organizations, such as Transpar-ency International (TI), the World Bank, have developed indices ofgood governance, which rank countries on the institutional quality.Despite some criticisms (e.g. Arndt & Oman, 2006), these rankingsattract considerable publicity from the media, and have raised theattention of the international community on the consequences ofcorruption on the populations.
Good governance can have performance implications forcompanies operating in uncertainty and risky environments, suchas those of developing and emerging economies (Wan, 2005).Research on good governance has emphasized primarily itseconomy-wide effects (Easterly & Levine, 1997; Mauro, 1995)with mixed findings (e.g. Knack & Keefer, 1995; Barro, 1997 versusQuibria, 2006). Evidence from some countries (e.g. China,Indonesia) supports the view that poor public governance hashad small effects. These countries have experienced high economicgrowth rates while retaining some institutional disorder (Boisot &Child, 1996). Similarly, from a strategic management perspective,it is not clear if improvements in the public governance affect firmperformance in a country as indeed in countries with poorgovernance companies can take advantage of the institutionalvoids and earn monopolistic profit levels.
Africa offers an idiosyncratic setting for examining the effectsof good governance. The problems facing African countries are notframed entirely as cultural or economic issues but mostly aspolitical issues; poor development is argued to result primarilyfrom poor governance.2 While African leaders cite the Chinesemodel as an example of the tradeoff between economicdevelopment and rights, in Africa, it is hard to find an exampleof authoritarian regime that has achieved good economicoutcomes as well. At the same time, African countries areexperiencing some changes in their public governance mecha-nisms. In its 2007 report on Doing Business, the World Bankshowed that Africa had moved from last place to third in terms ofreforms that encourage new enterprises and growth. In the 2011report of Doing Business, it is said that 27 of 46 Sub-Saharan Africaneconomies implemented Doing Business reforms. Naturally, aquestion that arises from a business strategy perspective is thefollowing: do the growing changes in governance policies acrossAfrican countries influence the performance of the companiesoperating in these countries?
Our study aims to examine the influence of good governance onthe performance of companies operating in African countries witha focus on two types of firm performance metrics (Chan, Takehiko,& Makino, 2008): the level of firm performance (the return on theinvestment), and the variation in performance within the country(risk of the investment). More specifically, we address the
1 It must be noted that good governance in this paper refers to public governance
not to corporate governance, which is the set of mechanisms/systems used by
corporations in order to attenuate the problem of the conflict of interests between
management and shareholders.2 World Bank, Managing Development: The Governance Dimension, Washington,
DC, June 1991; The World Bank, Governance and Development, Washington, DC,
1992.
following question: Is the country’s public governance quality,as measured and reported in international governance databases,reflected in the performance of companies operating in Africa?From a managerial perspective, good governance can improve (e.g.through lower costs) or decrease (e.g. by increasing the competi-tive intensity) firm performance. Our study intends to provideinsights to policy makers and managers about whether, how, andwhere good governance matters for business in Africa.
We organize the rest of the paper as follows. The next sectionprovides the research background by reviewing extant research onthe role of country factors in firm performance. Then, we developour research model and hypotheses. Next, we describe our dataset.The subsequent section proposes the model to quantify the effectsof governance rankings on firm performance. The estimationoutcomes are presented next. The paper ends with a discussion ofthe research implications and limitations. Our study contributes tothe existing literature on good governance in two significant ways.First, we examine the role of good governance on two aspects offirm performance, i.e. the profitability and risk of Africancompanies, while prior research, regarding African economies,has primarily examined the effects of good governance oneconomy-wide indicators such as GDP growth. Second, byadopting a multilevel latent factor regression model, we showhow firms respond to good governance across various groups ofcountries. Thus, we offer a moderated theory of the influence ofgood governance on firm performance. For example, we find thatthe influence of good governance on firm performance dependsboth on the level of good governance already achieved by a countryand by the type of performance indicator one considers (e.g.returns vs. risk).
2. The theoretical framework and hypotheses
2.1. Country effects, institutions, and firm performance: a review
Institutions are the humanly devised (economic, political,social) constraints that shape interactions in a society by designingthe rules of the game, which, in turn, structure the incentives insocial, economic, and political exchanges (North, 1990). Institu-tions are associated with different resources and opportunitiesthat shape firms’ industry and competitive environments (Wan &Hoskisson, 2003). They determine the incentives for innovation(Bartholomew, 1997; Clarke, 2001), differences in entrepreneurialactivities (Busenitz, Gomez, & Spencer, 2000), the development ofsocial networks (Kiss & Danis, 2008), and so forth. A series ofstudies has shown that country’s legal origin influences economicperformance. Common law countries have less concentratedownership (La Porta, Lopez-de-Silanes, Shleifer, & Vishny, 1998),better capital markets (La Porta, Lopez-de-Silanes, Shleifer, &Vishny, 1997), pay higher dividends (La Porta, Lopez-de-Silanes,Shleifer, & Vishny, 2000), and firm value (La Porta, Lopez-de-Silanes, Shleifer, & Vishny, 2002).When the law protects investors’rights, they are willing to pay more for the company’s assetsbecause they recognize that more of those profits would come backas dividends. Wan (2005) offers an institution-based theory ofstrategy and performance where the country environment isviewed as a resource context, i.e. it provides factors of productionand institutions. Because countries have different factors ofproduction and institutions of different quality, the resourcesand capabilities companies can develop will differ across countries,and so will firm performance. When institutions are strong, non-market capabilities, e.g. lobbying, bureaucratic relationships,become less useful as the government role in the economydiminishes. Strong institutions contribute to firm performance as itprovides the incentives to develop market capabilities (e.g.innovation).
P.V. Ngobo, M. Fouda / Journal of World Business 47 (2012) 435–449 437
The use of institutional theory has increased the most in studiesof business strategy in the emerging economies, which arecharacterized by poorer institutional frameworks compared todeveloped economies (Khanna, Palepu, & Sinha, 2005; Wan, 2005).This research stream shows that national institutional environ-ments of emerging economies influence strategic choices such asproduct and geographic diversification and their performance (e.g.Chang & Hong, 2000; Khanna & Palepu, 2000). Second, institutionaldifferences influence the foreign investment strategies of compa-nies in and from emerging countries such as entry mode (e.g.Chung & Beamish, 2005; Meyer & Nguyen, 2005) and the level ofequity ownership (Delios & Henisz, 2000). Third, institutionsinfluence the domestic strategies in emerging economies byencouraging professional and political strategies (Peng & Luo,2000).Fourth, institutional quality explains differences in firmperformance. Carroll and Delacroix (1982) found a highermortality rate for newspapers in Argentina during periods ofpolitical unrest. Clarke (2001) found that expenditures in R&D tendto be lower in countries characterized by a high risk ofexpropriation, weak rule of law, and more tenuous intellectualproperty rights. In their research, Chan et al. (2008) find thatforeign affiliate performance varies significantly across and withinhost countries. The level of institutional development (or theextent to which the economic, political, and social institutions in ahost country are developed and are favorable for foreign affiliates)has a negative curvilinear relationship with the variation in foreignaffiliate performance but, unexpectedly, they observe a negativeeffect on the level of foreign affiliate performance. They providedifferent explanations to this result. Yet, it is also possible thatinstitutional development will reduce the levels of profitability ofthe foreign affiliates when it exposes these firms to the discipline ofproduct market competition. Their study also concerned theforeign affiliates of Japanese corporations. We differ from theextant literature in research focus as we examine the influence ofthe country’s governance quality on the performance of the firmsin African economies. The vast majority of research in support ofinstitution-based view of the firm comes from Asia (see Peng &
Fig. 1. Researc
Delios, 2006). A focus on African economies allows us to examine adifferent institutional area whose underdevelopment has beenprimarily attributed to problems of poor governance.
2.2. How good governance influences firm performance
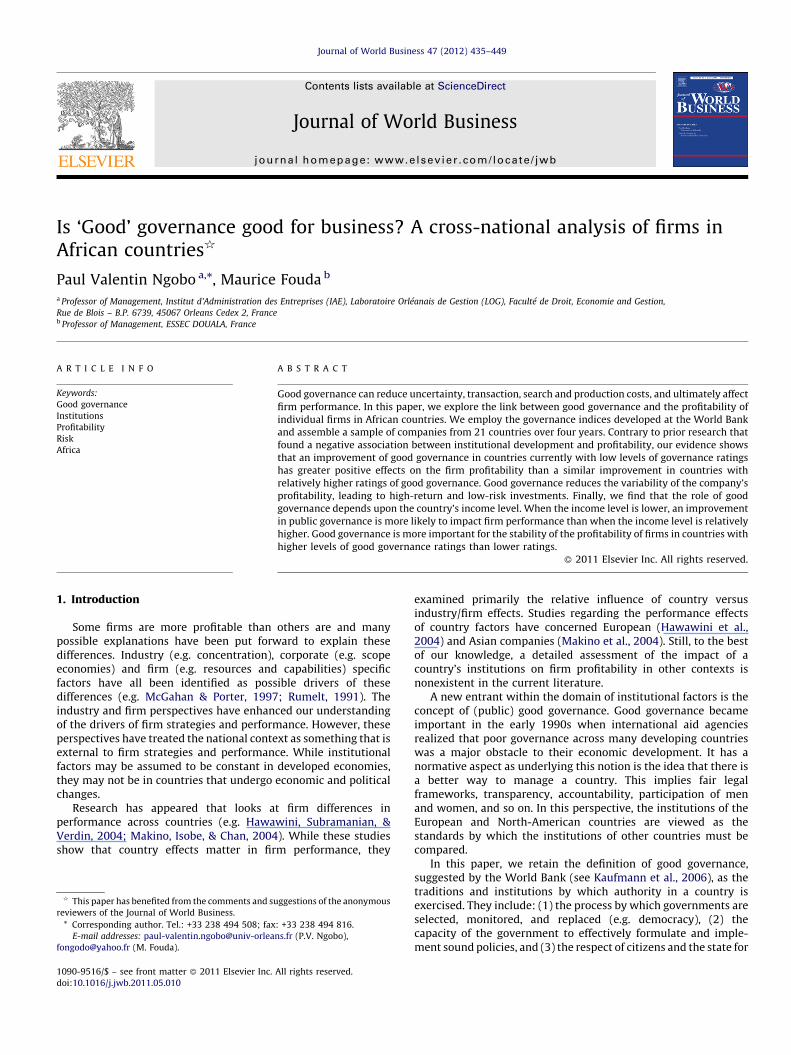
Fig. 1 presents the conceptual model used in this research. Weinvestigate whether country effects matter and how differences ingood governance influence the performance of companies inAfrican countries. We consider that firm performance is not onlydriven by industry conditions and firm specific factors, but also bythe institutional constraints of the countries in which firms areembedded (e.g. Meyer & Nguyen, 2005; Ring et al., 2005).
2.2.1. Country effects in the performance of African companies
Markets require specific institutions and rules (e.g. marketintermediaries, property rights, regulations) in order to come intoexistence and to function appropriately. An inherent challenge ofdoing business in Africa either as an international corporation or asa local firm is the absence of institutional mechanisms (orinstitutional voids). These typically provide information, and rulesof law, which are critical to successful business operations. Weargue that the level of firm profitability should vary across Africancountries because of the differences in institutional voids betweenthese countries. The level of institutional development in someAfrican countries is lower than in others because the institutionalvoids (e.g. differences in government effectiveness, rule of law andlaw enforcement) are relatively larger in some countries than inothers (e.g. South Africa versus Mali).The 2009 Doing Business
statistics, for example, show that it takes 24 days in Algeria, 68 inAngola, 37 in Cameroon, 155 in the Democratic Republic of Congo,7 in Egypt, 66 in Namibia, 8 in Senegal, and 22 days in South Africato start a business. The institutional voids prevent the efficientfunctioning of markets by increasing the cost of transactions(Khanna & Palepu, 2000). Because of differences in transaction andtransformation costs across Africa, companies operating in thesecountries face different institutional costs that, as a consequence,
h model.
P.V. Ngobo, M. Fouda / Journal of World Business 47 (2012) 435–449438
can create differences in firm competitiveness and profitability(Habib & Zurawicki, 2002; Hoskisson, Eden, Lau, & Wright, 2000).We hypothesize that:
H1 (:).Levels of firm profitability vary across African economies.
2.2.2. Good governance and firm profitability
These cross-country differences can be explained using thenotion of good governance. Nevertheless, it is not clear whether anincrease in good governance will result in better firm performanceor not. Good governance can affect the profitability of companiesoperating in that country. For example, typically, in a corruptcountry, firms, specifically those with strong political ties, are ableto earn higher profit rates. In his institution-based theory, Wan(2005) argues that in emerging economies ‘‘firms can erectinstitutional barriers to entry, barring competitors from resourceenvironments, in order to enjoy prolonged competitive advan-tages’’ (p. 169). Consequently, improvements in the quality of thecountry governance may expose the incumbent firms to thediscipline of product market competition. In a regime with weakgovernance, there may be a small number of incumbentmonopolies with strong political ties, benefiting from importrestrictions. As governance improves, these firms might beexpected to suffer declines in sales and profitability as newcompetitive entrants come into the market. In line with this view,Chan et al. (2008) find a negative association between institu-tional development and level of firm performance of foreignaffiliates of Japanese MNCs. Khanna and Palepu (2000) also foundthat the advent of political stability and democracy lead to thereduction in the group effect (diversification benefits) in Chile.They interpret this result as indicating that the ‘‘development ofefficient external markets results in less need for the internalmarkets that groups can create and therefore lowers theperformance effects of group affiliation’’. Poor institutions mayalso provide competitive advantages to firms that are able to dobusiness in unstable countries or who can exploit the institutionalvoids (e.g. Fisman & Khanna, 1998). Furthermore, the advent ofdemocracy in a country and the improved political rights cannegatively influence business performance and economic growth,e.g. when political groups prevent the government from makingthe reforms that are necessary for economic growth andbusinesses.
In the long run, however, the costs of poor governance shouldoutweigh its short-run benefits. This is what underlies the generalinterest in good governance. North (1990) suggests that poorinstitutions raise transaction costs while better-developed institu-tions reduce uncertainty and lower transaction, search, andproduction costs. Firms in countries with lower institutionaldevelopment have to find ways for protecting their assets (Bergara,Henisz, & Spiller, 1998; Henisz, 2000) and sometimes have toresort to corruption to have things done (Rodriguez, Uhlenbruck, &Eden, 2005; Tanzi, 1998). Poor governance also increases the risk ofdoing business in a country (Delios & Henisz, 2003; Uhlenbrucket al., 2006) and can decrease profitability levels by creatingadditional expenses, reducing the levels of investments, by leadingthe firm to invest in projects with immediate returns, and byshifting resources from economic to political activity (Henisz,2000).
Good governance should be associated with higher profit levelsbecause it has the potential to reduce the institutional voids andconsequently the transaction costs and business risks. Variousstudies support this opinion and consequently the possibility of apositive link between good governance and firm profitability. Onetype of institutional void is the lack of political accountability andstability in a country. Governments in many African countries are
not sufficiently accountable to their citizens because of the lack of areal democracy. Yet, democracy is argued to guarantee propertyand contract rights (Olson, 1993), to attenuate social conflict in acountry, and to provide greater incentives for investment (Clague,Keefer, Knack, & Olson, 1996). Although most studies, e.g. Helliwell(1994), de Haan and Siermann (1995) find no relationship betweengrowth and democracy, it appears that democracies influenceeconomic growth through human capital accumulation, incomedistribution, and political stability (see Alesina, Ozler, Roubini, &Swagel, 1996; Baum & Lake, 2003).
An increase in political accountability is thus likely to lead topolitical stability and possibly to lower the uncertainties associat-ed with doing business in an African country. There is clearconsensus from the previous studies that political instability canlead firms to avoid (Delios & Henisz, 2003), minimize (Delios &Henisz, 2000; Uhlenbruck et al., 2006) their investment levels,investments in a country’s infrastructures (Bergara et al., 1998;Levy & Spiller, 1994) or to increase the mortality rates ofcompanies (Carroll & Delacroix, 1982).In sum, firm performanceshould be greater in politically stable contexts. As good governanceis associated with political stability and accountability, it shouldlead to as well.
Another institutional void pertains to the quality of thegovernment (e.g. in terms of appropriate market regulation).Regulatory quality can affect the costs of production inputs incountries where the government has market-unfriendly policies,conducts price controls or when the government imposesexcessive regulation in areas such as foreign trade (Delios &Henisz, 2000). The existence of independent and strong institu-tions, such as the antitrust regulations, can also improve firmperformance through open and fair competition. Open competitionwill challenge incumbents and make them improve their productsand innovative capabilities for greater customer satisfaction andfirm performance. Having to compete with other firms forcustomers will provide the pressure required to stimulate greaterefficiency and profitability. Boubakri, Cosset, and Guedhami (2005)found a positive relationship between trade openness and sales forfirms in developing countries. The legal environment and degree ofeconomic freedom also significantly influenced the newly-privatized firm’s productivity.
Good governance can improve firm performance when itencourages the rule of law and reduces levels of corruption. Thereare indications that corruption hinders investment (both domesticand foreign), reduces growth, restricts trade, weakens the financialsystem, and strengthens the underground economy (Kaufmann &Wei, 1999; Mauro, 1995). Batra, Kaufmann, & Stone (2003), usingWorld Bank survey data, found that corruption was negativelyrelated to sales growth. Corruption acts as an additional expensefor companies, which consequently increases the transaction costs.It hampers the markets’ ability to promote fair competition, as thecompany development is not based on competitiveness andexcellence, but on the political strategies and the ability to pay(Wan, 2005). By removing impediments to business activity, goodgovernance can contribute to greater profitability. Throughcombating corruption, the government can reduce the transactioncosts for the companies operating in the country. Thus, wehypothesize that:
H2 (:).There is a positive association between good governance and thelevel of firm profitability.
2.3. Good governance and variability of firm performance
Good governance should also reduce the variability of firmprofitability within a country. Chan and colleagues (2008) argue
P.V. Ngobo, M. Fouda / Journal of World Business 47 (2012) 435–449 439
that such a variation can result from two factors. First, theysuggest that lower institutional development is associated witha lack of legitimate strategic actions. To overcome theinstitutional voids present in countries with poor institutions,companies may engage in a wider range of strategic actionswhose outcomes are uncertain. As a consequence, the perfor-mance outcomes of these different strategic choices are likely tovary. Second, Chan et al. (2008) argue that performance levels ofcompanies in countries with undeveloped institutions shouldvary because companies differ in their abilities to compete formarket opportunities. Companies that have capabilities tomanage the institutional idiosyncrasies of the country will havea better chance of achieving better performance than thosewithout this ability. In institutionally developed countries,variation in performance is more due to differences incompetitive advantages among firms (Wan, 2005). Indeed,Makino, Isobe, & Chan (2004) found that firm effects countmore in advanced economies than in poorer ones. Research ondemocracy and political stability shows that democracies havelower growth volatility (Quinn & Woolley, 2001; Mobarak,2005). According to Chan et al. (2008), variation is smaller inbetter-developed institutions because the latter constrain therange of legitimate strategic actions, and the outcomes of theseactions are more certain. Drawing upon these studies, we arguethat by providing a safer, more stable environment, goodgovernance should help firms maintain the level of theirprofitability. This does not mean that there will be no variationin firm profitability. Rather, the variation in profitabilitybecomes more and more due to firm- and industry-specificeffects than to the country specific effects (Makino et al., 2004).Thus, we hypothesize that:
H3 (:).Good governance has a negative relationship with the variation offirm profitability.
3. Methods
3.1. Sample and procedure
Our data come from two sources. The first is Jeune Afrique
(http://www.lintelligent.com), which publishes the list of the 500largest African companies based on their revenues. The data coverstwenty six (26) countries. Because not all companies report dataduring the entire period, we have an unbalanced panel. The datawas published in 2003 through 2006 issues of December, reflectingin reality the performance of companies in 2002–2005. It includesthree items: revenue, income, and employees. Because of missingvalues, we excluded the number of employees. We do not have2000 observations because some companies refuse to reportincome levels so that it is impossible to compute the dependentvariable for those companies.
3.2. Measures
3.2.1. Dependent variables
We used two dependent variable measures of firm performancenamely, firm profitability measured with return on sales (ROS),which is an accounting-based performance measures, andcompany risk. We calculated ROS as the ratio of income to sales.Although we have a limited number of performance indicators,prior studies have argued that return on Sales (ROS) is a superiormeasure in the global environment (Chan et al., 2008). We followChan et al. (2008) and adopt a measure of company risk thatcaptures the variation in ROS among companies within a countryin each year, rather than the variation in performance within a
company across years. More specifically, we measure risk asfollows:
Riskikt ¼ffiffiffiffiffiffiffiffiffiffiffiffiffiffiffiffiffiffiffiffiffiffiffiffiffiffiffiffiffiffiffiffiffiffiffiffiðROSikt � ROSikÞ2
q
where Riskikt refers to the risk of company i in country k and time t.It is the squared value of the deviation between the ROSikt (returnon sales of firm i of country kin the year t) and the mean countryROS in that same year ðROSikÞ. By looking at both the level of ROSand its variation over time, we should be able to examine bothsides of performance, which are risk and returns.
3.2.2. Independent variables
The Kaufman, Kraay, and Zoido-Lobotan (KKZ) index ongovernance has emerged as the leading index in the industry.The database developed by these authors is by far the mostcomplete of all, covering over 200 countries, and mobilizingvarious indices compiled by over 31 institutions. Kaufmann et al.(2006) organize the dimensions of good governance in three: (1)authority selection and replacement, (2) government capacity, and(3) the respect for the institutions that govern the interactions inthe society. The indicators are constructed using an unobservedcomponents methodology and presented in units ranging from�2.5 to +2.5, with higher values corresponding to bettergovernance outcomes.
Authority selection and replacement aspects concern the processby which those in authority are selected and replaced. This processis captured with the Voice and Accountability and PoliticalStability. Voice and accountability (VA) measures the extent towhich a country’s citizens are able to participate in selecting theirgovernment, as well as freedom of expression, freedom ofassociation, and free media. An increase in this indicator issupposed to reflect an improvement in the political process, civilliberties, and political rights, and consequently in country stability.Accountability is a key requirement of good governance. The moreaccountable to the public governments are the more transparentthey are and the lower the perceived business risk in the country.Political stability and absence of violence (PV) refer to theperceptions of the likelihood that the government will bedestabilized or overthrown by unconstitutional or violent means,including political violence and terrorism. An increase in this indexcaptures the idea that the likelihood of wrenching changes ingovernment is reduced.
Government capacity reflects the capacity of government toformulate and implement policies. There are two aspects in thegovernment capacity: the government effectiveness and theregulatory quality. Government effectiveness (GE) reflects thequality of public services, the quality of the civil service, and thedegree of its independence from political pressures, the quality ofpolicy formulation and implementation, and the credibility of thegovernment’s commitment to such policies. An increase in thisfactor would reflect the quality of public service provision, thequality of the bureaucracy, the competence of civil servants, theindependence of the civil service from political pressures, and thecredibility of the government’s commitment to policies. Regulato-ry quality (RQ) reflects the ability of the government to formulateand implement sound policies and regulations, which permit andpromote private sector development. It includes measures of theincidence of market-unfriendly policies such as price controls orinadequate bank supervision, as well as perceptions of the burdensimposed by excessive regulation in areas such as foreign trade andbusiness development.
Respect for the institutions governing interactions: The third set ofindicators concern the respect of citizens and institutionsgoverning interactions between individuals, organizations, andinstitutions. Control of corruption (CC) measures perceptions of
Ta
ble
1V
ari
ab
led
esc
rip
tio
n(m
ea
nv
alu
es)
.
Co
un
try
#o
f
ob
s.
GD
PE
thn
ic
fra
ctio
na
liza
tio
n
Fre
ed
om
of
tra
de
Cre
dit
reg
ula
tio
n
Vo
ice
an
d
acc
.
Po
liti
cal
sta
bil
ity
Go
v.
eff
ect
.
Re
gu
lato
r
qu
ali
ty
Co
ntr
ol
of
corr
up
tio
n
Ru
leo
f
law
Go
ve
rna
nce
RO
S
Alg
eri
a1
02
24
96
.57
00
.34
05
.50
04
.53
6�
0.9
74
�1
.49
6�
0.4
64
�0
.60
9�
0.5
52
�0
.67
0�
0.7
94
6.4
Be
nin
34
99
.61
00
.78
05
.13
38
.20
00
.36
30
.18
9�
0.4
76
�0
.60
1�
0.6
40
�0
.56
7�
0.2
89
0.1
Bo
tsw
an
a1
14
77
1.4
40
0.4
10
7.3
73
9.8
27
0.7
16
0.8
36
0.8
06
0.7
90
0.9
87
0.6
94
0.8
05
10
.0
Ca
me
roo
n1
21
10
06
.98
00
.86
05
.53
97
.06
1�
1.1
67
�0
.54
1�
0.7
25
�0
.76
4�
1.0
02
�1
.07
6�
0.8
79
5.1
Ga
bo
n4
94
71
0.2
40
.77
5.8
87
.30
�.6
75
.11
2�
.59
2�
.29
0�
.58
5�
.52
6�
0.4
26
1.8
4
Ivo
ryC
oa
st1
22
90
8.3
60
0.8
20
5.9
97
7.4
39
�1
.41
4�
2.2
46
�1
.16
9�
0.7
66
�1
.12
6�
1.4
10
�1
.35
52
.6
Eg
yp
t8
21
22
2.2
00
0.1
80
5.3
61
5.3
11
�1
.07
8�
0.8
12
�0
.27
9�
0.4
83
�0
.34
40
.00
7�
0.4
98
10
.2
Gh
an
a2
74
03
.19
00
.67
06
.92
67
.35
60
.38
30
.09
3�
0.1
54
�0
.20
7�
0.3
48
�0
.22
3�
0.0
76
2.1
Ke
ny
a4
44
43
.45
00
.86
86
.68
76
.07
8�
0.2
66
�1
.11
0�
0.7
18
�0
.29
9�
0.9
57
�1
.00
7�
0.7
26
3.4
Ma
da
ga
sca
r1
22
2.4
60
0.8
80
6.2
00
8.2
00
�0
.00
50
.18
0�
0.1
19
�0
.27
00
.00
2�
0.1
50
�0
.06
12
.9
Ma
li2
93
76
.82
00
.69
06
.39
37
.49
30
.34
6�
0.0
67
�0
.37
3�
0.4
05
�0
.30
5�
0.2
08
�0
.16
97
.9
Ma
uri
tiu
s1
08
51
22
.75
00
.46
06
.36
07
.27
60
.92
00
.86
10
.64
90
.40
70
.33
60
.85
80
.67
26
.2
Mo
rocc
o1
53
15
88
.95
00
.48
05
.60
87
.45
7�
0.6
40
�0
.39
1�
0.1
15
�0
.22
6�
0.0
71
�0
.03
6�
0.2
46
7.6
Mo
zam
biq
ue
53
28
.45
00
.69
06
.16
77
.23
3�
0.0
75
0.0
54
�0
.36
8�
0.5
42
�0
.72
1�
0.7
11
�0
.39
41
0.5
Na
mib
ia8
26
60
.73
00
.63
06
.52
59
.63
80
.36
10
.42
50
.12
90
.18
50
.07
40
.08
90
.21
11
0.6
Nig
eri
a1
25
59
3.6
00
0.8
50
6.6
34
7.5
43
�0
.70
2�
1.7
30
�0
.92
1�
1.1
82
�1
.27
1�
1.4
77
�1
.21
45
.2
Se
ne
ga
l4
66
71
.87
00
.69
06
.00
48
.31
30
.21
9�
0.2
40
�0
.18
1�
0.2
52
�0
.35
0�
0.2
36
�0
.17
36
.1
S.
Afr
ica
43
64
50
7.2
60
0.7
52
7.1
66
8.7
87
0.8
21
�0
.20
30
.73
50
.56
30
.42
60
.14
70
.41
57
.0
Tu
nis
ia1
01
28
14
.81
00
.04
06
.12
28
.07
0�
1.0
47
0.1
34
0.5
27
�0
.04
30
.26
10
.19
80
.00
5�
1.3
Ma
law
i4
16
4.8
20
0.6
70
6.2
25
5.1
75
�0
.48
1�
0.0
69
�0
.72
9�
0.4
59
�0
.87
0�
0.3
46
�0
.49
21
4.9
Za
mb
ia2
46
3.0
30
0.7
80
6.9
50
5.9
00
�0
.34
00
.03
4�
0.8
78
�0
.87
8�
0.8
14
�0
.61
1�
0.5
81
7.4
P.V. Ngobo, M. Fouda / Journal of World Business 47 (2012) 435–449440
corruption, defined as the exercise of public power for private gain.This indicator include various facets such as the frequency ofadditional payments to get things done, grand corruption in thepolitical arena, the tendency of elite forms to engage in ‘‘statecapture’’, etc. Rule of law (RL).Good governance requires fair legalsystems that provide full protection of human rights and anindependent judiciary, which assures an impartial enforcement oflaws. The variable ‘‘rule of law’’ measures the extent to whichagents have confidence in and abide by the rules of society, and inparticular the quality of contract enforcement, the police, and thecourts, as well as the likelihood of crime and violence.
3.2.3. Control variables
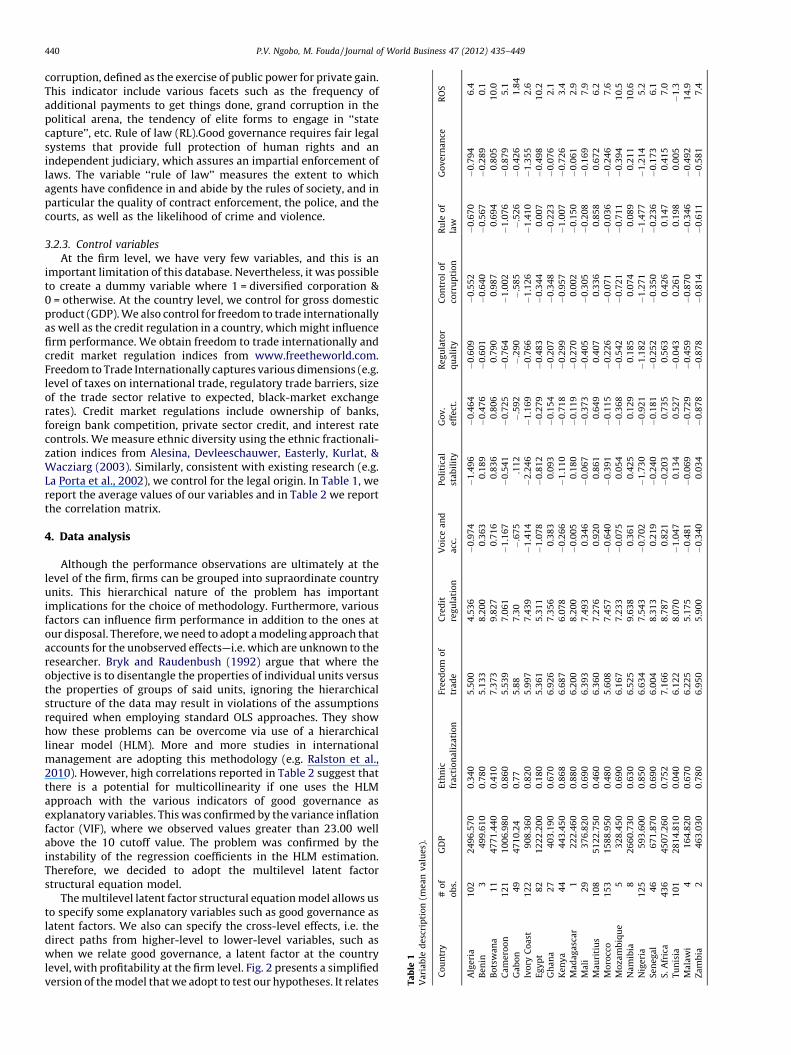
At the firm level, we have very few variables, and this is animportant limitation of this database. Nevertheless, it was possibleto create a dummy variable where 1 = diversified corporation &0 = otherwise. At the country level, we control for gross domesticproduct (GDP). We also control for freedom to trade internationallyas well as the credit regulation in a country, which might influencefirm performance. We obtain freedom to trade internationally andcredit market regulation indices from www.freetheworld.com.Freedom to Trade Internationally captures various dimensions (e.g.level of taxes on international trade, regulatory trade barriers, sizeof the trade sector relative to expected, black-market exchangerates). Credit market regulations include ownership of banks,foreign bank competition, private sector credit, and interest ratecontrols. We measure ethnic diversity using the ethnic fractionali-zation indices from Alesina, Devleeschauwer, Easterly, Kurlat, &Wacziarg (2003). Similarly, consistent with existing research (e.g.La Porta et al., 2002), we control for the legal origin. In Table 1, wereport the average values of our variables and in Table 2 we reportthe correlation matrix.
4. Data analysis
Although the performance observations are ultimately at thelevel of the firm, firms can be grouped into supraordinate countryunits. This hierarchical nature of the problem has importantimplications for the choice of methodology. Furthermore, variousfactors can influence firm performance in addition to the ones atour disposal. Therefore, we need to adopt a modeling approach thataccounts for the unobserved effects—i.e. which are unknown to theresearcher. Bryk and Raudenbush (1992) argue that where theobjective is to disentangle the properties of individual units versusthe properties of groups of said units, ignoring the hierarchicalstructure of the data may result in violations of the assumptionsrequired when employing standard OLS approaches. They showhow these problems can be overcome via use of a hierarchicallinear model (HLM). More and more studies in internationalmanagement are adopting this methodology (e.g. Ralston et al.,2010). However, high correlations reported in Table 2 suggest thatthere is a potential for multicollinearity if one uses the HLMapproach with the various indicators of good governance asexplanatory variables. This was confirmed by the variance inflationfactor (VIF), where we observed values greater than 23.00 wellabove the 10 cutoff value. The problem was confirmed by theinstability of the regression coefficients in the HLM estimation.Therefore, we decided to adopt the multilevel latent factorstructural equation model.
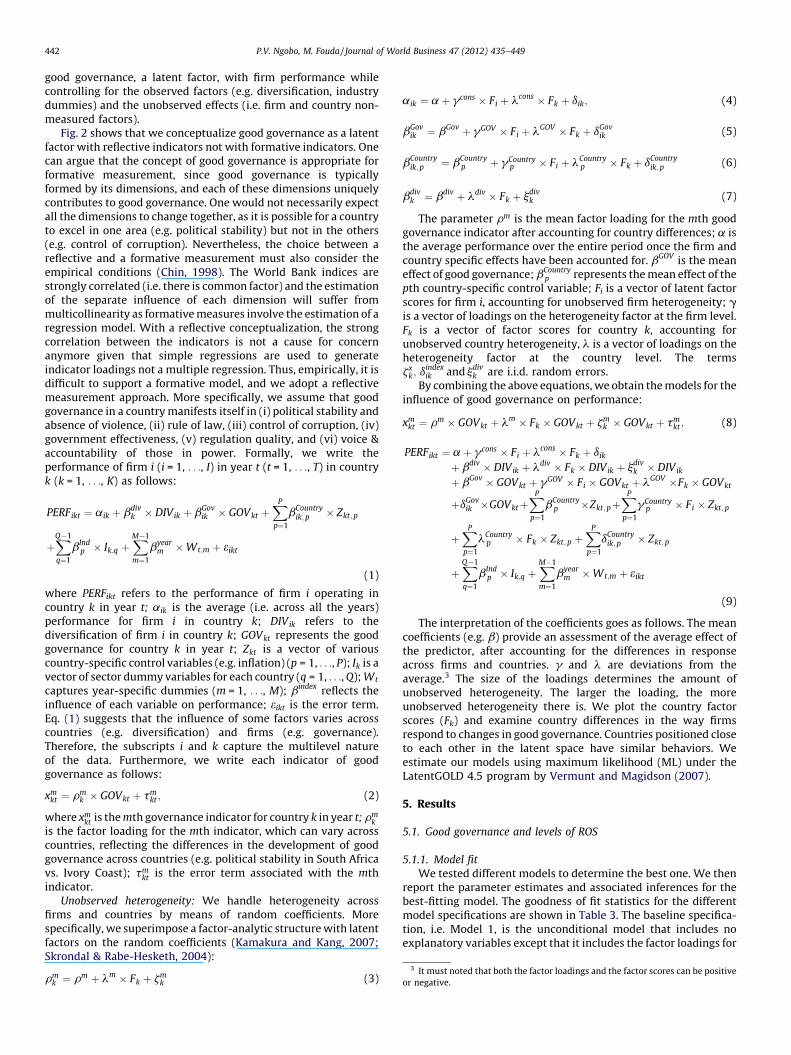
The multilevel latent factor structural equation model allows usto specify some explanatory variables such as good governance aslatent factors. We also can specify the cross-level effects, i.e. thedirect paths from higher-level to lower-level variables, such aswhen we relate good governance, a latent factor at the countrylevel, with profitability at the firm level. Fig. 2 presents a simplifiedversion of the model that we adopt to test our hypotheses. It relates
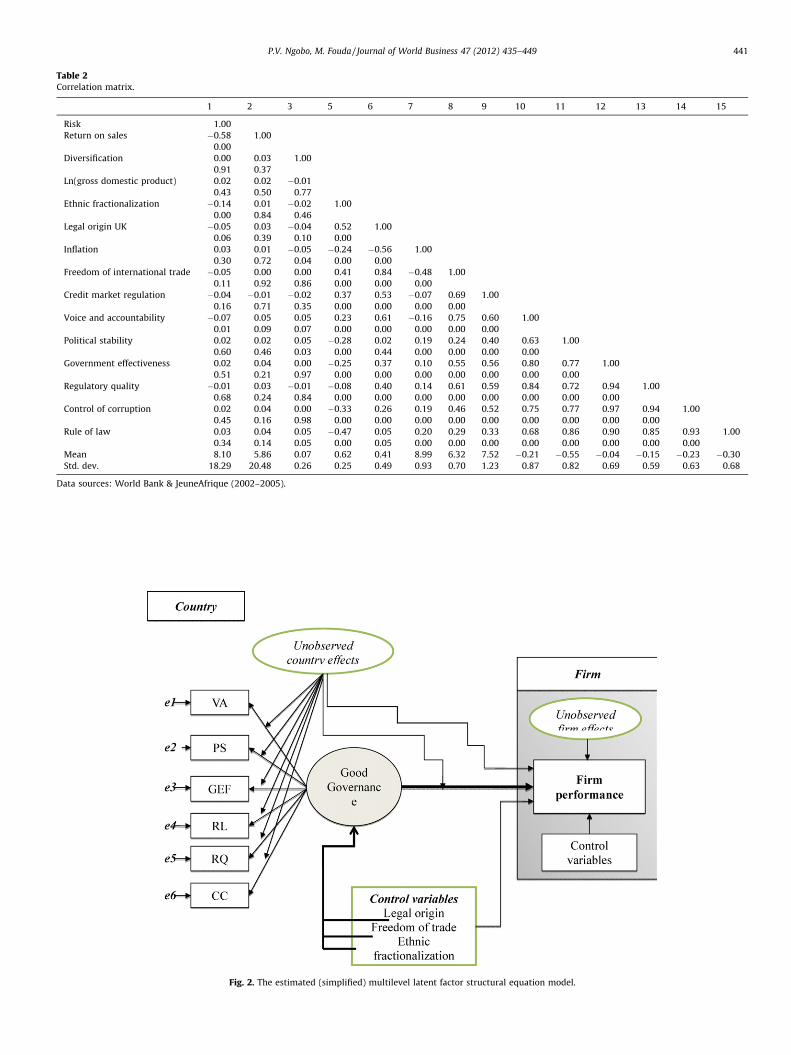
Table 2Correlation matrix.
1 2 3 5 6 7 8 9 10 11 12 13 14 15
Risk 1.00
Return on sales �0.58 1.00
0.00
Diversification 0.00 0.03 1.00
0.91 0.37
Ln(gross domestic product) 0.02 0.02 �0.01
0.43 0.50 0.77
Ethnic fractionalization �0.14 0.01 �0.02 1.00
0.00 0.84 0.46
Legal origin UK �0.05 0.03 �0.04 0.52 1.00
0.06 0.39 0.10 0.00
Inflation 0.03 0.01 �0.05 �0.24 �0.56 1.00
0.30 0.72 0.04 0.00 0.00
Freedom of international trade �0.05 0.00 0.00 0.41 0.84 �0.48 1.00
0.11 0.92 0.86 0.00 0.00 0.00
Credit market regulation �0.04 �0.01 �0.02 0.37 0.53 �0.07 0.69 1.00
0.16 0.71 0.35 0.00 0.00 0.00 0.00
Voice and accountability �0.07 0.05 0.05 0.23 0.61 �0.16 0.75 0.60 1.00
0.01 0.09 0.07 0.00 0.00 0.00 0.00 0.00
Political stability 0.02 0.02 0.05 �0.28 0.02 0.19 0.24 0.40 0.63 1.00
0.60 0.46 0.03 0.00 0.44 0.00 0.00 0.00 0.00
Government effectiveness 0.02 0.04 0.00 �0.25 0.37 0.10 0.55 0.56 0.80 0.77 1.00
0.51 0.21 0.97 0.00 0.00 0.00 0.00 0.00 0.00 0.00
Regulatory quality �0.01 0.03 �0.01 �0.08 0.40 0.14 0.61 0.59 0.84 0.72 0.94 1.00
0.68 0.24 0.84 0.00 0.00 0.00 0.00 0.00 0.00 0.00 0.00
Control of corruption 0.02 0.04 0.00 �0.33 0.26 0.19 0.46 0.52 0.75 0.77 0.97 0.94 1.00
0.45 0.16 0.98 0.00 0.00 0.00 0.00 0.00 0.00 0.00 0.00 0.00
Rule of law 0.03 0.04 0.05 �0.47 0.05 0.20 0.29 0.33 0.68 0.86 0.90 0.85 0.93 1.00
0.34 0.14 0.05 0.00 0.05 0.00 0.00 0.00 0.00 0.00 0.00 0.00 0.00
Mean 8.10 5.86 0.07 0.62 0.41 8.99 6.32 7.52 �0.21 �0.55 �0.04 �0.15 �0.23 �0.30
Std. dev. 18.29 20.48 0.26 0.25 0.49 0.93 0.70 1.23 0.87 0.82 0.69 0.59 0.63 0.68
Data sources: World Bank & JeuneAfrique (2002–2005).
Fig. 2. The estimated (simplified) multilevel latent factor structural equation model.
P.V. Ngobo, M. Fouda / Journal of World Business 47 (2012) 435–449 441
3 It must noted that both the factor loadings and the factor scores can be positive
or negative.
P.V. Ngobo, M. Fouda / Journal of World Business 47 (2012) 435–449442
good governance, a latent factor, with firm performance whilecontrolling for the observed factors (e.g. diversification, industrydummies) and the unobserved effects (i.e. firm and country non-measured factors).
Fig. 2 shows that we conceptualize good governance as a latentfactor with reflective indicators not with formative indicators. Onecan argue that the concept of good governance is appropriate forformative measurement, since good governance is typicallyformed by its dimensions, and each of these dimensions uniquelycontributes to good governance. One would not necessarily expectall the dimensions to change together, as it is possible for a countryto excel in one area (e.g. political stability) but not in the others(e.g. control of corruption). Nevertheless, the choice between areflective and a formative measurement must also consider theempirical conditions (Chin, 1998). The World Bank indices arestrongly correlated (i.e. there is common factor) and the estimationof the separate influence of each dimension will suffer frommulticollinearity as formative measures involve the estimation of aregression model. With a reflective conceptualization, the strongcorrelation between the indicators is not a cause for concernanymore given that simple regressions are used to generateindicator loadings not a multiple regression. Thus, empirically, it isdifficult to support a formative model, and we adopt a reflectivemeasurement approach. More specifically, we assume that goodgovernance in a country manifests itself in (i) political stability andabsence of violence, (ii) rule of law, (iii) control of corruption, (iv)government effectiveness, (v) regulation quality, and (vi) voice &accountability of those in power. Formally, we write theperformance of firm i (i = 1, . . ., I) in year t (t = 1, . . ., T) in countryk (k = 1, . . ., K) as follows:
PERFikt ¼ aik þ bdivk � DIVik þ bGov
ik � GOVkt þXP
p¼1
bCountryik; p � Zkt; p
þXQ�1
q¼1
bIndp � Ik;q þ
XM�1
m¼1
byearm � Wt;m þ eikt
(1)
where PERFikt refers to the performance of firm i operating incountry k in year t; aik is the average (i.e. across all the years)performance for firm i in country k; DIVik refers to thediversification of firm i in country k; GOVkt represents the goodgovernance for country k in year t; Zkt is a vector of variouscountry-specific control variables (e.g. inflation) (p = 1, . . ., P); Ik is avector of sector dummy variables for each country (q = 1, . . ., Q); Wt
captures year-specific dummies (m = 1, . . ., M); bindex reflects theinfluence of each variable on performance; eikt is the error term.Eq. (1) suggests that the influence of some factors varies acrosscountries (e.g. diversification) and firms (e.g. governance).Therefore, the subscripts i and k capture the multilevel natureof the data. Furthermore, we write each indicator of goodgovernance as follows:
xmkt ¼ rm
k � GOVkt þ tmkt ; (2)
where xmkt is the mth governance indicator for country k in year t; rm
k
is the factor loading for the mth indicator, which can vary acrosscountries, reflecting the differences in the development of goodgovernance across countries (e.g. political stability in South Africavs. Ivory Coast); tm
kt is the error term associated with the mthindicator.
Unobserved heterogeneity: We handle heterogeneity acrossfirms and countries by means of random coefficients. Morespecifically, we superimpose a factor-analytic structure with latentfactors on the random coefficients (Kamakura and Kang, 2007;Skrondal & Rabe-Hesketh, 2004):
rmk ¼ rm þ lm � Fk þ zm
k (3)
aik ¼ a þ gcons � Fi þ lcons � Fk þ dik; (4)
bGovik ¼ bGov þ gGOV � Fi þ lGOV � Fk þ dGov
ik (5)
bCountryik; p ¼ bCountry
p þ gCountryp � Fi þ lCountry
p � Fk þ dCountryik; p (6)
bdivk ¼ bdiv þ ldiv � Fk þ jdiv
k (7)
The parameter rm is the mean factor loading for the mth goodgovernance indicator after accounting for country differences; a isthe average performance over the entire period once the firm andcountry specific effects have been accounted for. bGOV
is the meaneffect of good governance; bCountry
p represents the mean effect of thepth country-specific control variable; Fi is a vector of latent factorscores for firm i, accounting for unobserved firm heterogeneity; gis a vector of loadings on the heterogeneity factor at the firm level.Fk is a vector of factor scores for country k, accounting forunobserved country heterogeneity, l is a vector of loadings on theheterogeneity factor at the country level. The termszx
k; dindexik and jdiv
k are i.i.d. random errors.By combining the above equations, we obtain the models for the
influence of good governance on performance:
xmkt ¼ rm � GOVkt þ lm � Fk � GOVkt þ zm
k � GOVkt þ tmkt ; (8)
PERFikt ¼ a þ gcons � Fi þ lcons � Fk þ dik
þ bdiv � DIVik þ ldiv � Fk � DIVik þ jdivk � DIVik
þ bGov � GOVkt þ gGOV � Fi � GOVkt þ lGOV �Fk � GOVkt
þdGovik �GOVktþ
XP
p¼1
bCountryp �Zkt; pþ
XP
p¼1
gCountryp � Fi � Zkt; p
þXP
p¼1
lCountryp � Fk � Zkt; p þ
XP
p¼1
dCountryik; p � Zkt; p
þXQ�1
q¼1
bIndp � Ik;q þ
XM�1
m¼1
byearm � Wt;m þ eikt
(9)
The interpretation of the coefficients goes as follows. The meancoefficients (e.g. b) provide an assessment of the average effect ofthe predictor, after accounting for the differences in responseacross firms and countries. g and l are deviations from theaverage.3 The size of the loadings determines the amount ofunobserved heterogeneity. The larger the loading, the moreunobserved heterogeneity there is. We plot the country factorscores (Fk) and examine country differences in the way firmsrespond to changes in good governance. Countries positioned closeto each other in the latent space have similar behaviors. Weestimate our models using maximum likelihood (ML) under theLatentGOLD 4.5 program by Vermunt and Magidson (2007).
5. Results
5.1. Good governance and levels of ROS
5.1.1. Model fit
We tested different models to determine the best one. We thenreport the parameter estimates and associated inferences for thebest-fitting model. The goodness of fit statistics for the differentmodel specifications are shown in Table 3. The baseline specifica-tion, i.e. Model 1, is the unconditional model that includes noexplanatory variables except that it includes the factor loadings for
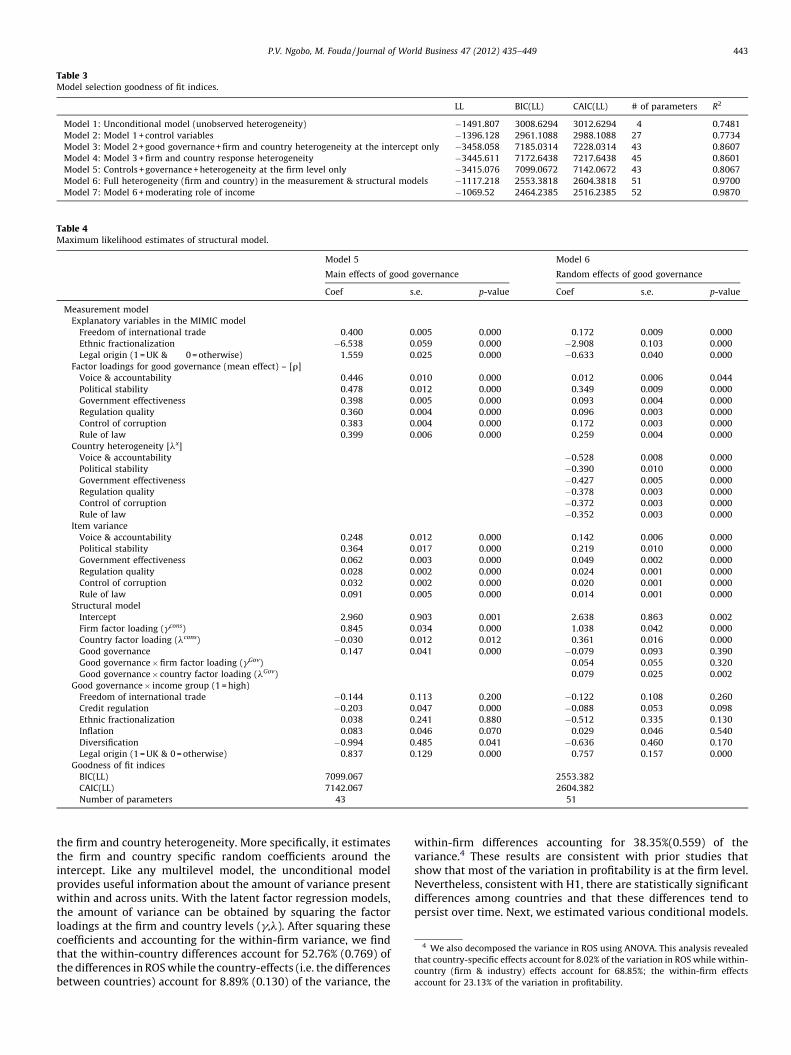
Table 3Model selection goodness of fit indices.
LL BIC(LL) CAIC(LL) # of parameters R2
Model 1: Unconditional model (unobserved heterogeneity) �1491.807 3008.6294 3012.6294 4 0.7481
Model 2: Model 1 + control variables �1396.128 2961.1088 2988.1088 27 0.7734
Model 3: Model 2 + good governance + firm and country heterogeneity at the intercept only �3458.058 7185.0314 7228.0314 43 0.8607
Model 4: Model 3 + firm and country response heterogeneity �3445.611 7172.6438 7217.6438 45 0.8601
Model 5: Controls + governance + heterogeneity at the firm level only �3415.076 7099.0672 7142.0672 43 0.8067
Model 6: Full heterogeneity (firm and country) in the measurement & structural models �1117.218 2553.3818 2604.3818 51 0.9700
Model 7: Model 6 + moderating role of income �1069.52 2464.2385 2516.2385 52 0.9870
Table 4Maximum likelihood estimates of structural model.
Model 5 Model 6
Main effects of good governance Random effects of good governance
Coef s.e. p-value Coef s.e. p-value
Measurement model
Explanatory variables in the MIMIC model
Freedom of international trade 0.400 0.005 0.000 0.172 0.009 0.000
Ethnic fractionalization �6.538 0.059 0.000 �2.908 0.103 0.000
Legal origin (1 = UK & 0 = otherwise) 1.559 0.025 0.000 �0.633 0.040 0.000
Factor loadings for good governance (mean effect) – [r]
Voice & accountability 0.446 0.010 0.000 0.012 0.006 0.044
Political stability 0.478 0.012 0.000 0.349 0.009 0.000
Government effectiveness 0.398 0.005 0.000 0.093 0.004 0.000
Regulation quality 0.360 0.004 0.000 0.096 0.003 0.000
Control of corruption 0.383 0.004 0.000 0.172 0.003 0.000
Rule of law 0.399 0.006 0.000 0.259 0.004 0.000
Country heterogeneity [lx]
Voice & accountability �0.528 0.008 0.000
Political stability �0.390 0.010 0.000
Government effectiveness �0.427 0.005 0.000
Regulation quality �0.378 0.003 0.000
Control of corruption �0.372 0.003 0.000
Rule of law �0.352 0.003 0.000
Item variance
Voice & accountability 0.248 0.012 0.000 0.142 0.006 0.000
Political stability 0.364 0.017 0.000 0.219 0.010 0.000
Government effectiveness 0.062 0.003 0.000 0.049 0.002 0.000
Regulation quality 0.028 0.002 0.000 0.024 0.001 0.000
Control of corruption 0.032 0.002 0.000 0.020 0.001 0.000
Rule of law 0.091 0.005 0.000 0.014 0.001 0.000
Structural model
Intercept 2.960 0.903 0.001 2.638 0.863 0.002
Firm factor loading (gcons) 0.845 0.034 0.000 1.038 0.042 0.000
Country factor loading (lcons) �0.030 0.012 0.012 0.361 0.016 0.000
Good governance 0.147 0.041 0.000 �0.079 0.093 0.390
Good governance � firm factor loading (gGov) 0.054 0.055 0.320
Good governance � country factor loading (lGov) 0.079 0.025 0.002
Good governance � income group (1 = high)
Freedom of international trade �0.144 0.113 0.200 �0.122 0.108 0.260
Credit regulation �0.203 0.047 0.000 �0.088 0.053 0.098
Ethnic fractionalization 0.038 0.241 0.880 �0.512 0.335 0.130
Inflation 0.083 0.046 0.070 0.029 0.046 0.540
Diversification �0.994 0.485 0.041 �0.636 0.460 0.170
Legal origin (1 = UK & 0 = otherwise) 0.837 0.129 0.000 0.757 0.157 0.000
Goodness of fit indices
BIC(LL) 7099.067 2553.382
CAIC(LL) 7142.067 2604.382
Number of parameters 43 51
4 We also decomposed the variance in ROS using ANOVA. This analysis revealed
that country-specific effects account for 8.02% of the variation in ROS while within-
country (firm & industry) effects account for 68.85%; the within-firm effects
account for 23.13% of the variation in profitability.
P.V. Ngobo, M. Fouda / Journal of World Business 47 (2012) 435–449 443
the firm and country heterogeneity. More specifically, it estimatesthe firm and country specific random coefficients around theintercept. Like any multilevel model, the unconditional modelprovides useful information about the amount of variance presentwithin and across units. With the latent factor regression models,the amount of variance can be obtained by squaring the factorloadings at the firm and country levels (g,l). After squaring thesecoefficients and accounting for the within-firm variance, we findthat the within-country differences account for 52.76% (0.769) ofthe differences in ROS while the country-effects (i.e. the differencesbetween countries) account for 8.89% (0.130) of the variance, the
within-firm differences accounting for 38.35%(0.559) of thevariance.4 These results are consistent with prior studies thatshow that most of the variation in profitability is at the firm level.Nevertheless, consistent with H1, there are statistically significantdifferences among countries and that these differences tend topersist over time. Next, we estimated various conditional models.
-2 -1.5 -1 -.5 0 .5 1 1.5 2Country Factor Loadings
MauritiusSouth Africa
GhanaKenya
MadagascarMali
MoroccoNamibiaSenegalTunisia
MozambiqueBenin
AlgeriaCameroon
Cote d'IvoireEgypt, Arab Rep.
GabonMalawi
NigerNigeriaZambia
Fig. 3. Country factor loadings.
P.V. Ngobo, M. Fouda / Journal of World Business 47 (2012) 435–449444
We use the Consistent Akaike’s Information Criterion (CAIC) andBayesian Information Criterion (BIC) to assess these specifications.In terms of the main effects of good governance, it appears thatModel 6 has a better fit than the other specifications. It explains97% of the variation in ROS. Parameter estimates for profitabilitymodel are shown in Table 4. We report both Model 5 and Model 6for comparison. We start by discussing the measurement modeland then discuss the structural model parameters.
5.1.2. Measurement model
Mean effects: Our results indicate that Model 6 fits the databetter than the other specifications. Therefore, we focus on thismodel. Looking at the measurement model for good governance(see Eq. (8)), we find that, on average (i.e. irrespective of thecountry), political stability (r = 0.0.349) has the largest loadingfollowed by rule of law (r = 0.259).5 Said differently, politicalstability and absence of violence are more important to goodgovernance than rule of law, control of corruption, and so on; goodgovernance manifests itself more in terms of political stability thanin terms of voice & accountability on average.
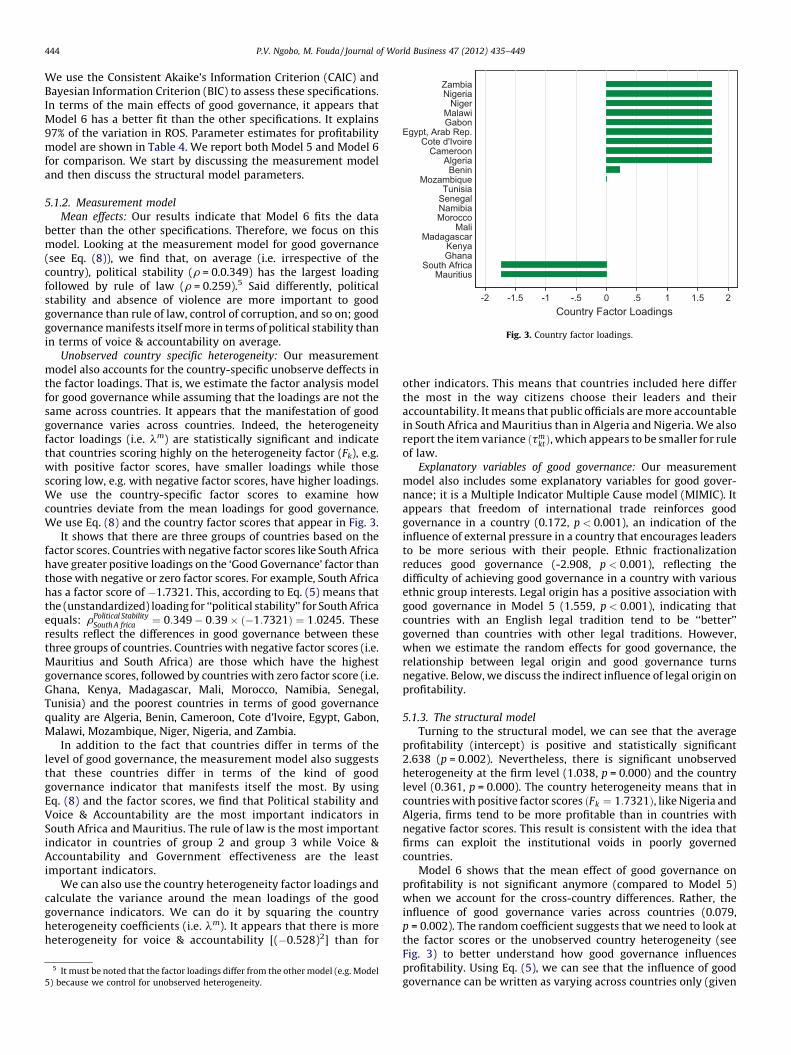
Unobserved country specific heterogeneity: Our measurementmodel also accounts for the country-specific unobserve deffects inthe factor loadings. That is, we estimate the factor analysis modelfor good governance while assuming that the loadings are not thesame across countries. It appears that the manifestation of goodgovernance varies across countries. Indeed, the heterogeneityfactor loadings (i.e. lm) are statistically significant and indicatethat countries scoring highly on the heterogeneity factor (Fk), e.g.with positive factor scores, have smaller loadings while thosescoring low, e.g. with negative factor scores, have higher loadings.We use the country-specific factor scores to examine howcountries deviate from the mean loadings for good governance.We use Eq. (8) and the country factor scores that appear in Fig. 3.
It shows that there are three groups of countries based on thefactor scores. Countries with negative factor scores like South Africahave greater positive loadings on the ‘Good Governance’ factor thanthose with negative or zero factor scores. For example, South Africahas a factor score of �1.7321. This, according to Eq. (5) means thatthe (unstandardized) loading for ‘‘political stability’’ for South Africaequals: rPolitical Stability
South A frica ¼ 0:349 � 0:39 � ð�1:7321Þ ¼ 1:0245. Theseresults reflect the differences in good governance between thesethree groups of countries. Countries with negative factor scores (i.e.Mauritius and South Africa) are those which have the highestgovernance scores, followed by countries with zero factor score (i.e.Ghana, Kenya, Madagascar, Mali, Morocco, Namibia, Senegal,Tunisia) and the poorest countries in terms of good governancequality are Algeria, Benin, Cameroon, Cote d’Ivoire, Egypt, Gabon,Malawi, Mozambique, Niger, Nigeria, and Zambia.
In addition to the fact that countries differ in terms of thelevel of good governance, the measurement model also suggeststhat these countries differ in terms of the kind of goodgovernance indicator that manifests itself the most. By usingEq. (8) and the factor scores, we find that Political stability andVoice & Accountability are the most important indicators inSouth Africa and Mauritius. The rule of law is the most importantindicator in countries of group 2 and group 3 while Voice &Accountability and Government effectiveness are the leastimportant indicators.
We can also use the country heterogeneity factor loadings andcalculate the variance around the mean loadings of the goodgovernance indicators. We can do it by squaring the countryheterogeneity coefficients (i.e. lm). It appears that there is moreheterogeneity for voice & accountability [(�0.528)2] than for
5 It must be noted that the factor loadings differ from the other model (e.g. Model
5) because we control for unobserved heterogeneity.
other indicators. This means that countries included here differthe most in the way citizens choose their leaders and theiraccountability. It means that public officials are more accountablein South Africa and Mauritius than in Algeria and Nigeria. We alsoreport the item variance ðtm
ktÞ, which appears to be smaller for ruleof law.
Explanatory variables of good governance: Our measurementmodel also includes some explanatory variables for good gover-nance; it is a Multiple Indicator Multiple Cause model (MIMIC). Itappears that freedom of international trade reinforces goodgovernance in a country (0.172, p < 0.001), an indication of theinfluence of external pressure in a country that encourages leadersto be more serious with their people. Ethnic fractionalizationreduces good governance (-2.908, p < 0.001), reflecting thedifficulty of achieving good governance in a country with variousethnic group interests. Legal origin has a positive association withgood governance in Model 5 (1.559, p < 0.001), indicating thatcountries with an English legal tradition tend to be ‘‘better’’governed than countries with other legal traditions. However,when we estimate the random effects for good governance, therelationship between legal origin and good governance turnsnegative. Below, we discuss the indirect influence of legal origin onprofitability.
5.1.3. The structural model
Turning to the structural model, we can see that the averageprofitability (intercept) is positive and statistically significant2.638 (p = 0.002). Nevertheless, there is significant unobservedheterogeneity at the firm level (1.038, p = 0.000) and the countrylevel (0.361, p = 0.000). The country heterogeneity means that incountries with positive factor scores ðFk ¼ 1:7321Þ, like Nigeria andAlgeria, firms tend to be more profitable than in countries withnegative factor scores. This result is consistent with the idea thatfirms can exploit the institutional voids in poorly governedcountries.
Model 6 shows that the mean effect of good governance onprofitability is not significant anymore (compared to Model 5)when we account for the cross-country differences. Rather, theinfluence of good governance varies across countries (0.079,p = 0.002). The random coefficient suggests that we need to look atthe factor scores or the unobserved country heterogeneity (seeFig. 3) to better understand how good governance influencesprofitability. Using Eq. (5), we can see that the influence of goodgovernance can be written as varying across countries only (given
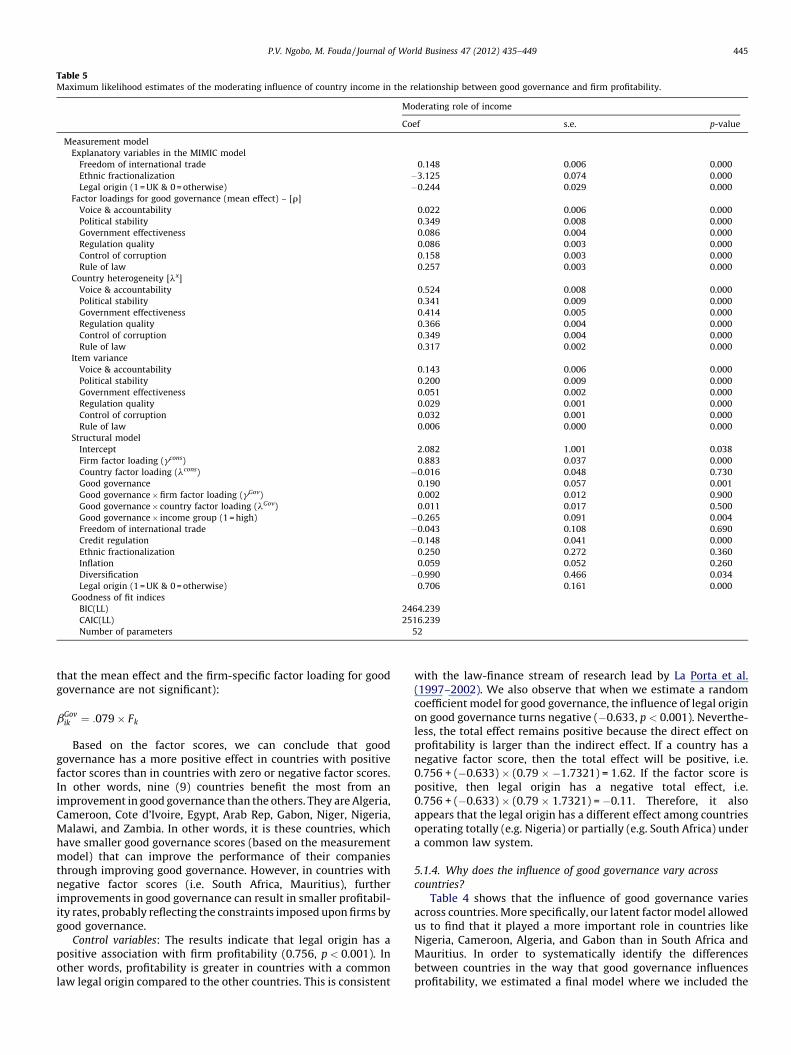
Table 5Maximum likelihood estimates of the moderating influence of country income in the relationship between good governance and firm profitability.
Moderating role of income
Coef s.e. p-value
Measurement model
Explanatory variables in the MIMIC model
Freedom of international trade 0.148 0.006 0.000
Ethnic fractionalization �3.125 0.074 0.000
Legal origin (1 = UK & 0 = otherwise) �0.244 0.029 0.000
Factor loadings for good governance (mean effect) – [r]
Voice & accountability 0.022 0.006 0.000
Political stability 0.349 0.008 0.000
Government effectiveness 0.086 0.004 0.000
Regulation quality 0.086 0.003 0.000
Control of corruption 0.158 0.003 0.000
Rule of law 0.257 0.003 0.000
Country heterogeneity [lx]
Voice & accountability 0.524 0.008 0.000
Political stability 0.341 0.009 0.000
Government effectiveness 0.414 0.005 0.000
Regulation quality 0.366 0.004 0.000
Control of corruption 0.349 0.004 0.000
Rule of law 0.317 0.002 0.000
Item variance
Voice & accountability 0.143 0.006 0.000
Political stability 0.200 0.009 0.000
Government effectiveness 0.051 0.002 0.000
Regulation quality 0.029 0.001 0.000
Control of corruption 0.032 0.001 0.000
Rule of law 0.006 0.000 0.000
Structural model
Intercept 2.082 1.001 0.038
Firm factor loading (gcons) 0.883 0.037 0.000
Country factor loading (lcons) �0.016 0.048 0.730
Good governance 0.190 0.057 0.001
Good governance � firm factor loading (gGov) 0.002 0.012 0.900
Good governance � country factor loading (lGov) 0.011 0.017 0.500
Good governance � income group (1 = high) �0.265 0.091 0.004
Freedom of international trade �0.043 0.108 0.690
Credit regulation �0.148 0.041 0.000
Ethnic fractionalization 0.250 0.272 0.360
Inflation 0.059 0.052 0.260
Diversification �0.990 0.466 0.034
Legal origin (1 = UK & 0 = otherwise) 0.706 0.161 0.000
Goodness of fit indices
BIC(LL) 2464.239
CAIC(LL) 2516.239
Number of parameters 52
P.V. Ngobo, M. Fouda / Journal of World Business 47 (2012) 435–449 445
that the mean effect and the firm-specific factor loading for goodgovernance are not significant):
bGovik ¼ :079 � Fk
Based on the factor scores, we can conclude that goodgovernance has a more positive effect in countries with positivefactor scores than in countries with zero or negative factor scores.In other words, nine (9) countries benefit the most from animprovement in good governance than the others. They are Algeria,Cameroon, Cote d’Ivoire, Egypt, Arab Rep, Gabon, Niger, Nigeria,Malawi, and Zambia. In other words, it is these countries, whichhave smaller good governance scores (based on the measurementmodel) that can improve the performance of their companiesthrough improving good governance. However, in countries withnegative factor scores (i.e. South Africa, Mauritius), furtherimprovements in good governance can result in smaller profitabil-ity rates, probably reflecting the constraints imposed upon firms bygood governance.
Control variables: The results indicate that legal origin has apositive association with firm profitability (0.756, p < 0.001). Inother words, profitability is greater in countries with a commonlaw legal origin compared to the other countries. This is consistent
with the law-finance stream of research lead by La Porta et al.(1997–2002). We also observe that when we estimate a randomcoefficient model for good governance, the influence of legal originon good governance turns negative (�0.633, p < 0.001). Neverthe-less, the total effect remains positive because the direct effect onprofitability is larger than the indirect effect. If a country has anegative factor score, then the total effect will be positive, i.e.0.756 + (�0.633) � (0.79 � �1.7321) = 1.62. If the factor score ispositive, then legal origin has a negative total effect, i.e.0.756 + (�0.633) � (0.79 � 1.7321) = �0.11. Therefore, it alsoappears that the legal origin has a different effect among countriesoperating totally (e.g. Nigeria) or partially (e.g. South Africa) undera common law system.
5.1.4. Why does the influence of good governance vary across
countries?
Table 4 shows that the influence of good governance variesacross countries. More specifically, our latent factor model allowedus to find that it played a more important role in countries likeNigeria, Cameroon, Algeria, and Gabon than in South Africa andMauritius. In order to systematically identify the differencesbetween countries in the way that good governance influencesprofitability, we estimated a final model where we included the
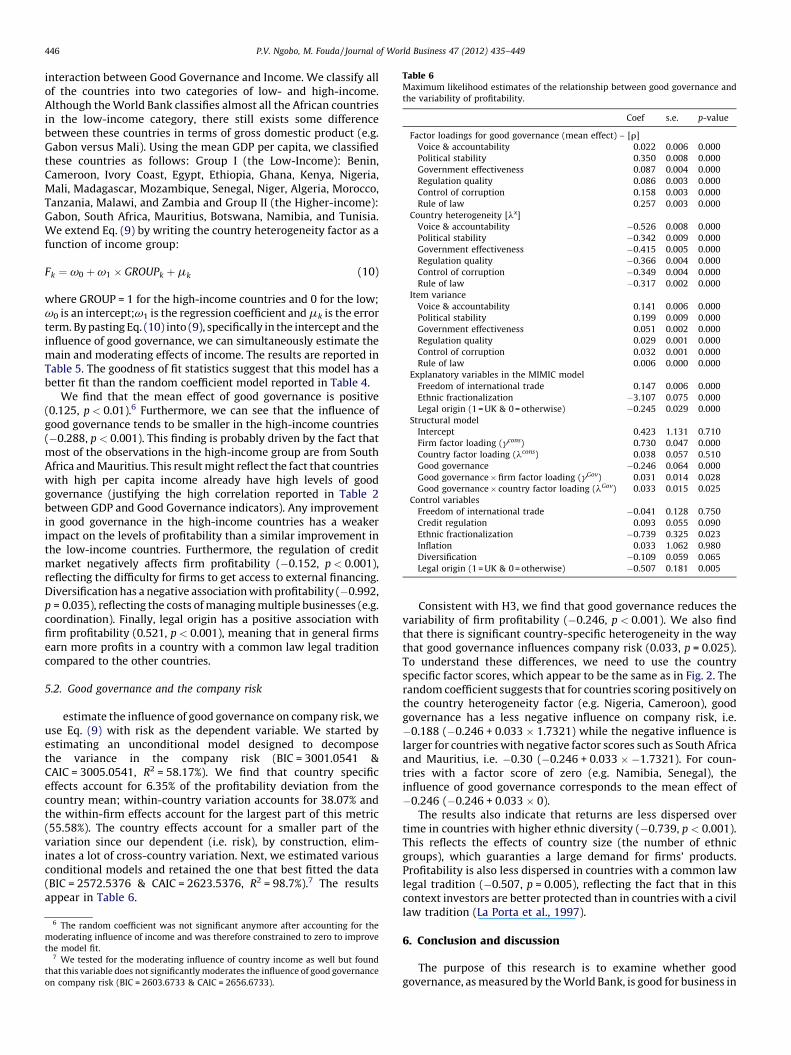
Table 6Maximum likelihood estimates of the relationship between good governance and
the variability of profitability.
Coef s.e. p-value
Factor loadings for good governance (mean effect) – [r]
Voice & accountability 0.022 0.006 0.000
Political stability 0.350 0.008 0.000
Government effectiveness 0.087 0.004 0.000
Regulation quality 0.086 0.003 0.000
Control of corruption 0.158 0.003 0.000
Rule of law 0.257 0.003 0.000
Country heterogeneity [lx]
Voice & accountability �0.526 0.008 0.000
Political stability �0.342 0.009 0.000
Government effectiveness �0.415 0.005 0.000
Regulation quality �0.366 0.004 0.000
Control of corruption �0.349 0.004 0.000
Rule of law �0.317 0.002 0.000
Item variance
Voice & accountability 0.141 0.006 0.000
Political stability 0.199 0.009 0.000
Government effectiveness 0.051 0.002 0.000
Regulation quality 0.029 0.001 0.000
Control of corruption 0.032 0.001 0.000
Rule of law 0.006 0.000 0.000
Explanatory variables in the MIMIC model
Freedom of international trade 0.147 0.006 0.000
Ethnic fractionalization �3.107 0.075 0.000
Legal origin (1 = UK & 0 = otherwise) �0.245 0.029 0.000
Structural model
Intercept 0.423 1.131 0.710
Firm factor loading (gcons) 0.730 0.047 0.000
Country factor loading (lcons) 0.038 0.057 0.510
Good governance �0.246 0.064 0.000
Good governance � firm factor loading (gGov) 0.031 0.014 0.028
Good governance � country factor loading (lGov) 0.033 0.015 0.025
Control variables
Freedom of international trade �0.041 0.128 0.750
Credit regulation 0.093 0.055 0.090
Ethnic fractionalization �0.739 0.325 0.023
Inflation 0.033 1.062 0.980
Diversification �0.109 0.059 0.065
Legal origin (1 = UK & 0 = otherwise) �0.507 0.181 0.005
P.V. Ngobo, M. Fouda / Journal of World Business 47 (2012) 435–449446
interaction between Good Governance and Income. We classify allof the countries into two categories of low- and high-income.Although the World Bank classifies almost all the African countriesin the low-income category, there still exists some differencebetween these countries in terms of gross domestic product (e.g.Gabon versus Mali). Using the mean GDP per capita, we classifiedthese countries as follows: Group I (the Low-Income): Benin,Cameroon, Ivory Coast, Egypt, Ethiopia, Ghana, Kenya, Nigeria,Mali, Madagascar, Mozambique, Senegal, Niger, Algeria, Morocco,Tanzania, Malawi, and Zambia and Group II (the Higher-income):Gabon, South Africa, Mauritius, Botswana, Namibia, and Tunisia.We extend Eq. (9) by writing the country heterogeneity factor as afunction of income group:
Fk ¼ v0 þ v1 � GROUPk þ mk (10)
where GROUP = 1 for the high-income countries and 0 for the low;v0 is an intercept;v1 is the regression coefficient and mk is the errorterm. By pasting Eq. (10) into (9), specifically in the intercept and theinfluence of good governance, we can simultaneously estimate themain and moderating effects of income. The results are reported inTable 5. The goodness of fit statistics suggest that this model has abetter fit than the random coefficient model reported in Table 4.
We find that the mean effect of good governance is positive(0.125, p < 0.01).6 Furthermore, we can see that the influence ofgood governance tends to be smaller in the high-income countries(�0.288, p < 0.001). This finding is probably driven by the fact thatmost of the observations in the high-income group are from SouthAfrica and Mauritius. This result might reflect the fact that countrieswith high per capita income already have high levels of goodgovernance (justifying the high correlation reported in Table 2between GDP and Good Governance indicators). Any improvementin good governance in the high-income countries has a weakerimpact on the levels of profitability than a similar improvement inthe low-income countries. Furthermore, the regulation of creditmarket negatively affects firm profitability (�0.152, p < 0.001),reflecting the difficulty for firms to get access to external financing.Diversification has a negative association with profitability (�0.992,p = 0.035), reflecting the costs of managing multiple businesses (e.g.coordination). Finally, legal origin has a positive association withfirm profitability (0.521, p < 0.001), meaning that in general firmsearn more profits in a country with a common law legal traditioncompared to the other countries.
5.2. Good governance and the company risk
estimate the influence of good governance on company risk, weuse Eq. (9) with risk as the dependent variable. We started byestimating an unconditional model designed to decomposethe variance in the company risk (BIC = 3001.0541 &CAIC = 3005.0541, R2 = 58.17%). We find that country specificeffects account for 6.35% of the profitability deviation from thecountry mean; within-country variation accounts for 38.07% andthe within-firm effects account for the largest part of this metric(55.58%). The country effects account for a smaller part of thevariation since our dependent (i.e. risk), by construction, elim-inates a lot of cross-country variation. Next, we estimated variousconditional models and retained the one that best fitted the data(BIC = 2572.5376 & CAIC = 2623.5376, R2 = 98.7%).7 The resultsappear in Table 6.
6 The random coefficient was not significant anymore after accounting for the
moderating influence of income and was therefore constrained to zero to improve
the model fit.7 We tested for the moderating influence of country income as well but found
that this variable does not significantly moderates the influence of good governance
on company risk (BIC = 2603.6733 & CAIC = 2656.6733).
Consistent with H3, we find that good governance reduces thevariability of firm profitability (�0.246, p < 0.001). We also findthat there is significant country-specific heterogeneity in the waythat good governance influences company risk (0.033, p = 0.025).To understand these differences, we need to use the countryspecific factor scores, which appear to be the same as in Fig. 2. Therandom coefficient suggests that for countries scoring positively onthe country heterogeneity factor (e.g. Nigeria, Cameroon), goodgovernance has a less negative influence on company risk, i.e.�0.188 (�0.246 + 0.033 � 1.7321) while the negative influence islarger for countries with negative factor scores such as South Africaand Mauritius, i.e. �0.30 (�0.246 + 0.033 � �1.7321). For coun-tries with a factor score of zero (e.g. Namibia, Senegal), theinfluence of good governance corresponds to the mean effect of�0.246 (�0.246 + 0.033 � 0).
The results also indicate that returns are less dispersed overtime in countries with higher ethnic diversity (�0.739, p < 0.001).This reflects the effects of country size (the number of ethnicgroups), which guaranties a large demand for firms’ products.Profitability is also less dispersed in countries with a common lawlegal tradition (�0.507, p = 0.005), reflecting the fact that in thiscontext investors are better protected than in countries with a civillaw tradition (La Porta et al., 1997).
6. Conclusion and discussion
The purpose of this research is to examine whether goodgovernance, as measured by the World Bank, is good for business in
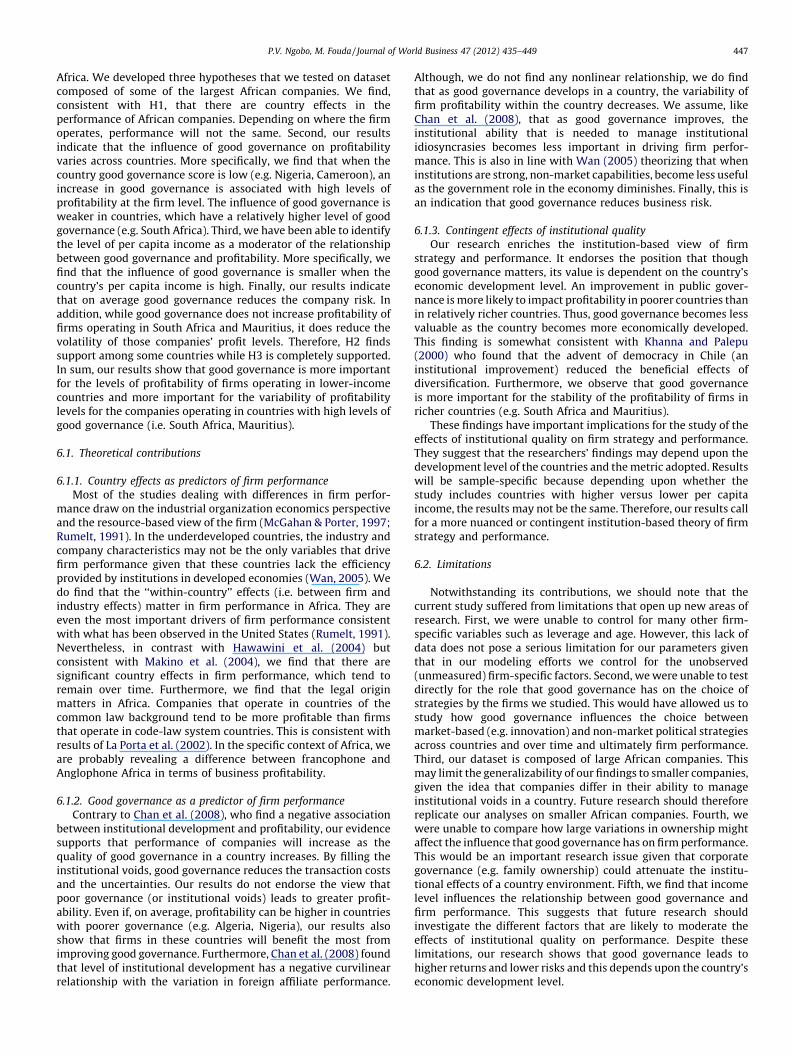
P.V. Ngobo, M. Fouda / Journal of World Business 47 (2012) 435–449 447
Africa. We developed three hypotheses that we tested on datasetcomposed of some of the largest African companies. We find,consistent with H1, that there are country effects in theperformance of African companies. Depending on where the firmoperates, performance will not the same. Second, our resultsindicate that the influence of good governance on profitabilityvaries across countries. More specifically, we find that when thecountry good governance score is low (e.g. Nigeria, Cameroon), anincrease in good governance is associated with high levels ofprofitability at the firm level. The influence of good governance isweaker in countries, which have a relatively higher level of goodgovernance (e.g. South Africa). Third, we have been able to identifythe level of per capita income as a moderator of the relationshipbetween good governance and profitability. More specifically, wefind that the influence of good governance is smaller when thecountry’s per capita income is high. Finally, our results indicatethat on average good governance reduces the company risk. Inaddition, while good governance does not increase profitability offirms operating in South Africa and Mauritius, it does reduce thevolatility of those companies’ profit levels. Therefore, H2 findssupport among some countries while H3 is completely supported.In sum, our results show that good governance is more importantfor the levels of profitability of firms operating in lower-incomecountries and more important for the variability of profitabilitylevels for the companies operating in countries with high levels ofgood governance (i.e. South Africa, Mauritius).
6.1. Theoretical contributions
6.1.1. Country effects as predictors of firm performance
Most of the studies dealing with differences in firm perfor-mance draw on the industrial organization economics perspectiveand the resource-based view of the firm (McGahan & Porter, 1997;Rumelt, 1991). In the underdeveloped countries, the industry andcompany characteristics may not be the only variables that drivefirm performance given that these countries lack the efficiencyprovided by institutions in developed economies (Wan, 2005). Wedo find that the ‘‘within-country’’ effects (i.e. between firm andindustry effects) matter in firm performance in Africa. They areeven the most important drivers of firm performance consistentwith what has been observed in the United States (Rumelt, 1991).Nevertheless, in contrast with Hawawini et al. (2004) butconsistent with Makino et al. (2004), we find that there aresignificant country effects in firm performance, which tend toremain over time. Furthermore, we find that the legal originmatters in Africa. Companies that operate in countries of thecommon law background tend to be more profitable than firmsthat operate in code-law system countries. This is consistent withresults of La Porta et al. (2002). In the specific context of Africa, weare probably revealing a difference between francophone andAnglophone Africa in terms of business profitability.
6.1.2. Good governance as a predictor of firm performance
Contrary to Chan et al. (2008), who find a negative associationbetween institutional development and profitability, our evidencesupports that performance of companies will increase as thequality of good governance in a country increases. By filling theinstitutional voids, good governance reduces the transaction costsand the uncertainties. Our results do not endorse the view thatpoor governance (or institutional voids) leads to greater profit-ability. Even if, on average, profitability can be higher in countrieswith poorer governance (e.g. Algeria, Nigeria), our results alsoshow that firms in these countries will benefit the most fromimproving good governance. Furthermore, Chan et al. (2008) foundthat level of institutional development has a negative curvilinearrelationship with the variation in foreign affiliate performance.
Although, we do not find any nonlinear relationship, we do findthat as good governance develops in a country, the variability offirm profitability within the country decreases. We assume, likeChan et al. (2008), that as good governance improves, theinstitutional ability that is needed to manage institutionalidiosyncrasies becomes less important in driving firm perfor-mance. This is also in line with Wan (2005) theorizing that wheninstitutions are strong, non-market capabilities, become less usefulas the government role in the economy diminishes. Finally, this isan indication that good governance reduces business risk.
6.1.3. Contingent effects of institutional quality
Our research enriches the institution-based view of firmstrategy and performance. It endorses the position that thoughgood governance matters, its value is dependent on the country’seconomic development level. An improvement in public gover-nance is more likely to impact profitability in poorer countries thanin relatively richer countries. Thus, good governance becomes lessvaluable as the country becomes more economically developed.This finding is somewhat consistent with Khanna and Palepu(2000) who found that the advent of democracy in Chile (aninstitutional improvement) reduced the beneficial effects ofdiversification. Furthermore, we observe that good governanceis more important for the stability of the profitability of firms inricher countries (e.g. South Africa and Mauritius).
These findings have important implications for the study of theeffects of institutional quality on firm strategy and performance.They suggest that the researchers’ findings may depend upon thedevelopment level of the countries and the metric adopted. Resultswill be sample-specific because depending upon whether thestudy includes countries with higher versus lower per capitaincome, the results may not be the same. Therefore, our results callfor a more nuanced or contingent institution-based theory of firmstrategy and performance.
6.2. Limitations
Notwithstanding its contributions, we should note that thecurrent study suffered from limitations that open up new areas ofresearch. First, we were unable to control for many other firm-specific variables such as leverage and age. However, this lack ofdata does not pose a serious limitation for our parameters giventhat in our modeling efforts we control for the unobserved(unmeasured) firm-specific factors. Second, we were unable to testdirectly for the role that good governance has on the choice ofstrategies by the firms we studied. This would have allowed us tostudy how good governance influences the choice betweenmarket-based (e.g. innovation) and non-market political strategiesacross countries and over time and ultimately firm performance.Third, our dataset is composed of large African companies. Thismay limit the generalizability of our findings to smaller companies,given the idea that companies differ in their ability to manageinstitutional voids in a country. Future research should thereforereplicate our analyses on smaller African companies. Fourth, wewere unable to compare how large variations in ownership mightaffect the influence that good governance has on firm performance.This would be an important research issue given that corporategovernance (e.g. family ownership) could attenuate the institu-tional effects of a country environment. Fifth, we find that incomelevel influences the relationship between good governance andfirm performance. This suggests that future research shouldinvestigate the different factors that are likely to moderate theeffects of institutional quality on performance. Despite theselimitations, our research shows that good governance leads tohigher returns and lower risks and this depends upon the country’seconomic development level.
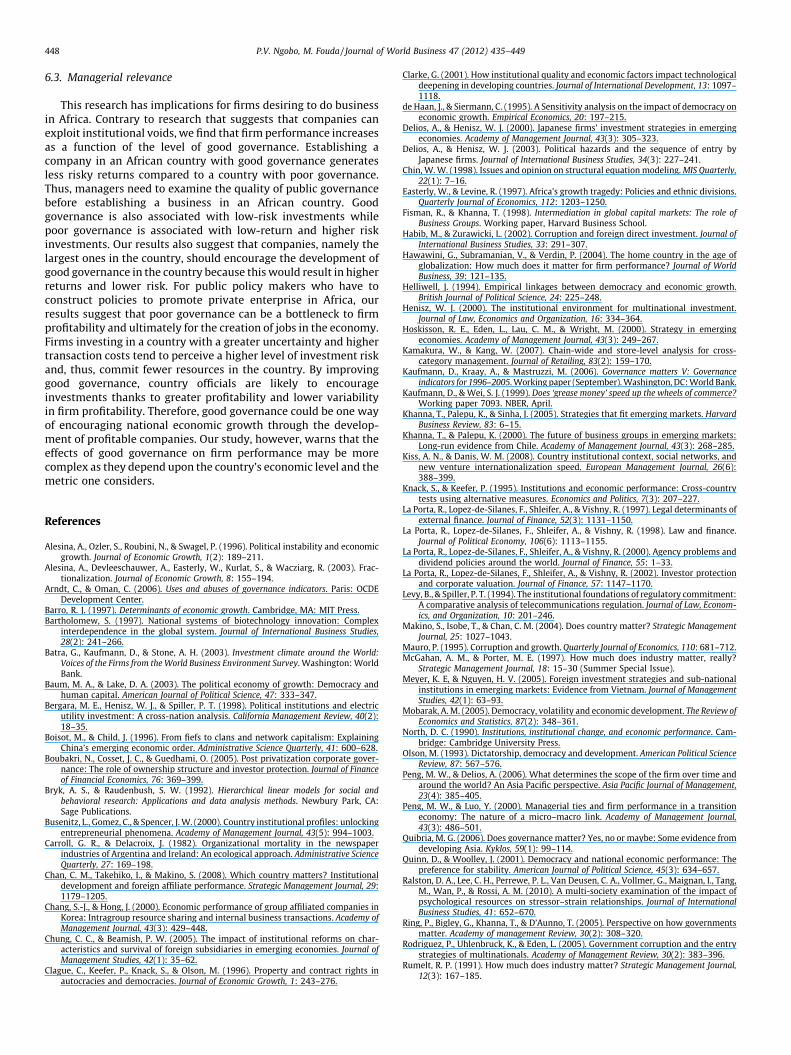
P.V. Ngobo, M. Fouda / Journal of World Business 47 (2012) 435–449448
6.3. Managerial relevance
This research has implications for firms desiring to do businessin Africa. Contrary to research that suggests that companies canexploit institutional voids, we find that firm performance increasesas a function of the level of good governance. Establishing acompany in an African country with good governance generatesless risky returns compared to a country with poor governance.Thus, managers need to examine the quality of public governancebefore establishing a business in an African country. Goodgovernance is also associated with low-risk investments whilepoor governance is associated with low-return and higher riskinvestments. Our results also suggest that companies, namely thelargest ones in the country, should encourage the development ofgood governance in the country because this would result in higherreturns and lower risk. For public policy makers who have toconstruct policies to promote private enterprise in Africa, ourresults suggest that poor governance can be a bottleneck to firmprofitability and ultimately for the creation of jobs in the economy.Firms investing in a country with a greater uncertainty and highertransaction costs tend to perceive a higher level of investment riskand, thus, commit fewer resources in the country. By improvinggood governance, country officials are likely to encourageinvestments thanks to greater profitability and lower variabilityin firm profitability. Therefore, good governance could be one wayof encouraging national economic growth through the develop-ment of profitable companies. Our study, however, warns that theeffects of good governance on firm performance may be morecomplex as they depend upon the country’s economic level and themetric one considers.
References
Alesina, A., Ozler, S., Roubini, N., & Swagel, P. (1996). Political instability and economicgrowth. Journal of Economic Growth, 1(2): 189–211.
Alesina, A., Devleeschauwer, A., Easterly, W., Kurlat, S., & Wacziarg, R. (2003). Frac-tionalization. Journal of Economic Growth, 8: 155–194.
Arndt, C., & Oman, C. (2006). Uses and abuses of governance indicators. Paris: OCDEDevelopment Center.
Barro, R. J. (1997). Determinants of economic growth. Cambridge, MA: MIT Press.Bartholomew, S. (1997). National systems of biotechnology innovation: Complex
interdependence in the global system. Journal of International Business Studies,28(2): 241–266.
Batra, G., Kaufmann, D., & Stone, A. H. (2003). Investment climate around the World:Voices of the Firms from the World Business Environment Survey. Washington: WorldBank.
Baum, M. A., & Lake, D. A. (2003). The political economy of growth: Democracy andhuman capital. American Journal of Political Science, 47: 333–347.
Bergara, M. E., Henisz, W. J., & Spiller, P. T. (1998). Political institutions and electricutility investment: A cross-nation analysis. California Management Review, 40(2):18–35.
Boisot, M., & Child, J. (1996). From fiefs to clans and network capitalism: ExplainingChina’s emerging economic order. Administrative Science Quarterly, 41: 600–628.
Boubakri, N., Cosset, J. C., & Guedhami, O. (2005). Post privatization corporate gover-nance: The role of ownership structure and investor protection. Journal of Financeof Financial Economics, 76: 369–399.
Bryk, A. S., & Raudenbush, S. W. (1992). Hierarchical linear models for social andbehavioral research: Applications and data analysis methods. Newbury Park, CA:Sage Publications.
Busenitz, L., Gomez, C., & Spencer, J. W. (2000). Country institutional profiles: unlockingentrepreneurial phenomena. Academy of Management Journal, 43(5): 994–1003.
Carroll, G. R., & Delacroix, J. (1982). Organizational mortality in the newspaperindustries of Argentina and Ireland: An ecological approach. Administrative ScienceQuarterly, 27: 169–198.
Chan, C. M., Takehiko, I., & Makino, S. (2008). Which country matters? Institutionaldevelopment and foreign affiliate performance. Strategic Management Journal, 29:1179–1205.
Chang, S.-J., & Hong, J. (2000). Economic performance of group affiliated companies inKorea: Intragroup resource sharing and internal business transactions. Academy ofManagement Journal, 43(3): 429–448.
Chung, C. C., & Beamish, P. W. (2005). The impact of institutional reforms on char-acteristics and survival of foreign subsidiaries in emerging economies. Journal ofManagement Studies, 42(1): 35–62.
Clague, C., Keefer, P., Knack, S., & Olson, M. (1996). Property and contract rights inautocracies and democracies. Journal of Economic Growth, 1: 243–276.
Clarke, G. (2001). How institutional quality and economic factors impact technologicaldeepening in developing countries. Journal of International Development, 13: 1097–1118.
de Haan, J., & Siermann, C. (1995). A Sensitivity analysis on the impact of democracy oneconomic growth. Empirical Economics, 20: 197–215.
Delios, A., & Henisz, W. J. (2000). Japanese firms’ investment strategies in emergingeconomies. Academy of Management Journal, 43(3): 305–323.
Delios, A., & Henisz, W. J. (2003). Political hazards and the sequence of entry byJapanese firms. Journal of International Business Studies, 34(3): 227–241.
Chin, W. W. (1998). Issues and opinion on structural equation modeling. MIS Quarterly,22(1): 7–16.
Easterly, W., & Levine, R. (1997). Africa’s growth tragedy: Policies and ethnic divisions.Quarterly Journal of Economics, 112: 1203–1250.
Fisman, R., & Khanna, T. (1998). Intermediation in global capital markets: The role ofBusiness Groups. Working paper, Harvard Business School.
Habib, M., & Zurawicki, L. (2002). Corruption and foreign direct investment. Journal ofInternational Business Studies, 33: 291–307.
Hawawini, G., Subramanian, V., & Verdin, P. (2004). The home country in the age ofglobalization: How much does it matter for firm performance? Journal of WorldBusiness, 39: 121–135.
Helliwell, J. (1994). Empirical linkages between democracy and economic growth.British Journal of Political Science, 24: 225–248.
Henisz, W. J. (2000). The institutional environment for multinational investment.Journal of Law, Economics and Organization, 16: 334–364.
Hoskisson, R. E., Eden, L., Lau, C. M., & Wright, M. (2000). Strategy in emergingeconomies. Academy of Management Journal, 43(3): 249–267.
Kamakura, W., & Kang, W. (2007). Chain-wide and store-level analysis for cross-category management. Journal of Retailing, 83(2): 159–170.
Kaufmann, D., Kraay, A., & Mastruzzi, M. (2006). Governance matters V: Governanceindicators for 1996–2005. Working paper (September). Washington, DC: World Bank.
Kaufmann, D., & Wei, S. J. (1999). Does ‘grease money’ speed up the wheels of commerce?Working paper 7093. NBER, April.
Khanna, T., Palepu, K., & Sinha, J. (2005). Strategies that fit emerging markets. HarvardBusiness Review, 83: 6–15.
Khanna, T., & Palepu, K. (2000). The future of business groups in emerging markets:Long-run evidence from Chile. Academy of Management Journal, 43(3): 268–285.
Kiss, A. N., & Danis, W. M. (2008). Country institutional context, social networks, andnew venture internationalization speed. European Management Journal, 26(6):388–399.
Knack, S., & Keefer, P. (1995). Institutions and economic performance: Cross-countrytests using alternative measures. Economics and Politics, 7(3): 207–227.
La Porta, R., Lopez-de-Silanes, F., Shleifer, A., & Vishny, R. (1997). Legal determinants ofexternal finance. Journal of Finance, 52(3): 1131–1150.
La Porta, R., Lopez-de-Silanes, F., Shleifer, A., & Vishny, R. (1998). Law and finance.Journal of Political Economy, 106(6): 1113–1155.
La Porta, R., Lopez-de-Silanes, F., Shleifer, A., & Vishny, R. (2000). Agency problems anddividend policies around the world. Journal of Finance, 55: 1–33.
La Porta, R., Lopez-de-Silanes, F., Shleifer, A., & Vishny, R. (2002). Investor protectionand corporate valuation. Journal of Finance, 57: 1147–1170.
Levy, B., & Spiller, P. T. (1994). The institutional foundations of regulatory commitment:A comparative analysis of telecommunications regulation. Journal of Law, Econom-ics, and Organization, 10: 201–246.
Makino, S., Isobe, T., & Chan, C. M. (2004). Does country matter? Strategic ManagementJournal, 25: 1027–1043.
Mauro, P. (1995). Corruption and growth. Quarterly Journal of Economics, 110: 681–712.McGahan, A. M., & Porter, M. E. (1997). How much does industry matter, really?
Strategic Management Journal, 18: 15–30 (Summer Special Issue).Meyer, K. E, & Nguyen, H. V. (2005). Foreign investment strategies and sub-national
institutions in emerging markets: Evidence from Vietnam. Journal of ManagementStudies, 42(1): 63–93.
Mobarak, A. M. (2005). Democracy, volatility and economic development. The Review ofEconomics and Statistics, 87(2): 348–361.
North, D. C. (1990). Institutions, institutional change, and economic performance. Cam-bridge: Cambridge University Press.
Olson, M. (1993). Dictatorship, democracy and development. American Political ScienceReview, 87: 567–576.
Peng, M. W., & Delios, A. (2006). What determines the scope of the firm over time andaround the world? An Asia Pacific perspective. Asia Pacific Journal of Management,23(4): 385–405.
Peng, M. W., & Luo, Y. (2000). Managerial ties and firm performance in a transitioneconomy: The nature of a micro–macro link. Academy of Management Journal,43(3): 486–501.
Quibria, M. G. (2006). Does governance matter? Yes, no or maybe: Some evidence fromdeveloping Asia. Kyklos, 59(1): 99–114.
Quinn, D., & Woolley, J. (2001). Democracy and national economic performance: Thepreference for stability. American Journal of Political Science, 45(3): 634–657.
Ralston, D. A., Lee, C. H., Perrewe, P. L., Van Deusen, C. A., Vollmer, G., Maignan, I., Tang,M., Wan, P., & Rossi, A. M. (2010). A multi-society examination of the impact ofpsychological resources on stressor–strain relationships. Journal of InternationalBusiness Studies, 41: 652–670.
Ring, P., Bigley, G., Khanna, T., & D’Aunno, T. (2005). Perspective on how governmentsmatter. Academy of management Review, 30(2): 308–320.
Rodriguez, P., Uhlenbruck, K., & Eden, L. (2005). Government corruption and the entrystrategies of multinationals. Academy of Management Review, 30(2): 383–396.
Rumelt, R. P. (1991). How much does industry matter? Strategic Management Journal,12(3): 167–185.

P.V. Ngobo, M. Fouda / Journal of World Business 47 (2012) 435–449 449
Skrondal, A., & Rabe-Hesketh, S. (2004). Generalized latent variable modeling: Multilevel,longitudinal, and structural equation models. Boca Raton, FL: Chapman & Hall/CRC.
Tanzi, V. (1998). Corruption around the world: causes, consequences, scope, and cures.Working paper No. 98/63. Washington, DC: International Monetary Fund.
Uhlenbruck, K., Rodriguez, P., Doh, J., & Eden, L. (2006). The impact of corruption onentry strategy: Evidence from telecommunication projects in emerging economies.Organization Science, 17(3): 402–414.
Vermunt J. K., & Magidson, J. (2007). User’s manual and technical guide for LG-Syntax—thesyntax module for latent GOLD and LG choice 4.5. Statistical Innovations USA.
Wan, W. P., & Hoskisson, R. (2003). Home country environments, corporate diversifi-cation strategies, and firm performance. Academy of Management Journal, 46(1):27–45.
Wan, W. P. (2005). Country resource environments, firm capabilities, and corporatediversification strategies. Journal of Management Studies, 42(1): 161–182.