
Antipoverty Transfers and Labour Force Participation Effects

Optimizing bulk data transfers using network
measurements: a practical case
A. Ciuffoletti
Dept of Computer Science - Pisa - Italy
S. Pardi
INFN-Napoli Section - Italy
L. Merola, F. Palmieri, G. Russo
Universita degli Studi di Napoli Federico II Complesso di M.S. Angelo Via Cintia - Napoli
November 10, 2008
Abstract
The quality of the connectivity provided by the network infrastructureof a Grid is a crucial factor to guarantee the accessibility of Grid services,schedulate efficiently processing and data transfer activity on the Grid andmeet QoS expectations. Yet most Grid application do not take into con-sideration the expected performance of the network resources they planto use. In this paper we describe the effective use of a Grid Monitor-ing framework, whose measurements are used to introduce netwrok aware
features in a legacy application.We use GlueDomains, a network monitoring framework oriented to
Grid infrastructures that measures a small (although possibly extensi-ble) set of network parameters. Such framework works off the shelf withminimal administrative effort, is reliable, and has a negligible impact onsystem operation. The deployment covers a Metropolitan Grid infras-tructure, aimed at supporting a data intensive eScience application. Wedescribe a real use case consisting of bulk data trasfers during the opera-tion of the Grid for the Virgo experiment.
1 Introduction and motivation
In the recent past Grid computing has introduced several improvements as re-garding the software and the implementation of new algorithms, thus creatinga stabler and more performant environment. So that, in the current state, theabsence of a network management strategy appears to be one of the primarylimits to improve the QoS level.
Considering the impact of quality of service issues, network performance canaffect dramatically the job computation time in those applications that processlarge quantities of remote data, and is crucial whenever an application requires
1

data replication. Moreover, a degraded connectivity may cause job failures, asin the case of an application scheduled in a short queue on processing resources,or if unexpected latencies cause timeout events.
Currently, in the main Grid deployments the network resource is consideredas pure facility and the middleware components act agnostically with respectto network performance parameters, for instance during job scheduling, datatransfer, and data replica process. This situation is justified by the challengesintroduced by the introduction of network reservation policies in heterogeneousand distributed environment, and also by the absence of a simple and functionalnetwork monitoring framework.
In essence, if we introduce an abstract view of a Grid as the integration ofcomputational, storage and network resources, the lack of information aboutnetwork performance brings the overall system to work globally below the besteffort threshold.
In this paper we describe an experiment, consisting in introducing network
awareness in a simple data transfer application, using network measurementsobtained from GlueDomains [6], a network monitoring framework created tosupport middleware services. GlueDomains offers a set of measurements usefulfor general operations, and we want to investigate their use for bandwith perfor-mance previsions. It is composed of a software environment for data producerand consumer, a basic set of measurements tools and an information model fordata representation. GlueDomains proposes a simple and modular environment,very easy to deploy and configure, which can be easely expanded with custommeasurement tools. The framework has been integrated in the INFN-GRIDmiddleware (based on LCG-gLite) and deployed in a real testbed on the SCoPEGrid Infrastructure [12].
The rest of this article is organized as follow: in the next section we presentthe applicative context and some use cases and middleware services that cantake advantage of the availability of network information. Next we summarizethe concepts and tools underlaying the GlueDomains framework, introducingthe information model used for the publication of the performed measurements.Finally we present the GlueDomains integration in the INFN-GRID middlewareand the testbed as deployed: the architecture, the physical and logical topologyand the available measurements.
2 The need for network measurements
The LHC experiments of high energy physisc, as ATLAS[1], or CMS[2], aredominated by a enormous data acquisition rate. The CMS[3], for instance, plansto manage an event rate of 100Hz, corresponding to a data rate of 100MB/s thatmust be analyzed. An other example is the Virgo Experiment for grativationalwaves detection [4] that is caracterized by a data acquisiton rate of 10MB/s24h for day[8], that must be analysed and replicated on geographical scale fromexperiment Tier 0 to Tier 1, and to Tier 2 upon request.
The peculiar requirements that caracterize this kind of applications are chal-
2

lenging the the Grid development community to improve the middleware com-ponent in order do be network aware. Such feature is often discussed in lit-erature with reference to meta-scheduling algorithms [11, 15, 9]. The relatedworks propose new resource brokering strategies that consider availability ofcomputational, storage and network resources, whose target is the optimizationof appropriate cost estimators.
Another interesting topic is related with replica optimization. File catalogservices like LFC [7] represent with a logical name a set of physical file locations,in order to select the more convenient replica when needed. Many strategies areproposed [14, 10, 5] that aim to improve the use of the file catalog services byquantifying network costs.
All the above experiences confirm the favorable impact of network awareness
in Grid system, but the successful application of such paradigm relies on theavailability of network measurements; a specialized infrastructure is required,that provides information about netwrok performance. In the next section weintroduce GlueDomains, and motivate its adoption as a network monitoringframework.
3 The GlueDomains network monitoring archi-
tecture
Schematically, these are the reasons why the GlueDomains network monitoringinfrastructure fits our scenario:
a. it has an extremely low footprint on deployed system resources;
b. it requires the introduction of a limited number of functionalities;
c. it is easy to deploy;
d. its scalability matches the present and future sizes of our system;
e. it works unattended for long periods of time, and is fault tolerant;
f. it can be easely reconfigured, for instance in case of join of a new sensor;
g. it can be adapted introducing custom network monitoring tools and pub-lication engines.
The above points will be motivated in the course of the following summaryof GlueDomains architecture.
The network monitoring layout consists of a partitioning of the networkmonitoring end-points (hereafter the Edge Services) into Domains: this signif-icantly contributes to its scalability (point (d) above). Such partitioning takesinto account the fact that monitoring will in fact aggregate and report domain-
to-domain measurements: therefore domains should be designed so to includeedge points that have a uniform connectivity with the rest of the network. Such
3

assumption significantly simplifies the design of the network monitoring lay-out, while matching a wide range of use cases simply considering a DNS baseddomain partitioning.
Network monitoring is carried out through a number of network monitoringtools, whose location ensures that collected network measurements are signifi-cant; the hosts that support the activity of network monitoring tools are calledTheodolites. One simplifying hypotheses is that they are co-located with oneof the Edge Services in each Domain. Such option is valid since the networkmonitoring activity has a low footprint, and reduces the number of hardwaredevices dedicated to network monitoring (see point (b) above).
New tools can be easely added to those shipped with the GlueDomains pack-age: one simply needs to create a new Perl class wrapping the tool in such a waythat data are packaged in a hash that complies with an internal schema, derivedfrom OGF Network Monitoring Working Group ones (see point (g) above).
The activity of the theodolites is coordinated by a centralized database : eachtheodolite periodically fetches the description of its activity from the database,possibly modifying its activity. The overall activity of the network monitor-ing infrastructure is represented by a number of network monitoring sessions.The UML description of a session is outlined in figure 1, and is rooted on theTheodolite.
Each Theodolite is composed of several monitoring Sessions subclassedinto Periodic and OnDemand. The attributes of Periodic and On demand
sessions allow the control of the monitoring activity: tool specific configurationsare an attribute of a Session.
Note that each session addresses an instance of a tool running on the theodo-lite: unlike other more complex network monitoring architectures, we do notindicate the result of the monitoring activity, but its operational description.
The reconfiguration of the whole monitoring infrastructure does not needhuman intervention on theodolites, and is carried out simply uploading a newcontent in the database (see point (f above). For the same reason, the deploy-ment of the network monitoring infrastructure is straightforward: the adminis-trator of a theodolite that wants to join the monitoring infrastructure installsthe package, and obtains the credentials that the theodolite will use to fetch thedescription of its activity (see point (c) above).
The task of the designer of the network monitoring activity is simplified bythe provision of a tool that uses XML definitions of the monitoring tasks of eachtheodolite in order to maintain the MySQL database (see point (f) above).
Database updates are considered infrequent events, typically related to achange in the membership of theodolites. The database server offers a webservice interface to the theodolites, in order to make the access to the databasemore flexible and is therefore transparent to the technology used to implementthe database (see point (g) above). Fault tolerance features of the theodolitecope with transient failures of the server (see point (e) above).
The software component that manages the data transfer to the publicationengine is another pluggable entity: data are presented to that plugin as Perlpacked data on a pipe. The plugin is in charge to flush the pipe periodically
4

Figure 1: The UML diagram of the monitoring database
5

and forward the data to the publication engine of choice. Thus the theodolite,per se, has a very low footprint, since it does not support any complex operationor storage on collected data (see point (a) above). The plugin should operateaccording to the same principles.
In figure 2 we sketch a functional view according to the above description:
• the topology database, that stores and makes available to users the de-scription of the Grid partitioning (e.g. which Domain contains a certaincomputing service);
• the monitoring database, that describes the planned monitoring activityin the Grid;
• the production engine, that stores and makes available the characteristicsof Grid services and fabric (e.g., packet loss rate between computing andstorage services);
• the producers, the Theodolites, that query the monitoring database andthe topology database to configure their network monitoring activity. Ob-servations are published through the production engine;
• the consumers, that find the domain they belong to, as well as those ofother services of interest, querying the topology database. Observationsare retrieved using the production engine.
As explained above, GlueDomains architecture is somewhat open: only theinterface of some of its components is in fact specified.
In order to adapt such architecture to our purposes, we had to customizethe three pluggable components: monitoring database, tools, and publicationengine.
As for the monitoring database we reused an existing implementation basedon a MySQL database. Although such database might be replicated, mainlyfor performance reasons, the scale of our experiment did not justify databasereplication.
The domain database is implemented using a set of rules that extract thedomain from the DNS. Therefore there is not a real database, but a set of agreedsyntactical rules.
We used GridICE for data publication, an MDS based tool extensively usedin the INFN network. Therefore we reused the plugin implemented for thedeployment of GlueDomains over part of the INFN network.
In figure 3 we see the relationships between the various software module,distributed on three physical entities: the database, the theodolite, and thepublication engine.
According with such modular approach, the architecture of the network mon-
itoring host is divided into a GlueDomains part, and an MDS specific part: infigure 3 they are separated by a dotted line, the GlueDomains part being on theleft side.
The GlueDomains side is composed of a hierarchy of processes:
6

Figure 2: Modular architecture of a GIS: dashed lines represent read-only access
GlueDomains is a daemon process that controls the whole monitoring activ-ity of the host. It spawns the processes that implement the theodolite
services. The description of the theodolite services is obtained queryingthe monitoring database hosted by the GlueDomains server, each time atheodolite service is spawned. The query returns the list of all theodoliteservices that are associated with any of the IP addresses of the host.
Theodolite is a process that implements a theodolite service. It spawns —and re-spawns when needed — all monitoring sessions associated witha theodolite service. The description of all sessions associated with thetheodolite service is retrieved from the monitoring database. The identifierof the monitored Network Service is retrieved from the Topology Database,given the identifier of the theodolite and of the target associated with thesession. The theodolite may interact with the GIS adapter to initialize thepublication of the observations for those Network Services.
Session is a process that implements a monitoring session. All parameters thatconfigure a specific session are passed from the theodolite process, so thatthe session should not need to access the monitoring or topology databases.The session interacts with the GIS adapter to record the observations inthe production engine.
We distinguish two kinds of controls structures for a session:
• a periodic control, like the usual pinger;
7

Figure 3: Prototype architecture (with MDS adapter)
8
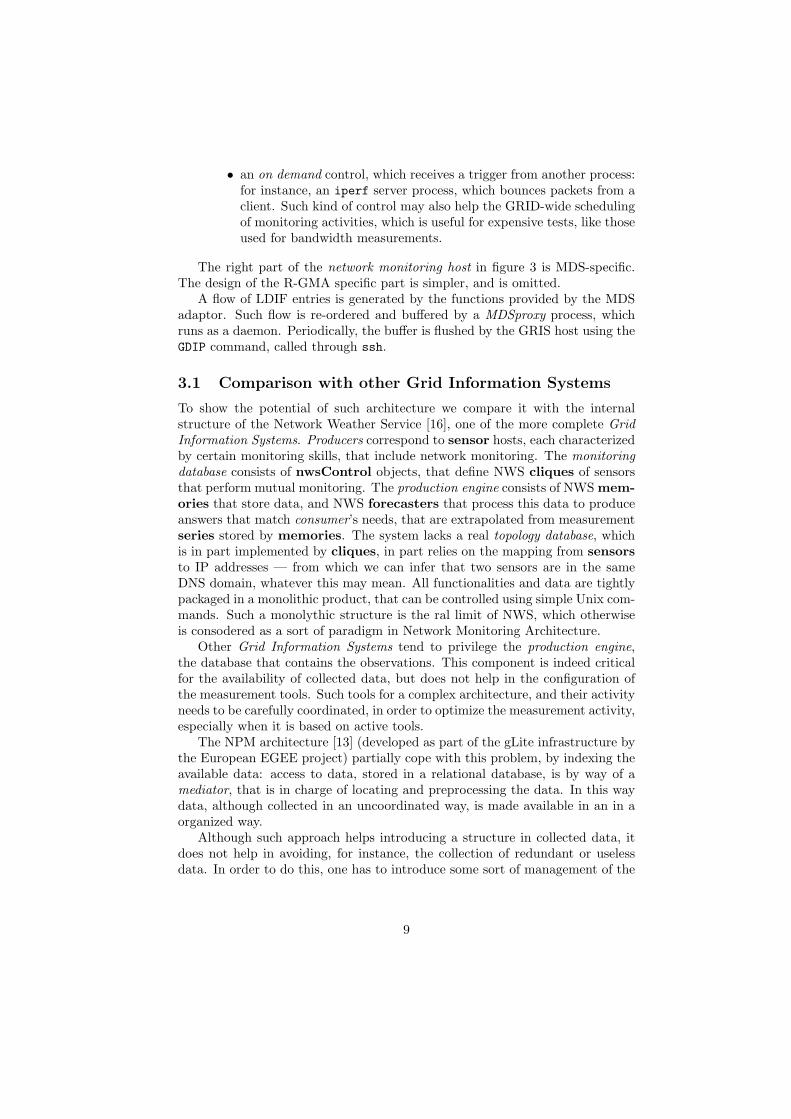
• an on demand control, which receives a trigger from another process:for instance, an iperf server process, which bounces packets from aclient. Such kind of control may also help the GRID-wide schedulingof monitoring activities, which is useful for expensive tests, like thoseused for bandwidth measurements.
The right part of the network monitoring host in figure 3 is MDS-specific.The design of the R-GMA specific part is simpler, and is omitted.
A flow of LDIF entries is generated by the functions provided by the MDSadaptor. Such flow is re-ordered and buffered by a MDSproxy process, whichruns as a daemon. Periodically, the buffer is flushed by the GRIS host using theGDIP command, called through ssh.
3.1 Comparison with other Grid Information Systems
To show the potential of such architecture we compare it with the internalstructure of the Network Weather Service [16], one of the more complete Grid
Information Systems. Producers correspond to sensor hosts, each characterizedby certain monitoring skills, that include network monitoring. The monitoring
database consists of nwsControl objects, that define NWS cliques of sensorsthat perform mutual monitoring. The production engine consists of NWSmem-
ories that store data, and NWS forecasters that process this data to produceanswers that match consumer’s needs, that are extrapolated from measurementseries stored by memories. The system lacks a real topology database, whichis in part implemented by cliques, in part relies on the mapping from sensors
to IP addresses — from which we can infer that two sensors are in the sameDNS domain, whatever this may mean. All functionalities and data are tightlypackaged in a monolithic product, that can be controlled using simple Unix com-mands. Such a monolythic structure is the ral limit of NWS, which otherwiseis consodered as a sort of paradigm in Network Monitoring Architecture.
Other Grid Information Systems tend to privilege the production engine,the database that contains the observations. This component is indeed criticalfor the availability of collected data, but does not help in the configuration ofthe measurement tools. Such tools for a complex architecture, and their activityneeds to be carefully coordinated, in order to optimize the measurement activity,especially when it is based on active tools.
The NPM architecture [13] (developed as part of the gLite infrastructure bythe European EGEE project) partially cope with this problem, by indexing theavailable data: access to data, stored in a relational database, is by way of amediator, that is in charge of locating and preprocessing the data. In this waydata, although collected in an uncoordinated way, is made available in an in aorganized way.
Although such approach helps introducing a structure in collected data, itdoes not help in avoiding, for instance, the collection of redundant or uselessdata. In order to do this, one has to introduce some sort of management of the
9

Figure 4: At left the current fiber optic MAN ring of the University FedericoII. In the rigth picture a map of the city of Naples with the main SCoPEsites. In green the departments not still connected at the Federico II netowrkinfrastructure
overall monitoring activity. The NWS architecture introduces a specialized com-ponent to this purpose, that exactly represents such functionality EXPLAIN.
The GlueDomains server reproduces a similar function, although its designimproves performance and reliability with respect to the the NWS XXXX. Wesummarized he functionality of the server at page 4.
One distinguishing feature of GlueDomains is that it does not contain apublication engine of its own, but relies on an already existing one: we consid-ered that data publication as a separated issue, that is preferably implementedorthogonally, possibly by a different team. Therefore the theodolite implemen-tation offers an interface for a specialized plugin, tailored for a certain type ofpublication engine. In our testbed we used a GridICE plugin.
4 A testbed deployement on Metropoltan Area
Grid
4.1 The SCoPE project
The S.Co.P.E. (Italian acronymic for high Performance, Cooperative and dis-tributed System for scientific Elaboration) [12]is a research project that aims atdeveloping several applications in the field of fundamental research, which is oneof its strategic objectives. The main spin off is the implementation of an openand multidisciplinar Grid infrastructure between the departments of UniversityFederico II, distributed in Metropolitan scale in the city of Naples.
The S.Co.P.E. Architecture provides the unification of all the main compu-tational and storage resources already available in the sites that participate atthe project, using the Grid Paradigm supported by INFN-GRID distribution.
The computing infrastructure connectivity is supported by the metropolitan
10

Figure 5: The testbed network topology with the link speed and the theodolitelocations
fiber optic ring that connects at 2.4Gb/s the 4 main sites of the University:Medicine, Engineering, C.S.I. (Center of Information Services) and the Campusof Monte Sant’Angelo, that accommodates the science faculty departments andare already organized in a Grid infrastructure over a fiber optic LAN at campuslevel (THE CAMPUS GRID). The MAN will be extended by the end of 2008with a wireless bridge towards the Astronomical Observatory of Capodimonteand a wired link to the detached engineering site (see figure 4).
All the peripheral sites share their resources by offering the basic Grid siteservices of the INFN-GRID middleware: Computing Element, Worker Nodeand Storage Element based on DPM. The collective services, are centralized ina new computing center open in the Campus Grid that offer Services Discovery,Resource Brokering, File Catalog, Grid Monitoring and graphical user interface.
Most of the research topics covered by the University Federico II involve theuse of different software packages and applications, each exhibiting distinguishedrequirements on the Grid services. This framework promotes the research onGrid computing, and offers an excellent and complete testbed in which new Gridservices can be deployed and evaluated.
4.2 The testbed deployment
The GlueDomains testbed, has been deployed on five sites of the SCoPE in-frastructure, interconnected in a switched network with different end-to-endperformances, as shown in the figure 5.
11

Figure 6: The SCoPE GridICE web page show the measurement performedamong all the possible couple of theodolites
The GlueDomains Server component is supported by a dedicated node of thecollective services farm, placed in the Campus Grid site. This server manages thecentral database used to configure the measurement topology and the networkmonitoring activity of each theodolite.
In order to monitor the network performance of our Grid, five theodolitesare installed in the following sites:
• UNINA-SCOPE-GSC in the Campus Grid Site
• UNINA-SCOPE-ASTRO in the Campus Grid Site
• INFN-NAPOLI-VIRGO in the Campus Grid Site
• UNINA-SCOPE-CENTRO in the Center Site
• UNINA-SCOPE-CEINGE in the Medicine Site
They are installed in the Storage Elements and configured in a full mesh,making available Rondtrip Time, Packet Loss Rate and One-Way Jitter for eachdomain-to-domain path. The data produced by the GlueDomains sensors areperiodically uploaded and published through the GridICE web interface (seefigure 6) which is used also to check theodolite operation.
5 The data transfer problem
The SCoPE infrastructure exports the storage via an SRM interface. Each file,distributed on several storage elements, is registered in a central logical file
12

catalog (LFC) and the applications access to the physical replicas by queryingthis service. In absence of a replica optimization service [14], when an user oran application asks for a file, addressed using its logical name, the LFC catalogreturns a physical location selected randomly among the different replicas thatcorrespond at the same logical name: this way is clearly sub-optimal. In therest of this paper we show some prelimnary results about a real use case, and wecompare the performances obtained using the random strategy applied by LFCwith respect to the use of a cost driven selection obtained from data providedby GlueDomains.
5.1 The Framework
The VIRGO comunity at University Federico II is in charge of analyzing thedata produced by the Virgo interferometer, located in Cascina (PISA). To thispurpose, fresh data continuously flow from the interferometer to the Virgo Grid.Data acquisition is followed by a synchronization phase, in which raw data arereplicated in the different storage elements of the SCoPE infrastructure, in orderto optimize their parallel processing on distinct computing resources.
The network traffic created during data synchronization and distributionaffects the general Grid performance, which reflects on the network performanceobserved by the other users of the Grid.
In [11] a meta-scheduler network-aware is introduced, called DIANA, fordata intensive applications. The scheduling algorithm used by DIANA is basedon the estimate of the cost of computation and of data transfers. This algo-rithm, defined in the framework of the CMS experiment, provides a cost functionthat can be used to select site from data set are downloaded during networkcongestion.
The model proposed in the DIANA framework estimates the network costusing very basic network measurements (Round Trip Time (RTT), Jitter, PacketLoss and the Maximum Segment Size(MSS)), through the following equation:
NetCost ∝Losses
Bandwidth
where
Losses = RTT ×W1 + Loss×W2 + Jitter ×W3
and
Bandwidth <MSS
RTT×
1√Loss
This model as been used to perform some preliminary tests, with the pur-pose of evaluating the effective use of network measurements as provided byGlueDomains.
13

lcg-cp --verbose lfn:/grid/scope/gluetest.txt srm://grid002.ceinge.unina.it:8446/dpm/ceinge.unina.it/home/scope/gluetest97.txt
Using grid catalog type: lfcUsing grid catalog : scopelfc01.dsf.unina.itVO name: (null)Source URL: lfn:/grid/scope/gluetest.txtFile size: 1246076580Source URL for copy: gsiftp://scopese01.dsf.unina.it/scopese01.dsf.unina.it:/scope/scope/2007-12-02/gluetest.txt.1530.0Destination URL: srm://grid002.ceinge.unina.it:8446/dpm/ceinge.unina.it/home/scope/gluetest97.txt# streams: 1# set timeout to 0 (seconds)
1241186304 bytes 1744.02 KB/sec avg 2598.40 KB/sec instTransfer took 701940 ms
Figure 7: Network performance without replica selection
5.2 Experimental results
The experiment consists in downloading in the storage element of the Medicinesite UNINA-SCOPE-CEINGE a set of 1.2Gb size files which is replicated inthe sites INFN-VIRGO-NAPOLI, UNINA-SCOPE-GSC and UNINA-SCOPE-CENTRO.
The files are registered in the SCoPE logical file catalog: this allows tohave an single namespace for all the replicas distributed along different storageelements.
The tests are deliberately run during an intensive sincronization activityamong UNINA-SCOPE-GSC, UNINA-SCOPE-CENTRO and UNINA-SCOPE-ASTRO sites, and unfold in two phases:
• Replication of 10 files on the UNINA-SCOPE-CEINGE site by using thelcg-utils tools and the logical file name.
• Replication of 10 files on the UNINA-SCOPE-CEINGE site by selectingthe Strage using the above NetCost.
During the first test sequence, the lcg-cp command, after querying thelfc catalog, start downloading data from scopese01.dsf.unina.it, which fre-quently happens to be the busiest host. Therefore the global performance de-grades and each file takes about 700s to be replicated on the UNINA-SCOPE-CEINGE site, with an average rate of 1.800 KB/sec vs the theoretical 12.000KB/s. Figure 7 reports a typical session.
In the second sequence of tests, data are downloaded using the SURL addressand selecting the location by computing the network cost in advance. Startingfrom the measurements provided by the UNINA-SCOPE-CEINGE theodolite,right before the download we can estimate the Network Cost. A typical sessionis in figure 8.
The Network cost shows that the best storage element from which to down-load the replica is INFN-NAPOLI-VIRGO, since the SCOPE-UNINA-GSC Net-Cost is sensitive to the relevant packet loss rate. The data transfer rate shows
14

SITE MSS RTT (sec) JITTER LOSS NetCost
INFN-NAPOLI-VIRGO 1024 0.890 174 0 0.15SCOPE-UNINA-ASTRO 1024 2.993 142 6250 1447SCOPE-UNINA-CENTRO 1024 2.442 2314 0 5.5SCOPE-UNINA-GSC 1024 2.308 12 40186 18163
Figure 8: Available measurements before the download
lcg-cp --verbose srm://virgo-se.na.infn.it:8446/dpm/na.infn.it/home/scope/gluetest.txt srm://grid002.ceinge.unina.it:8446/dpm/ceinge.unina.it/home/scope/gluetest94.txt
Source URL: srm://virgo-se.na.infn.it:8446/dpm/na.infn.it/home/scope/gluetest.txtFile size: 1246076580Source URL for copy: gsiftp://virgo-se.na.infn.it/virgo-se.na.infn.it:/flatfiles/SE00/virgo/scope/2007-12-02/gluetest.txt.20.0Destination URL: srm://grid002.ceinge.unina.it:8446/dpm/ceinge.unina.it/home/scope/gluetest94.txt# streams: 1# set timeout to 0 (seconds)
1196621824 bytes 11129.29 KB/sec avg 11200.00 KB/sec instTransfer took 111090 ms
Figure 9: Network performance without replica selection based on network per-formance
a significant improvement in terms of the average transfer time. In table 9 weshow the output of a typical lcg-cp session, and in figure 10 we summarize theresults of the performed tests time needed to copy the file from ??
6 Conclusions and future work
It is a widespread sentiment that the introduction network awareness in theimplementation of Grid services promises important performance improvements,for which an effective, reliable network monitoring system is just a premise. Wehave successfully applied such concept to the management of a typical eSciencetask, in the frame of a relevant scientific experiment, Virgo.
From such experience we conclude that one of the characteristics of thenetwork monitoring infrastructure is its flexibility and reliability; its deploymentand maintenance costs should be negligible compared with the management ofthe target activity. Measurements should be presented with an application
TEST TOTAL TIME TOTAL SIZE Time Mean/file BAND
TEST SERIE 1 116 min 12 GB 701 sec 14MbsTEST SERIE 2 20 min 12GB 120 sec 81Mbs
Figure 10: Comparison between transfer performance
15

friendly interface, to simplify the upgrade of legacy applications.In this paper we targeted the use of simple network measurements, with the
purpose of verifying the effectiveness of simple cost estimators. The results weobtained are encouraging, and we plan to investigate the possibility of acquiringbandwith measurements, in order to improve decision accuracy.
References
[1] ATLAS web page. http://atlas.web.cern.ch/Atlas/index.html.
[2] CMA production. http://cmsdoc.cern.ch/cms/production.
[3] Data analysis techniques for high-energy physics. Cambridge UniversityPress.
[4] Webpage of the Virgo experiment. http://www.virgo.infn.it.
[5] Design of a replica optimisation framework. Technical Report DataGrid-02-TED-021215, DATAGRID Project, December 2002.
[6] Sergio Andreozzi, Augusto Ciuffoletti, Antonia Ghiselli, and Cristina Vis-toli. Monitoring the connectivity of a grid. In 2nd Workshop on Middleware
for Grid Computing, pages 47–51, Toronto, Canada 2004.
[7] J-P. Baud, J. Casey, S. Lemaitre, C. Nicholson, D. Smith, and G. Stewart.Lcg data management: From edg to egee. In Proceedings of ”UK eScience
All Hands Meeting”, Nottingham, UK, 2005.
[8] P. Canitrot, L. Milano, and A. Vicer. Computational costs for coalescingbinaries detection in VIRGO using matched filters. Technical Report VIR-NOT-PIS-1390-149, Virgo Project.
[9] Hai Jin, Xuanhua Shi, Weizhong Qiang, and Deqing Zou. An adaptivemeta-scheduler for data-intensive applications. International Journal of
Grid and Utility Computing, 1(1):32 – 37, 2005.
[10] P. Kunszt, E. Laure, H. Stockinger, and K. Stockinger. Advanced replicamanagement with Reptor. In Lecture Notes in Computer Science, volume3019. Springer Berlin / Heidelberg, 2004.
[11] R. McClatchey, A. Anjum, H. Stockinger, I. Ali, A. Willers, andM. Thomas. Data intensive and network aware (DIANA) grid scheduling.Journal of Grid Computing, 5(1):43–64, 2007.
[12] S. Pardi, L. Merola, G. Marrucci, and G. Russo. The SCoPE project. In3rd International Conference on Cybernetics and Information Technologies,Orlando, Florida, USA, July 2006.
16

[13] Alistair Phipps. Network performance monitoring architecture. Techni-cal Report EGEE-JRA4-TEC-606702-NPM NMWG Model Design, JRA4Design Team, September 2005.
[14] K. Stockinger, H. Stockinger, L. Dutka, R. Slota, D. Nikolow, andJ. Kitowski. Access cost estimation for unified grid storage systems.In IEEE Computer Society Press, editor, 4th Intl. Workshop Grid2003,Phoenix/Arizona, USA, 2003.
[15] B. Volckaert, P. Thysebaert, M. De Leenheer, F. F. De Turck, B. Dhoedt,and P. Demeester. Network aware scheduling in grids. In Proc. of the
9th European Conference on Networks and Optical Communications, Eind-hoven, The Netherlands, Jun 2004.
[16] R. Wolski, N.T. Spring, and J. Hayes. The Network Weather Service: adistributed resource performance forecasting service for metacomputing.Future Generation Computer Systems,, 15(5):757–768, October 1999.
17
Copyright © 2022 FDOKUMEN