
linking organic farmers to retail stores– agricultural - NIAM
Upload
uantwerpenCategory
view
3download
0
This article appeared in a journal published by Elsevier. The attachedcopy is furnished to the author for internal non-commercial researchand education use, including for instruction at the authors institution
and sharing with colleagues.
Other uses, including reproduction and distribution, or selling orlicensing copies, or posting to personal, institutional or third party
websites are prohibited.
In most cases authors are permitted to post their version of thearticle (e.g. in Word or Tex form) to their personal website orinstitutional repository. Authors requiring further information
regarding Elsevier’s archiving and manuscript policies areencouraged to visit:
http://www.elsevier.com/copyright

Author's personal copy
Optimization of the humidification of cold stores by pressurized wateratomizers based on a multiscale CFD model
M.A. Delele a,*, A. Schenk b, E. Tijskens a, H. Ramon a, B.M Nicolaï a,b, P. Verboven a
a BIOSYST-MeBioS, Katholieke Universiteit Leuven, Willem de Croylaan 42, 3001 Leuven, Belgiumb Flanders Centre of Postharvest Technology, Willem de Croylaan 42, 3001 Leuven, Belgium
a r t i c l e i n f o
Article history:Received 9 June 2008Received in revised form 26 August 2008Accepted 27 August 2008Available online 6 September 2008
Keywords:CFDCold storageHumidificationLagrangian modelMultiphase flowPorous mediaFruit
a b s t r a c t
Humidification during long-term cooled storage of fruits is being introduced into practice to preventexcessive moisture loss and quality degradation. High pressure fogging is one of the few systems thatcan be used in ultra low oxygen (ULO) storage rooms. For system design and optimization, a CFD basedmultiscale model was used. At the smallest scale, the flow through stacked products in boxes was pre-dicted using a direct model that combined discrete element (DE)-CFD modelling. At larger scale, a loadedcool room model that predicts the storage room air velocity, temperature and humidity distributions andfate of the water droplets was developed. The loaded product was considered as a porous medium, wherethe anisotropic loss coefficients were determined from a combined DE-CFD simulation. A Lagrangian par-ticle tracking multiphase flow model was used. An interval humidification of 1 min on and 15 min offwith a water pressure of 80 bar (3.59 L h�1) for a ULO storage room at �1 �C on average gave a relativehumidity of 96.3%. The amount of sprayed water deposited on the stack and room surfaces depend onthe application pressure and nozzle position and direction. Good agreement was found between mea-sured and predicted results.
� 2008 Elsevier Ltd. All rights reserved.
1. Introduction
The relative humidity (RH) of storage rooms affects the qualityof the stored products. Numerous previous studies reported a sig-nificant effect of RH on weight loss and firmness (Henriod, 2006;Hertog et al., 2004; Paull, 1999; Tu et al., 2000). The most impor-tant factors that affect the weight loss are the rate of respirationand the water vapour pressure difference between the surroundingair and the product surface. A low optimum storage temperaturecombined with a high RH of the surrounding air can reduce theweight loss. However, due to the condensation and freezing ofwater vapour on the cooling coils, maintaining the required highRH at subzero storage conditions is very difficult. The temperaturedifference between the cooler surface and the room air is the mostimportant factor that controls the rate of condensation/freezing ofwater vapour on the cooling coils (Paull, 1999). To maintain the re-quired high RH, humidifying the cooling air using steam or atom-ized water droplets are the commonly used methods. However,an excessive RH level may encourage microbial spoilage and thusit is necessary to maintaining the RH at an acceptable level (Tassouand Xiang, 1998). Most of the previous studies discussed theadvantages of humidification on decreasing the saleable weight
loss and maintaining the product quality during storage. But it ishard to find any studies on the optimal operation and design ofsuch humidification systems for sub-zero storage conditions whichare commonly used for storing products such as pear.
Since it affects the storage room temperature during the time ofinjection, steam humidifier is not a good alternative. Cold wateratomizing humidifier can avoid this increase of the storage roomtemperature, but due to the low evaporation rate of the waterdroplets at sub-zero optimum storage temperature (for instance,�1 �C for conference pears or �2 �C for chicory root) maintaininghigh RH (>95% RH) with minimum deposition of the droplets onthe product surface is very challenging. There are four types ofatomizers that are commonly used for such humidification pur-pose: high pressure, ultrasonic, air-assisted and rotary atomizes.However, for ULO storage at sub-zero temperature the high pres-sure system is the viable option. Due to the low operating temper-ature and low ejection velocity of the droplets from ultrasonicatomizer (Rajan and Pandit, 2001), the clogging of the ejectordue to the freezing of the droplets on the surface makes its opera-tion for such storage condition very difficult. In case of the air-as-sisted nozzles, the high velocity atmospheric air that is used for theatomization disturbs the air composition of the ULO room. Rotaryatomizers are quite complex (Bayvel and Orzechowski, 1993).Experimentally, the suitability of the pressurized water atomizersfor humidification of storage rooms at �1 �C was investigated suc-cessfully (Delele et al., 2007a).
0260-8774/$ - see front matter � 2008 Elsevier Ltd. All rights reserved.doi:10.1016/j.jfoodeng.2008.08.027
* Corresponding author. Tel.: +32 16322376; fax: +32 16322955.E-mail address: [email protected] (M.A. Delele).
Journal of Food Engineering 91 (2009) 228–239
Contents lists available at ScienceDirect
Journal of Food Engineering
journal homepage: www.elsevier .com/locate / j foodeng
Author's personal copy
The use of experimental methods to set the optimum operatingparameters that give such a high relative humidity without causingexcessive water deposit on the product is very difficult. The use ofCFD modelling is an alternative to the expensive and tediousexperiments. A number of studies to model the air flow patternand temperature distribution in cold storage rooms demonstratethe appropriateness of the method (Chourasia and Goswami,2007; Hoang et al., 2000, 2003; Nahor et al., 2005; Tassou andXiang, 1998; Xu and Burfoot, 1999). The humidification system isusually not modelled and for calculating the pressure loss coeffi-cients for a flow through stacked products, these previous studiescommonly used the Ergun (1952) correlation that does not con-sider any effect of the confining and vented box walls oftenencountered in fruit storage. For a flow through loaded ventedstrawberry package, Ferrua and Singh (2008) observed a non-homogeneous and complex flow distribution; and stressed theneed for geometrical and mathematical models that are capableof generating the geometry and predicting the flow through thepackage and product. The humidification system was modelledusing a particle tracking approach (Delele et al., 2007b; Gouesbetand Berlemont, 1999).
In this paper, we present and validate a complete CFD modelthat predicts the storage room air velocity, temperature and
humidity distributions and fate of the water droplets that weresprayed from humidifying nozzles. In this study the loss coeffi-cients were determined using an explicit combined DE-CFD simu-lation that takes into account product geometrical properties, boxdesign and the randomness of the product stacking (Delele et al.,2008).
2. Materials and methods
2.1. Humidification system and cold storage room
The study was conducted in a storage room with a secondaryglycol cooling system 4.25 m in length, 2.8 m in width and 3.6 min height (Fig. 1). The cooling unit was located at the back of theroom. For the recirculation of the cooling air in the room two axialflow fans with a diameter of 40 cm and a capacity of 2140 m3 h�1
each were used. The humidification system (Becrou C.V.B.A,Brussels, Belgium) had a capacity up to 100 bar water pressure,and was equipped with an automatic controller that controls theon/off cycle. One humidifying nozzle (Delavan Inc., USA) was posi-tioned in front of the cooler exit. The control system of the roomwas equipped with Pt100 and RH meters (Siemens Building Tech-nologies Inc., Illinois, USA) with an accuracy of ±0.5 �C and ±5%, for
Nomenclature
Ac heat transfer area of the cooler, m2
Aspec specific area, m2 m�3
aw water activityCd drag coefficientCp specific heat, J kg�1 �C�1
d droplet diameter, mDp product equivalent diameter, mCov,s vapour concentration on the droplet surface, kmol m�3
Cov,1 vapour concentration in the bulk air, kmol m�3
D molecular diffusion coefficient, m2 s�1
Dt turbulent diffusion coefficient, m2 s�1
E relative error, %g gravitational acceleration, m s�2
h static enthalpy, J kg�1
h0 fluctuating static enthalpy, J kg�1
hb bulk product mass transfer coefficient, kg m�2 s�1 Pa�1
hh heat transfer coefficient, W m�2 C�1
hm mass transfer coefficient, m s�1
hoh air film heat transfer coefficient, W m�2 C�1
hom air film mass transfer coefficient, kg m�2 s�1 Pa�1
hs skin mass transfer coefficient, kg m�2 s�1 Pa�1
k turbulent kinetic energy, m2 s�2
K Darcy permeability, m2
L latent heat of condensation vaporization, J kg�1
Le Lewis numbermc moisture condensation evaporation rate at the cooler,
kg s�1
md mass of discrete droplet, kgmlp product moisture loss, kg m�3 s�1
Mwv molar mass of water vapour, kg kmol�1
nd number of droplets in the cellNu Nusselt numberp pressure, PaPrt turbulent Prandtl numberPvp vapour pressure on the product surface, PaPva vapour pressure on the surrounding air, PaR universal gas constant, 8.314 J mol�1 K�1
Re particle Reynolds numberSct turbulent Schmidt number
Se energy source term, J m�3 s�1
Sm mass source term, kg m�3 s�1
Su momentum source term, kg m�2 s�2
t time, sT temperature, �CTo reference temperature, �Cui, uj mean velocity components in X, Y, and Z-directions,
m s�1
u0i;u0j fluctuating velocity components, m s�1
Uc calculated velocity, m s�1
Um measured velocity, m s�1
us superficial velocity, m s�1
Vcell cell volume, m3
VH2O molar volume of water, 18� 10�6 m3 mol�1
vi velocity, m s�1
xi; xj Cartesian coordinates, mXv moisture content, kg kg�1
Yv vapour mass fractionY 0v fluctuating vapour mass fractionb Forchheimer drag coefficient, m�1
dij kronecker deltal molecular thermal conductivity, W m�1 �C�1
leff effective thermal conductivity of porous zone,W m�1 �C�1
kt turbulent thermal conductivity, W m�1 �C�1
l dynamic viscosity, kg m�1 s�1
lt turbulent viscosity, kg m�1 s�1
q density, kg m�3
qvsat saturated vapour density, kg m�3
/ porosityu shape factor
Subscripta continuous air phasec cooler surface/interface between the cooler surface and
cooling aird discrete droplet phasep producti, j Cartesian coordinate index
M.A. Delele et al. / Journal of Food Engineering 91 (2009) 228–239 229
Author's personal copy
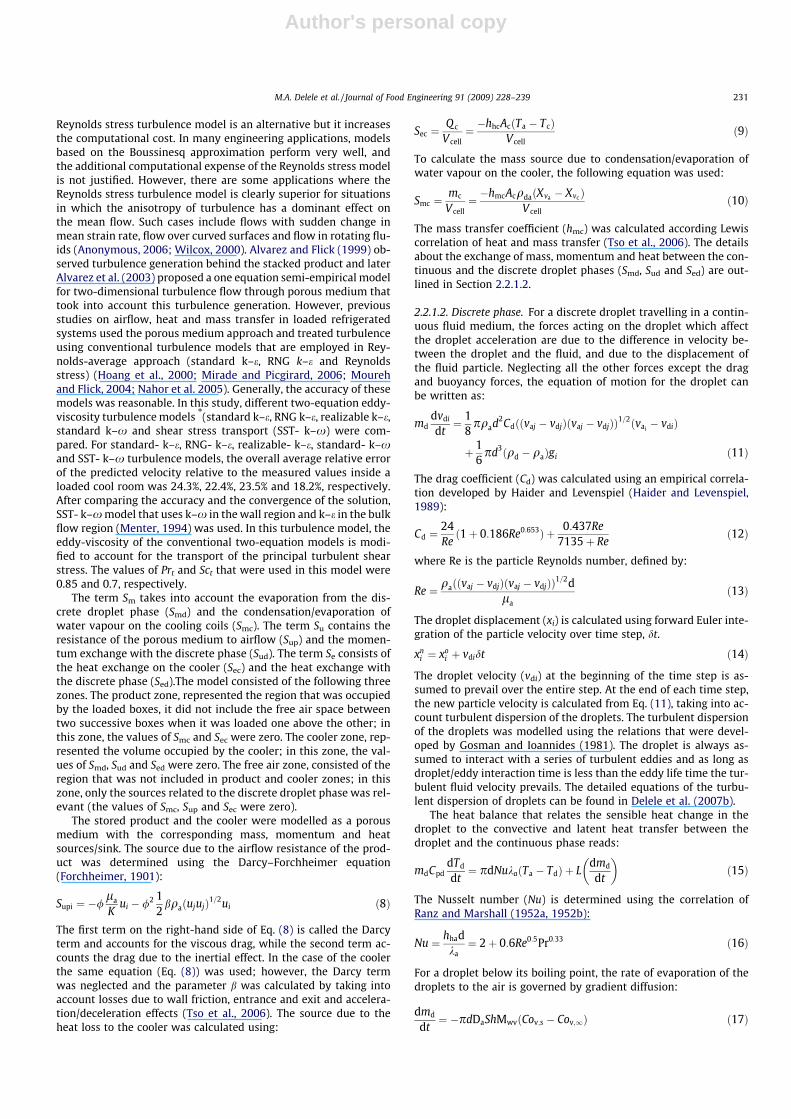
measuring temperature and humidity, respectively. The tempera-ture sensors measured the cooling air and coolant temperaturesat the entrance and exit of the cooler. The room was loaded with72 vented EPS (Euro Pool System, Leidschendam, The Netherlands)boxes of dimensions 30 � 40 � 16 cm were used (Fig. 2). Each boxwas filled with 32 artificial hollow polyvinyl chloride (PVC) plasticspheres of 75 mm diameter. The artificial PVC spheres were filledwith water and assumed to represent the real fruit.
2.2. CFD model formulation
The CFD code used for this work was Fluent 6.3.28 (Fluent Inc.,Lebanon, USA). The continuous air flow was solved using Reynolds-averaged fluid flow equations. The position of the water droplets(discrete phase) in the continuous air stream was tracked using aLagrangian particle tracking multiphase flow model. The modeltook into account two-way coupling with turbulent dispersionand droplet evaporation. Two-way coupling incorporates the effectof the continuous air flow on the flow of the discrete droplet phase,
and the effect of discrete droplet flow on the flow of the continuousair phase.
2.2.1. Governing equations2.2.1.1. Continuous phase. In Cartesian coordinates, for flow in aporous media, the Reynolds-averaged fluid flow equations basedon interstitial fluid velocity are as follows (Nakayama andKuwahara, 1999; Antohe and Lage, 1997):
oðqaÞotþ oðqauiÞ
oxi¼ Sm ð1Þ
oðqauiÞot
þ oðqauiujÞoxj
¼ � oðpÞoxiþ o
oxjla
oðuiÞoxjþ oðujÞ
oxi
� �� �
� o
oxjðqau0iu
0jÞ � di3½1� aðT � ToÞ�qag þ Su
ð2Þ
By assuming a local thermal equilibrium between the air and theporous solid matrix (the temperature of the air and the porous solidmatrix is assumed to be equal), the energy equation is
o
otð/qaCpaT þ ð1� /ÞqpCppTÞ þ /
o
xjðqaCpaujTÞ
¼ o
oxjkeff
oToxj
� �� �� /
o
oxjðqaCpau0T 0Þ þ Se ð3Þ
In most cases of flow in fluid saturated porous media the assump-tion of local thermal equilibrium is valid (Nakayama and Kuwahara,2005); and, this assumption has been used by several previousstudies (Nakayama and Kuwahara, 1999; Antohe and Lage, 1997;Masuoka and Takatsu, 1996; Chourasia and Goswami, 2007). How-ever, the limitation of such thermal equilibrium assumption for aflow through a porous solid matrix with a heat generation has beendiscussed (Laguerre et al., 2008; Verboven et al., 2006). In this mod-el, the heat generation due to the respiration and the water evapo-ration from the surface of the stored product were not included. Thetransport equation for vapour mass fraction is
/oðqaYvÞ
otþ /
o
oxjðqaujYvÞ ¼ /
o
oxjqaDa
oðYvÞoxj
� �� �� /
o
oxj
�ðqau0jY0Þ þ Sm ð4Þ
The specific Reynolds stress term (u0iu0jÞ in Eq. (2) and the specific
Reynolds flux terms u0jT0 and u0jY
0v in Eqs. (3) and (4) can be approx-
imated by (Versteeg and Malalasekera, 1995; Wilcox, 2000;Gouesbet and Berlemont, 1999)
u0iu0j ¼ �
lt
qa
oui
oxjþ ouj
oxi
� �þ 2
3kdij ð5Þ
u0jT0 ¼ � lt
qaPrt
oToxj
� �ð6Þ
u0jY0v ¼ �
lt
qaSct
oYv
oxj
� �ð7Þ
where the effective thermal conductivity and heat capacity are esti-mated using: keff ¼ /ka þ ð1� /Þka, Cpeff ¼ /Cpa þ ð1� /ÞCpp,respectively) (Carson, 2006; Bertola and Cafaro, 2006); Prt is the tur-bulent Prandtl number (Prt ¼ Cpala
ka); Sct is the turbulent Schmidt
numbers (Sct ¼ ltqaDt
).For closure of these equations, the appropriate turbulence mod-
els are used. The Boussinesq hypothesis (Eq. (5)), that relatesthe Reynolds stress term to the mean velocity gradient assumesthe turbulent viscosity to be isotropic, which is not strictly true.The Boussinesq hypothesis is used in the Spalart–Allmaras turbu-lence model, k–e turbulence model and k–x turbulence model.The alternative approach is to use a turbulence model that takesinto account the anisotropy of the Reynolds stress term. The
Fig. 1. Cold storage room (a) side view (b) top view; (�), positions of thermocouplesinside the stack, on different levels on the spheres and in the air (L1, L2 and L3); a, b,c, d and e are measurement positions for vertical velocity profile of the cooling air.
Fig. 2. Vented EPS box loaded with 32 spheres of 75mm diameter, used for DE-CFDsimulations.
230 M.A. Delele et al. / Journal of Food Engineering 91 (2009) 228–239
Author's personal copy
Reynolds stress turbulence model is an alternative but it increasesthe computational cost. In many engineering applications, modelsbased on the Boussinesq approximation perform very well, andthe additional computational expense of the Reynolds stress modelis not justified. However, there are some applications where theReynolds stress turbulence model is clearly superior for situationsin which the anisotropy of turbulence has a dominant effect onthe mean flow. Such cases include flows with sudden change inmean strain rate, flow over curved surfaces and flow in rotating flu-ids (Anonymous, 2006; Wilcox, 2000). Alvarez and Flick (1999) ob-served turbulence generation behind the stacked product and laterAlvarez et al. (2003) proposed a one equation semi-empirical modelfor two-dimensional turbulence flow through porous medium thattook into account this turbulence generation. However, previousstudies on airflow, heat and mass transfer in loaded refrigeratedsystems used the porous medium approach and treated turbulenceusing conventional turbulence models that are employed in Rey-nolds-average approach (standard k–e, RNG k–e and Reynoldsstress) (Hoang et al., 2000; Mirade and Picgirard, 2006; Mourehand Flick, 2004; Nahor et al. 2005). Generally, the accuracy of thesemodels was reasonable. In this study, different two-equation eddy-viscosity turbulence models *(standard k–e, RNG k–e, realizable k–e,standard k–x and shear stress transport (SST- k–x) were com-pared. For standard- k–e, RNG- k–e, realizable- k–e, standard- k–xand SST- k–x turbulence models, the overall average relative errorof the predicted velocity relative to the measured values inside aloaded cool room was 24.3%, 22.4%, 23.5% and 18.2%, respectively.After comparing the accuracy and the convergence of the solution,SST- k–x model that uses k–x in the wall region and k–e in the bulkflow region (Menter, 1994) was used. In this turbulence model, theeddy-viscosity of the conventional two-equation models is modi-fied to account for the transport of the principal turbulent shearstress. The values of Prt and Sct that were used in this model were0.85 and 0.7, respectively.
The term Sm takes into account the evaporation from the dis-crete droplet phase (Smd) and the condensation/evaporation ofwater vapour on the cooling coils (Smc). The term Su contains theresistance of the porous medium to airflow (Sup) and the momen-tum exchange with the discrete phase (Sud). The term Se consists ofthe heat exchange on the cooler (Sec) and the heat exchange withthe discrete phase (Sed).The model consisted of the following threezones. The product zone, represented the region that was occupiedby the loaded boxes, it did not include the free air space betweentwo successive boxes when it was loaded one above the other; inthis zone, the values of Smc and Sec were zero. The cooler zone, rep-resented the volume occupied by the cooler; in this zone, the val-ues of Smd, Sud and Sed were zero. The free air zone, consisted of theregion that was not included in product and cooler zones; in thiszone, only the sources related to the discrete droplet phase was rel-evant (the values of Smc, Sup and Sec were zero).
The stored product and the cooler were modelled as a porousmedium with the corresponding mass, momentum and heatsources/sink. The source due to the airflow resistance of the prod-uct was determined using the Darcy–Forchheimer equation(Forchheimer, 1901):
Supi ¼ �/la
Kui � /2 1
2bqaðujujÞ1=2ui ð8Þ
The first term on the right-hand side of Eq. (8) is called the Darcyterm and accounts for the viscous drag, while the second term ac-counts the drag due to the inertial effect. In the case of the coolerthe same equation (Eq. (8)) was used; however, the Darcy termwas neglected and the parameter b was calculated by taking intoaccount losses due to wall friction, entrance and exit and accelera-tion/deceleration effects (Tso et al., 2006). The source due to theheat loss to the cooler was calculated using:
Sec ¼Q c
V cell¼ �hhcAcðTa � TcÞ
Vcellð9Þ
To calculate the mass source due to condensation/evaporation ofwater vapour on the cooler, the following equation was used:
Smc ¼mc
Vcell¼ �hmcAcqdaðXva � Xvc Þ
V cellð10Þ
The mass transfer coefficient (hmc) was calculated according Lewiscorrelation of heat and mass transfer (Tso et al., 2006). The detailsabout the exchange of mass, momentum and heat between the con-tinuous and the discrete droplet phases (Smd, Sud and Sed) are out-lined in Section 2.2.1.2.
2.2.1.2. Discrete phase. For a discrete droplet travelling in a contin-uous fluid medium, the forces acting on the droplet which affectthe droplet acceleration are due to the difference in velocity be-tween the droplet and the fluid, and due to the displacement ofthe fluid particle. Neglecting all the other forces except the dragand buoyancy forces, the equation of motion for the droplet canbe written as:
mddvdi
dt¼ 1
8pqad2Cdððvaj � vdjÞðvaj � vdjÞÞ1=2ðvai
� vdiÞ
þ 16pd3ðqd � qaÞgi ð11Þ
The drag coefficient (Cd) was calculated using an empirical correla-tion developed by Haider and Levenspiel (Haider and Levenspiel,1989):
Cd ¼24Reð1þ 0:186Re0:653Þ þ 0:437Re
7135þ Reð12Þ
where Re is the particle Reynolds number, defined by:
Re ¼ qaððvaj � vdjÞðvaj � vdjÞÞ1=2dla
ð13Þ
The droplet displacement (xi) is calculated using forward Euler inte-gration of the particle velocity over time step, dt.
xni ¼ xo
i þ vdidt ð14Þ
The droplet velocity (vdi) at the beginning of the time step is as-sumed to prevail over the entire step. At the end of each time step,the new particle velocity is calculated from Eq. (11), taking into ac-count turbulent dispersion of the droplets. The turbulent dispersionof the droplets was modelled using the relations that were devel-oped by Gosman and Ioannides (1981). The droplet is always as-sumed to interact with a series of turbulent eddies and as long asdroplet/eddy interaction time is less than the eddy life time the tur-bulent fluid velocity prevails. The detailed equations of the turbu-lent dispersion of droplets can be found in Delele et al. (2007b).
The heat balance that relates the sensible heat change in thedroplet to the convective and latent heat transfer between thedroplet and the continuous phase reads:
mdCpddTd
dt¼ pdNukaðTa � TdÞ þ L
dmd
dt
� �ð15Þ
The Nusselt number (Nu) is determined using the correlation ofRanz and Marshall (1952a, 1952b):
Nu ¼ hhadka¼ 2þ 0:6Re0:5Pr0:33 ð16Þ
For a droplet below its boiling point, the rate of evaporation of thedroplets to the air is governed by gradient diffusion:
dmd
dt¼ �pdDaShMwvðCov;s � Cov;1Þ ð17Þ
M.A. Delele et al. / Journal of Food Engineering 91 (2009) 228–239 231
Author's personal copy
The Sherwood number (Sh) is calculated from the heat and masstransfer analogy:
Sh ¼ hmadDa¼ 2þ 0:6Re0:5Sc0:33 ð18Þ
The contribution of the droplet to the source/sink terms (Smd, Sud
and Sed) in Eqs. (1)–(4) represent the integrated effects of dropletmass, momentum and energy exchange with the continuous phase.These Eulerian variables are calculated from the Lagrangian dropletvariables by volume averaging the contributions from all individualdroplets within the cell volume as follows:
Smd ¼�1
Vcell
Xnd
n¼1
dmd
dtð19Þ
Sudi ¼�18pqad2Cdððvaj� vdjÞðvaj�vdjÞÞ1=2ðvai
�vdi�1
Vcell
Xnd
n¼1
dmd
dtvdj
ð20Þ
Sed ¼�1
V cell
Xnd
n¼1
pdNukaðTa�TdÞ�1
Vcell
Xnd
n¼1
Cpvdmd
dtTd ð21Þ
The first and second terms in right hand side (RHS) of Eq. (20) rep-resent the momentum exchange between the two phases withoutany phase change and the momentum flux ejected by the dropletduring its vaporization, respectively. The first and second terms inthe RHS of Eq. (21) represent the convective heat transfer and heatreleased by the droplets into the continuous phase as a result ofmass transfer accompanying the change from the liquid state tothe gaseous state, respectively.
2.2.2. Geometry and boundary conditionsThe domain used for the simulation had the size of the refriger-
ated room along with the fan and the heat exchanger (Fig. 1). Thefan was modelled as a fan boundary with a given pressure rise (28Pa), this was a lumped parameter model that did not give the detailflow behaviour through the fan blades but predicted the amount offlow through the fan. This approach did not also take into accountthe effect of the fan on the turbulence. All the solid surfaces in theroom were taken as no slip walls. On the floor of the room and thewalls that were exposed to the atmosphere a heat flux(qfw ¼ kw
twðTw � TÞ) from outside to the inside was applied. The out-
side wall/soil below the concrete floor temperature Tw was as-sumed to be the outside room temperature (19 �C) as the coldstore is built indoor; the thermal conductivity kw of the insulationwall and the concrete floor were 0.022 and 2.6 W m�1 �C�1, respec-tively; the thickness tw of the insulation wall and the concrete floorwere 0.12 and 0.1 m, respectively. The wall boundary layer wastreated using a standard wall function. The droplets that collidewith the walls were assumed to be trapped. The heat of productrespiration and evaporation of moisture from the product surfacewere not taken into account.
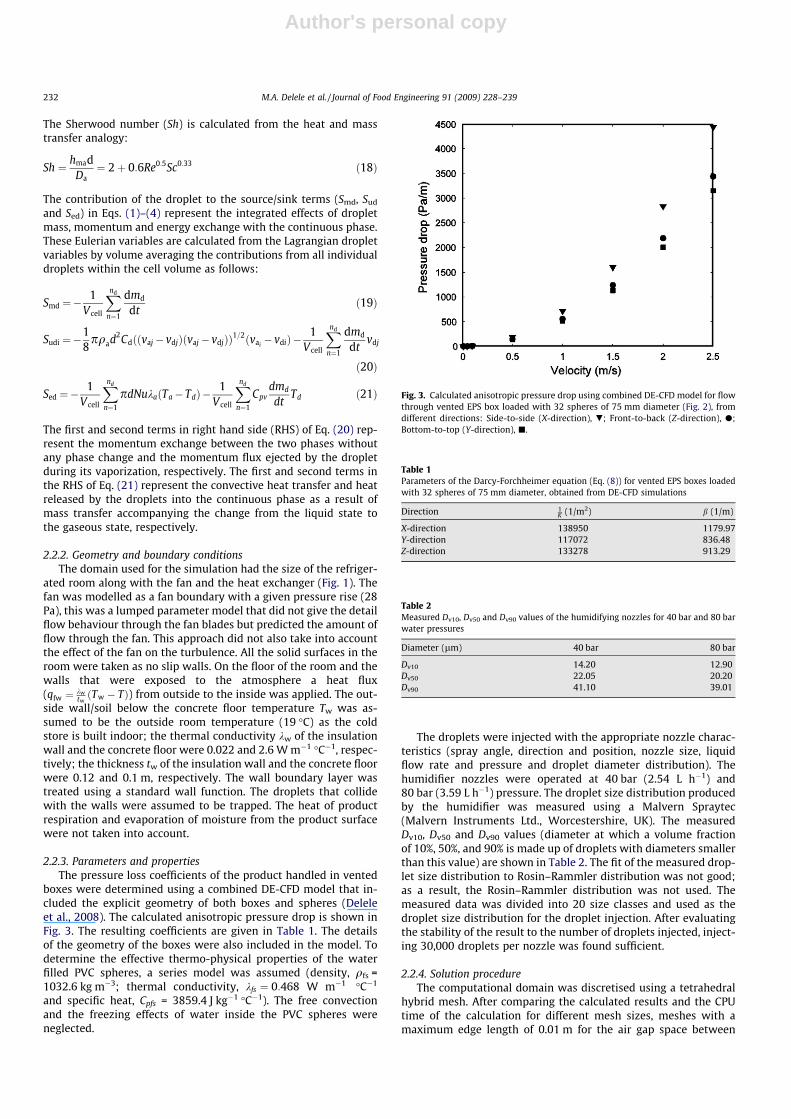
2.2.3. Parameters and propertiesThe pressure loss coefficients of the product handled in vented
boxes were determined using a combined DE-CFD model that in-cluded the explicit geometry of both boxes and spheres (Deleleet al., 2008). The calculated anisotropic pressure drop is shown inFig. 3. The resulting coefficients are given in Table 1. The detailsof the geometry of the boxes were also included in the model. Todetermine the effective thermo-physical properties of the waterfilled PVC spheres, a series model was assumed (density, qfs =1032.6 kg m�3; thermal conductivity, kfs ¼ 0:468 W m�1 �C�1
and specific heat, Cpfs = 3859.4 J kg�1 �C�1). The free convectionand the freezing effects of water inside the PVC spheres wereneglected.
The droplets were injected with the appropriate nozzle charac-teristics (spray angle, direction and position, nozzle size, liquidflow rate and pressure and droplet diameter distribution). Thehumidifier nozzles were operated at 40 bar (2.54 L h�1) and80 bar (3.59 L h�1) pressure. The droplet size distribution producedby the humidifier was measured using a Malvern Spraytec(Malvern Instruments Ltd., Worcestershire, UK). The measuredDv10, Dv50 and Dv90 values (diameter at which a volume fractionof 10%, 50%, and 90% is made up of droplets with diameters smallerthan this value) are shown in Table 2. The fit of the measured drop-let size distribution to Rosin–Rammler distribution was not good;as a result, the Rosin–Rammler distribution was not used. Themeasured data was divided into 20 size classes and used as thedroplet size distribution for the droplet injection. After evaluatingthe stability of the result to the number of droplets injected, inject-ing 30,000 droplets per nozzle was found sufficient.
2.2.4. Solution procedureThe computational domain was discretised using a tetrahedral
hybrid mesh. After comparing the calculated results and the CPUtime of the calculation for different mesh sizes, meshes with amaximum edge length of 0.01 m for the air gap space between
Fig. 3. Calculated anisotropic pressure drop using combined DE-CFD model for flowthrough vented EPS box loaded with 32 spheres of 75 mm diameter (Fig. 2), fromdifferent directions: Side-to-side (X-direction), .; Front-to-back (Z-direction), d;Bottom-to-top (Y-direction), j.
Table 1Parameters of the Darcy-Forchheimer equation (Eq. (8)) for vented EPS boxes loadedwith 32 spheres of 75 mm diameter, obtained from DE-CFD simulations
Direction 1K (1/m2) b (1/m)
X-direction 138950 1179.97Y-direction 117072 836.48Z-direction 133278 913.29
Table 2Measured Dv10, Dv50 and Dv90 values of the humidifying nozzles for 40 bar and 80 barwater pressures
Diameter (lm) 40 bar 80 bar
Dv10 14.20 12.90Dv50 22.05 20.20Dv90 41.10 39.01
232 M.A. Delele et al. / Journal of Food Engineering 91 (2009) 228–239
Author's personal copy
two layers of boxes and 0.05 m for the other regions were selected.The total number of cells was 1,243,628. Prior to the injection ofthe droplets the steady state simulation was converged to a nor-malized scaled residual below 10�4 of all equations. During theinjection of the droplets, a transient simulation with a time stepof 1s and 50 iterations per time step was performed. During inter-val humidification, after the injection time of the droplets, the timestep was gradually increased up to 60 s. The calculation was doneusing a Pentium IV, 3.21 GHz WinXp workstation with 3.62GBRam. A total CPU time of up to 9 days was needed.
2.2.5. Validation methodThe air velocity, temperature, humidity and the amount of
sprayed droplet deposited at different positions were measuredin a storage room that was described in Section 2.1. By assumingsymmetry, the measurements were taken only in half of the room.
The air velocity was measured using an air velocity transducer(TSI Incorporated, MN, USA). The operating range of the sensor is0.05–2.5 m s�1. The factory calibrated accuracy of the sensor is±3% of the reading or ±1% of the full range. The vertical velocityprofile was measured at the following positions (Fig. 1): 1 m infront of the stack (position a), 1 cm in front of the stack (positionb), 1 cm behind the stack (position c), 1 m behind the stack (posi-tion d) and 0.5 m from the side of the stack (position e). For mea-suring the temperature, type-T Teflon-insulated thermocoupleswith an accuracy of ±0.4% were used (Omega Engineering, Inc.,Stanford, USA). Inside a loaded room, the temperature in the airgap between two layers of boxes and surface temperature of thetop water filled artificial spheres inside the lower box were moni-tored. The measurement was taken at three vertical positions(L1 = 0.24 m, L2 = 1.39 m and L3 = 2.73 m from the floor). At everyvertical position 20 thermocouples (10 in the air gap and 10 on the
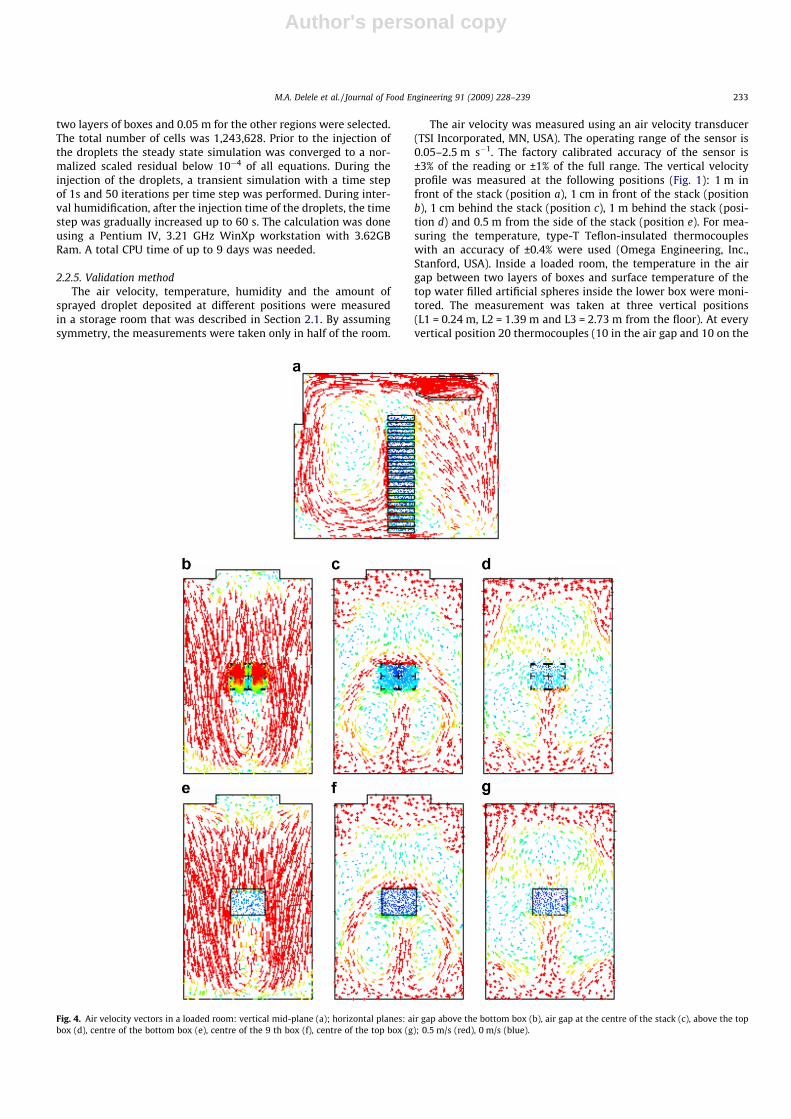
Fig. 4. Air velocity vectors in a loaded room: vertical mid-plane (a); horizontal planes: air gap above the bottom box (b), air gap at the centre of the stack (c), above the topbox (d), centre of the bottom box (e), centre of the 9 th box (f), centre of the top box (g); 0.5 m/s (red), 0 m/s (blue).
M.A. Delele et al. / Journal of Food Engineering 91 (2009) 228–239 233
Author's personal copy
sphere surface) were used (Fig. 1). There was a 2 cm gap betweenthe surface and the air gap thermocouples.
The humidity was determined by measuring the dry bulb andthe dew point temperatures of the cooling air using a PT100 and achilled-mirror dew point meter (General Eastern Instruments,MA, USA), respectively. The humidity was measured in the air gapbetween boxes at X = 1.6 m, Y = 2.42 m and Z = 2.25 m. To quantifythe amount of sprayed droplets deposited on top, side and insidethe stack and floor of the loaded room a 3 cm by 3 cm piece of cot-ton was used. The piece of cotton was weighed before and after 22hr of interval (1 min on and 15 min off) humidification.
2.2.6. Simulation casesSimulation was performed for the following cases:Case 1, a
steady state simulation of the air velocity distribution in the room.This was used as an initial velocity condition of the other cases. Theresult of this simulation was also used to study and validate thepredicted cooling air velocity distribution.Case 2, a transient simu-lation of room cooling with and without interval humidification(1 min on and 10 min off); initially the room was set at 20 �C and83.6% RH. This simulation was used to investigate and validatethe effect of humidification during the cooling period on RH andcooling rate.Case 3, a transient simulation with an interval humid-ification 1 min on and 15 min off; initially the room was set at �1�C and 93.8% RH. This simulation was used to investigate and val-idate the effect of interval humidification on RH at sub-zero stor-age condition and effects of nozzle pressure, position anddirection on droplet surface deposition. A design study was per-formed with this model.
3. Results and discussion
3.1. Cooling air velocity distribution
Predicted cooling air velocity vector fields in a loaded room aregiven in Fig. 4. The highest velocity was observed around the bot-tom region where it was in contact with the high velocity air jetfrom the cooler (Fig. 4b). The lowest velocity was observed around
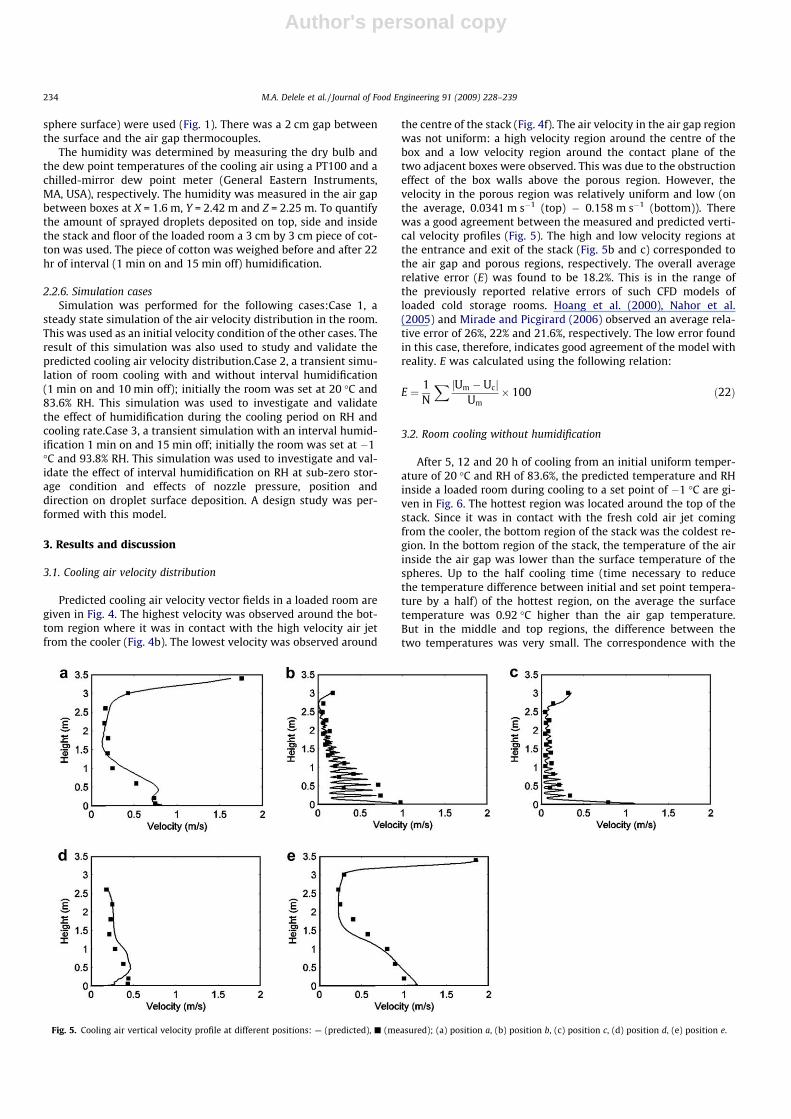
the centre of the stack (Fig. 4f). The air velocity in the air gap regionwas not uniform: a high velocity region around the centre of thebox and a low velocity region around the contact plane of thetwo adjacent boxes were observed. This was due to the obstructioneffect of the box walls above the porous region. However, thevelocity in the porous region was relatively uniform and low (onthe average, 0.0341 m s�1 (top) � 0.158 m s�1 (bottom)). Therewas a good agreement between the measured and predicted verti-cal velocity profiles (Fig. 5). The high and low velocity regions atthe entrance and exit of the stack (Fig. 5b and c) corresponded tothe air gap and porous regions, respectively. The overall averagerelative error (E) was found to be 18.2%. This is in the range ofthe previously reported relative errors of such CFD models ofloaded cold storage rooms. Hoang et al. (2000), Nahor et al.(2005) and Mirade and Picgirard (2006) observed an average rela-tive error of 26%, 22% and 21.6%, respectively. The low error foundin this case, therefore, indicates good agreement of the model withreality. E was calculated using the following relation:
E ¼ 1N
X jUm � UcjUm
� 100 ð22Þ
3.2. Room cooling without humidification
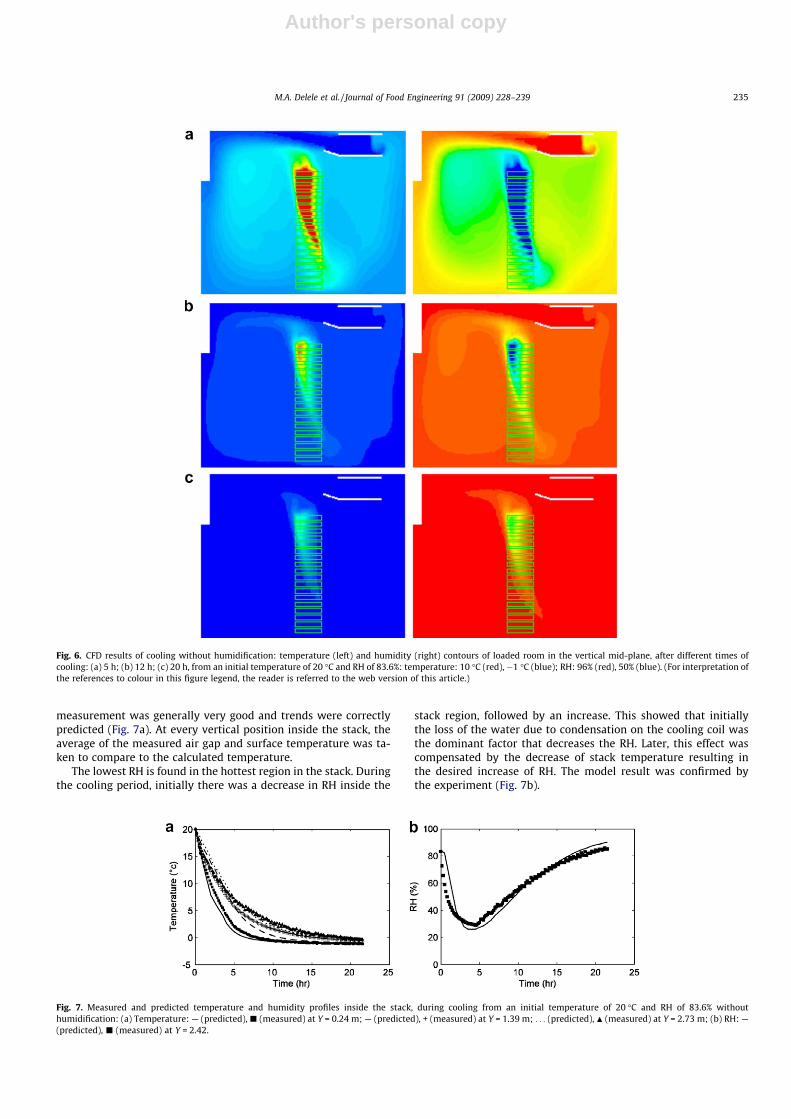
After 5, 12 and 20 h of cooling from an initial uniform temper-ature of 20 �C and RH of 83.6%, the predicted temperature and RHinside a loaded room during cooling to a set point of �1 �C are gi-ven in Fig. 6. The hottest region was located around the top of thestack. Since it was in contact with the fresh cold air jet comingfrom the cooler, the bottom region of the stack was the coldest re-gion. In the bottom region of the stack, the temperature of the airinside the air gap was lower than the surface temperature of thespheres. Up to the half cooling time (time necessary to reducethe temperature difference between initial and set point tempera-ture by a half) of the hottest region, on the average the surfacetemperature was 0.92 �C higher than the air gap temperature.But in the middle and top regions, the difference between thetwo temperatures was very small. The correspondence with the
Fig. 5. Cooling air vertical velocity profile at different positions: — (predicted), j (measured); (a) position a, (b) position b, (c) position c, (d) position d, (e) position e.
234 M.A. Delele et al. / Journal of Food Engineering 91 (2009) 228–239
Author's personal copy
measurement was generally very good and trends were correctlypredicted (Fig. 7a). At every vertical position inside the stack, theaverage of the measured air gap and surface temperature was ta-ken to compare to the calculated temperature.
The lowest RH is found in the hottest region in the stack. Duringthe cooling period, initially there was a decrease in RH inside the
stack region, followed by an increase. This showed that initiallythe loss of the water due to condensation on the cooling coil wasthe dominant factor that decreases the RH. Later, this effect wascompensated by the decrease of stack temperature resulting inthe desired increase of RH. The model result was confirmed bythe experiment (Fig. 7b).
Fig. 6. CFD results of cooling without humidification: temperature (left) and humidity (right) contours of loaded room in the vertical mid-plane, after different times ofcooling: (a) 5 h; (b) 12 h; (c) 20 h, from an initial temperature of 20 �C and RH of 83.6%: temperature: 10 �C (red), �1 �C (blue); RH: 96% (red), 50% (blue). (For interpretation ofthe references to colour in this figure legend, the reader is referred to the web version of this article.)
Fig. 7. Measured and predicted temperature and humidity profiles inside the stack, during cooling from an initial temperature of 20 �C and RH of 83.6% withouthumidification: (a) Temperature: — (predicted), j (measured) at Y = 0.24 m; — (predicted), + (measured) at Y = 1.39 m; . . . (predicted), N (measured) at Y = 2.73 m; (b) RH: —(predicted), j (measured) at Y = 2.42.
M.A. Delele et al. / Journal of Food Engineering 91 (2009) 228–239 235
Author's personal copy
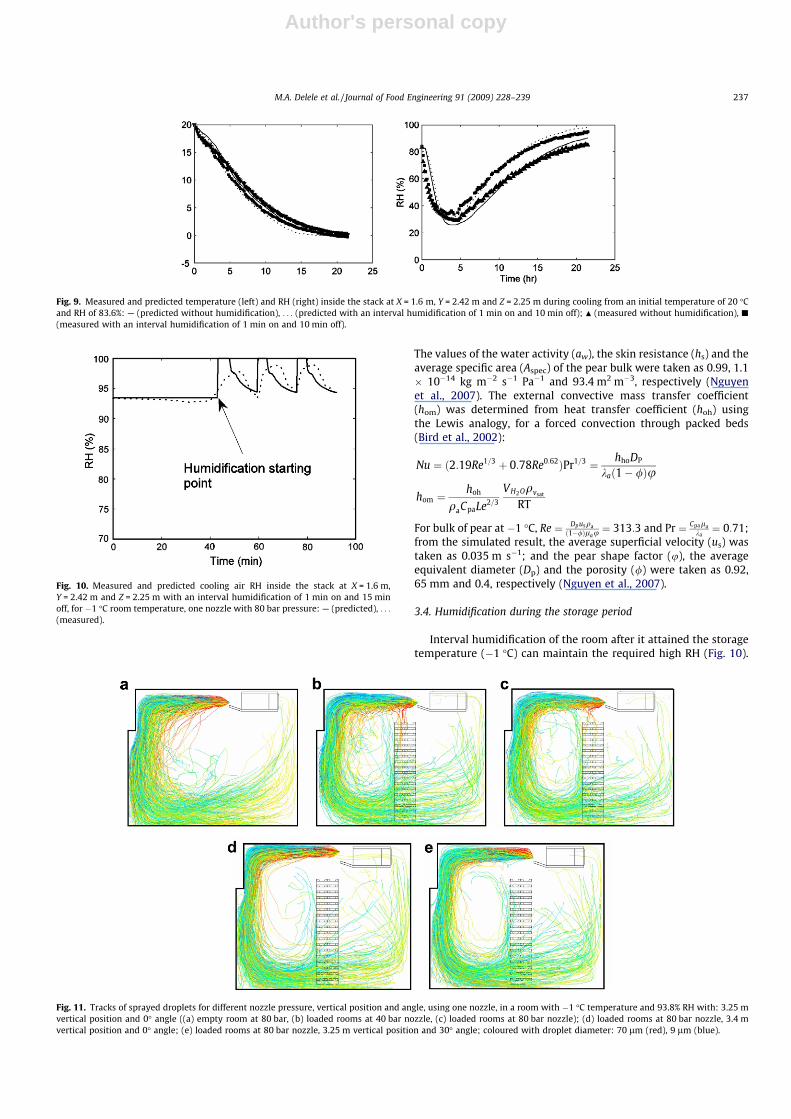
3.3. Room cooling with humidification
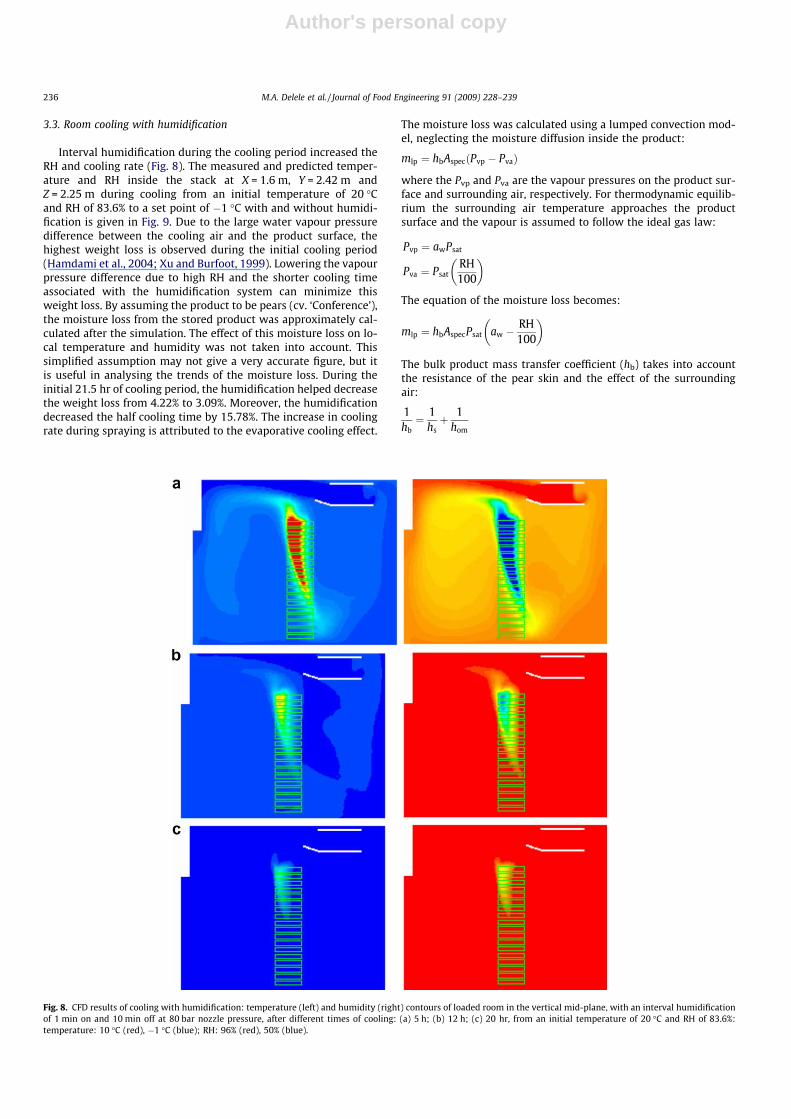
Interval humidification during the cooling period increased theRH and cooling rate (Fig. 8). The measured and predicted temper-ature and RH inside the stack at X = 1.6 m, Y = 2.42 m andZ = 2.25 m during cooling from an initial temperature of 20 �Cand RH of 83.6% to a set point of �1 �C with and without humidi-fication is given in Fig. 9. Due to the large water vapour pressuredifference between the cooling air and the product surface, thehighest weight loss is observed during the initial cooling period(Hamdami et al., 2004; Xu and Burfoot, 1999). Lowering the vapourpressure difference due to high RH and the shorter cooling timeassociated with the humidification system can minimize thisweight loss. By assuming the product to be pears (cv. ‘Conference’),the moisture loss from the stored product was approximately cal-culated after the simulation. The effect of this moisture loss on lo-cal temperature and humidity was not taken into account. Thissimplified assumption may not give a very accurate figure, but itis useful in analysing the trends of the moisture loss. During theinitial 21.5 hr of cooling period, the humidification helped decreasethe weight loss from 4.22% to 3.09%. Moreover, the humidificationdecreased the half cooling time by 15.78%. The increase in coolingrate during spraying is attributed to the evaporative cooling effect.
The moisture loss was calculated using a lumped convection mod-el, neglecting the moisture diffusion inside the product:
mlp ¼ hbAspecðPvp � PvaÞ
where the Pvp and Pva are the vapour pressures on the product sur-face and surrounding air, respectively. For thermodynamic equilib-rium the surrounding air temperature approaches the productsurface and the vapour is assumed to follow the ideal gas law:
Pvp ¼ awPsat
Pva ¼ PsatRH100
� �
The equation of the moisture loss becomes:
mlp ¼ hbAspecPsat aw �RH100
� �
The bulk product mass transfer coefficient (hb) takes into accountthe resistance of the pear skin and the effect of the surroundingair:
1hb¼ 1
hsþ 1
hom
Fig. 8. CFD results of cooling with humidification: temperature (left) and humidity (right) contours of loaded room in the vertical mid-plane, with an interval humidificationof 1 min on and 10 min off at 80 bar nozzle pressure, after different times of cooling: (a) 5 h; (b) 12 h; (c) 20 hr, from an initial temperature of 20 �C and RH of 83.6%:temperature: 10 �C (red), �1 �C (blue); RH: 96% (red), 50% (blue).
236 M.A. Delele et al. / Journal of Food Engineering 91 (2009) 228–239
Author's personal copy
The values of the water activity (aw), the skin resistance (hs) and theaverage specific area (Aspec) of the pear bulk were taken as 0.99, 1.1� 10�14 kg m�2 s�1 Pa�1 and 93.4 m2 m�3, respectively (Nguyenet al., 2007). The external convective mass transfer coefficient(hom) was determined from heat transfer coefficient (hoh) usingthe Lewis analogy, for a forced convection through packed beds(Bird et al., 2002):
Nu ¼ ð2:19Re1=3 þ 0:78Re0:62ÞPr1=3 ¼ hhoDP
kað1� /Þu
hom ¼hoh
qaCpaLe2=3
VH2Oqvsat
RT
For bulk of pear at �1 �C, Re ¼ Dpusqað1�/Þlau
¼ 313:3 and Pr ¼ Cpalaka¼ 0:71;
from the simulated result, the average superficial velocity (us) wastaken as 0.035 m s�1; and the pear shape factor (u), the averageequivalent diameter (Dp) and the porosity (/) were taken as 0.92,65 mm and 0.4, respectively (Nguyen et al., 2007).
3.4. Humidification during the storage period
Interval humidification of the room after it attained the storagetemperature (�1 �C) can maintain the required high RH (Fig. 10).
Fig. 9. Measured and predicted temperature (left) and RH (right) inside the stack at X = 1.6 m, Y = 2.42 m and Z = 2.25 m during cooling from an initial temperature of 20 �Cand RH of 83.6%: — (predicted without humidification), . . . (predicted with an interval humidification of 1 min on and 10 min off); N (measured without humidification), j
(measured with an interval humidification of 1 min on and 10 min off).
Fig. 10. Measured and predicted cooling air RH inside the stack at X = 1.6 m,Y = 2.42 m and Z = 2.25 m with an interval humidification of 1 min on and 15 minoff, for �1 �C room temperature, one nozzle with 80 bar pressure: — (predicted), . . .
(measured).
Fig. 11. Tracks of sprayed droplets for different nozzle pressure, vertical position and angle, using one nozzle, in a room with �1 �C temperature and 93.8% RH with: 3.25 mvertical position and 0� angle ((a) empty room at 80 bar, (b) loaded rooms at 40 bar nozzle, (c) loaded rooms at 80 bar nozzle); (d) loaded rooms at 80 bar nozzle, 3.4 mvertical position and 0� angle; (e) loaded rooms at 80 bar nozzle, 3.25 m vertical position and 30� angle; coloured with droplet diameter: 70 lm (red), 9 lm (blue).
M.A. Delele et al. / Journal of Food Engineering 91 (2009) 228–239 237
Author's personal copy
While without humidification the equilibrium RH was 93.8%,humidification brought the average RH to a level of 96.3%. Theweight loss rate was decreased from 1.02%/month to 0.61%/monthby including the humidification. This is in the same range with theresult that was reported by Nguyen et al. (2007); for the same stor-age temperature and RH of 95% and 97% over storage time of 9months a weight loss of 5.6 and 3% was observed, respectively.The peaks of the predicted result were sharper than the measuredresults; this could be due to the response time of the sensors(2 min). The model over predicted the peak RH but produced thecorrect trends and dynamics of the system.
3.5. Optimization of nozzle operation
While we demonstrated in the previous sections the positive ef-fects on cooling rate and product weight loss, the nozzle operationmust be carefully designed to avoid excessive misting, leading tocondensation and insufficient evaporation of water droplets. Thetracks of the sprayed droplets for empty and loaded rooms are givenin Fig. 11. Most of the droplets were carried by the high velocitycold air that was coming out of the cooler. Part of the droplets thatwere not completely evaporated entered the cooler. The loading ofthe room affected both the velocity of the air jet and the dispersionof the sprayed droplets. Some of the larger droplets had a tendencyto escape from the confined air jet region at the ceiling and droppeddown on the stack (Fig. 11b and c). The dispersion of the dropletswas affected by nozzle position and direction and water pressure.
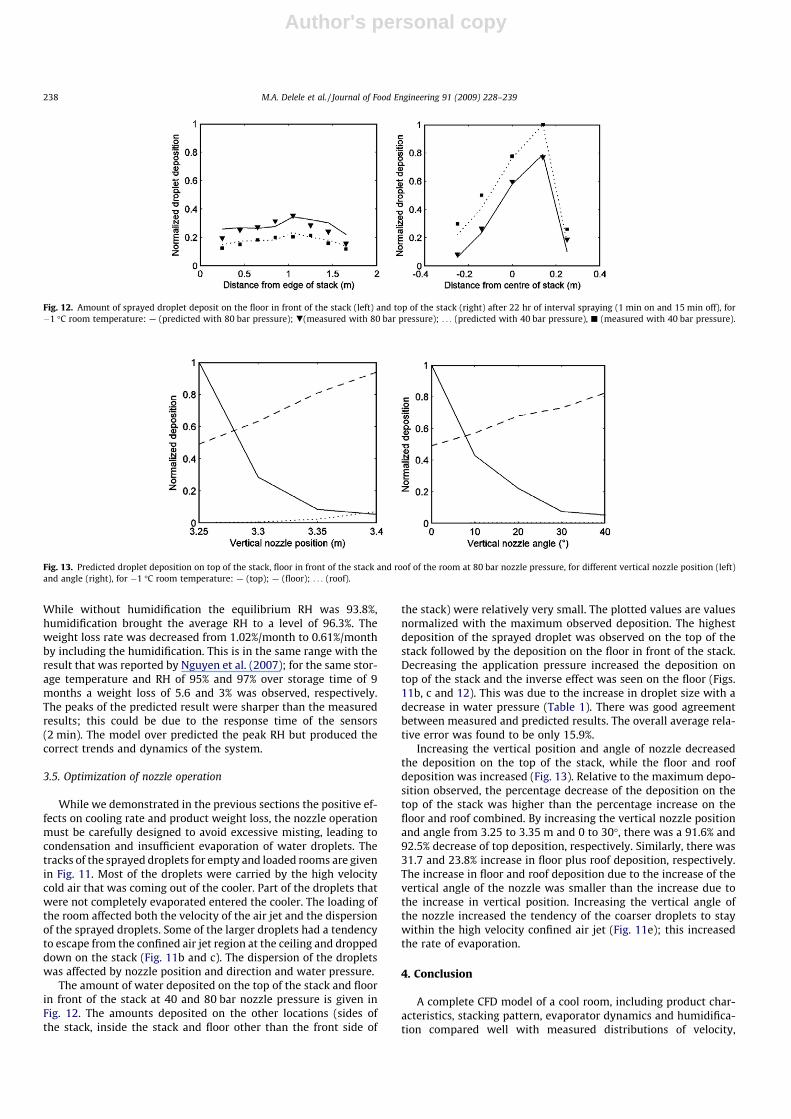
The amount of water deposited on the top of the stack and floorin front of the stack at 40 and 80 bar nozzle pressure is given inFig. 12. The amounts deposited on the other locations (sides ofthe stack, inside the stack and floor other than the front side of
the stack) were relatively very small. The plotted values are valuesnormalized with the maximum observed deposition. The highestdeposition of the sprayed droplet was observed on the top of thestack followed by the deposition on the floor in front of the stack.Decreasing the application pressure increased the deposition ontop of the stack and the inverse effect was seen on the floor (Figs.11b, c and 12). This was due to the increase in droplet size with adecrease in water pressure (Table 1). There was good agreementbetween measured and predicted results. The overall average rela-tive error was found to be only 15.9%.
Increasing the vertical position and angle of nozzle decreasedthe deposition on the top of the stack, while the floor and roofdeposition was increased (Fig. 13). Relative to the maximum depo-sition observed, the percentage decrease of the deposition on thetop of the stack was higher than the percentage increase on thefloor and roof combined. By increasing the vertical nozzle positionand angle from 3.25 to 3.35 m and 0 to 30�, there was a 91.6% and92.5% decrease of top deposition, respectively. Similarly, there was31.7 and 23.8% increase in floor plus roof deposition, respectively.The increase in floor and roof deposition due to the increase of thevertical angle of the nozzle was smaller than the increase due tothe increase in vertical position. Increasing the vertical angle ofthe nozzle increased the tendency of the coarser droplets to staywithin the high velocity confined air jet (Fig. 11e); this increasedthe rate of evaporation.
4. Conclusion
A complete CFD model of a cool room, including product char-acteristics, stacking pattern, evaporator dynamics and humidifica-tion compared well with measured distributions of velocity,
Fig. 12. Amount of sprayed droplet deposit on the floor in front of the stack (left) and top of the stack (right) after 22 hr of interval spraying (1 min on and 15 min off), for�1 �C room temperature: — (predicted with 80 bar pressure); .(measured with 80 bar pressure); . . . (predicted with 40 bar pressure), j (measured with 40 bar pressure).
Fig. 13. Predicted droplet deposition on top of the stack, floor in front of the stack and roof of the room at 80 bar nozzle pressure, for different vertical nozzle position (left)and angle (right), for �1 �C room temperature: — (top); — (floor); . . . (roof).
238 M.A. Delele et al. / Journal of Food Engineering 91 (2009) 228–239
Author's personal copy
temperature, humidity and droplet deposition inside the cold stor-age room with an installed humidification system. 1 min on and10 min off interval humidification during cooling allowed increas-ing RH with 10.1% on average, reducing the cooling time with15.8% and reducing the weight loss with 1.13%; 1 min on and15 min off interval humidification during storage at �1 �C raisedthe RH with 2.5% and decreased the weight loss by 40.2%. The re-sult demonstrated clearly the applicability of CFD models to studythe effects of different operating parameters on the efficiency ofthe humidification system and to identify the optimum operatingcondition of the system that produce the maximum evaporationand minimum deposition of the sprayed water droplets.
Acknowledgement
The Interfaculty Council for Development Co-operation (IRO)and IWT project 060720 are gratefully acknowledged for financialsupport. Pieter Verboven is Fellow of the Industrial Research Fundof the K.U. Leuven. In addition, we like to acknowledge the Univer-sité Libre de Bruxelles (Prof. Dr. Karim AMIGHI) for use of the Mal-vern Spraytec unit.
References
Anonymous, 2006. FLUENT 6.3 User’s Guide. Fluent, Inc., Lebanon, NH, USA.Antohe, B.V., Lage, J.L., 1997. A general two-equation macroscopic turbulence model
for incompressible flow in porous media. International Journal of Heat and MassTransfer 40 (13), 3013–3024.
Alvarez, G., Flick, D., 1999. Analysis of heterogeneous cooling of agriculturalproducts inside bines. Part I: Aerodynamic study. Journal of Food Engineering39, 227–237.
Alvarez, G., Bournet, P-E., Flick, D., 2003. Two-dimensional simulation of turbulentflow and transfer through stacked spheres. International Journal of Heat andMass Transfer 46, 2459–2469.
Bayvel, L., Orzechowski, Z., 1993. Liquid Atomization. Taylor & Francis, Washington,DC, USA.
Bertola, V., Cafaro, E., 2006. Thermal instability of viscoelastic fluids in horizontalporous layers as initial value problem. International Journal of Heat and massTransfer 49, 4003–4012.
Bird, R.B., Stewart, W.E., Lightfoot, E.N., 2002. Transport Phenomena, second ed.John wiley & Sons, Inc., New York, USA.
Carson, J.K., 2006. Review of effective thermal conductivity models for foods.International Journal of Refrigeration 29, 958–967.
Chourasia, M.K., Goswami, T.K., 2007. CFD simulation of effects of operatingparameters and product on heat transfer and moisture loss in the stack ofbagged potatoes. Journal of Food Engineering 80 (3), 947–960.
Delele, M.A., Tijskens, E., Atalay, T.A., Ho, Q.T., Ramon, H., Nicolaï, B.M., Verboven, P.,2008. Combined discrete element and CFD modeling of airflow through randomstacking of horticultural products in vented boxes. Journal of Food Engineering89 (1), 33–41.
Delele, M.A., Verboven, P., Schenk, A., Ramon, H., Nicolaï, B.M., 2007a. Assessment ofhumidification using pressurized water atomizers for ULO storage of conferencepears. In: Proceedings of the 22nd IIR International Congress of Refrigeration,Beijing, P.R. China.
Delele, M.A., Jaeken, P., Debaer, C., Ramon, H., Nicolaï, B.M., Verboven, P., 2007b. CFDprototyping of an air-assisted orchard sprayer aimed at drift reduction.Computers and Electronics in Agriculture 55, 16–27.
Ergun, S., 1952. Fluid flow through packed columns. Chemical Engineering Progress48, 89–94.
Forchheimer, P., 1901. Wasserbewegung durch Boden. Zeitschrift des VereinesDeuts Ingenieure 45, 1736–1741.
Ferrua, M.J., Singh, R.P., 2008. A nonintrusive flow measurement technique tovalidate the simulated laminar fluid flow in a packed container with ventedwalls. International Journal of Refrigeration 31, 242–255.
Gosman, A.D., Ioannides, E., 1981. Aspects of computer simulation of liquid fuelledcombustors. AIAA paper No. 81-0323.
Gouesbet, G., Berlemont, A., 1999. Eulerian and Lagrangian approaches forpredicting the behaviour of discrete particles in turbulent flows. Progress inEnergy and Combustion Sciences 25, 133–159.
Haider, A., Levenspiel, O., 1989. Drag coefficient and terminal velocity of sphericaland nonspherical particles. Powder technology 58, 63–70.
Hamdami, N., Monteau, J-Y., Le Bail, A., 2004. Simulation of coupled heat and masstransfer during freezing of a porous humid matrix. International Journal ofRefrigeration 27, 595–603.
Henriod, R.E., 2006. Postharvest characteristics of navel oranges following highhumidity and low temperature storage and transport. Postharvest Biology andTechnology 42, 57–64.
Hertog, M.L.A.T.M., Ben-Arie, R., Róth, E., Nicolaï, B.M., 2004. Humidity andtemperature effects on invasive and non-invasive firmness measures.Postharvest Biology and Technology 33, 79–91.
Hoang, M.L., Verboven, P., Baelmans, M., Nicolaï, B.M., 2003. A continuum model forairflow, heat and mass transfer in bulk of chicory roots. Transactions of theASAE 46 (6), 1603–1611.
Hoang, M.L., Verboven, P., De Baerdemaeker, J., Nicolaï, B.M., 2000. Analysis of airflow in a cold store by means of computational fluid dynamics. InternationalJournal of Refrigeration 23, 127–140.
Laguerre, O., Ben Amara, S., Alvarez, G., Flick, D., 2008. Transient heat transfer byfree convection in a packed bed of spheres: comparison between two modellingapproaches and experimental results. Applied Thermal Engineering 28, 14–24.
Masuoka, T., Takatsu, Y., 1996. Turbulence model for flow through porous media.International Journal of Heat and Mass Transfer 39 (13), 2803–2809.
Menter, F.R., 1994. Two equation Eddy-viscosity turbulence models for engineeringapplications. AIAA Journal 32 (8), 1598–1605.
Mirade, P-S., Picgirard, L., 2006. Improvement of ventilation homogeneity in anindustrial batch-type carcass chiller by CFD investigation. Food ResearchInternational 39, 871–881.
Moureh, J., Flick, D., 2004. Airflow pattern and temperature distribution in a typicalrefrigeration truck configuration loaded with pallets. International Journal ofRefrigeration 27, 464–474.
Nakayama, A., Kuwahara, F., 2005. Algebraic model for thermal dispersion heat fluxwithin porous media. AIChE Journal 51 (10), 2859–2864.
Nakayama, A., Kuwahara, F., 1999. A macroscopic turbulence model for flow in aporous medium. Journal of Fluids Engineering – Transactions of the ASME 121,427–433.
Nahor, H.B., Hoang, M.L., Verboven, P., Baelmans, M., Nicolaï, B.M., 2005. CFD modelof the airflow, heat and mass transfer in cooling stores. International Journal ofRefrigeration 28, 368–380.
Nguyen, T.A., Verboven, P., Schenk, A., Nicolaï, B.M., 2007. Prediction of water lossfrom pears (Pyrus communis cv. Conference) during controlled atmospherestorage as affected by relative humidity. Journal of Food Engineering 83, 149–155.
Paull, R.E., 1999. Effect of temperature and relative humidity on fresh commodityquality. Postharvest Biology and Technology 15, 263–277.
Rajan, R., Pandit, A.B., 2001. Correlations to predict droplet size in ultrasonicatomisation. Ultrasonics 39, 235–255.
Ranz, W.E., Marshall, W.R., 1952a. Evaporation from drops: Part I. ChemicalEngineering Progress 48, 141–146.
Ranz, W.E., Marshall, W.R., 1952b. Evaporation from drops: Part II. ChemicalEngineering Progress 48, 173–180.
Tassou, S.A., Xiang, W., 1998. Modelling the environment within a wet air-cooledvegetable store. Journal of Food Engineering 38, 169–187.
Tso, C.P., Cheng, Y.C., Lai, A.C.K., 2006. An improved model for predictingperformance of finned tube heat exchanger under frosting condition, withfrost thickness variation along fin. Applied Thermal Engineering 26, 111–120.
Tu, K., Nicolaï, B., De Baerdemaeker, J., 2000. Effect of relative humidity on Applequality under simulated shelf temperature storage. Scientia Horticulturae 85,217–229.
Verboven, P., Flick, D., Nicolaï, B.M., Alvarez, G., 2006. Modelling transportphenomena in refrigerated food bulks, packages and stacks: basics andadvances. International Journal of Refrigeration 29, 985–997.
Versteeg, H.K., Malalasekera, W., 1995. An introduction to Computational FluidDynamics–The Finite Volume Method. John Wiley and sons, New York, USA.
Wilcox, D.C., 2000. Turbulence Modeling for CFD, second ed. DCW Industries, Inc., LaCanada, California, USA.
Xu, Y., Burfoot, D., 1999. Simulating the bulk storage of food stuffs. Journal of FoodEngineering 39, 23–29.
M.A. Delele et al. / Journal of Food Engineering 91 (2009) 228–239 239
Copyright © 2022 FDOKUMEN