Optimization of brass contents for best combination of tribo-performance and thermal conductivity of...
14
Available online at www.sciencedirect.com Wear 265 (2008) 699–712 Optimization of brass contents for best combination of tribo-performance and thermal conductivity of non-asbestos organic (NAO) friction composites Jayashree Bijwe a,∗ , Mukesh Kumar a , P.V. Gurunath a , Yannick Desplanques b , G’erard Degallaix b a Industrial Tribology Machine Dynamics and Maintenance Engineering Centre, Indian Institute of Technology Delhi, Hauz Khas, New Delhi 110 016, India b Laboratoire de M’ecanique de Lille (UMR CNRS 8107), Ecole Centrale de Lille, BP 48, F59651 Villeneuve d’Ascq Cedex, France Received 19 July 2007; received in revised form 7 December 2007; accepted 19 December 2007 Available online 4 March 2008 Abstract Thermal conductivity (TC) of composites especially friction composites plays a vital role in the performance during braking. Low TC renders the tribo-surface vulnerable for degradation of organic ingredients affecting the braking capability adversely while too high TC on the other hand, results in adverse effect on brake-fluid. Simultaneously it is also required that the composite should exhibit best possible combination of performance properties as a friction material. The optimum combination of various properties hence is to be tailored with right contents of metallic fillers. In this paper the effect of brass fibers in increasing amount on friction and wear performance of non-asbestos organic (NAO) friction composites was studied. Four friction materials based on parent composition and with varying amount of brass (0, 4, 8 and 12 wt%) and barite (35, 31, 27, and 23 wt%) in a complementary manner were developed as brake pads and were characterized for physical, chemical and mechanical properties. These were further tested for their friction and wear behavior in fade and recovery (F & R) mode on a Krauss machine as per ECE R 90 schedule. Moreover, the small specimens (24 mm × 24 mm) of the brake pad were evaluated for studying their friction sensitivity for loads and speeds in simulated braking conditions against a commercial disc on a reduced scale prototype (RSP). Composite with 8% brass fibers (where TC was not highest) proved to exhibit best combination of performance parameters related to friction and wear in both the testing modes. Scanning electron microscopy (SEM) and energy dispersive X-ray analysis (EDAX) were employed to understand wear mechanisms. © 2007 Elsevier B.V. All rights reserved. Keywords: Non-asbestos organic (NAO) friction composites; Thermal conductivity of friction composites; Fade and recovery studies; Load–speed sensitivity of friction composites; Brass fibers in friction composites 1. Introduction Non-asbestos organic (NAO) fiber reinforced low metallic composites are increasingly being used in automotive brake disc pads, shoes, linings, blocks, clutch facings, etc. primar- ily because of awareness of health hazardness of asbestos. They are essentially multi-ingredient systems in order to achieve the desired amalgam of performance properties [1,2] and more than several hundred ingredients have been reported being used for friction composites in the literature. These are categorized as binder, fibers, friction modifiers and fillers based on the major function they perform. Binder is a resin mainly phenolic based, whose function is to hold all the ingredients very firmly so that they can contribute towards their major functions. While fibers ∗ Corresponding author. Tel.: +91 11 26591280; fax: +91 11 26591280. E-mail address: [email protected] (J. Bijwe). such as mineral, ceramics, organic and metallic types provide mainly strength, wear resistance and raise the friction level, in general. Friction modifiers such as abrasives and solid lubricants are used to achieve the desired range of friction with minimal fluctuations. The class of fillers is again subdivided as functional fillers (to enhance the specific function such as resistance to fade, thermal conductivity, etc.) and space/inert fillers (mainly to cut the cost). A lot is reported on the influence of these ingredients in friction composites on tribo-performance in various testing situations such as fade and recovery, load, speed, etc. [3–7]. Metallic fillers contents are important in friction materi- als since they control the conductivity of composites apart from additional functions such as wear resistance, strength, etc. Comparatively little is reported on metallic contents in non-asbestos friction materials in this context [8–10]. Thermo- physical properties such as specific heat, thermal conductivity (TC), diffusivity, thermal expansion, etc. play vital roles in per- formance of brake pads, especially when braking is severe. Low 0043-1648/$ – see front matter © 2007 Elsevier B.V. All rights reserved. doi:10.1016/j.wear.2007.12.016
-
Upload
independent -
Category
Documents
-
view
0 -
download
0
Transcript of Optimization of brass contents for best combination of tribo-performance and thermal conductivity of...
A
tiptwaTMshm©
Kf
1
cdiadsfbfwt
0d
Available online at www.sciencedirect.com
Wear 265 (2008) 699–712
Optimization of brass contents for best combination of tribo-performanceand thermal conductivity of non-asbestos organic (NAO) friction composites
Jayashree Bijwe a,∗, Mukesh Kumar a, P.V. Gurunath a, Yannick Desplanques b, G’erard Degallaix b
a Industrial Tribology Machine Dynamics and Maintenance Engineering Centre, Indian Institute of Technology Delhi, Hauz Khas, New Delhi 110 016, Indiab Laboratoire de M’ecanique de Lille (UMR CNRS 8107), Ecole Centrale de Lille, BP 48, F59651 Villeneuve d’Ascq Cedex, France
Received 19 July 2007; received in revised form 7 December 2007; accepted 19 December 2007Available online 4 March 2008
bstract
Thermal conductivity (TC) of composites especially friction composites plays a vital role in the performance during braking. Low TC renders theribo-surface vulnerable for degradation of organic ingredients affecting the braking capability adversely while too high TC on the other hand, resultsn adverse effect on brake-fluid. Simultaneously it is also required that the composite should exhibit best possible combination of performanceroperties as a friction material. The optimum combination of various properties hence is to be tailored with right contents of metallic fillers. Inhis paper the effect of brass fibers in increasing amount on friction and wear performance of non-asbestos organic (NAO) friction compositesas studied. Four friction materials based on parent composition and with varying amount of brass (0, 4, 8 and 12 wt%) and barite (35, 31, 27,
nd 23 wt%) in a complementary manner were developed as brake pads and were characterized for physical, chemical and mechanical properties.hese were further tested for their friction and wear behavior in fade and recovery (F & R) mode on a Krauss machine as per ECE R 90 schedule.oreover, the small specimens (24 mm × 24 mm) of the brake pad were evaluated for studying their friction sensitivity for loads and speeds in
imulated braking conditions against a commercial disc on a reduced scale prototype (RSP). Composite with 8% brass fibers (where TC was notighest) proved to exhibit best combination of performance parameters related to friction and wear in both the testing modes. Scanning electronicroscopy (SEM) and energy dispersive X-ray analysis (EDAX) were employed to understand wear mechanisms.2007 Elsevier B.V. All rights reserved.
tivity
smgaflfittis
eywords: Non-asbestos organic (NAO) friction composites; Thermal conducriction composites; Brass fibers in friction composites
. Introduction
Non-asbestos organic (NAO) fiber reinforced low metallicomposites are increasingly being used in automotive brakeisc pads, shoes, linings, blocks, clutch facings, etc. primar-ly because of awareness of health hazardness of asbestos. Theyre essentially multi-ingredient systems in order to achieve theesired amalgam of performance properties [1,2] and more thaneveral hundred ingredients have been reported being used forriction composites in the literature. These are categorized asinder, fibers, friction modifiers and fillers based on the major
unction they perform. Binder is a resin mainly phenolic based,hose function is to hold all the ingredients very firmly so thathey can contribute towards their major functions. While fibers
∗ Corresponding author. Tel.: +91 11 26591280; fax: +91 11 26591280.E-mail address: [email protected] (J. Bijwe).
afenp(f
043-1648/$ – see front matter © 2007 Elsevier B.V. All rights reserved.oi:10.1016/j.wear.2007.12.016
of friction composites; Fade and recovery studies; Load–speed sensitivity of
uch as mineral, ceramics, organic and metallic types provideainly strength, wear resistance and raise the friction level, in
eneral. Friction modifiers such as abrasives and solid lubricantsre used to achieve the desired range of friction with minimaluctuations. The class of fillers is again subdivided as functionalllers (to enhance the specific function such as resistance to fade,
hermal conductivity, etc.) and space/inert fillers (mainly to cuthe cost). A lot is reported on the influence of these ingredientsn friction composites on tribo-performance in various testingituations such as fade and recovery, load, speed, etc. [3–7].
Metallic fillers contents are important in friction materi-ls since they control the conductivity of composites apartrom additional functions such as wear resistance, strength,tc. Comparatively little is reported on metallic contents in
on-asbestos friction materials in this context [8–10]. Thermo-hysical properties such as specific heat, thermal conductivityTC), diffusivity, thermal expansion, etc. play vital roles in per-ormance of brake pads, especially when braking is severe. Low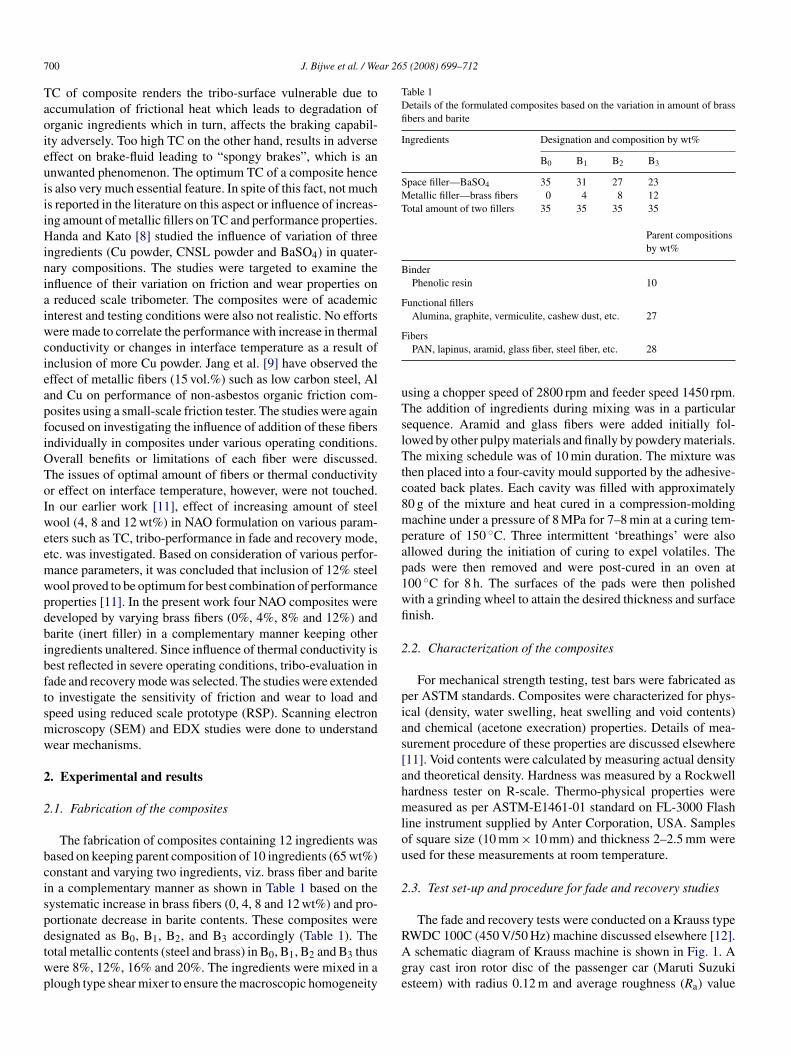
7 ar 265 (2008) 699–712
TaoieuiiiHiniaiwcieapfiOToIweemwpdbibftsmw
2
2
bcispdtwp
Table 1Details of the formulated composites based on the variation in amount of brassfibers and barite
Ingredients Designation and composition by wt%
B0 B1 B2 B3
Space filler—BaSO4 35 31 27 23Metallic filler—brass fibers 0 4 8 12Total amount of two fillers 35 35 35 35
Parent compositionsby wt%
BinderPhenolic resin 10
Functional fillersAlumina, graphite, vermiculite, cashew dust, etc. 27
F
uTslTtc8mpap1wfi
2
pias[ahmlou
2
00 J. Bijwe et al. / We
C of composite renders the tribo-surface vulnerable due toccumulation of frictional heat which leads to degradation ofrganic ingredients which in turn, affects the braking capabil-ty adversely. Too high TC on the other hand, results in adverseffect on brake-fluid leading to “spongy brakes”, which is annwanted phenomenon. The optimum TC of a composite hences also very much essential feature. In spite of this fact, not muchs reported in the literature on this aspect or influence of increas-ng amount of metallic fillers on TC and performance properties.anda and Kato [8] studied the influence of variation of three
ngredients (Cu powder, CNSL powder and BaSO4) in quater-ary compositions. The studies were targeted to examine thenfluence of their variation on friction and wear properties onreduced scale tribometer. The composites were of academic
nterest and testing conditions were also not realistic. No effortsere made to correlate the performance with increase in thermal
onductivity or changes in interface temperature as a result ofnclusion of more Cu powder. Jang et al. [9] have observed theffect of metallic fibers (15 vol.%) such as low carbon steel, Alnd Cu on performance of non-asbestos organic friction com-osites using a small-scale friction tester. The studies were againocused on investigating the influence of addition of these fibersndividually in composites under various operating conditions.verall benefits or limitations of each fiber were discussed.he issues of optimal amount of fibers or thermal conductivityr effect on interface temperature, however, were not touched.n our earlier work [11], effect of increasing amount of steelool (4, 8 and 12 wt%) in NAO formulation on various param-
ters such as TC, tribo-performance in fade and recovery mode,tc. was investigated. Based on consideration of various perfor-ance parameters, it was concluded that inclusion of 12% steelool proved to be optimum for best combination of performanceroperties [11]. In the present work four NAO composites wereeveloped by varying brass fibers (0%, 4%, 8% and 12%) andarite (inert filler) in a complementary manner keeping otherngredients unaltered. Since influence of thermal conductivity isest reflected in severe operating conditions, tribo-evaluation inade and recovery mode was selected. The studies were extendedo investigate the sensitivity of friction and wear to load andpeed using reduced scale prototype (RSP). Scanning electronicroscopy (SEM) and EDX studies were done to understandear mechanisms.
. Experimental and results
.1. Fabrication of the composites
The fabrication of composites containing 12 ingredients wasased on keeping parent composition of 10 ingredients (65 wt%)onstant and varying two ingredients, viz. brass fiber and bariten a complementary manner as shown in Table 1 based on theystematic increase in brass fibers (0, 4, 8 and 12 wt%) and pro-ortionate decrease in barite contents. These composites were
esignated as B0, B1, B2, and B3 accordingly (Table 1). Theotal metallic contents (steel and brass) in B0, B1, B2 and B3 thusere 8%, 12%, 16% and 20%. The ingredients were mixed in alough type shear mixer to ensure the macroscopic homogeneityRAge
ibersPAN, lapinus, aramid, glass fiber, steel fiber, etc. 28
sing a chopper speed of 2800 rpm and feeder speed 1450 rpm.he addition of ingredients during mixing was in a particularequence. Aramid and glass fibers were added initially fol-owed by other pulpy materials and finally by powdery materials.he mixing schedule was of 10 min duration. The mixture was
hen placed into a four-cavity mould supported by the adhesive-oated back plates. Each cavity was filled with approximately0 g of the mixture and heat cured in a compression-moldingachine under a pressure of 8 MPa for 7–8 min at a curing tem-
erature of 150 ◦C. Three intermittent ‘breathings’ were alsollowed during the initiation of curing to expel volatiles. Theads were then removed and were post-cured in an oven at00 ◦C for 8 h. The surfaces of the pads were then polishedith a grinding wheel to attain the desired thickness and surfacenish.
.2. Characterization of the composites
For mechanical strength testing, test bars were fabricated aser ASTM standards. Composites were characterized for phys-cal (density, water swelling, heat swelling and void contents)nd chemical (acetone execration) properties. Details of mea-urement procedure of these properties are discussed elsewhere11]. Void contents were calculated by measuring actual densitynd theoretical density. Hardness was measured by a Rockwellardness tester on R-scale. Thermo-physical properties wereeasured as per ASTM-E1461-01 standard on FL-3000 Flash
ine instrument supplied by Anter Corporation, USA. Samplesf square size (10 mm × 10 mm) and thickness 2–2.5 mm weresed for these measurements at room temperature.
.3. Test set-up and procedure for fade and recovery studies
The fade and recovery tests were conducted on a Krauss type
WDC 100C (450 V/50 Hz) machine discussed elsewhere [12].schematic diagram of Krauss machine is shown in Fig. 1. Aray cast iron rotor disc of the passenger car (Maruti Suzukisteem) with radius 0.12 m and average roughness (Ra) value
J. Bijwe et al. / Wear 265 (2008) 699–712 701
Table 2Physical and mechanical properties of the selected composites
Properties B0 B1 B2 B3
Density (g/cm3) 2.27 2.29 2.33 2.38Acetone extraction (%) 1.18 0.40 0.35 0.60Water absorption (%) 0.73 0.32 0.56 0.70Void content (%) (theoretical) 1.98 2.08 3.03 3.52Heat swelling (%) 1.47 1.78 2.23 2.52Tensile strength (MPa) ASTM D 638 11.64 10.97 10.01 8.22Tensile modulus (GPa) ASTM D 638 0.42 0.35 0.39 0.33Flexural strength (MPa) ASTM D 790 37.34 29.60 28.91 27.26Flexural modulus (GPa) (ASTM D790) 7.35 6.31 5.97 5.77Rockwell hardness (R-scale) 118 116 116 114Diffusivity (×10−4 cm2/s) 92 100 105 108SC
3aiovldm(opdostsB
F(2a
Table 3aEssence of ECE R-90 frictional response of the selected composites
Properties B0 B1 B2 B3
μperformance 0.377 0.358 0.366 0.386μrecovery 0.466 0.412 0.391 0.400μfade 0.299 0.307 0.327 0.307μmin 0.138 0.153 0.157 0.161μmax 0.466 0.413 0.409 0.440�μ (μmax − μmin) 0.328 0.260 0.252 0.279% Fade 21 14 11 18% Recovery 124 115 107 104WT
idrSd
2f
iFr&t1
pecific heat (J/(kg K)) 730.6 737.9 833.8 855.8onductivity (W/(m K)) 1.53 1.69 2.04 2.20
.38 �m was used as a counterface. Details about testing methodre explained elsewhere [13]. The software computes the var-ous values of performance parameters. Important definitionsf performance parameters are presented in Appendix A. Wearolume of the composites was calculated by measuring weightoss and density data. For each composite new disc was used. Alliscs were purchased from the same lot to avoid variations due toanufacturing. The constant speed (660 rpm), constant interval
5 s) and constant pressure (1.8 MPa) R-90 frictional responsef the composites is summarized in Table 3a. It incorporates theerformance μ, the fade μ, the recovery μ, temperature rise inisc and wear of pads. In Table 3b results on similar series withnly difference of steel fibers in our earlier work [11] has beenhown for the sake of comparison. The μ and corresponding
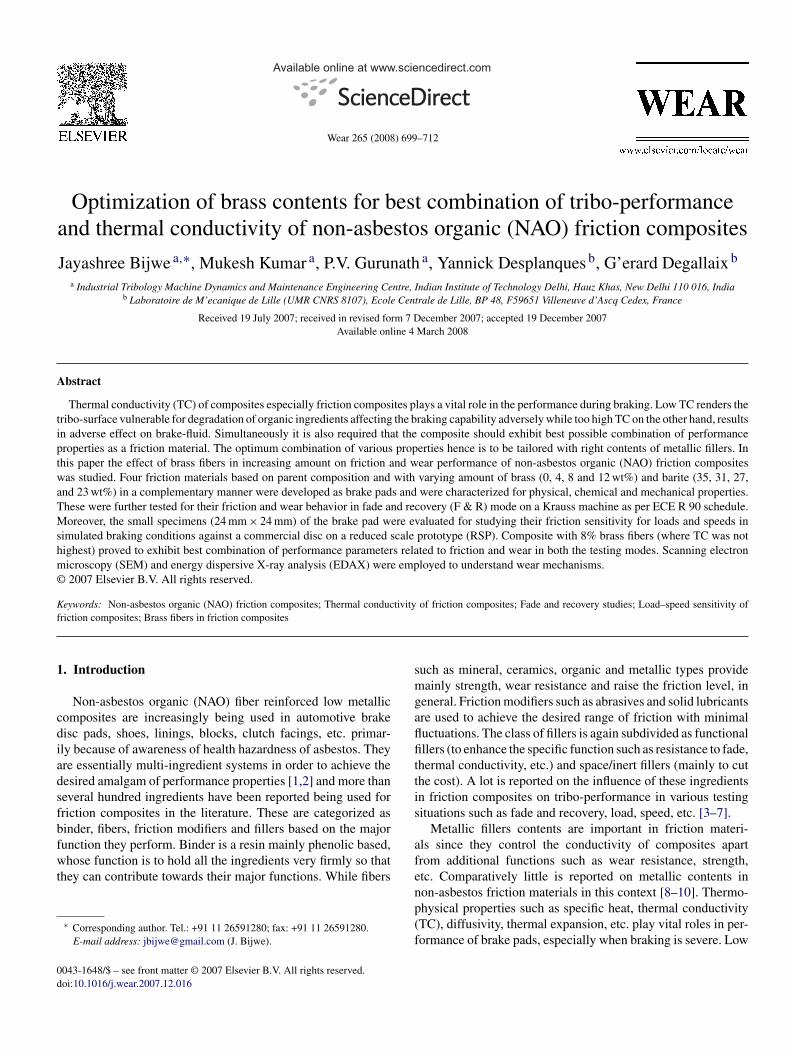
emperature rise during each braking application are plotted as aeven step friction assessment test graphs for all composites (B0,1, B2, and B3) and are shown in Fig. 2a–d. Wear of compositesig. 1. Schematic diagram of Krauss machine for fade and recovery tests.1) Compressed air supply; (2) bearings movable; (3) bearings; (4) option SH.5 kg m2; (5) emergency stop option; (6) bearings; (7) options SH 5 kg m2; (8)ir inlet; (9) dc motor; (10) clutch at option SH; (11) belt drive; (12) generator.
wdtioacdTa
TEv
P
μ
μ
μ
μ
μ
%%WT�
tS
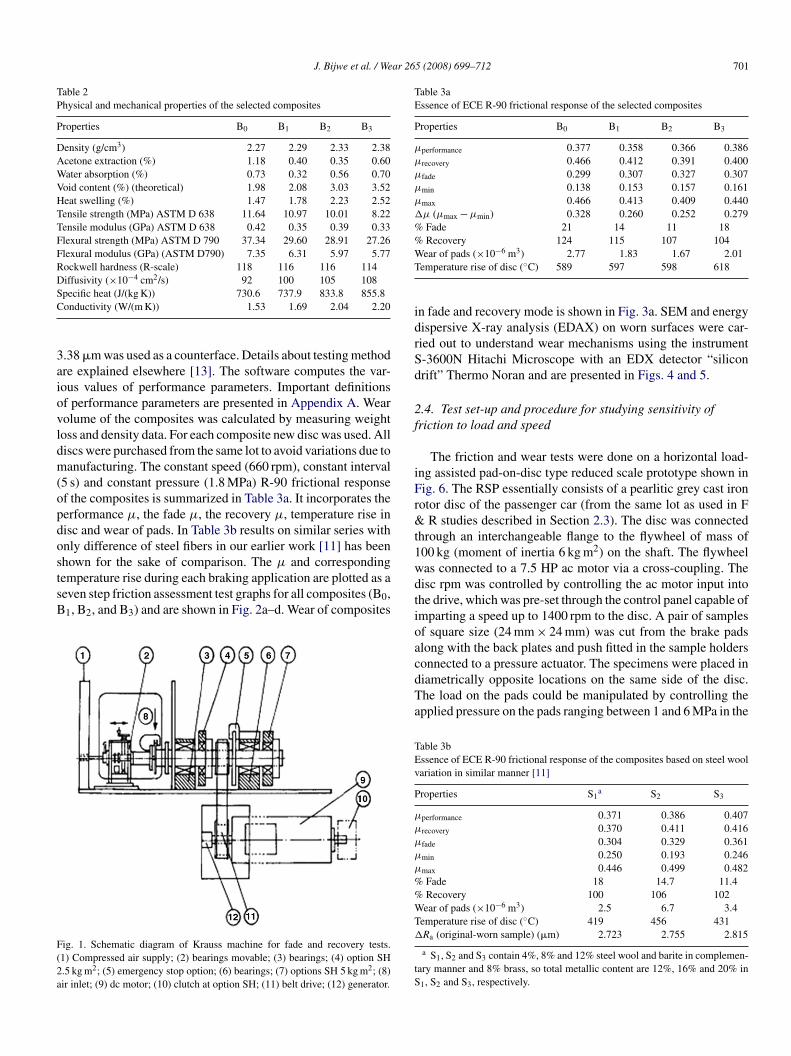
ear of pads (×10−6 m3) 2.77 1.83 1.67 2.01emperature rise of disc (◦C) 589 597 598 618
n fade and recovery mode is shown in Fig. 3a. SEM and energyispersive X-ray analysis (EDAX) on worn surfaces were car-ied out to understand wear mechanisms using the instrument-3600N Hitachi Microscope with an EDX detector “siliconrift” Thermo Noran and are presented in Figs. 4 and 5.
.4. Test set-up and procedure for studying sensitivity ofriction to load and speed
The friction and wear tests were done on a horizontal load-ng assisted pad-on-disc type reduced scale prototype shown inig. 6. The RSP essentially consists of a pearlitic grey cast ironotor disc of the passenger car (from the same lot as used in F
R studies described in Section 2.3). The disc was connectedhrough an interchangeable flange to the flywheel of mass of00 kg (moment of inertia 6 kg m2) on the shaft. The flywheelas connected to a 7.5 HP ac motor via a cross-coupling. Theisc rpm was controlled by controlling the ac motor input intohe drive, which was pre-set through the control panel capable ofmparting a speed up to 1400 rpm to the disc. A pair of samplesf square size (24 mm × 24 mm) was cut from the brake padslong with the back plates and push fitted in the sample holders
onnected to a pressure actuator. The specimens were placed iniametrically opposite locations on the same side of the disc.he load on the pads could be manipulated by controlling thepplied pressure on the pads ranging between 1 and 6 MPa in theable 3bssence of ECE R-90 frictional response of the composites based on steel woolariation in similar manner [11]
roperties S1a S2 S3
performance 0.371 0.386 0.407
recovery 0.370 0.411 0.416
fade 0.304 0.329 0.361
min 0.250 0.193 0.246
max 0.446 0.499 0.482Fade 18 14.7 11.4Recovery 100 106 102ear of pads (×10−6 m3) 2.5 6.7 3.4
emperature rise of disc (◦C) 419 456 431Ra (original-worn sample) (�m) 2.723 2.755 2.815
a S1, S2 and S3 contain 4%, 8% and 12% steel wool and barite in complemen-ary manner and 8% brass, so total metallic content are 12%, 16% and 20% in
1, S2 and S3, respectively.
702 J. Bijwe et al. / Wear 265 (2008) 699–712
Fig. 2. Fade and recovery cycles for selected composites: (a) composite B0, (b) composite B1, (c) composite B2, and (d) composite B3.
comp
stvaacitbamt
oto braking cycles on the RSP under a series of braking pressureand speed as described in Table 4. For each composite, three newspecimens were used for each pressure such as P1, P2 and P3.Braking duration (touch time) and number of brakings in each
Table 4Experimental design for tribo-evaluation of composites
Fig. 3. Histograms showing wear of the selected
teps of 0.1 MPa. The load cell attached to the frame carryinghe specimen holder measured the frictional force. The operatingariables conforming to a particular experimental design suchs applied pressure, rubbing speed, number of braking cyclesnd braking duration could be pre-set in the programmer on theontroller. The specimens were ground to a thickness of approx-mately 1.5 cm (including back plate). The uniform contact ofhe friction surface was assured through a few cycles of initial
edding-in operation under a nominal pressure of 1 MPa and atlinear speed of 5.03 m/s on the disc. This was done to ensureore than 80% of conformal contact. The samples were cleanedo remove the loose wear debris followed by the initial weighing
O
PL
osites for (a) Krause testing and (b) RSP testing.
f the sample after cooling. The specimens were then subjected
perating variables Experimental design
ressure (MPa) 2, 3 and 4inear speed (m/s)/rpm 10.0/800, 12.5/1000 and 15.0/1200
J. Bijwe et al. / Wear 265 (2008) 699–712 703
Table 5Increase in the temperature of surfaces of discs and composites tested on RSP under various conditions of loads and speeds
Samples Parameters
Speed10 m/s (800 rpm) Speed 12.5 m/s (1000 rpm) Speed-15 m/s (1200 rpm)
2 MPa 3 MPa 4 MPa 2 MPa 3 MPa 4 MPa 2 MPa 3 MPa 4 MPa
Disc temperature (◦C)B0 56 64 67 63 83 83 75 107 108B1 55 65 76 71 84 104 83 106 115B2 53 62 63 65 89 95 82 110 110B3 48 57 67 66 83 91 74 91 103
Pad temperature (◦C)B0 108 122 114 113 152 191 138 179 239
161817
cadCaircwfiw
te
atoo
F4iB
B1 100 114 144 138B2 65 112 123 114B3 80 103 118 116
ycle were constant as 1 s and 25, respectively. Initial temper-ture of the disc was 25 ◦C. The temperature of specimen andisc was measured with laser gun (Quick temp 860-T3, Testoo., Germany make) after each experiment to have a rough ideabout trends in increase in temperature after completion of brak-ng cycles and are shown in Table 5. The frictional force wasecorded continuously on the PC and the built in software cal-
ulated the average value. In the final display 25 values of μere recorded as a function of 25 cycles. The μ stabilized afterrst 10 cycles in general. Hence the mean μ of last 15 cyclesas calculated and considered as representative value (μm) for
�
i(r
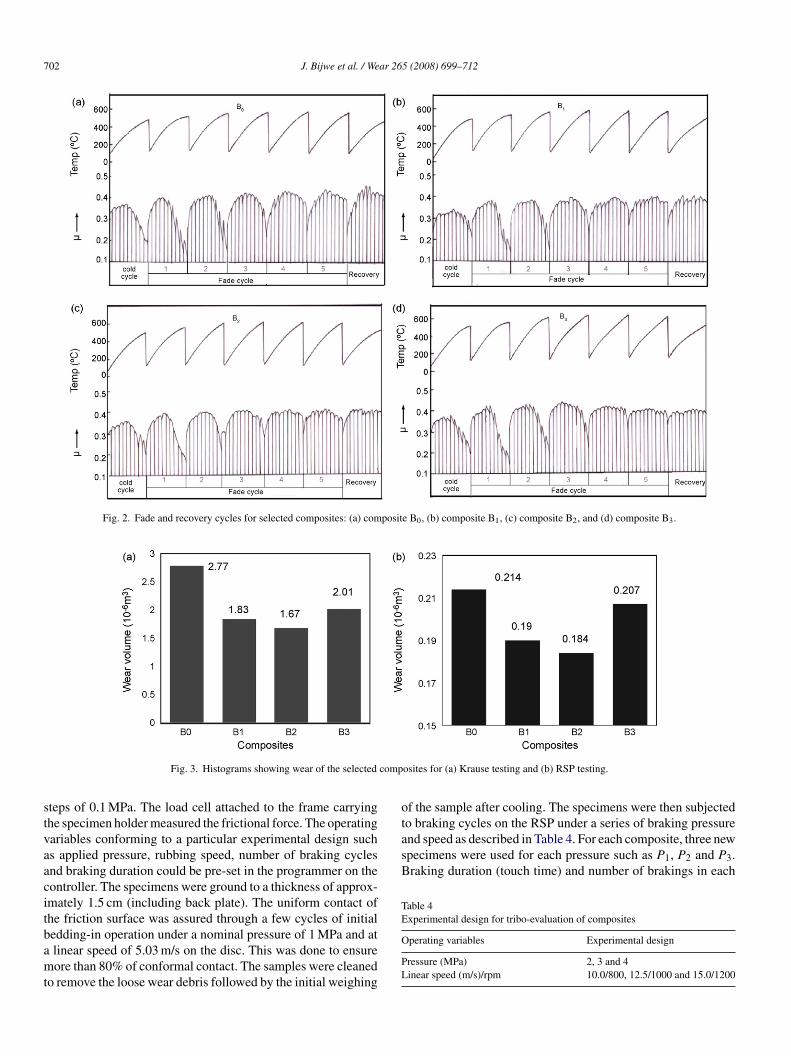
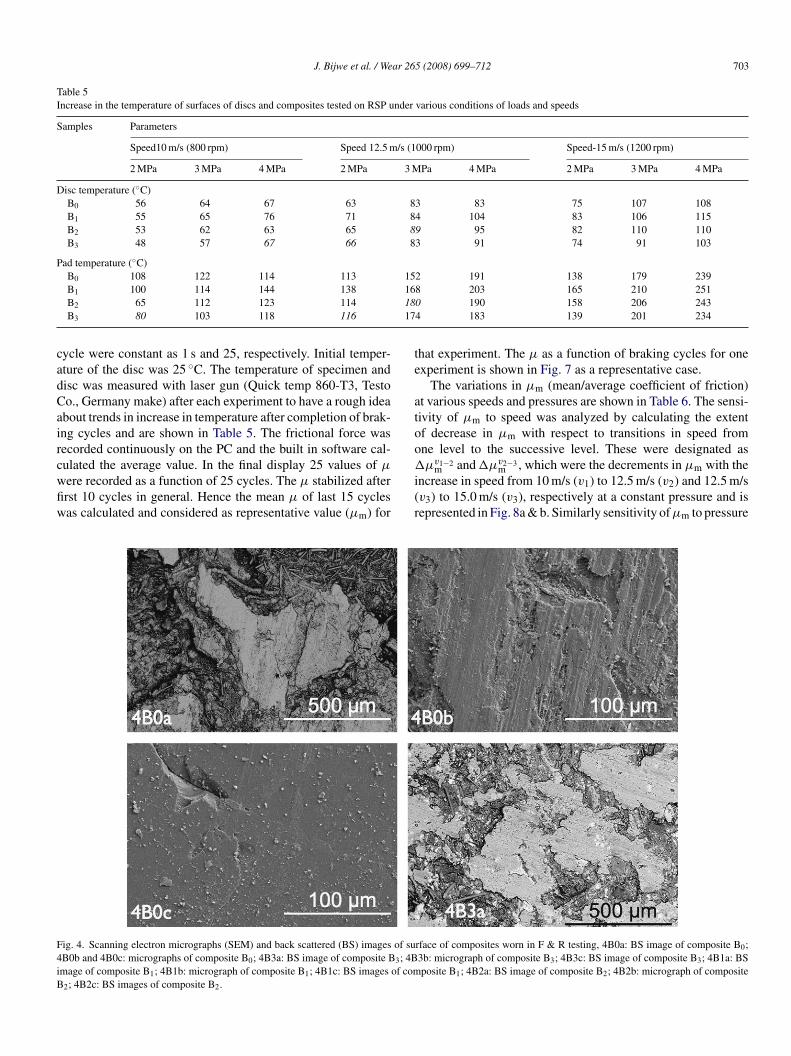
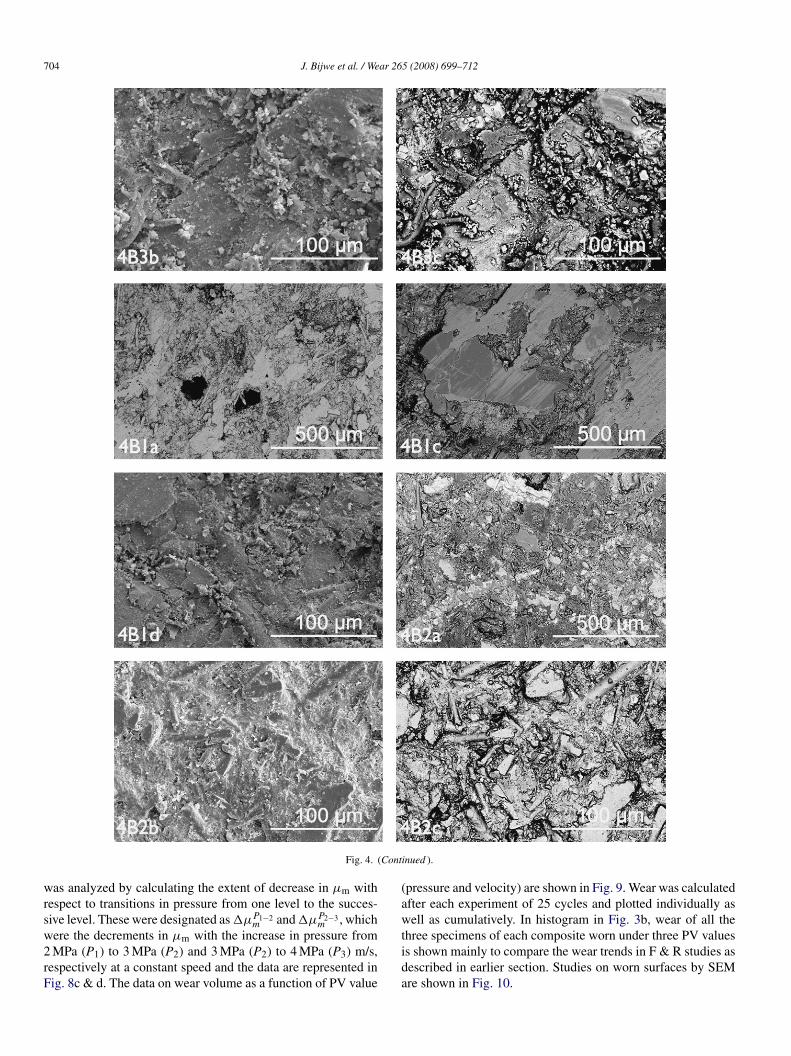
ig. 4. Scanning electron micrographs (SEM) and back scattered (BS) images of suB0b and 4B0c: micrographs of composite B0; 4B3a: BS image of composite B3; 4Bmage of composite B1; 4B1b: micrograph of composite B1; 4B1c: BS images of com
2; 4B2c: BS images of composite B2.
8 203 165 210 2510 190 158 206 2434 183 139 201 234
hat experiment. The μ as a function of braking cycles for onexperiment is shown in Fig. 7 as a representative case.
The variations in μm (mean/average coefficient of friction)t various speeds and pressures are shown in Table 6. The sensi-ivity of μm to speed was analyzed by calculating the extentf decrease in μm with respect to transitions in speed fromne level to the successive level. These were designated as
v1−2 v2−3
μm and �μm , which were the decrements in μm with thencrease in speed from 10 m/s (v1) to 12.5 m/s (v2) and 12.5 m/sv3) to 15.0 m/s (v3), respectively at a constant pressure and isepresented in Fig. 8a & b. Similarly sensitivity of μm to pressurerface of composites worn in F & R testing, 4B0a: BS image of composite B0;3b: micrograph of composite B3; 4B3c: BS image of composite B3; 4B1a: BSposite B1; 4B2a: BS image of composite B2; 4B2b: micrograph of composite
704 J. Bijwe et al. / Wear 265 (2008) 699–712
Cont
wrsw2rF
(aw
Fig. 4. (
as analyzed by calculating the extent of decrease in μm withespect to transitions in pressure from one level to the succes-ive level. These were designated as �μP1−2
m and �μP2−3m , which
ere the decrements in μm with the increase in pressure fromMPa (P1) to 3 MPa (P2) and 3 MPa (P2) to 4 MPa (P3) m/s,
espectively at a constant speed and the data are represented inig. 8c & d. The data on wear volume as a function of PV value
tida
inued ).
pressure and velocity) are shown in Fig. 9. Wear was calculatedfter each experiment of 25 cycles and plotted individually asell as cumulatively. In histogram in Fig. 3b, wear of all the
hree specimens of each composite worn under three PV valuess shown mainly to compare the wear trends in F & R studies asescribed in earlier section. Studies on worn surfaces by SEMre shown in Fig. 10.
J. Bijwe et al. / Wear 265 (2008) 699–712 705
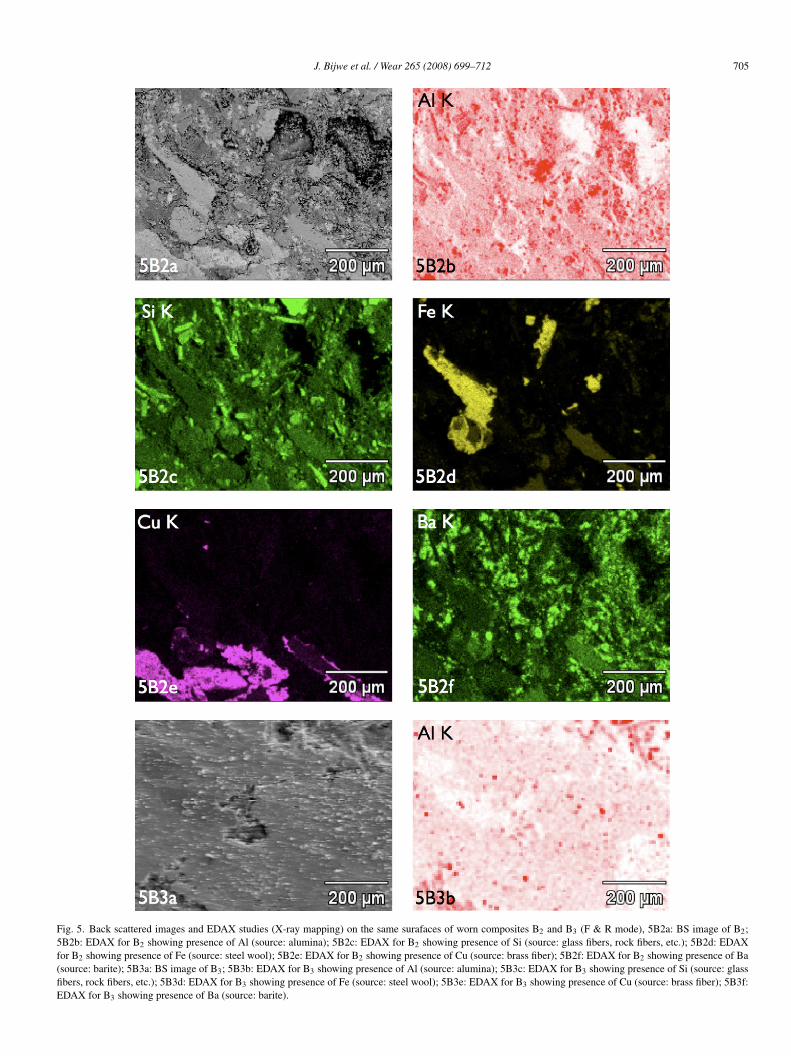
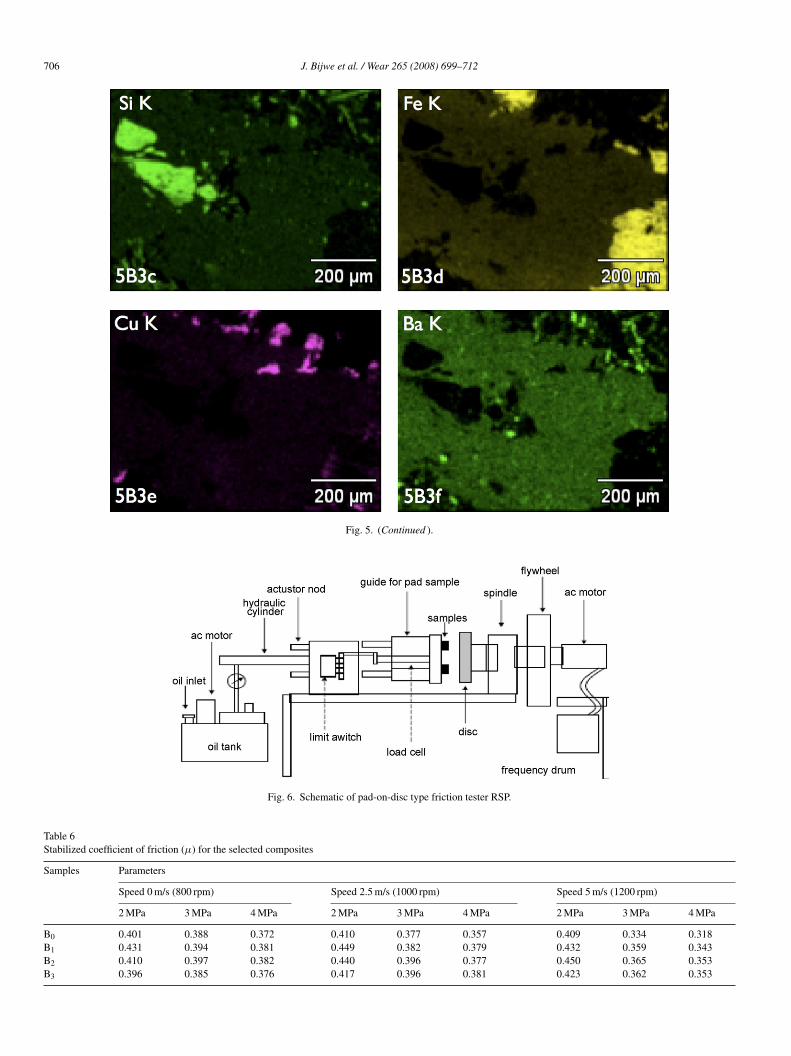
Fig. 5. Back scattered images and EDAX studies (X-ray mapping) on the same surafaces of worn composites B2 and B3 (F & R mode), 5B2a: BS image of B2;5B2b: EDAX for B2 showing presence of Al (source: alumina); 5B2c: EDAX for B2 showing presence of Si (source: glass fibers, rock fibers, etc.); 5B2d: EDAXfor B2 showing presence of Fe (source: steel wool); 5B2e: EDAX for B2 showing presence of Cu (source: brass fiber); 5B2f: EDAX for B2 showing presence of Ba(source: barite); 5B3a: BS image of B3; 5B3b: EDAX for B3 showing presence of Al (source: alumina); 5B3c: EDAX for B3 showing presence of Si (source: glassfibers, rock fibers, etc.); 5B3d: EDAX for B3 showing presence of Fe (source: steel wool); 5B3e: EDAX for B3 showing presence of Cu (source: brass fiber); 5B3f:EDAX for B3 showing presence of Ba (source: barite).
706 J. Bijwe et al. / Wear 265 (2008) 699–712
Fig. 5. (Continued ).
Fig. 6. Schematic of pad-on-disc type friction tester RSP.
Table 6Stabilized coefficient of friction (μ) for the selected composites
Samples Parameters
Speed 0 m/s (800 rpm) Speed 2.5 m/s (1000 rpm) Speed 5 m/s (1200 rpm)
2 MPa 3 MPa 4 MPa 2 MPa 3 MPa 4 MPa 2 MPa 3 MPa 4 MPa
B0 0.401 0.388 0.372 0.410 0.377 0.357 0.409 0.334 0.318B1 0.431 0.394 0.381 0.449 0.382 0.379 0.432 0.359 0.343B2 0.410 0.397 0.382 0.440 0.396 0.377 0.450 0.365 0.353B3 0.396 0.385 0.376 0.417 0.396 0.381 0.423 0.362 0.353
J. Bijwe et al. / Wear 265 (2008) 699–712 707
Fb
3
3
cfitwhbts
FP
fiwficifio
F(P
ig. 7. Representative graph of the data received from RSP (μ as a function ofraking cycles).
. Discussion on results
.1. Physical and mechanical properties
As seen from the Table 2 it was observed that the density ofomposites showed increasing trend because of addition of brassbers, which is heavier than the filler barite. Acetone extrac-
ion indicates amount of uncured resin in the composites, whichas negligible in all the composites except B0 where it was
ighest (1.1%). Void contents increased slowly with increase inrass fibers because of larger size of brass fiber as comparedo barite powdery particles. The heat swelling also showed theame trend as expected because of higher expansion of brassIomt
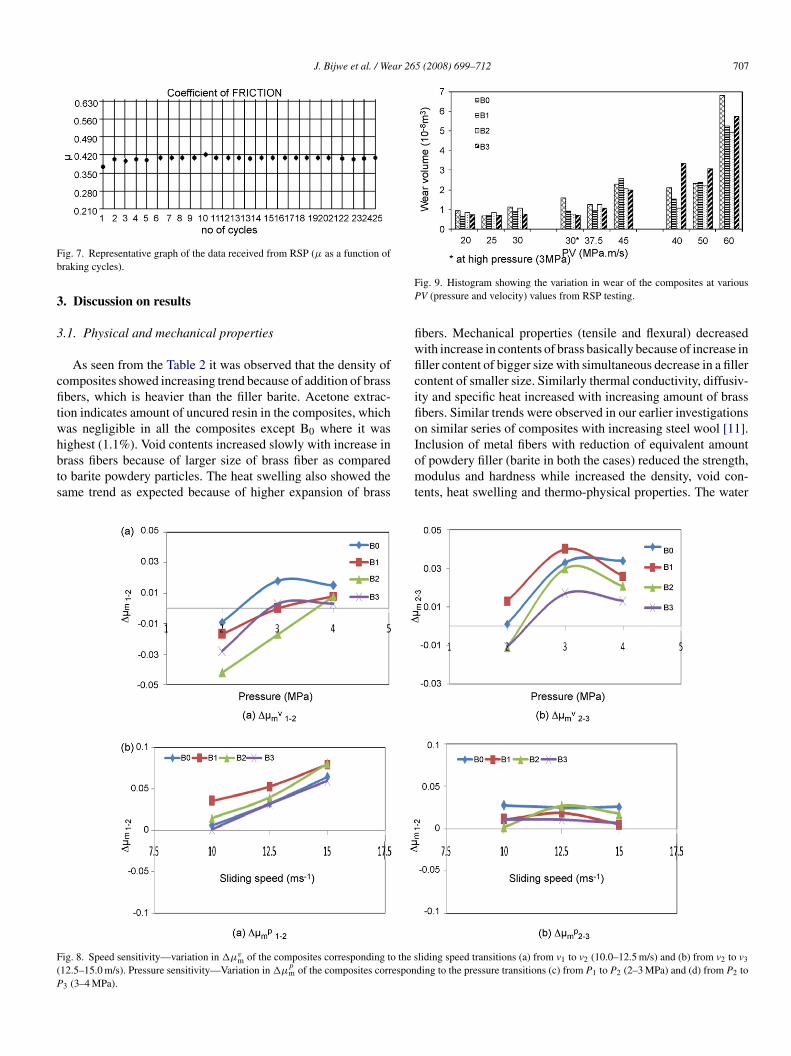
ig. 8. Speed sensitivity—variation in �μvm of the composites corresponding to the s
12.5–15.0 m/s). Pressure sensitivity—Variation in �μpm of the composites correspon
3 (3–4 MPa).
ig. 9. Histogram showing the variation in wear of the composites at variousV (pressure and velocity) values from RSP testing.
bers. Mechanical properties (tensile and flexural) decreasedith increase in contents of brass basically because of increase inller content of bigger size with simultaneous decrease in a fillerontent of smaller size. Similarly thermal conductivity, diffusiv-ty and specific heat increased with increasing amount of brassbers. Similar trends were observed in our earlier investigationsn similar series of composites with increasing steel wool [11].
nclusion of metal fibers with reduction of equivalent amountf powdery filler (barite in both the cases) reduced the strength,odulus and hardness while increased the density, void con-ents, heat swelling and thermo-physical properties. The water
liding speed transitions (a) from v1 to v2 (10.0–12.5 m/s) and (b) from v2 to v3
ding to the pressure transitions (c) from P1 to P2 (2–3 MPa) and (d) from P2 to
708 J. Bijwe et al. / Wear 265 (2008) 699–712
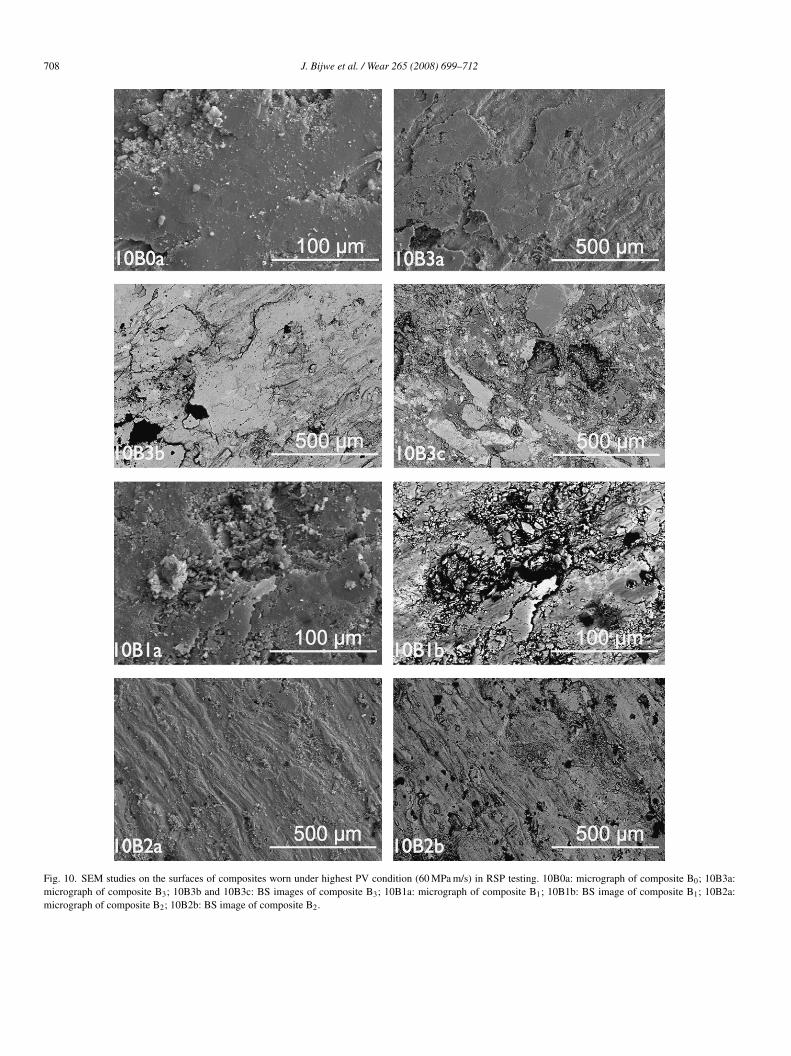
Fig. 10. SEM studies on the surfaces of composites worn under highest PV condition (60 MPa m/s) in RSP testing. 10B0a: micrograph of composite B0; 10B3a:micrograph of composite B3; 10B3b and 10B3c: BS images of composite B3; 10B1a: micrograph of composite B1; 10B1b: BS image of composite B1; 10B2a:micrograph of composite B2; 10B2b: BS image of composite B2.

ar 26
ar
3
3
absciiibpiaoitirrwt
rrapFw%c[iftr
itcednivahEwahSs
arμ
wbsm
ifpscTri
t
su
sTrnoch
3
irsobpbpdp
sabslfi(
s
J. Bijwe et al. / We
bsorption and amount of uncured resin, however, did not showegular trends in both the series of steel wool and brass fibers.
.2. Fade and recovery (F & R) behavior
.2.1. Tribo-performanceFig. 2a–d shows the plots for F & R cycles. For ideal materi-
ls, the 10 curves indicative of 10 braking in each cycle shoulde very flat and downward slope indicating fade in each cyclehould be shallow. As seen from Fig. 2a for B0, in first fadeycle, μ rose continuously till fifth braking and started decreas-ng sharply till 10th braking. Though the behavior showed somemprovement in further cycles, overall behavior of this compos-te was poor. As seen from Fig. 2b for B1, in first fade cycleehavior is similar to that of B0. However, in further cycleslateaus in fade cycles are flatter than those in earlier casendicating better performance of B1. When performance of B1nd B2 (Fig. 2b and c) is compared, a slight improvement wasbserved for B2. The extent of fading especially in first cycles low. For further cycles also, the slope in downward direc-ion in each braking is less acute indicating performance of B2s slightly better than B1. Composite B3 has shown interestingesults. Though the curves in fade cycles (third to fifth) andecovery cycle are very flat, the performance in initial cyclesas poor. The slopes were very acute and this has contributed
o its high value of fade as discussed in later section.R-90 frictional response of the four composites is summa-
ized in Table 3a. Barring B0, μperformance increased while μ
ecovery decreased with increase in brass fibers. Disc temper-ture also increased with contents of brass fibers. Rest of theroperties did not show fixed pattern with increase in brass fibers.ade was maximum for B0 and B3 (21% and 18%). For B2 itas minimum (11%) while for B1 it was moderate (14%). Fadeof B3 did not fall in expected line. It was excessively high. (In
ase of steel series with increase in steel wool, fade % decreased11].) It was anticipated that increase in brass contents wouldncrease in thermal conductivity leading to lowering of pad sur-ace temperature and hence fade. The experiment was repeatedhree times to confirm the fade behavior. % fade varied in theange of 17–20. The reasons behind this were thought as follows.
As already discussed, increase in amount of brass resultedn increase in performance μ and hence increase in more fric-ional heat. The temperature of surfaces of pad and disc is aombined effect of generation and dissipation of heat. The gen-ration was more in case of B3 as confirmed from the highestisc temperature (Tables 3a and 3b). Perhaps the dissipation wasot proportionate. This was indirectly supported by the visualnspection of the pad surface and EDAX studies on it. It wasery important to note that the worn surface of B3 did not showppreciable amount of brass particles on it, though it containedighest amount. It was very difficult to identify the same byDAX technique also indicating that most of the brass particlesere removed during wear process. (Wear of this composite was
lso highest as discussed in subsequent section.) This would haveampered the dissipation of frictional heat leading to high fade.econdly high amount of uncured resin in B3 possibly could beomewhat responsible for this behavior.
fTro
5 (2008) 699–712 709
In case of % recovery property, inclusion of brass fibersppeared to be detrimental. Higher the contents, less was theecovery. Inclusion of brass fibers led to decrease in μrecovery,performance and recovery also (exception in B3). Comparisonith earlier work [11] (Table 3b) confirmed that the steel wooloosts the μperformance more effectively. Brass is comparativelyofter filler than the steel wool. Rise in disc temperature wasore in case of brass series as compared to steel series.The wear of composites did not show any relation with the
ncrease in brass contents. Composite B2 showed lowest wearollowed by B1, B3 and B0. In the series of brass containing com-osites, B3 showed highest wear. As already discussed, wornurface inspection indicated excessive removal of brass parti-les, which could be a reason for high wear of this composite.hus increase in brass content after certain amount led to dete-
ioration in properties possibly the resin was inadequate to holdt beyond certain percentage at high temperatures.
The wear trends in steel series, however, did not show par-icular trends (Table 3b).
Overall, it was observed that steel series composites showedlightly higher wear than the brass series composites when testednder same schedule.
Thus it was confirmed that composite B2 (8% brass fibers)howed least fluctuations in μ (as seen from the plots) andable 3a �μ (μmax − μmin), moderate performance μ, highestesistance to fade and wear, highest μ fade, moderate friendli-ess with the counterface (rise in disc temperature), etc. In casef earlier work [11], 12% steel wool composite showed bestombination of properties. However, its wear resistance was notighest.
.2.2. SEM and EDAX studiesScanning electron micrographs of worn surfaces are shown
n Fig. 4 and are arranged in the sequence of increasing wearesistance. Micrographs 4B0a–4B0c are for composite B0 whichhowed highest wear. The dominant feature was the thick sec-ndary plateaus. As seen in 4B0a (100×, backscattered image)oth secondary and primary plateaus and thick cracks sup-ort its highest wear. Micrograph 4B0b (500×) indicates heavyack-transfer of organic material in the form of thick secondarylateaus with intermittent patches removed and converted intoebris. Avery fine debris is loosely held on such secondarylateaus (4B0c, 500×).
Micrographs of B3 (second poorest in wear performance) arehown in 4B3a–4B3c. A general feature of the composite wasbout extensive amount of secondary plateaus (100×, 4B3a:ack scattered, BS). In general these were thinner and somewhatmaller than the earlier case. 4B3b and 4B3c (BS) show anotherocation indicating mainly secondary plateaus and trapping ofne wear debris in the available voids on primary plateaus (4B3cBS)).
Micrographs of B1 (second best in wear performance) arehown in 4B1a–4B1d. A distinctive feature observed on the sur-
aces of B1 (100×, 4B1a: BS) and B2 was about micro-voids.hese could have been one of the factors for imparting high wearesistance. Literature reports for supporting and damaging rolesf micro-voids on wear performance [14,15]. As seen from 4B1b
7 ar 26
aa
iop(swgo
aF
om(Aivcs(mw
Tsmptt
3p
3
wsiasefwdwcHimatii
pnmg
•
•
•
hIciClcic
dpt
p
•
•
•
•
sm
gomoip
10 J. Bijwe et al. / We
nd 4B1c (BS), there were secondary plateaus in lesser amountnd of lower thickness and size.
Micrographs of B2 (best in wear performance) are shownn Fig. 4B2a–4B2c. Overall a very negligible amount of sec-ndary plateaus were seen on the surface supporting its best wearerformance. Distinctive feature observed on the micrograph100×, 4B2a: BS) was about very dense primary plateaus withhining patches of ingredients. To identify these EDAX studiesere done and are discussed in subsequent sections. Micro-raphs 4B2b (500×) and 4B2c (500× BS) indicate dominancef primary plateaus supporting its best wear behavior.
EDAX studies on the worn surfaces of B2 and B3re shown in micrographs and X-ray analysis maps inigs. 5B2a–5B2f and 5B3a–5B3f).
As seen in 5B2a, SEM of B2 showed very less amountf secondary plateaus and shining ingredients. Various X-rayappings—Al (5B2b), Si (5B2c), Fe (5B2d), Cu (5B2e) and Ba
5B2f) helped in identifying the ingredients and its distribution.l mapping indicates presence of alumina while Si mapping
ndicates glass fibers, its debris and other ingredients such asermiculite, lapinus fibers, etc. (Ca mapping was also done toonfirm, however not included here). Fe mapping confirms theteel wool while brass was confirmed from Cu and Zn mappingZn mapping is not shown here). Shining white particles are ofetals. Ba mapping indicates the distribution of barite at placeshere other ingredients are absent.Similar studies on composite B3 are shown in 5B3a–5B3f.
he surface selected was that of secondary plateau (5B3a). Iteems that such plateaus get transferred prominently on softeraterials such as barite, expanded vermiculite, etc. Under the
lateaus not appreciable amount of glass fibers or metallic con-ents were observed in spite of highest amount of brass fibers inhis composite.
.3. Load–speed sensitivity studies on reduced scalerototype
.3.1. Tribo-performanceAs seen from Table 5, it was observed that pad temperature
as higher than the disc temperature. Moreover, with increase inpeed and pressure temperature of the surfaces of discs and padsncreased as expected. It was, however, interesting to note thats brass contents in composites increased, the temperature onurfaces of discs and pads decreased slowly, in general with fewxceptions, which are italicized in Table 5. In case of pad sur-ace exceptions are very few. Thus the basic aim of the researchork to minimize the temperatures at the surface of pad andisc with the help of metal contents was fulfilled. However, itas also observed that the interface temperature is not the only
riteria to decide the overall performance of the composites.ad it been true, B3 should have shown the best performance
n both the selected evaluation modes. This confirms that theetal contents which are added to control the interface temper-
ture interfered with other performance properties also makinghe formulation-design task more difficult. Hence selection ofngredients in formulation in optimized contents becomes moremperative.
3
(m
5 (2008) 699–712
As seen in Table 6, it was observed that with increase inressure μ of composites decreased. In case of speed increase,o fixed trends were observed because speed is known to haveore complex influence on μ rather than the pressure. Some
eneral trends emerged from this table as follows:
Friction behavior at lowest speed (10 m/s): B2 and B1 showedhigher μ and B3 showed lowest, in general.Friction behavior at moderate speed (12.5 m/s): B3 startedshowing higher μ especially at higher pressures, followed byB2. B0 showed the lowest μ.Friction behavior at highest speed (12.5 m/s): B3 and B2showed highest μ in general. B0 showed the lowest μ.
These trends indicate that inclusion of metal contents andence TC of pads increased the μ of composites in general.ncrease in TC reduced the interface temperature of the tribo-ouple and hence the fading tendency in μ (braking conditionn this mode were less severe as compared to the F & R mode).omposite B0 which had no brass fibers hence showed very
ow μ as operating conditions became more severe (high P–Vonditions). Composites B2 and B3 thus proved more efficientn protecting μ from lowering down under severe operatingonditions.
Fig. 8 indicates the sensitivity of μ towards operating con-itions. For ideal materials such curves should be as straight,arallel and very near to x-axis confirming least sensitivityowards operating parameters.
As seen from Fig. 8a1, for lower to moderate speed transition,erformance in general followed the order;
B1 = B0 > B3 > B2For moderate to high speed transition (Fig. 8a2), it was
B3 > B2 > B0 > B1For sensitivity to pressure as seen from Fig. 8b1, perfor-
mance order in general wasB3 = B0 > B2 > B1
For moderate to high speed transition (Fig. 8b2), perfor-mance order wasB3 > B1 > B2 > B0
Thus, overall composite B3 appears to be the best from leastensitivity of friction coefficient to load–speed variation. B2 wasoderate performer in this respect.Fig. 9 shows wear of composites at different PV values. In
eneral it was observed that B0 and B3 showed higher wear thanther two composites. B2 appeared to be most wear resistant inost of the cases. It was of interest to compare cumulative wear
f RSP study (wear of composites under all PV values) with thatn F & R studies. Wear trend were similar (Fig. 3a and b). B2roved to be the wear resistant composite.
.3.2. SEM studiesSurfaces of specimens worn under highest PV condition
60 MPa m/s) were selected for SEM studies. The wear perfor-ance was in the identical order as seen in F & R studies.

ar 26
o
(fcihefp1pBeSnca
4
biw
•
•
•
•
•
•
•
•
A
aAi(m
Aa
•
•
•
•
•
•
•
•
R
J. Bijwe et al. / We
B2 > B1 > B3 > B0. The micrographs are arranged in the orderf their increase wear performance.
As seen from micrograph (10B0a, 500×), the surface of B0which showed lowest wear performer and highest wear) wasully covered with secondary plateaus similar to the F & Rase. The micrographs 10B3a and 10B3b (BS) (both 500×)ndicated the dominance of secondary plateaus, which supportigher wear of B3. Micrograph 10B3c (BS) (500×) at differ-nt location confirms the existence of various ingredients andew primary plateaus. As seen in EDAX studies, these shiningatches are of metallic contents (steel and brass). Micrographs0B1a and 10B1b (BS) (both 500×) confirms more amounts ofrimary plateaus supporting its good wear resistance. Surface of2, which showed lowest wear, however, was distinctly differ-nt from other surfaces as seen in micrographs 10B2a–10B2c.EM and BS images (10B2a and 10B2b, 100×) indicate wavyature of the surface and micro-voids. The primary plateaus (leftorner) are also seen. The secondary plateaus are small in sizend uniformly distributed.
. Conclusions
Based on studies conducted on composites with increasingrass contents under various operating conditions and two test-ng modes, viz. F & R and P–V sensitivity, following conclusionsere drawn:
Increase in brass contents led to deterioration in strength andmodulus, hardness, etc. and increase in density, void con-tents, heat swelling, water absorption, specific heat, thermaldiffusivity and conductivity.Increase in brass contents led to increase in μperformance whenevaluated under ECR 90 schedule conducive to precipitate thefade and recovery behavior of the materials. In case of RSPfor varying PV conditions, μ average showed similar trendsup to 8% brass composite (B2) more regularly rather than12% brass composite (B3).In case of F & R studies, there was no linear relation with brasscontents/TC with fade. There was an optimum value of 8%brass where properties such as resistance to fade, wear, coun-terface temperature, stability in μ or μ fluctuations, μfade,etc. were the best. For further increase to 12%, fade, wear,counterface temperature, etc. increased appreciably.Higher TC leads to lower interface temperature in case of RSPstudies. μ decreased with load. However, no fixed trends wereobserved for speed.Overall inclusion of brass fibers was observed to be effectivein boosting TC, μperformance, reducing wear to certain extentand fluctuations in μ. It, however, reduced recovery features(recovery % and μ) also.It was also concluded that the results from both types of weartestings, which were designed to bring out the different tribo-features in diverse evaluation modes, were supportive to each
other. Based on these, composite with 8% brass (B2) provedto have best combination of performance properties.It was thus finally concluded that enhancement in TC ofa composite does not necessarily improve its fade behav-5 (2008) 699–712 711
ior and overall tribo-performance. Tribo-performance, ingeneral, improves up to a certain level of brass contents(in this case up to 8%) and then drops down. Vari-ous mechanisms were found to be responsible for theseobservations.If brass is compared to steel wool based on the series of com-posites fabricated in identical fashion in earlier studies, it wasconcluded that steel wool is more effective in boosting theμperformance, keeping the disc temperature less but increasingthe wear.
cknowledgements
Authors acknowledge the funding by Department of Sciencend Technology (Govt. of India) to carry out this work andllied Nippon Ltd., Sahibabad (India) for extending the facil-
ty of Krauss tester. Authors are grateful to Prof. Bolloy DavidLML, Ecole de Centrale, Lille, France) for his help to carry outicroscopic studies.
ppendix A. Definitions of friction coefficient in fadend recovery studies
μ minimum: this is lowest coefficient of friction for cold, fadeand recovery cycles.μ maximum: this is highest coefficient of friction for cold,fade and recovery cycles.Performance μ: this is average of coefficient of friction takenafter 1 s for fade and recovery cycles at temperature greaterthan 100 ◦C. (The requirement of this varies from vehicleto vehicle. For a small sized car, μ in the range 0.4–0.45 isrequired while that for racing cars range of 0.5–0.6 is required.For heavier vehicles or medium sized cars, it should be in therange 0.3–0.35.)μ fade: minimum coefficient of friction for the fade cycletaken after 270 ◦C.% Fade: (performance μ − fade μ) × 100/performance μ
(lower fade % is desirable for a good friction composite).μ recovery: maximum coefficient of friction for the recoverytaken after 100 ◦C.% Recovery: recovery μ × 100 /performance μ (desirable100–120% for a good friction composite).Difference in μmax and μmin (�μ) should be minimum, sinceit indicated unsteadiness of braking behavior.
eferences
[1] J. Bijwe, Composites as friction materials: recent developments in non-asbestos fiber reinforced friction materials—a review, Polym. Compos. 18(3) (1997) 378–396.
[2] D. Chan, G.W. Stachowiak, Review of automotive brake friction materials,Proc. Inst. Mech. Eng. Part D: J. Automob. Eng. 218 (2004) 953–966.
[3] F. Dong, F.D. Blum, L.R. Dharani, Lapinus fiber reinforced phenolic com-
posites: flexural and frictional properties, Polym. Polym. Compos. 4 (1996)155–161.[4] B.K. Sathapathy, Performance evaluation of non-asbestos fiber reinforcedorganic friction materials, Ph.D. Thesis, Indian Institute of Technology,Delhi, 2003.
7 ar 26
[
[
[
[
12 J. Bijwe et al. / We
[5] L. Gudmand-Hoyer, A. Bach, G.T. Nielsen, P. Morgen, Tribological prop-erties of automotive disc brakes with solid lubricants, Wear 232 (1999)168–175.
[6] P. Gopal, L.R. Dharani, F.D. Blum, Load, speed and temperature sensitiv-ities of a carbon fiber reinforced phenolic friction material, Wear 181–183(1995) 913–921.
[7] S.J. Kim, M.H. Cho, D.S. Lim, H. Jang, Synergistic effect of aramid pulpand potassium titanate whiskers in the automotive friction materials, Wear251 (2001) 1484–1491.
[8] Y. Handa, T. Kato, Effects of Cu powder BaSO4 and cashew dust on the
wear and friction characteristics of automotive brake pads, Tribol. Trans.39 (2) (1996) 346–353.[9] H. Jang, K. Koa, S.J. Kim, R.H. Basch, J.W. Fash, The effect of metal fiberson the friction performance of automotive brake friction materials, Wear256 (2004) 406–414.
[
[
5 (2008) 699–712
10] X. Qu, L. Zhang, H. Hing, G. Liu, The effect of steel fiber orientation onfrictional properties of asbestos-free friction materials, Polym. Compos. 25(1) (2004) 94–101.
11] J. Bijwe, M. Kumar, Optimization of steel wool contents in non-asbestosorganic (NAO) friction composites for best combination of thermal con-ductivity and tribo-performance, Wear 263 (2007) 1243–1248.
12] B.K. Satapathy, J. Bijwe, Performance of friction materials based on vari-ation in nature of organic fibers. Part 1. Fade and recovery behavior, Wear257 (2004) 573–584.
13] Replacement brake lining Assemblies, E.C.E. Regulation No. 90,
INTEREUROPE Regulation Ltd., 1997, UN, March 31, 1993.14] M. Eriksson, F. Bergman, S. Jacobson, On the nature of tribological contactin automotive brakes, Wear 252 (2002) 26–36.
15] J. Bettge, Starcevic, Topographic properties of the contact zones of wearsurfaces in disc brakes, Wear 254 (2003) 195–202.