Optimization and Validation of a Visual Integration Test for Schizophrenia Research
10
Optimization and Validation of a Visual Integration Test for Schizophrenia Research Steven M. Silverstein *,1,2 , Brian P. Keane 1,3 , Deanna M. Barch 4 , Cameron S. Carter 5 , James M. Gold 6 , Ilona Kova ´cs 7 , Angus MacDonald III 8 , J. Daniel Ragland 5 , and Milton E. Strauss 9 1 University of Medicine and Dentistry of New Jersey, University Behavioral HealthCare, 151 Centennial Avenue, Piscataway, NJ 08854; 2 Department of Psychiatry, University of Medicine and Dentistry of New Jersey, Robert Wood Johnson Medical School, Piscataway, NJ 08854; 3 Center for Cognitive Science, Rutgers University, New Brunswick, NJ 08901; 4 Departments of Psychology, Psychiatry, and Radiology, Washington University in St Louis, St. Louis, MO 63130; 5 Departments of Psychiatry and Psychology, University of California at Davis, Davis, CA 95616; 6 Department of Psychiatry, University of Maryland School of Medicine, Maryland Psychiatric Research Center, Baltimore, MD 21201; 7 Department of Psychology, Budapest University of Technology and Economics, H-1111 Budapest, Hungary; 8 Department of Psychology, University of Minnesota, Minneapolis, MN 55455; 9 Department of Psychology, Case Western Reserve University, Cleveland, OH 44106 *To whom correspondence should be addressed; tel: 732-235-5149, fax: 732-235-9293, e-mail: [email protected] The Cognitive Neuroscience Treatment Research to Improve Cognition in Schizophrenia initiative highlighted a contour integration test as a promising index of visual integration impairment because of its well-established psychometric properties; its prior validation in healthy adults, patients, and nonhuman primates; and its potential sensitivity to treatment effects. In this multisite study, our goals were to validate the task on the largest subject sample to date, clarify the task conditions and number of trials that best discriminate patients from controls, and determine whether this discrimination can occur in standard clinical trial settings. For our task, subjects briefly observed a field of disconnected, oriented elements and attempted to decide whether a subset of those elements formed a leftward- or rightward-pointing shape. Difficulty depended on the amount of orientational jitter that was added to the shape’s elements. Two versions of this Jittered Orientation Visual Integration task (JOVI) were examined. Study 1 did not reveal between-group differences in threshold (ie, the jitter magnitude needed to reach a performance level of ~80%), but this likely owed to the wide sampling distribution of jitter levels and resulting floor/ceiling effects in many conditions. Study 2 incorporated a narrower range of dif- ficulty levels and revealed lower thresholds (worse perfor- mance) among patients (p < .001). This group difference remained even when only the first half of the trials was analyzed (p 5 .001). Thus, the JOVI-2 provides a brief, sensitive measure of visual integration deficits in schizophrenia. Neural implications and potential future applications of the JOVI are discussed. Key words: schizophrenia/perception/cognition/ neuroscience/psychometrics/psychophysics/vision/ contour integration Introduction A goal of the Cognitive Neuroscience Treatment Research to Improve Cognition in Schizophrenia (CNTRICS) initiative is to develop measures of specific cognitive func- tions that are grounded in cognitive neuroscience. Ideally, the measures should have known links to neurobiology (as documented through pharmacological manipulations, an- imal studies, and imaging studies); they should be brief and acceptable to patients (ie, not causing frustration or fa- tigue); and they should be in a format that can be admin- istered and scored in typical clinical settings. A cognitive domain designated as high priority by CNTRICS was visual integration. Also known as ‘‘per- ceptual organization,’’ visual integration is ‘‘the process by which the bits and pieces of information that are pres- ent in the retinal image are structured into the larger units of perceived objects and their interrelations 1 (p. 723).’’ It occurs one step beyond the registration of color, orienta- tion, motion, and depth. Visual integration impairments in schizophrenia were first described in clinical reports in the 1950s, and research on the dysfunction goes back to the early 1960s, with a rapid increase since the early 1980s. 2 According to a recent review, 2 55 of 61 studies demonstrated some kind of impairment. These studies suggest that (1) task performance is unimpaired for sim- ple, symmetrical, closed figures (eg, triangles) that can be processed by mechanisms that are present at birth or shortly therafter 3 ; (2) task performance is most impaired for novel, noisy, or highly fragmented forms that require significant contributions from later developing mecha- nisms 4 and top-down factors 5 (eg, memory, expectation, strategy); and (3) performance is most abnormal among patients with disorganized symptoms and poor premor- bid social functioning. 2 Schizophrenia Bulletin vol. 38 no. 1 pp. 125–134, 2012 doi:10.1093/schbul/sbr141 Advance Access publication on October 20, 2011 Ó The Author 2011. Published by Oxford University Press on behalf of the Maryland Psychiatric Research Center. All rights reserved. For permissions, please email: [email protected]. 125
Transcript of Optimization and Validation of a Visual Integration Test for Schizophrenia Research
Optimization and Validation of a Visual Integration Test for Schizophrenia Research
Steven M. Silverstein*,1,2, Brian P. Keane1,3, Deanna M. Barch4, Cameron S. Carter5, James M. Gold6, Ilona Kovacs7,Angus MacDonald III8, J. Daniel Ragland5, and Milton E. Strauss9
1University of Medicine and Dentistry of New Jersey, University Behavioral HealthCare, 151 Centennial Avenue, Piscataway, NJ 08854;2Department of Psychiatry, University of Medicine and Dentistry of New Jersey, Robert Wood Johnson Medical School, Piscataway,NJ 08854; 3Center for Cognitive Science, Rutgers University, New Brunswick, NJ 08901; 4Departments of Psychology, Psychiatry, andRadiology, Washington University in St Louis, St. Louis, MO 63130; 5Departments of Psychiatry and Psychology, University ofCalifornia at Davis, Davis, CA 95616; 6Department of Psychiatry, University of Maryland School of Medicine, Maryland PsychiatricResearch Center, Baltimore, MD 21201; 7Department of Psychology, Budapest University of Technology and Economics, H-1111Budapest, Hungary; 8Department of Psychology, University of Minnesota, Minneapolis, MN 55455; 9Department of Psychology, CaseWestern Reserve University, Cleveland, OH 44106
*To whom correspondence should be addressed; tel: 732-235-5149, fax: 732-235-9293, e-mail: [email protected]
The Cognitive Neuroscience Treatment Research toImprove Cognition in Schizophrenia initiative highlighteda contour integration test as a promising index of visualintegration impairment because of its well-establishedpsychometric properties; its prior validation in healthyadults, patients, and nonhuman primates; and its potentialsensitivity to treatment effects. In this multisite study, ourgoals were to validate the task on the largest subject sampleto date, clarify the task conditions and number of trials thatbest discriminate patients from controls, and determinewhether this discrimination can occur in standard clinicaltrial settings. For our task, subjects briefly observed a fieldof disconnected, oriented elements and attempted to decidewhether a subset of those elements formed a leftward- orrightward-pointing shape. Difficulty depended on theamount of orientational jitter that was added to the shape’selements. Two versions of this Jittered Orientation VisualIntegration task (JOVI) were examined. Study 1 did notreveal between-group differences in threshold (ie, the jittermagnitude needed to reach a performance level of ~80%),but this likely owed to the wide sampling distribution ofjitter levels and resulting floor/ceiling effects in manyconditions. Study 2 incorporated a narrower range of dif-ficulty levels and revealed lower thresholds (worse perfor-mance) among patients (p < .001). This group differenceremained even when only the first half of the trials wasanalyzed (p 5 .001). Thus, the JOVI-2 provides a brief,sensitive measure of visual integration deficits inschizophrenia. Neural implications and potential futureapplications of the JOVI are discussed.
Key words: schizophrenia/perception/cognition/neuroscience/psychometrics/psychophysics/vision/contour integration
Introduction
A goal of the Cognitive Neuroscience Treatment Researchto Improve Cognition in Schizophrenia (CNTRICS)initiative is to develop measures of specific cognitive func-tions that are grounded in cognitive neuroscience. Ideally,the measures should have known links to neurobiology (asdocumented through pharmacological manipulations, an-imal studies, and imaging studies); they should be brief andacceptable to patients (ie, not causing frustration or fa-tigue); and they should be in a format that can be admin-istered and scored in typical clinical settings.
A cognitive domain designated as high priority byCNTRICS was visual integration. Also known as ‘‘per-ceptual organization,’’ visual integration is ‘‘the processby which the bits and pieces of information that are pres-ent in the retinal image are structured into the larger unitsof perceived objects and their interrelations1 (p. 723).’’ Itoccurs one step beyond the registration of color, orienta-tion, motion, and depth. Visual integration impairmentsin schizophrenia were first described in clinical reports inthe 1950s, and research on the dysfunction goes back tothe early 1960s, with a rapid increase since the early1980s.2 According to a recent review,2 55 of 61 studiesdemonstrated some kind of impairment. These studiessuggest that (1) task performance is unimpaired for sim-ple, symmetrical, closed figures (eg, triangles) that can beprocessed by mechanisms that are present at birth orshortly therafter3; (2) task performance is most impairedfor novel, noisy, or highly fragmented forms that requiresignificant contributions from later developing mecha-nisms4 and top-down factors5 (eg, memory, expectation,strategy); and (3) performance is most abnormal amongpatients with disorganized symptoms and poor premor-bid social functioning.2
Schizophrenia Bulletin vol. 38 no. 1 pp. 125–134, 2012doi:10.1093/schbul/sbr141Advance Access publication on October 20, 2011
� The Author 2011. Published by Oxford University Press on behalf of the Maryland Psychiatric Research Center. All rights reserved.For permissions, please email: [email protected].
125
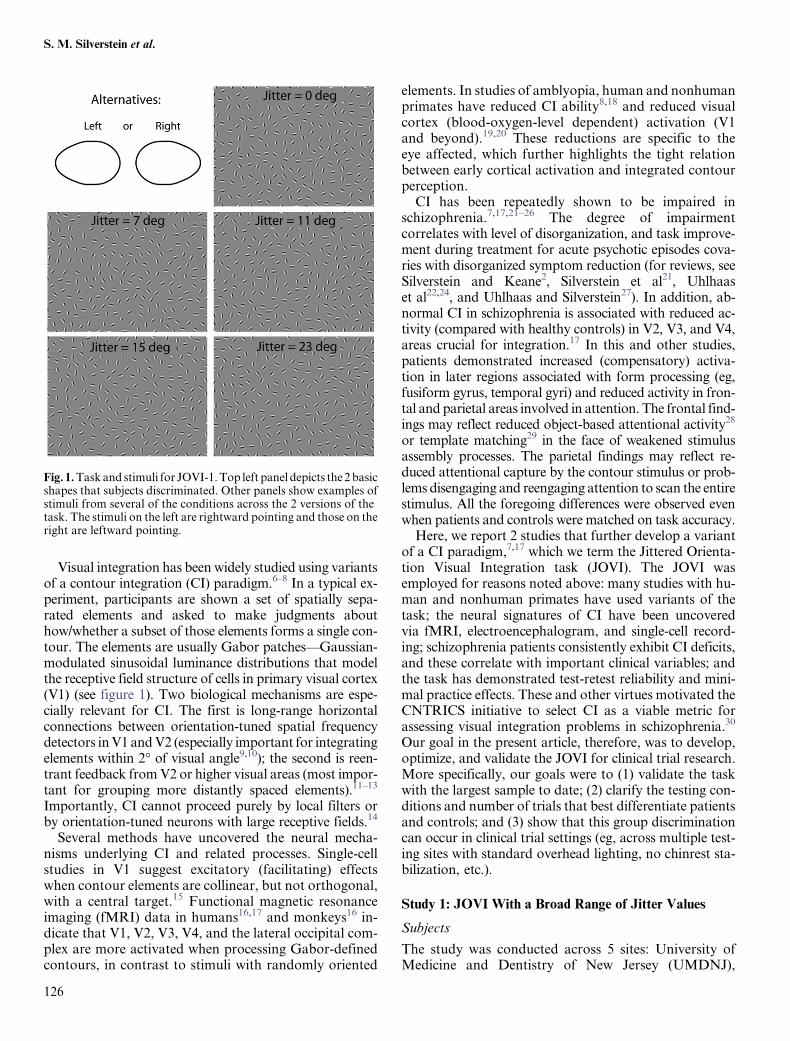
Visual integration has been widely studied using variantsof a contour integration (CI) paradigm.6–8 In a typical ex-periment, participants are shown a set of spatially sepa-rated elements and asked to make judgments abouthow/whether a subset of those elements forms a single con-tour. The elements are usually Gabor patches—Gaussian-modulated sinusoidal luminance distributions that modelthe receptive field structure of cells in primary visual cortex(V1) (see figure 1). Two biological mechanisms are espe-cially relevant for CI. The first is long-range horizontalconnections between orientation-tuned spatial frequencydetectors in V1 and V2 (especially important for integratingelements within 2� of visual angle9,10); the second is reen-trant feedback from V2 or higher visual areas (most impor-tant for grouping more distantly spaced elements).11–13
Importantly, CI cannot proceed purely by local filters orby orientation-tuned neurons with large receptive fields.14
Several methods have uncovered the neural mecha-nisms underlying CI and related processes. Single-cellstudies in V1 suggest excitatory (facilitating) effectswhen contour elements are collinear, but not orthogonal,with a central target.15 Functional magnetic resonanceimaging (fMRI) data in humans16,17 and monkeys16 in-dicate that V1, V2, V3, V4, and the lateral occipital com-plex are more activated when processing Gabor-definedcontours, in contrast to stimuli with randomly oriented
elements. In studies of amblyopia, human and nonhumanprimates have reduced CI ability8,18 and reduced visualcortex (blood-oxygen-level dependent) activation (V1and beyond).19,20 These reductions are specific to theeye affected, which further highlights the tight relationbetween early cortical activation and integrated contourperception.
CI has been repeatedly shown to be impaired inschizophrenia.7,17,21–26 The degree of impairmentcorrelates with level of disorganization, and task improve-ment during treatment for acute psychotic episodes cova-ries with disorganized symptom reduction (for reviews, seeSilverstein and Keane2, Silverstein et al21, Uhlhaaset al22,24, and Uhlhaas and Silverstein27). In addition, ab-normal CI in schizophrenia is associated with reduced ac-tivity (compared with healthy controls) in V2, V3, and V4,areas crucial for integration.17 In this and other studies,patients demonstrated increased (compensatory) activa-tion in later regions associated with form processing (eg,fusiform gyrus, temporal gyri) and reduced activity in fron-tal and parietal areas involved in attention. The frontal find-ings may reflect reduced object-based attentional activity28
or template matching29 in the face of weakened stimulusassembly processes. The parietal findings may reflect re-duced attentional capture by the contour stimulus or prob-lems disengaging and reengaging attention to scan the entirestimulus. All the foregoing differences were observed evenwhen patients and controls were matched on task accuracy.
Here, we report 2 studies that further develop a variantof a CI paradigm,7,17 which we term the Jittered Orienta-tion Visual Integration task (JOVI). The JOVI wasemployed for reasons noted above: many studies with hu-man and nonhuman primates have used variants of thetask; the neural signatures of CI have been uncoveredvia fMRI, electroencephalogram, and single-cell record-ing; schizophrenia patients consistently exhibit CI deficits,and these correlate with important clinical variables; andthe task has demonstrated test-retest reliability and mini-mal practice effects. These and other virtues motivated theCNTRICS initiative to select CI as a viable metric forassessing visual integration problems in schizophrenia.30
Our goal in the present article, therefore, was to develop,optimize, and validate the JOVI for clinical trial research.More specifically, our goals were to (1) validate the taskwith the largest sample to date; (2) clarify the testing con-ditions and number of trials that best differentiate patientsand controls; and (3) show that this group discriminationcan occur in clinical trial settings (eg, across multiple test-ing sites with standard overhead lighting, no chinrest sta-bilization, etc.).
Study 1: JOVI With a Broad Range of Jitter Values
Subjects
The study was conducted across 5 sites: University ofMedicine and Dentistry of New Jersey (UMDNJ),
Fig. 1. Task and stimuli for JOVI-1. Top left panel depicts the 2 basicshapes that subjects discriminated. Other panels show examples ofstimuli from several of the conditions across the 2 versions of thetask. The stimuli on the left are rightward pointing and those on theright are leftward pointing.
S. M. Silverstein et al.
126
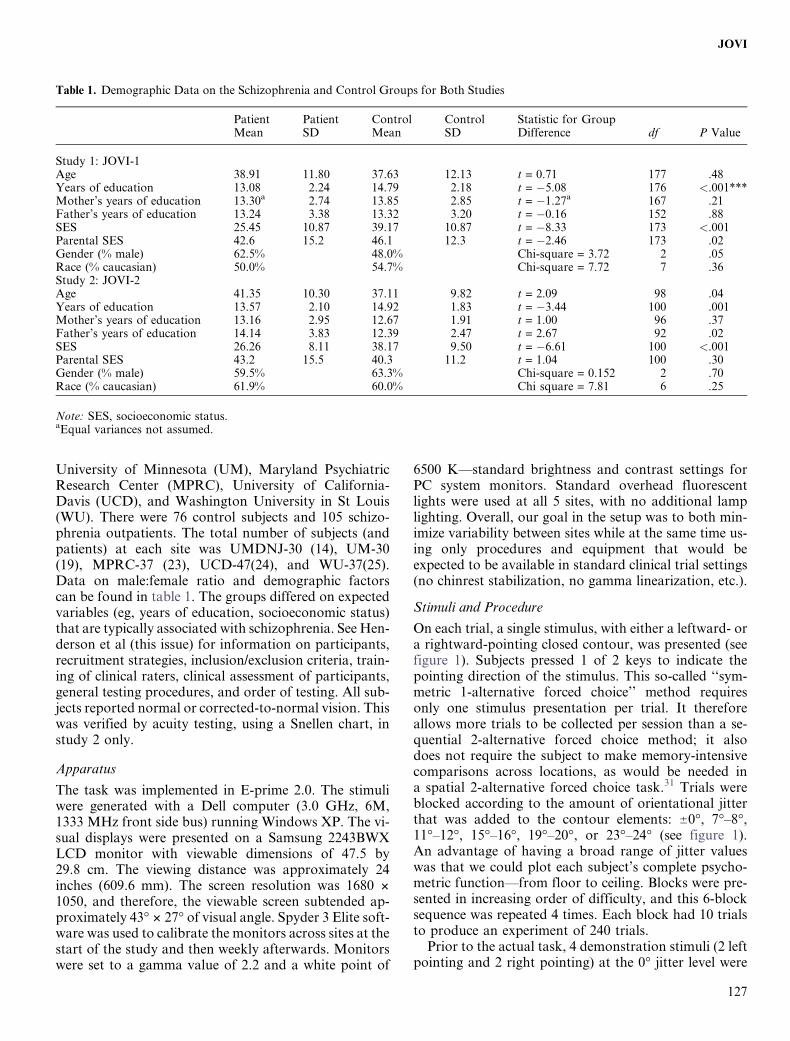
University of Minnesota (UM), Maryland PsychiatricResearch Center (MPRC), University of California-Davis (UCD), and Washington University in St Louis(WU). There were 76 control subjects and 105 schizo-phrenia outpatients. The total number of subjects (andpatients) at each site was UMDNJ-30 (14), UM-30(19), MPRC-37 (23), UCD-47(24), and WU-37(25).Data on male:female ratio and demographic factorscan be found in table 1. The groups differed on expectedvariables (eg, years of education, socioeconomic status)that are typically associated with schizophrenia. See Hen-derson et al (this issue) for information on participants,recruitment strategies, inclusion/exclusion criteria, train-ing of clinical raters, clinical assessment of participants,general testing procedures, and order of testing. All sub-jects reported normal or corrected-to-normal vision. Thiswas verified by acuity testing, using a Snellen chart, instudy 2 only.
Apparatus
The task was implemented in E-prime 2.0. The stimuliwere generated with a Dell computer (3.0 GHz, 6M,1333 MHz front side bus) running Windows XP. The vi-sual displays were presented on a Samsung 2243BWXLCD monitor with viewable dimensions of 47.5 by29.8 cm. The viewing distance was approximately 24inches (609.6 mm). The screen resolution was 1680 3
1050, and therefore, the viewable screen subtended ap-proximately 43� 3 27� of visual angle. Spyder 3 Elite soft-ware was used to calibrate the monitors across sites at thestart of the study and then weekly afterwards. Monitorswere set to a gamma value of 2.2 and a white point of
6500 K—standard brightness and contrast settings forPC system monitors. Standard overhead fluorescentlights were used at all 5 sites, with no additional lamplighting. Overall, our goal in the setup was to both min-imize variability between sites while at the same time us-ing only procedures and equipment that would beexpected to be available in standard clinical trial settings(no chinrest stabilization, no gamma linearization, etc.).
Stimuli and Procedure
On each trial, a single stimulus, with either a leftward- ora rightward-pointing closed contour, was presented (seefigure 1). Subjects pressed 1 of 2 keys to indicate thepointing direction of the stimulus. This so-called ‘‘sym-metric 1-alternative forced choice’’ method requiresonly one stimulus presentation per trial. It thereforeallows more trials to be collected per session than a se-quential 2-alternative forced choice method; it alsodoes not require the subject to make memory-intensivecomparisons across locations, as would be needed ina spatial 2-alternative forced choice task.31 Trials wereblocked according to the amount of orientational jitterthat was added to the contour elements: 60�, 7�–8�,11�–12�, 15�–16�, 19�–20�, or 23�–24� (see figure 1).An advantage of having a broad range of jitter valueswas that we could plot each subject’s complete psycho-metric function—from floor to ceiling. Blocks were pre-sented in increasing order of difficulty, and this 6-blocksequence was repeated 4 times. Each block had 10 trialsto produce an experiment of 240 trials.
Prior to the actual task, 4 demonstration stimuli (2 leftpointing and 2 right pointing) at the 0� jitter level were
Table 1. Demographic Data on the Schizophrenia and Control Groups for Both Studies
PatientMean
PatientSD
ControlMean
ControlSD
Statistic for GroupDifference df P Value
Study 1: JOVI-1Age 38.91 11.80 37.63 12.13 t = 0.71 177 .48Years of education 13.08 2.24 14.79 2.18 t = �5.08 176 <.001***Mother’s years of education 13.30a 2.74 13.85 2.85 t = �1.27a 167 .21Father’s years of education 13.24 3.38 13.32 3.20 t = �0.16 152 .88SES 25.45 10.87 39.17 10.87 t = �8.33 173 <.001Parental SES 42.6 15.2 46.1 12.3 t = �2.46 173 .02Gender (% male) 62.5% 48.0% Chi-square = 3.72 2 .05Race (% caucasian) 50.0% 54.7% Chi-square = 7.72 7 .36Study 2: JOVI-2Age 41.35 10.30 37.11 9.82 t = 2.09 98 .04Years of education 13.57 2.10 14.92 1.83 t = �3.44 100 .001Mother’s years of education 13.16 2.95 12.67 1.91 t = 1.00 96 .37Father’s years of education 14.14 3.83 12.39 2.47 t = 2.67 92 .02SES 26.26 8.11 38.17 9.50 t = �6.61 100 <.001Parental SES 43.2 15.5 40.3 11.2 t = 1.04 100 .30Gender (% male) 59.5% 63.3% Chi-square = 0.152 2 .70Race (% caucasian) 61.9% 60.0% Chi square = 7.81 6 .25
Note: SES, socioeconomic status.aEqual variances not assumed.
127
JOVI

sequentially shown on the screen—without a timelimit—until the subject reported seeing the contour.Next, four 0� jitter stimuli were shown with a rectangularoutline around the location of the contour; these wereshown for 2 seconds each in order to clarify the appearanceof the shape alternatives. Subsequently, a block of 8 addi-tional timed-practice trials with no additional cues, at 5�jitter, were given to further familiarize subjects with thetask. If subjects got 7 of these trials correct, the practicephase ended and they proceeded to the actual task. If fewerthan 7 practice trials were answered correctly, they couldreceive up to 4 additional blocks of 8 practice trials withthe same criterion. If a subject answered fewer than 7 trialscorrect on all practice blocks, it was up to the experimenterto judge whether the subject understood the task suffi-ciently to continue with the actual task.
During the actual task, stimuli were presented for 2 sec-onds each, followed by a 1-second interstimulus interval(during which responses were not scored). Only a graybackground appeared during the interval. The stimulusappeared on a black screen and subtended 16.9� 3
12.8� of visual angle. Each stimulus itself consisted of207 distractor Gabor elements, 15 target elements, anda gray background. The average distance between adja-cent Gabors was 1.4�, which is well within the 2� spatialwindow typically needed for CI to happen without the aidof high-level feedback.9,10,32 All elements were identicalexcept for their positions and orientations. The widthof each Gabor was 0.4�. The Gabor wavelength was ap-proximately 0.4�. The luminance of the gray backgroundwas approximately 23 cd/m2. The peak and trough lumi-nance values for a Gabor corresponded to ~192 and ~2cd/m2, respectively. The distance between adjacent dis-tractors divided by the distance between adjacent contourelements (ie, delta or signal-noise ratio) was 0.9 so thatdensity cues could not aid in the task. Note that at delta= 0.9, schizophrenia patients can reliably perceive con-tours under conditions of zero-to-minimal jitter.21
Data Analysis
Prior to carrying out all analyses, every other timed-outtrial during the actual task (ie, not during practice) wascoded as a correct response, so that chance performancewould be 50% regardless of whether a subject preferred toguess or time-out on a trial. Next, we performed simple ttest comparisons for each jitter level and also a 2 (group)3 6 (jitter) mixed-model ANOVA. We also fit the datawith a psychometric curve and compared threshold be-tween groups. (Threshold corresponds to the amountof jitter needed to reach ~81% for an observer who per-forms perfectly at the easiest jitter levels.)
Although curve fitting analyses are less common inclinical research, this method has been well establishedfor over 35 years and is the standard data analytic tech-nique in the field of visual perception (including CI).33,34
One reason for this is their ability to characterize data
that are nonlinear. Perceptual performance in many tasks(including ours) follows a characteristic shape: as taskdifficulty transitions from very hard to very easy, accu-racy increases slowly at first, then increases rapidly,and finally climbs more slowly again toward ceiling.This well-established relation between difficulty and ac-curacy can be described by a variety of sigmoidal (s-shaped) functions, perhaps the most common of whichis the cumulative Weibull.35 Fitting a function typicallyinvolves calculating accuracy for each condition andfinding the parameters that produce a best-fitting curve(in a least squares sense). There are commonly 3 fittedvariables, and each denotes a different aspect ofperformance.36 Threshold (a) measures how much jittera subject needs to perform at a certain level of accuracy.
In our case, higher threshold corresponds to better per-
formance. The slope parameter (b) determines how much
a subject’s accuracy changes for a given change in jitter
(where steeper slopes correspond to higher sensitivity to
jitter changes). The upper asymptote parameter (k) rep-
resents how well that the subject performs at the easiest
difficulty levels. Nonzero k values usually, but not nec-
essarily, reflect errors associated with lapses in attention
(as discussed below). In sum, a curve fitting approach
provides a well-established means to evaluate 3 different
aspects of performance and therefore complements and
extends the findings derived via standard accuracy-based
ANOVA analyses.Several steps were performed to prepare the data for
curve fitting. We removed subjects whose overall propor-
tion correct was less than or equal to 50%. Next, we fit
a psychometric curve to each subject’s data and removed
subjects who could not be modeled with such a curve (see
below).For the analyses, we compared the fitted parameters
across groups and also the R-squared values across
groups. The latter index served as a goodness of fit statistic
and quantified an observer’s variability (noisiness) around
a predicted performance pattern (independent of accu-
racy); therefore, this can also be viewed as a check on in-
ternal consistency or degree of error variance in the data.
Between-group comparisons were made with nonparamet-
ric (Wilcoxon rank sum) tests because the compared var-
iables were not normally distributed on either task.Curve fitting was done with Matlab’s curve fitting tool-
box. To fit a curve, we first recoded the x dimension as
being distance from a baseline jitter level of 23� to estab-
lish the conventional monotonically increasing relation-
ship between the dependent and independent variables.
We chose a baseline of 23� because performance at
this level was at chance and thus seemed like a reasonable
point from which to measure performance. Next, each
subject’s accuracy data were fit to a cumulative Weibull
distribution function37:
128
S. M. Silverstein et al.

wðx; a;ß; c; kÞ= c þ ð1 � c� kÞ3f1 � exp½ � ðx=aÞ^ß�g
W corresponds to the predicted probability correct,and x denotes the recoded jitter values; a and b determinethe threshold and slope of the psychometric function;gamma is the guessing rate and was fixed at .5; and krefers to the upper asymptote of the fitted curve and tra-ditionally corresponds to the stimulus-independent errorrate. (Note that a threshold for a Weibull curve in a testwith 2 response options corresponds to the jitter valueneeded to produce 81.6% accuracy; the accuracy percent-age is lower if the subject has a positive k value.) Six sub-jects (all patients) were excluded for failing to performabove 50%. An additional 6 subjects (5 patients) were ex-cluded because their data could not be modeled with theabove function. Parameter estimates for these subjectsdid not converge because the proportion correct didnot improve with reduced jitter or because data weremissing for one or more jitter values.
Results and Discussion
Data from study 1 are presented in figure 2. The maineffect of condition (jitter) was significant, indicatingthat the manipulation produced the intended effect on vi-sual integration: F(2.87,502.09) = 1063.46, P < .001,g2p=:859. There was also a significant effect of group,
with patients performing worse overall than controls:F(1,175) = 18.32, P < .001, g2
p=:095. Patients were signif-icantly worse than controls in the 0�, 7�, and 11� condi-tions. There was an interaction between group andcondition such that patients performed more like controlsas the task became harder, F(2.87,502.1) = 7.81, P< .001,Greenhouse-Geisser.
The curve fitting provided additional insights. The me-dian R-squared values exceeded 0.96 in each group indi-cating that the data conformed well to the classicsigmoidal shape, though the patients’ data were margin-ally noisier (Z = 1.83, P = .068). More importantly, therewas neither a threshold difference between groups(Z = 1.34,P = .18; see figure 2) nor any difference in slopes(Z = 0.20, P > .8), indicating no real between-group dif-ference in the effect of orientation jitter on visual integra-tion. The only clear between-group difference was in the kvalues, which correspond to the upper asymptote of thecurves (Z = 3.34, P = .001; Mdn(patients) = 0.035;Mdn(controls) = 0.02), indicating that patients mademore errors at the easiest conditions.
In this, the largest study to date of CI in schizophrenia,patients were less accurate overall than controls, weresimilar to controls in terms of threshold and slope,and differed on k. Three caveats are important to men-tion, however. First, although k traditionally reflects er-ror rates that are independent of task difficulty (eg, thosedue to lapses in attention),37 it is possible that patientsreally are worse at integrating even nonjittered stimuli.More on this will be said below. Second, our resultsare inconsistent with the findings of 2 past studies,7,17
in which patients and controls did not differ on thezero-jitter condition. The discrepancy may owe to samplesize differences (with a larger sample in this study) or tothe fact that the subjects in previous studies were allowedto practice the task until they performed at 80% accuracyon the easiest condition (which in turn may have pro-vided more training for patients). Therefore, past studiesmay have underestimated patient-control differences atthe easiest jitter levels. Finally, the jitter levels mayhave been too close to floor and ceiling to sensitively iden-tify threshold differences. Because threshold is most ac-curately estimated when the difficulty levels are closer tothe steepest part of the psychometric function (wherelambda estimates are less influential on threshold esti-mates),36 we selected a narrower range of intermediatejitter levels for the next study and added additional con-ditions within that range.
Study 2: JOVI With a Narrow Range of Jitter Values
Subjects
Floor and ceiling effects uncovered in study 1 promptedus to modify the JOVI task approximately 2/3 of the waythrough the planned data collection effort. As a result,
Fig. 2. Data from study 1. Proportion correct is plotted against jittermagnitude for controls (C, in black) and persons with schizophrenia(SZ, in red). Individual points denote group averages at each of the 6jitter values and include only those subjects who were included in thecurve analysis. For illustration, a cumulative Weibull curve is drawnthroughthe6averageddatapointsforeachgroup.Notethatdifficultylevel decreases from left to right. Also, while a full range of difficultylevels isplotted, correspondingtoallpoints alongthe fittedcurves, theactual conditions included in the task were those listed on the x-axis,namely, 0�, 7�–8�, 11�–12�, 15�–16�, 19�–20�, and 23–24� of jitter.
129
JOVI
for study 2, the sample sizes, while still larger than usual,were smaller than in study 1 and are less matched in termsof group sizes. Study 2 included 60 controls and 43schizophrenia patients. The total number of subjects(and patients) per each site was as follows: UMDNJ-9(9), UM-30(11), MPRC-27(11), UCD-10(4), and WU-27(8). None of the subjects in study 2 had participatedin study 1. Data on male:female ratio and demographicfactors can be found in table 1.
Stimuli and Procedure
The JOVI-2 included the following conditions: 7�–8�, 9�–10� (new), 11�–12�, 13�–14� (new), and 15�–16�. Stimuliwere blocked by condition, with 12 trials per block.Blocks were presented in increasing order of difficulty,and each was presented 4 times for a total of 240 trials(4 repetitions 3 5 blocks 3 12 trials).
The stimulus subtended a 13.33 13.3 square. The Gaborwavelength and width was 0.2�. The numbers of target anddistractor elements were 18 and 298, respectively. Targetelements were separated by 1� of visual angle. Otheraspects of the experiment, including practice and stimulusexposure duration, were the same as in study 1.
Data Analysis
The data analysis procedure was the same as in study 1. Inthe curve fitting, 2 subjects (both patients) were removedfor performing at or below 50% correct and 2 additionalsubjects (1 patient) could not be modeled with a curve.
Results and Discussion
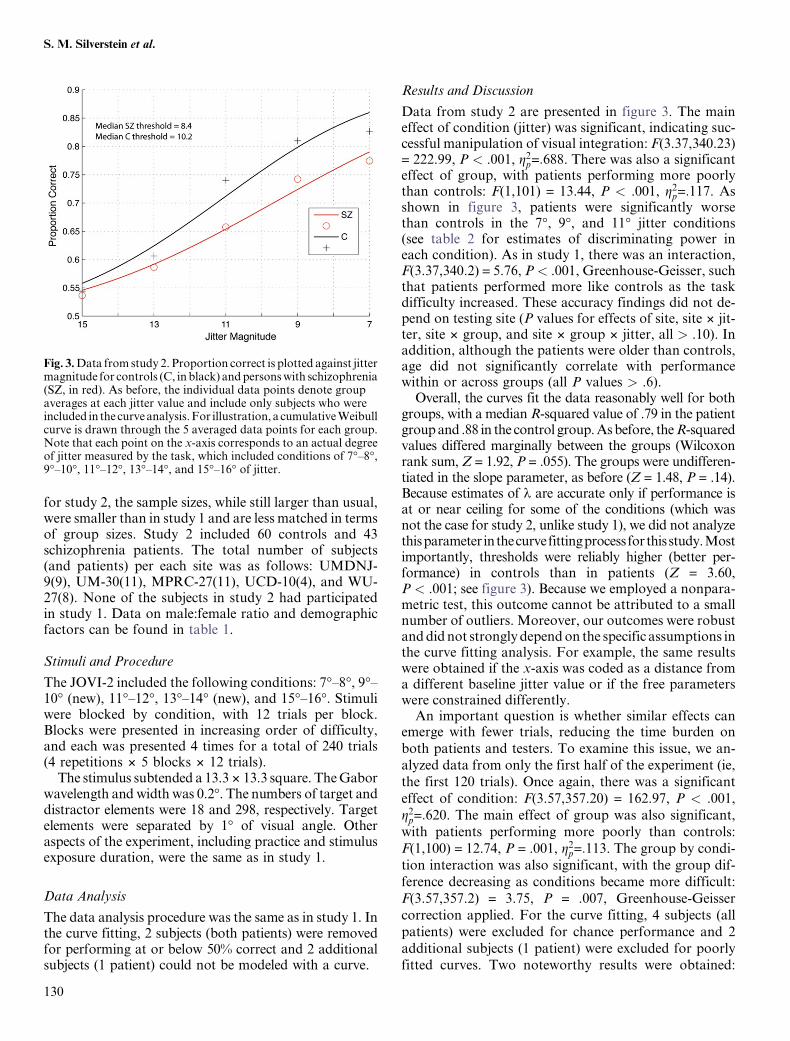
Data from study 2 are presented in figure 3. The maineffect of condition (jitter) was significant, indicating suc-cessful manipulation of visual integration: F(3.37,340.23)= 222.99, P < .001, g2
p=:688. There was also a significanteffect of group, with patients performing more poorlythan controls: F(1,101) = 13.44, P < .001, g2
p=:117. Asshown in figure 3, patients were significantly worsethan controls in the 7�, 9�, and 11� jitter conditions(see table 2 for estimates of discriminating power ineach condition). As in study 1, there was an interaction,F(3.37,340.2) = 5.76, P< .001, Greenhouse-Geisser, suchthat patients performed more like controls as the taskdifficulty increased. These accuracy findings did not de-pend on testing site (P values for effects of site, site 3 jit-ter, site 3 group, and site 3 group 3 jitter, all > .10). Inaddition, although the patients were older than controls,age did not significantly correlate with performancewithin or across groups (all P values > .6).
Overall, the curves fit the data reasonably well for bothgroups, with a median R-squared value of .79 in the patientgroup and .88 in the control group. As before, theR-squaredvalues differed marginally between the groups (Wilcoxonrank sum, Z = 1.92, P = .055). The groups were undifferen-tiated in the slope parameter, as before (Z = 1.48, P = .14).Because estimates of k are accurate only if performance isat or near ceiling for some of the conditions (which wasnot the case for study 2, unlike study 1), we did not analyzethisparameter inthecurvefittingprocessfor thisstudy.Mostimportantly, thresholds were reliably higher (better per-formance) in controls than in patients (Z = 3.60,P < .001; see figure 3). Because we employed a nonpara-metric test, this outcome cannot be attributed to a smallnumber of outliers. Moreover, our outcomes were robustand did not strongly depend on the specific assumptions inthe curve fitting analysis. For example, the same resultswere obtained if the x-axis was coded as a distance froma different baseline jitter value or if the free parameterswere constrained differently.
An important question is whether similar effects canemerge with fewer trials, reducing the time burden on
both patients and testers. To examine this issue, we an-alyzed data from only the first half of the experiment (ie,
the first 120 trials). Once again, there was a significant
effect of condition: F(3.57,357.20) = 162.97, P < .001,
g2p=:620. The main effect of group was also significant,
with patients performing more poorly than controls:
F(1,100) = 12.74, P = .001, g2p=:113. The group by condi-
tion interaction was also significant, with the group dif-
ference decreasing as conditions became more difficult:
F(3.57,357.2) = 3.75, P = .007, Greenhouse-Geisser
correction applied. For the curve fitting, 4 subjects (all
patients) were excluded for chance performance and 2
additional subjects (1 patient) were excluded for poorlyfitted curves. Two noteworthy results were obtained:
Fig. 3. Data from study 2. Proportion correct is plotted against jittermagnitude for controls (C, in black) and persons with schizophrenia(SZ, in red). As before, the individual data points denote groupaverages at each jitter value and include only subjects who wereincluded in the curve analysis. For illustration, a cumulative Weibullcurve is drawn through the 5 averaged data points for each group.Note that each point on the x-axis corresponds to an actual degreeof jitter measured by the task, which included conditions of 7�–8�,9�–10�, 11�–12�, 13�–14�, and 15�–16� of jitter.
130
S. M. Silverstein et al.

(1) ‘‘shallower’’ slopes for patients than controls(Z = 2.64, P = .008) and (2) ‘‘better’’ (higher) thresholdsfor controls than patients (Z = 3.26, P = .001). The firstresult suggests that patients were less sensitive to the jit-ter manipulation; it should be considered preliminary,however, because slope differences were not found inthe other analyses. The threshold difference, on theother hand, is consonant with our other results andshows that patient integration deficits emerge with asfew as 120 trials.
General Discussion
Results from the second study—using a revised versionof the JOVI—replicate past studies in indicating poorerCI performance among people with schizophrenia. Asnoted, the null result for the threshold differences ofstudy 1 most likely owes to the selection of jitter levels.In that study, only 1 of the 6 conditions yielded a pro-portion correct (for each group) between .65 and .85 (ie,between floor and ceiling; NB: a proportion correct of.65 or greater is necessary to statistically exceed chance).In contrast, in study 2, 3 of the 5 data points averaged tobe within the .65–.85 range. The group differences inJOVI-2 did not depend on testing site and could be iden-tified with a 120-trial experiment using either a curve fit-ting or an ANOVA analysis. For such reasons, theJOVI-2 is the preferred version of the task.
At least 2 factors contribute to the generalized deficitin schizophrenia, and each is worth considering in lightof our results. One possibility is that patients becomemore frustrated and lose more motivation (relative tocontrols) as the task gets harder, causing between-groupdifferences to increase with task difficulty. In this case,patients would perform worse overall relative to con-trols without any corresponding problem in integra-tion.38 Our results are not consistent with thispattern. The psychometric slopes were no steeper forpatients than controls, and between-group differencesdid not increase as the task became more difficult (infact, the opposite was found). A second type of gener-alized deficit confound occurs when subjects commitstimulus-independent errors, either by allocating insuf-ficient attention toward the screen or by pressing thewrong key for a given response. In such cases, subjectswill have a lower upper asymptote36 and lower overallaccuracy but not necessarily any dysfunction in integrat-ing contours. While patient data did match this trend forstudy 1, it is important to note that patient errors mightnot be stimulus independent; they may actually reflectpoor contour processing. The upper asymptote of thepsychometric function can depend, eg, on the abilityof a target to exogenously grab attention.39 One possi-bility therefore is that less-jittered contours pop-out forhealthy controls, and this, in turn, enhances form dis-crimination.40 Integration deficits among patients, onT
ab
le2
.B
etw
een
-Gro
up
Eff
ect
Siz
es,
Dis
crim
ina
tin
gP
ow
erfo
rE
ach
Jitt
erC
on
dit
ion
,a
nd
the
Da
taU
sed
toC
alc
ula
teT
hes
e
Co
effi
cien
tA
lph
aC
oef
fici
ent
Alp
ha
SD
SD
Va
ria
nce
Dis
crim
ina
tin
gP
ow
erM
ean
Mea
n
Co
nd
itio
nC
on
tro
lsIn
div
idu
als
wit
hsc
hiz
op
hre
nia
Co
ntr
ols
Ind
ivid
ua
lsw
ith
sch
izo
ph
ren
iaC
on
tro
lso
nly
Co
ntr
ols
Ind
ivid
ua
lsw
ith
sch
izo
ph
ren
iaP
oo
led
SD
Co
hen
’sD
7�
Jitt
er.6
98
.87
60
.10
33
80
.17
39
40
.01
06
87
42
0.0
07
45
98
22
0.7
96
50
.70
04
0.1
44
17
0.6
66
57
41
89�
Jitt
er.7
09
.79
40
.10
81
60
.14
34
0.0
11
69
85
90
.00
82
94
29
70
.77
53
0.6
72
60
.13
32
80
.77
05
58
22
11�
Jitt
er.7
54
.76
40
.13
11
27
30
.14
24
60
40
.01
71
94
37
0.0
12
96
45
54
0.6
80
55
60
.56
54
76
0.1
46
70
46
0.7
84
43
34
81
3�
Jitt
er.5
44
.78
90
.10
52
80
.15
12
10
.01
10
83
88
0.0
06
02
96
30
.52
71
0.4
82
60
.12
74
30
.34
92
11
33
15�
Jitt
er.6
51
.80
90
.11
86
20
.15
57
30
.01
40
70
70
.00
91
60
02
90
.44
38
0.4
17
20
.13
50
40
.19
69
78
67
Note
:O
nly
raw
(un
pro
cess
ed)
da
taa
resh
ow
n.
Dis
crim
ina
tin
gp
ow
erw
as
calc
ula
ted
as
reli
ab
ilit
y(e
xp
ress
eda
sco
effi
cien
ta
for
each
con
dit
ion
)3
va
ria
nce
.T
he
latt
erw
as
calc
ula
ted
ba
sed
on
con
tro
ld
ata
on
ly.
Pro
ba
bil
ity
(P)
va
lues
of
‘‘.0
00
’’re
pre
sen
tv
alu
esw
her
eP<
.00
1.
No
teth
at
coef
fici
enta
isa
reli
ab
ilit
yst
ati
stic
an
dsh
ou
ldn
ot
be
con
fuse
dw
ith
the
pa
ram
eter
ad
escr
ibed
inth
ecu
rve
fitt
ing
an
aly
ses,
wh
ich
refe
rsto
thre
sho
ldv
alu
e.
131
JOVI

the other hand, would reduce the reflexive transient at-tentional shift toward the target and therefore further im-pair form discrimination at the lowest jitter values. In linewith this view, others have found reduced activity in pa-rietal regions in the CI task for patients,17 suggesting thatdysfunctional bottom-up processing of contours mayweaken the normal orienting response to the integratedshapes.
On the other hand, the relationship between discrimi-nating power (calculated as reliability [ie, coefficient a] 3variance for each condition) and between-group effectsize in each condition revealed inconsistent evidencefor a generalized deficit involving motivation and/or at-tentional effects. Specifically, as can be seen in table 2 (us-ing study 2 data), the 11� condition, which was associatedwith the largest between-group effect size (d = 0.78), wasalso associated with the highest degree of discriminatingpower. However, the condition with the second highestlevel of discriminating power (15�) was associated withthe smallest effect size (d = 0.20). Therefore, there wasnot a consistent relationship between discriminatingpower and effect size across all conditions, arguing againsta generalized deficit interpretation of the data.
In our current work, we are continuing to refine the taskto ensure that the data reflect CI abilities rather than in-attention toward the screen or poor motivation. One waywe have done this is to add ‘‘catch’’ trials, which shouldonly be failed by people responding randomly. Two typesof catch trials have been added, and both derive from the0� jitter condition. In one type, a black continuous contourhas been drawn in through the Gabor elements composingthe target (obviating the need for integration). In the othertype, the background elements have been excluded (obvi-ating the need for noise inhibition). If patients and controlsperform the same on catch trials but differently on the eas-ier jitter conditions, then that would present strong evi-dence for a specific deficit in visual integration. Inaddition, although we found that a 120-trial version ofthe task provides data equivalent to that of the 240-trialversion, it is possible that the task could be shortenedeven further, thereby providing additional protectionagainst fatigue or impaired sustained attention confounds.For example, a version with only the 7� jitter condition andcatch trials may be just as sensitive as the current 120-trialversion. We are currently investigating this and will reportthe results in a future article.
The JOVI may be useful in pharmacological challengestudies and in early-phase clinical trials. As noted, the con-tour linking process is thought to be implemented both viahorizontal connections in V1 or V211,12 and reentrant feed-back from post-V1 visual regions41,42 and much is knownabout the underlying physiology of these processes,43,44 (seealso Shimizu et al45 and Gais.46) Integration deficits mayowe to N-methyl D-aspartate (NMDA) receptor hypoac-tivity and subsequent reduced input to inhibitory gammaamino butyric acid (GABA)-ergic interneurons,47,48
suggesting that the JOVI might be useful in studies of med-ications targeting these systems. Furthermore, becauseNMDA and GABA-ergic contributions to synchronizedoscillations are modulated by cholinergic activity via mus-carinic receptors,49 the effects of anticholinergic agents onJOVI performance would also be useful to investigate. Thisis especially true given prior findings linking reduced syn-chrony to reduced visual integration in schizophrenia.2 Todate, studies have shown that improvements in CI covarywith reductions in disorganized symptoms during short-term inpatient treatment24 and that ketamine (anNMDA antagonist) impairs CI in nonpsychotic subjects.50
However, sensitivity of test scores to specific pharmacolog-ical agents in patient populations has yet to be explored.
Ongoing studies are extending and further validating theJOVI paradigm. For example, we are examining the testreliability of the full version of the task (including catchtrials). This will help clarify whether a version with fewerconditions (eg, only 7� jitter and catch trials) is as reliableas a longer version, whether an abbreviated task wouldlead to a reduced subject exclusion, and whetherbetween-group differences at easier stimulus levels resultfrom integration deficits. Other issues under investigationinclude the following: fMRI correlates of normal andabnormal JOVI performance in large subject samples,test-retest reliability of the fMRI findings, and diagnosticspecificity of the behavioral findings (among schizophre-nia and mood disorder patients). All this work is consistentwith the goals of the CNTRICS initiative, which includeoptimizing and validating promising cognitive tasks for fu-ture clinical trial research in schizophrenia. To date, mostresearch has not been focused on refining behavioral para-digms, perhaps because it is seen as laborious, tedious,time consuming, and less groundbreaking than investiga-tion of new hypotheses about mechanisms of psychopa-thology. However, this type of foundational work iscritical in that—by establishing validity and reliability ofbehavioral and brain imaging findings across large subjectsamples, multiple sites, and varying testing conditions—wecan be sure that the effects are sufficiently robust and thatthe underlying mechanisms are indeed dysfunctional.
In conclusion, the JOVI is an easy-to-administer mea-sure of visual integration that can be used to detect impair-ments in schizophrenia. Data from study 2 indicate thatreliable data can be obtained with a 10-minute, 120-trialtask (including instructions and practice trials; the totalfor just stimulus presentation and intertrial intervals is120 trials 3 3 sec = 6 min). Earlier versions of the measuresuggested that it may be especially sensitive to a more se-verely ill patient subtype (characterized by poor premorbidsocial functioning25,26), as well as state effects (ie, level ofdisorganization21,22,24). It is therefore potentially useful asboth a cross-sectional measure of the integrity of visual in-tegration processes and of their reconstitution during re-covery from psychosis. Its demonstrated ability to revealvisual cortex hypoactivation within an fMRI context17
132
S. M. Silverstein et al.
also suggests that integration with psychophysiological re-cording can reveal valuable information about the neuro-biological mechanisms involved in psychosis and recovery.
Funding
National Institute of Mental Health via 5 collaborativeR01 grants to the S.M.S, D.M.B., C.S.C., J.M.G., A.M..
References
1. Palmer SE. Vision Science: Photons to Phenomenology.Cambridge, MA: MIT Press; 1999.
2. Silverstein SM, Keane BP. Perceptual organization impair-ment in schizophrenia and associated brain mechanisms: re-view of research from 2005-2010. Schizophr Bull.2011;37:690–699.
3. Pornstein MH, Krinsky SJ. Perception of symmetry in in-fancy: the salience of vertical symmetry and the perceptionof pattern wholes. J Exp Child Psychol. 1985;39:1–19.
4. Kovacs I, Kozma P, Feher A, Benedek G. Late maturation ofvisual spatial integration in humans. Proc Natl Acad Sci U S A.1999;96:12204–12209.
5. Beck DM, Palmer SE. Top-down influences on perceptualgrouping. J Exp Psychol Hum Percept Perform. 2002;28:1071–1084.
6. Field DJ, Hayes A, Hess RF. Contour integration by the hu-man visual system: evidence for a local ‘‘association field’’.Vision Res. 1993;33:173–193.
7. Kozma-Weibe P, Silverstein SM, Feher A, Kovacs I, UhlhaasP, Wilkniss S. Development of a World-Wide-Web basedcontour integration test: reliability and validity. ComputHum Behav. 2006;22:971–980.
8. Kovacs I, Polat U, Pennefather PM, Chandna A, NorciaAM. A new test of contour integration deficits in patientswith a history of disrupted binocular experience during visualdevelopment. Vision Res. 2000;40:1775–1783.
9. Stettler DD, Das A, Bennett J, Gilbert CD. Lateral connec-tivity and contextual interactions in macaque primary visualcortex. Neuron. 2002;36:739–750.
10. Mandon S, Kreiter AK. Rapid contour integration in ma-caque monkeys. Vision Res. 2005;45:291–300.
11. Li W, Piech V, Gilbert CD. Learning to link visual contours.Neuron. 2008;57:442–451.
12. Zhang NR, von der Heydt R. Analysis of the context integra-tion mechanisms underlying figure-ground organization inthe visual cortex. J Neurosci. 2010;30:6482–6496.
13. Series P, Lorenceau J, Fregnac Y. The ‘‘silent’’ surround ofV1 receptive fields: theory and experiments. J Physiol Paris.2003;97:453–474.
14. Hess R, Field D. Integration of contours: new insights.Trends Cogn Sci. 1999;3:480–486.
15. Kinoshita M, Gilbert CD, Das A. Optical imaging of contex-tual interactions in V1 of the behaving monkey. J Neurophysiol.2009;102:1930–1944.
16. Kourtzi Z, Tolias AS, Altmann CF, Augath M, LogothetisNK. Integration of local features into global shapes: monkeyand human FMRI studies. Neuron. 2003;37:333–346.
17. Silverstein SM, Berten S, Essex B, Kovacs I, Susmaras T, Lit-tle DM. An fMRI examination of visual integration in schizo-phrenia. J Integr Neurosci. 2009;8:175–202.
18. Chandna A, Pennefather PM, Kovacs I, Norcia AM. Con-tour integration deficits in anisometropic amblyopia. InvestOphthalmol Vis Sci. 2001;42:875–878.
19. Kiorpes L. Visual processing in amblyopia: animal studies.Strabismus. 2006;14:3–10.
20. Mendola JD, Conner IP, Roy A, et al. Voxel-based analysisof MRI detects abnormal visual cortex in children and adultswith amblyopia. Hum Brain Mapp. 2005;25:222–236.
21. Silverstein SM, Kovacs I, Corry R, Valone C. Perceptualorganization, the disorganization syndrome, and contextprocessing in chronic schizophrenia. Schizophr Res. 2000;43:11–20.
22. Uhlhaas PJ, Phillips WA, Mitchell G, Silverstein SM. Percep-tual grouping in disorganized schizophrenia. Psychiatry Res.2006;145:105–117.
23. Uhlhaas PJ, Phillips WA, Schenkel LS, Silverstein SM. The-ory of mind and perceptual context-processing in schizophre-nia. Cogn Neuropsychiatry. 2006;11:416–436.
24. Uhlhaas PJ, Phillips WA, Silverstein SM. The course andclinical correlates of dysfunctions in visual perceptual organi-zation in schizophrenia during the remission of psychoticsymptoms. Schizophr Res. 2005;75:183–192.
25. Schenkel LS, Spaulding WD, DiLillo D, Silverstein SM. His-tories of childhood maltreatment in schizophrenia: relation-ships with premorbid functioning, symptomatology, andcognitive deficits. Schizophr Res. 2005;76:273–286.
26. Schenkel LS, Spaulding WD, Silverstein SM. Poor premorbidsocial functioning and theory of mind deficit in schizophre-nia: evidence of reduced context processing? J PsychiatrRes. 2005;39:499–508.
27. Uhlhaas PJ, Silverstein SM. Perceptual organization inschizophrenia spectrum disorders: empirical research and the-oretical implications. Psychol Bull. 2005;131:618–632.
28. Sinnett S, Snyder JJ, Kingstone A. Role of the lateral prefron-tal cortex in visual object-based selective attention. Exp BrainRes. 2009;194:191–196.
29. Hamker FH. The reentry hypothesis: the putative interactionof the frontal eye field, ventrolateral prefrontal cortex, andareas V4, IT for attention and eye movement. Cereb Cortex.2005;15:431–447.
30. Barch DM, Carter CS, Arnsten A, et al. Selecting paradigmsfrom cognitive neuroscience for translation into use in clinicaltrials: proceedings of the third CNTRICS meeting. SchizophrBull. 2009;35:109–114.
31. Kingdom FAA, Prins N. Psychophysics. London, UK:Academic Press; 2010.
32. Ciaramelli ELF, Del Viva MM, Burr DC, Ladavas E. Thecontributions of prefrontal cortex to global perception. ExpBrain Res. 2007;181:427–434.
33. Burr DC, Morrone MC, Ross J. Selective suppression of themagnocellular visual pathway during saccadic eye move-ments. Nature. 1994;371:511–513.
34. Quick RF, Jr. A vector-magnitude model of contrast detec-tion. Kybernetik. 1974;16:65–67.
35. Weibull W. Statistical distribution function of wide applica-bility. J Appl Mechanics. 1951;18:292–297.
36. Wichmann FA, Hill NJ. The psychometric function: I. Fit-ting, sampling, and goodness of fit. Percept Psychophys.2001;63:1293–1313.
37. Wichmann FA, Hill NJ. The psychometric function: II.Bootstrap-based confidence intervals and sampling. PerceptPsychophys. 2001;63:1314–1329.
133
JOVI
38. Knight RA, Silverstein SM. A process-oriented approach for
averting confounds resulting from general performance defi-
ciencies in schizophrenia. J Abnorm Psychol. 2001;110:15–30.
39. Ling S, Carrasco M. Sustained and transient covert attention
enhance the signal via different contrast response functions.
Vision Res. 2006;46:1210–1220.
40. Keane BP, Mettler E, Tsoi V, Kellman PJ. Attentional signa-
tures of perception: multiple object tracking reveals the auto-
maticity of contour interpolation. J Exp Psychol Hum Percept
Perform. 2011;37:685–698.
41. Sporns O, Tononi G, Edelman GM. Modeling perceptual
grouping and figure-ground segregation by means of active reen-
trant connections. Proc Natl Acad Sci U S A. 1991;88:129–133.
42. Angelucci A, Levitt JB, Walton EJ, Hupe JM, Bullier J, Lund
JS. Circuits for local and global signal integration in primary
visual cortex. J Neurosci. 2002;22:8633–8646.
43. Phillips WA, Singer W. In search of common foundations for
cortical computation. Behav Brain Sci. 1997;20:657–683;
discussion 83–722.
44. Singer W. Development and plasticity of cortical processing
architectures. Science. 1995;270:758–764.
45. Shimizu E, Tang YP, Rampon C, Tsien JZ. NMDA receptor-dependent synaptic reinforcement as a crucial process formemory consolidation. Science. 2000;290:1170–1174.
46. Gais S, Rasch B, Wagner U, Born J. Visual-procedural mem-ory consolidation during sleep blocked by glutamatergic re-ceptor antagonists. J Neurosci. 2008;28:5513–5518.
47. Roopun AK, Cunningham MO, Racca C, Alter K, TraubRD, Whittington MA. Region-specific changes in gammaand beta2 rhythms in NMDA receptor dysfunction modelsof schizophrenia. Schizophr Bull. 2008;34:962–973.
48. Bitanihirwe BK, LM, Kelley JF, Kaneko T, Woo TU. Gluta-matergic deficits and parvalbumin-containing inhibitory neu-rons in the prefrontal cortex in schizophrenia. BMCPsychiatry. 2009;9.
49. Uhlhaas PJ, Haenschel C, Nikolic D, Singer W. The role ofoscillations and synchrony in cortical networks and their pu-tative relevance for the pathophysiology of schizophrenia.Schizophr Bull. 2008;34:927–943.
50. Uhlhaas PJ, Millard I, Muetzelfeldt L, Curran HV, MorganCJ. Perceptual organization in ketamine users: preliminaryevidence of deficits on night of drug use but not 3 days later.J Psychopharmacol. 2007;21:347–352.
134
S. M. Silverstein et al.